User login
The Journal of Clinical Outcomes Management® is an independent, peer-reviewed journal offering evidence-based, practical information for improving the quality, safety, and value of health care.
div[contains(@class, 'header__large-screen')]
div[contains(@class, 'read-next-article')]
div[contains(@class, 'nav-primary')]
nav[contains(@class, 'nav-primary')]
section[contains(@class, 'footer-nav-section-wrapper')]
footer[@id='footer']
div[contains(@class, 'main-prefix')]
section[contains(@class, 'nav-hidden')]
div[contains(@class, 'ce-card-content')]
nav[contains(@class, 'nav-ce-stack')]
‘Smoking gun–level’ evidence found linking air pollution with lung cancer
PARIS – Air pollution has been recognized as a risk factor for lung cancer for about 2 decades, and already present in normal lung cells to cause cancer.
Think of it as “smoking gun–level” evidence that may explain why many nonsmokers still develop non–small cell lung cancer, said Charles Swanton, PhD, from the Francis Crick Institute and Cancer Research UK Chief Clinician, London.
“What this work shows is that air pollution is directly causing lung cancer but through a slightly unexpected pathway,” he said at a briefing prior to his presentation of the data in a presidential symposium held earlier this month in Paris at the European Society for Medical Oncology Congress 2022.
Importantly, he and his team also propose a mechanism for blocking the effects of air pollution with monoclonal antibodies directed against the inflammatory cytokine interleukein-1 beta.
Carcinogenesis explored
Lung cancer in never-smokers has a low mutational burden, with about 5- to 10-fold fewer mutations in a nonsmoker, compared with an ever smoker or current smoker, Dr. Swanton noted.
“The other thing to say about never-smokers is that they don’t have a clear environmental carcinogenic signature. So how do you square the circle? You’ve got the problem that you know that air pollution is associated with lung cancer – we don’t know if it causes it – but we also see that we’ve got no DNA mutations due to an environmental carcinogen,” he said during his symposium presentation.
The traditional model proposed to explain how carcinogens cause cancer holds that exposure to a carcinogen causes DNA mutations that lead to clonal expansion and tumor growth.
“But there are some major problems with this model,” Dr. Swanton said.
For example, normal skin contains a “patchwork of mutant clones,” but skin cancer is still uncommon, he said, and in studies in mice, 17 of 20 environmental carcinogens did not induce DNA mutations. He also noted that a common melanoma driver mutation, BRAF V600E, is not induced by exposure to a ultraviolet light.
“Any explanation for never-smoking lung cancer would have to fulfill three criteria: one, you have to explain why geographic variation exists; two, you have to prove causation; and three, you have to explain how cancers can be initiated without directly causing DNA mutations,” he said.
Normal lung tissues in nonsmoking adults can harbor pre-existing mutations, with the number of mutations increasing likely as a consequence of aging. In fact, more than 50% of normal lung biopsy tissues have been shown to harbor driver KRAS and/or EGFR mutations, Dr. Swanton said.
“In our research, these mutations alone only weakly potentiated cancer in laboratory models. However, when lung cells with these mutations were exposed to air pollutants, we saw more cancers and these occurred more quickly than when lung cells with these mutations were not exposed to pollutants, suggesting that air pollution promotes the initiation of lung cancer in cells harboring driver gene mutations. The next step is to discover why some lung cells with mutations become cancerous when exposed to pollutants while others don’t,” he said.
Geographical exposures
Looking at data on 447,932 participants in the UK Biobank, the investigators found that increasing exposure to ambient air particles smaller than 2.5 mcm (PM2.5) was significantly associated with seven cancer types, including lung cancer. They also saw an association between PM2.5 exposure levels and EGFR-mutated lung cancer incidence in the United Kingdom, South Korea, and Taiwan.
And crucially, as Dr. Swanton and associates showed in mouse models, exposure of lung cells bearing somatic EGFR and KRAS mutations to PM2.5 causes recruitment of macrophages that in turn secrete IL-1B, resulting in a transdifferentiation of EGFR-mutated cells into a cancer stem cell state, and tumor formation.
Importantly, pollution-induced tumor formation can be blocked by antibodies directed against IL-1B, Dr. Swanton said.
He pointed to a 2017 study in The Lancet suggesting that anti-inflammatory therapy with the anti–IL-1 antibody canakinumab (Ilaris) could reduce incident lung cancer and lung cancer deaths.
‘Elegant first demonstration’
“This is a very meaningful demonstration, from epidemiological data to preclinical models of the role of PM2.5 air pollutants in the promotion of lung cancer, and it provides us with very important insights into the mechanism through which nonsmokers can get lung cancer,” commented Suzette Delaloge, MD, from the cancer interception program at Institut Goustave Roussy in Villejuif, France, the invited discussant.
“But beyond that, it also has a great impact on our vision of carcinogenesis, with this very elegant first demonstration of the alternative nonmutagenic, carcinogenetic promotion hypothesis for fine particulate matter,” she said.
Questions still to be answered include whether PM2.5 pollutants could also be mutagenic, is the oncogenic pathway ubiquitous in tissue, which components of PM2.5 might drive the effect, how long of an exposure is required to promote lung cancer, and why and how persons without cancer develop specific driver mutations such as EGFR, she said.
“This research is intriguing and exciting as it means that we can ask whether, in the future, it will be possible to use lung scans to look for precancerous lesions in the lungs and try to reverse them with medicines such as interleukin-1B inhibitors,” said Tony Mok, MD, a lung cancer specialist at the Chinese University of Hong Kong, who was not involved in the study.
“We don’t yet know whether it will be possible to use highly sensitive EGFR profiling on blood or other samples to find nonsmokers who are predisposed to lung cancer and may benefit from lung scanning, so discussions are still very speculative,” he said in a statement.
The study was supported by Cancer Research UK, the Lung Cancer Research Foundations, Rosetrees Trust, the Mark Foundation for Cancer Research and the Ruth Strauss Foundation. Dr. Swanton disclosed grants/research support, honoraria, and stock ownership with multiple entities. Dr. Delaloge disclosed institutional financing and research funding from multiple companies. Dr. Mok disclosed stock ownership and honoraria with multiple companies.
AT ESMO CONGRESS 2022
Heparin pretreatment may safely open arteries before STEMI cath
, suggests a large registry study.
An open infarct-related artery (IRA) at angiography on cath-lab arrival presents STEMI patients an opportunity for earlier reperfusion and a chance, in theory at least, for smaller infarcts and maybe improved clinical outcomes.
In the new analysis, which covers more than 40,000 patients with STEMI in Sweden, the 38% who received heparin before cath-lab arrival were 11% less likely to show IRA occlusion at angiography prior to direct percutaneous coronary intervention (PCI). They also showed a 13% lower 30-day mortality compared with patients who were started on heparin in the cath lab. Importantly, their risk of major bleeding in the hospital did not increase.
The “early reperfusion” associated with IRA patency at angiography “could have long-term benefit due to smaller infarct size,” potentially explaining the observed 30-day survival gain in the pretreatment group, Oskar Love Emilsson, Lund (Sweden) University, said in an interview.
Mr. Emilsson, a third-year medical student, reported the analysis at the annual congress of the European Society of Cardiology, and is lead author on its same-day publication in the journal EuroIntervention.
He mentioned a few cautions in interpreting the study, which is based primarily on data from the Swedish Coronary Angiography and Angioplasty Registry (SCAAR). It included several sensitivity analyses that continued to back pretreatment heparin as a significant predictor of an unoccluded IRA but didn’t consistently support the 30-day mortality benefit seen in the primary analysis.
And, although the pretreatment group overall didn’t have more major bleeds, the risk did go up significantly for those older than 75 or those who weighed less than 60 kg (132 pounds) or underwent catheterization with an access route other than the radial artery. Extra caution should be exercised in such patients who receive heparin before cath-lab arrival for PCI, Mr. Emilsson observed.
“Our results suggest that heparin pretreatment might be a good option to improve patency of infarct related arteries in STEMI,” and potentially clinical outcomes, he said. “However, a definite answer would require a randomized controlled trial.”
Meanwhile, the current study may be the largest yet to look at clinical outcomes after pretreatment with unfractionated heparin before PCI for acute STEMI, the report states. There have been some observational studies, subanalyses of STEMI trials, and even a few limited randomized trials – including the HEAP trial published in 2000 – to weigh in on the subject. Some have supported the strategy, others have not.
“With rapid door-to-balloon times in STEMI, it can be challenging to show a significant difference between a prehospital heparin approach and heparin given in the lab,” observed Sunil V. Rao, MD, NYU Langone Health System, New York, who is not connected with the current study.
Many EDs in the United States have “a STEMI protocol that calls for an IV bolus of heparin. It would be tougher in the U.S. to give it in the ambulance but again, it’s not clear how much advantage that would really provide,” he told this news organization.
Support from randomized trials would be needed before the practice could be formally recommended. “The SCAAR registries have set the standard for how registries should be conducted,” Dr. Rao said. “This is a very well done observational study, but it is observational.”
The priority for STEMI patients, he added, “really should be to get them to the lab as fast as possible. If the ED protocol includes heparin before the cath lab, that’s great, but I don’t think we should delay getting these patients to the lab to accommodate pre–cath-lab heparin.”
The current analysis covered 41,631 patients with STEMI from 2008 through to 2016, of whom 38% were pretreated with heparin in an ambulance or the ED. The remaining 62% initiated heparin in the cath lab.
About one-third of the group had an open IRA at angiography. The adjusted risk ratio (RR) for IRA occlusion at angiography for patients pretreated vs. not pretreated with heparin was 0.89 (95% confidence interval [CI], 0.87-0.90).
The corresponding RR for death within 30 days was 0.87 (95% CI, 0.77-0.99), and for major in-hospital bleeding it was 1.01 (95% CI, 0.86-1.18).
The analysis was adjusted for other medications received before cath-lab arrival, especially a long list of antiplatelets and non-heparin antithrombins. That strengthens the case for heparin pretreatment as an independent predictor of an open IRA at initial angiography, Mr. Emilsson said.
Comparisons of propensity-score–matched subgroups of the total cohort, conducted separately for the IRA-occlusion endpoint and the endpoints of 30-day mortality and major bleeding, produced similar results.
Some observational data suggest that antiplatelet pretreatment with a P2Y12 inhibitor may promote IRA patency on angiography after cath lab arrival, Dr. Rao observed. “This indicates that there probably is a role of earlier antithrombotic therapy in STEMI patients, but the randomized trials have not shown a consistent benefit,” he said, referring in particular to the ATLANTIC trial.
Mr. Emilsson and Dr. Rao disclosed no relevant financial relationships.
A version of this article first appeared on Medscape.com.
FROM ESC CONGRESS 2022
Myocardial infarction in women younger than 50: Lessons to learn
Young women (under 50) are increasingly having heart attacks without doctors really knowing why. This is where the Young Women Presenting Acute Myocardial Infarction in France (WAMIF) study comes in, the results of which were presented in an e-poster at the annual congress of the European Society of Cardiology by Stéphane Manzo-Silberman, MD, Institute of Cardiology, Pitié-Salpétrière, Paris. The results (yet to be published) fight several of the preconceived ideas on the topic, Dr. Manzo-Silberman commented in an interview.
Significantly higher hospital death rates in women
“Cardiovascular disease is the main cause of death in women, killing seven times more than breast cancer,” notes Dr. Manzo-Silberman. The hospital death rate is significantly higher in women and, despite going down, is significantly higher than in men (more than double), particularly in women under 50. What’s more, in addition to the typical risk factors, women present specific risk factors related to hormone changes, high-risk inflammatory profiles, and thrombophilia.”
The WAMIF study was designed to determine the clinical, biological, and morphological features linked to hospital mortality after 12 months in women under 50. The prospective, observational study included all women in this age range from 30 sites in France between May 2017 and June 2019.
90% with retrosternal chest pain
The age of the 314 women enrolled was 44.9 years on average. Nearly two-thirds (192) presented with ST-segment elevation myocardial infarction and the other 122 without. In terms of symptoms, 91.6% of these women presented with typical chest pain, and 59.7% had related symptoms.
“With more than 90% having retrosternal pain, the idea that myocardial infarction presents with atypical symptoms in women has been widely challenged, despite the fact that more than half present with related symptoms and it isn’t known in which order these symptoms occur, Dr. Manzo-Silberman said in an interview. But what we can say is that if at any point a young woman mentions chest pain, even when occurring as part of several other symptoms, MI must be deemed a possibility until it has been ruled out.”
The risk profile revealed that 75.5% were smokers, 35% had a family history of heart disease, 33% had pregnancy complications, and 55% had recently experienced a stressful situation. The analysis also showed that cannabis use and oral contraception were primary risk factors in women younger than 35.
“With regard to risk factors, when designing this study we expected that lots of these young women would have largely atypical autoimmune conditions, with high levels of inflammation. We looked for everything, but this was not actually the case. Instead, we found very many women to have classic risk factors; three-quarters were smokers, a modifiable risk factor, which can largely be prevented. The other aspect concerns contraception, and it’s why I insist that gynecologists must be involved insofar as they must inform their patients how to manage their risk factors and tweak their contraception.”
Coronary angiography findings showed that only 1% received a normal result, 29.3% had vessel damage, and 14.6% had aortic dissection. “We were surprised again here because we expected that with young women we would see lots of heart attacks without obstruction, [in other words] normal coronary arteries, atypical forms of MI,” commented Dr. Manzo-Silberman. “In fact, most presented with atheroma, often obstructive lesions, or even triple-vessel disease, in nearly a third of the cohort. So that’s another misconception dispelled – we can’t just think that because a woman is young, nothing will be found. Coronary catheterization should be considered, and the diagnostic process should be completed in full.”
After 1 year, there had been two cancer-related deaths and 25 patients had undergone several angioplasty procedures. Nevertheless, 90.4% had not experienced any type of CV event, and 72% had not even had any symptoms.
“The final surprise was prognosis,” he said. “Previous studies, especially some authored by Viola Vaccarino, MD, PhD, showed an excess hospital rate in women and we had expected this to be the case here, but no hospital deaths were recorded. However, not far off 10% of women attended (at least once) the emergency department in the year following for recurrent chest pain which was not ischemic – ECG normal, troponin normal – so something was missing in their education as a patient.”
“So, there are improvements to be made in terms of secondary prevention, follow-up, and in the education of these young female patients who have experienced the major event that is a myocardial infarction,” concluded Dr. Manzo-Silberman.
This content was originally published on Medscape French edition.
FROM ESC CONGRESS 2022
Dietary change tops for reducing CVD risk in stage 1 hypertension
Healthy lifestyle changes to reduce systolic blood pressure to below 130 mm Hg may prevent 26,000 heart attacks and strokes and reduce health care costs over the next 10 years, a new simulation study suggests.
Among the various lifestyle changes, adopting the Dietary Approaches to Stop Hypertension diet, known as the DASH diet, may have the greatest impact for young and middle-aged adults with stage 1 hypertension.
“This research reveals that we should look to feasible ways our food system could make healthy eating the default option,” Kendra Sims, PhD, MPH, postdoctoral fellow at University of California, San Francisco, told this news organization.
“Above all, it means collaborating with the patient about nourishing choices that fit best into their culture and lifestyle,” Dr. Sims said.
Be proactive
“What is important is that people not wait until they have hypertension to start thinking about healthful diets,” commented Taylor Wallace, PhD, department of nutrition and food studies, George Mason University, Fairfax, Va., who was not involved in the study.
“It’s all about prevention in my mind. Whether you are hypertensive or are perfectly healthy, the DASH diet or any other dietary pattern that emphasizes consumption of fruits, vegetables, whole grains, lean meats, seafood, nuts/seeds, and low/non-fat dairy and decreased intake of saturated fats, added sugars, and sodium is a good idea,” Dr. Wallace said in an interview.
The study was presented at the American Heart Association Hypertension Scientific Sessions 2022 in San Diego.
Dr. Sims and colleagues used U.S. statistics from multiple sources to simulate CVD events, mortality, and health care costs between 2018 and 2027 in adults aged 35-64 years with untreated stage 1 hypertension, defined as systolic BP of 130 to 139 mm Hg.
The researchers estimate that 8.8 million U.S. adults (5.5 million women) aged 35-64 years have untreated stage 1 hypertension and would be recommended for lifestyle change, such as physical activity, weight loss, moderating alcohol intake, and adoption of the DASH diet.
Controlling blood pressure to less than 130 mm Hg in this population could prevent 26,000 CVD events, avoid 2,900 deaths, and lead to $1.6 billion saved in associated health care costs, the researchers calculate.
The largest benefit would come from adoption of the DASH diet, with an estimated 15,000 CVD events prevented among men and 11,000 among women.
Even small changes can help
“Young and middle-aged adults with stage 1 hypertension aren’t as low risk as you – or even your doctor – might think,” Dr. Sims told this news organization.
“Millions of working-aged people are walking around with elevated blood pressure, which is symptomless but is also a leading preventable cause of disability and death. Most do not follow the recommended DASH diet,” Dr. Sims said.
“Unfortunately, the availability and affordability of healthy food sources does not easily allow people to follow the DASH diet,” Dr. Sims adds in a conference news release.
“Clinicians should consider whether their patients live in food deserts or places with limited walkability. Health counseling should include addressing these specific challenges to blood pressure control,” Dr. Sims says.
Dr. Wallace noted that diet changes don’t have to be drastic.
“Honestly, just increasing fruit and vegetable intake has been shown to displace calories from saturated fats, added sugars, and sodium,” he told this news organization.
“It’s hard for people to stick to ‘diets’ long-term, so shifting toward healthier dietary patterns without having to read a book on the DASH diet or count calories and carbs seems like a more practical solution for the general population, although I have no issues with the DASH diet and think it is a great dietary pattern for heart health,” Dr. Wallace said.
The study had no funding. Dr. Sims reports no relevant financial relationships. Dr. Wallace is principal and CEO of Think Healthy Group; chief food and nutrition scientist with Produce for Better Health Foundation; editor, Journal of Dietary Supplements; deputy editor, Journal of the American College of Nutrition; nutrition section editor, Annals of Medicine; and advisory board member with Forbes Health.
A version of this article first appeared on Medscape.com.
Children and COVID: New cases took a downturn in September
After 2 weeks of increases in the number of new COVID-19 cases in children – a trend that just happened to coincide with the start of a new school year – there were fewer cases reported during the first full week of September, according to the American Academy of Pediatrics and the Children’s Hospital Association.
, the AAP and CHA said in their weekly COVID-19 report, noting also that seven states and the District of Columbia no longer update their online dashboards while others publish new data less often than every week.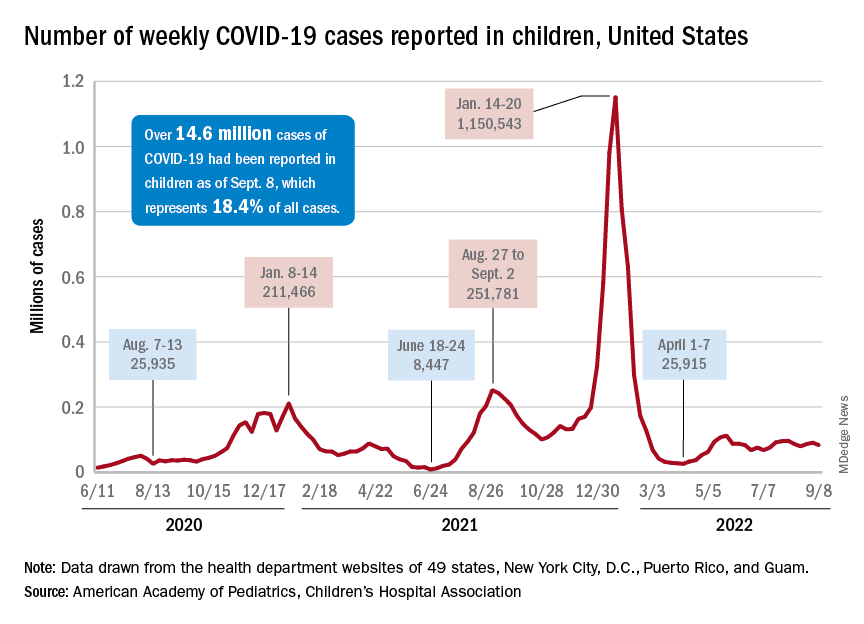
The drop in new cases was accompanied by declines in emergency department visits and hospital admissions, both of which had shown some signs of resurgence in mid- to late August. The brief rise in ED visits seemed to be age-related, occurring in those aged 12 years and older but not in younger children, whose ED visit rate fell steadily through August. Through the first week of September, however, 7-day averages were down for both those aged 12-15 and for 16- to 17-year-olds, the Centers for Disease Control and Prevention reported.
The rate of new hospital admissions of children with confirmed COVID-19, available only for ages 0-17 years, has declined every day since Aug. 28, when it reached 0.44 per 100,000 population after a week of climbing, the CDC said on its COVID Data Tracker.
Cumulatively, about 156,000 children were hospitalized with COVID from Aug. 1, 2020 to Sept. 10, 2022, according to the CDC, which puts the total number of pediatric cases at just over 15 million and deaths at 1,778. Those last two figures represent 17.4% and about 0.4% of all U.S. cases and deaths. The AAP and CHA estimate that about 14.6 million child cases have been reported so far, which is 18.4% of cases in all ages.
Vaccinations are slowly adding up
On the prevention side of the health care system’s response to COVID, the CDC’s cumulative numbers looked like this as of Sept. 6:
- 1.1 million children under age 5 (about 5.8% of the age group) had received at least one dose of vaccine, and 280,000 (1.4%) were fully vaccinated.
- Almost 11 million (38.2%) children aged 5-11 had gotten one dose, and 8.9 million (31.1%) were fully vaccinated.
- 17.9 million (70.8%) children aged 12-17 had received at least one dose, and 15.3 million (60.5%) were fully vaccinated.
Over the 14 days ending Sept. 7, children aged 2-4 years made up the largest group (21.4%) of Americans getting their first vaccine doses, while those aged 5-11 years were the third largest age group at 16.7% of all vaccinees (25- to 49-year-olds were second). The situation was reversed for vaccine completion over the last 2 weeks: Those aged 5-11 were first at 24.7%, and the 2- to 4-year-olds were third at 16.7% (those aged 25-49 were second again), according to the COVID Data Tracker.
FAQ: New COVID Omicron boosters
Here are answers to frequently asked questions about the shots produced by Moderna and Pfizer/BioNTech, based on information provided by the CDC and Keri Althoff, PhD, and virologist Andrew Pekosz, PhD, Johns Hopkins Bloomberg School of Public Health epidemiologists.
Question: Who is eligible for the new bivalent boosters?
Answer: The CDC greenlighted the upgraded Pfizer/BioNTech shots for Americans 12 and older and the Moderna booster for those 18 and over, if they have received a primary vaccine series or a booster at least 2 months before.
The boosters have been redesigned to protect against the predominant BA.4 and BA.5 strains of the virus. The Biden administration is making 160 million of the booster shots available free of charge through pharmacies, doctor’s offices, clinics, and state health departments.
Q: What about children under 12?
A: The new boosters are not approved for children under 12. Additional testing and trials need to be conducted for safety and effectiveness. But officials recommend that children 5 and above receive the primary vaccine series and be boosted with one shot. Children 6 months to under 5 years are not yet eligible for boosters.
Pfizer said it hopes to ask the Food and Drug Administration for authorization in 5- to 11-year-olds in October.
Q: How do the new bivalent boosters differ from previous shots?
A: The new shots use the same mRNA technology as the prior Moderna and Pfizer/BioNTech vaccines and boosters but have been upgraded to target the newer Omicron strains. The shots use mRNA created in a lab to teach our cells to produce a specific protein that triggers an immune-system response and make antibodies that help protect us from SARS-CoV-2, the virus that causes COVID.
The recipe for the new shots incorporates the so-called “spike protein” of both the original (ancestral) strain of the virus and more highly transmissible Omicron strains (BA.4, BA.5). Once your body produces these proteins, your immune system kicks into gear to mount a response.
It’s also possible – but yet to be determined – that the new bivalent boosters will offer protection against newer but less common strains known as BA.4.6 and BA.2.75.
Q: Are there any new risks or side effects associated with these boosters?
A: Health experts don’t expect to see anything beyond what has already been noted with prior mRNA vaccines, with the vast majority of recipients experiencing only mild issues such as redness from the shot, soreness, and fatigue.
Q: Do I need one of the new shots if I’ve already had past boosters or had COVID?
A: Yes. Even if you’ve been infected with COVID in the past year and/or received the prior series of primary vaccines and boosters, you should get a bivalent Omicron shot.
Doing so will give you broader immunity against COVID and also help limit the emergence of other variants. The more Americans with high immunity, the better; it makes it less likely other variants will emerge that can escape the immunity provided by vaccines and COVID infections.
Q: How long should I wait, from the time of my last shot, before getting a new booster?
A: The bivalent boosters are most effective when given after a period of time has passed between your last shot and the new one. A 2- to 3-month waiting period is the minimum, but some evidence suggests extending it out to 4-6 months might be good timing.
To determine when you should get a new booster, check out the CDC’s Stay Up to Date with COVID-19 Vaccines Including Boosters website.
Q: What if I’ve recently had COVID?
A: There are no specific rules about a waiting period after COVID infection. But if you have been infected with the virus in the last 8 weeks, you may want to wait for 8 weeks to pass before receiving the bivalent booster to allow your immune system to get greater benefit from the shot.
Q: If I never got the original vaccines, do I need to get those shots first?
A: Yes. The bivalent vaccine has a lower dose of mRNA than the vaccines used in the primary series of vaccines, rolled out in late 2020. The bivalent vaccine is authorized for use as a booster dose and not a primary vaccine series dose.
Q: Do the Omicron-specific boosters entirely replace the other boosters?
A: Yes. The new booster shots, which target the original strain and the Omicron subvariants, are now the only available boosters for people ages 12 and older. The FDA no longer authorizes the previous booster doses for people in the approved age groups.
Q: What if I received a non-mRNA vaccine produced by Novavax or Johnson & Johnson? Should I still get an mRNA booster?
A: You can mix and match COVID vaccines, and you are eligible to get the bivalent booster 8 weeks after completing the primary COVID vaccination series – whether that was two doses of mRNA or Novavax, or one shot of J&J.
Q: How effective are the new boosters?
A: Scientists don’t have complete effectiveness data from the bivalent vaccines yet. But because the new boosters contain mRNA from the Omicron and the original strains, they are believed to offer greater protection against COVID overall.
Cellular-level data support this, with studies showing the bivalent vaccines increase neutralizing antibodies to BA.4/BA.5 strains. Scientists regard these kinds of studies as surrogate stand-ins for clinical trials. But officials will be studying the effectiveness of the new boosters, examining to what degree they reduce hospitalizations and deaths.
Q: How long will the boosters’ protection last?
A: Research shows that vaccine effectiveness eventually wanes, which is why we have the boosters. Scientists will be monitoring to see how long the protection lasts from the bivalent boosters through studies of antibody levels as well as assessments of severe COVID illnesses over time, throughout the fall and winter.
Q: Is it OK to get a flu shot and a COVID booster at the same time?
A: Yes. In fact, it’s important to get a flu shot this year because some experts believe we could see overlapping COVID-influenza surges this fall – a phenomenon some have fancifully called a “twindemic.” Getting a flu shot and COVID booster – simultaneously, if possible – is particularly important if you’re in a high-risk group.
People who are susceptible to severe complications from COVID – such as older people, people with weakened immune systems, and those with chronic health conditions – are also especially vulnerable to severe influenza complications.
Q: Will a new booster mean I can stop wearing a mask, social distancing, avoiding crowded indoor spaces, and taking other precautions to avoid COVID?
A: No. It’s still a good idea to mask up, keep your distance from others, avoid indoor spaces with people whose vaccine status is unknown, and take other precautions against COVID.
Although the new boosters are front of mind, it’s a good idea to also use other tools in the toolbox, as well, particularly if you have contact with someone who is older, immune-suppressed, or has a chronic condition that puts them at higher risk from COVID.
Keep in mind: The community risk of infection nationwide is still high today, with about 67,400 new cases and nearly 320 deaths reported each day in the United States, according to the latest CDC reports.A version of this article first appeared on WebMD.
Lack of exercise linked to small heart, HFpEF
Chronic lack of exercise – dubbed “exercise deficiency” – is associated with cardiac atrophy, reduced cardiac output and chamber size, and diminished cardiorespiratory fitness (CRF) in a subgroup of patients with heart failure with preserved ejection fraction (HFpEF), researchers say.
Increasing the physical activity levels of these sedentary individuals could be an effective preventive strategy, particularly for those who are younger and middle-aged, they suggest.
Thinking of HFpEF as an exercise deficiency syndrome leading to a small heart “flies in the face of decades of cardiovascular teaching, because traditionally, we’ve thought of heart failure as the big floppy heart,” Andre La Gerche, MBBS, PhD, of the Baker Heart and Diabetes Institute, Melbourne, told this news organization.
“While it is true that some people with HFpEF have thick, stiff hearts, we propose that another subset has a normal heart, except it’s small because it’s been underexercised,” he said.
The article, published online as part of a Focus Seminar series in the Journal of the American College of Cardiology, has “gone viral on social media,” Jason C. Kovacic, MBBS, PhD, of the Victor Chang Cardiac Research Institute, Darlinghurst, Australia, told this news organization.
Dr. Kovacic is a JACC section editor and the coordinating and senior author of the series, which covers other issues surrounding physical activity, both in athletes and the general public.
‘Coin-dropping moment’
To support their hypothesis that HFpEF is an exercise deficiency in certain patients, Dr. La Gerche and colleagues conducted a literature review that highlights the following points:
- There is a strong association between physical activity and both CRF and heart function.
- Exercise deficiency is a major risk factor for HFpEF in a subset of patients.
- Increasing physical activity is associated with greater cardiac mass, stroke volumes, cardiac output, and peak oxygen consumption.
- Physical inactivity leads to loss of heart muscle, reduced output and chamber size, and less ability to improve cardiac performance with exercise.
- Aging results in a smaller, stiffer heart; however, this effect is mitigated by regular exercise.
- Individuals who are sedentary throughout life cannot attenuate age-related reductions in heart size and have increasing chamber stiffness.
“When we explain it, it’s like a coin-dropping moment, because it’s actually a really simple concept,” Dr. La Gerche said. “A small heart has a small stroke volume. A patient with a small heart with a maximal stroke volume of 60 mL can generate a cardiac output of 9 L/min at a heart rate of 150 beats/min during exercise – an output that just isn’t enough. It’s like trying to drive a truck with a 50cc motorbike engine.”
“Plus,” Dr. La Gerche added, “exercise deficiency also sets the stage for comorbidities such as obesity, diabetes, and high blood pressure, all of which can ultimately lead to HFpEF.”
Considering HFpEF as an exercise deficiency syndrome has two clinical implications, Dr. La Gerche said. “First, it helps us understand the condition and diagnose more cases. For example, I think practitioners will start to recognize that breathlessness in some of their patients is associated with a small heart.”
“Second,” he said, “if it’s an exercise deficiency syndrome, the treatment is exercise. For most people, that means exercising regularly before the age of 60 to prevent HFpEF, because studies have found that after the age of 60, the heart is a bit fixed and harder to remodel. That doesn’t mean you shouldn’t try after 60 or that you won’t get benefit. But the real sweet spot is in middle age and younger.”
The bigger picture
The JACC Focus Seminar series starts with an article that underscores the benefits of regular physical activity. “The key is getting our patients to meet the guidelines: 150 to 300 minutes of moderate intensity exercise per week, or 75 to 250 minutes of vigorous activity per week,” Dr. Kovacic emphasized.
“Yes, we can give a statin to lower cholesterol. Yes, we can give a blood pressure medication to lower blood pressure. But when you prescribe exercise, you impact patients’ blood pressure, their cholesterol, their weight, their sense of well-being,” he said. “It cuts across so many different aspects of people’s lives that it’s important to underscore the value of exercise to everybody.”
That includes physicians, he affirmed. “It behooves all physicians to be leading by example. I would encourage those who are overweight or aren’t exercising as much as they should be to make the time to be healthy and to exercise. If you don’t, then bad health will force you to make the time to deal with bad health issues.”
Other articles in the series deal with the athlete’s heart. Christopher Semsarian, MBBS, PhD, MPH, University of Sydney, and colleagues discuss emerging data on hypertrophic cardiomyopathy and other genetic cardiovascular diseases, with the conclusion that it is probably okay for more athletes with these conditions to participate in recreational and competitive sports than was previously thought – another paradigm shift, according to Dr. Kovacic.
The final article addresses some of the challenges and controversies related to the athlete’s heart, including whether extreme exercise is associated with vulnerability to atrial fibrillation and other arrhythmias, and the impact of gender on the cardiac response to exercise, which can’t be determined now because of a paucity of data on women in sports.
Overall, Dr. Kovacic said, the series makes for “compelling” reading that should encourage readers to embark on their own studies to add to the data and support exercise prescription across the board.
No commercial funding or relevant conflicts of interest were reported.
A version of this article first appeared on Medscape.com.
Even mild COVID tied to vascular impairment
In a small prospective study, participants who previously had COVID-19, even those with mild illness, had significantly decreased CVR, compared with never-infected individuals.
Results also showed cerebral blood flow (CBF) was greater in never-infected versus previously infected participants, and whole-brain CVR was lower in previously infected versus never-infected participants. Although CVR was also smaller in those with versus those without post-COVID neurologic conditions, the difference was not considered significant.
“It is important to remember that while our findings were statistically significant, we had a relatively small sample size – 25 total participants – and so we encourage future larger studies in this domain to see if these results are reproducible at a larger scale,” lead author Andrew Callen, MD, assistant professor of radiology, Neuroradiology Section, University of Colorado at Denver, Aurora, said in an interview.
“In a practical sense, it may encourage treating clinicians to be more aggressive with preventative neurovascular and cardiovascular health measures and/or screening in this patient population,” Dr. Callen said.
The findings were published online in the American Journal of Roentgenology.
Endothelial dysfunction
The acute phase SARS-CoV-2 infection “is associated with strokes that have features of both vascular inflammation and thromboembolism,” the investigators note.
Moreover, following the acute phase of infection, up to three-quarters of patients “experience persistent neurologic symptoms not attributable to another diagnosis, including headache, difficulty concentrating, vision changes, disequilibrium, and fatigue,” they write.
Preliminary studies “suggest a potential role for endothelial and circulatory dysfunction” in these symptoms, they add.
The researchers note that vessel wall imaging is an MRI technique that can detect and characterize arterial vascular inflammation and may differentiate vasculitic arterial pathology from atherosclerotic pathology.
Dr. Callen conducted previous research assessing cerebral vasoreactivity in women living with HIV. He noted that this is a population at a much higher risk of stroke, compared with uninfected individuals with otherwise similar cardiovascular risk factors, even when their viral load is controlled with antiretroviral therapies.
Evidence has pointed to chronic endothelial dysfunction in these individuals, and endothelial function and dysfunction can be measured through vasoreactivity testing, Dr. Callen said.
“As the COVID pandemic progressed, not only did we observe an increased rate of stroke in individuals acutely infected with COVID, but histopathological evidence began to emerge which suggested that the COVID-19 virus had tropism to and often damaged the vascular endothelium,” he noted.
This emerging evidence prompted Dr. Callen to wonder whether “individuals previously infected with COVID might also demonstrate long-term impairment in cerebral vasoreactivity or if we might see abnormalities using high resolution vessel wall imaging.”
In the current study, 15 individuals with prior SARS-CoV-2 infection (11 women, 4 men; mean age, 43 years) were compared with 10 never-infected individuals (8 women, 2 men; mean age, 43 years) who functioned as the control group.
The previously infected individuals, of whom three had prior critical infection and 12 had prior mild infection, were assessed, on average, about 8 months after infection. Of this group, seven had various post-COVID neurologic conditions, including headache, memory impairment, insomnia, depression, disequilibrium, fatigue, personality change, phantosmias (detecting smells that aren’t present), dysgeusia (taste disorder), and tinnitus.
All participants underwent MRI and vessel wall imaging. The MRI included arterial spin labeling perfusion imaging with acetazolamide stimulus to measure CBF and calculate CVR. The vessel wall imaging examinations used a contrast-enhanced black-blood 3D T1-weighted sequence.
Imaging data
Prior to acetazolamide administration, the mean whole-cortex CBF did not differ significantly between never-infected and previously infected participants. However, following the acetazolamide administration, the mean whole-cortex CBF was greater in never-infected participants (73.8 mL/100 g/min vs. 60.5 mL/100 g/min, respectively; P = .04).
Moreover, the mean whole-brain CVR was greater in never-infected participants, compared with previously infected participants (27.8 mL/100 g/min vs. 19.1 mL/100 g/min; P < .001).
After adjusting for age and sex, researchers found that prior infection was associated with a lower whole-brain CVR (–8.9 mL/100 g/min; 95% confidence interval, 4.6-13.3 ml/100g/min; P < .001).
Previously infected individuals also showed significantly lower CVR, even after the researchers excluded those with prior critical illness.
A nonsignificant difference was found in previously infected participants, with smaller CVR in participants with versus without post-COVID neurologic symptoms (16.9 vs. 21.0 mL/100 g/min; P = .22).
In addition, 40% of the previously infected participants versus 10% of the never-infected participants had at least one vessel wall imaging abnormality – but the difference was not deemed significant (P = .18). Notably, “all detected vessel wall imaging abnormalities were morphologically consistent with atherosclerosis rather than vasculitis,” the investigators said.
Dr. Callen said it is “unknown whether the lack of statistical significance in the differences in vasoreactivity impairment with those living with long COVID symptoms is due to a lack of a biomechanistic correlation or due to statistical underpowering.”
If it is the latter, “it may emphasize the role of vascular health in those living with long COVID symptoms and potentially all individuals living with COVID,” he added.
Independent risk factor?
Commenting on the study for this article, Jared Narvid, MD, associate professor of neuroradiology, University of California, San Francisco, said it “adds to the literature suggesting a correlation between COVID-19 infection and measures of cerebrovascular abnormality.”
Dr. Narvid, who was not involved with the research, added that “although it is a small case-control study, it is well executed and should encourage scientists to further study whether COVID-19 infection represents an independent risk factor for cerebrovascular disease.”
The investigators agree. “Future studies are needed to determine the clinical implications arising from SARS-CoV-2–associated CVR impairment,” they write.
The study was funded by a University of Colorado department of radiology Faculty Development Seed Grant. The investigators and Dr. Narvid report no relevant financial relationships.
A version of this article first appeared on Medscape.com .
When do we stop using BMI to diagnose obesity?
“BMI is trash. Full stop.” This controversial tweet received 26,500 likes and almost 3,000 retweets. The 400 comments from medical and non–health care personnel ranged from agreeable to contrary to offensive.
As a Black woman who is an obesity expert living with the impact of obesity in my own life, I know the emotion that a BMI conversation can evoke. Before emotions hijack the conversation, let’s discuss BMI’s past, present, and future.
BMI: From observational measurement to clinical use
Imagine walking into your favorite clothing store where an eager clerk greets you with a shirt to try on. The fit is off, but the clerk insists that the shirt must fit because everyone who’s your height should be able to wear it. This scenario seems ridiculous. But this is how we’ve come to use the BMI. Instead of thinking that people of the same height may be the same size, we declare that they must be the same size.
The idea behind the BMI was conceived in 1832 by Belgian anthropologist and mathematician Adolphe Quetelet, but he didn’t intend for it to be a health measure. Instead, it was simply an observation of how people’s weight changed in proportion to height over their lifetime.
Fast-forward to the 20th century, when insurance companies began using weight as an indicator of health status. Weights were recorded in a “Life Table.” Individual health status was determined on the basis of arbitrary cut-offs for weight on the Life Tables. Furthermore, White men set the “normal” weight standards because they were the primary insurance holders.
In 1972, Dr. Ancel Keys, a physician and leading expert in body composition at the time, cried foul on this practice and sought to standardize the use of weight as a health indicator. Dr. Keys used Quetelet’s calculation and termed it the Body Mass Index.
By 1985, the U.S. National Institutes of Health and the World Health Organization adopted the BMI. By the 21st century, BMI had become widely used in clinical settings. For example, the Centers for Medicare & Medicaid Services adopted BMI as a quality-of-care measure, placing even more pressure on clinicians to use BMI as a health screening tool.
BMI as a tool to diagnose obesity
We can’t discuss BMI without discussing the disease of obesity. BMI is the most widely used tool to diagnose obesity. In the United States, one-third of Americans meet the criteria for obesity. Another one-third are at risk for obesity.
Compared with BMI’s relatively quick acceptance into clinical practice, however, obesity was only recently recognized as a disease.
Historically, obesity has been viewed as a lifestyle choice, fueled by misinformation and multiple forms of bias. The historical bias associated with BMI and discrimination has led some public health officials and scholars to dismiss the use of BMI or fail to recognize obesity as disease.
This is a dangerous conclusion, because it comes to the detriment of the very people disproportionately impacted by obesity-related health disparities.
Furthermore, weight bias continues to prevent people living with obesity from receiving insurance coverage for life-enhancing obesity medications and interventions.
Is it time to phase out BMI?
The BMI is intertwined with many forms of bias: age, gender, racial, ethnic, and even weight. Therefore, it is time to phase out BMI. However, phasing out BMI is complex and will take time, given that:
- Obesity is still a relatively “young” disease. 2023 marks the 10th anniversary of obesity’s recognition as a disease by the American Medical Association. Currently, BMI is the most widely used tool to diagnose obesity. Tools such as waist circumference, body composition, and metabolic health assessment will need to replace the BMI. Shifting from BMI emphasizes that obesity is more than a number on the scale. Obesity, as defined by the Obesity Medicine Association, is indeed a “chronic, relapsing, multi-factorial, neurobehavioral disease, wherein an increase in body fat promotes adipose tissue dysfunction and abnormal fat mass physical forces, resulting in adverse metabolic, biomechanical, and psychosocial health consequences.”
- Much of our health research is tied to BMI. There have been some shifts in looking at non–weight-related health indicators. However, we need more robust studies evaluating other health indicators beyond weight and BMI. The availability of this data will help eliminate the need for BMI and promote individualized health assessment.
- Current treatment guidelines for obesity medications are based on BMI. (Note: Medications to treat obesity are called “anti-obesity” medications or AOMs. However, given the stigma associated with obesity, I prefer not to use the term “anti-obesity.”) Presently this interferes with long-term obesity treatment. Once BMI is “normal,” many patients lose insurance coverage for their obesity medication, despite needing long-term metabolic support to overcome the compensatory mechanism of weight regain. Obesity is a chronic disease that exists independent of weight status. Therefore, using non-BMI measures will help ensure appropriate lifetime support for obesity.
The preceding are barriers, not impossibilities. In the interim, if BMI is still used in any capacity, the BMI reference chart should be an adjusted BMI chart based on age, race, ethnicity, biological sex, and obesity-related conditions. Furthermore, BMI isn’t the sole determining factor of health status.
Instead, an “abnormal” BMI should initiate conversation and further testing, if needed, to determine an individual’s health. For example, compare two people of the same height with different BMIs and lifestyles. Current studies support that a person flagged as having a high adjusted BMI but practicing a healthy lifestyle and having no metabolic diseases is less at risk than a person with a “normal” BMI but high waist circumference and an unhealthy lifestyle.
Regardless of your personal feelings, the facts are clear. Technology empowers us with better tools than BMI to determine health status. Therefore, it’s not a matter of if we will stop using BMI but when.
Sylvia Gonsahn-Bollie, MD, DipABOM, is an integrative obesity specialist who specializes in individualized solutions for emotional and biological overeating. Connect with her at www.embraceyouweightloss.com or on Instagram @embraceyoumd. Her bestselling book, “Embrace You: Your Guide to Transforming Weight Loss Misconceptions Into Lifelong Wellness,” is Healthline.com’s Best Overall Weight Loss Book 2022 and one of Livestrong.com’s picks for the 8 Best Weight-Loss Books to Read in 2022.
A version of this article first appeared on Medscape.com.
Hip fractures likely to double by 2050 as population ages
The annual incidence of hip fractures declined in most countries from 2005 to 2018, but this rate is projected to roughly double by 2050, according to a new study of 19 countries/regions.
The study by Chor-Wing Sing, PhD, and colleagues was presented at the annual meeting of the American Society of Bone and Mineral Research. The predicted increase in hip fractures is being driven by the aging population, with the population of those age 85 and older projected to increase 4.5-fold from 2010 to 2050, they note.
The researchers also estimate that from 2018 to 2050 the incidence of fractures will increase by 1.9-fold overall – more in men (2.4-fold) than in women (1.7-fold).
In addition, rates of use of osteoporosis drugs 1 year after a hip fracture were less than 50%, with less treatment in men. Men were also more likely than women to die within 1 year of a hip fracture.

The researchers conclude that “larger and more collaborative efforts among health care providers, policymakers, and patients are needed to prevent hip fractures and improve the treatment gap and post-fracture care, especially in men and the oldest old.”
Aging will fuel rise in hip fractures; more preventive treatment needed
“Even though there is a decreasing trend of hip fracture incidence in some countries, such a percentage decrease is insufficient to offset the percentage increase in the aging population,” senior co-author Ching-Lung Cheung, PhD, associate professor in the department of pharmacology and pharmacy at the University of Hong Kong, explained to this news organization.
The takeaways from the study are that “a greater effort on fracture prevention should be made to avoid the continuous increase in the number of hip fractures,” he said.
In addition, “although initiation of anti-osteoporosis medication after hip fracture is recommended in international guidelines, the 1-year treatment rate [was] well below 50% in most of the countries and regions studied. This indicates the treatment rate is far from optimal.”
“Our study also showed that the use of anti-osteoporosis medications following a hip fracture is lower in men than in women by 30% to 67%,” he said. “Thus, more attention should be paid to preventing and treating hip fractures in men.”
“The greater increase in the projected number of hip fractures in men than in women “could be [because] osteoporosis is commonly perceived as a ‘woman’s disease,’ ” he speculated.
Invited to comment, Juliet Compston, MD, who selected the study as one of the top clinical science highlight abstracts at the ASBMR meeting, agrees that “there is substantial room for improvement” in osteoporosis treatment rates following a hip fracture “in all the regions covered by the study.”
“In addition,” she continues, “the wide variations in treatment rates can provide important lessons about the most effective models of care for people who sustain a hip fracture: for example, fracture liaison services.”
Men suffer as osteoporosis perceived to be a ‘woman’s disease’
The even lower treatment rate in men than women is “concerning and likely reflects the mistaken perception that osteoporosis is predominantly a disease affecting women,” notes Dr. Compston, emeritus professor of bone medicine, University of Cambridge, United Kingdom.
Also invited to comment, Peter R. Ebeling, MD, outgoing president of the ASBMR, said that the projected doubling of hip fractures “is likely mainly due to aging of the population, with increasing lifespan for males in particular. However, increasing urbanization and decreasing weight-bearing exercise as a result are likely to also contribute in developing countries.”
“Unfortunately, despite the advances in treatments for osteoporosis over the last 25 years, osteoporosis treatment rates remain low, and osteoporosis remains undiagnosed in postmenopausal women and older men,” added Dr. Ebeling, from Monash University, Melbourne, who was not involved with the research.
“More targeted screening for osteoporosis would help,” he said, “as would treating patients for it following other minimal trauma fractures (vertebral, distal radius, and humerus, etc.), since if left untreated, about 50% of these patients will have hip fractures later in life.”
“Some countries may be doing better because they have health quality standards for hip fracture (for example, surgery within 24 hours, investigation, and treatment for osteoporosis). In other countries like Australia, bone density tests and treatment for osteoporosis are reimbursed, increasing their uptake.”
The public health implications of this study are “substantial” according to Dr. Compston. “People who have sustained a hip fracture are at high risk of subsequent fractures if untreated. There is a range of safe, cost-effective pharmacological therapies to reduce fracture rate, and wider use of these would have a major impact on the current and future burden imposed by hip fractures in the elderly population.”
Similarly, Dr. Ebeling noted that “prevention is important to save a huge health burden for patients and costs for society.”
“Patients with minimal trauma fractures (particularly hip or spinal fractures) should be investigated and treated for osteoporosis with care pathways established in the hospitals, reaching out to the community [fracture liaison services],” he said.
Support for these is being sought under Medicare in the United States, he noted, and bone densitometry reimbursement rates also need to be higher in the United States.
Projections for number of hip fractures to 2050
Previous international reviews of hip fractures have been based on heterogeneous data from more than 10 to 30 years ago, the researchers note.
They performed a retrospective cohort study using a common protocol across 19 countries/regions, as described in an article about the protocol published in BMJ Open.
They analyzed data from adults aged 50 and older who were hospitalized with a hip fracture to determine 1) the annual incidence of hip fractures in 2008-2015; 2) the uptake of drugs to treat osteoporosis at 1 year after a hip fracture; and 3) all-cause mortality at 1 year after a hip fracture.
In a second step, they estimated the number of hip fractures that would occur from 2030 to 2050, using World Bank population growth projections.
The data are from 20 health care databases from 19 countries/regions: Oceania (Australia, New Zealand), Asia (Hong Kong, Japan, Singapore, South Korea, Taiwan, and Thailand), Northern Europe (Denmark, Finland, and U.K.), Western Europe (France, Germany, Italy, The Netherlands, and Spain), and North and South America (Canada, United States, and Brazil).
The population in Japan was under age 75. U.S. data are from two databases: Medicare (age ≥ 65) and Optum.
Most databases (13) covered 90%-100% of the national population, and the rest covered 5%-70% of the population.
From 2008 to 2015, the annual incidence of hip fractures declined in 11 countries/regions (Singapore, Denmark, Hong Kong, Taiwan, Finland, U.K., Italy, Spain, United States [Medicare], Canada, and New Zealand).
“One potential reason that some countries have seen relatively large declines in hip fractures is better osteoporosis management and post-fracture care,” said Dr. Sing in a press release issued by ASBMR. “Better fall-prevention programs and clearer guidelines for clinical care have likely made a difference.”
Hip fracture incidence increased in five countries (The Netherlands, South Korea, France, Germany, and Brazil) and was stable in four countries (Australia, Japan, Thailand, and United States [Optum]).
The United Kingdom had the highest rate of osteoporosis treatment at 1-year after a hip fracture (50.3%). Rates in the other countries/regions ranged from 11.5% to 37%.
Fewer men than women were receiving drugs for osteoporosis at 1 year (range 5.1% to 38.2% versus 15.0% to 54.7%).
From 2005 to 2018, rates of osteoporosis treatment at 1 year after a hip fracture declined in six countries, increased in four countries, and were stable in five countries.
All-cause mortality within 1 year of hip fracture was higher in men than in women (range 19.2% to 35.8% versus 12.1% to 25.4%).
“Among the studied countries and regions, the U.S. ranks fifth with the highest hip fracture incidence,” Dr. Cheung replied when specifically asked about this. “The risk of hip fracture is determined by multiple factors: for example, lifestyle, diet, genetics, as well as management of osteoporosis,” he noted.
“Denmark is the only country showing no projected increase, and it is because Denmark had a continuous and remarkable decrease in the incidence of hip fractures,” he added, which “can offset the number of hip fractures contributed by the population aging.”
The study was funded by Amgen. Dr. Sing and Dr. Cheung have reported no relevant financial relationships. One of the study authors is employed by Amgen.
A version of this article first appeared on Medscape.com.
The annual incidence of hip fractures declined in most countries from 2005 to 2018, but this rate is projected to roughly double by 2050, according to a new study of 19 countries/regions.
The study by Chor-Wing Sing, PhD, and colleagues was presented at the annual meeting of the American Society of Bone and Mineral Research. The predicted increase in hip fractures is being driven by the aging population, with the population of those age 85 and older projected to increase 4.5-fold from 2010 to 2050, they note.
The researchers also estimate that from 2018 to 2050 the incidence of fractures will increase by 1.9-fold overall – more in men (2.4-fold) than in women (1.7-fold).
In addition, rates of use of osteoporosis drugs 1 year after a hip fracture were less than 50%, with less treatment in men. Men were also more likely than women to die within 1 year of a hip fracture.
The researchers conclude that “larger and more collaborative efforts among health care providers, policymakers, and patients are needed to prevent hip fractures and improve the treatment gap and post-fracture care, especially in men and the oldest old.”
Aging will fuel rise in hip fractures; more preventive treatment needed
“Even though there is a decreasing trend of hip fracture incidence in some countries, such a percentage decrease is insufficient to offset the percentage increase in the aging population,” senior co-author Ching-Lung Cheung, PhD, associate professor in the department of pharmacology and pharmacy at the University of Hong Kong, explained to this news organization.
The takeaways from the study are that “a greater effort on fracture prevention should be made to avoid the continuous increase in the number of hip fractures,” he said.
In addition, “although initiation of anti-osteoporosis medication after hip fracture is recommended in international guidelines, the 1-year treatment rate [was] well below 50% in most of the countries and regions studied. This indicates the treatment rate is far from optimal.”
“Our study also showed that the use of anti-osteoporosis medications following a hip fracture is lower in men than in women by 30% to 67%,” he said. “Thus, more attention should be paid to preventing and treating hip fractures in men.”
“The greater increase in the projected number of hip fractures in men than in women “could be [because] osteoporosis is commonly perceived as a ‘woman’s disease,’ ” he speculated.
Invited to comment, Juliet Compston, MD, who selected the study as one of the top clinical science highlight abstracts at the ASBMR meeting, agrees that “there is substantial room for improvement” in osteoporosis treatment rates following a hip fracture “in all the regions covered by the study.”
“In addition,” she continues, “the wide variations in treatment rates can provide important lessons about the most effective models of care for people who sustain a hip fracture: for example, fracture liaison services.”
Men suffer as osteoporosis perceived to be a ‘woman’s disease’
The even lower treatment rate in men than women is “concerning and likely reflects the mistaken perception that osteoporosis is predominantly a disease affecting women,” notes Dr. Compston, emeritus professor of bone medicine, University of Cambridge, United Kingdom.
Also invited to comment, Peter R. Ebeling, MD, outgoing president of the ASBMR, said that the projected doubling of hip fractures “is likely mainly due to aging of the population, with increasing lifespan for males in particular. However, increasing urbanization and decreasing weight-bearing exercise as a result are likely to also contribute in developing countries.”
“Unfortunately, despite the advances in treatments for osteoporosis over the last 25 years, osteoporosis treatment rates remain low, and osteoporosis remains undiagnosed in postmenopausal women and older men,” added Dr. Ebeling, from Monash University, Melbourne, who was not involved with the research.
“More targeted screening for osteoporosis would help,” he said, “as would treating patients for it following other minimal trauma fractures (vertebral, distal radius, and humerus, etc.), since if left untreated, about 50% of these patients will have hip fractures later in life.”
“Some countries may be doing better because they have health quality standards for hip fracture (for example, surgery within 24 hours, investigation, and treatment for osteoporosis). In other countries like Australia, bone density tests and treatment for osteoporosis are reimbursed, increasing their uptake.”
The public health implications of this study are “substantial” according to Dr. Compston. “People who have sustained a hip fracture are at high risk of subsequent fractures if untreated. There is a range of safe, cost-effective pharmacological therapies to reduce fracture rate, and wider use of these would have a major impact on the current and future burden imposed by hip fractures in the elderly population.”
Similarly, Dr. Ebeling noted that “prevention is important to save a huge health burden for patients and costs for society.”
“Patients with minimal trauma fractures (particularly hip or spinal fractures) should be investigated and treated for osteoporosis with care pathways established in the hospitals, reaching out to the community [fracture liaison services],” he said.
Support for these is being sought under Medicare in the United States, he noted, and bone densitometry reimbursement rates also need to be higher in the United States.
Projections for number of hip fractures to 2050
Previous international reviews of hip fractures have been based on heterogeneous data from more than 10 to 30 years ago, the researchers note.
They performed a retrospective cohort study using a common protocol across 19 countries/regions, as described in an article about the protocol published in BMJ Open.
They analyzed data from adults aged 50 and older who were hospitalized with a hip fracture to determine 1) the annual incidence of hip fractures in 2008-2015; 2) the uptake of drugs to treat osteoporosis at 1 year after a hip fracture; and 3) all-cause mortality at 1 year after a hip fracture.
In a second step, they estimated the number of hip fractures that would occur from 2030 to 2050, using World Bank population growth projections.
The data are from 20 health care databases from 19 countries/regions: Oceania (Australia, New Zealand), Asia (Hong Kong, Japan, Singapore, South Korea, Taiwan, and Thailand), Northern Europe (Denmark, Finland, and U.K.), Western Europe (France, Germany, Italy, The Netherlands, and Spain), and North and South America (Canada, United States, and Brazil).
The population in Japan was under age 75. U.S. data are from two databases: Medicare (age ≥ 65) and Optum.
Most databases (13) covered 90%-100% of the national population, and the rest covered 5%-70% of the population.
From 2008 to 2015, the annual incidence of hip fractures declined in 11 countries/regions (Singapore, Denmark, Hong Kong, Taiwan, Finland, U.K., Italy, Spain, United States [Medicare], Canada, and New Zealand).
“One potential reason that some countries have seen relatively large declines in hip fractures is better osteoporosis management and post-fracture care,” said Dr. Sing in a press release issued by ASBMR. “Better fall-prevention programs and clearer guidelines for clinical care have likely made a difference.”
Hip fracture incidence increased in five countries (The Netherlands, South Korea, France, Germany, and Brazil) and was stable in four countries (Australia, Japan, Thailand, and United States [Optum]).
The United Kingdom had the highest rate of osteoporosis treatment at 1-year after a hip fracture (50.3%). Rates in the other countries/regions ranged from 11.5% to 37%.
Fewer men than women were receiving drugs for osteoporosis at 1 year (range 5.1% to 38.2% versus 15.0% to 54.7%).
From 2005 to 2018, rates of osteoporosis treatment at 1 year after a hip fracture declined in six countries, increased in four countries, and were stable in five countries.
All-cause mortality within 1 year of hip fracture was higher in men than in women (range 19.2% to 35.8% versus 12.1% to 25.4%).
“Among the studied countries and regions, the U.S. ranks fifth with the highest hip fracture incidence,” Dr. Cheung replied when specifically asked about this. “The risk of hip fracture is determined by multiple factors: for example, lifestyle, diet, genetics, as well as management of osteoporosis,” he noted.
“Denmark is the only country showing no projected increase, and it is because Denmark had a continuous and remarkable decrease in the incidence of hip fractures,” he added, which “can offset the number of hip fractures contributed by the population aging.”
The study was funded by Amgen. Dr. Sing and Dr. Cheung have reported no relevant financial relationships. One of the study authors is employed by Amgen.
A version of this article first appeared on Medscape.com.
FROM ASBMR 2022