User login
Can combining triptans with SSRIs or SNRIs cause serotonin syndrome?
In 2006, the FDA issued a warning of the risk of potentially fatal serotonin syndrome when 5-hydroxytryptamine receptor agonist antimigraine medications (triptans) and selective serotonin reuptake inhibitors (SSRIs) or serotonin-norepinephrine reuptake inhibitors (SNRI) are coprescribed.1 As a result, most drug interaction programs trigger a serotonin syndrome warning when triptans are prescribed with an SSRI or SNRI.2 However, many patients with depression or anxiety also suffer from migraines and require treatment with both triptans and an SSRI or SNRI.3,4 Kalaydjian et al4 found the incidence of major depression and generalized anxiety disorder were approximately 3 times greater in patients with migraines than in those without migraines. Should we avoid coprescribing triptans and SSRIs or SNRIs?
What is serotonin syndrome?
Serotonin syndrome is an adverse drug reaction that results from excessive serotonin stimulation. There are 2 sets of validated diagnostic criteria: the Sternbach Criteria and the Hunter Serotonin Toxicity Criteria; the latter is considered more stringent.3,5-7 Symptoms of serotonin syndrome include mental status changes, autonomic hyperactivity, and neuromuscular changes such as muscle rigidity.5-7 Typical manifestations of serotonin syndrome on physical exam include spontaneous and/or inducible clonus, agitation, diaphoresis, tremor, hyperreflexia, hypertonia, and temperature >38°C.6 In severe cases, serotonin syndrome can lead to seizures, coma, and death. Management includes supportive treatment, discontinuing the offending agents, controlling agitation with medications such as benzodiazepines, and possibly administering cyproheptadine, a 5HT2A antagonist.8 Most cases resolve within 24 hours of discontinuing the offending agents or appropriate treatment.5
What did the FDA say?
The 2006 FDA warning initially was based on 27 reports of serotonin syndrome in patients receiving triptans and SSRIs or SNRIs; this was later expanded to include 29 patients.1,9 No patients died but 13 required hospitalization and 2 had life-threatening symptoms. However, most cases lacked data necessary to diagnose serotonin syndrome.9 Further, reviews of the available clinical information have suggested that in some cases, clinicians did not rule out other disorders as required by diagnostic criteria, while others were viral in nature or resolved despite ongoing treatment with the presumed offending agents.9-11
Some clinicians met the FDA’s assessment with skepticism. Only 10 of the 29 cases met the Sternbach criteria of serotonin syndrome and none met the more rigorous Hunter criteria. Additionally, the theoretical basis has been questioned.9-11 Available evidence indicates that serotonin syndrome requires activation of 5HT2A receptors and a possible limited role of 5HT1A.9-12 However, triptans are agonists at the 5HT1B/1D/1F receptor subtypes, with weak affinity for 5HT1A receptors and no activity at the 5HT2 receptors.13,14 Additionally, triptan medications are used as needed, not as standing treatments, with parameters limiting the maximum dose, dosing interval, and frequency of use. In clinical practice, it appears that these dosing guidelines are being followed: Tepper et al15 found the typical female patient experiences 1 to 2 migraines per month; on average, patients use 1.2 to 1.8 triptan tablets per month.
Our opinion
We believe it is reasonable to coprescribe SSRIs or SNRIs with triptans because:
- data indicate that many patients are treated with a combination of triptans and SSRIs or SNRIs but the number of reported cases of serotonin syndrome is extremely limited
- the nature of serotonin syndrome cases reported in the literature is questionable
- the interaction is biologically implausible
- triptans remain in the body for a limited time
- triptans are used infrequently.5-11
This view is supported by the most recent American Headache Society position paper,11 which states that inadequate data are available to assess the risk but current evidence does not support limiting use of triptans with SSRIs and SNRIs.
How we deal with the warning in clinical practice. In practice we are alerted to this interaction by notification in our e-prescribing systems, by pharmacists calling with concerns about dispensing an SSRI or SNRI for a patient already receiving a triptan, and during patient visits that involve prescribing an SSRI or SNRI.
Although it is relatively easy to override a drug interaction warning in our e-prescribing system, we discuss the issue with pharmacists and patients. We provide information about the signs and symptoms of serotonin syndrome and its potential dangerousness. We note that serotonin syndrome is a theoretical concern, but highly unlikely with this combination of medications because of their pharmacologic properties. We explain the parameters of triptan use, recommend that our patients use triptans for migraines when needed, and reassure patients we are available to answer questions. When a patient uses triptans more than twice monthly, we consider discussing this usage with the patient and the treating physician.
Related Resource
- Sclar DA, Robison LM, Castillo LV, et al. Concomitant use of triptan, and SSRI or SNRI after the US Food and Drug Administration alert on serotonin syndrome. Headache. 2012. www.headachejournal.org/SpringboardWebApp/userfiles/headache/file/sclar.pdf.
Drug Brand Name
- Cyproheptadine • Perinctin
Disclosure
The authors report no financial relationship with any company whose products are mentioned in this article or with manufacturers of competing products.
1. U.S. Food and Drug Administration. Public health advisory—combined use of 5-hydroxytryptamine receptor agonists (triptans), selective serotonin reuptake inhibitors (SSRIs) or selective serotonin/norepinephrine reuptake inhibitors (SNRIs) may result in life-threatening serotonin syndrome. http://1.usa.gov/U0A0V4. Published July 19, 2006. Accessed September 18, 2012.
2. Kogut SJ. Do triptan antimigraine medications interact with SSRI/SNRI antidepressants? What does your decision support system say? J Manag Care Pharm. 2011;17(7):547-551.
3. Tepper SJ. Serotonin syndrome: SSRIs SNRIs, triptans, and current clinical practice. Headache. 2012;52(2):195-197.
4. Kalaydjian A, Merikangas K. Physical and mental comorbidity of headache in a nationally representative sample of US adults. Psychosom Med. 2008;70(7):773-780.
5. Boyer EW, Shannon M. The serotonin syndrome. N Engl J Med. 2005;352(11):1112-1120.
6. Sternbach H. The serotonin syndrome. Am J Psychiatry. 1991;148(6):705-713.
7. Dunkley EJ, Isbister GK, Sibbritt D, et al. The Hunter Serotonin Toxicity Criteria: simple and accurate diagnostic decision rules for serotonin toxicity. QJM. 2003;96(9):635-642.
8. Ables AZ, Nagubilli R. Prevention recognition, and management of serotonin syndrome. Am Fam Physician. 2010;81(9):1139-1142.
9. Evans RW. The FDA alert on serotonin syndrome with combined use of SSRIs or SNRIs and triptans: an analysis of the 29 case reports. MedGenMed. 2007;9(3):48.-
10. Gillman PK. Triptans serotonin agonists, and serotonin syndrome (serotonin toxicity): a review. Headache. 2010;50(2):264-272.
11. Evans RW, Tepper SJ, Shapiro RE, et al. The FDA alert on serotonin syndrome with use of triptans combined with selective serotonin reuptake inhibitors or selective serotonin-norepinephrine reuptake inhibitors: American Headache Society position paper. Headache. 2010;50(6):1089-1099.
12. Ahn AH, Basbaum AI. Where do triptans act in the treatment of migraine? Pain. 2005;115(1-2):1-4.
13. Pediatric & Neonatal Lexi-Drugs. Hudson, OH: Lexi-Comp, Inc.; 2011.
14. Sclar DA, Robison LM, Castillo LV, et al. Concomitant use of triptan, and SSRI or SNRI after the US Food and Drug Administration alert on serotonin syndrome. Headache. 2012;52(2):198-203.
15. Tepper S, Allen C, Sanders D, et al. Coprescription of triptans with potentially interacting medications: a cohort study involving 240,268 patients. Headache. 2003;43(1):44-48.
In 2006, the FDA issued a warning of the risk of potentially fatal serotonin syndrome when 5-hydroxytryptamine receptor agonist antimigraine medications (triptans) and selective serotonin reuptake inhibitors (SSRIs) or serotonin-norepinephrine reuptake inhibitors (SNRI) are coprescribed.1 As a result, most drug interaction programs trigger a serotonin syndrome warning when triptans are prescribed with an SSRI or SNRI.2 However, many patients with depression or anxiety also suffer from migraines and require treatment with both triptans and an SSRI or SNRI.3,4 Kalaydjian et al4 found the incidence of major depression and generalized anxiety disorder were approximately 3 times greater in patients with migraines than in those without migraines. Should we avoid coprescribing triptans and SSRIs or SNRIs?
What is serotonin syndrome?
Serotonin syndrome is an adverse drug reaction that results from excessive serotonin stimulation. There are 2 sets of validated diagnostic criteria: the Sternbach Criteria and the Hunter Serotonin Toxicity Criteria; the latter is considered more stringent.3,5-7 Symptoms of serotonin syndrome include mental status changes, autonomic hyperactivity, and neuromuscular changes such as muscle rigidity.5-7 Typical manifestations of serotonin syndrome on physical exam include spontaneous and/or inducible clonus, agitation, diaphoresis, tremor, hyperreflexia, hypertonia, and temperature >38°C.6 In severe cases, serotonin syndrome can lead to seizures, coma, and death. Management includes supportive treatment, discontinuing the offending agents, controlling agitation with medications such as benzodiazepines, and possibly administering cyproheptadine, a 5HT2A antagonist.8 Most cases resolve within 24 hours of discontinuing the offending agents or appropriate treatment.5
What did the FDA say?
The 2006 FDA warning initially was based on 27 reports of serotonin syndrome in patients receiving triptans and SSRIs or SNRIs; this was later expanded to include 29 patients.1,9 No patients died but 13 required hospitalization and 2 had life-threatening symptoms. However, most cases lacked data necessary to diagnose serotonin syndrome.9 Further, reviews of the available clinical information have suggested that in some cases, clinicians did not rule out other disorders as required by diagnostic criteria, while others were viral in nature or resolved despite ongoing treatment with the presumed offending agents.9-11
Some clinicians met the FDA’s assessment with skepticism. Only 10 of the 29 cases met the Sternbach criteria of serotonin syndrome and none met the more rigorous Hunter criteria. Additionally, the theoretical basis has been questioned.9-11 Available evidence indicates that serotonin syndrome requires activation of 5HT2A receptors and a possible limited role of 5HT1A.9-12 However, triptans are agonists at the 5HT1B/1D/1F receptor subtypes, with weak affinity for 5HT1A receptors and no activity at the 5HT2 receptors.13,14 Additionally, triptan medications are used as needed, not as standing treatments, with parameters limiting the maximum dose, dosing interval, and frequency of use. In clinical practice, it appears that these dosing guidelines are being followed: Tepper et al15 found the typical female patient experiences 1 to 2 migraines per month; on average, patients use 1.2 to 1.8 triptan tablets per month.
Our opinion
We believe it is reasonable to coprescribe SSRIs or SNRIs with triptans because:
- data indicate that many patients are treated with a combination of triptans and SSRIs or SNRIs but the number of reported cases of serotonin syndrome is extremely limited
- the nature of serotonin syndrome cases reported in the literature is questionable
- the interaction is biologically implausible
- triptans remain in the body for a limited time
- triptans are used infrequently.5-11
This view is supported by the most recent American Headache Society position paper,11 which states that inadequate data are available to assess the risk but current evidence does not support limiting use of triptans with SSRIs and SNRIs.
How we deal with the warning in clinical practice. In practice we are alerted to this interaction by notification in our e-prescribing systems, by pharmacists calling with concerns about dispensing an SSRI or SNRI for a patient already receiving a triptan, and during patient visits that involve prescribing an SSRI or SNRI.
Although it is relatively easy to override a drug interaction warning in our e-prescribing system, we discuss the issue with pharmacists and patients. We provide information about the signs and symptoms of serotonin syndrome and its potential dangerousness. We note that serotonin syndrome is a theoretical concern, but highly unlikely with this combination of medications because of their pharmacologic properties. We explain the parameters of triptan use, recommend that our patients use triptans for migraines when needed, and reassure patients we are available to answer questions. When a patient uses triptans more than twice monthly, we consider discussing this usage with the patient and the treating physician.
Related Resource
- Sclar DA, Robison LM, Castillo LV, et al. Concomitant use of triptan, and SSRI or SNRI after the US Food and Drug Administration alert on serotonin syndrome. Headache. 2012. www.headachejournal.org/SpringboardWebApp/userfiles/headache/file/sclar.pdf.
Drug Brand Name
- Cyproheptadine • Perinctin
Disclosure
The authors report no financial relationship with any company whose products are mentioned in this article or with manufacturers of competing products.
In 2006, the FDA issued a warning of the risk of potentially fatal serotonin syndrome when 5-hydroxytryptamine receptor agonist antimigraine medications (triptans) and selective serotonin reuptake inhibitors (SSRIs) or serotonin-norepinephrine reuptake inhibitors (SNRI) are coprescribed.1 As a result, most drug interaction programs trigger a serotonin syndrome warning when triptans are prescribed with an SSRI or SNRI.2 However, many patients with depression or anxiety also suffer from migraines and require treatment with both triptans and an SSRI or SNRI.3,4 Kalaydjian et al4 found the incidence of major depression and generalized anxiety disorder were approximately 3 times greater in patients with migraines than in those without migraines. Should we avoid coprescribing triptans and SSRIs or SNRIs?
What is serotonin syndrome?
Serotonin syndrome is an adverse drug reaction that results from excessive serotonin stimulation. There are 2 sets of validated diagnostic criteria: the Sternbach Criteria and the Hunter Serotonin Toxicity Criteria; the latter is considered more stringent.3,5-7 Symptoms of serotonin syndrome include mental status changes, autonomic hyperactivity, and neuromuscular changes such as muscle rigidity.5-7 Typical manifestations of serotonin syndrome on physical exam include spontaneous and/or inducible clonus, agitation, diaphoresis, tremor, hyperreflexia, hypertonia, and temperature >38°C.6 In severe cases, serotonin syndrome can lead to seizures, coma, and death. Management includes supportive treatment, discontinuing the offending agents, controlling agitation with medications such as benzodiazepines, and possibly administering cyproheptadine, a 5HT2A antagonist.8 Most cases resolve within 24 hours of discontinuing the offending agents or appropriate treatment.5
What did the FDA say?
The 2006 FDA warning initially was based on 27 reports of serotonin syndrome in patients receiving triptans and SSRIs or SNRIs; this was later expanded to include 29 patients.1,9 No patients died but 13 required hospitalization and 2 had life-threatening symptoms. However, most cases lacked data necessary to diagnose serotonin syndrome.9 Further, reviews of the available clinical information have suggested that in some cases, clinicians did not rule out other disorders as required by diagnostic criteria, while others were viral in nature or resolved despite ongoing treatment with the presumed offending agents.9-11
Some clinicians met the FDA’s assessment with skepticism. Only 10 of the 29 cases met the Sternbach criteria of serotonin syndrome and none met the more rigorous Hunter criteria. Additionally, the theoretical basis has been questioned.9-11 Available evidence indicates that serotonin syndrome requires activation of 5HT2A receptors and a possible limited role of 5HT1A.9-12 However, triptans are agonists at the 5HT1B/1D/1F receptor subtypes, with weak affinity for 5HT1A receptors and no activity at the 5HT2 receptors.13,14 Additionally, triptan medications are used as needed, not as standing treatments, with parameters limiting the maximum dose, dosing interval, and frequency of use. In clinical practice, it appears that these dosing guidelines are being followed: Tepper et al15 found the typical female patient experiences 1 to 2 migraines per month; on average, patients use 1.2 to 1.8 triptan tablets per month.
Our opinion
We believe it is reasonable to coprescribe SSRIs or SNRIs with triptans because:
- data indicate that many patients are treated with a combination of triptans and SSRIs or SNRIs but the number of reported cases of serotonin syndrome is extremely limited
- the nature of serotonin syndrome cases reported in the literature is questionable
- the interaction is biologically implausible
- triptans remain in the body for a limited time
- triptans are used infrequently.5-11
This view is supported by the most recent American Headache Society position paper,11 which states that inadequate data are available to assess the risk but current evidence does not support limiting use of triptans with SSRIs and SNRIs.
How we deal with the warning in clinical practice. In practice we are alerted to this interaction by notification in our e-prescribing systems, by pharmacists calling with concerns about dispensing an SSRI or SNRI for a patient already receiving a triptan, and during patient visits that involve prescribing an SSRI or SNRI.
Although it is relatively easy to override a drug interaction warning in our e-prescribing system, we discuss the issue with pharmacists and patients. We provide information about the signs and symptoms of serotonin syndrome and its potential dangerousness. We note that serotonin syndrome is a theoretical concern, but highly unlikely with this combination of medications because of their pharmacologic properties. We explain the parameters of triptan use, recommend that our patients use triptans for migraines when needed, and reassure patients we are available to answer questions. When a patient uses triptans more than twice monthly, we consider discussing this usage with the patient and the treating physician.
Related Resource
- Sclar DA, Robison LM, Castillo LV, et al. Concomitant use of triptan, and SSRI or SNRI after the US Food and Drug Administration alert on serotonin syndrome. Headache. 2012. www.headachejournal.org/SpringboardWebApp/userfiles/headache/file/sclar.pdf.
Drug Brand Name
- Cyproheptadine • Perinctin
Disclosure
The authors report no financial relationship with any company whose products are mentioned in this article or with manufacturers of competing products.
1. U.S. Food and Drug Administration. Public health advisory—combined use of 5-hydroxytryptamine receptor agonists (triptans), selective serotonin reuptake inhibitors (SSRIs) or selective serotonin/norepinephrine reuptake inhibitors (SNRIs) may result in life-threatening serotonin syndrome. http://1.usa.gov/U0A0V4. Published July 19, 2006. Accessed September 18, 2012.
2. Kogut SJ. Do triptan antimigraine medications interact with SSRI/SNRI antidepressants? What does your decision support system say? J Manag Care Pharm. 2011;17(7):547-551.
3. Tepper SJ. Serotonin syndrome: SSRIs SNRIs, triptans, and current clinical practice. Headache. 2012;52(2):195-197.
4. Kalaydjian A, Merikangas K. Physical and mental comorbidity of headache in a nationally representative sample of US adults. Psychosom Med. 2008;70(7):773-780.
5. Boyer EW, Shannon M. The serotonin syndrome. N Engl J Med. 2005;352(11):1112-1120.
6. Sternbach H. The serotonin syndrome. Am J Psychiatry. 1991;148(6):705-713.
7. Dunkley EJ, Isbister GK, Sibbritt D, et al. The Hunter Serotonin Toxicity Criteria: simple and accurate diagnostic decision rules for serotonin toxicity. QJM. 2003;96(9):635-642.
8. Ables AZ, Nagubilli R. Prevention recognition, and management of serotonin syndrome. Am Fam Physician. 2010;81(9):1139-1142.
9. Evans RW. The FDA alert on serotonin syndrome with combined use of SSRIs or SNRIs and triptans: an analysis of the 29 case reports. MedGenMed. 2007;9(3):48.-
10. Gillman PK. Triptans serotonin agonists, and serotonin syndrome (serotonin toxicity): a review. Headache. 2010;50(2):264-272.
11. Evans RW, Tepper SJ, Shapiro RE, et al. The FDA alert on serotonin syndrome with use of triptans combined with selective serotonin reuptake inhibitors or selective serotonin-norepinephrine reuptake inhibitors: American Headache Society position paper. Headache. 2010;50(6):1089-1099.
12. Ahn AH, Basbaum AI. Where do triptans act in the treatment of migraine? Pain. 2005;115(1-2):1-4.
13. Pediatric & Neonatal Lexi-Drugs. Hudson, OH: Lexi-Comp, Inc.; 2011.
14. Sclar DA, Robison LM, Castillo LV, et al. Concomitant use of triptan, and SSRI or SNRI after the US Food and Drug Administration alert on serotonin syndrome. Headache. 2012;52(2):198-203.
15. Tepper S, Allen C, Sanders D, et al. Coprescription of triptans with potentially interacting medications: a cohort study involving 240,268 patients. Headache. 2003;43(1):44-48.
1. U.S. Food and Drug Administration. Public health advisory—combined use of 5-hydroxytryptamine receptor agonists (triptans), selective serotonin reuptake inhibitors (SSRIs) or selective serotonin/norepinephrine reuptake inhibitors (SNRIs) may result in life-threatening serotonin syndrome. http://1.usa.gov/U0A0V4. Published July 19, 2006. Accessed September 18, 2012.
2. Kogut SJ. Do triptan antimigraine medications interact with SSRI/SNRI antidepressants? What does your decision support system say? J Manag Care Pharm. 2011;17(7):547-551.
3. Tepper SJ. Serotonin syndrome: SSRIs SNRIs, triptans, and current clinical practice. Headache. 2012;52(2):195-197.
4. Kalaydjian A, Merikangas K. Physical and mental comorbidity of headache in a nationally representative sample of US adults. Psychosom Med. 2008;70(7):773-780.
5. Boyer EW, Shannon M. The serotonin syndrome. N Engl J Med. 2005;352(11):1112-1120.
6. Sternbach H. The serotonin syndrome. Am J Psychiatry. 1991;148(6):705-713.
7. Dunkley EJ, Isbister GK, Sibbritt D, et al. The Hunter Serotonin Toxicity Criteria: simple and accurate diagnostic decision rules for serotonin toxicity. QJM. 2003;96(9):635-642.
8. Ables AZ, Nagubilli R. Prevention recognition, and management of serotonin syndrome. Am Fam Physician. 2010;81(9):1139-1142.
9. Evans RW. The FDA alert on serotonin syndrome with combined use of SSRIs or SNRIs and triptans: an analysis of the 29 case reports. MedGenMed. 2007;9(3):48.-
10. Gillman PK. Triptans serotonin agonists, and serotonin syndrome (serotonin toxicity): a review. Headache. 2010;50(2):264-272.
11. Evans RW, Tepper SJ, Shapiro RE, et al. The FDA alert on serotonin syndrome with use of triptans combined with selective serotonin reuptake inhibitors or selective serotonin-norepinephrine reuptake inhibitors: American Headache Society position paper. Headache. 2010;50(6):1089-1099.
12. Ahn AH, Basbaum AI. Where do triptans act in the treatment of migraine? Pain. 2005;115(1-2):1-4.
13. Pediatric & Neonatal Lexi-Drugs. Hudson, OH: Lexi-Comp, Inc.; 2011.
14. Sclar DA, Robison LM, Castillo LV, et al. Concomitant use of triptan, and SSRI or SNRI after the US Food and Drug Administration alert on serotonin syndrome. Headache. 2012;52(2):198-203.
15. Tepper S, Allen C, Sanders D, et al. Coprescription of triptans with potentially interacting medications: a cohort study involving 240,268 patients. Headache. 2003;43(1):44-48.
Management of dermatological toxicities in patients receiving EGFR inhibitors
Patients receiving treatment with epidermal growth factor receptor inhibitors often experience dermatological toxicities. The majority of patients develop skin rash, and may also experience adverse nail and periungual alterations. EGFR inhibitors have become part of the standard of care for several solid tumors, including metastatic colorectal cancer, cancers of the head and neck, and non small-cell lung cancer, thus adequate management of these side effects is necessary to ensure patient compliance to therapy, as well as to maximize patient comfort and quality of life. This review presents a protocol our center optimized to successfully manage cetuximab-associated acneiform rash and nail toxicities.
Click on the PDF icon at the top of this introduction to read the full article.
Patients receiving treatment with epidermal growth factor receptor inhibitors often experience dermatological toxicities. The majority of patients develop skin rash, and may also experience adverse nail and periungual alterations. EGFR inhibitors have become part of the standard of care for several solid tumors, including metastatic colorectal cancer, cancers of the head and neck, and non small-cell lung cancer, thus adequate management of these side effects is necessary to ensure patient compliance to therapy, as well as to maximize patient comfort and quality of life. This review presents a protocol our center optimized to successfully manage cetuximab-associated acneiform rash and nail toxicities.
Click on the PDF icon at the top of this introduction to read the full article.
Patients receiving treatment with epidermal growth factor receptor inhibitors often experience dermatological toxicities. The majority of patients develop skin rash, and may also experience adverse nail and periungual alterations. EGFR inhibitors have become part of the standard of care for several solid tumors, including metastatic colorectal cancer, cancers of the head and neck, and non small-cell lung cancer, thus adequate management of these side effects is necessary to ensure patient compliance to therapy, as well as to maximize patient comfort and quality of life. This review presents a protocol our center optimized to successfully manage cetuximab-associated acneiform rash and nail toxicities.
Click on the PDF icon at the top of this introduction to read the full article.
Hypertension in cancer patients
Hypertension is the force of blood pushing against the walls of the arteries. It is measured as systolic pressure when the heart beats and pumps blood and as diastolic pressure in the arteries when the heart rests between beats. There are 4 stages in blood pressure classification—normal, prehypertension, stage 1, and stage 2. Hypertension affects approximately 50 million people in the United States and 1 billion people worldwide. People who are normotensive at age 55 years have a 90% chance of developing hypertension in their lifetime. Starting with a blood pressure of 115/75 mmHg, the risk of cardiovascular death doubles with each 20/10 mmHg increment...
*For PDFs of the full article and related Commentary, click on the links to the left of this introduction.
Hypertension is the force of blood pushing against the walls of the arteries. It is measured as systolic pressure when the heart beats and pumps blood and as diastolic pressure in the arteries when the heart rests between beats. There are 4 stages in blood pressure classification—normal, prehypertension, stage 1, and stage 2. Hypertension affects approximately 50 million people in the United States and 1 billion people worldwide. People who are normotensive at age 55 years have a 90% chance of developing hypertension in their lifetime. Starting with a blood pressure of 115/75 mmHg, the risk of cardiovascular death doubles with each 20/10 mmHg increment...
*For PDFs of the full article and related Commentary, click on the links to the left of this introduction.
Hypertension is the force of blood pushing against the walls of the arteries. It is measured as systolic pressure when the heart beats and pumps blood and as diastolic pressure in the arteries when the heart rests between beats. There are 4 stages in blood pressure classification—normal, prehypertension, stage 1, and stage 2. Hypertension affects approximately 50 million people in the United States and 1 billion people worldwide. People who are normotensive at age 55 years have a 90% chance of developing hypertension in their lifetime. Starting with a blood pressure of 115/75 mmHg, the risk of cardiovascular death doubles with each 20/10 mmHg increment...
*For PDFs of the full article and related Commentary, click on the links to the left of this introduction.
Recent developments in the treatment of high-grade gliomas
Patients with glioblastoma and other high-grade gliomas have poor outcomes and are challenging to treat. The relative rarity of these tumors has made large-scale, practice-changing trials difficult to accomplish and has led to the formation of large multinational organizations that focus on neuro-oncology. This has resulted in the rapid completion of several large trials that in some cases have set new standards of care that can offer increased progression-free and overall survivals for some patients. The incorporation of correlative tissue studies in these trials has led to the identification of prognostic and predictive genetic markers that demonstrate the heterogeneity of these tumors and will assist in developing individualized treatment strategies as research continues to uncover new therapeutic targets. This review of recently completed and in-progress phase 3 trials in high-grade gliomas highlights the developments and future directions in the treatment of these tumors...
*For PDFs of the full article and related Commentary, click on the links to the left of this introduction.
Patients with glioblastoma and other high-grade gliomas have poor outcomes and are challenging to treat. The relative rarity of these tumors has made large-scale, practice-changing trials difficult to accomplish and has led to the formation of large multinational organizations that focus on neuro-oncology. This has resulted in the rapid completion of several large trials that in some cases have set new standards of care that can offer increased progression-free and overall survivals for some patients. The incorporation of correlative tissue studies in these trials has led to the identification of prognostic and predictive genetic markers that demonstrate the heterogeneity of these tumors and will assist in developing individualized treatment strategies as research continues to uncover new therapeutic targets. This review of recently completed and in-progress phase 3 trials in high-grade gliomas highlights the developments and future directions in the treatment of these tumors...
*For PDFs of the full article and related Commentary, click on the links to the left of this introduction.
Patients with glioblastoma and other high-grade gliomas have poor outcomes and are challenging to treat. The relative rarity of these tumors has made large-scale, practice-changing trials difficult to accomplish and has led to the formation of large multinational organizations that focus on neuro-oncology. This has resulted in the rapid completion of several large trials that in some cases have set new standards of care that can offer increased progression-free and overall survivals for some patients. The incorporation of correlative tissue studies in these trials has led to the identification of prognostic and predictive genetic markers that demonstrate the heterogeneity of these tumors and will assist in developing individualized treatment strategies as research continues to uncover new therapeutic targets. This review of recently completed and in-progress phase 3 trials in high-grade gliomas highlights the developments and future directions in the treatment of these tumors...
*For PDFs of the full article and related Commentary, click on the links to the left of this introduction.
Second TNF-Blocker Approved for Refractory Ulcerative Colitis
Adalimumab, a subcutaneously administered tumor necrosis factor blocker, has been approved for treating adults with moderately to severely active ulcerative colitis who have not had an adequate response with conventional treatments, the Food and Drug Administration announced on Sept. 28.
The safety and effectiveness of adalimumab for this patient population was established in two clinical studies of 908 patients with moderately to severely active ulcerative colitis (UC).

Adalimumab, marketed as Humira by Abbott Laboratories, was first approved for treating rheumatoid arthritis in 2002, followed by psoriatic arthritis in 2005, ankylosing spondylitis in 2006, Crohn’s disease in 2007, and plaque psoriasis and juvenile idiopathic arthritis in 2008.
Adalimumab is the second TNF blocker to be approved for ulcerative colitis; infliximab (Remicade), an intravenous TNF blocker, was previously approved for treating UC.
Clinical remission rates in the two studies were significantly greater among patients treated with infliximab than among those who received placebo: In an 8-week study, which did not include patients who had previously been treated with a TNF blocker, the clinical remission rate at 8 weeks was 18.5% among those on adalimumab vs. 9.2% in those on placebo, a 9.3% difference. In the second study, which followed patients for 1 year and included some who had been treated with infliximab, the clinical remission rate at 8 weeks was 16.5% among those on adalimumab, vs. 9.3% among those on placebo, a 7.2% difference.
At a meeting on Aug. 28 held to review these data, the majority of the FDA’s Gastrointestinal Drugs Advisory Committee agreed that these differences represented clinically meaningful benefits and supported approval of adalimumab for this indication. Panelists cited the need for more treatments for UC and for a subcutaneous TNF blocker for these patients, as well as its potential steroid-sparing effects.
In the studies, no new side effects were identified, the agency said. The FDA statement points out that the effectiveness of adalimumab "has not been established in patients with ulcerative colitis who have lost response to or were intolerant to TNF blockers."
The approved dosing regimen for adalimumab is a starting dose of 160 mg, followed by a second dose of 80 mg 2 weeks later and then a maintenance dose of 40 mg every other week. "The drug should only continue to be used in patients who have shown evidence of clinical remission by 8 weeks of therapy," according to the FDA statement.
Adalimumab is the first self-administered biologic treatment for ulcerative colitis to be approved.
Adalimumab, a subcutaneously administered tumor necrosis factor blocker, has been approved for treating adults with moderately to severely active ulcerative colitis who have not had an adequate response with conventional treatments, the Food and Drug Administration announced on Sept. 28.
The safety and effectiveness of adalimumab for this patient population was established in two clinical studies of 908 patients with moderately to severely active ulcerative colitis (UC).
Adalimumab, marketed as Humira by Abbott Laboratories, was first approved for treating rheumatoid arthritis in 2002, followed by psoriatic arthritis in 2005, ankylosing spondylitis in 2006, Crohn’s disease in 2007, and plaque psoriasis and juvenile idiopathic arthritis in 2008.
Adalimumab is the second TNF blocker to be approved for ulcerative colitis; infliximab (Remicade), an intravenous TNF blocker, was previously approved for treating UC.
Clinical remission rates in the two studies were significantly greater among patients treated with infliximab than among those who received placebo: In an 8-week study, which did not include patients who had previously been treated with a TNF blocker, the clinical remission rate at 8 weeks was 18.5% among those on adalimumab vs. 9.2% in those on placebo, a 9.3% difference. In the second study, which followed patients for 1 year and included some who had been treated with infliximab, the clinical remission rate at 8 weeks was 16.5% among those on adalimumab, vs. 9.3% among those on placebo, a 7.2% difference.
At a meeting on Aug. 28 held to review these data, the majority of the FDA’s Gastrointestinal Drugs Advisory Committee agreed that these differences represented clinically meaningful benefits and supported approval of adalimumab for this indication. Panelists cited the need for more treatments for UC and for a subcutaneous TNF blocker for these patients, as well as its potential steroid-sparing effects.
In the studies, no new side effects were identified, the agency said. The FDA statement points out that the effectiveness of adalimumab "has not been established in patients with ulcerative colitis who have lost response to or were intolerant to TNF blockers."
The approved dosing regimen for adalimumab is a starting dose of 160 mg, followed by a second dose of 80 mg 2 weeks later and then a maintenance dose of 40 mg every other week. "The drug should only continue to be used in patients who have shown evidence of clinical remission by 8 weeks of therapy," according to the FDA statement.
Adalimumab is the first self-administered biologic treatment for ulcerative colitis to be approved.
Adalimumab, a subcutaneously administered tumor necrosis factor blocker, has been approved for treating adults with moderately to severely active ulcerative colitis who have not had an adequate response with conventional treatments, the Food and Drug Administration announced on Sept. 28.
The safety and effectiveness of adalimumab for this patient population was established in two clinical studies of 908 patients with moderately to severely active ulcerative colitis (UC).
Adalimumab, marketed as Humira by Abbott Laboratories, was first approved for treating rheumatoid arthritis in 2002, followed by psoriatic arthritis in 2005, ankylosing spondylitis in 2006, Crohn’s disease in 2007, and plaque psoriasis and juvenile idiopathic arthritis in 2008.
Adalimumab is the second TNF blocker to be approved for ulcerative colitis; infliximab (Remicade), an intravenous TNF blocker, was previously approved for treating UC.
Clinical remission rates in the two studies were significantly greater among patients treated with infliximab than among those who received placebo: In an 8-week study, which did not include patients who had previously been treated with a TNF blocker, the clinical remission rate at 8 weeks was 18.5% among those on adalimumab vs. 9.2% in those on placebo, a 9.3% difference. In the second study, which followed patients for 1 year and included some who had been treated with infliximab, the clinical remission rate at 8 weeks was 16.5% among those on adalimumab, vs. 9.3% among those on placebo, a 7.2% difference.
At a meeting on Aug. 28 held to review these data, the majority of the FDA’s Gastrointestinal Drugs Advisory Committee agreed that these differences represented clinically meaningful benefits and supported approval of adalimumab for this indication. Panelists cited the need for more treatments for UC and for a subcutaneous TNF blocker for these patients, as well as its potential steroid-sparing effects.
In the studies, no new side effects were identified, the agency said. The FDA statement points out that the effectiveness of adalimumab "has not been established in patients with ulcerative colitis who have lost response to or were intolerant to TNF blockers."
The approved dosing regimen for adalimumab is a starting dose of 160 mg, followed by a second dose of 80 mg 2 weeks later and then a maintenance dose of 40 mg every other week. "The drug should only continue to be used in patients who have shown evidence of clinical remission by 8 weeks of therapy," according to the FDA statement.
Adalimumab is the first self-administered biologic treatment for ulcerative colitis to be approved.

New Gout Guidelines Inspired by Recent Data
The first guidelines on the management of gout from the American College of Rheumatology recommend new ways of using old drugs and changes in prophylaxis strategies, among other things.
The two-part guidelines, published online Sept. 28, should help speed up effective treatment of gout and get physicians to treat patients to a target urate level of less than 6 mg/dL in order to improve symptoms, Dr. John D. FitzGerald said in an interview.
"There has been a fair amount of recent movement on gout medications" including new alternatives to allopurinol and colchicine and new data on how to use those traditional drugs in safer ways, said Dr. FitzGerald, acting chief of the rheumatology division at the University of California, Los Angeles. "It’s a fair number of changes for medications that people had been using for decades."
The documents update previous guidelines from medical organizations in Europe, the Netherlands, and Japan. The new guidelines will be published in October 2012 by the journal Arthritis Care & Research.
Part 1 of the American College of Rheumatology (ACR) guidelines covers nonpharmacologic and pharmacologic approaches to managing hyperuricemia (Arthritis Care Res. 2012;64:1431-46 [doi:10.1002/acr.21772]).
Part 2 addresses prophylaxis and treatment for acute gouty arthritis (Arthritis Care Res. 2012;64:1447-61 [doi.wiley.com/10.1002/acr.21773]).
Dr. FitzGerald and two other co-leaders of the project, Dr. Dinesh Khanna of the University of Michigan, Ann Arbor and Dr. Robert Terkeltaub of the University of California, San Diego, reviewed the medical literature on gout from the 1950s to the present and drew up nine clinical case scenarios commonly seen in practice. A task force panel comprising seven rheumatologists, two primary care physicians, a nephrologist, and a patient representative used the scenarios to create consensus recommendations.
Among the recommendations, for example, on the use of allopurinol is to start at a low dose of 100 mg/day (instead of the common practice of starting with 300 mg/day), or even lower for patients with chronic kidney disease, and then gradually titrate upward every 2-5 weeks. That recommendation supports previous statements from the Food and Drug Administration and the European League Against Rheumatism.
Also, allopurinol therapy should be actively managed and patients followed to make sure the uric acid target is achieved. "You can’t just give a prescription and say your job is done," though some recent studies suggest that many physicians do just that, Dr. FitzGerald said. "The corollary would be if someone gave blood pressure medication and then didn’t follow the patient’s blood pressure. That wouldn’t be seen as good medicine."
Maintenance doses of allopurinol to prevent acute gout attacks can exceed 300 mg even in patients with chronic kidney disease provided there is adequate patient education and monitoring.
A new recommendation drops the starting dose of oral colchicine for acute gout attacks to a loading dose of 1.2 mg, followed by 0.6 mg an hour later, and then starting prophylaxis 12 hours later at dosing of 0.6 mg once or twice daily.
"We used to give up to eight tablets a day," Dr. FitzGerald said. "That is dropped down to three to four tablets at the start of an attacks, because of findings that more colchicine didn’t really help outcomes" and that smaller doses are safer. The authors called this recommendation from ACR "a paradigm shift" that’s in accordance with Food and Drug Administration-approved label language.
Other highlights of the new ACR recommendations include sections on screening for HLA-B*5801 in patients at high risk of severe adverse reaction to allopurinol, combination therapy when target urate levels are not achieved, medication options including new drugs, and more.
Although the reports are titled "Guidelines," the text makes clear that they are expert recommendations and that clinicians are expected to take active roles in choosing the best management strategies for their particular patients. The authors were "very concerned" that the guidelines not be used by third-party payers to restrict access to medications or to promote one drug over another if there isn’t clear evidence to support it, Dr. FitzGerald said.
The methodology of the project precluded evaluations of costs and cost effectiveness, instead focusing on efficacy. So, for example, the guidelines say that allopurinol and febuxostat can be used equivalently in some circumstances, but clinicians need to consider all other aspects of these options including cost, patient preference, and more.
The ACR plans to update the guidelines as new data become available. The task force panel did create specific indications for use of imaging studies because results should be available in the next few years from studies on the use of high-resolution ultrasound and dual-energy CT for patients with gout.
In the United States, gout affects an estimated 4% of adults – more than 8 million people.
"I’m most excited and hopeful about trying to get this out to internal medicine and family practice doctors," Dr. FitzGerald said. "They see more gout than rheumatologists."
Dr. FitzGerald reported having no financial disclosures. Some members of the task force reported financial associations with multiple pharmaceutical companies but, by design, a majority of task force members had no perceived potential conflicts of interest.
Writing guidelines on gout is a difficult task. I think they made a very good effort to cover as many treatment issues as they could.
Most patients with gout in the United States are cared for by primary care physicians. The guidelines will be helpful to both primary practitioners and rheumatologists, but the subtleties may be lost on the general practitioner, whereas the rheumatologist would pick these up right away. The devil is often in the details when it comes to treating gout. If physicians use the guidelines employing a cookbook approach, they might run into some problems.
For instance, the guidelines cover the use of colchicine as a first-line agent for an acute attack: It’s a good choice, but even the randomized controlled trials that have been published on this, especially using the low-dose approach, show that a significant proportion of patients will not respond to this regimen. The guidelines recommend a dosage higher than what has been advised previously for the low-dose colchicine approach. This may actually be a better method, so I hope this will allow primary practitioners to be able identify more people using this approach. But there are definitely going to be people who do not respond to the colchicine.
Another example of where the guidelines may mislead primary care physicians is the recommendation on when to start urate-lowering therapy (ULT). Their indications for starting pharmacologic ULT include an established diagnosis of gouty arthritis and at least two attacks per year. My colleagues and I think that may exclude too many people. Theoretically, you could have a patient with one attack per year who is having gout-related joint damage and, with this criteria, wouldn’t qualify for ULT. A rheumatologist would pick that up right away, but general practitioners who adhere to these guidelines might end up undertreating some patients.
Also, they recommend using adrenocorticotropic hormone (ACTH) for people who cannot take oral medications. Not only is ACTH is extremely expensive, but the Food and Drug Administration has taken gout off the list of indications for ACTH, so I doubt it would be readily available in a real clinical situation.
When the recommendations discuss using prednisone as a prophylactic against gout attacks, they suggest using 10 mg or less. I think that the authors are trying for the best of both worlds and ending up not having either. We generally try to avoid using steroids long term, so the authors suggest using low-dose prednisone; the problem is that 10 mg would probably be ineffective. There are data suggesting that gout prophylaxis requires higher doses, maybe as much as 20 mg/day. You could try 10 mg but I anticipate that it is not going to work very well.
In their defense, were the authors to go into the subtleties and side effects, what to do with a patient with liver or coronary disease, or issues of cost effectiveness, the guidelines would have become an unmanageable length. But the devil is in the details.
That said, it’s a major effort here. It’s good work. They tried to answer a lot of questions.
Dr. Christopher M. Burns is a rheumatologist at the Geisel School of Medicine at Dartmouth, Hanover, N.H. He reported having no financial disclosures.
Writing guidelines on gout is a difficult task. I think they made a very good effort to cover as many treatment issues as they could.
Most patients with gout in the United States are cared for by primary care physicians. The guidelines will be helpful to both primary practitioners and rheumatologists, but the subtleties may be lost on the general practitioner, whereas the rheumatologist would pick these up right away. The devil is often in the details when it comes to treating gout. If physicians use the guidelines employing a cookbook approach, they might run into some problems.
For instance, the guidelines cover the use of colchicine as a first-line agent for an acute attack: It’s a good choice, but even the randomized controlled trials that have been published on this, especially using the low-dose approach, show that a significant proportion of patients will not respond to this regimen. The guidelines recommend a dosage higher than what has been advised previously for the low-dose colchicine approach. This may actually be a better method, so I hope this will allow primary practitioners to be able identify more people using this approach. But there are definitely going to be people who do not respond to the colchicine.
Another example of where the guidelines may mislead primary care physicians is the recommendation on when to start urate-lowering therapy (ULT). Their indications for starting pharmacologic ULT include an established diagnosis of gouty arthritis and at least two attacks per year. My colleagues and I think that may exclude too many people. Theoretically, you could have a patient with one attack per year who is having gout-related joint damage and, with this criteria, wouldn’t qualify for ULT. A rheumatologist would pick that up right away, but general practitioners who adhere to these guidelines might end up undertreating some patients.
Also, they recommend using adrenocorticotropic hormone (ACTH) for people who cannot take oral medications. Not only is ACTH is extremely expensive, but the Food and Drug Administration has taken gout off the list of indications for ACTH, so I doubt it would be readily available in a real clinical situation.
When the recommendations discuss using prednisone as a prophylactic against gout attacks, they suggest using 10 mg or less. I think that the authors are trying for the best of both worlds and ending up not having either. We generally try to avoid using steroids long term, so the authors suggest using low-dose prednisone; the problem is that 10 mg would probably be ineffective. There are data suggesting that gout prophylaxis requires higher doses, maybe as much as 20 mg/day. You could try 10 mg but I anticipate that it is not going to work very well.
In their defense, were the authors to go into the subtleties and side effects, what to do with a patient with liver or coronary disease, or issues of cost effectiveness, the guidelines would have become an unmanageable length. But the devil is in the details.
That said, it’s a major effort here. It’s good work. They tried to answer a lot of questions.
Dr. Christopher M. Burns is a rheumatologist at the Geisel School of Medicine at Dartmouth, Hanover, N.H. He reported having no financial disclosures.
Writing guidelines on gout is a difficult task. I think they made a very good effort to cover as many treatment issues as they could.
Most patients with gout in the United States are cared for by primary care physicians. The guidelines will be helpful to both primary practitioners and rheumatologists, but the subtleties may be lost on the general practitioner, whereas the rheumatologist would pick these up right away. The devil is often in the details when it comes to treating gout. If physicians use the guidelines employing a cookbook approach, they might run into some problems.
For instance, the guidelines cover the use of colchicine as a first-line agent for an acute attack: It’s a good choice, but even the randomized controlled trials that have been published on this, especially using the low-dose approach, show that a significant proportion of patients will not respond to this regimen. The guidelines recommend a dosage higher than what has been advised previously for the low-dose colchicine approach. This may actually be a better method, so I hope this will allow primary practitioners to be able identify more people using this approach. But there are definitely going to be people who do not respond to the colchicine.
Another example of where the guidelines may mislead primary care physicians is the recommendation on when to start urate-lowering therapy (ULT). Their indications for starting pharmacologic ULT include an established diagnosis of gouty arthritis and at least two attacks per year. My colleagues and I think that may exclude too many people. Theoretically, you could have a patient with one attack per year who is having gout-related joint damage and, with this criteria, wouldn’t qualify for ULT. A rheumatologist would pick that up right away, but general practitioners who adhere to these guidelines might end up undertreating some patients.
Also, they recommend using adrenocorticotropic hormone (ACTH) for people who cannot take oral medications. Not only is ACTH is extremely expensive, but the Food and Drug Administration has taken gout off the list of indications for ACTH, so I doubt it would be readily available in a real clinical situation.
When the recommendations discuss using prednisone as a prophylactic against gout attacks, they suggest using 10 mg or less. I think that the authors are trying for the best of both worlds and ending up not having either. We generally try to avoid using steroids long term, so the authors suggest using low-dose prednisone; the problem is that 10 mg would probably be ineffective. There are data suggesting that gout prophylaxis requires higher doses, maybe as much as 20 mg/day. You could try 10 mg but I anticipate that it is not going to work very well.
In their defense, were the authors to go into the subtleties and side effects, what to do with a patient with liver or coronary disease, or issues of cost effectiveness, the guidelines would have become an unmanageable length. But the devil is in the details.
That said, it’s a major effort here. It’s good work. They tried to answer a lot of questions.
Dr. Christopher M. Burns is a rheumatologist at the Geisel School of Medicine at Dartmouth, Hanover, N.H. He reported having no financial disclosures.
The first guidelines on the management of gout from the American College of Rheumatology recommend new ways of using old drugs and changes in prophylaxis strategies, among other things.
The two-part guidelines, published online Sept. 28, should help speed up effective treatment of gout and get physicians to treat patients to a target urate level of less than 6 mg/dL in order to improve symptoms, Dr. John D. FitzGerald said in an interview.
"There has been a fair amount of recent movement on gout medications" including new alternatives to allopurinol and colchicine and new data on how to use those traditional drugs in safer ways, said Dr. FitzGerald, acting chief of the rheumatology division at the University of California, Los Angeles. "It’s a fair number of changes for medications that people had been using for decades."
The documents update previous guidelines from medical organizations in Europe, the Netherlands, and Japan. The new guidelines will be published in October 2012 by the journal Arthritis Care & Research.
Part 1 of the American College of Rheumatology (ACR) guidelines covers nonpharmacologic and pharmacologic approaches to managing hyperuricemia (Arthritis Care Res. 2012;64:1431-46 [doi:10.1002/acr.21772]).
Part 2 addresses prophylaxis and treatment for acute gouty arthritis (Arthritis Care Res. 2012;64:1447-61 [doi.wiley.com/10.1002/acr.21773]).
Dr. FitzGerald and two other co-leaders of the project, Dr. Dinesh Khanna of the University of Michigan, Ann Arbor and Dr. Robert Terkeltaub of the University of California, San Diego, reviewed the medical literature on gout from the 1950s to the present and drew up nine clinical case scenarios commonly seen in practice. A task force panel comprising seven rheumatologists, two primary care physicians, a nephrologist, and a patient representative used the scenarios to create consensus recommendations.
Among the recommendations, for example, on the use of allopurinol is to start at a low dose of 100 mg/day (instead of the common practice of starting with 300 mg/day), or even lower for patients with chronic kidney disease, and then gradually titrate upward every 2-5 weeks. That recommendation supports previous statements from the Food and Drug Administration and the European League Against Rheumatism.
Also, allopurinol therapy should be actively managed and patients followed to make sure the uric acid target is achieved. "You can’t just give a prescription and say your job is done," though some recent studies suggest that many physicians do just that, Dr. FitzGerald said. "The corollary would be if someone gave blood pressure medication and then didn’t follow the patient’s blood pressure. That wouldn’t be seen as good medicine."
Maintenance doses of allopurinol to prevent acute gout attacks can exceed 300 mg even in patients with chronic kidney disease provided there is adequate patient education and monitoring.
A new recommendation drops the starting dose of oral colchicine for acute gout attacks to a loading dose of 1.2 mg, followed by 0.6 mg an hour later, and then starting prophylaxis 12 hours later at dosing of 0.6 mg once or twice daily.
"We used to give up to eight tablets a day," Dr. FitzGerald said. "That is dropped down to three to four tablets at the start of an attacks, because of findings that more colchicine didn’t really help outcomes" and that smaller doses are safer. The authors called this recommendation from ACR "a paradigm shift" that’s in accordance with Food and Drug Administration-approved label language.
Other highlights of the new ACR recommendations include sections on screening for HLA-B*5801 in patients at high risk of severe adverse reaction to allopurinol, combination therapy when target urate levels are not achieved, medication options including new drugs, and more.
Although the reports are titled "Guidelines," the text makes clear that they are expert recommendations and that clinicians are expected to take active roles in choosing the best management strategies for their particular patients. The authors were "very concerned" that the guidelines not be used by third-party payers to restrict access to medications or to promote one drug over another if there isn’t clear evidence to support it, Dr. FitzGerald said.
The methodology of the project precluded evaluations of costs and cost effectiveness, instead focusing on efficacy. So, for example, the guidelines say that allopurinol and febuxostat can be used equivalently in some circumstances, but clinicians need to consider all other aspects of these options including cost, patient preference, and more.
The ACR plans to update the guidelines as new data become available. The task force panel did create specific indications for use of imaging studies because results should be available in the next few years from studies on the use of high-resolution ultrasound and dual-energy CT for patients with gout.
In the United States, gout affects an estimated 4% of adults – more than 8 million people.
"I’m most excited and hopeful about trying to get this out to internal medicine and family practice doctors," Dr. FitzGerald said. "They see more gout than rheumatologists."
Dr. FitzGerald reported having no financial disclosures. Some members of the task force reported financial associations with multiple pharmaceutical companies but, by design, a majority of task force members had no perceived potential conflicts of interest.
The first guidelines on the management of gout from the American College of Rheumatology recommend new ways of using old drugs and changes in prophylaxis strategies, among other things.
The two-part guidelines, published online Sept. 28, should help speed up effective treatment of gout and get physicians to treat patients to a target urate level of less than 6 mg/dL in order to improve symptoms, Dr. John D. FitzGerald said in an interview.
"There has been a fair amount of recent movement on gout medications" including new alternatives to allopurinol and colchicine and new data on how to use those traditional drugs in safer ways, said Dr. FitzGerald, acting chief of the rheumatology division at the University of California, Los Angeles. "It’s a fair number of changes for medications that people had been using for decades."
The documents update previous guidelines from medical organizations in Europe, the Netherlands, and Japan. The new guidelines will be published in October 2012 by the journal Arthritis Care & Research.
Part 1 of the American College of Rheumatology (ACR) guidelines covers nonpharmacologic and pharmacologic approaches to managing hyperuricemia (Arthritis Care Res. 2012;64:1431-46 [doi:10.1002/acr.21772]).
Part 2 addresses prophylaxis and treatment for acute gouty arthritis (Arthritis Care Res. 2012;64:1447-61 [doi.wiley.com/10.1002/acr.21773]).
Dr. FitzGerald and two other co-leaders of the project, Dr. Dinesh Khanna of the University of Michigan, Ann Arbor and Dr. Robert Terkeltaub of the University of California, San Diego, reviewed the medical literature on gout from the 1950s to the present and drew up nine clinical case scenarios commonly seen in practice. A task force panel comprising seven rheumatologists, two primary care physicians, a nephrologist, and a patient representative used the scenarios to create consensus recommendations.
Among the recommendations, for example, on the use of allopurinol is to start at a low dose of 100 mg/day (instead of the common practice of starting with 300 mg/day), or even lower for patients with chronic kidney disease, and then gradually titrate upward every 2-5 weeks. That recommendation supports previous statements from the Food and Drug Administration and the European League Against Rheumatism.
Also, allopurinol therapy should be actively managed and patients followed to make sure the uric acid target is achieved. "You can’t just give a prescription and say your job is done," though some recent studies suggest that many physicians do just that, Dr. FitzGerald said. "The corollary would be if someone gave blood pressure medication and then didn’t follow the patient’s blood pressure. That wouldn’t be seen as good medicine."
Maintenance doses of allopurinol to prevent acute gout attacks can exceed 300 mg even in patients with chronic kidney disease provided there is adequate patient education and monitoring.
A new recommendation drops the starting dose of oral colchicine for acute gout attacks to a loading dose of 1.2 mg, followed by 0.6 mg an hour later, and then starting prophylaxis 12 hours later at dosing of 0.6 mg once or twice daily.
"We used to give up to eight tablets a day," Dr. FitzGerald said. "That is dropped down to three to four tablets at the start of an attacks, because of findings that more colchicine didn’t really help outcomes" and that smaller doses are safer. The authors called this recommendation from ACR "a paradigm shift" that’s in accordance with Food and Drug Administration-approved label language.
Other highlights of the new ACR recommendations include sections on screening for HLA-B*5801 in patients at high risk of severe adverse reaction to allopurinol, combination therapy when target urate levels are not achieved, medication options including new drugs, and more.
Although the reports are titled "Guidelines," the text makes clear that they are expert recommendations and that clinicians are expected to take active roles in choosing the best management strategies for their particular patients. The authors were "very concerned" that the guidelines not be used by third-party payers to restrict access to medications or to promote one drug over another if there isn’t clear evidence to support it, Dr. FitzGerald said.
The methodology of the project precluded evaluations of costs and cost effectiveness, instead focusing on efficacy. So, for example, the guidelines say that allopurinol and febuxostat can be used equivalently in some circumstances, but clinicians need to consider all other aspects of these options including cost, patient preference, and more.
The ACR plans to update the guidelines as new data become available. The task force panel did create specific indications for use of imaging studies because results should be available in the next few years from studies on the use of high-resolution ultrasound and dual-energy CT for patients with gout.
In the United States, gout affects an estimated 4% of adults – more than 8 million people.
"I’m most excited and hopeful about trying to get this out to internal medicine and family practice doctors," Dr. FitzGerald said. "They see more gout than rheumatologists."
Dr. FitzGerald reported having no financial disclosures. Some members of the task force reported financial associations with multiple pharmaceutical companies but, by design, a majority of task force members had no perceived potential conflicts of interest.
Childhood Problem Flares at Age 50
ANSWER
The correct interpretation includes normal sinus rhythm, right bundle branch block, and left anterior fascicular block. Normal sinus rhythm is evidenced by a rate between 60 and 100 beats/min, with a corresponding P for every QRS and a QRS for every P.
Right bundle branch block is evidenced by a QRS duration > 120 ms, a terminal broad S wave in lead I, and an RSR’ complex in lead V1. Left anterior fascicular block is evident from the finding that the S waves are greater than the R waves in leads II, III, and aVF.
The presence of a right ventricular block and left anterior fascicular block (bifascicular block) is consistent with a history of a VSD and/or surgical repair. The right and left bundles proceed from the atrioventricular node and bundle of His down the ventricular septum to the Purkinje fibers in the distal ventricular myocardium. Therefore, congenital anomalies of the ventricular septum, and/or surgical intervention within it, often affect conduction of the right and/or left bundle.
This patient’s symptoms were a result of his dilated aorta, and he underwent successful repair, with resolution of his symptoms.
ANSWER
The correct interpretation includes normal sinus rhythm, right bundle branch block, and left anterior fascicular block. Normal sinus rhythm is evidenced by a rate between 60 and 100 beats/min, with a corresponding P for every QRS and a QRS for every P.
Right bundle branch block is evidenced by a QRS duration > 120 ms, a terminal broad S wave in lead I, and an RSR’ complex in lead V1. Left anterior fascicular block is evident from the finding that the S waves are greater than the R waves in leads II, III, and aVF.
The presence of a right ventricular block and left anterior fascicular block (bifascicular block) is consistent with a history of a VSD and/or surgical repair. The right and left bundles proceed from the atrioventricular node and bundle of His down the ventricular septum to the Purkinje fibers in the distal ventricular myocardium. Therefore, congenital anomalies of the ventricular septum, and/or surgical intervention within it, often affect conduction of the right and/or left bundle.
This patient’s symptoms were a result of his dilated aorta, and he underwent successful repair, with resolution of his symptoms.
ANSWER
The correct interpretation includes normal sinus rhythm, right bundle branch block, and left anterior fascicular block. Normal sinus rhythm is evidenced by a rate between 60 and 100 beats/min, with a corresponding P for every QRS and a QRS for every P.
Right bundle branch block is evidenced by a QRS duration > 120 ms, a terminal broad S wave in lead I, and an RSR’ complex in lead V1. Left anterior fascicular block is evident from the finding that the S waves are greater than the R waves in leads II, III, and aVF.
The presence of a right ventricular block and left anterior fascicular block (bifascicular block) is consistent with a history of a VSD and/or surgical repair. The right and left bundles proceed from the atrioventricular node and bundle of His down the ventricular septum to the Purkinje fibers in the distal ventricular myocardium. Therefore, congenital anomalies of the ventricular septum, and/or surgical intervention within it, often affect conduction of the right and/or left bundle.
This patient’s symptoms were a result of his dilated aorta, and he underwent successful repair, with resolution of his symptoms.
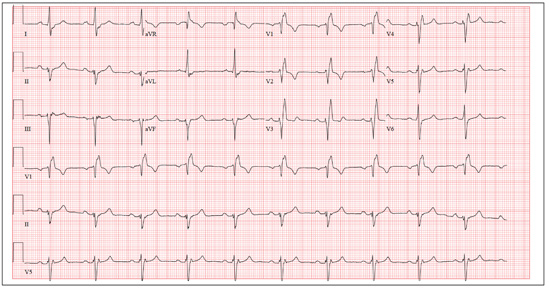
A man, 50, has a history of tetralogy of Fallot (ventricular septal defect [VSD], pulmonary stenosis, right ventricular hypertrophy, and overriding aorta). He underwent surgical correction at age 4, with placement of a Blalock-Taussig shunt and closure of his VSD, and was asymptomatic until one year ago. In the past year, he has developed progressive shortness of breath and dyspnea on exertion. In the past three months, he has developed chest pain that he describes as sharp, nonradiating, and occurring most often with dyspnea on exertion. He denies syncope, near-syncope, palpitations, or tachycardia. He cannot walk more than one-and-a-half blocks before stopping to rest, and he avoids hills and stairs if at all possible. A review of his most recent cardiac work-up (performed six months ago) reveals no significant coronary artery disease or evidence of aortic stenosis; it shows moderate aortic regurgitation, normal systolic aortic pressures, and normal left ventricular end diastolic pressures. The right ventricular pressures were elevated due to pulmonic stenosis; however, the estimated pulmonary artery pressures were normal. A cardiac MRI performed one month ago shows a significantly dilated aortic root with aneurysmal dilatation extending to the aortic arch, with effacement at the sinotubular junction and moderate aortic regurgitation. Additional findings include a markedly dilated right ventricular outflow tract with no pulmonic stenosis, evi-dence of a previous right Blalock-Taussig shunt, and moderate right atrial enlargement. Medical history is remarkable for hypertension. Family history is remarkable for hypertension, diabetes, and coronary artery disease, but not congenital heart disease. The patient does not smoke and drinks socially on the weekends. His medications include amlodipine, aspirin, and lisinopril. He is allergic to penicillin and amox-icillin. A review of systems reveals that he has had flulike symptoms for the past four days, with a dry, nonproductive cough. Physical exam reveals a well-developed, obese male in no distress. His height is 67”and his weight, 208 lb. Blood pressure is 102/70 mm Hg; pulse, 70 beats/min; respiratory rate, 16 breaths/min-1; and temperature, 98.4°F. His oxygen saturation is 98% on room air. Pertinent physical findings include a grade II/VI holosystolic murmur and a grade III/VI diastolic murmur, with a prominent S2 best heard at the left lower sternal border. There is no jugular venous distention, no peripheral edema, and no abnormal pulmonary finding. An ECG previously ordered for today’s visit reveals the following: a ventricular rate of 63 beats/min; PR interval, 196 ms; QRS duration, 174 ms; QT/QTc inter-val, 460/470 ms; P axis, 34°; R axis, –67°; and T axis, 56°. What is your interpretation of this ECG? How does the patient’s history predict the findings?
Wife is Worried That Her Husband's Condition is Contagious
ANSWER
The correct answer is petaloid seborrheic dermatitis (choice “d”), named for the flowerlike appearance of its polycyclic borders. Psoriasis (choice “a”) can present in this area, but tends to be scalier and usually involves multiple areas (eg, elbows, knees, and nails).
Rashes like this patient’s are often termed yeast infection (choice “b”). However, while a commensal yeast (Pityrosporum) can play a role in its formation, it appears that seborrhea represents an idiosyncratic reaction to increased numbers of this organism, rather than an actual infection.
Bowen’s disease (choice “c”) is a superficial squamous cell carcinoma, usually caused by overexposure to sunlight. Its lesions will be fixed, slowly growing larger with time, while seborrheic dermatitis will typically come and go. Biopsy is sometimes necessary to distinguish one from the other.
DISCUSSION
Seborrheic dermatitis (SD, aka seborrhea) is common, affecting up to 5% of the population. Dandruff is its usual manifestation, but it affects numerous other areas (as in this case), including the axillae, groin, beard, and genitals.
Presenting with scaling on an erythematous base, SD often flares and remits with the season (especially winter), with stress, and with increases in alcohol intake. Although it is usually mild, some cases can be severe. SD is associated with or accentuated by several other conditions, including Parkinson’s, stroke, and HIV. Severe SD in infants raises the possibility of Langerhans cell histiocytosis, especially when the presentation is atypical.
The diagnosis of SD can be difficult when it appears elsewhere than the scalp and face (eg, as an axillary or genital rash). Likewise, sternal petaloid SD is mystifying, unless other corroboratory manifestations are sought and found.
A few patients show signs of SD and psoriasis such that a definitive diagnosis cannot be made. Such overlap cases are sometimes termed sebopsoriasis. But psoriasis will usually exhibit signs not seen with SD, such as pitting of the nails, involvement of extensor surfaces of elbows and knees, and characteristic signs of psoriatic arthropathy in about 20% of cases. Pinpoint bleeding caused by peeling away scale, called the Auspitz sign, is seen with psoriasis and not with SD.
TREATMENT
This patient’s chest involvement responded rapidly to topical betamethasone foam, quickly tapered to avoid thinning the skin. Less powerful steroid creams, lotions, or gels (eg, triamcinolone 0.025%) can be used on other areas, such as ears and face. The daily use of an OTC dandruff shampoo (containing selenium sulfide, zinc pyrithione, tar, or ketoconazole) is an effective approach to controlling scalp involvement, but the product should be changed weekly.
Once the initial inflammation is controlled, topical antiyeast/antifungal preparations (eg, ketoconazole cream or any of the imidazoles, such as clotrimazole or oxiconazole) can be useful.
Finally, emphasis must be placed on educating the patient to expect control of the condition but not a cure.
ANSWER
The correct answer is petaloid seborrheic dermatitis (choice “d”), named for the flowerlike appearance of its polycyclic borders. Psoriasis (choice “a”) can present in this area, but tends to be scalier and usually involves multiple areas (eg, elbows, knees, and nails).
Rashes like this patient’s are often termed yeast infection (choice “b”). However, while a commensal yeast (Pityrosporum) can play a role in its formation, it appears that seborrhea represents an idiosyncratic reaction to increased numbers of this organism, rather than an actual infection.
Bowen’s disease (choice “c”) is a superficial squamous cell carcinoma, usually caused by overexposure to sunlight. Its lesions will be fixed, slowly growing larger with time, while seborrheic dermatitis will typically come and go. Biopsy is sometimes necessary to distinguish one from the other.
DISCUSSION
Seborrheic dermatitis (SD, aka seborrhea) is common, affecting up to 5% of the population. Dandruff is its usual manifestation, but it affects numerous other areas (as in this case), including the axillae, groin, beard, and genitals.
Presenting with scaling on an erythematous base, SD often flares and remits with the season (especially winter), with stress, and with increases in alcohol intake. Although it is usually mild, some cases can be severe. SD is associated with or accentuated by several other conditions, including Parkinson’s, stroke, and HIV. Severe SD in infants raises the possibility of Langerhans cell histiocytosis, especially when the presentation is atypical.
The diagnosis of SD can be difficult when it appears elsewhere than the scalp and face (eg, as an axillary or genital rash). Likewise, sternal petaloid SD is mystifying, unless other corroboratory manifestations are sought and found.
A few patients show signs of SD and psoriasis such that a definitive diagnosis cannot be made. Such overlap cases are sometimes termed sebopsoriasis. But psoriasis will usually exhibit signs not seen with SD, such as pitting of the nails, involvement of extensor surfaces of elbows and knees, and characteristic signs of psoriatic arthropathy in about 20% of cases. Pinpoint bleeding caused by peeling away scale, called the Auspitz sign, is seen with psoriasis and not with SD.
TREATMENT
This patient’s chest involvement responded rapidly to topical betamethasone foam, quickly tapered to avoid thinning the skin. Less powerful steroid creams, lotions, or gels (eg, triamcinolone 0.025%) can be used on other areas, such as ears and face. The daily use of an OTC dandruff shampoo (containing selenium sulfide, zinc pyrithione, tar, or ketoconazole) is an effective approach to controlling scalp involvement, but the product should be changed weekly.
Once the initial inflammation is controlled, topical antiyeast/antifungal preparations (eg, ketoconazole cream or any of the imidazoles, such as clotrimazole or oxiconazole) can be useful.
Finally, emphasis must be placed on educating the patient to expect control of the condition but not a cure.
ANSWER
The correct answer is petaloid seborrheic dermatitis (choice “d”), named for the flowerlike appearance of its polycyclic borders. Psoriasis (choice “a”) can present in this area, but tends to be scalier and usually involves multiple areas (eg, elbows, knees, and nails).
Rashes like this patient’s are often termed yeast infection (choice “b”). However, while a commensal yeast (Pityrosporum) can play a role in its formation, it appears that seborrhea represents an idiosyncratic reaction to increased numbers of this organism, rather than an actual infection.
Bowen’s disease (choice “c”) is a superficial squamous cell carcinoma, usually caused by overexposure to sunlight. Its lesions will be fixed, slowly growing larger with time, while seborrheic dermatitis will typically come and go. Biopsy is sometimes necessary to distinguish one from the other.
DISCUSSION
Seborrheic dermatitis (SD, aka seborrhea) is common, affecting up to 5% of the population. Dandruff is its usual manifestation, but it affects numerous other areas (as in this case), including the axillae, groin, beard, and genitals.
Presenting with scaling on an erythematous base, SD often flares and remits with the season (especially winter), with stress, and with increases in alcohol intake. Although it is usually mild, some cases can be severe. SD is associated with or accentuated by several other conditions, including Parkinson’s, stroke, and HIV. Severe SD in infants raises the possibility of Langerhans cell histiocytosis, especially when the presentation is atypical.
The diagnosis of SD can be difficult when it appears elsewhere than the scalp and face (eg, as an axillary or genital rash). Likewise, sternal petaloid SD is mystifying, unless other corroboratory manifestations are sought and found.
A few patients show signs of SD and psoriasis such that a definitive diagnosis cannot be made. Such overlap cases are sometimes termed sebopsoriasis. But psoriasis will usually exhibit signs not seen with SD, such as pitting of the nails, involvement of extensor surfaces of elbows and knees, and characteristic signs of psoriatic arthropathy in about 20% of cases. Pinpoint bleeding caused by peeling away scale, called the Auspitz sign, is seen with psoriasis and not with SD.
TREATMENT
This patient’s chest involvement responded rapidly to topical betamethasone foam, quickly tapered to avoid thinning the skin. Less powerful steroid creams, lotions, or gels (eg, triamcinolone 0.025%) can be used on other areas, such as ears and face. The daily use of an OTC dandruff shampoo (containing selenium sulfide, zinc pyrithione, tar, or ketoconazole) is an effective approach to controlling scalp involvement, but the product should be changed weekly.
Once the initial inflammation is controlled, topical antiyeast/antifungal preparations (eg, ketoconazole cream or any of the imidazoles, such as clotrimazole or oxiconazole) can be useful.
Finally, emphasis must be placed on educating the patient to expect control of the condition but not a cure.
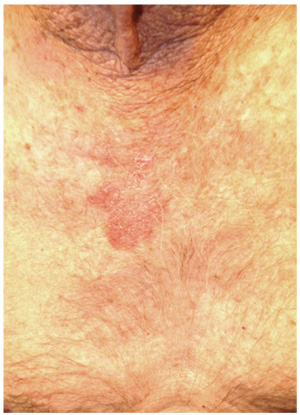
A 70-year-old man presents with a slightly itchy rash on his sternum that has appeared intermittently for years. Told it is “ringworm” by his primary care provider, the patient tried tolnaftate cream, to no avail. He is seeking additional consultation primarily because his wife is concerned she will catch the “infection.” The patient denies other skin problems, but then remembers that he has dandruff that flares from time to time, as well as a curious scaly red rash that “comes and goes” between his eyes, in his nasolabial folds, and behind his ears, especially in the winter. His father had similar problems. The patient is otherwise healthy, except for mild hypertension. The rash, located on the lower right sternum, measures about 6 cm at its largest dimension. Faintly pink, it has a papulosquamous surface, especially on its pol-ycyclic borders. Results of a KOH prep are negative for fungal elements. Elsewhere, a faintly scaly, orange-red rash is seen in the glabellar area and behind both ears. The man’s knees, elbows, and nails are free of any changes.

Proactive Rounding by RRT
Rapid response teams (RRT) have been promoted by numerous patient safety organizations to reduce preventable in‐hospital deaths.14 Initial studies of RRTs were promising,57 but recent literature,811 including systematic reviews and meta‐analyses, has called these findings into question. Nevertheless, RRTs remain popular in academic and community hospitals worldwide, and many have expanded their roles beyond solely responding to the deteriorating patient.12
Some RRTs, for example, proactively round on seriously ill ward patients and patients recently discharged from the intensive care unit (ICU) in an effort to prevent transitions to higher levels of care. Priestley and colleagues demonstrated that institution of such a team, referred to as a critical care outreach team (CCOT), decreased in‐hospital mortality while possibly increasing hospital length of stay (LOS).13 Three additional single‐center studies from the United Kingdom, where CCOTs are common, specifically examined proactive rounding by CCOTs on the ICU readmission rate: 2 observed no improvement,14, 15 while the third, limited by a small sample size, demonstrated a modest reduction in ICU readmissions.16
We sought to determine the impact of proactive rounding by an RRT on patients discharged from intensive care on the ICU readmission rate, ICU LOS, and in‐hospital mortality of patients discharged from the ICU. We hypothesized that proactive rounding by an RRT would decrease the ICU readmission rate, ICU LOS, and the in‐hospital mortality of patients discharged from the ICU.
MATERIALS AND METHODS
Site and Subjects
We carried out a retrospective, observational study of adult patients discharged from the ICU at University of California San Francisco (UCSF) Medical Center between January 2006 and June 2009. UCSF is a 790‐bed quaternary care academic hospital that admits approximately 17,000 patients annually and has 5 adult ICUs, with 62 beds and 3500 to 4000 ICU admissions annually. Our study was approved by the UCSF Medical Center Committee on Human Research; need for informed consent was waived.
Description of the RRT Before June 1, 2007
Throughout the study, the goal of the RRT was unchanged: to assess, triage, and institute early treatment in patients who experienced an acute decline in their clinical status. From November 2005 to October 2006, the RRT was staffed by an attending hospitalist and medicine resident during daytime, and by a critical care fellow at nighttime and on weekends. The RRT could be activated by any concerned staff member in response to a set of predetermined vital sign abnormalities, decreased urine output, or altered mental status, or simply if the staff member was concerned about the patient's clinical status. Despite extensive educational efforts, utilization of the team was low (2.7 calls per 1000 admissions) and, accordingly, it was discontinued in October 2006. After this time, staff would contact the primary team caring for the patient, should concerns regarding the patient's condition arise.
Description of the RRT After June 1, 2007
In an effort to expand its scope and utility, the RRT was reinstated on June 1, 2007 with a new composition and increased responsibilities. After this date, physician roles were eliminated, and the team composition changed to a dedicated critical care nurse and respiratory therapist, available 24 hours a day. Criteria for calling the team remained unchanged. In addition to responding to acute deteriorations in patients' clinical courses, the RRT began to proactively assess all patients within 12 hours of discharge from the ICU and would continue to round on these patients daily until it was felt that they were clinically stable. During these rounds, the RRT would provide consultation expertise to the bedside nurse and contact the patient's clinicians if concern existed about a patient's clinical trajectory; decisions to transfer a patient back to the ICU ultimately rested with the patient's primary team. During this time period, the RRT received an average of 110.6 calls per 1000 admissions.
Data Sources
Data collected included: demographics, clinical information (all patient refined [APR] severity of illness, APR risk of mortality, and the presence of 29 comorbidities), whether there was a readmission to the ICU, the total ICU LOS, and the vital status at the time of hospital discharge.
Outcomes
Outcomes included: readmission to the ICU, defined as 2 noncontiguous ICU stays during a single hospitalization; ICU LOS, defined as the total number of ICU days accrued during hospitalization; and in‐hospital mortality of patients discharged from the ICU.
Adjustment Variables
Patient age, gender, race, and ethnicity were available from administrative data. We used admission diagnosis code data to classify comorbidities using the method of Elixhauser et al.17
Statistical Analysis
For each of the 3 study outcomes, we assessed the effects of the intervention using multivariable models adjusting for patient‐ and service‐level factors, including a gamma model for ICU LOS and logistic models for ICU readmission and in‐hospital mortality of patients discharged from the ICU. We first compared unadjusted outcome levels before and after implementation. We then used an interrupted time series (ITS) framework to assess the effects of the intervention in terms of 5 measures: 1) the secular trend in the mean of the outcome before the intervention; 2) the change in the mean at the start of the implementation, or immediate effects; 3) the secular trend in the mean after implementation; 4) the change in secular trend, reflecting cumulative intervention effects; and 5) the net effect of the intervention, estimated as the adjusted difference between the fitted mean at the end of the postintervention period and the expected mean if the preintervention trend had continued without interruption or change.
Secondary Analyses
Given the heterogeneity of the RRT in the preintervention period, we assessed potential changes in trend at October 2006, the month in which the RRT was discontinued. We also examined changes in trend midway through the postimplementation period to evaluate for increased efficacy of the RRT with time.
Selection of Covariates
Age, race, and admitting service were included in both the prepost and ITS models by default for face validity. Additional covariates were selected for each outcome using backwards deletion with a retention criterion of P < 0.05, based on models that allowed the outcome rate to vary freely month to month. Because these data were obtained from administrative billing datasets, and the presence of comorbidities could not be definitively linked with time points during hospitalization, only those comorbidities that were likely present prior at ICU discharge were included. For similar reasons, APR severity of illness and risk of mortality scores, which were calculated from billing diagnoses at the end of hospitalization, were excluded from the models.
RESULTS
Patient Characteristics
During the study period, 11,687 patients were admitted to the ICU; 10,288 were discharged from the ICU alive and included in the analysis. In the 17 months prior to the introduction of proactive rounding by the RRT, 4902 (41.9%) patients were admitted, and during the 25 months afterwards, 6785 (58.1%) patients. Patients admitted in the 2 time periods were similar, although there were clinically small but statistically significant differences in race, APR severity of illness, APR risk of mortality, and certain comorbidities between the 2 groups (Table 1).
| Pre‐RRT (n = 4305) N (%) | Post‐RRT (n = 5983) N (%) | P Value | |
|---|---|---|---|
| |||
| Age, mean (y [SD]) | 57.7 [16.6] | 57.9 [16.5] | 0.50 |
| Female gender | 2,005 (46.6) | 2,824 (47.2) | 0.53 |
| Race | 0.0013 | ||
| White | 2,538 (59.0) | 3,520 (58.8) | |
| Black | 327 (7.6) | 436 (7.3) | |
| Asian | 642 (14.9) | 842 (14.1) | |
| Other | 719 (16.7) | 1,121 (18.7) | |
| Unknown | 79 (1.8) | 64 (1.1) | |
| Ethnicity | 0.87 | ||
| Hispanic | 480 (11.2) | 677 (11.3%) | |
| Non‐Hispanic | 3,547 (82.4) | 4,907 (82.0%) | |
| Unknown | 278 (6.5) | 399 (6.7) | |
| Insurance | 0.50 | ||
| Medicare | 1,788 (41.5) | 2,415 (40.4) | |
| Medicaid/Medi‐Cal | 699 (16.2) | 968 (16.2) | |
| Private | 1,642 (38.1) | 2,329 (38.9) | |
| Other | 176 (4.1) | 271 (4.5) | |
| Admission source | 0.41 | ||
| ED | 1,621 (37.7) | 2,244 (37.5) | |
| Outside hospital | 652 (15.2) | 855 (14.3) | |
| Direct admit | 2,032 (47.2) | 2,884 (48.2) | |
| Major surgery | 0.99 | ||
| Yes | 3,107 (72.2) | 4,319 (72.2) | |
| APR severity of illness | 0.0001 | ||
| Mild | 622 (14.5) | 828 (13.8) | |
| Moderate | 1,328 (30.9) | 1,626 (27.2) | |
| Major | 1,292 (30.0) | 1,908 (31.9) | |
| Extreme | 1,063 (24.7) | 1,621 (27.1) | |
| APR risk of mortality | 0.0109 | ||
| Mild | 1,422 (33.0) | 1,821 (30.4) | |
| Moderate | 1,074 (25.0) | 1,467 (24.5) | |
| Major | 947 (22.0) | 1,437 (24.0) | |
| Extreme | 862 (20.0) | 1,258 (21.0) | |
| Admitting service | 0.11 | ||
| Adult general surgery | 190 (4.4) | 260 (4.4) | |
| Cardiology | 347 (8.1) | 424 (7.1) | |
| Cardiothoracic surgery | 671 (15.6) | 930 (15.5) | |
| Kidney transplant surgery | 105 (2.4) | 112 (1.9) | |
| Liver transplant surgery | 298 (6.9) | 379 (6.3) | |
| Medicine | 683 (15.9) | 958 (16.0) | |
| Neurology | 420 (9.8) | 609 (10.2) | |
| Neurosurgery | 1,345 (31.2) | 1,995 (33.3) | |
| Vascular surgery | 246 (5.7) | 316 (5.3) | |
| Comorbidities | |||
| Hypertension | 2,054 (47.7) | 2,886 (48.2) | 0.60 |
| Fluid and electrolyte disorders | 998 (23.2) | 1,723 (28.8) | <0.0001 |
| Diabetes | 708 (16.5) | 880 (14.7) | 0.02 |
| Chronic obstructive pulmonary disease | 632 (14.7) | 849 (14.2) | 0.48 |
| Iron deficiency anemia | 582 (13.5) | 929 (15.5) | 0.005 |
| Renal failure | 541 (12.6) | 744 (12.4) | 0.84 |
| Coagulopathy | 418 (9.7) | 712 (11.9) | 0.0005 |
| Liver disease | 400 (9.3) | 553 (9.2) | 0.93 |
| Hypothyroidism | 330 (7.7) | 500 (8.4) | 0.20 |
| Depression | 306 (7.1) | 508 (8.5) | 0.01 |
| Peripheral vascular disease | 304 (7.1) | 422 (7.1) | 0.99 |
| Congestive heart failure | 263 (6.1) | 360 (6.0) | 0.85 |
| Weight loss | 236 (5.5) | 425 (7.1) | 0.0009 |
| Paralysis | 225 (5.2) | 328 (5.5) | 0.57 |
| Neurological disorders | 229 (5.3) | 276 (4.6) | 0.10 |
| Valvular disease | 210 (4.9) | 329 (5.5) | 0.16 |
| Drug abuse | 198 (4.6) | 268 (4.5) | 0.77 |
| Metastatic cancer | 198 (4.6) | 296 (5.0) | 0.42 |
| Obesity | 201 (4.7) | 306 (5.1) | 0.30 |
| Alcohol abuse | 178 (4.1) | 216 (3.6) | 0.17 |
| Diabetes with complications | 175 (4.1) | 218 (3.6) | 0.27 |
| Solid tumor without metastasis | 146 (3.4) | 245 (4.1) | 0.07 |
| Psychoses | 115 (2.7) | 183 (3.1) | 0.25 |
| Rheumatoid arthritis/collagen vascular disease | 96 (2.2) | 166 (2.8) | 0.08 |
| Pulmonary circulation disease | 83 (1.9) | 181 (3.0) | 0.0005 |
| Outcomes | |||
| Readmission to ICU | 288 (6.7) | 433 (7.3) | 0.24 |
| ICU length of stay, mean [SD] | 5.1 [9.7] | 4.9 [8.3] | 0.24 |
| In‐hospital mortality of patients discharged from the ICU | 260 (6.0) | 326 (5.5) | 0.24 |
ICU Readmission Rate
Introduction of proactive rounding by the RRT was not associated with unadjusted differences in the ICU readmission rate (6.7% preintervention vs 7.3% postintervention, P = 0.24; Table 1). In the adjusted ITS model, the intervention had no net effect on the odds of ICU readmission (adjusted odds ratio [AOR] for net intervention effect 0.98, 95% confidence interval [CI] 0.42, 2.28), with similar secular trends both preintervention (AOR 1.00 per year, 95% CI 0.97, 1.03), and afterwards (AOR 0.99 per year, 95% CI 0.98, 01.00), and a nonsignificant increase at implementation (Table 2). Figure 1 uses solid lines to show the fitted readmission rates, a hatched line to show the projection of the preintervention secular trend into the postintervention period, and circles to represent adjusted monthly means. The lack of a net intervention effect is indicated by the convergence of the solid and hatched lines 24 months postintervention.
| Outcome: Summary Effect Measure | Value (95% CI) | P Value |
|---|---|---|
| ||
| ICU readmission rateadjusted odds ratio | ||
| Pre‐RRT trend | 1.00 (0.97, 1.03) | 0.98 |
| Change at RRT implementation | 1.24 (0.94, 1.63) | 0.13 |
| Post‐RRT trend | 0.98 (0.97, 1.00) | 0.06 |
| Change in trend | 0.98 (0.96, 1.02) | 0.39 |
| Net intervention effect | 0.92 (0.40, 2.12) | 0.85 |
| ICU average length of stayadjusted ratio of means | ||
| Trend at 9 mo pre‐RRT | 0.98 (0.96, 1.00) | 0.05 |
| Trend at 3 mo pre‐RRT | 1.02 (0.99, 1.04) | 0.19 |
| Change in trend at 3 mo pre‐RRT | 1.03 (1.00, 1.07) | 0.07 |
| Change at RRT implementation | 0.92 (0.80, 1.06) | 0.27 |
| Post‐RRT trend | 1.00 (0.99, 1.00) | 0.35 |
| Change in trend at RRT implementation | 0.98 (0.96, 1.01) | 0.14 |
| Net intervention effect | 0.60 (0.31, 1.18) | 0.14 |
| In‐hospital mortality of patients discharged from the ICUadjusted odds ratio | ||
| Pre‐RRT trend | 1.02 (0.99, 1.06) | 0.15 |
| Change at RRT implementation | 0.74 (0.51, 1.08) | 0.12 |
| Post‐RRT trend | 1.00 (0.98, 1.01) | 0.68 |
| Change in trend | 0.97 (0.94, 1.01) | 0.14 |
| Net intervention effect | 0.39 (0.14, 1.10) | 0.08 |
ICU Average LOS
Introduction of proactive rounding by the RRT was not associated with unadjusted differences in ICU average LOS (5.1 days preintervention vs 4.9 days postintervention, P = 0.24; Table 1). Trends in ICU LOS may have changed in October 2006 (P = 0.07), decreasing in the first half of the study period (adjusted rate ratio [ARR] 0.98 per year, 95% CI 0.961.00), but did not change significantly thereafter. As with the ICU readmission rate, neither the change in estimated secular trend after implementation (ARR 0.98, 95% CI 0.961.01), nor the net effect of the intervention (ARR 0.62, 95% CI 0.321.22) was statistically significant (Table 2); these results are depicted graphically in Figure 2.
In‐Hospital Mortality of Patients Discharged From the ICU
Introduction of proactive rounding by the RRT was not associated with unadjusted differences in the mortality of patients discharged from the ICU (6.0% preintervention vs 5.5% postintervention, P = 0.24; Table 1). Similarly, in the adjusted ITS model, the intervention had no statistically significant net effect on the mortality outcome (Table 2 and Figure 3).
Secondary Analyses
Apart from weak evidence for a change in trend in ICU LOS in October 2006, no other changes in trend were found within the preintervention or postintervention periods (data not shown). This suggests that the heterogeneity of the preintervention RRT had no significant impact on the 3 outcomes examined, and that the RRT intervention failed to gain efficacy with time in the postintervention period. Additionally, we saw no outcome benefit in sensitivity analyses among all ICU patients or in service‐defined analyses (eg, surgical services), where ability to control for illness severity was improved.
DISCUSSION
In this single center study, introduction of an RRT that proactively rounded on patients discharged from the ICU did not reduce the ICU readmission rate, ICU LOS, or mortality of patients discharged from the ICU, after accounting for secular trends using robust ITS methods and adjusting for patient level factors.
Our study is consistent with 2 smaller studies that assessed the impact of proactive rounding by a CCOT on ICU readmission rate. Leary and Ridley14 found that proactively rounding by a CCOT did not reduce ICU readmissions or shorten the ICU LOS, although this study was limited by a surprisingly low ICU readmission rate and short ICU LOS prior to the intervention. Another study15 also observed no change in the ICU readmission rate following introduction of a proactively rounding CCOT but noted small reductions in both ICU and hospital mortality. The sole study showing an effect16 observed a lower ICU readmission rate and increased survival to hospital discharge (after excluding do not resuscitate [DNR] patients) with implementation of a CCOT, although some of their findings may be explained by their CCOT's use of palliative care services, a function not featured in our model.
Our study adds to the meta‐analyses and systematic reviews810 that have questioned the hypothesis that a trained and proactive team of caregivers should be able to prevent patients from returning to the ICU. Perhaps one reason why this is not true is that proactive rounding by RRTs may have minimal effect in systems where step‐down beds are readily available. At UCSF, nearly every patient transferred out of the ICU is triaged to a step‐down unit, where telemetry and pulse oximetry are continuously monitored. Despite this, however, our institution's 2 step‐down units generate more calls to our RRT than any other units in the hospital.
We were surprised to see that proactive rounding failed to shorten ICU LOS, hypothesizing that clinicians would be more comfortable discharging patients from the ICU knowing that the RRT would be closely monitoring them afterwards. Although we have no data to support this hypothesis, increased use of the RRT may have also increased step‐down bed use, as patients on the general medicalsurgical floors were transferred to a higher level of care upon recommendation of the RRT, thereby delaying transfers out of the ICU. Moreover, the opening of an additional 16‐bed ICU in October 2008 might have encouraged clinicians to transfer patients back to the ICU simply because beds were more easily accessible than before.
Introduction of proactive rounding by the RRT was also not associated with differences in the mortality rate of patients discharged from the ICU. This finding conflicts with the results of Garcea et al,15 Ball et al,16 and Priestley et al13, all of which found that implementation of a CCOT led to small but statistically significant reductions in in‐hospital mortality. All 3 of these studies, however, examined smaller patient populations (1380, 470, and 2903 patients, respectively), and both the Priestley and Ball studies13, 16 had significantly shorter periods of data collection (24 months and 32 weeks, respectively). Our results are based on models with confidence intervals and P values that account for variability in all 3 underlying effect estimates but assume a linear extrapolation of the preintervention trend. This approach allowed us to flexibly deal with changes related to the intervention, while relying on our large sample size to define time trends not dealt with adequately (or at all) in previous research.
The lack of improvement in outcomes cannot be attributed to immaturity of the RRT or failure of the clinical staff to use the RRT adequately. A prespecified secondary data analysis midway through the postintervention time period demonstrated that the RRT failed to gain efficacy with time with respect to all 3 outcomes. The postintervention RRT was also utilized far more frequently than its predecessor (110.6 vs 2.7 calls per 1000 admissions, respectively), and this degree of RRT utilization far surpasses the dose considered to be indicative of a mature RRT system.12
Our study has several limitations. First, we relied on administrative rather than chart‐collected data to determine the reason for ICU admission, and the APR severity of illness and risk of mortality scores. It seems unlikely, however, that coding deficiencies or biases affected the preintervention and postintervention patient populations differently. Even though we adjusted for all available measures, it is possible that we were not able to account for time trends in all potential confounders. Second, we did not have detailed clinical information on reasons for ICU readmission and whether readmissions occurred before or after the RRT proactively rounded on the patient. Therefore, potential readmissions to the ICU that might have been planned or which would have happened regardless of the presence of the RRT, such as for antibiotic desensitization, could not be accounted for. Third, introduction of proactive rounding by the RRT in June 2007 was accompanied by a change in the RRT's composition, from a physician‐led model to a nurse‐led model. Therefore, inherent differences in the way that physicians and nurses might assess and triage patients could not have been adjusted for. Lastly, this was a retrospective study conducted at a single academic medical center with a specific RRT model, and our results may not be directly applicable to nonteaching settings or to different RRT models.
Our findings raise further questions about the benefits of RRTs as they assume additional roles, such as proactive rounding on patients recently discharged from the ICU. The failure of our RRT to reduce the ICU readmission rate, the ICU average LOS, and the mortality of patients discharged from the ICU raises concerns that the benefits of our RRT are not commensurate with its cost. While defining the degree of impact and underlying mechanisms are worthy of prospective study, hospitals seeking to improve their RRT models should consider how to develop systems that achieve the RRT's promise in measurable ways.
Acknowledgements
The authors acknowledge Heather Leicester, MSPH, Senior Performance Improvement Analyst for Patient Safety and Quality Services at the University of California San Francisco for her work in data acquisition.
Disclosures: Dr Vittinghoff received salary support from an NIH grant during the time of this work for statistical consulting. He receives textbook royalties from Springer Verlag. Dr Auerbach was supported by 5K24HL098372‐02 from the National Heart Lung and Blood Institute during the period of this study although not specifically for this study; they had no role in the design or conduct of the study; the collection, analysis, or interpretation of the data; or the preparation, review, or approval of the manuscript. The other authors have no financial conflicts of interest.
- , , , . The 100,000 lives campaign: setting a goal and a deadline for improving health care quality. JAMA. 2006;295(3):324–327.
- Clinical Governance Unit, Quality and Safety Branch, Rural and Regional Health and Aged Care Services Division Safer Systems, Department of Human Services, State Government of Victoria. Safer Systems—Saving Lives Campaign. Available at: http://www.health.vic.gov.au/sssl. Accessed April 5, 2012.
- Canadian Patient Safety Institute. Safer Healthcare Now! Campaign. Available at: http://www.saferhealthcarenow.ca. Accessed April 5, 2012.
- , . The growth of rapid response systems. Jt Comm J Qual Patient Saf. 2008;34:489–495.
- , , , . The medical emergency team. Anaesth Intensive Care. 1995;23(2):183–186.
- , , , et al. Rates of in‐hospital arrests, deaths, and intensive care admission: the effect of a medical emergency team. Med J Aust. 2000;173:236–240.
- , , , , . The patient‐at‐risk team: identifying and managing seriously ill ward patients. Anaesthesia. 1999;54:853–860.
- , , , , . Effects of rapid response systems on clinical outcomes: systemic review and meta‐analysis. J Hosp Med. 2007;2:422–432.
- , , , , . Rapid response teams: a systemic review and meta‐analysis. Arch Intern Med. 2010;170(1):18–26.
- , , , , , . Rapid response systems: a systematic review. Crit Care Med. 2007;35(5):1238–1243.
- , , , et al. Introduction of the medical emergency team (MET) system: a cluster‐randomised controlled trial. Lancet. 2005;365:2091–2097.
- , , . Rapid response teams. N Engl J Med. 2011;365:139–146.
- , , , et al. Introducing critical care outreach: a ward‐randomised trial of phased introduction in a general hospital. Intensive Care Med. 2004;30(7):1398–1404.
- , . Impact of an outreach team on re‐admissions to a critical care unit. Anaesthesia. 2003;58:328–332.
- , , , , . Impact of a critical care outreach team on critical care readmissions and mortality. Acta Anaesthesiol Scand. 2004;48:1096–1100.
- , , . Effect of the critical care outreach team on patient survival to discharge from hospital and readmission to critical care: non‐randomised population based study. BMJ. 2003;327:1014–1017.
- , , , . Comorbidity measures for use with administrative data. Med Care. 1998;36(1):8–27.
Rapid response teams (RRT) have been promoted by numerous patient safety organizations to reduce preventable in‐hospital deaths.14 Initial studies of RRTs were promising,57 but recent literature,811 including systematic reviews and meta‐analyses, has called these findings into question. Nevertheless, RRTs remain popular in academic and community hospitals worldwide, and many have expanded their roles beyond solely responding to the deteriorating patient.12
Some RRTs, for example, proactively round on seriously ill ward patients and patients recently discharged from the intensive care unit (ICU) in an effort to prevent transitions to higher levels of care. Priestley and colleagues demonstrated that institution of such a team, referred to as a critical care outreach team (CCOT), decreased in‐hospital mortality while possibly increasing hospital length of stay (LOS).13 Three additional single‐center studies from the United Kingdom, where CCOTs are common, specifically examined proactive rounding by CCOTs on the ICU readmission rate: 2 observed no improvement,14, 15 while the third, limited by a small sample size, demonstrated a modest reduction in ICU readmissions.16
We sought to determine the impact of proactive rounding by an RRT on patients discharged from intensive care on the ICU readmission rate, ICU LOS, and in‐hospital mortality of patients discharged from the ICU. We hypothesized that proactive rounding by an RRT would decrease the ICU readmission rate, ICU LOS, and the in‐hospital mortality of patients discharged from the ICU.
MATERIALS AND METHODS
Site and Subjects
We carried out a retrospective, observational study of adult patients discharged from the ICU at University of California San Francisco (UCSF) Medical Center between January 2006 and June 2009. UCSF is a 790‐bed quaternary care academic hospital that admits approximately 17,000 patients annually and has 5 adult ICUs, with 62 beds and 3500 to 4000 ICU admissions annually. Our study was approved by the UCSF Medical Center Committee on Human Research; need for informed consent was waived.
Description of the RRT Before June 1, 2007
Throughout the study, the goal of the RRT was unchanged: to assess, triage, and institute early treatment in patients who experienced an acute decline in their clinical status. From November 2005 to October 2006, the RRT was staffed by an attending hospitalist and medicine resident during daytime, and by a critical care fellow at nighttime and on weekends. The RRT could be activated by any concerned staff member in response to a set of predetermined vital sign abnormalities, decreased urine output, or altered mental status, or simply if the staff member was concerned about the patient's clinical status. Despite extensive educational efforts, utilization of the team was low (2.7 calls per 1000 admissions) and, accordingly, it was discontinued in October 2006. After this time, staff would contact the primary team caring for the patient, should concerns regarding the patient's condition arise.
Description of the RRT After June 1, 2007
In an effort to expand its scope and utility, the RRT was reinstated on June 1, 2007 with a new composition and increased responsibilities. After this date, physician roles were eliminated, and the team composition changed to a dedicated critical care nurse and respiratory therapist, available 24 hours a day. Criteria for calling the team remained unchanged. In addition to responding to acute deteriorations in patients' clinical courses, the RRT began to proactively assess all patients within 12 hours of discharge from the ICU and would continue to round on these patients daily until it was felt that they were clinically stable. During these rounds, the RRT would provide consultation expertise to the bedside nurse and contact the patient's clinicians if concern existed about a patient's clinical trajectory; decisions to transfer a patient back to the ICU ultimately rested with the patient's primary team. During this time period, the RRT received an average of 110.6 calls per 1000 admissions.
Data Sources
Data collected included: demographics, clinical information (all patient refined [APR] severity of illness, APR risk of mortality, and the presence of 29 comorbidities), whether there was a readmission to the ICU, the total ICU LOS, and the vital status at the time of hospital discharge.
Outcomes
Outcomes included: readmission to the ICU, defined as 2 noncontiguous ICU stays during a single hospitalization; ICU LOS, defined as the total number of ICU days accrued during hospitalization; and in‐hospital mortality of patients discharged from the ICU.
Adjustment Variables
Patient age, gender, race, and ethnicity were available from administrative data. We used admission diagnosis code data to classify comorbidities using the method of Elixhauser et al.17
Statistical Analysis
For each of the 3 study outcomes, we assessed the effects of the intervention using multivariable models adjusting for patient‐ and service‐level factors, including a gamma model for ICU LOS and logistic models for ICU readmission and in‐hospital mortality of patients discharged from the ICU. We first compared unadjusted outcome levels before and after implementation. We then used an interrupted time series (ITS) framework to assess the effects of the intervention in terms of 5 measures: 1) the secular trend in the mean of the outcome before the intervention; 2) the change in the mean at the start of the implementation, or immediate effects; 3) the secular trend in the mean after implementation; 4) the change in secular trend, reflecting cumulative intervention effects; and 5) the net effect of the intervention, estimated as the adjusted difference between the fitted mean at the end of the postintervention period and the expected mean if the preintervention trend had continued without interruption or change.
Secondary Analyses
Given the heterogeneity of the RRT in the preintervention period, we assessed potential changes in trend at October 2006, the month in which the RRT was discontinued. We also examined changes in trend midway through the postimplementation period to evaluate for increased efficacy of the RRT with time.
Selection of Covariates
Age, race, and admitting service were included in both the prepost and ITS models by default for face validity. Additional covariates were selected for each outcome using backwards deletion with a retention criterion of P < 0.05, based on models that allowed the outcome rate to vary freely month to month. Because these data were obtained from administrative billing datasets, and the presence of comorbidities could not be definitively linked with time points during hospitalization, only those comorbidities that were likely present prior at ICU discharge were included. For similar reasons, APR severity of illness and risk of mortality scores, which were calculated from billing diagnoses at the end of hospitalization, were excluded from the models.
RESULTS
Patient Characteristics
During the study period, 11,687 patients were admitted to the ICU; 10,288 were discharged from the ICU alive and included in the analysis. In the 17 months prior to the introduction of proactive rounding by the RRT, 4902 (41.9%) patients were admitted, and during the 25 months afterwards, 6785 (58.1%) patients. Patients admitted in the 2 time periods were similar, although there were clinically small but statistically significant differences in race, APR severity of illness, APR risk of mortality, and certain comorbidities between the 2 groups (Table 1).
| Pre‐RRT (n = 4305) N (%) | Post‐RRT (n = 5983) N (%) | P Value | |
|---|---|---|---|
| |||
| Age, mean (y [SD]) | 57.7 [16.6] | 57.9 [16.5] | 0.50 |
| Female gender | 2,005 (46.6) | 2,824 (47.2) | 0.53 |
| Race | 0.0013 | ||
| White | 2,538 (59.0) | 3,520 (58.8) | |
| Black | 327 (7.6) | 436 (7.3) | |
| Asian | 642 (14.9) | 842 (14.1) | |
| Other | 719 (16.7) | 1,121 (18.7) | |
| Unknown | 79 (1.8) | 64 (1.1) | |
| Ethnicity | 0.87 | ||
| Hispanic | 480 (11.2) | 677 (11.3%) | |
| Non‐Hispanic | 3,547 (82.4) | 4,907 (82.0%) | |
| Unknown | 278 (6.5) | 399 (6.7) | |
| Insurance | 0.50 | ||
| Medicare | 1,788 (41.5) | 2,415 (40.4) | |
| Medicaid/Medi‐Cal | 699 (16.2) | 968 (16.2) | |
| Private | 1,642 (38.1) | 2,329 (38.9) | |
| Other | 176 (4.1) | 271 (4.5) | |
| Admission source | 0.41 | ||
| ED | 1,621 (37.7) | 2,244 (37.5) | |
| Outside hospital | 652 (15.2) | 855 (14.3) | |
| Direct admit | 2,032 (47.2) | 2,884 (48.2) | |
| Major surgery | 0.99 | ||
| Yes | 3,107 (72.2) | 4,319 (72.2) | |
| APR severity of illness | 0.0001 | ||
| Mild | 622 (14.5) | 828 (13.8) | |
| Moderate | 1,328 (30.9) | 1,626 (27.2) | |
| Major | 1,292 (30.0) | 1,908 (31.9) | |
| Extreme | 1,063 (24.7) | 1,621 (27.1) | |
| APR risk of mortality | 0.0109 | ||
| Mild | 1,422 (33.0) | 1,821 (30.4) | |
| Moderate | 1,074 (25.0) | 1,467 (24.5) | |
| Major | 947 (22.0) | 1,437 (24.0) | |
| Extreme | 862 (20.0) | 1,258 (21.0) | |
| Admitting service | 0.11 | ||
| Adult general surgery | 190 (4.4) | 260 (4.4) | |
| Cardiology | 347 (8.1) | 424 (7.1) | |
| Cardiothoracic surgery | 671 (15.6) | 930 (15.5) | |
| Kidney transplant surgery | 105 (2.4) | 112 (1.9) | |
| Liver transplant surgery | 298 (6.9) | 379 (6.3) | |
| Medicine | 683 (15.9) | 958 (16.0) | |
| Neurology | 420 (9.8) | 609 (10.2) | |
| Neurosurgery | 1,345 (31.2) | 1,995 (33.3) | |
| Vascular surgery | 246 (5.7) | 316 (5.3) | |
| Comorbidities | |||
| Hypertension | 2,054 (47.7) | 2,886 (48.2) | 0.60 |
| Fluid and electrolyte disorders | 998 (23.2) | 1,723 (28.8) | <0.0001 |
| Diabetes | 708 (16.5) | 880 (14.7) | 0.02 |
| Chronic obstructive pulmonary disease | 632 (14.7) | 849 (14.2) | 0.48 |
| Iron deficiency anemia | 582 (13.5) | 929 (15.5) | 0.005 |
| Renal failure | 541 (12.6) | 744 (12.4) | 0.84 |
| Coagulopathy | 418 (9.7) | 712 (11.9) | 0.0005 |
| Liver disease | 400 (9.3) | 553 (9.2) | 0.93 |
| Hypothyroidism | 330 (7.7) | 500 (8.4) | 0.20 |
| Depression | 306 (7.1) | 508 (8.5) | 0.01 |
| Peripheral vascular disease | 304 (7.1) | 422 (7.1) | 0.99 |
| Congestive heart failure | 263 (6.1) | 360 (6.0) | 0.85 |
| Weight loss | 236 (5.5) | 425 (7.1) | 0.0009 |
| Paralysis | 225 (5.2) | 328 (5.5) | 0.57 |
| Neurological disorders | 229 (5.3) | 276 (4.6) | 0.10 |
| Valvular disease | 210 (4.9) | 329 (5.5) | 0.16 |
| Drug abuse | 198 (4.6) | 268 (4.5) | 0.77 |
| Metastatic cancer | 198 (4.6) | 296 (5.0) | 0.42 |
| Obesity | 201 (4.7) | 306 (5.1) | 0.30 |
| Alcohol abuse | 178 (4.1) | 216 (3.6) | 0.17 |
| Diabetes with complications | 175 (4.1) | 218 (3.6) | 0.27 |
| Solid tumor without metastasis | 146 (3.4) | 245 (4.1) | 0.07 |
| Psychoses | 115 (2.7) | 183 (3.1) | 0.25 |
| Rheumatoid arthritis/collagen vascular disease | 96 (2.2) | 166 (2.8) | 0.08 |
| Pulmonary circulation disease | 83 (1.9) | 181 (3.0) | 0.0005 |
| Outcomes | |||
| Readmission to ICU | 288 (6.7) | 433 (7.3) | 0.24 |
| ICU length of stay, mean [SD] | 5.1 [9.7] | 4.9 [8.3] | 0.24 |
| In‐hospital mortality of patients discharged from the ICU | 260 (6.0) | 326 (5.5) | 0.24 |
ICU Readmission Rate
Introduction of proactive rounding by the RRT was not associated with unadjusted differences in the ICU readmission rate (6.7% preintervention vs 7.3% postintervention, P = 0.24; Table 1). In the adjusted ITS model, the intervention had no net effect on the odds of ICU readmission (adjusted odds ratio [AOR] for net intervention effect 0.98, 95% confidence interval [CI] 0.42, 2.28), with similar secular trends both preintervention (AOR 1.00 per year, 95% CI 0.97, 1.03), and afterwards (AOR 0.99 per year, 95% CI 0.98, 01.00), and a nonsignificant increase at implementation (Table 2). Figure 1 uses solid lines to show the fitted readmission rates, a hatched line to show the projection of the preintervention secular trend into the postintervention period, and circles to represent adjusted monthly means. The lack of a net intervention effect is indicated by the convergence of the solid and hatched lines 24 months postintervention.
| Outcome: Summary Effect Measure | Value (95% CI) | P Value |
|---|---|---|
| ||
| ICU readmission rateadjusted odds ratio | ||
| Pre‐RRT trend | 1.00 (0.97, 1.03) | 0.98 |
| Change at RRT implementation | 1.24 (0.94, 1.63) | 0.13 |
| Post‐RRT trend | 0.98 (0.97, 1.00) | 0.06 |
| Change in trend | 0.98 (0.96, 1.02) | 0.39 |
| Net intervention effect | 0.92 (0.40, 2.12) | 0.85 |
| ICU average length of stayadjusted ratio of means | ||
| Trend at 9 mo pre‐RRT | 0.98 (0.96, 1.00) | 0.05 |
| Trend at 3 mo pre‐RRT | 1.02 (0.99, 1.04) | 0.19 |
| Change in trend at 3 mo pre‐RRT | 1.03 (1.00, 1.07) | 0.07 |
| Change at RRT implementation | 0.92 (0.80, 1.06) | 0.27 |
| Post‐RRT trend | 1.00 (0.99, 1.00) | 0.35 |
| Change in trend at RRT implementation | 0.98 (0.96, 1.01) | 0.14 |
| Net intervention effect | 0.60 (0.31, 1.18) | 0.14 |
| In‐hospital mortality of patients discharged from the ICUadjusted odds ratio | ||
| Pre‐RRT trend | 1.02 (0.99, 1.06) | 0.15 |
| Change at RRT implementation | 0.74 (0.51, 1.08) | 0.12 |
| Post‐RRT trend | 1.00 (0.98, 1.01) | 0.68 |
| Change in trend | 0.97 (0.94, 1.01) | 0.14 |
| Net intervention effect | 0.39 (0.14, 1.10) | 0.08 |
ICU Average LOS
Introduction of proactive rounding by the RRT was not associated with unadjusted differences in ICU average LOS (5.1 days preintervention vs 4.9 days postintervention, P = 0.24; Table 1). Trends in ICU LOS may have changed in October 2006 (P = 0.07), decreasing in the first half of the study period (adjusted rate ratio [ARR] 0.98 per year, 95% CI 0.961.00), but did not change significantly thereafter. As with the ICU readmission rate, neither the change in estimated secular trend after implementation (ARR 0.98, 95% CI 0.961.01), nor the net effect of the intervention (ARR 0.62, 95% CI 0.321.22) was statistically significant (Table 2); these results are depicted graphically in Figure 2.
In‐Hospital Mortality of Patients Discharged From the ICU
Introduction of proactive rounding by the RRT was not associated with unadjusted differences in the mortality of patients discharged from the ICU (6.0% preintervention vs 5.5% postintervention, P = 0.24; Table 1). Similarly, in the adjusted ITS model, the intervention had no statistically significant net effect on the mortality outcome (Table 2 and Figure 3).
Secondary Analyses
Apart from weak evidence for a change in trend in ICU LOS in October 2006, no other changes in trend were found within the preintervention or postintervention periods (data not shown). This suggests that the heterogeneity of the preintervention RRT had no significant impact on the 3 outcomes examined, and that the RRT intervention failed to gain efficacy with time in the postintervention period. Additionally, we saw no outcome benefit in sensitivity analyses among all ICU patients or in service‐defined analyses (eg, surgical services), where ability to control for illness severity was improved.
DISCUSSION
In this single center study, introduction of an RRT that proactively rounded on patients discharged from the ICU did not reduce the ICU readmission rate, ICU LOS, or mortality of patients discharged from the ICU, after accounting for secular trends using robust ITS methods and adjusting for patient level factors.
Our study is consistent with 2 smaller studies that assessed the impact of proactive rounding by a CCOT on ICU readmission rate. Leary and Ridley14 found that proactively rounding by a CCOT did not reduce ICU readmissions or shorten the ICU LOS, although this study was limited by a surprisingly low ICU readmission rate and short ICU LOS prior to the intervention. Another study15 also observed no change in the ICU readmission rate following introduction of a proactively rounding CCOT but noted small reductions in both ICU and hospital mortality. The sole study showing an effect16 observed a lower ICU readmission rate and increased survival to hospital discharge (after excluding do not resuscitate [DNR] patients) with implementation of a CCOT, although some of their findings may be explained by their CCOT's use of palliative care services, a function not featured in our model.
Our study adds to the meta‐analyses and systematic reviews810 that have questioned the hypothesis that a trained and proactive team of caregivers should be able to prevent patients from returning to the ICU. Perhaps one reason why this is not true is that proactive rounding by RRTs may have minimal effect in systems where step‐down beds are readily available. At UCSF, nearly every patient transferred out of the ICU is triaged to a step‐down unit, where telemetry and pulse oximetry are continuously monitored. Despite this, however, our institution's 2 step‐down units generate more calls to our RRT than any other units in the hospital.
We were surprised to see that proactive rounding failed to shorten ICU LOS, hypothesizing that clinicians would be more comfortable discharging patients from the ICU knowing that the RRT would be closely monitoring them afterwards. Although we have no data to support this hypothesis, increased use of the RRT may have also increased step‐down bed use, as patients on the general medicalsurgical floors were transferred to a higher level of care upon recommendation of the RRT, thereby delaying transfers out of the ICU. Moreover, the opening of an additional 16‐bed ICU in October 2008 might have encouraged clinicians to transfer patients back to the ICU simply because beds were more easily accessible than before.
Introduction of proactive rounding by the RRT was also not associated with differences in the mortality rate of patients discharged from the ICU. This finding conflicts with the results of Garcea et al,15 Ball et al,16 and Priestley et al13, all of which found that implementation of a CCOT led to small but statistically significant reductions in in‐hospital mortality. All 3 of these studies, however, examined smaller patient populations (1380, 470, and 2903 patients, respectively), and both the Priestley and Ball studies13, 16 had significantly shorter periods of data collection (24 months and 32 weeks, respectively). Our results are based on models with confidence intervals and P values that account for variability in all 3 underlying effect estimates but assume a linear extrapolation of the preintervention trend. This approach allowed us to flexibly deal with changes related to the intervention, while relying on our large sample size to define time trends not dealt with adequately (or at all) in previous research.
The lack of improvement in outcomes cannot be attributed to immaturity of the RRT or failure of the clinical staff to use the RRT adequately. A prespecified secondary data analysis midway through the postintervention time period demonstrated that the RRT failed to gain efficacy with time with respect to all 3 outcomes. The postintervention RRT was also utilized far more frequently than its predecessor (110.6 vs 2.7 calls per 1000 admissions, respectively), and this degree of RRT utilization far surpasses the dose considered to be indicative of a mature RRT system.12
Our study has several limitations. First, we relied on administrative rather than chart‐collected data to determine the reason for ICU admission, and the APR severity of illness and risk of mortality scores. It seems unlikely, however, that coding deficiencies or biases affected the preintervention and postintervention patient populations differently. Even though we adjusted for all available measures, it is possible that we were not able to account for time trends in all potential confounders. Second, we did not have detailed clinical information on reasons for ICU readmission and whether readmissions occurred before or after the RRT proactively rounded on the patient. Therefore, potential readmissions to the ICU that might have been planned or which would have happened regardless of the presence of the RRT, such as for antibiotic desensitization, could not be accounted for. Third, introduction of proactive rounding by the RRT in June 2007 was accompanied by a change in the RRT's composition, from a physician‐led model to a nurse‐led model. Therefore, inherent differences in the way that physicians and nurses might assess and triage patients could not have been adjusted for. Lastly, this was a retrospective study conducted at a single academic medical center with a specific RRT model, and our results may not be directly applicable to nonteaching settings or to different RRT models.
Our findings raise further questions about the benefits of RRTs as they assume additional roles, such as proactive rounding on patients recently discharged from the ICU. The failure of our RRT to reduce the ICU readmission rate, the ICU average LOS, and the mortality of patients discharged from the ICU raises concerns that the benefits of our RRT are not commensurate with its cost. While defining the degree of impact and underlying mechanisms are worthy of prospective study, hospitals seeking to improve their RRT models should consider how to develop systems that achieve the RRT's promise in measurable ways.
Acknowledgements
The authors acknowledge Heather Leicester, MSPH, Senior Performance Improvement Analyst for Patient Safety and Quality Services at the University of California San Francisco for her work in data acquisition.
Disclosures: Dr Vittinghoff received salary support from an NIH grant during the time of this work for statistical consulting. He receives textbook royalties from Springer Verlag. Dr Auerbach was supported by 5K24HL098372‐02 from the National Heart Lung and Blood Institute during the period of this study although not specifically for this study; they had no role in the design or conduct of the study; the collection, analysis, or interpretation of the data; or the preparation, review, or approval of the manuscript. The other authors have no financial conflicts of interest.
Rapid response teams (RRT) have been promoted by numerous patient safety organizations to reduce preventable in‐hospital deaths.14 Initial studies of RRTs were promising,57 but recent literature,811 including systematic reviews and meta‐analyses, has called these findings into question. Nevertheless, RRTs remain popular in academic and community hospitals worldwide, and many have expanded their roles beyond solely responding to the deteriorating patient.12
Some RRTs, for example, proactively round on seriously ill ward patients and patients recently discharged from the intensive care unit (ICU) in an effort to prevent transitions to higher levels of care. Priestley and colleagues demonstrated that institution of such a team, referred to as a critical care outreach team (CCOT), decreased in‐hospital mortality while possibly increasing hospital length of stay (LOS).13 Three additional single‐center studies from the United Kingdom, where CCOTs are common, specifically examined proactive rounding by CCOTs on the ICU readmission rate: 2 observed no improvement,14, 15 while the third, limited by a small sample size, demonstrated a modest reduction in ICU readmissions.16
We sought to determine the impact of proactive rounding by an RRT on patients discharged from intensive care on the ICU readmission rate, ICU LOS, and in‐hospital mortality of patients discharged from the ICU. We hypothesized that proactive rounding by an RRT would decrease the ICU readmission rate, ICU LOS, and the in‐hospital mortality of patients discharged from the ICU.
MATERIALS AND METHODS
Site and Subjects
We carried out a retrospective, observational study of adult patients discharged from the ICU at University of California San Francisco (UCSF) Medical Center between January 2006 and June 2009. UCSF is a 790‐bed quaternary care academic hospital that admits approximately 17,000 patients annually and has 5 adult ICUs, with 62 beds and 3500 to 4000 ICU admissions annually. Our study was approved by the UCSF Medical Center Committee on Human Research; need for informed consent was waived.
Description of the RRT Before June 1, 2007
Throughout the study, the goal of the RRT was unchanged: to assess, triage, and institute early treatment in patients who experienced an acute decline in their clinical status. From November 2005 to October 2006, the RRT was staffed by an attending hospitalist and medicine resident during daytime, and by a critical care fellow at nighttime and on weekends. The RRT could be activated by any concerned staff member in response to a set of predetermined vital sign abnormalities, decreased urine output, or altered mental status, or simply if the staff member was concerned about the patient's clinical status. Despite extensive educational efforts, utilization of the team was low (2.7 calls per 1000 admissions) and, accordingly, it was discontinued in October 2006. After this time, staff would contact the primary team caring for the patient, should concerns regarding the patient's condition arise.
Description of the RRT After June 1, 2007
In an effort to expand its scope and utility, the RRT was reinstated on June 1, 2007 with a new composition and increased responsibilities. After this date, physician roles were eliminated, and the team composition changed to a dedicated critical care nurse and respiratory therapist, available 24 hours a day. Criteria for calling the team remained unchanged. In addition to responding to acute deteriorations in patients' clinical courses, the RRT began to proactively assess all patients within 12 hours of discharge from the ICU and would continue to round on these patients daily until it was felt that they were clinically stable. During these rounds, the RRT would provide consultation expertise to the bedside nurse and contact the patient's clinicians if concern existed about a patient's clinical trajectory; decisions to transfer a patient back to the ICU ultimately rested with the patient's primary team. During this time period, the RRT received an average of 110.6 calls per 1000 admissions.
Data Sources
Data collected included: demographics, clinical information (all patient refined [APR] severity of illness, APR risk of mortality, and the presence of 29 comorbidities), whether there was a readmission to the ICU, the total ICU LOS, and the vital status at the time of hospital discharge.
Outcomes
Outcomes included: readmission to the ICU, defined as 2 noncontiguous ICU stays during a single hospitalization; ICU LOS, defined as the total number of ICU days accrued during hospitalization; and in‐hospital mortality of patients discharged from the ICU.
Adjustment Variables
Patient age, gender, race, and ethnicity were available from administrative data. We used admission diagnosis code data to classify comorbidities using the method of Elixhauser et al.17
Statistical Analysis
For each of the 3 study outcomes, we assessed the effects of the intervention using multivariable models adjusting for patient‐ and service‐level factors, including a gamma model for ICU LOS and logistic models for ICU readmission and in‐hospital mortality of patients discharged from the ICU. We first compared unadjusted outcome levels before and after implementation. We then used an interrupted time series (ITS) framework to assess the effects of the intervention in terms of 5 measures: 1) the secular trend in the mean of the outcome before the intervention; 2) the change in the mean at the start of the implementation, or immediate effects; 3) the secular trend in the mean after implementation; 4) the change in secular trend, reflecting cumulative intervention effects; and 5) the net effect of the intervention, estimated as the adjusted difference between the fitted mean at the end of the postintervention period and the expected mean if the preintervention trend had continued without interruption or change.
Secondary Analyses
Given the heterogeneity of the RRT in the preintervention period, we assessed potential changes in trend at October 2006, the month in which the RRT was discontinued. We also examined changes in trend midway through the postimplementation period to evaluate for increased efficacy of the RRT with time.
Selection of Covariates
Age, race, and admitting service were included in both the prepost and ITS models by default for face validity. Additional covariates were selected for each outcome using backwards deletion with a retention criterion of P < 0.05, based on models that allowed the outcome rate to vary freely month to month. Because these data were obtained from administrative billing datasets, and the presence of comorbidities could not be definitively linked with time points during hospitalization, only those comorbidities that were likely present prior at ICU discharge were included. For similar reasons, APR severity of illness and risk of mortality scores, which were calculated from billing diagnoses at the end of hospitalization, were excluded from the models.
RESULTS
Patient Characteristics
During the study period, 11,687 patients were admitted to the ICU; 10,288 were discharged from the ICU alive and included in the analysis. In the 17 months prior to the introduction of proactive rounding by the RRT, 4902 (41.9%) patients were admitted, and during the 25 months afterwards, 6785 (58.1%) patients. Patients admitted in the 2 time periods were similar, although there were clinically small but statistically significant differences in race, APR severity of illness, APR risk of mortality, and certain comorbidities between the 2 groups (Table 1).
| Pre‐RRT (n = 4305) N (%) | Post‐RRT (n = 5983) N (%) | P Value | |
|---|---|---|---|
| |||
| Age, mean (y [SD]) | 57.7 [16.6] | 57.9 [16.5] | 0.50 |
| Female gender | 2,005 (46.6) | 2,824 (47.2) | 0.53 |
| Race | 0.0013 | ||
| White | 2,538 (59.0) | 3,520 (58.8) | |
| Black | 327 (7.6) | 436 (7.3) | |
| Asian | 642 (14.9) | 842 (14.1) | |
| Other | 719 (16.7) | 1,121 (18.7) | |
| Unknown | 79 (1.8) | 64 (1.1) | |
| Ethnicity | 0.87 | ||
| Hispanic | 480 (11.2) | 677 (11.3%) | |
| Non‐Hispanic | 3,547 (82.4) | 4,907 (82.0%) | |
| Unknown | 278 (6.5) | 399 (6.7) | |
| Insurance | 0.50 | ||
| Medicare | 1,788 (41.5) | 2,415 (40.4) | |
| Medicaid/Medi‐Cal | 699 (16.2) | 968 (16.2) | |
| Private | 1,642 (38.1) | 2,329 (38.9) | |
| Other | 176 (4.1) | 271 (4.5) | |
| Admission source | 0.41 | ||
| ED | 1,621 (37.7) | 2,244 (37.5) | |
| Outside hospital | 652 (15.2) | 855 (14.3) | |
| Direct admit | 2,032 (47.2) | 2,884 (48.2) | |
| Major surgery | 0.99 | ||
| Yes | 3,107 (72.2) | 4,319 (72.2) | |
| APR severity of illness | 0.0001 | ||
| Mild | 622 (14.5) | 828 (13.8) | |
| Moderate | 1,328 (30.9) | 1,626 (27.2) | |
| Major | 1,292 (30.0) | 1,908 (31.9) | |
| Extreme | 1,063 (24.7) | 1,621 (27.1) | |
| APR risk of mortality | 0.0109 | ||
| Mild | 1,422 (33.0) | 1,821 (30.4) | |
| Moderate | 1,074 (25.0) | 1,467 (24.5) | |
| Major | 947 (22.0) | 1,437 (24.0) | |
| Extreme | 862 (20.0) | 1,258 (21.0) | |
| Admitting service | 0.11 | ||
| Adult general surgery | 190 (4.4) | 260 (4.4) | |
| Cardiology | 347 (8.1) | 424 (7.1) | |
| Cardiothoracic surgery | 671 (15.6) | 930 (15.5) | |
| Kidney transplant surgery | 105 (2.4) | 112 (1.9) | |
| Liver transplant surgery | 298 (6.9) | 379 (6.3) | |
| Medicine | 683 (15.9) | 958 (16.0) | |
| Neurology | 420 (9.8) | 609 (10.2) | |
| Neurosurgery | 1,345 (31.2) | 1,995 (33.3) | |
| Vascular surgery | 246 (5.7) | 316 (5.3) | |
| Comorbidities | |||
| Hypertension | 2,054 (47.7) | 2,886 (48.2) | 0.60 |
| Fluid and electrolyte disorders | 998 (23.2) | 1,723 (28.8) | <0.0001 |
| Diabetes | 708 (16.5) | 880 (14.7) | 0.02 |
| Chronic obstructive pulmonary disease | 632 (14.7) | 849 (14.2) | 0.48 |
| Iron deficiency anemia | 582 (13.5) | 929 (15.5) | 0.005 |
| Renal failure | 541 (12.6) | 744 (12.4) | 0.84 |
| Coagulopathy | 418 (9.7) | 712 (11.9) | 0.0005 |
| Liver disease | 400 (9.3) | 553 (9.2) | 0.93 |
| Hypothyroidism | 330 (7.7) | 500 (8.4) | 0.20 |
| Depression | 306 (7.1) | 508 (8.5) | 0.01 |
| Peripheral vascular disease | 304 (7.1) | 422 (7.1) | 0.99 |
| Congestive heart failure | 263 (6.1) | 360 (6.0) | 0.85 |
| Weight loss | 236 (5.5) | 425 (7.1) | 0.0009 |
| Paralysis | 225 (5.2) | 328 (5.5) | 0.57 |
| Neurological disorders | 229 (5.3) | 276 (4.6) | 0.10 |
| Valvular disease | 210 (4.9) | 329 (5.5) | 0.16 |
| Drug abuse | 198 (4.6) | 268 (4.5) | 0.77 |
| Metastatic cancer | 198 (4.6) | 296 (5.0) | 0.42 |
| Obesity | 201 (4.7) | 306 (5.1) | 0.30 |
| Alcohol abuse | 178 (4.1) | 216 (3.6) | 0.17 |
| Diabetes with complications | 175 (4.1) | 218 (3.6) | 0.27 |
| Solid tumor without metastasis | 146 (3.4) | 245 (4.1) | 0.07 |
| Psychoses | 115 (2.7) | 183 (3.1) | 0.25 |
| Rheumatoid arthritis/collagen vascular disease | 96 (2.2) | 166 (2.8) | 0.08 |
| Pulmonary circulation disease | 83 (1.9) | 181 (3.0) | 0.0005 |
| Outcomes | |||
| Readmission to ICU | 288 (6.7) | 433 (7.3) | 0.24 |
| ICU length of stay, mean [SD] | 5.1 [9.7] | 4.9 [8.3] | 0.24 |
| In‐hospital mortality of patients discharged from the ICU | 260 (6.0) | 326 (5.5) | 0.24 |
ICU Readmission Rate
Introduction of proactive rounding by the RRT was not associated with unadjusted differences in the ICU readmission rate (6.7% preintervention vs 7.3% postintervention, P = 0.24; Table 1). In the adjusted ITS model, the intervention had no net effect on the odds of ICU readmission (adjusted odds ratio [AOR] for net intervention effect 0.98, 95% confidence interval [CI] 0.42, 2.28), with similar secular trends both preintervention (AOR 1.00 per year, 95% CI 0.97, 1.03), and afterwards (AOR 0.99 per year, 95% CI 0.98, 01.00), and a nonsignificant increase at implementation (Table 2). Figure 1 uses solid lines to show the fitted readmission rates, a hatched line to show the projection of the preintervention secular trend into the postintervention period, and circles to represent adjusted monthly means. The lack of a net intervention effect is indicated by the convergence of the solid and hatched lines 24 months postintervention.
| Outcome: Summary Effect Measure | Value (95% CI) | P Value |
|---|---|---|
| ||
| ICU readmission rateadjusted odds ratio | ||
| Pre‐RRT trend | 1.00 (0.97, 1.03) | 0.98 |
| Change at RRT implementation | 1.24 (0.94, 1.63) | 0.13 |
| Post‐RRT trend | 0.98 (0.97, 1.00) | 0.06 |
| Change in trend | 0.98 (0.96, 1.02) | 0.39 |
| Net intervention effect | 0.92 (0.40, 2.12) | 0.85 |
| ICU average length of stayadjusted ratio of means | ||
| Trend at 9 mo pre‐RRT | 0.98 (0.96, 1.00) | 0.05 |
| Trend at 3 mo pre‐RRT | 1.02 (0.99, 1.04) | 0.19 |
| Change in trend at 3 mo pre‐RRT | 1.03 (1.00, 1.07) | 0.07 |
| Change at RRT implementation | 0.92 (0.80, 1.06) | 0.27 |
| Post‐RRT trend | 1.00 (0.99, 1.00) | 0.35 |
| Change in trend at RRT implementation | 0.98 (0.96, 1.01) | 0.14 |
| Net intervention effect | 0.60 (0.31, 1.18) | 0.14 |
| In‐hospital mortality of patients discharged from the ICUadjusted odds ratio | ||
| Pre‐RRT trend | 1.02 (0.99, 1.06) | 0.15 |
| Change at RRT implementation | 0.74 (0.51, 1.08) | 0.12 |
| Post‐RRT trend | 1.00 (0.98, 1.01) | 0.68 |
| Change in trend | 0.97 (0.94, 1.01) | 0.14 |
| Net intervention effect | 0.39 (0.14, 1.10) | 0.08 |
ICU Average LOS
Introduction of proactive rounding by the RRT was not associated with unadjusted differences in ICU average LOS (5.1 days preintervention vs 4.9 days postintervention, P = 0.24; Table 1). Trends in ICU LOS may have changed in October 2006 (P = 0.07), decreasing in the first half of the study period (adjusted rate ratio [ARR] 0.98 per year, 95% CI 0.961.00), but did not change significantly thereafter. As with the ICU readmission rate, neither the change in estimated secular trend after implementation (ARR 0.98, 95% CI 0.961.01), nor the net effect of the intervention (ARR 0.62, 95% CI 0.321.22) was statistically significant (Table 2); these results are depicted graphically in Figure 2.
In‐Hospital Mortality of Patients Discharged From the ICU
Introduction of proactive rounding by the RRT was not associated with unadjusted differences in the mortality of patients discharged from the ICU (6.0% preintervention vs 5.5% postintervention, P = 0.24; Table 1). Similarly, in the adjusted ITS model, the intervention had no statistically significant net effect on the mortality outcome (Table 2 and Figure 3).
Secondary Analyses
Apart from weak evidence for a change in trend in ICU LOS in October 2006, no other changes in trend were found within the preintervention or postintervention periods (data not shown). This suggests that the heterogeneity of the preintervention RRT had no significant impact on the 3 outcomes examined, and that the RRT intervention failed to gain efficacy with time in the postintervention period. Additionally, we saw no outcome benefit in sensitivity analyses among all ICU patients or in service‐defined analyses (eg, surgical services), where ability to control for illness severity was improved.
DISCUSSION
In this single center study, introduction of an RRT that proactively rounded on patients discharged from the ICU did not reduce the ICU readmission rate, ICU LOS, or mortality of patients discharged from the ICU, after accounting for secular trends using robust ITS methods and adjusting for patient level factors.
Our study is consistent with 2 smaller studies that assessed the impact of proactive rounding by a CCOT on ICU readmission rate. Leary and Ridley14 found that proactively rounding by a CCOT did not reduce ICU readmissions or shorten the ICU LOS, although this study was limited by a surprisingly low ICU readmission rate and short ICU LOS prior to the intervention. Another study15 also observed no change in the ICU readmission rate following introduction of a proactively rounding CCOT but noted small reductions in both ICU and hospital mortality. The sole study showing an effect16 observed a lower ICU readmission rate and increased survival to hospital discharge (after excluding do not resuscitate [DNR] patients) with implementation of a CCOT, although some of their findings may be explained by their CCOT's use of palliative care services, a function not featured in our model.
Our study adds to the meta‐analyses and systematic reviews810 that have questioned the hypothesis that a trained and proactive team of caregivers should be able to prevent patients from returning to the ICU. Perhaps one reason why this is not true is that proactive rounding by RRTs may have minimal effect in systems where step‐down beds are readily available. At UCSF, nearly every patient transferred out of the ICU is triaged to a step‐down unit, where telemetry and pulse oximetry are continuously monitored. Despite this, however, our institution's 2 step‐down units generate more calls to our RRT than any other units in the hospital.
We were surprised to see that proactive rounding failed to shorten ICU LOS, hypothesizing that clinicians would be more comfortable discharging patients from the ICU knowing that the RRT would be closely monitoring them afterwards. Although we have no data to support this hypothesis, increased use of the RRT may have also increased step‐down bed use, as patients on the general medicalsurgical floors were transferred to a higher level of care upon recommendation of the RRT, thereby delaying transfers out of the ICU. Moreover, the opening of an additional 16‐bed ICU in October 2008 might have encouraged clinicians to transfer patients back to the ICU simply because beds were more easily accessible than before.
Introduction of proactive rounding by the RRT was also not associated with differences in the mortality rate of patients discharged from the ICU. This finding conflicts with the results of Garcea et al,15 Ball et al,16 and Priestley et al13, all of which found that implementation of a CCOT led to small but statistically significant reductions in in‐hospital mortality. All 3 of these studies, however, examined smaller patient populations (1380, 470, and 2903 patients, respectively), and both the Priestley and Ball studies13, 16 had significantly shorter periods of data collection (24 months and 32 weeks, respectively). Our results are based on models with confidence intervals and P values that account for variability in all 3 underlying effect estimates but assume a linear extrapolation of the preintervention trend. This approach allowed us to flexibly deal with changes related to the intervention, while relying on our large sample size to define time trends not dealt with adequately (or at all) in previous research.
The lack of improvement in outcomes cannot be attributed to immaturity of the RRT or failure of the clinical staff to use the RRT adequately. A prespecified secondary data analysis midway through the postintervention time period demonstrated that the RRT failed to gain efficacy with time with respect to all 3 outcomes. The postintervention RRT was also utilized far more frequently than its predecessor (110.6 vs 2.7 calls per 1000 admissions, respectively), and this degree of RRT utilization far surpasses the dose considered to be indicative of a mature RRT system.12
Our study has several limitations. First, we relied on administrative rather than chart‐collected data to determine the reason for ICU admission, and the APR severity of illness and risk of mortality scores. It seems unlikely, however, that coding deficiencies or biases affected the preintervention and postintervention patient populations differently. Even though we adjusted for all available measures, it is possible that we were not able to account for time trends in all potential confounders. Second, we did not have detailed clinical information on reasons for ICU readmission and whether readmissions occurred before or after the RRT proactively rounded on the patient. Therefore, potential readmissions to the ICU that might have been planned or which would have happened regardless of the presence of the RRT, such as for antibiotic desensitization, could not be accounted for. Third, introduction of proactive rounding by the RRT in June 2007 was accompanied by a change in the RRT's composition, from a physician‐led model to a nurse‐led model. Therefore, inherent differences in the way that physicians and nurses might assess and triage patients could not have been adjusted for. Lastly, this was a retrospective study conducted at a single academic medical center with a specific RRT model, and our results may not be directly applicable to nonteaching settings or to different RRT models.
Our findings raise further questions about the benefits of RRTs as they assume additional roles, such as proactive rounding on patients recently discharged from the ICU. The failure of our RRT to reduce the ICU readmission rate, the ICU average LOS, and the mortality of patients discharged from the ICU raises concerns that the benefits of our RRT are not commensurate with its cost. While defining the degree of impact and underlying mechanisms are worthy of prospective study, hospitals seeking to improve their RRT models should consider how to develop systems that achieve the RRT's promise in measurable ways.
Acknowledgements
The authors acknowledge Heather Leicester, MSPH, Senior Performance Improvement Analyst for Patient Safety and Quality Services at the University of California San Francisco for her work in data acquisition.
Disclosures: Dr Vittinghoff received salary support from an NIH grant during the time of this work for statistical consulting. He receives textbook royalties from Springer Verlag. Dr Auerbach was supported by 5K24HL098372‐02 from the National Heart Lung and Blood Institute during the period of this study although not specifically for this study; they had no role in the design or conduct of the study; the collection, analysis, or interpretation of the data; or the preparation, review, or approval of the manuscript. The other authors have no financial conflicts of interest.
- , , , . The 100,000 lives campaign: setting a goal and a deadline for improving health care quality. JAMA. 2006;295(3):324–327.
- Clinical Governance Unit, Quality and Safety Branch, Rural and Regional Health and Aged Care Services Division Safer Systems, Department of Human Services, State Government of Victoria. Safer Systems—Saving Lives Campaign. Available at: http://www.health.vic.gov.au/sssl. Accessed April 5, 2012.
- Canadian Patient Safety Institute. Safer Healthcare Now! Campaign. Available at: http://www.saferhealthcarenow.ca. Accessed April 5, 2012.
- , . The growth of rapid response systems. Jt Comm J Qual Patient Saf. 2008;34:489–495.
- , , , . The medical emergency team. Anaesth Intensive Care. 1995;23(2):183–186.
- , , , et al. Rates of in‐hospital arrests, deaths, and intensive care admission: the effect of a medical emergency team. Med J Aust. 2000;173:236–240.
- , , , , . The patient‐at‐risk team: identifying and managing seriously ill ward patients. Anaesthesia. 1999;54:853–860.
- , , , , . Effects of rapid response systems on clinical outcomes: systemic review and meta‐analysis. J Hosp Med. 2007;2:422–432.
- , , , , . Rapid response teams: a systemic review and meta‐analysis. Arch Intern Med. 2010;170(1):18–26.
- , , , , , . Rapid response systems: a systematic review. Crit Care Med. 2007;35(5):1238–1243.
- , , , et al. Introduction of the medical emergency team (MET) system: a cluster‐randomised controlled trial. Lancet. 2005;365:2091–2097.
- , , . Rapid response teams. N Engl J Med. 2011;365:139–146.
- , , , et al. Introducing critical care outreach: a ward‐randomised trial of phased introduction in a general hospital. Intensive Care Med. 2004;30(7):1398–1404.
- , . Impact of an outreach team on re‐admissions to a critical care unit. Anaesthesia. 2003;58:328–332.
- , , , , . Impact of a critical care outreach team on critical care readmissions and mortality. Acta Anaesthesiol Scand. 2004;48:1096–1100.
- , , . Effect of the critical care outreach team on patient survival to discharge from hospital and readmission to critical care: non‐randomised population based study. BMJ. 2003;327:1014–1017.
- , , , . Comorbidity measures for use with administrative data. Med Care. 1998;36(1):8–27.
- , , , . The 100,000 lives campaign: setting a goal and a deadline for improving health care quality. JAMA. 2006;295(3):324–327.
- Clinical Governance Unit, Quality and Safety Branch, Rural and Regional Health and Aged Care Services Division Safer Systems, Department of Human Services, State Government of Victoria. Safer Systems—Saving Lives Campaign. Available at: http://www.health.vic.gov.au/sssl. Accessed April 5, 2012.
- Canadian Patient Safety Institute. Safer Healthcare Now! Campaign. Available at: http://www.saferhealthcarenow.ca. Accessed April 5, 2012.
- , . The growth of rapid response systems. Jt Comm J Qual Patient Saf. 2008;34:489–495.
- , , , . The medical emergency team. Anaesth Intensive Care. 1995;23(2):183–186.
- , , , et al. Rates of in‐hospital arrests, deaths, and intensive care admission: the effect of a medical emergency team. Med J Aust. 2000;173:236–240.
- , , , , . The patient‐at‐risk team: identifying and managing seriously ill ward patients. Anaesthesia. 1999;54:853–860.
- , , , , . Effects of rapid response systems on clinical outcomes: systemic review and meta‐analysis. J Hosp Med. 2007;2:422–432.
- , , , , . Rapid response teams: a systemic review and meta‐analysis. Arch Intern Med. 2010;170(1):18–26.
- , , , , , . Rapid response systems: a systematic review. Crit Care Med. 2007;35(5):1238–1243.
- , , , et al. Introduction of the medical emergency team (MET) system: a cluster‐randomised controlled trial. Lancet. 2005;365:2091–2097.
- , , . Rapid response teams. N Engl J Med. 2011;365:139–146.
- , , , et al. Introducing critical care outreach: a ward‐randomised trial of phased introduction in a general hospital. Intensive Care Med. 2004;30(7):1398–1404.
- , . Impact of an outreach team on re‐admissions to a critical care unit. Anaesthesia. 2003;58:328–332.
- , , , , . Impact of a critical care outreach team on critical care readmissions and mortality. Acta Anaesthesiol Scand. 2004;48:1096–1100.
- , , . Effect of the critical care outreach team on patient survival to discharge from hospital and readmission to critical care: non‐randomised population based study. BMJ. 2003;327:1014–1017.
- , , , . Comorbidity measures for use with administrative data. Med Care. 1998;36(1):8–27.
Copyright © 2012 Society of Hospital Medicine
Risk Factors For Unplanned ICU Transfer
Emergency Department (ED) patients who are hospitalized and require unplanned transfer to the intensive care unit (ICU) within 24 hours of arrival on the ward have higher mortality than direct ICU admissions.1, 2 Previous research found that 5% of ED admissions experienced unplanned ICU transfer during their hospitalization, yet these patients account for 25% of in‐hospital deaths and have a longer length of stay than direct ICU admissions.1, 3 For these reasons, inpatient rapid‐response teams and early warning systems have been studied to reduce the mortality of patients who rapidly deteriorate on the hospital ward.410 However, there is little conclusive evidence that these interventions decrease mortality.710 It is possible that with better recognition and intervention in the ED, a portion of these unplanned ICU transfers and their subsequent adverse outcomes could be prevented.11
Previous research on risk factors for unplanned ICU transfers among ED admissions is limited. While 2 previous studies from non‐US hospitals used administrative data to identify some general populations at risk for unplanned ICU transfer,12, 13 these studies did not differentiate between transfers shortly after admission and those that occurred during a prolonged hospital staya critical distinction since the outcomes between these groups differs substantially.1 Another limitation of these studies is the absence of physiologic measures at ED presentation, which have been shown to be highly predictive of mortality.14
In this study, we describe risk factors for unplanned transfer to the ICU within 24 hours of arrival on the ward, among a large cohort of ED hospitalizations across 13 community hospitals. Focusing on admitting diagnoses most at risk, our goal was to inform efforts to improve the triage of ED admissions and determine which patients may benefit from additional interventions, such as improved resuscitation, closer monitoring, or risk stratification tools. We also hypothesized that higher volume hospitals would have lower rates of unplanned ICU transfers, as these hospitals are more likely have more patient care resources on the hospital ward and a higher threshold to transfer to the ICU.
METHODS
Setting and Patients
The setting for this study was Kaiser Permanente Northern California (KPNC), a large integrated healthcare delivery system serving approximately 3.3 million members.1, 3, 15, 16 We extracted data on all adult ED admissions (18 years old) to the hospital between 2007 and 2009. We excluded patients who went directly to the operating room or the ICU, as well as gynecological/pregnancy‐related admissions, as these patients have substantially different mortality risks.14 ED admissions to hospital wards could either go to medicalsurgical units or transitional care units (TCU), an intermediate level of care between the medicalsurgical units and the ICU. We chose to focus on hospitals with similar inpatient structures. Thus, 8 hospitals without TCUs were excluded, leaving 13 hospitals for analysis. The KPNC Institutional Review Board approved this study.
Main Outcome Measure
The main outcome measure was unplanned transfer to the ICU within 24 hours of arrival to the hospital ward, based upon bed history data. As in previous research, we make the assumptionwhich is supported by the high observed‐to‐expected mortality ratios found in these patientsthat these transfers to the ICU were due to clinical deterioration, and thus were unplanned, rather than a planned transfer to the ICU as is more common after an elective surgical procedure.13 The comparison population was patients admitted from the ED to the ward who never experienced a transfer to the ICU.
Patient and Hospital Characteristics
We extracted patient data on age, sex, admitting diagnosis, chronic illness burden, acute physiologic derangement in the ED, and hospital unit length of stay. Chronic illness was measured using the Comorbidity Point Score (COPS), and physiologic derangement was measured using the Laboratory Acute Physiology Score (LAPS) calculated from labs collected in the ED.1, 14, 17 The derivation of these variables from the electronic medical record has been previously described.14 The COPS was derived from International Classification of Diseases, Ninth Revision (ICD‐9) codes for all Kaiser Permanente Medical Care Program (KPMCP) inpatient and outpatient encounters prior to hospitalization. The LAPS is based on 14 possible lab tests that could be drawn in the ED or in the 72 hours prior to hospitalization. The admitting diagnosis is the ICD‐9 code assigned for the primary diagnosis determined by the admitting physician at the time when hospital admission orders are entered. We further collapsed a previously used categorization of 44 primary condition diagnoses, based on admission ICD‐9 codes,14 into 25 broad diagnostic categories based on pathophysiologic plausibility and mortality rates. We tabulated inpatient admissions originating in the ED to derive a hospital volume measure.
Statistical Analyses
We compared patient characteristics, hospital volume, and outcomes by whether or not an unplanned ICU transfer occurred. Unadjusted analyses were performed with analysis of variance (ANOVA) and chi‐square tests. We calculated crude rates of unplanned ICU transfer per 1,000 ED inpatient admissions by patient characteristics and by hospital, stratified by hospital volume.
We used a hierarchical multivariate logistic regression model to estimate adjusted odds ratios for unplanned ICU transfer as a function of both patient‐level variables (age, sex, COPS, LAPS, time of admission, admission to TCU vs ward, admitting diagnosis) and hospital‐level variables (volume) in the model. We planned to choose the reference group for admitting diagnosis as the one with an unadjusted odds ratio closest to the null (1.00). This model addresses correlations between patients with multiple hospitalizations and clustering by hospital, by fitting random intercepts for these clusters. All analyses were performed in Stata 12 (StataCorp, College Station, TX), and statistics are presented with 95% confidence intervals (CI). The Stata program gllamm (Generalized Linear Latent and Mixed Models) was used for hierarchical modeling.18
RESULTS
Of 178,315 ED non‐ICU hospitalizations meeting inclusion criteria, 4,252 (2.4%) were admitted to the ward and were transferred to the ICU within 24 hours of leaving the ED. There were 122,251 unique patients in our study population. Table 1 compares the characteristics of ED hospitalizations in which an unplanned transfer occurred to those that did not experience an unplanned transfer. Unplanned transfers were more likely to have a higher comorbidity burden, more deranged physiology, and more likely to arrive on the floor during the overnight shift.
| Characteristics | Unplanned Transfer to ICU Within 24 h of Leaving ED? | P Value* | |
|---|---|---|---|
| Yes | No | ||
| N = 4,252 (2.4%) | N = 174,063 (97.6%) | ||
| |||
| Age, median (IQR) | 69 (5680) | 70 (5681) | <0.01 |
| Male, % | 51.3 | 45.9 | <0.01 |
| Comorbidity Points Score (COPS), median (IQR) | 100 (46158) | 89 (42144) | <0.01 |
| Laboratory Acute Physiology Score (LAPS), median (IQR) | 26 (1342) | 18 (633) | <0.01 |
| Nursing shift on arrival to floor, % | |||
| Day: 7 am3 pm (Reference) | 20.1 | 20.1 | NS |
| Evening: 3 pm11 pm | 47.6 | 50.2 | NS |
| Overnight: 11 pm7 am | 32.3 | 29.7 | <0.01 |
| Weekend admission, % | 33.7 | 32.7 | NS |
| Admitted to monitored bed, % | 24.1 | 24.9 | NS |
| Emergency department annual volume, mean (SD) | 48,755 (15,379) | 50,570 (15,276) | <0.01 |
| Non‐ICU annual admission volume, mean (SD) | 5,562 (1,626) | 5,774 (1,568) | <0.01 |
| Admitting diagnosis, listed by descending frequency, % | NS | ||
| Pneumonia and respiratory infections | 16.3 | 11.8 | <0.01 |
| Gastrointestinal bleeding | 12.8 | 13.6 | NS |
| Chest pain | 7.3 | 10.0 | <0.01 |
| Miscellaneous conditions | 5.6 | 6.2 | NS |
| All other acute infections | 4.7 | 6.0 | <0.01 |
| Seizures | 4.1 | 5.9 | <0.01 |
| AMI | 3.9 | 3.3 | <0.05 |
| COPD | 3.8 | 3.0 | <0.01 |
| CHF | 3.5 | 3.7 | NS |
| Arrhythmias and pulmonary embolism | 3.5 | 3.3 | NS |
| Stroke | 3.4 | 3.5 | NS |
| Diabetic emergencies | 3.3 | 2.6 | <0.01 |
| Metabolic, endocrine, electrolytes | 3.0 | 2.9 | NS |
| Sepsis | 3.0 | 1.2 | <0.01 |
| Other neurology and toxicology | 3.0 | 2.9 | NS |
| Urinary tract infections | 2.9 | 3.2 | NS |
| Catastrophic conditions | 2.6 | 1.2 | <0.01 |
| Rheumatology | 2.5 | 3.5 | <0.01 |
| Hematology and oncology | 2.4 | 2.4 | NS |
| Acute renal failure | 1.9 | 1.1 | <0.01 |
| Pancreatic and liver | 1.7 | 2.0 | NS |
| Trauma, fractures, and dislocations | 1.6 | 1.8 | NS |
| Bowel obstructions and diseases | 1.6 | 2.9 | <0.01 |
| Other cardiac conditions | 1.5 | 1.3 | NS |
| Other renal conditions | 0.6 | 1.0 | <0.01 |
| Inpatient length of stay, median days (IQR) | 4.7 (2.78.6) | 2.6 (1.54.4) | <0.01 |
| Died during hospitalization, % | 12.7 | 2.4 | <0.01 |
Unplanned ICU transfers were more frequent in lower volume hospitals (Table 1). Figure 1 displays the inverse relationship between hospital annual ED inpatient admission volume and unplanned ICU transfers rates. The lowest volume hospital had a crude rate twice as high as the 2 highest volume hospitals (39 vs 20, per 1,000 admissions).
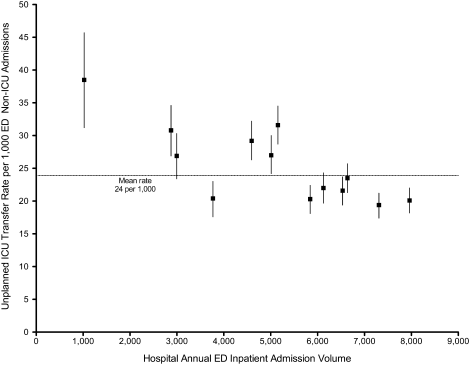
Pneumonia/respiratory infection was the most frequent admitting condition associated with unplanned transfer (16.3%) (Table 1). There was also wide variation in crude rates for unplanned ICU transfer by admitting condition (Figure 2). Patients admitted with sepsis had the highest rate (59 per 1,000 admissions), while patients admitted with renal conditions other than acute renal failure had the lowest rates (14.3 per 1,000 admissions).
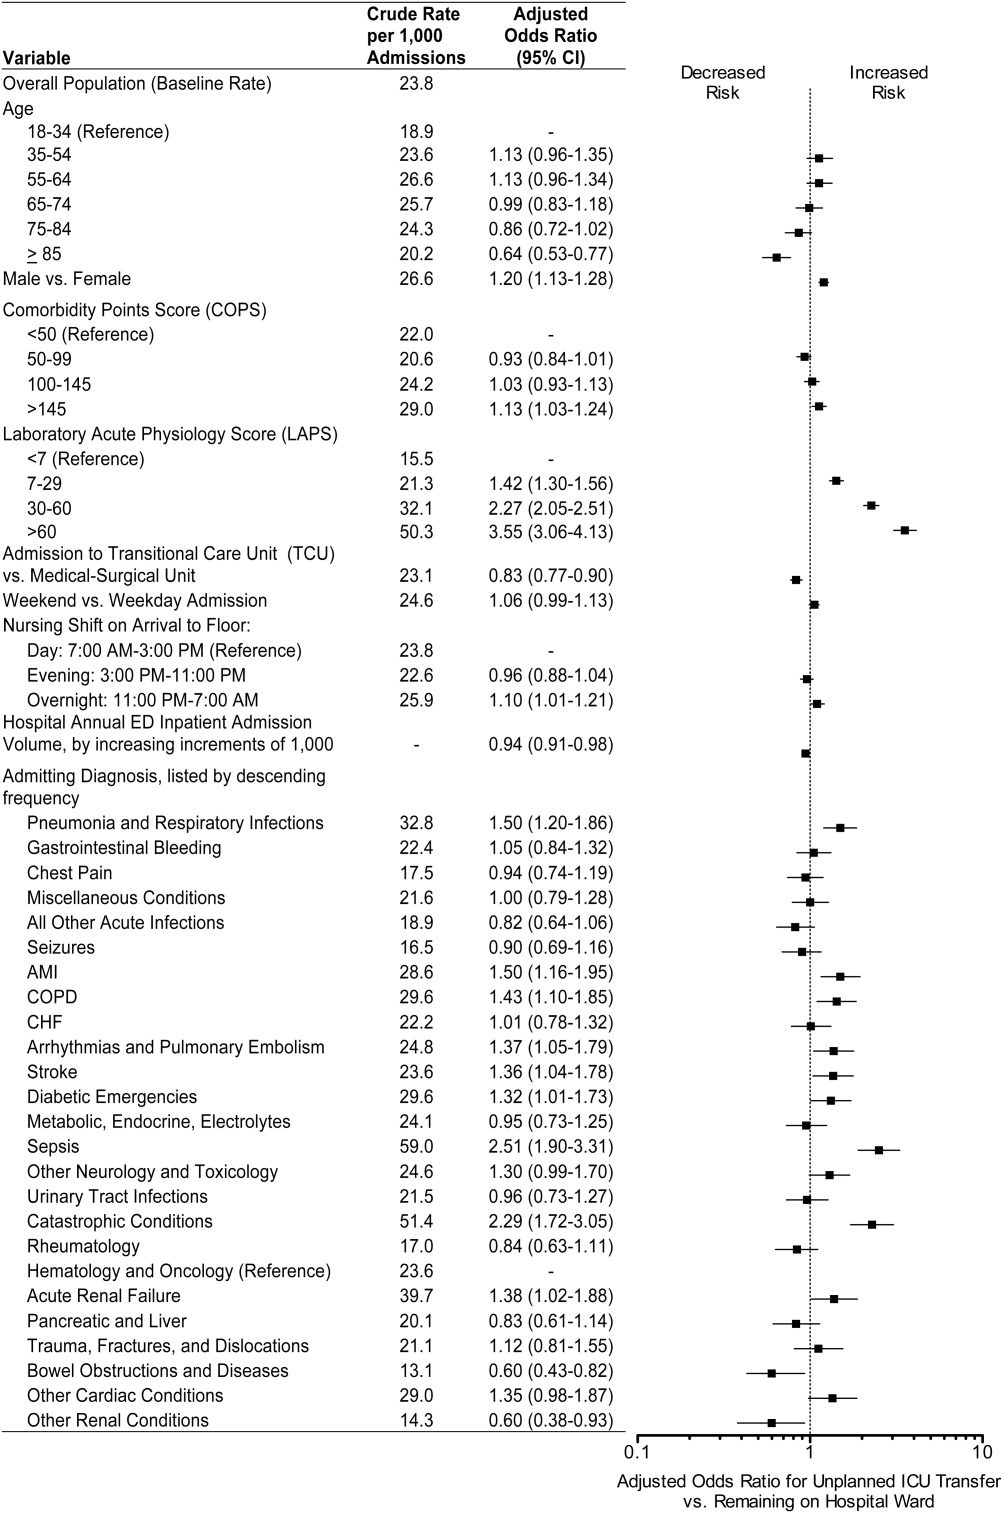
We confirmed that almost all diagnoses found to account for a disproportionately high share of unplanned ICU transfers in Table 1 were indeed independently associated with this phenomenon after adjustment for patient and hospital differences (Figure 2). Pneumonia remained the most frequent condition associated with unplanned ICU transfer (odds ratio [OR] 1.50; 95% CI 1.201.86). Although less frequent, sepsis had the strongest association of any condition with unplanned transfer (OR 2.51; 95% CI 1.903.31). However, metabolic, endocrine, and electrolyte conditions were no longer associated with unplanned transfer after adjustment, while arrhythmias and pulmonary embolism were. Other conditions confirmed to be associated with increased risk of unplanned transfer included: myocardial infarction (MI), chronic obstructive pulmonary disease (COPD), stroke, diabetic emergencies, catastrophic conditions (includes aortic catastrophes, all forms of shock except septic shock, and intracranial hemorrhage), and acute renal failure. After taking into account the frequency of admitting diagnoses, respiratory conditions (COPD, pneumonia/acute respiratory infection) comprised nearly half (47%) of all conditions associated with increased risk of unplanned ICU transfer.
Other factors confirmed to be independently associated with unplanned ICU transfer included: male sex (OR 1.20; 95% CI 1.131.28), high comorbidity burden as measured by COPS >145 (OR 1.13; 95% CI 1.031.24), increasingly abnormal physiology compared to a LAPS <7, and arrival on ward during the overnight shift (OR 1.10; 95% CI 1.011.21). After adjustment, we did find that admission to the TCU rather than a medicalsurgical unit was associated with decreased risk of unplanned ICU transfer (OR 0.83; 95% CI 0.770.90). Age 85 was associated with decreased risk of unplanned ICU transfer relative to the youngest age group of 1834‐year‐old patients (OR 0.64; 95% CI 0.530.77).
ED admissions to higher volume hospitals were 6% less likely to experience an unplanned transfer for each additional 1,000 annual ED hospitalizations over a lower volume hospital (OR 0.94; 95% CI 0.910.98). In other words, a patient admitted to a hospital with 8,000 annual ED hospitalizations had 30% decreased odds of unplanned ICU transfer compared to a hospital with only 3,000 annual ED hospitalizations.
DISCUSSION
Patients admitted with respiratory conditions accounted for half of all admitting diagnoses associated with increased risk of unplanned transfer to the ICU within 24 hours of arrival to the ward. We found that 1 in 30 ED ward admissions for pneumonia, and 1 in 33 for COPD, were transferred to the ICU within 24 hours. These findings indicate that there is some room for improvement in early care of respiratory conditions, given the average unplanned transfer rate of 1 in 42, and previous research showing that patients with pneumonia and patients with COPD, who experience unplanned ICU transfer, have substantially worse mortality than those directly admitted to the ICU.1
Although less frequent than hospitalizations for respiratory conditions, patients admitted with sepsis were at the highest risk of unplanned ICU transfer (1 in 17 ED non‐ICU hospitalizations). We also found that MI and stroke ward admissions had a higher risk of unplanned ICU transfer. However, we previously found that unplanned ICU transfers for sepsis, MI, and stroke did not have worse mortality than direct ICU admits for these conditions.1 Therefore, quality improvement efforts to reduce excess mortality related to early decompensation in the hospital and unplanned ICU transfer would be most effective if targeted towards respiratory conditions such as pneumonia and COPD.
This is the only in‐depth study, to our knowledge, to explore the association between a set of mutually exclusive diagnostic categories and risk of unplanned ICU transfer within 24 hours, and it is the first study to identify risk factors for unplanned ICU transfer in a multi‐hospital cohort adjusted for patient‐ and hospital‐level characteristics. We also identified a novel hospital volumeoutcome relationship: Unplanned ICU transfers are up to twice as likely to occur in the smallest volume hospitals compared with highest volume hospitals. Hospital volume has long been proposed as a proxy for hospital resources; there are several studies showing a relationship between low‐volume hospitals and worse outcomes for a number of conditions.19, 20 Possible mechanisms may include decreased ICU capacity, decreased on‐call intensivists in the hospital after hours, and less experience with certain critical care conditions seen more frequently in high‐volume hospitals.21
Patients at risk of unplanned ICU transfer were also more likely to have physiologic derangement identified on laboratory testing, high comorbidity burden, and arrive on the ward between 11 PM and 7 AM. Given the strong correlation between comorbidity burden and physiologic derangement and mortality,14 it is not surprising that the COPS and LAPS were independent predictors of unplanned transfer. It is unclear, however, why arriving on the ward on the overnight shift is associated with higher risk. One possibility is that patients who arrive on the wards during 11 PM to 7 AM are also likely to have been in the ED during evening peak hours most associated with ED crowding.22 High levels of ED crowding have been associated with delays in care, worse quality care, lapses in patient safety, and even increased in‐hospital mortality.22, 23 Other possible reasons include decreased in‐hospital staffing and longer delays in critical diagnostic tests and interventions.2428
Admission to TCUs was associated with decreased risk of unplanned ICU transfer in the first 24 hours of hospitalization. This may be due to the continuous monitoring, decreased nursing‐to‐patient ratios, or the availability to provide some critical care interventions. In our study, age 85 was associated with lower likelihood of unplanned transfer. Unfortunately, we did not have access to data on advanced directives or patient preferences. Data on advanced directives would help to distinguish whether this phenomenon was related to end‐of‐life care goals versus other explanations.
Our study confirms some risk factors identified in previous studies. These include specific diagnoses such as pneumonia and COPD,12, 13, 29 heavy comorbidity burden,12, 13, 29 abnormal labs,29 and male sex.13 Pneumonia has consistently been shown to be a risk factor for unplanned ICU transfer. This may stem from the dynamic nature of this condition and its ability to rapidly progress, and the fact that some ICUs may not accept pneumonia patients unless they demonstrate a need for mechanical ventilation.30 Recently, a prediction rule has been developed to determine which patients with pneumonia are likely to have an unplanned ICU transfer.30 It is possible that with validation and application of this rule, unplanned transfer rates for pneumonia could be reduced. It is unclear whether males have unmeasured factors associated with increased risk of unplanned transfer or whether a true gender disparity exists.
Our findings should be interpreted within the context of this study's limitations. First, this study was not designed to distinguish the underlying cause of the unplanned transfer such as under‐recognition of illness severity in the ED, evolving clinical disease after leaving the ED, or delays in critical interventions on the ward. These are a focus of our ongoing research efforts. Second, while previous studies have demonstrated that our automated risk adjustment variables can accurately predict in‐hospital mortality (0.88 area under curve in external populations),17 additional data on vital signs and mental status could further improve risk adjustment. However, using automated data allowed us to study risk factors for unplanned transfer in a multi‐hospital cohort with a much larger population than has been previously studied. Serial data on vital signs and mental status both in the ED and during hospitalization could also be helpful in determining which unplanned transfers could be prevented with earlier recognition and intervention. Finally, all patient care occurred within an integrated healthcare delivery system. Thus, differences in case‐mix, hospital resources, ICU structure, and geographic location should be considered when applying our results to other healthcare systems.
This study raises several new areas for future research. With access to richer data becoming available in electronic medical records, prediction rules should be developed to enable better triage to appropriate levels of care for ED admissions. Future research should also analyze the comparative effectiveness of intermediate monitored units versus non‐monitored wards for preventing clinical deterioration by admitting diagnosis. Diagnoses that have been shown to have an increased risk of death after unplanned ICU transfer, such as pneumonia/respiratory infection and COPD,1 should be prioritized in this research. Better understanding is needed on the diagnosis‐specific differences and the differences in ED triage process and ICU structure that may explain why high‐volume hospitals have significantly lower rates of early unplanned ICU transfers compared with low‐volume hospitals. In particular, determining the effect of TCU and ICU capacities and census at the time of admission, and comparing patient risk characteristics across hospital‐volume strata would be very useful. Finally, more work is needed to determine whether the higher rate of unplanned transfers during overnight nursing shifts is related to decreased resource availability, preceding ED crowding, or other organizational causes.
In conclusion, patients admitted with respiratory conditions, sepsis, MI, high comorbidity, and abnormal labs are at modestly increased risk of unplanned ICU transfer within 24 hours of admission from the ED. Patients admitted with respiratory conditions (pneumonia/respiratory infections and COPD) accounted for half of the admitting diagnoses that are at increased risk for unplanned ICU transfer. These patients may benefit from better inpatient triage from the ED, earlier intervention, or closer monitoring. More research is needed to determine the specific aspects of care associated with admission to intermediate care units and high‐volume hospitals that reduce the risk of unplanned ICU transfer.
Acknowledgements
The authors thank John D. Greene, Juan Carlos La Guardia, and Benjamin Turk for their assistance with formatting of the dataset; Dr Alan S. Go, Acting Director of the Division of Research, for reviewing the manuscript; and Alina Schnake‐Mahl for formatting the manuscript.
- , , , et al. Adverse outcomes associated with delayed intensive care unit transfers in an integrated healthcare system. J Hosp Med. 2011;7(3):224–230.
- , , , et al. Inpatient transfers to the intensive care unit. J Gen Intern Med. 2003;18(2):77–83.
- , , , et al. Intra‐hospital transfers to a higher level of care: contribution to total hospital and intensive care unit (ICU) mortality and length of stay (LOS). J Hosp Med. 2011;6:74–80.
- , , , et al. Hospital‐wide code rates and mortality before and after implementation of a rapid response team. JAMA. 2008;300(21):2506–2513.
- , , , et al. Effect of a rapid response team on hospital‐wide mortality and code rates outside the ICU in a children's hospital. JAMA. 2007;298(19):2267–2274.
- , , , et al. Introduction of the medical emergency team (MET) system: a cluster‐randomised controlled trial. Lancet. 2005;365(9477):2091–2097.
- , , , et al. Rapid response systems: A systematic review. Crit Care Med. 2007;35(5):1238–1243.
- , , , et al. Effects of rapid response systems on clinical outcomes: systematic review and meta‐analysis. J Hosp Med. 2007;2(6):422–432.
- , , , et al. Rapid response teams: a systematic review and meta‐analysis. Arch Intern Med. 2010;170(1):18–26.
- , , , et al. Outreach and early warning systems (EWS) for the prevention of intensive care admission and death of critically ill adult patients on general hospital wards. Cochrane Database Syst Rev. 2007;3:CD005529.
- , , , et al. Unplanned transfers to a medical intensive care unit: Causes and relationship to preventable errors in care. J Hosp Med. 2011;6:68–72.
- , , , et al. Using administrative data to develop a nomogram for individualising risk of unplanned admission to intensive care. Resuscitation. 2008;79(2):241–248.
- , , , et al. Unplanned admission to intensive care after emergency hospitalisation: risk factors and development of a nomogram for individualising risk. Resuscitation. 2009;80(2):224–230.
- , , , et al. Risk‐adjusting hospital inpatient mortality using automated inpatient, outpatient, and laboratory databases. Med Care. 2008;46(3):232–239.
- . Linking automated databases for research in managed care settings. Ann Intern Med. 1997;127(8 pt 2):719–724.
- , , , et al. Risk adjusting community‐acquired pneumonia hospital outcomes using automated databases. Am J Manag Care. 2008;14(3):158–166.
- , , , et al. The Kaiser Permanente inpatient risk adjustment methodology was valid in an external patient population. J Clin Epidemiol. 2011;63(7):798–803.
- , , . Maximum likelihood estimation of limited and discrete dependent variable models with nested random effects. J Econometrics. 2005;128(2):301–323.
- . The relation between volume and outcome in health care. N Engl J Med. 1999;340(21):1677–1679.
- , , . Is volume related to outcome in health care? A systematic review and methodologic critique of the literature. Ann Intern Med. 2002;137(6):511–520.
- , , . Working with capacity limitations: operations management in critical care. Crit Care. 2011;15(4):308.
- , . Systematic review of emergency department crowding: causes, effects, and solutions. Ann Intern Med. 2008;52(2):126–136.
- , , , et al. The effect of emergency department crowding on clinically oriented outcomes. Acad Emerg Med. 2009;16(1):1–10.
- , , , et al. Association between time of admission to the ICU and mortality. Chest. 2010;138(1):68–75.
- , , , et al. Off‐hour admission and in‐hospital stroke case fatality in the get with the guidelines‐stroke program. Stroke. 2009;40(2):569–576.
- , , , et al. Relationship between time of day, day of week, timeliness of reperfusion, and in‐hospital mortality for patients with acute ST‐segment elevation myocardial infarction. JAMA. 2005;294(7):803–812.
- , , , et al. Hospital mortality among adults admitted to and discharged from intensive care on weekends and evenings. J Crit Care. 2008;23(3):317–324.
- , , , et al. Association between ICU admission during morning rounds and mortality. Chest. 2009;136(6):1489–1495.
- , , , et al. Identifying infected emergency department patients admitted to the hospital ward at risk of clinical deterioration and intensive care unit transfer. Acad Emerg Med. 2010;17(10):1080–1085.
- , , , et al. Risk stratification of early admission to the intensive care unit of patients with no major criteria of severe community‐acquired pneumonia: development of an international prediction rule. Crit Care. 2009;13(2):R54.
Emergency Department (ED) patients who are hospitalized and require unplanned transfer to the intensive care unit (ICU) within 24 hours of arrival on the ward have higher mortality than direct ICU admissions.1, 2 Previous research found that 5% of ED admissions experienced unplanned ICU transfer during their hospitalization, yet these patients account for 25% of in‐hospital deaths and have a longer length of stay than direct ICU admissions.1, 3 For these reasons, inpatient rapid‐response teams and early warning systems have been studied to reduce the mortality of patients who rapidly deteriorate on the hospital ward.410 However, there is little conclusive evidence that these interventions decrease mortality.710 It is possible that with better recognition and intervention in the ED, a portion of these unplanned ICU transfers and their subsequent adverse outcomes could be prevented.11
Previous research on risk factors for unplanned ICU transfers among ED admissions is limited. While 2 previous studies from non‐US hospitals used administrative data to identify some general populations at risk for unplanned ICU transfer,12, 13 these studies did not differentiate between transfers shortly after admission and those that occurred during a prolonged hospital staya critical distinction since the outcomes between these groups differs substantially.1 Another limitation of these studies is the absence of physiologic measures at ED presentation, which have been shown to be highly predictive of mortality.14
In this study, we describe risk factors for unplanned transfer to the ICU within 24 hours of arrival on the ward, among a large cohort of ED hospitalizations across 13 community hospitals. Focusing on admitting diagnoses most at risk, our goal was to inform efforts to improve the triage of ED admissions and determine which patients may benefit from additional interventions, such as improved resuscitation, closer monitoring, or risk stratification tools. We also hypothesized that higher volume hospitals would have lower rates of unplanned ICU transfers, as these hospitals are more likely have more patient care resources on the hospital ward and a higher threshold to transfer to the ICU.
METHODS
Setting and Patients
The setting for this study was Kaiser Permanente Northern California (KPNC), a large integrated healthcare delivery system serving approximately 3.3 million members.1, 3, 15, 16 We extracted data on all adult ED admissions (18 years old) to the hospital between 2007 and 2009. We excluded patients who went directly to the operating room or the ICU, as well as gynecological/pregnancy‐related admissions, as these patients have substantially different mortality risks.14 ED admissions to hospital wards could either go to medicalsurgical units or transitional care units (TCU), an intermediate level of care between the medicalsurgical units and the ICU. We chose to focus on hospitals with similar inpatient structures. Thus, 8 hospitals without TCUs were excluded, leaving 13 hospitals for analysis. The KPNC Institutional Review Board approved this study.
Main Outcome Measure
The main outcome measure was unplanned transfer to the ICU within 24 hours of arrival to the hospital ward, based upon bed history data. As in previous research, we make the assumptionwhich is supported by the high observed‐to‐expected mortality ratios found in these patientsthat these transfers to the ICU were due to clinical deterioration, and thus were unplanned, rather than a planned transfer to the ICU as is more common after an elective surgical procedure.13 The comparison population was patients admitted from the ED to the ward who never experienced a transfer to the ICU.
Patient and Hospital Characteristics
We extracted patient data on age, sex, admitting diagnosis, chronic illness burden, acute physiologic derangement in the ED, and hospital unit length of stay. Chronic illness was measured using the Comorbidity Point Score (COPS), and physiologic derangement was measured using the Laboratory Acute Physiology Score (LAPS) calculated from labs collected in the ED.1, 14, 17 The derivation of these variables from the electronic medical record has been previously described.14 The COPS was derived from International Classification of Diseases, Ninth Revision (ICD‐9) codes for all Kaiser Permanente Medical Care Program (KPMCP) inpatient and outpatient encounters prior to hospitalization. The LAPS is based on 14 possible lab tests that could be drawn in the ED or in the 72 hours prior to hospitalization. The admitting diagnosis is the ICD‐9 code assigned for the primary diagnosis determined by the admitting physician at the time when hospital admission orders are entered. We further collapsed a previously used categorization of 44 primary condition diagnoses, based on admission ICD‐9 codes,14 into 25 broad diagnostic categories based on pathophysiologic plausibility and mortality rates. We tabulated inpatient admissions originating in the ED to derive a hospital volume measure.
Statistical Analyses
We compared patient characteristics, hospital volume, and outcomes by whether or not an unplanned ICU transfer occurred. Unadjusted analyses were performed with analysis of variance (ANOVA) and chi‐square tests. We calculated crude rates of unplanned ICU transfer per 1,000 ED inpatient admissions by patient characteristics and by hospital, stratified by hospital volume.
We used a hierarchical multivariate logistic regression model to estimate adjusted odds ratios for unplanned ICU transfer as a function of both patient‐level variables (age, sex, COPS, LAPS, time of admission, admission to TCU vs ward, admitting diagnosis) and hospital‐level variables (volume) in the model. We planned to choose the reference group for admitting diagnosis as the one with an unadjusted odds ratio closest to the null (1.00). This model addresses correlations between patients with multiple hospitalizations and clustering by hospital, by fitting random intercepts for these clusters. All analyses were performed in Stata 12 (StataCorp, College Station, TX), and statistics are presented with 95% confidence intervals (CI). The Stata program gllamm (Generalized Linear Latent and Mixed Models) was used for hierarchical modeling.18
RESULTS
Of 178,315 ED non‐ICU hospitalizations meeting inclusion criteria, 4,252 (2.4%) were admitted to the ward and were transferred to the ICU within 24 hours of leaving the ED. There were 122,251 unique patients in our study population. Table 1 compares the characteristics of ED hospitalizations in which an unplanned transfer occurred to those that did not experience an unplanned transfer. Unplanned transfers were more likely to have a higher comorbidity burden, more deranged physiology, and more likely to arrive on the floor during the overnight shift.
| Characteristics | Unplanned Transfer to ICU Within 24 h of Leaving ED? | P Value* | |
|---|---|---|---|
| Yes | No | ||
| N = 4,252 (2.4%) | N = 174,063 (97.6%) | ||
| |||
| Age, median (IQR) | 69 (5680) | 70 (5681) | <0.01 |
| Male, % | 51.3 | 45.9 | <0.01 |
| Comorbidity Points Score (COPS), median (IQR) | 100 (46158) | 89 (42144) | <0.01 |
| Laboratory Acute Physiology Score (LAPS), median (IQR) | 26 (1342) | 18 (633) | <0.01 |
| Nursing shift on arrival to floor, % | |||
| Day: 7 am3 pm (Reference) | 20.1 | 20.1 | NS |
| Evening: 3 pm11 pm | 47.6 | 50.2 | NS |
| Overnight: 11 pm7 am | 32.3 | 29.7 | <0.01 |
| Weekend admission, % | 33.7 | 32.7 | NS |
| Admitted to monitored bed, % | 24.1 | 24.9 | NS |
| Emergency department annual volume, mean (SD) | 48,755 (15,379) | 50,570 (15,276) | <0.01 |
| Non‐ICU annual admission volume, mean (SD) | 5,562 (1,626) | 5,774 (1,568) | <0.01 |
| Admitting diagnosis, listed by descending frequency, % | NS | ||
| Pneumonia and respiratory infections | 16.3 | 11.8 | <0.01 |
| Gastrointestinal bleeding | 12.8 | 13.6 | NS |
| Chest pain | 7.3 | 10.0 | <0.01 |
| Miscellaneous conditions | 5.6 | 6.2 | NS |
| All other acute infections | 4.7 | 6.0 | <0.01 |
| Seizures | 4.1 | 5.9 | <0.01 |
| AMI | 3.9 | 3.3 | <0.05 |
| COPD | 3.8 | 3.0 | <0.01 |
| CHF | 3.5 | 3.7 | NS |
| Arrhythmias and pulmonary embolism | 3.5 | 3.3 | NS |
| Stroke | 3.4 | 3.5 | NS |
| Diabetic emergencies | 3.3 | 2.6 | <0.01 |
| Metabolic, endocrine, electrolytes | 3.0 | 2.9 | NS |
| Sepsis | 3.0 | 1.2 | <0.01 |
| Other neurology and toxicology | 3.0 | 2.9 | NS |
| Urinary tract infections | 2.9 | 3.2 | NS |
| Catastrophic conditions | 2.6 | 1.2 | <0.01 |
| Rheumatology | 2.5 | 3.5 | <0.01 |
| Hematology and oncology | 2.4 | 2.4 | NS |
| Acute renal failure | 1.9 | 1.1 | <0.01 |
| Pancreatic and liver | 1.7 | 2.0 | NS |
| Trauma, fractures, and dislocations | 1.6 | 1.8 | NS |
| Bowel obstructions and diseases | 1.6 | 2.9 | <0.01 |
| Other cardiac conditions | 1.5 | 1.3 | NS |
| Other renal conditions | 0.6 | 1.0 | <0.01 |
| Inpatient length of stay, median days (IQR) | 4.7 (2.78.6) | 2.6 (1.54.4) | <0.01 |
| Died during hospitalization, % | 12.7 | 2.4 | <0.01 |
Unplanned ICU transfers were more frequent in lower volume hospitals (Table 1). Figure 1 displays the inverse relationship between hospital annual ED inpatient admission volume and unplanned ICU transfers rates. The lowest volume hospital had a crude rate twice as high as the 2 highest volume hospitals (39 vs 20, per 1,000 admissions).
Pneumonia/respiratory infection was the most frequent admitting condition associated with unplanned transfer (16.3%) (Table 1). There was also wide variation in crude rates for unplanned ICU transfer by admitting condition (Figure 2). Patients admitted with sepsis had the highest rate (59 per 1,000 admissions), while patients admitted with renal conditions other than acute renal failure had the lowest rates (14.3 per 1,000 admissions).
We confirmed that almost all diagnoses found to account for a disproportionately high share of unplanned ICU transfers in Table 1 were indeed independently associated with this phenomenon after adjustment for patient and hospital differences (Figure 2). Pneumonia remained the most frequent condition associated with unplanned ICU transfer (odds ratio [OR] 1.50; 95% CI 1.201.86). Although less frequent, sepsis had the strongest association of any condition with unplanned transfer (OR 2.51; 95% CI 1.903.31). However, metabolic, endocrine, and electrolyte conditions were no longer associated with unplanned transfer after adjustment, while arrhythmias and pulmonary embolism were. Other conditions confirmed to be associated with increased risk of unplanned transfer included: myocardial infarction (MI), chronic obstructive pulmonary disease (COPD), stroke, diabetic emergencies, catastrophic conditions (includes aortic catastrophes, all forms of shock except septic shock, and intracranial hemorrhage), and acute renal failure. After taking into account the frequency of admitting diagnoses, respiratory conditions (COPD, pneumonia/acute respiratory infection) comprised nearly half (47%) of all conditions associated with increased risk of unplanned ICU transfer.
Other factors confirmed to be independently associated with unplanned ICU transfer included: male sex (OR 1.20; 95% CI 1.131.28), high comorbidity burden as measured by COPS >145 (OR 1.13; 95% CI 1.031.24), increasingly abnormal physiology compared to a LAPS <7, and arrival on ward during the overnight shift (OR 1.10; 95% CI 1.011.21). After adjustment, we did find that admission to the TCU rather than a medicalsurgical unit was associated with decreased risk of unplanned ICU transfer (OR 0.83; 95% CI 0.770.90). Age 85 was associated with decreased risk of unplanned ICU transfer relative to the youngest age group of 1834‐year‐old patients (OR 0.64; 95% CI 0.530.77).
ED admissions to higher volume hospitals were 6% less likely to experience an unplanned transfer for each additional 1,000 annual ED hospitalizations over a lower volume hospital (OR 0.94; 95% CI 0.910.98). In other words, a patient admitted to a hospital with 8,000 annual ED hospitalizations had 30% decreased odds of unplanned ICU transfer compared to a hospital with only 3,000 annual ED hospitalizations.
DISCUSSION
Patients admitted with respiratory conditions accounted for half of all admitting diagnoses associated with increased risk of unplanned transfer to the ICU within 24 hours of arrival to the ward. We found that 1 in 30 ED ward admissions for pneumonia, and 1 in 33 for COPD, were transferred to the ICU within 24 hours. These findings indicate that there is some room for improvement in early care of respiratory conditions, given the average unplanned transfer rate of 1 in 42, and previous research showing that patients with pneumonia and patients with COPD, who experience unplanned ICU transfer, have substantially worse mortality than those directly admitted to the ICU.1
Although less frequent than hospitalizations for respiratory conditions, patients admitted with sepsis were at the highest risk of unplanned ICU transfer (1 in 17 ED non‐ICU hospitalizations). We also found that MI and stroke ward admissions had a higher risk of unplanned ICU transfer. However, we previously found that unplanned ICU transfers for sepsis, MI, and stroke did not have worse mortality than direct ICU admits for these conditions.1 Therefore, quality improvement efforts to reduce excess mortality related to early decompensation in the hospital and unplanned ICU transfer would be most effective if targeted towards respiratory conditions such as pneumonia and COPD.
This is the only in‐depth study, to our knowledge, to explore the association between a set of mutually exclusive diagnostic categories and risk of unplanned ICU transfer within 24 hours, and it is the first study to identify risk factors for unplanned ICU transfer in a multi‐hospital cohort adjusted for patient‐ and hospital‐level characteristics. We also identified a novel hospital volumeoutcome relationship: Unplanned ICU transfers are up to twice as likely to occur in the smallest volume hospitals compared with highest volume hospitals. Hospital volume has long been proposed as a proxy for hospital resources; there are several studies showing a relationship between low‐volume hospitals and worse outcomes for a number of conditions.19, 20 Possible mechanisms may include decreased ICU capacity, decreased on‐call intensivists in the hospital after hours, and less experience with certain critical care conditions seen more frequently in high‐volume hospitals.21
Patients at risk of unplanned ICU transfer were also more likely to have physiologic derangement identified on laboratory testing, high comorbidity burden, and arrive on the ward between 11 PM and 7 AM. Given the strong correlation between comorbidity burden and physiologic derangement and mortality,14 it is not surprising that the COPS and LAPS were independent predictors of unplanned transfer. It is unclear, however, why arriving on the ward on the overnight shift is associated with higher risk. One possibility is that patients who arrive on the wards during 11 PM to 7 AM are also likely to have been in the ED during evening peak hours most associated with ED crowding.22 High levels of ED crowding have been associated with delays in care, worse quality care, lapses in patient safety, and even increased in‐hospital mortality.22, 23 Other possible reasons include decreased in‐hospital staffing and longer delays in critical diagnostic tests and interventions.2428
Admission to TCUs was associated with decreased risk of unplanned ICU transfer in the first 24 hours of hospitalization. This may be due to the continuous monitoring, decreased nursing‐to‐patient ratios, or the availability to provide some critical care interventions. In our study, age 85 was associated with lower likelihood of unplanned transfer. Unfortunately, we did not have access to data on advanced directives or patient preferences. Data on advanced directives would help to distinguish whether this phenomenon was related to end‐of‐life care goals versus other explanations.
Our study confirms some risk factors identified in previous studies. These include specific diagnoses such as pneumonia and COPD,12, 13, 29 heavy comorbidity burden,12, 13, 29 abnormal labs,29 and male sex.13 Pneumonia has consistently been shown to be a risk factor for unplanned ICU transfer. This may stem from the dynamic nature of this condition and its ability to rapidly progress, and the fact that some ICUs may not accept pneumonia patients unless they demonstrate a need for mechanical ventilation.30 Recently, a prediction rule has been developed to determine which patients with pneumonia are likely to have an unplanned ICU transfer.30 It is possible that with validation and application of this rule, unplanned transfer rates for pneumonia could be reduced. It is unclear whether males have unmeasured factors associated with increased risk of unplanned transfer or whether a true gender disparity exists.
Our findings should be interpreted within the context of this study's limitations. First, this study was not designed to distinguish the underlying cause of the unplanned transfer such as under‐recognition of illness severity in the ED, evolving clinical disease after leaving the ED, or delays in critical interventions on the ward. These are a focus of our ongoing research efforts. Second, while previous studies have demonstrated that our automated risk adjustment variables can accurately predict in‐hospital mortality (0.88 area under curve in external populations),17 additional data on vital signs and mental status could further improve risk adjustment. However, using automated data allowed us to study risk factors for unplanned transfer in a multi‐hospital cohort with a much larger population than has been previously studied. Serial data on vital signs and mental status both in the ED and during hospitalization could also be helpful in determining which unplanned transfers could be prevented with earlier recognition and intervention. Finally, all patient care occurred within an integrated healthcare delivery system. Thus, differences in case‐mix, hospital resources, ICU structure, and geographic location should be considered when applying our results to other healthcare systems.
This study raises several new areas for future research. With access to richer data becoming available in electronic medical records, prediction rules should be developed to enable better triage to appropriate levels of care for ED admissions. Future research should also analyze the comparative effectiveness of intermediate monitored units versus non‐monitored wards for preventing clinical deterioration by admitting diagnosis. Diagnoses that have been shown to have an increased risk of death after unplanned ICU transfer, such as pneumonia/respiratory infection and COPD,1 should be prioritized in this research. Better understanding is needed on the diagnosis‐specific differences and the differences in ED triage process and ICU structure that may explain why high‐volume hospitals have significantly lower rates of early unplanned ICU transfers compared with low‐volume hospitals. In particular, determining the effect of TCU and ICU capacities and census at the time of admission, and comparing patient risk characteristics across hospital‐volume strata would be very useful. Finally, more work is needed to determine whether the higher rate of unplanned transfers during overnight nursing shifts is related to decreased resource availability, preceding ED crowding, or other organizational causes.
In conclusion, patients admitted with respiratory conditions, sepsis, MI, high comorbidity, and abnormal labs are at modestly increased risk of unplanned ICU transfer within 24 hours of admission from the ED. Patients admitted with respiratory conditions (pneumonia/respiratory infections and COPD) accounted for half of the admitting diagnoses that are at increased risk for unplanned ICU transfer. These patients may benefit from better inpatient triage from the ED, earlier intervention, or closer monitoring. More research is needed to determine the specific aspects of care associated with admission to intermediate care units and high‐volume hospitals that reduce the risk of unplanned ICU transfer.
Acknowledgements
The authors thank John D. Greene, Juan Carlos La Guardia, and Benjamin Turk for their assistance with formatting of the dataset; Dr Alan S. Go, Acting Director of the Division of Research, for reviewing the manuscript; and Alina Schnake‐Mahl for formatting the manuscript.
Emergency Department (ED) patients who are hospitalized and require unplanned transfer to the intensive care unit (ICU) within 24 hours of arrival on the ward have higher mortality than direct ICU admissions.1, 2 Previous research found that 5% of ED admissions experienced unplanned ICU transfer during their hospitalization, yet these patients account for 25% of in‐hospital deaths and have a longer length of stay than direct ICU admissions.1, 3 For these reasons, inpatient rapid‐response teams and early warning systems have been studied to reduce the mortality of patients who rapidly deteriorate on the hospital ward.410 However, there is little conclusive evidence that these interventions decrease mortality.710 It is possible that with better recognition and intervention in the ED, a portion of these unplanned ICU transfers and their subsequent adverse outcomes could be prevented.11
Previous research on risk factors for unplanned ICU transfers among ED admissions is limited. While 2 previous studies from non‐US hospitals used administrative data to identify some general populations at risk for unplanned ICU transfer,12, 13 these studies did not differentiate between transfers shortly after admission and those that occurred during a prolonged hospital staya critical distinction since the outcomes between these groups differs substantially.1 Another limitation of these studies is the absence of physiologic measures at ED presentation, which have been shown to be highly predictive of mortality.14
In this study, we describe risk factors for unplanned transfer to the ICU within 24 hours of arrival on the ward, among a large cohort of ED hospitalizations across 13 community hospitals. Focusing on admitting diagnoses most at risk, our goal was to inform efforts to improve the triage of ED admissions and determine which patients may benefit from additional interventions, such as improved resuscitation, closer monitoring, or risk stratification tools. We also hypothesized that higher volume hospitals would have lower rates of unplanned ICU transfers, as these hospitals are more likely have more patient care resources on the hospital ward and a higher threshold to transfer to the ICU.
METHODS
Setting and Patients
The setting for this study was Kaiser Permanente Northern California (KPNC), a large integrated healthcare delivery system serving approximately 3.3 million members.1, 3, 15, 16 We extracted data on all adult ED admissions (18 years old) to the hospital between 2007 and 2009. We excluded patients who went directly to the operating room or the ICU, as well as gynecological/pregnancy‐related admissions, as these patients have substantially different mortality risks.14 ED admissions to hospital wards could either go to medicalsurgical units or transitional care units (TCU), an intermediate level of care between the medicalsurgical units and the ICU. We chose to focus on hospitals with similar inpatient structures. Thus, 8 hospitals without TCUs were excluded, leaving 13 hospitals for analysis. The KPNC Institutional Review Board approved this study.
Main Outcome Measure
The main outcome measure was unplanned transfer to the ICU within 24 hours of arrival to the hospital ward, based upon bed history data. As in previous research, we make the assumptionwhich is supported by the high observed‐to‐expected mortality ratios found in these patientsthat these transfers to the ICU were due to clinical deterioration, and thus were unplanned, rather than a planned transfer to the ICU as is more common after an elective surgical procedure.13 The comparison population was patients admitted from the ED to the ward who never experienced a transfer to the ICU.
Patient and Hospital Characteristics
We extracted patient data on age, sex, admitting diagnosis, chronic illness burden, acute physiologic derangement in the ED, and hospital unit length of stay. Chronic illness was measured using the Comorbidity Point Score (COPS), and physiologic derangement was measured using the Laboratory Acute Physiology Score (LAPS) calculated from labs collected in the ED.1, 14, 17 The derivation of these variables from the electronic medical record has been previously described.14 The COPS was derived from International Classification of Diseases, Ninth Revision (ICD‐9) codes for all Kaiser Permanente Medical Care Program (KPMCP) inpatient and outpatient encounters prior to hospitalization. The LAPS is based on 14 possible lab tests that could be drawn in the ED or in the 72 hours prior to hospitalization. The admitting diagnosis is the ICD‐9 code assigned for the primary diagnosis determined by the admitting physician at the time when hospital admission orders are entered. We further collapsed a previously used categorization of 44 primary condition diagnoses, based on admission ICD‐9 codes,14 into 25 broad diagnostic categories based on pathophysiologic plausibility and mortality rates. We tabulated inpatient admissions originating in the ED to derive a hospital volume measure.
Statistical Analyses
We compared patient characteristics, hospital volume, and outcomes by whether or not an unplanned ICU transfer occurred. Unadjusted analyses were performed with analysis of variance (ANOVA) and chi‐square tests. We calculated crude rates of unplanned ICU transfer per 1,000 ED inpatient admissions by patient characteristics and by hospital, stratified by hospital volume.
We used a hierarchical multivariate logistic regression model to estimate adjusted odds ratios for unplanned ICU transfer as a function of both patient‐level variables (age, sex, COPS, LAPS, time of admission, admission to TCU vs ward, admitting diagnosis) and hospital‐level variables (volume) in the model. We planned to choose the reference group for admitting diagnosis as the one with an unadjusted odds ratio closest to the null (1.00). This model addresses correlations between patients with multiple hospitalizations and clustering by hospital, by fitting random intercepts for these clusters. All analyses were performed in Stata 12 (StataCorp, College Station, TX), and statistics are presented with 95% confidence intervals (CI). The Stata program gllamm (Generalized Linear Latent and Mixed Models) was used for hierarchical modeling.18
RESULTS
Of 178,315 ED non‐ICU hospitalizations meeting inclusion criteria, 4,252 (2.4%) were admitted to the ward and were transferred to the ICU within 24 hours of leaving the ED. There were 122,251 unique patients in our study population. Table 1 compares the characteristics of ED hospitalizations in which an unplanned transfer occurred to those that did not experience an unplanned transfer. Unplanned transfers were more likely to have a higher comorbidity burden, more deranged physiology, and more likely to arrive on the floor during the overnight shift.
| Characteristics | Unplanned Transfer to ICU Within 24 h of Leaving ED? | P Value* | |
|---|---|---|---|
| Yes | No | ||
| N = 4,252 (2.4%) | N = 174,063 (97.6%) | ||
| |||
| Age, median (IQR) | 69 (5680) | 70 (5681) | <0.01 |
| Male, % | 51.3 | 45.9 | <0.01 |
| Comorbidity Points Score (COPS), median (IQR) | 100 (46158) | 89 (42144) | <0.01 |
| Laboratory Acute Physiology Score (LAPS), median (IQR) | 26 (1342) | 18 (633) | <0.01 |
| Nursing shift on arrival to floor, % | |||
| Day: 7 am3 pm (Reference) | 20.1 | 20.1 | NS |
| Evening: 3 pm11 pm | 47.6 | 50.2 | NS |
| Overnight: 11 pm7 am | 32.3 | 29.7 | <0.01 |
| Weekend admission, % | 33.7 | 32.7 | NS |
| Admitted to monitored bed, % | 24.1 | 24.9 | NS |
| Emergency department annual volume, mean (SD) | 48,755 (15,379) | 50,570 (15,276) | <0.01 |
| Non‐ICU annual admission volume, mean (SD) | 5,562 (1,626) | 5,774 (1,568) | <0.01 |
| Admitting diagnosis, listed by descending frequency, % | NS | ||
| Pneumonia and respiratory infections | 16.3 | 11.8 | <0.01 |
| Gastrointestinal bleeding | 12.8 | 13.6 | NS |
| Chest pain | 7.3 | 10.0 | <0.01 |
| Miscellaneous conditions | 5.6 | 6.2 | NS |
| All other acute infections | 4.7 | 6.0 | <0.01 |
| Seizures | 4.1 | 5.9 | <0.01 |
| AMI | 3.9 | 3.3 | <0.05 |
| COPD | 3.8 | 3.0 | <0.01 |
| CHF | 3.5 | 3.7 | NS |
| Arrhythmias and pulmonary embolism | 3.5 | 3.3 | NS |
| Stroke | 3.4 | 3.5 | NS |
| Diabetic emergencies | 3.3 | 2.6 | <0.01 |
| Metabolic, endocrine, electrolytes | 3.0 | 2.9 | NS |
| Sepsis | 3.0 | 1.2 | <0.01 |
| Other neurology and toxicology | 3.0 | 2.9 | NS |
| Urinary tract infections | 2.9 | 3.2 | NS |
| Catastrophic conditions | 2.6 | 1.2 | <0.01 |
| Rheumatology | 2.5 | 3.5 | <0.01 |
| Hematology and oncology | 2.4 | 2.4 | NS |
| Acute renal failure | 1.9 | 1.1 | <0.01 |
| Pancreatic and liver | 1.7 | 2.0 | NS |
| Trauma, fractures, and dislocations | 1.6 | 1.8 | NS |
| Bowel obstructions and diseases | 1.6 | 2.9 | <0.01 |
| Other cardiac conditions | 1.5 | 1.3 | NS |
| Other renal conditions | 0.6 | 1.0 | <0.01 |
| Inpatient length of stay, median days (IQR) | 4.7 (2.78.6) | 2.6 (1.54.4) | <0.01 |
| Died during hospitalization, % | 12.7 | 2.4 | <0.01 |
Unplanned ICU transfers were more frequent in lower volume hospitals (Table 1). Figure 1 displays the inverse relationship between hospital annual ED inpatient admission volume and unplanned ICU transfers rates. The lowest volume hospital had a crude rate twice as high as the 2 highest volume hospitals (39 vs 20, per 1,000 admissions).
Pneumonia/respiratory infection was the most frequent admitting condition associated with unplanned transfer (16.3%) (Table 1). There was also wide variation in crude rates for unplanned ICU transfer by admitting condition (Figure 2). Patients admitted with sepsis had the highest rate (59 per 1,000 admissions), while patients admitted with renal conditions other than acute renal failure had the lowest rates (14.3 per 1,000 admissions).
We confirmed that almost all diagnoses found to account for a disproportionately high share of unplanned ICU transfers in Table 1 were indeed independently associated with this phenomenon after adjustment for patient and hospital differences (Figure 2). Pneumonia remained the most frequent condition associated with unplanned ICU transfer (odds ratio [OR] 1.50; 95% CI 1.201.86). Although less frequent, sepsis had the strongest association of any condition with unplanned transfer (OR 2.51; 95% CI 1.903.31). However, metabolic, endocrine, and electrolyte conditions were no longer associated with unplanned transfer after adjustment, while arrhythmias and pulmonary embolism were. Other conditions confirmed to be associated with increased risk of unplanned transfer included: myocardial infarction (MI), chronic obstructive pulmonary disease (COPD), stroke, diabetic emergencies, catastrophic conditions (includes aortic catastrophes, all forms of shock except septic shock, and intracranial hemorrhage), and acute renal failure. After taking into account the frequency of admitting diagnoses, respiratory conditions (COPD, pneumonia/acute respiratory infection) comprised nearly half (47%) of all conditions associated with increased risk of unplanned ICU transfer.
Other factors confirmed to be independently associated with unplanned ICU transfer included: male sex (OR 1.20; 95% CI 1.131.28), high comorbidity burden as measured by COPS >145 (OR 1.13; 95% CI 1.031.24), increasingly abnormal physiology compared to a LAPS <7, and arrival on ward during the overnight shift (OR 1.10; 95% CI 1.011.21). After adjustment, we did find that admission to the TCU rather than a medicalsurgical unit was associated with decreased risk of unplanned ICU transfer (OR 0.83; 95% CI 0.770.90). Age 85 was associated with decreased risk of unplanned ICU transfer relative to the youngest age group of 1834‐year‐old patients (OR 0.64; 95% CI 0.530.77).
ED admissions to higher volume hospitals were 6% less likely to experience an unplanned transfer for each additional 1,000 annual ED hospitalizations over a lower volume hospital (OR 0.94; 95% CI 0.910.98). In other words, a patient admitted to a hospital with 8,000 annual ED hospitalizations had 30% decreased odds of unplanned ICU transfer compared to a hospital with only 3,000 annual ED hospitalizations.
DISCUSSION
Patients admitted with respiratory conditions accounted for half of all admitting diagnoses associated with increased risk of unplanned transfer to the ICU within 24 hours of arrival to the ward. We found that 1 in 30 ED ward admissions for pneumonia, and 1 in 33 for COPD, were transferred to the ICU within 24 hours. These findings indicate that there is some room for improvement in early care of respiratory conditions, given the average unplanned transfer rate of 1 in 42, and previous research showing that patients with pneumonia and patients with COPD, who experience unplanned ICU transfer, have substantially worse mortality than those directly admitted to the ICU.1
Although less frequent than hospitalizations for respiratory conditions, patients admitted with sepsis were at the highest risk of unplanned ICU transfer (1 in 17 ED non‐ICU hospitalizations). We also found that MI and stroke ward admissions had a higher risk of unplanned ICU transfer. However, we previously found that unplanned ICU transfers for sepsis, MI, and stroke did not have worse mortality than direct ICU admits for these conditions.1 Therefore, quality improvement efforts to reduce excess mortality related to early decompensation in the hospital and unplanned ICU transfer would be most effective if targeted towards respiratory conditions such as pneumonia and COPD.
This is the only in‐depth study, to our knowledge, to explore the association between a set of mutually exclusive diagnostic categories and risk of unplanned ICU transfer within 24 hours, and it is the first study to identify risk factors for unplanned ICU transfer in a multi‐hospital cohort adjusted for patient‐ and hospital‐level characteristics. We also identified a novel hospital volumeoutcome relationship: Unplanned ICU transfers are up to twice as likely to occur in the smallest volume hospitals compared with highest volume hospitals. Hospital volume has long been proposed as a proxy for hospital resources; there are several studies showing a relationship between low‐volume hospitals and worse outcomes for a number of conditions.19, 20 Possible mechanisms may include decreased ICU capacity, decreased on‐call intensivists in the hospital after hours, and less experience with certain critical care conditions seen more frequently in high‐volume hospitals.21
Patients at risk of unplanned ICU transfer were also more likely to have physiologic derangement identified on laboratory testing, high comorbidity burden, and arrive on the ward between 11 PM and 7 AM. Given the strong correlation between comorbidity burden and physiologic derangement and mortality,14 it is not surprising that the COPS and LAPS were independent predictors of unplanned transfer. It is unclear, however, why arriving on the ward on the overnight shift is associated with higher risk. One possibility is that patients who arrive on the wards during 11 PM to 7 AM are also likely to have been in the ED during evening peak hours most associated with ED crowding.22 High levels of ED crowding have been associated with delays in care, worse quality care, lapses in patient safety, and even increased in‐hospital mortality.22, 23 Other possible reasons include decreased in‐hospital staffing and longer delays in critical diagnostic tests and interventions.2428
Admission to TCUs was associated with decreased risk of unplanned ICU transfer in the first 24 hours of hospitalization. This may be due to the continuous monitoring, decreased nursing‐to‐patient ratios, or the availability to provide some critical care interventions. In our study, age 85 was associated with lower likelihood of unplanned transfer. Unfortunately, we did not have access to data on advanced directives or patient preferences. Data on advanced directives would help to distinguish whether this phenomenon was related to end‐of‐life care goals versus other explanations.
Our study confirms some risk factors identified in previous studies. These include specific diagnoses such as pneumonia and COPD,12, 13, 29 heavy comorbidity burden,12, 13, 29 abnormal labs,29 and male sex.13 Pneumonia has consistently been shown to be a risk factor for unplanned ICU transfer. This may stem from the dynamic nature of this condition and its ability to rapidly progress, and the fact that some ICUs may not accept pneumonia patients unless they demonstrate a need for mechanical ventilation.30 Recently, a prediction rule has been developed to determine which patients with pneumonia are likely to have an unplanned ICU transfer.30 It is possible that with validation and application of this rule, unplanned transfer rates for pneumonia could be reduced. It is unclear whether males have unmeasured factors associated with increased risk of unplanned transfer or whether a true gender disparity exists.
Our findings should be interpreted within the context of this study's limitations. First, this study was not designed to distinguish the underlying cause of the unplanned transfer such as under‐recognition of illness severity in the ED, evolving clinical disease after leaving the ED, or delays in critical interventions on the ward. These are a focus of our ongoing research efforts. Second, while previous studies have demonstrated that our automated risk adjustment variables can accurately predict in‐hospital mortality (0.88 area under curve in external populations),17 additional data on vital signs and mental status could further improve risk adjustment. However, using automated data allowed us to study risk factors for unplanned transfer in a multi‐hospital cohort with a much larger population than has been previously studied. Serial data on vital signs and mental status both in the ED and during hospitalization could also be helpful in determining which unplanned transfers could be prevented with earlier recognition and intervention. Finally, all patient care occurred within an integrated healthcare delivery system. Thus, differences in case‐mix, hospital resources, ICU structure, and geographic location should be considered when applying our results to other healthcare systems.
This study raises several new areas for future research. With access to richer data becoming available in electronic medical records, prediction rules should be developed to enable better triage to appropriate levels of care for ED admissions. Future research should also analyze the comparative effectiveness of intermediate monitored units versus non‐monitored wards for preventing clinical deterioration by admitting diagnosis. Diagnoses that have been shown to have an increased risk of death after unplanned ICU transfer, such as pneumonia/respiratory infection and COPD,1 should be prioritized in this research. Better understanding is needed on the diagnosis‐specific differences and the differences in ED triage process and ICU structure that may explain why high‐volume hospitals have significantly lower rates of early unplanned ICU transfers compared with low‐volume hospitals. In particular, determining the effect of TCU and ICU capacities and census at the time of admission, and comparing patient risk characteristics across hospital‐volume strata would be very useful. Finally, more work is needed to determine whether the higher rate of unplanned transfers during overnight nursing shifts is related to decreased resource availability, preceding ED crowding, or other organizational causes.
In conclusion, patients admitted with respiratory conditions, sepsis, MI, high comorbidity, and abnormal labs are at modestly increased risk of unplanned ICU transfer within 24 hours of admission from the ED. Patients admitted with respiratory conditions (pneumonia/respiratory infections and COPD) accounted for half of the admitting diagnoses that are at increased risk for unplanned ICU transfer. These patients may benefit from better inpatient triage from the ED, earlier intervention, or closer monitoring. More research is needed to determine the specific aspects of care associated with admission to intermediate care units and high‐volume hospitals that reduce the risk of unplanned ICU transfer.
Acknowledgements
The authors thank John D. Greene, Juan Carlos La Guardia, and Benjamin Turk for their assistance with formatting of the dataset; Dr Alan S. Go, Acting Director of the Division of Research, for reviewing the manuscript; and Alina Schnake‐Mahl for formatting the manuscript.
- , , , et al. Adverse outcomes associated with delayed intensive care unit transfers in an integrated healthcare system. J Hosp Med. 2011;7(3):224–230.
- , , , et al. Inpatient transfers to the intensive care unit. J Gen Intern Med. 2003;18(2):77–83.
- , , , et al. Intra‐hospital transfers to a higher level of care: contribution to total hospital and intensive care unit (ICU) mortality and length of stay (LOS). J Hosp Med. 2011;6:74–80.
- , , , et al. Hospital‐wide code rates and mortality before and after implementation of a rapid response team. JAMA. 2008;300(21):2506–2513.
- , , , et al. Effect of a rapid response team on hospital‐wide mortality and code rates outside the ICU in a children's hospital. JAMA. 2007;298(19):2267–2274.
- , , , et al. Introduction of the medical emergency team (MET) system: a cluster‐randomised controlled trial. Lancet. 2005;365(9477):2091–2097.
- , , , et al. Rapid response systems: A systematic review. Crit Care Med. 2007;35(5):1238–1243.
- , , , et al. Effects of rapid response systems on clinical outcomes: systematic review and meta‐analysis. J Hosp Med. 2007;2(6):422–432.
- , , , et al. Rapid response teams: a systematic review and meta‐analysis. Arch Intern Med. 2010;170(1):18–26.
- , , , et al. Outreach and early warning systems (EWS) for the prevention of intensive care admission and death of critically ill adult patients on general hospital wards. Cochrane Database Syst Rev. 2007;3:CD005529.
- , , , et al. Unplanned transfers to a medical intensive care unit: Causes and relationship to preventable errors in care. J Hosp Med. 2011;6:68–72.
- , , , et al. Using administrative data to develop a nomogram for individualising risk of unplanned admission to intensive care. Resuscitation. 2008;79(2):241–248.
- , , , et al. Unplanned admission to intensive care after emergency hospitalisation: risk factors and development of a nomogram for individualising risk. Resuscitation. 2009;80(2):224–230.
- , , , et al. Risk‐adjusting hospital inpatient mortality using automated inpatient, outpatient, and laboratory databases. Med Care. 2008;46(3):232–239.
- . Linking automated databases for research in managed care settings. Ann Intern Med. 1997;127(8 pt 2):719–724.
- , , , et al. Risk adjusting community‐acquired pneumonia hospital outcomes using automated databases. Am J Manag Care. 2008;14(3):158–166.
- , , , et al. The Kaiser Permanente inpatient risk adjustment methodology was valid in an external patient population. J Clin Epidemiol. 2011;63(7):798–803.
- , , . Maximum likelihood estimation of limited and discrete dependent variable models with nested random effects. J Econometrics. 2005;128(2):301–323.
- . The relation between volume and outcome in health care. N Engl J Med. 1999;340(21):1677–1679.
- , , . Is volume related to outcome in health care? A systematic review and methodologic critique of the literature. Ann Intern Med. 2002;137(6):511–520.
- , , . Working with capacity limitations: operations management in critical care. Crit Care. 2011;15(4):308.
- , . Systematic review of emergency department crowding: causes, effects, and solutions. Ann Intern Med. 2008;52(2):126–136.
- , , , et al. The effect of emergency department crowding on clinically oriented outcomes. Acad Emerg Med. 2009;16(1):1–10.
- , , , et al. Association between time of admission to the ICU and mortality. Chest. 2010;138(1):68–75.
- , , , et al. Off‐hour admission and in‐hospital stroke case fatality in the get with the guidelines‐stroke program. Stroke. 2009;40(2):569–576.
- , , , et al. Relationship between time of day, day of week, timeliness of reperfusion, and in‐hospital mortality for patients with acute ST‐segment elevation myocardial infarction. JAMA. 2005;294(7):803–812.
- , , , et al. Hospital mortality among adults admitted to and discharged from intensive care on weekends and evenings. J Crit Care. 2008;23(3):317–324.
- , , , et al. Association between ICU admission during morning rounds and mortality. Chest. 2009;136(6):1489–1495.
- , , , et al. Identifying infected emergency department patients admitted to the hospital ward at risk of clinical deterioration and intensive care unit transfer. Acad Emerg Med. 2010;17(10):1080–1085.
- , , , et al. Risk stratification of early admission to the intensive care unit of patients with no major criteria of severe community‐acquired pneumonia: development of an international prediction rule. Crit Care. 2009;13(2):R54.
- , , , et al. Adverse outcomes associated with delayed intensive care unit transfers in an integrated healthcare system. J Hosp Med. 2011;7(3):224–230.
- , , , et al. Inpatient transfers to the intensive care unit. J Gen Intern Med. 2003;18(2):77–83.
- , , , et al. Intra‐hospital transfers to a higher level of care: contribution to total hospital and intensive care unit (ICU) mortality and length of stay (LOS). J Hosp Med. 2011;6:74–80.
- , , , et al. Hospital‐wide code rates and mortality before and after implementation of a rapid response team. JAMA. 2008;300(21):2506–2513.
- , , , et al. Effect of a rapid response team on hospital‐wide mortality and code rates outside the ICU in a children's hospital. JAMA. 2007;298(19):2267–2274.
- , , , et al. Introduction of the medical emergency team (MET) system: a cluster‐randomised controlled trial. Lancet. 2005;365(9477):2091–2097.
- , , , et al. Rapid response systems: A systematic review. Crit Care Med. 2007;35(5):1238–1243.
- , , , et al. Effects of rapid response systems on clinical outcomes: systematic review and meta‐analysis. J Hosp Med. 2007;2(6):422–432.
- , , , et al. Rapid response teams: a systematic review and meta‐analysis. Arch Intern Med. 2010;170(1):18–26.
- , , , et al. Outreach and early warning systems (EWS) for the prevention of intensive care admission and death of critically ill adult patients on general hospital wards. Cochrane Database Syst Rev. 2007;3:CD005529.
- , , , et al. Unplanned transfers to a medical intensive care unit: Causes and relationship to preventable errors in care. J Hosp Med. 2011;6:68–72.
- , , , et al. Using administrative data to develop a nomogram for individualising risk of unplanned admission to intensive care. Resuscitation. 2008;79(2):241–248.
- , , , et al. Unplanned admission to intensive care after emergency hospitalisation: risk factors and development of a nomogram for individualising risk. Resuscitation. 2009;80(2):224–230.
- , , , et al. Risk‐adjusting hospital inpatient mortality using automated inpatient, outpatient, and laboratory databases. Med Care. 2008;46(3):232–239.
- . Linking automated databases for research in managed care settings. Ann Intern Med. 1997;127(8 pt 2):719–724.
- , , , et al. Risk adjusting community‐acquired pneumonia hospital outcomes using automated databases. Am J Manag Care. 2008;14(3):158–166.
- , , , et al. The Kaiser Permanente inpatient risk adjustment methodology was valid in an external patient population. J Clin Epidemiol. 2011;63(7):798–803.
- , , . Maximum likelihood estimation of limited and discrete dependent variable models with nested random effects. J Econometrics. 2005;128(2):301–323.
- . The relation between volume and outcome in health care. N Engl J Med. 1999;340(21):1677–1679.
- , , . Is volume related to outcome in health care? A systematic review and methodologic critique of the literature. Ann Intern Med. 2002;137(6):511–520.
- , , . Working with capacity limitations: operations management in critical care. Crit Care. 2011;15(4):308.
- , . Systematic review of emergency department crowding: causes, effects, and solutions. Ann Intern Med. 2008;52(2):126–136.
- , , , et al. The effect of emergency department crowding on clinically oriented outcomes. Acad Emerg Med. 2009;16(1):1–10.
- , , , et al. Association between time of admission to the ICU and mortality. Chest. 2010;138(1):68–75.
- , , , et al. Off‐hour admission and in‐hospital stroke case fatality in the get with the guidelines‐stroke program. Stroke. 2009;40(2):569–576.
- , , , et al. Relationship between time of day, day of week, timeliness of reperfusion, and in‐hospital mortality for patients with acute ST‐segment elevation myocardial infarction. JAMA. 2005;294(7):803–812.
- , , , et al. Hospital mortality among adults admitted to and discharged from intensive care on weekends and evenings. J Crit Care. 2008;23(3):317–324.
- , , , et al. Association between ICU admission during morning rounds and mortality. Chest. 2009;136(6):1489–1495.
- , , , et al. Identifying infected emergency department patients admitted to the hospital ward at risk of clinical deterioration and intensive care unit transfer. Acad Emerg Med. 2010;17(10):1080–1085.
- , , , et al. Risk stratification of early admission to the intensive care unit of patients with no major criteria of severe community‐acquired pneumonia: development of an international prediction rule. Crit Care. 2009;13(2):R54.
Copyright © 2012 Society of Hospital Medicine