User login
H1N1/09—Fever and Hospital Presentation
The Centers for Disease Control and Prevention (CDC) established a case definition during the 2009 influenza season for influenza‐like illness (ILI): a temperature of 100.0F (37.8C), oral or equivalent, and cough or sore throat, in the absence of a known cause other than influenza.1 Even though this definition is currently being revised, fever is still listed as a predominant symptom for influenza on the CDC Web site.2, 3
During the spring of 2009 in New York City, 95% of patients with pandemic hemagglutinin type 1 and neuraminidase type 1 (H1N1) influenza A met the case definition for ILI,4 whereas a report from Mexico5 and another from China6 reported that about one‐third of patients presented without fever. A recent study found that the clinical features of H1N1/09 influenza and seasonal strains were similar in hospitalized patients.7 Until recently, the CDC case definition for ILI included fever as a requisite symptom. Most clinicians still consider influenza a fever‐based illness.8, 9 Some studies have reported that seeking early medical care and early treatment for influenza resulted in reduced severity and duration of illness.1013 However, individuals without fever may not have sought early care because their illnesses did not meet all the criteria for ILI.
We hypothesized that significant number of our patients hospitalized during the H1N1/09 influenza pandemic did not have fever as part of the influenza‐like illness prior to hospital presentation. We further hypothesized that this absence of fever was associated with delayed presentation to the hospital and delayed treatment. No prior studies have assessed the effect of fever on hospital presentation, diagnosis, and treatment of H1N1/09 patients. We performed a retrospective cohort analysis comparing H1N1/09 patients with fever as part of their illness prior to hospital presentation to those without fever, to assess the influence of fever on hospital presentation and on diagnosis and treatment in hospitalized patients with laboratory‐confirmed H1N1/09 infection.
METHODS
Study Design and Setting
This retrospective cohort study was conducted at a tertiary care center with 1159 beds divided between 2 general hospitals (634 and 167 beds), a large cancer center (208 beds), and an inpatient cardiac hospital (150 beds).
Selection of Participants
During the pandemic influenza season, clinicians throughout the tertiary care center were encouraged to obtain nasopharyngeal swabs to screen for influenza from all patients presenting to the hospital with respiratory illness, unexplained gastrointestinal symptoms, ILI, or any suspicion for influenza infection based on physician discretion. Patients were admitted through routine hospital admission procedures and triage. Physicians were encouraged to treat all patients in whom pandemic H1N1/09 was suspected empirically with an antiviral drug (oseltamivir). Patients with a positive H1N1/09 test were then continued on treatment. Obese patients, critically ill patients requiring intensive care unit (ICU) care, pregnant women, and patients with chronic medical conditions such as chronic respiratory disease, chronic kidney disease, diabetes mellitus, and immune‐compromising conditions were treated with a higher dose of oseltamivir (150 mg twice a day). Other patients were treated with the standard dose of oseltamivir (75 mg twice a day). The present analyses include all patients at least 18 years of age, hospitalized with laboratory‐confirmed pandemic H1N1/09 virus infection from 1 June 2009 through 31 December 2009. Subjects younger than 18 years and prisoners were excluded.
Data Collection
Laboratory‐confirmed pandemic H1N1/09 patients were identified from the hospital's infection control database. After identifying eligible patients, physician investigators accessed each electronic medical record to obtain health history, diagnosis, test results, disposition, and clinical outcome information. We captured data on gender, race, age, comorbidities, symptoms and onset of illness, hospital presentation, diagnosis, treatment, ICU admission, and death. Data abstraction was performed by an infectious disease physician using a standardized form, and all data abstraction was validated by another infectious disease physician. The research was deemed exempt from further review by the Ohio State University Institutional Review Board (2009E0979).
Subjects with laboratory‐confirmed H1N1/09 virus infection were identified if nasal swab or respiratory secretions were positive for novel influenza A (H1N1) by specific rapid antigen or culture testing. Nasal swabs that were processed for confirmatory influenza testing by polymerase chain reaction (PCR) were confirmed by panel (xTAG) or specific influenza A and B PCR (Luminex Molecular Diagnostics, Toronto, CA).14 Positive tests were confirmed using the Prodesse ProFlu‐ST, Influenza A [2009] real‐time PCR (H1N1 subtyping) assay (Focus Diagnostics, Cypress, CA).
Day of onset of illness was defined as the day when the patient started developing one or more symptoms of influenza‐like illness. Day of hospital presentation was defined as the day when the patient either presented to the emergency department or a physician's office and was subsequently admitted or was directly admitted to the hospital. Fever was defined as a temperature of 100F (37.8C) or greater at presentation, or reported subjective fever upon presentation, and reported antipyretic use (nonsteroidal anti‐inflammatory drugs or acetaminophen) prior to admission. When multiple temperature readings were present in the emergency department record, any recorded temperature of 100F or greater was considered a fever. The Charlson comorbidity index predicts the 10‐year mortality for a patient with a range of comorbid conditions such as heart disease, acquired immune deficiency syndrome (AIDS), or cancer. The Charlson comorbidity index was calculated according to previously described methods.1517 Diabetes, chronic respiratory disease (asthma, chronic obstructive pulmonary disease), and chronic kidney disease with hemodialysis were recorded as comorbidities if these diagnoses were documented in the patient notes. Immunosuppression was defined as oral steroid use or other immunosuppressive medication, organ transplantation, human immunodeficiency virus (HIV) infection, or cancer chemotherapy. Empiric antibiotic treatment was defined as treatment with antibiotics regardless of the evidence of bacterial infection. Proven bacterial coinfection was defined as infection with bacterial pathogens documented by a positive bacterial culture from any site that was obtained in response to clinical suspicion of bacterial infection.
Data Analysis
Demographic and clinical characteristics were summarized for all patients, and for those patients with or without fever, as part of their illness prior to hospital presentation. Continuous variables were summarized as mean ( standard deviation) or median values. For categorical variables, the percentage of patients in each category was calculated. For comparison between patients with fever and those with no fever, for continuous variables, the 2‐sample t test for normally distributed data or the Wilcoxon rank‐sum test for non‐normal data was used. The Pearson chi‐square test was used for categorical data. We performed a logistic regression analysis to examine the association between fever and time to presentation and ICU admission, adjusting for patient age and Charlson index. All analyses were carried out using SAS 9.2 software (SAS, Cary, NC).
RESULTS
We identified 135 hospitalized patients with laboratory‐confirmed pandemic H1N1 virus infection during the study period. A substantial number of patients (n = 56, 42%) had no fever as part of their illness prior to hospital presentation. Thirty‐one patients (23%) required treatment in an ICU during hospitalization, and 9 (7%) died. While we observed no differences between patients with fever and those without fever prior to hospital presentation in gender, race, or age (Table 1), patients without fever had higher Charlson index compared to those with fever (P = 0.01, Wilcoxon rank‐sum test). Patients without fever also had significantly longer time to presentation to the hospital since the onset of illness, compared to those with fever (median of 4 vs 2 days, P < 0.001). Patients without fever also had significantly longer time to initiation of proper treatment since the onset of illness, compared to those with fever (median of 5 vs 2 days, P = 0.001).
| Fever | No Fever | Unadjusted Odds Ratio | P Value* | ||
|---|---|---|---|---|---|
| N = 79 (59%) | N = 56 (42%) | ||||
| |||||
| Gender | Female, n (%) | 41 (52) | 34 (61) | 0.7 | 0.31 |
| Race | White, n (%) | 45 (57) | 29 (52) | 1.03 | 0.30 |
| Black, n (%) | 30 (38) | 20 (36) | |||
| Other, n (%) | 4 (5) | 7 (13) | |||
| Age | Mean SD (range) | 4315 (1889) | 48 17 (1989) | 0.060 | |
| Charlson index | Median (range) | 0 (0, 13) | 1 (0, 13) | 0.010 | |
| Comorbidities | |||||
| Obese (BMI 30) | n (%) | 37 (50) | 29 (54) | 0.82 | 0.571 |
| Chronic respiratory illness (asthma, COPD) | n (%) | 19 (24) | 13 (23) | 1.05 | 0.910 |
| Diabetes | n (%) | 14 (18) | 19 (34) | 0.419 | 0.031 |
| CKD with hemodialysis | n (%) | 12 (15) | 6 (11) | 1.49 | 0.451 |
| Immunocompromised | n (%) | 29 (38) | 13 (23) | 1.92 | 0.095 |
| Days from onset to hospital presentation | Median (range) | 2 (010) | 4 (121) | 0.0001 | |
| No. with days >2 | n (%) | 31 (39) | 40 (71) | 0.26 | <0.001 |
| Days to diagnosis from hospital presentation | Median (range) | 0 (03) | 0 (05) | 0.166 | |
| No. with days >2 | n (%) | 1 (1) | 3 (5) | 0.24 | 0.170 |
| Days to oseltamivir since admission | Median (range) | 0 (013) | 1 (014) | 0.07 | |
| Days to oseltamivir since onset of illness | Median (range) | 2 (013) | 5 (119) | 0.0003 | |
| No. with days >2 | n (%) | 35 (44) | 39 (70) | 0.24 | 0.001 |
| Need for ICU care | n (%) | 12 (15) | 19 (34) | 0.35 | 0.010 |
| Death | n (%) | 6 (8) | 3 (5) | 1.45 | 0.061 |
| Bacterial coinfection | n (%) | 5 (n = 79; 6%) | 9 (15) | 0.35 | 0.067 |
| Empiric antibiotics | 65 (n = 77; 84%) | 33 (59) | 3.24 | 0.003 | |
| Lower respiratory symptoms | n (%) | 72 (91) | 50 (91) | 1.03 | 0.963 |
| Cough | n (%) | 58 (73) | 38 (69) | 1.24 | 0.585 |
| Shortness of breath | n (%) | 34 (43) | 25 (46) | 0.91 | 0.782 |
| Respiratory failure | n (%) | 7 (9) | 7 (13) | 0.67 | 0.472 |
| Sore throat/congestion/rhinorrhea | n (%) | 21 (27) | 10 (18) | 1.63 | 0.257 |
| Gastrointestinal symptoms (nausea, vomiting, diarrhea) | n (%) | 30 (38) | 13 (24) | 1.98 | 0.080 |
Patients were rapidly diagnosed and treated after presentation to the hospital with no significant difference by fever status at presentation (P = 0.17 and 0.07 for differences in time from hospital presentation to diagnosis and treatment, respectively). While 82% (65/79) of patients with fever received empiric antibiotic treatment, only 59% (33/56) of those with no fever received empiric antibiotic treatment (P = 0.003). Prevalence of bacterial coinfection was similar between the 2 groups (5% in the fever group vs 9% in the group without fever; P = 0.067). Patients without fever were more frequently in an ICU than those with fever (P = 0.01), but we observed no significant differences in mortality by fever status at presentation in the small number of deaths during the study period (P = 0.61). Compared to patients with no fever, after adjustment for age (<40 vs 40) and Charlson index (0, 12, 3), patients with fever had significantly decreased likelihood of late hospital presentation (>2 days from the onset of illness) (adjusted odds ratio [OR]: 0.27, P = 0.001). Patients with fever also had decreased likelihood of ICU stay compared to patients with no fever, after adjustment for age and Charlson index (adjusted OR: 0.42, P = 0.05) (Table 2).
| Adjusted Odds Ratio | P Value | |
|---|---|---|
| ||
| Late hospital presentation (>2 d from onset of illness) | ||
| Fever (vs no fever) | 0.27 | 0.001 |
| Age (40 y) | 2.06 | 0.071 |
| Charlson index | ||
| 12 | 0.69 | 0.38 |
| 3 | 1.01 | 0.99 |
| ICU admission | ||
| Fever (vs no fever) | 0.42 | 0.05 |
| Age (40 y) | 1.21 | 0.701 |
| Charlson index | ||
| 12 | 0.66 | 0.448 |
| 3 | 4.02 | 0.016 |
Patients who presented to the hospital more than 2 days after the onset of illness were significantly more likely to be treated in an ICU during their hospitalization (P < 0.001). Among 71 patients who presented to the hospital more than 2 days after the onset of illness, 27 patients were treated in an ICU and 44 patients did not require ICU care. Among 64 patients who presented to the hospital within 2 days of the onset of illness, 4 patients were treated in an ICU and 60 patients did not require ICU care. Those who presented to the hospital more than 2 days after the onset of illness also had a nonsignificantly higher death rate: 7 of 71 (10%) versus 2 of 64 (3%). Among the comorbidities tested, patients with no fever were significantly more likely to have diabetes mellitus (P = 0.03).
ICU patients had a slightly higher median Charlson index than those who did not receive ICU care (median score 1 vs score 0 for ICU patients vs non‐ICU patients, respectively; P = 0.052). We observed no difference in median Charlson index between patients with late hospital presentation (>2 days from onset of illness) and those with early hospital presentation (2 days from onset of illness) (P = 0.51).
DISCUSSION
We present the first study, to our knowledge, to assess the influence of presence of fever, as part of the illness prior to hospital presentation, on time to presentation and treatment for H1N1/09 patients. By comparing patients who had fever with those who did not, we showed that patients with fever tended to seek medical care sooner and thus received treatment sooner. Those without fever may not have realized they needed to seek medical care until much later in the course of disease compared to those with fever. Given that ICU stay was significantly more likely in patients with late presentation and no fever, these findings have important medical and economic consequences for individual patients and healthcare systems. Our findings, in conjunction with previous studies indicating reduced disease severity with early treatment of influenza,1013, can be used to educate the public to seek medical care for influenza early, even in the absence of fever.
Our study confirms previous observations that a significant number of patients with H1N1/09 did not have fever.5, 6 Nevertheless, fever appeared to trigger initiation of empiric antibiotic treatment. Empiric antibiotic use was significantly higher in the fever group. There was no difference in the median Charlson index among those who received antibiotic treatment and those who did not, suggesting that comorbidities are unlikely to explain the observed association. Empiric antibiotic treatment appeared not to affect whether or not a patient required ICU care during the hospitalization, though this association is difficult to measure because the majority of ICU patients (84%) were admitted to an ICU on the same day as hospital admission. We saw no difference in laboratory‐confirmed bacterial coinfection between patients presenting with and without fever. We did not observe a significant effect of late presentation or fever on mortality, though the small number of deaths in the study likely limited our ability to detect any association.
Recent studies have shown that clinical signs cannot reliably differentiate H1N1/09‐positive and H1N1/09‐negative patients.18, 19 In our study, patients in the fever and non‐fever groups received prompt diagnosis and treatment once they presented to the hospital. This may be because clinicians were encouraged to test patients based on any suspicion for influenza infection and to treat for influenza while waiting for the result of testing. This may explain the similar timeframes for diagnosis and treatment between the fever and non‐fever groups.
Limitations
Our study took place in a single medical center, and our findings may not be generalizable to other clinical settings. However, this large tertiary care center admits 25% of patients in central Ohio. Our study focused on hospitalized patients only and excluded patients who may have presented to the emergency department with H1N1/09 but were not hospitalized. Thus, our findings can be applied to patients with severe enough disease to warrant hospitalization. It is possible that patients without fever presented early (within 2 days of onset of illness) and were treated as outpatients; these individuals would not have been captured in the current analysis. However, our primary goal was to assess the effect of fever on the overall course of H1N1/09 presentation, diagnosis, and management in hospitalized patients. Provider bias may have played a role in the decision to admit patients to the hospital, but clinicians were encouraged to use a standardized protocol to drive decisions to test and admit. We studied H1N1/09 patients only, and our findings may not be generalizable to patients infected with other influenza types. However, H1N1/09 influenza symptoms are similar to other types of influenza. We also did not collect data on insurance status which may play a role in patients' choice to seek hospital care.
Strengths
Our study also has substantial strengths. Because clinicians tested all patients with symptoms of respiratory illness and unexplained gastrointestinal symptoms irrespective of the presence of fever, we were able to assess the proportion of H1N1/09 patients without fever as part of their illness and to determine that the most common presenting symptoms were respiratory. Our analysis includes only patients with laboratory‐confirmed H1N1/09 infection. Our surveillance was strengthened by the availability of real‐time PCR confirmatory testing performed in our own molecular microbiology laboratory.
Conclusions
In this study, nearly half of patients with H1N1/09 requiring hospitalization did not have fever as part of their illness. Patients with fever tended to seek medical care sooner and thus received treatment sooner. Patients with late presentation and no fever were more likely to need ICU admission. Our findings reinforce previous studies that indicate better outcomes with early treatment of influenza.1013 These findings can be used to prompt clinicians to consider treating hospitalized patients with influenza and to educate the public to seek medical care soon after the onset of illness, despite absence of fever, if symptoms of respiratory illness and unexplained gastrointestinal symptoms are present during the influenza season.
- CDC. Update: infections with a swine‐origin influenza A (H1N1) virus—United States and other countries, April 28, 2009. MMWR.2009;58:433–434.
- United States Centers for Disease Control and Prevention. Clinical Signs and Symptoms of Influenza. Available at: http://www.cdc.gov/flu/professionals/acip/clinical.htm#signs. Accessed June 11, 2012.
- United States Centers for Disease Control and Prevention. Cold Versus Flu. Available at: http://www.cdc.gov/flu/about/qa/coldflu.htm. Accessed June 11, 2012.
- CDC. Swine‐origin influenza A (H1N1) virus infections in a school—New York City, April 30, 2009. MMWR. 2009;58(Dispatch);1–3.
- The New York Times. Many swine flu cases have no fever. Available at: http://www.nytimes.com/2009/05/13/health/13fever.html?_r=1361(26):2507–2517.
- , , , et al. Clinical and epidemiological profile of patients with severe H1N1/09 pandemic influenza in Australia and New Zealand: an observational cohort study. BMJ Open.2011;1(1). Available at: http://dx.doi.org/10.1136/bmjopen‐2011‐000100.
- Colds and the Flu. Available at: http://familydoctor.org/familydoctor/en/diseases‐conditions/colds‐and‐the‐flu/symptoms.html. Accessed June 11, 2012.
- Flu or Cold Symptoms? Available at: http://www.webmd.com/cold‐and‐flu/cold‐guide/flu‐cold‐symptoms. Accessed June 11, 2012.
- . Neuraminidase inhibitors for influenza. N Engl J Med. 2005;353:1363–1373.
- , , , et al. Early administration of oral oseltamivir increases the benefits of influenza treatment. J Antimicrob Chemother. 2003;51:123–129.
- , , , et al. Factors influencing the effectiveness of oseltamivir and amantadine for the treatment of influenza: a multicenter study from Japan of the 2002‐2003 influenza season. Clin Infect Dis. 2005;40:1309–1316.
- , , , et al. Use of oseltamivir during influenza outbreaks in Ontario nursing homes, 1999‐2000. J Am Geriatr Soc. 2002;50:608–616.
- , . Likelihood that an unsubtypeable influenza A virus result obtained with the Luminex xTAG respiratory virus panel is indicative of infection with novel A/H1N1 (swine‐like) influenza virus. J Clin Microbiol. 2009;47:2347–2348.
- , , , . A new method of classifying prognostic comorbidity in longitudinal studies: development and validation. J Chronic Dis. 1987;40(5):373–383.
- , , , . A systematic review of the Charlson comorbidity index using Canadian administrative databases: a perspective on risk adjustment in critical care research. J Crit Care. 2005;20(1):12–19.
- , , . Adapting a clinical comorbidity index for use with ICD‐9‐CM administrative databases. J Clin Epidemiol. 1992;45(6):613–619.
- , , , , , . Characteristics of outpatients with pandemic H1N1/09 influenza in a tertiary care university hospital in Korea. Yonsei Med J. 2012;53(1):213–220.
- , , , et al. Comparison of clinical presentation of respiratory tract infections in H1N1/09‐positive and H1N1/09‐negative patients. Eur J Pediatr. 2012;171(1):159–166.
The Centers for Disease Control and Prevention (CDC) established a case definition during the 2009 influenza season for influenza‐like illness (ILI): a temperature of 100.0F (37.8C), oral or equivalent, and cough or sore throat, in the absence of a known cause other than influenza.1 Even though this definition is currently being revised, fever is still listed as a predominant symptom for influenza on the CDC Web site.2, 3
During the spring of 2009 in New York City, 95% of patients with pandemic hemagglutinin type 1 and neuraminidase type 1 (H1N1) influenza A met the case definition for ILI,4 whereas a report from Mexico5 and another from China6 reported that about one‐third of patients presented without fever. A recent study found that the clinical features of H1N1/09 influenza and seasonal strains were similar in hospitalized patients.7 Until recently, the CDC case definition for ILI included fever as a requisite symptom. Most clinicians still consider influenza a fever‐based illness.8, 9 Some studies have reported that seeking early medical care and early treatment for influenza resulted in reduced severity and duration of illness.1013 However, individuals without fever may not have sought early care because their illnesses did not meet all the criteria for ILI.
We hypothesized that significant number of our patients hospitalized during the H1N1/09 influenza pandemic did not have fever as part of the influenza‐like illness prior to hospital presentation. We further hypothesized that this absence of fever was associated with delayed presentation to the hospital and delayed treatment. No prior studies have assessed the effect of fever on hospital presentation, diagnosis, and treatment of H1N1/09 patients. We performed a retrospective cohort analysis comparing H1N1/09 patients with fever as part of their illness prior to hospital presentation to those without fever, to assess the influence of fever on hospital presentation and on diagnosis and treatment in hospitalized patients with laboratory‐confirmed H1N1/09 infection.
METHODS
Study Design and Setting
This retrospective cohort study was conducted at a tertiary care center with 1159 beds divided between 2 general hospitals (634 and 167 beds), a large cancer center (208 beds), and an inpatient cardiac hospital (150 beds).
Selection of Participants
During the pandemic influenza season, clinicians throughout the tertiary care center were encouraged to obtain nasopharyngeal swabs to screen for influenza from all patients presenting to the hospital with respiratory illness, unexplained gastrointestinal symptoms, ILI, or any suspicion for influenza infection based on physician discretion. Patients were admitted through routine hospital admission procedures and triage. Physicians were encouraged to treat all patients in whom pandemic H1N1/09 was suspected empirically with an antiviral drug (oseltamivir). Patients with a positive H1N1/09 test were then continued on treatment. Obese patients, critically ill patients requiring intensive care unit (ICU) care, pregnant women, and patients with chronic medical conditions such as chronic respiratory disease, chronic kidney disease, diabetes mellitus, and immune‐compromising conditions were treated with a higher dose of oseltamivir (150 mg twice a day). Other patients were treated with the standard dose of oseltamivir (75 mg twice a day). The present analyses include all patients at least 18 years of age, hospitalized with laboratory‐confirmed pandemic H1N1/09 virus infection from 1 June 2009 through 31 December 2009. Subjects younger than 18 years and prisoners were excluded.
Data Collection
Laboratory‐confirmed pandemic H1N1/09 patients were identified from the hospital's infection control database. After identifying eligible patients, physician investigators accessed each electronic medical record to obtain health history, diagnosis, test results, disposition, and clinical outcome information. We captured data on gender, race, age, comorbidities, symptoms and onset of illness, hospital presentation, diagnosis, treatment, ICU admission, and death. Data abstraction was performed by an infectious disease physician using a standardized form, and all data abstraction was validated by another infectious disease physician. The research was deemed exempt from further review by the Ohio State University Institutional Review Board (2009E0979).
Subjects with laboratory‐confirmed H1N1/09 virus infection were identified if nasal swab or respiratory secretions were positive for novel influenza A (H1N1) by specific rapid antigen or culture testing. Nasal swabs that were processed for confirmatory influenza testing by polymerase chain reaction (PCR) were confirmed by panel (xTAG) or specific influenza A and B PCR (Luminex Molecular Diagnostics, Toronto, CA).14 Positive tests were confirmed using the Prodesse ProFlu‐ST, Influenza A [2009] real‐time PCR (H1N1 subtyping) assay (Focus Diagnostics, Cypress, CA).
Day of onset of illness was defined as the day when the patient started developing one or more symptoms of influenza‐like illness. Day of hospital presentation was defined as the day when the patient either presented to the emergency department or a physician's office and was subsequently admitted or was directly admitted to the hospital. Fever was defined as a temperature of 100F (37.8C) or greater at presentation, or reported subjective fever upon presentation, and reported antipyretic use (nonsteroidal anti‐inflammatory drugs or acetaminophen) prior to admission. When multiple temperature readings were present in the emergency department record, any recorded temperature of 100F or greater was considered a fever. The Charlson comorbidity index predicts the 10‐year mortality for a patient with a range of comorbid conditions such as heart disease, acquired immune deficiency syndrome (AIDS), or cancer. The Charlson comorbidity index was calculated according to previously described methods.1517 Diabetes, chronic respiratory disease (asthma, chronic obstructive pulmonary disease), and chronic kidney disease with hemodialysis were recorded as comorbidities if these diagnoses were documented in the patient notes. Immunosuppression was defined as oral steroid use or other immunosuppressive medication, organ transplantation, human immunodeficiency virus (HIV) infection, or cancer chemotherapy. Empiric antibiotic treatment was defined as treatment with antibiotics regardless of the evidence of bacterial infection. Proven bacterial coinfection was defined as infection with bacterial pathogens documented by a positive bacterial culture from any site that was obtained in response to clinical suspicion of bacterial infection.
Data Analysis
Demographic and clinical characteristics were summarized for all patients, and for those patients with or without fever, as part of their illness prior to hospital presentation. Continuous variables were summarized as mean ( standard deviation) or median values. For categorical variables, the percentage of patients in each category was calculated. For comparison between patients with fever and those with no fever, for continuous variables, the 2‐sample t test for normally distributed data or the Wilcoxon rank‐sum test for non‐normal data was used. The Pearson chi‐square test was used for categorical data. We performed a logistic regression analysis to examine the association between fever and time to presentation and ICU admission, adjusting for patient age and Charlson index. All analyses were carried out using SAS 9.2 software (SAS, Cary, NC).
RESULTS
We identified 135 hospitalized patients with laboratory‐confirmed pandemic H1N1 virus infection during the study period. A substantial number of patients (n = 56, 42%) had no fever as part of their illness prior to hospital presentation. Thirty‐one patients (23%) required treatment in an ICU during hospitalization, and 9 (7%) died. While we observed no differences between patients with fever and those without fever prior to hospital presentation in gender, race, or age (Table 1), patients without fever had higher Charlson index compared to those with fever (P = 0.01, Wilcoxon rank‐sum test). Patients without fever also had significantly longer time to presentation to the hospital since the onset of illness, compared to those with fever (median of 4 vs 2 days, P < 0.001). Patients without fever also had significantly longer time to initiation of proper treatment since the onset of illness, compared to those with fever (median of 5 vs 2 days, P = 0.001).
| Fever | No Fever | Unadjusted Odds Ratio | P Value* | ||
|---|---|---|---|---|---|
| N = 79 (59%) | N = 56 (42%) | ||||
| |||||
| Gender | Female, n (%) | 41 (52) | 34 (61) | 0.7 | 0.31 |
| Race | White, n (%) | 45 (57) | 29 (52) | 1.03 | 0.30 |
| Black, n (%) | 30 (38) | 20 (36) | |||
| Other, n (%) | 4 (5) | 7 (13) | |||
| Age | Mean SD (range) | 4315 (1889) | 48 17 (1989) | 0.060 | |
| Charlson index | Median (range) | 0 (0, 13) | 1 (0, 13) | 0.010 | |
| Comorbidities | |||||
| Obese (BMI 30) | n (%) | 37 (50) | 29 (54) | 0.82 | 0.571 |
| Chronic respiratory illness (asthma, COPD) | n (%) | 19 (24) | 13 (23) | 1.05 | 0.910 |
| Diabetes | n (%) | 14 (18) | 19 (34) | 0.419 | 0.031 |
| CKD with hemodialysis | n (%) | 12 (15) | 6 (11) | 1.49 | 0.451 |
| Immunocompromised | n (%) | 29 (38) | 13 (23) | 1.92 | 0.095 |
| Days from onset to hospital presentation | Median (range) | 2 (010) | 4 (121) | 0.0001 | |
| No. with days >2 | n (%) | 31 (39) | 40 (71) | 0.26 | <0.001 |
| Days to diagnosis from hospital presentation | Median (range) | 0 (03) | 0 (05) | 0.166 | |
| No. with days >2 | n (%) | 1 (1) | 3 (5) | 0.24 | 0.170 |
| Days to oseltamivir since admission | Median (range) | 0 (013) | 1 (014) | 0.07 | |
| Days to oseltamivir since onset of illness | Median (range) | 2 (013) | 5 (119) | 0.0003 | |
| No. with days >2 | n (%) | 35 (44) | 39 (70) | 0.24 | 0.001 |
| Need for ICU care | n (%) | 12 (15) | 19 (34) | 0.35 | 0.010 |
| Death | n (%) | 6 (8) | 3 (5) | 1.45 | 0.061 |
| Bacterial coinfection | n (%) | 5 (n = 79; 6%) | 9 (15) | 0.35 | 0.067 |
| Empiric antibiotics | 65 (n = 77; 84%) | 33 (59) | 3.24 | 0.003 | |
| Lower respiratory symptoms | n (%) | 72 (91) | 50 (91) | 1.03 | 0.963 |
| Cough | n (%) | 58 (73) | 38 (69) | 1.24 | 0.585 |
| Shortness of breath | n (%) | 34 (43) | 25 (46) | 0.91 | 0.782 |
| Respiratory failure | n (%) | 7 (9) | 7 (13) | 0.67 | 0.472 |
| Sore throat/congestion/rhinorrhea | n (%) | 21 (27) | 10 (18) | 1.63 | 0.257 |
| Gastrointestinal symptoms (nausea, vomiting, diarrhea) | n (%) | 30 (38) | 13 (24) | 1.98 | 0.080 |
Patients were rapidly diagnosed and treated after presentation to the hospital with no significant difference by fever status at presentation (P = 0.17 and 0.07 for differences in time from hospital presentation to diagnosis and treatment, respectively). While 82% (65/79) of patients with fever received empiric antibiotic treatment, only 59% (33/56) of those with no fever received empiric antibiotic treatment (P = 0.003). Prevalence of bacterial coinfection was similar between the 2 groups (5% in the fever group vs 9% in the group without fever; P = 0.067). Patients without fever were more frequently in an ICU than those with fever (P = 0.01), but we observed no significant differences in mortality by fever status at presentation in the small number of deaths during the study period (P = 0.61). Compared to patients with no fever, after adjustment for age (<40 vs 40) and Charlson index (0, 12, 3), patients with fever had significantly decreased likelihood of late hospital presentation (>2 days from the onset of illness) (adjusted odds ratio [OR]: 0.27, P = 0.001). Patients with fever also had decreased likelihood of ICU stay compared to patients with no fever, after adjustment for age and Charlson index (adjusted OR: 0.42, P = 0.05) (Table 2).
| Adjusted Odds Ratio | P Value | |
|---|---|---|
| ||
| Late hospital presentation (>2 d from onset of illness) | ||
| Fever (vs no fever) | 0.27 | 0.001 |
| Age (40 y) | 2.06 | 0.071 |
| Charlson index | ||
| 12 | 0.69 | 0.38 |
| 3 | 1.01 | 0.99 |
| ICU admission | ||
| Fever (vs no fever) | 0.42 | 0.05 |
| Age (40 y) | 1.21 | 0.701 |
| Charlson index | ||
| 12 | 0.66 | 0.448 |
| 3 | 4.02 | 0.016 |
Patients who presented to the hospital more than 2 days after the onset of illness were significantly more likely to be treated in an ICU during their hospitalization (P < 0.001). Among 71 patients who presented to the hospital more than 2 days after the onset of illness, 27 patients were treated in an ICU and 44 patients did not require ICU care. Among 64 patients who presented to the hospital within 2 days of the onset of illness, 4 patients were treated in an ICU and 60 patients did not require ICU care. Those who presented to the hospital more than 2 days after the onset of illness also had a nonsignificantly higher death rate: 7 of 71 (10%) versus 2 of 64 (3%). Among the comorbidities tested, patients with no fever were significantly more likely to have diabetes mellitus (P = 0.03).
ICU patients had a slightly higher median Charlson index than those who did not receive ICU care (median score 1 vs score 0 for ICU patients vs non‐ICU patients, respectively; P = 0.052). We observed no difference in median Charlson index between patients with late hospital presentation (>2 days from onset of illness) and those with early hospital presentation (2 days from onset of illness) (P = 0.51).
DISCUSSION
We present the first study, to our knowledge, to assess the influence of presence of fever, as part of the illness prior to hospital presentation, on time to presentation and treatment for H1N1/09 patients. By comparing patients who had fever with those who did not, we showed that patients with fever tended to seek medical care sooner and thus received treatment sooner. Those without fever may not have realized they needed to seek medical care until much later in the course of disease compared to those with fever. Given that ICU stay was significantly more likely in patients with late presentation and no fever, these findings have important medical and economic consequences for individual patients and healthcare systems. Our findings, in conjunction with previous studies indicating reduced disease severity with early treatment of influenza,1013, can be used to educate the public to seek medical care for influenza early, even in the absence of fever.
Our study confirms previous observations that a significant number of patients with H1N1/09 did not have fever.5, 6 Nevertheless, fever appeared to trigger initiation of empiric antibiotic treatment. Empiric antibiotic use was significantly higher in the fever group. There was no difference in the median Charlson index among those who received antibiotic treatment and those who did not, suggesting that comorbidities are unlikely to explain the observed association. Empiric antibiotic treatment appeared not to affect whether or not a patient required ICU care during the hospitalization, though this association is difficult to measure because the majority of ICU patients (84%) were admitted to an ICU on the same day as hospital admission. We saw no difference in laboratory‐confirmed bacterial coinfection between patients presenting with and without fever. We did not observe a significant effect of late presentation or fever on mortality, though the small number of deaths in the study likely limited our ability to detect any association.
Recent studies have shown that clinical signs cannot reliably differentiate H1N1/09‐positive and H1N1/09‐negative patients.18, 19 In our study, patients in the fever and non‐fever groups received prompt diagnosis and treatment once they presented to the hospital. This may be because clinicians were encouraged to test patients based on any suspicion for influenza infection and to treat for influenza while waiting for the result of testing. This may explain the similar timeframes for diagnosis and treatment between the fever and non‐fever groups.
Limitations
Our study took place in a single medical center, and our findings may not be generalizable to other clinical settings. However, this large tertiary care center admits 25% of patients in central Ohio. Our study focused on hospitalized patients only and excluded patients who may have presented to the emergency department with H1N1/09 but were not hospitalized. Thus, our findings can be applied to patients with severe enough disease to warrant hospitalization. It is possible that patients without fever presented early (within 2 days of onset of illness) and were treated as outpatients; these individuals would not have been captured in the current analysis. However, our primary goal was to assess the effect of fever on the overall course of H1N1/09 presentation, diagnosis, and management in hospitalized patients. Provider bias may have played a role in the decision to admit patients to the hospital, but clinicians were encouraged to use a standardized protocol to drive decisions to test and admit. We studied H1N1/09 patients only, and our findings may not be generalizable to patients infected with other influenza types. However, H1N1/09 influenza symptoms are similar to other types of influenza. We also did not collect data on insurance status which may play a role in patients' choice to seek hospital care.
Strengths
Our study also has substantial strengths. Because clinicians tested all patients with symptoms of respiratory illness and unexplained gastrointestinal symptoms irrespective of the presence of fever, we were able to assess the proportion of H1N1/09 patients without fever as part of their illness and to determine that the most common presenting symptoms were respiratory. Our analysis includes only patients with laboratory‐confirmed H1N1/09 infection. Our surveillance was strengthened by the availability of real‐time PCR confirmatory testing performed in our own molecular microbiology laboratory.
Conclusions
In this study, nearly half of patients with H1N1/09 requiring hospitalization did not have fever as part of their illness. Patients with fever tended to seek medical care sooner and thus received treatment sooner. Patients with late presentation and no fever were more likely to need ICU admission. Our findings reinforce previous studies that indicate better outcomes with early treatment of influenza.1013 These findings can be used to prompt clinicians to consider treating hospitalized patients with influenza and to educate the public to seek medical care soon after the onset of illness, despite absence of fever, if symptoms of respiratory illness and unexplained gastrointestinal symptoms are present during the influenza season.
The Centers for Disease Control and Prevention (CDC) established a case definition during the 2009 influenza season for influenza‐like illness (ILI): a temperature of 100.0F (37.8C), oral or equivalent, and cough or sore throat, in the absence of a known cause other than influenza.1 Even though this definition is currently being revised, fever is still listed as a predominant symptom for influenza on the CDC Web site.2, 3
During the spring of 2009 in New York City, 95% of patients with pandemic hemagglutinin type 1 and neuraminidase type 1 (H1N1) influenza A met the case definition for ILI,4 whereas a report from Mexico5 and another from China6 reported that about one‐third of patients presented without fever. A recent study found that the clinical features of H1N1/09 influenza and seasonal strains were similar in hospitalized patients.7 Until recently, the CDC case definition for ILI included fever as a requisite symptom. Most clinicians still consider influenza a fever‐based illness.8, 9 Some studies have reported that seeking early medical care and early treatment for influenza resulted in reduced severity and duration of illness.1013 However, individuals without fever may not have sought early care because their illnesses did not meet all the criteria for ILI.
We hypothesized that significant number of our patients hospitalized during the H1N1/09 influenza pandemic did not have fever as part of the influenza‐like illness prior to hospital presentation. We further hypothesized that this absence of fever was associated with delayed presentation to the hospital and delayed treatment. No prior studies have assessed the effect of fever on hospital presentation, diagnosis, and treatment of H1N1/09 patients. We performed a retrospective cohort analysis comparing H1N1/09 patients with fever as part of their illness prior to hospital presentation to those without fever, to assess the influence of fever on hospital presentation and on diagnosis and treatment in hospitalized patients with laboratory‐confirmed H1N1/09 infection.
METHODS
Study Design and Setting
This retrospective cohort study was conducted at a tertiary care center with 1159 beds divided between 2 general hospitals (634 and 167 beds), a large cancer center (208 beds), and an inpatient cardiac hospital (150 beds).
Selection of Participants
During the pandemic influenza season, clinicians throughout the tertiary care center were encouraged to obtain nasopharyngeal swabs to screen for influenza from all patients presenting to the hospital with respiratory illness, unexplained gastrointestinal symptoms, ILI, or any suspicion for influenza infection based on physician discretion. Patients were admitted through routine hospital admission procedures and triage. Physicians were encouraged to treat all patients in whom pandemic H1N1/09 was suspected empirically with an antiviral drug (oseltamivir). Patients with a positive H1N1/09 test were then continued on treatment. Obese patients, critically ill patients requiring intensive care unit (ICU) care, pregnant women, and patients with chronic medical conditions such as chronic respiratory disease, chronic kidney disease, diabetes mellitus, and immune‐compromising conditions were treated with a higher dose of oseltamivir (150 mg twice a day). Other patients were treated with the standard dose of oseltamivir (75 mg twice a day). The present analyses include all patients at least 18 years of age, hospitalized with laboratory‐confirmed pandemic H1N1/09 virus infection from 1 June 2009 through 31 December 2009. Subjects younger than 18 years and prisoners were excluded.
Data Collection
Laboratory‐confirmed pandemic H1N1/09 patients were identified from the hospital's infection control database. After identifying eligible patients, physician investigators accessed each electronic medical record to obtain health history, diagnosis, test results, disposition, and clinical outcome information. We captured data on gender, race, age, comorbidities, symptoms and onset of illness, hospital presentation, diagnosis, treatment, ICU admission, and death. Data abstraction was performed by an infectious disease physician using a standardized form, and all data abstraction was validated by another infectious disease physician. The research was deemed exempt from further review by the Ohio State University Institutional Review Board (2009E0979).
Subjects with laboratory‐confirmed H1N1/09 virus infection were identified if nasal swab or respiratory secretions were positive for novel influenza A (H1N1) by specific rapid antigen or culture testing. Nasal swabs that were processed for confirmatory influenza testing by polymerase chain reaction (PCR) were confirmed by panel (xTAG) or specific influenza A and B PCR (Luminex Molecular Diagnostics, Toronto, CA).14 Positive tests were confirmed using the Prodesse ProFlu‐ST, Influenza A [2009] real‐time PCR (H1N1 subtyping) assay (Focus Diagnostics, Cypress, CA).
Day of onset of illness was defined as the day when the patient started developing one or more symptoms of influenza‐like illness. Day of hospital presentation was defined as the day when the patient either presented to the emergency department or a physician's office and was subsequently admitted or was directly admitted to the hospital. Fever was defined as a temperature of 100F (37.8C) or greater at presentation, or reported subjective fever upon presentation, and reported antipyretic use (nonsteroidal anti‐inflammatory drugs or acetaminophen) prior to admission. When multiple temperature readings were present in the emergency department record, any recorded temperature of 100F or greater was considered a fever. The Charlson comorbidity index predicts the 10‐year mortality for a patient with a range of comorbid conditions such as heart disease, acquired immune deficiency syndrome (AIDS), or cancer. The Charlson comorbidity index was calculated according to previously described methods.1517 Diabetes, chronic respiratory disease (asthma, chronic obstructive pulmonary disease), and chronic kidney disease with hemodialysis were recorded as comorbidities if these diagnoses were documented in the patient notes. Immunosuppression was defined as oral steroid use or other immunosuppressive medication, organ transplantation, human immunodeficiency virus (HIV) infection, or cancer chemotherapy. Empiric antibiotic treatment was defined as treatment with antibiotics regardless of the evidence of bacterial infection. Proven bacterial coinfection was defined as infection with bacterial pathogens documented by a positive bacterial culture from any site that was obtained in response to clinical suspicion of bacterial infection.
Data Analysis
Demographic and clinical characteristics were summarized for all patients, and for those patients with or without fever, as part of their illness prior to hospital presentation. Continuous variables were summarized as mean ( standard deviation) or median values. For categorical variables, the percentage of patients in each category was calculated. For comparison between patients with fever and those with no fever, for continuous variables, the 2‐sample t test for normally distributed data or the Wilcoxon rank‐sum test for non‐normal data was used. The Pearson chi‐square test was used for categorical data. We performed a logistic regression analysis to examine the association between fever and time to presentation and ICU admission, adjusting for patient age and Charlson index. All analyses were carried out using SAS 9.2 software (SAS, Cary, NC).
RESULTS
We identified 135 hospitalized patients with laboratory‐confirmed pandemic H1N1 virus infection during the study period. A substantial number of patients (n = 56, 42%) had no fever as part of their illness prior to hospital presentation. Thirty‐one patients (23%) required treatment in an ICU during hospitalization, and 9 (7%) died. While we observed no differences between patients with fever and those without fever prior to hospital presentation in gender, race, or age (Table 1), patients without fever had higher Charlson index compared to those with fever (P = 0.01, Wilcoxon rank‐sum test). Patients without fever also had significantly longer time to presentation to the hospital since the onset of illness, compared to those with fever (median of 4 vs 2 days, P < 0.001). Patients without fever also had significantly longer time to initiation of proper treatment since the onset of illness, compared to those with fever (median of 5 vs 2 days, P = 0.001).
| Fever | No Fever | Unadjusted Odds Ratio | P Value* | ||
|---|---|---|---|---|---|
| N = 79 (59%) | N = 56 (42%) | ||||
| |||||
| Gender | Female, n (%) | 41 (52) | 34 (61) | 0.7 | 0.31 |
| Race | White, n (%) | 45 (57) | 29 (52) | 1.03 | 0.30 |
| Black, n (%) | 30 (38) | 20 (36) | |||
| Other, n (%) | 4 (5) | 7 (13) | |||
| Age | Mean SD (range) | 4315 (1889) | 48 17 (1989) | 0.060 | |
| Charlson index | Median (range) | 0 (0, 13) | 1 (0, 13) | 0.010 | |
| Comorbidities | |||||
| Obese (BMI 30) | n (%) | 37 (50) | 29 (54) | 0.82 | 0.571 |
| Chronic respiratory illness (asthma, COPD) | n (%) | 19 (24) | 13 (23) | 1.05 | 0.910 |
| Diabetes | n (%) | 14 (18) | 19 (34) | 0.419 | 0.031 |
| CKD with hemodialysis | n (%) | 12 (15) | 6 (11) | 1.49 | 0.451 |
| Immunocompromised | n (%) | 29 (38) | 13 (23) | 1.92 | 0.095 |
| Days from onset to hospital presentation | Median (range) | 2 (010) | 4 (121) | 0.0001 | |
| No. with days >2 | n (%) | 31 (39) | 40 (71) | 0.26 | <0.001 |
| Days to diagnosis from hospital presentation | Median (range) | 0 (03) | 0 (05) | 0.166 | |
| No. with days >2 | n (%) | 1 (1) | 3 (5) | 0.24 | 0.170 |
| Days to oseltamivir since admission | Median (range) | 0 (013) | 1 (014) | 0.07 | |
| Days to oseltamivir since onset of illness | Median (range) | 2 (013) | 5 (119) | 0.0003 | |
| No. with days >2 | n (%) | 35 (44) | 39 (70) | 0.24 | 0.001 |
| Need for ICU care | n (%) | 12 (15) | 19 (34) | 0.35 | 0.010 |
| Death | n (%) | 6 (8) | 3 (5) | 1.45 | 0.061 |
| Bacterial coinfection | n (%) | 5 (n = 79; 6%) | 9 (15) | 0.35 | 0.067 |
| Empiric antibiotics | 65 (n = 77; 84%) | 33 (59) | 3.24 | 0.003 | |
| Lower respiratory symptoms | n (%) | 72 (91) | 50 (91) | 1.03 | 0.963 |
| Cough | n (%) | 58 (73) | 38 (69) | 1.24 | 0.585 |
| Shortness of breath | n (%) | 34 (43) | 25 (46) | 0.91 | 0.782 |
| Respiratory failure | n (%) | 7 (9) | 7 (13) | 0.67 | 0.472 |
| Sore throat/congestion/rhinorrhea | n (%) | 21 (27) | 10 (18) | 1.63 | 0.257 |
| Gastrointestinal symptoms (nausea, vomiting, diarrhea) | n (%) | 30 (38) | 13 (24) | 1.98 | 0.080 |
Patients were rapidly diagnosed and treated after presentation to the hospital with no significant difference by fever status at presentation (P = 0.17 and 0.07 for differences in time from hospital presentation to diagnosis and treatment, respectively). While 82% (65/79) of patients with fever received empiric antibiotic treatment, only 59% (33/56) of those with no fever received empiric antibiotic treatment (P = 0.003). Prevalence of bacterial coinfection was similar between the 2 groups (5% in the fever group vs 9% in the group without fever; P = 0.067). Patients without fever were more frequently in an ICU than those with fever (P = 0.01), but we observed no significant differences in mortality by fever status at presentation in the small number of deaths during the study period (P = 0.61). Compared to patients with no fever, after adjustment for age (<40 vs 40) and Charlson index (0, 12, 3), patients with fever had significantly decreased likelihood of late hospital presentation (>2 days from the onset of illness) (adjusted odds ratio [OR]: 0.27, P = 0.001). Patients with fever also had decreased likelihood of ICU stay compared to patients with no fever, after adjustment for age and Charlson index (adjusted OR: 0.42, P = 0.05) (Table 2).
| Adjusted Odds Ratio | P Value | |
|---|---|---|
| ||
| Late hospital presentation (>2 d from onset of illness) | ||
| Fever (vs no fever) | 0.27 | 0.001 |
| Age (40 y) | 2.06 | 0.071 |
| Charlson index | ||
| 12 | 0.69 | 0.38 |
| 3 | 1.01 | 0.99 |
| ICU admission | ||
| Fever (vs no fever) | 0.42 | 0.05 |
| Age (40 y) | 1.21 | 0.701 |
| Charlson index | ||
| 12 | 0.66 | 0.448 |
| 3 | 4.02 | 0.016 |
Patients who presented to the hospital more than 2 days after the onset of illness were significantly more likely to be treated in an ICU during their hospitalization (P < 0.001). Among 71 patients who presented to the hospital more than 2 days after the onset of illness, 27 patients were treated in an ICU and 44 patients did not require ICU care. Among 64 patients who presented to the hospital within 2 days of the onset of illness, 4 patients were treated in an ICU and 60 patients did not require ICU care. Those who presented to the hospital more than 2 days after the onset of illness also had a nonsignificantly higher death rate: 7 of 71 (10%) versus 2 of 64 (3%). Among the comorbidities tested, patients with no fever were significantly more likely to have diabetes mellitus (P = 0.03).
ICU patients had a slightly higher median Charlson index than those who did not receive ICU care (median score 1 vs score 0 for ICU patients vs non‐ICU patients, respectively; P = 0.052). We observed no difference in median Charlson index between patients with late hospital presentation (>2 days from onset of illness) and those with early hospital presentation (2 days from onset of illness) (P = 0.51).
DISCUSSION
We present the first study, to our knowledge, to assess the influence of presence of fever, as part of the illness prior to hospital presentation, on time to presentation and treatment for H1N1/09 patients. By comparing patients who had fever with those who did not, we showed that patients with fever tended to seek medical care sooner and thus received treatment sooner. Those without fever may not have realized they needed to seek medical care until much later in the course of disease compared to those with fever. Given that ICU stay was significantly more likely in patients with late presentation and no fever, these findings have important medical and economic consequences for individual patients and healthcare systems. Our findings, in conjunction with previous studies indicating reduced disease severity with early treatment of influenza,1013, can be used to educate the public to seek medical care for influenza early, even in the absence of fever.
Our study confirms previous observations that a significant number of patients with H1N1/09 did not have fever.5, 6 Nevertheless, fever appeared to trigger initiation of empiric antibiotic treatment. Empiric antibiotic use was significantly higher in the fever group. There was no difference in the median Charlson index among those who received antibiotic treatment and those who did not, suggesting that comorbidities are unlikely to explain the observed association. Empiric antibiotic treatment appeared not to affect whether or not a patient required ICU care during the hospitalization, though this association is difficult to measure because the majority of ICU patients (84%) were admitted to an ICU on the same day as hospital admission. We saw no difference in laboratory‐confirmed bacterial coinfection between patients presenting with and without fever. We did not observe a significant effect of late presentation or fever on mortality, though the small number of deaths in the study likely limited our ability to detect any association.
Recent studies have shown that clinical signs cannot reliably differentiate H1N1/09‐positive and H1N1/09‐negative patients.18, 19 In our study, patients in the fever and non‐fever groups received prompt diagnosis and treatment once they presented to the hospital. This may be because clinicians were encouraged to test patients based on any suspicion for influenza infection and to treat for influenza while waiting for the result of testing. This may explain the similar timeframes for diagnosis and treatment between the fever and non‐fever groups.
Limitations
Our study took place in a single medical center, and our findings may not be generalizable to other clinical settings. However, this large tertiary care center admits 25% of patients in central Ohio. Our study focused on hospitalized patients only and excluded patients who may have presented to the emergency department with H1N1/09 but were not hospitalized. Thus, our findings can be applied to patients with severe enough disease to warrant hospitalization. It is possible that patients without fever presented early (within 2 days of onset of illness) and were treated as outpatients; these individuals would not have been captured in the current analysis. However, our primary goal was to assess the effect of fever on the overall course of H1N1/09 presentation, diagnosis, and management in hospitalized patients. Provider bias may have played a role in the decision to admit patients to the hospital, but clinicians were encouraged to use a standardized protocol to drive decisions to test and admit. We studied H1N1/09 patients only, and our findings may not be generalizable to patients infected with other influenza types. However, H1N1/09 influenza symptoms are similar to other types of influenza. We also did not collect data on insurance status which may play a role in patients' choice to seek hospital care.
Strengths
Our study also has substantial strengths. Because clinicians tested all patients with symptoms of respiratory illness and unexplained gastrointestinal symptoms irrespective of the presence of fever, we were able to assess the proportion of H1N1/09 patients without fever as part of their illness and to determine that the most common presenting symptoms were respiratory. Our analysis includes only patients with laboratory‐confirmed H1N1/09 infection. Our surveillance was strengthened by the availability of real‐time PCR confirmatory testing performed in our own molecular microbiology laboratory.
Conclusions
In this study, nearly half of patients with H1N1/09 requiring hospitalization did not have fever as part of their illness. Patients with fever tended to seek medical care sooner and thus received treatment sooner. Patients with late presentation and no fever were more likely to need ICU admission. Our findings reinforce previous studies that indicate better outcomes with early treatment of influenza.1013 These findings can be used to prompt clinicians to consider treating hospitalized patients with influenza and to educate the public to seek medical care soon after the onset of illness, despite absence of fever, if symptoms of respiratory illness and unexplained gastrointestinal symptoms are present during the influenza season.
- CDC. Update: infections with a swine‐origin influenza A (H1N1) virus—United States and other countries, April 28, 2009. MMWR.2009;58:433–434.
- United States Centers for Disease Control and Prevention. Clinical Signs and Symptoms of Influenza. Available at: http://www.cdc.gov/flu/professionals/acip/clinical.htm#signs. Accessed June 11, 2012.
- United States Centers for Disease Control and Prevention. Cold Versus Flu. Available at: http://www.cdc.gov/flu/about/qa/coldflu.htm. Accessed June 11, 2012.
- CDC. Swine‐origin influenza A (H1N1) virus infections in a school—New York City, April 30, 2009. MMWR. 2009;58(Dispatch);1–3.
- The New York Times. Many swine flu cases have no fever. Available at: http://www.nytimes.com/2009/05/13/health/13fever.html?_r=1361(26):2507–2517.
- , , , et al. Clinical and epidemiological profile of patients with severe H1N1/09 pandemic influenza in Australia and New Zealand: an observational cohort study. BMJ Open.2011;1(1). Available at: http://dx.doi.org/10.1136/bmjopen‐2011‐000100.
- Colds and the Flu. Available at: http://familydoctor.org/familydoctor/en/diseases‐conditions/colds‐and‐the‐flu/symptoms.html. Accessed June 11, 2012.
- Flu or Cold Symptoms? Available at: http://www.webmd.com/cold‐and‐flu/cold‐guide/flu‐cold‐symptoms. Accessed June 11, 2012.
- . Neuraminidase inhibitors for influenza. N Engl J Med. 2005;353:1363–1373.
- , , , et al. Early administration of oral oseltamivir increases the benefits of influenza treatment. J Antimicrob Chemother. 2003;51:123–129.
- , , , et al. Factors influencing the effectiveness of oseltamivir and amantadine for the treatment of influenza: a multicenter study from Japan of the 2002‐2003 influenza season. Clin Infect Dis. 2005;40:1309–1316.
- , , , et al. Use of oseltamivir during influenza outbreaks in Ontario nursing homes, 1999‐2000. J Am Geriatr Soc. 2002;50:608–616.
- , . Likelihood that an unsubtypeable influenza A virus result obtained with the Luminex xTAG respiratory virus panel is indicative of infection with novel A/H1N1 (swine‐like) influenza virus. J Clin Microbiol. 2009;47:2347–2348.
- , , , . A new method of classifying prognostic comorbidity in longitudinal studies: development and validation. J Chronic Dis. 1987;40(5):373–383.
- , , , . A systematic review of the Charlson comorbidity index using Canadian administrative databases: a perspective on risk adjustment in critical care research. J Crit Care. 2005;20(1):12–19.
- , , . Adapting a clinical comorbidity index for use with ICD‐9‐CM administrative databases. J Clin Epidemiol. 1992;45(6):613–619.
- , , , , , . Characteristics of outpatients with pandemic H1N1/09 influenza in a tertiary care university hospital in Korea. Yonsei Med J. 2012;53(1):213–220.
- , , , et al. Comparison of clinical presentation of respiratory tract infections in H1N1/09‐positive and H1N1/09‐negative patients. Eur J Pediatr. 2012;171(1):159–166.
- CDC. Update: infections with a swine‐origin influenza A (H1N1) virus—United States and other countries, April 28, 2009. MMWR.2009;58:433–434.
- United States Centers for Disease Control and Prevention. Clinical Signs and Symptoms of Influenza. Available at: http://www.cdc.gov/flu/professionals/acip/clinical.htm#signs. Accessed June 11, 2012.
- United States Centers for Disease Control and Prevention. Cold Versus Flu. Available at: http://www.cdc.gov/flu/about/qa/coldflu.htm. Accessed June 11, 2012.
- CDC. Swine‐origin influenza A (H1N1) virus infections in a school—New York City, April 30, 2009. MMWR. 2009;58(Dispatch);1–3.
- The New York Times. Many swine flu cases have no fever. Available at: http://www.nytimes.com/2009/05/13/health/13fever.html?_r=1361(26):2507–2517.
- , , , et al. Clinical and epidemiological profile of patients with severe H1N1/09 pandemic influenza in Australia and New Zealand: an observational cohort study. BMJ Open.2011;1(1). Available at: http://dx.doi.org/10.1136/bmjopen‐2011‐000100.
- Colds and the Flu. Available at: http://familydoctor.org/familydoctor/en/diseases‐conditions/colds‐and‐the‐flu/symptoms.html. Accessed June 11, 2012.
- Flu or Cold Symptoms? Available at: http://www.webmd.com/cold‐and‐flu/cold‐guide/flu‐cold‐symptoms. Accessed June 11, 2012.
- . Neuraminidase inhibitors for influenza. N Engl J Med. 2005;353:1363–1373.
- , , , et al. Early administration of oral oseltamivir increases the benefits of influenza treatment. J Antimicrob Chemother. 2003;51:123–129.
- , , , et al. Factors influencing the effectiveness of oseltamivir and amantadine for the treatment of influenza: a multicenter study from Japan of the 2002‐2003 influenza season. Clin Infect Dis. 2005;40:1309–1316.
- , , , et al. Use of oseltamivir during influenza outbreaks in Ontario nursing homes, 1999‐2000. J Am Geriatr Soc. 2002;50:608–616.
- , . Likelihood that an unsubtypeable influenza A virus result obtained with the Luminex xTAG respiratory virus panel is indicative of infection with novel A/H1N1 (swine‐like) influenza virus. J Clin Microbiol. 2009;47:2347–2348.
- , , , . A new method of classifying prognostic comorbidity in longitudinal studies: development and validation. J Chronic Dis. 1987;40(5):373–383.
- , , , . A systematic review of the Charlson comorbidity index using Canadian administrative databases: a perspective on risk adjustment in critical care research. J Crit Care. 2005;20(1):12–19.
- , , . Adapting a clinical comorbidity index for use with ICD‐9‐CM administrative databases. J Clin Epidemiol. 1992;45(6):613–619.
- , , , , , . Characteristics of outpatients with pandemic H1N1/09 influenza in a tertiary care university hospital in Korea. Yonsei Med J. 2012;53(1):213–220.
- , , , et al. Comparison of clinical presentation of respiratory tract infections in H1N1/09‐positive and H1N1/09‐negative patients. Eur J Pediatr. 2012;171(1):159–166.
Copyright © 2012 Society of Hospital Medicine
Mortality After Therapeutic Hypothermia
There are over 350,000 cases of out‐of‐hospital cardiac arrest (OHCA) each year in the United States1, 2 and, with supportive therapy alone, only a fraction of victims survive to hospital discharge. Rapid intervention including cardiopulmonary resuscitation in the moments following arrest is critical to minimizing neurologic injury, morbidity, and mortality. In 2002, two small randomized controlled trials showed a survival benefit of therapeutic hypothermia (TH) when provided within 12 hours after return of circulation following an OHCA and, to date, TH remains one of the few interventions with proven mortality benefit after initial cardiopulmonary resuscitation.3, 4 Since 2003, TH has been incorporated into the American Heart Association practice guidelines57 and use of TH has steadily increased, but widespread clinical uptake remains low.8, 9
The initial studies that evaluated TH were small, with only 189 patients included in the TH arms of the 2 trials combined. To date, only a few studies have replicated this initial observation in real‐world settings, with little analysis of outcomes in US centers in particular.1013 Accordingly, we aimed to examine the real‐world experience with TH in the United States using a large administrative claims database of all California hospital admissions to describe utilization trends, hospital mortality, and volumeoutcome relationships associated with the intervention.
MATERIALS AND METHODS
Data
We identified all admissions to California hospitals during 19992008 based on discharge records from the California Office of Statewide Health Planning and Development. Our study period included cases of TH performed prior to the 2002 major clinical trials, since TH was in occasional use prior to the publication of these trials. The data was de‐identified and publicly available, and therefore exempt from review by the Institutional Review Board. In addition to hospital name, each discharge record included patient age, gender, admission year, International Classification of Disease, Ninth Revision (ICD‐9) code for presenting primary and secondary diagnoses, procedure codes, and disposition (discharge to home or rehabilitation, in‐hospital death). All California hospitals were included in the registry (n = 419). We defined teaching status for each hospital based on membership in the Council of Teaching Hospitals, as reported in the American Hospital Association's Annual Survey (n = 19 teaching hospitals).14
Setting and Participants
We used discharge diagnoses to identify patients who could be considered eligible for therapeutic hypothermia after cardiac arrest. We classified patients as eligible for therapeutic hypothermia after cardiac arrest based on ICD‐9 diagnosis codes that indicated the presence of both cardiac arrest and anoxic brain injury in the administrative diagnoses. Because of known imprecision in using billing codes to identify patients with cardiac arrest,15, 16 we broadly defined cardiac arrest to include those patients with ICD‐9 codes for cardiac arrest, ventricular fibrillation (VF), or ventricular tachycardia (VT) (see Supporting Table 1 in the online version of this article). We could not distinguish between out‐of‐hospital and in‐hospital cardiac arrest based on administrative diagnoses. To ensure that we included only patients with cardiac arrest complicated by neurologic insult, we required an ICD‐9 diagnosis of either anoxic brain injury, coma, or persistent vegetative state. Claims did not allow us to distinguish among initial cardiac arrest rhythms (VF vs pulseless VT vs asystole). Patients younger than 18 years of age, and those who were pregnant, suffered traumatic brain injury, intracranial hemorrhage, metastatic cancer, or dementia were excluded.3, 17 We did not exclude patients based on coagulopathy (which is considered a contraindication to TH), since ICD‐9 coding did not allow us to determine the severity of the coagulopathy or whether it was a result of therapeutic hypothermia itself.
We used the ICD‐9 procedure code (99.81) for TH to first identify patients who underwent TH from 1999 to 2008. Since this code also applies to TH used during cardiac and neurosurgery, we examined each of these cases and excluded individuals who underwent cardiac surgery or neurosurgery during the hospitalization. As in our eligible for TH definition, we excluded patients younger than 18 years of age, and those who were pregnant, suffered traumatic brain injury, intracranial hemorrhage, metastatic cancer, or dementia. Patients who underwent therapeutic hypothermia but for whom a specific procedure code was not recorded in the discharge abstractperhaps because the medical institution did not directly bill for the procedurecould not be identified.
Statistical Analysis
We used a multivariable logistic model to estimate differences in hospital mortality after cardiac arrest associated with use of therapeutic hypothermia. We conducted 2 specifications. In our baseline specification, we accounted for case‐mix differences between those who underwent TH and those who did not by adjusting for age, gender, year of admission, the number of Charlson‐Deyo comorbidities,1820 and hospital teaching status. Because mortality after cardiac arrest in centers that perform therapeutic hypothermia may be different from centers that do not, even for patients who do not undergo the procedure, we included indicators for volume tercile of therapeutic hypothermia cases performed. Volume of therapeutic hypothermia was defined at the hospital level as the total number of cases performed by that hospital from 1999 to 2008.
In order to explore how hospital teaching status, volume of therapeutic hypothermia procedures (broken into terciles), and year of admission affected the association between hospital mortality after cardiac arrest and therapeutic hypothermia, our baseline logistic model was expanded to include interactions between therapeutic hypothermia and each of these variables. The interaction between therapeutic hypothermia and year explored whether the effectiveness of the procedure changed over time, as case‐selection, method of therapeutic hypothermia (cold saline vs commercially available devices), and experience changed in California hospitals. For both specifications, we reported the odds ratio of hospital mortality among patients undergoing therapeutic hypothermia, as well as risk‐adjusted mortality for both TH and non‐TH groups.
STATA version 11 (STATA Corp, College Station, TX) was used for statistical analyses, and a 2‐sided P 0.05 was used.
RESULTS
Descriptive Data
Table 1 reports summary statistics for patients with cardiac arrest complicated by neurologic insult (anoxic brain injury, coma, or persistent vegetative state) between 1999 and 2008. Across all years, 204 patients were identified as undergoing TH. In comparison, 105 patients were identified as undergoing TH in 2008 alone. Patients who underwent TH were less likely to be male (30.7% vs 44.6% male, P < 0.01), were younger (63.9 15.0 years vs 67.3 15.7 years, P = 0.03), and had equivalent numbers of Charlson‐Deyo comorbidities (2.5 2.0 diagnoses vs 2.5 2.0 diagnoses, P = 0.89). Therapeutic hypothermia was more commonly employed at teaching hospitals (51/3709 [1.4%] vs 153/42,942 [0.4%], P < 0.01). There was a trend toward decreased unadjusted mortality among patients who underwent therapeutic hypothermia compared with those who did not (56.9% vs 62.8%, P = 0.08).
| Therapeutic Hypothermia | No Therapeutic Hypothermia | P Value | |
|---|---|---|---|
| |||
| No. observations | 204 | 46,629 | |
| No. cases in teaching hospitals | 51 | 3,658 | |
| No. cases in non‐teaching hospitals | 153 | 42,789 | |
| Age, y | 63.9 15.0 | 67.3 15.7 | 0.06 |
| Male | 30.7 | 44.6 | <0.01 |
| Hospital mortality, % | 56.9 | 62.8 | 0.08 |
| Comorbidities | |||
| No. Charlson‐Deyo comorbidities | 2.5 2.0 | 2.5 2.0 | 0.89 |
| Coronary artery disease, % | 48.0 | 38.0 | <0.01 |
| Acute myocardial infarction, % | 42.6 | 28.9 | <0.01 |
| Congestive heart failure, % | 27.9 | 35.3 | 0.03 |
| Hypertension, % | 36.3 | 33.2 | 0.83 |
| Acute renal failure, % | 33.3 | 26.6 | 0.03 |
| Diabetes mellitus, % | 30.9 | 23.0 | <0.01 |
| Chronic obstructive pulmonary disease, % | 10.3 | 19.3 | <0.01 |
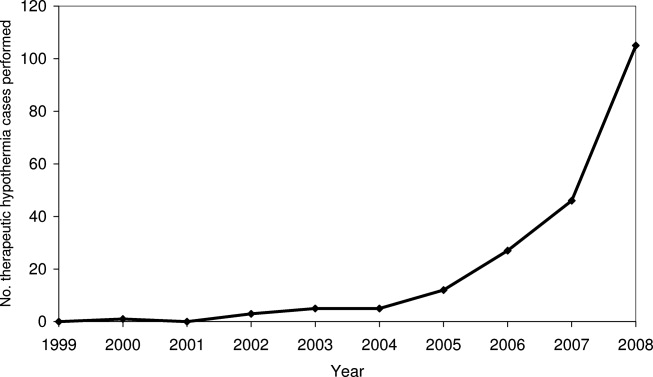
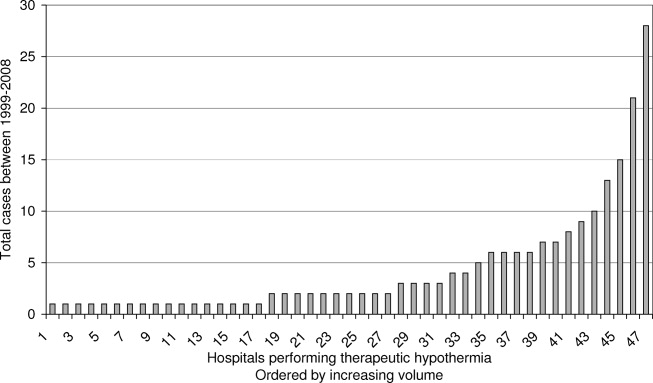
Figures 1 and 2 provide additional aggregate statistics on therapeutic hypothermia in California hospitals. Figure 1 plots the number of therapeutic hypothermia cases recorded in the administrative discharge registry between 1999 and 2008. Of the 204 total cases identified during this period, 178 (87.3%) were performed between 2006 and 2008. Figure 2 shows the distribution of TH cases across centers that performed therapeutic hypothermia (n = 47 hospitals, 11.3 % of all hospitals). Ten centers accounted for 124/204 (60.7%) of the total patients treated with TH after cardiac arrest; the top 3 centers accounted for 64 (31.4%) of the treated patients. Twenty‐seven hospitals were identified as performing therapeutic hypothermia on only 1 or 2 patients between 1999 and 2008.
Risk‐Adjusted Mortality
Table 2 presents the odds ratio of factors predicting in‐hospital mortality after cardiac arrest complicated by neurologic insult. Factors include use of TH after cardiac arrest, age, gender, year of admission, number of Charlson‐Deyo comorbidities, hospital teaching status, and volume tercile of hospitals that performed therapeutic hypothermia. Overall, patients who were older, male, and had greater comorbidities were statistically more likely to die after cardiac arrest complicated by neurologic insult. Regardless of whether they underwent TH, patients admitted to hospitals in the highest volume tercile of TH use were more likely to die after cardiac arrest. Adjusting for volume tercile, teaching hospital status was not independently associated with mortality after cardiac arrest. The adjusted odds ratio of mortality among patients undergoing therapeutic hypothermia was 0.80 (95% confidence interval [CI] 0.601.06, P = 0.11). The adjusted probability of inpatient mortality among patients undergoing therapeutic hypothermia was 57.5% (95% CI 50.764.3%) compared to those who did not 62.8% (95% CI 61.763.9%, P = 0.11).
| Variable | Odds Ratio of Hospital Mortality (95% CI) | P Value |
|---|---|---|
| ||
| No. observations | 46,651 | |
| Age* | ||
| 6569 | 1.19 (1.121.28) | <0.001 |
| 7074 | 1.29 (1.201.39) | <0.001 |
| 7579 | 1.55 (1.441.67) | <0.001 |
| 8084 | 1.79 (1.651.93) | <0.001 |
| 85 and over | 2.06 (1.892.25) | <0.001 |
| Male | 1.15 (1.101.21) | <0.001 |
| Teaching hospital | 1.13 (0.951.34) | 0.17 |
| No. Charlson‐Deyo comorbidities | 1.09 (1.081.10) | <0.001 |
| Year trend | 0.98 (0.970.99) | <0.001 |
| Volume tercile among hospitals performing TH | ||
| First tercile | 0.94 (0.791.12) | 0.48 |
| Second tercile | 1.03 (0.801.33) | 0.82 |
| Third tercile | 1.20 (1.051.36) | 0.006 |
| Therapeutic hypothermia | 0.80 (0.601.06) | 0.11 |
Figure 3 presents adjusted mortality after cardiac arrest in hospitals that did not perform TH, as well as adjusted mortality associated with TH for each volume tercile of hospitals that performed the procedure. Hospital mortality rates among patients not receiving TH after cardiac arrest were slightly higher in hospitals in the high volume tercile of TH (66.3%, 95% CI 63.868.8%) compared to hospitals in low and moderate volume terciles and to hospitals not performing TH (P < 0.001). Hospital mortality rates among low and moderate TH volume centers and in centers not performing TH were similar (62.3%, 61.3%, and 63.4%, respectively). Among both the low volume and moderate volume terciles, however, patients who underwent TH after cardiac arrest were significantly less likely to die in‐hospital compared to those who did not. For patients admitted to hospitals in the low volume tercile, those undergoing therapeutic hypothermia had an adjusted hospital mortality rate of 25.5% (95% CI 3.047.9%) compared to those who did not undergo TH (adjusted mortality 61.3%, 95% CI 57.465.1%), P < 0.001. In the moderate volume tercile, patients receiving therapeutic hypothermia had an adjusted hospital mortality rate of 31.0% (95% CI 9.2%52.8%) compared to 63.4% (95% CI 57.769.1%), P < 0.001, among those not undergoing the procedure. There was no statistically significant difference in adjusted mortality between those who underwent TH and those who did not, in hospitals in the highest volume tercile (P = 0.211). In addition to examining how volume of therapeutic hypothermia performed by hospitals affected the association between TH and hospital mortality, we also examined whether year of admission and teaching hospital independently modified the association. Neither year of admission nor teaching hospital statistically significantly affected the association between therapeutic hypothermia and hospital mortality after cardiac arrest at the P < 0.10 level.
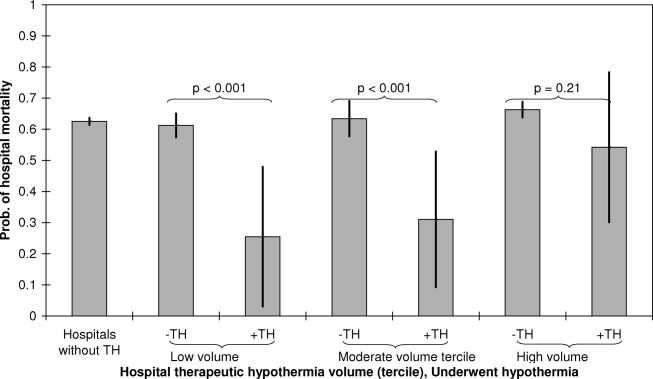
DISCUSSION
In an administrative database of all admissions to California hospitals, we demonstrated that use of TH increased steadily since the publication of the initial clinical trials in 2002. The absolute level of TH utilization in our study undoubtedly represents a significant underestimation of actual TH utilization, however, our study does provide an assessment of the utilization trends over time. The bulk of TH use appears to be performed in a small group of high volume centers, and 89% of California hospitals did not perform TH during the study period (as assessed by procedure billing codes). Additionally, within the limitations of a retrospective, administrative claims‐based study design, TH appears to be associated with a similar in‐hospital mortality rate to that seen in clinical trials.3, 4 In exploratory analyses, there appears to be a particular benefit of TH in low and moderate volume centers, though these findings should be considered hypothesis‐generating.
Despite the body of evidence in favor of TH, utilization in our study and others appears quite low. In a 2005 survey of physicians, 87% of respondents had never used therapeutic hypothermia, citing inadequate data, technical limitations, and lack of incorporation in the Advanced Cardiac Life Support (ACLS) protocol as principal justifications.8 Other surveys have shown similar results and noted that critical care physicians and those working in large medical centers were more likely to adopt the therapy.9 Advocates of the therapy have suggested that an explicit hospital‐based plan developed by key stakeholders can help facilitate implementation.21 Accordingly, there is growing interest in developing centers of expertise in highly intensive therapies such as TH. For instance, the New York City Emergency Medical Service has begun to explore a protocol to divert TH candidates to specialized centers.22, 23 Some favorable results have been reported in individual hospitals and local hospital systems.2428
Our data suggest that TH is associated with an in‐hospital mortality rate that is comparable to that reported in the clinical trials. For example, in a 2009 meta‐analysis of 4 clinical trials and 1 abstract (481 patients in total), TH was associated with a 35% relative mortality benefit as compared to standard post‐resuscitation care.29 It has been estimated that broad TH implementation could save thousands of lives30 and many authors have advocated for its use and outlined explicit protocols for implementation.17 Furthermore, TH appears to be cost‐effective in line with other accepted therapies. Assuming the Hypothermia After Cardiac Arrest (HACA) trial inclusion criteria, even at extreme estimates for costs, the cost‐effectiveness of hypothermia remains less than $100,000 per quality‐adjusted life year.31
There are important limitations of this study. Our use of administrative claims data certainly underestimates the level of TH utilization, since we could only identify cases in which TH was included in the billing codes for the hospitalization. Hospitals may vary in utilization of this particular billing code for TH in ways that bias our estimated associations. The ICD‐9 code 99.81 for therapeutic hypothermia was also not developed for post‐cardiac arrest TH specifically, so use of the code may actually lag clinical utilization. Although the observed trend in TH utilization is likely mainly due to a true increase in utilization, it is possible that some of the observed increase is due to an increase in utilization of TH procedure billing codes. Our TH utilization estimates should be construed as a lower bound of the actual rates. Additionally, although the estimated real‐world mortality benefit of TH may be comparable to that of clinical trials, the equivalence of patients in our sample to those in published randomized trials is uncertain. Similarly, even after adjusting for age, gender, year of admission, comorbidities, hospital teaching status, and TH volume, there are likely many unmeasured variables that influence mortality in both the TH and comparison groups. There are also likely patients included in our comparison group who had both cardiac arrest or ventricular tachycardia and anoxic brain injury, but who were not candidates for TH as the episode of cardiac arrest followed rather than preceded the anoxic brain injury. Since we lack detailed clinical data about the TH cases (initial rhythm, time before return of circulation, preexisting disease states, etc.), we are unable to match controls directly to cases. Additionally, we lack data to assess neurologic recovery or quality of life after arrest.
The observation that a mortality benefit in our study could be detected only in low and moderate volume centers requires further exploration. Indeed, one might expect that high volume centers may have better outcomes with TH as a result of more robust infrastructure, technical experience, and available resources. Our finding that mortality benefits of TH appear concentrated in centers with low to moderate volume of TH utilization suggest at least 1 of 2 possibilities. First, low and moderate volume centers may perform TH in a subset of patients who benefit most from the intervention or, alternatively, in the most viable cardiac arrest cases (those who may fare well with or without the therapy). Consequently, we may observe relatively favorable outcomes in this group due to this selection bias. Second, high volume centersdespite having more expertisemay also attract patients at higher mortality risk due to referral bias. This would lead us to estimate lower mortality benefits associated with TH in these high volume centers. Indeed, greater observed mortality at high volume centers regardless of TH status suggests that overall acuity is higher at high volume centers. While our inferences are greatly affected by issues of case selection and referral bias, it also important to consider the possibility that the estimated mortality benefit of TH in higher volume centers is lower because of the selection of patients who do not meet current guidelines for treatment with TH. Distinguishing whether the selection of patients undergoing TH at high volume centers is appropriate or inappropriate based on current guidelines is an important issue that merits further research with datasets with more refined patient clinical information.
In summary, therapeutic hypothermia utilization is low, but the rate of implementation has increased since the publication of the initial clinical trials in 2002. The bulk of TH utilization appears limited to a subset of high volume centers, and most centers in California appear to have not used the therapy. Real‐world in‐hospital mortality associated with TH is comparable to that reported in randomized clinical trials.
Acknowledgements
Disclosures: Dr Romley received support from NIH grant R03AG031990‐A1. Dr Noseworthy received support from the Max Schaldach Fellowship in Cardiac Pacing and Electrophysiology granted by the Heart Rhythm Society. The design, conduct, analysis, interpretation, and presentation of the data are the responsibility of the investigators, with no involvement from the funding sources. The contents of this article have not been published in any other peer‐reviewed media, and the manuscript is not under review elsewhere. All authors listed have contributed sufficiently to this project to be included as authors. The authors have no conflict of interest, financial or otherwise.
- , , , et al. Sudden cardiac death in the United States, 1989 to 1998. Circulation. 2001;104(18):2158–2163.
- , . Projections of global mortality and burden of disease from 2002 to 2030. PLoS Med. 2006;3(11):e442.
- , , , et al. Treatment of comatose survivors of out‐of‐hospital cardiac arrest with induced hypothermia. N Engl J Med. 2002;346(8):557–563.
- Hypothermia After Cardiac Arrest Study Group. Mild therapeutic hypothermia to improve the neurologic outcome after cardiac arrest. N Engl J Med. 2002;346(8):549–556.
- , , , et al. Therapeutic hypothermia after cardiac arrest: an advisory statement by the Advanced Life Support Task Force of the International Liaison Committee on Resuscitation. Circulation. 2003;108(1):118–121.
- 2005 American Heart Association guidelines for cardiopulmonary resuscitation and emergency cardiovascular care: part 7.5: postresuscitation support. Circulation. 2005;112(suppl I):IV‐84–IV‐88.
- , , , et al. Part 8: advanced life support: 2010 international consensus on cardiopulmonary resuscitation and emergency cardiovascular care science with treatment recommendations. Resuscitation. 2010;81(suppl 1):e93–e174.
- , , , et al. Induced hypothermia is underused after resuscitation from cardiac arrest: a current practice survey. Resuscitation. 2005;64(2):181–186.
- , , , et al. Therapeutic hypothermia utilization among physicians after resuscitation from cardiac arrest. Crit Care Med. 2006;34(7):1935–1940.
- , , , et al. Adverse events and their relation to mortality in out‐of‐hospital cardiac arrest patients treated with therapeutic hypothermia. Crit Care Med.39(1):57–64.
- , , , et al. Outcome, timing and adverse events in therapeutic hypothermia after out‐of‐hospital cardiac arrest. Acta Anaesthesiol Scand. 2009;53(7):926–934.
- . Clinical application of mild therapeutic hypothermia after cardiac arrest. Crit Care Med. 2007;35(4):1041–1047.
- , , , et al. Therapeutic hypothermia after out‐of‐hospital cardiac arrest: evaluation of a regional system to increase access to cooling. Circulation. 2011;124(2):206–214.
- American Hospital Association (AHA). American Hospital Association 2001 Annual Survey. Chicago, IL: Health Forum, LLC.
- , , . A multicenter study of the coding accuracy of hospital discharge administrative data for patients admitted to cardiac care units in Ontario. Am Heart J. 2002;144(2):290–296.
- . Accuracy of ICD‐9‐CM coding for the identification of patients with acute ischemic stroke: effect of modifier codes. Stroke. 1998;29(8):1602–1604.
- . Targeted temperature management for comatose survivors of cardiac arrest. N Engl J Med. 2010;363(13):1256–1264.
- , , , et al. A new method of classifying prognostic comorbidity in longitudinal studies: development and validation. J Chronic Dis. 1987;40(5):373–383.
- , , . Adapting a clinical comorbidity index for use with ICD‐9‐CM administrative databases. J Clin Epidemiol. 1992;45(6):613–619.
- , , . Adapting a clinical comorbidity index for use with ICD‐9‐CM administrative data: differing perspectives. J Clin Epidemiol. 1993;46(10):1075–1079; discussion 1081–1090.
- , , , et al. Practical implementation of therapeutic hypothermia after cardiac arrest. Hosp Pract (Minneap). 2009;37(1):71–83.
- . Paramedics will employ new therapy in cardiac arrest cases. New York Times. August 3, 2010:A18.
- , , , et al. Resuscitation center designation: recommendations for emergency medical services practices. Prehosp Emerg Care. 2010;14(1):51–61.
- , , , et al. Implementation of a hospital‐wide protocol for induced hypothermia following successfully resuscitated cardiac arrest. Crit Pathw Cardiol. 2010;9(4):216–220.
- , , , et al. Therapeutic hypothermia protocol in a community emergency department. West J Emerg Med. 2010;11(4):367–372.
- , , , et al. Implementation of a post‐cardiac arrest care bundle including therapeutic hypothermia and hemodynamic optimization in comatose patients with return of spontaneous circulation after out‐of‐hospital cardiac arrest: a feasibility study. Shock. 2011;35(4):360–366.
- , , , et al. Improved out‐of‐hospital cardiac arrest survival after the sequential implementation of 2005 AHA guidelines for compressions, ventilations, and induced hypothermia: the Wake County experience. Ann Emerg Med. 2010;56(4):348–357.
- , , , et al. Community‐based application of mild therapeutic hypothermia for survivors of cardiac arrest. South Med J. 2010;103(4):295–300.
- , , , et al. Hypothermia for neuroprotection in adults after cardiopulmonary resuscitation. Cochrane Database Syst Rev 2009(4):CD004128.
- , . Therapeutic hypothermia after cardiac arrest and myocardial infarction. Best Pract Res Clin Anaesthesiol. 2008;22(4):711–728.
- , , , et al. Cost‐effectiveness of therapeutic hypothermia after cardiac arrest. Circ Cardiovasc Qual Outcomes. 2009;2(5):421–428.
There are over 350,000 cases of out‐of‐hospital cardiac arrest (OHCA) each year in the United States1, 2 and, with supportive therapy alone, only a fraction of victims survive to hospital discharge. Rapid intervention including cardiopulmonary resuscitation in the moments following arrest is critical to minimizing neurologic injury, morbidity, and mortality. In 2002, two small randomized controlled trials showed a survival benefit of therapeutic hypothermia (TH) when provided within 12 hours after return of circulation following an OHCA and, to date, TH remains one of the few interventions with proven mortality benefit after initial cardiopulmonary resuscitation.3, 4 Since 2003, TH has been incorporated into the American Heart Association practice guidelines57 and use of TH has steadily increased, but widespread clinical uptake remains low.8, 9
The initial studies that evaluated TH were small, with only 189 patients included in the TH arms of the 2 trials combined. To date, only a few studies have replicated this initial observation in real‐world settings, with little analysis of outcomes in US centers in particular.1013 Accordingly, we aimed to examine the real‐world experience with TH in the United States using a large administrative claims database of all California hospital admissions to describe utilization trends, hospital mortality, and volumeoutcome relationships associated with the intervention.
MATERIALS AND METHODS
Data
We identified all admissions to California hospitals during 19992008 based on discharge records from the California Office of Statewide Health Planning and Development. Our study period included cases of TH performed prior to the 2002 major clinical trials, since TH was in occasional use prior to the publication of these trials. The data was de‐identified and publicly available, and therefore exempt from review by the Institutional Review Board. In addition to hospital name, each discharge record included patient age, gender, admission year, International Classification of Disease, Ninth Revision (ICD‐9) code for presenting primary and secondary diagnoses, procedure codes, and disposition (discharge to home or rehabilitation, in‐hospital death). All California hospitals were included in the registry (n = 419). We defined teaching status for each hospital based on membership in the Council of Teaching Hospitals, as reported in the American Hospital Association's Annual Survey (n = 19 teaching hospitals).14
Setting and Participants
We used discharge diagnoses to identify patients who could be considered eligible for therapeutic hypothermia after cardiac arrest. We classified patients as eligible for therapeutic hypothermia after cardiac arrest based on ICD‐9 diagnosis codes that indicated the presence of both cardiac arrest and anoxic brain injury in the administrative diagnoses. Because of known imprecision in using billing codes to identify patients with cardiac arrest,15, 16 we broadly defined cardiac arrest to include those patients with ICD‐9 codes for cardiac arrest, ventricular fibrillation (VF), or ventricular tachycardia (VT) (see Supporting Table 1 in the online version of this article). We could not distinguish between out‐of‐hospital and in‐hospital cardiac arrest based on administrative diagnoses. To ensure that we included only patients with cardiac arrest complicated by neurologic insult, we required an ICD‐9 diagnosis of either anoxic brain injury, coma, or persistent vegetative state. Claims did not allow us to distinguish among initial cardiac arrest rhythms (VF vs pulseless VT vs asystole). Patients younger than 18 years of age, and those who were pregnant, suffered traumatic brain injury, intracranial hemorrhage, metastatic cancer, or dementia were excluded.3, 17 We did not exclude patients based on coagulopathy (which is considered a contraindication to TH), since ICD‐9 coding did not allow us to determine the severity of the coagulopathy or whether it was a result of therapeutic hypothermia itself.
We used the ICD‐9 procedure code (99.81) for TH to first identify patients who underwent TH from 1999 to 2008. Since this code also applies to TH used during cardiac and neurosurgery, we examined each of these cases and excluded individuals who underwent cardiac surgery or neurosurgery during the hospitalization. As in our eligible for TH definition, we excluded patients younger than 18 years of age, and those who were pregnant, suffered traumatic brain injury, intracranial hemorrhage, metastatic cancer, or dementia. Patients who underwent therapeutic hypothermia but for whom a specific procedure code was not recorded in the discharge abstractperhaps because the medical institution did not directly bill for the procedurecould not be identified.
Statistical Analysis
We used a multivariable logistic model to estimate differences in hospital mortality after cardiac arrest associated with use of therapeutic hypothermia. We conducted 2 specifications. In our baseline specification, we accounted for case‐mix differences between those who underwent TH and those who did not by adjusting for age, gender, year of admission, the number of Charlson‐Deyo comorbidities,1820 and hospital teaching status. Because mortality after cardiac arrest in centers that perform therapeutic hypothermia may be different from centers that do not, even for patients who do not undergo the procedure, we included indicators for volume tercile of therapeutic hypothermia cases performed. Volume of therapeutic hypothermia was defined at the hospital level as the total number of cases performed by that hospital from 1999 to 2008.
In order to explore how hospital teaching status, volume of therapeutic hypothermia procedures (broken into terciles), and year of admission affected the association between hospital mortality after cardiac arrest and therapeutic hypothermia, our baseline logistic model was expanded to include interactions between therapeutic hypothermia and each of these variables. The interaction between therapeutic hypothermia and year explored whether the effectiveness of the procedure changed over time, as case‐selection, method of therapeutic hypothermia (cold saline vs commercially available devices), and experience changed in California hospitals. For both specifications, we reported the odds ratio of hospital mortality among patients undergoing therapeutic hypothermia, as well as risk‐adjusted mortality for both TH and non‐TH groups.
STATA version 11 (STATA Corp, College Station, TX) was used for statistical analyses, and a 2‐sided P 0.05 was used.
RESULTS
Descriptive Data
Table 1 reports summary statistics for patients with cardiac arrest complicated by neurologic insult (anoxic brain injury, coma, or persistent vegetative state) between 1999 and 2008. Across all years, 204 patients were identified as undergoing TH. In comparison, 105 patients were identified as undergoing TH in 2008 alone. Patients who underwent TH were less likely to be male (30.7% vs 44.6% male, P < 0.01), were younger (63.9 15.0 years vs 67.3 15.7 years, P = 0.03), and had equivalent numbers of Charlson‐Deyo comorbidities (2.5 2.0 diagnoses vs 2.5 2.0 diagnoses, P = 0.89). Therapeutic hypothermia was more commonly employed at teaching hospitals (51/3709 [1.4%] vs 153/42,942 [0.4%], P < 0.01). There was a trend toward decreased unadjusted mortality among patients who underwent therapeutic hypothermia compared with those who did not (56.9% vs 62.8%, P = 0.08).
| Therapeutic Hypothermia | No Therapeutic Hypothermia | P Value | |
|---|---|---|---|
| |||
| No. observations | 204 | 46,629 | |
| No. cases in teaching hospitals | 51 | 3,658 | |
| No. cases in non‐teaching hospitals | 153 | 42,789 | |
| Age, y | 63.9 15.0 | 67.3 15.7 | 0.06 |
| Male | 30.7 | 44.6 | <0.01 |
| Hospital mortality, % | 56.9 | 62.8 | 0.08 |
| Comorbidities | |||
| No. Charlson‐Deyo comorbidities | 2.5 2.0 | 2.5 2.0 | 0.89 |
| Coronary artery disease, % | 48.0 | 38.0 | <0.01 |
| Acute myocardial infarction, % | 42.6 | 28.9 | <0.01 |
| Congestive heart failure, % | 27.9 | 35.3 | 0.03 |
| Hypertension, % | 36.3 | 33.2 | 0.83 |
| Acute renal failure, % | 33.3 | 26.6 | 0.03 |
| Diabetes mellitus, % | 30.9 | 23.0 | <0.01 |
| Chronic obstructive pulmonary disease, % | 10.3 | 19.3 | <0.01 |
Figures 1 and 2 provide additional aggregate statistics on therapeutic hypothermia in California hospitals. Figure 1 plots the number of therapeutic hypothermia cases recorded in the administrative discharge registry between 1999 and 2008. Of the 204 total cases identified during this period, 178 (87.3%) were performed between 2006 and 2008. Figure 2 shows the distribution of TH cases across centers that performed therapeutic hypothermia (n = 47 hospitals, 11.3 % of all hospitals). Ten centers accounted for 124/204 (60.7%) of the total patients treated with TH after cardiac arrest; the top 3 centers accounted for 64 (31.4%) of the treated patients. Twenty‐seven hospitals were identified as performing therapeutic hypothermia on only 1 or 2 patients between 1999 and 2008.
Risk‐Adjusted Mortality
Table 2 presents the odds ratio of factors predicting in‐hospital mortality after cardiac arrest complicated by neurologic insult. Factors include use of TH after cardiac arrest, age, gender, year of admission, number of Charlson‐Deyo comorbidities, hospital teaching status, and volume tercile of hospitals that performed therapeutic hypothermia. Overall, patients who were older, male, and had greater comorbidities were statistically more likely to die after cardiac arrest complicated by neurologic insult. Regardless of whether they underwent TH, patients admitted to hospitals in the highest volume tercile of TH use were more likely to die after cardiac arrest. Adjusting for volume tercile, teaching hospital status was not independently associated with mortality after cardiac arrest. The adjusted odds ratio of mortality among patients undergoing therapeutic hypothermia was 0.80 (95% confidence interval [CI] 0.601.06, P = 0.11). The adjusted probability of inpatient mortality among patients undergoing therapeutic hypothermia was 57.5% (95% CI 50.764.3%) compared to those who did not 62.8% (95% CI 61.763.9%, P = 0.11).
| Variable | Odds Ratio of Hospital Mortality (95% CI) | P Value |
|---|---|---|
| ||
| No. observations | 46,651 | |
| Age* | ||
| 6569 | 1.19 (1.121.28) | <0.001 |
| 7074 | 1.29 (1.201.39) | <0.001 |
| 7579 | 1.55 (1.441.67) | <0.001 |
| 8084 | 1.79 (1.651.93) | <0.001 |
| 85 and over | 2.06 (1.892.25) | <0.001 |
| Male | 1.15 (1.101.21) | <0.001 |
| Teaching hospital | 1.13 (0.951.34) | 0.17 |
| No. Charlson‐Deyo comorbidities | 1.09 (1.081.10) | <0.001 |
| Year trend | 0.98 (0.970.99) | <0.001 |
| Volume tercile among hospitals performing TH | ||
| First tercile | 0.94 (0.791.12) | 0.48 |
| Second tercile | 1.03 (0.801.33) | 0.82 |
| Third tercile | 1.20 (1.051.36) | 0.006 |
| Therapeutic hypothermia | 0.80 (0.601.06) | 0.11 |
Figure 3 presents adjusted mortality after cardiac arrest in hospitals that did not perform TH, as well as adjusted mortality associated with TH for each volume tercile of hospitals that performed the procedure. Hospital mortality rates among patients not receiving TH after cardiac arrest were slightly higher in hospitals in the high volume tercile of TH (66.3%, 95% CI 63.868.8%) compared to hospitals in low and moderate volume terciles and to hospitals not performing TH (P < 0.001). Hospital mortality rates among low and moderate TH volume centers and in centers not performing TH were similar (62.3%, 61.3%, and 63.4%, respectively). Among both the low volume and moderate volume terciles, however, patients who underwent TH after cardiac arrest were significantly less likely to die in‐hospital compared to those who did not. For patients admitted to hospitals in the low volume tercile, those undergoing therapeutic hypothermia had an adjusted hospital mortality rate of 25.5% (95% CI 3.047.9%) compared to those who did not undergo TH (adjusted mortality 61.3%, 95% CI 57.465.1%), P < 0.001. In the moderate volume tercile, patients receiving therapeutic hypothermia had an adjusted hospital mortality rate of 31.0% (95% CI 9.2%52.8%) compared to 63.4% (95% CI 57.769.1%), P < 0.001, among those not undergoing the procedure. There was no statistically significant difference in adjusted mortality between those who underwent TH and those who did not, in hospitals in the highest volume tercile (P = 0.211). In addition to examining how volume of therapeutic hypothermia performed by hospitals affected the association between TH and hospital mortality, we also examined whether year of admission and teaching hospital independently modified the association. Neither year of admission nor teaching hospital statistically significantly affected the association between therapeutic hypothermia and hospital mortality after cardiac arrest at the P < 0.10 level.
DISCUSSION
In an administrative database of all admissions to California hospitals, we demonstrated that use of TH increased steadily since the publication of the initial clinical trials in 2002. The absolute level of TH utilization in our study undoubtedly represents a significant underestimation of actual TH utilization, however, our study does provide an assessment of the utilization trends over time. The bulk of TH use appears to be performed in a small group of high volume centers, and 89% of California hospitals did not perform TH during the study period (as assessed by procedure billing codes). Additionally, within the limitations of a retrospective, administrative claims‐based study design, TH appears to be associated with a similar in‐hospital mortality rate to that seen in clinical trials.3, 4 In exploratory analyses, there appears to be a particular benefit of TH in low and moderate volume centers, though these findings should be considered hypothesis‐generating.
Despite the body of evidence in favor of TH, utilization in our study and others appears quite low. In a 2005 survey of physicians, 87% of respondents had never used therapeutic hypothermia, citing inadequate data, technical limitations, and lack of incorporation in the Advanced Cardiac Life Support (ACLS) protocol as principal justifications.8 Other surveys have shown similar results and noted that critical care physicians and those working in large medical centers were more likely to adopt the therapy.9 Advocates of the therapy have suggested that an explicit hospital‐based plan developed by key stakeholders can help facilitate implementation.21 Accordingly, there is growing interest in developing centers of expertise in highly intensive therapies such as TH. For instance, the New York City Emergency Medical Service has begun to explore a protocol to divert TH candidates to specialized centers.22, 23 Some favorable results have been reported in individual hospitals and local hospital systems.2428
Our data suggest that TH is associated with an in‐hospital mortality rate that is comparable to that reported in the clinical trials. For example, in a 2009 meta‐analysis of 4 clinical trials and 1 abstract (481 patients in total), TH was associated with a 35% relative mortality benefit as compared to standard post‐resuscitation care.29 It has been estimated that broad TH implementation could save thousands of lives30 and many authors have advocated for its use and outlined explicit protocols for implementation.17 Furthermore, TH appears to be cost‐effective in line with other accepted therapies. Assuming the Hypothermia After Cardiac Arrest (HACA) trial inclusion criteria, even at extreme estimates for costs, the cost‐effectiveness of hypothermia remains less than $100,000 per quality‐adjusted life year.31
There are important limitations of this study. Our use of administrative claims data certainly underestimates the level of TH utilization, since we could only identify cases in which TH was included in the billing codes for the hospitalization. Hospitals may vary in utilization of this particular billing code for TH in ways that bias our estimated associations. The ICD‐9 code 99.81 for therapeutic hypothermia was also not developed for post‐cardiac arrest TH specifically, so use of the code may actually lag clinical utilization. Although the observed trend in TH utilization is likely mainly due to a true increase in utilization, it is possible that some of the observed increase is due to an increase in utilization of TH procedure billing codes. Our TH utilization estimates should be construed as a lower bound of the actual rates. Additionally, although the estimated real‐world mortality benefit of TH may be comparable to that of clinical trials, the equivalence of patients in our sample to those in published randomized trials is uncertain. Similarly, even after adjusting for age, gender, year of admission, comorbidities, hospital teaching status, and TH volume, there are likely many unmeasured variables that influence mortality in both the TH and comparison groups. There are also likely patients included in our comparison group who had both cardiac arrest or ventricular tachycardia and anoxic brain injury, but who were not candidates for TH as the episode of cardiac arrest followed rather than preceded the anoxic brain injury. Since we lack detailed clinical data about the TH cases (initial rhythm, time before return of circulation, preexisting disease states, etc.), we are unable to match controls directly to cases. Additionally, we lack data to assess neurologic recovery or quality of life after arrest.
The observation that a mortality benefit in our study could be detected only in low and moderate volume centers requires further exploration. Indeed, one might expect that high volume centers may have better outcomes with TH as a result of more robust infrastructure, technical experience, and available resources. Our finding that mortality benefits of TH appear concentrated in centers with low to moderate volume of TH utilization suggest at least 1 of 2 possibilities. First, low and moderate volume centers may perform TH in a subset of patients who benefit most from the intervention or, alternatively, in the most viable cardiac arrest cases (those who may fare well with or without the therapy). Consequently, we may observe relatively favorable outcomes in this group due to this selection bias. Second, high volume centersdespite having more expertisemay also attract patients at higher mortality risk due to referral bias. This would lead us to estimate lower mortality benefits associated with TH in these high volume centers. Indeed, greater observed mortality at high volume centers regardless of TH status suggests that overall acuity is higher at high volume centers. While our inferences are greatly affected by issues of case selection and referral bias, it also important to consider the possibility that the estimated mortality benefit of TH in higher volume centers is lower because of the selection of patients who do not meet current guidelines for treatment with TH. Distinguishing whether the selection of patients undergoing TH at high volume centers is appropriate or inappropriate based on current guidelines is an important issue that merits further research with datasets with more refined patient clinical information.
In summary, therapeutic hypothermia utilization is low, but the rate of implementation has increased since the publication of the initial clinical trials in 2002. The bulk of TH utilization appears limited to a subset of high volume centers, and most centers in California appear to have not used the therapy. Real‐world in‐hospital mortality associated with TH is comparable to that reported in randomized clinical trials.
Acknowledgements
Disclosures: Dr Romley received support from NIH grant R03AG031990‐A1. Dr Noseworthy received support from the Max Schaldach Fellowship in Cardiac Pacing and Electrophysiology granted by the Heart Rhythm Society. The design, conduct, analysis, interpretation, and presentation of the data are the responsibility of the investigators, with no involvement from the funding sources. The contents of this article have not been published in any other peer‐reviewed media, and the manuscript is not under review elsewhere. All authors listed have contributed sufficiently to this project to be included as authors. The authors have no conflict of interest, financial or otherwise.
There are over 350,000 cases of out‐of‐hospital cardiac arrest (OHCA) each year in the United States1, 2 and, with supportive therapy alone, only a fraction of victims survive to hospital discharge. Rapid intervention including cardiopulmonary resuscitation in the moments following arrest is critical to minimizing neurologic injury, morbidity, and mortality. In 2002, two small randomized controlled trials showed a survival benefit of therapeutic hypothermia (TH) when provided within 12 hours after return of circulation following an OHCA and, to date, TH remains one of the few interventions with proven mortality benefit after initial cardiopulmonary resuscitation.3, 4 Since 2003, TH has been incorporated into the American Heart Association practice guidelines57 and use of TH has steadily increased, but widespread clinical uptake remains low.8, 9
The initial studies that evaluated TH were small, with only 189 patients included in the TH arms of the 2 trials combined. To date, only a few studies have replicated this initial observation in real‐world settings, with little analysis of outcomes in US centers in particular.1013 Accordingly, we aimed to examine the real‐world experience with TH in the United States using a large administrative claims database of all California hospital admissions to describe utilization trends, hospital mortality, and volumeoutcome relationships associated with the intervention.
MATERIALS AND METHODS
Data
We identified all admissions to California hospitals during 19992008 based on discharge records from the California Office of Statewide Health Planning and Development. Our study period included cases of TH performed prior to the 2002 major clinical trials, since TH was in occasional use prior to the publication of these trials. The data was de‐identified and publicly available, and therefore exempt from review by the Institutional Review Board. In addition to hospital name, each discharge record included patient age, gender, admission year, International Classification of Disease, Ninth Revision (ICD‐9) code for presenting primary and secondary diagnoses, procedure codes, and disposition (discharge to home or rehabilitation, in‐hospital death). All California hospitals were included in the registry (n = 419). We defined teaching status for each hospital based on membership in the Council of Teaching Hospitals, as reported in the American Hospital Association's Annual Survey (n = 19 teaching hospitals).14
Setting and Participants
We used discharge diagnoses to identify patients who could be considered eligible for therapeutic hypothermia after cardiac arrest. We classified patients as eligible for therapeutic hypothermia after cardiac arrest based on ICD‐9 diagnosis codes that indicated the presence of both cardiac arrest and anoxic brain injury in the administrative diagnoses. Because of known imprecision in using billing codes to identify patients with cardiac arrest,15, 16 we broadly defined cardiac arrest to include those patients with ICD‐9 codes for cardiac arrest, ventricular fibrillation (VF), or ventricular tachycardia (VT) (see Supporting Table 1 in the online version of this article). We could not distinguish between out‐of‐hospital and in‐hospital cardiac arrest based on administrative diagnoses. To ensure that we included only patients with cardiac arrest complicated by neurologic insult, we required an ICD‐9 diagnosis of either anoxic brain injury, coma, or persistent vegetative state. Claims did not allow us to distinguish among initial cardiac arrest rhythms (VF vs pulseless VT vs asystole). Patients younger than 18 years of age, and those who were pregnant, suffered traumatic brain injury, intracranial hemorrhage, metastatic cancer, or dementia were excluded.3, 17 We did not exclude patients based on coagulopathy (which is considered a contraindication to TH), since ICD‐9 coding did not allow us to determine the severity of the coagulopathy or whether it was a result of therapeutic hypothermia itself.
We used the ICD‐9 procedure code (99.81) for TH to first identify patients who underwent TH from 1999 to 2008. Since this code also applies to TH used during cardiac and neurosurgery, we examined each of these cases and excluded individuals who underwent cardiac surgery or neurosurgery during the hospitalization. As in our eligible for TH definition, we excluded patients younger than 18 years of age, and those who were pregnant, suffered traumatic brain injury, intracranial hemorrhage, metastatic cancer, or dementia. Patients who underwent therapeutic hypothermia but for whom a specific procedure code was not recorded in the discharge abstractperhaps because the medical institution did not directly bill for the procedurecould not be identified.
Statistical Analysis
We used a multivariable logistic model to estimate differences in hospital mortality after cardiac arrest associated with use of therapeutic hypothermia. We conducted 2 specifications. In our baseline specification, we accounted for case‐mix differences between those who underwent TH and those who did not by adjusting for age, gender, year of admission, the number of Charlson‐Deyo comorbidities,1820 and hospital teaching status. Because mortality after cardiac arrest in centers that perform therapeutic hypothermia may be different from centers that do not, even for patients who do not undergo the procedure, we included indicators for volume tercile of therapeutic hypothermia cases performed. Volume of therapeutic hypothermia was defined at the hospital level as the total number of cases performed by that hospital from 1999 to 2008.
In order to explore how hospital teaching status, volume of therapeutic hypothermia procedures (broken into terciles), and year of admission affected the association between hospital mortality after cardiac arrest and therapeutic hypothermia, our baseline logistic model was expanded to include interactions between therapeutic hypothermia and each of these variables. The interaction between therapeutic hypothermia and year explored whether the effectiveness of the procedure changed over time, as case‐selection, method of therapeutic hypothermia (cold saline vs commercially available devices), and experience changed in California hospitals. For both specifications, we reported the odds ratio of hospital mortality among patients undergoing therapeutic hypothermia, as well as risk‐adjusted mortality for both TH and non‐TH groups.
STATA version 11 (STATA Corp, College Station, TX) was used for statistical analyses, and a 2‐sided P 0.05 was used.
RESULTS
Descriptive Data
Table 1 reports summary statistics for patients with cardiac arrest complicated by neurologic insult (anoxic brain injury, coma, or persistent vegetative state) between 1999 and 2008. Across all years, 204 patients were identified as undergoing TH. In comparison, 105 patients were identified as undergoing TH in 2008 alone. Patients who underwent TH were less likely to be male (30.7% vs 44.6% male, P < 0.01), were younger (63.9 15.0 years vs 67.3 15.7 years, P = 0.03), and had equivalent numbers of Charlson‐Deyo comorbidities (2.5 2.0 diagnoses vs 2.5 2.0 diagnoses, P = 0.89). Therapeutic hypothermia was more commonly employed at teaching hospitals (51/3709 [1.4%] vs 153/42,942 [0.4%], P < 0.01). There was a trend toward decreased unadjusted mortality among patients who underwent therapeutic hypothermia compared with those who did not (56.9% vs 62.8%, P = 0.08).
| Therapeutic Hypothermia | No Therapeutic Hypothermia | P Value | |
|---|---|---|---|
| |||
| No. observations | 204 | 46,629 | |
| No. cases in teaching hospitals | 51 | 3,658 | |
| No. cases in non‐teaching hospitals | 153 | 42,789 | |
| Age, y | 63.9 15.0 | 67.3 15.7 | 0.06 |
| Male | 30.7 | 44.6 | <0.01 |
| Hospital mortality, % | 56.9 | 62.8 | 0.08 |
| Comorbidities | |||
| No. Charlson‐Deyo comorbidities | 2.5 2.0 | 2.5 2.0 | 0.89 |
| Coronary artery disease, % | 48.0 | 38.0 | <0.01 |
| Acute myocardial infarction, % | 42.6 | 28.9 | <0.01 |
| Congestive heart failure, % | 27.9 | 35.3 | 0.03 |
| Hypertension, % | 36.3 | 33.2 | 0.83 |
| Acute renal failure, % | 33.3 | 26.6 | 0.03 |
| Diabetes mellitus, % | 30.9 | 23.0 | <0.01 |
| Chronic obstructive pulmonary disease, % | 10.3 | 19.3 | <0.01 |
Figures 1 and 2 provide additional aggregate statistics on therapeutic hypothermia in California hospitals. Figure 1 plots the number of therapeutic hypothermia cases recorded in the administrative discharge registry between 1999 and 2008. Of the 204 total cases identified during this period, 178 (87.3%) were performed between 2006 and 2008. Figure 2 shows the distribution of TH cases across centers that performed therapeutic hypothermia (n = 47 hospitals, 11.3 % of all hospitals). Ten centers accounted for 124/204 (60.7%) of the total patients treated with TH after cardiac arrest; the top 3 centers accounted for 64 (31.4%) of the treated patients. Twenty‐seven hospitals were identified as performing therapeutic hypothermia on only 1 or 2 patients between 1999 and 2008.
Risk‐Adjusted Mortality
Table 2 presents the odds ratio of factors predicting in‐hospital mortality after cardiac arrest complicated by neurologic insult. Factors include use of TH after cardiac arrest, age, gender, year of admission, number of Charlson‐Deyo comorbidities, hospital teaching status, and volume tercile of hospitals that performed therapeutic hypothermia. Overall, patients who were older, male, and had greater comorbidities were statistically more likely to die after cardiac arrest complicated by neurologic insult. Regardless of whether they underwent TH, patients admitted to hospitals in the highest volume tercile of TH use were more likely to die after cardiac arrest. Adjusting for volume tercile, teaching hospital status was not independently associated with mortality after cardiac arrest. The adjusted odds ratio of mortality among patients undergoing therapeutic hypothermia was 0.80 (95% confidence interval [CI] 0.601.06, P = 0.11). The adjusted probability of inpatient mortality among patients undergoing therapeutic hypothermia was 57.5% (95% CI 50.764.3%) compared to those who did not 62.8% (95% CI 61.763.9%, P = 0.11).
| Variable | Odds Ratio of Hospital Mortality (95% CI) | P Value |
|---|---|---|
| ||
| No. observations | 46,651 | |
| Age* | ||
| 6569 | 1.19 (1.121.28) | <0.001 |
| 7074 | 1.29 (1.201.39) | <0.001 |
| 7579 | 1.55 (1.441.67) | <0.001 |
| 8084 | 1.79 (1.651.93) | <0.001 |
| 85 and over | 2.06 (1.892.25) | <0.001 |
| Male | 1.15 (1.101.21) | <0.001 |
| Teaching hospital | 1.13 (0.951.34) | 0.17 |
| No. Charlson‐Deyo comorbidities | 1.09 (1.081.10) | <0.001 |
| Year trend | 0.98 (0.970.99) | <0.001 |
| Volume tercile among hospitals performing TH | ||
| First tercile | 0.94 (0.791.12) | 0.48 |
| Second tercile | 1.03 (0.801.33) | 0.82 |
| Third tercile | 1.20 (1.051.36) | 0.006 |
| Therapeutic hypothermia | 0.80 (0.601.06) | 0.11 |
Figure 3 presents adjusted mortality after cardiac arrest in hospitals that did not perform TH, as well as adjusted mortality associated with TH for each volume tercile of hospitals that performed the procedure. Hospital mortality rates among patients not receiving TH after cardiac arrest were slightly higher in hospitals in the high volume tercile of TH (66.3%, 95% CI 63.868.8%) compared to hospitals in low and moderate volume terciles and to hospitals not performing TH (P < 0.001). Hospital mortality rates among low and moderate TH volume centers and in centers not performing TH were similar (62.3%, 61.3%, and 63.4%, respectively). Among both the low volume and moderate volume terciles, however, patients who underwent TH after cardiac arrest were significantly less likely to die in‐hospital compared to those who did not. For patients admitted to hospitals in the low volume tercile, those undergoing therapeutic hypothermia had an adjusted hospital mortality rate of 25.5% (95% CI 3.047.9%) compared to those who did not undergo TH (adjusted mortality 61.3%, 95% CI 57.465.1%), P < 0.001. In the moderate volume tercile, patients receiving therapeutic hypothermia had an adjusted hospital mortality rate of 31.0% (95% CI 9.2%52.8%) compared to 63.4% (95% CI 57.769.1%), P < 0.001, among those not undergoing the procedure. There was no statistically significant difference in adjusted mortality between those who underwent TH and those who did not, in hospitals in the highest volume tercile (P = 0.211). In addition to examining how volume of therapeutic hypothermia performed by hospitals affected the association between TH and hospital mortality, we also examined whether year of admission and teaching hospital independently modified the association. Neither year of admission nor teaching hospital statistically significantly affected the association between therapeutic hypothermia and hospital mortality after cardiac arrest at the P < 0.10 level.
DISCUSSION
In an administrative database of all admissions to California hospitals, we demonstrated that use of TH increased steadily since the publication of the initial clinical trials in 2002. The absolute level of TH utilization in our study undoubtedly represents a significant underestimation of actual TH utilization, however, our study does provide an assessment of the utilization trends over time. The bulk of TH use appears to be performed in a small group of high volume centers, and 89% of California hospitals did not perform TH during the study period (as assessed by procedure billing codes). Additionally, within the limitations of a retrospective, administrative claims‐based study design, TH appears to be associated with a similar in‐hospital mortality rate to that seen in clinical trials.3, 4 In exploratory analyses, there appears to be a particular benefit of TH in low and moderate volume centers, though these findings should be considered hypothesis‐generating.
Despite the body of evidence in favor of TH, utilization in our study and others appears quite low. In a 2005 survey of physicians, 87% of respondents had never used therapeutic hypothermia, citing inadequate data, technical limitations, and lack of incorporation in the Advanced Cardiac Life Support (ACLS) protocol as principal justifications.8 Other surveys have shown similar results and noted that critical care physicians and those working in large medical centers were more likely to adopt the therapy.9 Advocates of the therapy have suggested that an explicit hospital‐based plan developed by key stakeholders can help facilitate implementation.21 Accordingly, there is growing interest in developing centers of expertise in highly intensive therapies such as TH. For instance, the New York City Emergency Medical Service has begun to explore a protocol to divert TH candidates to specialized centers.22, 23 Some favorable results have been reported in individual hospitals and local hospital systems.2428
Our data suggest that TH is associated with an in‐hospital mortality rate that is comparable to that reported in the clinical trials. For example, in a 2009 meta‐analysis of 4 clinical trials and 1 abstract (481 patients in total), TH was associated with a 35% relative mortality benefit as compared to standard post‐resuscitation care.29 It has been estimated that broad TH implementation could save thousands of lives30 and many authors have advocated for its use and outlined explicit protocols for implementation.17 Furthermore, TH appears to be cost‐effective in line with other accepted therapies. Assuming the Hypothermia After Cardiac Arrest (HACA) trial inclusion criteria, even at extreme estimates for costs, the cost‐effectiveness of hypothermia remains less than $100,000 per quality‐adjusted life year.31
There are important limitations of this study. Our use of administrative claims data certainly underestimates the level of TH utilization, since we could only identify cases in which TH was included in the billing codes for the hospitalization. Hospitals may vary in utilization of this particular billing code for TH in ways that bias our estimated associations. The ICD‐9 code 99.81 for therapeutic hypothermia was also not developed for post‐cardiac arrest TH specifically, so use of the code may actually lag clinical utilization. Although the observed trend in TH utilization is likely mainly due to a true increase in utilization, it is possible that some of the observed increase is due to an increase in utilization of TH procedure billing codes. Our TH utilization estimates should be construed as a lower bound of the actual rates. Additionally, although the estimated real‐world mortality benefit of TH may be comparable to that of clinical trials, the equivalence of patients in our sample to those in published randomized trials is uncertain. Similarly, even after adjusting for age, gender, year of admission, comorbidities, hospital teaching status, and TH volume, there are likely many unmeasured variables that influence mortality in both the TH and comparison groups. There are also likely patients included in our comparison group who had both cardiac arrest or ventricular tachycardia and anoxic brain injury, but who were not candidates for TH as the episode of cardiac arrest followed rather than preceded the anoxic brain injury. Since we lack detailed clinical data about the TH cases (initial rhythm, time before return of circulation, preexisting disease states, etc.), we are unable to match controls directly to cases. Additionally, we lack data to assess neurologic recovery or quality of life after arrest.
The observation that a mortality benefit in our study could be detected only in low and moderate volume centers requires further exploration. Indeed, one might expect that high volume centers may have better outcomes with TH as a result of more robust infrastructure, technical experience, and available resources. Our finding that mortality benefits of TH appear concentrated in centers with low to moderate volume of TH utilization suggest at least 1 of 2 possibilities. First, low and moderate volume centers may perform TH in a subset of patients who benefit most from the intervention or, alternatively, in the most viable cardiac arrest cases (those who may fare well with or without the therapy). Consequently, we may observe relatively favorable outcomes in this group due to this selection bias. Second, high volume centersdespite having more expertisemay also attract patients at higher mortality risk due to referral bias. This would lead us to estimate lower mortality benefits associated with TH in these high volume centers. Indeed, greater observed mortality at high volume centers regardless of TH status suggests that overall acuity is higher at high volume centers. While our inferences are greatly affected by issues of case selection and referral bias, it also important to consider the possibility that the estimated mortality benefit of TH in higher volume centers is lower because of the selection of patients who do not meet current guidelines for treatment with TH. Distinguishing whether the selection of patients undergoing TH at high volume centers is appropriate or inappropriate based on current guidelines is an important issue that merits further research with datasets with more refined patient clinical information.
In summary, therapeutic hypothermia utilization is low, but the rate of implementation has increased since the publication of the initial clinical trials in 2002. The bulk of TH utilization appears limited to a subset of high volume centers, and most centers in California appear to have not used the therapy. Real‐world in‐hospital mortality associated with TH is comparable to that reported in randomized clinical trials.
Acknowledgements
Disclosures: Dr Romley received support from NIH grant R03AG031990‐A1. Dr Noseworthy received support from the Max Schaldach Fellowship in Cardiac Pacing and Electrophysiology granted by the Heart Rhythm Society. The design, conduct, analysis, interpretation, and presentation of the data are the responsibility of the investigators, with no involvement from the funding sources. The contents of this article have not been published in any other peer‐reviewed media, and the manuscript is not under review elsewhere. All authors listed have contributed sufficiently to this project to be included as authors. The authors have no conflict of interest, financial or otherwise.
- , , , et al. Sudden cardiac death in the United States, 1989 to 1998. Circulation. 2001;104(18):2158–2163.
- , . Projections of global mortality and burden of disease from 2002 to 2030. PLoS Med. 2006;3(11):e442.
- , , , et al. Treatment of comatose survivors of out‐of‐hospital cardiac arrest with induced hypothermia. N Engl J Med. 2002;346(8):557–563.
- Hypothermia After Cardiac Arrest Study Group. Mild therapeutic hypothermia to improve the neurologic outcome after cardiac arrest. N Engl J Med. 2002;346(8):549–556.
- , , , et al. Therapeutic hypothermia after cardiac arrest: an advisory statement by the Advanced Life Support Task Force of the International Liaison Committee on Resuscitation. Circulation. 2003;108(1):118–121.
- 2005 American Heart Association guidelines for cardiopulmonary resuscitation and emergency cardiovascular care: part 7.5: postresuscitation support. Circulation. 2005;112(suppl I):IV‐84–IV‐88.
- , , , et al. Part 8: advanced life support: 2010 international consensus on cardiopulmonary resuscitation and emergency cardiovascular care science with treatment recommendations. Resuscitation. 2010;81(suppl 1):e93–e174.
- , , , et al. Induced hypothermia is underused after resuscitation from cardiac arrest: a current practice survey. Resuscitation. 2005;64(2):181–186.
- , , , et al. Therapeutic hypothermia utilization among physicians after resuscitation from cardiac arrest. Crit Care Med. 2006;34(7):1935–1940.
- , , , et al. Adverse events and their relation to mortality in out‐of‐hospital cardiac arrest patients treated with therapeutic hypothermia. Crit Care Med.39(1):57–64.
- , , , et al. Outcome, timing and adverse events in therapeutic hypothermia after out‐of‐hospital cardiac arrest. Acta Anaesthesiol Scand. 2009;53(7):926–934.
- . Clinical application of mild therapeutic hypothermia after cardiac arrest. Crit Care Med. 2007;35(4):1041–1047.
- , , , et al. Therapeutic hypothermia after out‐of‐hospital cardiac arrest: evaluation of a regional system to increase access to cooling. Circulation. 2011;124(2):206–214.
- American Hospital Association (AHA). American Hospital Association 2001 Annual Survey. Chicago, IL: Health Forum, LLC.
- , , . A multicenter study of the coding accuracy of hospital discharge administrative data for patients admitted to cardiac care units in Ontario. Am Heart J. 2002;144(2):290–296.
- . Accuracy of ICD‐9‐CM coding for the identification of patients with acute ischemic stroke: effect of modifier codes. Stroke. 1998;29(8):1602–1604.
- . Targeted temperature management for comatose survivors of cardiac arrest. N Engl J Med. 2010;363(13):1256–1264.
- , , , et al. A new method of classifying prognostic comorbidity in longitudinal studies: development and validation. J Chronic Dis. 1987;40(5):373–383.
- , , . Adapting a clinical comorbidity index for use with ICD‐9‐CM administrative databases. J Clin Epidemiol. 1992;45(6):613–619.
- , , . Adapting a clinical comorbidity index for use with ICD‐9‐CM administrative data: differing perspectives. J Clin Epidemiol. 1993;46(10):1075–1079; discussion 1081–1090.
- , , , et al. Practical implementation of therapeutic hypothermia after cardiac arrest. Hosp Pract (Minneap). 2009;37(1):71–83.
- . Paramedics will employ new therapy in cardiac arrest cases. New York Times. August 3, 2010:A18.
- , , , et al. Resuscitation center designation: recommendations for emergency medical services practices. Prehosp Emerg Care. 2010;14(1):51–61.
- , , , et al. Implementation of a hospital‐wide protocol for induced hypothermia following successfully resuscitated cardiac arrest. Crit Pathw Cardiol. 2010;9(4):216–220.
- , , , et al. Therapeutic hypothermia protocol in a community emergency department. West J Emerg Med. 2010;11(4):367–372.
- , , , et al. Implementation of a post‐cardiac arrest care bundle including therapeutic hypothermia and hemodynamic optimization in comatose patients with return of spontaneous circulation after out‐of‐hospital cardiac arrest: a feasibility study. Shock. 2011;35(4):360–366.
- , , , et al. Improved out‐of‐hospital cardiac arrest survival after the sequential implementation of 2005 AHA guidelines for compressions, ventilations, and induced hypothermia: the Wake County experience. Ann Emerg Med. 2010;56(4):348–357.
- , , , et al. Community‐based application of mild therapeutic hypothermia for survivors of cardiac arrest. South Med J. 2010;103(4):295–300.
- , , , et al. Hypothermia for neuroprotection in adults after cardiopulmonary resuscitation. Cochrane Database Syst Rev 2009(4):CD004128.
- , . Therapeutic hypothermia after cardiac arrest and myocardial infarction. Best Pract Res Clin Anaesthesiol. 2008;22(4):711–728.
- , , , et al. Cost‐effectiveness of therapeutic hypothermia after cardiac arrest. Circ Cardiovasc Qual Outcomes. 2009;2(5):421–428.
- , , , et al. Sudden cardiac death in the United States, 1989 to 1998. Circulation. 2001;104(18):2158–2163.
- , . Projections of global mortality and burden of disease from 2002 to 2030. PLoS Med. 2006;3(11):e442.
- , , , et al. Treatment of comatose survivors of out‐of‐hospital cardiac arrest with induced hypothermia. N Engl J Med. 2002;346(8):557–563.
- Hypothermia After Cardiac Arrest Study Group. Mild therapeutic hypothermia to improve the neurologic outcome after cardiac arrest. N Engl J Med. 2002;346(8):549–556.
- , , , et al. Therapeutic hypothermia after cardiac arrest: an advisory statement by the Advanced Life Support Task Force of the International Liaison Committee on Resuscitation. Circulation. 2003;108(1):118–121.
- 2005 American Heart Association guidelines for cardiopulmonary resuscitation and emergency cardiovascular care: part 7.5: postresuscitation support. Circulation. 2005;112(suppl I):IV‐84–IV‐88.
- , , , et al. Part 8: advanced life support: 2010 international consensus on cardiopulmonary resuscitation and emergency cardiovascular care science with treatment recommendations. Resuscitation. 2010;81(suppl 1):e93–e174.
- , , , et al. Induced hypothermia is underused after resuscitation from cardiac arrest: a current practice survey. Resuscitation. 2005;64(2):181–186.
- , , , et al. Therapeutic hypothermia utilization among physicians after resuscitation from cardiac arrest. Crit Care Med. 2006;34(7):1935–1940.
- , , , et al. Adverse events and their relation to mortality in out‐of‐hospital cardiac arrest patients treated with therapeutic hypothermia. Crit Care Med.39(1):57–64.
- , , , et al. Outcome, timing and adverse events in therapeutic hypothermia after out‐of‐hospital cardiac arrest. Acta Anaesthesiol Scand. 2009;53(7):926–934.
- . Clinical application of mild therapeutic hypothermia after cardiac arrest. Crit Care Med. 2007;35(4):1041–1047.
- , , , et al. Therapeutic hypothermia after out‐of‐hospital cardiac arrest: evaluation of a regional system to increase access to cooling. Circulation. 2011;124(2):206–214.
- American Hospital Association (AHA). American Hospital Association 2001 Annual Survey. Chicago, IL: Health Forum, LLC.
- , , . A multicenter study of the coding accuracy of hospital discharge administrative data for patients admitted to cardiac care units in Ontario. Am Heart J. 2002;144(2):290–296.
- . Accuracy of ICD‐9‐CM coding for the identification of patients with acute ischemic stroke: effect of modifier codes. Stroke. 1998;29(8):1602–1604.
- . Targeted temperature management for comatose survivors of cardiac arrest. N Engl J Med. 2010;363(13):1256–1264.
- , , , et al. A new method of classifying prognostic comorbidity in longitudinal studies: development and validation. J Chronic Dis. 1987;40(5):373–383.
- , , . Adapting a clinical comorbidity index for use with ICD‐9‐CM administrative databases. J Clin Epidemiol. 1992;45(6):613–619.
- , , . Adapting a clinical comorbidity index for use with ICD‐9‐CM administrative data: differing perspectives. J Clin Epidemiol. 1993;46(10):1075–1079; discussion 1081–1090.
- , , , et al. Practical implementation of therapeutic hypothermia after cardiac arrest. Hosp Pract (Minneap). 2009;37(1):71–83.
- . Paramedics will employ new therapy in cardiac arrest cases. New York Times. August 3, 2010:A18.
- , , , et al. Resuscitation center designation: recommendations for emergency medical services practices. Prehosp Emerg Care. 2010;14(1):51–61.
- , , , et al. Implementation of a hospital‐wide protocol for induced hypothermia following successfully resuscitated cardiac arrest. Crit Pathw Cardiol. 2010;9(4):216–220.
- , , , et al. Therapeutic hypothermia protocol in a community emergency department. West J Emerg Med. 2010;11(4):367–372.
- , , , et al. Implementation of a post‐cardiac arrest care bundle including therapeutic hypothermia and hemodynamic optimization in comatose patients with return of spontaneous circulation after out‐of‐hospital cardiac arrest: a feasibility study. Shock. 2011;35(4):360–366.
- , , , et al. Improved out‐of‐hospital cardiac arrest survival after the sequential implementation of 2005 AHA guidelines for compressions, ventilations, and induced hypothermia: the Wake County experience. Ann Emerg Med. 2010;56(4):348–357.
- , , , et al. Community‐based application of mild therapeutic hypothermia for survivors of cardiac arrest. South Med J. 2010;103(4):295–300.
- , , , et al. Hypothermia for neuroprotection in adults after cardiopulmonary resuscitation. Cochrane Database Syst Rev 2009(4):CD004128.
- , . Therapeutic hypothermia after cardiac arrest and myocardial infarction. Best Pract Res Clin Anaesthesiol. 2008;22(4):711–728.
- , , , et al. Cost‐effectiveness of therapeutic hypothermia after cardiac arrest. Circ Cardiovasc Qual Outcomes. 2009;2(5):421–428.
Copyright © 2012 Society of Hospital Medicine
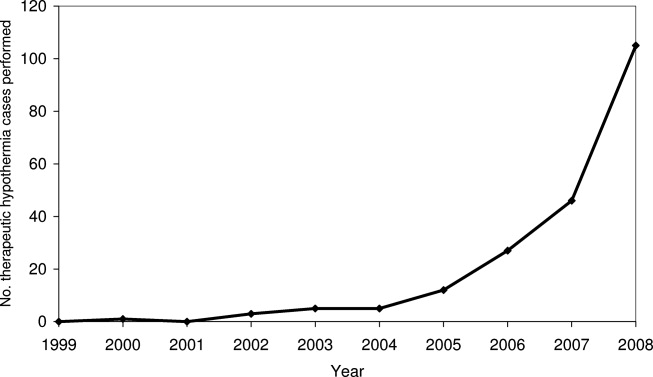
Rethinking Cardiac Risk Reduction
Noncardiac surgery is frequently associated with major adverse cardiac events. Prevention of these events has traditionally focused on risk estimation and targeted interventions prior to surgical intervention.1 Cardiac risk is assessed through clinical prediction rules, such as the revised cardiac risk index (RCRI) or the American Society of Anesthesiology (ASA) classification. In patients deemed to be at high risk of adverse cardiac events, discretionary preoperative testing, medical treatments, and interventions are implemented.2 However, even when executed optimally, this approach fails to protect all patients. Thus, many patients undergoing noncardiac surgery continue to experience perioperative myocardial infarction (MI) and death.3
Recently, a prospective international study involving 15,133 patients reported that cardiac troponin levels measured within 3 days of noncardiac surgery were strongly associated with 30‐day mortality.4 This study is but the latest in a series of investigations that have concluded that postoperative measurement of cardiac troponin is a better predictor of cardiac outcomes than preoperative‐risk algorithms.48 Intuitively, this link is not surprising. Surgery represents the ultimate physiologic stress test. In the setting of hemodynamic changes and sustained oxygen supply:demand mismatch, it is hardly shocking that those with significant epicardial coronary stenosis or major subendocardial ischemia suffer poorer outcomes. What is perhaps most important about the association between troponin release and clinical outcomes, however, is the foundation it provides for a novel framework to improve perioperative care: using troponin measurement to guide treatment and interventions in the postoperative setting.
MODEL TO IMPROVE POSTOPERATIVE CARDIAC OUTCOMES
We hypothesize that the postoperative period can be seized as a golden moment to ameliorate cardiac risk and improve clinical outcomes for 3 reasons. First, those who release cardiac troponin during surgery declare themselves as harboring myocardial territories in jeopardy. In effect, the peripheral presence of troponin amounts to a cry for help in a population where many cardiac events are silent and thus remain clinically unnoticed.9, 10 Routine postoperative monitoring for this biomarker can thus help identify a population that would ordinarily escape detection until the precipitation of a major clinical event. Second, as the pathophysiology of cardiac events centers around rupture of vulnerable plaque (type‐1 MI), supply:demand mismatch (type‐2 MI), or both of these phenomena, escalation or institution of important medical risk‐reducing treatments (such as aspirin, beta‐blockers, or statins), can be established to improve outcomes. The ability to initiate these treatments in a monitored setting may offset and address many of the risks feared with these therapies, including hypotension, stroke, or rhabdomyolysis. Third, as patients convalesce from surgery, timely and discretionary cardiac testing or interventions can be undertaken in those identified as being at elevated cardiovascular risk prior to discharge. In sum, the trifecta of clearly recognizing those at risk, instituting interventions in controlled settings, and performing well‐timed interventions could translate into greater odds of survival in this cohort.
Owing to their intimate involvement with patients in the perioperative setting, hospitalists are uniquely suited for implementing a troponin surveillance paradigm. Yet, how may such a schema be realized? In Figure 1, we outline a pathway with which to implement this approach. This model replicates perioperative management workflow, calling for 3 discrete interventionspreoperative assessment, perioperative surveillance, and postoperative risk stratification:
-
Preoperative assessment: Patients estimated to be at high risk of perioperative cardiac events (eg, RCRI 3) should undergo baseline, preoperative high‐sensitivity troponin measurement, as the frequency of major adverse cardiac outcomes is significant this group (11%).11 The importance of a baseline measurement of troponin cannot be overstated, as biologic variation of this marker can impact subsequent management.12, 13 Hospitalists can obtain these assays in preoperative clinics at the time of initial review and risk‐estimation.
-
Perioperative surveillance: Following the model implemented by a recent study, serial troponin surveillance should commence 612 hours after surgery, then daily on the first, second, and third day.4 As the optimal cardiac troponin threshold for the diagnosis of perioperative ischemia remains uncertain, doubling of baseline troponin levels may serve as a logical signal for further evaluation.14 The electrocardiographic pattern may be used as a branch point for immediate management at this stage: ST‐segment elevation MI may be treated aggressively with an early invasive strategy and cardiac catheterization when apropos (much as in the nonoperative context). However, as most perioperative cardiac events are non‐ST elevation MIs, treatment of this subset should center on initiation or escalation of medical therapy. Thus, achieving heart‐rate control in order to preserve coronary perfusion by careful titration of beta‐blockers, and initiation/up‐titration of statins to temper unstable atherosclerotic plaques represent cornerstones of this approach. Other potential therapeutic entities such as initiation of angiotensin‐converting‐enzyme (ACE)‐inhibitors in the context of left‐ventricular dysfunction, and/or antiplatelet agents such as aspirin, may also be relevant risk‐reducing tools.
-
Postoperative risk stratification: Prior to hospital discharge, objective assessment of myocardial perfusion and viability should occur in selected individuals with troponin elevations. Modalities that may be utilized in this context include either noninvasive imaging or occasional coronary angiography in patients with unstable coronary syndromes. Defining an optimal approach must be contextual, as interventions that may subsequently mandate uninterrupted antiplatelet treatment may be logistically challenging in this setting.
LIMITATIONS
Although this implementation model is plausible, it generates many questions that must be tested through the lens of a randomized controlled study. For instance, what is the optimal strategy for intervention in the postoperative setting? Though medical treatment with statins and beta‐blockade may represent the mainstay of treatment, are these therapies safe during potential clinical instability? Can net benefit be realized through judicious use of coronary angiography and revascularization? Can the artifact of heightened awareness and reporting of postoperative cardiac events mar the reported quality of a hospital? Finally, though cardiac troponin has been shown to be a strong and independent predictor of mortality, which troponin assay, reference range, and troponometric standard to use remain unclear.15 Whether or not these interventions translate into lesser mortality and improved clinical outcomes represents the raison d'etre for this experimental approach. As no alternative approach to define and target patients at high risk of adverse outcome after seemingly uneventful surgery currently exists, we believe that this hypothetical paradigm is worthy of further investigation.
CONCLUSION
For decades, perioperative practitioners have searched for a divining rod to reduce risk during surgery. While our efforts have been focused on the preoperative setting, the postoperative setting represents an as yet untapped and potentially profound period in the quest to improving surgical outcomes. Through our proximity to patients in the perioperative setting, hospitalists are ideal agents to test, deliver, and bring about this change. It is time for a postoperative carpe diem.
- , , , et al. Predictors of cardiac events after major vascular surgery: role of clinical characteristics, dobutamine echocardiography, and beta‐blocker therapy. JAMA. 2001;285(14):1865–1873.
- , , , et al. Combining clinical and thallium data optimizes preoperative assessment of cardiac risk before major vascular surgery. Ann Intern Med. 1989;110(11):859–866.
- , , , et al. An estimation of the global volume of surgery: a modelling strategy based on available data. Lancet. 2008;372(9633):139–144.
- VISION Study Investigators. Association between postoperative troponin levels and 30‐day mortlality among patients undergoing noncardiac surgery. JAMA. 2012;307(21):2295–2304.
- , , , et al. Postoperative levels of cardiac troponin versus CK‐MB and high‐sensitivity C‐reactive protein for the prediction of 1‐year cardiovascular outcome in patients undergoing vascular surgery. Coron Artery Dis. 2011;22(6):428–434.
- , , , et al. Peak postoperative troponin levels outperform preoperative cardiac risk indices as predictors of long‐term mortality after vascular surgery Troponins and postoperative outcomes. J Crit Care. 2012;27(1):66–72.
- , , , et al. Prognostic value of troponin and creatine kinase muscle and brain isoenzyme measurement after noncardiac surgery: a systematic review and meta‐analysis. Anesthesiology. 2011;114(4):796–806.
- , , . Outcomes in vascular surgical patients with isolated postoperative troponin leak: a meta‐analysis. Anaesthesia. 2011;66(7):604–610.
- , , , et al. Characteristics and short‐term prognosis of perioperative myocardial infarction in patients undergoing noncardiac surgery: a cohort study. Ann Intern Med. 2011;154(8):523–528.
- , , , , . Perioperative myocardial necrosis in patients at high cardiovascular risk undergoing elective non‐cardiac surgery. Heart. 2012;98(10):792–798.
- , , , et al. Derivation and prospective validation of a simple index for prediction of cardiac risk of major noncardiac surgery. Circulation. 1999;100(10):1043–1049.
- , , , , . Biologic variation of a novel cardiac troponin I assay. Clin Chem. 2011;57(7):1080–1081.
- , , , , . Short‐ and long‐term biological variation in cardiac troponin I measured with a high‐sensitivity assay: implications for clinical practice. Clin Chem. 2009;55(1):52–58.
- , , , et al. Relationship between perioperative troponin elevation and other indicators of myocardial injury in vascular surgery patients. Br J Anaesth. 2006;96(3):303–309.
- , , , et al. Which troponometric best predicts midterm outcome after coronary artery bypass graft surgery? Ann Thorac Surg. 2011;91(6):1860–1867.
Noncardiac surgery is frequently associated with major adverse cardiac events. Prevention of these events has traditionally focused on risk estimation and targeted interventions prior to surgical intervention.1 Cardiac risk is assessed through clinical prediction rules, such as the revised cardiac risk index (RCRI) or the American Society of Anesthesiology (ASA) classification. In patients deemed to be at high risk of adverse cardiac events, discretionary preoperative testing, medical treatments, and interventions are implemented.2 However, even when executed optimally, this approach fails to protect all patients. Thus, many patients undergoing noncardiac surgery continue to experience perioperative myocardial infarction (MI) and death.3
Recently, a prospective international study involving 15,133 patients reported that cardiac troponin levels measured within 3 days of noncardiac surgery were strongly associated with 30‐day mortality.4 This study is but the latest in a series of investigations that have concluded that postoperative measurement of cardiac troponin is a better predictor of cardiac outcomes than preoperative‐risk algorithms.48 Intuitively, this link is not surprising. Surgery represents the ultimate physiologic stress test. In the setting of hemodynamic changes and sustained oxygen supply:demand mismatch, it is hardly shocking that those with significant epicardial coronary stenosis or major subendocardial ischemia suffer poorer outcomes. What is perhaps most important about the association between troponin release and clinical outcomes, however, is the foundation it provides for a novel framework to improve perioperative care: using troponin measurement to guide treatment and interventions in the postoperative setting.
MODEL TO IMPROVE POSTOPERATIVE CARDIAC OUTCOMES
We hypothesize that the postoperative period can be seized as a golden moment to ameliorate cardiac risk and improve clinical outcomes for 3 reasons. First, those who release cardiac troponin during surgery declare themselves as harboring myocardial territories in jeopardy. In effect, the peripheral presence of troponin amounts to a cry for help in a population where many cardiac events are silent and thus remain clinically unnoticed.9, 10 Routine postoperative monitoring for this biomarker can thus help identify a population that would ordinarily escape detection until the precipitation of a major clinical event. Second, as the pathophysiology of cardiac events centers around rupture of vulnerable plaque (type‐1 MI), supply:demand mismatch (type‐2 MI), or both of these phenomena, escalation or institution of important medical risk‐reducing treatments (such as aspirin, beta‐blockers, or statins), can be established to improve outcomes. The ability to initiate these treatments in a monitored setting may offset and address many of the risks feared with these therapies, including hypotension, stroke, or rhabdomyolysis. Third, as patients convalesce from surgery, timely and discretionary cardiac testing or interventions can be undertaken in those identified as being at elevated cardiovascular risk prior to discharge. In sum, the trifecta of clearly recognizing those at risk, instituting interventions in controlled settings, and performing well‐timed interventions could translate into greater odds of survival in this cohort.
Owing to their intimate involvement with patients in the perioperative setting, hospitalists are uniquely suited for implementing a troponin surveillance paradigm. Yet, how may such a schema be realized? In Figure 1, we outline a pathway with which to implement this approach. This model replicates perioperative management workflow, calling for 3 discrete interventionspreoperative assessment, perioperative surveillance, and postoperative risk stratification:
-
Preoperative assessment: Patients estimated to be at high risk of perioperative cardiac events (eg, RCRI 3) should undergo baseline, preoperative high‐sensitivity troponin measurement, as the frequency of major adverse cardiac outcomes is significant this group (11%).11 The importance of a baseline measurement of troponin cannot be overstated, as biologic variation of this marker can impact subsequent management.12, 13 Hospitalists can obtain these assays in preoperative clinics at the time of initial review and risk‐estimation.
-
Perioperative surveillance: Following the model implemented by a recent study, serial troponin surveillance should commence 612 hours after surgery, then daily on the first, second, and third day.4 As the optimal cardiac troponin threshold for the diagnosis of perioperative ischemia remains uncertain, doubling of baseline troponin levels may serve as a logical signal for further evaluation.14 The electrocardiographic pattern may be used as a branch point for immediate management at this stage: ST‐segment elevation MI may be treated aggressively with an early invasive strategy and cardiac catheterization when apropos (much as in the nonoperative context). However, as most perioperative cardiac events are non‐ST elevation MIs, treatment of this subset should center on initiation or escalation of medical therapy. Thus, achieving heart‐rate control in order to preserve coronary perfusion by careful titration of beta‐blockers, and initiation/up‐titration of statins to temper unstable atherosclerotic plaques represent cornerstones of this approach. Other potential therapeutic entities such as initiation of angiotensin‐converting‐enzyme (ACE)‐inhibitors in the context of left‐ventricular dysfunction, and/or antiplatelet agents such as aspirin, may also be relevant risk‐reducing tools.
-
Postoperative risk stratification: Prior to hospital discharge, objective assessment of myocardial perfusion and viability should occur in selected individuals with troponin elevations. Modalities that may be utilized in this context include either noninvasive imaging or occasional coronary angiography in patients with unstable coronary syndromes. Defining an optimal approach must be contextual, as interventions that may subsequently mandate uninterrupted antiplatelet treatment may be logistically challenging in this setting.
LIMITATIONS
Although this implementation model is plausible, it generates many questions that must be tested through the lens of a randomized controlled study. For instance, what is the optimal strategy for intervention in the postoperative setting? Though medical treatment with statins and beta‐blockade may represent the mainstay of treatment, are these therapies safe during potential clinical instability? Can net benefit be realized through judicious use of coronary angiography and revascularization? Can the artifact of heightened awareness and reporting of postoperative cardiac events mar the reported quality of a hospital? Finally, though cardiac troponin has been shown to be a strong and independent predictor of mortality, which troponin assay, reference range, and troponometric standard to use remain unclear.15 Whether or not these interventions translate into lesser mortality and improved clinical outcomes represents the raison d'etre for this experimental approach. As no alternative approach to define and target patients at high risk of adverse outcome after seemingly uneventful surgery currently exists, we believe that this hypothetical paradigm is worthy of further investigation.
CONCLUSION
For decades, perioperative practitioners have searched for a divining rod to reduce risk during surgery. While our efforts have been focused on the preoperative setting, the postoperative setting represents an as yet untapped and potentially profound period in the quest to improving surgical outcomes. Through our proximity to patients in the perioperative setting, hospitalists are ideal agents to test, deliver, and bring about this change. It is time for a postoperative carpe diem.
Noncardiac surgery is frequently associated with major adverse cardiac events. Prevention of these events has traditionally focused on risk estimation and targeted interventions prior to surgical intervention.1 Cardiac risk is assessed through clinical prediction rules, such as the revised cardiac risk index (RCRI) or the American Society of Anesthesiology (ASA) classification. In patients deemed to be at high risk of adverse cardiac events, discretionary preoperative testing, medical treatments, and interventions are implemented.2 However, even when executed optimally, this approach fails to protect all patients. Thus, many patients undergoing noncardiac surgery continue to experience perioperative myocardial infarction (MI) and death.3
Recently, a prospective international study involving 15,133 patients reported that cardiac troponin levels measured within 3 days of noncardiac surgery were strongly associated with 30‐day mortality.4 This study is but the latest in a series of investigations that have concluded that postoperative measurement of cardiac troponin is a better predictor of cardiac outcomes than preoperative‐risk algorithms.48 Intuitively, this link is not surprising. Surgery represents the ultimate physiologic stress test. In the setting of hemodynamic changes and sustained oxygen supply:demand mismatch, it is hardly shocking that those with significant epicardial coronary stenosis or major subendocardial ischemia suffer poorer outcomes. What is perhaps most important about the association between troponin release and clinical outcomes, however, is the foundation it provides for a novel framework to improve perioperative care: using troponin measurement to guide treatment and interventions in the postoperative setting.
MODEL TO IMPROVE POSTOPERATIVE CARDIAC OUTCOMES
We hypothesize that the postoperative period can be seized as a golden moment to ameliorate cardiac risk and improve clinical outcomes for 3 reasons. First, those who release cardiac troponin during surgery declare themselves as harboring myocardial territories in jeopardy. In effect, the peripheral presence of troponin amounts to a cry for help in a population where many cardiac events are silent and thus remain clinically unnoticed.9, 10 Routine postoperative monitoring for this biomarker can thus help identify a population that would ordinarily escape detection until the precipitation of a major clinical event. Second, as the pathophysiology of cardiac events centers around rupture of vulnerable plaque (type‐1 MI), supply:demand mismatch (type‐2 MI), or both of these phenomena, escalation or institution of important medical risk‐reducing treatments (such as aspirin, beta‐blockers, or statins), can be established to improve outcomes. The ability to initiate these treatments in a monitored setting may offset and address many of the risks feared with these therapies, including hypotension, stroke, or rhabdomyolysis. Third, as patients convalesce from surgery, timely and discretionary cardiac testing or interventions can be undertaken in those identified as being at elevated cardiovascular risk prior to discharge. In sum, the trifecta of clearly recognizing those at risk, instituting interventions in controlled settings, and performing well‐timed interventions could translate into greater odds of survival in this cohort.
Owing to their intimate involvement with patients in the perioperative setting, hospitalists are uniquely suited for implementing a troponin surveillance paradigm. Yet, how may such a schema be realized? In Figure 1, we outline a pathway with which to implement this approach. This model replicates perioperative management workflow, calling for 3 discrete interventionspreoperative assessment, perioperative surveillance, and postoperative risk stratification:
-
Preoperative assessment: Patients estimated to be at high risk of perioperative cardiac events (eg, RCRI 3) should undergo baseline, preoperative high‐sensitivity troponin measurement, as the frequency of major adverse cardiac outcomes is significant this group (11%).11 The importance of a baseline measurement of troponin cannot be overstated, as biologic variation of this marker can impact subsequent management.12, 13 Hospitalists can obtain these assays in preoperative clinics at the time of initial review and risk‐estimation.
-
Perioperative surveillance: Following the model implemented by a recent study, serial troponin surveillance should commence 612 hours after surgery, then daily on the first, second, and third day.4 As the optimal cardiac troponin threshold for the diagnosis of perioperative ischemia remains uncertain, doubling of baseline troponin levels may serve as a logical signal for further evaluation.14 The electrocardiographic pattern may be used as a branch point for immediate management at this stage: ST‐segment elevation MI may be treated aggressively with an early invasive strategy and cardiac catheterization when apropos (much as in the nonoperative context). However, as most perioperative cardiac events are non‐ST elevation MIs, treatment of this subset should center on initiation or escalation of medical therapy. Thus, achieving heart‐rate control in order to preserve coronary perfusion by careful titration of beta‐blockers, and initiation/up‐titration of statins to temper unstable atherosclerotic plaques represent cornerstones of this approach. Other potential therapeutic entities such as initiation of angiotensin‐converting‐enzyme (ACE)‐inhibitors in the context of left‐ventricular dysfunction, and/or antiplatelet agents such as aspirin, may also be relevant risk‐reducing tools.
-
Postoperative risk stratification: Prior to hospital discharge, objective assessment of myocardial perfusion and viability should occur in selected individuals with troponin elevations. Modalities that may be utilized in this context include either noninvasive imaging or occasional coronary angiography in patients with unstable coronary syndromes. Defining an optimal approach must be contextual, as interventions that may subsequently mandate uninterrupted antiplatelet treatment may be logistically challenging in this setting.
LIMITATIONS
Although this implementation model is plausible, it generates many questions that must be tested through the lens of a randomized controlled study. For instance, what is the optimal strategy for intervention in the postoperative setting? Though medical treatment with statins and beta‐blockade may represent the mainstay of treatment, are these therapies safe during potential clinical instability? Can net benefit be realized through judicious use of coronary angiography and revascularization? Can the artifact of heightened awareness and reporting of postoperative cardiac events mar the reported quality of a hospital? Finally, though cardiac troponin has been shown to be a strong and independent predictor of mortality, which troponin assay, reference range, and troponometric standard to use remain unclear.15 Whether or not these interventions translate into lesser mortality and improved clinical outcomes represents the raison d'etre for this experimental approach. As no alternative approach to define and target patients at high risk of adverse outcome after seemingly uneventful surgery currently exists, we believe that this hypothetical paradigm is worthy of further investigation.
CONCLUSION
For decades, perioperative practitioners have searched for a divining rod to reduce risk during surgery. While our efforts have been focused on the preoperative setting, the postoperative setting represents an as yet untapped and potentially profound period in the quest to improving surgical outcomes. Through our proximity to patients in the perioperative setting, hospitalists are ideal agents to test, deliver, and bring about this change. It is time for a postoperative carpe diem.
- , , , et al. Predictors of cardiac events after major vascular surgery: role of clinical characteristics, dobutamine echocardiography, and beta‐blocker therapy. JAMA. 2001;285(14):1865–1873.
- , , , et al. Combining clinical and thallium data optimizes preoperative assessment of cardiac risk before major vascular surgery. Ann Intern Med. 1989;110(11):859–866.
- , , , et al. An estimation of the global volume of surgery: a modelling strategy based on available data. Lancet. 2008;372(9633):139–144.
- VISION Study Investigators. Association between postoperative troponin levels and 30‐day mortlality among patients undergoing noncardiac surgery. JAMA. 2012;307(21):2295–2304.
- , , , et al. Postoperative levels of cardiac troponin versus CK‐MB and high‐sensitivity C‐reactive protein for the prediction of 1‐year cardiovascular outcome in patients undergoing vascular surgery. Coron Artery Dis. 2011;22(6):428–434.
- , , , et al. Peak postoperative troponin levels outperform preoperative cardiac risk indices as predictors of long‐term mortality after vascular surgery Troponins and postoperative outcomes. J Crit Care. 2012;27(1):66–72.
- , , , et al. Prognostic value of troponin and creatine kinase muscle and brain isoenzyme measurement after noncardiac surgery: a systematic review and meta‐analysis. Anesthesiology. 2011;114(4):796–806.
- , , . Outcomes in vascular surgical patients with isolated postoperative troponin leak: a meta‐analysis. Anaesthesia. 2011;66(7):604–610.
- , , , et al. Characteristics and short‐term prognosis of perioperative myocardial infarction in patients undergoing noncardiac surgery: a cohort study. Ann Intern Med. 2011;154(8):523–528.
- , , , , . Perioperative myocardial necrosis in patients at high cardiovascular risk undergoing elective non‐cardiac surgery. Heart. 2012;98(10):792–798.
- , , , et al. Derivation and prospective validation of a simple index for prediction of cardiac risk of major noncardiac surgery. Circulation. 1999;100(10):1043–1049.
- , , , , . Biologic variation of a novel cardiac troponin I assay. Clin Chem. 2011;57(7):1080–1081.
- , , , , . Short‐ and long‐term biological variation in cardiac troponin I measured with a high‐sensitivity assay: implications for clinical practice. Clin Chem. 2009;55(1):52–58.
- , , , et al. Relationship between perioperative troponin elevation and other indicators of myocardial injury in vascular surgery patients. Br J Anaesth. 2006;96(3):303–309.
- , , , et al. Which troponometric best predicts midterm outcome after coronary artery bypass graft surgery? Ann Thorac Surg. 2011;91(6):1860–1867.
- , , , et al. Predictors of cardiac events after major vascular surgery: role of clinical characteristics, dobutamine echocardiography, and beta‐blocker therapy. JAMA. 2001;285(14):1865–1873.
- , , , et al. Combining clinical and thallium data optimizes preoperative assessment of cardiac risk before major vascular surgery. Ann Intern Med. 1989;110(11):859–866.
- , , , et al. An estimation of the global volume of surgery: a modelling strategy based on available data. Lancet. 2008;372(9633):139–144.
- VISION Study Investigators. Association between postoperative troponin levels and 30‐day mortlality among patients undergoing noncardiac surgery. JAMA. 2012;307(21):2295–2304.
- , , , et al. Postoperative levels of cardiac troponin versus CK‐MB and high‐sensitivity C‐reactive protein for the prediction of 1‐year cardiovascular outcome in patients undergoing vascular surgery. Coron Artery Dis. 2011;22(6):428–434.
- , , , et al. Peak postoperative troponin levels outperform preoperative cardiac risk indices as predictors of long‐term mortality after vascular surgery Troponins and postoperative outcomes. J Crit Care. 2012;27(1):66–72.
- , , , et al. Prognostic value of troponin and creatine kinase muscle and brain isoenzyme measurement after noncardiac surgery: a systematic review and meta‐analysis. Anesthesiology. 2011;114(4):796–806.
- , , . Outcomes in vascular surgical patients with isolated postoperative troponin leak: a meta‐analysis. Anaesthesia. 2011;66(7):604–610.
- , , , et al. Characteristics and short‐term prognosis of perioperative myocardial infarction in patients undergoing noncardiac surgery: a cohort study. Ann Intern Med. 2011;154(8):523–528.
- , , , , . Perioperative myocardial necrosis in patients at high cardiovascular risk undergoing elective non‐cardiac surgery. Heart. 2012;98(10):792–798.
- , , , et al. Derivation and prospective validation of a simple index for prediction of cardiac risk of major noncardiac surgery. Circulation. 1999;100(10):1043–1049.
- , , , , . Biologic variation of a novel cardiac troponin I assay. Clin Chem. 2011;57(7):1080–1081.
- , , , , . Short‐ and long‐term biological variation in cardiac troponin I measured with a high‐sensitivity assay: implications for clinical practice. Clin Chem. 2009;55(1):52–58.
- , , , et al. Relationship between perioperative troponin elevation and other indicators of myocardial injury in vascular surgery patients. Br J Anaesth. 2006;96(3):303–309.
- , , , et al. Which troponometric best predicts midterm outcome after coronary artery bypass graft surgery? Ann Thorac Surg. 2011;91(6):1860–1867.
Causes of Sudden Unexpected Death
The sudden unexpected death of a hospitalized patient is extremely distressing to the family and the healthcare team. It is also distressingly common. Over 200,000 treated cardiac arrests are estimated to occur each year in US hospital patients.1 Most of these patients die, and studies have shown that physicians often incorrectly diagnose the causes of death when autopsies are performed to determine the causes of death.2, 3 This study was undertaken to elucidate the causes of sudden unexpected death of adult hospital patients as determined by autopsy.
METHODS
One hundred seventy‐five consecutive cases with autopsies by the senior author (L.N.) of adult hospital patients in the University of Pittsburgh Medical Center (UPMC) Health System, who died within 1 hour after onset of symptoms and in which death was unexpected, were retrospectively analyzed. Patients under 18, or dead on arrival, or on comfort measures only, were excluded. The unexpectedness of the deaths in this series was determined by review of the medical record, usually confirmed by a pre‐autopsy discussion with a clinician (following UPMC policy), and by the fact that attempted resuscitation was carried out in all but a few cases. Patient age, sex, race, and causes of death were obtained from the autopsy report. The medical record was reviewed to determine if the patient was on cardiac monitoring at the time of death. The study was approved by the University of Pittsburgh Medical Center Committee for Oversight of Research Involving the Dead.
RESULTS
The 175 autopsies in this study included 98 male patients and 77 female patients. Their ages ranged from 19 to 95 years, with an average age of 63.8 years. Categorized by race, 139 were white, 34 black, 1 Hispanic, and 1 Filipino. The autopsies were done over a 14‐year period from 1992 to 2006, during which the autopsy rate gradually decreased from 19% to 8%. Seeking authorization for autopsy from family was the responsibility of clinicians.
The most common immediate cause of death was judged to be a cardiac arrhythmia, usually presumptive; this was the immediate cause of death in 58 (33.1%) cases, as shown in Table 1. Second most common was hemorrhage, which was the immediate cause of death in 38 (21.7%) cases, and third was pulmonary thromboembolism in 27 (15.4%) cases, as shown in Table 1. Other conditions judged to be the immediate cause of death were cardiogenic pulmonary edema/congestive heart failure in 13 cases (7.4%), sepsis in 11 cases (6.3%), pulmonary edema due to acute lung injury in 4 cases (3 with associated pneumonia), and acute respiratory failure due to pneumonia (in 3 cases), usual interstitial pneumonia (2), emphysema (1), chronic obstructive pulmonary disease (1), herpes simplex virus bronchitis (1), carbon dioxide narcosis (1), and undiagnosed massive metastatic pancreatic carcinoma infiltrating and pushing up the diaphragm (1). Miscellaneous other conditions judged to be the immediate cause of death were brain stem compression in 2 cases, aspiration in 2 cases, andin 1 case eachsubarachnoid hemorrhage, hemorrhagic cerebral infarction, fat embolism, amniotic fluid embolism, bilateral pneumothoraces, massive hemolysis, sickle cell vaso‐occlusive crisis, cardiopulmonary decompensation, cardiac tamponade (due to pericardial metastases), and shock and systemic inflammatory response syndrome (due to volvulus).
| Immediate Cause of Death | No. (n = 175) |
|---|---|
| Cardiac arrhythmia | 58 (33.1%) |
| With 75% coronary stenosis | 36 |
| With myocardial infarction | 31 |
| Remote | 23 |
| Acute or subacute | 13 |
| Hemorrhage | 38 (21.7%) |
| With endogenous coagulopathy | 13 |
| With oral or injected anticoagulation | 12 |
| With antiplatelet therapy | 6 |
| Site: Pericardial (tamponade) | 15 |
| Retroperitoneal | 6 |
| Airway | 4 |
| Gastrointestinal | 4 |
| Pleural space | 2 |
| Thoracoabdominal | 2 |
| Intra‐abdominal | 1 |
| Mediastinal | 1 |
| Nasopharyngeal | 1 |
| Retroperitoneal and pleural | 1 |
| Multi‐organ | 1 |
| Pulmonary thromboembolism | 27 (15.4%) |
The majority, 36 of the 58 patients (62%), with sudden death judged due to arrhythmias, had 75% or greater stenosis of 1 or more coronary arteries (average 2); 11 of these patients were on cardiac monitoring with their fatal arrhythmia displayed on the monitor, and 1 patient was wearing a Holter monitor at the time of her sudden death. The frequency of cardiac arrhythmia as a cause of sudden death did not change over the course of the 14 years of this study. Among the 31 of the 58 patients (53.4%) with histologically confirmed myocardial infarctions, 15 (25.9%) had a remote or subacute myocardial infarction without a history of myocardial infarction.
The most common underlying cause of death was severe coronary atherosclerosis, as shown in Table 2, but there were 14 patients whose underlying cause of death was a diverse group of other heart diseases. Five patients died postoperatively following heart surgery. One patient had a mitral valve papillary fibroelastoma, and another patient's arrhythmia was preceded by a right bundle branch block and a new first‐degree atrioventricular block attributable to mitral annular calcification. One patient with sickle cell disease had a myocardial bridge over a coronary artery. Three patients had heart transplants, 2 alcoholic cardiomyopathy, and 1 idiopathic dilated cardiomyopathy.
| Underlying Cause of Death | No. (%) n = 175 |
|---|---|
| Severe coronary atherosclerosis | 43 (24.6) |
| Neoplastic disease | 30 (17.1) |
| Various heart diseases (see text) | 14 (8.0) |
| Digestive system disorders | 14 (8.0) |
| Aortic aneurysm or dissection | 12 (6.9) |
| Chronic lung disease | 8 (4.6) |
| Infectious diseases | 7 (4.0) |
| Autoimmune diseases | 5 (2.9) |
| Diabetes mellitus | 4 (2.3) |
| Deep vein thrombosis | 3 (1.7) |
| Morbid obesity | 3 (1.7) |
| Other | 32 (18.3) |
The initial cardiac rhythm during attempted cardiopulmonary resuscitation was obtainable for 120 cases. As shown in Table 3, a higher proportion of patients judged to have died of arrhythmias had an initial rhythm of ventricular tachycardia or fibrillation than the proportion of those judged to have died of hemorrhage, pulmonary embolism, or other immediate causes of death.
| Immediate Cause of Death | Initial Cardiac Rhythm, No. (%) | ||||
|---|---|---|---|---|---|
| Ventricular Tachycardia/Fibrillation n = 28 | Bradycardia n = 33 | Pulseless Electrical Activity n = 21 | Asystole n = 31 | Total | |
| |||||
| Arrhythmia | 14 (50) | 6 (18) | 7 (33) | 16 (52) | 43 |
| Hemorrhage | 6 (21) | 10 (30) | 10 (48) | 6 (19) | 32 |
| Thromboembolism | 2 (7) | 8 (24) | 2 (10) | 2 (6) | 15* |
| Other | 6 (21) | 9 (27) | 2 (10) | 7 (23) | 30 |
DISCUSSION
The patients who had an initial cardiac rhythm of asystole during attempted resuscitation, and were judged to have died of an arrhythmia, most likely had ventricular tachycardia or some other arrhythmia before asystole. The majority of them were found in cardiac arrest at night, not on cardiac monitoring. In other studies, there has been an unexplained continuing decline in the prevalence of sudden cardiac arrest cases presenting with ventricular fibrillation and corresponding rise in the prevalence of pulseless electrical activity (PEA) arrests.4 The 7 patients who had an initial cardiac rhythm of PEA and were judged to have died of an arrhythmia were all, except 1, off cardiac monitoring. Four had myocardial infarctions, 3 heart block pre‐arrest, 1 postoperative intramyocardial hematoma, 1 myocardial metastatic melanoma, 1 acute heart transplant rejection, and 3 ventricular tachycardia or fibrillation following PEA, suggesting that PEA was a phase in the evolution of an arrhythmogenic death. The patients who had an initial cardiac rhythm of ventricular tachycardia or fibrillation, and were judged to have died of hemorrhage or pulmonary thromboembolism, generally had coronary artery disease. The hemorrhage or embolism presumably caused terminal myocardial ischemia, but the cardiac disease was judged to be a contributing cause of death, less important than the immediate cause.
The conclusion that a cardiac arrhythmia was the most common mechanism of death in this series fits with the conclusion that cardiac arrhythmias were the most common immediate cause of cardiac arrest, specifically of 49% of them, in a study of 14,720 cardiac arrests of adult inpatients.5 It is accepted by convention that the presence of 75% or greater cross‐sectional luminal narrowing of a coronary artery, even without thrombosis, can be a cause of sudden cardiac death.6 Cardiac arrhythmias commonly occur during myocardial ischemia prior to the irreversible necrosis of myocardial infarction.7 Fatal cardiac arrhythmias can also be caused by old myocardial infarctions.8 The finding that 15 of the patients in this study, 25.9% of the 58 whose sudden death was attributable to a cardiac arrhythmia, had a remote or subacute myocardial infarction without a history of myocardial infarction fits with evidence that 25%30% of myocardial infarctions are unrecognized.
Hemorrhage has been an underpublicized cause of unexpected sudden death in hospital patients. Intracranial hemorrhages, due to ruptured berry aneurysms, hypertension, tumors, or arteriovenous malformations, are well‐recognized causes of sudden death, but not specifically in hospital patients.9 In a Scottish series of 111 unexpected sudden deaths due to an acute abdomen in patients aged 70 or older, 24 died of acute gastrointestinal hemorrhage, but cases of ruptured abdominal aortic aneurysm were excluded from the study because they would have dominated the analysis.10 Retroperitoneal hemorrhage is a particularly insidious cause of sudden death. It commonly causes little or no pain, and proceeds asymptomatically until the patient reaches the limits of cardiopulmonary compensation, which can mask the hemodynamic effect of the bleeding until sudden death.
The limitations of this study include the presumptive nature of the arrhythmias in the majority of patients judged most likely to have died of arrhythmias, and a potential selection bias in the cases coming to autopsy. No data on the 81% to 92% of deaths not investigated by autopsy is available, so the possibility of some sort of selection bias in this case series cannot be excluded. The causes of death determined by autopsy also inevitably represent a judgment or opinion about causation (as opposed to mere correlation), just as the assessment of the causes of death without autopsy does, but autopsy adds the knowledge of conditions undiagnosed prior to death and the exclusion of some suspected diagnoses, substantially improving the unavoidably judgmental conclusion.
There are implications for preventing the sudden unexpected death of hospital patients from the results of this study. They suggest that more cardiac rhythm monitoring might be helpful.11 More prophylactic antiarrhythmic medication and automatic implanted cardiac defibrillators might also be helpful.12 Some UPMC intensivists believe that the sort of fatal arrhythmias seen in this study are caused by hypoxemia, which suggests that more pulse oximetry oxygen saturation monitoring might allow preventative intervention.13 More frequent and possibly automated monitoring of vital signs might provide early warning of hemorrhage or pulmonary embolization.14 Keeping a wide differential diagnosis is taught for resuscitation with an initial rhythm of PEA, but keeping a wide differential including hemorrhage in cases with other initial rhythms, especially bradycardia, for example, may be important. This study suggests the importance of keeping hemorrhage in the differential diagnosis of sudden unexpected cardiac arrest of hospital patients.
- , , , et al. Incidence of treated cardiac arrest in hospitalized patients in the United States. Crit Care Med. 2011;39:2401–2406.
- , , , . Discrepancies between clinical and autopsy diagnoses. A comparison of university, community and private autopsy practices. Am J Clin Pathol. 2008;129:102–109.
- , , , . The four horsemen: clinicopathological correlation in 407 hospital autopsies. Intern Med J. 2010;40:626–632.
- , , , et al. Factors associated with pulseless electric activity versus ventricular fibrillation: the Oregon sudden unexpected death study. Circulation. 2010;122(21):2116–2122.
- , , , et al. Cardiopulmonary resuscitation of adults in the hospital: a report of 14,720 cardiac arrests from the national registry of cardiopulmonary resuscitation. Resuscitation. 2003;58:297–308.
- , , . Coronary thrombosis: what's new? Pathol Case Rev. 2001;6:244–252.
- , , , . Myocardial ischemia and ventricular fibrillation: pathophysiology and clinical implications. Int J Cardiol. 2007;119:283–290.
- , , , . Sudden death in coronary artery disease: acute ischemia versus myocardial substrate. Circulation. 1997;96:3215–3223.
- , . Sudden unexplained death in adults. Curr Top Pathol. 2001;95:125–148.
- , , . Acute abdomen as a cause of death in sudden, unexpected deaths in the elderly. Scott Med J. 2006;52:20–23.
- . Survival after tachyarrhythmic arrest—what are we waiting for? N Engl J Med. 2008;358:77–79.
- , , , et al. Circumstances and outcomes of sudden unexpected death in patients with high‐risk myocardial infarction: implications for prevention. Circulation. 2011;123:2674–2680.
- , , , , , . Use of pulse oximetry to predict in‐hospital complications in normotensive patients with pulmonary embolism. Am J Med. 2003;115(3):203–208.
- , , , , , . Telemetry‐based vital sign monitoring for ambulatory hospital patients. Conf Proc IEEE Eng Med Biol Soc. 2009;2009:4650–4653.
The sudden unexpected death of a hospitalized patient is extremely distressing to the family and the healthcare team. It is also distressingly common. Over 200,000 treated cardiac arrests are estimated to occur each year in US hospital patients.1 Most of these patients die, and studies have shown that physicians often incorrectly diagnose the causes of death when autopsies are performed to determine the causes of death.2, 3 This study was undertaken to elucidate the causes of sudden unexpected death of adult hospital patients as determined by autopsy.
METHODS
One hundred seventy‐five consecutive cases with autopsies by the senior author (L.N.) of adult hospital patients in the University of Pittsburgh Medical Center (UPMC) Health System, who died within 1 hour after onset of symptoms and in which death was unexpected, were retrospectively analyzed. Patients under 18, or dead on arrival, or on comfort measures only, were excluded. The unexpectedness of the deaths in this series was determined by review of the medical record, usually confirmed by a pre‐autopsy discussion with a clinician (following UPMC policy), and by the fact that attempted resuscitation was carried out in all but a few cases. Patient age, sex, race, and causes of death were obtained from the autopsy report. The medical record was reviewed to determine if the patient was on cardiac monitoring at the time of death. The study was approved by the University of Pittsburgh Medical Center Committee for Oversight of Research Involving the Dead.
RESULTS
The 175 autopsies in this study included 98 male patients and 77 female patients. Their ages ranged from 19 to 95 years, with an average age of 63.8 years. Categorized by race, 139 were white, 34 black, 1 Hispanic, and 1 Filipino. The autopsies were done over a 14‐year period from 1992 to 2006, during which the autopsy rate gradually decreased from 19% to 8%. Seeking authorization for autopsy from family was the responsibility of clinicians.
The most common immediate cause of death was judged to be a cardiac arrhythmia, usually presumptive; this was the immediate cause of death in 58 (33.1%) cases, as shown in Table 1. Second most common was hemorrhage, which was the immediate cause of death in 38 (21.7%) cases, and third was pulmonary thromboembolism in 27 (15.4%) cases, as shown in Table 1. Other conditions judged to be the immediate cause of death were cardiogenic pulmonary edema/congestive heart failure in 13 cases (7.4%), sepsis in 11 cases (6.3%), pulmonary edema due to acute lung injury in 4 cases (3 with associated pneumonia), and acute respiratory failure due to pneumonia (in 3 cases), usual interstitial pneumonia (2), emphysema (1), chronic obstructive pulmonary disease (1), herpes simplex virus bronchitis (1), carbon dioxide narcosis (1), and undiagnosed massive metastatic pancreatic carcinoma infiltrating and pushing up the diaphragm (1). Miscellaneous other conditions judged to be the immediate cause of death were brain stem compression in 2 cases, aspiration in 2 cases, andin 1 case eachsubarachnoid hemorrhage, hemorrhagic cerebral infarction, fat embolism, amniotic fluid embolism, bilateral pneumothoraces, massive hemolysis, sickle cell vaso‐occlusive crisis, cardiopulmonary decompensation, cardiac tamponade (due to pericardial metastases), and shock and systemic inflammatory response syndrome (due to volvulus).
| Immediate Cause of Death | No. (n = 175) |
|---|---|
| Cardiac arrhythmia | 58 (33.1%) |
| With 75% coronary stenosis | 36 |
| With myocardial infarction | 31 |
| Remote | 23 |
| Acute or subacute | 13 |
| Hemorrhage | 38 (21.7%) |
| With endogenous coagulopathy | 13 |
| With oral or injected anticoagulation | 12 |
| With antiplatelet therapy | 6 |
| Site: Pericardial (tamponade) | 15 |
| Retroperitoneal | 6 |
| Airway | 4 |
| Gastrointestinal | 4 |
| Pleural space | 2 |
| Thoracoabdominal | 2 |
| Intra‐abdominal | 1 |
| Mediastinal | 1 |
| Nasopharyngeal | 1 |
| Retroperitoneal and pleural | 1 |
| Multi‐organ | 1 |
| Pulmonary thromboembolism | 27 (15.4%) |
The majority, 36 of the 58 patients (62%), with sudden death judged due to arrhythmias, had 75% or greater stenosis of 1 or more coronary arteries (average 2); 11 of these patients were on cardiac monitoring with their fatal arrhythmia displayed on the monitor, and 1 patient was wearing a Holter monitor at the time of her sudden death. The frequency of cardiac arrhythmia as a cause of sudden death did not change over the course of the 14 years of this study. Among the 31 of the 58 patients (53.4%) with histologically confirmed myocardial infarctions, 15 (25.9%) had a remote or subacute myocardial infarction without a history of myocardial infarction.
The most common underlying cause of death was severe coronary atherosclerosis, as shown in Table 2, but there were 14 patients whose underlying cause of death was a diverse group of other heart diseases. Five patients died postoperatively following heart surgery. One patient had a mitral valve papillary fibroelastoma, and another patient's arrhythmia was preceded by a right bundle branch block and a new first‐degree atrioventricular block attributable to mitral annular calcification. One patient with sickle cell disease had a myocardial bridge over a coronary artery. Three patients had heart transplants, 2 alcoholic cardiomyopathy, and 1 idiopathic dilated cardiomyopathy.
| Underlying Cause of Death | No. (%) n = 175 |
|---|---|
| Severe coronary atherosclerosis | 43 (24.6) |
| Neoplastic disease | 30 (17.1) |
| Various heart diseases (see text) | 14 (8.0) |
| Digestive system disorders | 14 (8.0) |
| Aortic aneurysm or dissection | 12 (6.9) |
| Chronic lung disease | 8 (4.6) |
| Infectious diseases | 7 (4.0) |
| Autoimmune diseases | 5 (2.9) |
| Diabetes mellitus | 4 (2.3) |
| Deep vein thrombosis | 3 (1.7) |
| Morbid obesity | 3 (1.7) |
| Other | 32 (18.3) |
The initial cardiac rhythm during attempted cardiopulmonary resuscitation was obtainable for 120 cases. As shown in Table 3, a higher proportion of patients judged to have died of arrhythmias had an initial rhythm of ventricular tachycardia or fibrillation than the proportion of those judged to have died of hemorrhage, pulmonary embolism, or other immediate causes of death.
| Immediate Cause of Death | Initial Cardiac Rhythm, No. (%) | ||||
|---|---|---|---|---|---|
| Ventricular Tachycardia/Fibrillation n = 28 | Bradycardia n = 33 | Pulseless Electrical Activity n = 21 | Asystole n = 31 | Total | |
| |||||
| Arrhythmia | 14 (50) | 6 (18) | 7 (33) | 16 (52) | 43 |
| Hemorrhage | 6 (21) | 10 (30) | 10 (48) | 6 (19) | 32 |
| Thromboembolism | 2 (7) | 8 (24) | 2 (10) | 2 (6) | 15* |
| Other | 6 (21) | 9 (27) | 2 (10) | 7 (23) | 30 |
DISCUSSION
The patients who had an initial cardiac rhythm of asystole during attempted resuscitation, and were judged to have died of an arrhythmia, most likely had ventricular tachycardia or some other arrhythmia before asystole. The majority of them were found in cardiac arrest at night, not on cardiac monitoring. In other studies, there has been an unexplained continuing decline in the prevalence of sudden cardiac arrest cases presenting with ventricular fibrillation and corresponding rise in the prevalence of pulseless electrical activity (PEA) arrests.4 The 7 patients who had an initial cardiac rhythm of PEA and were judged to have died of an arrhythmia were all, except 1, off cardiac monitoring. Four had myocardial infarctions, 3 heart block pre‐arrest, 1 postoperative intramyocardial hematoma, 1 myocardial metastatic melanoma, 1 acute heart transplant rejection, and 3 ventricular tachycardia or fibrillation following PEA, suggesting that PEA was a phase in the evolution of an arrhythmogenic death. The patients who had an initial cardiac rhythm of ventricular tachycardia or fibrillation, and were judged to have died of hemorrhage or pulmonary thromboembolism, generally had coronary artery disease. The hemorrhage or embolism presumably caused terminal myocardial ischemia, but the cardiac disease was judged to be a contributing cause of death, less important than the immediate cause.
The conclusion that a cardiac arrhythmia was the most common mechanism of death in this series fits with the conclusion that cardiac arrhythmias were the most common immediate cause of cardiac arrest, specifically of 49% of them, in a study of 14,720 cardiac arrests of adult inpatients.5 It is accepted by convention that the presence of 75% or greater cross‐sectional luminal narrowing of a coronary artery, even without thrombosis, can be a cause of sudden cardiac death.6 Cardiac arrhythmias commonly occur during myocardial ischemia prior to the irreversible necrosis of myocardial infarction.7 Fatal cardiac arrhythmias can also be caused by old myocardial infarctions.8 The finding that 15 of the patients in this study, 25.9% of the 58 whose sudden death was attributable to a cardiac arrhythmia, had a remote or subacute myocardial infarction without a history of myocardial infarction fits with evidence that 25%30% of myocardial infarctions are unrecognized.
Hemorrhage has been an underpublicized cause of unexpected sudden death in hospital patients. Intracranial hemorrhages, due to ruptured berry aneurysms, hypertension, tumors, or arteriovenous malformations, are well‐recognized causes of sudden death, but not specifically in hospital patients.9 In a Scottish series of 111 unexpected sudden deaths due to an acute abdomen in patients aged 70 or older, 24 died of acute gastrointestinal hemorrhage, but cases of ruptured abdominal aortic aneurysm were excluded from the study because they would have dominated the analysis.10 Retroperitoneal hemorrhage is a particularly insidious cause of sudden death. It commonly causes little or no pain, and proceeds asymptomatically until the patient reaches the limits of cardiopulmonary compensation, which can mask the hemodynamic effect of the bleeding until sudden death.
The limitations of this study include the presumptive nature of the arrhythmias in the majority of patients judged most likely to have died of arrhythmias, and a potential selection bias in the cases coming to autopsy. No data on the 81% to 92% of deaths not investigated by autopsy is available, so the possibility of some sort of selection bias in this case series cannot be excluded. The causes of death determined by autopsy also inevitably represent a judgment or opinion about causation (as opposed to mere correlation), just as the assessment of the causes of death without autopsy does, but autopsy adds the knowledge of conditions undiagnosed prior to death and the exclusion of some suspected diagnoses, substantially improving the unavoidably judgmental conclusion.
There are implications for preventing the sudden unexpected death of hospital patients from the results of this study. They suggest that more cardiac rhythm monitoring might be helpful.11 More prophylactic antiarrhythmic medication and automatic implanted cardiac defibrillators might also be helpful.12 Some UPMC intensivists believe that the sort of fatal arrhythmias seen in this study are caused by hypoxemia, which suggests that more pulse oximetry oxygen saturation monitoring might allow preventative intervention.13 More frequent and possibly automated monitoring of vital signs might provide early warning of hemorrhage or pulmonary embolization.14 Keeping a wide differential diagnosis is taught for resuscitation with an initial rhythm of PEA, but keeping a wide differential including hemorrhage in cases with other initial rhythms, especially bradycardia, for example, may be important. This study suggests the importance of keeping hemorrhage in the differential diagnosis of sudden unexpected cardiac arrest of hospital patients.
The sudden unexpected death of a hospitalized patient is extremely distressing to the family and the healthcare team. It is also distressingly common. Over 200,000 treated cardiac arrests are estimated to occur each year in US hospital patients.1 Most of these patients die, and studies have shown that physicians often incorrectly diagnose the causes of death when autopsies are performed to determine the causes of death.2, 3 This study was undertaken to elucidate the causes of sudden unexpected death of adult hospital patients as determined by autopsy.
METHODS
One hundred seventy‐five consecutive cases with autopsies by the senior author (L.N.) of adult hospital patients in the University of Pittsburgh Medical Center (UPMC) Health System, who died within 1 hour after onset of symptoms and in which death was unexpected, were retrospectively analyzed. Patients under 18, or dead on arrival, or on comfort measures only, were excluded. The unexpectedness of the deaths in this series was determined by review of the medical record, usually confirmed by a pre‐autopsy discussion with a clinician (following UPMC policy), and by the fact that attempted resuscitation was carried out in all but a few cases. Patient age, sex, race, and causes of death were obtained from the autopsy report. The medical record was reviewed to determine if the patient was on cardiac monitoring at the time of death. The study was approved by the University of Pittsburgh Medical Center Committee for Oversight of Research Involving the Dead.
RESULTS
The 175 autopsies in this study included 98 male patients and 77 female patients. Their ages ranged from 19 to 95 years, with an average age of 63.8 years. Categorized by race, 139 were white, 34 black, 1 Hispanic, and 1 Filipino. The autopsies were done over a 14‐year period from 1992 to 2006, during which the autopsy rate gradually decreased from 19% to 8%. Seeking authorization for autopsy from family was the responsibility of clinicians.
The most common immediate cause of death was judged to be a cardiac arrhythmia, usually presumptive; this was the immediate cause of death in 58 (33.1%) cases, as shown in Table 1. Second most common was hemorrhage, which was the immediate cause of death in 38 (21.7%) cases, and third was pulmonary thromboembolism in 27 (15.4%) cases, as shown in Table 1. Other conditions judged to be the immediate cause of death were cardiogenic pulmonary edema/congestive heart failure in 13 cases (7.4%), sepsis in 11 cases (6.3%), pulmonary edema due to acute lung injury in 4 cases (3 with associated pneumonia), and acute respiratory failure due to pneumonia (in 3 cases), usual interstitial pneumonia (2), emphysema (1), chronic obstructive pulmonary disease (1), herpes simplex virus bronchitis (1), carbon dioxide narcosis (1), and undiagnosed massive metastatic pancreatic carcinoma infiltrating and pushing up the diaphragm (1). Miscellaneous other conditions judged to be the immediate cause of death were brain stem compression in 2 cases, aspiration in 2 cases, andin 1 case eachsubarachnoid hemorrhage, hemorrhagic cerebral infarction, fat embolism, amniotic fluid embolism, bilateral pneumothoraces, massive hemolysis, sickle cell vaso‐occlusive crisis, cardiopulmonary decompensation, cardiac tamponade (due to pericardial metastases), and shock and systemic inflammatory response syndrome (due to volvulus).
| Immediate Cause of Death | No. (n = 175) |
|---|---|
| Cardiac arrhythmia | 58 (33.1%) |
| With 75% coronary stenosis | 36 |
| With myocardial infarction | 31 |
| Remote | 23 |
| Acute or subacute | 13 |
| Hemorrhage | 38 (21.7%) |
| With endogenous coagulopathy | 13 |
| With oral or injected anticoagulation | 12 |
| With antiplatelet therapy | 6 |
| Site: Pericardial (tamponade) | 15 |
| Retroperitoneal | 6 |
| Airway | 4 |
| Gastrointestinal | 4 |
| Pleural space | 2 |
| Thoracoabdominal | 2 |
| Intra‐abdominal | 1 |
| Mediastinal | 1 |
| Nasopharyngeal | 1 |
| Retroperitoneal and pleural | 1 |
| Multi‐organ | 1 |
| Pulmonary thromboembolism | 27 (15.4%) |
The majority, 36 of the 58 patients (62%), with sudden death judged due to arrhythmias, had 75% or greater stenosis of 1 or more coronary arteries (average 2); 11 of these patients were on cardiac monitoring with their fatal arrhythmia displayed on the monitor, and 1 patient was wearing a Holter monitor at the time of her sudden death. The frequency of cardiac arrhythmia as a cause of sudden death did not change over the course of the 14 years of this study. Among the 31 of the 58 patients (53.4%) with histologically confirmed myocardial infarctions, 15 (25.9%) had a remote or subacute myocardial infarction without a history of myocardial infarction.
The most common underlying cause of death was severe coronary atherosclerosis, as shown in Table 2, but there were 14 patients whose underlying cause of death was a diverse group of other heart diseases. Five patients died postoperatively following heart surgery. One patient had a mitral valve papillary fibroelastoma, and another patient's arrhythmia was preceded by a right bundle branch block and a new first‐degree atrioventricular block attributable to mitral annular calcification. One patient with sickle cell disease had a myocardial bridge over a coronary artery. Three patients had heart transplants, 2 alcoholic cardiomyopathy, and 1 idiopathic dilated cardiomyopathy.
| Underlying Cause of Death | No. (%) n = 175 |
|---|---|
| Severe coronary atherosclerosis | 43 (24.6) |
| Neoplastic disease | 30 (17.1) |
| Various heart diseases (see text) | 14 (8.0) |
| Digestive system disorders | 14 (8.0) |
| Aortic aneurysm or dissection | 12 (6.9) |
| Chronic lung disease | 8 (4.6) |
| Infectious diseases | 7 (4.0) |
| Autoimmune diseases | 5 (2.9) |
| Diabetes mellitus | 4 (2.3) |
| Deep vein thrombosis | 3 (1.7) |
| Morbid obesity | 3 (1.7) |
| Other | 32 (18.3) |
The initial cardiac rhythm during attempted cardiopulmonary resuscitation was obtainable for 120 cases. As shown in Table 3, a higher proportion of patients judged to have died of arrhythmias had an initial rhythm of ventricular tachycardia or fibrillation than the proportion of those judged to have died of hemorrhage, pulmonary embolism, or other immediate causes of death.
| Immediate Cause of Death | Initial Cardiac Rhythm, No. (%) | ||||
|---|---|---|---|---|---|
| Ventricular Tachycardia/Fibrillation n = 28 | Bradycardia n = 33 | Pulseless Electrical Activity n = 21 | Asystole n = 31 | Total | |
| |||||
| Arrhythmia | 14 (50) | 6 (18) | 7 (33) | 16 (52) | 43 |
| Hemorrhage | 6 (21) | 10 (30) | 10 (48) | 6 (19) | 32 |
| Thromboembolism | 2 (7) | 8 (24) | 2 (10) | 2 (6) | 15* |
| Other | 6 (21) | 9 (27) | 2 (10) | 7 (23) | 30 |
DISCUSSION
The patients who had an initial cardiac rhythm of asystole during attempted resuscitation, and were judged to have died of an arrhythmia, most likely had ventricular tachycardia or some other arrhythmia before asystole. The majority of them were found in cardiac arrest at night, not on cardiac monitoring. In other studies, there has been an unexplained continuing decline in the prevalence of sudden cardiac arrest cases presenting with ventricular fibrillation and corresponding rise in the prevalence of pulseless electrical activity (PEA) arrests.4 The 7 patients who had an initial cardiac rhythm of PEA and were judged to have died of an arrhythmia were all, except 1, off cardiac monitoring. Four had myocardial infarctions, 3 heart block pre‐arrest, 1 postoperative intramyocardial hematoma, 1 myocardial metastatic melanoma, 1 acute heart transplant rejection, and 3 ventricular tachycardia or fibrillation following PEA, suggesting that PEA was a phase in the evolution of an arrhythmogenic death. The patients who had an initial cardiac rhythm of ventricular tachycardia or fibrillation, and were judged to have died of hemorrhage or pulmonary thromboembolism, generally had coronary artery disease. The hemorrhage or embolism presumably caused terminal myocardial ischemia, but the cardiac disease was judged to be a contributing cause of death, less important than the immediate cause.
The conclusion that a cardiac arrhythmia was the most common mechanism of death in this series fits with the conclusion that cardiac arrhythmias were the most common immediate cause of cardiac arrest, specifically of 49% of them, in a study of 14,720 cardiac arrests of adult inpatients.5 It is accepted by convention that the presence of 75% or greater cross‐sectional luminal narrowing of a coronary artery, even without thrombosis, can be a cause of sudden cardiac death.6 Cardiac arrhythmias commonly occur during myocardial ischemia prior to the irreversible necrosis of myocardial infarction.7 Fatal cardiac arrhythmias can also be caused by old myocardial infarctions.8 The finding that 15 of the patients in this study, 25.9% of the 58 whose sudden death was attributable to a cardiac arrhythmia, had a remote or subacute myocardial infarction without a history of myocardial infarction fits with evidence that 25%30% of myocardial infarctions are unrecognized.
Hemorrhage has been an underpublicized cause of unexpected sudden death in hospital patients. Intracranial hemorrhages, due to ruptured berry aneurysms, hypertension, tumors, or arteriovenous malformations, are well‐recognized causes of sudden death, but not specifically in hospital patients.9 In a Scottish series of 111 unexpected sudden deaths due to an acute abdomen in patients aged 70 or older, 24 died of acute gastrointestinal hemorrhage, but cases of ruptured abdominal aortic aneurysm were excluded from the study because they would have dominated the analysis.10 Retroperitoneal hemorrhage is a particularly insidious cause of sudden death. It commonly causes little or no pain, and proceeds asymptomatically until the patient reaches the limits of cardiopulmonary compensation, which can mask the hemodynamic effect of the bleeding until sudden death.
The limitations of this study include the presumptive nature of the arrhythmias in the majority of patients judged most likely to have died of arrhythmias, and a potential selection bias in the cases coming to autopsy. No data on the 81% to 92% of deaths not investigated by autopsy is available, so the possibility of some sort of selection bias in this case series cannot be excluded. The causes of death determined by autopsy also inevitably represent a judgment or opinion about causation (as opposed to mere correlation), just as the assessment of the causes of death without autopsy does, but autopsy adds the knowledge of conditions undiagnosed prior to death and the exclusion of some suspected diagnoses, substantially improving the unavoidably judgmental conclusion.
There are implications for preventing the sudden unexpected death of hospital patients from the results of this study. They suggest that more cardiac rhythm monitoring might be helpful.11 More prophylactic antiarrhythmic medication and automatic implanted cardiac defibrillators might also be helpful.12 Some UPMC intensivists believe that the sort of fatal arrhythmias seen in this study are caused by hypoxemia, which suggests that more pulse oximetry oxygen saturation monitoring might allow preventative intervention.13 More frequent and possibly automated monitoring of vital signs might provide early warning of hemorrhage or pulmonary embolization.14 Keeping a wide differential diagnosis is taught for resuscitation with an initial rhythm of PEA, but keeping a wide differential including hemorrhage in cases with other initial rhythms, especially bradycardia, for example, may be important. This study suggests the importance of keeping hemorrhage in the differential diagnosis of sudden unexpected cardiac arrest of hospital patients.
- , , , et al. Incidence of treated cardiac arrest in hospitalized patients in the United States. Crit Care Med. 2011;39:2401–2406.
- , , , . Discrepancies between clinical and autopsy diagnoses. A comparison of university, community and private autopsy practices. Am J Clin Pathol. 2008;129:102–109.
- , , , . The four horsemen: clinicopathological correlation in 407 hospital autopsies. Intern Med J. 2010;40:626–632.
- , , , et al. Factors associated with pulseless electric activity versus ventricular fibrillation: the Oregon sudden unexpected death study. Circulation. 2010;122(21):2116–2122.
- , , , et al. Cardiopulmonary resuscitation of adults in the hospital: a report of 14,720 cardiac arrests from the national registry of cardiopulmonary resuscitation. Resuscitation. 2003;58:297–308.
- , , . Coronary thrombosis: what's new? Pathol Case Rev. 2001;6:244–252.
- , , , . Myocardial ischemia and ventricular fibrillation: pathophysiology and clinical implications. Int J Cardiol. 2007;119:283–290.
- , , , . Sudden death in coronary artery disease: acute ischemia versus myocardial substrate. Circulation. 1997;96:3215–3223.
- , . Sudden unexplained death in adults. Curr Top Pathol. 2001;95:125–148.
- , , . Acute abdomen as a cause of death in sudden, unexpected deaths in the elderly. Scott Med J. 2006;52:20–23.
- . Survival after tachyarrhythmic arrest—what are we waiting for? N Engl J Med. 2008;358:77–79.
- , , , et al. Circumstances and outcomes of sudden unexpected death in patients with high‐risk myocardial infarction: implications for prevention. Circulation. 2011;123:2674–2680.
- , , , , , . Use of pulse oximetry to predict in‐hospital complications in normotensive patients with pulmonary embolism. Am J Med. 2003;115(3):203–208.
- , , , , , . Telemetry‐based vital sign monitoring for ambulatory hospital patients. Conf Proc IEEE Eng Med Biol Soc. 2009;2009:4650–4653.
- , , , et al. Incidence of treated cardiac arrest in hospitalized patients in the United States. Crit Care Med. 2011;39:2401–2406.
- , , , . Discrepancies between clinical and autopsy diagnoses. A comparison of university, community and private autopsy practices. Am J Clin Pathol. 2008;129:102–109.
- , , , . The four horsemen: clinicopathological correlation in 407 hospital autopsies. Intern Med J. 2010;40:626–632.
- , , , et al. Factors associated with pulseless electric activity versus ventricular fibrillation: the Oregon sudden unexpected death study. Circulation. 2010;122(21):2116–2122.
- , , , et al. Cardiopulmonary resuscitation of adults in the hospital: a report of 14,720 cardiac arrests from the national registry of cardiopulmonary resuscitation. Resuscitation. 2003;58:297–308.
- , , . Coronary thrombosis: what's new? Pathol Case Rev. 2001;6:244–252.
- , , , . Myocardial ischemia and ventricular fibrillation: pathophysiology and clinical implications. Int J Cardiol. 2007;119:283–290.
- , , , . Sudden death in coronary artery disease: acute ischemia versus myocardial substrate. Circulation. 1997;96:3215–3223.
- , . Sudden unexplained death in adults. Curr Top Pathol. 2001;95:125–148.
- , , . Acute abdomen as a cause of death in sudden, unexpected deaths in the elderly. Scott Med J. 2006;52:20–23.
- . Survival after tachyarrhythmic arrest—what are we waiting for? N Engl J Med. 2008;358:77–79.
- , , , et al. Circumstances and outcomes of sudden unexpected death in patients with high‐risk myocardial infarction: implications for prevention. Circulation. 2011;123:2674–2680.
- , , , , , . Use of pulse oximetry to predict in‐hospital complications in normotensive patients with pulmonary embolism. Am J Med. 2003;115(3):203–208.
- , , , , , . Telemetry‐based vital sign monitoring for ambulatory hospital patients. Conf Proc IEEE Eng Med Biol Soc. 2009;2009:4650–4653.
Prediction Rule of Bacteremia
Fever is a nonspecific phenomenon that can result from many inciting causes such as infection, inflammation, malignancy, thromboembolic disease, drugs, and endocrine disease. In hospitalized patients, one of the most important clinical considerations is bacteremia. Although vital signs compose 3 of the 4 current criteria for the diagnosis of Systemic Inflammatory Response Syndrome (SIRS),1, 2 they contribute little to the diagnosis of the cause, which can be inflammation or infection. Unfortunately, the physician's clinical diagnosis of bacteremia lacks both sensitivity and specificity.35 Blood culture acquisition is a simple and basic diagnostic procedure routinely used in clinical practice that yields essential information for the evaluation of various infectious diseases.6 Positive blood cultures can demonstrate not only an infectious cause of disease but also the microbiological response to antibiotic therapy.7 However, studies have reported that 35% to 50% of positive blood cultures are falsely positive owing to contamination.711 False‐positive cultures may lead to the use of inappropriate or unnecessary antibiotics, additional testing and consultation, and prolonged hospitalizations that increase patient care costs.9, 12
Nursing staff caring for patients are generally able to assess oral intake, general clinical state, and care requirements. Moreover, the nursing staff are often able to identify problems with patients before physicians.13 In Japan, nurse‐assessed food consumption of every meal is standardized, and is frequently regarded as an indicator of the patient's clinical status, akin to a vital sign. In this context, we hypothesized that quantitative variations in food consumption could accurately distinguish those patients with or without bacteremia.
MATERIALS AND METHODS
Study Design
Between 2005 and 2009, we conducted a cross‐sectional observational study at Juntendo University Nerima Hospital in Tokyo, Japan. We evaluated 1179 consecutive Japanese patients (mean age, 67.8 16.8 years; 51% male) who underwent blood cultures. Patients with anorexia‐inducing conditions, such as gastrointestinal disease and those who were receiving chemotherapy for malignancy, were excluded. We also excluded patients who were not allowed to eat a regular diet. Patients aged <6 years old were also excluded. The indication for blood culture acquisition was at the discretion of the treating physicians. In general, when an axillary temperature >37.538C developed, blood cultures were taken. The study was approved by the ethics committee of Juntendo University Nerima Hospital, and was conducted in accordance with the Helsinki Declaration of 1971, as revised in 1983.
Definition of Bacteremia
In this study, bacteremia was defined as follows:
Identical organisms isolated from 2 sets of blood cultures (a set refers to 1 aerobic bottle and 1 anaerobic bottle).
If only 1 set of blood cultures was acquired and was positive for a pathogenic organism (such as enteric Gram‐negative bacilli or Streptococcus pneumonia) that could account for the clinical presentation, then the culture was considered positive.7, 14, 15
Definition of Contamination
We considered as contaminants organisms common to skin flora, including Bacillus species, coagulase‐negative staphylococci, Corynebacterium species, and Micrococcus species, without isolation of an identical organism with the same antibiotic susceptibilities from another potentially infected site in a patient with incompatible clinical features and no attributable risks.16 Single blood cultures positive for organisms thought unlikely to explain the patient's symptoms were also considered contaminants.
Assessment of Food Consumption and Inter‐Assessor Reliability
Nursing staff assessed the patients' food consumption by estimating the percentage intake at each meal, and we characterized the patients' oral intake based on the meal immediately prior to the blood culture. We categorized the patients into 3 groups: low food consumption group (<50% consumed), moderate food consumption group (>50% to <80% consumed), and high food consumption group (>80% food consumed). To assess the reliability of the evaluations of food consumption, 100 patients (separate from this main study) were selected randomly and evaluated independently by 2 nurses. The kappa score of agreement between the nurses was 0.79 (95% confidence interval [CI], 0.770.80) indicating a high level of concordance.
Other Predictor Variables
In addition to food consumption, we considered the following additional predictor variables: age, leukocyte count, C‐reactive protein (CRP), systolic blood pressure, heart rate, and body temperature.17 These predictor variables were obtained just prior to the blood culture acquisition. We defined systemic inflammatory response syndrome (SIRS) based on standard criteria (heart rate of 90 beats/min, temperature of 36 or 38C, and leukocyte level of 4000 or 12,000 cells/mL), and sepsis as SIRS in the context of clinical evidence or microbiological findings suggesting a primary focus of infection. Two investigators independently determined whether sepsis was present in each case, and the differences were resolved by consensus. Age subclassifications were categorized into 2 groups (<69 years and >70 years). CRP levels were dichotomized as above or below 10.0 mg/dL.
Statistical Analysis
Continuous variables were presented as medians with the associated interquartile range. Univariate analysis was performed using the Student's t test for continuous variables and the Pearson chi‐square test for categorical variables. Locally weighted regression analysis was applied for continuous variables significantly predictive of the outcome in univariate analysis, and the log odds of the outcome was performed to explore which cut‐off points were the best predictors of true‐positive blood culture results.18 Evaluation of best fit was performed using a multivariate logistic regression model with a forward stepwise procedure, with significant multivariate predictors of the outcome kept in the model and expressed as adjusted odds ratios. Calibration was evaluated using the Hosmer‐Lemeshow goodness‐of‐fit test. We calculated the sensitivity and specificity, and positive and negative predictive value for criteria to predict bacteremia. As a subgroup analysis, we repeated the above analytic approach after excluding those patients exposed to antibacterial drugs (which might independently impact food intake). All hypothesis testing was 2‐tailed, and P values of less than 0.05 were considered statistically significant. Statistical analysis was performed using the SPSS v.16.0 software package (SPSS Inc, Chicago, IL).
RESULTS
During the study period, 851 patients aged 16 to 99 years (66.8 16.6), were eligible for inclusion (Figure 1). Baseline characteristics of the subjects are given in Table 1. The mean body temperature ( standard deviation [SD]) was 38.1 1.1C, and the mean CRP level was 8.7 8.1 mg/dL. The results show that the patients had at least 2 SIRS criteria with elevations in temperature and heart rate. Of the 851 patients entered into the study, only 122 (14.3%) had positive blood cultures. Of these, 75 patients (8.8%) were considered to have true‐positive blood culture. In this study, blood cultures were taken at the time of onset of fever, whether that was a new inpatient admission, or during the course of an admission to the hospital. On average, blood cultures were drawn 12 days after admission (SD, 5.6 days). Despite the variation in onset of fever, the inverse relationship of blood culture positivity to decreased food consumption held true (data not shown). Gram‐positive and Gram‐negative organisms were obtained in near equal amounts. The main pathogens recovered from the true‐positive blood cultures were Gram‐positive cocci (26 patients [34.7% in true‐positive blood cultures]), and Gram‐negative bacilli (46 patients [61.3%]), as shown in Table 1. The underlying clinical diagnosis included 28 urinary tract infections; 9 catheter‐associated infections; 5 cases each of pneumonia and abscess; 3 cases of phlebitis; 2 cases of meningitis and osteomyelitis; 1 case each of infective endocarditis, decubitus ulcer, and pelvic infection; and 17 cases of infection with an unknown focus.
| Mean | SD | |
|---|---|---|
| ||
| Age, years | 66.8 | 16.7 |
| Male (%) | 50.6 | |
| Vital signs | ||
| Systolic blood pressure, mmHg | 122.6 | 25.9 |
| Diastolic blood pressure, mmHg | 65.3 | 14.6 |
| Heart rate, beats/min | 91.1 | 19.2 |
| Body temperature, C | 38.1 | 1.1 |
| Laboratory results | ||
| Leukocyte, 100 /L | 10.6 | 11.8 |
| C‐reactive protein, mg/L | 8.8 | 8.1 |
| Results of blood cultures | N | % |
| Blood culture positive | 122 | 14.3 |
| True positive | 75 | 8.8 |
| Gram‐positive coccus | 26 | 3.1 |
| Gram‐negative baccili | 46 | 5.4 |
| Gram‐negative coccus | 1 | 0.1 |
| Fungus | 1 | 0.1 |
| Anaerobic | 1 | 0.1 |
| Contamination | 47 | 5.6 |
| Blood culture negative | 729 | 85.7 |
| Food consumption | ||
| Low food consumption group | 344 | 4.4 |
| Moderate food consumption group | 152 | 17.9 |
| High food consumption group | 354 | 41.4 |
Low, moderate, and high food consumption groups consisted of 344 patients (40.4%), 152 patients (17.9%), and 354 patients (41.7%), respectively (Table 1). Of these, 63 patients, 6 patients, and 6 patients had bacteremia in the low, moderate, and high food consumption group, respectively. In order to distinguish those patients who had decreased food consumption compared to almost normal food consumption, low and moderate food consumption groups were combined and compared to the high food consumption group. Comparison of the combined low and moderate food consumption group versus the high food consumption group revealed a sensitivity of 92.0% and a negative predictive value of 98.3% for excluding true bacteremia. Conversely, the specificity (45.1%) and the positive predictive value (13.9%) were poor.
In the univariate analysis, the following variables were not statistically significantly associated with true bacteremia: age, heart rate, and leukocyte counts. Significant univariate predictors of bacteremia and their associated cut‐off points were body temperature of 36 or 38C (odds ratio [OR], 2.5; 95% CI, 1.54.4), CRP 10.0 mg/dL (OR, 2.0; 95% CI, 1.23.2), and food consumption (OR, 8.5; 95% CI, 3.818.6) (Table 2). There was no evidence of colinearity. In the final stepwise logistic regression (Table 3), the significant predictors of bacteremia were body temperature of 36 or 38C (OR, 2.4; 95% CI, 1.44.2; P = 0.002), C‐reactive protein of 10.0 mg/dL (OR, 1.9; 95% CI, 1.23.0; P = 0.011), and food consumption (OR, 7.5; 95% CI, 3.416.6; P < 0.001). We identified only 6 patients with bacteremia in the high food consumption group. Three of the patients had been previously treated with antibiotics for conditions including infective endocarditis, osteomyelitis, and myelodysplasic syndrome.
| Variables | Blood Culture Result | P Value | OR (95% CI) | |
|---|---|---|---|---|
| Negative (n = 729) (%) | Positive (n = 75) | |||
| ||||
| Age, years | 66.6 | 69.0 | ||
| Mean SD | 16.9 | 13.5 | ||
| 70 | 408 (56.0) | 43 (57.3) | 0.7 | |
| Heart rate, beats/min | 90.5 | 96.3 | ||
| Mean SD | 19.0 | 20.3 | ||
| 90 | 368 (50.4) | 43 (57.3) | 0.3 | |
| Temperature, C | 38.0 | 38.6 | ||
| Mean SD | 1.0 | 1.6 | ||
| 36, 38 | 444 (61.0) | 61 (81.3) | <0.001 | 2.5 (1.54.4) |
| Leukocyte count, cells/L | 10.1 | 11.2 | ||
| Mean SD, 100 | 12.1 | 7.4 | ||
| 120 103, <4 103 | 336 (46.1) | 38 (50.7) | 0.4 | |
| C‐reactive protein | ||||
| Mean SD | 7.8 | 10.0 | ||
| 10.0 | 245 (33.6) | 39 (52.0) | 0.0004 | 2.0 (1.23.2) |
| Food consumption | ||||
| Low and moderate | 426 (58.9) | 69 (92.0) | ||
| High | 350 (48.0) | 6 (8.0) | <0.001 | 8.5 (3.818.6) |
| Variables | OR (95% CI) | P Value |
|---|---|---|
| ||
| Temperature, C 36 or 38 | 2.4 (1.44.2) | 0.002 |
| C‐reactive protein, mg/dL 10.0 | 1.9 (1.23.0) | 0.011 |
| Food consumption High vs low and moderate | 7.5 (3.416.6) | <0.001 |
On further analysis, we excluded patients who had received antibiotics before blood culture acquisition. There were 661 patients in this subanalysis. Low, moderate, and high food consumption groups consisted of 282 patients (41.4%), 118 patients (17.3%), and 261 patients (38.3%), respectively. Of these, 50 patients (17.7%), 5 patients (4.2%), and 4 patients (1.5%) had bacteremia in the low, moderate, and high food consumption groups, respectively. The sensitivity and negative predictive values were 93.2% and 98.5%, respectively. In the stepwise logistic regression, significant predictors of bacteremia were body temperature of 36 or 38C (OR, 3.0; 95% CI, 1.55.6; P = 0.001), CRP 10.0 mg/dL (OR, 2.1; 95% CI, 1.23.7; P = 0.006), and food consumption (OR, 9.3; 95% CI, 3.326.1; P < 0.001).
DISCUSSION
We found that in a group of 851 Japanese patients who were suspected with bacterial infection, the estimated food consumption was negatively associated, both significantly and independently, with the subsequent isolation of microorganisms from their blood cultures. If validated in other studies, this simple rule of thumb can provide the clinician with reasonable confidence that a febrile patient has a low probability of being bacteremic, as long as the appetite remains normal. Both the sensitivity and the negative predictive value were extremely high at 92.3% and 98.3%, respectively, suggesting that adequate oral intake is a strong marker against the presence of bacteremia. In this study, it was the strongest predictor of bacteremia in multivariate analysis. After including only antibiotic‐naive patients, the sensitivity and the negative predictive values were 93.2% and 98.5%, respectively. Administration of antibiotics may lead to improved appetite in febrile patients despite bacteremia in the presence of fever, and therefore, inquiring about recent or current antimicrobial usage should be a requirement when considering oral intake as an indicator of bacteremia.
Our study has limitations. Since we did not make treatment decisions based on oral intake, we cannot conclude that it is safe to withhold antibiotic treatment on the basis of food intake alone. Additionally, this study would need to be repeated across many different age groups and racial groups to ensure applicability to the general population. It is also unknown whether this rule would be applicable to patients with underlying immunosuppression. Finally, although inter‐rater reliability was high in our center, nurses in other settings may not be as diligent in their assessment of food consumption. The high inter‐assessor reliability in our setting, however, suggests that objective assessment of food intake can be performed reliably in settings in which accurate documentation of food consumption is expected.
In summary, we found that normal food intake was strongly and negatively associated with bacteremia in febrile patients. This observation, if validated in other settings, may serve as a simple aid to assist in the clinical diagnosis of bacteremia or for recruitment of patients with a high likelihood of bacteremia into clinical trials.
Acknowledgements
The authors thank Drs T. Morimoto and S. Ueda for assistance with statistical analysis, Ms M. Takigawa, and M. Kudo for collection of data, and Drs T. Oguri and Tachibana for infectious disease consultation on the pathogenicity of the microbiological organisms.
- , , , et al. 2001 SCCM/ESICM/ACCP/ATS/SIS International Sepsis Definitions Conference. Crit Care Med. 2003;31(4):1250–1256.
- , , . Septic shock. Lancet. 2005;365(9453):63–78.
- , , , . A simple index to identify occult bacterial infection in adults with acute unexplained fever. Arch Intern Med. 1987;147(4):666–671.
- , , . Occult bacterial infection in adults with unexplained fever. Validation of a diagnostic index. Arch Intern Med. 1990;150(6):1270–1272.
- , , , , . Bacteremia in febrile patients. A clinical model for diagnosis. Arch Intern Med. 1991;151(9):1801–1806.
- , . Blood cultures. Ann Intern Med. 1987;106(2):246–253.
- , , , et al. The clinical significance of positive blood cultures in the 1990s: a prospective comprehensive evaluation of the microbiology, epidemiology, and outcome of bacteremia and fungemia in adults. Clin Infect Dis. 1997;24(4):584–602.
- , , . Effect of iodophor vs iodine tincture skin preparation on blood culture contamination rate. JAMA. 1993;269(8):1004–1006.
- , , , et al. Predicting bacteremia in patients with sepsis syndrome. Academic Medical Center Consortium Sepsis Project Working Group. J Infect Dis. 1997;176(6):1538–1551.
- , . Clinical issues of blood cultures. Arch Intern Med. 1994;154(8):841–849.
- , , . High frequency of pseudobacteremia at a university hospital. Infect Control Hosp Epidemiol. 1997;18(3):200–202.
- , , , . Predicting bacteremia in hospitalized patients. A prospectively validated model. Ann Intern Med. 1990;113(7):495–500.
- , , , . Decisions made by critical care nurses during mechanical ventilation and weaning in an Australian intensive care unit. Am J Crit Care. 2007;16(5):434–443; quiz 444.
- , . Updated review of blood culture contamination. Clin Microbiol Rev. 2006;19(4):788–802.
- , , , et al. Minimizing the workup of blood culture contaminants: implementation and evaluation of a laboratory‐based algorithm. J Clin Microbiol. 2002;40(7):2437–2444.
- , . Evaluation of positive blood cultures. Guidelines for early differentiation of contaminated from valid positive cultures. Arch Intern Med. 1972;130(1):84–87.
- , , , et al. Predicting bacteremia at the bedside. Clin Infect Dis. 2004;38(3):357–362.
- . Local Regression and Likelihood. New York, NY: Springer; 1999.
Fever is a nonspecific phenomenon that can result from many inciting causes such as infection, inflammation, malignancy, thromboembolic disease, drugs, and endocrine disease. In hospitalized patients, one of the most important clinical considerations is bacteremia. Although vital signs compose 3 of the 4 current criteria for the diagnosis of Systemic Inflammatory Response Syndrome (SIRS),1, 2 they contribute little to the diagnosis of the cause, which can be inflammation or infection. Unfortunately, the physician's clinical diagnosis of bacteremia lacks both sensitivity and specificity.35 Blood culture acquisition is a simple and basic diagnostic procedure routinely used in clinical practice that yields essential information for the evaluation of various infectious diseases.6 Positive blood cultures can demonstrate not only an infectious cause of disease but also the microbiological response to antibiotic therapy.7 However, studies have reported that 35% to 50% of positive blood cultures are falsely positive owing to contamination.711 False‐positive cultures may lead to the use of inappropriate or unnecessary antibiotics, additional testing and consultation, and prolonged hospitalizations that increase patient care costs.9, 12
Nursing staff caring for patients are generally able to assess oral intake, general clinical state, and care requirements. Moreover, the nursing staff are often able to identify problems with patients before physicians.13 In Japan, nurse‐assessed food consumption of every meal is standardized, and is frequently regarded as an indicator of the patient's clinical status, akin to a vital sign. In this context, we hypothesized that quantitative variations in food consumption could accurately distinguish those patients with or without bacteremia.
MATERIALS AND METHODS
Study Design
Between 2005 and 2009, we conducted a cross‐sectional observational study at Juntendo University Nerima Hospital in Tokyo, Japan. We evaluated 1179 consecutive Japanese patients (mean age, 67.8 16.8 years; 51% male) who underwent blood cultures. Patients with anorexia‐inducing conditions, such as gastrointestinal disease and those who were receiving chemotherapy for malignancy, were excluded. We also excluded patients who were not allowed to eat a regular diet. Patients aged <6 years old were also excluded. The indication for blood culture acquisition was at the discretion of the treating physicians. In general, when an axillary temperature >37.538C developed, blood cultures were taken. The study was approved by the ethics committee of Juntendo University Nerima Hospital, and was conducted in accordance with the Helsinki Declaration of 1971, as revised in 1983.
Definition of Bacteremia
In this study, bacteremia was defined as follows:
Identical organisms isolated from 2 sets of blood cultures (a set refers to 1 aerobic bottle and 1 anaerobic bottle).
If only 1 set of blood cultures was acquired and was positive for a pathogenic organism (such as enteric Gram‐negative bacilli or Streptococcus pneumonia) that could account for the clinical presentation, then the culture was considered positive.7, 14, 15
Definition of Contamination
We considered as contaminants organisms common to skin flora, including Bacillus species, coagulase‐negative staphylococci, Corynebacterium species, and Micrococcus species, without isolation of an identical organism with the same antibiotic susceptibilities from another potentially infected site in a patient with incompatible clinical features and no attributable risks.16 Single blood cultures positive for organisms thought unlikely to explain the patient's symptoms were also considered contaminants.
Assessment of Food Consumption and Inter‐Assessor Reliability
Nursing staff assessed the patients' food consumption by estimating the percentage intake at each meal, and we characterized the patients' oral intake based on the meal immediately prior to the blood culture. We categorized the patients into 3 groups: low food consumption group (<50% consumed), moderate food consumption group (>50% to <80% consumed), and high food consumption group (>80% food consumed). To assess the reliability of the evaluations of food consumption, 100 patients (separate from this main study) were selected randomly and evaluated independently by 2 nurses. The kappa score of agreement between the nurses was 0.79 (95% confidence interval [CI], 0.770.80) indicating a high level of concordance.
Other Predictor Variables
In addition to food consumption, we considered the following additional predictor variables: age, leukocyte count, C‐reactive protein (CRP), systolic blood pressure, heart rate, and body temperature.17 These predictor variables were obtained just prior to the blood culture acquisition. We defined systemic inflammatory response syndrome (SIRS) based on standard criteria (heart rate of 90 beats/min, temperature of 36 or 38C, and leukocyte level of 4000 or 12,000 cells/mL), and sepsis as SIRS in the context of clinical evidence or microbiological findings suggesting a primary focus of infection. Two investigators independently determined whether sepsis was present in each case, and the differences were resolved by consensus. Age subclassifications were categorized into 2 groups (<69 years and >70 years). CRP levels were dichotomized as above or below 10.0 mg/dL.
Statistical Analysis
Continuous variables were presented as medians with the associated interquartile range. Univariate analysis was performed using the Student's t test for continuous variables and the Pearson chi‐square test for categorical variables. Locally weighted regression analysis was applied for continuous variables significantly predictive of the outcome in univariate analysis, and the log odds of the outcome was performed to explore which cut‐off points were the best predictors of true‐positive blood culture results.18 Evaluation of best fit was performed using a multivariate logistic regression model with a forward stepwise procedure, with significant multivariate predictors of the outcome kept in the model and expressed as adjusted odds ratios. Calibration was evaluated using the Hosmer‐Lemeshow goodness‐of‐fit test. We calculated the sensitivity and specificity, and positive and negative predictive value for criteria to predict bacteremia. As a subgroup analysis, we repeated the above analytic approach after excluding those patients exposed to antibacterial drugs (which might independently impact food intake). All hypothesis testing was 2‐tailed, and P values of less than 0.05 were considered statistically significant. Statistical analysis was performed using the SPSS v.16.0 software package (SPSS Inc, Chicago, IL).
RESULTS
During the study period, 851 patients aged 16 to 99 years (66.8 16.6), were eligible for inclusion (Figure 1). Baseline characteristics of the subjects are given in Table 1. The mean body temperature ( standard deviation [SD]) was 38.1 1.1C, and the mean CRP level was 8.7 8.1 mg/dL. The results show that the patients had at least 2 SIRS criteria with elevations in temperature and heart rate. Of the 851 patients entered into the study, only 122 (14.3%) had positive blood cultures. Of these, 75 patients (8.8%) were considered to have true‐positive blood culture. In this study, blood cultures were taken at the time of onset of fever, whether that was a new inpatient admission, or during the course of an admission to the hospital. On average, blood cultures were drawn 12 days after admission (SD, 5.6 days). Despite the variation in onset of fever, the inverse relationship of blood culture positivity to decreased food consumption held true (data not shown). Gram‐positive and Gram‐negative organisms were obtained in near equal amounts. The main pathogens recovered from the true‐positive blood cultures were Gram‐positive cocci (26 patients [34.7% in true‐positive blood cultures]), and Gram‐negative bacilli (46 patients [61.3%]), as shown in Table 1. The underlying clinical diagnosis included 28 urinary tract infections; 9 catheter‐associated infections; 5 cases each of pneumonia and abscess; 3 cases of phlebitis; 2 cases of meningitis and osteomyelitis; 1 case each of infective endocarditis, decubitus ulcer, and pelvic infection; and 17 cases of infection with an unknown focus.
| Mean | SD | |
|---|---|---|
| ||
| Age, years | 66.8 | 16.7 |
| Male (%) | 50.6 | |
| Vital signs | ||
| Systolic blood pressure, mmHg | 122.6 | 25.9 |
| Diastolic blood pressure, mmHg | 65.3 | 14.6 |
| Heart rate, beats/min | 91.1 | 19.2 |
| Body temperature, C | 38.1 | 1.1 |
| Laboratory results | ||
| Leukocyte, 100 /L | 10.6 | 11.8 |
| C‐reactive protein, mg/L | 8.8 | 8.1 |
| Results of blood cultures | N | % |
| Blood culture positive | 122 | 14.3 |
| True positive | 75 | 8.8 |
| Gram‐positive coccus | 26 | 3.1 |
| Gram‐negative baccili | 46 | 5.4 |
| Gram‐negative coccus | 1 | 0.1 |
| Fungus | 1 | 0.1 |
| Anaerobic | 1 | 0.1 |
| Contamination | 47 | 5.6 |
| Blood culture negative | 729 | 85.7 |
| Food consumption | ||
| Low food consumption group | 344 | 4.4 |
| Moderate food consumption group | 152 | 17.9 |
| High food consumption group | 354 | 41.4 |
Low, moderate, and high food consumption groups consisted of 344 patients (40.4%), 152 patients (17.9%), and 354 patients (41.7%), respectively (Table 1). Of these, 63 patients, 6 patients, and 6 patients had bacteremia in the low, moderate, and high food consumption group, respectively. In order to distinguish those patients who had decreased food consumption compared to almost normal food consumption, low and moderate food consumption groups were combined and compared to the high food consumption group. Comparison of the combined low and moderate food consumption group versus the high food consumption group revealed a sensitivity of 92.0% and a negative predictive value of 98.3% for excluding true bacteremia. Conversely, the specificity (45.1%) and the positive predictive value (13.9%) were poor.
In the univariate analysis, the following variables were not statistically significantly associated with true bacteremia: age, heart rate, and leukocyte counts. Significant univariate predictors of bacteremia and their associated cut‐off points were body temperature of 36 or 38C (odds ratio [OR], 2.5; 95% CI, 1.54.4), CRP 10.0 mg/dL (OR, 2.0; 95% CI, 1.23.2), and food consumption (OR, 8.5; 95% CI, 3.818.6) (Table 2). There was no evidence of colinearity. In the final stepwise logistic regression (Table 3), the significant predictors of bacteremia were body temperature of 36 or 38C (OR, 2.4; 95% CI, 1.44.2; P = 0.002), C‐reactive protein of 10.0 mg/dL (OR, 1.9; 95% CI, 1.23.0; P = 0.011), and food consumption (OR, 7.5; 95% CI, 3.416.6; P < 0.001). We identified only 6 patients with bacteremia in the high food consumption group. Three of the patients had been previously treated with antibiotics for conditions including infective endocarditis, osteomyelitis, and myelodysplasic syndrome.
| Variables | Blood Culture Result | P Value | OR (95% CI) | |
|---|---|---|---|---|
| Negative (n = 729) (%) | Positive (n = 75) | |||
| ||||
| Age, years | 66.6 | 69.0 | ||
| Mean SD | 16.9 | 13.5 | ||
| 70 | 408 (56.0) | 43 (57.3) | 0.7 | |
| Heart rate, beats/min | 90.5 | 96.3 | ||
| Mean SD | 19.0 | 20.3 | ||
| 90 | 368 (50.4) | 43 (57.3) | 0.3 | |
| Temperature, C | 38.0 | 38.6 | ||
| Mean SD | 1.0 | 1.6 | ||
| 36, 38 | 444 (61.0) | 61 (81.3) | <0.001 | 2.5 (1.54.4) |
| Leukocyte count, cells/L | 10.1 | 11.2 | ||
| Mean SD, 100 | 12.1 | 7.4 | ||
| 120 103, <4 103 | 336 (46.1) | 38 (50.7) | 0.4 | |
| C‐reactive protein | ||||
| Mean SD | 7.8 | 10.0 | ||
| 10.0 | 245 (33.6) | 39 (52.0) | 0.0004 | 2.0 (1.23.2) |
| Food consumption | ||||
| Low and moderate | 426 (58.9) | 69 (92.0) | ||
| High | 350 (48.0) | 6 (8.0) | <0.001 | 8.5 (3.818.6) |
| Variables | OR (95% CI) | P Value |
|---|---|---|
| ||
| Temperature, C 36 or 38 | 2.4 (1.44.2) | 0.002 |
| C‐reactive protein, mg/dL 10.0 | 1.9 (1.23.0) | 0.011 |
| Food consumption High vs low and moderate | 7.5 (3.416.6) | <0.001 |
On further analysis, we excluded patients who had received antibiotics before blood culture acquisition. There were 661 patients in this subanalysis. Low, moderate, and high food consumption groups consisted of 282 patients (41.4%), 118 patients (17.3%), and 261 patients (38.3%), respectively. Of these, 50 patients (17.7%), 5 patients (4.2%), and 4 patients (1.5%) had bacteremia in the low, moderate, and high food consumption groups, respectively. The sensitivity and negative predictive values were 93.2% and 98.5%, respectively. In the stepwise logistic regression, significant predictors of bacteremia were body temperature of 36 or 38C (OR, 3.0; 95% CI, 1.55.6; P = 0.001), CRP 10.0 mg/dL (OR, 2.1; 95% CI, 1.23.7; P = 0.006), and food consumption (OR, 9.3; 95% CI, 3.326.1; P < 0.001).
DISCUSSION
We found that in a group of 851 Japanese patients who were suspected with bacterial infection, the estimated food consumption was negatively associated, both significantly and independently, with the subsequent isolation of microorganisms from their blood cultures. If validated in other studies, this simple rule of thumb can provide the clinician with reasonable confidence that a febrile patient has a low probability of being bacteremic, as long as the appetite remains normal. Both the sensitivity and the negative predictive value were extremely high at 92.3% and 98.3%, respectively, suggesting that adequate oral intake is a strong marker against the presence of bacteremia. In this study, it was the strongest predictor of bacteremia in multivariate analysis. After including only antibiotic‐naive patients, the sensitivity and the negative predictive values were 93.2% and 98.5%, respectively. Administration of antibiotics may lead to improved appetite in febrile patients despite bacteremia in the presence of fever, and therefore, inquiring about recent or current antimicrobial usage should be a requirement when considering oral intake as an indicator of bacteremia.
Our study has limitations. Since we did not make treatment decisions based on oral intake, we cannot conclude that it is safe to withhold antibiotic treatment on the basis of food intake alone. Additionally, this study would need to be repeated across many different age groups and racial groups to ensure applicability to the general population. It is also unknown whether this rule would be applicable to patients with underlying immunosuppression. Finally, although inter‐rater reliability was high in our center, nurses in other settings may not be as diligent in their assessment of food consumption. The high inter‐assessor reliability in our setting, however, suggests that objective assessment of food intake can be performed reliably in settings in which accurate documentation of food consumption is expected.
In summary, we found that normal food intake was strongly and negatively associated with bacteremia in febrile patients. This observation, if validated in other settings, may serve as a simple aid to assist in the clinical diagnosis of bacteremia or for recruitment of patients with a high likelihood of bacteremia into clinical trials.
Acknowledgements
The authors thank Drs T. Morimoto and S. Ueda for assistance with statistical analysis, Ms M. Takigawa, and M. Kudo for collection of data, and Drs T. Oguri and Tachibana for infectious disease consultation on the pathogenicity of the microbiological organisms.
Fever is a nonspecific phenomenon that can result from many inciting causes such as infection, inflammation, malignancy, thromboembolic disease, drugs, and endocrine disease. In hospitalized patients, one of the most important clinical considerations is bacteremia. Although vital signs compose 3 of the 4 current criteria for the diagnosis of Systemic Inflammatory Response Syndrome (SIRS),1, 2 they contribute little to the diagnosis of the cause, which can be inflammation or infection. Unfortunately, the physician's clinical diagnosis of bacteremia lacks both sensitivity and specificity.35 Blood culture acquisition is a simple and basic diagnostic procedure routinely used in clinical practice that yields essential information for the evaluation of various infectious diseases.6 Positive blood cultures can demonstrate not only an infectious cause of disease but also the microbiological response to antibiotic therapy.7 However, studies have reported that 35% to 50% of positive blood cultures are falsely positive owing to contamination.711 False‐positive cultures may lead to the use of inappropriate or unnecessary antibiotics, additional testing and consultation, and prolonged hospitalizations that increase patient care costs.9, 12
Nursing staff caring for patients are generally able to assess oral intake, general clinical state, and care requirements. Moreover, the nursing staff are often able to identify problems with patients before physicians.13 In Japan, nurse‐assessed food consumption of every meal is standardized, and is frequently regarded as an indicator of the patient's clinical status, akin to a vital sign. In this context, we hypothesized that quantitative variations in food consumption could accurately distinguish those patients with or without bacteremia.
MATERIALS AND METHODS
Study Design
Between 2005 and 2009, we conducted a cross‐sectional observational study at Juntendo University Nerima Hospital in Tokyo, Japan. We evaluated 1179 consecutive Japanese patients (mean age, 67.8 16.8 years; 51% male) who underwent blood cultures. Patients with anorexia‐inducing conditions, such as gastrointestinal disease and those who were receiving chemotherapy for malignancy, were excluded. We also excluded patients who were not allowed to eat a regular diet. Patients aged <6 years old were also excluded. The indication for blood culture acquisition was at the discretion of the treating physicians. In general, when an axillary temperature >37.538C developed, blood cultures were taken. The study was approved by the ethics committee of Juntendo University Nerima Hospital, and was conducted in accordance with the Helsinki Declaration of 1971, as revised in 1983.
Definition of Bacteremia
In this study, bacteremia was defined as follows:
Identical organisms isolated from 2 sets of blood cultures (a set refers to 1 aerobic bottle and 1 anaerobic bottle).
If only 1 set of blood cultures was acquired and was positive for a pathogenic organism (such as enteric Gram‐negative bacilli or Streptococcus pneumonia) that could account for the clinical presentation, then the culture was considered positive.7, 14, 15
Definition of Contamination
We considered as contaminants organisms common to skin flora, including Bacillus species, coagulase‐negative staphylococci, Corynebacterium species, and Micrococcus species, without isolation of an identical organism with the same antibiotic susceptibilities from another potentially infected site in a patient with incompatible clinical features and no attributable risks.16 Single blood cultures positive for organisms thought unlikely to explain the patient's symptoms were also considered contaminants.
Assessment of Food Consumption and Inter‐Assessor Reliability
Nursing staff assessed the patients' food consumption by estimating the percentage intake at each meal, and we characterized the patients' oral intake based on the meal immediately prior to the blood culture. We categorized the patients into 3 groups: low food consumption group (<50% consumed), moderate food consumption group (>50% to <80% consumed), and high food consumption group (>80% food consumed). To assess the reliability of the evaluations of food consumption, 100 patients (separate from this main study) were selected randomly and evaluated independently by 2 nurses. The kappa score of agreement between the nurses was 0.79 (95% confidence interval [CI], 0.770.80) indicating a high level of concordance.
Other Predictor Variables
In addition to food consumption, we considered the following additional predictor variables: age, leukocyte count, C‐reactive protein (CRP), systolic blood pressure, heart rate, and body temperature.17 These predictor variables were obtained just prior to the blood culture acquisition. We defined systemic inflammatory response syndrome (SIRS) based on standard criteria (heart rate of 90 beats/min, temperature of 36 or 38C, and leukocyte level of 4000 or 12,000 cells/mL), and sepsis as SIRS in the context of clinical evidence or microbiological findings suggesting a primary focus of infection. Two investigators independently determined whether sepsis was present in each case, and the differences were resolved by consensus. Age subclassifications were categorized into 2 groups (<69 years and >70 years). CRP levels were dichotomized as above or below 10.0 mg/dL.
Statistical Analysis
Continuous variables were presented as medians with the associated interquartile range. Univariate analysis was performed using the Student's t test for continuous variables and the Pearson chi‐square test for categorical variables. Locally weighted regression analysis was applied for continuous variables significantly predictive of the outcome in univariate analysis, and the log odds of the outcome was performed to explore which cut‐off points were the best predictors of true‐positive blood culture results.18 Evaluation of best fit was performed using a multivariate logistic regression model with a forward stepwise procedure, with significant multivariate predictors of the outcome kept in the model and expressed as adjusted odds ratios. Calibration was evaluated using the Hosmer‐Lemeshow goodness‐of‐fit test. We calculated the sensitivity and specificity, and positive and negative predictive value for criteria to predict bacteremia. As a subgroup analysis, we repeated the above analytic approach after excluding those patients exposed to antibacterial drugs (which might independently impact food intake). All hypothesis testing was 2‐tailed, and P values of less than 0.05 were considered statistically significant. Statistical analysis was performed using the SPSS v.16.0 software package (SPSS Inc, Chicago, IL).
RESULTS
During the study period, 851 patients aged 16 to 99 years (66.8 16.6), were eligible for inclusion (Figure 1). Baseline characteristics of the subjects are given in Table 1. The mean body temperature ( standard deviation [SD]) was 38.1 1.1C, and the mean CRP level was 8.7 8.1 mg/dL. The results show that the patients had at least 2 SIRS criteria with elevations in temperature and heart rate. Of the 851 patients entered into the study, only 122 (14.3%) had positive blood cultures. Of these, 75 patients (8.8%) were considered to have true‐positive blood culture. In this study, blood cultures were taken at the time of onset of fever, whether that was a new inpatient admission, or during the course of an admission to the hospital. On average, blood cultures were drawn 12 days after admission (SD, 5.6 days). Despite the variation in onset of fever, the inverse relationship of blood culture positivity to decreased food consumption held true (data not shown). Gram‐positive and Gram‐negative organisms were obtained in near equal amounts. The main pathogens recovered from the true‐positive blood cultures were Gram‐positive cocci (26 patients [34.7% in true‐positive blood cultures]), and Gram‐negative bacilli (46 patients [61.3%]), as shown in Table 1. The underlying clinical diagnosis included 28 urinary tract infections; 9 catheter‐associated infections; 5 cases each of pneumonia and abscess; 3 cases of phlebitis; 2 cases of meningitis and osteomyelitis; 1 case each of infective endocarditis, decubitus ulcer, and pelvic infection; and 17 cases of infection with an unknown focus.
| Mean | SD | |
|---|---|---|
| ||
| Age, years | 66.8 | 16.7 |
| Male (%) | 50.6 | |
| Vital signs | ||
| Systolic blood pressure, mmHg | 122.6 | 25.9 |
| Diastolic blood pressure, mmHg | 65.3 | 14.6 |
| Heart rate, beats/min | 91.1 | 19.2 |
| Body temperature, C | 38.1 | 1.1 |
| Laboratory results | ||
| Leukocyte, 100 /L | 10.6 | 11.8 |
| C‐reactive protein, mg/L | 8.8 | 8.1 |
| Results of blood cultures | N | % |
| Blood culture positive | 122 | 14.3 |
| True positive | 75 | 8.8 |
| Gram‐positive coccus | 26 | 3.1 |
| Gram‐negative baccili | 46 | 5.4 |
| Gram‐negative coccus | 1 | 0.1 |
| Fungus | 1 | 0.1 |
| Anaerobic | 1 | 0.1 |
| Contamination | 47 | 5.6 |
| Blood culture negative | 729 | 85.7 |
| Food consumption | ||
| Low food consumption group | 344 | 4.4 |
| Moderate food consumption group | 152 | 17.9 |
| High food consumption group | 354 | 41.4 |
Low, moderate, and high food consumption groups consisted of 344 patients (40.4%), 152 patients (17.9%), and 354 patients (41.7%), respectively (Table 1). Of these, 63 patients, 6 patients, and 6 patients had bacteremia in the low, moderate, and high food consumption group, respectively. In order to distinguish those patients who had decreased food consumption compared to almost normal food consumption, low and moderate food consumption groups were combined and compared to the high food consumption group. Comparison of the combined low and moderate food consumption group versus the high food consumption group revealed a sensitivity of 92.0% and a negative predictive value of 98.3% for excluding true bacteremia. Conversely, the specificity (45.1%) and the positive predictive value (13.9%) were poor.
In the univariate analysis, the following variables were not statistically significantly associated with true bacteremia: age, heart rate, and leukocyte counts. Significant univariate predictors of bacteremia and their associated cut‐off points were body temperature of 36 or 38C (odds ratio [OR], 2.5; 95% CI, 1.54.4), CRP 10.0 mg/dL (OR, 2.0; 95% CI, 1.23.2), and food consumption (OR, 8.5; 95% CI, 3.818.6) (Table 2). There was no evidence of colinearity. In the final stepwise logistic regression (Table 3), the significant predictors of bacteremia were body temperature of 36 or 38C (OR, 2.4; 95% CI, 1.44.2; P = 0.002), C‐reactive protein of 10.0 mg/dL (OR, 1.9; 95% CI, 1.23.0; P = 0.011), and food consumption (OR, 7.5; 95% CI, 3.416.6; P < 0.001). We identified only 6 patients with bacteremia in the high food consumption group. Three of the patients had been previously treated with antibiotics for conditions including infective endocarditis, osteomyelitis, and myelodysplasic syndrome.
| Variables | Blood Culture Result | P Value | OR (95% CI) | |
|---|---|---|---|---|
| Negative (n = 729) (%) | Positive (n = 75) | |||
| ||||
| Age, years | 66.6 | 69.0 | ||
| Mean SD | 16.9 | 13.5 | ||
| 70 | 408 (56.0) | 43 (57.3) | 0.7 | |
| Heart rate, beats/min | 90.5 | 96.3 | ||
| Mean SD | 19.0 | 20.3 | ||
| 90 | 368 (50.4) | 43 (57.3) | 0.3 | |
| Temperature, C | 38.0 | 38.6 | ||
| Mean SD | 1.0 | 1.6 | ||
| 36, 38 | 444 (61.0) | 61 (81.3) | <0.001 | 2.5 (1.54.4) |
| Leukocyte count, cells/L | 10.1 | 11.2 | ||
| Mean SD, 100 | 12.1 | 7.4 | ||
| 120 103, <4 103 | 336 (46.1) | 38 (50.7) | 0.4 | |
| C‐reactive protein | ||||
| Mean SD | 7.8 | 10.0 | ||
| 10.0 | 245 (33.6) | 39 (52.0) | 0.0004 | 2.0 (1.23.2) |
| Food consumption | ||||
| Low and moderate | 426 (58.9) | 69 (92.0) | ||
| High | 350 (48.0) | 6 (8.0) | <0.001 | 8.5 (3.818.6) |
| Variables | OR (95% CI) | P Value |
|---|---|---|
| ||
| Temperature, C 36 or 38 | 2.4 (1.44.2) | 0.002 |
| C‐reactive protein, mg/dL 10.0 | 1.9 (1.23.0) | 0.011 |
| Food consumption High vs low and moderate | 7.5 (3.416.6) | <0.001 |
On further analysis, we excluded patients who had received antibiotics before blood culture acquisition. There were 661 patients in this subanalysis. Low, moderate, and high food consumption groups consisted of 282 patients (41.4%), 118 patients (17.3%), and 261 patients (38.3%), respectively. Of these, 50 patients (17.7%), 5 patients (4.2%), and 4 patients (1.5%) had bacteremia in the low, moderate, and high food consumption groups, respectively. The sensitivity and negative predictive values were 93.2% and 98.5%, respectively. In the stepwise logistic regression, significant predictors of bacteremia were body temperature of 36 or 38C (OR, 3.0; 95% CI, 1.55.6; P = 0.001), CRP 10.0 mg/dL (OR, 2.1; 95% CI, 1.23.7; P = 0.006), and food consumption (OR, 9.3; 95% CI, 3.326.1; P < 0.001).
DISCUSSION
We found that in a group of 851 Japanese patients who were suspected with bacterial infection, the estimated food consumption was negatively associated, both significantly and independently, with the subsequent isolation of microorganisms from their blood cultures. If validated in other studies, this simple rule of thumb can provide the clinician with reasonable confidence that a febrile patient has a low probability of being bacteremic, as long as the appetite remains normal. Both the sensitivity and the negative predictive value were extremely high at 92.3% and 98.3%, respectively, suggesting that adequate oral intake is a strong marker against the presence of bacteremia. In this study, it was the strongest predictor of bacteremia in multivariate analysis. After including only antibiotic‐naive patients, the sensitivity and the negative predictive values were 93.2% and 98.5%, respectively. Administration of antibiotics may lead to improved appetite in febrile patients despite bacteremia in the presence of fever, and therefore, inquiring about recent or current antimicrobial usage should be a requirement when considering oral intake as an indicator of bacteremia.
Our study has limitations. Since we did not make treatment decisions based on oral intake, we cannot conclude that it is safe to withhold antibiotic treatment on the basis of food intake alone. Additionally, this study would need to be repeated across many different age groups and racial groups to ensure applicability to the general population. It is also unknown whether this rule would be applicable to patients with underlying immunosuppression. Finally, although inter‐rater reliability was high in our center, nurses in other settings may not be as diligent in their assessment of food consumption. The high inter‐assessor reliability in our setting, however, suggests that objective assessment of food intake can be performed reliably in settings in which accurate documentation of food consumption is expected.
In summary, we found that normal food intake was strongly and negatively associated with bacteremia in febrile patients. This observation, if validated in other settings, may serve as a simple aid to assist in the clinical diagnosis of bacteremia or for recruitment of patients with a high likelihood of bacteremia into clinical trials.
Acknowledgements
The authors thank Drs T. Morimoto and S. Ueda for assistance with statistical analysis, Ms M. Takigawa, and M. Kudo for collection of data, and Drs T. Oguri and Tachibana for infectious disease consultation on the pathogenicity of the microbiological organisms.
- , , , et al. 2001 SCCM/ESICM/ACCP/ATS/SIS International Sepsis Definitions Conference. Crit Care Med. 2003;31(4):1250–1256.
- , , . Septic shock. Lancet. 2005;365(9453):63–78.
- , , , . A simple index to identify occult bacterial infection in adults with acute unexplained fever. Arch Intern Med. 1987;147(4):666–671.
- , , . Occult bacterial infection in adults with unexplained fever. Validation of a diagnostic index. Arch Intern Med. 1990;150(6):1270–1272.
- , , , , . Bacteremia in febrile patients. A clinical model for diagnosis. Arch Intern Med. 1991;151(9):1801–1806.
- , . Blood cultures. Ann Intern Med. 1987;106(2):246–253.
- , , , et al. The clinical significance of positive blood cultures in the 1990s: a prospective comprehensive evaluation of the microbiology, epidemiology, and outcome of bacteremia and fungemia in adults. Clin Infect Dis. 1997;24(4):584–602.
- , , . Effect of iodophor vs iodine tincture skin preparation on blood culture contamination rate. JAMA. 1993;269(8):1004–1006.
- , , , et al. Predicting bacteremia in patients with sepsis syndrome. Academic Medical Center Consortium Sepsis Project Working Group. J Infect Dis. 1997;176(6):1538–1551.
- , . Clinical issues of blood cultures. Arch Intern Med. 1994;154(8):841–849.
- , , . High frequency of pseudobacteremia at a university hospital. Infect Control Hosp Epidemiol. 1997;18(3):200–202.
- , , , . Predicting bacteremia in hospitalized patients. A prospectively validated model. Ann Intern Med. 1990;113(7):495–500.
- , , , . Decisions made by critical care nurses during mechanical ventilation and weaning in an Australian intensive care unit. Am J Crit Care. 2007;16(5):434–443; quiz 444.
- , . Updated review of blood culture contamination. Clin Microbiol Rev. 2006;19(4):788–802.
- , , , et al. Minimizing the workup of blood culture contaminants: implementation and evaluation of a laboratory‐based algorithm. J Clin Microbiol. 2002;40(7):2437–2444.
- , . Evaluation of positive blood cultures. Guidelines for early differentiation of contaminated from valid positive cultures. Arch Intern Med. 1972;130(1):84–87.
- , , , et al. Predicting bacteremia at the bedside. Clin Infect Dis. 2004;38(3):357–362.
- . Local Regression and Likelihood. New York, NY: Springer; 1999.
- , , , et al. 2001 SCCM/ESICM/ACCP/ATS/SIS International Sepsis Definitions Conference. Crit Care Med. 2003;31(4):1250–1256.
- , , . Septic shock. Lancet. 2005;365(9453):63–78.
- , , , . A simple index to identify occult bacterial infection in adults with acute unexplained fever. Arch Intern Med. 1987;147(4):666–671.
- , , . Occult bacterial infection in adults with unexplained fever. Validation of a diagnostic index. Arch Intern Med. 1990;150(6):1270–1272.
- , , , , . Bacteremia in febrile patients. A clinical model for diagnosis. Arch Intern Med. 1991;151(9):1801–1806.
- , . Blood cultures. Ann Intern Med. 1987;106(2):246–253.
- , , , et al. The clinical significance of positive blood cultures in the 1990s: a prospective comprehensive evaluation of the microbiology, epidemiology, and outcome of bacteremia and fungemia in adults. Clin Infect Dis. 1997;24(4):584–602.
- , , . Effect of iodophor vs iodine tincture skin preparation on blood culture contamination rate. JAMA. 1993;269(8):1004–1006.
- , , , et al. Predicting bacteremia in patients with sepsis syndrome. Academic Medical Center Consortium Sepsis Project Working Group. J Infect Dis. 1997;176(6):1538–1551.
- , . Clinical issues of blood cultures. Arch Intern Med. 1994;154(8):841–849.
- , , . High frequency of pseudobacteremia at a university hospital. Infect Control Hosp Epidemiol. 1997;18(3):200–202.
- , , , . Predicting bacteremia in hospitalized patients. A prospectively validated model. Ann Intern Med. 1990;113(7):495–500.
- , , , . Decisions made by critical care nurses during mechanical ventilation and weaning in an Australian intensive care unit. Am J Crit Care. 2007;16(5):434–443; quiz 444.
- , . Updated review of blood culture contamination. Clin Microbiol Rev. 2006;19(4):788–802.
- , , , et al. Minimizing the workup of blood culture contaminants: implementation and evaluation of a laboratory‐based algorithm. J Clin Microbiol. 2002;40(7):2437–2444.
- , . Evaluation of positive blood cultures. Guidelines for early differentiation of contaminated from valid positive cultures. Arch Intern Med. 1972;130(1):84–87.
- , , , et al. Predicting bacteremia at the bedside. Clin Infect Dis. 2004;38(3):357–362.
- . Local Regression and Likelihood. New York, NY: Springer; 1999.
Copyright © 2012 Society of Hospital Medicine
Chance Favors the Prepared Mind
The approach to clinical conundrums by an expert clinician is revealed through the presentation of an actual patient's case in an approach typical of a morning report. Similarly to patient care, sequential pieces of information are provided to the clinician, who is unfamiliar with the case. The focus is on the thought processes of both the clinical team caring for the patient and the discussant.
A previously healthy 18‐year‐old woman living in the Pacific Northwest was brought in by her parents to a local hospital with a 4‐day history of acting crazy. Two weeks prior to presentation, she complained of a new‐onset severe headache, diaphoresis, and chills. Four days prior to presentation, she became progressively more impulsive, which ultimately included jumping out of a moving vehicle and running away from home. She experienced unexplained emotional outbursts and was unable to identify familiar relatives or common objects. Additionally, she began having hyperventilation spells and auditory hallucinations.
In an adolescent presenting with erratic behavior, one should consider the possibility of substance abuse or a psychiatric disease such as bipolar disorder with manic features, psychotic manifestations of severe depression, or early schizophrenia. However, it is important to first rule out non‐psychiatric disease, with a diagnostic approach dependent on her human immunodeficiency virus (HIV) status. The presence of headache, diaphoresis, and chills raises concern for an infectious or noninfectious inflammatory central nervous system process. In addition to the effects of illicit drugs such as cocaine or methamphetamine, this presentation may be consistent with a medication‐ or herbal‐induced anticholinergic syndrome, which may present with confusion, ataxia, coma, and cardiopulmonary failure. Since this case originates in the Northwest, one should be aware of the regional outbreak of Cryptococcus gattii in immunocompetent hosts, and that local hallucinogenic plants, such as jimson weed or mushrooms (Amanita muscaria) can cause anticholinergic syndromes. At this point, the differential diagnosis is broad, and evaluation should focus on potentially reversible life‐threatening conditions; in particular, herpes encephalitis. In addition to a detailed history, examination, and routine laboratory studies including HIV serology, I would obtain a drug screen, and order a computed tomography (CT) scan of the brain before performing a lumbar puncture. I would also order a magnetic resonance imaging (MRI) study to evaluate for meningeal or cerebral enhancement suggestive of encephalitis.
The patient had no past medical, psychiatric, or surgical history and took no medications. She lived with her parents who thought she neither used illicit drugs or alcohol, nor was sexually active. She had recently graduated high school and was planning to attend college. Her family history was notable for a mother with bipolar and seizure disorders, and 2 healthy younger siblings. Her family had a healthy cat and dog, and reported a large number of bats living nearby. She had never traveled outside the western United States. The patient presented in late spring, but there was no obvious history of mosquito bites. Her last menstrual period was 4 months prior to presentation. Full review of systems was otherwise negative.
The family history of mood disorder supports continued consideration of bipolar disorder with psychotic manifestations. However, infectious or inflammatory processes remain highest on the differential at this point. The duration of symptoms makes common bacterial meningitis etiologies (Streptococcus, Neisseria, Haemophilus, Listeria) less likely, but would be consistent with herpes simplex encephalitis or lupus cerebritis. Additional infectious considerations would include other viral (eg, varicella zoster virus, Epstein‐Barr virus, enteroviruses, and the arthropod‐borne encephalitides) or unusual bacterial encephalitic syndromes. Although the health status of pets is rarely helpful, dogs can carry ticks that harbor Borrelia burgdorferi (the agent of Lyme disease), which may present with central nervous system (CNS) manifestations. Other conditions associated with pets (such as leptospirosis or cat scratch disease) seem unlikely. The exposure to bats raises the possibility of rabies infection. If she is HIV‐positive, one would need to consider the possibility of opportunistic infections such as cytomegalovirus (CMV), Cryptococcus, cerebral toxoplasmosis, and progressive multifocal leukoencephalopathy (PML) caused by JC virus reaction. Finally, regardless of history, given the patient's amenorrhea, we must perform a pregnancy test.
The patient's temperature was 97.3F, heart rate 129 beats per minute, respiratory rate 19 breaths per minute, and her blood pressure 144/97 mmHg. She was an obese, well‐developed young woman, who was drowsy but arousable, with marked speech latency. Her cranium and oropharynx were normal, and her neck was supple. Aside from tachycardia, her cardiopulmonary, musculoskeletal, and skin exams were normal. Her abdomen was obese and soft, without masses or organomegaly. A pelvic examination was not performed. On neurologic exam, her strength was symmetrically diminished throughout (3+/5). Otherwise, she was oriented to person and general location, but not to day of week, month, or year. Her cranial nerves, sensation, deep tendon reflexes, and muscle tone were normal. A cerebellar examination, plantar response, and gait test were not performed. A brain MRI revealed only a small subarachnoid cyst and possible subtle enhancement of temporal lobes. Initial laboratory studies demonstrated: white blood cell count 14,000/mm3 (72% neutrophils, 17% lymphocytes, 9% monocytes, 2% eosinophils); hemoglobin 14.0 g/dL (mean corpuscular volume 87.4 fL); platelet count 417,000/mm3. Serum electrolytes, liver function tests, coagulation studies, thyroid stimulating hormone, serum ammonia, and urinalysis were normal. Her serum pregnancy test and urine toxicology screen were negative. A room air arterial blood gas revealed a pH of 7.49, PaCO2 32 mmHg, PaO2 89 mmHg; and a bicarbonate 24 mmol/L. Cerebrospinal fluid demonstrated: red cell count of 2/mm3; white cell count 17/mm3 (88% lymphocytes, 3% neutrophils, 9% monocytes); protein 19 mg/dL (normal 1555 mg/dL); and glucose of 79 mg/dL (normal 4080 mg/dL). Gram stain, fungal and bacterial cultures, and HIV serology were negative, and herpes simplex virus was not detected via polymerase chain reaction (PCR).
The tachycardia, respiratory alkalosis, and leukocytosis continue to suggest an infection or inflammatory state. Her neurological deterioration without focal findings, cerebrospinal fluid (CSF) lymphocytic pleocytosis with normal glucose and protein, and temporal lobe enhancement on MRI strongly suggest a meningoencephalitis. This would be an unusual presentation for most bacterial pathogens, but Mycobacterium, Rickettsia, Listeria, Mycoplasma, and Bartonella may rarely mimic encephalitis. Autoimmune encephalitis secondary to lupus, vasculitis, or other autoimmune disorder remains possible, but at this point an infectious encephalitis, particularly herpes encephalitis, is my highest concern. West Nile virus must be considered, but usually produces a severe illness only in immunocompromised or elderly patients. Additionally, despite the rarity of rabies, the patient's exposure to bats and the rapid clinical deterioration, suggest this possibility. In addition to routine bacterial and viral analyses (eg, enteroviral panel), samples should be sent for rabies PCR and antibody testing, West Nile virus, Lyme disease, syphilis, and mycobacterial and fungal pathogens, such as the aforementioned Cryptococcus gattii. Finally, given her presenting syndrome and MRI, immediate treatment with acyclovir and antibiotics is indicated.
The patient was treated for presumed meningoencephalitis with acyclovir and ceftriaxone, but over the following several days became unresponsive to all stimuli and developed repetitive thrusting movements of her mouth, tongue, and jaw. On hospital day 10, with concern for seizures, pentobarbital coma was induced, and the patient was intubated and transferred to our facility. On arrival, her physical examination was essentially unchanged aside from being in a medical coma. Hematology, chemistries, and thyroid‐stimulating hormone (TSH) were again unremarkable with the exception of an elevated creatine kinase (414 U/L) and a new anemia (hemoglobin 8.9 g/dL; mean corpuscular volume 87.6 fL) without evidence of iron deficiency or hemolysis. Blood and urine cultures were negative. Repeat cerebrospinal fluid analysis was essentially unchanged, revealing a red cell count of 1/mm3; white cell count 20/mm3 (86% lymphocytes, 2% neutrophils, 12% monocytes); protein 14 mg/dL; glucose 63 mg/dL, and negative Gram stain. Continuous electroencephalography revealed diffuse generalized slowing, but no seizure activity. An extensive evaluation for viral, bacterial, autoimmune, and paraneoplastic disorders was negative, including tests for anti‐acetylcholine (ACh) receptor binding antibody, anti‐striated muscle antibody, anti‐N‐type calcium channel antibody, anti‐P/Q‐type calcium channel antibodies, anto‐cancer associated retinopathy (CAR) antibody (also known as anti‐recoverin antibody), and anti‐collapsin respons mediator protein (CRMP‐5). Without confirmatory results and continued deterioration, she was empirically treated with methylprednisolone for presumed autoimmune encephalitis from hospital days 16 to 21. The patient remained unresponsive and ventilator‐dependent, despite removal of all sedation. She experienced intermittent fevers as high as 40.5C, remained tachycardic, hypertensive, and exhibited orofacial dyskinesias and jaw clenching, ultimately requiring botulinum toxin injections to prevent tongue biting. Given the lack of improvement despite attempted therapies, a working diagnosis of viral encephalitis with lasting neuropsychiatric sequelae was made. A tracheostomy and percutaneous gastrostomy tube were placed, and a long‐term ventilator care facility was identified.
I continue to wonder if this may be an autoimmune encephalitis, and am concerned about her unexplained fevers. Neuroleptic malignant syndrome secondary to misuse of her parents' medications should be considered in light of the elevated creatine kinase, although the severity and duration of the syndrome seem more profound than I would anticipate. Tetanus could present with jaw dystonia, but the rest of the case does not seem to fit. At this point, considering the patient's young age and poor prognosis without identified etiology, prior to discharge I would argue for a brain biopsy looking for evidence of rabies, or other infectious or autoimmune etiologies of the patient's progressive neurologic deterioration.
On hospital day 25, due to the persistent fevers with concern for occult abscess, an abdominopelvic CT was obtained, which identified a complex 11.8 cm 9.0 cm adnexal mass consistent with a teratoma (Figure 1).

Given the size of the mass, it is surprising that the patient did not report abdominal symptoms and that the physicians were unable to palpate it on examination. The differential diagnosis of a complex adnexal mass in an adolescent should include an ectopic pregnancy, ovarian cysts, tubo‐ovarian abscess, rarely an ovarian carcinoma or leiomyosarcoma, and a teratoma or dermoid tumor. While I mentioned the possibility of a malignancy at the outset, I did not further consider it. Common neoplasms encountered in adolescent patients include lymphoma and leukemia, germ cell tumors (including teratomas), central nervous system tumors and sarcomas, many of which have been reported to cause paraneoplastic disorders. At this point, I now think her presumed teratoma is associated with a paraneoplastic syndrome resulting in her presentation of limbic encephalitis.
A literature search was performed by the managing clinicians who rapidly identified the association between teratoma and limbic encephalitis. The patient was initially treated with intravenous immune globulin (IVIG), with transient improvement in her mental status. Serology returned positive for the anti‐N‐methyl‐D‐aspartate receptor antibody, confirming the diagnosis of anti‐N‐methyl‐D‐aspartate receptor encephalitis. On hospital day 36, her mass was resected (Figure 2). Pathology was consistent with a mature teratoma. Postoperatively, the patient improved daily, and was discharged on hospital day 43 with a near complete neurologic recovery. Four months following discharge, the patient had enrolled full time in college.
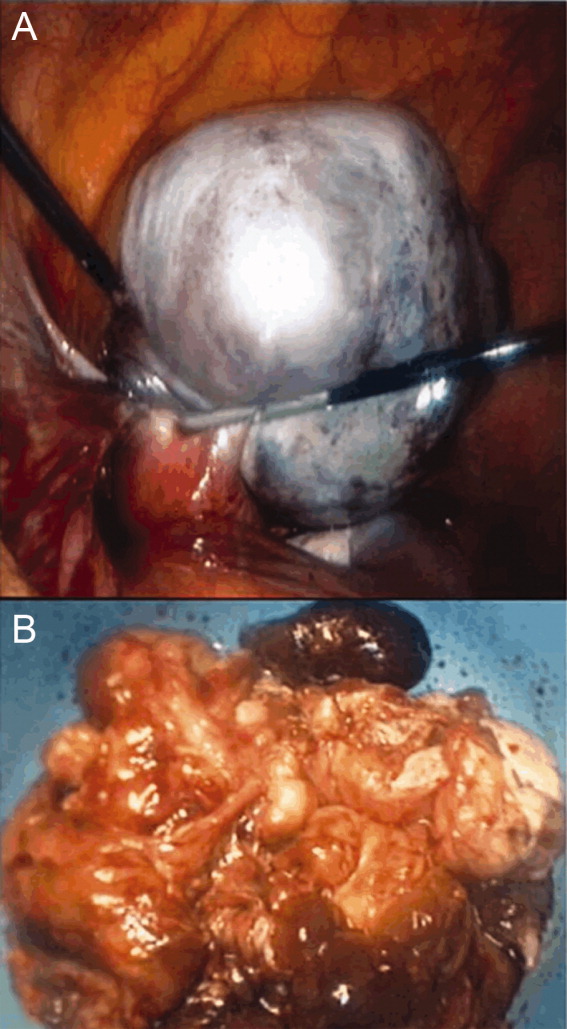
COMMENTARY
The N‐methyl‐D‐aspartate receptor (NMDAR) is an important regulator of synaptic transmission and memory within the CNS. Our patient's case illustrates the increasingly recognized syndrome of anti‐NMDAR encephalitis. NMDAR hypofunction is hypothesized to result in the cognitive and behavioral abnormalities of schizophrenia, and direct antagonism of the NMDAR by drugs such as phencyclidine (PCP) and ketamine results in symptoms such as psychosis, hallucinations, delusions, agitation, and dissociative amnesia.14 This constellation of symptoms is very similar to some of the initial neuropsychiatric symptoms observed in patients with anti‐NMDAR encephalitis.
Anti‐NMDAR encephalitis was first described in 2005 as a paraneoplastic limbic encephalitis associated with ovarian teratoma.5, 6 Characterized by the subacute onset (days to weeks) of short‐term memory loss, psychiatric symptoms, and sleep disturbances, limbic encephalitis is an inflammatory process caused by autoantibodies against intracellular or extracellar antigens in the limbic system and other brain structures. Limbic encephalitides associated with antibodies to intracellular antigens (such as Hu, Ma2, CV2/CRMP5, and Amphiphysin) are more often associated with malignancies, have worse outcomes (permanent neuropsychiatric sequelae and death), and are less responsive to immune therapy. Conversely, it appears that both the paraneoplastic and non‐paraneoplastic variants of limbic encephalitis associated with antibodies against cell membrane antigens (such as NMDAR and Voltage Gated Potassium Channels) respond more favorably to therapy.7
As with limbic encephalitis in general, anti‐NMDAR encephalitis can be non‐paraneoplastic as well as paraneoplastic in etiology. In a recently published series of 44 consecutive patients with anti‐NMDAR encephalitis, tumors were present in only 9 cases (8 teratomas).8 When associated with a teratoma, it has been postulated that anti‐NMDAR antibodies develop and cross the bloodbrain barrier to target central nervous system NMDA receptors. This process results in down‐regulation of the neuronal surface NMDAR which then causes the psychiatric and behavioral changes described.6 The mechanism by which these antibodies traverse the bloodbrain barrier is not completely understood, but likely requires some disruption of the barrier in order to trigger anti‐NMDAR encephalitis.8, 9 Non‐paraneoplastic cases evidently involve other unknown stimuli for NMDAR antibody synthesisone report has suggested that subunits of the NMDAR are expressed by normal ovarian tissue, something which may explain the female predilection even in the cohort unaffected by teratomas.10
Most patients with anti‐NMDAR encephalitis are female and young (median age 23 years), although men and children are also affected.8, 9, 11 While the exact incidence of anti‐NMDAR encephalitis is still unknown, the increasing number of case reports suggests that it may be more frequent than any other type of paraneoplastic encephalitis.12 The majority of patients with anti‐NMDAR encephalitis experience an antecedent infectious prodrome (eg, diarrheal illness or upper respiratory infection [URI]), followed 1020 days later by progressive neuropsychiatric and behavioral symptoms which include confusion, memory deficits, impaired responsiveness, seizures, central hypoventilation, and signs of autonomic instability (tachycardia, tachypnea, diaphoresis, cardiac dysrhythmia, blood pressure instability, and dysthermia). At this stage, patients may also manifest a unique constellation of choreoathetoid orofacial and limb movements such as lip licking, chewing, sustained jaw clenching, jaw opening dystonias, ocular deviation and disconjugation, grimacing, myoclonus, and bizarre arm movements. Due to cardiovascular complications and ventilator requirements, most patients require intensive care unit (ICU) level care. 8, 9, 11 As in our discussant's evaluation, other disorders to include in the differential diagnosis for this presentation includes paraneoplastic or autoimmune causes of limbic encephalitis, toxins, heavy metals, and viral causes of encephalitis; in particular, herpes simplex virus (HSV).7
The CNS imaging findings in this condition include brain MRI abnormalities in about 30%55% of patients, which can include increased signal on fluid‐attenuated inversion recovery (FLAIR) or T2 sequences of the cerebral cortex, overlying meninges, or basal ganglia. Abnormalities in the temporal lobes, corpus callosum, and brainstem have also been described. As in our patient, CSF lymphocytic pleocytosis has also been noted.6, 8, 9
Although many cases of limbic encephalitis portend a poor prognosis with permanent neuropsychiatric sequelae and death, anti‐NMDAR can be very responsive to treatment; particularly if diagnosed early. Successful treatment of anti‐NMDAR encephalitis involves immunotherapy and, preferably, early surgical resection of any tumor. 6, 8, 9 Non‐paraneoplastic cases appear to require more aggressive and prolonged immunotherapies to avoid relapse. In both groups, a trend towards improved outcome has been noted in patients treated early in disease course (40 days from symptom onset).8 There are no established guidelines for the treatment of anti‐NMDAR encephalitis, and no randomized controlled trials have evaluated anti‐NMDAR encephalitis treatment. Observational studies of immune‐modulating therapies have shown efficacy with high‐dose steroids and the addition of plasma exchange and/or intravenous immune globulin. Rituximab and cyclophosphamide can be considered if patients fail to improve on other immunotherapies.9 Data from case series seem to suggest a lower risk of relapse in patients treated with immunotherapy.13
Exploration of this patient's persistent high fevers ultimately led to the serendipitous diagnosis of the increasingly recognized syndrome of anti‐NMDAR encephalitis, although in retrospect nearly all of the features of her presentation fit well with this condition. Thus, it was only by a chance finding on her abdominal CT scan that this patient was ultimately diagnosed with a treatable, noninfectious encephalitis associated with an ovarian teratoma. This case reinforces the importance of thorough patient evaluations and being prepared to draw meaningful conclusions from unexpected findings. Given how close this patient was to being discharged to a long‐term care facility, we found this case a fascinating yet sobering reminder to guard against prematurely concluding a syndrome to be untreatable.
KEY TEACHING POINTS
-
Anti‐NMDAR encephalitis is an increasingly recognized cause of autoimmune limbic encephalitis, and thus should be considered in patients with new‐onset psychiatric symptoms accompanied by seizures, autonomic instability, hypoventilation, or dyskinesias.
-
A thorough history, examination, and evaluation of data is critical to make an early diagnosis of anti‐NMDAR encephalitis, because, unlike other forms of limbic encephalitis, this condition may be very responsive to early initiation of treatment.
- , . N‐methyl‐D‐aspartate receptor subtypes: multiple roles in excitotoxicity and neurological disease. Neuroscientist. 2005;11:37–49.
- , . Recent advances in the phencyclidine model of schizophrenia. Am J Psychiatry. 1991;148:1301–1308.
- , , . NMDA receptor hypofunction model of schizophrenia. J Psychiatr Res. 1999;33:523–533.
- , , , et al. Ketamine‐induced NMDA receptor hypofunction as a model of memory impairment and psychosis. Neuropsychopharmacology. 1999;20:106–118.
- , , , , , . Paraneoplastic encephalitis, psychiatric symptoms, and hypoventilation in ovarian teratoma. Ann Neurol. 2005;58:594–604.
- , , , et al. Paraneoplastic anti‐N‐methyl‐D‐aspartate receptor encephalitis associated with ovarian teratoma. Ann Neurol. 2007;61:25–36.
- , . Limbic encephalitis and variants: classification, diagnosis and treatment. Neurologist. 2007;13:261–271.
- , , , et al. N‐methyl‐D‐aspartate antibody encephalitis: temporal progression of clinical and paraclinical observations in a predominantly non‐paraneoplastic disorder of both sexes. Brain. 2010;133:1655–1667.
- , . NMDA receptor antibody encephalitis. Curr Neurol Neurosci Rep. 2011;11:298–304.
- , , , et al. Expression of various glutamate receptors including N‐methyl‐D‐aspartate receptor (NMDAR) in an ovarian teratoma removed from a young woman with anti‐NMDAR encephalitis. Intern Med. 2010;49:2167–2173.
- , , , et al. Anti‐NMDA‐receptor encephalitis: case series and analysis of the effects of antibodies. Lancet Neurol. 2008;7:1074–1075.
- , , , , . Clinical experience and laboratory investigations in patients with anti‐NMDAR encephalitis. Lancet Neurol. 2011;10:63–74.
- , , , et al. Analysis of relapses in anti‐NMDAR encephalitis. Neurology. 2011;77:996–999.
The approach to clinical conundrums by an expert clinician is revealed through the presentation of an actual patient's case in an approach typical of a morning report. Similarly to patient care, sequential pieces of information are provided to the clinician, who is unfamiliar with the case. The focus is on the thought processes of both the clinical team caring for the patient and the discussant.
A previously healthy 18‐year‐old woman living in the Pacific Northwest was brought in by her parents to a local hospital with a 4‐day history of acting crazy. Two weeks prior to presentation, she complained of a new‐onset severe headache, diaphoresis, and chills. Four days prior to presentation, she became progressively more impulsive, which ultimately included jumping out of a moving vehicle and running away from home. She experienced unexplained emotional outbursts and was unable to identify familiar relatives or common objects. Additionally, she began having hyperventilation spells and auditory hallucinations.
In an adolescent presenting with erratic behavior, one should consider the possibility of substance abuse or a psychiatric disease such as bipolar disorder with manic features, psychotic manifestations of severe depression, or early schizophrenia. However, it is important to first rule out non‐psychiatric disease, with a diagnostic approach dependent on her human immunodeficiency virus (HIV) status. The presence of headache, diaphoresis, and chills raises concern for an infectious or noninfectious inflammatory central nervous system process. In addition to the effects of illicit drugs such as cocaine or methamphetamine, this presentation may be consistent with a medication‐ or herbal‐induced anticholinergic syndrome, which may present with confusion, ataxia, coma, and cardiopulmonary failure. Since this case originates in the Northwest, one should be aware of the regional outbreak of Cryptococcus gattii in immunocompetent hosts, and that local hallucinogenic plants, such as jimson weed or mushrooms (Amanita muscaria) can cause anticholinergic syndromes. At this point, the differential diagnosis is broad, and evaluation should focus on potentially reversible life‐threatening conditions; in particular, herpes encephalitis. In addition to a detailed history, examination, and routine laboratory studies including HIV serology, I would obtain a drug screen, and order a computed tomography (CT) scan of the brain before performing a lumbar puncture. I would also order a magnetic resonance imaging (MRI) study to evaluate for meningeal or cerebral enhancement suggestive of encephalitis.
The patient had no past medical, psychiatric, or surgical history and took no medications. She lived with her parents who thought she neither used illicit drugs or alcohol, nor was sexually active. She had recently graduated high school and was planning to attend college. Her family history was notable for a mother with bipolar and seizure disorders, and 2 healthy younger siblings. Her family had a healthy cat and dog, and reported a large number of bats living nearby. She had never traveled outside the western United States. The patient presented in late spring, but there was no obvious history of mosquito bites. Her last menstrual period was 4 months prior to presentation. Full review of systems was otherwise negative.
The family history of mood disorder supports continued consideration of bipolar disorder with psychotic manifestations. However, infectious or inflammatory processes remain highest on the differential at this point. The duration of symptoms makes common bacterial meningitis etiologies (Streptococcus, Neisseria, Haemophilus, Listeria) less likely, but would be consistent with herpes simplex encephalitis or lupus cerebritis. Additional infectious considerations would include other viral (eg, varicella zoster virus, Epstein‐Barr virus, enteroviruses, and the arthropod‐borne encephalitides) or unusual bacterial encephalitic syndromes. Although the health status of pets is rarely helpful, dogs can carry ticks that harbor Borrelia burgdorferi (the agent of Lyme disease), which may present with central nervous system (CNS) manifestations. Other conditions associated with pets (such as leptospirosis or cat scratch disease) seem unlikely. The exposure to bats raises the possibility of rabies infection. If she is HIV‐positive, one would need to consider the possibility of opportunistic infections such as cytomegalovirus (CMV), Cryptococcus, cerebral toxoplasmosis, and progressive multifocal leukoencephalopathy (PML) caused by JC virus reaction. Finally, regardless of history, given the patient's amenorrhea, we must perform a pregnancy test.
The patient's temperature was 97.3F, heart rate 129 beats per minute, respiratory rate 19 breaths per minute, and her blood pressure 144/97 mmHg. She was an obese, well‐developed young woman, who was drowsy but arousable, with marked speech latency. Her cranium and oropharynx were normal, and her neck was supple. Aside from tachycardia, her cardiopulmonary, musculoskeletal, and skin exams were normal. Her abdomen was obese and soft, without masses or organomegaly. A pelvic examination was not performed. On neurologic exam, her strength was symmetrically diminished throughout (3+/5). Otherwise, she was oriented to person and general location, but not to day of week, month, or year. Her cranial nerves, sensation, deep tendon reflexes, and muscle tone were normal. A cerebellar examination, plantar response, and gait test were not performed. A brain MRI revealed only a small subarachnoid cyst and possible subtle enhancement of temporal lobes. Initial laboratory studies demonstrated: white blood cell count 14,000/mm3 (72% neutrophils, 17% lymphocytes, 9% monocytes, 2% eosinophils); hemoglobin 14.0 g/dL (mean corpuscular volume 87.4 fL); platelet count 417,000/mm3. Serum electrolytes, liver function tests, coagulation studies, thyroid stimulating hormone, serum ammonia, and urinalysis were normal. Her serum pregnancy test and urine toxicology screen were negative. A room air arterial blood gas revealed a pH of 7.49, PaCO2 32 mmHg, PaO2 89 mmHg; and a bicarbonate 24 mmol/L. Cerebrospinal fluid demonstrated: red cell count of 2/mm3; white cell count 17/mm3 (88% lymphocytes, 3% neutrophils, 9% monocytes); protein 19 mg/dL (normal 1555 mg/dL); and glucose of 79 mg/dL (normal 4080 mg/dL). Gram stain, fungal and bacterial cultures, and HIV serology were negative, and herpes simplex virus was not detected via polymerase chain reaction (PCR).
The tachycardia, respiratory alkalosis, and leukocytosis continue to suggest an infection or inflammatory state. Her neurological deterioration without focal findings, cerebrospinal fluid (CSF) lymphocytic pleocytosis with normal glucose and protein, and temporal lobe enhancement on MRI strongly suggest a meningoencephalitis. This would be an unusual presentation for most bacterial pathogens, but Mycobacterium, Rickettsia, Listeria, Mycoplasma, and Bartonella may rarely mimic encephalitis. Autoimmune encephalitis secondary to lupus, vasculitis, or other autoimmune disorder remains possible, but at this point an infectious encephalitis, particularly herpes encephalitis, is my highest concern. West Nile virus must be considered, but usually produces a severe illness only in immunocompromised or elderly patients. Additionally, despite the rarity of rabies, the patient's exposure to bats and the rapid clinical deterioration, suggest this possibility. In addition to routine bacterial and viral analyses (eg, enteroviral panel), samples should be sent for rabies PCR and antibody testing, West Nile virus, Lyme disease, syphilis, and mycobacterial and fungal pathogens, such as the aforementioned Cryptococcus gattii. Finally, given her presenting syndrome and MRI, immediate treatment with acyclovir and antibiotics is indicated.
The patient was treated for presumed meningoencephalitis with acyclovir and ceftriaxone, but over the following several days became unresponsive to all stimuli and developed repetitive thrusting movements of her mouth, tongue, and jaw. On hospital day 10, with concern for seizures, pentobarbital coma was induced, and the patient was intubated and transferred to our facility. On arrival, her physical examination was essentially unchanged aside from being in a medical coma. Hematology, chemistries, and thyroid‐stimulating hormone (TSH) were again unremarkable with the exception of an elevated creatine kinase (414 U/L) and a new anemia (hemoglobin 8.9 g/dL; mean corpuscular volume 87.6 fL) without evidence of iron deficiency or hemolysis. Blood and urine cultures were negative. Repeat cerebrospinal fluid analysis was essentially unchanged, revealing a red cell count of 1/mm3; white cell count 20/mm3 (86% lymphocytes, 2% neutrophils, 12% monocytes); protein 14 mg/dL; glucose 63 mg/dL, and negative Gram stain. Continuous electroencephalography revealed diffuse generalized slowing, but no seizure activity. An extensive evaluation for viral, bacterial, autoimmune, and paraneoplastic disorders was negative, including tests for anti‐acetylcholine (ACh) receptor binding antibody, anti‐striated muscle antibody, anti‐N‐type calcium channel antibody, anti‐P/Q‐type calcium channel antibodies, anto‐cancer associated retinopathy (CAR) antibody (also known as anti‐recoverin antibody), and anti‐collapsin respons mediator protein (CRMP‐5). Without confirmatory results and continued deterioration, she was empirically treated with methylprednisolone for presumed autoimmune encephalitis from hospital days 16 to 21. The patient remained unresponsive and ventilator‐dependent, despite removal of all sedation. She experienced intermittent fevers as high as 40.5C, remained tachycardic, hypertensive, and exhibited orofacial dyskinesias and jaw clenching, ultimately requiring botulinum toxin injections to prevent tongue biting. Given the lack of improvement despite attempted therapies, a working diagnosis of viral encephalitis with lasting neuropsychiatric sequelae was made. A tracheostomy and percutaneous gastrostomy tube were placed, and a long‐term ventilator care facility was identified.
I continue to wonder if this may be an autoimmune encephalitis, and am concerned about her unexplained fevers. Neuroleptic malignant syndrome secondary to misuse of her parents' medications should be considered in light of the elevated creatine kinase, although the severity and duration of the syndrome seem more profound than I would anticipate. Tetanus could present with jaw dystonia, but the rest of the case does not seem to fit. At this point, considering the patient's young age and poor prognosis without identified etiology, prior to discharge I would argue for a brain biopsy looking for evidence of rabies, or other infectious or autoimmune etiologies of the patient's progressive neurologic deterioration.
On hospital day 25, due to the persistent fevers with concern for occult abscess, an abdominopelvic CT was obtained, which identified a complex 11.8 cm 9.0 cm adnexal mass consistent with a teratoma (Figure 1).
Given the size of the mass, it is surprising that the patient did not report abdominal symptoms and that the physicians were unable to palpate it on examination. The differential diagnosis of a complex adnexal mass in an adolescent should include an ectopic pregnancy, ovarian cysts, tubo‐ovarian abscess, rarely an ovarian carcinoma or leiomyosarcoma, and a teratoma or dermoid tumor. While I mentioned the possibility of a malignancy at the outset, I did not further consider it. Common neoplasms encountered in adolescent patients include lymphoma and leukemia, germ cell tumors (including teratomas), central nervous system tumors and sarcomas, many of which have been reported to cause paraneoplastic disorders. At this point, I now think her presumed teratoma is associated with a paraneoplastic syndrome resulting in her presentation of limbic encephalitis.
A literature search was performed by the managing clinicians who rapidly identified the association between teratoma and limbic encephalitis. The patient was initially treated with intravenous immune globulin (IVIG), with transient improvement in her mental status. Serology returned positive for the anti‐N‐methyl‐D‐aspartate receptor antibody, confirming the diagnosis of anti‐N‐methyl‐D‐aspartate receptor encephalitis. On hospital day 36, her mass was resected (Figure 2). Pathology was consistent with a mature teratoma. Postoperatively, the patient improved daily, and was discharged on hospital day 43 with a near complete neurologic recovery. Four months following discharge, the patient had enrolled full time in college.
COMMENTARY
The N‐methyl‐D‐aspartate receptor (NMDAR) is an important regulator of synaptic transmission and memory within the CNS. Our patient's case illustrates the increasingly recognized syndrome of anti‐NMDAR encephalitis. NMDAR hypofunction is hypothesized to result in the cognitive and behavioral abnormalities of schizophrenia, and direct antagonism of the NMDAR by drugs such as phencyclidine (PCP) and ketamine results in symptoms such as psychosis, hallucinations, delusions, agitation, and dissociative amnesia.14 This constellation of symptoms is very similar to some of the initial neuropsychiatric symptoms observed in patients with anti‐NMDAR encephalitis.
Anti‐NMDAR encephalitis was first described in 2005 as a paraneoplastic limbic encephalitis associated with ovarian teratoma.5, 6 Characterized by the subacute onset (days to weeks) of short‐term memory loss, psychiatric symptoms, and sleep disturbances, limbic encephalitis is an inflammatory process caused by autoantibodies against intracellular or extracellar antigens in the limbic system and other brain structures. Limbic encephalitides associated with antibodies to intracellular antigens (such as Hu, Ma2, CV2/CRMP5, and Amphiphysin) are more often associated with malignancies, have worse outcomes (permanent neuropsychiatric sequelae and death), and are less responsive to immune therapy. Conversely, it appears that both the paraneoplastic and non‐paraneoplastic variants of limbic encephalitis associated with antibodies against cell membrane antigens (such as NMDAR and Voltage Gated Potassium Channels) respond more favorably to therapy.7
As with limbic encephalitis in general, anti‐NMDAR encephalitis can be non‐paraneoplastic as well as paraneoplastic in etiology. In a recently published series of 44 consecutive patients with anti‐NMDAR encephalitis, tumors were present in only 9 cases (8 teratomas).8 When associated with a teratoma, it has been postulated that anti‐NMDAR antibodies develop and cross the bloodbrain barrier to target central nervous system NMDA receptors. This process results in down‐regulation of the neuronal surface NMDAR which then causes the psychiatric and behavioral changes described.6 The mechanism by which these antibodies traverse the bloodbrain barrier is not completely understood, but likely requires some disruption of the barrier in order to trigger anti‐NMDAR encephalitis.8, 9 Non‐paraneoplastic cases evidently involve other unknown stimuli for NMDAR antibody synthesisone report has suggested that subunits of the NMDAR are expressed by normal ovarian tissue, something which may explain the female predilection even in the cohort unaffected by teratomas.10
Most patients with anti‐NMDAR encephalitis are female and young (median age 23 years), although men and children are also affected.8, 9, 11 While the exact incidence of anti‐NMDAR encephalitis is still unknown, the increasing number of case reports suggests that it may be more frequent than any other type of paraneoplastic encephalitis.12 The majority of patients with anti‐NMDAR encephalitis experience an antecedent infectious prodrome (eg, diarrheal illness or upper respiratory infection [URI]), followed 1020 days later by progressive neuropsychiatric and behavioral symptoms which include confusion, memory deficits, impaired responsiveness, seizures, central hypoventilation, and signs of autonomic instability (tachycardia, tachypnea, diaphoresis, cardiac dysrhythmia, blood pressure instability, and dysthermia). At this stage, patients may also manifest a unique constellation of choreoathetoid orofacial and limb movements such as lip licking, chewing, sustained jaw clenching, jaw opening dystonias, ocular deviation and disconjugation, grimacing, myoclonus, and bizarre arm movements. Due to cardiovascular complications and ventilator requirements, most patients require intensive care unit (ICU) level care. 8, 9, 11 As in our discussant's evaluation, other disorders to include in the differential diagnosis for this presentation includes paraneoplastic or autoimmune causes of limbic encephalitis, toxins, heavy metals, and viral causes of encephalitis; in particular, herpes simplex virus (HSV).7
The CNS imaging findings in this condition include brain MRI abnormalities in about 30%55% of patients, which can include increased signal on fluid‐attenuated inversion recovery (FLAIR) or T2 sequences of the cerebral cortex, overlying meninges, or basal ganglia. Abnormalities in the temporal lobes, corpus callosum, and brainstem have also been described. As in our patient, CSF lymphocytic pleocytosis has also been noted.6, 8, 9
Although many cases of limbic encephalitis portend a poor prognosis with permanent neuropsychiatric sequelae and death, anti‐NMDAR can be very responsive to treatment; particularly if diagnosed early. Successful treatment of anti‐NMDAR encephalitis involves immunotherapy and, preferably, early surgical resection of any tumor. 6, 8, 9 Non‐paraneoplastic cases appear to require more aggressive and prolonged immunotherapies to avoid relapse. In both groups, a trend towards improved outcome has been noted in patients treated early in disease course (40 days from symptom onset).8 There are no established guidelines for the treatment of anti‐NMDAR encephalitis, and no randomized controlled trials have evaluated anti‐NMDAR encephalitis treatment. Observational studies of immune‐modulating therapies have shown efficacy with high‐dose steroids and the addition of plasma exchange and/or intravenous immune globulin. Rituximab and cyclophosphamide can be considered if patients fail to improve on other immunotherapies.9 Data from case series seem to suggest a lower risk of relapse in patients treated with immunotherapy.13
Exploration of this patient's persistent high fevers ultimately led to the serendipitous diagnosis of the increasingly recognized syndrome of anti‐NMDAR encephalitis, although in retrospect nearly all of the features of her presentation fit well with this condition. Thus, it was only by a chance finding on her abdominal CT scan that this patient was ultimately diagnosed with a treatable, noninfectious encephalitis associated with an ovarian teratoma. This case reinforces the importance of thorough patient evaluations and being prepared to draw meaningful conclusions from unexpected findings. Given how close this patient was to being discharged to a long‐term care facility, we found this case a fascinating yet sobering reminder to guard against prematurely concluding a syndrome to be untreatable.
KEY TEACHING POINTS
-
Anti‐NMDAR encephalitis is an increasingly recognized cause of autoimmune limbic encephalitis, and thus should be considered in patients with new‐onset psychiatric symptoms accompanied by seizures, autonomic instability, hypoventilation, or dyskinesias.
-
A thorough history, examination, and evaluation of data is critical to make an early diagnosis of anti‐NMDAR encephalitis, because, unlike other forms of limbic encephalitis, this condition may be very responsive to early initiation of treatment.
The approach to clinical conundrums by an expert clinician is revealed through the presentation of an actual patient's case in an approach typical of a morning report. Similarly to patient care, sequential pieces of information are provided to the clinician, who is unfamiliar with the case. The focus is on the thought processes of both the clinical team caring for the patient and the discussant.
A previously healthy 18‐year‐old woman living in the Pacific Northwest was brought in by her parents to a local hospital with a 4‐day history of acting crazy. Two weeks prior to presentation, she complained of a new‐onset severe headache, diaphoresis, and chills. Four days prior to presentation, she became progressively more impulsive, which ultimately included jumping out of a moving vehicle and running away from home. She experienced unexplained emotional outbursts and was unable to identify familiar relatives or common objects. Additionally, she began having hyperventilation spells and auditory hallucinations.
In an adolescent presenting with erratic behavior, one should consider the possibility of substance abuse or a psychiatric disease such as bipolar disorder with manic features, psychotic manifestations of severe depression, or early schizophrenia. However, it is important to first rule out non‐psychiatric disease, with a diagnostic approach dependent on her human immunodeficiency virus (HIV) status. The presence of headache, diaphoresis, and chills raises concern for an infectious or noninfectious inflammatory central nervous system process. In addition to the effects of illicit drugs such as cocaine or methamphetamine, this presentation may be consistent with a medication‐ or herbal‐induced anticholinergic syndrome, which may present with confusion, ataxia, coma, and cardiopulmonary failure. Since this case originates in the Northwest, one should be aware of the regional outbreak of Cryptococcus gattii in immunocompetent hosts, and that local hallucinogenic plants, such as jimson weed or mushrooms (Amanita muscaria) can cause anticholinergic syndromes. At this point, the differential diagnosis is broad, and evaluation should focus on potentially reversible life‐threatening conditions; in particular, herpes encephalitis. In addition to a detailed history, examination, and routine laboratory studies including HIV serology, I would obtain a drug screen, and order a computed tomography (CT) scan of the brain before performing a lumbar puncture. I would also order a magnetic resonance imaging (MRI) study to evaluate for meningeal or cerebral enhancement suggestive of encephalitis.
The patient had no past medical, psychiatric, or surgical history and took no medications. She lived with her parents who thought she neither used illicit drugs or alcohol, nor was sexually active. She had recently graduated high school and was planning to attend college. Her family history was notable for a mother with bipolar and seizure disorders, and 2 healthy younger siblings. Her family had a healthy cat and dog, and reported a large number of bats living nearby. She had never traveled outside the western United States. The patient presented in late spring, but there was no obvious history of mosquito bites. Her last menstrual period was 4 months prior to presentation. Full review of systems was otherwise negative.
The family history of mood disorder supports continued consideration of bipolar disorder with psychotic manifestations. However, infectious or inflammatory processes remain highest on the differential at this point. The duration of symptoms makes common bacterial meningitis etiologies (Streptococcus, Neisseria, Haemophilus, Listeria) less likely, but would be consistent with herpes simplex encephalitis or lupus cerebritis. Additional infectious considerations would include other viral (eg, varicella zoster virus, Epstein‐Barr virus, enteroviruses, and the arthropod‐borne encephalitides) or unusual bacterial encephalitic syndromes. Although the health status of pets is rarely helpful, dogs can carry ticks that harbor Borrelia burgdorferi (the agent of Lyme disease), which may present with central nervous system (CNS) manifestations. Other conditions associated with pets (such as leptospirosis or cat scratch disease) seem unlikely. The exposure to bats raises the possibility of rabies infection. If she is HIV‐positive, one would need to consider the possibility of opportunistic infections such as cytomegalovirus (CMV), Cryptococcus, cerebral toxoplasmosis, and progressive multifocal leukoencephalopathy (PML) caused by JC virus reaction. Finally, regardless of history, given the patient's amenorrhea, we must perform a pregnancy test.
The patient's temperature was 97.3F, heart rate 129 beats per minute, respiratory rate 19 breaths per minute, and her blood pressure 144/97 mmHg. She was an obese, well‐developed young woman, who was drowsy but arousable, with marked speech latency. Her cranium and oropharynx were normal, and her neck was supple. Aside from tachycardia, her cardiopulmonary, musculoskeletal, and skin exams were normal. Her abdomen was obese and soft, without masses or organomegaly. A pelvic examination was not performed. On neurologic exam, her strength was symmetrically diminished throughout (3+/5). Otherwise, she was oriented to person and general location, but not to day of week, month, or year. Her cranial nerves, sensation, deep tendon reflexes, and muscle tone were normal. A cerebellar examination, plantar response, and gait test were not performed. A brain MRI revealed only a small subarachnoid cyst and possible subtle enhancement of temporal lobes. Initial laboratory studies demonstrated: white blood cell count 14,000/mm3 (72% neutrophils, 17% lymphocytes, 9% monocytes, 2% eosinophils); hemoglobin 14.0 g/dL (mean corpuscular volume 87.4 fL); platelet count 417,000/mm3. Serum electrolytes, liver function tests, coagulation studies, thyroid stimulating hormone, serum ammonia, and urinalysis were normal. Her serum pregnancy test and urine toxicology screen were negative. A room air arterial blood gas revealed a pH of 7.49, PaCO2 32 mmHg, PaO2 89 mmHg; and a bicarbonate 24 mmol/L. Cerebrospinal fluid demonstrated: red cell count of 2/mm3; white cell count 17/mm3 (88% lymphocytes, 3% neutrophils, 9% monocytes); protein 19 mg/dL (normal 1555 mg/dL); and glucose of 79 mg/dL (normal 4080 mg/dL). Gram stain, fungal and bacterial cultures, and HIV serology were negative, and herpes simplex virus was not detected via polymerase chain reaction (PCR).
The tachycardia, respiratory alkalosis, and leukocytosis continue to suggest an infection or inflammatory state. Her neurological deterioration without focal findings, cerebrospinal fluid (CSF) lymphocytic pleocytosis with normal glucose and protein, and temporal lobe enhancement on MRI strongly suggest a meningoencephalitis. This would be an unusual presentation for most bacterial pathogens, but Mycobacterium, Rickettsia, Listeria, Mycoplasma, and Bartonella may rarely mimic encephalitis. Autoimmune encephalitis secondary to lupus, vasculitis, or other autoimmune disorder remains possible, but at this point an infectious encephalitis, particularly herpes encephalitis, is my highest concern. West Nile virus must be considered, but usually produces a severe illness only in immunocompromised or elderly patients. Additionally, despite the rarity of rabies, the patient's exposure to bats and the rapid clinical deterioration, suggest this possibility. In addition to routine bacterial and viral analyses (eg, enteroviral panel), samples should be sent for rabies PCR and antibody testing, West Nile virus, Lyme disease, syphilis, and mycobacterial and fungal pathogens, such as the aforementioned Cryptococcus gattii. Finally, given her presenting syndrome and MRI, immediate treatment with acyclovir and antibiotics is indicated.
The patient was treated for presumed meningoencephalitis with acyclovir and ceftriaxone, but over the following several days became unresponsive to all stimuli and developed repetitive thrusting movements of her mouth, tongue, and jaw. On hospital day 10, with concern for seizures, pentobarbital coma was induced, and the patient was intubated and transferred to our facility. On arrival, her physical examination was essentially unchanged aside from being in a medical coma. Hematology, chemistries, and thyroid‐stimulating hormone (TSH) were again unremarkable with the exception of an elevated creatine kinase (414 U/L) and a new anemia (hemoglobin 8.9 g/dL; mean corpuscular volume 87.6 fL) without evidence of iron deficiency or hemolysis. Blood and urine cultures were negative. Repeat cerebrospinal fluid analysis was essentially unchanged, revealing a red cell count of 1/mm3; white cell count 20/mm3 (86% lymphocytes, 2% neutrophils, 12% monocytes); protein 14 mg/dL; glucose 63 mg/dL, and negative Gram stain. Continuous electroencephalography revealed diffuse generalized slowing, but no seizure activity. An extensive evaluation for viral, bacterial, autoimmune, and paraneoplastic disorders was negative, including tests for anti‐acetylcholine (ACh) receptor binding antibody, anti‐striated muscle antibody, anti‐N‐type calcium channel antibody, anti‐P/Q‐type calcium channel antibodies, anto‐cancer associated retinopathy (CAR) antibody (also known as anti‐recoverin antibody), and anti‐collapsin respons mediator protein (CRMP‐5). Without confirmatory results and continued deterioration, she was empirically treated with methylprednisolone for presumed autoimmune encephalitis from hospital days 16 to 21. The patient remained unresponsive and ventilator‐dependent, despite removal of all sedation. She experienced intermittent fevers as high as 40.5C, remained tachycardic, hypertensive, and exhibited orofacial dyskinesias and jaw clenching, ultimately requiring botulinum toxin injections to prevent tongue biting. Given the lack of improvement despite attempted therapies, a working diagnosis of viral encephalitis with lasting neuropsychiatric sequelae was made. A tracheostomy and percutaneous gastrostomy tube were placed, and a long‐term ventilator care facility was identified.
I continue to wonder if this may be an autoimmune encephalitis, and am concerned about her unexplained fevers. Neuroleptic malignant syndrome secondary to misuse of her parents' medications should be considered in light of the elevated creatine kinase, although the severity and duration of the syndrome seem more profound than I would anticipate. Tetanus could present with jaw dystonia, but the rest of the case does not seem to fit. At this point, considering the patient's young age and poor prognosis without identified etiology, prior to discharge I would argue for a brain biopsy looking for evidence of rabies, or other infectious or autoimmune etiologies of the patient's progressive neurologic deterioration.
On hospital day 25, due to the persistent fevers with concern for occult abscess, an abdominopelvic CT was obtained, which identified a complex 11.8 cm 9.0 cm adnexal mass consistent with a teratoma (Figure 1).
Given the size of the mass, it is surprising that the patient did not report abdominal symptoms and that the physicians were unable to palpate it on examination. The differential diagnosis of a complex adnexal mass in an adolescent should include an ectopic pregnancy, ovarian cysts, tubo‐ovarian abscess, rarely an ovarian carcinoma or leiomyosarcoma, and a teratoma or dermoid tumor. While I mentioned the possibility of a malignancy at the outset, I did not further consider it. Common neoplasms encountered in adolescent patients include lymphoma and leukemia, germ cell tumors (including teratomas), central nervous system tumors and sarcomas, many of which have been reported to cause paraneoplastic disorders. At this point, I now think her presumed teratoma is associated with a paraneoplastic syndrome resulting in her presentation of limbic encephalitis.
A literature search was performed by the managing clinicians who rapidly identified the association between teratoma and limbic encephalitis. The patient was initially treated with intravenous immune globulin (IVIG), with transient improvement in her mental status. Serology returned positive for the anti‐N‐methyl‐D‐aspartate receptor antibody, confirming the diagnosis of anti‐N‐methyl‐D‐aspartate receptor encephalitis. On hospital day 36, her mass was resected (Figure 2). Pathology was consistent with a mature teratoma. Postoperatively, the patient improved daily, and was discharged on hospital day 43 with a near complete neurologic recovery. Four months following discharge, the patient had enrolled full time in college.
COMMENTARY
The N‐methyl‐D‐aspartate receptor (NMDAR) is an important regulator of synaptic transmission and memory within the CNS. Our patient's case illustrates the increasingly recognized syndrome of anti‐NMDAR encephalitis. NMDAR hypofunction is hypothesized to result in the cognitive and behavioral abnormalities of schizophrenia, and direct antagonism of the NMDAR by drugs such as phencyclidine (PCP) and ketamine results in symptoms such as psychosis, hallucinations, delusions, agitation, and dissociative amnesia.14 This constellation of symptoms is very similar to some of the initial neuropsychiatric symptoms observed in patients with anti‐NMDAR encephalitis.
Anti‐NMDAR encephalitis was first described in 2005 as a paraneoplastic limbic encephalitis associated with ovarian teratoma.5, 6 Characterized by the subacute onset (days to weeks) of short‐term memory loss, psychiatric symptoms, and sleep disturbances, limbic encephalitis is an inflammatory process caused by autoantibodies against intracellular or extracellar antigens in the limbic system and other brain structures. Limbic encephalitides associated with antibodies to intracellular antigens (such as Hu, Ma2, CV2/CRMP5, and Amphiphysin) are more often associated with malignancies, have worse outcomes (permanent neuropsychiatric sequelae and death), and are less responsive to immune therapy. Conversely, it appears that both the paraneoplastic and non‐paraneoplastic variants of limbic encephalitis associated with antibodies against cell membrane antigens (such as NMDAR and Voltage Gated Potassium Channels) respond more favorably to therapy.7
As with limbic encephalitis in general, anti‐NMDAR encephalitis can be non‐paraneoplastic as well as paraneoplastic in etiology. In a recently published series of 44 consecutive patients with anti‐NMDAR encephalitis, tumors were present in only 9 cases (8 teratomas).8 When associated with a teratoma, it has been postulated that anti‐NMDAR antibodies develop and cross the bloodbrain barrier to target central nervous system NMDA receptors. This process results in down‐regulation of the neuronal surface NMDAR which then causes the psychiatric and behavioral changes described.6 The mechanism by which these antibodies traverse the bloodbrain barrier is not completely understood, but likely requires some disruption of the barrier in order to trigger anti‐NMDAR encephalitis.8, 9 Non‐paraneoplastic cases evidently involve other unknown stimuli for NMDAR antibody synthesisone report has suggested that subunits of the NMDAR are expressed by normal ovarian tissue, something which may explain the female predilection even in the cohort unaffected by teratomas.10
Most patients with anti‐NMDAR encephalitis are female and young (median age 23 years), although men and children are also affected.8, 9, 11 While the exact incidence of anti‐NMDAR encephalitis is still unknown, the increasing number of case reports suggests that it may be more frequent than any other type of paraneoplastic encephalitis.12 The majority of patients with anti‐NMDAR encephalitis experience an antecedent infectious prodrome (eg, diarrheal illness or upper respiratory infection [URI]), followed 1020 days later by progressive neuropsychiatric and behavioral symptoms which include confusion, memory deficits, impaired responsiveness, seizures, central hypoventilation, and signs of autonomic instability (tachycardia, tachypnea, diaphoresis, cardiac dysrhythmia, blood pressure instability, and dysthermia). At this stage, patients may also manifest a unique constellation of choreoathetoid orofacial and limb movements such as lip licking, chewing, sustained jaw clenching, jaw opening dystonias, ocular deviation and disconjugation, grimacing, myoclonus, and bizarre arm movements. Due to cardiovascular complications and ventilator requirements, most patients require intensive care unit (ICU) level care. 8, 9, 11 As in our discussant's evaluation, other disorders to include in the differential diagnosis for this presentation includes paraneoplastic or autoimmune causes of limbic encephalitis, toxins, heavy metals, and viral causes of encephalitis; in particular, herpes simplex virus (HSV).7
The CNS imaging findings in this condition include brain MRI abnormalities in about 30%55% of patients, which can include increased signal on fluid‐attenuated inversion recovery (FLAIR) or T2 sequences of the cerebral cortex, overlying meninges, or basal ganglia. Abnormalities in the temporal lobes, corpus callosum, and brainstem have also been described. As in our patient, CSF lymphocytic pleocytosis has also been noted.6, 8, 9
Although many cases of limbic encephalitis portend a poor prognosis with permanent neuropsychiatric sequelae and death, anti‐NMDAR can be very responsive to treatment; particularly if diagnosed early. Successful treatment of anti‐NMDAR encephalitis involves immunotherapy and, preferably, early surgical resection of any tumor. 6, 8, 9 Non‐paraneoplastic cases appear to require more aggressive and prolonged immunotherapies to avoid relapse. In both groups, a trend towards improved outcome has been noted in patients treated early in disease course (40 days from symptom onset).8 There are no established guidelines for the treatment of anti‐NMDAR encephalitis, and no randomized controlled trials have evaluated anti‐NMDAR encephalitis treatment. Observational studies of immune‐modulating therapies have shown efficacy with high‐dose steroids and the addition of plasma exchange and/or intravenous immune globulin. Rituximab and cyclophosphamide can be considered if patients fail to improve on other immunotherapies.9 Data from case series seem to suggest a lower risk of relapse in patients treated with immunotherapy.13
Exploration of this patient's persistent high fevers ultimately led to the serendipitous diagnosis of the increasingly recognized syndrome of anti‐NMDAR encephalitis, although in retrospect nearly all of the features of her presentation fit well with this condition. Thus, it was only by a chance finding on her abdominal CT scan that this patient was ultimately diagnosed with a treatable, noninfectious encephalitis associated with an ovarian teratoma. This case reinforces the importance of thorough patient evaluations and being prepared to draw meaningful conclusions from unexpected findings. Given how close this patient was to being discharged to a long‐term care facility, we found this case a fascinating yet sobering reminder to guard against prematurely concluding a syndrome to be untreatable.
KEY TEACHING POINTS
-
Anti‐NMDAR encephalitis is an increasingly recognized cause of autoimmune limbic encephalitis, and thus should be considered in patients with new‐onset psychiatric symptoms accompanied by seizures, autonomic instability, hypoventilation, or dyskinesias.
-
A thorough history, examination, and evaluation of data is critical to make an early diagnosis of anti‐NMDAR encephalitis, because, unlike other forms of limbic encephalitis, this condition may be very responsive to early initiation of treatment.
- , . N‐methyl‐D‐aspartate receptor subtypes: multiple roles in excitotoxicity and neurological disease. Neuroscientist. 2005;11:37–49.
- , . Recent advances in the phencyclidine model of schizophrenia. Am J Psychiatry. 1991;148:1301–1308.
- , , . NMDA receptor hypofunction model of schizophrenia. J Psychiatr Res. 1999;33:523–533.
- , , , et al. Ketamine‐induced NMDA receptor hypofunction as a model of memory impairment and psychosis. Neuropsychopharmacology. 1999;20:106–118.
- , , , , , . Paraneoplastic encephalitis, psychiatric symptoms, and hypoventilation in ovarian teratoma. Ann Neurol. 2005;58:594–604.
- , , , et al. Paraneoplastic anti‐N‐methyl‐D‐aspartate receptor encephalitis associated with ovarian teratoma. Ann Neurol. 2007;61:25–36.
- , . Limbic encephalitis and variants: classification, diagnosis and treatment. Neurologist. 2007;13:261–271.
- , , , et al. N‐methyl‐D‐aspartate antibody encephalitis: temporal progression of clinical and paraclinical observations in a predominantly non‐paraneoplastic disorder of both sexes. Brain. 2010;133:1655–1667.
- , . NMDA receptor antibody encephalitis. Curr Neurol Neurosci Rep. 2011;11:298–304.
- , , , et al. Expression of various glutamate receptors including N‐methyl‐D‐aspartate receptor (NMDAR) in an ovarian teratoma removed from a young woman with anti‐NMDAR encephalitis. Intern Med. 2010;49:2167–2173.
- , , , et al. Anti‐NMDA‐receptor encephalitis: case series and analysis of the effects of antibodies. Lancet Neurol. 2008;7:1074–1075.
- , , , , . Clinical experience and laboratory investigations in patients with anti‐NMDAR encephalitis. Lancet Neurol. 2011;10:63–74.
- , , , et al. Analysis of relapses in anti‐NMDAR encephalitis. Neurology. 2011;77:996–999.
- , . N‐methyl‐D‐aspartate receptor subtypes: multiple roles in excitotoxicity and neurological disease. Neuroscientist. 2005;11:37–49.
- , . Recent advances in the phencyclidine model of schizophrenia. Am J Psychiatry. 1991;148:1301–1308.
- , , . NMDA receptor hypofunction model of schizophrenia. J Psychiatr Res. 1999;33:523–533.
- , , , et al. Ketamine‐induced NMDA receptor hypofunction as a model of memory impairment and psychosis. Neuropsychopharmacology. 1999;20:106–118.
- , , , , , . Paraneoplastic encephalitis, psychiatric symptoms, and hypoventilation in ovarian teratoma. Ann Neurol. 2005;58:594–604.
- , , , et al. Paraneoplastic anti‐N‐methyl‐D‐aspartate receptor encephalitis associated with ovarian teratoma. Ann Neurol. 2007;61:25–36.
- , . Limbic encephalitis and variants: classification, diagnosis and treatment. Neurologist. 2007;13:261–271.
- , , , et al. N‐methyl‐D‐aspartate antibody encephalitis: temporal progression of clinical and paraclinical observations in a predominantly non‐paraneoplastic disorder of both sexes. Brain. 2010;133:1655–1667.
- , . NMDA receptor antibody encephalitis. Curr Neurol Neurosci Rep. 2011;11:298–304.
- , , , et al. Expression of various glutamate receptors including N‐methyl‐D‐aspartate receptor (NMDAR) in an ovarian teratoma removed from a young woman with anti‐NMDAR encephalitis. Intern Med. 2010;49:2167–2173.
- , , , et al. Anti‐NMDA‐receptor encephalitis: case series and analysis of the effects of antibodies. Lancet Neurol. 2008;7:1074–1075.
- , , , , . Clinical experience and laboratory investigations in patients with anti‐NMDAR encephalitis. Lancet Neurol. 2011;10:63–74.
- , , , et al. Analysis of relapses in anti‐NMDAR encephalitis. Neurology. 2011;77:996–999.
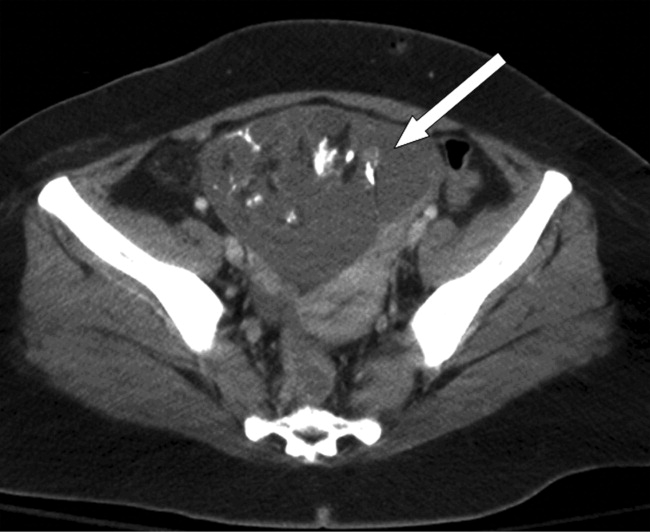
Managing Serious Surgical Illness
Editor's Note: This article is the first in a series on surgical palliative care that will appear periodically in Surgery News. The series, which will include contributions from members of the American College of Surgeons' Surgical Palliative Care Task Force, is intended to inform readers about the variety of issues involved in managing patients with serious or terminal illnesses and the role surgeons can play in providing the best possible care for these individuals.
If I were asked what has made the biggest impact on the field of surgery during my 30-year career, I would say the transition to evidence-based practice as a benchmark of quality and the recognition of quality of life outcomes as meaningful measures of care have been equally important. These represent an evolution from the surgeon-centric practice of the past to the patient-centered practice of the present.
But I believe we are at the point of another pendulum swing, because the "patient-centeredness" concept not only has failed to prevent vast and often ineffectual health care expenditures, but might actually be contributing to them.

I recently asked a physically and emotionally exhausted family member of an "ICU to nowhere" patient why he thought patients get "stuck" in the ICU. He answered eloquently, "People just don’t think they should die."
The current conceptual framework for care of the seriously ill is unable to respond to the psychological and spiritual questions raised by this comment. Disease management alone will not break this type of gridlock, nor will it leave patients and families with a lasting sense of support.
Surgical palliative care is an evidence-based and interdisciplinary approach (consisting of surgery, nursing, social work, chaplaincy, counseling, and others) to caring for patients who are seriously or terminally ill.
Palliative care includes communication skills (disclosure of prognosis, setting goals, advance care planning), pain and non-pain symptom management, ethics and conflict resolution, and self-awareness. Palliative care emphasizes continuity of care across clinical settings and services, attention to spiritual needs, psychosocial support for patients and families, and bereavement support for families of the deceased and team members who cared for them.
Although the origins of palliative care are identifiable in the modern hospice movement, its applicability goes far beyond the hospice-appropriate population. For example, in my own in-hospital practice, only about half of my palliative care consultations are appropriate for hospice referral. Some patients I have subsequently referred for liver and kidney transplantation; numerous others have proceeded to primary surgical management of cancer; and still others have returned to work following trauma rehabilitation.
During the past 15 years, the American College of Surgeons has strongly supported the concept of palliative care through position statements, ACS Bulletin articles, and education initiatives for surgeons. The Commission on Cancer has endorsed palliative care in its Cancer Program Standards 2012 by requiring the availability of palliative care services. The ABS has joined nine other member boards of the American Board of Medical Specialties (ABMS) in offering subspecialty certification in Hospice and Palliative Medicine (HPM). Although the number of surgeons specializing in palliative medicine will be very small, the need for expertise in this area will grow as the public and practitioners recognize the rewards of an evidence-based palliative care for seriously ill patients, their families, and surgical practitioners.
Dr. Dunn, an ACS Fellow based in Erie, Pa., is chair of the ACS Surgical Palliative Care Task Force.
Editor's Note: This article is the first in a series on surgical palliative care that will appear periodically in Surgery News. The series, which will include contributions from members of the American College of Surgeons' Surgical Palliative Care Task Force, is intended to inform readers about the variety of issues involved in managing patients with serious or terminal illnesses and the role surgeons can play in providing the best possible care for these individuals.
If I were asked what has made the biggest impact on the field of surgery during my 30-year career, I would say the transition to evidence-based practice as a benchmark of quality and the recognition of quality of life outcomes as meaningful measures of care have been equally important. These represent an evolution from the surgeon-centric practice of the past to the patient-centered practice of the present.
But I believe we are at the point of another pendulum swing, because the "patient-centeredness" concept not only has failed to prevent vast and often ineffectual health care expenditures, but might actually be contributing to them.
I recently asked a physically and emotionally exhausted family member of an "ICU to nowhere" patient why he thought patients get "stuck" in the ICU. He answered eloquently, "People just don’t think they should die."
The current conceptual framework for care of the seriously ill is unable to respond to the psychological and spiritual questions raised by this comment. Disease management alone will not break this type of gridlock, nor will it leave patients and families with a lasting sense of support.
Surgical palliative care is an evidence-based and interdisciplinary approach (consisting of surgery, nursing, social work, chaplaincy, counseling, and others) to caring for patients who are seriously or terminally ill.
Palliative care includes communication skills (disclosure of prognosis, setting goals, advance care planning), pain and non-pain symptom management, ethics and conflict resolution, and self-awareness. Palliative care emphasizes continuity of care across clinical settings and services, attention to spiritual needs, psychosocial support for patients and families, and bereavement support for families of the deceased and team members who cared for them.
Although the origins of palliative care are identifiable in the modern hospice movement, its applicability goes far beyond the hospice-appropriate population. For example, in my own in-hospital practice, only about half of my palliative care consultations are appropriate for hospice referral. Some patients I have subsequently referred for liver and kidney transplantation; numerous others have proceeded to primary surgical management of cancer; and still others have returned to work following trauma rehabilitation.
During the past 15 years, the American College of Surgeons has strongly supported the concept of palliative care through position statements, ACS Bulletin articles, and education initiatives for surgeons. The Commission on Cancer has endorsed palliative care in its Cancer Program Standards 2012 by requiring the availability of palliative care services. The ABS has joined nine other member boards of the American Board of Medical Specialties (ABMS) in offering subspecialty certification in Hospice and Palliative Medicine (HPM). Although the number of surgeons specializing in palliative medicine will be very small, the need for expertise in this area will grow as the public and practitioners recognize the rewards of an evidence-based palliative care for seriously ill patients, their families, and surgical practitioners.
Dr. Dunn, an ACS Fellow based in Erie, Pa., is chair of the ACS Surgical Palliative Care Task Force.
Editor's Note: This article is the first in a series on surgical palliative care that will appear periodically in Surgery News. The series, which will include contributions from members of the American College of Surgeons' Surgical Palliative Care Task Force, is intended to inform readers about the variety of issues involved in managing patients with serious or terminal illnesses and the role surgeons can play in providing the best possible care for these individuals.
If I were asked what has made the biggest impact on the field of surgery during my 30-year career, I would say the transition to evidence-based practice as a benchmark of quality and the recognition of quality of life outcomes as meaningful measures of care have been equally important. These represent an evolution from the surgeon-centric practice of the past to the patient-centered practice of the present.
But I believe we are at the point of another pendulum swing, because the "patient-centeredness" concept not only has failed to prevent vast and often ineffectual health care expenditures, but might actually be contributing to them.
I recently asked a physically and emotionally exhausted family member of an "ICU to nowhere" patient why he thought patients get "stuck" in the ICU. He answered eloquently, "People just don’t think they should die."
The current conceptual framework for care of the seriously ill is unable to respond to the psychological and spiritual questions raised by this comment. Disease management alone will not break this type of gridlock, nor will it leave patients and families with a lasting sense of support.
Surgical palliative care is an evidence-based and interdisciplinary approach (consisting of surgery, nursing, social work, chaplaincy, counseling, and others) to caring for patients who are seriously or terminally ill.
Palliative care includes communication skills (disclosure of prognosis, setting goals, advance care planning), pain and non-pain symptom management, ethics and conflict resolution, and self-awareness. Palliative care emphasizes continuity of care across clinical settings and services, attention to spiritual needs, psychosocial support for patients and families, and bereavement support for families of the deceased and team members who cared for them.
Although the origins of palliative care are identifiable in the modern hospice movement, its applicability goes far beyond the hospice-appropriate population. For example, in my own in-hospital practice, only about half of my palliative care consultations are appropriate for hospice referral. Some patients I have subsequently referred for liver and kidney transplantation; numerous others have proceeded to primary surgical management of cancer; and still others have returned to work following trauma rehabilitation.
During the past 15 years, the American College of Surgeons has strongly supported the concept of palliative care through position statements, ACS Bulletin articles, and education initiatives for surgeons. The Commission on Cancer has endorsed palliative care in its Cancer Program Standards 2012 by requiring the availability of palliative care services. The ABS has joined nine other member boards of the American Board of Medical Specialties (ABMS) in offering subspecialty certification in Hospice and Palliative Medicine (HPM). Although the number of surgeons specializing in palliative medicine will be very small, the need for expertise in this area will grow as the public and practitioners recognize the rewards of an evidence-based palliative care for seriously ill patients, their families, and surgical practitioners.
Dr. Dunn, an ACS Fellow based in Erie, Pa., is chair of the ACS Surgical Palliative Care Task Force.

Factor appears safe, effective in hemophilia B

A novel therapy can prevent bleeding episodes in patients with hemophilia B, results of an industry-funded study suggest.
The goal of the phase 3 study, called B-LONG, was to evaluate the safety and efficacy of a long-lasting recombinant factor IX Fc fusion protein (rFIXFc, also known as eftrenonacog alfa and Alprolix).
Researchers found that a single injection of rFIXFc was sufficient to control more than 90% of bleeding episodes in males with hemophilia B.
In addition, none of the patients developed inhibitors, and the factor was generally well-tolerated.
The companies developing rFIXFc, Biogen Idec and Sobi, announced these results on September 26.
“Our companies are pioneering the application of Fc fusion technology to extend the half-life of clotting factors,” said Geoffrey McDonough, MD, Chief Executive Officer of Sobi, a biopharmaceutical company based in Stockholm, Sweden.
“Fc fusion technology utilizes a naturally occurring recycling pathway that has been successfully employed in other therapeutic areas. This approach holds promise for combining more consistent protection with fewer injections.”
Study design
To determine if rFIXFc does, in fact, provide bleeding protection with fewer injections, researchers administered the factor to 123 male patients with hemophilia B.
Patients were 12 years of age and older and had a history of at least 100 prior days during which they received 1 or more injections with any currently marketed factor IX product.
The investigators divided patients into 4 treatment arms. In Arm 1, 63 patients received weekly prophylaxis with rFIXFc. The starting dose was 50 IU/kg, and it was adjusted to maintain trough factor levels sufficient to prevent bleeding.
In Arm 2, 29 patients received individualized interval prophylaxis with rFIXFc. The factor was administered at 100 IU/kg at an initial interval of 10 days. It was subsequently individualized to maintain trough factor levels sufficient to prevent bleeding.
In Arm 3, 27 patients received episodic rFIXFc as needed to control bleeding. And in Arm 4, 12 patients who required major surgery received perioperative management with rFIXFc. Eight patients in this arm were also enrolled in other treatment arms.
Efficacy data
Overall, 93.5% of patients completed the study. Researchers assessed control of bleeding in all patients who experienced a bleeding episode while on study. In total, 90.4% of bleeding episodes were controlled by a single injection of rFIXFc.
The overall median annualized bleeding rates—including spontaneous and traumatic bleeds—were 2.95 in the weekly prophylaxis arm, 1.38 in the individualized interval prophylaxis arm, and 17.69 in the episodic treatment arm.
The perioperative management arm consisted of 12 patients undergoing 14 major surgical procedures. The treating physicians rated the hemostatic efficacy of rFIXFc as excellent or good in 100% of these surgeries.
The researchers also analyzed the pharmacokinetics of rFIXFc. The approximate terminal half-life of rFIXFc was 82 hours, compared to 34 hours for another recombinant factor IX product called BeneFIX.
This suggests that rFIXFc offers longer-lasting protection from bleeding in patients with hemophilia B, said Glenn Pierce, MD, PhD, Chief Medical Officer of Biogen Idec’s hemophilia therapeutic area.
“Currently, prophylactic treatment of hemophilia B requires intravenous injections up to 3 times a week,” he said, “which makes the prospect of a longer-lasting factor IX therapy very exciting.”
Safety data
The researchers found that rFIXFc was generally well-tolerated. None of the patients developed inhibitors, and none reported anaphylaxis.
The most common adverse events—with an incidence of 5% or greater—occurring outside of the perioperative management arm were nasopharyngitis, influenza, arthralgia, upper respiratory infection, hypertension, and headache.
One serious adverse event may have been drug-related. The patient experienced obstructive uropathy in the setting of hematuria. However, he continued to receive rFIXFc, and the event resolved with medical management.
Next steps
Based on the overall favorable outcomes of this study, Biogen Idec and Sobi are planning to submit a Biologics License Application for rFIXFc to the FDA in the first half of 2013. They also plan to submit an application to the EMA following results of a similar study in children, called Kids B-LONG.
Kids B-LONG is a phase 3, open-label study in previously treated children who are younger than 12 years of age and have been diagnosed with hemophilia B. The study is actively recruiting patients.
Researchers are also evaluating rFIXFc in the B-YOND study, which is a long-term, open-label extension study for patients who completed the B-LONG study or who will complete the Kids B-LONG study. 
A novel therapy can prevent bleeding episodes in patients with hemophilia B, results of an industry-funded study suggest.
The goal of the phase 3 study, called B-LONG, was to evaluate the safety and efficacy of a long-lasting recombinant factor IX Fc fusion protein (rFIXFc, also known as eftrenonacog alfa and Alprolix).
Researchers found that a single injection of rFIXFc was sufficient to control more than 90% of bleeding episodes in males with hemophilia B.
In addition, none of the patients developed inhibitors, and the factor was generally well-tolerated.
The companies developing rFIXFc, Biogen Idec and Sobi, announced these results on September 26.
“Our companies are pioneering the application of Fc fusion technology to extend the half-life of clotting factors,” said Geoffrey McDonough, MD, Chief Executive Officer of Sobi, a biopharmaceutical company based in Stockholm, Sweden.
“Fc fusion technology utilizes a naturally occurring recycling pathway that has been successfully employed in other therapeutic areas. This approach holds promise for combining more consistent protection with fewer injections.”
Study design
To determine if rFIXFc does, in fact, provide bleeding protection with fewer injections, researchers administered the factor to 123 male patients with hemophilia B.
Patients were 12 years of age and older and had a history of at least 100 prior days during which they received 1 or more injections with any currently marketed factor IX product.
The investigators divided patients into 4 treatment arms. In Arm 1, 63 patients received weekly prophylaxis with rFIXFc. The starting dose was 50 IU/kg, and it was adjusted to maintain trough factor levels sufficient to prevent bleeding.
In Arm 2, 29 patients received individualized interval prophylaxis with rFIXFc. The factor was administered at 100 IU/kg at an initial interval of 10 days. It was subsequently individualized to maintain trough factor levels sufficient to prevent bleeding.
In Arm 3, 27 patients received episodic rFIXFc as needed to control bleeding. And in Arm 4, 12 patients who required major surgery received perioperative management with rFIXFc. Eight patients in this arm were also enrolled in other treatment arms.
Efficacy data
Overall, 93.5% of patients completed the study. Researchers assessed control of bleeding in all patients who experienced a bleeding episode while on study. In total, 90.4% of bleeding episodes were controlled by a single injection of rFIXFc.
The overall median annualized bleeding rates—including spontaneous and traumatic bleeds—were 2.95 in the weekly prophylaxis arm, 1.38 in the individualized interval prophylaxis arm, and 17.69 in the episodic treatment arm.
The perioperative management arm consisted of 12 patients undergoing 14 major surgical procedures. The treating physicians rated the hemostatic efficacy of rFIXFc as excellent or good in 100% of these surgeries.
The researchers also analyzed the pharmacokinetics of rFIXFc. The approximate terminal half-life of rFIXFc was 82 hours, compared to 34 hours for another recombinant factor IX product called BeneFIX.
This suggests that rFIXFc offers longer-lasting protection from bleeding in patients with hemophilia B, said Glenn Pierce, MD, PhD, Chief Medical Officer of Biogen Idec’s hemophilia therapeutic area.
“Currently, prophylactic treatment of hemophilia B requires intravenous injections up to 3 times a week,” he said, “which makes the prospect of a longer-lasting factor IX therapy very exciting.”
Safety data
The researchers found that rFIXFc was generally well-tolerated. None of the patients developed inhibitors, and none reported anaphylaxis.
The most common adverse events—with an incidence of 5% or greater—occurring outside of the perioperative management arm were nasopharyngitis, influenza, arthralgia, upper respiratory infection, hypertension, and headache.
One serious adverse event may have been drug-related. The patient experienced obstructive uropathy in the setting of hematuria. However, he continued to receive rFIXFc, and the event resolved with medical management.
Next steps
Based on the overall favorable outcomes of this study, Biogen Idec and Sobi are planning to submit a Biologics License Application for rFIXFc to the FDA in the first half of 2013. They also plan to submit an application to the EMA following results of a similar study in children, called Kids B-LONG.
Kids B-LONG is a phase 3, open-label study in previously treated children who are younger than 12 years of age and have been diagnosed with hemophilia B. The study is actively recruiting patients.
Researchers are also evaluating rFIXFc in the B-YOND study, which is a long-term, open-label extension study for patients who completed the B-LONG study or who will complete the Kids B-LONG study.
A novel therapy can prevent bleeding episodes in patients with hemophilia B, results of an industry-funded study suggest.
The goal of the phase 3 study, called B-LONG, was to evaluate the safety and efficacy of a long-lasting recombinant factor IX Fc fusion protein (rFIXFc, also known as eftrenonacog alfa and Alprolix).
Researchers found that a single injection of rFIXFc was sufficient to control more than 90% of bleeding episodes in males with hemophilia B.
In addition, none of the patients developed inhibitors, and the factor was generally well-tolerated.
The companies developing rFIXFc, Biogen Idec and Sobi, announced these results on September 26.
“Our companies are pioneering the application of Fc fusion technology to extend the half-life of clotting factors,” said Geoffrey McDonough, MD, Chief Executive Officer of Sobi, a biopharmaceutical company based in Stockholm, Sweden.
“Fc fusion technology utilizes a naturally occurring recycling pathway that has been successfully employed in other therapeutic areas. This approach holds promise for combining more consistent protection with fewer injections.”
Study design
To determine if rFIXFc does, in fact, provide bleeding protection with fewer injections, researchers administered the factor to 123 male patients with hemophilia B.
Patients were 12 years of age and older and had a history of at least 100 prior days during which they received 1 or more injections with any currently marketed factor IX product.
The investigators divided patients into 4 treatment arms. In Arm 1, 63 patients received weekly prophylaxis with rFIXFc. The starting dose was 50 IU/kg, and it was adjusted to maintain trough factor levels sufficient to prevent bleeding.
In Arm 2, 29 patients received individualized interval prophylaxis with rFIXFc. The factor was administered at 100 IU/kg at an initial interval of 10 days. It was subsequently individualized to maintain trough factor levels sufficient to prevent bleeding.
In Arm 3, 27 patients received episodic rFIXFc as needed to control bleeding. And in Arm 4, 12 patients who required major surgery received perioperative management with rFIXFc. Eight patients in this arm were also enrolled in other treatment arms.
Efficacy data
Overall, 93.5% of patients completed the study. Researchers assessed control of bleeding in all patients who experienced a bleeding episode while on study. In total, 90.4% of bleeding episodes were controlled by a single injection of rFIXFc.
The overall median annualized bleeding rates—including spontaneous and traumatic bleeds—were 2.95 in the weekly prophylaxis arm, 1.38 in the individualized interval prophylaxis arm, and 17.69 in the episodic treatment arm.
The perioperative management arm consisted of 12 patients undergoing 14 major surgical procedures. The treating physicians rated the hemostatic efficacy of rFIXFc as excellent or good in 100% of these surgeries.
The researchers also analyzed the pharmacokinetics of rFIXFc. The approximate terminal half-life of rFIXFc was 82 hours, compared to 34 hours for another recombinant factor IX product called BeneFIX.
This suggests that rFIXFc offers longer-lasting protection from bleeding in patients with hemophilia B, said Glenn Pierce, MD, PhD, Chief Medical Officer of Biogen Idec’s hemophilia therapeutic area.
“Currently, prophylactic treatment of hemophilia B requires intravenous injections up to 3 times a week,” he said, “which makes the prospect of a longer-lasting factor IX therapy very exciting.”
Safety data
The researchers found that rFIXFc was generally well-tolerated. None of the patients developed inhibitors, and none reported anaphylaxis.
The most common adverse events—with an incidence of 5% or greater—occurring outside of the perioperative management arm were nasopharyngitis, influenza, arthralgia, upper respiratory infection, hypertension, and headache.
One serious adverse event may have been drug-related. The patient experienced obstructive uropathy in the setting of hematuria. However, he continued to receive rFIXFc, and the event resolved with medical management.
Next steps
Based on the overall favorable outcomes of this study, Biogen Idec and Sobi are planning to submit a Biologics License Application for rFIXFc to the FDA in the first half of 2013. They also plan to submit an application to the EMA following results of a similar study in children, called Kids B-LONG.
Kids B-LONG is a phase 3, open-label study in previously treated children who are younger than 12 years of age and have been diagnosed with hemophilia B. The study is actively recruiting patients.
Researchers are also evaluating rFIXFc in the B-YOND study, which is a long-term, open-label extension study for patients who completed the B-LONG study or who will complete the Kids B-LONG study.
Hospitalist-Led Teams Vital to Improved ED Care
Hospitalist-led teams in the ED help reduce diversions, improve patient flow, and provide more timely care to boarded patients, according to a study in the Journal of Hospital Medicine (JHM).
The single-center study, "Hospitalist-Led Medicine Emergency Department Team: Associations with Throughput, Timeliness of Patient Care, and Satisfaction," found a reduction in diversions due to medicine bed capacity of 27% (4.5% to 3%, P=<0.01). Boarded patients were rounded a mean of 2 hours and 9 minutes earlier with hospitalist-led teams; length of stay (LOS) in the ED, LOS in the hospital, and 48-hour returns were unchanged. The study, which took place at 477-bed Denver Health Medical Center (DHMC), assigned a hospitalist and an allied health provider to the ED during dayshifts. At night, ED coverage was rolled into the existing hospitalist duties.
Lead author Smitha R. Chadaga, MD, who works in DHMC's Department of Medicine, believes the study could spur more HM groups to consider dedicating a staffer to the ED. The team in Denver was created to care for medicine patients in the ED awaiting inpatient beds, and to work with nursing supervisors to improve bed management.
"There are numerous places that hospitalists can impact hospital flow, whether it's helping with bed management, providing consultative services to the ED, or caring for boarded patients," Dr. Chadaga says. "Knowing the ins and outs of inpatient medicine really lends itself well to some areas that hospitalists might not have thought about before."
Dr. Chadaga says the research is broadly applicable because HM groups can implement its different features. For example, adding a consultative phone service can help ED physicians determine whether a patient needs to be admitted and could improve patient flow.
Hospitalist-led teams in the ED help reduce diversions, improve patient flow, and provide more timely care to boarded patients, according to a study in the Journal of Hospital Medicine (JHM).
The single-center study, "Hospitalist-Led Medicine Emergency Department Team: Associations with Throughput, Timeliness of Patient Care, and Satisfaction," found a reduction in diversions due to medicine bed capacity of 27% (4.5% to 3%, P=<0.01). Boarded patients were rounded a mean of 2 hours and 9 minutes earlier with hospitalist-led teams; length of stay (LOS) in the ED, LOS in the hospital, and 48-hour returns were unchanged. The study, which took place at 477-bed Denver Health Medical Center (DHMC), assigned a hospitalist and an allied health provider to the ED during dayshifts. At night, ED coverage was rolled into the existing hospitalist duties.
Lead author Smitha R. Chadaga, MD, who works in DHMC's Department of Medicine, believes the study could spur more HM groups to consider dedicating a staffer to the ED. The team in Denver was created to care for medicine patients in the ED awaiting inpatient beds, and to work with nursing supervisors to improve bed management.
"There are numerous places that hospitalists can impact hospital flow, whether it's helping with bed management, providing consultative services to the ED, or caring for boarded patients," Dr. Chadaga says. "Knowing the ins and outs of inpatient medicine really lends itself well to some areas that hospitalists might not have thought about before."
Dr. Chadaga says the research is broadly applicable because HM groups can implement its different features. For example, adding a consultative phone service can help ED physicians determine whether a patient needs to be admitted and could improve patient flow.
Hospitalist-led teams in the ED help reduce diversions, improve patient flow, and provide more timely care to boarded patients, according to a study in the Journal of Hospital Medicine (JHM).
The single-center study, "Hospitalist-Led Medicine Emergency Department Team: Associations with Throughput, Timeliness of Patient Care, and Satisfaction," found a reduction in diversions due to medicine bed capacity of 27% (4.5% to 3%, P=<0.01). Boarded patients were rounded a mean of 2 hours and 9 minutes earlier with hospitalist-led teams; length of stay (LOS) in the ED, LOS in the hospital, and 48-hour returns were unchanged. The study, which took place at 477-bed Denver Health Medical Center (DHMC), assigned a hospitalist and an allied health provider to the ED during dayshifts. At night, ED coverage was rolled into the existing hospitalist duties.
Lead author Smitha R. Chadaga, MD, who works in DHMC's Department of Medicine, believes the study could spur more HM groups to consider dedicating a staffer to the ED. The team in Denver was created to care for medicine patients in the ED awaiting inpatient beds, and to work with nursing supervisors to improve bed management.
"There are numerous places that hospitalists can impact hospital flow, whether it's helping with bed management, providing consultative services to the ED, or caring for boarded patients," Dr. Chadaga says. "Knowing the ins and outs of inpatient medicine really lends itself well to some areas that hospitalists might not have thought about before."
Dr. Chadaga says the research is broadly applicable because HM groups can implement its different features. For example, adding a consultative phone service can help ED physicians determine whether a patient needs to be admitted and could improve patient flow.
High-Tech Connections Give Hospitalists Broad Access to Medical Records
U.S. News and World Report recently named its 156 "most connected" U.S. hospitals, singled out for their combination of high quality and early adoption of information technology. But what does "most connected" really mean for hospitalists working on the wards?
"I've been in hospital medicine for a few years, and I can still remember the old days of going down to the medical records room and pulling a chart off the shelf," says hospitalist Kristian Feterik, MD, clinical assistant professor of medicine at the University of Pittsburgh Medical Center (UPMC) in Pittsburgh, which is on the U.S. News list. "The transition from paper to electronic medical records has just been tremendous. We're almost 100% paperless here."
Going paperless means hospitalists and other clinicians can access medical records anywhere in the hospital or at home using multiple interfaces, including their own tablet, Dr. Feterik says. "We're now piloting an application for smartphones that would notify us of pending tests. Plus, the applications support access to radiology studies, for example, without having to re-enter patient identification numbers once you're in the patient's record."
UPMC clinicians have access to a number of applications, some still in beta testing.
But technology also has its downside. "We need to be mindful about how we write our orders, because it's so easy to order things electronically," Dr. Feterik adds. "I stress to the residents: You need to take a moment and think, 'Why are you ordering this test?'"
U.S. News and World Report recently named its 156 "most connected" U.S. hospitals, singled out for their combination of high quality and early adoption of information technology. But what does "most connected" really mean for hospitalists working on the wards?
"I've been in hospital medicine for a few years, and I can still remember the old days of going down to the medical records room and pulling a chart off the shelf," says hospitalist Kristian Feterik, MD, clinical assistant professor of medicine at the University of Pittsburgh Medical Center (UPMC) in Pittsburgh, which is on the U.S. News list. "The transition from paper to electronic medical records has just been tremendous. We're almost 100% paperless here."
Going paperless means hospitalists and other clinicians can access medical records anywhere in the hospital or at home using multiple interfaces, including their own tablet, Dr. Feterik says. "We're now piloting an application for smartphones that would notify us of pending tests. Plus, the applications support access to radiology studies, for example, without having to re-enter patient identification numbers once you're in the patient's record."
UPMC clinicians have access to a number of applications, some still in beta testing.
But technology also has its downside. "We need to be mindful about how we write our orders, because it's so easy to order things electronically," Dr. Feterik adds. "I stress to the residents: You need to take a moment and think, 'Why are you ordering this test?'"
U.S. News and World Report recently named its 156 "most connected" U.S. hospitals, singled out for their combination of high quality and early adoption of information technology. But what does "most connected" really mean for hospitalists working on the wards?
"I've been in hospital medicine for a few years, and I can still remember the old days of going down to the medical records room and pulling a chart off the shelf," says hospitalist Kristian Feterik, MD, clinical assistant professor of medicine at the University of Pittsburgh Medical Center (UPMC) in Pittsburgh, which is on the U.S. News list. "The transition from paper to electronic medical records has just been tremendous. We're almost 100% paperless here."
Going paperless means hospitalists and other clinicians can access medical records anywhere in the hospital or at home using multiple interfaces, including their own tablet, Dr. Feterik says. "We're now piloting an application for smartphones that would notify us of pending tests. Plus, the applications support access to radiology studies, for example, without having to re-enter patient identification numbers once you're in the patient's record."
UPMC clinicians have access to a number of applications, some still in beta testing.
But technology also has its downside. "We need to be mindful about how we write our orders, because it's so easy to order things electronically," Dr. Feterik adds. "I stress to the residents: You need to take a moment and think, 'Why are you ordering this test?'"