User login
Clinical Endocrinology News is an independent news source that provides endocrinologists with timely and relevant news and commentary about clinical developments and the impact of health care policy on the endocrinologist's practice. Specialty topics include Diabetes, Lipid & Metabolic Disorders Menopause, Obesity, Osteoporosis, Pediatric Endocrinology, Pituitary, Thyroid & Adrenal Disorders, and Reproductive Endocrinology. Featured content includes Commentaries, Implementin Health Reform, Law & Medicine, and In the Loop, the blog of Clinical Endocrinology News. Clinical Endocrinology News is owned by Frontline Medical Communications.
addict
addicted
addicting
addiction
adult sites
alcohol
antibody
ass
attorney
audit
auditor
babies
babpa
baby
ban
banned
banning
best
bisexual
bitch
bleach
blog
blow job
bondage
boobs
booty
buy
cannabis
certificate
certification
certified
cheap
cheapest
class action
cocaine
cock
counterfeit drug
crack
crap
crime
criminal
cunt
curable
cure
dangerous
dangers
dead
deadly
death
defend
defended
depedent
dependence
dependent
detergent
dick
die
dildo
drug abuse
drug recall
dying
fag
fake
fatal
fatalities
fatality
free
fuck
gangs
gingivitis
guns
hardcore
herbal
herbs
heroin
herpes
home remedies
homo
horny
hypersensitivity
hypoglycemia treatment
illegal drug use
illegal use of prescription
incest
infant
infants
job
ketoacidosis
kill
killer
killing
kinky
law suit
lawsuit
lawyer
lesbian
marijuana
medicine for hypoglycemia
murder
naked
natural
newborn
nigger
noise
nude
nudity
orgy
over the counter
overdosage
overdose
overdosed
overdosing
penis
pimp
pistol
porn
porno
pornographic
pornography
prison
profanity
purchase
purchasing
pussy
queer
rape
rapist
recall
recreational drug
rob
robberies
sale
sales
sex
sexual
shit
shoot
slut
slutty
stole
stolen
store
sue
suicidal
suicide
supplements
supply company
theft
thief
thieves
tit
toddler
toddlers
toxic
toxin
tragedy
treating dka
treating hypoglycemia
treatment for hypoglycemia
vagina
violence
whore
withdrawal
without prescription
section[contains(@class, 'nav-hidden')]
footer[@id='footer']
div[contains(@class, 'pane-pub-article-imn')]
div[contains(@class, 'pane-pub-home-imn')]
div[contains(@class, 'pane-pub-topic-imn')]
div[contains(@class, 'panel-panel-inner')]
div[contains(@class, 'pane-node-field-article-topics')]
section[contains(@class, 'footer-nav-section-wrapper')]
Weight Loss Not Enough to Sustain Type 2 Diabetes Remission
Very few patients with type 2 diabetes (T2D) achieve and sustain diabetes remission via weight loss alone, new research suggests.
Among more than 37,000 people with T2D in Hong Kong, only 6% had achieved and sustained diabetes remission solely through weight loss up to 8 years after diagnosis. Among those who initially achieved remission, 67% had hyperglycemia at 3 years.
People who lost the most weight (10% of their body weight or more) in the first year after diagnosis were most likely to have sustained remission.
The study “helped to confirm the low rate of diabetes remission and high rate of returning to hyperglycemia in real-world practice,” Andrea Luk, MD, of the Chinese University of Hong Kong, told this news organization. “Over 80% of diabetes remission occurred within the first 5 years of a diabetes diagnosis. This is in line with our understanding that beta cell function will gradually decline over time, making diabetes remission increasingly difficult even with weight reduction.”
The study was published in PLOS Medicine.
Early Weight Management Works
Recent clinical trials have demonstrated that T2D remission can be achieved following sustained weight loss through bariatric surgery or lifestyle interventions, the authors noted. In this study, they investigated the association of weight change at 1 year after a diabetes diagnosis with the long-term incidence and sustainability of T2D remission in real-world settings, using data from the territory-wide Risk Assessment and Management Programme-Diabetes Mellitus (RAMP-DM).
A total of 37,326 people with newly diagnosed T2D who were enrolled in the RAMP-DM between 2000 and 2017 were included and followed until 2019.
At baseline, participants’ mean age was 56.6 years, mean body mass index (BMI) was 26.4 kg/m2, and mean A1c was 7.7%, and 65% were using glucose-lowering drugs (GLDs).
T2D remission was defined as two consecutive A1c < 6.5% measurements at least 6 months apart without GLDs currently or in the previous 3 months.
During a median follow-up of 7.9 years, 6.1% of people achieved remission, with an incidence rate of 7.8 per 1000 person-years. The proportion was higher among those with greater weight loss: 14.4% of people who lost 10% of their body weight or more achieved remission compared with 9.9% of those with 5%-9.9% weight loss, 6.5% of those with 0%-4.9% weight loss, and 4.5% of those who gained weight.
After adjustment for age at diagnosis, sex, assessment year, BMI, other metabolic indices, smoking, alcohol drinking, and medication use, the hazard ratio (HR) for diabetes remission was 3.28 for those with 10% or greater weight loss within 1 year of diagnosis, 2.29 for 5%-9.9% weight loss, and 1.34 for 0%-4.9% weight loss compared to weight gain.
The incidence of diabetes remission in the study was significantly lower than that in clinical trials, possibly because trial participants were in structured programs that included intensive lifestyle interventions, regular monitoring and feedback, and reinforcement of a holistic approach to managing diabetes, the authors noted. Real-world settings may or may not include such interventions.
Further analyses showed that within a median follow-up of 3.1 years, 67.2% of people who had achieved diabetes remission returned to hyperglycemia — an incidence rate of 184.8 per 1000 person-years.
The adjusted HR for returning to hyperglycemia was 0.52 for people with 10% or greater weight loss, 0.78 for those with 5%-9.9% weight loss, and 0.90 for those with 0%-4.9% weight loss compared to people with weight gain.
In addition, diabetes remission was associated with a 31% (HR, 0.69) decreased risk for all-cause mortality.
The study “provides evidence for policymakers to design and implement early weight management interventions” for people diagnosed with T2D, the authors concluded.
Clinicians also have a role to play, Dr. Luk said. “At the first encounter with an individual with newly diagnosed T2D, clinicians should emphasize the importance of weight reduction and guide the individual on how this can be achieved through making healthy lifestyle choices. Pharmacotherapy and metabolic surgery for weight management can be considered in appropriate individuals.”
Overall, she added, “clinicians should be informed that the likelihood of achieving and maintaining diabetes remission is low, and patients should be counseled accordingly.”
Similar to US Experience
Mona Mshayekhi, MD, PhD, an assistant professor of medicine in the division of Diabetes, Endocrinology and Metabolism at Vanderbilt University Medical Center, Nashville, Tennessee, commented on the study for this news organization.
“These findings mirror clinical experience in the US very well,” she said. “We know that sustained weight loss without the use of medications or surgery is extremely difficult in the real-world setting due to the hormonal drivers of obesity, in combination with socioeconomic challenges.”
The study was done before newer weight-management strategies such as glucagon-like peptide 1 receptor agonists were widely available, she noted. “This actually strengthens the finding that weight loss without the routine use of medications has a multitude of benefits, including diabetes remission and reduction of all-cause mortality.”
That said, she added, “I suspect that future studies with more modern cohorts will reveal much higher rates of diabetes remission with the use of newer medications.”
“Our ability to help our patients lose meaningful weight has been limited until recently,” she said. “With new tools in our armamentarium, clinicians need to take the lead in helping patients address and treat obesity and fight the stigma that prevents many from even discussing it with their providers.”
The study did not receive funding. Dr. Luk has received research grants or contracts from Amgen, AstraZeneca, Bayer, Biogen, Boehringer Ingelheim, Eli Lilly, Junshi, Lee Pharmaceutical, MSD, Novo Nordisk, Roche, Sanofi, Shanghai Junshi Biosciences, Sugardown, and Takeda and received travel grants and honoraria for speaking from AstraZeneca, Boehringer Ingelheim, Eli Lilly, and MSD. Dr. Mshayekhi reported no conflicts of interest.
A version of this article appeared on Medscape.com.
FROM PLOS MEDICINE
Corticosteroid Injections Don’t Move Blood Sugar for Most
TOPLINE:
Intra-articular corticosteroid (IACS) injections pose a minimal risk of accelerating diabetes for most people, despite temporarily elevating blood glucose levels, according to a study published in Clinical Diabetes.
METHODOLOGY:
- Almost half of Americans with diabetes have arthritis, so glycemic control is a concern for many receiving IACS injections.
- IACS injections are known to cause short-term hyperglycemia, but their long-term effects on glycemic control are not well studied.
- For the retrospective cohort study, researchers at Mayo Clinic in Rochester, Minnesota, used electronic health records from 1169 adults who had received an IACS injection in one large joint between 2012 and 2018.
- They analyzed data on A1C levels for study participants from 18 months before and after the injections.
- Researchers assessed if participants had a greater-than-expected (defined as an increase of more than 0.5% above expected) concentration of A1C after the injection, and examined rates of diabetic ketoacidosis and hyperosmolar hyperglycemic syndrome in the 30 days following an injection.
TAKEAWAY:
- Nearly 16% of people experienced a greater-than-expected A1C level after receiving an injection.
- A1C levels rose by an average of 1.2% in the greater-than-expected group, but decreased by an average of 0.2% in the average group.
- One patient had an episode of severe hyperglycemia that was linked to the injection.
- A baseline level of A1C above 8% was the only factor associated with a greater-than-expected increase in the marker after an IACS injection.
IN PRACTICE:
“Although most patients do not experience an increase in A1C after IACS, clinicians should counsel patients with suboptimally controlled diabetes about risks of further hyperglycemia after IACS administration,” the researchers wrote.
SOURCE:
The study was led by Terin T. Sytsma, MD, of Mayo Clinic in Rochester, Minnesota.
LIMITATIONS:
The study was retrospective and could not establish causation. In addition, the population was of residents from one county in Minnesota, and was not racially or ethnically diverse. Details about the injection, such as location and total dose, were not available. The study also did not include a control group.
DISCLOSURES:
The study was funded by Mayo Clinic and the National Center for Advancing Translational Sciences. The authors reported no relevant disclosures.
A version of this article first appeared on Medscape.com.
SGLT2 Inhibitors Protective Against Retinopathy in T2D
TOPLINE:
Sodium-glucose cotransporter 2 (SGLT2) inhibitors are associated with a lower risk for sight-threatening retinopathy than other second-line glucose-lowering medications in patients with type 2 diabetes (T2D).
METHODOLOGY:
- Researchers conducted a nationwide cohort study including 3,544,383 patients with newly diagnosed T2D.
- During the 5-year study period, 159,965 patients were treated with SGLT2 inhibitors, 304,383 received dipeptidyl peptidase-4 (DPP-4) inhibitors, 108,420 took pioglitazone, and 189,618 received sulfonylurea.
- The propensity score matching found 65,930 pairs of patients treated with SGLT2 inhibitors vs DPP-4 inhibitors, 93,760 pairs treated with SGLT2 inhibitors vs pioglitazone, and 42,121 pairs treated with SGLT2 inhibitors vs sulfonylurea.
- The main outcome was sight-threatening retinopathy in patients with at least two outpatient visits or one hospitalization or anti-vascular endothelial growth factor injections.
TAKEAWAY:
- SGLT2 inhibitors reduced sight-threatening retinopathy risk by 43% vs DPP-4 inhibitors (adjusted hazard ratio [aHR], 0.57), 38% vs sulfonylurea (aHR, 0.62), and 25% vs pioglitazone (aHR, 0.75; P < .001 for all).
- Similarly, the cumulative incidence of sight-threatening retinopathy was significantly lower with SGLT2 inhibitors vs DPP-4i, pioglitazone, or sulfonylurea (P < .001 for all).
- All three SGLT2 inhibitor treatments, namely, empagliflozin, dapagliflozin, and canagliflozin, were more effective than DPP-4 inhibitors, pioglitazone, or sulfonylurea in reducing the risk for sight-threatening retinopathy.
IN PRACTICE:
“SGLT2i treatments were as safe and effective in slowing the progression of diabetic retinopathy as in lowering the risk for diabetic nephropathy in patients with T2D,” the authors wrote.
SOURCE:
This study was led by Fu-Shun Yen, MD, a private practitioner from Taiwan, and was published online on December 20, 2023, in JAMA Network Open.
LIMITATIONS:
There were insufficient data regarding the participants’ alcohol use, physical activity, smoking status, and family history, which may have had an impact on the results.
The study mainly involved individuals of Taiwanese ethnicity.
DISCLOSURES:
This study was supported partly by the Taiwan Ministry of Health and Welfare Clinical Trial Center, the MOST Clinical Trial Consortium for Stroke, and other sources. The authors declared no conflicts of interest.
A version of this article appeared on Medscape.com.
High Salt Intake Linked to Increased Risk for Kidney Disease
People who habitually add salt to their meals at the table may unknowingly be risking their kidneys, according to a study utilizing UK Biobank data. Chronic salt additions are associated with an elevated risk of developing chronic kidney disease (CKD), as revealed by researchers led by Rui Tang, a doctoral candidate in epidemiology at Tulane University in New Orleans, Louisiana. The study was published in JAMA Network Open.
Large Study Sample
In a population-based cohort study comprising over 460,000 UK Biobank participants aged 37-73 years, the researchers explored the association between adding table salt to food and increased CKD risk.
Participants indicated how often they added salt to their meals: Never or rarely, sometimes, often, or always. The follow-up period exceeded a decade, and median duration was 11.8 years. During this time, approximately 22,000 new CKD cases were documented. Data analysis revealed a significantly higher CKD risk among those who frequently added salt.
The extent of risk elevation varied with the frequency of salt additions. Even occasional salters had a 7% higher risk than those who never or rarely added salt. For frequent salters, the risk increased by 12%, and for those who always added salt, it rose to 29%. These results were adjusted for age and gender.
Worse Overall Health
The research group noted that individuals who frequently added salt were generally less healthy, adopting an unhealthier lifestyle and having lower socioeconomic status. They exhibited higher body mass index (BMI), were more likely to smoke, had diabetes or cardiovascular diseases, and had reduced estimated glomerular filtration rate (eGFR) at the beginning of the study. Moreover, their Townsend Deprivation Index, indicating material deprivation, was higher.
Considering these factors, the researchers adjusted the results not only for age and gender but also for ethnicity, Townsend Deprivation Index, eGFR, BMI, smoking status, alcohol consumption, physical activity, elevated cholesterol levels, diabetes, cardiovascular diseases, hypertension, infectious diseases, immune system disorders, and the use of nephrotoxic medications.
Association Persists
Even after accounting for these factors, a significant, albeit attenuated, association between salt additions and CKD risk remained. The risk increased by 2% for occasional salters, 5% for frequent salters, and 6% for those who always added salt.
The research group concluded that adding salt to meals could be associated with an increased risk for CKD in the general population. However, they highlighted several limitations that should be considered when interpreting the study results.
Reducing Salt
Primarily, self-reported frequency of salt addition doesn’t precisely reflect actual salt consumption. While earlier studies validated the accuracy of this variable, the researchers acknowledged the possibility that frequent salt addition may merely be a marker for an unhealthy lifestyle.
Nevertheless, the authors speculated that reducing the frequency of salt additions to meals could contribute to lowering CKD risk in the general population. They suggested validating their results in post hoc analyses or follow-up studies from clinical trials.
This article was translated from the Medscape German edition. A version of this article appeared on Medscape.com.
No Compelling Evidence of Pancreatic Cancer Risk With GLP-1s
TOPLINE:
New data provide no support for an increased risk for pancreatic cancer with use of a glucagon-like peptide-1 receptor agonist (GLP-1 RA) for up to 7 years, although longer-term data are needed, researchers said.
METHODOLOGY:
- Some studies have raised concern about a possible increased risk for pancreatitis and pancreatic cancer in patients taking a GLP-1 RA.
- Investigators behind this population-based cohort study assessed the association of GLP-1 RA treatment with pancreatic cancer incidence over a median of 7 years in 543,595 adults (mean age, 59.9 years; 51% women) with type 2 diabetes.
- Treatment with basal insulin was used as an active comparator.
- The analyses accounted for major confounding factors and time-related biases and adjusted for treatment with other glucose-lowering medications and a history of pancreatitis.
TAKEAWAY:
- During the study period, 33,377 patients (6.1%) used GLP-1 RAs and 106,849 (19.7%) used basal insulin, with 1665 of all patients diagnosed with pancreatic cancer.
- There was no evidence that GLP-1 RA use increased pancreatic cancer risk compared with basal insulin.
- The estimated hazard ratio (HR) for pancreatic cancer associated with incremental use of one defined daily dose per day of GLP-1 RA compared with basal insulin in years 5-7 was 0.50 (95% CI, 0.15-1.71).
- New-user and prevalent new-user analyses showed HRs from year 5 onward following initiation of a GLP-1 RA vs basal insulin was 0.52 (95% CI, 0.19-1.41) and 0.75 (95% CI, 0.37-1.53), respectively.
IN PRACTICE:
Using several analytical approaches, these findings do not suggest an increase in pancreatic cancer incidence over 7 years following the start of GLP-1 RA treatment, according to the investigation. “However, monitoring for pancreatic cancer risk beyond 7 years following initiation of treatment is still required,” the authors wrote.
SOURCE:
The study, with first author Rachel Dankner, MD, MPH, Gertner Institute for Epidemiology and Health Policy Research, Sheba Medical Center, Israel, was published online on January 4, 2024, in JAMA Network Open.
LIMITATIONS:
Data on the exact type of GLP-1 RA were not available. The analyses accounted for history of pancreatitis but not alcohol use or exposure to pesticides/chemicals. Because of the risk for bias due to reverse causation, an emphasis was placed on drug effects several years after their initiation. However, this reduced the number of pancreatic cancer cases available and led to estimated HRs with wider CIs.
DISCLOSURES:
The study received no specific funding. The authors disclosed no relevant conflicts of interest.
A version of this article appeared on Medscape.com.
Tirzepatide: A ‘Rising Star’ in T2D Renal Protection
TOPLINE:
in patients with type 2 diabetes (T2D).
METHODOLOGY:
- A meta-analysis of eight randomized controlled trials compared the effects of tirzepatide and control treatment (placebo or any active comparator) on albuminuria levels and renal function in patients with T2D.
- The pooled data included 6226 patients with T2D who received tirzepatide (5, 10, or 15 mg) and 3307 participants in the control group who received placebo, semaglutide, or insulin.
- The primary outcome was the difference in absolute change in urinary albumin-creatinine ratio (UACR) from baseline between the tirzepatide and control groups.
- The secondary efficacy endpoint was the comparative change in estimated glomerular filtration rate (eGFR) between the two groups.
TAKEAWAY:
- Overall, tirzepatide reduced UACR by ~27% (mean difference [MD], −26.9%; P < .001) compared with controls.
- The reduction in UACR was consistent across all tirzepatide doses (5 mg: MD, −23.12%; 10 mg: MD, −27.87%; 15 mg: MD, −27.15).
- Benefits of tirzepatide were even more pronounced in patients with increased albuminuria levels (UACR ≥ 30 mg/g) at baseline (MD, −41.42%; P < .001) than in controls.
- However, tirzepatide vs control treatment did not have a significant effect on eGFR levels (P = .46), which indicated no negative effect of tirzepatide on renal function.
IN PRACTICE:
“Tirzepatide seems to be a ‘rising star’ for the prevention and delaying of chronic kidney disease and related, surrogate renal outcomes in patients with T2DM,” the authors wrote.
SOURCE:
Paschalis Karakasis, MD, Aristotle University of Thessaloniki, Thessaloniki, Greece, led this study, which was published online December 20, 2023, in the journal Diabetes, Obesity and Metabolism.
LIMITATIONS:
There was significant heterogeneity between the studies. Bias may have come from the open-label design in the included randomized controlled trials. The pathophysiological mechanisms underlying the effect of tirzepatide on chronic kidney disease pathogenesis are speculative.
DISCLOSURES:
The paper did not receive any specific funding. The authors declared no conflicts of interest.
A version of this article appeared on Medscape.com.
Researchers Uncover Nanoplastics in Water Bottles
Using an advanced microscopic technique, American researchers have detected 100,000 nanoplastic molecules per liter of water in plastic bottles. Because of their small size, these particles can enter the bloodstream, cells, and the brain, thus posing potential health risks. The study, recently published in the Proceedings of the National Academy of Sciences, raises concerns about the impact of these nanoparticles.
An Unknown Realm
Formed as plastics break down into increasingly small pieces, these particles are consumed by humans and other organisms, with unknown effects on health and ecosystems. Whereas macroplastics have been found in various organs, including the lungs and liver, the study marks a unique exploration into the world of nanoplastics.
Concerns about nanoplastic presence in humans intensified when a 2018 study revealed contamination signs in 93% of 259 examined bottles from nine countries.
The novelty of this research lies in its focus, using a refined spectrometry method, on the poorly understood world of nanoplastics, which derive from the decomposition of microplastics. For the first time, American researchers, including biophysicists and chemists, counted and identified these tiny particles in bottled water. On average, they found around 240,000 detectable plastic fragments per liter, which is 10-100 times more than previous estimates based on larger sizes.
Microplastics are defined as fragments ranging from 5 mm to 1 µm, whereas nanoplastics, particles < 1 µm, are measured in billionths of a meter.
In contrast to microplastics, nanoplastics are so small that they can traverse the intestines and lungs and move directly into the bloodstream, reaching organs such as the heart or brain or even the fetus via the placenta.
“This was previously an obscure, unexplored area. Toxicity studies could only speculate about what was in there,” said Beizhan Yan, PhD, coauthor of the study and environmental chemist at the Lamont–Doherty Earth Observatory of Columbia University, New York. “This study opens a window for us to observe a world we were not exposed to before.”
90% Nanoplastics Found
The new study employed a technique called stimulated Raman scattering microscopy, which was invented by study coauthor Wei Min, a biophysicist at Columbia. This method involves probing samples simultaneously with two lasers tuned to resonate specific molecules.
Researchers tested three bottled water brands that are popular in the United States, analyzing plastic particles up to 100 nm in size. They identified 110,000-370,000 plastic particles per liter. About 90% were nanoplastics — which are invisible by standard imaging techniques — and the rest were microplastics. The study also identified the seven plastics involved.
The most common is polyamide, a type of nylon, likely from plastic filters purportedly used to purify water before bottling. Next is polyethylene terephthalate, which is commonly used for water bottles and other food containers. Researchers also found other common plastics, including polystyrene, polyvinyl chloride, and methyl methacrylate, used in various industrial processes.
Not Size But Quantity
What’s more concerning is that the seven types of plastics accounted for only about 10% of all nanoparticles found in the samples. Researchers have no idea about the composition of the remaining 90%. If these are all nanoparticles, their number could reach tens of millions per liter, representing the complex composition of seemingly simple water samples, as noted by the authors.
Researchers now plan to expand beyond bottled water, exploring the vast realm of nanoplastics. They emphasize that, in terms of mass, nanoplastics are far smaller than microplastics, but “it’s not about size. It’s about the numbers as smaller things can easily penetrate us.”
The team aims to study tap water, which also contains microplastics but in much smaller proportions than bottled water.
This article was translated from the Medscape French edition.
FROM THE PROCEEDINGS OF THE NATIONAL ACADEMY OF SCIENCES
Hypocalcemia Risk Warning Added to Osteoporosis Drug
The US Food and Drug Administration (FDA) has added a boxed warning to the label of the osteoporosis drug denosumab (Prolia) about increased risk for severe hypocalcemia in patients with advanced chronic kidney disease (CKD).
Denosumab is a monoclonal antibody, indicated for the treatment of postmenopausal women with osteoporosis who are at increased risk for fracture for whom other treatments aren’t effective or can’t be tolerated. It’s also indicated to increase bone mass in men with osteoporosis at high risk for fracture, treat glucocorticoid-induced osteoporosis in men and women at high risk for fracture, increase bone mass in men at high risk for fracture receiving androgen-deprivation therapy for nonmetastatic prostate cancer, and increase bone mass in women at high risk for fracture receiving adjuvant aromatase inhibitor therapy for breast cancer.
This new warning updates a November 2022 alert based on preliminary evidence for a “substantial risk” for hypocalcemia in patients with CKD on dialysis.
Upon further examination of the data from two trials including more than 500,000 denosumab-treated women with CKD, the FDA concluded that severe hypocalcemia appears to be more common in those with CKD who also have mineral and bone disorder (CKD-MBD). And, for patients with advanced CKD taking denosumab, “severe hypocalcemia resulted in serious harm, including hospitalization, life-threatening events, and death.”
Most of the severe hypocalcemia events occurred 2-10 weeks after denosumab injection, with the greatest risk during weeks 2-5.
The new warning advises healthcare professionals to assess patients’ kidney function before prescribing denosumab, and for those with advanced CKD, “consider the risk of severe hypocalcemia with Prolia in the context of other available treatments for osteoporosis.”
If the drug is still being considered for those patients for initial or continued use, calcium blood levels should be checked, and patients should be evaluated for CKD-MBD. Prior to prescribing denosumab in these patients, CKD-MBD should be properly managed, hypocalcemia corrected, and patients supplemented with calcium and activated vitamin D to decrease the risk for severe hypocalcemia and associated complications.
“Treatment with denosumab in patients with advanced CKD, including those on dialysis, and particularly patients with diagnosed CKD-MBD should involve a health care provider with expertise in the diagnosis and management of CKD-MBD,” the FDA advises.
Once denosumab is administered, close monitoring of blood calcium levels and prompt hypocalcemia management is essential to prevent complications including seizures or arrythmias. Patients should be advised to promptly report symptoms that could be consistent with hypocalcemia, including confusion, seizures, irregular heartbeat, fainting, muscle spasms or weakness, face twitching, tingling, or numbness anywhere in the body.
In 2022, an estimated 2.2 million Prolia prefilled syringes were sold by the manufacturer to US healthcare settings.
A version of this article appeared on Medscape.com.
Why Don’t Physicians Call In Sick?
I began practicing medicine on July 1, 1981. In the 43-plus years since then,
There are several reasons, both good and bad, why this is so: (1) like most physicians, I am a terrible patient; (2) as a solo practitioner, there was (until recently — I’ll get to that in a minute) no one else to see an office full of patients who had waited significant amounts of time for their appointments and in many cases had taken off work themselves to keep them; and (3) there is an unspoken rule against it. Taking sick days is highly frowned upon in the medical world. As a medical student, intern, and resident I was told in so many words not to call in sick, no matter how serious the illness might be.

Apparently, I was not the only doctor-in-training to receive that message. In a survey reported in JAMA Pediatrics several years ago, 95% of the physicians and advanced practice clinicians (APCs) surveyed believed that working while sick put patients at risk — yet 83% reported working sick at least one time over the prior year. They understood the risks, but did it anyway.
There is no question that this practice does put patients’ health at risk. The JAMA study linked numerous reports of outbreaks traceable to symptomatic healthcare workers. Some outbreaks of flu, staph infections, norovirus, and pertussis were shown to originate from a sick physician or supporting staff member. These associations have led to increased morbidity and mortality, as well as excess costs. Those of us who treat immunocompromised patients on a regular basis risk inducing a life-threatening illness by unnecessarily exposing them to pathogens.
The JAMA survey results also confirmed my own observation that many physicians feel boxed in by their institutions or practice situations. “The study illustrates the complex social and logistic factors that cause this behavior,” the authors wrote. “These results may inform efforts to design systems at our hospital to provide support for attending physicians and APCs and help them make the right choice to keep their patients and colleagues safe while caring for themselves.”
What might those efforts look like? For one thing, we can take the obvious and necessary steps to avoid getting sick in the first place, such as staying fit and hydrated, and eating well. We can keep up with routine health visits and measures such as colorectal screening, pap smears, and mammograms, and stay up to date with flu shots and all other essential immunizations.
Next, we can minimize the risk of spreading any illnesses we encounter in the course of our work by practicing the basic infectious disease prevention measures driven home so forcefully by the recent COVID-19 pandemic — washing our hands, using hand sanitizers, and, when appropriate, wearing gloves and masks.
Finally, we can work to overcome this institutional taboo against staying home when we do get sick. Work out a system of mutual coverage for such situations. Two years ago, I merged my solo practice with a local, larger group. I did it for a variety of reasons, but a principal one was to assure that a partner could cover for me if I became ill. Practitioners who choose to remain solo or in small groups should contact colleagues and work out a coverage agreement.
Now, during flu season, it is especially important to resist the temptation to work while sick. The CDC has guidelines for employees specific for the flu, which notes that “persons with the flu are most contagious during the first 3 days of their illness,” and should remain at home until at least 24 hours after their fever subsides (without the use of fever-reducing medications) or after symptoms have improved (at least 4-5 days after they started) — or, if they do not have a fever, after symptoms improve “for at least 4-5 days after the onset of symptoms.”
Of course, we need to remember that COVID-19 is still with us. With the constant evolution of new strains, it is especially important to avoid exposing patients and colleagues to the disease should you become infected. The most recent advice from the CDC includes the recommendation that those who are mildly ill and not moderately or severely immunocompromised should isolate after SARS-CoV-2 infection for at least 5 days after symptom onset (day 0 is the day symptoms appeared, and day 1 is the next full day thereafter) if fever has resolved for at least 24 hours (without taking fever-reducing medications) and other symptoms are improving. In addition, “a high-quality mask should be worn around others at home and in public through day 10.”
We should also extend these rules to our support staff, starting with providing them with adequate sick leave and encouraging them to use it when necessary. Research has found a direct correlation between preventative health care and the number of paid sick leave days a worker gets. In a study of over 3000 US workers, those with 10 paid sick days or more annually accessed preventative care more frequently than those without paid sick days.
Dr. Eastern practices dermatology and dermatologic surgery in Belleville, N.J. He is the author of numerous articles and textbook chapters, and is a longtime monthly columnist for Dermatology News. Write to him at [email protected].
I began practicing medicine on July 1, 1981. In the 43-plus years since then,
There are several reasons, both good and bad, why this is so: (1) like most physicians, I am a terrible patient; (2) as a solo practitioner, there was (until recently — I’ll get to that in a minute) no one else to see an office full of patients who had waited significant amounts of time for their appointments and in many cases had taken off work themselves to keep them; and (3) there is an unspoken rule against it. Taking sick days is highly frowned upon in the medical world. As a medical student, intern, and resident I was told in so many words not to call in sick, no matter how serious the illness might be.
Apparently, I was not the only doctor-in-training to receive that message. In a survey reported in JAMA Pediatrics several years ago, 95% of the physicians and advanced practice clinicians (APCs) surveyed believed that working while sick put patients at risk — yet 83% reported working sick at least one time over the prior year. They understood the risks, but did it anyway.
There is no question that this practice does put patients’ health at risk. The JAMA study linked numerous reports of outbreaks traceable to symptomatic healthcare workers. Some outbreaks of flu, staph infections, norovirus, and pertussis were shown to originate from a sick physician or supporting staff member. These associations have led to increased morbidity and mortality, as well as excess costs. Those of us who treat immunocompromised patients on a regular basis risk inducing a life-threatening illness by unnecessarily exposing them to pathogens.
The JAMA survey results also confirmed my own observation that many physicians feel boxed in by their institutions or practice situations. “The study illustrates the complex social and logistic factors that cause this behavior,” the authors wrote. “These results may inform efforts to design systems at our hospital to provide support for attending physicians and APCs and help them make the right choice to keep their patients and colleagues safe while caring for themselves.”
What might those efforts look like? For one thing, we can take the obvious and necessary steps to avoid getting sick in the first place, such as staying fit and hydrated, and eating well. We can keep up with routine health visits and measures such as colorectal screening, pap smears, and mammograms, and stay up to date with flu shots and all other essential immunizations.
Next, we can minimize the risk of spreading any illnesses we encounter in the course of our work by practicing the basic infectious disease prevention measures driven home so forcefully by the recent COVID-19 pandemic — washing our hands, using hand sanitizers, and, when appropriate, wearing gloves and masks.
Finally, we can work to overcome this institutional taboo against staying home when we do get sick. Work out a system of mutual coverage for such situations. Two years ago, I merged my solo practice with a local, larger group. I did it for a variety of reasons, but a principal one was to assure that a partner could cover for me if I became ill. Practitioners who choose to remain solo or in small groups should contact colleagues and work out a coverage agreement.
Now, during flu season, it is especially important to resist the temptation to work while sick. The CDC has guidelines for employees specific for the flu, which notes that “persons with the flu are most contagious during the first 3 days of their illness,” and should remain at home until at least 24 hours after their fever subsides (without the use of fever-reducing medications) or after symptoms have improved (at least 4-5 days after they started) — or, if they do not have a fever, after symptoms improve “for at least 4-5 days after the onset of symptoms.”
Of course, we need to remember that COVID-19 is still with us. With the constant evolution of new strains, it is especially important to avoid exposing patients and colleagues to the disease should you become infected. The most recent advice from the CDC includes the recommendation that those who are mildly ill and not moderately or severely immunocompromised should isolate after SARS-CoV-2 infection for at least 5 days after symptom onset (day 0 is the day symptoms appeared, and day 1 is the next full day thereafter) if fever has resolved for at least 24 hours (without taking fever-reducing medications) and other symptoms are improving. In addition, “a high-quality mask should be worn around others at home and in public through day 10.”
We should also extend these rules to our support staff, starting with providing them with adequate sick leave and encouraging them to use it when necessary. Research has found a direct correlation between preventative health care and the number of paid sick leave days a worker gets. In a study of over 3000 US workers, those with 10 paid sick days or more annually accessed preventative care more frequently than those without paid sick days.
Dr. Eastern practices dermatology and dermatologic surgery in Belleville, N.J. He is the author of numerous articles and textbook chapters, and is a longtime monthly columnist for Dermatology News. Write to him at [email protected].

Testosterone Replacement May Cause ... Fracture?
This transcript has been edited for clarity.
I am showing you a graph without any labels.
What could this line represent? The stock price of some company that made a big splash but failed to live up to expectations? An outbreak curve charting the introduction of a new infectious agent to a population? The performance of a viral tweet?
I’ll tell you what it is in a moment, but I wanted you to recognize that there is something inherently wistful in this shape, something that speaks of past glory and inevitable declines. It’s a graph that induces a feeling of resistance — no, do not go gently into that good night.
The graph actually represents (roughly) the normal level of serum testosterone in otherwise-healthy men as they age.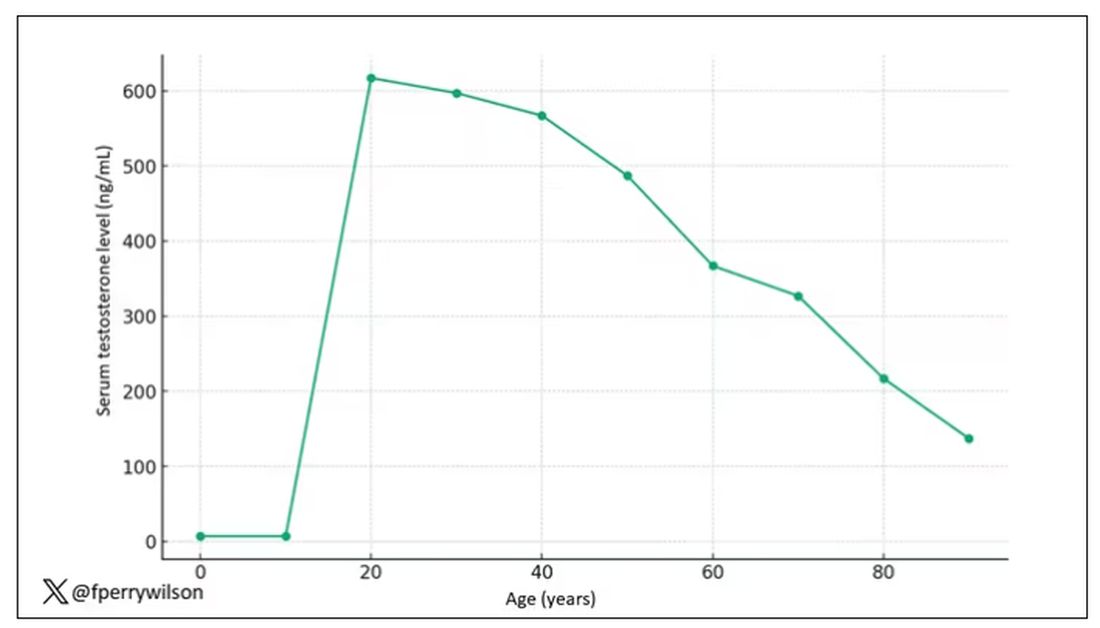
A caveat here: These numbers are not as well defined as I made them seem on this graph, particularly for those older than 65 years. But it is clear that testosterone levels decline with time, and the idea to supplement testosterone is hardly new. Like all treatments, testosterone supplementation has risks and benefits. Some risks are predictable, like exacerbating the symptoms of benign prostatic hyperplasia. Some risks seem to come completely out of left field. That’s what we have today, in a study suggesting that testosterone supplementation increases the risk for bone fractures.
Let me set the stage here by saying that nearly all prior research into the effects of testosterone supplementation has suggested that it is pretty good for bone health. It increases bone mineral density, bone strength, and improves bone architecture.
So if you were to do a randomized trial of testosterone supplementation and look at fracture risk in the testosterone group compared with the placebo group, you would expect the fracture risk would be much lower in those getting supplemented. Of course, this is why we actually do studies instead of assuming we know the answer already — because in this case, you’d be wrong.
I’m talking about this study, appearing in The New England Journal of Medicine.
It’s a prespecified secondary analysis of a randomized trial known as the TRAVERSE trial, which randomly assigned 5246 men with low testosterone levels to transdermal testosterone gel vs placebo. The primary goal of that trial was to assess the cardiovascular risk associated with testosterone supplementation, and the major take-home was that there was no difference in cardiovascular event rates between the testosterone and placebo groups.
This secondary analysis looked at fracture incidence. Researchers contacted participants multiple times in the first year of the study and yearly thereafter. Each time, they asked whether the participant had sustained a fracture. If they answered in the affirmative, a request for medical records was made and the researchers, still blinded to randomization status, adjudicated whether there was indeed a fracture or not, along with some details as to location, situation, and so on.
This was a big study, though, and that translates to just a 3.5% fracture rate in testosterone vs 2.5% in control, but the difference was statistically significant.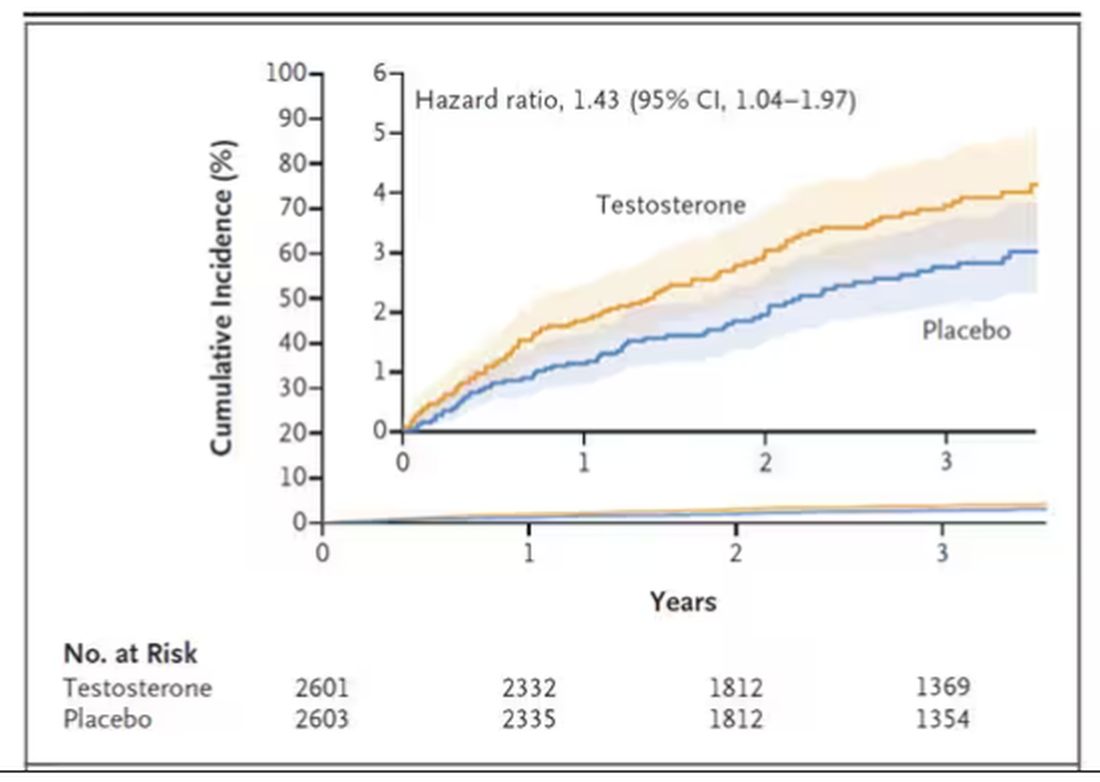
This difference persisted across various fracture types (non–high-impact fractures, for example) after excluding the small percentage of men taking osteoporosis medication.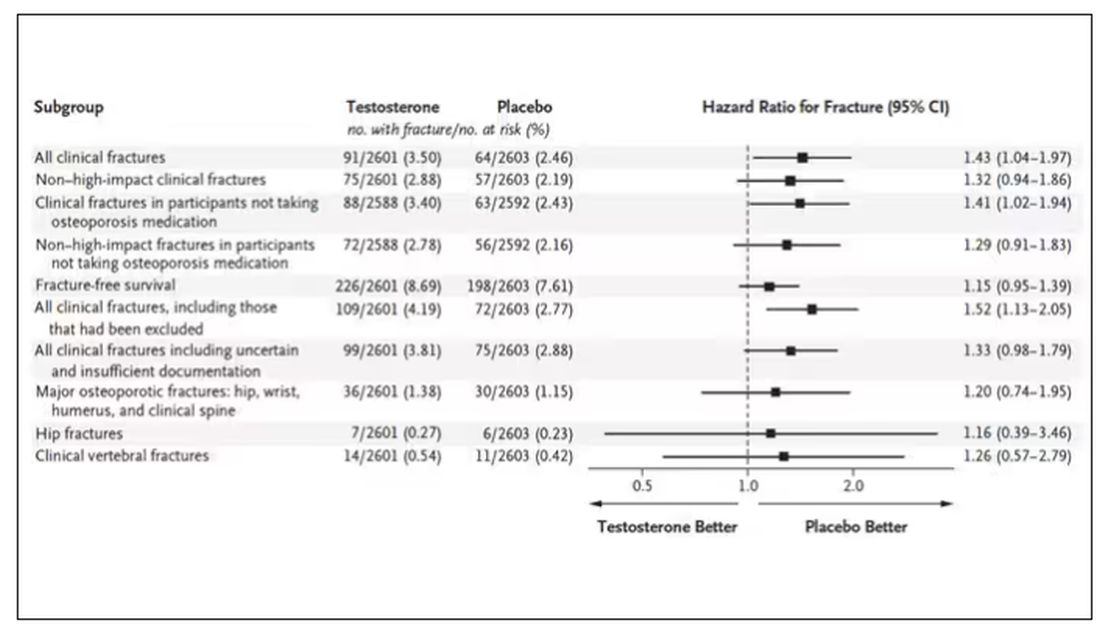
How does a drug that increases bone mineral density and bone strength increase the risk for fracture?
Well, one clue — and this was pointed out in a nice editorial by Matthis Grossman and Bradley Anawalt — is that the increased risk for fracture occurs quite soon after starting treatment, which is not consistent with direct bone effects. Rather, this might represent behavioral differences. Testosterone supplementation seems to increase energy levels; might it lead men to engage in activities that put them at higher risk for fracture?
Regardless of the cause, this adds to our knowledge about the rather complex mix of risks and benefits of testosterone supplementation and probably puts a bit more weight on the risks side. The truth is that testosterone levels do decline with age, as do many things, and it may not be appropriate to try to fight against that in all people. It’s worth noting that all of these studies use low levels of total serum testosterone as an entry criterion. But total testosterone is not what your body “sees.” It sees free testosterone, the portion not bound to sex hormone–binding globulin. And that binding protein is affected by lots of stuff — diabetes and obesity lower it, for example — making total testosterone levels seem low when free testosterone might be just fine.
In other words, testosterone supplementation is probably not terrible, but it is definitely not the cure for aging. In situations like this, we need better data to guide exactly who will benefit from the therapy and who will only be exposed to the risks.
Dr. Wilson is associate professor of medicine and public health and director of the Clinical and Translational Research Accelerator at Yale University, New Haven, Conn. He has disclosed no relevant financial relationships.
A version of this article appeared on Medscape.com.