User login
Congenital syphilis rates continue skyrocketing alongside other STDs
Rapidly increasing cases of newborn syphilis have reached their highest prevalence in 2 decades, according to a new report by the Centers for Disease Control and Prevention on sexually transmitted disease surveillance in 2017.
Newborn syphilis incidence has more than doubled, from 362 cases in 2013 to 918 cases in 2017, resulting in 64 syphilitic stillbirths and 13 infant deaths that year, according to data published in Sexually Transmitted Disease Surveillance 2017.
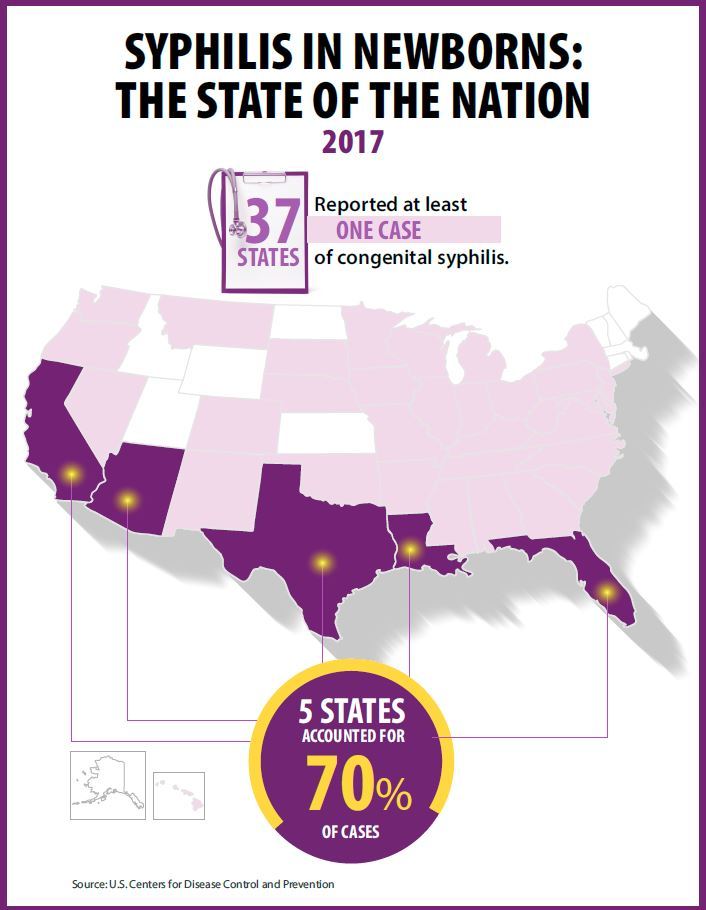
At least one case was reported in 37 states last year, and the greatest burden of cases occurred in California, Arizona, Texas, Louisiana, and Florida, together accounting for 70% of all 2017 cases.
“The resurgence of syphilis, and particularly congenital syphilis, is not an arbitrary event, but rather a symptom of a deteriorating public health infrastructure and lack of access to health care,” wrote Gail Bolan, MD, director of the Division of STD Prevention at the CDC’s National Center for HIV/AIDS, Viral Hepatitis, STD and TB Prevention. “It is exposing hidden, fragile populations in need that are not getting the health care and preventive services they deserve.”
Dr. Bolan recommends modernizing surveillance to capture more of the cases in populations without ready access to diagnosis and treatment and in those choosing not to access care.
“It is imperative that federal, state, and local programs employ strategies that maximize long-term population impact by reducing STD incidence and promoting sexual, reproductive, maternal, and infant health,” she wrote. “Further, it will be important for us to measure and monitor the adverse health consequences of STDs, such as ocular and neurosyphilis, pelvic inflammatory disease, ectopic pregnancy, infertility, HIV, congenital syphilis, and neonatal herpes.”
Multiple sources contributed data to the report: state and local STD programs’ notifiable disease reporting, private and federal national surveys, and specific projects that collect STD prevalence data, including the National Job Training Program, the STD Surveillance Network and the Gonococcal Isolate Surveillance Project.
The four nationally notifiable STDs are chlamydia, gonorrhea, syphilis, and chancroid.
The rise in newborn syphilis cases, currently at 23.3 cases per 100,000 live births, mirrors the increased U.S. prevalence of both primary and secondary syphilis in 2017, with 9.5 cases per 100,000 people. Syphilis has increased every year since 2000-2001, when prevalence was at a record low.
Chlamydia and gonorrhea rates climb too
The report also noted increases in the prevalence of other STDs. Chlamydia, the most common STD, increased 6.9% as compared to 2016, with 528.8 cases per 100,000 people. This increase occurred in all U.S. regions and independently of sex, race, or ethnicity, though rates were highest in teens and young adults. Nearly two-thirds of chlamydia cases in 2017 occurred in people ages 15-24 years old.
Reported rates were higher in women than in men, likely due to women’s increased likelihood of undergoing screening, the report suggested. Better surveillance may also partly explain the climb in men’s cases.
“Increases in rates among men may reflect an increased number of men, including gay, bisexual and other men who have sex with men (collectively referred to as MSM) being tested and diagnosed with a chlamydial infection due to increased availability of urine testing and extragenital screening,” according to the report.
The CDC received reports of more than a half million gonorrhea infections in 2017 (555,608 cases), an increase of 18.6% since the previous year, including a 19.3% increase among men and a 17.8% increase among women.
“The magnitude of the increase among men suggests either increased transmission, increased case ascertainment (e.g., through increased extra-genital screening among MSM), or both,” the authors wrote. “The concurrent increase in cases reported among women suggests parallel increases in heterosexual transmission, increased screening among women, or both.”
Overall, gonorrhea cases have skyrocketed 75.2% since their historic low in 2009, compounding the problem of antibiotic resistance that has limited CDC-recommended treatment to just ceftriaxone and azithromycin.
The report was supported by the Centers for Disease Control and Prevention. The authors did not report having any disclosures.
SOURCE: Centers for Disease Control and Prevention. Sexually Transmitted Disease Surveillance 2017; https://www.cdc.gov/std/stats
Rapidly increasing cases of newborn syphilis have reached their highest prevalence in 2 decades, according to a new report by the Centers for Disease Control and Prevention on sexually transmitted disease surveillance in 2017.
Newborn syphilis incidence has more than doubled, from 362 cases in 2013 to 918 cases in 2017, resulting in 64 syphilitic stillbirths and 13 infant deaths that year, according to data published in Sexually Transmitted Disease Surveillance 2017.
At least one case was reported in 37 states last year, and the greatest burden of cases occurred in California, Arizona, Texas, Louisiana, and Florida, together accounting for 70% of all 2017 cases.
“The resurgence of syphilis, and particularly congenital syphilis, is not an arbitrary event, but rather a symptom of a deteriorating public health infrastructure and lack of access to health care,” wrote Gail Bolan, MD, director of the Division of STD Prevention at the CDC’s National Center for HIV/AIDS, Viral Hepatitis, STD and TB Prevention. “It is exposing hidden, fragile populations in need that are not getting the health care and preventive services they deserve.”
Dr. Bolan recommends modernizing surveillance to capture more of the cases in populations without ready access to diagnosis and treatment and in those choosing not to access care.
“It is imperative that federal, state, and local programs employ strategies that maximize long-term population impact by reducing STD incidence and promoting sexual, reproductive, maternal, and infant health,” she wrote. “Further, it will be important for us to measure and monitor the adverse health consequences of STDs, such as ocular and neurosyphilis, pelvic inflammatory disease, ectopic pregnancy, infertility, HIV, congenital syphilis, and neonatal herpes.”
Multiple sources contributed data to the report: state and local STD programs’ notifiable disease reporting, private and federal national surveys, and specific projects that collect STD prevalence data, including the National Job Training Program, the STD Surveillance Network and the Gonococcal Isolate Surveillance Project.
The four nationally notifiable STDs are chlamydia, gonorrhea, syphilis, and chancroid.
The rise in newborn syphilis cases, currently at 23.3 cases per 100,000 live births, mirrors the increased U.S. prevalence of both primary and secondary syphilis in 2017, with 9.5 cases per 100,000 people. Syphilis has increased every year since 2000-2001, when prevalence was at a record low.
Chlamydia and gonorrhea rates climb too
The report also noted increases in the prevalence of other STDs. Chlamydia, the most common STD, increased 6.9% as compared to 2016, with 528.8 cases per 100,000 people. This increase occurred in all U.S. regions and independently of sex, race, or ethnicity, though rates were highest in teens and young adults. Nearly two-thirds of chlamydia cases in 2017 occurred in people ages 15-24 years old.
Reported rates were higher in women than in men, likely due to women’s increased likelihood of undergoing screening, the report suggested. Better surveillance may also partly explain the climb in men’s cases.
“Increases in rates among men may reflect an increased number of men, including gay, bisexual and other men who have sex with men (collectively referred to as MSM) being tested and diagnosed with a chlamydial infection due to increased availability of urine testing and extragenital screening,” according to the report.
The CDC received reports of more than a half million gonorrhea infections in 2017 (555,608 cases), an increase of 18.6% since the previous year, including a 19.3% increase among men and a 17.8% increase among women.
“The magnitude of the increase among men suggests either increased transmission, increased case ascertainment (e.g., through increased extra-genital screening among MSM), or both,” the authors wrote. “The concurrent increase in cases reported among women suggests parallel increases in heterosexual transmission, increased screening among women, or both.”
Overall, gonorrhea cases have skyrocketed 75.2% since their historic low in 2009, compounding the problem of antibiotic resistance that has limited CDC-recommended treatment to just ceftriaxone and azithromycin.
The report was supported by the Centers for Disease Control and Prevention. The authors did not report having any disclosures.
SOURCE: Centers for Disease Control and Prevention. Sexually Transmitted Disease Surveillance 2017; https://www.cdc.gov/std/stats
Key clinical point: Newborn syphilis cases have more than doubled in 5 years along with substantial increases in chlamydia, gonorrhea, and syphilis.
Major finding: 918 cases of newborn syphilis were reported in 37 states in 2017.
Study details: The findings are based on data from public health notifiable disease reports and multiple federal and private surveillance projects.
Disclosures: The report was supported by the Centers for Disease Control and Prevention. The authors did not report having any disclosures.
Source: Centers for Disease Control and Prevention. Sexually Transmitted Disease Surveillance 2017.
Pertussis vaccine at birth shows immune response, tolerability
compared with a group receiving only the hepatitis B vaccine, a randomized clinical trial from Australia has found.

“These results indicate that a birth dose of aP vaccine is immunogenic in newborns and significantly narrows the immunity gap between birth and 14 days after receipt of DTaP at 6 or 8 weeks of age, marking the critical period when infants are most vulnerable to severe pertussis infection,” reported Nicholas Wood, PhD, of the National Centre for Immunisation Research and Surveillance of Vaccine Preventable Diseases in New South Wales, Australia, and his colleagues.
“Administration of the acellular pertussis vaccine at birth has the potential to reduce severe morbidity from Bordetella pertussis infection in the first 3 months of life, especially for infants of mothers who have not received a pertussis vaccine during pregnancy,” the researchers concluded in JAMA Pediatrics.
The researchers enrolled 417 infants from Sydney, Melbourne, Adelaide, and Perth between June 2010 and March 2013 and randomized them to receive either the hepatitis B vaccine alone (n = 205) or the hepatitis B vaccine with a monovalent acellular pertussis vaccine (n = 212) within the first 5 days after birth. The randomization was stratified for mothers’ receipt of the Tdap before pregnancy.
The Centers for Disease Control and Prevention currently recommends all newborns receive the hepatitis B vaccine shortly after birth and that pregnant women receive the Tdap vaccine during each pregnancy. There is not currently a monovalent acellular pertussis vaccine licensed in the United States.
The study infants then received the hexavalent DTaP-Hib-hep B-polio vaccine and the 10-valent pneumococcal conjugate vaccine at 6 weeks, 4 months, and 6 months.
The primary outcome was detectable levels of IgG antibody to pertussis toxin and pertactin at 10 weeks old.
Of the 206 infants receiving the pertussis vaccine at birth, 93% had detectable antibodies to pertussis toxin and pertactin at 10 weeks, compared with 51% of the 193 infants who received only the hepatitis B shot (P less than .001). Geometric mean concentration for pertussis toxin IgG also was four times higher in infants who received the pertussis vaccine at birth.
Adverse events were similar in the two groups both at birth and at 32 weeks, demonstrating that the pertussis birth dose is safe and tolerable.
“More important, in this study, the prevalence of fever after receipt of the birth dose, which can mistakenly be associated with potential sepsis and result in additional investigations in the neonatal period, was similar in both the group that received the aP vaccine at birth and the control group,” the authors reported.
A remaining question is the potential impact of maternal antibodies on protection from pertussis.
“The presence of maternal pertussis antibodies at birth can negatively affect postprimary responses to pertussis, diphtheria, and diphtheria-related CRM197 conjugate vaccines with a variety of infant immunization schedules and vaccines,” the authors noted. “The clinical significance of reductions in pertussis antibody related to maternal interference will require ongoing clinical evaluation, because there are no accepted serologic correlates of protection.”
The research was funded by a Australian National Health and Medical Research Council (NHMRC) grant, and several authors received NHMRC grants. One author also was supported by a Murdoch Children’s Research Institute Career Development Award. GlaxoSmithKline provided the vaccine and conducted the serologic assays. The authors reported having no conflicts of interest.
SOURCE: Wood N et al, JAMA Pediatr. 2018 Sep 10. doi: 10.1001/jamapediatrics.2018.2349.
Pertussis is most likely to cause morbidity or kill neonates between birth and when they are given their first pertussis vaccine at 6-8 weeks of age. This is well known.
In the current study giving the acellular pertussis (aP) vaccine at birth led to “significantly higher antibody titers to pertussis antigens at 10 weeks of age,” compared with those who did not receive it. Those infants who received the birth dose of aP vaccine also had higher pertussis antibodies at 6 weeks, whether or not their mothers had received Tdap within 5 years prior to delivery.
When this study began in 2009, maternal immunization was not a well accepted concept, but this attitude has changed, in part due to the safe vaccination of pregnant women with the pandemic flu vaccine. Despite this, Centers for Disease Control and Prevention 2016 data showed that only 49% of pregnant women in the United Stated received Tdap. These rates need to increase.
Administering the aP vaccine with the existing hepatitis B vaccine at birth to infants whose mothers who did not receive Tdap during pregnancy would be a practical solution, if the aP vaccine were universally available.
But the aP vaccine currently is not available in the United States and many other countries as a standalone vaccine, and the administration of DTaP as a birth dose has been linked with “significant immune interference.” The aP vaccine could have a place in countries where it is available, and there is no maternal immunization program. Otherwise, boosting maternal immunization appears to be the primary approach for now.
Kathryn M. Edwards, MD, is the Sarah H. Sell and Cornelius Vanderbilt Chair in Pediatrics at Vanderbilt University, Nashville. She specializes in pediatric infectious diseases. These comments are a summary of her editorial accompanying the article by Wood et al. (Pediatrics. 2018 Sep 10. doi: 10.1001/jamapediatrics.2018.2363). Dr. Edwards said she had no conflicts of interest.
compared with a group receiving only the hepatitis B vaccine, a randomized clinical trial from Australia has found.
“These results indicate that a birth dose of aP vaccine is immunogenic in newborns and significantly narrows the immunity gap between birth and 14 days after receipt of DTaP at 6 or 8 weeks of age, marking the critical period when infants are most vulnerable to severe pertussis infection,” reported Nicholas Wood, PhD, of the National Centre for Immunisation Research and Surveillance of Vaccine Preventable Diseases in New South Wales, Australia, and his colleagues.
“Administration of the acellular pertussis vaccine at birth has the potential to reduce severe morbidity from Bordetella pertussis infection in the first 3 months of life, especially for infants of mothers who have not received a pertussis vaccine during pregnancy,” the researchers concluded in JAMA Pediatrics.
The researchers enrolled 417 infants from Sydney, Melbourne, Adelaide, and Perth between June 2010 and March 2013 and randomized them to receive either the hepatitis B vaccine alone (n = 205) or the hepatitis B vaccine with a monovalent acellular pertussis vaccine (n = 212) within the first 5 days after birth. The randomization was stratified for mothers’ receipt of the Tdap before pregnancy.
The Centers for Disease Control and Prevention currently recommends all newborns receive the hepatitis B vaccine shortly after birth and that pregnant women receive the Tdap vaccine during each pregnancy. There is not currently a monovalent acellular pertussis vaccine licensed in the United States.
The study infants then received the hexavalent DTaP-Hib-hep B-polio vaccine and the 10-valent pneumococcal conjugate vaccine at 6 weeks, 4 months, and 6 months.
The primary outcome was detectable levels of IgG antibody to pertussis toxin and pertactin at 10 weeks old.
Of the 206 infants receiving the pertussis vaccine at birth, 93% had detectable antibodies to pertussis toxin and pertactin at 10 weeks, compared with 51% of the 193 infants who received only the hepatitis B shot (P less than .001). Geometric mean concentration for pertussis toxin IgG also was four times higher in infants who received the pertussis vaccine at birth.
Adverse events were similar in the two groups both at birth and at 32 weeks, demonstrating that the pertussis birth dose is safe and tolerable.
“More important, in this study, the prevalence of fever after receipt of the birth dose, which can mistakenly be associated with potential sepsis and result in additional investigations in the neonatal period, was similar in both the group that received the aP vaccine at birth and the control group,” the authors reported.
A remaining question is the potential impact of maternal antibodies on protection from pertussis.
“The presence of maternal pertussis antibodies at birth can negatively affect postprimary responses to pertussis, diphtheria, and diphtheria-related CRM197 conjugate vaccines with a variety of infant immunization schedules and vaccines,” the authors noted. “The clinical significance of reductions in pertussis antibody related to maternal interference will require ongoing clinical evaluation, because there are no accepted serologic correlates of protection.”
The research was funded by a Australian National Health and Medical Research Council (NHMRC) grant, and several authors received NHMRC grants. One author also was supported by a Murdoch Children’s Research Institute Career Development Award. GlaxoSmithKline provided the vaccine and conducted the serologic assays. The authors reported having no conflicts of interest.
SOURCE: Wood N et al, JAMA Pediatr. 2018 Sep 10. doi: 10.1001/jamapediatrics.2018.2349.
FROM JAMA PEDIATRICS
Key clinical point: A monovalent acellular pertussis vaccine dose at birth appears safe, tolerable, and effective.
Major finding: 93% of 212 newborns receiving an acellular pertussis vaccine at birth showed antibodies against pertussis toxin and pertactin at 10 weeks, compared with 51% of 205 newborns without the birth dose.
Study details: The findings are based on a randomized controlled trial involving 417 healthy term newborns in four Australian cities from June 2010 to March 2013.
Disclosures: The research was funded by an Australian National Health and Medical Research Council (NHMRC) grant, and several authors received NHMRC grants. One author also was supported by a Murdoch Children’s Research Institute Career Development Award. GlaxoSmithKline provided the vaccine and conducted the serologic assays. The authors reporting having no conflicts of interest.
Source: Wood N et al. JAMA Pediatr. 2018 Sep. 10. doi: 10.1001/jamapediatrics.2018.2349.
Russian Twitter bots and trolls amplify vaccine controversy
Russian trolls and bots significantly intensified the polarization of vaccine messaging on Twitter, fostering discord on the social network, according to researchers who analyzed the content of tweets over a 3-year period.

“Bots and trolls are actively involved in the online public health discourse, skewing discussions about vaccination,” wrote David A. Broniatowski, PhD, of George Washington University, Washington, D.C., and his associates.
in the American Journal of Public Health (Am J Public Health. doi: 10.2105/AJPH.2018.304567).
“This is vital knowledge for risk communicators, especially considering that neither members of the public nor algorithmic approaches may be able to easily identify bots, trolls, or cyborgs.”
The researchers conducted two content analyses and one qualitative analysis of tweets from July 2014 to September 2017. Their data set included 1% of all tweets during that time period and a sample of tweets containing vaccine-related keywords.
First they compared rates of vaccine-related tweets between bots and average users, and then they assessed the attitude of these tweets from different account types. Their qualitative case study focused on the use of the hashtag #vaccinateUS which was predominantly used by Russian trolls.
The researchers relied on seven publicly available lists to identify which accounts were bots or trolls and then compared them to randomly selected tweets posted in the same time period.
In their second analysis, the researchers used Botometer, a program created by the Indiana University Network Science Institute (IUNI) and the Center for Complex Networks and Systems Research (CNetS), to categorize tweets as very likely to be human, very likely to be bots, or of uncertain provenance.
Results revealed that Russian trolls, sophisticated bot accounts, and “content polluters” – those that spread malware and unsolicited content – are more likely than average users to tweet about vaccination. Content polluters tweeted more anti-vaccine messages while Russian trolls and sophisticated bots promoted both anti-vaccine and pro-vaccine messages that amplified the polarization (P less than .001).
The higher rate of antivaccine messages from content polluters suggested that antivaccine advocates may have exploited existing bot networks for their messaging.
“These accounts may also use the compelling nature of antivaccine content as clickbait to drive up advertising revenue and expose users to malware,” Dr. Broniatowski and colleagues wrote. “Antivaccine content may increase the risks of infection by both computer and biological viruses.”
The qualitative analysis of the #VaccinateUS hashtag found that 43% were provaccine, 38% were antivaccine and the other 19% were neutral.
“Whereas most non-neutral vaccine-relevant hashtags were clearly identifiable as either provaccine (#vaccineswork, #vaxwithme) or antivaccine (#Vaxxed, #b1less, #CDCWhistleblower), with limited appropriation by the opposing side, #VaccinateUS is unique in that it appears with very polarized messages on both sides,” the researchers reported.
Tweets using the #VaccinateUS hashtags were also more likely to contain grammatical errors, unnatural word choices, and irregular phrasing – but fewer spelling or punctuation errors than average tweets related to vaccines.
“The #VaccinateUS messages are also distinctive in that they contain no links to outside content, rare @mentions of other users, and no images (but occasionally use some emojis),” the researchers found.
Although messages with that hashtag “mirrored” Twitter’s overall vaccine discourse, subtle differences included greater emphasis on “freedom,” “democracy,” and “constitutional rights” than the more common “parental choice” focus of tweets using other vaccine-related hashtags. The conspiracy-theory targets of #VaccinateUS tweets also focused almost entirely on the U.S. government instead of a wide range of conspiracy theories at large, which was more common in other anti-vaccine tweets.
Antivaccine content was densest among accounts, with accounts falling in the middle bot category of uncertainty.
“Although we speculate that this set of accounts contains more sophisticated bots, trolls, and cyborgs, their provenance is ultimately unknown,” the researchers wrote. “Therefore, beyond attempting to prevent bots from spreading messages over social media, public health practitioners should focus on combating the messages themselves while not feeding the trolls.”
The research was funded by the National Institutes of Health. No conflicts of interest were noted.
SOURCE: Broniatowski DA et al. Am J Public Health. 2018 Aug 23. doi: 10.2105/AJPH.2018.304567.
Russian trolls and bots significantly intensified the polarization of vaccine messaging on Twitter, fostering discord on the social network, according to researchers who analyzed the content of tweets over a 3-year period.
“Bots and trolls are actively involved in the online public health discourse, skewing discussions about vaccination,” wrote David A. Broniatowski, PhD, of George Washington University, Washington, D.C., and his associates.
in the American Journal of Public Health (Am J Public Health. doi: 10.2105/AJPH.2018.304567).
“This is vital knowledge for risk communicators, especially considering that neither members of the public nor algorithmic approaches may be able to easily identify bots, trolls, or cyborgs.”
The researchers conducted two content analyses and one qualitative analysis of tweets from July 2014 to September 2017. Their data set included 1% of all tweets during that time period and a sample of tweets containing vaccine-related keywords.
First they compared rates of vaccine-related tweets between bots and average users, and then they assessed the attitude of these tweets from different account types. Their qualitative case study focused on the use of the hashtag #vaccinateUS which was predominantly used by Russian trolls.
The researchers relied on seven publicly available lists to identify which accounts were bots or trolls and then compared them to randomly selected tweets posted in the same time period.
In their second analysis, the researchers used Botometer, a program created by the Indiana University Network Science Institute (IUNI) and the Center for Complex Networks and Systems Research (CNetS), to categorize tweets as very likely to be human, very likely to be bots, or of uncertain provenance.
Results revealed that Russian trolls, sophisticated bot accounts, and “content polluters” – those that spread malware and unsolicited content – are more likely than average users to tweet about vaccination. Content polluters tweeted more anti-vaccine messages while Russian trolls and sophisticated bots promoted both anti-vaccine and pro-vaccine messages that amplified the polarization (P less than .001).
The higher rate of antivaccine messages from content polluters suggested that antivaccine advocates may have exploited existing bot networks for their messaging.
“These accounts may also use the compelling nature of antivaccine content as clickbait to drive up advertising revenue and expose users to malware,” Dr. Broniatowski and colleagues wrote. “Antivaccine content may increase the risks of infection by both computer and biological viruses.”
The qualitative analysis of the #VaccinateUS hashtag found that 43% were provaccine, 38% were antivaccine and the other 19% were neutral.
“Whereas most non-neutral vaccine-relevant hashtags were clearly identifiable as either provaccine (#vaccineswork, #vaxwithme) or antivaccine (#Vaxxed, #b1less, #CDCWhistleblower), with limited appropriation by the opposing side, #VaccinateUS is unique in that it appears with very polarized messages on both sides,” the researchers reported.
Tweets using the #VaccinateUS hashtags were also more likely to contain grammatical errors, unnatural word choices, and irregular phrasing – but fewer spelling or punctuation errors than average tweets related to vaccines.
“The #VaccinateUS messages are also distinctive in that they contain no links to outside content, rare @mentions of other users, and no images (but occasionally use some emojis),” the researchers found.
Although messages with that hashtag “mirrored” Twitter’s overall vaccine discourse, subtle differences included greater emphasis on “freedom,” “democracy,” and “constitutional rights” than the more common “parental choice” focus of tweets using other vaccine-related hashtags. The conspiracy-theory targets of #VaccinateUS tweets also focused almost entirely on the U.S. government instead of a wide range of conspiracy theories at large, which was more common in other anti-vaccine tweets.
Antivaccine content was densest among accounts, with accounts falling in the middle bot category of uncertainty.
“Although we speculate that this set of accounts contains more sophisticated bots, trolls, and cyborgs, their provenance is ultimately unknown,” the researchers wrote. “Therefore, beyond attempting to prevent bots from spreading messages over social media, public health practitioners should focus on combating the messages themselves while not feeding the trolls.”
The research was funded by the National Institutes of Health. No conflicts of interest were noted.
SOURCE: Broniatowski DA et al. Am J Public Health. 2018 Aug 23. doi: 10.2105/AJPH.2018.304567.
FROM THE AMERICAN JOURNAL OF PUBLIC HEALTH
Key clinical point: Twitter bots and trolls are polluting social media vaccine discussions.
Major finding: Russian trolls and bots are more likely to amplify polarization of vaccine Twitter messaging while other trolls and bots are more likely to promote anti-vaccine messages and malware.
Study details: The findings are based on three content analyses of vaccine-related Twitter content samples from July 2014 to September 2017.
Disclosures: The research was funded by the National Institutes of Health. No conflicts of interest were noted.
Source: Broniatowski, D et al. Am J Public Health. doi:10.2105/AJPH.2018.304567.
The second victim: More ob.gyn. organizations recognize need for support
When Patrice Weiss, MD, was a resident, a healthy, low-risk patient underwent what should have been an uncomplicated vaginal hysterectomy. But the patient developed a series of postoperative complications leading to multisystem organ failure and a lengthy stay in intensive care.
“None of us could really figure out how this happened. I still can’t figure out how this person who was relatively young developed all these complications,” said Dr. Weiss, now chief medical officer of Carilion Clinic and professor of obstetrics and gynecology at Virginia Tech Carilion School of Medicine and Research Institute, both in Roanoke, Va. “There are times when you don’t know why something happened or what you could have done differently – and the answer may be nothing – but that dramatic, potentially very complicated outcome can really weigh on people. You still harbor those feelings of a second victim.”
It’s the health care professional who is that “second victim,” a term coined in 2000 by Albert W. Wu, MD, professor of public health at Johns Hopkins University, Baltimore, to describe an increasingly recognized phenomenon following unexpected adverse patient events, medical errors, or patient injuries (BMJ. 2000 Mar 18;320[7237]:726-7). The patients and their loved ones are the first victims, but a health care professional’s feelings of guilt, shame, inadequacy, and other powerful, complicated emotions can have long-lasting effects on his or her psyche, clinical practice, and career, particularly if he or she does not receive validation, support, and access to resources to work through the experience.
“Second victims ... become victimized in the sense that the provider is traumatized by the event,” Susan D. Scott, PhD, of the University of Missouri Health System, Columbia, and her colleagues wrote in a 2009 paper about the phenomenon (Qual Saf Health Care. 2009;18[5]:325-30). “Frequently, these individuals feel personally responsible for the patient outcome. Many feel as though they have failed the patient, second-guessing their clinical skills and knowledge base,” they said.
It’s that latter part that can fester and potentially poison a health care professional’s ability to function, according to Charlie Jaynes, MD, senior director of medical operations for Ob Hospitalist Group in Greenville, S.C.
“ and therefore can have a direct effect on patient care and lead to poor outcomes,” Dr. Jaynes said. “It’s a very dangerous phenomenon because it can degrade the quality of medical care provided.”
Most physicians are trained to internalize and compartmentalize these experiences, to “suck it up and get on with it,” he said, but it’s now become clear that such a strategy can have disastrous professional and personal consequences.
“In the worst case scenario, people burn out, drop out or commit suicide, their marriage ends up in shambles, or they turn to drugs and alcohol,” Dr. Jaynes said. “What Dr. Wu did was open the box to allow some empathy and compassion to be introduced to the situation.”
Dangers of unaddressed second victim impact
Estimates vary widely on the prevalence of second victim phenomenon among physicians and nurses who have been involved in a medical error or unexpected serious outcome. Across the medical field, estimates range from 10% in a study among otolaryngologists (Laryngoscope. 2006 Jul;116[7]:1114-20) to up to 30% and 50% more broadly, although some fields may be more susceptible than others (Jt Comm J Qual Patient Saf. 2010;36[5]:233-40; BMJ Qual Saf. 2012;21[4]:267-70).
“In the world of obstetrics, we spend 99.9% of our time in a happy field of medicine filled with joy and new life,” Dr. Weiss said. “Whether consciously or unconsciously, those become the expectations of the patients and the providers, so when there is an outcome that is less than optimal, that’s when you’re even more affected because of what your expectations are going into it.”
Dr. Scott and her colleagues noted that the stages of being a second victim are similar to the Kübler-Ross stages:
- Stage 1: Chaos and event repair.
- Stage 2: Intrusive thoughts, “what if.”
- Stage 3: Restoring personal identity.
- Stage 4: Enduring the inquisition.
- Stage 5: Obtaining emotional first aid.
- Stage 6: Moving on or dropping out; surviving and/or thriving.”
“This can go on for years. Someone can spend years just surviving and not thriving,” Dr. Weiss said. “It can really happen along a continuum.”
Although studies have not looked specifically at second victims and patient care, research has shown that second victims have a higher risk of burnout, and that physicians with high burnout tend to order more tests, spend less time with patients, and have greater risk of making medical errors, Dr. Weiss said.
A study looking at the emotional impact of medical errors on physicians found that 61% had greater anxiety about making future medical errors, 44% had a loss of confidence, 42% had trouble sleeping, and 42% were less satisfied in their job (Jt Comm J Qual Patient Saf. 2007;33[8]:467-76).
“You have the risk of the provider leaving medicine altogether or significantly changing their practice patterns, or giving up obstetric care because of the emotional toll it takes on providers,” she said. “We already know that one of the crises facing medicine right now is burnout, so you have the risk of additional or worsening burnout.”
Recognizing the need for formal support programs
Research does clearly show a need for programs formally addressing these experiences. A 2007 survey found that only 10% of 3,171 of internal medicine doctors, pediatricians, family physicians, and surgeons felt their health care organizations provided adequate support in managing stress following a medical error, yet about 8 in 10 wanted support (Jt Comm J Qual Patient Saf. 2007;33[8]:467-76).
Organizations are responding. One of the first second-victim programs is the “forYOU” program implemented at the University of Missouri Health Care’s Office of Clinical Effectiveness in 2007. The free, 24-7 program provides a “safe zone” for expressing emotions and reactions confidentially.
Ob Hospitalist Group just launched the CARE (Clinician Assistance, Recovery & Encouragement) Program, the first national peer-support program for second victims. The first 25 volunteers who underwent training in September will serve the organization’s more than 700 health care professionals across 32 states.
Instead of psychological counseling or intervention, the program emphasizes active listening, nonjudgment, and compassion during confidential calls; peers don’t take notes or record the conversations.
“We will be quiet and listen and speak at the appropriate times to be compassionate and not make judgments,” Dr. Jaynes said. “I think its critical to realize that in order to do that you have to be one of us. If you haven’t been there yourself when a baby dies in utero or you have a mother almost die by hemorrhage or a complication of surgery ... it creates emotional turmoil. Everybody who’s worth their salt questions, ‘What did I do wrong?’ and we’re really harsh on ourselves. If I can say I realize it’s a horrible place to be because I’ve been there myself, I can be a useful peer.”
At Dr. Weiss’s institution, Carilion Clinic spent 5 years developing and implementing the TRUST second-victim program, emphasizing Treatment, Respect, Understanding/compassion, Supportive care, and Transparency. Dr. Weiss said the first step in developing such a program is talking about the problem.
“You need hospital leadership addressing the phenomenon of the second victim, recognizing it is real, that it’s not a sign of weakness for providers to have any of these signs,” she said. “It has to be done at an organizational level. There has to be a place where providers can talk freely about the emotional impact of the outcome, not just the clinical outcomes.”
Johns Hopkins Hospital in Baltimore published findings in September 2017 about its program RISE (Resilience In Stressful Events) (Jt Comm J Qual Patient Saf. 2017 Sep;43[9]:471-83 that was featured by the Joint Commission as a program that employs some of the tools the commission describes in its toolkit for health care organizations to develop second-victim support programs (Jt Comm J Qual Patient Saf. 2012 May;38[5]:235-40, 193).
It’s important that health care professionals are not expected or required to seek counseling or similar interventions, Dr. Weiss said, but they know of available resources.
“People need to be able to talk about it when they’re ready. It doesn’t necessarily matter how your peers judge your actions because these are feelings that come from within,” Dr. Weiss said, although colleagues can validate a second victim’s experience or feelings by sharing their own.
“It’s helpful when someone in a leadership role can acknowledge that this is real and say to a provider, ‘I’ve been there, and this is what helped me,’ or ‘I’ve been there, and there was no resource and I went without help for years,’ ” she said.
In fact, it’s her own past experiences that have made Dr. Weiss so passionate about raising awareness about second victims.
“I’ve been involved in cases of unanticipated outcomes and personally witnessed medical errors, and I’ve seen how very close colleagues can be affected,” she said. “This is a topic that really, really hits home for me.”
Signs and symptoms: How to recognize a possible second victim
Anyone can become a second victim, regardless of their training, experience, or years of practice, Dr. Weiss said. A health care professional may practice for years and witness many unanticipated poor outcomes before one suddenly drums up feelings they don’t expect.
“It’s almost inevitable that providers are going to have unanticipated outcomes or unexpected outcomes,” Dr. Weiss said. “The challenge with the second victim is no one can ever predict how someone is going to respond to an outcome, including ourselves. This may be the first time they have a response to something they never saw coming.”
Two aspects correlated with a higher risk of second victim are the severity of the morbidity or mortality of the patient and the degree of personal responsibility the health care professional feels. The signs and symptoms of being a second victim can be indistinguishable from those of depression, anxiety, or posttraumatic stress syndrome, but the biggest indicator is a change in a person’s normal behavior, Dr. Weiss said.
“The person who is never late to work is late to work. The person who is always mild-mannered is on edge,” she said. “A lot of it is subtle personality or behavior changes, or you begin to notice practice pattern differences, such as ordering a bunch of labs.”
Perhaps the providers are snapping at people when they’ve never snapped before, or they express more cynicism or sarcasm, she added. “A change in their sleeping or eating patterns or in their personal hygiene are all things that one could look for.”
According to Dr. Jaynes, emotional signs may include irritability, fear, anger, grief, remorse, frustration, desperation, numbness, guilt, loneliness, shock and feeling disconnected, feeling hopeless or out of control. Physical symptoms include headaches, muscle tension, chest pain, extreme fatigue, sleeping problems, appetite changes or gastrointestinal symptoms, dizziness, frequent illnesses, being easily startled, or increased heart rate, blood pressure, or breathing rate. Other possible signs include flashbacks, nightmares, social avoidance, difficulties concentrating, poor memory, avoiding patient care areas, fearing repercussions to their reputations, and decreased job satisfaction. Second victims also may experience a loss in confidence or spiritual connection, or loss of interest in work, usual activities, and connections with others.
Dr. Weiss and Dr. Jaynes said they had no relevant financial disclosures.

Psoriasis pipeline is full of biologics
CHICAGO – Most psoriasis therapies in the pipeline are biologics, including several interleukin (IL)-23 inhibitors and a promising dual inhibitor of IL-17A and IL-17F, so dermatologists are likely to gain a few more options for treating psoriasis patients who have not responded well to or tolerated existing therapies.
“The IL-23 blockers are ideal for patients who want a few injections,” Mark Lebwohl, MD, professor of dermatology at the Icahn School of Medicine at Mount Sinai, New York, and chair of the department of dermatology of the Mount Sinai Health System, said after the American Academy of Dermatology summer meeting. He discussed clinical trial results for risankizumab, mirikizumab, certolizumab pegol (which was recently approved for psoriasis), bimekizumab, as well as tildrakizumab, which has been approved by the Food and Drug Administration, but has not yet been released.
Tildrakizumab: The FDA approved tildrakizumab (Ilumya), a selective IL-23p19 inhibitor, for treatment of moderate to severe plaque psoriasis in March 2018 based on data from the reSURFACE 1 and reSURFACE 2 trials. After initial doses at weeks 0 and 4, patients received a 100-mg subcutaneous injection dose every 12 weeks. Results of reSURFACE 1 showed that 14% of trial participants achieved a Psoriasis Area and Severity Index (PASI) score of 100 with tildrakizumab at week 12, compared with 1% of those receiving a placebo. Similarly, 35% achieved a PASI 90 and 64% achieved a PASI 75 with the drug, compared with 3% and 6%, respectively, in the placebo group. Findings for reSURFACE 2 were similar; in a pooled analysis, a quarter of the 371 patients reached PASI 100 by week 28, 36% reached PASI 90-PASI 99, 24% reached PASI 75-PASI 89, and 10% reached PASI 50-PASI 74. Efficacy remained high 2 years after treatment, although body weight affected the efficacy. “The authors concluded that PASI and PGA [Physician Global Assessment] responses were numerically greater in patients with lower versus higher body weight,” Dr. Lebwohl said at the meeting.
Tildrakizumab also has an “overall clean safety profile,” he said. Among all patients treated in the trials, the rate of severe infections, malignancies and major adverse cardiac events did not significantly differ from placebo.*
Risankizumab: Also an IL-23 inhibitor, risankizumab, under FDA review for treatment of moderate to severe plaque psoriasis, outperformed both ustekinumab and adalimumab in pivotal phase 3 trials reported in October 2017. In the two ultlMMa trials, 75% of 598 total patients achieved a PASI 90 score after 16 weeks of treatment, compared with 2%-5% of placebo participants and 42%-48% of those on ustekinumab. In ultlMMa-1, just over a third of patients treated with achieved PASI 100, and just over half did in ultlMMa-2, compared with 12% and 24% of those on ustekinumab, respectively.
At 1 year, the proportion of those with PASI 90 rose to 82% in ultlMMa-1 and 81% in ultlMMa-2, with over half the participants achieving PASI 100 in both studies. The risankizumab trial findings were “among highest efficacy results reported to date, with impressive durability of response on and off drug,” Dr. Lebwohl said. “Preliminary safety is encouraging,” but “long-term data are required.”
Mirikizumab: Although not as far along in clinical trials, mirikizumab is another IL-23 inhibitor with “interesting and impressive preliminary results,” Dr. Lebwohl said. In a phase 2 trial of 205 participants whose baseline demographics indicated more severe psoriasis, 67% achieved PASI 90 at week 16 with a 300-mg dose (administered every 8 weeks). Doses of 100 mg and 30 mg resulted in 59% and 29% of participants achieving PASI 90 at week 16.
“The most common treatment emergent adverse events included upper respiratory tract infection [including viral], injection site pain, hypertension and diarrhea,” Dr. Lebwohl said. Patients are now being recruited for two phase 3 studies of mirikizumab (OASIS-1 and OASIS-2).
Certolizumab pegol: Certolizumab pegol is a tumor necrosis factor blocker approved in 2013 for treatment of psoriatic arthritis, and for moderate to severe plaque psoriasis in May 2018. In a pooled data analysis of three phase 3 trials (CIMPASI-1, CIMPASI-2, and CIMPACT), 52.3% of participants taking 400 mg subcutaneously every 2 weeks and 44.5% of those taking 200 mg every 2 weeks achieved PASI 90 at week 16, compared with 1.6% of those on placebo. In addition, a trial evaluating maternal transfer of certolizumab to the fetus via placenta found minimal drug concentration levels in the umbilical cord and infant’s plasma. “Certolizumab is ideal for women of childbearing potential,” Dr. Lebwohl said after the meeting.
Bimekizumab: This is a dual inhibitor of IL-17A and IL-17F being studied for treatment of mild psoriasis but “is very promising for psoriatic arthritis, as well as psoriasis,” Dr. Lebwohl said. In the phase 2b BE ABLE 1 trial, up to 79% of patients receiving bimekizumab achieved PASI 90 at week 12, and up to 46% of psoriatic arthritis patients had at least a 50% improvement in joint symptoms, compared with 7% of those on placebo.
Dr. Lebwohl is a consultant for Allergan, Boehringer-Ingelheim, Leo and Promius Pharma, and is an employee of Mount Sinai, which receives research funds from Abbvie, Amgen, Boehringer Ingelheim, Celgene, Eli Lilly, Janssen/Johnson & Johnson, Kadmon, Medimmune/AstraZeneca, Novartis, Pfizer, and ViDac Pharma.
*Correction, 8/6/18: An earlier version of this article misstated the adverse event data for tildrakizumab.
EXPERT ANALYSIS FROM SUMMER AAD 2018
AAP: Food additives inadequately regulated, pose risks to children
The regulation of food additives needs an overhaul in the United States because of the risks these compounds pose to children and infants, according to a new policy statement by the American Academy of Pediatrics.

suggested members of the AAP Council on Environmental Health.
Among the additives of greatest concern, the statement notes, are bisphenols (including bisphenol A), phthalates, certain pesticides, perfluoroalkyl chemicals, perchlorate, artificial food colors, nitrates, and nitrites. A technical report accompanying the policy statement reviewed existing evidence on these compounds.
The statement, authored by the council led by Leonardo Trasande, MD, of New York University, noted that many of the more than 10,000 chemicals added to food and food packaging were grandfathered into use prior to current regulations. Further, approximately 1,000 of these chemicals fall under the Food and Drug Administration’s designation of “generally recognized as safe,” which does not require FDA approval for use.
“Current requirements for a ‘generally recognized as safe’ [GRAS] designation are insufficient to ensure the safety of food additives and do not contain sufficient protections against conflict of interest,” they wrote. “Additionally, the FDA does not have authority to obtain data on or reassess the safety of chemicals already on the market.” The FDA does not regularly consider cumulative effects of food additives or the synergistic effects of chemicals found in foods.
The authors noted that concerns about food additives have increased in the past 20 years as new research has identified adverse health effects, including endocrine disruption, associated with these chemicals.
Dr. Trasande and his associates also acknowledged the limited evidence available on food additives particularly for children and infants, but noted this population’s greater vulnerability to chemical exposures.
Compounds addressed in the statement
- Bisphenols. Health concerns tied to these chemicals are endocrine/neurodevelopmental disruption and obesogenic activity.
- Phthalates. Health concerns linked to these chemicals are endocrine disruption, obesogenic activity, oxidative stress, and cardiotoxicity.
- Perfluoroalkyl chemicals. Health concerns associated with these chemicals are immunosuppression, endocrine disruption, obesogenic activity, and decreased birth weight.
- Perchlorate. The health concern tied to this chemical is thyroid hormone disruption.
- Nitrates and nitrites. Use of these as a preservative and color enhancer has been linked to carcinogenicity and thyroid hormone disruption.
Of these, only nitrates and nitrites are directly added to food while the other chemicals are indirect additives via their use in food packaging that directly touches the food.
How health care providers can help parents and children
“Insofar as these modifications can pose additional costs, barriers may exist for low-income families to reduce their exposure to food additives of concern,” the authors wrote. Health care providers “may wish to tailor guidance in the context of practicality, especially because food insecurity remains a substantial child health concern.”
Their recommendations on guidance for parents include:
- Prioritize fresh or frozen vegetables in meals. “Develop a list of low-cost sources for fresh fruits and vegetables” in the area.
- Avoid processed meats (particularly for mothers during pregnancy).
- Avoid microwaving food in plastic. This includes infant formula and pumped human milk.
- Avoid washing plastics in the dishwasher.
- Use plastic alternatives such as glass or stainless steel.
- Encourage both hand-washing and washing all fruits and vegetables.
- Look at recycling codes on products and avoid plastics with codes 3 (phthalates), 6 (styrene), and 7 (bisphenols) unless labeled as “biobased” or “greenware.”
The statement also encourages health care providers to advocate for updating and strengthening the Toxic Substances Control Act.
The committee also made multiple recommendations for government.
Dr. Trasande and coauthor Rachel M. Shaffer, MPH, received funding from some National Institutes of Health grants. The authors had no relevant financial disclosures.
SOURCES: Trasande L et al. Pediatrics. 2018 Jun 23. doi: 10.1542/peds.2018-1408; doi: 10.1542/ peds. 2018-1410.
The regulation of food additives needs an overhaul in the United States because of the risks these compounds pose to children and infants, according to a new policy statement by the American Academy of Pediatrics.
suggested members of the AAP Council on Environmental Health.
Among the additives of greatest concern, the statement notes, are bisphenols (including bisphenol A), phthalates, certain pesticides, perfluoroalkyl chemicals, perchlorate, artificial food colors, nitrates, and nitrites. A technical report accompanying the policy statement reviewed existing evidence on these compounds.
The statement, authored by the council led by Leonardo Trasande, MD, of New York University, noted that many of the more than 10,000 chemicals added to food and food packaging were grandfathered into use prior to current regulations. Further, approximately 1,000 of these chemicals fall under the Food and Drug Administration’s designation of “generally recognized as safe,” which does not require FDA approval for use.
“Current requirements for a ‘generally recognized as safe’ [GRAS] designation are insufficient to ensure the safety of food additives and do not contain sufficient protections against conflict of interest,” they wrote. “Additionally, the FDA does not have authority to obtain data on or reassess the safety of chemicals already on the market.” The FDA does not regularly consider cumulative effects of food additives or the synergistic effects of chemicals found in foods.
The authors noted that concerns about food additives have increased in the past 20 years as new research has identified adverse health effects, including endocrine disruption, associated with these chemicals.
Dr. Trasande and his associates also acknowledged the limited evidence available on food additives particularly for children and infants, but noted this population’s greater vulnerability to chemical exposures.
Compounds addressed in the statement
- Bisphenols. Health concerns tied to these chemicals are endocrine/neurodevelopmental disruption and obesogenic activity.
- Phthalates. Health concerns linked to these chemicals are endocrine disruption, obesogenic activity, oxidative stress, and cardiotoxicity.
- Perfluoroalkyl chemicals. Health concerns associated with these chemicals are immunosuppression, endocrine disruption, obesogenic activity, and decreased birth weight.
- Perchlorate. The health concern tied to this chemical is thyroid hormone disruption.
- Nitrates and nitrites. Use of these as a preservative and color enhancer has been linked to carcinogenicity and thyroid hormone disruption.
Of these, only nitrates and nitrites are directly added to food while the other chemicals are indirect additives via their use in food packaging that directly touches the food.
How health care providers can help parents and children
“Insofar as these modifications can pose additional costs, barriers may exist for low-income families to reduce their exposure to food additives of concern,” the authors wrote. Health care providers “may wish to tailor guidance in the context of practicality, especially because food insecurity remains a substantial child health concern.”
Their recommendations on guidance for parents include:
- Prioritize fresh or frozen vegetables in meals. “Develop a list of low-cost sources for fresh fruits and vegetables” in the area.
- Avoid processed meats (particularly for mothers during pregnancy).
- Avoid microwaving food in plastic. This includes infant formula and pumped human milk.
- Avoid washing plastics in the dishwasher.
- Use plastic alternatives such as glass or stainless steel.
- Encourage both hand-washing and washing all fruits and vegetables.
- Look at recycling codes on products and avoid plastics with codes 3 (phthalates), 6 (styrene), and 7 (bisphenols) unless labeled as “biobased” or “greenware.”
The statement also encourages health care providers to advocate for updating and strengthening the Toxic Substances Control Act.
The committee also made multiple recommendations for government.
Dr. Trasande and coauthor Rachel M. Shaffer, MPH, received funding from some National Institutes of Health grants. The authors had no relevant financial disclosures.
SOURCES: Trasande L et al. Pediatrics. 2018 Jun 23. doi: 10.1542/peds.2018-1408; doi: 10.1542/ peds. 2018-1410.
FROM PEDIATRICS
Children’s ‘gluten-free’ foods are no healthier than others
Children’s foods labeled as gluten-free (GF) generally had less sodium and fat than other foods marketed for children, but they also had a higher percentage of calories from sugar, a study in Pediatrics found. Further,

Parents and caregivers who are purchasing gluten-free products should carefully assess product labels. Another positive step would be to serve whole, unprocessed food, she wrote in Pediatrics.
Dr. Elliott purchased all child-targeted packaged foods available at two major supermarket chains in Alberta from February 2017 to March 2017, excluding candy, chocolate, potato chips, cheese-flavored snacks, sugary sodas, and similar “junk food” products. Of the 374 foods purchased, 18% had gluten-free claims.
“The intent was to examine the regular foods that have been repackaged to attract children,” she wrote, which she defined as meeting any of the following criteria qualified:
- Contains the word “child” or “kids’” in the product or brand name.
- Has the word “fun” or “play” on the package.
- The foods are linked to children’s TV programs, toys, or movies.
- The foods are promoted for lunch boxes.
- Contains graphics or activities, or promotional offers, intended for children.
- “Presents unusual or child-oriented shapes, unusual colors, or playful product names or tastes.”
Dr. Elliott compared the nutritional content of products labeled as gluten-free with that of products without a gluten-free label based on 100-g servings. She then compared the same GF-labeled products to their equivalent products without a GF label, when possible.
She used the Pan American Health Organization (PAHO) Nutrient Profile Model to evaluate the foods. PAHO criteria for nutritionally poor qualities include the following when applied to “processed” and “ultraprocessed” foods:
- A ratio between sodium and calories greater than or equal to 1.
- Total calories from sugar (glucose, fructose, and disaccharides) at least 10% or more of total calories.
- Contains other nonsugar sweeteners.
- Total calories from fat are at least 30% or more of total calories.
- Total saturated fat is at least at least 10% or more of total calories.
Nearly all the non-gluten free children’s foods (97%) and 88% of the children’s gluten-free foods were considered to have poor nutritional quality (P less than .001). High sugar content was present in 79% of gluten-free products and 81% of their gluten-containing equivalent products (P less than .001).
These foods can be classified as unhealthy because of “their high levels of sugar, sodium, and/or fat, which means that the options for purchasing healthy packaged foods are limited,” Dr. Elliott wrote.
Gluten free–labeled products did have less sodium, total fat, and saturated fat than did those without gluten-free claims, but sugar levels were higher and protein levels lower (nonstatistically significant) in gluten-free products.
“Such findings echo those in other studies of child-targeted supermarket foods and reveal that products marketed as ‘better for you’ for children are as much about marketing as they are about nutrition,” Dr. Elliott wrote. “Given children’s lower daily caloric intake and the challenges associated with consuming a nutrient-rich, gluten-free diet for children with celiac disease in particular, it is important that the products designed for children are held to a higher nutritional standard.”
The study’s biggest limitations are its inability to represent all child-marketed packaged foods available in stores and the fact that many foods labeled as “gluten-free” would not have gluten in them anyway, such as apple sauce and fruit snacks.
“In this case, the use of a gluten-free claim on products that are inherently free of gluten might be understood as a marketing tool directed at consumers who view gluten-free products as healthier than their regular counterparts,” Dr. Elliott noted
The research was funded by the Canadian Institutes of Health Research’s Canada Research Chairs Program. Dr. Elliott had no relevant financial disclosures.
SOURCE: Elliott C. Pediatrics. 2018 Jul 20. doi: 10.1542/peds.2018-0525.
Children’s foods labeled as gluten-free (GF) generally had less sodium and fat than other foods marketed for children, but they also had a higher percentage of calories from sugar, a study in Pediatrics found. Further,
Parents and caregivers who are purchasing gluten-free products should carefully assess product labels. Another positive step would be to serve whole, unprocessed food, she wrote in Pediatrics.
Dr. Elliott purchased all child-targeted packaged foods available at two major supermarket chains in Alberta from February 2017 to March 2017, excluding candy, chocolate, potato chips, cheese-flavored snacks, sugary sodas, and similar “junk food” products. Of the 374 foods purchased, 18% had gluten-free claims.
“The intent was to examine the regular foods that have been repackaged to attract children,” she wrote, which she defined as meeting any of the following criteria qualified:
- Contains the word “child” or “kids’” in the product or brand name.
- Has the word “fun” or “play” on the package.
- The foods are linked to children’s TV programs, toys, or movies.
- The foods are promoted for lunch boxes.
- Contains graphics or activities, or promotional offers, intended for children.
- “Presents unusual or child-oriented shapes, unusual colors, or playful product names or tastes.”
Dr. Elliott compared the nutritional content of products labeled as gluten-free with that of products without a gluten-free label based on 100-g servings. She then compared the same GF-labeled products to their equivalent products without a GF label, when possible.
She used the Pan American Health Organization (PAHO) Nutrient Profile Model to evaluate the foods. PAHO criteria for nutritionally poor qualities include the following when applied to “processed” and “ultraprocessed” foods:
- A ratio between sodium and calories greater than or equal to 1.
- Total calories from sugar (glucose, fructose, and disaccharides) at least 10% or more of total calories.
- Contains other nonsugar sweeteners.
- Total calories from fat are at least 30% or more of total calories.
- Total saturated fat is at least at least 10% or more of total calories.
Nearly all the non-gluten free children’s foods (97%) and 88% of the children’s gluten-free foods were considered to have poor nutritional quality (P less than .001). High sugar content was present in 79% of gluten-free products and 81% of their gluten-containing equivalent products (P less than .001).
These foods can be classified as unhealthy because of “their high levels of sugar, sodium, and/or fat, which means that the options for purchasing healthy packaged foods are limited,” Dr. Elliott wrote.
Gluten free–labeled products did have less sodium, total fat, and saturated fat than did those without gluten-free claims, but sugar levels were higher and protein levels lower (nonstatistically significant) in gluten-free products.
“Such findings echo those in other studies of child-targeted supermarket foods and reveal that products marketed as ‘better for you’ for children are as much about marketing as they are about nutrition,” Dr. Elliott wrote. “Given children’s lower daily caloric intake and the challenges associated with consuming a nutrient-rich, gluten-free diet for children with celiac disease in particular, it is important that the products designed for children are held to a higher nutritional standard.”
The study’s biggest limitations are its inability to represent all child-marketed packaged foods available in stores and the fact that many foods labeled as “gluten-free” would not have gluten in them anyway, such as apple sauce and fruit snacks.
“In this case, the use of a gluten-free claim on products that are inherently free of gluten might be understood as a marketing tool directed at consumers who view gluten-free products as healthier than their regular counterparts,” Dr. Elliott noted
The research was funded by the Canadian Institutes of Health Research’s Canada Research Chairs Program. Dr. Elliott had no relevant financial disclosures.
SOURCE: Elliott C. Pediatrics. 2018 Jul 20. doi: 10.1542/peds.2018-0525.
FROM PEDIATRICS
Key clinical point: Most prepackaged gluten-free foods marketed for children are unhealthy.
Major finding: Of gluten-free packaged children’s foods, 88% had poor nutritional quality, as did 97% of children’s food not labeled as gluten-free.
Study details: The findings are based on a comparison of 374 child-marketed packaged foods, including 66 gluten free–labeled foods and their non-gluten free equivalents and other non-gluten free foods.
Disclosures: The research was funded by the Canadian Institutes of Health Research’s Canada Research Chairs Program. Dr. Elliott had no relevant financial disclosures.
Source: Elliott C. Pediatrics. 2018 Jul 20. doi: 10.1542/peds.2018-0525.
Spinal muscular atrophy added to newborn screening panel recommendations
Spinal muscular atrophy (SMA) is now among the disorders officially included in the Recommended Uniform Screening Panel (RUSP), which is used by state public health departments to screen newborns for genetic disorders.
Secretary of the Department of Health and Human Services Alex M. Azar II formally added SMA to the panel July 2 on the recommendation of the Advisory Committee on Heritable Disorders in Newborns and Children.
“Adding SMA to the list will help ensure that babies born with SMA are identified, so that they have the opportunity to benefit from early treatment and intervention,” according to a statement from the Muscular Dystrophy Association about the decision. “This testing can also provide families with a genetic diagnosis – information that often is required to determine whether their child is eligible to participate in clinical trials.”
Adding SMA to the RUSP does not mean states must screen newborns for the disorder. Each state’s public health apparatus decides independently whether to accept the recommendation and which disorders on the RUSP to screen for. Most states screen for most disorders on the RUSP. Evidence compiled by the advisory committee suggested wide variation in resources, infrastructure, funding, and time to implementation among states.
An estimated 1 in 11,000 newborns have SMA, a disorder caused by mutations in the survival motor neuron 1 (SMN1) gene. SMA affects motor neurons in the brain stem and spinal cord leading to motor weakness and atrophy. The only treatment for SMA had been palliative care until the Food and Drug Administration approved nusinersen (Spinraza) for the disorder in December 2016, although the drug’s approval has raised some ethical questions.1-3

After reviewing the evidence at their February 8, 2018 meeting, the advisory committee recommended the addition of spinal muscular atrophy screening to the RUSP in a March 8, 2018, letter from committee chair Joseph A. Bocchini Jr., MD, who is a professor and the chairman of the department of pediatrics at Louisiana State University Health in Shreveport.
Secretary Azar accepted the recommendation based on the evidence the committee provided; he also requested a follow-up report within 2 years “describing the status of implementing newborn screening for SMA and clinical outcomes of early treatment, including any potential harms, for infants diagnosed with SMA.”
The advisory committee makes its recommendations to the HHS on which heritable disorders to include in the RUSP after they have assessed a systematic, evidence-based review assigned by the committee to an external independent group. Alex R. Kemper, MD, MPH, a professor of pediatrics at the Ohio State University and division chief of ambulatory pediatrics at Nationwide Children’s Hospital, both in Columbus, led the review group for SMA. Dr. Kemper is also deputy editor of the journal Pediatrics and a member of the U.S. Preventive Services Task Force.

According to Secretary Azar’s summary in his July 2, 2018, letter of acceptance, the evidence review suggested that “early screening and treatment can lead to decreased mortality for individuals with SMA and improved motor milestones.”
Dr. Kemper elaborated in an interview that, “SMA can be detected through newborn screening, and treatment is now available that can not only reduce the risk of death but decrease the development of neurologic impairment. As with adding any condition to newborn screening, public health laboratories will need to develop strategies to incorporate the screening test. The current FDA-approved treatment, nusinersen, is delivered by lumbar puncture into the spinal fluid. In addition, there are exciting advances in gene therapy leading to new treatment approaches.”
Approximately 95% of SMA cases result from the deletion of exon 7 from both alleles of SMN1. (Other rarer cases are caused by mutations in different genes.) Without the SMN protein produced by SMN1, a person gradually loses muscle function.
A similar gene, SMN2, also can produce the SMN protein but in much lower amounts, typically less than 10% of what a person needs. People can, however, have multiple copies of SMN2, which can produce slightly more SMN protein for a slower disease process.
The five types of spinal muscular atrophy are determined according to symptom onset, which directly correlates with disorder severity and prognosis. Just over half (54%) of SMA cases are Type I, in which progressive weakness occurs over the first 6 months of life and results in early death. Only 18% of children with Type I live past age 4 years, and 68% die by age 2 years. Type 0 is rarer but more severe, usually causing fetal loss or early infant death.
Type II represents 18% of SMA cases and causes progressive weakness by age 15 months. Most people with Type II survive to their 30s but then experience respiratory failure and rarely reach their fourth decade. Individuals with Types III and IV typically have a normal lifespan and only begin to see progressive muscle weakness after 1 year old or in adulthood.

Dr. Kemper’s group focused on the three types diagnosed in infancy: types I, II, and III.
Dr. Kemper emphasized in an interview that “it will be critical to make sure that infants diagnosed with SMA through newborn screening receive follow-up shortly afterward to determine whether they would benefit from nusinersen. More information is needed about the long-term outcomes of those infants who begin treatment following newborn screening so we not only know about outcomes in later childhood and adolescence but treatment approaches can be further refined and personalized.”
Nusinersen works by altering the splicing of precursor messenger RNA in SMN2 so that the mRNA strands are longer, which thereby increases how much SMN protein is produced. Concerns about the medication, however, have included its cost – $750,000 in the first year and $375,000 every following year for life – and potential adverse events from repeated administration. Nusinersen is injected into the spinal canal four times in the first year and then once annually, and the painful injections require patient immobilization. Potential adverse events include thrombocytopenia and nephrotoxicity, along with potential complications from repeated lumbar punctures over time.2
Other concerns about the drug include its limited evidence base, lack of long-term data, associated costs with administration (for example, travel costs), the potential for patients taking nusinersen to be excluded from future clinical trials on other treatments, and ensuring parents have enough information on the drug’s limitations and potential risks to provide adequate informed consent.2
Yet evidence to date is favorable in children with early onset. Dr. Bocchini wrote in the letter to Secretary Azar that “limited data suggest that treatment effect is greater when the treatment is initiated before symptoms develop and when the individual has more copies of SMN2.”
Dr. Kemper’s group concluded that screening can detect SMA in newborns and that treatment can modify disease course. “Grey literature suggests those with total disease duration less than or equal to 12 weeks before nusinersen treatment were more likely to have better outcomes than those with longer periods of disease duration.”
“Presymptomatic treatment alters the natural history” of the disorder, the group found, although outcome data past 1 year of age are not yet available. Based on findings from a New York pilot program, they predicted that nationwide newborn screening would avert 33 deaths and 48 cases of children who were dependent on a ventilator among an annual cohort of 4 million births.
At the time of the evidence review, Massachusetts, Minnesota, Missouri, North Carolina, New York, Utah, and Wisconsin initiated pilot programs or whole-population mandated screening for SMA. Of the three states that reported costs, all reported costs at $1 or less per screen.
The research for the evidence review was funded by a Health Resources and Services Administration grant to Duke University, Durham, N.C. No disclosures were provided for evidence review group members.
References
1. Gene Ther. 2017 Sep;24(9):534-8.
2. JAMA Intern Med. 2018 Jun 1;178(6):743-44.
3. JAMA Pediatr. 2018 Feb 1;172(2):188-92.
Spinal muscular atrophy (SMA) is now among the disorders officially included in the Recommended Uniform Screening Panel (RUSP), which is used by state public health departments to screen newborns for genetic disorders.
Secretary of the Department of Health and Human Services Alex M. Azar II formally added SMA to the panel July 2 on the recommendation of the Advisory Committee on Heritable Disorders in Newborns and Children.
“Adding SMA to the list will help ensure that babies born with SMA are identified, so that they have the opportunity to benefit from early treatment and intervention,” according to a statement from the Muscular Dystrophy Association about the decision. “This testing can also provide families with a genetic diagnosis – information that often is required to determine whether their child is eligible to participate in clinical trials.”
Adding SMA to the RUSP does not mean states must screen newborns for the disorder. Each state’s public health apparatus decides independently whether to accept the recommendation and which disorders on the RUSP to screen for. Most states screen for most disorders on the RUSP. Evidence compiled by the advisory committee suggested wide variation in resources, infrastructure, funding, and time to implementation among states.
An estimated 1 in 11,000 newborns have SMA, a disorder caused by mutations in the survival motor neuron 1 (SMN1) gene. SMA affects motor neurons in the brain stem and spinal cord leading to motor weakness and atrophy. The only treatment for SMA had been palliative care until the Food and Drug Administration approved nusinersen (Spinraza) for the disorder in December 2016, although the drug’s approval has raised some ethical questions.1-3
After reviewing the evidence at their February 8, 2018 meeting, the advisory committee recommended the addition of spinal muscular atrophy screening to the RUSP in a March 8, 2018, letter from committee chair Joseph A. Bocchini Jr., MD, who is a professor and the chairman of the department of pediatrics at Louisiana State University Health in Shreveport.
Secretary Azar accepted the recommendation based on the evidence the committee provided; he also requested a follow-up report within 2 years “describing the status of implementing newborn screening for SMA and clinical outcomes of early treatment, including any potential harms, for infants diagnosed with SMA.”
The advisory committee makes its recommendations to the HHS on which heritable disorders to include in the RUSP after they have assessed a systematic, evidence-based review assigned by the committee to an external independent group. Alex R. Kemper, MD, MPH, a professor of pediatrics at the Ohio State University and division chief of ambulatory pediatrics at Nationwide Children’s Hospital, both in Columbus, led the review group for SMA. Dr. Kemper is also deputy editor of the journal Pediatrics and a member of the U.S. Preventive Services Task Force.
According to Secretary Azar’s summary in his July 2, 2018, letter of acceptance, the evidence review suggested that “early screening and treatment can lead to decreased mortality for individuals with SMA and improved motor milestones.”
Dr. Kemper elaborated in an interview that, “SMA can be detected through newborn screening, and treatment is now available that can not only reduce the risk of death but decrease the development of neurologic impairment. As with adding any condition to newborn screening, public health laboratories will need to develop strategies to incorporate the screening test. The current FDA-approved treatment, nusinersen, is delivered by lumbar puncture into the spinal fluid. In addition, there are exciting advances in gene therapy leading to new treatment approaches.”
Approximately 95% of SMA cases result from the deletion of exon 7 from both alleles of SMN1. (Other rarer cases are caused by mutations in different genes.) Without the SMN protein produced by SMN1, a person gradually loses muscle function.
A similar gene, SMN2, also can produce the SMN protein but in much lower amounts, typically less than 10% of what a person needs. People can, however, have multiple copies of SMN2, which can produce slightly more SMN protein for a slower disease process.
The five types of spinal muscular atrophy are determined according to symptom onset, which directly correlates with disorder severity and prognosis. Just over half (54%) of SMA cases are Type I, in which progressive weakness occurs over the first 6 months of life and results in early death. Only 18% of children with Type I live past age 4 years, and 68% die by age 2 years. Type 0 is rarer but more severe, usually causing fetal loss or early infant death.
Type II represents 18% of SMA cases and causes progressive weakness by age 15 months. Most people with Type II survive to their 30s but then experience respiratory failure and rarely reach their fourth decade. Individuals with Types III and IV typically have a normal lifespan and only begin to see progressive muscle weakness after 1 year old or in adulthood.
Dr. Kemper’s group focused on the three types diagnosed in infancy: types I, II, and III.
Dr. Kemper emphasized in an interview that “it will be critical to make sure that infants diagnosed with SMA through newborn screening receive follow-up shortly afterward to determine whether they would benefit from nusinersen. More information is needed about the long-term outcomes of those infants who begin treatment following newborn screening so we not only know about outcomes in later childhood and adolescence but treatment approaches can be further refined and personalized.”
Nusinersen works by altering the splicing of precursor messenger RNA in SMN2 so that the mRNA strands are longer, which thereby increases how much SMN protein is produced. Concerns about the medication, however, have included its cost – $750,000 in the first year and $375,000 every following year for life – and potential adverse events from repeated administration. Nusinersen is injected into the spinal canal four times in the first year and then once annually, and the painful injections require patient immobilization. Potential adverse events include thrombocytopenia and nephrotoxicity, along with potential complications from repeated lumbar punctures over time.2
Other concerns about the drug include its limited evidence base, lack of long-term data, associated costs with administration (for example, travel costs), the potential for patients taking nusinersen to be excluded from future clinical trials on other treatments, and ensuring parents have enough information on the drug’s limitations and potential risks to provide adequate informed consent.2
Yet evidence to date is favorable in children with early onset. Dr. Bocchini wrote in the letter to Secretary Azar that “limited data suggest that treatment effect is greater when the treatment is initiated before symptoms develop and when the individual has more copies of SMN2.”
Dr. Kemper’s group concluded that screening can detect SMA in newborns and that treatment can modify disease course. “Grey literature suggests those with total disease duration less than or equal to 12 weeks before nusinersen treatment were more likely to have better outcomes than those with longer periods of disease duration.”
“Presymptomatic treatment alters the natural history” of the disorder, the group found, although outcome data past 1 year of age are not yet available. Based on findings from a New York pilot program, they predicted that nationwide newborn screening would avert 33 deaths and 48 cases of children who were dependent on a ventilator among an annual cohort of 4 million births.
At the time of the evidence review, Massachusetts, Minnesota, Missouri, North Carolina, New York, Utah, and Wisconsin initiated pilot programs or whole-population mandated screening for SMA. Of the three states that reported costs, all reported costs at $1 or less per screen.
The research for the evidence review was funded by a Health Resources and Services Administration grant to Duke University, Durham, N.C. No disclosures were provided for evidence review group members.
References
1. Gene Ther. 2017 Sep;24(9):534-8.
2. JAMA Intern Med. 2018 Jun 1;178(6):743-44.
3. JAMA Pediatr. 2018 Feb 1;172(2):188-92.
Antidepressant use linked to increased weight gain
Taking antidepressants appears associated with weight gain in a recent study, though the researchers caution that the link might not be causal. Antidepressant use already was lowest in those with an initially normal BMI, and it increased with each category of greater BMI.
“Participants of normal weight showed an increased risk of transitioning to overweight or obesity, and overweight participants were more likely to become obese if they were treated with an antidepressant,” Rafael Gafoor, PhD, of King’s College London, and his associates wrote in BMJ.
“The risk of weight gain was substantially increased during the second and third years of treatment,” they reported. “The risk of weight gain remained increased during at least 6 years of follow-up.”
The researchers retrospectively analyzed EHRs from the U.K. Clinical Practice Research Datalink, representing about 7% of general practices in the United Kingdom, to compare the risk of weight gain among those who were and were not prescribed antidepressants. Of more than 2 million registered participants, a random sample of those with at least three measurements for body mass index (BMI), representing different weight classes, were included.
Out of 136,762 men and 157,957 women, 13% of the men and 22.4% of the women received prescriptions for antidepressants. The 10-year follow-up period included more than 1.8 million person-years. The proportion of people gaining at least 5% in BMI was 11.1% in those with antidepressants prescriptions, compared with 8.1% in those not prescribed antidepressants.
“Antidepressant use was greater in patients with comorbidity and coprescriptions, particularly with diagnoses of stroke and diabetes or coprescribing of antiepileptics or antipsychotics, than in those without,” the researchers wrote. “Antidepressant use was also associated with current smoking and higher deprivation category.”
The researchers adjusted the analysis to account for age, sex, initial BMI classification, smoking, prescriptions for antiepileptics or antipsychotics, year, region of residence, socioeconomic status, or having received advice on weight management or diet. They also accounted for diabetes, coronary heart disease, stroke, cancer, and depression diagnoses, and they eliminated the 280 days before a newborn delivery to account for pregnancy-related weight increases.
After adjustment for those potential confounders, people prescribed antidepressants were 21% more likely to experience substantial weight gain than those not prescribed them (adjusted rate ratio = 1.21; P less than .001). The researchers, cautioned, however, that residual confounding might have inflated the risk.
Those who had a normal weight when they began taking antidepressants had 29% greater risk of gaining enough weight to meet the criteria for overweight or obesity. Likewise, those already overweight when first prescribed antidepressants were 29% more likely to develop obesity.
For every 27 patients who took antidepressants for at least 1 year, 1 of them gained at least 5% in BMI during the subsequent year. Again, however, the researchers emphasized the absence of evidence for causality and the risk of bias from confounding.
Mirtazapine was the antidepressant associated with the highest incidence ratio of weight gain, but that drug was prescribed infrequently.
“From a clinical perspective, these observations reinforce the need for active body weight management to accompany widespread antidepressant treatment, although this might often be met with limited success,” the authors wrote.
The research was funded by the National Health Service Foundation Trust and by King’s College London. Aside from one author’s employment with the U.K. Clinical Practice Research Datalink data source, the authors had no disclosures.
SOURCE: Gafoor R et al. BMJ. 2018;361:k1951. doi: 10.1136/bmj.k1951.
FROM THE BMJ
Key clinical point: “These observations reinforce the need for active body weight management to accompany widespread antidepressant treatment.”
Major finding: People taking antidepressants had 21% higher risk of gaining at least 5% in body mass index and 29% greater risk of moving into a higher BMI category.
Study details: The findings are based on analysis of 10-year follow-up date from a British population-based cohort of 294,719 men and women, 18% of whom had been prescribed antidepressants.
Disclosures: The research was funded by the National Health Service Foundation Trust and by King’s College London. Aside from one author’s employment with the U.K. Clinical Practice Research Datalink data source, the authors had no disclosures.
Source: Gafoor R et al. BMJ. 2018;361:k1951. doi: 10.1136/bmj.k1951.
GDM, subsequent diabetes predictive of later renal damage
Women with a history of gestational diabetes mellitus who later develop diabetes had an elevated urinary albumin-to-creatinine ratio an average of 13 years later, indicating renal damage, according to a new study.
Those with a history of gestational diabetes mellitus (GDM) – but no subsequent development of diabetes – did not show an increased urinary albumin-to-creatinine ratio (UACR) but did have a higher estimated glomerular filtration rate (eGFR), hinting at early stages of glomerular hyperfiltration and renal damage.
“Our findings suggest that in women with a history of GDM, deterioration of renal function may potentially precede the development of overt diabetes, although clinically relevant outcomes such as elevated UACR may manifest only after progression to diabetes,” wrote Shristi Rawal, PhD, a postdoctoral fellow at the National Institute of Child Health and Human Development and her associates.
“These findings suggest that women with GDM-complicated pregnancies may represent a high-risk group that could benefit from regular monitoring for early-stage renal damage, timely detection of which may help clinicians initiate treatment to prevent or delay further disease progression,” they wrote.
The investigators compared outcomes among 1,226 Danish women 9-16 years after their index pregnancy during 1996-2002; a predominantly white study population, which limited the study’s generalizability to other demographic groups, the authors acknowledged. A total of 607 women had had GDM during their first pregnancy, 183 of whom developed type 1 or 2 diabetes. Of the 619 women who did not have GDM, 9 developed diabetes.
Serum creatinine and urinary albumin and creatinine measurements were taken to determine eGFR and UACR. Women with a previous GDM diagnosis had higher eGFR and UACR than women without previous GDM. The higher eGFR remained significant after adjustments for age at first pregnancy, completion of high school, smoking during pregnancy, a family history of diabetes, prepregnancy hypertension, and prepregnancy body mass index (BMI). UACR differences were not significant after adjustment.
Women with GDM and subsequent diabetes had a significantly higher UACR than women without either and had more than twice the risk of an elevated UACR of at least 20 mg/g (adjusted relative risk, 2.3), even after confounder adjustment.
The association with increased UACR was significant with the combination of a GDM history and a subsequent diabetes diagnosis, but not individually. The increased eGFR, however, remained significant after adjustment even for women with only a history of GDM, regardless of whether they later developed diabetes or even prediabetes.
“The independent association of GDM with eGFR also remained significant when we excluded women with conditions that might influence renal function markers at follow-up, including type 1 diabetes, preeclampsia/eclampsia or any hypertension complication during the index pregnancy, regular use of cholesterol-lowering drugs, or recent use of ACE inhibitors, diuretics, or H2 blockers,” the authors reported.
“Furthermore, no effect modification was observed when we stratified the analyses by clinical and lifestyle characteristics at follow-up, including current BMI, smoking, antihypertension medication use, family history of diabetes, physical activity, and median time since index pregnancy. Associations in some strata became statistically insignificant due to reduced sample size [all P for interaction = .05],” they wrote.
The research was funded by the National Institute of Child Health and Human Development at the National Institutes of Health, the Innovation Fund Denmark, March of Dimes Birth Defects Foundation, Health Foundation, Heart Foundation and European Union.
Coauthor Allan Vaag, MD, PhD is a vice president at AstraZeneca. No other authors had disclosures.
SOURCE: Rawal S et al. Diabetes Care. 2018 May 4. doi: 10.2337/dc17-2629.
FROM DIABETES CARE
Key clinical point: Gestational diabetes mellitus may be a risk factor for future development of renal damage.
Major finding: Women with previous GDM and a subsequent diagnosis of diabetes were over twice as likely to show evidence of existing renal damage.
Data source: The findings are based on 9-16 years of prospective follow-up of 607 women with and 619 women without a history of GDM.
Disclosures: The research was funded by the National Institute of Child Health and Human Development at the National Institutes of Health, the Innovation Fund Denmark, March of Dimes Birth Defects Foundation, Health Foundation, Heart Foundation and European Union. Coauthor Allan Vaag is an employee of AstraZeneca. No other authors had disclosures.
Source: Rawal S et al. Diabetes Care. 2018 May 4. doi: 10.2337/dc17-2629.