User login
Richard Franki is the associate editor who writes and creates graphs. He started with the company in 1987, when it was known as the International Medical News Group. In his years as a journalist, Richard has worked for Cap Cities/ABC, Disney, Harcourt, Elsevier, Quadrant, Frontline, and Internet Brands. In the 1990s, he was a contributor to the ill-fated Indications column, predecessor of Livin' on the MDedge.
Gender Gap Closing in Gastroenterology
In 2010, women represented 24% of the U.S. gastroenterologist workforce under the age of 45 years, but only 14% of all gastroenterologists, according to the most recent data available from the American Medical Association.
Among the youngest gastroenterologists – those under the age of 35 years – the proportion was 32% women and 68% men, the AMA reported.
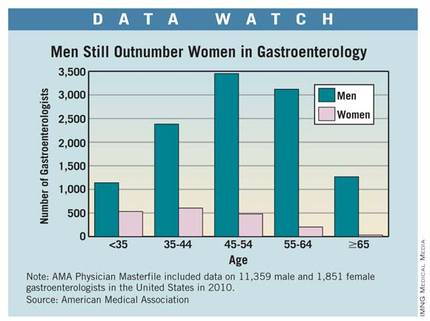
The total number of gastroenterologists in the United States in 2010 was 13,210 – 86% men and 14% women. And the total number of U.S. physicians was 985,375, of whom 688,468 (70%) were men and 296,907 (30%) were women, the AMA said.
The mean age of gastroenterologists in the United States was 49.4 years, and the mean age of all physicians was 51.0 years.
In 2010, women represented 24% of the U.S. gastroenterologist workforce under the age of 45 years, but only 14% of all gastroenterologists, according to the most recent data available from the American Medical Association.
Among the youngest gastroenterologists – those under the age of 35 years – the proportion was 32% women and 68% men, the AMA reported.
The total number of gastroenterologists in the United States in 2010 was 13,210 – 86% men and 14% women. And the total number of U.S. physicians was 985,375, of whom 688,468 (70%) were men and 296,907 (30%) were women, the AMA said.
The mean age of gastroenterologists in the United States was 49.4 years, and the mean age of all physicians was 51.0 years.
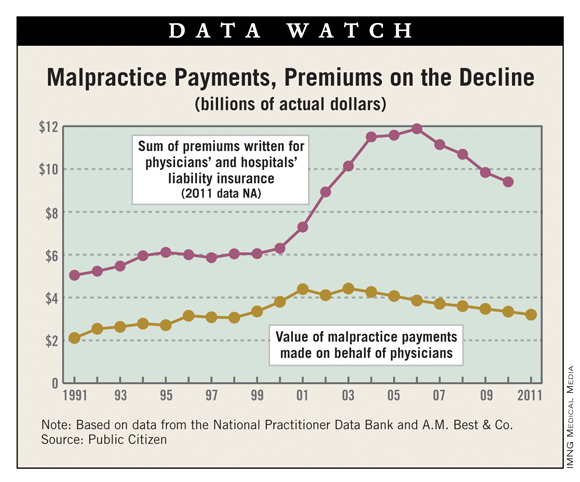
Malpractice Costs Continue to Drop
In 2011, the total cost of medical malpractice payments made on behalf of physicians dropped for the 8th year in a row, according to a report from Public Citizen.
The total value of those payments, in actual dollars, was $3.34 billion for the year. After adjusting for inflation, that figure was the lowest since the National Practitioner Data Bank started tracking malpractice payments in 1990, the report said.
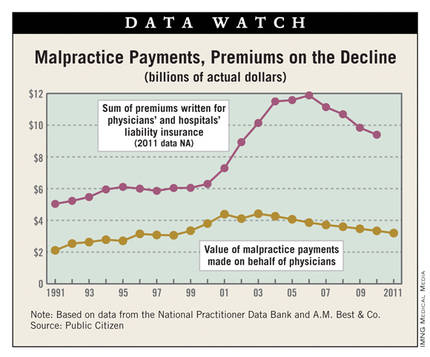
The cost of premiums for doctors’ and hospitals’ liability insurance has also been declining – the total was $9.4 billion in actual dollars in 2010, the last year for which data are available. The cost of premiums can be considered a proxy for the total cost of medical malpractice litigation since it covers payments to victims, litigation defense costs, and insurers’ profits and administrative costs, Public Citizen suggested. The $9.4 billion spent in 2010 represents 0.36% of the national health care expenditure of $2.6 trillion.
"Between 2000 and 2011, the value of medical malpractice payments fell 11.9% while healthcare spending nearly doubled, increasing 96.7%" in unadjusted dollars, Public Citizen said.
Note: Based on data from the National Practitioner Data Bank and A.M. Best & Co.
Source: Public Citizen
In 2011, the total cost of medical malpractice payments made on behalf of physicians dropped for the 8th year in a row, according to a report from Public Citizen.
The total value of those payments, in actual dollars, was $3.34 billion for the year. After adjusting for inflation, that figure was the lowest since the National Practitioner Data Bank started tracking malpractice payments in 1990, the report said.
The cost of premiums for doctors’ and hospitals’ liability insurance has also been declining – the total was $9.4 billion in actual dollars in 2010, the last year for which data are available. The cost of premiums can be considered a proxy for the total cost of medical malpractice litigation since it covers payments to victims, litigation defense costs, and insurers’ profits and administrative costs, Public Citizen suggested. The $9.4 billion spent in 2010 represents 0.36% of the national health care expenditure of $2.6 trillion.
"Between 2000 and 2011, the value of medical malpractice payments fell 11.9% while healthcare spending nearly doubled, increasing 96.7%" in unadjusted dollars, Public Citizen said.
Note: Based on data from the National Practitioner Data Bank and A.M. Best & Co.
Source: Public Citizen
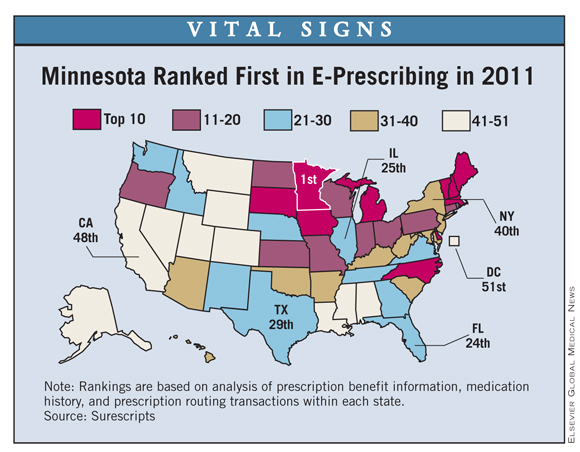
Minnesota Ranked First in E-Prescribing in 2011
Minnesota had the highest rate of e-prescribing use in the Unites States in 2011, ending Massachusetts’ 5-year run in the top spot, according to the Surescripts electronic prescribing network.
Massachusetts was second in the company’s Safe-Rx rankings in 2011, with South Dakota, Delaware, and New Hampshire rounding out the top five. Minnesota, which finished 11th last year, is the only state to have passed an e-prescribing mandate, Surescripts noted.
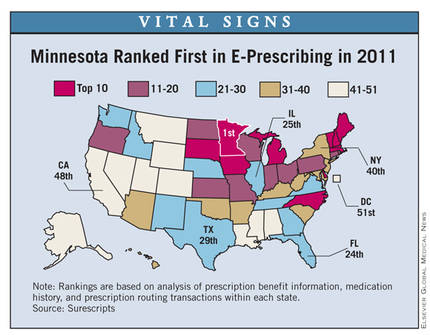
"In Minnesota, there has been a strong commitment to a common e-prescribing objective by providers, pharmacies, and payers statewide who worked collaboratively with the e-Health Initiative," said Dr. Marty LaVenture, director of office of health information technology and e-health at the Minnesota Department of Health, according to Surescripts.
Prescribers in Minnesota routed 61% of prescriptions electronically last year, and Massachusetts and New Hampshire had the highest rate of physician adoption, at 86%, Surescripts reported.
The Surescripts Safe-Rx rankings, now in their seventh year, base e-prescribing performance on states’ use of prescription benefit information, medication history, and prescription routing.
Note: Rankings are based on analysis of prescription benefit information, medication history, and prescription routing transactions within each state.
Source: Surescripts
Minnesota had the highest rate of e-prescribing use in the Unites States in 2011, ending Massachusetts’ 5-year run in the top spot, according to the Surescripts electronic prescribing network.
Massachusetts was second in the company’s Safe-Rx rankings in 2011, with South Dakota, Delaware, and New Hampshire rounding out the top five. Minnesota, which finished 11th last year, is the only state to have passed an e-prescribing mandate, Surescripts noted.
"In Minnesota, there has been a strong commitment to a common e-prescribing objective by providers, pharmacies, and payers statewide who worked collaboratively with the e-Health Initiative," said Dr. Marty LaVenture, director of office of health information technology and e-health at the Minnesota Department of Health, according to Surescripts.
Prescribers in Minnesota routed 61% of prescriptions electronically last year, and Massachusetts and New Hampshire had the highest rate of physician adoption, at 86%, Surescripts reported.
The Surescripts Safe-Rx rankings, now in their seventh year, base e-prescribing performance on states’ use of prescription benefit information, medication history, and prescription routing.
Note: Rankings are based on analysis of prescription benefit information, medication history, and prescription routing transactions within each state.
Source: Surescripts
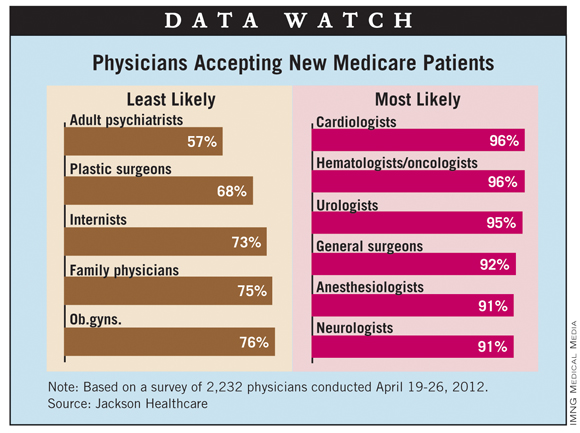
One-Fourth of Doctors Not Taking New Medicare Patients
Approximately 82% of physician practices are accepting new patients, but that number drops to 75% for Medicare patients and 64% for Medicaid patients, according to a survey by Jackson Healthcare.
Cardiologists and hematologists/oncologists are the most likely to accept new Medicare patients, with urologists, general surgeons, and anesthesiologists not far behind. Adult psychiatrists and plastic surgeons are the least likely to accept new Medicare patients, followed by internists, family physicians, and ob.gyns.
Geographically speaking, physicians in Mississippi, Texas, California, Oregon, and Georgia were the least likely to take new Medicare patients, and 10% of survey respondents said that they do not see any Medicare patients.
A total of 2,232 physicians completed the online survey, which was conducted April 19-26, 2012.
Asthma Prevalence Up 15% Since 2001
Asthma prevalence in the United States rose from 7.3% in 2001 to 8.4% in 2010, an increase of 15%, according to a report from the National Center for Health Statistics.
The number of asthma-related visits to physician offices and hospital outpatient departments dropped from 61.9 per 100 persons with asthma in 2001 to 47.8 per 100 in 2009. The number of visits to emergency departments, however, remained stable: 8.2 per 100 persons with asthma in 2001 and 8.4 per 100 in 2009. Hospitalizations were also stable, going from 2.2 per 100 persons with asthma in 2001 to 2.0 per 100 in 2009, the NCHS noted.
The total number of Americans with asthma in 2010 was 25.7 million. For the period from 2008 to 2010, the average annual prevalence was higher for blacks and American Indian/Alaska Natives than for whites, Hispanics, or Asians. (See below.) Asthma prevalence among Hispanics of Puerto Rican descent was three times higher than among those of Mexican descent.
The death rate for asthma dropped from 0.21 per 1,000 persons with asthma in 2001 to 0.14 per 1,000 in 2009, according to the report.
Note: Based on data from the National Health Interview Survey.
Source: National Center for Health Statistics
Fees for Cosmetic Procedures Down Since 2008
The average physician fee for the most popular form of minimally invasive cosmetic surgery, injection of botulinum toxin type A, dropped 6.6% from 2008 to 2011, according to data from the American Society of Plastic Surgeons.
The average fees for the five most popular minimally invasive surgeries fell in that time period, with microdermabrasion (29.5%) and laser hair removal (21.5%) showing the largest drops. Soft-tissue filler injection had the smallest decrease, 1.1%, the ASPS data show.
There were an estimated 5.7 million botulinum toxin A injections performed in 2011, which was almost half of the 12.2 million minimally invasive procedures performed for the year. The next-most popular procedure was soft-tissue filler injection, which accounted for 1.9 million procedures, the ASPS reported.
Notes: Listed in order of popularity. 2011 estimates are based on data from a national database and survey responses from 1,266 dermatologists, ENTs, and plastic surgeons.
Source: American Society of Plastic Surgeons
Match Day: U.S. Seniors Fill 70% of Pediatric Positions
The number of pediatric residency positions offered and the number of U.S. seniors filling those slots both dropped in 2012, according to the National Resident Matching Program.
The number of positions offered in 2012 was 2,475 – a slight drop from the 2,482 available in 2011 – but the number of U.S. seniors joining pediatric residencies fell from 1,768 in 2011 to 1,732 in 2012, a drop of just over 2%, the NRMP reported. U.S. seniors filled just under 70% of pediatric slots in 2012, compared with 71.2% in 2011.
The total number of pediatric residency slots available each year has risen 6.3% since 2007, but the number of U.S. seniors filling those positions has gone up by only 2.2% over that period, according to NRMP figures.
Source: National Resident Matching Program
Match Day: U.S. Seniors Fill 56% of Internal Medicine Slots
The percentage of internal medicine residency slots filled by U.S. seniors dropped from 57.4% in 2011 to 55.7% in 2012, according to the National Resident Matching Program.
The number of U.S. seniors held steady – 2,940 in 2011 and 2,941 in 2012 – but the number of available positions went from 5,121 to 5,277, an increase of just over 3%. Over the 5-year period from 2007 to 2012, the number of available internal medicine residency positions went up by nearly 10%, the NRMP reported.
The total number of applicants for the Main Residency Match this year for all specialties was 38,377, up from 37,735 in 2011. The total number of positions available was 26,772, which is an increase of 614 over last year, the NRMP said.
Source: National Resident Matching Program
Match Day: Psychiatry Slots Up, U.S. Fill Rate Down
The number of psychiatry residency positions offered this year was up by 1.9% from 2011, but the number of slots filled by U.S. seniors dropped by 3.8%, according to the National Resident Matching Program.
The overall number of positions available in 2012 was 1,118, compared with 1,097 in 2011. The total number of positions filled by U.S. seniors was 616 this year and 640 last year, the NRMP reported. That works out to a fill rate of 55.1% for 2012, compared with the rate of 58.5% for 2011.
The total number of applicants for the Main Residency Match this year for all specialties was 38,377, up from 37,735 in 2011. The total number of positions available was 26,772, which is an increase of 614 over last year, the NRMP said.
Source: National Resident Matching Program
Match Day: U.S. Seniors Fill 85% of Dermatology Positions
Dermatology was one the most competitive fields in this year’s Match Day, according to the National Resident Matching Program.
In 2012, dermatology filled 329 (97%) of the 340 PGY-2 positions offered, with U.S. seniors filling 85%. The total number of slots was down from the 344 offered in 2011, but the number of U.S. seniors filling residency slots went up 1.8% – from 283 last year to 288 this year, the NRMP reported.
Of the 28 PGY-1 positions offered in dermatology this year, a total of 26 were filled, all by U.S. seniors.
Source: National Resident Matching Program