User login
Richard Franki is the associate editor who writes and creates graphs. He started with the company in 1987, when it was known as the International Medical News Group. In his years as a journalist, Richard has worked for Cap Cities/ABC, Disney, Harcourt, Elsevier, Quadrant, Frontline, and Internet Brands. In the 1990s, he was a contributor to the ill-fated Indications column, predecessor of Livin' on the MDedge.
Psychiatrists' Earnings Rose in 2011
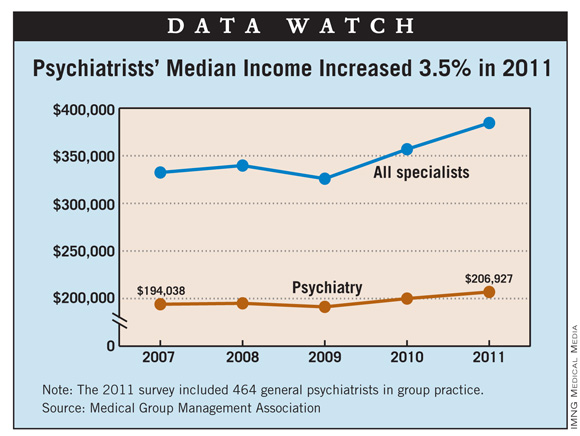
Median compensation for general psychiatrists in group practice increased 3.5% in 2011, according to a survey by the Medical Group Management Association.
In 2011, the median compensation for the 464 general psychiatrists responding to the survey was $206,927, compared with $199,996 in 2010. Psychiatrists in single-specialty practices earned $197,285 in 2011, compared with $209,049 for those in multispecialty practices, the MGMA reported.

There was considerable geographic variation in median compensation, with those in the Midwest earning $239,340, followed by the South ($230,000), the West ($201,102), and the East ($191,726).
For all specialists surveyed, median salary rose 7.7% to $384,467 in 2011, while primary care physicians had a 5.2% increase that brought their income to $212,840. Among nonphysician providers, the median compensation of $102,770 was 6.4% higher than in 2010.
For 2011, the MGMA’s annual compensation and production survey includes data from 62,245 physicians and nonphysician providers in 2,913 group practices.
Median compensation for general psychiatrists in group practice increased 3.5% in 2011, according to a survey by the Medical Group Management Association.
In 2011, the median compensation for the 464 general psychiatrists responding to the survey was $206,927, compared with $199,996 in 2010. Psychiatrists in single-specialty practices earned $197,285 in 2011, compared with $209,049 for those in multispecialty practices, the MGMA reported.
There was considerable geographic variation in median compensation, with those in the Midwest earning $239,340, followed by the South ($230,000), the West ($201,102), and the East ($191,726).
For all specialists surveyed, median salary rose 7.7% to $384,467 in 2011, while primary care physicians had a 5.2% increase that brought their income to $212,840. Among nonphysician providers, the median compensation of $102,770 was 6.4% higher than in 2010.
For 2011, the MGMA’s annual compensation and production survey includes data from 62,245 physicians and nonphysician providers in 2,913 group practices.
Ob.Gyns.' Earnings Rose in 2011, Survey Shows
Median compensation for obstetrician/gynecologists in group practice rebounded in 2011, rising 5% after falling the previous 2 years, according to a survey by the Medical Group Management Association.
In 2011, the median compensation for the 1,923 ob.gyns. responding to the survey was $295,144, compared with $281,190 in 2010. Ob.gyns. in single-specialty practices earned $288,129 in 2011, compared with $297,535 for those in multispecialty practices, the MGMA reported.

There was considerable geographic variation in median compensation, with those in the Midwest earning $311,300, followed by the South ($302,730), the West ($291,920), and the East ($275,000).
For all specialists surveyed, median salary rose 7.7% to $384,467 in 2011, while primary care physicians had a 5.2% increase that brought their income to $212,840. Among nonphysician providers, the median compensation of $102,770 was 6.4% higher than in 2010.
For 2011, the MGMA’s annual compensation and production survey includes data from 62,245 physicians and nonphysician providers in 2,913 group practices.
Median compensation for obstetrician/gynecologists in group practice rebounded in 2011, rising 5% after falling the previous 2 years, according to a survey by the Medical Group Management Association.
In 2011, the median compensation for the 1,923 ob.gyns. responding to the survey was $295,144, compared with $281,190 in 2010. Ob.gyns. in single-specialty practices earned $288,129 in 2011, compared with $297,535 for those in multispecialty practices, the MGMA reported.
There was considerable geographic variation in median compensation, with those in the Midwest earning $311,300, followed by the South ($302,730), the West ($291,920), and the East ($275,000).
For all specialists surveyed, median salary rose 7.7% to $384,467 in 2011, while primary care physicians had a 5.2% increase that brought their income to $212,840. Among nonphysician providers, the median compensation of $102,770 was 6.4% higher than in 2010.
For 2011, the MGMA’s annual compensation and production survey includes data from 62,245 physicians and nonphysician providers in 2,913 group practices.
Dermatologists' Incomes Continue to Rise
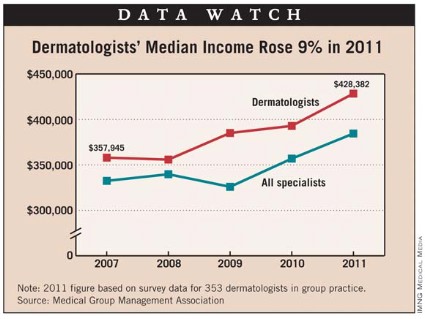
Median compensation for dermatologists in group practice rose 9% from 2010 to 2011, according to survey results from the Medical Group Management Association.
In 2011, the median compensation for the 353 dermatologists responding to the survey was $428,382, compared with $392,885 in 2010. Dermatologists in single-specialty practices earned $417,885 in 2011, compared with $430,956 for those in multispecialty practices, the MGMA reported.
There was considerable geographic variation in yearly median compensation, with dermatologists in the Midwest earning $437,565, followed by the West ($430,405), the South ($420,935), and the East ($378,841).
For all specialists surveyed, median salary rose 7.7% to $384,467 in 2011, while primary care physicians had a 5.2% increase that brought their income to $212,840. Among nonphysician providers, the median compensation of $102,770 was 6.4% higher than in 2010.
For 2011, the MGMA’s annual compensation and production survey includes data from 62,245 physicians and nonphysician providers in 2,913 group practices.
Neurologists Saw Small Income Bump in 2011
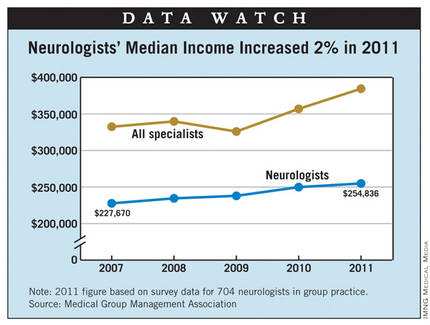
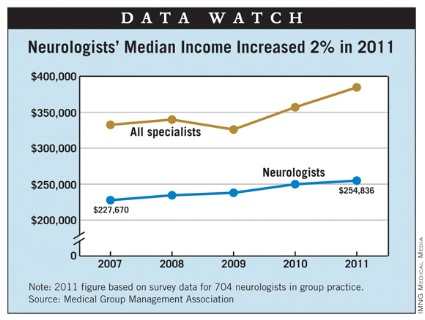
Median compensation for neurologists in group practice rose 2% from 2010 to 2011, according to a survey by the Medical Group Management Association.
In 2011, the median compensation for the 704 neurologists responding to the survey was $254,836, compared with $249,867 in 2010. Neurologists in single-specialty practices earned $238,500 in 2011, compared with $259,302 for those in multispecialty practices, the MGMA reported.
There was considerable geographic variation in median compensation, with neurologists in the South earning $285,479, followed by the Midwest ($261,168), the West ($240,765), and the East ($236,893).
For all specialists surveyed, median salary rose 7.7% to $384,467 in 2011. Among nonphysician providers, the median compensation of $102,770 was 6.4% higher than 2010.
For 2011, the MGMA’s annual compensation and production survey includes data from 62,245 physicians and nonphysician providers in 2,913 group practices.
Vaccination Exemptions at 2.2% for Kindergartners
For the 2011-2012 school year, an estimated 2.2% of all U.S. children enrolled in kindergarten received exemptions to vaccination, according to a report from the Centers for Disease Control and Prevention.
There were 89,133 exemptions reported in the estimated kindergarten population of 4,124,185 children, but states may have reported exemptions for one or more required vaccines, so "it is unlikely that children with an exemption were completely unvaccinated," the CDC noted (MMWR 2012;61:647-52).
Among the individual states, Alaska had the highest exemption rate (7.0%) and Mississippi the lowest (less than 0.1%). Compared with the 2009-2010 school year, the largest increase in exemption rate came in Arkansas, which went from 0.6% to 3.9%. The largest decrease occurred in Nebraska, which dropped from 3.8% to 1.5%, the report said.
The exemptions come in two basic types, medical and nonmedical, with the nonmedical category divided into religious and philosophic exemptions.
Texas had the largest number of medical exemptions (2,058), Illinois had the highest number of religious exemptions (7,270), and California had greatest number of philosophic exemptions (12,665). Illinois’ number of religious exemptions was 2.6-fold greater than that of the next-highest state, Florida, which had 2,771, and California’s number of philosophic exemptions was 2.4 times higher than that of Michigan, which came in second at 5,213, according to the CDC.

Pediatricians' Salaries Increased in 2011
Median compensation for general pediatricians in group practice rebounded in 2011, rising 6.1% after an increase of only 0.2% the previous year, according to a survey by the Medical Group Management Association.
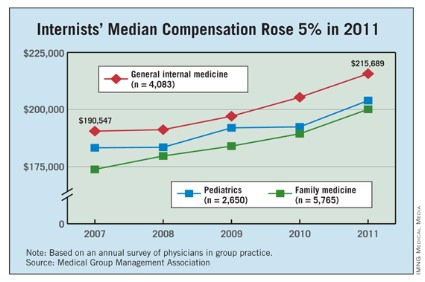
In 2011, the median compensation for the 2,650 general pediatricians responding to the survey was $203,948, compared with $192,423 in 2010. Among primary care providers, that puts pediatricians below general internists, who earned $215,689 in 2011, but above family physicians not practicing obstetrics, who earned $200,114, the MGMA data show.
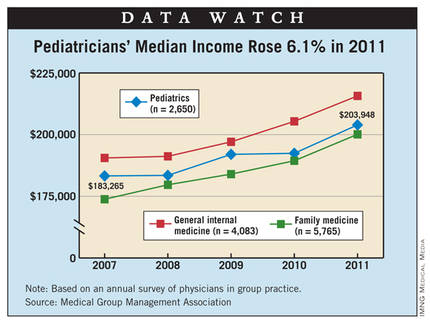
Median compensation for all primary care providers in group practice, including hospitalists, was $212,840 – an increase of 5.2% over 2010. For specialists, the median salary rose 7.7% to $384,467 in 2011. Among nonphysician providers, the median compensation of $102,770 was 6.4% higher than 2010.
For 2011, the MGMA’s annual compensation and production survey includes data from 62,245 physicians and nonphysician providers in 2,913 group practices.
Median compensation for general pediatricians in group practice rebounded in 2011, rising 6.1% after an increase of only 0.2% the previous year, according to a survey by the Medical Group Management Association.
In 2011, the median compensation for the 2,650 general pediatricians responding to the survey was $203,948, compared with $192,423 in 2010. Among primary care providers, that puts pediatricians below general internists, who earned $215,689 in 2011, but above family physicians not practicing obstetrics, who earned $200,114, the MGMA data show.
Median compensation for all primary care providers in group practice, including hospitalists, was $212,840 – an increase of 5.2% over 2010. For specialists, the median salary rose 7.7% to $384,467 in 2011. Among nonphysician providers, the median compensation of $102,770 was 6.4% higher than 2010.
For 2011, the MGMA’s annual compensation and production survey includes data from 62,245 physicians and nonphysician providers in 2,913 group practices.

More Hospitals House Palliative Care Teams
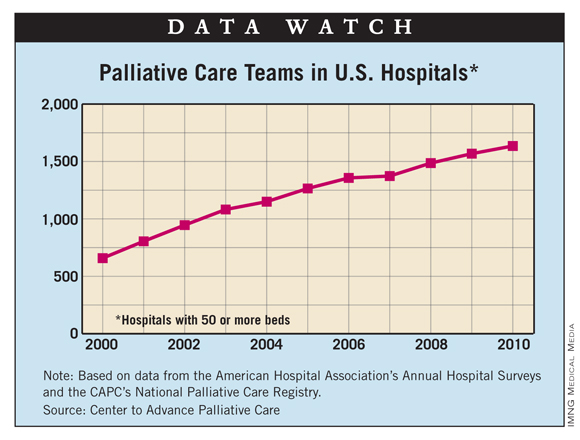
The number of U.S. hospitals with palliative care teams increased for the 10th consecutive year, according to a new analysis from the Center to Advance Palliative Care.
In 2010, the last year for which data are available, there were 1,635 palliative care teams in hospitals – an increase of 4.3% over 2009 and an increase of 148.5% since 2000. In 2010, almost 66% of hospitals had a palliative care team, compared with 24.5% in 2000, the CAPC reported.

By region, the South had a much lower prevalence of hospitals with palliative care teams (53%) than the rest of the country: Northeast (76%), Midwest (75%), and West (71%). In terms of hospital size, those with 300 or more beds had an 88% prevalence of palliative care teams, compared with 57% for hospitals with 50-299 beds, the CAPC said.
The analysis – based mainly on data from the American Hospital Association and supplemented by data from the CAPC’s National Palliative Care Registry – excluded hospitals with less than 50 beds and those that are controlled by the federal government, such as Veterans Affairs hospitals.
The number of U.S. hospitals with palliative care teams increased for the 10th consecutive year, according to a new analysis from the Center to Advance Palliative Care.
In 2010, the last year for which data are available, there were 1,635 palliative care teams in hospitals – an increase of 4.3% over 2009 and an increase of 148.5% since 2000. In 2010, almost 66% of hospitals had a palliative care team, compared with 24.5% in 2000, the CAPC reported.
By region, the South had a much lower prevalence of hospitals with palliative care teams (53%) than the rest of the country: Northeast (76%), Midwest (75%), and West (71%). In terms of hospital size, those with 300 or more beds had an 88% prevalence of palliative care teams, compared with 57% for hospitals with 50-299 beds, the CAPC said.
The analysis – based mainly on data from the American Hospital Association and supplemented by data from the CAPC’s National Palliative Care Registry – excluded hospitals with less than 50 beds and those that are controlled by the federal government, such as Veterans Affairs hospitals.
Survey Finds Support for Health Reform
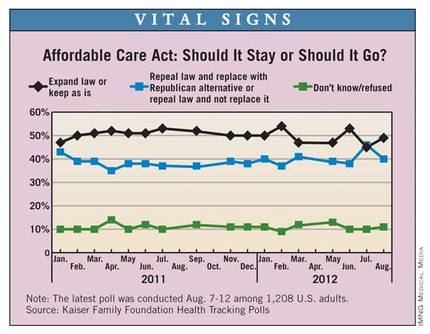
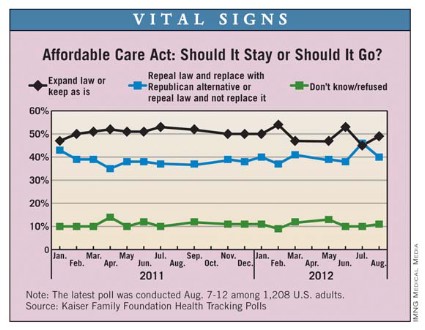
More Americans want to keep or expand the Affordable Care Act than want to repeal it or replace it, according to the Kaiser Family Foundation.
In its most recent Health Tracking Poll, 49% of the 1,208 adult respondents said that they wanted to expand the law or keep it as it is, compared with 40% who wanted to repeal it or replace it with a Republican alternative, Kaiser found in the survey, which was conducted Aug. 7-12.
In the July poll, for the first time since Kaiser started asking the question in January 2011, more people said that they wanted the health reform law repealed or replaced.
Group Practice FPs' Median Income Up 5.7% in 2011
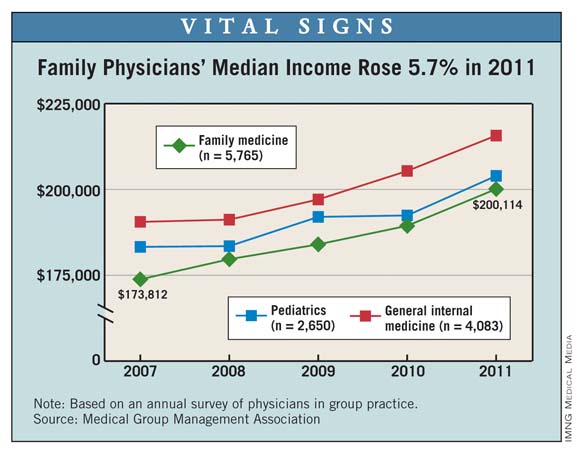
Median compensation for family physicians in group practice rose 5.7% from 2010 to 2011, according to a survey by the Medical Group Management Association.
In 2011, the median compensation for the 5,765 family physicians not practicing obstetrics who responded to the survey was $200,114, compared with $189,402 in 2010. Pediatricians earned $203,948 in 2011, and general internists earned $215,689, the MGMA data show.
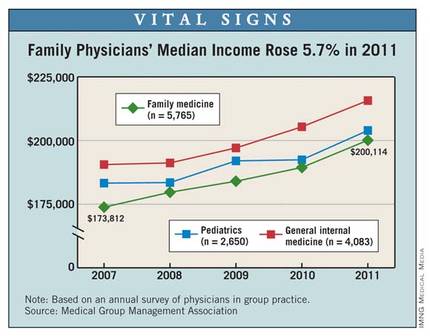
Median compensation for all primary care providers in group practice, including hospitalists, was $212,840 – an increase of 5.2% over 2010. For specialists, the median salary rose 7.7% to $384,467 in 2011. Among nonphysician providers, the median compensation of $102,770 was 6.4% higher than in 2010.
For 2011, the MGMA’s annual compensation and production survey includes data from 62,245 physicians and nonphysician providers in 2,913 group practices.
Median compensation for family physicians in group practice rose 5.7% from 2010 to 2011, according to a survey by the Medical Group Management Association.
In 2011, the median compensation for the 5,765 family physicians not practicing obstetrics who responded to the survey was $200,114, compared with $189,402 in 2010. Pediatricians earned $203,948 in 2011, and general internists earned $215,689, the MGMA data show.
Median compensation for all primary care providers in group practice, including hospitalists, was $212,840 – an increase of 5.2% over 2010. For specialists, the median salary rose 7.7% to $384,467 in 2011. Among nonphysician providers, the median compensation of $102,770 was 6.4% higher than in 2010.
For 2011, the MGMA’s annual compensation and production survey includes data from 62,245 physicians and nonphysician providers in 2,913 group practices.
Internists' Median Compensation Rose 5% in 2011
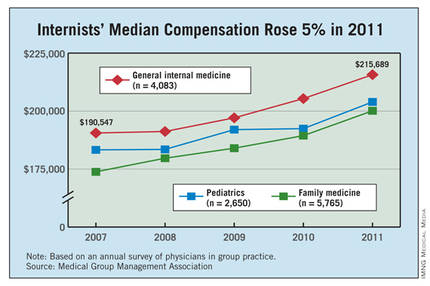
Median compensation for general internists in group practice rose 5% from 2010 to 2011, according to a survey by the Medical Group Management Association.
In 2011, the median compensation for the 4,083 general internists responding to the survey was $215,689, compared with $205,379 in 2010. Pediatricians earned $203,948 in 2011 and family physicians not practicing obstetrics earned $200,114, the MGMA data show.
Median compensation for all primary care providers in group practice, including hospitalists, was $212,840 – an increase of 5.2% over 2010. For specialists, the median salary rose 7.7% to $384,467 in 2011. Among nonphysician providers, the median compensation of $102,770 was 6.4% higher than in 2010.
For 2011, the MGMA’s annual compensation and production survey includes data from 62,245 physicians and nonphysician providers in 2,913 group practices.