User login
Richard Franki is the associate editor who writes and creates graphs. He started with the company in 1987, when it was known as the International Medical News Group. In his years as a journalist, Richard has worked for Cap Cities/ABC, Disney, Harcourt, Elsevier, Quadrant, Frontline, and Internet Brands. In the 1990s, he was a contributor to the ill-fated Indications column, predecessor of Livin' on the MDedge.
Teen Drinking and Driving Down 54% Since 1991
From 1991 to 2011, the prevalence of drinking and driving among high school students aged 16 years and older declined by 54%, according to a report from the Centers for Disease Control and Prevention.
In 2011, 10.3% of high school students aged 16-19 years reported driving a car when they had been drinking alcohol in the previous 30 days, compared with 22.3% in 1991, the CDC said.

The data from the national Youth Risk Behavior Surveys show that significantly more male students (11.7%) reported drinking and driving than females (8.8%), and that white (10.6%) and Hispanic (11.5%) students were significantly more likely to drink and drive than black students (6.6%) were. Of the 41 states with available data, the prevalence was lowest in Utah (4.6%) and highest in North Dakota (14.5%), according to the report.
From 1991 to 2011, the prevalence of drinking and driving among high school students aged 16 years and older declined by 54%, according to a report from the Centers for Disease Control and Prevention.
In 2011, 10.3% of high school students aged 16-19 years reported driving a car when they had been drinking alcohol in the previous 30 days, compared with 22.3% in 1991, the CDC said.
The data from the national Youth Risk Behavior Surveys show that significantly more male students (11.7%) reported drinking and driving than females (8.8%), and that white (10.6%) and Hispanic (11.5%) students were significantly more likely to drink and drive than black students (6.6%) were. Of the 41 states with available data, the prevalence was lowest in Utah (4.6%) and highest in North Dakota (14.5%), according to the report.

Joint Commission Names Top-Performing Hospitals
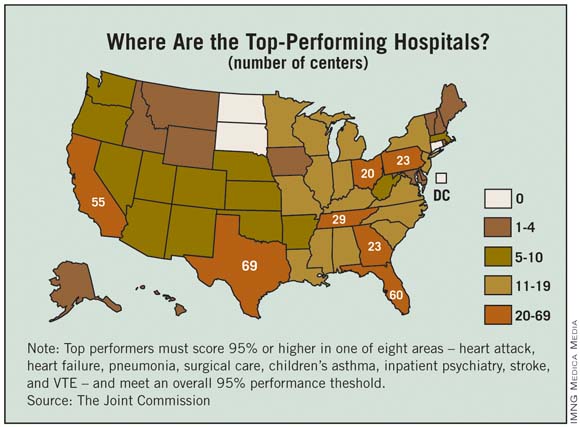
The number of hospitals considered to be top performers increased by 53% from 2011 to 2012, according to a report from the Joint Commission.
The commission recognized 620 hospitals, compared with 405 last year, as "top performers on key quality measures." Those 620 hospitals represent about 18% of the more than 3,300 that report performance data, with 244 making the list for the second year in a row. 2011 was the first year in which the commission released its list of top hospitals.

The Joint Commission said that it tracks hospital performance "on 45 accountability measures of evidence-based care processes linked to positive patient outcomes."
To be named a top performer, each hospital must achieve performance of 95% or more on a composite score in at least one of eight areas – heart attack, heart failure, pneumonia, surgical care, children’s asthma, inpatient psychiatry, stroke, and venous thromboembolism – including measures with fewer than 30 eligible cases. Each hospital also must meet or exceed "95% performance on every accountability measure for which it reports data," although this requirement excludes measures with fewer than 30 eligible cases, the commission said.
In addition to the top performers, the commission noted that 583 hospitals (17% of those reporting) "fell slightly short by missing 95% performance on only one measure."
Among the hospitals that did not qualify as top performers were Cleveland Clinic, Massachusetts General Hospital in Boston, Johns Hopkins Hospital in Baltimore, and the Mayo Clinic in Rochester, Minn., (although satellite facilities in Fairmont, Minn., and New Prague, Minn., were named).
The number of hospitals considered to be top performers increased by 53% from 2011 to 2012, according to a report from the Joint Commission.
The commission recognized 620 hospitals, compared with 405 last year, as "top performers on key quality measures." Those 620 hospitals represent about 18% of the more than 3,300 that report performance data, with 244 making the list for the second year in a row. 2011 was the first year in which the commission released its list of top hospitals.
The Joint Commission said that it tracks hospital performance "on 45 accountability measures of evidence-based care processes linked to positive patient outcomes."
To be named a top performer, each hospital must achieve performance of 95% or more on a composite score in at least one of eight areas – heart attack, heart failure, pneumonia, surgical care, children’s asthma, inpatient psychiatry, stroke, and venous thromboembolism – including measures with fewer than 30 eligible cases. Each hospital also must meet or exceed "95% performance on every accountability measure for which it reports data," although this requirement excludes measures with fewer than 30 eligible cases, the commission said.
In addition to the top performers, the commission noted that 583 hospitals (17% of those reporting) "fell slightly short by missing 95% performance on only one measure."
Among the hospitals that did not qualify as top performers were Cleveland Clinic, Massachusetts General Hospital in Boston, Johns Hopkins Hospital in Baltimore, and the Mayo Clinic in Rochester, Minn., (although satellite facilities in Fairmont, Minn., and New Prague, Minn., were named).
Prescription Cost Concerns Hit Minority Patients Hardest
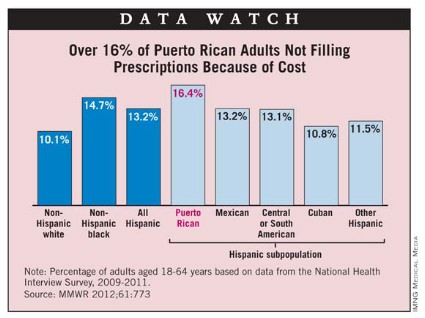
Minority patients are more likely go without needed prescription drugs due to cost concerns, according to the Centers for Disease Control and Prevention.
Based on 2009-2011 data from 18-64 year olds in the National Health Interview Survey, 10.1% of white adults, 13.2% of Hispanic adults, and 14.7% of black adults said that they had not filled a prescription in the past 12 months because they couldn’t afford i
PhRMA Spent $10.15 Million on Lobbying in 2012
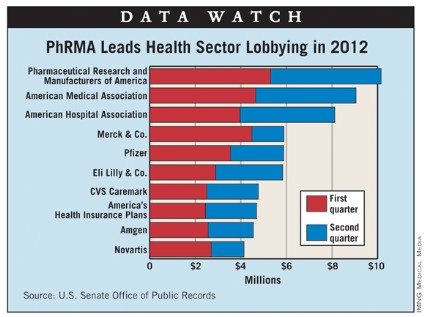
In the first half of 2012, Pharmaceutical Research and Manufacturers of America spent $10.15 million lobbying the federal government, the most of any entity in the health sector, data from the U.S. Senate Office of Public Records show.
The American Medical Association was second in lobbying at $9.05 million and the American Hospital Association was third with $8.12 million. The next two spots were filled by pharmaceutical companies: Merck ($5.89 million) and Pfizer ($5.88 million), according to a search of the senate’s Lobbying Disclosure Act Database, which does not yet contain data for the third quarter.
The largest spender overall in the first half of this year was the U.S. Chamber of Commerce, which reported $42.72 million in lobbying expenses.
Endocrinologists' Income Still Lags Behind Other Specialists
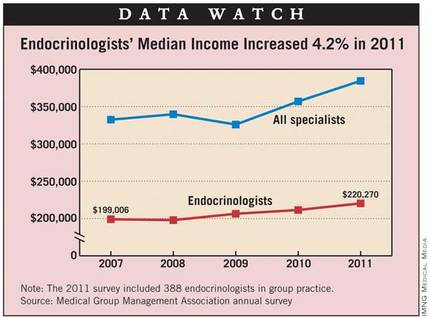
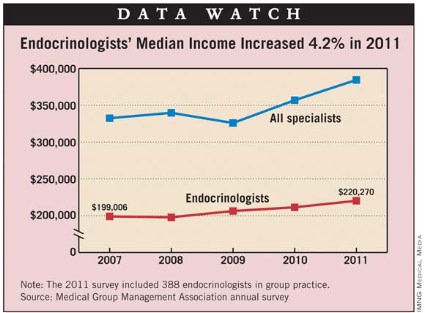
Median compensation for endocrinologists in group practice increased 4.2% in 2011, according to a survey by the Medical Group Management Association.
In 2011, the median compensation for the 388 endocrinologists responding to the survey was $220,270, compared with $211,400 in 2010, the MGMA reported.
Endocrinologists in single-specialty practices earned $222,802 last year, compared with $220,030 for those in multispecialty practices. There was more variation from a geographic standpoint, with those in the South earning $239,128, followed by the West ($221,898), the Midwest ($216,780), and the East ($216,290), the MGMA said.
For all specialists surveyed, median compensation rose 7.7% to $384,467 in 2011, while primary care physicians had a 5.2% increase that brought their income to $212,840. Among nonphysician providers, the median compensation of $102,770 was 6.4% higher than in 2010.
For 2011, the MGMA’s annual compensation and production survey includes data from 62,245 physicians and nonphysician providers in 2,913 group practices.
Cardiologists' Incomes Were Up in 2011
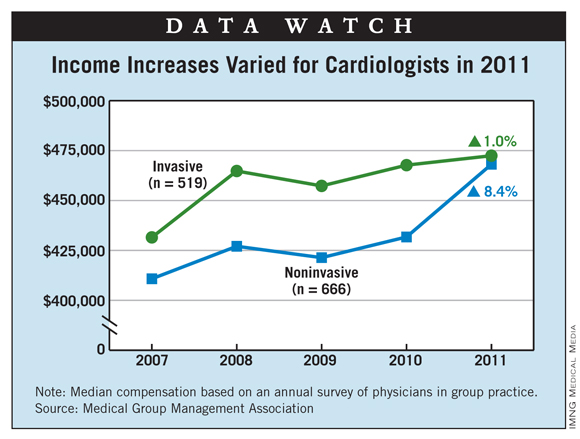
Median compensation for noninvasive cardiologists in group practice increased 8.4% in 2011, but invasive cardiologists saw only a 1% increase, according to a survey by the Medical Group Management Association.
In 2011, the median compensation for the 666 noninvasive cardiologists responding to the survey was $468,136, compared with $431,740 in 2010. The 519 invasive cardiologists had a median income of $472,446 in 2011, compared with $467,715 in 2010, the MGMA reported.
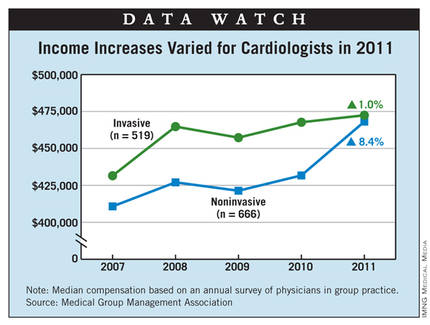
Noninvasive cardiologists in single-specialty practices earned $499,197 in 2011, while those in multispecialty practices earned $448,544. Invasive cardiologists in single-specialty practices reported median compensation of $477,349 in 2011, compared with $470,417 for those in multispecialty practices, the survey showed.
There was considerable geographic variation in both subspecialties. Noninvasive cardiologists in the South earned $522,094, followed by the Midwest ($479,876), the East ($424,685), and the West ($416,630). Among invasive cardiologists, those in the South were the highest earners at $556,124, followed by the Midwest ($490,060), the East ($441,667), and the West ($404,525), the MGMA said.
For all specialists surveyed, median salary rose 7.7% to $384,467 in 2011, while primary care physicians had a 5.2% increase that brought their income to $212,840. Among nonphysician providers, the median compensation of $102,770 was 6.4% higher than in 2010.
For 2011, the MGMA’s annual compensation and production survey includes data from 62,245 physicians and nonphysician providers in 2,913 group practices.
Median compensation for noninvasive cardiologists in group practice increased 8.4% in 2011, but invasive cardiologists saw only a 1% increase, according to a survey by the Medical Group Management Association.
In 2011, the median compensation for the 666 noninvasive cardiologists responding to the survey was $468,136, compared with $431,740 in 2010. The 519 invasive cardiologists had a median income of $472,446 in 2011, compared with $467,715 in 2010, the MGMA reported.
Noninvasive cardiologists in single-specialty practices earned $499,197 in 2011, while those in multispecialty practices earned $448,544. Invasive cardiologists in single-specialty practices reported median compensation of $477,349 in 2011, compared with $470,417 for those in multispecialty practices, the survey showed.
There was considerable geographic variation in both subspecialties. Noninvasive cardiologists in the South earned $522,094, followed by the Midwest ($479,876), the East ($424,685), and the West ($416,630). Among invasive cardiologists, those in the South were the highest earners at $556,124, followed by the Midwest ($490,060), the East ($441,667), and the West ($404,525), the MGMA said.
For all specialists surveyed, median salary rose 7.7% to $384,467 in 2011, while primary care physicians had a 5.2% increase that brought their income to $212,840. Among nonphysician providers, the median compensation of $102,770 was 6.4% higher than in 2010.
For 2011, the MGMA’s annual compensation and production survey includes data from 62,245 physicians and nonphysician providers in 2,913 group practices.
Income Up for Hematology/Oncology
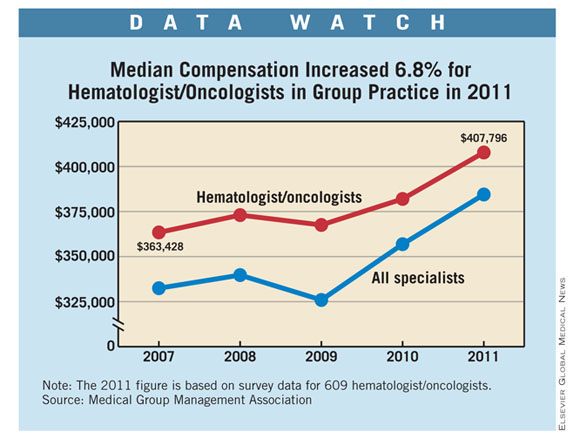
Median compensation for hematologist/oncologists in group practice increased 6.8% in 2011, according to a survey by the Medical Group Management Association.
In 2011, the median compensation for the 609 hematologist/oncologists responding to the survey was $407,796, compared with $381,992 in 2010. Those in single-specialty practices earned $483,690 in 2011, compared with $381,208 for those in multispecialty practices, the MGMA reported.
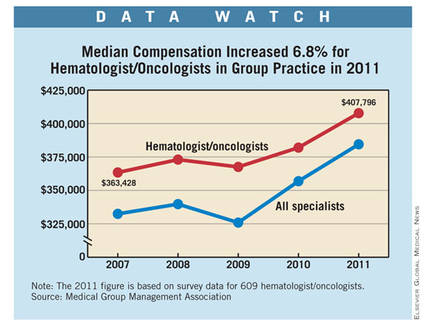
There was considerable geographic variation in median compensation, with hematologist/oncologists in the Midwest earning $449,547, followed by those in the East ($403,107), the West ($389,624), and the South ($387,925).
For all specialists surveyed, median salary rose 7.7% to $384,467 in 2011, while primary care physicians had a 5.2% increase that brought their income to $212,840. Among nonphysician providers, the median compensation of $102,770 was 6.4% higher than in 2010, the survey showed.
For 2011, the MGMA’s annual compensation and production survey includes data from 62,245 physicians and nonphysician providers in 2,913 group practices.
Median compensation for hematologist/oncologists in group practice increased 6.8% in 2011, according to a survey by the Medical Group Management Association.
In 2011, the median compensation for the 609 hematologist/oncologists responding to the survey was $407,796, compared with $381,992 in 2010. Those in single-specialty practices earned $483,690 in 2011, compared with $381,208 for those in multispecialty practices, the MGMA reported.
There was considerable geographic variation in median compensation, with hematologist/oncologists in the Midwest earning $449,547, followed by those in the East ($403,107), the West ($389,624), and the South ($387,925).
For all specialists surveyed, median salary rose 7.7% to $384,467 in 2011, while primary care physicians had a 5.2% increase that brought their income to $212,840. Among nonphysician providers, the median compensation of $102,770 was 6.4% higher than in 2010, the survey showed.
For 2011, the MGMA’s annual compensation and production survey includes data from 62,245 physicians and nonphysician providers in 2,913 group practices.
Hospitalists Received Healthy Raise in 2011
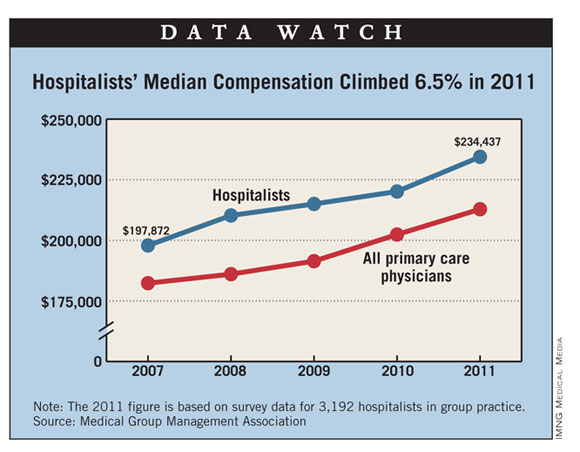
Median compensation for hospitalists in group practice increased 6.5% in 2011, according to a survey by the Medical Group Management Association.
In 2011, the median compensation for the 3,192 hospitalists responding to the survey was $234,437, compared with $220,144 in 2010. Hospitalists in single-specialty practices earned $240,785 in 2011, compared with $231,393 for those in multispecialty practices, the MGMA reported.
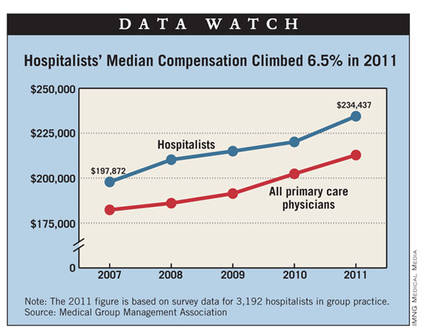
There was considerable geographic variation in median compensation, with those in the South earning $261,603, followed by the Midwest ($239,089), the East ($227,656), and the West ($223,591).
For all primary care physicians surveyed, median salary rose 5.2% to $212,840 in 2011, while specialists had a 7.7% increase that brought their income to $384,467. Among nonphysician providers, the median compensation of $102,770 was 6.4% higher than in 2010.
For 2011, the MGMA’s annual compensation and production survey includes data from 62,245 physicians and nonphysician providers in 2,913 group practices.
Median compensation for hospitalists in group practice increased 6.5% in 2011, according to a survey by the Medical Group Management Association.
In 2011, the median compensation for the 3,192 hospitalists responding to the survey was $234,437, compared with $220,144 in 2010. Hospitalists in single-specialty practices earned $240,785 in 2011, compared with $231,393 for those in multispecialty practices, the MGMA reported.
There was considerable geographic variation in median compensation, with those in the South earning $261,603, followed by the Midwest ($239,089), the East ($227,656), and the West ($223,591).
For all primary care physicians surveyed, median salary rose 5.2% to $212,840 in 2011, while specialists had a 7.7% increase that brought their income to $384,467. Among nonphysician providers, the median compensation of $102,770 was 6.4% higher than in 2010.
For 2011, the MGMA’s annual compensation and production survey includes data from 62,245 physicians and nonphysician providers in 2,913 group practices.
Rheumatologists' Earnings Up 8% in 2011
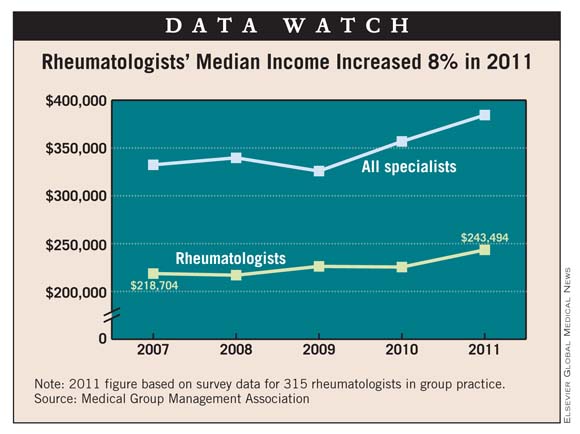
Median compensation for rheumatologists in group practice increased 8% in 2011, according to data from the Medical Group Management Association.
In 2011, the median compensation for the 315 rheumatologists responding to an MGMA survey was $243,494, compared with $225,521 in 2010. Regional variation put rheumatologists in the Midwest on top at $250,291, followed by the West ($249,128), the South ($244,268), and the East ($235,174), the MGMA reported.
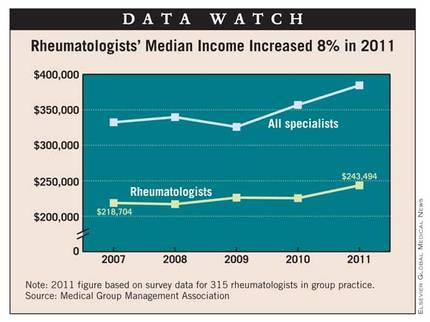
For all specialists surveyed, median salary rose 7.7% to $384,467 in 2011, while primary care physicians had a 5.2% increase that brought their income to $212,840. Among nonphysician providers, the median compensation of $102,770 was 6.4% higher than in 2010.
For 2011, the MGMA’s annual compensation and production survey includes data from 62,245 physicians and nonphysician providers in 2,913 group practices.
Median compensation for rheumatologists in group practice increased 8% in 2011, according to data from the Medical Group Management Association.
In 2011, the median compensation for the 315 rheumatologists responding to an MGMA survey was $243,494, compared with $225,521 in 2010. Regional variation put rheumatologists in the Midwest on top at $250,291, followed by the West ($249,128), the South ($244,268), and the East ($235,174), the MGMA reported.
For all specialists surveyed, median salary rose 7.7% to $384,467 in 2011, while primary care physicians had a 5.2% increase that brought their income to $212,840. Among nonphysician providers, the median compensation of $102,770 was 6.4% higher than in 2010.
For 2011, the MGMA’s annual compensation and production survey includes data from 62,245 physicians and nonphysician providers in 2,913 group practices.
Surgeons in Group Practice Saw Income Rise in 2011
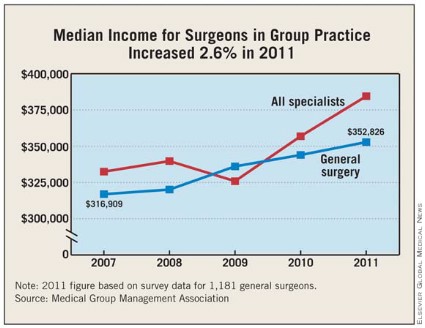
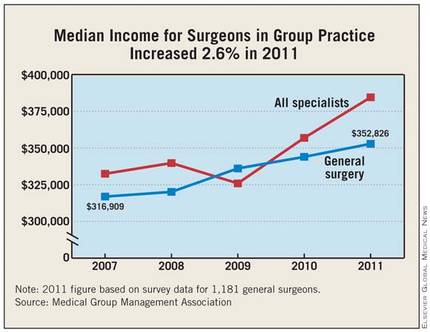
Median compensation for general surgeons in group practice increased 2.6% in 2011, according to a survey by the Medical Group Management Association.
In 2011, the median compensation for the 1,181 general surgeons responding to the survey was $352,826, compared with $343,958 in 2010. Surgeons in single-specialty practices earned $347,826 in 2011, compared with $355,493 for those in multispecialty practices, the MGMA reported.
There was considerable geographic variation in median compensation, with those in the Midwest earning $383,568, followed by the South ($361,281), the West ($345,173), and the East ($318,000).
For all specialists surveyed, median salary rose 7.7% to $384,467 in 2011, while primary care physicians had a 5.2% increase that brought their income to $212,840. Among nonphysician providers, the median compensation of $102,770 was 6.4% higher than in 2010.
For 2011, the MGMA’s annual compensation and production survey includes data from 62,245 physicians and nonphysician providers in 2,913 group practices.