User login
The American Journal of Orthopedics is an Index Medicus publication that is valued by orthopedic surgeons for its peer-reviewed, practice-oriented clinical information. Most articles are written by specialists at leading teaching institutions and help incorporate the latest technology into everyday practice.
Interobserver Agreement Using Computed Tomography to Assess Radiographic Fusion Criteria With a Unique Titanium Interbody Device
The accuracy of using computed tomography (CT) to assess lumbar interbody fusion with titanium implants has been questioned in the past.1-4 Reports have most often focused on older technologies using paired, threaded, smooth-surface titanium devices. Some authors have reported they could not confidently assess the quality of fusions using CT because of implant artifact.1-3
When pseudarthrosis is suspected clinically, and imaging results are inconclusive, surgical explorations may be performed with mechanical stressing of the segment to assess for motion.2,5-7 However, surgical exploration not only has the morbidity of another surgery but may not be conclusive. Direct exploration of an interbody fusion is problematic. In some cases, there may be residual normal springing motion through posterior elements, even in the presence of a solid interbody fusion, which can be confusing.5 Radiologic confirmation of fusion status is therefore preferred over surgical exploration. CT is the imaging modality used most often to assess spinal fusions.8,9
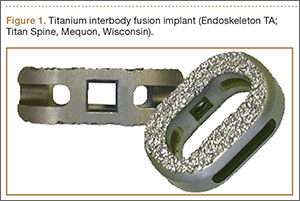
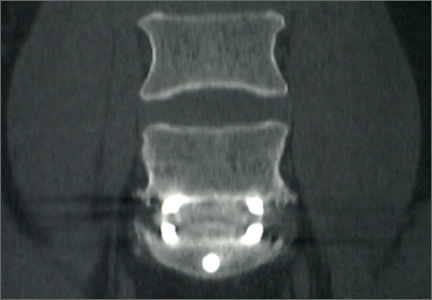
A new titanium interbody fusion implant (Endoskeleton TA; Titan Spine, Mequon, Wisconsin) preserves the endplate and has an acid-etched titanium surface for osseous integration and a wide central aperture for bone graft (Figure 1). Compared with earlier titanium implants, this design may allow for more accurate CT imaging and fusion assessment. We conducted a study to determine the interobserver reliability of using CT to evaluate bone formation and other radiographic variables with this new titanium interbody device.
Materials and Methods
After receiving institutional review board approval for this study, as well as patient consent, we obtained and analyzed CT scans of patients after they had undergone anterior lumbar interbody fusion (ALIF) at L3–S1 as part of a separate clinical outcomes study.
Each patient received an Endoskeleton TA implant. The fusion cage was packed with 2 sponges (3.0 mg per fusion level) of bone morphogenetic protein, or BMP (InFuse; Medtronic, Minneapolis, Minnesota). In addition, 1 to 3 cm3 of hydroxyapatite/β-tricalcium phosphate (MasterGraft, Medtronic) collagen sponge was used as graft extender to fill any remaining gaps within the cage. Pedicle screw fixation was used in all cases.
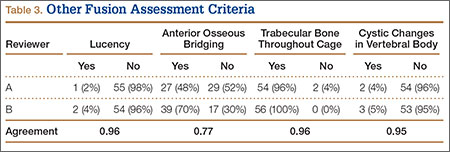
Patients were randomly assigned to have fine-cut CT scans with reconstructed images at 6, 9, or 12 months. The scans were reviewed by 2 independent radiologists who were blinded to each other’s interpretations and the clinical results. The radiographic fusion criteria are listed in Tables 1 to 3. Interobserver agreement (κ) was calculated separately for each radiographic criterion and could range from 0.00 (no agreement) to 1.00 (perfect agreement).10,11
Results
The study involved 33 patients (17 men, 16 women) with 56 lumbar spinal fusion levels. Mean age was 46 years (range, 23-66 years). Six patients (18%) were nicotine users. Seventeen patients were scanned at 6 months, 9 at 9 months, and 7 at 12 months. There were no significant differences in results between men and women, between nicotine users and nonusers, or among patients evaluated at 6, 9, or 12 months.
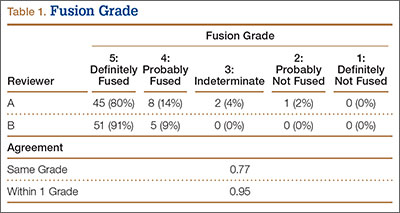
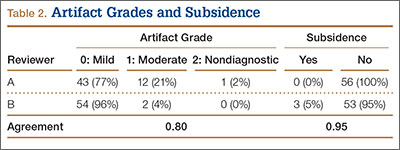
The radiologists agreed on 345 of the 392 data points reviewed (κ = 0.88). Interobserver agreement results for the fusion criteria are listed in Tables 1 and 3. Interobserver agreement was 0.77 for overall fusion grade, with the radiologists noting definite fusion (grade 5) in 80% and 91% of the levels (Table 1). Other radiographic criteria are listed in Tables 2 and 3. Interobserver agreement was 0.80 for degree of artifact, 0.95 for subsidence, 0.96 for both lucency and trabecular bone, 0.77 for anterior osseous bridging, and 0.95 for cystic vertebral changes.
Discussion
Radiographic analysis of interbody fusions is an important clinical issue. Investigators have shown that CT is the radiographic method of choice for assessing fusion.8,9 Others have reported that assessing fusion with metallic interbody implants is more difficult compared with PEEK (polyether ether ketone) or allograft bone.3,4,5,12
Heithoff and colleagues1,2 reported on difficulties they encountered in assessing interbody fusion with titanium implants, and their research has often been cited. The authors concluded that they could not accurately assess fusion in these cases because of artifact from the small apertures in the cages and metallic scatter. Their study was very small (8 patients, 12 surgical levels) and used paired BAK (Bagby and Kuslich) cages (Zimmer, Warsaw, Indiana).
Recently, a unique surface technology, used to manufacture osseointegrative dental implants, has been adapted for use in the spine.13-15 Acid etching modifies the surface of titanium to create a nano-scale (micron-level) alteration. Compared with PEEK and smooth titanium, acid-etched titanium stimulates a better osteogenic environment.16,17 As this technology is now used clinically in spinal surgery, we thought it important to revisit the issue of CT analysis for fusion assessment with the newer titanium implants.
Artifact
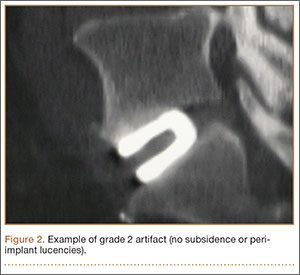
The results of our study support the idea that the design of a titanium interbody fusion implant is important to radiographic analysis. The implant studied has a large open central aperture that appears to generate less artifact than historical controls (paired cylindrical cages) have.1-4 Other investigators have reported fewer problems with artifact in their studies of implants incorporating larger openings for bone graft.6,18 The radiologists in the present study found no significant problems with artifact. Less artifact is clinically important, as the remaining fusion variables can be more clearly visualized (Table 2, Figure 2).
Anterior Osseous Bridging, Subsidence, Lysis
In this study, the bony endplates were preserved. The disc and endplate cartilage was removed without reaming or drilling. Endplate reaming most likely contributes to subsidence and loss of original fixation between implant and bone interface.1,4,12 Some authors have advocated recessing the cages deeply and then packing bone anteriorly to create a “sentinel fusion sign.”1,2,6 Deeply seating interbody implants, instead of resting them more widely on the apophyseal ring of the vertebral endplate, may also lead to subsidence.4,12 The issue of identifying a sentinel fusion sign is relevant only if the surgeon tries to create one. In the present study, the implant used was an impacted cage positioned on the apophyseal perimeter of the disc space, just slightly recessed, so there was no attempt to create a sentinel fusion sign, as reflected in the relatively low scores on anterior osseous bridging (48%, 52%).
Subsidence and peri-implant lysis are pathologic variables associated with motion and bone loss. Sethi and colleagues19 noted a high percentage of endplate resorption and subsidence in cases reviewed using PEEK or allograft spacers paired with BMP-2. Although BMP-2 was used in the present study, we found very low rates of subsidence (0%, 5%) and no significant peri-implant lucencies (2%, 4%) (Figure 2). Interobserver agreement for these variables was high (0.95, 0.96). We hypothesize that the combination of endplate-sparing surgical technique and implant–bone integration contributed to these results.
Trabecular Bone and Fusion Grade
The primary radiographic criterion for solid interbody fusion is trabecular bone throughout the cage, bridging the vertebral bodies. In our study, the success rates for this variable were 96% and 100%, and there was very high interobserver agreement (0.96) (Figure 3). This very high fusion rate may preclude detecting subtle differences in interobserver agreement, but to what degree, if any, is unknown. Other investigators have effectively identified trabecular bone across the interspace and throughout the cages.6,18 The openings for bone formation were larger in the implants they used than in first-generation fusion cages but not as large as the implant openings in the present study. Larger openings may correlate with improved ability to visualize bridging bone on CT.
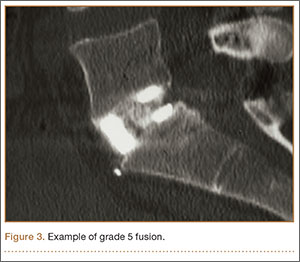
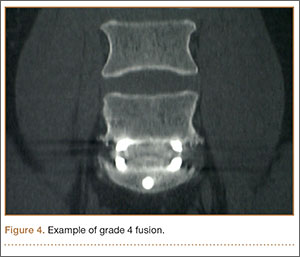
Radiologists and surgeons must ultimately arrive at a conclusion regarding the likelihood a fusion has occurred. Our radiologists integrated all the separate radiologic variables cited here, as well as their overall impressions of the scans, to arrive at a final grade regarding fusion quality (Figures 3, 4). Although this category provides the most interpretive latitude of all the variables examined, the results demonstrate high interobserver reliability. Agreement to exactly the same fusion grade was 0.77, and agreement to within 1 category grade was 0.95.
This study had several limitations. Surgical explorations were not clinically indicated and were not performed. There were no suspected nonunions or hardware complications, two of the most common indications for exploration. In addition, this study was conducted not to determine specific accuracy of CT (compared with surgery exploration) for fusion assessment but to assess interobserver reliability. The clinical success rates for this population were high, and no patient required revision surgery for suspected pseudarthrosis. To assess the true accuracy of CT for fusion assessment, one would have to subject patients to follow-up exploratory surgery to test fusions mechanically.
Another limitation is the lack of a single industry-accepted radiographic fusion grading system. Fusion criteria are not standardized across all studies. Our radiologists have extensive research experience and limit their practices to neuromuscular radiology with a concentration on the spine. The radiographic criteria cited here are the same criteria they use in clinical practice, when reviewing CT scans for clinicians. Last, there was no control group for direct comparison against other cages. Historical controls were cited. This does not adversely affect the conclusions of this investigation.
Conclusion
Clinicians have been reluctant to rely on CT with titanium devices because of concerns about the accuracy of image interpretations. The interbody device used in this study demonstrated minimal artifact and minimal subsidence, and trabecular bone was easily identified throughout the implant in the majority of cases reviewed. We found high interobserver agreement scores across all fusion criteria. Although surgical exploration remains the gold standard for fusion assessment, surgeons should have confidence in using CT with this titanium implant.
1. Gilbert TJ, Heithoff KB, Mullin WJ. Radiographic assessment of cage-assisted interbody fusions in the lumbar spine. Semin Spine Surg. 2001;13:311-315.
2. Heithoff KB, Mullin WJ, Renfrew DL, Gilbert TJ. The failure of radiographic detection of pseudarthrosis in patients with titanium lumbar interbody fusion cages. In: Proceedings of the 14th Annual Meeting of the North American Spine Society; October 20-23, 1999; Chicago, IL. Abstract 14.
3. Cizek GR, Boyd LM. Imaging pitfalls of interbody implants. Spine. 2000;25(20):2633-2636.
4. Dorchak JD, Burkus JK, Foor BD, Sanders DL. Dual paired proximity and combined BAK/proximity interbody fusion cages: radiographic results. In: Proceedings of the 15th Annual Meeting of the North American Spine Society. New Orleans, LA: North American Spine Society; 2000:83-85.
5. Santos ER, Goss DG, Morcom RK, Fraser RD. Radiologic assessment of interbody fusion using carbon fiber cages. Spine. 2003;28(10):997-1001.
6. Carreon LY, Glassman SD, Schwender JD, Subach BR, Gornet MF, Ohno S. Reliability and accuracy of fine-cut computed tomography scans to determine the status of anterior interbody fusions with metallic cages. Spine J. 2008;8(6):998-1002.
7. Fogel GR, Toohey JS, Neidre A, Brantigan JW. Fusion assessment of posterior lumbar interbody fusion using radiolucent cages: x-ray films and helical computed tomography scans compared with surgical exploration of fusion. Spine J. 2008;8(4):570-577.
8. Selby MD, Clark SR, Hall DJ, Freeman BJ. Radiologic assessment of spinal fusion. J Am Acad Orthop Surg. 2012;20(11):694-703.
9. Chafetz N, Cann CE, Morris JM, Steinbach LS, Goldberg HI, Ax L. Pseudarthrosis following lumbar fusion: detection by direct coronal CT scanning. Radiology. 1987;162(3):803-805.
10. Landis RJ, Koch GG. The measurement of observer agreement for categorical data. Biometrics. 1977;33(1):159-174.
11. Viera AJ, Garrett JM. Understanding interobserver agreement; the kappa statistic. Fam Med. 2005;37(5):360-363.
12. Burkus JK, Foley K, Haid RW, Lehuec JC. Surgical Interbody Research Group—radiographic assessment of interbody fusion devices: fusion criteria for anterior lumbar interbody surgery. Neurosurg Focus. 2001;10(4):E11.
13. Albrektsson T, Zarb G, Worthington P, Eriksson AR. The long-term efficacy of currently used dental implants: a review and proposed criteria of success. Int J Oral Maxillofac Implants. 1986;1(1):11-25.
14. De Leonardis D, Garg AK, Pecora GE. Osseointegration of rough acid-etched titanium implants: 5-year follow-up of 100 Minimatic implants. Int J Oral Maxillofac Implants. 1999;14(3):384-391.
15. Schwartz Z, Raz P, Zhao G, et al. Effect of micrometer-scale roughness on the surface of Ti6Al4V pedicle screws in vitro and in vivo. J Bone Joint Surg Am. 2008;90(11):2485-2498.
16. Olivares-Navarrete R, Gittens RA, Schneider JM, et al. Osteoblasts exhibit a more differentiated phenotype and increased bone morphogenetic protein production on titanium alloy substrates than on poly-ether-ether-ketone. Spine J. 2012;12(3):265-272.
17. Olivares-Navarrete R, Hyzy SL, Gittens RA 1st, et al. Rough titanium alloys regulate osteoblast production of angiogenic factors. Spine J. 2013;13(11):1563-1570.
18. Burkus JK, Dorchak JD, Sanders DL. Radiographic assessment of interbody fusion using recombinant human bone morphogenetic protein type 2. Spine. 2003;28(4):372-377.
19. Sethi A, Craig J, Bartol S, et al. Radiographic and CT evaluation of recombinant human bone morphogenetic protein-2–assisted spinal interbody fusion. AJR Am J Roentgenol. 2011;197(1):W128-W133.
The accuracy of using computed tomography (CT) to assess lumbar interbody fusion with titanium implants has been questioned in the past.1-4 Reports have most often focused on older technologies using paired, threaded, smooth-surface titanium devices. Some authors have reported they could not confidently assess the quality of fusions using CT because of implant artifact.1-3
When pseudarthrosis is suspected clinically, and imaging results are inconclusive, surgical explorations may be performed with mechanical stressing of the segment to assess for motion.2,5-7 However, surgical exploration not only has the morbidity of another surgery but may not be conclusive. Direct exploration of an interbody fusion is problematic. In some cases, there may be residual normal springing motion through posterior elements, even in the presence of a solid interbody fusion, which can be confusing.5 Radiologic confirmation of fusion status is therefore preferred over surgical exploration. CT is the imaging modality used most often to assess spinal fusions.8,9
A new titanium interbody fusion implant (Endoskeleton TA; Titan Spine, Mequon, Wisconsin) preserves the endplate and has an acid-etched titanium surface for osseous integration and a wide central aperture for bone graft (Figure 1). Compared with earlier titanium implants, this design may allow for more accurate CT imaging and fusion assessment. We conducted a study to determine the interobserver reliability of using CT to evaluate bone formation and other radiographic variables with this new titanium interbody device.
Materials and Methods
After receiving institutional review board approval for this study, as well as patient consent, we obtained and analyzed CT scans of patients after they had undergone anterior lumbar interbody fusion (ALIF) at L3–S1 as part of a separate clinical outcomes study.
Each patient received an Endoskeleton TA implant. The fusion cage was packed with 2 sponges (3.0 mg per fusion level) of bone morphogenetic protein, or BMP (InFuse; Medtronic, Minneapolis, Minnesota). In addition, 1 to 3 cm3 of hydroxyapatite/β-tricalcium phosphate (MasterGraft, Medtronic) collagen sponge was used as graft extender to fill any remaining gaps within the cage. Pedicle screw fixation was used in all cases.
Patients were randomly assigned to have fine-cut CT scans with reconstructed images at 6, 9, or 12 months. The scans were reviewed by 2 independent radiologists who were blinded to each other’s interpretations and the clinical results. The radiographic fusion criteria are listed in Tables 1 to 3. Interobserver agreement (κ) was calculated separately for each radiographic criterion and could range from 0.00 (no agreement) to 1.00 (perfect agreement).10,11
Results
The study involved 33 patients (17 men, 16 women) with 56 lumbar spinal fusion levels. Mean age was 46 years (range, 23-66 years). Six patients (18%) were nicotine users. Seventeen patients were scanned at 6 months, 9 at 9 months, and 7 at 12 months. There were no significant differences in results between men and women, between nicotine users and nonusers, or among patients evaluated at 6, 9, or 12 months.
The radiologists agreed on 345 of the 392 data points reviewed (κ = 0.88). Interobserver agreement results for the fusion criteria are listed in Tables 1 and 3. Interobserver agreement was 0.77 for overall fusion grade, with the radiologists noting definite fusion (grade 5) in 80% and 91% of the levels (Table 1). Other radiographic criteria are listed in Tables 2 and 3. Interobserver agreement was 0.80 for degree of artifact, 0.95 for subsidence, 0.96 for both lucency and trabecular bone, 0.77 for anterior osseous bridging, and 0.95 for cystic vertebral changes.
Discussion
Radiographic analysis of interbody fusions is an important clinical issue. Investigators have shown that CT is the radiographic method of choice for assessing fusion.8,9 Others have reported that assessing fusion with metallic interbody implants is more difficult compared with PEEK (polyether ether ketone) or allograft bone.3,4,5,12
Heithoff and colleagues1,2 reported on difficulties they encountered in assessing interbody fusion with titanium implants, and their research has often been cited. The authors concluded that they could not accurately assess fusion in these cases because of artifact from the small apertures in the cages and metallic scatter. Their study was very small (8 patients, 12 surgical levels) and used paired BAK (Bagby and Kuslich) cages (Zimmer, Warsaw, Indiana).
Recently, a unique surface technology, used to manufacture osseointegrative dental implants, has been adapted for use in the spine.13-15 Acid etching modifies the surface of titanium to create a nano-scale (micron-level) alteration. Compared with PEEK and smooth titanium, acid-etched titanium stimulates a better osteogenic environment.16,17 As this technology is now used clinically in spinal surgery, we thought it important to revisit the issue of CT analysis for fusion assessment with the newer titanium implants.
Artifact
The results of our study support the idea that the design of a titanium interbody fusion implant is important to radiographic analysis. The implant studied has a large open central aperture that appears to generate less artifact than historical controls (paired cylindrical cages) have.1-4 Other investigators have reported fewer problems with artifact in their studies of implants incorporating larger openings for bone graft.6,18 The radiologists in the present study found no significant problems with artifact. Less artifact is clinically important, as the remaining fusion variables can be more clearly visualized (Table 2, Figure 2).
Anterior Osseous Bridging, Subsidence, Lysis
In this study, the bony endplates were preserved. The disc and endplate cartilage was removed without reaming or drilling. Endplate reaming most likely contributes to subsidence and loss of original fixation between implant and bone interface.1,4,12 Some authors have advocated recessing the cages deeply and then packing bone anteriorly to create a “sentinel fusion sign.”1,2,6 Deeply seating interbody implants, instead of resting them more widely on the apophyseal ring of the vertebral endplate, may also lead to subsidence.4,12 The issue of identifying a sentinel fusion sign is relevant only if the surgeon tries to create one. In the present study, the implant used was an impacted cage positioned on the apophyseal perimeter of the disc space, just slightly recessed, so there was no attempt to create a sentinel fusion sign, as reflected in the relatively low scores on anterior osseous bridging (48%, 52%).
Subsidence and peri-implant lysis are pathologic variables associated with motion and bone loss. Sethi and colleagues19 noted a high percentage of endplate resorption and subsidence in cases reviewed using PEEK or allograft spacers paired with BMP-2. Although BMP-2 was used in the present study, we found very low rates of subsidence (0%, 5%) and no significant peri-implant lucencies (2%, 4%) (Figure 2). Interobserver agreement for these variables was high (0.95, 0.96). We hypothesize that the combination of endplate-sparing surgical technique and implant–bone integration contributed to these results.
Trabecular Bone and Fusion Grade
The primary radiographic criterion for solid interbody fusion is trabecular bone throughout the cage, bridging the vertebral bodies. In our study, the success rates for this variable were 96% and 100%, and there was very high interobserver agreement (0.96) (Figure 3). This very high fusion rate may preclude detecting subtle differences in interobserver agreement, but to what degree, if any, is unknown. Other investigators have effectively identified trabecular bone across the interspace and throughout the cages.6,18 The openings for bone formation were larger in the implants they used than in first-generation fusion cages but not as large as the implant openings in the present study. Larger openings may correlate with improved ability to visualize bridging bone on CT.
Radiologists and surgeons must ultimately arrive at a conclusion regarding the likelihood a fusion has occurred. Our radiologists integrated all the separate radiologic variables cited here, as well as their overall impressions of the scans, to arrive at a final grade regarding fusion quality (Figures 3, 4). Although this category provides the most interpretive latitude of all the variables examined, the results demonstrate high interobserver reliability. Agreement to exactly the same fusion grade was 0.77, and agreement to within 1 category grade was 0.95.
This study had several limitations. Surgical explorations were not clinically indicated and were not performed. There were no suspected nonunions or hardware complications, two of the most common indications for exploration. In addition, this study was conducted not to determine specific accuracy of CT (compared with surgery exploration) for fusion assessment but to assess interobserver reliability. The clinical success rates for this population were high, and no patient required revision surgery for suspected pseudarthrosis. To assess the true accuracy of CT for fusion assessment, one would have to subject patients to follow-up exploratory surgery to test fusions mechanically.
Another limitation is the lack of a single industry-accepted radiographic fusion grading system. Fusion criteria are not standardized across all studies. Our radiologists have extensive research experience and limit their practices to neuromuscular radiology with a concentration on the spine. The radiographic criteria cited here are the same criteria they use in clinical practice, when reviewing CT scans for clinicians. Last, there was no control group for direct comparison against other cages. Historical controls were cited. This does not adversely affect the conclusions of this investigation.
Conclusion
Clinicians have been reluctant to rely on CT with titanium devices because of concerns about the accuracy of image interpretations. The interbody device used in this study demonstrated minimal artifact and minimal subsidence, and trabecular bone was easily identified throughout the implant in the majority of cases reviewed. We found high interobserver agreement scores across all fusion criteria. Although surgical exploration remains the gold standard for fusion assessment, surgeons should have confidence in using CT with this titanium implant.
1. Gilbert TJ, Heithoff KB, Mullin WJ. Radiographic assessment of cage-assisted interbody fusions in the lumbar spine. Semin Spine Surg. 2001;13:311-315.
2. Heithoff KB, Mullin WJ, Renfrew DL, Gilbert TJ. The failure of radiographic detection of pseudarthrosis in patients with titanium lumbar interbody fusion cages. In: Proceedings of the 14th Annual Meeting of the North American Spine Society; October 20-23, 1999; Chicago, IL. Abstract 14.
3. Cizek GR, Boyd LM. Imaging pitfalls of interbody implants. Spine. 2000;25(20):2633-2636.
4. Dorchak JD, Burkus JK, Foor BD, Sanders DL. Dual paired proximity and combined BAK/proximity interbody fusion cages: radiographic results. In: Proceedings of the 15th Annual Meeting of the North American Spine Society. New Orleans, LA: North American Spine Society; 2000:83-85.
5. Santos ER, Goss DG, Morcom RK, Fraser RD. Radiologic assessment of interbody fusion using carbon fiber cages. Spine. 2003;28(10):997-1001.
6. Carreon LY, Glassman SD, Schwender JD, Subach BR, Gornet MF, Ohno S. Reliability and accuracy of fine-cut computed tomography scans to determine the status of anterior interbody fusions with metallic cages. Spine J. 2008;8(6):998-1002.
7. Fogel GR, Toohey JS, Neidre A, Brantigan JW. Fusion assessment of posterior lumbar interbody fusion using radiolucent cages: x-ray films and helical computed tomography scans compared with surgical exploration of fusion. Spine J. 2008;8(4):570-577.
8. Selby MD, Clark SR, Hall DJ, Freeman BJ. Radiologic assessment of spinal fusion. J Am Acad Orthop Surg. 2012;20(11):694-703.
9. Chafetz N, Cann CE, Morris JM, Steinbach LS, Goldberg HI, Ax L. Pseudarthrosis following lumbar fusion: detection by direct coronal CT scanning. Radiology. 1987;162(3):803-805.
10. Landis RJ, Koch GG. The measurement of observer agreement for categorical data. Biometrics. 1977;33(1):159-174.
11. Viera AJ, Garrett JM. Understanding interobserver agreement; the kappa statistic. Fam Med. 2005;37(5):360-363.
12. Burkus JK, Foley K, Haid RW, Lehuec JC. Surgical Interbody Research Group—radiographic assessment of interbody fusion devices: fusion criteria for anterior lumbar interbody surgery. Neurosurg Focus. 2001;10(4):E11.
13. Albrektsson T, Zarb G, Worthington P, Eriksson AR. The long-term efficacy of currently used dental implants: a review and proposed criteria of success. Int J Oral Maxillofac Implants. 1986;1(1):11-25.
14. De Leonardis D, Garg AK, Pecora GE. Osseointegration of rough acid-etched titanium implants: 5-year follow-up of 100 Minimatic implants. Int J Oral Maxillofac Implants. 1999;14(3):384-391.
15. Schwartz Z, Raz P, Zhao G, et al. Effect of micrometer-scale roughness on the surface of Ti6Al4V pedicle screws in vitro and in vivo. J Bone Joint Surg Am. 2008;90(11):2485-2498.
16. Olivares-Navarrete R, Gittens RA, Schneider JM, et al. Osteoblasts exhibit a more differentiated phenotype and increased bone morphogenetic protein production on titanium alloy substrates than on poly-ether-ether-ketone. Spine J. 2012;12(3):265-272.
17. Olivares-Navarrete R, Hyzy SL, Gittens RA 1st, et al. Rough titanium alloys regulate osteoblast production of angiogenic factors. Spine J. 2013;13(11):1563-1570.
18. Burkus JK, Dorchak JD, Sanders DL. Radiographic assessment of interbody fusion using recombinant human bone morphogenetic protein type 2. Spine. 2003;28(4):372-377.
19. Sethi A, Craig J, Bartol S, et al. Radiographic and CT evaluation of recombinant human bone morphogenetic protein-2–assisted spinal interbody fusion. AJR Am J Roentgenol. 2011;197(1):W128-W133.
Biomechanical Comparison of Hamstring Tendon Fixation Devices for Anterior Cruciate Ligament Reconstruction: Part 2. Four Tibial Devices
Of the procedures performed by surgeons specializing in sports medicine and by general orthopedists, anterior cruciate ligament (ACL) reconstruction remains one of the most common.1 Recent years have seen a trend toward replacing the “gold standard” of bone–patellar tendon–bone autograft with autograft or allograft hamstring tendon in ACL reconstruction.2 This shift is being made to try to avoid the donor-site morbidity of patellar tendon autografts and decrease the incidence of postoperative anterior knee pain. With increased use of hamstring grafts in ACL reconstruction, it is important to determine the strength of different methods of graft fixation.
Rigid fixation of hamstring grafts is recognized as a crucial factor in the long-term success of ACL reconstruction. Grafts must withstand early rehabilitation forces as high as 500 N.2 There is therefore much concern about the strength of tibial fixation, given the lower bone density of the tibial metaphysis versus the femoral metaphysis. In addition, stability is more a concern in the tibia, as the forces are directly in line with the tibial tunnel.3,4
The challenge has been to engineer devices that provide stable, rigid graft fixation that allows expeditious tendon-to-bone healing and increased construct stiffness. Many new fixation devices are being marketed. There is much interest in determining which devices have the most fixation strength,4-9 but so far several products have not been compared with one another.
We conducted a study to determine if tibial hamstring fixation devices used in ACL reconstruction differ in fixation strength. We hypothesized we would find no differences.
Materials and Methods
Forty porcine tibias were harvested after the animals had been euthanized for other studies at our institution. Our study was approved by the institutional animal care and use committee. Specimens were stored at –25°C and, on day of testing, thawed to room temperature. Gracilis and semitendinosus tendon grafts were donated by a tissue bank (LifeNet Health, Virginia Beach, Virginia). The grafts were stored at –25°C; on day of testing, tendons were thawed to room temperature.
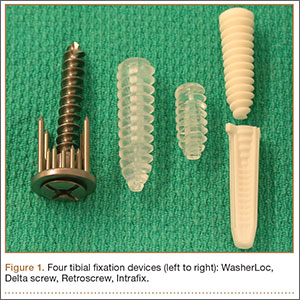
We evaluated 4 different tibial fixation devices (Figure 1): Delta screw and Retroscrew (Arthrex, Naples, Florida), WasherLoc (Arthrotek, Warsaw, Indiana), and Intrafix (Depuy Mitek, Raynham, Massachusetts). For each device, 10 ACL fixation constructs were tested.
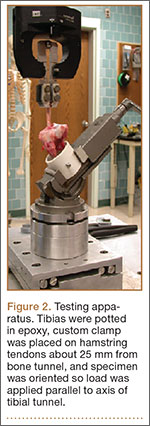
Quadrupled human semitendinosus–gracilis tendon grafts were fixed into the tibias using the 4 tibial fixation devices. All fixations were done according to manufacturer specifications. All interference screws were placed eccentrically. The testing apparatus and procedure are described in an article by Kousa and colleagues.6 The specimens were mounted on the mechanical testing apparatus by threaded bars and custom clamps to secure fixation (Figure 2). Constant tension was maintained on all 4 strands of the hamstring grafts to equalize the tendons. After the looped end of the hamstring graft was secured by clamps, 25 mm of graft was left between the clamp and the intra-articular tunnel.
In the cyclic loading test, the load was applied parallel to the long axis of the tibial tunnel. A 50-N preload was initially applied to each specimen for 10 seconds. Subsequently, 1500 loading cycles between 50 N and 200 N at a rate of 1 cycle per 120 seconds were performed. Standard force-displacement curves were then generated. Each tibial fixation device underwent 10 cyclic loading tests. Specimens surviving the cyclic loading then underwent a single-cycle load-to-failure (LTF) test in which the load was applied parallel to the long axis of the drill hole at a rate of 50 mm per minute.
Residual displacement, stiffness, and ultimate LTF data were recorded from the force-displacement curves. Residual displacement data were generated from the cyclic loading test; residual displacement was determined by subtracting preload displacement from displacement at 1, 10, 50, 100, 250, 500, 1000, and 1500 cycles. Stiffness data were generated from the single-cycle LTF test; stiffness was defined as the linear region slope of the force-displacement curve corresponding to the steepest straight-line tangent to the loading curve. Ultimate LTF (yield load) data were generated from the single-cycle LTF test; ultimate LTF was defined as the load at the point where the slope of the load displacement curve initially decreases.
Statistical analysis generated standard descriptive statistics: means, standard deviations, and proportions. One-way analysis of variance (ANOVA) was used to determine any statistically significant differences in stiffness, yield load, and residual displacement between the different fixation devices. Differences in force (load) between the single cycle and the cyclic loading test were determined by ANOVA. P < .05 was considered statistically significant for all tests.
Results
The modes of failure for the devices were similar. In all 10 tests, Intrafix was pulled through the tunnel with the hamstring allografts. WasherLoc failed in each test, with the tendons eventually being pulled through the washer and thus out through the tunnel. Delta screw and Retroscrew both failed with slippage of the fixation device and the tendons pulled out through the tunnel.
For the cyclic loading tests, 8 of the 10 Delta screws and only 2 of the 10 Retroscrews completed the 1500-cycle loading test before failure. The 2 Delta screws that did not complete the testing failed after about 500 cycles, and the 8 Retroscrews that did not complete the testing failed after about 250 cycles. All 10 WasherLoc and Intrafix devices completed the testing.
Residual displacement data were calculated from the cyclic loading tests (Table). Mean (SS) residual displacement was lowest for Intrafix at 2.9 (1.2) mm, followed by WasherLoc at 5.6 (2.2) mm and Delta at 6.4 (3.3) mm. Retroscrew at 25.5 (11.0) mm had the highest residual displacement, though only 2 completed the cyclic tests. Intrafix, WasherLoc, and Delta were not statistically different, but there was a statistical difference between Retroscrew and the other devices (P < .001).

Stiffness data were calculated from the LTF tests (Table). Mean (SD) stiffness was highest for Intrafix at 129 (32.7) N/mm, followed by WasherLoc at 97 (11.6) N/mm, Delta at 93 (9.5) N/mm, and Retroscrew at 80.2 (8.8) N/mm. Intrafix had statistically higher stiffness compared with WasherLoc (P < .05), Delta (P < .01), and Retroscrew (P < .05). There were no significant differences in stiffness among WasherLoc, Delta, and Retroscrew.
Mean (SD) ultimate LTF was highest for Intrafix at 656 (182.6) N, followed by WasherLoc at 630 (129.3) N, Delta at 430 (90.0) N, and Retroscrew at 285 (33.8) N (Table). There were significant differences between Intrafix and Delta (P < .05) and Retroscrew (P < .05). WasherLoc failed at a significantly higher load compared with Delta (P < .05) and Retroscrew (P < .05). There were no significant differences in mean LTF between Intrafix and WasherLoc.
Discussion
In this biomechanical comparison of 4 different tibial fixation devices, Intrafix had results superior to those of the other implants. Intrafix failed at higher LTF and lower residual displacement and had higher stiffness. WasherLoc performed well and had LTF similar to that of Intrafix. The interference screws performed poorly with respect to LTF, residual displacement, and stiffness, and a large proportion of them failed early into cyclic loading.
Intrafix is a central fixation device that uses a 4-quadrant sleeve and a screw to establish tensioning across all 4 hamstring graft strands. The theory is this configuration increases the contact area between graft and bone for proper integration of graft into bone. Intrafix has performed well in other biomechanical studies. Using a study design similar to ours, Kousa and colleagues7 found the performance of Intrafix to be superior to that of other devices, including interference screws and WasherLoc. Starch and colleagues10 reported that, compared with a standard interference screw, Intrafix required significantly higher load to cause a millimeter of graft laxity. They concluded that this demonstrates superior fixation strength and reduced laxity of the graft after cyclic loading. Coleridge and Amis4 found that, compared with WasherLoc and various interference screws, Intrafix had the lower residual displacement. However, they also found that, compared with Intrafix and interference screws, WasherLoc had the highest ultimate tensile strength. Their findings may be difficult to compare with ours, as they tested fixation of calf extensor tendons, and we tested human hamstring grafts.
An important concern in the present study was the poor performance of the interference screws. Other authors recently expressed concern with using interference screws in soft-tissue ACL grafts—based on biomechanical study results of increased slippage, bone tunnel widening, and less strength.11 Delta screws and Retroscrews have not been specifically evaluated, and their fixation strengths have not been directly compared with those of other devices. In the present study, Delta screws and Retroscrews consistently performed the poorest with respect to ultimate LTF, residual displacement, and stiffness. Twenty percent of the Delta screws and 80% of the Retroscrews did not complete 1500 cycles. The poor performance of the interference screws was echoed in studies by Magen and colleagues12 and Kousa and colleagues,7 in which the only complete failures were in the cyclic loading of the interference screws.
Three possible confounding factors may have affected the performance of the interference screws: bone density of porcine tibia, length of interference screw, and location of screw placement. In addition, in clinical practice these screws may be used with other modes of graft fixation. Combined fixation (interference screws, other devices) was not evaluated in this study.
Porcine models have been used in many biomechanical graft fixation studies.4,6,7,12,13 Some authors have found porcine tibia to be a poor substitute for human cadaver tibia because the volumetric density of porcine bone is higher than that of human bone.14,15 Other authors have demonstrated fairly similar bone density between human and porcine tibia.16 The concern is that interference screw fixation strength correlates with the density of the bone in which screws are fixed.17 Therefore, one limitation of our study is that we did not determine the bone density of the porcine tibias for comparison with that of young human tibias.
Another important variable that could have affected the performance of the interference screws is screw length. One study found no significant difference in screw strength between various lengths, and longer screws failed to protect against graft slippage.18 However, Selby and colleagues19 found that, compared with 28-mm screws, 35-mm bioabsorbable interference screws failed at higher LTF. This is in part why we selected 35-mm Delta screws for our study. Both 35-mm Delta screws and 20-mm Retroscrews performed poorly. However, we could not determine if the poorer performance of Retroscrews was related to their length.
We used an eccentric placement for our interference screws. Although some studies have suggested concentric placement might improve fixation strength by increasing bone–tendon contact,20 Simonian and colleagues21 found no difference in graft slippage or ultimate LTF between eccentrically and concentrically placed screws. Although they were not biomechanically tested in our study, a few grafts were fixed with concentrically placed screws, and these tendons appeared to be more clinically damaged than the eccentrically placed screws.
Combined tibial fixation techniques may be used in clinical practice, but we did not evaluate them in our study. Yoo and colleagues9 compared interference screw, interference screw plus cortical screw and spiked washer, and cortical screw and spiked washer alone. They found that stiffness nearly doubled, residual displacement was less, and ultimate LTF was significantly higher in the group with interference screw plus cortical screw and spiked washer. In a similar study, Walsh and colleagues13 demonstrated improved stiffness and LTF in cyclic testing with the combination of retrograde interference screw and suture button over interference screw alone. Further study may include direct comparisons of additional tibial fixation techniques using more than one device. Cost analysis of use of additional fixation devices would be beneficial as well.
Study results have clearly demonstrated that tibial fixation is the weak point in ACL reconstruction3,17 and that early aggressive rehabilitation can help restore range of motion, strength, and function.22,23 Implants that can withstand early loads during rehabilitation periods are therefore of utmost importance.
Conclusion
Intrafix demonstrated superior strength in the fixation of hamstring grafts in the tibia, followed closely by WasherLoc. When used as the sole tibial fixation device, interference screws had low LTF, decreased stiffness, and high residual displacement, which may have clinical implications for early rehabilitation after ACL reconstruction.
1. Garrett WE Jr, Swiontkowski MF, Weinsten JN, et al. American Board of Orthopaedic Surgery Practice of the Orthopaedic Surgeon: part-II, certification examination case mix. J Bone Joint Surg Am. 2006;88(3):660-667.
2. West RV, Harner CD. Graft selection in anterior cruciate ligament reconstruction. J Am Acad Orthop Surg. 2005;13(3):197-207.
3. Brand J Jr, Weiler A, Caborn DN, Brown CH Jr, Johnson DL. Graft fixation in cruciate ligament reconstruction. Am J Sports Med. 2000;28(5):761-774.
4. Coleridge SD, Amis AA. A comparison of five tibial-fixation systems in hamstring-graft anterior cruciate ligament reconstruction. Knee Surg Sports Traumatol Arthrosc. 2004;12(5):391-397.
5. Fabbriciani C, Mulas PD, Ziranu F, Deriu L, Zarelli D, Milano G. Mechanical analysis of fixation methods for anterior cruciate ligament reconstruction with hamstring tendon graft. An experimental study in sheep knees. Knee. 2005;12(2):135-138.
6. Kousa P, Järvinen TL, Vihavainen M, Kannus P, Järvinen M. The fixation strength of six hamstring tendon graft fixation devices in anterior cruciate ligament reconstruction. Part I: femoral site. Am J Sports Med. 2003;31(2):174-181.
7. Kousa P, Järvinen TL, Vihavainen M, Kannus P, Järvinen M. The fixation strength of six hamstring tendon graft fixation devices in anterior cruciate ligament reconstruction. Part II: tibial site. Am J Sports Med. 2003;31(2):182-188.
8. Weiler A, Hoffmann RF, Stähelin AC, Bail HJ, Siepe CJ, Südkamp NP. Hamstring tendon fixation using interference screws: a biomechanical study in calf tibial bone. Arthroscopy. 1998;14(1):29-37.
9. Yoo JC, Ahn JH, Kim JH, et al. Biomechanical testing of hybrid hamstring graft tibial fixation in anterior cruciate ligament reconstruction. Knee. 2006;13(6):455-459.
10. Starch DW, Alexander JW, Noble PC, Reddy S, Lintner DM. Multistranded hamstring tendon graft fixation with a central four-quadrant or a standard tibial interference screw for anterior cruciate ligament reconstruction. Am J Sports Med. 2003;31(3):338-344.
11. Prodromos CC, Fu FH, Howell SM, Johnson DH, Lawhorn K. Controversies in soft-tissue anterior cruciate ligament reconstruction: grafts, bundles, tunnels, fixation, and harvest. J Am Acad Orthop Surg. 2008;16(7):376-384.
12. Magen HE, Howell SM, Hull ML. Structural properties of six tibial fixation methods for anterior cruciate ligament soft tissue grafts. Am J Sports Med. 1999;27(1):35-43.
13. Walsh MP, Wijdicks CA, Parker JB, Hapa O, LaPrade RF. A comparison between a retrograde interference screw, suture button, and combined fixation on the tibial side in an all-inside anterior cruciate ligament reconstruction: a biomechanical study in a porcine model. Am J Sports Med. 2009;37(1):160-167.
14. Nurmi JT, Järvinen TL, Kannus P, Sievänen H, Toukosalo J, Järvinen M. Compaction versus extraction drilling for fixation of the hamstring tendon graft in anterior cruciate ligament reconstruction. Am J Sports Med. 2002;30(2):167-173.
15. Nurmi JT, Sievänen H, Kannus P, Järvinen M, Järvinen TL. Porcine tibia is a poor substitute for human cadaver tibia for evaluating interference screw fixation. Am J Sports Med. 2004;32(3):765-771.
16. Nagarkatti DG, McKeon BP, Donahue BS, Fulkerson JP. Mechanical evaluation of a soft tissue interference screw in free tendon anterior cruciate ligament graft fixation. Am J Sports Med. 2001;29(1):67-71.
17. Brand JC Jr, Pienkowski D, Steenlage E, Hamilton D, Johnson DL, Caborn DN. Interference screw fixation strength of a quadrupled hamstring tendon graft is directly related to bone mineral density and insertion torque. Am J Sports Med. 2000;28(5):705-710.
18. Stadelmaier DM, Lowe WR, Ilahi OA, Noble PC, Kohl HW 3rd. Cyclic pull-out strength of hamstring tendon graft fixation with soft tissue interference screws. Influence of screw length. Am J Sports Med. 1999;27(6):778-783.
19. Selby JB, Johnson DL, Hester P, Caborn DN. Effect of screw length on bioabsorbable interference screw fixation in a tibial bone tunnel. Am J Sports Med. 2001;29(5):614-619.
20. Shino K, Pflaster DS. Comparison of eccentric and concentric screw placement for hamstring graft fixation in the tibial tunnel. Knee Surg Sports Traumatol Arthrosc. 2000;8(2):73-75.
21. Simonian PT, Sussmann PS, Baldini TH, Crockett HC, Wickiewicz TL. Interference screw position and hamstring graft location for anterior cruciate ligament reconstruction. Arthroscopy. 1998;14(5):459-464.
22. Shelbourne KD, Nitz P. Accelerated rehabilitation after anterior cruciate ligament reconstruction. Am J Sports Med. 1990;18(3):292-299.
23. Shelbourne KD, Wilckens JH. Current concepts in anterior cruciate ligament rehabilitation. Orthop Rev. 1990;19(11):957-964.
Of the procedures performed by surgeons specializing in sports medicine and by general orthopedists, anterior cruciate ligament (ACL) reconstruction remains one of the most common.1 Recent years have seen a trend toward replacing the “gold standard” of bone–patellar tendon–bone autograft with autograft or allograft hamstring tendon in ACL reconstruction.2 This shift is being made to try to avoid the donor-site morbidity of patellar tendon autografts and decrease the incidence of postoperative anterior knee pain. With increased use of hamstring grafts in ACL reconstruction, it is important to determine the strength of different methods of graft fixation.
Rigid fixation of hamstring grafts is recognized as a crucial factor in the long-term success of ACL reconstruction. Grafts must withstand early rehabilitation forces as high as 500 N.2 There is therefore much concern about the strength of tibial fixation, given the lower bone density of the tibial metaphysis versus the femoral metaphysis. In addition, stability is more a concern in the tibia, as the forces are directly in line with the tibial tunnel.3,4
The challenge has been to engineer devices that provide stable, rigid graft fixation that allows expeditious tendon-to-bone healing and increased construct stiffness. Many new fixation devices are being marketed. There is much interest in determining which devices have the most fixation strength,4-9 but so far several products have not been compared with one another.
We conducted a study to determine if tibial hamstring fixation devices used in ACL reconstruction differ in fixation strength. We hypothesized we would find no differences.
Materials and Methods
Forty porcine tibias were harvested after the animals had been euthanized for other studies at our institution. Our study was approved by the institutional animal care and use committee. Specimens were stored at –25°C and, on day of testing, thawed to room temperature. Gracilis and semitendinosus tendon grafts were donated by a tissue bank (LifeNet Health, Virginia Beach, Virginia). The grafts were stored at –25°C; on day of testing, tendons were thawed to room temperature.
We evaluated 4 different tibial fixation devices (Figure 1): Delta screw and Retroscrew (Arthrex, Naples, Florida), WasherLoc (Arthrotek, Warsaw, Indiana), and Intrafix (Depuy Mitek, Raynham, Massachusetts). For each device, 10 ACL fixation constructs were tested.
Quadrupled human semitendinosus–gracilis tendon grafts were fixed into the tibias using the 4 tibial fixation devices. All fixations were done according to manufacturer specifications. All interference screws were placed eccentrically. The testing apparatus and procedure are described in an article by Kousa and colleagues.6 The specimens were mounted on the mechanical testing apparatus by threaded bars and custom clamps to secure fixation (Figure 2). Constant tension was maintained on all 4 strands of the hamstring grafts to equalize the tendons. After the looped end of the hamstring graft was secured by clamps, 25 mm of graft was left between the clamp and the intra-articular tunnel.
In the cyclic loading test, the load was applied parallel to the long axis of the tibial tunnel. A 50-N preload was initially applied to each specimen for 10 seconds. Subsequently, 1500 loading cycles between 50 N and 200 N at a rate of 1 cycle per 120 seconds were performed. Standard force-displacement curves were then generated. Each tibial fixation device underwent 10 cyclic loading tests. Specimens surviving the cyclic loading then underwent a single-cycle load-to-failure (LTF) test in which the load was applied parallel to the long axis of the drill hole at a rate of 50 mm per minute.
Residual displacement, stiffness, and ultimate LTF data were recorded from the force-displacement curves. Residual displacement data were generated from the cyclic loading test; residual displacement was determined by subtracting preload displacement from displacement at 1, 10, 50, 100, 250, 500, 1000, and 1500 cycles. Stiffness data were generated from the single-cycle LTF test; stiffness was defined as the linear region slope of the force-displacement curve corresponding to the steepest straight-line tangent to the loading curve. Ultimate LTF (yield load) data were generated from the single-cycle LTF test; ultimate LTF was defined as the load at the point where the slope of the load displacement curve initially decreases.
Statistical analysis generated standard descriptive statistics: means, standard deviations, and proportions. One-way analysis of variance (ANOVA) was used to determine any statistically significant differences in stiffness, yield load, and residual displacement between the different fixation devices. Differences in force (load) between the single cycle and the cyclic loading test were determined by ANOVA. P < .05 was considered statistically significant for all tests.
Results
The modes of failure for the devices were similar. In all 10 tests, Intrafix was pulled through the tunnel with the hamstring allografts. WasherLoc failed in each test, with the tendons eventually being pulled through the washer and thus out through the tunnel. Delta screw and Retroscrew both failed with slippage of the fixation device and the tendons pulled out through the tunnel.
For the cyclic loading tests, 8 of the 10 Delta screws and only 2 of the 10 Retroscrews completed the 1500-cycle loading test before failure. The 2 Delta screws that did not complete the testing failed after about 500 cycles, and the 8 Retroscrews that did not complete the testing failed after about 250 cycles. All 10 WasherLoc and Intrafix devices completed the testing.
Residual displacement data were calculated from the cyclic loading tests (Table). Mean (SS) residual displacement was lowest for Intrafix at 2.9 (1.2) mm, followed by WasherLoc at 5.6 (2.2) mm and Delta at 6.4 (3.3) mm. Retroscrew at 25.5 (11.0) mm had the highest residual displacement, though only 2 completed the cyclic tests. Intrafix, WasherLoc, and Delta were not statistically different, but there was a statistical difference between Retroscrew and the other devices (P < .001).
Stiffness data were calculated from the LTF tests (Table). Mean (SD) stiffness was highest for Intrafix at 129 (32.7) N/mm, followed by WasherLoc at 97 (11.6) N/mm, Delta at 93 (9.5) N/mm, and Retroscrew at 80.2 (8.8) N/mm. Intrafix had statistically higher stiffness compared with WasherLoc (P < .05), Delta (P < .01), and Retroscrew (P < .05). There were no significant differences in stiffness among WasherLoc, Delta, and Retroscrew.
Mean (SD) ultimate LTF was highest for Intrafix at 656 (182.6) N, followed by WasherLoc at 630 (129.3) N, Delta at 430 (90.0) N, and Retroscrew at 285 (33.8) N (Table). There were significant differences between Intrafix and Delta (P < .05) and Retroscrew (P < .05). WasherLoc failed at a significantly higher load compared with Delta (P < .05) and Retroscrew (P < .05). There were no significant differences in mean LTF between Intrafix and WasherLoc.
Discussion
In this biomechanical comparison of 4 different tibial fixation devices, Intrafix had results superior to those of the other implants. Intrafix failed at higher LTF and lower residual displacement and had higher stiffness. WasherLoc performed well and had LTF similar to that of Intrafix. The interference screws performed poorly with respect to LTF, residual displacement, and stiffness, and a large proportion of them failed early into cyclic loading.
Intrafix is a central fixation device that uses a 4-quadrant sleeve and a screw to establish tensioning across all 4 hamstring graft strands. The theory is this configuration increases the contact area between graft and bone for proper integration of graft into bone. Intrafix has performed well in other biomechanical studies. Using a study design similar to ours, Kousa and colleagues7 found the performance of Intrafix to be superior to that of other devices, including interference screws and WasherLoc. Starch and colleagues10 reported that, compared with a standard interference screw, Intrafix required significantly higher load to cause a millimeter of graft laxity. They concluded that this demonstrates superior fixation strength and reduced laxity of the graft after cyclic loading. Coleridge and Amis4 found that, compared with WasherLoc and various interference screws, Intrafix had the lower residual displacement. However, they also found that, compared with Intrafix and interference screws, WasherLoc had the highest ultimate tensile strength. Their findings may be difficult to compare with ours, as they tested fixation of calf extensor tendons, and we tested human hamstring grafts.
An important concern in the present study was the poor performance of the interference screws. Other authors recently expressed concern with using interference screws in soft-tissue ACL grafts—based on biomechanical study results of increased slippage, bone tunnel widening, and less strength.11 Delta screws and Retroscrews have not been specifically evaluated, and their fixation strengths have not been directly compared with those of other devices. In the present study, Delta screws and Retroscrews consistently performed the poorest with respect to ultimate LTF, residual displacement, and stiffness. Twenty percent of the Delta screws and 80% of the Retroscrews did not complete 1500 cycles. The poor performance of the interference screws was echoed in studies by Magen and colleagues12 and Kousa and colleagues,7 in which the only complete failures were in the cyclic loading of the interference screws.
Three possible confounding factors may have affected the performance of the interference screws: bone density of porcine tibia, length of interference screw, and location of screw placement. In addition, in clinical practice these screws may be used with other modes of graft fixation. Combined fixation (interference screws, other devices) was not evaluated in this study.
Porcine models have been used in many biomechanical graft fixation studies.4,6,7,12,13 Some authors have found porcine tibia to be a poor substitute for human cadaver tibia because the volumetric density of porcine bone is higher than that of human bone.14,15 Other authors have demonstrated fairly similar bone density between human and porcine tibia.16 The concern is that interference screw fixation strength correlates with the density of the bone in which screws are fixed.17 Therefore, one limitation of our study is that we did not determine the bone density of the porcine tibias for comparison with that of young human tibias.
Another important variable that could have affected the performance of the interference screws is screw length. One study found no significant difference in screw strength between various lengths, and longer screws failed to protect against graft slippage.18 However, Selby and colleagues19 found that, compared with 28-mm screws, 35-mm bioabsorbable interference screws failed at higher LTF. This is in part why we selected 35-mm Delta screws for our study. Both 35-mm Delta screws and 20-mm Retroscrews performed poorly. However, we could not determine if the poorer performance of Retroscrews was related to their length.
We used an eccentric placement for our interference screws. Although some studies have suggested concentric placement might improve fixation strength by increasing bone–tendon contact,20 Simonian and colleagues21 found no difference in graft slippage or ultimate LTF between eccentrically and concentrically placed screws. Although they were not biomechanically tested in our study, a few grafts were fixed with concentrically placed screws, and these tendons appeared to be more clinically damaged than the eccentrically placed screws.
Combined tibial fixation techniques may be used in clinical practice, but we did not evaluate them in our study. Yoo and colleagues9 compared interference screw, interference screw plus cortical screw and spiked washer, and cortical screw and spiked washer alone. They found that stiffness nearly doubled, residual displacement was less, and ultimate LTF was significantly higher in the group with interference screw plus cortical screw and spiked washer. In a similar study, Walsh and colleagues13 demonstrated improved stiffness and LTF in cyclic testing with the combination of retrograde interference screw and suture button over interference screw alone. Further study may include direct comparisons of additional tibial fixation techniques using more than one device. Cost analysis of use of additional fixation devices would be beneficial as well.
Study results have clearly demonstrated that tibial fixation is the weak point in ACL reconstruction3,17 and that early aggressive rehabilitation can help restore range of motion, strength, and function.22,23 Implants that can withstand early loads during rehabilitation periods are therefore of utmost importance.
Conclusion
Intrafix demonstrated superior strength in the fixation of hamstring grafts in the tibia, followed closely by WasherLoc. When used as the sole tibial fixation device, interference screws had low LTF, decreased stiffness, and high residual displacement, which may have clinical implications for early rehabilitation after ACL reconstruction.
1. Garrett WE Jr, Swiontkowski MF, Weinsten JN, et al. American Board of Orthopaedic Surgery Practice of the Orthopaedic Surgeon: part-II, certification examination case mix. J Bone Joint Surg Am. 2006;88(3):660-667.
2. West RV, Harner CD. Graft selection in anterior cruciate ligament reconstruction. J Am Acad Orthop Surg. 2005;13(3):197-207.
3. Brand J Jr, Weiler A, Caborn DN, Brown CH Jr, Johnson DL. Graft fixation in cruciate ligament reconstruction. Am J Sports Med. 2000;28(5):761-774.
4. Coleridge SD, Amis AA. A comparison of five tibial-fixation systems in hamstring-graft anterior cruciate ligament reconstruction. Knee Surg Sports Traumatol Arthrosc. 2004;12(5):391-397.
5. Fabbriciani C, Mulas PD, Ziranu F, Deriu L, Zarelli D, Milano G. Mechanical analysis of fixation methods for anterior cruciate ligament reconstruction with hamstring tendon graft. An experimental study in sheep knees. Knee. 2005;12(2):135-138.
6. Kousa P, Järvinen TL, Vihavainen M, Kannus P, Järvinen M. The fixation strength of six hamstring tendon graft fixation devices in anterior cruciate ligament reconstruction. Part I: femoral site. Am J Sports Med. 2003;31(2):174-181.
7. Kousa P, Järvinen TL, Vihavainen M, Kannus P, Järvinen M. The fixation strength of six hamstring tendon graft fixation devices in anterior cruciate ligament reconstruction. Part II: tibial site. Am J Sports Med. 2003;31(2):182-188.
8. Weiler A, Hoffmann RF, Stähelin AC, Bail HJ, Siepe CJ, Südkamp NP. Hamstring tendon fixation using interference screws: a biomechanical study in calf tibial bone. Arthroscopy. 1998;14(1):29-37.
9. Yoo JC, Ahn JH, Kim JH, et al. Biomechanical testing of hybrid hamstring graft tibial fixation in anterior cruciate ligament reconstruction. Knee. 2006;13(6):455-459.
10. Starch DW, Alexander JW, Noble PC, Reddy S, Lintner DM. Multistranded hamstring tendon graft fixation with a central four-quadrant or a standard tibial interference screw for anterior cruciate ligament reconstruction. Am J Sports Med. 2003;31(3):338-344.
11. Prodromos CC, Fu FH, Howell SM, Johnson DH, Lawhorn K. Controversies in soft-tissue anterior cruciate ligament reconstruction: grafts, bundles, tunnels, fixation, and harvest. J Am Acad Orthop Surg. 2008;16(7):376-384.
12. Magen HE, Howell SM, Hull ML. Structural properties of six tibial fixation methods for anterior cruciate ligament soft tissue grafts. Am J Sports Med. 1999;27(1):35-43.
13. Walsh MP, Wijdicks CA, Parker JB, Hapa O, LaPrade RF. A comparison between a retrograde interference screw, suture button, and combined fixation on the tibial side in an all-inside anterior cruciate ligament reconstruction: a biomechanical study in a porcine model. Am J Sports Med. 2009;37(1):160-167.
14. Nurmi JT, Järvinen TL, Kannus P, Sievänen H, Toukosalo J, Järvinen M. Compaction versus extraction drilling for fixation of the hamstring tendon graft in anterior cruciate ligament reconstruction. Am J Sports Med. 2002;30(2):167-173.
15. Nurmi JT, Sievänen H, Kannus P, Järvinen M, Järvinen TL. Porcine tibia is a poor substitute for human cadaver tibia for evaluating interference screw fixation. Am J Sports Med. 2004;32(3):765-771.
16. Nagarkatti DG, McKeon BP, Donahue BS, Fulkerson JP. Mechanical evaluation of a soft tissue interference screw in free tendon anterior cruciate ligament graft fixation. Am J Sports Med. 2001;29(1):67-71.
17. Brand JC Jr, Pienkowski D, Steenlage E, Hamilton D, Johnson DL, Caborn DN. Interference screw fixation strength of a quadrupled hamstring tendon graft is directly related to bone mineral density and insertion torque. Am J Sports Med. 2000;28(5):705-710.
18. Stadelmaier DM, Lowe WR, Ilahi OA, Noble PC, Kohl HW 3rd. Cyclic pull-out strength of hamstring tendon graft fixation with soft tissue interference screws. Influence of screw length. Am J Sports Med. 1999;27(6):778-783.
19. Selby JB, Johnson DL, Hester P, Caborn DN. Effect of screw length on bioabsorbable interference screw fixation in a tibial bone tunnel. Am J Sports Med. 2001;29(5):614-619.
20. Shino K, Pflaster DS. Comparison of eccentric and concentric screw placement for hamstring graft fixation in the tibial tunnel. Knee Surg Sports Traumatol Arthrosc. 2000;8(2):73-75.
21. Simonian PT, Sussmann PS, Baldini TH, Crockett HC, Wickiewicz TL. Interference screw position and hamstring graft location for anterior cruciate ligament reconstruction. Arthroscopy. 1998;14(5):459-464.
22. Shelbourne KD, Nitz P. Accelerated rehabilitation after anterior cruciate ligament reconstruction. Am J Sports Med. 1990;18(3):292-299.
23. Shelbourne KD, Wilckens JH. Current concepts in anterior cruciate ligament rehabilitation. Orthop Rev. 1990;19(11):957-964.
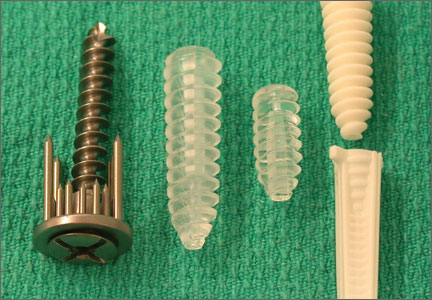
Factors Affecting Bone Growth
Differences in bone size are established early in life, before puberty and perhaps even in utero.1 Bone begins to form when mesenchymal cells form condensations—clusters of cells that adhere through expression of adhesion molecules2 (Figure 1). Bone must be stiff, flexible enough to change shape to absorb energy, and light enough to allow mobility.1,3 Longitudinal bone growth is detrimental to bone stability, but this effect is counteracted by concomitant bone growth in width.4 Bone growth in width has not been studied as extensively, despite its paramount role in skeletal development.5
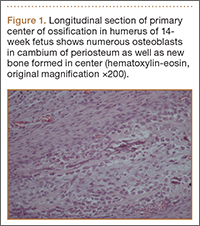
Bone growth and development are products of the complex interactions of genetic and environmental factors, including diet, hormones, and mechanical stimuli.6-9 Longitudinal bone growth is controlled by systemic and local hormones and local mechanical factors. Two models for control of bone growth in width have been suggested—the mechanostat theory (mechanical requirements regulate periosteal apposition) and the sizostat hypothesis (a master gene or set of genes regulates bone growth in width so bone reaches a preprogrammed size, independent of mechanical requirements).5
In this article, we review the most recent data regarding bone growth from the embryonic age and analyze the factors that control bone growth. An understanding of this complex system is important in identifying metabolic and developmental bone diseases10 and fracture risk.11,12
Growth Plate
The growth plate consists mainly of collagen fibrils, proteoglycans, and water, arranged to form a sort of sponge with very small pores.13 The growth plate is located between epiphyseal and metaphyseal bone at the distal end of long bones14 and is strain-rate–dependent,15,16 which means it is hard when squeezed rapidly but soft when deformed slowly. The growth plate becomes ossified after puberty and epiphyseal fusion.17
Histologically, the growth plate consists of horizontal zones of chondrocytes at different stages of differentiation.4 The germinal zone, at the epiphyseal end of the growth plate, contains resting chondrocytes, which seem crucial in orienting the underlying columns of chondrocytes and, therefore, in unidirectional bone growth, probably by secretion of a growth plate–orienting factor.14,18 Next is the proliferative zone, a matrix-rich zone in which flattened chondrocytes undergo longitudinal cell division and orient themselves in typical column-wise fashion. At some point, proliferating chondrocytes lose their capacity to divide; they start to differentiate and become prehypertrophic, coinciding with a size increase.4 Proliferating chondrocytes are located in the transition (maturation or prehypertrophic) zone. In the hypertrophic zone, round chondrocytes secrete matrix proteins in large amounts.14 This stage is characterized by an increase in intracellular calcium concentration, which is essential in the production of matrix vesicles. These vesicles, small membrane-enclosed particles, are released from chondrocytes19,20 and secrete calcium phosphates, hydroxyapatite, and matrix metalloproteinases, resulting in mineralization of the vesicles and their surrounding matrix.4 The chondrocytes in this mineralized zone eventually undergo programmed cell death (apoptosis), leaving a scaffold for new bone formation.
Longitudinal Bone Growth
Generally, bones increase in length as long as new material is being squeezed between the reserve zone of the growth plate and the zone of provisional calcification.4
Postnatal linear growth occurs in 3 phases. Phase 1 is characterized by a high rate of growth at the beginning of fetal life, and then rapid deceleration up to about 3 years; phase 2, by a lower, slowly decelerating growth rate up to puberty; and phase 3, by an increased rate of longitudinal growth until a peak is reached.14,21,22
In 1964, Park23 proposed that the structure of the epiphyseal cartilage may determine the pattern of the growing bone shaft. The changes within the hypertrophic zone are directly related to matrix mineralization, vascular invasion, and subsequent development.24 Intracellular calcium concentration increases in the hypertrophic chondrocytes in the hypertrophic zone of growth plate cartilage; at some point, these chondrocytes begin to mineralize the longitudinal septa in the surrounding matrix25 (Figure 2). At the growth cartilage junction, mononuclear cells of undetermined origin resorb the unmineralized horizontal septa of the growth cartilage. These cells are called septoclasts or chondroclasts.25,26 Blood vessels invade the area and pave the way for bone cell precursors.27 Eighty percent of the longitudinal septa of the growth cartilage is rapidly resorbed in the metaphyseal zone immediately behind the invading blood vessels, paving the way for bone cell precursors.28 Fazzalari and colleagues28 reported that about 40% of mineralized septa serves as scaffold for the formation of primary bone trabeculae; the other 60% is absorbed by chondroclasts (osteoclasts) near the vascular invasion front.
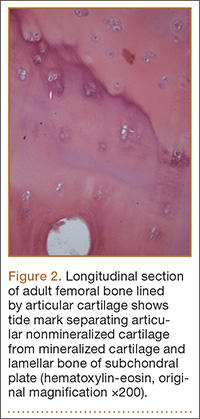
Regulation of Longitudinal Bone Growth
Longitudinal bone growth is regulated by genetic, hormonal, growth, and environment factors17,29-31 (Table). It must be controlled on at least 3 different levels.4 Level 1 is systemic control by factors such as growth hormone (GH), sex hormones, and glucocorticoids. The major systemic hormones that control longitudinal bone growth during childhood are GH, insulin-like growth factor 1 (IGF-1), the thyroid hormones triiodothyronine (T3) and thyroxine (T4), and glucocorticoids; during puberty, the sex steroids play the most significant role.14 Level 2 is local control by factors such as Indian hedgehog (Inh), parathyroid hormone–related peptide (PTHrP), and fibroblast growth factors (FGFs).14,31 Level 3 is mechanical control.4
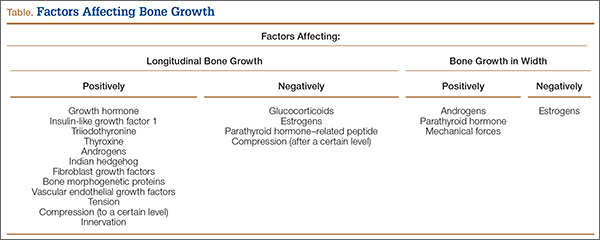
Systemic Regulation. After birth, GH becomes an important modulator of longitudinal growth and appears to be, together with IGF-1, the central player in the hypothalamus–pituitary–growth plate axis.14 According to the original somatomedin hypothesis,32 GH stimulates hepatic production of IGF-1, which in turn promotes growth directly at the epiphyseal plate.17 GH acts on resting zone chondrocytes and is responsible for local IGF-1 production, which stimulates clonal expansion of proliferating chondrocytes in an autocrine/paracrine manner.33 Infusion of GH or IGF-1 shortens stem- and proliferating-cell cycle times in the growth plate of hypophysectomized rats and decreases the duration of the hypertrophic differentiation phase, with GH being more effective.17 According to the experimental study of Hunziker and colleagues,34 GH or IGF-1 treatment restores mean cell volume and height, but the growth rate is not normalized by either hormone.
Thyroid hormones also play a vital role in bone growth. T3 and, to a lesser extent, T4 are crucial in normal bone maturation.30,35 Childhood hypothyroidism causes growth failure; growth failure may develop insidiously, but, once established, it is severe.17 On the other hand, hyperthyroidism increases the growth rate in children but also leads to premature growth plate fusion and short stature.36,37 T3 seems to stimulate recruitment of cells from the germinal zone to the proliferating zone and facilitates differentiation of growth plate chondrocytes.38-40 Its precursor, T4, increases the number of [3H]methylthymidine-labeled chondrocyte nuclei and [35S]incorporation in Snell dwarf mice growth plates, suggesting a stimulatory role in chondrocyte proliferation and differentiation.41
Glucocorticoids suppress growth by modifying the GH/IGF-1 pathway at different levels.17 Silvestrini and colleagues42 localized the glucocorticoid receptor in rat bone cells, including chondrocytes. The glucocorticoid receptor was also localized by Abu and colleagues43 in human growth plates, especially in hypertrophic chondrocytes, suggesting direct effects of glucocorticoids on the growth plate. An excess of glucocorticoids enhances bone resorption, inhibits osteoblast activity, and reduces bone matrix production to retard growth in children.44,45 Excess glucocorticoids also induce apoptosis of osteoblasts and osteocytes in rabbit trabecular bone46 and osteoblasts in rat long bones,47 resulting in an almost complete absence of new bone formation.17 In addition, glucocorticoids induce sex hormone deficiency and alter vitamin D metabolism, leading to deleterious effects on growth and skeletal integrity.48 Excess glucocorticoids modify the GH/IGF-1 pathway at different levels, suppressing growth.17 In contrast, low levels of glucocorticoids, as in familial glucocorticoid deficiency, are associated with tall stature.49
Longitudinal bone growth is also based on sex hormones, especially during puberty.17 In rats, estrogen depletion stimulates longitudinal growth, whereas estrogen administration inhibits longitudinal growth.50-52 Nilsson and colleagues53 studied ovariectomized immature rabbits treated with either estrogen or the selective estrogen receptor modulator raloxifene and found reduced chondrocyte proliferation and growth plate height as well as accelerated growth plate senescence. Many experimental studies have concluded that estrogen can inhibit longitudinal growth in the absence of GH.51,54,55
Androgens can directly influence growth plate function and may account for some skeletal differences between males and females.56-58 Unlike estrogens, androgens stimulate longitudinal growth, as shown in several studies that assessed the effect of administering nonaromatizable androgens on longitudinal growth in boys with constitutionally delayed growth.59,60
Local Regulation. Inh, a master regulator of bone development, coordinates chondrocyte proliferation, chondrocyte differentiation, and osteoblast differentiation.31 Inh belongs to the hedgehog protein family, which plays a crucial role in embryonic patterning and development.4 The proliferative effect of Inh is likely to be direct action on chondrocytes.31 In 1996, Vortkamp and colleagues61 reported that misexpression of Inh in chicken long bones blocked chondrocyte differentiation. More recently, St-Jacques and colleagues62 studied Inh-null mutant mice and found failure of both chondrocyte differentiation and osteoblast development. Inh is now thought to coordinate endochondral ossification, regulating chondrocyte proliferation and differentiation and osteoblast differentiation and coupling chondrogenesis and osteogenesis.62,63
PTHrP acts primarily to keep proliferating chondrocytes in the proliferative pool.31 Mice that did not express PTHrP showed accelerated chondrocyte differentiation leading to dwarfism.64 On the other hand, ectopic expression of PTHrP in the growth plate inhibited chondrocyte differentiation, resulting in a smaller cartilaginous skeleton compared with wild-type mice.65 PTHrP appears to regulate the rate of programmed chondrocyte differentiation in developing endochondral bone and at the level of the growth plate.64,66-69
The family of FGFs, which are major regulators of embryonic bone development, has at least 22 members.70,71 Achondroplasia, the most common type of dwarfism, is caused by an activating mutation in FGF receptor 3 (FGFR3).72-74 FGF18 deficiency also leads to delayed ossification and decreased expression of osteogenic markers.75
Bone morphogenetic proteins (BMPs) are recognized as important regulators of growth, differentiation, and morphogenesis during embryology.76 In 2001, Minina and colleagues77 showed that normal chondrocyte proliferation requires parallel signaling of both Inh and BMPs and that BMPs can inhibit chondrocyte differentiation independently of the Inh/PTHrP pathway.
Vascular endothelial growth factor (VEGF), a chemoattractant for endothelial cells, is one of the most important growth factors for endothelial cells.78 VEGF is a key player in the actions that occur during the end stage of endochondral bone formation; these actions include terminal differentiation of chondrocytes, vascular invasion, chondrocyte apoptosis, and replacement of chondrocytes with bone.27,79,80 When Gerber and colleagues27 inactivated VEGF in 24-day-old mice, they noticed suppressed blood vessel invasion and trabecular bone formation concomitant with an increased width of the hypertrophic zone.
Mechanical Regulation. Mechanical forces influence bone formation and adaptation.81 Growth rates from early infancy through late adolescence were found to be strongly correlated between an appropriate measure of mechanical loading (body size, or body weight–bone length) and bone strength (assessed by section modulus).82 The observation that compression inhibits bone growth was well known to the ancient Romans.83 In the 19th century, the Hueter-Volkmann law was proclaimed. This law is well known to pediatric orthopedic surgeons and is the basis of growth modulation for correcting angular deformities of the lower extremities and spinal deformities.4,84
If compression always inhibited bone growth, as it was believed, growth plates would be extremely unstable, as any slight deviation from the straight alignment of the long bones of the lower extremities would induce a vicious circle of positive feedback and result in catastrophic deformities.4 Mild compression leads to increased, not decreased, growth. Nevertheless, when compression on one side of the growth plate exceeds a certain level, growth is indeed suppressed, and the lesion begins to worsen.4
In 1997, Frost85 proposed using a single graph that combines the clinical observation of mechanical forces affecting longitudinal bone growth. Both mild tension and mild compression induce bone growth, whereas heavy compression inhibits growth (Figure 3).

Three rules describe bone adaptation in mathematical terms. First, bone adaptation is driven by dynamic, not static, loading. Second, only a short period of mechanical loading is needed to initiate an adaptive response (extending the loading period has a diminishing effect on further bone adaptation). Third, bone cells accommodate to a customary mechanical loading environment, making them less responsive to routine loading signals.81
Also playing a significant role in bone physiology is the nervous system, with leptin-dependent central control of bone formation via the sympathetic system.86 Several investigators have tried to determine the effect of muscle activity on bone growth in length.87 Pottorf88 in 1916 and Allison and Brooks89 in 1921 were among the first to study this correlation; they concluded that long bones grow less after denervation. On the other hand, Ring90 in 1961 reported that, despite innervation, longitudinal bone growth was increased. Investigators in more recent studies have advanced the idea that the nervous system plays a negative role in bone physiology. Dysart and colleagues87 showed that muscle pull affects periosteal tension and, consequently, bone form and growth in length. In a clinical study involving 32 children with neonatal brachial plexus injury,91 the ratio of skewness between the affected humeral head and the contralateral normal head was calculated. Skewness was determined by dividing the anterior area of the humeral head by the posterior area. There was a significant preoperative difference between the 2 sides, but the skewness ratio was significantly improved after surgery.
Bone Growth in Width
Bone growth in width has not received as much attention as longitudinal bone growth. Several studies have indicated that body mass and muscle strength have important influences on long bone strength in children and adolescents.92-97 As bone width changes only slowly after the growth period, bone growth in width is one of the most important determinants of bone strength throughout life.4 It is clear that, if bones grew in length without increasing in width, they would become unstable and break.4
Histologically, osteoblasts add mineralized tissue to the outer (periosteal) bone surface. This process is periosteal apposition.98 The periosteum has an outer layer, composed mainly of fibrous tissue, and an inner layer, the cambium, which harbors osteogenic cells.4 In children, bone formation is continuous, which is the hallmark of modeling99,100; in adults, periosteal bone may undergo cyclical resorption and formation, which are characteristic of remodeling.101,102
Macroscopically, bone grows rapidly during early life; then, growth continuously slows down until reaching a nadir during early school age.4 It is clear that wider bones must have higher midshaft periosteal apposition rates, as this is how they become wider.4,103
Regulation of Bone Growth in Width (Table)
Systemic Regulation. Periosteal apposition at diaphyseal bone sites is stimulated by androgen and GH and inhibited by estrogens.104-106 In an experimental study, Turner and colleagues104 found that androgen treatment stimulated bone formation in orchiectomized rats and suppressed bone formation in ovariectomized rats. A large dose of diethylstilbestrol also suppressed bone formation in ovariectomized rats. Parathyroid hormone is associated with faster periosteal expansion in adults, according to Parfitt.107 In addition, nutrition with high calcium intake has the same effects on children, especially those with high levels of physical activity.108
Local Regulation. Given that periosteal bone development is site-specific, whereas systemic hormones and nutrition are blind to structure,4 it is clear that local regulation is key to bone growth in width. Genetic heritage seems to have an overwhelming effect on periosteal bone development. Volkman and colleagues,109 who experimented with various genetic markers in rats, concluded that genetic control of cortical bone geometry is complex and that femoral size and shape may be influenced by different but overlapping groups of polymorphic loci.
Mechanical Regulation. Mechanical forces seem to be very important in determining bone width. For example, the difference in width between femur and humerus can be explained by the different mechanical forces acting on each bone. This perspective is supported by Ruff,82 who showed that the correlation of body size (body weight–bone length) and bone strength is stronger in the femur than in the humerus.
The vital role of mechanical forces in bone growth in width is also supported by results of a study by Goodship and colleagues,110 who overloaded the radius of young pigs by partially removing the ulna. They showed that the radius was strengthened by rapid periosteal apposition. This effect has also been noticed in the clinical setting, when the tibia is replaced with the fibula, which quickly hypertrophies in order to resemble the tibia.111
Conclusion
Longitudinal bone growth has been extensively studied. Systemic and local hormonal pathways control bone growth in a complicated regulation system. Mechanical loading is also strongly correlated with longitudinal bone growth. Bone growth in width has received less attention. Despite its importance in bone stability, periosteal development—and periosteal apposition and resorption more specifically—has not received enough attention. Researchers need to clarify the role of genetic factors affecting periosteal development.
1. Seeman E. Structural basis of growth-related gain and age-related loss of bone strength. Rheumatology. 2008;47(suppl 4):iv2-8.
2. Hall BK, Miyake T. All for one and one for all: condensations and the initiation of skeletal development. Bioessays. 2000;22(2):138-147.
3. Currey JD. Bones: Structure and Mechanics. Princeton, NJ: Princeton University Press; 2002.
4. Rauch F. Bone growth in length and width: the yin and yang of bone stability. J Musculoskelet Neuronal Interact. 2005;5(3):194-201.
5. Seeman E. Periosteal bone formation—a neglected determinant of bone strength. N Engl J Med. 2003;349(4):320-323.
6. Arden NK Spector TD. Genetic influences on muscle strength and bone mineral density: a twin study. J Bone Miner Res. 1997;12(12):2076-2081.
7. Biewener AA, Bertram JEA. Mechanical loading and bone growth in vivo. In: Hall BK, ed. Bone, Vol 7: Bone Growth—B. Boca Raton, FL: CRC Press; 1993:1-36.
8. McGuigan FE, Murray L, Gallagher A, et al. Genetic and environmental determinants of peak bone mass in young men and women. J Bone Miner Res. 2002;17(7):1273-1279.
9. Slemenda CW, Reister TK, Hui SL, Miller JZ, Christian JC, Johnston CC Jr. Influences on skeletal mineralization in children and adolescents: evidence for varying effects of sexual maturation and physical activity. J Pediatr. 1994;125(2):201-207.
10. Schoenau E, Neu CM, Beck B, Manz F, Rauch F. Bone mineral content per muscle cross-sectional area as an index of the functional muscle–bone unit. J Bone Miner Res. 2002;17(6):1095-1101.
11. Rauch F, Neu C, Manz F, Schoenau E. The development of metaphyseal cortex—implications for distal radius fractures during growth. J Bone Miner Res. 2001;16(8):1547-1555.
12. Skaggs DL, Loro ML, Pitukcheewanont P, Tolo V, Gilsanz V. Increased body weight and decreased radial cross-sectional dimensions in girls with forearm fractures. J Bone Miner Res. 2001;16(7):1337-1342.
13. Allen DM, Mao JJ. Heterogenous nanostructural and nanoelastic properties of pericellular and interterritorial matrices of chondrocytes by atomic force microscopy. J Struct Biol. 2004;145(3):196-204.
14. van der Eerden BC, Karperien M, Wit JM. Systemic and local regulation of the growth plate. Endocr Rev. 2003;24(6):782-801.
15. Li LP, Herzog W. Strain-rate dependence of cartilage stiffness in unconfined compression: the role of fibril reinforcement versus tissue volume change in fluid pressurization. J Biomech. 2004;37(3):375-382.
16. Cohen B, Chorney GS, Phillips DP, Dick HM, Mow VC. Compressive stress-relaxation behavior of bovine growth plate may be described by the non-linear biphasic theory. J Orthop Res. 1994;12(6):804-813.
17. Robson H, Siebler T, Shalet SM, Williams GR. Interactions between GH, IGF-Ι, glucocorticoids and thyroid hormones during skeletal growth. Pediatr Res. 2002;52(2):137-147.
18. Abad V, Meyers JL, Weise M, et al. The role of the resting zone in growth plate chondrogenesis. Endocrinology. 2002;143(5):1851-1857.
19. Wang W, Kirsch T. Retinoic acid stimulates annexin-mediated growth plate chondrocyte mineralization. J Cell Biol. 2002;157(6):1061-1069.
20. Anderson HC. Matrix vesicles and calcification. Curr Rheumatol Rep. 2003;5(3):222-226.
21. Tanner JM. The adolescent spurt in animals. In: Thomas CC, ed. Growth at Adolescence. Oxford, UK: Blackwell; 1962:223-239.
22. Drop SL, De Waal WJ, De Muinck Keizer-Schrama SM. Sex steroid treatment of constitutionally tall stature. Endocr Rev. 1998;19(5):540-558.
23. Park EA. The imprinting of nutritional disturbances on the growing bone. Pediatrics. 1964;33(suppl):815-862.
24. Buckwalter JA, Mower D, Unqar R, Schaeffer J, Ginsberg B. Morphometric analysis of chondrocyte hypertrophy. J Bone Joint Surg Am. 1986;68(2):243-255.
25. Sawae Y, Sahara T, Sasaki T. Osteoclast differentiation at the growth plate cartilage–trabecular bone junction in newborn rat femur. J Electron Microsc. 2003;52(6):493-502.
26. Lee ER, Lamplugh L, Shepard NL, Mort JS. The septoclast, a cathepsin B–rich cell involved in the resorption of growth plate cartilage. J Histochem Cytochem. 1995;43(5):525-536.
27. Gerber HP, Vu TH, Ryan AM, Kowalski J, Werb Z, Ferrara N. VEGF couples hypertrophic cartilage remodeling, ossification and angiogenesis during endochondral bone formation. Nat Med. 1999;5(6):623-628.
28. Fazzalari NL, Moore AJ, Byers S, Byard RW. Quantitative analysis of trabecular morphogenesis in the human costochondral junction during the postnatal period in normal subjects. Anat Rec. 1997;248(1):1-12.
29. Cancedda R, Descalzi Cancedda F, Castagnola P. Chondrocyte differentiation. Int Rev Cytol. 1995;159:265-358.
30. Stevens DA, Williams GR. Hormone regulation of chondrocyte differentiation and endochondral bone formation. Mol Cell Endocrinol. 1999;151(1-2):195-204.
31. Kronenberg HM. Developmental regulation of the growth plate. Nature. 2003;423(6937):332-336.
32. Daughaday WH, Hall K, Raben MS, Salmon WD Jr, van den Brande JL, van Wyk JJ. Somatomedin: proposed designation for sulphation factor. Nature. 1972;235(5333):107.
33. Isaksson OG, Lindahl A, Nilsson A, Isqaard J. Mechanism of the stimulatory effect of the growth hormone on longitudinal bone growth. Endocr Rev. 1987;8(4):426-438.
34. Hunziker EB, Wagner J, Zapf J. Differential effects of insulin-like growth factor I and growth hormone on developmental stages of rat growth plate chondrocytes in vivo. J Clin Invest. 1994;93(3):1078-1086.
35. Underwood LE, van Wijk JJ. Normal and aberrant growth. In: Wilson JD, Foster DW, eds. Textbook of Endocrinology. Philadelphia, PA: Saunders; 1992:1079-1138.
36. Rivkees SA, Bode HH, Crawford JD. Long-term growth in juvenile acquired hypothyroidism: the failure to achieve normal adult stature. N Engl J Med. 1988;318(10):599-602.
37. Segni M, Leonardi E, Mazzoncini B, Pucarelli I, Pasquino AM. Special features of Graves’ disease in early childhood. Thyroid. 1999;9(9):871-877.
38. Burch WM, Van Wyk JJ. Triiodothyronine stimulates cartilage growth and maturation by different mechanisms. Am J Physiol. 1987;252(2, pt 1):E176-E182.
39. Lewinson D, Bialik GM, Hochberg Z. Differential effects of hypothyroidism on the cartilage and the osteogenic process in the mandipular condyle: recovery by growth hormone and thyroxine. Endocrinology. 1994;135(4):1504-1510.
40. Wakita R, Izumi T, Itoman M. Thyroid hormone–induced chondrocyte terminal differentiation in rat femur organ culture. Cell Tissue Res. 1998;293(2):357-364.
41. Smeets T, van Buul-Offers S. Influence of growth hormone and thyroxine on cell kinetics in the proximal tibial growth plate of Snell dwarf mice. Cell Tissue Kinet. 1986;19(2):161-170.
42. Silvestrini G, Mocetti P, Ballanti P, Di Grezia R, Bonucci E. Cytochemical demonstration of the glucocorticoid receptor in skeletal cells of the rat. Endocr Res. 1999;25(1):117-128.
43. Abu EO, Horner A, Kusec V, Triffitt JT, Compston JE. The localization of the functional glucocorticoid receptor alpha in human bone. J Clin Endocrinol Metab. 2000;85(2):883-889.
44. Magiakou MA, Mastorakos G, Chrousos GP. Final stature in patients with endogenous Cushing’s syndrome. J Clin Endocrinol Metab. 1994;79(4):1082-1085.
45. Avioli LV. Glucocorticoid effects on statural growth. Br J Rheumatol. 1993;32(suppl 2):27-30.
46. Eberhardt AW, Yeager-Jones A, Blair HC. Regional trabecular bone matrix degeneration and osteocyte death in femora if glucocorticoid-treated rabbits. Endocrinology. 2001;142(3):1333-1340.
47. Silvestrini G, Ballanti P, Patacchioli FR, et al. Evaluation of apoptosis and the glucocorticoid receptor in the cartilage growth plate and metaphyseal bone cells of rats after high-dose treatment with corticosterone. Bone. 2000;26(1):33-42.
48. Montecucco C, Caporali R, Caprotti P, Caprotti M, Notario A. Sex hormones and bone metabolism in postmenopausal rheumatoid arthritis treated with two different glucocorticoids. J Rheumatol. 1992;19(12):1895-1900.
49. Bello CE, Garrett SD. Therapeutic issues in oral glucocorticoid use. Lippincotts Prim Care Pract. 1999;3(3):333-341.
50. Turner RT, Riggs BL, Speisberg TC. Skeletal effects of estrogen. Endocr Rev. 1994;15(3):275-300.
51. Gevers EF, Wit JM, Robinson IC. Effect of gonadectomy on growth and GH responsiveness in dwarf rats. J Endocrinol. 1995;145(1):69-79.
52. van der Eerden BC, Emons J, Ahmed S, et al. Evidence for genomic and non-genomic actions of estrogens in growth plate regulation in female and male rats at the onset of sexual maturation. J Endocrinol. 2002;175(2):277-288.
53. Nilsson O, Falk J, Ritzen EM, Baron J, Savendahl L. Raloxifene acts as an estrogen agonist on the rabbit growth plate. Endocrinology. 2003;144(4):1481-1485.
54. Strickland AL, Sprinz H. Studies of the influence of estradiol and growth hormone on the hypophysectomized immature rat epiphyseal cartilage growth plate. Am J Obstet Gynecol. 1973;115(4):471-477.
55. Jansson JO, Eden S, Isaksson O. Sites of action of testosterone and estradiol on longitudinal bone growth. Am J Physiol. 1983;244(2):E135-E140.
56. Abu EO, Horner A, Kusec V, Triffitt JT, Compston JE. The localization of androgen receptors in human bone. J Clin Endocrinol Metab. 1997;82(10):3493-3497.
57. Noble B, Routledge J, Stevens H, Hughes I, Jacobson W. Androgen receptors in bone-forming tissue. Horm Res. 1999;51(1):31-36.
58. van der Eerden BC, van Til NP, Brinkmann AO, Lowik CW, Wit JM, Karperien M. Sex differences in the expression of the androgen receptor in the tibial growth plate and metaphyseal bone of the rat. Bone. 2002;30(6):891-896.
59. Cassorla FG, Skerda MC, Valk IM, Hung W, Cutler GB Jr, Loriaux DL. The effects of sex steroids on ulnar growth during adolescence. J Clin Endocrinol Metab. 1984;58(4):717-720.
60. Zung A, Phillip M, Chalew SA, Palese T, Kowarski AA, Zadik Z. Testosterone effect on growth and growth mediators of the GF–IGF-I axis in the liver and epiphyseal growth plate of juvenile rats. J Mol Endocrinol. 1999;23(2):209-221.
61. Vortkamp A, Lee K, Lanske B, Segre GV, Kronenberg HM, Tabin CJ. Regulation of rate of cartilage differentiation by Indian hedgehog and PTH-related protein. Science. 1996;273(5275):613-622.
62. St-Jacques B, Hammerschmidt M, McMahon AP. Indian hedgehog signaling regulates proliferation and differentiation of chondrocytes and essential for bone formation. Genes Dev. 1999;13(16):2072-2086.
63. Karp SJ Schipani E, St-Jacques B, Hunzelman J, Kronenberg H, Mcmahon AP. Indian hedgehog coordinates endochondral bone growth and morphogenesis via parathyroid hormone related-protein–dependent and –independent pathways. Development. 2000;127(3):543-548.
64. Karaplis AC, Luz A, Glowacki J, et al. Lethal skeletal dysplasia from targeted disruption of the parathyroid hormone–related peptide gene. Genes Dev. 1994;8(3):277-289.
65. Weir EC, Philbrick WM, Amling M, Neff LA, Baron R, Broadus AE. Targeted overexpression of parathyroid hormone–related peptide in chondrocytes causes chondrodysplasia and delayed endochondral bone formation. Proc Natl Acad Sci U S A. 1996;93(19):10240-10245.
66. Erlebacher A, Filvaroff EH, Gitelman SE, Derynk R. Toward a molecular understanding of skeletal development. Cell. 1995;80(3):371-378.
67. Iwamoto M, Jikko A, Murakami H, et al. Changes in parathyroid hormone receptors during chondrocyte cytodifferentiation. J Biol Chem. 1994;269(25):17245-17251.
68. Henderson JE, Amizuka N, Warshawsky H, et al. Nucleolar localization of parathyroid hormone–related peptide enhances survival of chondrocytes under conditions that promote apoptotic cell death. Mol Cell Biol. 1995;15(8):4064-4075.
69. Amizuka N, Warshawsky H, Henderson JE, Goltzman D, Karaplis AC. Parathyroid hormone–related peptide-depleted mice show abnormal epiphyseal cartilage development and altered endochondral bone formation. J Cell Biol. 1994;126(6):1611-1623.
70. Szebenyi G, Fallon JF. Fibroblast growth factors as multifunctional signaling factors. Int Rev Cytol. 1999;185:45-106.
71. Ornitz DM, Marie PJ. FGF signaling pathways in endochondral and intramembranous bone development and human genetic disease. Genes Dev. 2002;16(12):1446-1465.
72. Shiang R. Thompson LM, Zhu YZ, et al. Mutations in the transmembrane domain of FGFR3 cause the most common genetic form of dwarfism, achondroplasia. Cell. 1994;78(2):335-342.
73. Rousseau F, Bonaventure J, Legeai-Mallet L, et al. Mutations in the gene encoding fibroblast growth factor receptor-3 in achondroplasia. Nature. 1994;371(6494):252-254.
74. Vajo Z, Francomano CA, Wilkin DJ. The molecular and genetic basis of fibroblast growth factor receptor 3 disorders: the achondroplasia family of skeletal dysplasias. Endocr Rev. 2000;21(1):23-39.
75. Liu Z, Xu J, Colvin JS, Ornitz DM. Coordination of chondrogenesis and osteogenesis by fibroblast growth factor 18. Genes Dev. 2002;16(7):859-869.
76. Reddi AH. Bone morphogenetic proteins: from basic science to clinical applications. J Bone Joint Surg Am. 2001;83(suppl 1, pt 1):S1-S6.
77. Minina E, Wenzel HM, Kreschel C, et al. BMP and Ihh/PTHrP signaling interact to coordinate chondrocyte proliferation and differentiation. Development. 2001;128(22):4523-4534.
78. Ferrara N, Davis-Smyth T. The biology of vascular endothelial growth factor. Endocr Rev. 1997;18(1):4-25.
79. Vu TH, Shipley JM, Bergers G, et al. MMP-9/gelatinase B is a key regulator of growth plate angiogenesis and apoptosis of hypertrophic chondrocytes. Cell. 1998;93(3):411-422.
80. Gerber HP, Ferrara N. Angiogenesis and bone growth. Trends Cardiovasc Med. 2000;10(5):223-228.
81. Turner CH. Three rules for bone adaptation to mechanical stimuli. Bone. 1998;23(5):399-407.
82. Ruff C. Growth in bone strength, body size, and muscle size in a juvenile longitudinal sample. Bone. 2003;33(3):317-329.
83. Arkin AM, Katz JF. The effects of pressure on epiphyseal growth; the mechanism of plasticity of growing bone. J Bone Joint Surg Am. 1956;38(5):1056-1076.
84. Mehlman CT, Araghi A, Roy DR. Hyphenated history: the Hueter-Volkmann law. Am J Orthop. 1997;26(11):798-800.
85. Frost HM. Biomechanical control of knee alignment: some insights from a new paradigm. Clin Orthop. 1997;(335):335-342.
86. Chenu C. Role of innervation in the control of bone remodeling. J Musculoskelet Neuronal Interact. 2004;4(2):132-134.
87. Dysart PS, Harkness EM, Herbison GP. Growth of the humerus after denervation. An experimental study in the rat. J Anat. 1989;167:147-159.
88. Pottorf JL. An experimental study of bone growth in the dog. Anat Rec. 1916;10:234-235.
89. Allison N, Brooks B. Bone atrophy. An experimental and clinical study of the changes in bone which result from non-use. Surg Gynecol Obstet. 1921;33:250-260.
90. Ring PA. The influence of the nervous system upon the growth of bones. J Bone Joint Surg Br. 1961;43:121-140.
91. Reading BD, Laor T, Salisbury SR, Lippert WC, Cornwall R. Quantification of humeral head deformity following neonatal brachial plexus palsy. J Bone Joint Surg Am. 2012;94(18):e136(1-8).
92. Moro M, van der Meulen MC, Kiratli BJ, Bachrach LK, Carter DR. Body mass is the primary determinant of midfemoral bone acquisition during adolescent growth. Bone. 1996;19(5):519-526.
93. Schoenau E, Neu CM, Mokov E, Wassmer G, Manz F. Influence of puberty on muscle area and cortical bone area and cortical of the forearm in boys and girls. J Clin Endocrinol Metab. 2000;85(3):1095-1098.
94. Schönau E. The development of the skeletal system in children and the influence of muscular strength. Horm Res. 1998;49(1):27-31.
95. Schönau E, Werhahn E, Schiedermaier U, et al. Influence of muscle strength on bone strength during childhood and adolescence. Horm Res. 1996;45(suppl 1):63-66.
96. van der Meulen MC, Ashford MW Jr, Kiratli BJ, Bachrach LK, Carter DR. Determinants of femoral geometry and structure during adolescent growth. J Orthop Res. 1996;14(1):22-29.
97. van der Meulen MC, Moro M, Kiratli BJ, Marcus R, Bachrach LK. Mechanobiology of femoral neck structure during adolescence. J Rehabil Res Dev. 2000;37(2):201-208.
98. Baron R. General principles of bone biology. In: Favus MJ, ed. Primer on the Metabolic Bone Diseases and Disorders of Mineral Metabolism. 5th ed. Washington DC: American Society for Bone and Mineral Research; 2003:1-8.
99. Parfitt AM, Travers R, Rauch F, Glorieux FH. Structural and cellular changes during bone growth in healthy children. Bone. 2000;27(4):487-494.
100. Frost HM. Skeletal structural adaptations to mechanical usage (SATMU): 2. Redefining Wolff’s law: the bone modeling problem. Anat Rec. 1990;226(4):414-422.
101. Frost HM. Skeletal structural adaptations to mechanical usage (SATMU): 1. Redefining Wolff’s law: the bone modeling problem. Anat Rec. 1990;226(4):403-413.
102. Balena R, Shih MS, Parfitt AM. Bone resorption and formation on the periosteal envelope of the ilium: a histomorphometric study in healthy women. J Bone Miner Res. 1992;7(12):1475-1482.
103. Tanner JM, Hughes PC, Whitehouse RH. Radiographically determined widths of bone muscle and fat in the upper arm and calf from age 3-18 years. Ann Hum Biol. 1981;8(6):495-517.
104. Turner RT, Wakley GK, Hannon KS. Differential effects of androgens on cortical bone histomorphometry in gonadectomized male and female rats. J Orthop Res. 1990;8(4):612-617.
105. Yeh JK, Chen MM, Aloia JF. Ovariectomy-induced high turnover in cortical bone is dependent on pituitary hormone in rats. Bone. 1996;18(5):443-450.
106. Kim BT, Mosekilde L, Duan Y, et al. The structural and hormonal basis of sex differences in peak appendicular bone strength in rats. J Bone Miner Res. 2003;18(1):150-155.
107. Parfitt AM. Parathyroid hormone and periosteal bone expansion. J Bone Miner Res. 2002;17(10):1741-1743.
108. Specker B, Binkley T. Randomized trial of physical activity and calcium supplementation on bone mineral content in 3- to 5-year-old children. J Bone Miner Res. 2003;18(5):885-892.
109. Volkman SK, Galecki AT, Burke DT, et al. Quantitative trait loci for femoral size and shape in a genetically heterogenous mouse population. J Bone Miner Res. 2003;18(8):1497-1505.
110. Goodship AE, Lanyon LE, McFie H. Functional adaptation of bone to increased stress. An experimental study. J Bone Joint Surg Am. 1979;61(4):539-546.
111. Falder S, Sinclair JS, Rogers CA, Townsend PL. Long-term behavior of the free vascularized fibula following reconstruction of large bony effects. Br J Plast Surg. 2003;56(6):571-584.
Differences in bone size are established early in life, before puberty and perhaps even in utero.1 Bone begins to form when mesenchymal cells form condensations—clusters of cells that adhere through expression of adhesion molecules2 (Figure 1). Bone must be stiff, flexible enough to change shape to absorb energy, and light enough to allow mobility.1,3 Longitudinal bone growth is detrimental to bone stability, but this effect is counteracted by concomitant bone growth in width.4 Bone growth in width has not been studied as extensively, despite its paramount role in skeletal development.5
Bone growth and development are products of the complex interactions of genetic and environmental factors, including diet, hormones, and mechanical stimuli.6-9 Longitudinal bone growth is controlled by systemic and local hormones and local mechanical factors. Two models for control of bone growth in width have been suggested—the mechanostat theory (mechanical requirements regulate periosteal apposition) and the sizostat hypothesis (a master gene or set of genes regulates bone growth in width so bone reaches a preprogrammed size, independent of mechanical requirements).5
In this article, we review the most recent data regarding bone growth from the embryonic age and analyze the factors that control bone growth. An understanding of this complex system is important in identifying metabolic and developmental bone diseases10 and fracture risk.11,12
Growth Plate
The growth plate consists mainly of collagen fibrils, proteoglycans, and water, arranged to form a sort of sponge with very small pores.13 The growth plate is located between epiphyseal and metaphyseal bone at the distal end of long bones14 and is strain-rate–dependent,15,16 which means it is hard when squeezed rapidly but soft when deformed slowly. The growth plate becomes ossified after puberty and epiphyseal fusion.17
Histologically, the growth plate consists of horizontal zones of chondrocytes at different stages of differentiation.4 The germinal zone, at the epiphyseal end of the growth plate, contains resting chondrocytes, which seem crucial in orienting the underlying columns of chondrocytes and, therefore, in unidirectional bone growth, probably by secretion of a growth plate–orienting factor.14,18 Next is the proliferative zone, a matrix-rich zone in which flattened chondrocytes undergo longitudinal cell division and orient themselves in typical column-wise fashion. At some point, proliferating chondrocytes lose their capacity to divide; they start to differentiate and become prehypertrophic, coinciding with a size increase.4 Proliferating chondrocytes are located in the transition (maturation or prehypertrophic) zone. In the hypertrophic zone, round chondrocytes secrete matrix proteins in large amounts.14 This stage is characterized by an increase in intracellular calcium concentration, which is essential in the production of matrix vesicles. These vesicles, small membrane-enclosed particles, are released from chondrocytes19,20 and secrete calcium phosphates, hydroxyapatite, and matrix metalloproteinases, resulting in mineralization of the vesicles and their surrounding matrix.4 The chondrocytes in this mineralized zone eventually undergo programmed cell death (apoptosis), leaving a scaffold for new bone formation.
Longitudinal Bone Growth
Generally, bones increase in length as long as new material is being squeezed between the reserve zone of the growth plate and the zone of provisional calcification.4
Postnatal linear growth occurs in 3 phases. Phase 1 is characterized by a high rate of growth at the beginning of fetal life, and then rapid deceleration up to about 3 years; phase 2, by a lower, slowly decelerating growth rate up to puberty; and phase 3, by an increased rate of longitudinal growth until a peak is reached.14,21,22
In 1964, Park23 proposed that the structure of the epiphyseal cartilage may determine the pattern of the growing bone shaft. The changes within the hypertrophic zone are directly related to matrix mineralization, vascular invasion, and subsequent development.24 Intracellular calcium concentration increases in the hypertrophic chondrocytes in the hypertrophic zone of growth plate cartilage; at some point, these chondrocytes begin to mineralize the longitudinal septa in the surrounding matrix25 (Figure 2). At the growth cartilage junction, mononuclear cells of undetermined origin resorb the unmineralized horizontal septa of the growth cartilage. These cells are called septoclasts or chondroclasts.25,26 Blood vessels invade the area and pave the way for bone cell precursors.27 Eighty percent of the longitudinal septa of the growth cartilage is rapidly resorbed in the metaphyseal zone immediately behind the invading blood vessels, paving the way for bone cell precursors.28 Fazzalari and colleagues28 reported that about 40% of mineralized septa serves as scaffold for the formation of primary bone trabeculae; the other 60% is absorbed by chondroclasts (osteoclasts) near the vascular invasion front.
Regulation of Longitudinal Bone Growth
Longitudinal bone growth is regulated by genetic, hormonal, growth, and environment factors17,29-31 (Table). It must be controlled on at least 3 different levels.4 Level 1 is systemic control by factors such as growth hormone (GH), sex hormones, and glucocorticoids. The major systemic hormones that control longitudinal bone growth during childhood are GH, insulin-like growth factor 1 (IGF-1), the thyroid hormones triiodothyronine (T3) and thyroxine (T4), and glucocorticoids; during puberty, the sex steroids play the most significant role.14 Level 2 is local control by factors such as Indian hedgehog (Inh), parathyroid hormone–related peptide (PTHrP), and fibroblast growth factors (FGFs).14,31 Level 3 is mechanical control.4
Systemic Regulation. After birth, GH becomes an important modulator of longitudinal growth and appears to be, together with IGF-1, the central player in the hypothalamus–pituitary–growth plate axis.14 According to the original somatomedin hypothesis,32 GH stimulates hepatic production of IGF-1, which in turn promotes growth directly at the epiphyseal plate.17 GH acts on resting zone chondrocytes and is responsible for local IGF-1 production, which stimulates clonal expansion of proliferating chondrocytes in an autocrine/paracrine manner.33 Infusion of GH or IGF-1 shortens stem- and proliferating-cell cycle times in the growth plate of hypophysectomized rats and decreases the duration of the hypertrophic differentiation phase, with GH being more effective.17 According to the experimental study of Hunziker and colleagues,34 GH or IGF-1 treatment restores mean cell volume and height, but the growth rate is not normalized by either hormone.
Thyroid hormones also play a vital role in bone growth. T3 and, to a lesser extent, T4 are crucial in normal bone maturation.30,35 Childhood hypothyroidism causes growth failure; growth failure may develop insidiously, but, once established, it is severe.17 On the other hand, hyperthyroidism increases the growth rate in children but also leads to premature growth plate fusion and short stature.36,37 T3 seems to stimulate recruitment of cells from the germinal zone to the proliferating zone and facilitates differentiation of growth plate chondrocytes.38-40 Its precursor, T4, increases the number of [3H]methylthymidine-labeled chondrocyte nuclei and [35S]incorporation in Snell dwarf mice growth plates, suggesting a stimulatory role in chondrocyte proliferation and differentiation.41
Glucocorticoids suppress growth by modifying the GH/IGF-1 pathway at different levels.17 Silvestrini and colleagues42 localized the glucocorticoid receptor in rat bone cells, including chondrocytes. The glucocorticoid receptor was also localized by Abu and colleagues43 in human growth plates, especially in hypertrophic chondrocytes, suggesting direct effects of glucocorticoids on the growth plate. An excess of glucocorticoids enhances bone resorption, inhibits osteoblast activity, and reduces bone matrix production to retard growth in children.44,45 Excess glucocorticoids also induce apoptosis of osteoblasts and osteocytes in rabbit trabecular bone46 and osteoblasts in rat long bones,47 resulting in an almost complete absence of new bone formation.17 In addition, glucocorticoids induce sex hormone deficiency and alter vitamin D metabolism, leading to deleterious effects on growth and skeletal integrity.48 Excess glucocorticoids modify the GH/IGF-1 pathway at different levels, suppressing growth.17 In contrast, low levels of glucocorticoids, as in familial glucocorticoid deficiency, are associated with tall stature.49
Longitudinal bone growth is also based on sex hormones, especially during puberty.17 In rats, estrogen depletion stimulates longitudinal growth, whereas estrogen administration inhibits longitudinal growth.50-52 Nilsson and colleagues53 studied ovariectomized immature rabbits treated with either estrogen or the selective estrogen receptor modulator raloxifene and found reduced chondrocyte proliferation and growth plate height as well as accelerated growth plate senescence. Many experimental studies have concluded that estrogen can inhibit longitudinal growth in the absence of GH.51,54,55
Androgens can directly influence growth plate function and may account for some skeletal differences between males and females.56-58 Unlike estrogens, androgens stimulate longitudinal growth, as shown in several studies that assessed the effect of administering nonaromatizable androgens on longitudinal growth in boys with constitutionally delayed growth.59,60
Local Regulation. Inh, a master regulator of bone development, coordinates chondrocyte proliferation, chondrocyte differentiation, and osteoblast differentiation.31 Inh belongs to the hedgehog protein family, which plays a crucial role in embryonic patterning and development.4 The proliferative effect of Inh is likely to be direct action on chondrocytes.31 In 1996, Vortkamp and colleagues61 reported that misexpression of Inh in chicken long bones blocked chondrocyte differentiation. More recently, St-Jacques and colleagues62 studied Inh-null mutant mice and found failure of both chondrocyte differentiation and osteoblast development. Inh is now thought to coordinate endochondral ossification, regulating chondrocyte proliferation and differentiation and osteoblast differentiation and coupling chondrogenesis and osteogenesis.62,63
PTHrP acts primarily to keep proliferating chondrocytes in the proliferative pool.31 Mice that did not express PTHrP showed accelerated chondrocyte differentiation leading to dwarfism.64 On the other hand, ectopic expression of PTHrP in the growth plate inhibited chondrocyte differentiation, resulting in a smaller cartilaginous skeleton compared with wild-type mice.65 PTHrP appears to regulate the rate of programmed chondrocyte differentiation in developing endochondral bone and at the level of the growth plate.64,66-69
The family of FGFs, which are major regulators of embryonic bone development, has at least 22 members.70,71 Achondroplasia, the most common type of dwarfism, is caused by an activating mutation in FGF receptor 3 (FGFR3).72-74 FGF18 deficiency also leads to delayed ossification and decreased expression of osteogenic markers.75
Bone morphogenetic proteins (BMPs) are recognized as important regulators of growth, differentiation, and morphogenesis during embryology.76 In 2001, Minina and colleagues77 showed that normal chondrocyte proliferation requires parallel signaling of both Inh and BMPs and that BMPs can inhibit chondrocyte differentiation independently of the Inh/PTHrP pathway.
Vascular endothelial growth factor (VEGF), a chemoattractant for endothelial cells, is one of the most important growth factors for endothelial cells.78 VEGF is a key player in the actions that occur during the end stage of endochondral bone formation; these actions include terminal differentiation of chondrocytes, vascular invasion, chondrocyte apoptosis, and replacement of chondrocytes with bone.27,79,80 When Gerber and colleagues27 inactivated VEGF in 24-day-old mice, they noticed suppressed blood vessel invasion and trabecular bone formation concomitant with an increased width of the hypertrophic zone.
Mechanical Regulation. Mechanical forces influence bone formation and adaptation.81 Growth rates from early infancy through late adolescence were found to be strongly correlated between an appropriate measure of mechanical loading (body size, or body weight–bone length) and bone strength (assessed by section modulus).82 The observation that compression inhibits bone growth was well known to the ancient Romans.83 In the 19th century, the Hueter-Volkmann law was proclaimed. This law is well known to pediatric orthopedic surgeons and is the basis of growth modulation for correcting angular deformities of the lower extremities and spinal deformities.4,84
If compression always inhibited bone growth, as it was believed, growth plates would be extremely unstable, as any slight deviation from the straight alignment of the long bones of the lower extremities would induce a vicious circle of positive feedback and result in catastrophic deformities.4 Mild compression leads to increased, not decreased, growth. Nevertheless, when compression on one side of the growth plate exceeds a certain level, growth is indeed suppressed, and the lesion begins to worsen.4
In 1997, Frost85 proposed using a single graph that combines the clinical observation of mechanical forces affecting longitudinal bone growth. Both mild tension and mild compression induce bone growth, whereas heavy compression inhibits growth (Figure 3).
Three rules describe bone adaptation in mathematical terms. First, bone adaptation is driven by dynamic, not static, loading. Second, only a short period of mechanical loading is needed to initiate an adaptive response (extending the loading period has a diminishing effect on further bone adaptation). Third, bone cells accommodate to a customary mechanical loading environment, making them less responsive to routine loading signals.81
Also playing a significant role in bone physiology is the nervous system, with leptin-dependent central control of bone formation via the sympathetic system.86 Several investigators have tried to determine the effect of muscle activity on bone growth in length.87 Pottorf88 in 1916 and Allison and Brooks89 in 1921 were among the first to study this correlation; they concluded that long bones grow less after denervation. On the other hand, Ring90 in 1961 reported that, despite innervation, longitudinal bone growth was increased. Investigators in more recent studies have advanced the idea that the nervous system plays a negative role in bone physiology. Dysart and colleagues87 showed that muscle pull affects periosteal tension and, consequently, bone form and growth in length. In a clinical study involving 32 children with neonatal brachial plexus injury,91 the ratio of skewness between the affected humeral head and the contralateral normal head was calculated. Skewness was determined by dividing the anterior area of the humeral head by the posterior area. There was a significant preoperative difference between the 2 sides, but the skewness ratio was significantly improved after surgery.
Bone Growth in Width
Bone growth in width has not received as much attention as longitudinal bone growth. Several studies have indicated that body mass and muscle strength have important influences on long bone strength in children and adolescents.92-97 As bone width changes only slowly after the growth period, bone growth in width is one of the most important determinants of bone strength throughout life.4 It is clear that, if bones grew in length without increasing in width, they would become unstable and break.4
Histologically, osteoblasts add mineralized tissue to the outer (periosteal) bone surface. This process is periosteal apposition.98 The periosteum has an outer layer, composed mainly of fibrous tissue, and an inner layer, the cambium, which harbors osteogenic cells.4 In children, bone formation is continuous, which is the hallmark of modeling99,100; in adults, periosteal bone may undergo cyclical resorption and formation, which are characteristic of remodeling.101,102
Macroscopically, bone grows rapidly during early life; then, growth continuously slows down until reaching a nadir during early school age.4 It is clear that wider bones must have higher midshaft periosteal apposition rates, as this is how they become wider.4,103
Regulation of Bone Growth in Width (Table)
Systemic Regulation. Periosteal apposition at diaphyseal bone sites is stimulated by androgen and GH and inhibited by estrogens.104-106 In an experimental study, Turner and colleagues104 found that androgen treatment stimulated bone formation in orchiectomized rats and suppressed bone formation in ovariectomized rats. A large dose of diethylstilbestrol also suppressed bone formation in ovariectomized rats. Parathyroid hormone is associated with faster periosteal expansion in adults, according to Parfitt.107 In addition, nutrition with high calcium intake has the same effects on children, especially those with high levels of physical activity.108
Local Regulation. Given that periosteal bone development is site-specific, whereas systemic hormones and nutrition are blind to structure,4 it is clear that local regulation is key to bone growth in width. Genetic heritage seems to have an overwhelming effect on periosteal bone development. Volkman and colleagues,109 who experimented with various genetic markers in rats, concluded that genetic control of cortical bone geometry is complex and that femoral size and shape may be influenced by different but overlapping groups of polymorphic loci.
Mechanical Regulation. Mechanical forces seem to be very important in determining bone width. For example, the difference in width between femur and humerus can be explained by the different mechanical forces acting on each bone. This perspective is supported by Ruff,82 who showed that the correlation of body size (body weight–bone length) and bone strength is stronger in the femur than in the humerus.
The vital role of mechanical forces in bone growth in width is also supported by results of a study by Goodship and colleagues,110 who overloaded the radius of young pigs by partially removing the ulna. They showed that the radius was strengthened by rapid periosteal apposition. This effect has also been noticed in the clinical setting, when the tibia is replaced with the fibula, which quickly hypertrophies in order to resemble the tibia.111
Conclusion
Longitudinal bone growth has been extensively studied. Systemic and local hormonal pathways control bone growth in a complicated regulation system. Mechanical loading is also strongly correlated with longitudinal bone growth. Bone growth in width has received less attention. Despite its importance in bone stability, periosteal development—and periosteal apposition and resorption more specifically—has not received enough attention. Researchers need to clarify the role of genetic factors affecting periosteal development.
1. Seeman E. Structural basis of growth-related gain and age-related loss of bone strength. Rheumatology. 2008;47(suppl 4):iv2-8.
2. Hall BK, Miyake T. All for one and one for all: condensations and the initiation of skeletal development. Bioessays. 2000;22(2):138-147.
3. Currey JD. Bones: Structure and Mechanics. Princeton, NJ: Princeton University Press; 2002.
4. Rauch F. Bone growth in length and width: the yin and yang of bone stability. J Musculoskelet Neuronal Interact. 2005;5(3):194-201.
5. Seeman E. Periosteal bone formation—a neglected determinant of bone strength. N Engl J Med. 2003;349(4):320-323.
6. Arden NK Spector TD. Genetic influences on muscle strength and bone mineral density: a twin study. J Bone Miner Res. 1997;12(12):2076-2081.
7. Biewener AA, Bertram JEA. Mechanical loading and bone growth in vivo. In: Hall BK, ed. Bone, Vol 7: Bone Growth—B. Boca Raton, FL: CRC Press; 1993:1-36.
8. McGuigan FE, Murray L, Gallagher A, et al. Genetic and environmental determinants of peak bone mass in young men and women. J Bone Miner Res. 2002;17(7):1273-1279.
9. Slemenda CW, Reister TK, Hui SL, Miller JZ, Christian JC, Johnston CC Jr. Influences on skeletal mineralization in children and adolescents: evidence for varying effects of sexual maturation and physical activity. J Pediatr. 1994;125(2):201-207.
10. Schoenau E, Neu CM, Beck B, Manz F, Rauch F. Bone mineral content per muscle cross-sectional area as an index of the functional muscle–bone unit. J Bone Miner Res. 2002;17(6):1095-1101.
11. Rauch F, Neu C, Manz F, Schoenau E. The development of metaphyseal cortex—implications for distal radius fractures during growth. J Bone Miner Res. 2001;16(8):1547-1555.
12. Skaggs DL, Loro ML, Pitukcheewanont P, Tolo V, Gilsanz V. Increased body weight and decreased radial cross-sectional dimensions in girls with forearm fractures. J Bone Miner Res. 2001;16(7):1337-1342.
13. Allen DM, Mao JJ. Heterogenous nanostructural and nanoelastic properties of pericellular and interterritorial matrices of chondrocytes by atomic force microscopy. J Struct Biol. 2004;145(3):196-204.
14. van der Eerden BC, Karperien M, Wit JM. Systemic and local regulation of the growth plate. Endocr Rev. 2003;24(6):782-801.
15. Li LP, Herzog W. Strain-rate dependence of cartilage stiffness in unconfined compression: the role of fibril reinforcement versus tissue volume change in fluid pressurization. J Biomech. 2004;37(3):375-382.
16. Cohen B, Chorney GS, Phillips DP, Dick HM, Mow VC. Compressive stress-relaxation behavior of bovine growth plate may be described by the non-linear biphasic theory. J Orthop Res. 1994;12(6):804-813.
17. Robson H, Siebler T, Shalet SM, Williams GR. Interactions between GH, IGF-Ι, glucocorticoids and thyroid hormones during skeletal growth. Pediatr Res. 2002;52(2):137-147.
18. Abad V, Meyers JL, Weise M, et al. The role of the resting zone in growth plate chondrogenesis. Endocrinology. 2002;143(5):1851-1857.
19. Wang W, Kirsch T. Retinoic acid stimulates annexin-mediated growth plate chondrocyte mineralization. J Cell Biol. 2002;157(6):1061-1069.
20. Anderson HC. Matrix vesicles and calcification. Curr Rheumatol Rep. 2003;5(3):222-226.
21. Tanner JM. The adolescent spurt in animals. In: Thomas CC, ed. Growth at Adolescence. Oxford, UK: Blackwell; 1962:223-239.
22. Drop SL, De Waal WJ, De Muinck Keizer-Schrama SM. Sex steroid treatment of constitutionally tall stature. Endocr Rev. 1998;19(5):540-558.
23. Park EA. The imprinting of nutritional disturbances on the growing bone. Pediatrics. 1964;33(suppl):815-862.
24. Buckwalter JA, Mower D, Unqar R, Schaeffer J, Ginsberg B. Morphometric analysis of chondrocyte hypertrophy. J Bone Joint Surg Am. 1986;68(2):243-255.
25. Sawae Y, Sahara T, Sasaki T. Osteoclast differentiation at the growth plate cartilage–trabecular bone junction in newborn rat femur. J Electron Microsc. 2003;52(6):493-502.
26. Lee ER, Lamplugh L, Shepard NL, Mort JS. The septoclast, a cathepsin B–rich cell involved in the resorption of growth plate cartilage. J Histochem Cytochem. 1995;43(5):525-536.
27. Gerber HP, Vu TH, Ryan AM, Kowalski J, Werb Z, Ferrara N. VEGF couples hypertrophic cartilage remodeling, ossification and angiogenesis during endochondral bone formation. Nat Med. 1999;5(6):623-628.
28. Fazzalari NL, Moore AJ, Byers S, Byard RW. Quantitative analysis of trabecular morphogenesis in the human costochondral junction during the postnatal period in normal subjects. Anat Rec. 1997;248(1):1-12.
29. Cancedda R, Descalzi Cancedda F, Castagnola P. Chondrocyte differentiation. Int Rev Cytol. 1995;159:265-358.
30. Stevens DA, Williams GR. Hormone regulation of chondrocyte differentiation and endochondral bone formation. Mol Cell Endocrinol. 1999;151(1-2):195-204.
31. Kronenberg HM. Developmental regulation of the growth plate. Nature. 2003;423(6937):332-336.
32. Daughaday WH, Hall K, Raben MS, Salmon WD Jr, van den Brande JL, van Wyk JJ. Somatomedin: proposed designation for sulphation factor. Nature. 1972;235(5333):107.
33. Isaksson OG, Lindahl A, Nilsson A, Isqaard J. Mechanism of the stimulatory effect of the growth hormone on longitudinal bone growth. Endocr Rev. 1987;8(4):426-438.
34. Hunziker EB, Wagner J, Zapf J. Differential effects of insulin-like growth factor I and growth hormone on developmental stages of rat growth plate chondrocytes in vivo. J Clin Invest. 1994;93(3):1078-1086.
35. Underwood LE, van Wijk JJ. Normal and aberrant growth. In: Wilson JD, Foster DW, eds. Textbook of Endocrinology. Philadelphia, PA: Saunders; 1992:1079-1138.
36. Rivkees SA, Bode HH, Crawford JD. Long-term growth in juvenile acquired hypothyroidism: the failure to achieve normal adult stature. N Engl J Med. 1988;318(10):599-602.
37. Segni M, Leonardi E, Mazzoncini B, Pucarelli I, Pasquino AM. Special features of Graves’ disease in early childhood. Thyroid. 1999;9(9):871-877.
38. Burch WM, Van Wyk JJ. Triiodothyronine stimulates cartilage growth and maturation by different mechanisms. Am J Physiol. 1987;252(2, pt 1):E176-E182.
39. Lewinson D, Bialik GM, Hochberg Z. Differential effects of hypothyroidism on the cartilage and the osteogenic process in the mandipular condyle: recovery by growth hormone and thyroxine. Endocrinology. 1994;135(4):1504-1510.
40. Wakita R, Izumi T, Itoman M. Thyroid hormone–induced chondrocyte terminal differentiation in rat femur organ culture. Cell Tissue Res. 1998;293(2):357-364.
41. Smeets T, van Buul-Offers S. Influence of growth hormone and thyroxine on cell kinetics in the proximal tibial growth plate of Snell dwarf mice. Cell Tissue Kinet. 1986;19(2):161-170.
42. Silvestrini G, Mocetti P, Ballanti P, Di Grezia R, Bonucci E. Cytochemical demonstration of the glucocorticoid receptor in skeletal cells of the rat. Endocr Res. 1999;25(1):117-128.
43. Abu EO, Horner A, Kusec V, Triffitt JT, Compston JE. The localization of the functional glucocorticoid receptor alpha in human bone. J Clin Endocrinol Metab. 2000;85(2):883-889.
44. Magiakou MA, Mastorakos G, Chrousos GP. Final stature in patients with endogenous Cushing’s syndrome. J Clin Endocrinol Metab. 1994;79(4):1082-1085.
45. Avioli LV. Glucocorticoid effects on statural growth. Br J Rheumatol. 1993;32(suppl 2):27-30.
46. Eberhardt AW, Yeager-Jones A, Blair HC. Regional trabecular bone matrix degeneration and osteocyte death in femora if glucocorticoid-treated rabbits. Endocrinology. 2001;142(3):1333-1340.
47. Silvestrini G, Ballanti P, Patacchioli FR, et al. Evaluation of apoptosis and the glucocorticoid receptor in the cartilage growth plate and metaphyseal bone cells of rats after high-dose treatment with corticosterone. Bone. 2000;26(1):33-42.
48. Montecucco C, Caporali R, Caprotti P, Caprotti M, Notario A. Sex hormones and bone metabolism in postmenopausal rheumatoid arthritis treated with two different glucocorticoids. J Rheumatol. 1992;19(12):1895-1900.
49. Bello CE, Garrett SD. Therapeutic issues in oral glucocorticoid use. Lippincotts Prim Care Pract. 1999;3(3):333-341.
50. Turner RT, Riggs BL, Speisberg TC. Skeletal effects of estrogen. Endocr Rev. 1994;15(3):275-300.
51. Gevers EF, Wit JM, Robinson IC. Effect of gonadectomy on growth and GH responsiveness in dwarf rats. J Endocrinol. 1995;145(1):69-79.
52. van der Eerden BC, Emons J, Ahmed S, et al. Evidence for genomic and non-genomic actions of estrogens in growth plate regulation in female and male rats at the onset of sexual maturation. J Endocrinol. 2002;175(2):277-288.
53. Nilsson O, Falk J, Ritzen EM, Baron J, Savendahl L. Raloxifene acts as an estrogen agonist on the rabbit growth plate. Endocrinology. 2003;144(4):1481-1485.
54. Strickland AL, Sprinz H. Studies of the influence of estradiol and growth hormone on the hypophysectomized immature rat epiphyseal cartilage growth plate. Am J Obstet Gynecol. 1973;115(4):471-477.
55. Jansson JO, Eden S, Isaksson O. Sites of action of testosterone and estradiol on longitudinal bone growth. Am J Physiol. 1983;244(2):E135-E140.
56. Abu EO, Horner A, Kusec V, Triffitt JT, Compston JE. The localization of androgen receptors in human bone. J Clin Endocrinol Metab. 1997;82(10):3493-3497.
57. Noble B, Routledge J, Stevens H, Hughes I, Jacobson W. Androgen receptors in bone-forming tissue. Horm Res. 1999;51(1):31-36.
58. van der Eerden BC, van Til NP, Brinkmann AO, Lowik CW, Wit JM, Karperien M. Sex differences in the expression of the androgen receptor in the tibial growth plate and metaphyseal bone of the rat. Bone. 2002;30(6):891-896.
59. Cassorla FG, Skerda MC, Valk IM, Hung W, Cutler GB Jr, Loriaux DL. The effects of sex steroids on ulnar growth during adolescence. J Clin Endocrinol Metab. 1984;58(4):717-720.
60. Zung A, Phillip M, Chalew SA, Palese T, Kowarski AA, Zadik Z. Testosterone effect on growth and growth mediators of the GF–IGF-I axis in the liver and epiphyseal growth plate of juvenile rats. J Mol Endocrinol. 1999;23(2):209-221.
61. Vortkamp A, Lee K, Lanske B, Segre GV, Kronenberg HM, Tabin CJ. Regulation of rate of cartilage differentiation by Indian hedgehog and PTH-related protein. Science. 1996;273(5275):613-622.
62. St-Jacques B, Hammerschmidt M, McMahon AP. Indian hedgehog signaling regulates proliferation and differentiation of chondrocytes and essential for bone formation. Genes Dev. 1999;13(16):2072-2086.
63. Karp SJ Schipani E, St-Jacques B, Hunzelman J, Kronenberg H, Mcmahon AP. Indian hedgehog coordinates endochondral bone growth and morphogenesis via parathyroid hormone related-protein–dependent and –independent pathways. Development. 2000;127(3):543-548.
64. Karaplis AC, Luz A, Glowacki J, et al. Lethal skeletal dysplasia from targeted disruption of the parathyroid hormone–related peptide gene. Genes Dev. 1994;8(3):277-289.
65. Weir EC, Philbrick WM, Amling M, Neff LA, Baron R, Broadus AE. Targeted overexpression of parathyroid hormone–related peptide in chondrocytes causes chondrodysplasia and delayed endochondral bone formation. Proc Natl Acad Sci U S A. 1996;93(19):10240-10245.
66. Erlebacher A, Filvaroff EH, Gitelman SE, Derynk R. Toward a molecular understanding of skeletal development. Cell. 1995;80(3):371-378.
67. Iwamoto M, Jikko A, Murakami H, et al. Changes in parathyroid hormone receptors during chondrocyte cytodifferentiation. J Biol Chem. 1994;269(25):17245-17251.
68. Henderson JE, Amizuka N, Warshawsky H, et al. Nucleolar localization of parathyroid hormone–related peptide enhances survival of chondrocytes under conditions that promote apoptotic cell death. Mol Cell Biol. 1995;15(8):4064-4075.
69. Amizuka N, Warshawsky H, Henderson JE, Goltzman D, Karaplis AC. Parathyroid hormone–related peptide-depleted mice show abnormal epiphyseal cartilage development and altered endochondral bone formation. J Cell Biol. 1994;126(6):1611-1623.
70. Szebenyi G, Fallon JF. Fibroblast growth factors as multifunctional signaling factors. Int Rev Cytol. 1999;185:45-106.
71. Ornitz DM, Marie PJ. FGF signaling pathways in endochondral and intramembranous bone development and human genetic disease. Genes Dev. 2002;16(12):1446-1465.
72. Shiang R. Thompson LM, Zhu YZ, et al. Mutations in the transmembrane domain of FGFR3 cause the most common genetic form of dwarfism, achondroplasia. Cell. 1994;78(2):335-342.
73. Rousseau F, Bonaventure J, Legeai-Mallet L, et al. Mutations in the gene encoding fibroblast growth factor receptor-3 in achondroplasia. Nature. 1994;371(6494):252-254.
74. Vajo Z, Francomano CA, Wilkin DJ. The molecular and genetic basis of fibroblast growth factor receptor 3 disorders: the achondroplasia family of skeletal dysplasias. Endocr Rev. 2000;21(1):23-39.
75. Liu Z, Xu J, Colvin JS, Ornitz DM. Coordination of chondrogenesis and osteogenesis by fibroblast growth factor 18. Genes Dev. 2002;16(7):859-869.
76. Reddi AH. Bone morphogenetic proteins: from basic science to clinical applications. J Bone Joint Surg Am. 2001;83(suppl 1, pt 1):S1-S6.
77. Minina E, Wenzel HM, Kreschel C, et al. BMP and Ihh/PTHrP signaling interact to coordinate chondrocyte proliferation and differentiation. Development. 2001;128(22):4523-4534.
78. Ferrara N, Davis-Smyth T. The biology of vascular endothelial growth factor. Endocr Rev. 1997;18(1):4-25.
79. Vu TH, Shipley JM, Bergers G, et al. MMP-9/gelatinase B is a key regulator of growth plate angiogenesis and apoptosis of hypertrophic chondrocytes. Cell. 1998;93(3):411-422.
80. Gerber HP, Ferrara N. Angiogenesis and bone growth. Trends Cardiovasc Med. 2000;10(5):223-228.
81. Turner CH. Three rules for bone adaptation to mechanical stimuli. Bone. 1998;23(5):399-407.
82. Ruff C. Growth in bone strength, body size, and muscle size in a juvenile longitudinal sample. Bone. 2003;33(3):317-329.
83. Arkin AM, Katz JF. The effects of pressure on epiphyseal growth; the mechanism of plasticity of growing bone. J Bone Joint Surg Am. 1956;38(5):1056-1076.
84. Mehlman CT, Araghi A, Roy DR. Hyphenated history: the Hueter-Volkmann law. Am J Orthop. 1997;26(11):798-800.
85. Frost HM. Biomechanical control of knee alignment: some insights from a new paradigm. Clin Orthop. 1997;(335):335-342.
86. Chenu C. Role of innervation in the control of bone remodeling. J Musculoskelet Neuronal Interact. 2004;4(2):132-134.
87. Dysart PS, Harkness EM, Herbison GP. Growth of the humerus after denervation. An experimental study in the rat. J Anat. 1989;167:147-159.
88. Pottorf JL. An experimental study of bone growth in the dog. Anat Rec. 1916;10:234-235.
89. Allison N, Brooks B. Bone atrophy. An experimental and clinical study of the changes in bone which result from non-use. Surg Gynecol Obstet. 1921;33:250-260.
90. Ring PA. The influence of the nervous system upon the growth of bones. J Bone Joint Surg Br. 1961;43:121-140.
91. Reading BD, Laor T, Salisbury SR, Lippert WC, Cornwall R. Quantification of humeral head deformity following neonatal brachial plexus palsy. J Bone Joint Surg Am. 2012;94(18):e136(1-8).
92. Moro M, van der Meulen MC, Kiratli BJ, Bachrach LK, Carter DR. Body mass is the primary determinant of midfemoral bone acquisition during adolescent growth. Bone. 1996;19(5):519-526.
93. Schoenau E, Neu CM, Mokov E, Wassmer G, Manz F. Influence of puberty on muscle area and cortical bone area and cortical of the forearm in boys and girls. J Clin Endocrinol Metab. 2000;85(3):1095-1098.
94. Schönau E. The development of the skeletal system in children and the influence of muscular strength. Horm Res. 1998;49(1):27-31.
95. Schönau E, Werhahn E, Schiedermaier U, et al. Influence of muscle strength on bone strength during childhood and adolescence. Horm Res. 1996;45(suppl 1):63-66.
96. van der Meulen MC, Ashford MW Jr, Kiratli BJ, Bachrach LK, Carter DR. Determinants of femoral geometry and structure during adolescent growth. J Orthop Res. 1996;14(1):22-29.
97. van der Meulen MC, Moro M, Kiratli BJ, Marcus R, Bachrach LK. Mechanobiology of femoral neck structure during adolescence. J Rehabil Res Dev. 2000;37(2):201-208.
98. Baron R. General principles of bone biology. In: Favus MJ, ed. Primer on the Metabolic Bone Diseases and Disorders of Mineral Metabolism. 5th ed. Washington DC: American Society for Bone and Mineral Research; 2003:1-8.
99. Parfitt AM, Travers R, Rauch F, Glorieux FH. Structural and cellular changes during bone growth in healthy children. Bone. 2000;27(4):487-494.
100. Frost HM. Skeletal structural adaptations to mechanical usage (SATMU): 2. Redefining Wolff’s law: the bone modeling problem. Anat Rec. 1990;226(4):414-422.
101. Frost HM. Skeletal structural adaptations to mechanical usage (SATMU): 1. Redefining Wolff’s law: the bone modeling problem. Anat Rec. 1990;226(4):403-413.
102. Balena R, Shih MS, Parfitt AM. Bone resorption and formation on the periosteal envelope of the ilium: a histomorphometric study in healthy women. J Bone Miner Res. 1992;7(12):1475-1482.
103. Tanner JM, Hughes PC, Whitehouse RH. Radiographically determined widths of bone muscle and fat in the upper arm and calf from age 3-18 years. Ann Hum Biol. 1981;8(6):495-517.
104. Turner RT, Wakley GK, Hannon KS. Differential effects of androgens on cortical bone histomorphometry in gonadectomized male and female rats. J Orthop Res. 1990;8(4):612-617.
105. Yeh JK, Chen MM, Aloia JF. Ovariectomy-induced high turnover in cortical bone is dependent on pituitary hormone in rats. Bone. 1996;18(5):443-450.
106. Kim BT, Mosekilde L, Duan Y, et al. The structural and hormonal basis of sex differences in peak appendicular bone strength in rats. J Bone Miner Res. 2003;18(1):150-155.
107. Parfitt AM. Parathyroid hormone and periosteal bone expansion. J Bone Miner Res. 2002;17(10):1741-1743.
108. Specker B, Binkley T. Randomized trial of physical activity and calcium supplementation on bone mineral content in 3- to 5-year-old children. J Bone Miner Res. 2003;18(5):885-892.
109. Volkman SK, Galecki AT, Burke DT, et al. Quantitative trait loci for femoral size and shape in a genetically heterogenous mouse population. J Bone Miner Res. 2003;18(8):1497-1505.
110. Goodship AE, Lanyon LE, McFie H. Functional adaptation of bone to increased stress. An experimental study. J Bone Joint Surg Am. 1979;61(4):539-546.
111. Falder S, Sinclair JS, Rogers CA, Townsend PL. Long-term behavior of the free vascularized fibula following reconstruction of large bony effects. Br J Plast Surg. 2003;56(6):571-584.
Prevention of Venous Thromboembolism After Total Joint Arthroplasty: Aspirin Is Enough for Most Patients
The orthopedic community continues to be concerned about venous thromboembolism (VTE) after orthopedic procedures. There is currently no consensus on the optimal strategy for prevention of VTE after knee and hip arthroplasty. In North America, the American Association of Orthopaedic Surgeons (AAOS) and the American College of Chest Physicians (ACCP) have both been involved in putting forth guidelines that are intended to minimize this complication after orthopedic procedures.1-2
Both of these guidelines have evaluated the available literature, whenever present, to reach their recommendations. Although the AAOS guidelines do not mention aspirin specifically, they do endorse any form of anticoagulation as acceptable after total hip and knee arthroplasty. The ACCP, on the other hand, gives their highest endorsement (1B) to aspirin as an effective prophylactic agent for prevention of VTE after total joint arthroplasty (TJA).1 In the analysis, surgeon choice of VTE prophylaxis should be based on a balance between safety and efficacy of a particular anticoagulant, with risk stratification used to identify patients at standard risk (the vast majority) or high risk of VTE or bleeding.
Recent studies have helped to dispel the age-old misconception that aspirin is an effective modality for prevention of clots in the high-pressure (arterial) system but not in the low-pressure (venous) system. The ASPIRE study evaluated 822 patients and detected that the incidence of VTE was 4.8% in patients who received aspirin versus 6.5% in patients who did not receive aspirin.3 Although the difference in the incidence of VTE in the given sample size did not reach statistical significance, the difference did reach statistical significance when other major vascular issues were taken into account.3 Another study (WARFASA), evaluating 402 patients with prior VTE, detected 42% reduction in the incidence of recurrent VTE in patients that received aspirin, confirming the fact that aspirin does indeed act on the venous low-pressure system.4
The prevailing evidence over the last decade supports the notion that aspirin is an effective agent for prevention of VTE with a lower risk of imparting many of the harms that other aggressive anticoagulant agents are likely to cause, such as wound drainage, bleeding, increased incidence of readmission, reoperation, periprosthetic infection, and even mortality.5-7
With the increasing scrutiny and penalties imposed on surgeons and health care systems by the regulatory bodies in the United States for a variety of “quality metric” considerations related to readmission and reoperation, including VTE prevention and its complications, the notion of using anticoagulant agents that are not only effective but also less harmful is gaining momentum and greater endorsement. Visiting the US Food and Drug Administration website reveals that among all drugs in the medical community, aggressive anticoagulants are associated with the highest number of adverse effects, including mortality.8
The medical community also needs to recognize that there have been immense changes in the practice of orthopedics, particularly in the realm of knee and hip arthroplasty. The majority of patients undergoing TJA receive regional anesthesia, using expeditious surgical techniques, and are mobilized immediately in the postoperative period—all of these elements have contributed to a declining incidence of VTE after TJA. Furthermore, patients are often discharged from the hospital within a day or two, making compliance with outpatient anticoagulant therapy more of a challenge. Thus, the historical protocols related to TJA—when patients stayed in bed for days before beginning a delayed and limited physical therapy program and a lengthy hospital stay—are behind us. These major changes in surgical and anesthesia techniques as well as accelerated postoperative protocols highlight the fact that any literature from the far past needs to be examined with caution as it may not be applicable to modern-day surgical patients.
Moving forward, while we strongly endorse risk stratification for VTE prophylaxis, in our opinion aspirin will become the mainstay of prevention of VTE for the majority of patients after TJA. The challenge that lies ahead is to determine which patients are at increased risk of VTE and in need of more aggressive anticoagulants. There has been a recent development on this front that aims to provide some guidance for selection of high-risk patients.9 It appears that over 90% of patients undergoing TJA can safely receive aspirin as an anticoagulation prophylaxis, while a validated risk profile can be used to detect those at higher risk for VTE and in need of more aggressive agents.9
Thanks to the diligent work of the ACCP and AAOS workgroups and many other scholars in the field, the science of VTE prophylaxis after TJA has truly evolved. The adaptation of the recent ACCP guidelines by the Surgical Care Improvement Project (SCIP), which accepts aspirin as an effective anticoagulation modality, is yet another step in the direction of optimizing outcomes for our patients, by preventing the feared VTE while also limiting untoward bleeding complications that can occur with administration of aggressive anticoagulants.10
1. Falck-Ytter Y, Francis CW, Johanson NA, et al; American College of Chest Physicians. Prevention of VTE in Orthopedic Surgery Patients: Antithrombotic Therapy and Prevention of Thrombosis, 9th ed: American College of Chest Physicians Evidence-Based Clinical Practice Guidelines. Chest. 2012;141(2 Suppl):e278S-325S.
2. Sharrock NE, Gonzalez Della Valle A, Go G, Lyman S, Salvati EA. Potent anticoagulants are associated with a higher all-cause mortality rate after hip and knee arthroplasty. Clin Orthop. 2008;466(3):714-721.
3. Brighton TA, Eikelboom JW, Mann K, et al; ASPIRE Investigators. Low-dose aspirin for preventing recurrent venous thromboembolism. N Engl J Med. 2012;367(21):1979-1987.
4. Becattini C, Agnelli G, Schenone A, et al; WARFASA Investigators. Aspirin for preventing the recurrence of venous thromboembolism. N Engl J Med. 2012;366(21):1959-1967.
5. Parvizi J, Ghanem E, Joshi A, Sharkey PF, Hozack WJ, Rothman RH. Does “excessive” anticoagulation predispose to periprosthetic infection? J Arthroplasty. 2007;22(6 Suppl 2):24-28.
6. Sachs RA, Smith JH, Kuney M, Paxton L. Does anticoagulation do more harm than good? A comparison of patients treated without prophylaxis and patients treated with low-dose warfarin after total knee arthroplasty. J Arthroplasty. 2003;18(4):389-395.
7. Lotke PA, Lonner JH. The benefit of aspirin chemoprophylaxis for thromboembolism after total knee arthroplasty. Clin Orthop. 2006;452:175-180.
8. Medical Product Safety Information. US Food and Drug Administration website. http://www.fda.gov/Safety/MedWatch/SafetyInformation/default.htm. Updated December 11, 2014. Accessed December 29, 2014.
9. Parvizi J, Huang R, Raphael IJ, Arnold WV, Rothman RH. Symptomatic pulmonary embolus after joint arthroplasty: stratification of risk factors. Clin Orthop. 2014;472(3):903-912.
10. Mont MA, Hozack WJ, Callaghan JJ, Krebs V, Parvizi J, Mason JB. Venous thromboemboli following total joint arthroplasty: SCIP measures move us closer to an agreement. J Arthroplasty. 2014;29(4):651-652.
The orthopedic community continues to be concerned about venous thromboembolism (VTE) after orthopedic procedures. There is currently no consensus on the optimal strategy for prevention of VTE after knee and hip arthroplasty. In North America, the American Association of Orthopaedic Surgeons (AAOS) and the American College of Chest Physicians (ACCP) have both been involved in putting forth guidelines that are intended to minimize this complication after orthopedic procedures.1-2
Both of these guidelines have evaluated the available literature, whenever present, to reach their recommendations. Although the AAOS guidelines do not mention aspirin specifically, they do endorse any form of anticoagulation as acceptable after total hip and knee arthroplasty. The ACCP, on the other hand, gives their highest endorsement (1B) to aspirin as an effective prophylactic agent for prevention of VTE after total joint arthroplasty (TJA).1 In the analysis, surgeon choice of VTE prophylaxis should be based on a balance between safety and efficacy of a particular anticoagulant, with risk stratification used to identify patients at standard risk (the vast majority) or high risk of VTE or bleeding.
Recent studies have helped to dispel the age-old misconception that aspirin is an effective modality for prevention of clots in the high-pressure (arterial) system but not in the low-pressure (venous) system. The ASPIRE study evaluated 822 patients and detected that the incidence of VTE was 4.8% in patients who received aspirin versus 6.5% in patients who did not receive aspirin.3 Although the difference in the incidence of VTE in the given sample size did not reach statistical significance, the difference did reach statistical significance when other major vascular issues were taken into account.3 Another study (WARFASA), evaluating 402 patients with prior VTE, detected 42% reduction in the incidence of recurrent VTE in patients that received aspirin, confirming the fact that aspirin does indeed act on the venous low-pressure system.4
The prevailing evidence over the last decade supports the notion that aspirin is an effective agent for prevention of VTE with a lower risk of imparting many of the harms that other aggressive anticoagulant agents are likely to cause, such as wound drainage, bleeding, increased incidence of readmission, reoperation, periprosthetic infection, and even mortality.5-7
With the increasing scrutiny and penalties imposed on surgeons and health care systems by the regulatory bodies in the United States for a variety of “quality metric” considerations related to readmission and reoperation, including VTE prevention and its complications, the notion of using anticoagulant agents that are not only effective but also less harmful is gaining momentum and greater endorsement. Visiting the US Food and Drug Administration website reveals that among all drugs in the medical community, aggressive anticoagulants are associated with the highest number of adverse effects, including mortality.8
The medical community also needs to recognize that there have been immense changes in the practice of orthopedics, particularly in the realm of knee and hip arthroplasty. The majority of patients undergoing TJA receive regional anesthesia, using expeditious surgical techniques, and are mobilized immediately in the postoperative period—all of these elements have contributed to a declining incidence of VTE after TJA. Furthermore, patients are often discharged from the hospital within a day or two, making compliance with outpatient anticoagulant therapy more of a challenge. Thus, the historical protocols related to TJA—when patients stayed in bed for days before beginning a delayed and limited physical therapy program and a lengthy hospital stay—are behind us. These major changes in surgical and anesthesia techniques as well as accelerated postoperative protocols highlight the fact that any literature from the far past needs to be examined with caution as it may not be applicable to modern-day surgical patients.
Moving forward, while we strongly endorse risk stratification for VTE prophylaxis, in our opinion aspirin will become the mainstay of prevention of VTE for the majority of patients after TJA. The challenge that lies ahead is to determine which patients are at increased risk of VTE and in need of more aggressive anticoagulants. There has been a recent development on this front that aims to provide some guidance for selection of high-risk patients.9 It appears that over 90% of patients undergoing TJA can safely receive aspirin as an anticoagulation prophylaxis, while a validated risk profile can be used to detect those at higher risk for VTE and in need of more aggressive agents.9
Thanks to the diligent work of the ACCP and AAOS workgroups and many other scholars in the field, the science of VTE prophylaxis after TJA has truly evolved. The adaptation of the recent ACCP guidelines by the Surgical Care Improvement Project (SCIP), which accepts aspirin as an effective anticoagulation modality, is yet another step in the direction of optimizing outcomes for our patients, by preventing the feared VTE while also limiting untoward bleeding complications that can occur with administration of aggressive anticoagulants.10
1. Falck-Ytter Y, Francis CW, Johanson NA, et al; American College of Chest Physicians. Prevention of VTE in Orthopedic Surgery Patients: Antithrombotic Therapy and Prevention of Thrombosis, 9th ed: American College of Chest Physicians Evidence-Based Clinical Practice Guidelines. Chest. 2012;141(2 Suppl):e278S-325S.
2. Sharrock NE, Gonzalez Della Valle A, Go G, Lyman S, Salvati EA. Potent anticoagulants are associated with a higher all-cause mortality rate after hip and knee arthroplasty. Clin Orthop. 2008;466(3):714-721.
3. Brighton TA, Eikelboom JW, Mann K, et al; ASPIRE Investigators. Low-dose aspirin for preventing recurrent venous thromboembolism. N Engl J Med. 2012;367(21):1979-1987.
4. Becattini C, Agnelli G, Schenone A, et al; WARFASA Investigators. Aspirin for preventing the recurrence of venous thromboembolism. N Engl J Med. 2012;366(21):1959-1967.
5. Parvizi J, Ghanem E, Joshi A, Sharkey PF, Hozack WJ, Rothman RH. Does “excessive” anticoagulation predispose to periprosthetic infection? J Arthroplasty. 2007;22(6 Suppl 2):24-28.
6. Sachs RA, Smith JH, Kuney M, Paxton L. Does anticoagulation do more harm than good? A comparison of patients treated without prophylaxis and patients treated with low-dose warfarin after total knee arthroplasty. J Arthroplasty. 2003;18(4):389-395.
7. Lotke PA, Lonner JH. The benefit of aspirin chemoprophylaxis for thromboembolism after total knee arthroplasty. Clin Orthop. 2006;452:175-180.
8. Medical Product Safety Information. US Food and Drug Administration website. http://www.fda.gov/Safety/MedWatch/SafetyInformation/default.htm. Updated December 11, 2014. Accessed December 29, 2014.
9. Parvizi J, Huang R, Raphael IJ, Arnold WV, Rothman RH. Symptomatic pulmonary embolus after joint arthroplasty: stratification of risk factors. Clin Orthop. 2014;472(3):903-912.
10. Mont MA, Hozack WJ, Callaghan JJ, Krebs V, Parvizi J, Mason JB. Venous thromboemboli following total joint arthroplasty: SCIP measures move us closer to an agreement. J Arthroplasty. 2014;29(4):651-652.

Treatment of Proximal Humerus Fractures: Comparison of Shoulder and Trauma Surgeons
Proximal humerus fractures (PHFs), AO/OTA (Ar beitsgemeinschaft für Osteosynthesefragen/Orthopaedic Trauma Association) type 11,1 are common, representing 4% to 5% of all fractures in adults.2 However, there is no consensus as to optimal management of these injuries, with some reports supporting and others rejecting the various fixation methods,3 and there are no evidence-based practice guidelines informing treatment decisions.4 Not surprisingly, orthopedic surgeons do not agree on ideal treatment for PHFs5,6 and differ by region in their rates of surgical management.2 In addition, analyses of national databases have found variation in choice of surgical treatment for PHFs between surgeons and between hospitals of different patient volumes.4 Few studies have assessed surgeon agreement on treatment decisions. Findings from these limited investigations indicate there is little agreement on treatment choices, but training may have some impact.5-7 In 3 studies,5-7 shoulder and trauma fellowship–trained surgeons differed in their management of PHFs both in terms of rates of operative treatment5,7 and specific operative management choices.5,6 No study has assessed surgeon agreement on radiographic outcomes.
We conducted a study to compare expert shoulder and trauma surgeons’ treatment decision-making and agreement on final radiographic outcomes of surgically treated PHFs. We hypothesized there would be poor agreement on treatment decisions and better agreement on radiographic outcomes, with a difference between shoulder and trauma fellowship–trained surgeons.
Materials and Methods
After receiving institutional review board approval for this study, we collected data on 100 consecutive PHFs (AO/OTA type 111) surgically treated at 2 affiliated level I trauma centers between January 2004 and July 2008. None of the cases in the series was managed by any of the surgeons participating in this study.
We created a PowerPoint (Microsoft, Redmond, Washington) survey that included radiographs (preoperative, immediate postoperative, final postoperative) and, if available, a computed tomography image. This survey was sent to 4 orthopedic surgeons: Drs. Gardner, Gerber, Lorich, and Walch. Two of these authors are fellowship-trained in shoulder surgery, the other 2 in orthopedic traumatology with specialization in treating PHFs. All are internationally renowned in PHF management. Using the survey images and a 4-point Likert scale ranging from disagree strongly to agree strongly, the examiners rated their agreement with treatment decisions (arthroplasty vs fixation). They also rated (very poor to very good) immediate postoperative reduction or arthroplasty placement, immediate postoperative fixation methods for fractures treated with open reduction and internal fixation (ORIF), and final radiographic outcomes.
Interobserver agreement was calculated using the intraclass correlation coefficient (ICC),8,9 with scores of <0.2 (poor), 0.21 to 0.4 (fair), 0.41 to 0.6 (moderate), 0.61 to 0.8 (good), and >0.8 (excellent) used to indicate agreement among observers. ICC scores were determined by treating the 4 examiners as independent entities. Subgroup analyses were also performed to determine ICC scores comparing the 2 shoulder surgeons, comparing the 2 trauma surgeons, and comparing the shoulder surgeons and trauma surgeons as 2 separate groups. ICC scores were used instead of κ coefficients to assess agreement because ICC scores treat ratings as continuous variables, allow for comparison of 2 or more raters, and allow for assessment of correlation among raters, whereas κ coefficients treat data as categorical variables and assume the ratings have no natural ordering. ICC scores were generated by SAS 9.1.3 software (SAS Institute, Cary, North Carolina).
Results
The 4 surgeons’ overall ICC scores for agreement with the rating of immediate reduction or arthroplasty placement and the rating of final radiographic outcome indicated moderate levels of agreement (Table 1). Regarding treatment decision-making and ratings of fixation, the surgeons demonstrated poor and fair levels of agreement, respectively.
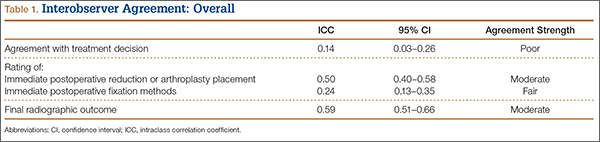
The ICC scores comparing the shoulder and trauma surgeons revealed similar levels of agreement (Table 2): moderate levels of agreement for ratings of both immediate postoperative reduction or arthroplasty placement and final radiographic outcomes, but poor and fair levels of agreement regarding treatment decision-making and the rating of immediate postoperative fixation methods for fractures treated with ORIF, respectively.
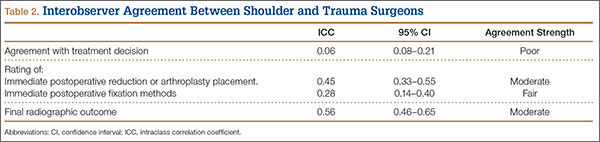
Subgroup analysis revealed that the 2 shoulder surgeons had poor and fair levels of agreement for treatment decisions and rating of immediate postoperative fixation, respectively, though they moderately agreed on rating of immediate postoperative reduction or arthroplasty placement and rating of final radiographic outcome (Table 3). When the 2 trauma surgeons were compared with each other, ICC scores revealed higher levels of agreement overall (Table 4). In other words, the 2 trauma surgeons agreed with each other more than the 2 shoulder surgeons agreed with each other.
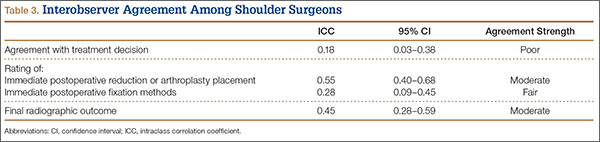
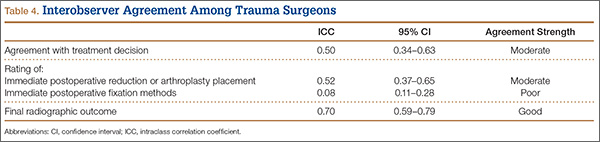
Discussion
This study had 3 major findings: (1) Surgeons do not agree on treatment decisions, including fixation methods, regarding PHFs; (2) regardless of their opinions on ideal treatment, they moderately agree on reductions and final radiographic outcomes; (3) expert trauma surgeons may agree more on treatment decisions than expert shoulder surgeons do. In other words, surgeons do not agree on the best treatment, but they radiographically recognize when a procedure has been performed technically well or poorly. These results support our hypothesis and the limited current literature.
An analysis of Medicare databases showed marked regional variation in rates of operative treatment of PHFs.2 Similarly, a Nationwide Inpatient Sample analysis revealed nationwide variation in operative management of PHFs.4 Both findings are consistent with our results of poor agreement about treatment decisions and ratings of postoperative fixation of PHFs. In 2010, Petit and colleagues6 reported that surgeons do not agree on PHF management. In 2011, Foroohar and colleagues10 similarly reported low interobserver agreement for treatment recommendations made by 4 upper extremity orthopedic specialists, 4 general orthopedic surgeons, 4 senior residents, and 4 junior residents, for a series of 16 PHFs—also consistent with our findings.
The lack of agreement about PHF treatment may reflect a difference in training, particularly in light of the recent expansion of shoulder and elbow fellowships.2 Three separate studies performed at 2 affiliated level I trauma centers demonstrated significant differences in treatment decision-making between shoulder and trauma fellowship–trained surgeons.5-7 Our results are consistent with the hypothesis that training affects treatment decision-making, as we found poor agreement between shoulder and trauma fellowship–trained surgeons regarding treatment decision for PHFs. Subanalyses revealed that expert trauma surgeons agreed with each other on treatment decisions more than expert shoulder surgeons agreed with each other, further suggesting that training may affect how surgeons manage PHFs. Differences in fellowship training even within the same specialty may account for the observed lesser levels of agreement between the shoulder surgeons, even among experts in the field.
The evidence for optimal treatment historically has been poor,4,6 with few high-quality prospective, randomized controlled studies on the topic up until the past few years. The most recent Cochrane Review on optimal PHF treatment concluded that there is insufficient evidence to make an evidence-based recommendation and that the long-term benefit of surgery is unclear.11 However, at least 5 controlled trials on the topic have been published within the past 5 years.12-16 The evidence is striking and generally supports nonoperative treatment for most PHFs, including some displaced fractures—contrary to general orthopedic practice in many parts of the United States,2 which hitherto had been based mainly on individual surgeon experience and the limited literature. Without strong evidence to support one treatment option over another, surgeons are left with no objective, scientific way of coming to agreement.
Related to the poor status quo of evidence for PHF treatments is new technology (eg, locking plates, reverse total shoulder arthroplasty) that has expanded surgical indications.2,17 Although such developments have the potential to improve surgical treatments, they may also exacerbate the disagreement between surgeons regarding optimal operative treatment of PHFs. This potential consequence of new technology may be reflected in our finding of disagreement among surgeons on immediate postoperative fixation methods. Precisely because they are new, such technological innovations have limited evidence supporting their use. This leaves surgeons with little to nothing to inform their decisions to use these devices, other than familiarity with and impressions of the new technology.
Our study had several limitations. First is the small sample size, of surgeons who are leaders in the field. Our sample therefore may not be generalizable to the general population of shoulder and trauma surgeons. Second, we did not calculate intraobserver variability. Third, inherent to studies of interobserver agreement is the uncertainty of their clinical relevance. In the clinical setting, a surgeon has much more information at hand (eg, patient history, physical examination findings, colleague consultations), thus raising the possibility of underestimations of interobserver agreements.18 Fourth, our comparison of surgeons’ ratings of outcomes was purely radiographic, which may or may not represent or be indicative of clinical outcomes (eg, pain relief, function, range of motion, patient satisfaction). The conclusions we may draw are accordingly limited, as we did not directly evaluate clinical outcome parameters.
Our study had several strengths as well. First, to our knowledge this is the first study to assess interobserver variability in surgeons’ ratings of radiographic outcomes. Its findings may provide further insight into the reasons for poor agreement among orthopedic surgeons on both classification and treatment of PHFs. Second, our surveying of internationally renowned expert surgeons from 4 different institutions may have helped reduce single-institution bias, and it presents the highest level of expertise in the treatment of PHFs.
Although the surgeons in our study moderately agreed on final radiographic outcomes of PHFs, such levels of agreement may still be clinically unacceptable.19 The overall disagreement on treatment decisions highlights the need for better evidence for optimal treatment of PHFs in order to improve consensus, particularly with anticipated increases in age and comorbidities in the population in coming years.4 Subgroup analysis suggested trauma fellowships may contribute to better treatment agreement, though this idea requires further study, perhaps by surveying shoulder and trauma fellowship directors and their curricula for variability in teaching treatment decision-making. The surgeons in our study agreed more on what they consider acceptable final radiographic outcomes, which is encouraging. However, treatment consensus is the primary goal. The recent publication of prospective, randomized studies is helping with this issue, but more studies are needed. It is encouraging that several are planned or under way.20-22
Conclusion
The surgeons surveyed in this study did not agree on ideal treatment for PHFs but moderately agreed on quality of radiographic outcomes. These differences may reflect a difference in training. We conducted this study to compare experienced shoulder and trauma fellowship–trained surgeons’ treatment decision-making and ratings of radiographic outcomes of PHFs when presented with the same group of patients managed at 2 level I trauma centers. We hypothesized there would be little agreement on treatment decisions, better agreement on final radiographic outcome, and a difference between decision-making and ratings of radiographic outcomes between expert shoulder and trauma surgeons. Our results showed that surgeons do not agree on the best treatment for PHFs but radiographically recognize when an operative treatment has been performed well or poorly. Regarding treatment decisions, our results also showed that expert trauma surgeons may agree more with each other than shoulder surgeons agree with each other. These results support our hypothesis and the limited current literature. The overall disagreement among the surgeons in our study and an aging population that grows sicker each year highlight the need for better evidence for the optimal treatment of PHFs in order to improve consensus.
1. Marsh JL, Slongo TF, Agel J, et al. Fracture and dislocation classification compendium – 2007: Orthopaedic Trauma Association classification, database and outcomes committee. J Orthop Trauma. 2007;21(10 suppl):S1-S133.
2. Bell JE, Leung BC, Spratt KF, et al. Trends and variation in incidence, surgical treatment, and repeat surgery of proximal humeral fractures in the elderly. J Bone Joint Surg Am. 2011;93(2):121-131.
3. McLaurin TM. Proximal humerus fractures in the elderly are we operating on too many? Bull Hosp Jt Dis. 2004;62(1-2):24-32.
4. Jain NB, Kuye I, Higgins LD, Warner JJP. Surgeon volume is associated with cost and variation in surgical treatment of proximal humeral fractures. Clin Orthop. 2012;471(2):655-664.
5. Boykin RE, Jawa A, O’Brien T, Higgins LD, Warner JJP. Variability in operative management of proximal humerus fractures. Shoulder Elbow. 2011;3(4):197-201.
6. Petit CJ, Millett PJ, Endres NK, Diller D, Harris MB, Warner JJP. Management of proximal humeral fractures: surgeons don’t agree. J Shoulder Elbow Surg. 2010;19(3):446-451.
7. Okike K, Lee OC, Makanji H, Harris MB, Vrahas MS. Factors associated with the decision for operative versus non-operative treatment of displaced proximal humerus fractures in the elderly. Injury. 2013;44(4):448-455.
8. Kodali P, Jones MH, Polster J, Miniaci A, Fening SD. Accuracy of measurement of Hill-Sachs lesions with computed tomography. J Shoulder Elbow Surg. 2011;20(8):1328-1334.
9. Shrout PE, Fleiss JL. Intraclass correlations: uses in assessing rater reliability. Psychol Bull. 1979;86(2):420-428.
10. Foroohar A, Tosti R, Richmond JM, Gaughan JP, Ilyas AM. Classification and treatment of proximal humerus fractures: inter-observer reliability and agreement across imaging modalities and experience. J Orthop Surg Res. 2011;6:38.
11. Handoll HH, Ollivere BJ. Interventions for treating proximal humeral fractures in adults. Cochrane Database Syst Rev. 2010;(12):CD000434.
12. Boons HW, Goosen JH, van Grinsven S, van Susante JL, van Loon CJ. Hemiarthroplasty for humeral four-part fractures for patients 65 years and older: a randomized controlled trial. Clin Orthop. 2012;470(12):3483-3491.
13. Fjalestad T, Hole MØ, Hovden IAH, Blücher J, Strømsøe K. Surgical treatment with an angular stable plate for complex displaced proximal humeral fractures in elderly patients: a randomized controlled trial. J Orthop Trauma. 2012;26(2):98-106.
14. Fjalestad T, Hole MØ, Jørgensen JJ, Strømsøe K, Kristiansen IS. Health and cost consequences of surgical versus conservative treatment for a comminuted proximal humeral fracture in elderly patients. Injury. 2010;41(6):599-605.
15. Olerud P, Ahrengart L, Ponzer S, Saving J, Tidermark J. Internal fixation versus nonoperative treatment of displaced 3-part proximal humeral fractures in elderly patients: a randomized controlled trial. J Shoulder Elbow Surg. 2011;20(5):747-755.
16. Olerud P, Ahrengart L, Ponzer S, Saving J, Tidermark J. Hemiarthroplasty versus nonoperative treatment of displaced 4-part proximal humeral fractures in elderly patients: a randomized controlled trial. J Shoulder Elbow Surg. 2011;20(7):1025-1033.
17. Agudelo J, Schürmann M, Stahel P, et al. Analysis of efficacy and failure in proximal humerus fractures treated with locking plates. J Orthop Trauma. 2007;21(10):676-681.
18. Brorson S, Hróbjartsson A. Training improves agreement among doctors using the Neer system for proximal humeral fractures in a systematic review. J Clin Epidemiol. 2008;61(1):7-16.
19. Brorson S, Olsen BS, Frich LH, et al. Surgeons agree more on treatment recommendations than on classification of proximal humeral fractures. BMC Musculoskelet Disord. 2012;13:114.
20. Handoll H, Brealey S, Rangan A, et al. Protocol for the ProFHER (PROximal Fracture of the Humerus: Evaluation by Randomisation) trial: a pragmatic multi-centre randomised controlled trial of surgical versus non-surgical treatment for proximal fracture of the humerus in adults. BMC Musculoskelet Disord. 2009;10:140.
21. Den Hartog D, Van Lieshout EMM, Tuinebreijer WE, et al. Primary hemiarthroplasty versus conservative treatment for comminuted fractures of the proximal humerus in the elderly (ProCon): a multicenter randomized controlled trial. BMC Musculoskelet Disord. 2010;11:97.
22. Verbeek PA, van den Akker-Scheek I, Wendt KW, Diercks RL. Hemiarthroplasty versus angle-stable locking compression plate osteosynthesis in the treatment of three- and four-part fractures of the proximal humerus in the elderly: design of a randomized controlled trial. BMC Musculoskelet Disord. 2012;13:16.
Proximal humerus fractures (PHFs), AO/OTA (Ar beitsgemeinschaft für Osteosynthesefragen/Orthopaedic Trauma Association) type 11,1 are common, representing 4% to 5% of all fractures in adults.2 However, there is no consensus as to optimal management of these injuries, with some reports supporting and others rejecting the various fixation methods,3 and there are no evidence-based practice guidelines informing treatment decisions.4 Not surprisingly, orthopedic surgeons do not agree on ideal treatment for PHFs5,6 and differ by region in their rates of surgical management.2 In addition, analyses of national databases have found variation in choice of surgical treatment for PHFs between surgeons and between hospitals of different patient volumes.4 Few studies have assessed surgeon agreement on treatment decisions. Findings from these limited investigations indicate there is little agreement on treatment choices, but training may have some impact.5-7 In 3 studies,5-7 shoulder and trauma fellowship–trained surgeons differed in their management of PHFs both in terms of rates of operative treatment5,7 and specific operative management choices.5,6 No study has assessed surgeon agreement on radiographic outcomes.
We conducted a study to compare expert shoulder and trauma surgeons’ treatment decision-making and agreement on final radiographic outcomes of surgically treated PHFs. We hypothesized there would be poor agreement on treatment decisions and better agreement on radiographic outcomes, with a difference between shoulder and trauma fellowship–trained surgeons.
Materials and Methods
After receiving institutional review board approval for this study, we collected data on 100 consecutive PHFs (AO/OTA type 111) surgically treated at 2 affiliated level I trauma centers between January 2004 and July 2008. None of the cases in the series was managed by any of the surgeons participating in this study.
We created a PowerPoint (Microsoft, Redmond, Washington) survey that included radiographs (preoperative, immediate postoperative, final postoperative) and, if available, a computed tomography image. This survey was sent to 4 orthopedic surgeons: Drs. Gardner, Gerber, Lorich, and Walch. Two of these authors are fellowship-trained in shoulder surgery, the other 2 in orthopedic traumatology with specialization in treating PHFs. All are internationally renowned in PHF management. Using the survey images and a 4-point Likert scale ranging from disagree strongly to agree strongly, the examiners rated their agreement with treatment decisions (arthroplasty vs fixation). They also rated (very poor to very good) immediate postoperative reduction or arthroplasty placement, immediate postoperative fixation methods for fractures treated with open reduction and internal fixation (ORIF), and final radiographic outcomes.
Interobserver agreement was calculated using the intraclass correlation coefficient (ICC),8,9 with scores of <0.2 (poor), 0.21 to 0.4 (fair), 0.41 to 0.6 (moderate), 0.61 to 0.8 (good), and >0.8 (excellent) used to indicate agreement among observers. ICC scores were determined by treating the 4 examiners as independent entities. Subgroup analyses were also performed to determine ICC scores comparing the 2 shoulder surgeons, comparing the 2 trauma surgeons, and comparing the shoulder surgeons and trauma surgeons as 2 separate groups. ICC scores were used instead of κ coefficients to assess agreement because ICC scores treat ratings as continuous variables, allow for comparison of 2 or more raters, and allow for assessment of correlation among raters, whereas κ coefficients treat data as categorical variables and assume the ratings have no natural ordering. ICC scores were generated by SAS 9.1.3 software (SAS Institute, Cary, North Carolina).
Results
The 4 surgeons’ overall ICC scores for agreement with the rating of immediate reduction or arthroplasty placement and the rating of final radiographic outcome indicated moderate levels of agreement (Table 1). Regarding treatment decision-making and ratings of fixation, the surgeons demonstrated poor and fair levels of agreement, respectively.
The ICC scores comparing the shoulder and trauma surgeons revealed similar levels of agreement (Table 2): moderate levels of agreement for ratings of both immediate postoperative reduction or arthroplasty placement and final radiographic outcomes, but poor and fair levels of agreement regarding treatment decision-making and the rating of immediate postoperative fixation methods for fractures treated with ORIF, respectively.
Subgroup analysis revealed that the 2 shoulder surgeons had poor and fair levels of agreement for treatment decisions and rating of immediate postoperative fixation, respectively, though they moderately agreed on rating of immediate postoperative reduction or arthroplasty placement and rating of final radiographic outcome (Table 3). When the 2 trauma surgeons were compared with each other, ICC scores revealed higher levels of agreement overall (Table 4). In other words, the 2 trauma surgeons agreed with each other more than the 2 shoulder surgeons agreed with each other.
Discussion
This study had 3 major findings: (1) Surgeons do not agree on treatment decisions, including fixation methods, regarding PHFs; (2) regardless of their opinions on ideal treatment, they moderately agree on reductions and final radiographic outcomes; (3) expert trauma surgeons may agree more on treatment decisions than expert shoulder surgeons do. In other words, surgeons do not agree on the best treatment, but they radiographically recognize when a procedure has been performed technically well or poorly. These results support our hypothesis and the limited current literature.
An analysis of Medicare databases showed marked regional variation in rates of operative treatment of PHFs.2 Similarly, a Nationwide Inpatient Sample analysis revealed nationwide variation in operative management of PHFs.4 Both findings are consistent with our results of poor agreement about treatment decisions and ratings of postoperative fixation of PHFs. In 2010, Petit and colleagues6 reported that surgeons do not agree on PHF management. In 2011, Foroohar and colleagues10 similarly reported low interobserver agreement for treatment recommendations made by 4 upper extremity orthopedic specialists, 4 general orthopedic surgeons, 4 senior residents, and 4 junior residents, for a series of 16 PHFs—also consistent with our findings.
The lack of agreement about PHF treatment may reflect a difference in training, particularly in light of the recent expansion of shoulder and elbow fellowships.2 Three separate studies performed at 2 affiliated level I trauma centers demonstrated significant differences in treatment decision-making between shoulder and trauma fellowship–trained surgeons.5-7 Our results are consistent with the hypothesis that training affects treatment decision-making, as we found poor agreement between shoulder and trauma fellowship–trained surgeons regarding treatment decision for PHFs. Subanalyses revealed that expert trauma surgeons agreed with each other on treatment decisions more than expert shoulder surgeons agreed with each other, further suggesting that training may affect how surgeons manage PHFs. Differences in fellowship training even within the same specialty may account for the observed lesser levels of agreement between the shoulder surgeons, even among experts in the field.
The evidence for optimal treatment historically has been poor,4,6 with few high-quality prospective, randomized controlled studies on the topic up until the past few years. The most recent Cochrane Review on optimal PHF treatment concluded that there is insufficient evidence to make an evidence-based recommendation and that the long-term benefit of surgery is unclear.11 However, at least 5 controlled trials on the topic have been published within the past 5 years.12-16 The evidence is striking and generally supports nonoperative treatment for most PHFs, including some displaced fractures—contrary to general orthopedic practice in many parts of the United States,2 which hitherto had been based mainly on individual surgeon experience and the limited literature. Without strong evidence to support one treatment option over another, surgeons are left with no objective, scientific way of coming to agreement.
Related to the poor status quo of evidence for PHF treatments is new technology (eg, locking plates, reverse total shoulder arthroplasty) that has expanded surgical indications.2,17 Although such developments have the potential to improve surgical treatments, they may also exacerbate the disagreement between surgeons regarding optimal operative treatment of PHFs. This potential consequence of new technology may be reflected in our finding of disagreement among surgeons on immediate postoperative fixation methods. Precisely because they are new, such technological innovations have limited evidence supporting their use. This leaves surgeons with little to nothing to inform their decisions to use these devices, other than familiarity with and impressions of the new technology.
Our study had several limitations. First is the small sample size, of surgeons who are leaders in the field. Our sample therefore may not be generalizable to the general population of shoulder and trauma surgeons. Second, we did not calculate intraobserver variability. Third, inherent to studies of interobserver agreement is the uncertainty of their clinical relevance. In the clinical setting, a surgeon has much more information at hand (eg, patient history, physical examination findings, colleague consultations), thus raising the possibility of underestimations of interobserver agreements.18 Fourth, our comparison of surgeons’ ratings of outcomes was purely radiographic, which may or may not represent or be indicative of clinical outcomes (eg, pain relief, function, range of motion, patient satisfaction). The conclusions we may draw are accordingly limited, as we did not directly evaluate clinical outcome parameters.
Our study had several strengths as well. First, to our knowledge this is the first study to assess interobserver variability in surgeons’ ratings of radiographic outcomes. Its findings may provide further insight into the reasons for poor agreement among orthopedic surgeons on both classification and treatment of PHFs. Second, our surveying of internationally renowned expert surgeons from 4 different institutions may have helped reduce single-institution bias, and it presents the highest level of expertise in the treatment of PHFs.
Although the surgeons in our study moderately agreed on final radiographic outcomes of PHFs, such levels of agreement may still be clinically unacceptable.19 The overall disagreement on treatment decisions highlights the need for better evidence for optimal treatment of PHFs in order to improve consensus, particularly with anticipated increases in age and comorbidities in the population in coming years.4 Subgroup analysis suggested trauma fellowships may contribute to better treatment agreement, though this idea requires further study, perhaps by surveying shoulder and trauma fellowship directors and their curricula for variability in teaching treatment decision-making. The surgeons in our study agreed more on what they consider acceptable final radiographic outcomes, which is encouraging. However, treatment consensus is the primary goal. The recent publication of prospective, randomized studies is helping with this issue, but more studies are needed. It is encouraging that several are planned or under way.20-22
Conclusion
The surgeons surveyed in this study did not agree on ideal treatment for PHFs but moderately agreed on quality of radiographic outcomes. These differences may reflect a difference in training. We conducted this study to compare experienced shoulder and trauma fellowship–trained surgeons’ treatment decision-making and ratings of radiographic outcomes of PHFs when presented with the same group of patients managed at 2 level I trauma centers. We hypothesized there would be little agreement on treatment decisions, better agreement on final radiographic outcome, and a difference between decision-making and ratings of radiographic outcomes between expert shoulder and trauma surgeons. Our results showed that surgeons do not agree on the best treatment for PHFs but radiographically recognize when an operative treatment has been performed well or poorly. Regarding treatment decisions, our results also showed that expert trauma surgeons may agree more with each other than shoulder surgeons agree with each other. These results support our hypothesis and the limited current literature. The overall disagreement among the surgeons in our study and an aging population that grows sicker each year highlight the need for better evidence for the optimal treatment of PHFs in order to improve consensus.
1. Marsh JL, Slongo TF, Agel J, et al. Fracture and dislocation classification compendium – 2007: Orthopaedic Trauma Association classification, database and outcomes committee. J Orthop Trauma. 2007;21(10 suppl):S1-S133.
2. Bell JE, Leung BC, Spratt KF, et al. Trends and variation in incidence, surgical treatment, and repeat surgery of proximal humeral fractures in the elderly. J Bone Joint Surg Am. 2011;93(2):121-131.
3. McLaurin TM. Proximal humerus fractures in the elderly are we operating on too many? Bull Hosp Jt Dis. 2004;62(1-2):24-32.
4. Jain NB, Kuye I, Higgins LD, Warner JJP. Surgeon volume is associated with cost and variation in surgical treatment of proximal humeral fractures. Clin Orthop. 2012;471(2):655-664.
5. Boykin RE, Jawa A, O’Brien T, Higgins LD, Warner JJP. Variability in operative management of proximal humerus fractures. Shoulder Elbow. 2011;3(4):197-201.
6. Petit CJ, Millett PJ, Endres NK, Diller D, Harris MB, Warner JJP. Management of proximal humeral fractures: surgeons don’t agree. J Shoulder Elbow Surg. 2010;19(3):446-451.
7. Okike K, Lee OC, Makanji H, Harris MB, Vrahas MS. Factors associated with the decision for operative versus non-operative treatment of displaced proximal humerus fractures in the elderly. Injury. 2013;44(4):448-455.
8. Kodali P, Jones MH, Polster J, Miniaci A, Fening SD. Accuracy of measurement of Hill-Sachs lesions with computed tomography. J Shoulder Elbow Surg. 2011;20(8):1328-1334.
9. Shrout PE, Fleiss JL. Intraclass correlations: uses in assessing rater reliability. Psychol Bull. 1979;86(2):420-428.
10. Foroohar A, Tosti R, Richmond JM, Gaughan JP, Ilyas AM. Classification and treatment of proximal humerus fractures: inter-observer reliability and agreement across imaging modalities and experience. J Orthop Surg Res. 2011;6:38.
11. Handoll HH, Ollivere BJ. Interventions for treating proximal humeral fractures in adults. Cochrane Database Syst Rev. 2010;(12):CD000434.
12. Boons HW, Goosen JH, van Grinsven S, van Susante JL, van Loon CJ. Hemiarthroplasty for humeral four-part fractures for patients 65 years and older: a randomized controlled trial. Clin Orthop. 2012;470(12):3483-3491.
13. Fjalestad T, Hole MØ, Hovden IAH, Blücher J, Strømsøe K. Surgical treatment with an angular stable plate for complex displaced proximal humeral fractures in elderly patients: a randomized controlled trial. J Orthop Trauma. 2012;26(2):98-106.
14. Fjalestad T, Hole MØ, Jørgensen JJ, Strømsøe K, Kristiansen IS. Health and cost consequences of surgical versus conservative treatment for a comminuted proximal humeral fracture in elderly patients. Injury. 2010;41(6):599-605.
15. Olerud P, Ahrengart L, Ponzer S, Saving J, Tidermark J. Internal fixation versus nonoperative treatment of displaced 3-part proximal humeral fractures in elderly patients: a randomized controlled trial. J Shoulder Elbow Surg. 2011;20(5):747-755.
16. Olerud P, Ahrengart L, Ponzer S, Saving J, Tidermark J. Hemiarthroplasty versus nonoperative treatment of displaced 4-part proximal humeral fractures in elderly patients: a randomized controlled trial. J Shoulder Elbow Surg. 2011;20(7):1025-1033.
17. Agudelo J, Schürmann M, Stahel P, et al. Analysis of efficacy and failure in proximal humerus fractures treated with locking plates. J Orthop Trauma. 2007;21(10):676-681.
18. Brorson S, Hróbjartsson A. Training improves agreement among doctors using the Neer system for proximal humeral fractures in a systematic review. J Clin Epidemiol. 2008;61(1):7-16.
19. Brorson S, Olsen BS, Frich LH, et al. Surgeons agree more on treatment recommendations than on classification of proximal humeral fractures. BMC Musculoskelet Disord. 2012;13:114.
20. Handoll H, Brealey S, Rangan A, et al. Protocol for the ProFHER (PROximal Fracture of the Humerus: Evaluation by Randomisation) trial: a pragmatic multi-centre randomised controlled trial of surgical versus non-surgical treatment for proximal fracture of the humerus in adults. BMC Musculoskelet Disord. 2009;10:140.
21. Den Hartog D, Van Lieshout EMM, Tuinebreijer WE, et al. Primary hemiarthroplasty versus conservative treatment for comminuted fractures of the proximal humerus in the elderly (ProCon): a multicenter randomized controlled trial. BMC Musculoskelet Disord. 2010;11:97.
22. Verbeek PA, van den Akker-Scheek I, Wendt KW, Diercks RL. Hemiarthroplasty versus angle-stable locking compression plate osteosynthesis in the treatment of three- and four-part fractures of the proximal humerus in the elderly: design of a randomized controlled trial. BMC Musculoskelet Disord. 2012;13:16.
The Effect of Humeral Rotation on Elbow Range-of-Motion Measurements
Elbow motion is crucial for activities of daily living and full function of the upper extremity.1 Measuring the elbow flexion arc accurately and consistently is an important part of the physical examination of patients with elbow pathology. Orthopedic surgeons rely on these measurements to follow patients over time, and they often base their treatment decisions on the range and progression/regression of motion arc.
In the clinical setting, elbow range of motion (ROM) is commonly measured with a handheld goniometer.2,3 The literature also suggests that goniometric measurements are highly reliable in the clinical setting and that intrarater reliability of elbow ROM measurements is high.2-4 Despite the routine use and clinical importance of flexion arc assessment, there is no universal recommendation regarding optimal measurement position. Textbooks and journal articles commonly do not specify arm position at time of elbow ROM measurements,5-8 and a literature review found no studies directly addressing this issue.
From a biomechanical standpoint, humeral rotation is often affected by forearm pronosupination position. Although forearm pronosupination is a product of the motion at the radioulnar joints, forearm position during elbow flexion arc measurement can influence the relationship of the distal humeral intercondylar axis to the plane of measurement. Full forearm supination rotates the distal humeral intercondylar axis externally to a position parallel to the floor and in line with the plane of measurement. Humeral rotation with the forearm in neutral pronosupination places the humeral condyles internally rotated relative to the floor. Therefore, for the purposes of this study, we defined full humeral external rotation and true plane of ulnohumeral motion as full forearm supination, and relative humeral and ulnohumeral joint internal rotation as neutral pronosupination.
Because of the potential for elbow ROM measurement changes caused by differences in the motion plane in which measurements are taken, some have advocated taking flexion arc measurements with the arm in full supination to allow measurements to be taken in the true plane of motion. We hypothesized that elbow flexion arc measurements taken with the forearm in neutral rotation would underestimate the extent of elbow flexion contractures compared with measurements taken in full supination.
Materials and Methods
This study received institutional review board approval. Eighty-four patients who presented with elbow dysfunction to a single shoulder and elbow orthopedic surgeon enrolled in the study. Skeletally immature patients and patients with a fracture or other disorder that prohibited elbow ROM were excluded. A standard goniometer was used to measure elbow flexion and extension with the humerus in 2 positions: full external rotation and neutral rotation.
All goniometer measurements were made by the same surgeon (to eliminate interobserver reliability error) using a standardized technique with the patient sitting upright. The goniometer was positioned laterally with its center of rotation over the lateral epicondyle, aligned proximally with the humeral head and distally with the center of the wrist. Measurements were obtained sequentially with the hand in both positions. For external rotation measurements, the patient’s arm was fully supinated to bring the humeral condyles parallel to the floor. For neutral positioning, the patient’s arm was placed in the “thumb-up” position with the hand perpendicular to the horizontal axis of the floor (Figures 1A–1C).
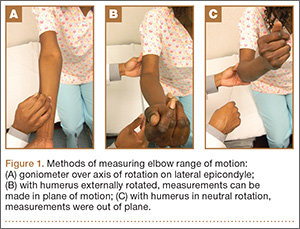
Data collected included demographics, diagnosis, hand dominance, affected side, and elbow ROM measurements with the hand in the 2 positions. These data were compiled and analyzed for all patients and then stratified into 3 groups by extent of elbow flexion contracture in the supinated position (group 1, hyperextension; group 2, 0°-29° elbow extension; group 3, ≥30° flexion contracture).
Statistically, paired t tests were used to identify differences between the 2 elbow ROM measurement methods. P < .05 was considered significant.
Results
Eighty-four (44 male, 40 female) consecutive patients (85 elbows) met the inclusion and exclusion criteria. Mean age was 51 years (range, 19-84 years). Seventy-six patients were right-handed, 7 were left-handed, and dominance was unknown in 1 patient. The right elbow was affected in 45 patients, the left in 38, and both in 1 patient. There were 25 different diagnoses, the most common of which was lateral epicondylitis; 7 patients had multiple disorders (Table).
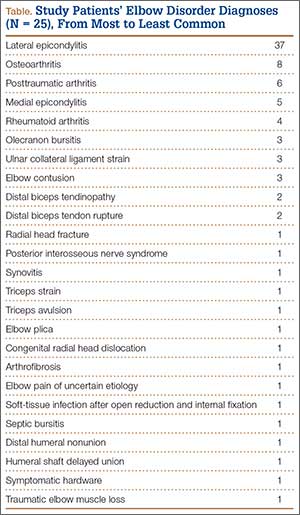
The first set of data, elbow ROM measurements, was taken with all 84 patients analyzed as a single group. In neutral humeral rotation, mean elbow extension was 14° (range, 10°-72°), and mean elbow flexion was 134° (range, 72°-145°). In external rotation, mean elbow extension was 20° (range, 12°-87°), and mean elbow flexion was 134° (range, 72°-145°). For the group, mean absolute difference in elbow extension was 8° (range, 0°-30°; P < .0001); there was no difference between external rotation and neutral rotation in flexion (Figure 2).
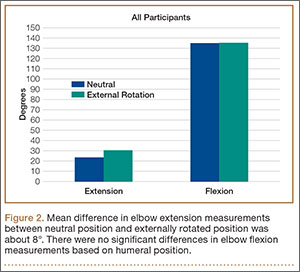
The data were reanalyzed after being stratified into 3 groups based on extent of elbow flexion contracture measured in supination.
The 9 elbows in group 1 (hyperextension) had mean extension of –2° (range, 10°-2°) and mean flexion of 141° (range, 130°-145°) in the neutral position. In external rotation, mean extension was –9° (range, –12° to –1°), and mean flexion was 141° (range, 130°-145°). When the 2 measurement positions were compared, group 1 had mean elbow ROM differences of –6° (range, –14° to 0°; P = .0033) for elbow extension and 0° for elbow flexion (Figure 3A).
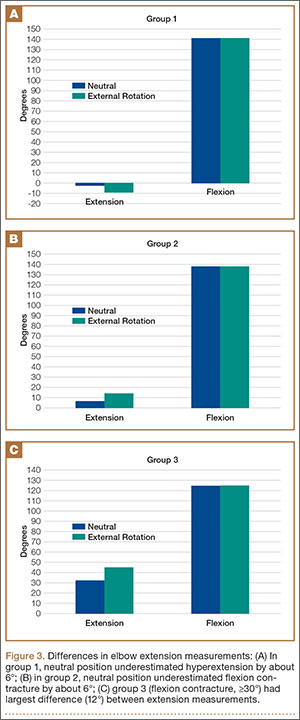
The 50 elbows in group 2 (0°-29° flexion contracture) had mean extension of 7° (range, 0°-20°) and mean flexion of 138° (range, 100°-145°) in the neutral position. In external rotation, mean extension was 13° (range, 0°-26°), and mean flexion was 138° (range, 100°-145°). Mean difference between neutral and external rotation measurements was 6° (range, 0°-20°; P < .0001) in extension and 0° in flexion (Figure 3B).
The 26 elbows in group 3 (≥30° flexion contracture) had mean extension of 33° (range, 0°-72°) and mean flexion of 124° (range, 72°-145°) in the neutral position. In external rotation, mean extension was 45° (range, 30°-87°), and mean flexion was 124° (range, 72°-145°). Mean difference between neutral and external rotation measurements was 12° (range, 0°-30°; P < .0001) in extension and 0° in flexion (Figure 3C).
Discussion
Elbow flexion arc measurements are crucial for patient outcomes and activities of daily living. Commonly cited as functional ROM, the 30°-to-130° flexion arc often is used to guide clinical decisions in patients with elbow disorders.1 However, our data indicate that humeral position can alter elbow ROM measurements. Specifically, because of neutral forearm pronosupination, measurements made with the humerus in neutral rotation underestimate both the extent of elbow hyperextension and the degree of flexion contracture (Figures 4A, 4B). The more severe the flexion contracture, the more values are altered by measurements taken in this position. The same does not apply for elbow flexion measurements, as varying humeral rotation did not significantly affect those values.
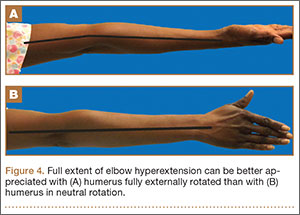
Our results indicate that patients evaluated with the arm in neutral humeral rotation had flexion contractures underestimated by a mean of 8°, while there was a negligible difference in flexion measurements. Stratifying our data into 3 groups, we found that neutral humeral rotation kept elbow extension measurements closer to 0° for patients with both hyperextension and contractures. With increasing severity of flexion contractures in groups 2 and 3, the measurement errors were magnified. The differences in extension measurement values between these 2 groups based on humeral rotation increased more than 4°—an indication that, as flexion contracture severity increases, so does the degree of measurement error when elbow extension is measured with the humerus in neutral rotation rather than external rotation.
Our literature review found no studies on ROM value differences based on position of humeral rotation. Most texts, in their descriptions of elbow ROM and biomechanics, make no reference to position of pronosupination at time of flexion arc measurement.5-8 Although many elbow authorities recommend taking elbow ROM measurements in full external rotation, we found no corroborating evidence.
Other investigators have evaluated the reliability of goniometer measurements.2,3 Rothstein and colleagues3 concluded that elbow and knee goniometric measurements are highly reliable in the clinical setting when taken by the same person. In particular, intratester reliability for elbow extension measurements was high. Armstrong and colleagues2 specifically examined intratester, intertester, and interdevice reliability and found that intratester reliability was much higher than intertester reliability for universal goniometry. In our study, all patients were measured with the same technique by the same orthopedic surgeon to eliminate any intertester reliability error. Armstrong and colleagues2 also found that intratester changes vis-a-vis extension measurements are meaningful when goniometric differences are more than 7°. In our study, the difference in extension measurements between the 2 humeral positions averaged 8° overall and 12° in group 3. This suggests that the data reported here reflect a true difference dependent on humeral rotation and are not a result of goniometer intratester variability.
Other studies have examined measurement devices other than the standard universal goniometer. Cleffken and colleagues4 found that the electronic digital inclinometer was reliable for elbow ROM measurements. Blonna and colleagues9 used digital photography–based goniometry to measure patient outcomes without doctor–patient contact at tertiary-care centers and found it to be more accurate and reliable than clinical goniometry in measuring elbow flexion and extension. Chapleau and colleagues10 compared the validity of goniometric elbow measurements in radiographic methods and concluded that the maximal error of goniometric measurements in extension was 10.3°. However, they also found high intraclass correlation coefficients for goniometric measurements. With the accepted clinical reliability of universal goniometry,2-4,10 we believe it to be the best clinical tool for this study because of its availability, minimal cost, and ease of use.
In the clinical setting, elbow flexion arc measurements are a major factor in treatment decisions and often dictate whether to proceed with operative interventions such as capsular release. In addition, ROM measurements are crucial in determining the success of treatments and the progression of disease. Erroneous elbow extension measurements can have significant consequences if they falsely indicate functional ROM when taken in neutral position. This is particularly true for patients with elbow flexion contractures of more than 30°, in whom differences in humeral rotation resulted in about 12° of variance between measured values. For instance, a patient with a true 40° flexion contracture in the externally rotated position could be determined to have functional ROM based on measurements made in the neutral position.
Limitations of this study include those involving goniometer reliability and intraobserver variability (already described) and the validity of goniometer measurements compared with radiographic measurements.
Conclusion
Because elbow goniometer extension measurements taken in neutral humeral rotation underestimate both the degree of elbow hyperextension and the degree of elbow flexion contracture, we recommend taking elbow flexion arc measurements in the true plane of motion, with the humerus externally rotated by fully supinating the forearm, such that the distal humeral condyles are parallel to the floor.
1. Morrey BF, Askew LJ, Chao EY. A biomechanical study of normal functional elbow motion. J Bone Joint Surg Am. 1981;63(6):872-877.
2. Armstrong AD, MacDermid JC, Chinchalkar S, Stevens RS, King GJ. Reliability of range-of-motion measurement in the elbow and forearm. J Shoulder Elbow Surg. 1998;7(6):573-580.
3. Rothstein JM, Miller PJ, Roettger RF. Goniometric reliability in a clinical setting. Elbow and knee measurements. Phys Ther. 1983;63(10):1611-1615.
4. Cleffken B, van Breukelen G, van Mameren H, Brink P, Olde Damink S. Test–retest reproducibility of elbow goniometric measurements in a rigid double-blinded protocol: intervals for distinguishing between measurement error and clinical change. J Shoulder Elbow Surg. 2007;16(6):788-794.
5. Hoppenfeld S. Physical Examination of the Spine and Extremities. Englewood Cliffs, NJ: Prentice-Hall; 1976.
6. Miller RM 3rd, Azar FM, Throckmorton TW. Shoulder and elbow injuries. In: Canale S, Beaty J, eds. Campbell’s Operative Orthopaedics. 12th ed. Philadelphia, PA: Mosby Elsevier; 2013:2241-2253.
7. Ring D. Elbow fractures and dislocations. In: Bucholz R, Heckman J, Court-Brown C, eds. Rockwood and Green’s Fractures in Adults. 6th ed. Philadelphia, PA: Lippincott Williams & Wilkins; 2006:901-991.
8. Katolik LI, Cohen MS. Lateral columnar release for extracapsular elbow contracture. In: Wiesel S, ed. Operative Techniques in Orthopaedic Surgery. Philadelphia, PA: Lippincott Williams & Wilkins; 2011:3406-3407.
9. Blonna D, Zarkadas PC, Fitzsimmons JS, O’Driscoll SW. Validation of a photography-based goniometry method for measuring joint range of motion. J Shoulder Elbow Surg. 2012;21(1):29-35.
10. Chapleau J, Canet F, Petit Y, Laflamme G, Rouleau D. Validity of elbow goniometer measurements. Comparative study with a radiographic method. Clin Orthop. 2001;(469):3134-3140.
Elbow motion is crucial for activities of daily living and full function of the upper extremity.1 Measuring the elbow flexion arc accurately and consistently is an important part of the physical examination of patients with elbow pathology. Orthopedic surgeons rely on these measurements to follow patients over time, and they often base their treatment decisions on the range and progression/regression of motion arc.
In the clinical setting, elbow range of motion (ROM) is commonly measured with a handheld goniometer.2,3 The literature also suggests that goniometric measurements are highly reliable in the clinical setting and that intrarater reliability of elbow ROM measurements is high.2-4 Despite the routine use and clinical importance of flexion arc assessment, there is no universal recommendation regarding optimal measurement position. Textbooks and journal articles commonly do not specify arm position at time of elbow ROM measurements,5-8 and a literature review found no studies directly addressing this issue.
From a biomechanical standpoint, humeral rotation is often affected by forearm pronosupination position. Although forearm pronosupination is a product of the motion at the radioulnar joints, forearm position during elbow flexion arc measurement can influence the relationship of the distal humeral intercondylar axis to the plane of measurement. Full forearm supination rotates the distal humeral intercondylar axis externally to a position parallel to the floor and in line with the plane of measurement. Humeral rotation with the forearm in neutral pronosupination places the humeral condyles internally rotated relative to the floor. Therefore, for the purposes of this study, we defined full humeral external rotation and true plane of ulnohumeral motion as full forearm supination, and relative humeral and ulnohumeral joint internal rotation as neutral pronosupination.
Because of the potential for elbow ROM measurement changes caused by differences in the motion plane in which measurements are taken, some have advocated taking flexion arc measurements with the arm in full supination to allow measurements to be taken in the true plane of motion. We hypothesized that elbow flexion arc measurements taken with the forearm in neutral rotation would underestimate the extent of elbow flexion contractures compared with measurements taken in full supination.
Materials and Methods
This study received institutional review board approval. Eighty-four patients who presented with elbow dysfunction to a single shoulder and elbow orthopedic surgeon enrolled in the study. Skeletally immature patients and patients with a fracture or other disorder that prohibited elbow ROM were excluded. A standard goniometer was used to measure elbow flexion and extension with the humerus in 2 positions: full external rotation and neutral rotation.
All goniometer measurements were made by the same surgeon (to eliminate interobserver reliability error) using a standardized technique with the patient sitting upright. The goniometer was positioned laterally with its center of rotation over the lateral epicondyle, aligned proximally with the humeral head and distally with the center of the wrist. Measurements were obtained sequentially with the hand in both positions. For external rotation measurements, the patient’s arm was fully supinated to bring the humeral condyles parallel to the floor. For neutral positioning, the patient’s arm was placed in the “thumb-up” position with the hand perpendicular to the horizontal axis of the floor (Figures 1A–1C).
Data collected included demographics, diagnosis, hand dominance, affected side, and elbow ROM measurements with the hand in the 2 positions. These data were compiled and analyzed for all patients and then stratified into 3 groups by extent of elbow flexion contracture in the supinated position (group 1, hyperextension; group 2, 0°-29° elbow extension; group 3, ≥30° flexion contracture).
Statistically, paired t tests were used to identify differences between the 2 elbow ROM measurement methods. P < .05 was considered significant.
Results
Eighty-four (44 male, 40 female) consecutive patients (85 elbows) met the inclusion and exclusion criteria. Mean age was 51 years (range, 19-84 years). Seventy-six patients were right-handed, 7 were left-handed, and dominance was unknown in 1 patient. The right elbow was affected in 45 patients, the left in 38, and both in 1 patient. There were 25 different diagnoses, the most common of which was lateral epicondylitis; 7 patients had multiple disorders (Table).
The first set of data, elbow ROM measurements, was taken with all 84 patients analyzed as a single group. In neutral humeral rotation, mean elbow extension was 14° (range, 10°-72°), and mean elbow flexion was 134° (range, 72°-145°). In external rotation, mean elbow extension was 20° (range, 12°-87°), and mean elbow flexion was 134° (range, 72°-145°). For the group, mean absolute difference in elbow extension was 8° (range, 0°-30°; P < .0001); there was no difference between external rotation and neutral rotation in flexion (Figure 2).
The data were reanalyzed after being stratified into 3 groups based on extent of elbow flexion contracture measured in supination.
The 9 elbows in group 1 (hyperextension) had mean extension of –2° (range, 10°-2°) and mean flexion of 141° (range, 130°-145°) in the neutral position. In external rotation, mean extension was –9° (range, –12° to –1°), and mean flexion was 141° (range, 130°-145°). When the 2 measurement positions were compared, group 1 had mean elbow ROM differences of –6° (range, –14° to 0°; P = .0033) for elbow extension and 0° for elbow flexion (Figure 3A).
The 50 elbows in group 2 (0°-29° flexion contracture) had mean extension of 7° (range, 0°-20°) and mean flexion of 138° (range, 100°-145°) in the neutral position. In external rotation, mean extension was 13° (range, 0°-26°), and mean flexion was 138° (range, 100°-145°). Mean difference between neutral and external rotation measurements was 6° (range, 0°-20°; P < .0001) in extension and 0° in flexion (Figure 3B).
The 26 elbows in group 3 (≥30° flexion contracture) had mean extension of 33° (range, 0°-72°) and mean flexion of 124° (range, 72°-145°) in the neutral position. In external rotation, mean extension was 45° (range, 30°-87°), and mean flexion was 124° (range, 72°-145°). Mean difference between neutral and external rotation measurements was 12° (range, 0°-30°; P < .0001) in extension and 0° in flexion (Figure 3C).
Discussion
Elbow flexion arc measurements are crucial for patient outcomes and activities of daily living. Commonly cited as functional ROM, the 30°-to-130° flexion arc often is used to guide clinical decisions in patients with elbow disorders.1 However, our data indicate that humeral position can alter elbow ROM measurements. Specifically, because of neutral forearm pronosupination, measurements made with the humerus in neutral rotation underestimate both the extent of elbow hyperextension and the degree of flexion contracture (Figures 4A, 4B). The more severe the flexion contracture, the more values are altered by measurements taken in this position. The same does not apply for elbow flexion measurements, as varying humeral rotation did not significantly affect those values.
Our results indicate that patients evaluated with the arm in neutral humeral rotation had flexion contractures underestimated by a mean of 8°, while there was a negligible difference in flexion measurements. Stratifying our data into 3 groups, we found that neutral humeral rotation kept elbow extension measurements closer to 0° for patients with both hyperextension and contractures. With increasing severity of flexion contractures in groups 2 and 3, the measurement errors were magnified. The differences in extension measurement values between these 2 groups based on humeral rotation increased more than 4°—an indication that, as flexion contracture severity increases, so does the degree of measurement error when elbow extension is measured with the humerus in neutral rotation rather than external rotation.
Our literature review found no studies on ROM value differences based on position of humeral rotation. Most texts, in their descriptions of elbow ROM and biomechanics, make no reference to position of pronosupination at time of flexion arc measurement.5-8 Although many elbow authorities recommend taking elbow ROM measurements in full external rotation, we found no corroborating evidence.
Other investigators have evaluated the reliability of goniometer measurements.2,3 Rothstein and colleagues3 concluded that elbow and knee goniometric measurements are highly reliable in the clinical setting when taken by the same person. In particular, intratester reliability for elbow extension measurements was high. Armstrong and colleagues2 specifically examined intratester, intertester, and interdevice reliability and found that intratester reliability was much higher than intertester reliability for universal goniometry. In our study, all patients were measured with the same technique by the same orthopedic surgeon to eliminate any intertester reliability error. Armstrong and colleagues2 also found that intratester changes vis-a-vis extension measurements are meaningful when goniometric differences are more than 7°. In our study, the difference in extension measurements between the 2 humeral positions averaged 8° overall and 12° in group 3. This suggests that the data reported here reflect a true difference dependent on humeral rotation and are not a result of goniometer intratester variability.
Other studies have examined measurement devices other than the standard universal goniometer. Cleffken and colleagues4 found that the electronic digital inclinometer was reliable for elbow ROM measurements. Blonna and colleagues9 used digital photography–based goniometry to measure patient outcomes without doctor–patient contact at tertiary-care centers and found it to be more accurate and reliable than clinical goniometry in measuring elbow flexion and extension. Chapleau and colleagues10 compared the validity of goniometric elbow measurements in radiographic methods and concluded that the maximal error of goniometric measurements in extension was 10.3°. However, they also found high intraclass correlation coefficients for goniometric measurements. With the accepted clinical reliability of universal goniometry,2-4,10 we believe it to be the best clinical tool for this study because of its availability, minimal cost, and ease of use.
In the clinical setting, elbow flexion arc measurements are a major factor in treatment decisions and often dictate whether to proceed with operative interventions such as capsular release. In addition, ROM measurements are crucial in determining the success of treatments and the progression of disease. Erroneous elbow extension measurements can have significant consequences if they falsely indicate functional ROM when taken in neutral position. This is particularly true for patients with elbow flexion contractures of more than 30°, in whom differences in humeral rotation resulted in about 12° of variance between measured values. For instance, a patient with a true 40° flexion contracture in the externally rotated position could be determined to have functional ROM based on measurements made in the neutral position.
Limitations of this study include those involving goniometer reliability and intraobserver variability (already described) and the validity of goniometer measurements compared with radiographic measurements.
Conclusion
Because elbow goniometer extension measurements taken in neutral humeral rotation underestimate both the degree of elbow hyperextension and the degree of elbow flexion contracture, we recommend taking elbow flexion arc measurements in the true plane of motion, with the humerus externally rotated by fully supinating the forearm, such that the distal humeral condyles are parallel to the floor.
1. Morrey BF, Askew LJ, Chao EY. A biomechanical study of normal functional elbow motion. J Bone Joint Surg Am. 1981;63(6):872-877.
2. Armstrong AD, MacDermid JC, Chinchalkar S, Stevens RS, King GJ. Reliability of range-of-motion measurement in the elbow and forearm. J Shoulder Elbow Surg. 1998;7(6):573-580.
3. Rothstein JM, Miller PJ, Roettger RF. Goniometric reliability in a clinical setting. Elbow and knee measurements. Phys Ther. 1983;63(10):1611-1615.
4. Cleffken B, van Breukelen G, van Mameren H, Brink P, Olde Damink S. Test–retest reproducibility of elbow goniometric measurements in a rigid double-blinded protocol: intervals for distinguishing between measurement error and clinical change. J Shoulder Elbow Surg. 2007;16(6):788-794.
5. Hoppenfeld S. Physical Examination of the Spine and Extremities. Englewood Cliffs, NJ: Prentice-Hall; 1976.
6. Miller RM 3rd, Azar FM, Throckmorton TW. Shoulder and elbow injuries. In: Canale S, Beaty J, eds. Campbell’s Operative Orthopaedics. 12th ed. Philadelphia, PA: Mosby Elsevier; 2013:2241-2253.
7. Ring D. Elbow fractures and dislocations. In: Bucholz R, Heckman J, Court-Brown C, eds. Rockwood and Green’s Fractures in Adults. 6th ed. Philadelphia, PA: Lippincott Williams & Wilkins; 2006:901-991.
8. Katolik LI, Cohen MS. Lateral columnar release for extracapsular elbow contracture. In: Wiesel S, ed. Operative Techniques in Orthopaedic Surgery. Philadelphia, PA: Lippincott Williams & Wilkins; 2011:3406-3407.
9. Blonna D, Zarkadas PC, Fitzsimmons JS, O’Driscoll SW. Validation of a photography-based goniometry method for measuring joint range of motion. J Shoulder Elbow Surg. 2012;21(1):29-35.
10. Chapleau J, Canet F, Petit Y, Laflamme G, Rouleau D. Validity of elbow goniometer measurements. Comparative study with a radiographic method. Clin Orthop. 2001;(469):3134-3140.
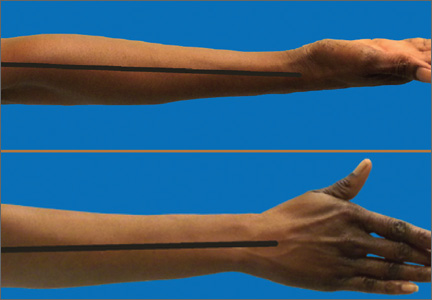
Sports Activity After Reverse Total Shoulder Arthroplasty With Minimum 2-Year Follow-Up
The treatment of patients with severe shoulder pain and disability combined with a nonfunctional rotator cuff was a clinical challenge until the development of the reverse total shoulder arthroplasty (RTSA).1-3 Massive rotator cuff tears can leave patients with a pseudoparalytic upper extremity and may result in advanced arthritis of the joint because of altered mechanical and nutritional factors.4 In this setting, simply replacing the arthritic joint with standard total shoulder arthroplasty (TSA) is not recommended because it does not address the functional deficits, and it has poor long-term outcomes.3,5 RTSA works by changing the center of rotation of the shoulder joint so that the deltoid muscle can be used to elevate the arm.6,7 The 4 rotator cuff muscles are not required for forward elevation or stability of this constrained implant.6,8
Current indications for RTSA are cuff tear arthropathy, complex proximal humerus fractures, and revision from hemiarthroplasty or TSA with rotator cuff dysfunction. Patients with advanced cuff tear arthropathy have minimal forward elevation and pseudoparalysis. Previous studies have shown mean preoperative forward flexion of 55º and mean ASES (American Shoulder and Elbow Surgeons) Standardized Shoulder Assessment Form score of 34.3.9 Thus, minimal overhead activity is possible without RTSA. Advances in the RTSA technique have led to promising results (excellent functional improvement), but there is limited information regarding the activity levels patients can achieve after surgery.7,9-11
We conducted a study of the types of sporting activities in which patients with RTSA could participate. We hypothesized that, relative to historic controls, patients with RTSA could return to low-intensity sporting activities with improvement in motion and ASES scores.
Materials and Methods
After this study received institutional review board approval, patients who had undergone RTSA at our institution between January 1, 2004 and December 31, 2010 were identified by the billing codes used for the procedure. Each patient who had RTSA performed during the study period was included in the study. Charts were then reviewed to extract demographic data, preoperative diagnosis, surgery date, operative side, dominant side, type of implant used, operative complications, and subsequent revisions. A questionnaire (Appendix) was designed and used to assess activity, functional status, pain, and satisfaction levels after RTSA. Patients had to be willing and able to complete this questionnaire in order to be included in the study.
The questionnaire included demographic questions; a list of 42 activities patients could choose from to describe their current activity level, activities they were able to perform before the surgery, and activities they wish they could perform; a list of reasons for any limitations; and questions about overall pain, strength, and satisfaction with the procedure. In addition, there was an open-ended question for activities that may not have been listed. The questionnaire also included a validated method for assessing shoulder range of motion (ROM) at home, where patients rated their overhead motion according to standardized physical landmarks, including the level of the shoulder, chin, eyebrows, top of head, and above head.12-14 Also provided was the ASES Standardized Shoulder Assessment Form, which features a 100-point visual analog scale for pain plus functional ability questions, with higher scores indicating less pain and better function.15,16 The minimal clinical significance in the ASES score is 6.4 points.17,18 Scores were recorded and analyzed. Student t test was used to calculate statistical differences between patients who had primary RTSA performed and patients who underwent revision RTSA.
Study personnel contacted patients by telephone and direct mailing. Patients who could not be reached initially were called at least 4 more times: twice during the weekday, once during the evening, and once on the weekend. Patients who could not be contacted by telephone were then cross-referenced with the Social Security database to see if any were deceased. Response data were tabulated, and patients were stratified into high-, moderate-, and low-intensity activity.
One of the 3 senior authors (Dr. Ahmad, Dr. Bigliani, Dr. Levine) performed the 95 RTSAs: 84 Zimmer (Warsaw, Indiana), 7 DePuy (Warsaw, Indiana), 4 Tornier (Minneapolis, Minnesota). The DePuy and Tornier implants were used when a 30-mm glenoid peg was required (before Zimmer offered this length in its system). The procedure was done with a deltopectoral approach with 20° of retroversion. In revision cases, the same approach was used, the hardware or implants were removed, and the position of the humeral component was determined based on the pectoralis major insertion and the deltoid tension. In 80% of cases, the subscapularis was not repaired; in the other 20%, it was. Whether it was repaired depended on tendon viability and surgeon preference, as subscapularis repair status has been shown not to affect functional outcome.19-21 No combined latissimus transfers were performed. Patients wore a sling the first 4 weeks after surgery (only wrist and elbow motion allowed) and then advanced to active shoulder ROM. Eight weeks after surgery, they began gentle shoulder strengthening.
Results
One hundred nine consecutive patients underwent RTSA at a single institution. Fifteen patients subsequently died, 14 could not be contacted, and 2 declined, leaving 78 patients available for clinical follow-up. Mean follow-up was 4.8 years (range 2-9 years). Mean (SD) age at surgery was 75.3 (7.5) years. Seventy-five percent of the patients were women. Sixty-one percent underwent surgery for cuff tear arthropathy, 31% for revision of previous arthroplasty or internal fixation, 7% for complex fractures, and 1% for tumor. Of the 24 revisions, 15 were for failed hemiarthroplasty, 3 were for failed TSA with rotator cuff dysfunction, 4 were for fracture with failed internal fixation, and 2 were for failed RTSA referred from other institutions. The dominant shoulder was involved 62% of the time. Preoperative active forward shoulder elevation was less than 90° in all patients. There were 10 complications: 2 dislocations that were closed-reduced and remained stable, 1 dislocation that required revision of the liner, 1 aseptic loosening in a patient who has declined revision, 2 dissociated glenosphere baseplates, 2 deep infections that required 2-stage exchanges, 1 deep infection that required a 2-stage exchange that was then complicated by dissociation of the glenosphere baseplate requiring revision, and 1 superficial infection that resolved with oral antibiotics.
After surgery, mean active forward elevation was 140°, mean active external rotation was 48°, and mean active internal rotation was to S1. Mean (SD) postoperative ASES score was 77.5 (23.4). Satisfaction level was high (mean, 8.3/10), and mean pain levels were low: 2.3 out of 10 on the visual analog scale and 44.0 (SD, 11.7) on the ASES pain component. Strength was rated a mean of good. Table 1 lists the clinical data for the primary and revision surgery patients.
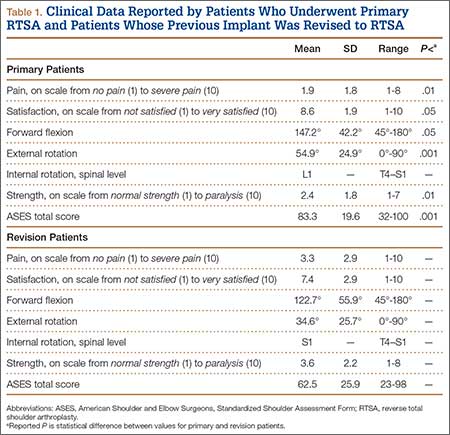
Eighteen patients (23.1%) returned to 24 different high-intensity activities, such as hunting, golf, and skiing; 38 patients (48.7%) returned to moderate-intensity activities, such as swimming, bowling, and raking leaves; and 22 patients (28.2%) returned to low-intensity activities, such as riding a stationary bike, playing a musical instrument, and walking (Table 2). Four patients played golf before and after RTSA, but neither of the 2 patients who played tennis before RTSA were able to do so after. Patients reported they engaged in their favorite leisure activity a mean of 4.8 times per week and a mean of 1.5 hours each time.
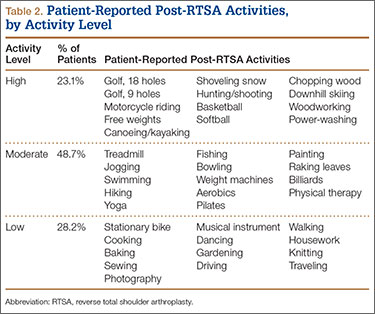
A medical problem was cited by 58% of patients as the reason for limited activity. These patients reported physical decline resulting from cardiac disease, diabetes, asthma/chronic obstructive pulmonary disease, or arthritis in other joints. Reasons for activity limitation are listed in Table 3. Post-RTSA activities that patients could not do for any reason are listed in Table 4. Activity limitations that patients attributed to the RTSA are listed in Table 5.
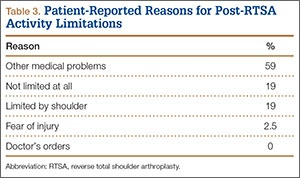
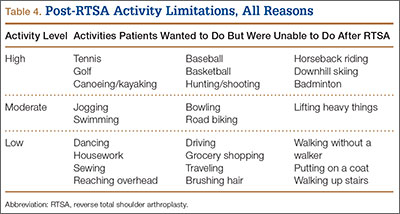
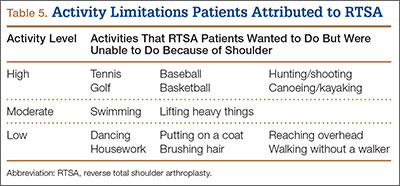
The majority of patients (57.7%) reported no change, from before RTSA to after RTSA, in being unable to do certain desired activities (eg, softball, target shooting, horseback riding, running, traveling). Sixteen patients (20.8%) reported being unable to return to an activity (eg, tennis, swimming, baseball, kayaking) they had been able to do before surgery. Most (69%) of those patients reported being unable to return to a moderate- or high-intensity activity after RTSA, but 81.8% were able to return to different moderate- or high-intensity activities.
Revision patients, who reported lower overhead activity levels, constituted 73% of the patients who felt their shoulder mechanically limited their activity, despite the fact that revisions constituted only 25% of the cases overall. Mean active ROM was statistically lower for revision patients than for primary patients (P < .05). Mean ASES score was statistically lower for the revision group (P < .001) and represented a clinically significant difference. Mean pain level was low (3.3) and satisfaction still generally high (7.4), but pain, satisfaction, and strength were about 1 point worse on average in the revision group than in the primary group.
Discussion
In the United States and other countries, RTSA implant survivorship is good.9,22 In this article, we have reported on post-RTSA activity levels, on the significant impact of comorbidities on this group, and on the negative effect of revisions on postoperative activity. Patients in this population reported that concomitant medical problems were the most important factor limiting their post-RTSA activity levels. Understanding and interpreting quality-of-life or functional scores in this elderly group must take into account the impact of comorbidities.23
Patients should have realistic postoperative expectations.24 In this study, some patients engaged in high-intensity overhead activities, such as golf, chopping wood, and shooting. However, the most difficulty was encountered trying to return to activities (eg, tennis, kayaking, archery, combing hair) that required external rotation in abduction.
Patients who had a previous implant (eg, hemiarthroplasty, TSA, failed internal fixation) revised to RTSA had lower activity levels and were 9 times more likely than primary patients to report having a mechanical shoulder limitation affecting their activity. Revision patients also had worse forward elevation, external rotation, pain, and satisfaction.
This study is limited in that it is retrospective. Subsequent prospective studies focused on younger patients who undergo primary RTSA may be useful if indications expand. In addition, subscapularis status and especially infraspinatus status may affect activity levels and could be analyzed in a study. Another limitation is that we did not specifically record detailed preoperative data, though all patients were known to have preoperative forward elevation of less than 90°.
In general, the primary measure of success for RTSA has been pain relief. Some studies have also reported on strength and ROM.2,20,25,26 A recent study using similar methodology demonstrated comparable ROM and low pain after RTSA, though revisions were not included in that study.26 In contrast to the present study, no patient in that study was able to play tennis or golf, but the reasons for the limited activity were not explored. In both studies, post-RTSA sports were generally of lower intensity than those played by patients after anatomical TSA.27
Overall, the majority of patients were very satisfied with their low pain level after RTSA. In addition, many patients not limited by other medical conditions were able to return to their pre-RTSA moderate-intensity recreational activities.
1. Baulot E, Chabernaud D, Grammont PM. Results of Grammont’s inverted prosthesis in omarthritis associated with major cuff destruction. Apropos of 16 cases [in French]. Acta Orthop Belg. 1995;61(suppl 1):112-119.
2. Sirveaux F, Favard L, Oudet D, Huquet D, Walch G, Molé D. Grammont inverted total shoulder arthroplasty in the treatment of glenohumeral osteoarthritis with massive rupture of the cuff. Results of a multicentre study of 80 shoulders. J Bone Joint Surg Br. 2004;86(3):388-395.
3. Franklin JL, Barrett WP, Jackins SE, Matsen FA 3rd. Glenoid loosening in total shoulder arthroplasty. Association with rotator cuff deficiency. J Arthroplasty. 1988;3(1):39-46.
4. Neer CS 2nd, Craig EV, Fukuda H. Cuff-tear arthropathy. J Bone Joint Surg Am. 1983;65(9):1232-1244.
5. Edwards TB, Boulahia A, Kempf JF, Boileau P, Nemoz C, Walch G. The influence of rotator cuff disease on the results of shoulder arthroplasty for primary osteoarthritis: results of a multicenter study. J Bone Joint Surg Am. 2002;84(12):2240-2248.
6. Boileau P, Watkinson DJ, Hatzidakis AM, Balg F. Grammont reverse prosthesis: design, rationale, and biomechanics. J Shoulder Elbow Surg. 2005;14(1 suppl S):147S-161S.
7. Nam D, Kepler CK, Neviaser AS, et al. Reverse total shoulder arthroplasty: current concepts, results, and component wear analysis. J Bone Joint Surg Am. 2010;92(suppl 2):23-35.
8. Ackland DC, Roshan-Zamir S, Richardson M, Pandy MG. Moment arms of the shoulder musculature after reverse total shoulder arthroplasty. J Bone Joint Surg Am. 2010;92(5):1221-1230.
9. Frankle M, Siegal S, Pupello D, Saleem A, Mighell M, Vasey M. The reverse shoulder prosthesis for glenohumeral arthritis associated with severe rotator cuff deficiency. A minimum two-year follow-up study of sixty patients. J Bone Joint Surg Am. 2005;87(8):1697-1705.
10. Cazeneuve JF, Cristofari DJ. Long term functional outcome following reverse shoulder arthroplasty in the elderly. Orthop Traumatol Surg Res. 2011;97(6):583-589.
11. Gerber C, Pennington, SD, Nyffeler RW. Reverse total shoulder arthroplasty. J Am Acad Orthop Surg. 2009;17(5):284-295.
12. Brophy RH, Beauvais RL, Jones EC, Cordasco FA, Marx RG. Measurement of shoulder activity level. Clin Orthop. 2005;(439):101-108.
13. Smith AM, Barnes SA, Sperling JW, Farrell CM, Cummings JD, Cofield RH. Patient and physician-assessed shoulder function after arthroplasty. J Bone Joint Surg Am. 2006;88(3):508-513.
14. Zarkadas PC, Throckmorton TQ, Dahm DL, Sperling J, Schleck CD, Cofield R. Patient reported activities after shoulder replacement: total and hemiarthroplasty. J Shoulder Elbow Surg. 2011;20(2):273-280.
15. Kocher, MS, Horan MP, Briggs KK, Richardson TR, O’Holleran J, Hawkins RJ. Reliability, validity, and responsiveness of the American Shoulder and Elbow Surgeons subjective shoulder scale in patients with shoulder instability, rotator cuff disease, and glenohumeral arthritis. J Bone Joint Surg Am. 2005;87(9):2006-2011.
16. Richards RR, An KN, Bigliani LU, et al. A standardized method for the assessment of shoulder function. J Shoulder Elbow Surg. 1994;3(6):347-352.
17. Michener LA, McClure PW, Sennett BJ. American Shoulder and Elbow Surgeons Standardized Shoulder Assessment Form, patient self-report section: reliability, validity, and responsiveness. J Shoulder Elbow Surg. 2002;11(6):587-594.
18. Hunsaker FG, Cioffi DA, Amadio PC, Wright JG, Caughlin B. The American Academy of Orthopaedic Surgeons outcomes instruments: normative values from the general population. J Bone Joint Surg Am. 2002;84(2):208-215.
19. Molé D, Favard L. Excentered scapulohumeral osteoarthritis [in French]. Rev Chir Orthop Reparatrice Appar Mot. 2007;93(6 suppl):37-94.
20. Clark JC, Ritchie J, Song FS, et al. Complication rates, dislocation, pain, and postoperative range of motion after reverse shoulder arthroplasty in patients with and without repair of the subscapularis. J Shoulder Elbow Surg. 2012;21(1):36-41.
21. Boulahia A, Edwards TB, Walch G, Baratta RV. Early results of a reverse design prosthesis in the treatment of arthritis of the shoulder in elderly patients with a large rotator cuff tear. Orthopedics. 2002;25(2):129-133.
22. Guery J, Favard L, Sirveaux F, Oudet D, Mole D, Walch G. Reverse total shoulder arthroplasty. Survivorship analysis of eighty replacements followed for five to ten years. J Bone Joint Surg Am. 2006;88(8):1742-1747.
23. Antuña SA, Sperling JW, Sánchez-Sotelo J, Cofield RH. Shoulder arthroplasty for proximal humeral nonunions. J Shoulder Elbow Surg. 2002;11(2):114-121.
24. Cheung E, Willis M, Walker M, Clark R, Frankle MA. Complications in reverse total shoulder arthroplasty. J Am Acad Orthop Surg. 2011;19(7):439-449.
25. Nolan BM, Ankerson E, Wiater JM. Reverse total shoulder arthroplasty improves function in cuff tear arthropathy. Clin Orthop. 2011;469(9):2476-2482.
26. Lawrence TM, Ahmadi S, Sanchez-Sotelo J, Sperling JW, Cofield RH. Patient reported activities after reverse shoulder arthroplasty: part II. J Shoulder Elbow Surg. 2012;21(11):1464-1469.
27. Schumann K, Flury MP, Schwyzer HK, Simmen BR, Drerup S, Goldhahn J. Sports activity after anatomical total shoulder arthroplasty. Am J Sports Med. 2010;38(10):2097-2105.
The treatment of patients with severe shoulder pain and disability combined with a nonfunctional rotator cuff was a clinical challenge until the development of the reverse total shoulder arthroplasty (RTSA).1-3 Massive rotator cuff tears can leave patients with a pseudoparalytic upper extremity and may result in advanced arthritis of the joint because of altered mechanical and nutritional factors.4 In this setting, simply replacing the arthritic joint with standard total shoulder arthroplasty (TSA) is not recommended because it does not address the functional deficits, and it has poor long-term outcomes.3,5 RTSA works by changing the center of rotation of the shoulder joint so that the deltoid muscle can be used to elevate the arm.6,7 The 4 rotator cuff muscles are not required for forward elevation or stability of this constrained implant.6,8
Current indications for RTSA are cuff tear arthropathy, complex proximal humerus fractures, and revision from hemiarthroplasty or TSA with rotator cuff dysfunction. Patients with advanced cuff tear arthropathy have minimal forward elevation and pseudoparalysis. Previous studies have shown mean preoperative forward flexion of 55º and mean ASES (American Shoulder and Elbow Surgeons) Standardized Shoulder Assessment Form score of 34.3.9 Thus, minimal overhead activity is possible without RTSA. Advances in the RTSA technique have led to promising results (excellent functional improvement), but there is limited information regarding the activity levels patients can achieve after surgery.7,9-11
We conducted a study of the types of sporting activities in which patients with RTSA could participate. We hypothesized that, relative to historic controls, patients with RTSA could return to low-intensity sporting activities with improvement in motion and ASES scores.
Materials and Methods
After this study received institutional review board approval, patients who had undergone RTSA at our institution between January 1, 2004 and December 31, 2010 were identified by the billing codes used for the procedure. Each patient who had RTSA performed during the study period was included in the study. Charts were then reviewed to extract demographic data, preoperative diagnosis, surgery date, operative side, dominant side, type of implant used, operative complications, and subsequent revisions. A questionnaire (Appendix) was designed and used to assess activity, functional status, pain, and satisfaction levels after RTSA. Patients had to be willing and able to complete this questionnaire in order to be included in the study.
The questionnaire included demographic questions; a list of 42 activities patients could choose from to describe their current activity level, activities they were able to perform before the surgery, and activities they wish they could perform; a list of reasons for any limitations; and questions about overall pain, strength, and satisfaction with the procedure. In addition, there was an open-ended question for activities that may not have been listed. The questionnaire also included a validated method for assessing shoulder range of motion (ROM) at home, where patients rated their overhead motion according to standardized physical landmarks, including the level of the shoulder, chin, eyebrows, top of head, and above head.12-14 Also provided was the ASES Standardized Shoulder Assessment Form, which features a 100-point visual analog scale for pain plus functional ability questions, with higher scores indicating less pain and better function.15,16 The minimal clinical significance in the ASES score is 6.4 points.17,18 Scores were recorded and analyzed. Student t test was used to calculate statistical differences between patients who had primary RTSA performed and patients who underwent revision RTSA.
Study personnel contacted patients by telephone and direct mailing. Patients who could not be reached initially were called at least 4 more times: twice during the weekday, once during the evening, and once on the weekend. Patients who could not be contacted by telephone were then cross-referenced with the Social Security database to see if any were deceased. Response data were tabulated, and patients were stratified into high-, moderate-, and low-intensity activity.
One of the 3 senior authors (Dr. Ahmad, Dr. Bigliani, Dr. Levine) performed the 95 RTSAs: 84 Zimmer (Warsaw, Indiana), 7 DePuy (Warsaw, Indiana), 4 Tornier (Minneapolis, Minnesota). The DePuy and Tornier implants were used when a 30-mm glenoid peg was required (before Zimmer offered this length in its system). The procedure was done with a deltopectoral approach with 20° of retroversion. In revision cases, the same approach was used, the hardware or implants were removed, and the position of the humeral component was determined based on the pectoralis major insertion and the deltoid tension. In 80% of cases, the subscapularis was not repaired; in the other 20%, it was. Whether it was repaired depended on tendon viability and surgeon preference, as subscapularis repair status has been shown not to affect functional outcome.19-21 No combined latissimus transfers were performed. Patients wore a sling the first 4 weeks after surgery (only wrist and elbow motion allowed) and then advanced to active shoulder ROM. Eight weeks after surgery, they began gentle shoulder strengthening.
Results
One hundred nine consecutive patients underwent RTSA at a single institution. Fifteen patients subsequently died, 14 could not be contacted, and 2 declined, leaving 78 patients available for clinical follow-up. Mean follow-up was 4.8 years (range 2-9 years). Mean (SD) age at surgery was 75.3 (7.5) years. Seventy-five percent of the patients were women. Sixty-one percent underwent surgery for cuff tear arthropathy, 31% for revision of previous arthroplasty or internal fixation, 7% for complex fractures, and 1% for tumor. Of the 24 revisions, 15 were for failed hemiarthroplasty, 3 were for failed TSA with rotator cuff dysfunction, 4 were for fracture with failed internal fixation, and 2 were for failed RTSA referred from other institutions. The dominant shoulder was involved 62% of the time. Preoperative active forward shoulder elevation was less than 90° in all patients. There were 10 complications: 2 dislocations that were closed-reduced and remained stable, 1 dislocation that required revision of the liner, 1 aseptic loosening in a patient who has declined revision, 2 dissociated glenosphere baseplates, 2 deep infections that required 2-stage exchanges, 1 deep infection that required a 2-stage exchange that was then complicated by dissociation of the glenosphere baseplate requiring revision, and 1 superficial infection that resolved with oral antibiotics.
After surgery, mean active forward elevation was 140°, mean active external rotation was 48°, and mean active internal rotation was to S1. Mean (SD) postoperative ASES score was 77.5 (23.4). Satisfaction level was high (mean, 8.3/10), and mean pain levels were low: 2.3 out of 10 on the visual analog scale and 44.0 (SD, 11.7) on the ASES pain component. Strength was rated a mean of good. Table 1 lists the clinical data for the primary and revision surgery patients.
Eighteen patients (23.1%) returned to 24 different high-intensity activities, such as hunting, golf, and skiing; 38 patients (48.7%) returned to moderate-intensity activities, such as swimming, bowling, and raking leaves; and 22 patients (28.2%) returned to low-intensity activities, such as riding a stationary bike, playing a musical instrument, and walking (Table 2). Four patients played golf before and after RTSA, but neither of the 2 patients who played tennis before RTSA were able to do so after. Patients reported they engaged in their favorite leisure activity a mean of 4.8 times per week and a mean of 1.5 hours each time.
A medical problem was cited by 58% of patients as the reason for limited activity. These patients reported physical decline resulting from cardiac disease, diabetes, asthma/chronic obstructive pulmonary disease, or arthritis in other joints. Reasons for activity limitation are listed in Table 3. Post-RTSA activities that patients could not do for any reason are listed in Table 4. Activity limitations that patients attributed to the RTSA are listed in Table 5.
The majority of patients (57.7%) reported no change, from before RTSA to after RTSA, in being unable to do certain desired activities (eg, softball, target shooting, horseback riding, running, traveling). Sixteen patients (20.8%) reported being unable to return to an activity (eg, tennis, swimming, baseball, kayaking) they had been able to do before surgery. Most (69%) of those patients reported being unable to return to a moderate- or high-intensity activity after RTSA, but 81.8% were able to return to different moderate- or high-intensity activities.
Revision patients, who reported lower overhead activity levels, constituted 73% of the patients who felt their shoulder mechanically limited their activity, despite the fact that revisions constituted only 25% of the cases overall. Mean active ROM was statistically lower for revision patients than for primary patients (P < .05). Mean ASES score was statistically lower for the revision group (P < .001) and represented a clinically significant difference. Mean pain level was low (3.3) and satisfaction still generally high (7.4), but pain, satisfaction, and strength were about 1 point worse on average in the revision group than in the primary group.
Discussion
In the United States and other countries, RTSA implant survivorship is good.9,22 In this article, we have reported on post-RTSA activity levels, on the significant impact of comorbidities on this group, and on the negative effect of revisions on postoperative activity. Patients in this population reported that concomitant medical problems were the most important factor limiting their post-RTSA activity levels. Understanding and interpreting quality-of-life or functional scores in this elderly group must take into account the impact of comorbidities.23
Patients should have realistic postoperative expectations.24 In this study, some patients engaged in high-intensity overhead activities, such as golf, chopping wood, and shooting. However, the most difficulty was encountered trying to return to activities (eg, tennis, kayaking, archery, combing hair) that required external rotation in abduction.
Patients who had a previous implant (eg, hemiarthroplasty, TSA, failed internal fixation) revised to RTSA had lower activity levels and were 9 times more likely than primary patients to report having a mechanical shoulder limitation affecting their activity. Revision patients also had worse forward elevation, external rotation, pain, and satisfaction.
This study is limited in that it is retrospective. Subsequent prospective studies focused on younger patients who undergo primary RTSA may be useful if indications expand. In addition, subscapularis status and especially infraspinatus status may affect activity levels and could be analyzed in a study. Another limitation is that we did not specifically record detailed preoperative data, though all patients were known to have preoperative forward elevation of less than 90°.
In general, the primary measure of success for RTSA has been pain relief. Some studies have also reported on strength and ROM.2,20,25,26 A recent study using similar methodology demonstrated comparable ROM and low pain after RTSA, though revisions were not included in that study.26 In contrast to the present study, no patient in that study was able to play tennis or golf, but the reasons for the limited activity were not explored. In both studies, post-RTSA sports were generally of lower intensity than those played by patients after anatomical TSA.27
Overall, the majority of patients were very satisfied with their low pain level after RTSA. In addition, many patients not limited by other medical conditions were able to return to their pre-RTSA moderate-intensity recreational activities.
1. Baulot E, Chabernaud D, Grammont PM. Results of Grammont’s inverted prosthesis in omarthritis associated with major cuff destruction. Apropos of 16 cases [in French]. Acta Orthop Belg. 1995;61(suppl 1):112-119.
2. Sirveaux F, Favard L, Oudet D, Huquet D, Walch G, Molé D. Grammont inverted total shoulder arthroplasty in the treatment of glenohumeral osteoarthritis with massive rupture of the cuff. Results of a multicentre study of 80 shoulders. J Bone Joint Surg Br. 2004;86(3):388-395.
3. Franklin JL, Barrett WP, Jackins SE, Matsen FA 3rd. Glenoid loosening in total shoulder arthroplasty. Association with rotator cuff deficiency. J Arthroplasty. 1988;3(1):39-46.
4. Neer CS 2nd, Craig EV, Fukuda H. Cuff-tear arthropathy. J Bone Joint Surg Am. 1983;65(9):1232-1244.
5. Edwards TB, Boulahia A, Kempf JF, Boileau P, Nemoz C, Walch G. The influence of rotator cuff disease on the results of shoulder arthroplasty for primary osteoarthritis: results of a multicenter study. J Bone Joint Surg Am. 2002;84(12):2240-2248.
6. Boileau P, Watkinson DJ, Hatzidakis AM, Balg F. Grammont reverse prosthesis: design, rationale, and biomechanics. J Shoulder Elbow Surg. 2005;14(1 suppl S):147S-161S.
7. Nam D, Kepler CK, Neviaser AS, et al. Reverse total shoulder arthroplasty: current concepts, results, and component wear analysis. J Bone Joint Surg Am. 2010;92(suppl 2):23-35.
8. Ackland DC, Roshan-Zamir S, Richardson M, Pandy MG. Moment arms of the shoulder musculature after reverse total shoulder arthroplasty. J Bone Joint Surg Am. 2010;92(5):1221-1230.
9. Frankle M, Siegal S, Pupello D, Saleem A, Mighell M, Vasey M. The reverse shoulder prosthesis for glenohumeral arthritis associated with severe rotator cuff deficiency. A minimum two-year follow-up study of sixty patients. J Bone Joint Surg Am. 2005;87(8):1697-1705.
10. Cazeneuve JF, Cristofari DJ. Long term functional outcome following reverse shoulder arthroplasty in the elderly. Orthop Traumatol Surg Res. 2011;97(6):583-589.
11. Gerber C, Pennington, SD, Nyffeler RW. Reverse total shoulder arthroplasty. J Am Acad Orthop Surg. 2009;17(5):284-295.
12. Brophy RH, Beauvais RL, Jones EC, Cordasco FA, Marx RG. Measurement of shoulder activity level. Clin Orthop. 2005;(439):101-108.
13. Smith AM, Barnes SA, Sperling JW, Farrell CM, Cummings JD, Cofield RH. Patient and physician-assessed shoulder function after arthroplasty. J Bone Joint Surg Am. 2006;88(3):508-513.
14. Zarkadas PC, Throckmorton TQ, Dahm DL, Sperling J, Schleck CD, Cofield R. Patient reported activities after shoulder replacement: total and hemiarthroplasty. J Shoulder Elbow Surg. 2011;20(2):273-280.
15. Kocher, MS, Horan MP, Briggs KK, Richardson TR, O’Holleran J, Hawkins RJ. Reliability, validity, and responsiveness of the American Shoulder and Elbow Surgeons subjective shoulder scale in patients with shoulder instability, rotator cuff disease, and glenohumeral arthritis. J Bone Joint Surg Am. 2005;87(9):2006-2011.
16. Richards RR, An KN, Bigliani LU, et al. A standardized method for the assessment of shoulder function. J Shoulder Elbow Surg. 1994;3(6):347-352.
17. Michener LA, McClure PW, Sennett BJ. American Shoulder and Elbow Surgeons Standardized Shoulder Assessment Form, patient self-report section: reliability, validity, and responsiveness. J Shoulder Elbow Surg. 2002;11(6):587-594.
18. Hunsaker FG, Cioffi DA, Amadio PC, Wright JG, Caughlin B. The American Academy of Orthopaedic Surgeons outcomes instruments: normative values from the general population. J Bone Joint Surg Am. 2002;84(2):208-215.
19. Molé D, Favard L. Excentered scapulohumeral osteoarthritis [in French]. Rev Chir Orthop Reparatrice Appar Mot. 2007;93(6 suppl):37-94.
20. Clark JC, Ritchie J, Song FS, et al. Complication rates, dislocation, pain, and postoperative range of motion after reverse shoulder arthroplasty in patients with and without repair of the subscapularis. J Shoulder Elbow Surg. 2012;21(1):36-41.
21. Boulahia A, Edwards TB, Walch G, Baratta RV. Early results of a reverse design prosthesis in the treatment of arthritis of the shoulder in elderly patients with a large rotator cuff tear. Orthopedics. 2002;25(2):129-133.
22. Guery J, Favard L, Sirveaux F, Oudet D, Mole D, Walch G. Reverse total shoulder arthroplasty. Survivorship analysis of eighty replacements followed for five to ten years. J Bone Joint Surg Am. 2006;88(8):1742-1747.
23. Antuña SA, Sperling JW, Sánchez-Sotelo J, Cofield RH. Shoulder arthroplasty for proximal humeral nonunions. J Shoulder Elbow Surg. 2002;11(2):114-121.
24. Cheung E, Willis M, Walker M, Clark R, Frankle MA. Complications in reverse total shoulder arthroplasty. J Am Acad Orthop Surg. 2011;19(7):439-449.
25. Nolan BM, Ankerson E, Wiater JM. Reverse total shoulder arthroplasty improves function in cuff tear arthropathy. Clin Orthop. 2011;469(9):2476-2482.
26. Lawrence TM, Ahmadi S, Sanchez-Sotelo J, Sperling JW, Cofield RH. Patient reported activities after reverse shoulder arthroplasty: part II. J Shoulder Elbow Surg. 2012;21(11):1464-1469.
27. Schumann K, Flury MP, Schwyzer HK, Simmen BR, Drerup S, Goldhahn J. Sports activity after anatomical total shoulder arthroplasty. Am J Sports Med. 2010;38(10):2097-2105.
Assessing the Reading Level of Online Sarcoma Patient Education Materials
The diagnosis of cancer is a life-changing event for the patient as well as the patient’s family, friends, and relatives. Once diagnosed, most cancer patients want more information about their prognosis, future procedures, and/or treatment options.1 Receiving such information has been shown to reduce patient anxiety, increase patient satisfaction with care, and improve self-care.2-6 With the evolution of the Internet, patients in general7-9 and, specifically, cancer patients10-17 have turned to websites and online patient education materials (PEMs) to gather more health information.
For online PEMs to convey health information, their reading level must match the health literacy of the individuals who access them. Health literacy is the ability of an individual to gather and comprehend information about their condition to make the best decisions for their health.18 According to a report by the Institute of Medicine, 90 million American adults cannot properly use the US health care system because they do not possess adequate health literacy.18 Additionally, 36% of adults in the United States have basic or less-than-basic health literacy.19 This is starkly contrasted with the 12% of US adults who have proficient health literacy. A 2012 survey showed that about 31% of individuals who look for health information on the Internet have a high school education or less.8 In order to address the low health literacy of adults, the National Institutes of Health (NIH) has recommended that online PEMs be written at a sixth- to seventh-grade reading level.20
Unfortunately, many online PEMs related to certain cancer21-25 and orthopedic conditions26-31 do not meet NIH recommendations. Only 1 study has specifically looked at PEMs related to an orthopedic cancer condition.32 Lam and colleagues32 evaluated the readability of osteosarcoma PEMs from 56 websites using only 2 readability instruments and identified 86% of the websites as having a greater than eighth-grade reading level. No study has thoroughly assessed the readability of PEMs about bone and soft-tissue sarcomas and related conditions nor has any used 10 different readability instruments. Since each readability instrument has different variables (eg, sentence length, number of paragraphs, or number of complex words), averaging the scores of 10 of these instruments may result in less bias.
The purpose of this study was to evaluate the readability of online PEMs concerning bone and soft-tissue sarcomas and related conditions. The online PEMs came from websites that sarcoma patients may visit to obtain information about their condition. Our hypothesis was that the majority of these online PEMs will have a higher reading level than the NIH recommendations.
Materials and Methods
In May 2013, we identified online PEMs that included background, diagnosis, tests, or treatments for bone and soft-tissue sarcomas and conditions that mimic bone sarcoma. We included articles from the Tumors section of the American Academy of Orthopaedic Surgeons (AAOS) website.33 A second source of online PEMs came from a list of academic training centers created through the American Medical Association’s Fellowship and Residency Electronic Internet Database (FREIDA) with search criteria narrowed to orthopedic surgery. If we did not find PEMs of bone and soft-tissue cancers in the orthopedic department of a given academic training center’s website, we searched its cancer center website. We chose 4 programs with PEMs relevant to bone and soft-tissue sarcomas from each region in FREIDA for a balanced representation, except for the Territory region because it had only 1 academic training center and no relevant PEMs. Specialized websites, including Bonetumor.org, Sarcoma Alliance (Sarcomaalliance.org), and Sarcoma Foundation of America (Curesarcoma.org), were also evaluated. Within the Sarcoma Specialists section of the Sarcoma Alliance website,34 sarcoma specialists who were not identified from the FREIDA search for academic training centers were selected for review.
Because 8 of 10 individuals looking for health information on the Internet start their investigation at search engines, we also looked for PEMs through a Google search (Google.com) of bone cancer, and evaluated the first 10 hits for PEMs.8 Of these 10 hits, 8 had relevant PEMs, which we searched for additional PEMs about bone and soft-tissue cancers and related conditions. We also conducted a Google search of the most common bone sarcoma and soft-tissue sarcoma, osteosarcoma and malignant fibrous histiocytoma, respectively, and found 2 additional websites with relevant PEMs. LaCoursiere and colleagues35 surveyed cancer patients who used the Internet and found that they preferred WebMD (Webmd.com) and Medscape (Medscape.com) as sources for content about their medical condition.35 WebMD had been identified in the Google search, and we gathered the PEMs from Medscape also. It is worth noting that some of these websites are written for patients as well as clinicians.
Text from these PEMs were copied and pasted into separate Microsoft Word documents (Microsoft, Redmond, Washington). Advertisements, pictures, picture text, hyperlinks, copyright notices, page navigation links, paragraphs with no text, and any text that was not related to the given condition were deleted from the document to format the text for the readability software. Then, each Microsoft Word document was uploaded into the software package Readability Studio Professional (RSP) Edition Version 2012.1 for Windows (Oleander Software, Vandalia, Ohio). The 10 distinct readability instruments that were used to gauge the readability of each document were the Flesch Reading Ease score (FRE), the New Fog Count, the New Automated Readability Index, the Coleman-Liau Index (CLI), the Fry readability graph, the New Dale-Chall formula (NDC), the Gunning Frequency of Gobbledygook (Gunning FOG), the Powers-Sumner-Kearl formula, the Simple Measure of Gobbledygook (SMOG), and the Raygor Estimate Graph.
The FRE’s formula takes the average number of words per sentence and average number of syllables per word to compute a score ranging from 0 to 100 with 0 being the hardest to read.36 The New Fog Count tallies the number of sentences, easy words, and hard words (polysyllables) to calculate the grade level of the document.37 The New Automated Readability Index takes the average characters per word and average words per sentence to calculate a grade level for the document.37 The CLI randomly samples a few hundred words from the document, averages the number of letters and sentences per sample, and calculates an estimated grade level.38 The Fry readability graph selects samples of 100 words from the document, averages the number of syllables and sentences per 100 words, plots these data points on a graph, with the intersection determining the reading level.39 The NDC uses a list of 3000 familiar words that most fourth-grade students know.40 The percentage of difficult words, which are not on the list of familiar words, and the average sentence length in words are used to calculate the reading grade level of the document. The Gunning FOG uses the average sentence length in words and the percentage of hard words from a sample of at least 100 words to determine the reading grade level of the document.41 The Powers-Sumner-Kearl formula uses the average sentence length and percentage of monosyllables from a 100-word sample passage to calculate the reading grade level.42 The SMOG formula counts the number of polysyllabic words from 30 sentences and calculates the reading grade level of the document.43 In contrast to other formulas that test for 50% to 75% comprehension, the SMOG formula tests for 100% comprehension. As a result, the SMOG formula generally assigns a reading level 2 grades higher than the Dale-Chall level. The Raygor Estimate Graph selects a 100-word passage, counts the number of sentences and number of words with 6 or more letters, and plots the 2 variables on a graph to determine the reading grade level.44 The software package calculated the results from each reading instrument and reported the mean grade level score
for each document.
Results
We identified a total of 72 websites with relevant PEMs and included them in this study. Of these 72 websites, 36 websites were academic training centers, 10 were Google search hits, and 21 were from the Sarcoma Alliance list of sarcoma specialists. The remaining 5 websites were AAOS, Bonetumor.org, Sarcoma Alliance, Sarcoma Foundation of America, and Medscape. A list of conditions and treatments that were considered relevant PEMs is found in Appendix 1. A total of 774 articles were obtained from the 72 websites.
None of the websites had a mean readability score of 7 (seventh grade) or lower (Figures 1A, 1B). Mid-America Sarcoma Institute’s PEMs had the lowest mean readability score, 8.9. The lowest readability score was 5.3, which the New Fog Count readability instrument calculated for Vanderbilt University Medical Center’s (VUMC’s) PEMs (Appendix 2). The mean readability score of all websites was 11.4 (range, 8.9-15.5) (Appendix 2).
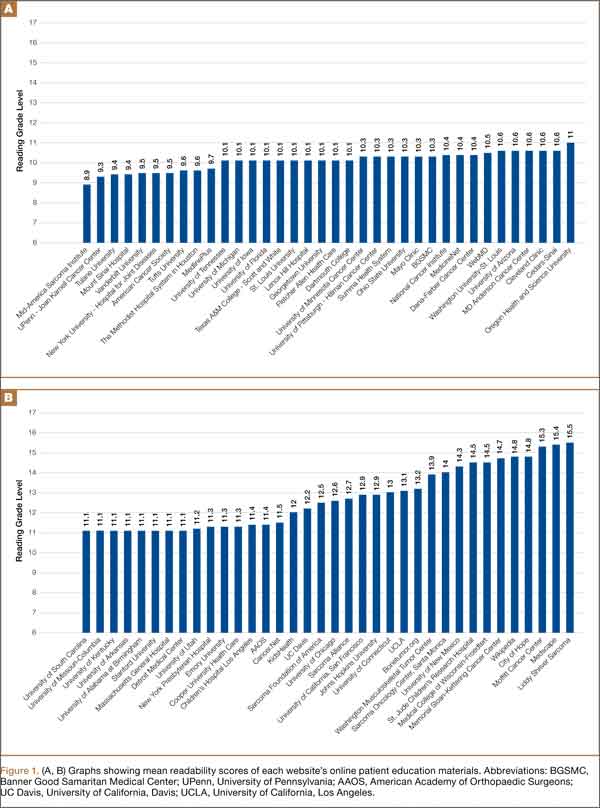
Seventy of 72 websites (97%) had PEMs that were fairly difficult or difficult, according to the FRE analysis (Figure 2). The American Cancer Society and Mid-America Sarcoma Institute had PEMs that were written in plain English. Sixty-nine of 72 websites (96%) had PEMs with a readability score of 10 or higher, according to the Raygor readability estimate (Figure 3). Using this instrument, the scores of the American Cancer Society and the University of Pennsylvania–Joan Karnell Cancer Center were 9; Mid-America Sarcoma Institute’s score was 8.
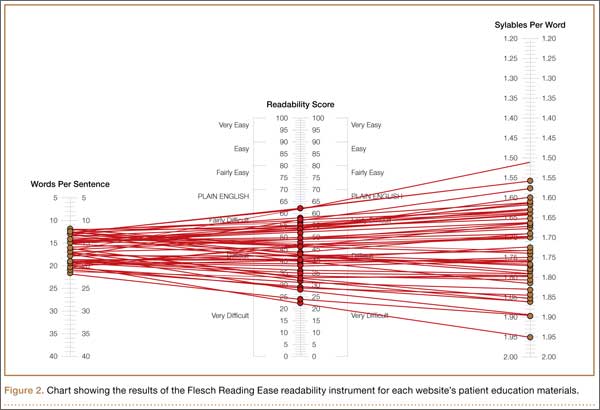
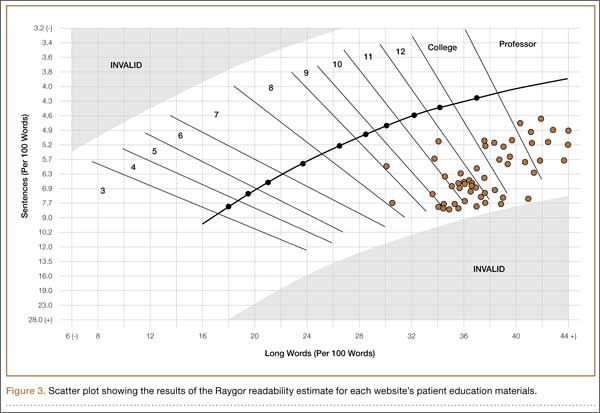
Discussion
Many cancer patients have turned to websites and online PEMs to gather health information about their condition.10-17 Basch and colleagues10 reported almost a decade ago that 44% of cancer patients, as well as 60% of their companions, used the Internet to find cancer-related information.10 When LaCoursiere and colleagues35 surveyed cancer patients, they found that patients handled their condition better and had less anxiety and uncertainty after using the Internet to find health information and support.35 In addition, many orthopedic patients, specifically 46% of orthopedic community outpatients,45 consult the Internet for information about their condition and future surgical procedures.46,47
This study comprehensively evaluated the readability of online PEMs of bone and soft-tissue sarcomas and related conditions by using 10 different readability instruments. After identifying 72 websites and 774 articles, we found that all 72 websites’ PEMs had a mean readability score that did not meet the NIH recommendation of writing PEMs at a sixth- to seventh-grade reading level. These results are consistent with studies evaluating the readability of online PEMs related to other cancer conditions21-25 and other orthopedic conditions.26-31
The combination of low health literacy of many US adults and high reading grade levels of the majority of online PEMs is not conducive to patients’ better understanding their condition(s). Even individuals with high reading skills prefer information that is simpler to read.48 In many areas of medicine, there is evidence that patients’ understanding of their condition has a positive impact on health outcomes, well-being, and the patient–physician relationship.49-61 Regarding cancer patients, Davis and colleagues54 and Peterson and colleagues57 showed that lower health literacy contributes to less knowledge and lower rates of breast54 and colorectal cancer57 screening tests. Even low health literacy of family caregivers of cancer patients can result in increased stress and lack of communication of important medical information between caregiver and physician.52 Among cancer patients, poor health literacy has been associated with mental distress60 as well as decreased compliance with treatment and lower involvement in clinical trials.55
The disparity between patients’ health literacy and the readability of online PEMs needs to be addressed by finding methods to improve patients’ understanding of their condition and to lower the readability scores of online PEMs. Better communication between patient and physician may improve patients’ comprehension of their condition and different aspects of their care.59,62-66 Doak and colleagues63 recommend giving cancer patients the most important information first; presenting information to patients in smaller doses; intermittently asking patients questions; and incorporating graphs, tables, and drawings into communication with patients.63 Additionally, allowing patients to repeat information they have just received/heard to the physician is another useful tool to improve patient education.62,64-66
Another way to address the disparity between patients’ health literacy and the readability of online PEMs is to reduce the reading grade level of existing PEMs. According to results from this study and others, the majority of online PEMs are above the reading grade level of a significant number of US adults. Many available and inexpensive readability instruments allow authors to assess their articles’ readability. Many writing guidelines also exist to help authors improve the readability of their PEMs.20,64,67-71 Living Word Vocabulary70 and Plain Language71 help authors replace complex words or medical terms with simpler words.29 Visual aids, audio, and video help patients with low health literacy remember the information.64
Efforts to improve PEM readability are effective. Of all the websites reviewed, VUMC was identified as having PEMs with the lowest readability score (5.3). This score was reported by the New Fog Count readability instrument, which accounts for the number of sentences, easy words, and hard words. In 2011, VUMC formed the Department of Patient Education to review and update its online and printed PEMs to make sure patients could read them.72 Additionally, the mean readability scores of the websites of the National Cancer Institute and MedlinePlus are in the top 50% of the websites included in this study. The NIH sponsors both sites, which follow the NIH guidelines for writing online PEMs at a reading level suitable for individuals with lower health literacy.20 These materials serve as potential models to improve the readability of PEMs, and, thus, help patients to better understand their condition, medical procedures, and/or treatment options.
To illustrate ways to improve the reading grade level of PEMs, we used the article “Ewing’s Sarcoma” from the AAOS website73 and followed the NIH guidelines to improve the reading grade level of the article.20 We identified complex words and defined them at an eighth-grade reading level. If that word was mentioned later in the article, simpler terminology was used instead of the initial complex word. For example, Ewing’s sarcoma was defined early and then referred to as bone tumor later in the article. We also identified every word that was 3 syllables or longer and used Microsoft Word’s thesaurus to replace those words with ones that were less than 3 syllables. Lastly, all sentences longer than 15 words were rewritten to be less than 15 words. After making these 3 changes to the article, the mean reading grade level dropped from 11.2 to 7.3.
This study has limitations. First, some readability instruments evaluate the number of syllables per word or polysyllabic words as part of their formula and, thus, can underestimate or overestimate the reading grade level of a document. Some readability formulas consider medical terms such as ulna, femur, or carpal as “easy” words because they have 2 syllables, but many laypersons may not comprehend these words. On the other hand, some readability formulas consider medical terms such as medications, diagnosis, or radiation as “hard” words because they contain 3 or more syllables, but the majority of laypersons likely comprehend these words. Second, the reading level of the patient population accessing those online sites was not assessed. Third, the readability instruments in this study did not evaluate the accuracy of the content, pictures, or tables of the PEMs. However, using 10 readability instruments allowed evaluation of many different readability aspects of the text. Fourth, because some websites identified in this study, such as Bonetumor.org, were written for patients as well as clinicians, the reading grade level of these sites may be higher than that of those sites written just for patients.
Conclusion
Because many orthopedic cancer patients rely on the Internet as a source of information, the need for online PEMs to match the reading skills of the patient population who accesses them is vital. However, this study shows that many organizations, academic training centers, and other entities need to update their online PEMs because all PEMs in this study had a mean readability grade level higher than the NIH recommendation. Further research needs to evaluate the effectiveness of other media, such as video, illustrations, and audio, to provide health information to patients. With many guidelines available that provide plans and advice to improve the readability of PEMs, research also must assess the most effective plans and advice in order to allow authors to focus their attention on 1 set of guidelines to improve the readability of their PEMs.
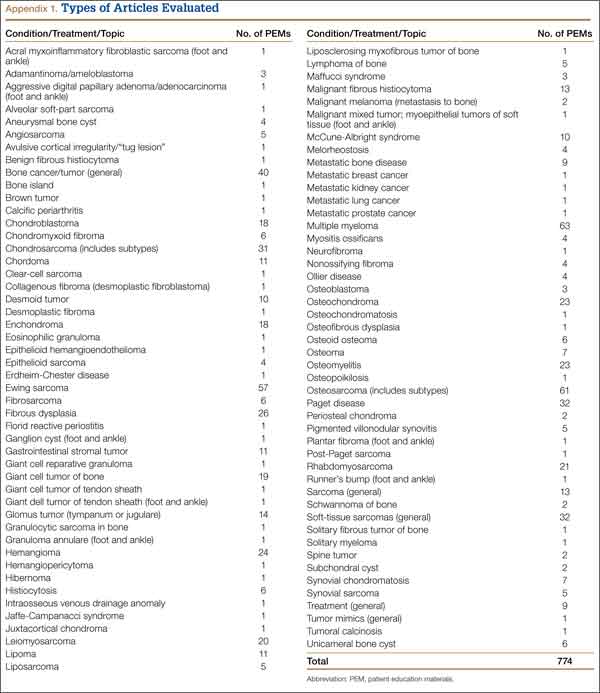
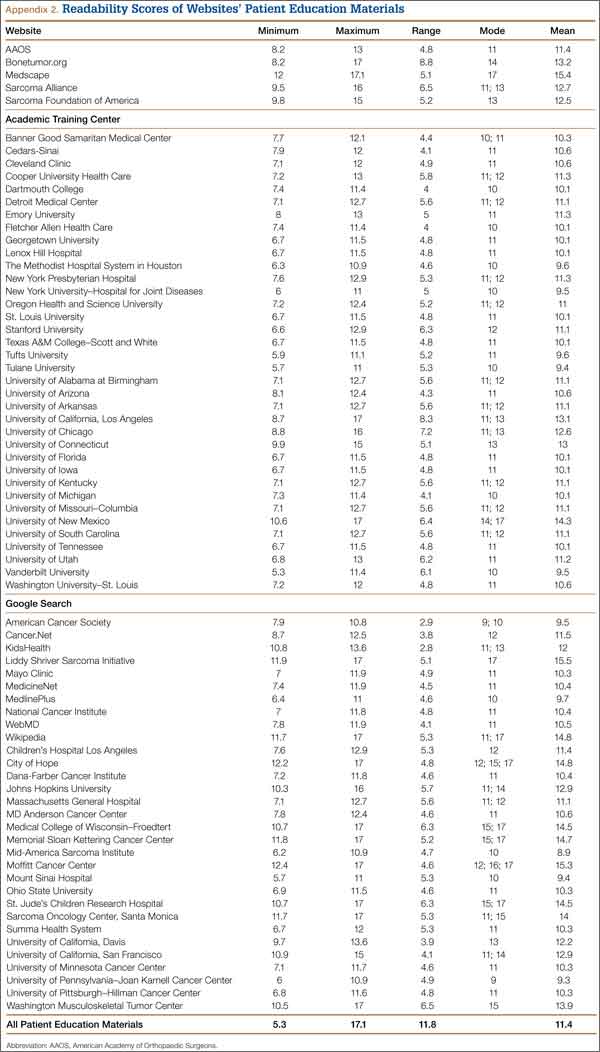
1. Piredda M, Rocci L, Gualandi R, Petitti T, Vincenzi B, De Marinis MG. Survey on learning needs and preferred sources of information to meet these needs in Italian oncology patients receiving chemotherapy. Eur J Oncol Nurs. 2008;12(2):120-126.
2. Fernsler JI, Cannon CA. The whys of patient education. Semin Oncol Nurs. 1991;7(2):79-86.
3. Glimelius B, Birgegård G, Hoffman K, Kvale G, Sjödén PO. Information to and communication with cancer patients: improvements and psychosocial correlates in a comprehensive care program for patients and their relatives. Patient Educ Couns. 1995;25(2):171-182.
4. Harris KA. The informational needs of patients with cancer and their families. Cancer Pract. 1998;6(1):39-46.
5. Jensen AB, Madsen B, Andersen P, Rose C. Information for cancer patients entering a clinical trial--an evaluation of an information strategy. Eur J Cancer. 1993;29A(16):2235-2238.
6. Wells ME, McQuellon RP, Hinkle JS, Cruz JM. Reducing anxiety in newly diagnosed cancer patients: a pilot program. Cancer Pract. 1995;3(2):100-104.
7. Diaz JA, Griffith RA, Ng JJ, Reinert SE, Friedmann PD, Moulton AW. Patients’ use of the Internet for medical information. J Gen Intern Med. 2002;17(3):180-185.
8. Fox S, Duggan M. Health Online 2013. Pew Research Center’s Internet and American Life Project. www.pewinternet.org/~/media//Files/Reports/PIP_HealthOnline.pdf. Published January 15, 2013. Accessed November 18. 2014.
9. Schwartz KL, Roe T, Northrup J, Meza J, Seifeldin R, Neale AV. Family medicine patients’ use of the Internet for health information: a MetroNet study. J Am Board Fam Med. 2006;19(1):39-45.
10. Basch EM, Thaler HT, Shi W, Yakren S, Schrag D. Use of information resources by patients with cancer and their companions. Cancer. 2004;100(11):2476-2483.
11. Huang GJ, Penson DF. Internet health resources and the cancer patient. Cancer Invest. 2008;26(2):202-207.
12. Metz JM, Devine P, Denittis A, et al. A multi-institutional study of Internet utilization by radiation oncology patients. Int J Radiat Oncol Biol Phys. 2003;56(4):1201-1205.
13. Peterson MW, Fretz PC. Patient use of the internet for information in a lung cancer clinic. Chest. 2003;123(2):452-457.
14. Satterlund MJ, McCaul KD, Sandgren AK. Information gathering over time by breast cancer patients. J Med Internet Res. 2003;5(3):e15.
15. Tustin N. The role of patient satisfaction in online health information seeking. J Health Commun. 2010;15(1):3-17.
16. Van de Poll-Franse LV, Van Eenbergen MC. Internet use by cancer survivors: current use and future wishes. Support Care Cancer. 2008;16(10):1189-1195.
17. Ziebland S, Chapple A, Dumelow C, Evans J, Prinjha S, Rozmovits L. How the internet affects patients’ experience of cancer: a qualitative study. BMJ. 2004;328(7439):564.
18. Committee on Health Literacy, Board on Neuroscience and Behavioral Health, Institute of Medicine. Nielsen-Bohlman L, Panzer AM, Kindig DA, eds. Health Literacy: A Prescription to End Confusion. Washington, DC: National Academies Press; 2004. Available at: www.nap.edu/openbook.php?record_id=10883. Accessed November 18, 2014.
19. Kutner M, Greenberg E, Ying J, Paulsen C. The Health Literacy of America’s Adults: Results from the 2003 National Assessment of Adult Literacy. NCES 2006-483. US Department of Education. Washington, DC: National Center for Education Statistics; 2006. Available at: www.nces.ed.gov/pubs2006/2006483.pdf. Accessed November 18, 2014.
20. How to write easy-to-read health materials. MedlinePlus website. www.nlm.nih.gov/medlineplus/etr.html. Updated February 13, 2013. Accessed November 18, 2014.
21. Ellimoottil C, Polcari A, Kadlec A, Gupta G. Readability of websites containing information about prostate cancer treatment options. J Urol. 2012;188(6):2171-2175.
22. Friedman DB, Hoffman-Goetz L, Arocha JF. Health literacy and the World Wide Web: comparing the readability of leading incident cancers on the Internet. Med Inform Internet Med. 2006;31(1):67-87.
23. Hoppe IC. Readability of patient information regarding breast cancer prevention from the Web site of the National Cancer Institute. J Cancer Educ. 2010;25(4):490-492.
24. Misra P, Kasabwala K, Agarwal N, Eloy JA, Liu JK. Readability analysis of internet-based patient information regarding skull base tumors. J Neurooncol. 2012;109(3):573-580.
25. Stinson JN, White M, Breakey V, et al. Perspectives on quality and content of information on the internet for adolescents with cancer. Pediatr Blood Cancer. 2011;57(1):97-104.
26. Badarudeen S, Sabharwal S. Readability of patient education materials from the American Academy of Orthopaedic Surgeons and Pediatric Orthopaedic Society of North America web sites. J Bone Joint Surg Am. 2008;90(1):199-204.
27. Bluman EM, Foley RP, Chiodo CP. Readability of the Patient Education Section of the AOFAS Website. Foot Ankle Int. 2009;30(4):287-291.
28. Polishchuk DL, Hashem J, Sabharwal S. Readability of online patient education materials on adult reconstruction Web sites. J Arthroplasty. 2012;27(5):716-719.
29. Sabharwal S, Badarudeen S, Unes Kunju S. Readability of online patient education materials from the AAOS web site. Clin Orthop. 2008;466(5):1245-1250.
30. Vives M, Young L, Sabharwal S. Readability of spine-related patient education materials from subspecialty organization and spine practitioner websites. Spine. 2009;34(25):2826-2831.
31. Wang SW, Capo JT, Orillaza N. Readability and comprehensibility of patient education material in hand-related web sites. J Hand Surg Am. 2009;34(7):1308-1315.
32. Lam CG, Roter DL, Cohen KJ. Survey of quality, readability, and social reach of websites on osteosarcoma in adolescents. Patient Educ Couns. 2013;90(1):82-87.
33. Tumors. Quinn RH, ed. OrthoInfo. American Academy of Orthopaedic Surgeons website. http://orthoinfo.aaos.org/menus/tumors.cfm. Accessed November 18, 2014.
34. Sarcoma specialists. Sarcoma Alliance website. sarcomaalliance.org/sarcoma-centers. Accessed November 18, 2014.
35. LaCoursiere SP, Knobf MT, McCorkle R. Cancer patients’ self-reported attitudes about the Internet. J Med Internet Res. 2005;7(3):e22.
36. Test your document’s readability. Microsoft Office website. office.microsoft.com/en-us/word-help/test-your-document-s-readability-HP010148506.aspx. Accessed November 18, 2014.
37. Kincaid JP, Fishburne RP, Rogers RL, Chissom BS. Derivation of new readability formulas (Automated Readability Index, Fog Count and Flesch Reading Ease Formula) for Navy enlisted personnel. Naval Technical Training Command. Research Branch Report 8-75. www.dtic.mil/dtic/tr/fulltext/u2/a006655.pdf. Published February 1975. Accessed November 18, 2014.
38. Coleman M, Liau TL. A computer readability formula designed for machine scoring. J Appl Psychol. 1975;60(2):283-284.
39. Fry E. Fry’s readability graph: clarifications, validity, and extension to Level 17. J Reading. 1977;21(3):242-252.
40. Chall JS, Dale E. Manual for the New Dale-Chall Readability Formula. Cambridge, MA: Brookline Books; 1995.
41. Gunning R. The Technique of Clear Writing. Rev. ed. New York, NY: McGraw-Hill; 1968.
42. Powers RD, Sumner WA, Kearl BE. A recalculation of four adult readability formulas. J Educ Psychol. 1958;49(2):99-105.
43. McLaughlin GH. SMOG grading—a new readability formula. J Reading. 1969;22,639-646.
44. Raygor L. The Raygor readability estimate: a quick and easy way to determine difficulty. In: Pearson PD, Hansen J, eds. Reading Theory, Research and Practice. Twenty-Sixth Yearbook of the National Reading Conference. Clemson, SC: National Reading Conference Inc; 1977:259-263.
45. Krempec J, Hall J, Biermann JS. Internet use by patients in orthopaedic surgery. Iowa Orthop J. 2003;23:80-82.
46. Beall MS, Golladay GJ, Greenfield ML, Hensinger RN, Biermann JS. Use of the Internet by pediatric orthopaedic outpatients. J Pediatr Orthop. 2002;22(2):261-264.
47. Beall MS, Beall MS, Greenfield ML, Biermann JS. Patient Internet use in a community outpatient orthopaedic practice. Iowa Orthop J. 2002;22:103-107.
48. Davis TC, Bocchini JA, Fredrickson D, et al. Parent comprehension of polio vaccine information pamphlets. Pediatrics. 1996;97(6 Pt 1):804-810.
49. Apter AJ, Wan F, Reisine S, et al. The association of health literacy with adherence and outcomes in moderate-severe asthma. J Allergy Clin Immunol. 2013;132(2):321-327.
50. Baker DW, Parker RM, Williams MV, Clark WS. Health literacy and the risk of hospital admission. J Gen Intern Med. 1998;13(12):791-798.
51. Berkman ND, Sheridan SL, Donahue KE, Halpern DJ, Crotty K. Low health literacy and health outcomes: an updated systematic review. Ann Intern Med. 2011;155(2):97-107.
52. Bevan JL, Pecchioni LL. Understanding the impact of family caregiver cancer literacy on patient health outcomes. Patient Educ Couns. 2008;71(3):356-364.
53. Corey MR, St Julien J, Miller C, et al. Patient education level affects functionality and long term mortality after major lower extremity amputation. Am J Surg. 2012;204(5):626-630.
54. Davis TC, Arnold C, Berkel HJ, Nandy I, Jackson RH, Glass J. Knowledge and attitude on screening mammography among low-literate, low-income women. Cancer. 1996;78(9):1912-1920.
55. Davis TC, Williams MV, Marin E, Parker RM, Glass J. Health literacy and cancer communication. CA Cancer J Clin. 2002;52(3):134-149.
56. Freedman RB, Jones SK, Lin A, Robin AL, Muir KW. Influence of parental health literacy and dosing responsibility on pediatric glaucoma medication adherence. Arch Ophthalmol. 2012;130(3):306-311.
57. Peterson NB, Dwyer KA, Mulvaney SA, Dietrich MS, Rothman RL. The influence of health literacy on colorectal cancer screening knowledge, beliefs and behavior. J Natl Med Assoc. 2007;99(10):1105-1112.
58. Peterson PN, Shetterly SM, Clarke CL, et al. Health literacy and outcomes among patients with heart failure. JAMA. 2011;305(16):1695-1701.
59. Rosas-salazar C, Apter AJ, Canino G, Celedón JC. Health literacy and asthma. J Allergy Clin Immunol. 2012;129(4):935-942.
60. Song L, Mishel M, Bensen JT, et al. How does health literacy affect quality of life among men with newly diagnosed clinically localized prostate cancer? Findings from the North Carolina-Louisiana Prostate Cancer Project (PCaP). Cancer. 2012;118(15):3842-3851.
61. Williams MV, Davis T, Parker RM, Weiss BD. The role of health literacy in patient-physician communication. Fam Med. 2002;34(5):383-389.
62. Badarudeen S, Sabharwal S. Assessing readability of patient education materials: current role in orthopaedics. Clin Orthop. 2010;468(10):2572-2580.
63. Doak CC, Doak LG, Friedell GH, Meade CD. Improving comprehension for cancer patients with low literacy skills: strategies for clinicians. CA Cancer J Clin. 1998;48(3):151-162.
64. Doak CC, Doak LG, Root JH. Teaching Patients With Low Literacy Skills. 2nd ed. Philadelphia, PA: JB Lippincott Company; 1996.
65. Kemp EC, Floyd MR, McCord-Duncan E, Lang F. Patients prefer the method of “tell back-collaborative inquiry” to assess understanding of medical information. J Am Board Fam Med. 2008;21(1):24-30.
66. Kripalani S, Bengtzen R, Henderson LE, Jacobson TA. Clinical research in low-literacy populations: using teach-back to assess comprehension of informed consent and privacy information. IRB. 2008;30(2):13-19.
67. Centers for Disease Control and Prevention. Simply Put: A Guide For Creating Easy-to-Understand Materials. 3rd ed. Atlanta, GA: Strategic and Proactive Communication Branch, Centers for Disease Control and Prevention, US Dept of Health and Human Services; 2009.
68. National Institutes of Health, National Cancer Institute. Clear & Simple: Developing Effective Print Materials for Low-Literate Readers. Devcompage website. http://devcompage.com/wp-content/uploads/2010/12/Clear_n_Simple.pdf Published March 2, 1998. Accessed December 1, 2014.
69. Weiss BD. Health Literacy and Patient Safety: Help Patients Understand. 2nd ed. Chicago, IL: American Medical Association and AMA Foundation; 2007:35-41.
70. Dale E, O’Rourke J. The Living Word Vocabulary. Newington, CT: World Book-Childcraft International, 1981.
71. Word suggestions. Plain Language website. www.plainlanguage.gov/howto/wordsuggestions/index.cfm. Accessed November 18, 2014.
72. Rivers K. Initiative aims to enhance patient communication materials. Reporter: Vanderbilt University Medical Center’s Weekly Newspaper. April 28, 2011. http://www.mc.vanderbilt.edu/reporter/index.html?ID=10649. Accessed November 18, 2014.
73. Ewing’s sarcoma. OrthoInfo. American Academy of Orthopaedic Surgeons website. http://orthoinfo.aaos.org/topic.cfm?topic=A00082. Last reviewed September 2011. Accessed November 18, 2014.
The diagnosis of cancer is a life-changing event for the patient as well as the patient’s family, friends, and relatives. Once diagnosed, most cancer patients want more information about their prognosis, future procedures, and/or treatment options.1 Receiving such information has been shown to reduce patient anxiety, increase patient satisfaction with care, and improve self-care.2-6 With the evolution of the Internet, patients in general7-9 and, specifically, cancer patients10-17 have turned to websites and online patient education materials (PEMs) to gather more health information.
For online PEMs to convey health information, their reading level must match the health literacy of the individuals who access them. Health literacy is the ability of an individual to gather and comprehend information about their condition to make the best decisions for their health.18 According to a report by the Institute of Medicine, 90 million American adults cannot properly use the US health care system because they do not possess adequate health literacy.18 Additionally, 36% of adults in the United States have basic or less-than-basic health literacy.19 This is starkly contrasted with the 12% of US adults who have proficient health literacy. A 2012 survey showed that about 31% of individuals who look for health information on the Internet have a high school education or less.8 In order to address the low health literacy of adults, the National Institutes of Health (NIH) has recommended that online PEMs be written at a sixth- to seventh-grade reading level.20
Unfortunately, many online PEMs related to certain cancer21-25 and orthopedic conditions26-31 do not meet NIH recommendations. Only 1 study has specifically looked at PEMs related to an orthopedic cancer condition.32 Lam and colleagues32 evaluated the readability of osteosarcoma PEMs from 56 websites using only 2 readability instruments and identified 86% of the websites as having a greater than eighth-grade reading level. No study has thoroughly assessed the readability of PEMs about bone and soft-tissue sarcomas and related conditions nor has any used 10 different readability instruments. Since each readability instrument has different variables (eg, sentence length, number of paragraphs, or number of complex words), averaging the scores of 10 of these instruments may result in less bias.
The purpose of this study was to evaluate the readability of online PEMs concerning bone and soft-tissue sarcomas and related conditions. The online PEMs came from websites that sarcoma patients may visit to obtain information about their condition. Our hypothesis was that the majority of these online PEMs will have a higher reading level than the NIH recommendations.
Materials and Methods
In May 2013, we identified online PEMs that included background, diagnosis, tests, or treatments for bone and soft-tissue sarcomas and conditions that mimic bone sarcoma. We included articles from the Tumors section of the American Academy of Orthopaedic Surgeons (AAOS) website.33 A second source of online PEMs came from a list of academic training centers created through the American Medical Association’s Fellowship and Residency Electronic Internet Database (FREIDA) with search criteria narrowed to orthopedic surgery. If we did not find PEMs of bone and soft-tissue cancers in the orthopedic department of a given academic training center’s website, we searched its cancer center website. We chose 4 programs with PEMs relevant to bone and soft-tissue sarcomas from each region in FREIDA for a balanced representation, except for the Territory region because it had only 1 academic training center and no relevant PEMs. Specialized websites, including Bonetumor.org, Sarcoma Alliance (Sarcomaalliance.org), and Sarcoma Foundation of America (Curesarcoma.org), were also evaluated. Within the Sarcoma Specialists section of the Sarcoma Alliance website,34 sarcoma specialists who were not identified from the FREIDA search for academic training centers were selected for review.
Because 8 of 10 individuals looking for health information on the Internet start their investigation at search engines, we also looked for PEMs through a Google search (Google.com) of bone cancer, and evaluated the first 10 hits for PEMs.8 Of these 10 hits, 8 had relevant PEMs, which we searched for additional PEMs about bone and soft-tissue cancers and related conditions. We also conducted a Google search of the most common bone sarcoma and soft-tissue sarcoma, osteosarcoma and malignant fibrous histiocytoma, respectively, and found 2 additional websites with relevant PEMs. LaCoursiere and colleagues35 surveyed cancer patients who used the Internet and found that they preferred WebMD (Webmd.com) and Medscape (Medscape.com) as sources for content about their medical condition.35 WebMD had been identified in the Google search, and we gathered the PEMs from Medscape also. It is worth noting that some of these websites are written for patients as well as clinicians.
Text from these PEMs were copied and pasted into separate Microsoft Word documents (Microsoft, Redmond, Washington). Advertisements, pictures, picture text, hyperlinks, copyright notices, page navigation links, paragraphs with no text, and any text that was not related to the given condition were deleted from the document to format the text for the readability software. Then, each Microsoft Word document was uploaded into the software package Readability Studio Professional (RSP) Edition Version 2012.1 for Windows (Oleander Software, Vandalia, Ohio). The 10 distinct readability instruments that were used to gauge the readability of each document were the Flesch Reading Ease score (FRE), the New Fog Count, the New Automated Readability Index, the Coleman-Liau Index (CLI), the Fry readability graph, the New Dale-Chall formula (NDC), the Gunning Frequency of Gobbledygook (Gunning FOG), the Powers-Sumner-Kearl formula, the Simple Measure of Gobbledygook (SMOG), and the Raygor Estimate Graph.
The FRE’s formula takes the average number of words per sentence and average number of syllables per word to compute a score ranging from 0 to 100 with 0 being the hardest to read.36 The New Fog Count tallies the number of sentences, easy words, and hard words (polysyllables) to calculate the grade level of the document.37 The New Automated Readability Index takes the average characters per word and average words per sentence to calculate a grade level for the document.37 The CLI randomly samples a few hundred words from the document, averages the number of letters and sentences per sample, and calculates an estimated grade level.38 The Fry readability graph selects samples of 100 words from the document, averages the number of syllables and sentences per 100 words, plots these data points on a graph, with the intersection determining the reading level.39 The NDC uses a list of 3000 familiar words that most fourth-grade students know.40 The percentage of difficult words, which are not on the list of familiar words, and the average sentence length in words are used to calculate the reading grade level of the document. The Gunning FOG uses the average sentence length in words and the percentage of hard words from a sample of at least 100 words to determine the reading grade level of the document.41 The Powers-Sumner-Kearl formula uses the average sentence length and percentage of monosyllables from a 100-word sample passage to calculate the reading grade level.42 The SMOG formula counts the number of polysyllabic words from 30 sentences and calculates the reading grade level of the document.43 In contrast to other formulas that test for 50% to 75% comprehension, the SMOG formula tests for 100% comprehension. As a result, the SMOG formula generally assigns a reading level 2 grades higher than the Dale-Chall level. The Raygor Estimate Graph selects a 100-word passage, counts the number of sentences and number of words with 6 or more letters, and plots the 2 variables on a graph to determine the reading grade level.44 The software package calculated the results from each reading instrument and reported the mean grade level score
for each document.
Results
We identified a total of 72 websites with relevant PEMs and included them in this study. Of these 72 websites, 36 websites were academic training centers, 10 were Google search hits, and 21 were from the Sarcoma Alliance list of sarcoma specialists. The remaining 5 websites were AAOS, Bonetumor.org, Sarcoma Alliance, Sarcoma Foundation of America, and Medscape. A list of conditions and treatments that were considered relevant PEMs is found in Appendix 1. A total of 774 articles were obtained from the 72 websites.
None of the websites had a mean readability score of 7 (seventh grade) or lower (Figures 1A, 1B). Mid-America Sarcoma Institute’s PEMs had the lowest mean readability score, 8.9. The lowest readability score was 5.3, which the New Fog Count readability instrument calculated for Vanderbilt University Medical Center’s (VUMC’s) PEMs (Appendix 2). The mean readability score of all websites was 11.4 (range, 8.9-15.5) (Appendix 2).
Seventy of 72 websites (97%) had PEMs that were fairly difficult or difficult, according to the FRE analysis (Figure 2). The American Cancer Society and Mid-America Sarcoma Institute had PEMs that were written in plain English. Sixty-nine of 72 websites (96%) had PEMs with a readability score of 10 or higher, according to the Raygor readability estimate (Figure 3). Using this instrument, the scores of the American Cancer Society and the University of Pennsylvania–Joan Karnell Cancer Center were 9; Mid-America Sarcoma Institute’s score was 8.
Discussion
Many cancer patients have turned to websites and online PEMs to gather health information about their condition.10-17 Basch and colleagues10 reported almost a decade ago that 44% of cancer patients, as well as 60% of their companions, used the Internet to find cancer-related information.10 When LaCoursiere and colleagues35 surveyed cancer patients, they found that patients handled their condition better and had less anxiety and uncertainty after using the Internet to find health information and support.35 In addition, many orthopedic patients, specifically 46% of orthopedic community outpatients,45 consult the Internet for information about their condition and future surgical procedures.46,47
This study comprehensively evaluated the readability of online PEMs of bone and soft-tissue sarcomas and related conditions by using 10 different readability instruments. After identifying 72 websites and 774 articles, we found that all 72 websites’ PEMs had a mean readability score that did not meet the NIH recommendation of writing PEMs at a sixth- to seventh-grade reading level. These results are consistent with studies evaluating the readability of online PEMs related to other cancer conditions21-25 and other orthopedic conditions.26-31
The combination of low health literacy of many US adults and high reading grade levels of the majority of online PEMs is not conducive to patients’ better understanding their condition(s). Even individuals with high reading skills prefer information that is simpler to read.48 In many areas of medicine, there is evidence that patients’ understanding of their condition has a positive impact on health outcomes, well-being, and the patient–physician relationship.49-61 Regarding cancer patients, Davis and colleagues54 and Peterson and colleagues57 showed that lower health literacy contributes to less knowledge and lower rates of breast54 and colorectal cancer57 screening tests. Even low health literacy of family caregivers of cancer patients can result in increased stress and lack of communication of important medical information between caregiver and physician.52 Among cancer patients, poor health literacy has been associated with mental distress60 as well as decreased compliance with treatment and lower involvement in clinical trials.55
The disparity between patients’ health literacy and the readability of online PEMs needs to be addressed by finding methods to improve patients’ understanding of their condition and to lower the readability scores of online PEMs. Better communication between patient and physician may improve patients’ comprehension of their condition and different aspects of their care.59,62-66 Doak and colleagues63 recommend giving cancer patients the most important information first; presenting information to patients in smaller doses; intermittently asking patients questions; and incorporating graphs, tables, and drawings into communication with patients.63 Additionally, allowing patients to repeat information they have just received/heard to the physician is another useful tool to improve patient education.62,64-66
Another way to address the disparity between patients’ health literacy and the readability of online PEMs is to reduce the reading grade level of existing PEMs. According to results from this study and others, the majority of online PEMs are above the reading grade level of a significant number of US adults. Many available and inexpensive readability instruments allow authors to assess their articles’ readability. Many writing guidelines also exist to help authors improve the readability of their PEMs.20,64,67-71 Living Word Vocabulary70 and Plain Language71 help authors replace complex words or medical terms with simpler words.29 Visual aids, audio, and video help patients with low health literacy remember the information.64
Efforts to improve PEM readability are effective. Of all the websites reviewed, VUMC was identified as having PEMs with the lowest readability score (5.3). This score was reported by the New Fog Count readability instrument, which accounts for the number of sentences, easy words, and hard words. In 2011, VUMC formed the Department of Patient Education to review and update its online and printed PEMs to make sure patients could read them.72 Additionally, the mean readability scores of the websites of the National Cancer Institute and MedlinePlus are in the top 50% of the websites included in this study. The NIH sponsors both sites, which follow the NIH guidelines for writing online PEMs at a reading level suitable for individuals with lower health literacy.20 These materials serve as potential models to improve the readability of PEMs, and, thus, help patients to better understand their condition, medical procedures, and/or treatment options.
To illustrate ways to improve the reading grade level of PEMs, we used the article “Ewing’s Sarcoma” from the AAOS website73 and followed the NIH guidelines to improve the reading grade level of the article.20 We identified complex words and defined them at an eighth-grade reading level. If that word was mentioned later in the article, simpler terminology was used instead of the initial complex word. For example, Ewing’s sarcoma was defined early and then referred to as bone tumor later in the article. We also identified every word that was 3 syllables or longer and used Microsoft Word’s thesaurus to replace those words with ones that were less than 3 syllables. Lastly, all sentences longer than 15 words were rewritten to be less than 15 words. After making these 3 changes to the article, the mean reading grade level dropped from 11.2 to 7.3.
This study has limitations. First, some readability instruments evaluate the number of syllables per word or polysyllabic words as part of their formula and, thus, can underestimate or overestimate the reading grade level of a document. Some readability formulas consider medical terms such as ulna, femur, or carpal as “easy” words because they have 2 syllables, but many laypersons may not comprehend these words. On the other hand, some readability formulas consider medical terms such as medications, diagnosis, or radiation as “hard” words because they contain 3 or more syllables, but the majority of laypersons likely comprehend these words. Second, the reading level of the patient population accessing those online sites was not assessed. Third, the readability instruments in this study did not evaluate the accuracy of the content, pictures, or tables of the PEMs. However, using 10 readability instruments allowed evaluation of many different readability aspects of the text. Fourth, because some websites identified in this study, such as Bonetumor.org, were written for patients as well as clinicians, the reading grade level of these sites may be higher than that of those sites written just for patients.
Conclusion
Because many orthopedic cancer patients rely on the Internet as a source of information, the need for online PEMs to match the reading skills of the patient population who accesses them is vital. However, this study shows that many organizations, academic training centers, and other entities need to update their online PEMs because all PEMs in this study had a mean readability grade level higher than the NIH recommendation. Further research needs to evaluate the effectiveness of other media, such as video, illustrations, and audio, to provide health information to patients. With many guidelines available that provide plans and advice to improve the readability of PEMs, research also must assess the most effective plans and advice in order to allow authors to focus their attention on 1 set of guidelines to improve the readability of their PEMs.
1. Piredda M, Rocci L, Gualandi R, Petitti T, Vincenzi B, De Marinis MG. Survey on learning needs and preferred sources of information to meet these needs in Italian oncology patients receiving chemotherapy. Eur J Oncol Nurs. 2008;12(2):120-126.
2. Fernsler JI, Cannon CA. The whys of patient education. Semin Oncol Nurs. 1991;7(2):79-86.
3. Glimelius B, Birgegård G, Hoffman K, Kvale G, Sjödén PO. Information to and communication with cancer patients: improvements and psychosocial correlates in a comprehensive care program for patients and their relatives. Patient Educ Couns. 1995;25(2):171-182.
4. Harris KA. The informational needs of patients with cancer and their families. Cancer Pract. 1998;6(1):39-46.
5. Jensen AB, Madsen B, Andersen P, Rose C. Information for cancer patients entering a clinical trial--an evaluation of an information strategy. Eur J Cancer. 1993;29A(16):2235-2238.
6. Wells ME, McQuellon RP, Hinkle JS, Cruz JM. Reducing anxiety in newly diagnosed cancer patients: a pilot program. Cancer Pract. 1995;3(2):100-104.
7. Diaz JA, Griffith RA, Ng JJ, Reinert SE, Friedmann PD, Moulton AW. Patients’ use of the Internet for medical information. J Gen Intern Med. 2002;17(3):180-185.
8. Fox S, Duggan M. Health Online 2013. Pew Research Center’s Internet and American Life Project. www.pewinternet.org/~/media//Files/Reports/PIP_HealthOnline.pdf. Published January 15, 2013. Accessed November 18. 2014.
9. Schwartz KL, Roe T, Northrup J, Meza J, Seifeldin R, Neale AV. Family medicine patients’ use of the Internet for health information: a MetroNet study. J Am Board Fam Med. 2006;19(1):39-45.
10. Basch EM, Thaler HT, Shi W, Yakren S, Schrag D. Use of information resources by patients with cancer and their companions. Cancer. 2004;100(11):2476-2483.
11. Huang GJ, Penson DF. Internet health resources and the cancer patient. Cancer Invest. 2008;26(2):202-207.
12. Metz JM, Devine P, Denittis A, et al. A multi-institutional study of Internet utilization by radiation oncology patients. Int J Radiat Oncol Biol Phys. 2003;56(4):1201-1205.
13. Peterson MW, Fretz PC. Patient use of the internet for information in a lung cancer clinic. Chest. 2003;123(2):452-457.
14. Satterlund MJ, McCaul KD, Sandgren AK. Information gathering over time by breast cancer patients. J Med Internet Res. 2003;5(3):e15.
15. Tustin N. The role of patient satisfaction in online health information seeking. J Health Commun. 2010;15(1):3-17.
16. Van de Poll-Franse LV, Van Eenbergen MC. Internet use by cancer survivors: current use and future wishes. Support Care Cancer. 2008;16(10):1189-1195.
17. Ziebland S, Chapple A, Dumelow C, Evans J, Prinjha S, Rozmovits L. How the internet affects patients’ experience of cancer: a qualitative study. BMJ. 2004;328(7439):564.
18. Committee on Health Literacy, Board on Neuroscience and Behavioral Health, Institute of Medicine. Nielsen-Bohlman L, Panzer AM, Kindig DA, eds. Health Literacy: A Prescription to End Confusion. Washington, DC: National Academies Press; 2004. Available at: www.nap.edu/openbook.php?record_id=10883. Accessed November 18, 2014.
19. Kutner M, Greenberg E, Ying J, Paulsen C. The Health Literacy of America’s Adults: Results from the 2003 National Assessment of Adult Literacy. NCES 2006-483. US Department of Education. Washington, DC: National Center for Education Statistics; 2006. Available at: www.nces.ed.gov/pubs2006/2006483.pdf. Accessed November 18, 2014.
20. How to write easy-to-read health materials. MedlinePlus website. www.nlm.nih.gov/medlineplus/etr.html. Updated February 13, 2013. Accessed November 18, 2014.
21. Ellimoottil C, Polcari A, Kadlec A, Gupta G. Readability of websites containing information about prostate cancer treatment options. J Urol. 2012;188(6):2171-2175.
22. Friedman DB, Hoffman-Goetz L, Arocha JF. Health literacy and the World Wide Web: comparing the readability of leading incident cancers on the Internet. Med Inform Internet Med. 2006;31(1):67-87.
23. Hoppe IC. Readability of patient information regarding breast cancer prevention from the Web site of the National Cancer Institute. J Cancer Educ. 2010;25(4):490-492.
24. Misra P, Kasabwala K, Agarwal N, Eloy JA, Liu JK. Readability analysis of internet-based patient information regarding skull base tumors. J Neurooncol. 2012;109(3):573-580.
25. Stinson JN, White M, Breakey V, et al. Perspectives on quality and content of information on the internet for adolescents with cancer. Pediatr Blood Cancer. 2011;57(1):97-104.
26. Badarudeen S, Sabharwal S. Readability of patient education materials from the American Academy of Orthopaedic Surgeons and Pediatric Orthopaedic Society of North America web sites. J Bone Joint Surg Am. 2008;90(1):199-204.
27. Bluman EM, Foley RP, Chiodo CP. Readability of the Patient Education Section of the AOFAS Website. Foot Ankle Int. 2009;30(4):287-291.
28. Polishchuk DL, Hashem J, Sabharwal S. Readability of online patient education materials on adult reconstruction Web sites. J Arthroplasty. 2012;27(5):716-719.
29. Sabharwal S, Badarudeen S, Unes Kunju S. Readability of online patient education materials from the AAOS web site. Clin Orthop. 2008;466(5):1245-1250.
30. Vives M, Young L, Sabharwal S. Readability of spine-related patient education materials from subspecialty organization and spine practitioner websites. Spine. 2009;34(25):2826-2831.
31. Wang SW, Capo JT, Orillaza N. Readability and comprehensibility of patient education material in hand-related web sites. J Hand Surg Am. 2009;34(7):1308-1315.
32. Lam CG, Roter DL, Cohen KJ. Survey of quality, readability, and social reach of websites on osteosarcoma in adolescents. Patient Educ Couns. 2013;90(1):82-87.
33. Tumors. Quinn RH, ed. OrthoInfo. American Academy of Orthopaedic Surgeons website. http://orthoinfo.aaos.org/menus/tumors.cfm. Accessed November 18, 2014.
34. Sarcoma specialists. Sarcoma Alliance website. sarcomaalliance.org/sarcoma-centers. Accessed November 18, 2014.
35. LaCoursiere SP, Knobf MT, McCorkle R. Cancer patients’ self-reported attitudes about the Internet. J Med Internet Res. 2005;7(3):e22.
36. Test your document’s readability. Microsoft Office website. office.microsoft.com/en-us/word-help/test-your-document-s-readability-HP010148506.aspx. Accessed November 18, 2014.
37. Kincaid JP, Fishburne RP, Rogers RL, Chissom BS. Derivation of new readability formulas (Automated Readability Index, Fog Count and Flesch Reading Ease Formula) for Navy enlisted personnel. Naval Technical Training Command. Research Branch Report 8-75. www.dtic.mil/dtic/tr/fulltext/u2/a006655.pdf. Published February 1975. Accessed November 18, 2014.
38. Coleman M, Liau TL. A computer readability formula designed for machine scoring. J Appl Psychol. 1975;60(2):283-284.
39. Fry E. Fry’s readability graph: clarifications, validity, and extension to Level 17. J Reading. 1977;21(3):242-252.
40. Chall JS, Dale E. Manual for the New Dale-Chall Readability Formula. Cambridge, MA: Brookline Books; 1995.
41. Gunning R. The Technique of Clear Writing. Rev. ed. New York, NY: McGraw-Hill; 1968.
42. Powers RD, Sumner WA, Kearl BE. A recalculation of four adult readability formulas. J Educ Psychol. 1958;49(2):99-105.
43. McLaughlin GH. SMOG grading—a new readability formula. J Reading. 1969;22,639-646.
44. Raygor L. The Raygor readability estimate: a quick and easy way to determine difficulty. In: Pearson PD, Hansen J, eds. Reading Theory, Research and Practice. Twenty-Sixth Yearbook of the National Reading Conference. Clemson, SC: National Reading Conference Inc; 1977:259-263.
45. Krempec J, Hall J, Biermann JS. Internet use by patients in orthopaedic surgery. Iowa Orthop J. 2003;23:80-82.
46. Beall MS, Golladay GJ, Greenfield ML, Hensinger RN, Biermann JS. Use of the Internet by pediatric orthopaedic outpatients. J Pediatr Orthop. 2002;22(2):261-264.
47. Beall MS, Beall MS, Greenfield ML, Biermann JS. Patient Internet use in a community outpatient orthopaedic practice. Iowa Orthop J. 2002;22:103-107.
48. Davis TC, Bocchini JA, Fredrickson D, et al. Parent comprehension of polio vaccine information pamphlets. Pediatrics. 1996;97(6 Pt 1):804-810.
49. Apter AJ, Wan F, Reisine S, et al. The association of health literacy with adherence and outcomes in moderate-severe asthma. J Allergy Clin Immunol. 2013;132(2):321-327.
50. Baker DW, Parker RM, Williams MV, Clark WS. Health literacy and the risk of hospital admission. J Gen Intern Med. 1998;13(12):791-798.
51. Berkman ND, Sheridan SL, Donahue KE, Halpern DJ, Crotty K. Low health literacy and health outcomes: an updated systematic review. Ann Intern Med. 2011;155(2):97-107.
52. Bevan JL, Pecchioni LL. Understanding the impact of family caregiver cancer literacy on patient health outcomes. Patient Educ Couns. 2008;71(3):356-364.
53. Corey MR, St Julien J, Miller C, et al. Patient education level affects functionality and long term mortality after major lower extremity amputation. Am J Surg. 2012;204(5):626-630.
54. Davis TC, Arnold C, Berkel HJ, Nandy I, Jackson RH, Glass J. Knowledge and attitude on screening mammography among low-literate, low-income women. Cancer. 1996;78(9):1912-1920.
55. Davis TC, Williams MV, Marin E, Parker RM, Glass J. Health literacy and cancer communication. CA Cancer J Clin. 2002;52(3):134-149.
56. Freedman RB, Jones SK, Lin A, Robin AL, Muir KW. Influence of parental health literacy and dosing responsibility on pediatric glaucoma medication adherence. Arch Ophthalmol. 2012;130(3):306-311.
57. Peterson NB, Dwyer KA, Mulvaney SA, Dietrich MS, Rothman RL. The influence of health literacy on colorectal cancer screening knowledge, beliefs and behavior. J Natl Med Assoc. 2007;99(10):1105-1112.
58. Peterson PN, Shetterly SM, Clarke CL, et al. Health literacy and outcomes among patients with heart failure. JAMA. 2011;305(16):1695-1701.
59. Rosas-salazar C, Apter AJ, Canino G, Celedón JC. Health literacy and asthma. J Allergy Clin Immunol. 2012;129(4):935-942.
60. Song L, Mishel M, Bensen JT, et al. How does health literacy affect quality of life among men with newly diagnosed clinically localized prostate cancer? Findings from the North Carolina-Louisiana Prostate Cancer Project (PCaP). Cancer. 2012;118(15):3842-3851.
61. Williams MV, Davis T, Parker RM, Weiss BD. The role of health literacy in patient-physician communication. Fam Med. 2002;34(5):383-389.
62. Badarudeen S, Sabharwal S. Assessing readability of patient education materials: current role in orthopaedics. Clin Orthop. 2010;468(10):2572-2580.
63. Doak CC, Doak LG, Friedell GH, Meade CD. Improving comprehension for cancer patients with low literacy skills: strategies for clinicians. CA Cancer J Clin. 1998;48(3):151-162.
64. Doak CC, Doak LG, Root JH. Teaching Patients With Low Literacy Skills. 2nd ed. Philadelphia, PA: JB Lippincott Company; 1996.
65. Kemp EC, Floyd MR, McCord-Duncan E, Lang F. Patients prefer the method of “tell back-collaborative inquiry” to assess understanding of medical information. J Am Board Fam Med. 2008;21(1):24-30.
66. Kripalani S, Bengtzen R, Henderson LE, Jacobson TA. Clinical research in low-literacy populations: using teach-back to assess comprehension of informed consent and privacy information. IRB. 2008;30(2):13-19.
67. Centers for Disease Control and Prevention. Simply Put: A Guide For Creating Easy-to-Understand Materials. 3rd ed. Atlanta, GA: Strategic and Proactive Communication Branch, Centers for Disease Control and Prevention, US Dept of Health and Human Services; 2009.
68. National Institutes of Health, National Cancer Institute. Clear & Simple: Developing Effective Print Materials for Low-Literate Readers. Devcompage website. http://devcompage.com/wp-content/uploads/2010/12/Clear_n_Simple.pdf Published March 2, 1998. Accessed December 1, 2014.
69. Weiss BD. Health Literacy and Patient Safety: Help Patients Understand. 2nd ed. Chicago, IL: American Medical Association and AMA Foundation; 2007:35-41.
70. Dale E, O’Rourke J. The Living Word Vocabulary. Newington, CT: World Book-Childcraft International, 1981.
71. Word suggestions. Plain Language website. www.plainlanguage.gov/howto/wordsuggestions/index.cfm. Accessed November 18, 2014.
72. Rivers K. Initiative aims to enhance patient communication materials. Reporter: Vanderbilt University Medical Center’s Weekly Newspaper. April 28, 2011. http://www.mc.vanderbilt.edu/reporter/index.html?ID=10649. Accessed November 18, 2014.
73. Ewing’s sarcoma. OrthoInfo. American Academy of Orthopaedic Surgeons website. http://orthoinfo.aaos.org/topic.cfm?topic=A00082. Last reviewed September 2011. Accessed November 18, 2014.
The Epidemic of Tommy John Surgery: The Role of the Orthopedic Surgeon
Ulnar collateral ligament (UCL) reconstruction, commonly referred to as Tommy John surgery, is a well-described surgical treatment for elite athletes with a symptomatic, deficient UCL.1, 2 The procedure was first performed by the late Dr. Frank Jobe in 1974, described in 1986, and has undergone several modifications over the past 30 years.3 Different graft choices, tunnel positions, graft configurations, and tunnel fixation methods are just some of the alterations that have been made to the original Jobe technique.4-6 With time, the index procedure has become more refined, with predictable outcomes in Major League Baseball (MLB) pitchers as well as other elite overhead throwing athletes.2,7,8 However, though this surgery was originally described for elite athletes suffering from UCL deficiency, recent times have seen an increase of over 50% in the number of UCL reconstructions performed on high school–aged and younger athletes.9 Furthermore, in 2000, a total of 13 MLB pitchers underwent UCL reconstruction, while in 2012 this number increased nearly threefold to 32.2 This paradigm shift of performing UCL reconstructions more frequently and on younger athletes raises a very important question: what is the role of the orthopedic surgeon in this epidemic?
UCL reconstruction has become a reliable procedure for MLB pitchers and other overhead throwing athletes.7,10,11 Recent studies have reported that MLB pitchers who undergo UCL reconstruction return to pitch in the MLB 83% of the time, whereas only 3% fail to return to pitch in either MLB or the minor league.2 Furthermore, pitchers who undergo UCL reconstruction perform similarly after surgery as prior to their UCL reconstruction, with fewer innings pitched after surgery, but, more importantly, a lower earned run average (ERA) and walks plus hits per inning pitched (WHIP) after surgery. These last 2 statistics, known as sabermetrics, evaluate the pitcher’s effectiveness; the fact that these are improved after surgery is reassuring for pitchers who undergo this procedure. However, it must be recognized that these pitchers pitched fewer innings after surgery.
There has been a sharp increase in the number of MLB pitchers who have undergone UCL reconstruction in recent years, especially the past 3 seasons, in which over 60 pitchers have had Tommy John surgery.2 This increase, however, is not confined to MLB pitchers. High school–aged pitchers have also been part of this drastic rise in the number of UCL reconstructions performed throughout the country. Dr. James Andrews and colleagues noted a 50% increase from 1988-1994 to 1995-2003 in the proportion of high school–aged pitchers who underwent UCL reconstruction (while the absolute number increased from 7 to 77 in high school–aged players compared with 85 to 609 in adult athletes).9 Given the increase in MLB pitchers over the past few years, it is likely this number has also increased among adolescent pitchers.
This data again raises the question: what is the role of the orthopedic surgeon in this epidemic? There are many plausible responses, but in my opinion, there is one answer that surpasses the others. As a trained professional, surgeons are tasked with the responsibility of looking out for the best interest of their patients, even when this conflicts with the patient’s, or the patient’s parent’s or coach’s desires. This includes injury prevention, such as instituting pitch counts and developing products that allow coaches to determine when a pitcher may be at risk for injury from fatigue, as well as injury treatment.12 It is difficult for a patient to understand the gravity of surgery and the rehabilitation process, specifically a procedure as involved as UCL reconstruction, and especially if the patient is an adolescent who has their outlook clouded by the fact that they believe they will be the next MLB star pitcher. The reality is that the National Collegiate Athletic Association (NCAA)13 has released data that has demonstrated that only 6.8% of high school baseball players will play baseball in college. Furthermore, only 9.4% of college baseball players will reach the professional level. That equates to 0.5%, or 1 in 200 high school players who will eventually play professional baseball.13 However, the reverse of this is also true, that out of every 200 players, 1 will make it to the major leagues, and that 1 player could be the patient in question. Hence, the purpose of this data is to show parents and athletes that, while they do have a chance of playing professional, and certainly collegiate, baseball, that percentage must be weighed against the risks of surgery.
MLB pitchers who have an endless supply of rehabilitation facilities, trainers, etc, do not return to pitching competitively and consistently in the majors for more than 15 months after UCL reconstruction.2 The time commitment and rehabilitation required for these patients is staggering.14,15 Furthermore, parents of these children who are consenting for them also have a difficult time comprehending the workload they are signing their child up for. Some parents believe this surgery will help their child throw faster, longer, and more accurately—beliefs that numerous studies have shown to be flat-out inaccurate. In fact, pitchers tend to lose a slight amount of velocity and accuracy after UCL reconstruction.11,16 Ahmad and colleagues17 administered a questionnaire to 189 players, 15 coaches, and 31 parents about the indications, risks, benefits, etc, regarding UCL reconstruction to determine the public’s perception regarding this surgery. The results demonstrated that the public, including coaches, have a significantly skewed perception of exactly how serious this surgery is. The study showed that 28% of players and 20% of coaches believed the pitcher’s performance would be improved after surgery, and, more strikingly, 26% of collegiate athletes, 30% percent of coaches, 37% of parents, and 51% of high school athletes believed UCL reconstruction should be performed as a prophylactic procedure to enhance performance in an uninjured athlete.17
Henceforth, it becomes the surgeon’s responsibility to ensure that both the patient and the parents understand what the surgery and rehabilitation process entails, to keep the expectations of the patient and his or her family realistic, and to counsel these patients on alternative options with lower risks. As Ahmad and colleagues17 demonstrated, this is not an easy task given the public’s preconceived notions. Many patients, especially patients of the younger generation, seem to be willing to jump to surgery as the first option for treatment without having truly tried any nonoperative measures, because they believe surgery to be a quick, easy, and definitive answer. This is not always the case, and a trial of nonoperative treatment, including rest, ice, physical therapy, and possibly platelet-rich plasma (PRP), should be instituted for high school–aged players who present with UCL insufficiency prior to discussing surgery.18,19
Medial UCL reconstruction is a successful procedure for elite MLB athletes. However, UCL reconstruction is becoming a victim of its own success as younger and younger athletes who will likely never play at the major league level are undergoing this procedure at an alarming rate. This is an epidemic which must be addressed by surgeons, coaches, and parents alike to curb the beliefs that UCL reconstruction will make high school–aged pitchers more successful. This procedure should not be performed prophylactically on an athlete of any age, especially those in high school. Further studies on the effectiveness of both nonoperative rest and rehabilitation and of PRP on partial-thickness UCL tears are warranted. New technology in the form of a compression sleeve with imbedded sensors to track the biomechanics of a pitcher’s elbow has been released and will hopefully provide information to coaches about when pitchers’ elbows begin to fatigue based on several biomechanical parameters.12 The future of UCL reconstruction is still fluid, and with proper prevention strategies, nonoperative treatment, indications, and preoperative discussions, the Tommy John epidemic can be cured. ◾
1. Conway JE, Jobe FW, Glousman RE, Pink M. Medial instability of the elbow in throwing athletes. Treatment by repair or reconstruction of the ulnar collateral ligament. J Bone Joint Surg Am. 1992;74(1):67-83.
2. Erickson BJ, Gupta AK, Harris JD, et al. Rate of return to pitching and performance after Tommy John surgery in Major League Baseball pitchers. Am J Sports Med. 2014;42(3):536-543.
3. Jobe FW, Stark H, Lombardo SJ. Reconstruction of the ulnar collateral ligament in athletes. J Bone Joint Surg Am. 1986;68(8):1158-1163.
4. Jackson TJ, Adamson GJ, Peterson A, Patton J, McGarry MH, Lee TQ. Ulnar collateral ligament reconstruction using bisuspensory fixation: a biomechanical comparison with the docking technique. Am J Sports Med. 2013;41(5):1158-1164.
5. Dines JS, ElAttrache NS, Conway JE, Smith W, Ahmad CS. Clinical outcomes of the DANE TJ technique to treat ulnar collateral ligament insufficiency of the elbow. Am J Sports Med. 2007;35(12):2039-2044.
6. Andrews JR, Jost PW, Cain EL. The ulnar collateral ligament procedure revisited: the procedure we use. Sports Health. 2012;4(5):438-441.
7. Dines JS, Jones KJ, Kahlenberg C, Rosenbaum A, Osbahr DC, Altchek DW. Elbow ulnar collateral ligament reconstruction in javelin throwers at a minimum 2-year follow-up. Am J Sports Med. 2012;40(1):148-151.
8. Gibson BW, Webner D, Huffman GR, Sennett BJ. Ulnar collateral ligament reconstruction in major league baseball pitchers. Am J Sports Med. 2007;35(4):575-581.
9. Petty DH, Andrews JR, Fleisig GS, Cain EL. Ulnar collateral ligament reconstruction in high school baseball players: clinical results and injury risk factors. Am J Sports Med. 2004;32(5):1158-1164.
10. Osbahr DC, Cain EL Jr, Raines BT, Fortenbaugh D, Dugas JR, Andrews JR. Long-term outcomes after ulnar collateral ligament reconstruction in competitive baseball players: minimum 10-year follow-up. Am J Sports Med. 2014;42(6):1333-1342.
11. Jiang JJ, Leland JM. Analysis of pitching velocity in major league baseball players before and after ulnar collateral ligament reconstruction. Am J Sports Med. 2014;42(4):880-885.
12. Carroll W. The sleeve that could save baseball: exclusive look at new MLB technology. Bleacher Report. http://bleacherreport.com/articles/2097866-the-sleeve-that-could-save-baseball-exclusive-look-at-new-mlb-technology?utm_campaign=tsipad&utm_medium=referral&utm_source=teamstream. Published July 2, 2014. Accessed November 12, 2014.
13. National Collegiate Athletic Association. Estimated probability of competing in athletics beyond the high school interscholastic level. https://www.ncaa.org/sites/default/files/Probability-of-going-pro-methodology_Update2013.pdf. Updated September 24, 2013. Accessed November 12, 2014.
14. Wilk KE, Macrina LC, Cain EL, Dugas JR, Andrews JR. Rehabilitation of the overhead athlete’s elbow. Sports Health. 2012;4(5):404-414.
15. Wilk KE, Reinold MM, Andrews JR. Rehabilitation of the thrower’s elbow. Tech Hand Up Extrem Surg. 2003;7(4):197-216.
16. Makhni EC, Lee RW, Morrow ZS, Gualtieri AP, Gorroochurn P, Ahmad CS. Performance, return to competition, and reinjury after Tommy John surgery in Major League Baseball pitchers: a review of 147 cases. Am J Sports Med. 2014;42(6):1323-1332.
17. Ahmad CS, Grantham WJ, Greiwe RM. Public perceptions of Tommy John surgery. Phys Sportsmed. 2012;40(2):64-72.
18. Rettig AC, Sherrill C, Snead DS, Mendler JC, Mieling P. Nonoperative treatment of ulnar collateral ligament injuries in throwing athletes. Am J Sports Med. 2001;29(1):15-17.
19. Podesta L, Crow SA, Volkmer D, Bert T, Yocum LA. Treatment of partial ulnar collateral ligament tears in the elbow with platelet-rich plasma. Am J Sports Med. 2013;41(7):1689-1694.
Ulnar collateral ligament (UCL) reconstruction, commonly referred to as Tommy John surgery, is a well-described surgical treatment for elite athletes with a symptomatic, deficient UCL.1, 2 The procedure was first performed by the late Dr. Frank Jobe in 1974, described in 1986, and has undergone several modifications over the past 30 years.3 Different graft choices, tunnel positions, graft configurations, and tunnel fixation methods are just some of the alterations that have been made to the original Jobe technique.4-6 With time, the index procedure has become more refined, with predictable outcomes in Major League Baseball (MLB) pitchers as well as other elite overhead throwing athletes.2,7,8 However, though this surgery was originally described for elite athletes suffering from UCL deficiency, recent times have seen an increase of over 50% in the number of UCL reconstructions performed on high school–aged and younger athletes.9 Furthermore, in 2000, a total of 13 MLB pitchers underwent UCL reconstruction, while in 2012 this number increased nearly threefold to 32.2 This paradigm shift of performing UCL reconstructions more frequently and on younger athletes raises a very important question: what is the role of the orthopedic surgeon in this epidemic?
UCL reconstruction has become a reliable procedure for MLB pitchers and other overhead throwing athletes.7,10,11 Recent studies have reported that MLB pitchers who undergo UCL reconstruction return to pitch in the MLB 83% of the time, whereas only 3% fail to return to pitch in either MLB or the minor league.2 Furthermore, pitchers who undergo UCL reconstruction perform similarly after surgery as prior to their UCL reconstruction, with fewer innings pitched after surgery, but, more importantly, a lower earned run average (ERA) and walks plus hits per inning pitched (WHIP) after surgery. These last 2 statistics, known as sabermetrics, evaluate the pitcher’s effectiveness; the fact that these are improved after surgery is reassuring for pitchers who undergo this procedure. However, it must be recognized that these pitchers pitched fewer innings after surgery.
There has been a sharp increase in the number of MLB pitchers who have undergone UCL reconstruction in recent years, especially the past 3 seasons, in which over 60 pitchers have had Tommy John surgery.2 This increase, however, is not confined to MLB pitchers. High school–aged pitchers have also been part of this drastic rise in the number of UCL reconstructions performed throughout the country. Dr. James Andrews and colleagues noted a 50% increase from 1988-1994 to 1995-2003 in the proportion of high school–aged pitchers who underwent UCL reconstruction (while the absolute number increased from 7 to 77 in high school–aged players compared with 85 to 609 in adult athletes).9 Given the increase in MLB pitchers over the past few years, it is likely this number has also increased among adolescent pitchers.
This data again raises the question: what is the role of the orthopedic surgeon in this epidemic? There are many plausible responses, but in my opinion, there is one answer that surpasses the others. As a trained professional, surgeons are tasked with the responsibility of looking out for the best interest of their patients, even when this conflicts with the patient’s, or the patient’s parent’s or coach’s desires. This includes injury prevention, such as instituting pitch counts and developing products that allow coaches to determine when a pitcher may be at risk for injury from fatigue, as well as injury treatment.12 It is difficult for a patient to understand the gravity of surgery and the rehabilitation process, specifically a procedure as involved as UCL reconstruction, and especially if the patient is an adolescent who has their outlook clouded by the fact that they believe they will be the next MLB star pitcher. The reality is that the National Collegiate Athletic Association (NCAA)13 has released data that has demonstrated that only 6.8% of high school baseball players will play baseball in college. Furthermore, only 9.4% of college baseball players will reach the professional level. That equates to 0.5%, or 1 in 200 high school players who will eventually play professional baseball.13 However, the reverse of this is also true, that out of every 200 players, 1 will make it to the major leagues, and that 1 player could be the patient in question. Hence, the purpose of this data is to show parents and athletes that, while they do have a chance of playing professional, and certainly collegiate, baseball, that percentage must be weighed against the risks of surgery.
MLB pitchers who have an endless supply of rehabilitation facilities, trainers, etc, do not return to pitching competitively and consistently in the majors for more than 15 months after UCL reconstruction.2 The time commitment and rehabilitation required for these patients is staggering.14,15 Furthermore, parents of these children who are consenting for them also have a difficult time comprehending the workload they are signing their child up for. Some parents believe this surgery will help their child throw faster, longer, and more accurately—beliefs that numerous studies have shown to be flat-out inaccurate. In fact, pitchers tend to lose a slight amount of velocity and accuracy after UCL reconstruction.11,16 Ahmad and colleagues17 administered a questionnaire to 189 players, 15 coaches, and 31 parents about the indications, risks, benefits, etc, regarding UCL reconstruction to determine the public’s perception regarding this surgery. The results demonstrated that the public, including coaches, have a significantly skewed perception of exactly how serious this surgery is. The study showed that 28% of players and 20% of coaches believed the pitcher’s performance would be improved after surgery, and, more strikingly, 26% of collegiate athletes, 30% percent of coaches, 37% of parents, and 51% of high school athletes believed UCL reconstruction should be performed as a prophylactic procedure to enhance performance in an uninjured athlete.17
Henceforth, it becomes the surgeon’s responsibility to ensure that both the patient and the parents understand what the surgery and rehabilitation process entails, to keep the expectations of the patient and his or her family realistic, and to counsel these patients on alternative options with lower risks. As Ahmad and colleagues17 demonstrated, this is not an easy task given the public’s preconceived notions. Many patients, especially patients of the younger generation, seem to be willing to jump to surgery as the first option for treatment without having truly tried any nonoperative measures, because they believe surgery to be a quick, easy, and definitive answer. This is not always the case, and a trial of nonoperative treatment, including rest, ice, physical therapy, and possibly platelet-rich plasma (PRP), should be instituted for high school–aged players who present with UCL insufficiency prior to discussing surgery.18,19
Medial UCL reconstruction is a successful procedure for elite MLB athletes. However, UCL reconstruction is becoming a victim of its own success as younger and younger athletes who will likely never play at the major league level are undergoing this procedure at an alarming rate. This is an epidemic which must be addressed by surgeons, coaches, and parents alike to curb the beliefs that UCL reconstruction will make high school–aged pitchers more successful. This procedure should not be performed prophylactically on an athlete of any age, especially those in high school. Further studies on the effectiveness of both nonoperative rest and rehabilitation and of PRP on partial-thickness UCL tears are warranted. New technology in the form of a compression sleeve with imbedded sensors to track the biomechanics of a pitcher’s elbow has been released and will hopefully provide information to coaches about when pitchers’ elbows begin to fatigue based on several biomechanical parameters.12 The future of UCL reconstruction is still fluid, and with proper prevention strategies, nonoperative treatment, indications, and preoperative discussions, the Tommy John epidemic can be cured. ◾
1. Conway JE, Jobe FW, Glousman RE, Pink M. Medial instability of the elbow in throwing athletes. Treatment by repair or reconstruction of the ulnar collateral ligament. J Bone Joint Surg Am. 1992;74(1):67-83.
2. Erickson BJ, Gupta AK, Harris JD, et al. Rate of return to pitching and performance after Tommy John surgery in Major League Baseball pitchers. Am J Sports Med. 2014;42(3):536-543.
3. Jobe FW, Stark H, Lombardo SJ. Reconstruction of the ulnar collateral ligament in athletes. J Bone Joint Surg Am. 1986;68(8):1158-1163.
4. Jackson TJ, Adamson GJ, Peterson A, Patton J, McGarry MH, Lee TQ. Ulnar collateral ligament reconstruction using bisuspensory fixation: a biomechanical comparison with the docking technique. Am J Sports Med. 2013;41(5):1158-1164.
5. Dines JS, ElAttrache NS, Conway JE, Smith W, Ahmad CS. Clinical outcomes of the DANE TJ technique to treat ulnar collateral ligament insufficiency of the elbow. Am J Sports Med. 2007;35(12):2039-2044.
6. Andrews JR, Jost PW, Cain EL. The ulnar collateral ligament procedure revisited: the procedure we use. Sports Health. 2012;4(5):438-441.
7. Dines JS, Jones KJ, Kahlenberg C, Rosenbaum A, Osbahr DC, Altchek DW. Elbow ulnar collateral ligament reconstruction in javelin throwers at a minimum 2-year follow-up. Am J Sports Med. 2012;40(1):148-151.
8. Gibson BW, Webner D, Huffman GR, Sennett BJ. Ulnar collateral ligament reconstruction in major league baseball pitchers. Am J Sports Med. 2007;35(4):575-581.
9. Petty DH, Andrews JR, Fleisig GS, Cain EL. Ulnar collateral ligament reconstruction in high school baseball players: clinical results and injury risk factors. Am J Sports Med. 2004;32(5):1158-1164.
10. Osbahr DC, Cain EL Jr, Raines BT, Fortenbaugh D, Dugas JR, Andrews JR. Long-term outcomes after ulnar collateral ligament reconstruction in competitive baseball players: minimum 10-year follow-up. Am J Sports Med. 2014;42(6):1333-1342.
11. Jiang JJ, Leland JM. Analysis of pitching velocity in major league baseball players before and after ulnar collateral ligament reconstruction. Am J Sports Med. 2014;42(4):880-885.
12. Carroll W. The sleeve that could save baseball: exclusive look at new MLB technology. Bleacher Report. http://bleacherreport.com/articles/2097866-the-sleeve-that-could-save-baseball-exclusive-look-at-new-mlb-technology?utm_campaign=tsipad&utm_medium=referral&utm_source=teamstream. Published July 2, 2014. Accessed November 12, 2014.
13. National Collegiate Athletic Association. Estimated probability of competing in athletics beyond the high school interscholastic level. https://www.ncaa.org/sites/default/files/Probability-of-going-pro-methodology_Update2013.pdf. Updated September 24, 2013. Accessed November 12, 2014.
14. Wilk KE, Macrina LC, Cain EL, Dugas JR, Andrews JR. Rehabilitation of the overhead athlete’s elbow. Sports Health. 2012;4(5):404-414.
15. Wilk KE, Reinold MM, Andrews JR. Rehabilitation of the thrower’s elbow. Tech Hand Up Extrem Surg. 2003;7(4):197-216.
16. Makhni EC, Lee RW, Morrow ZS, Gualtieri AP, Gorroochurn P, Ahmad CS. Performance, return to competition, and reinjury after Tommy John surgery in Major League Baseball pitchers: a review of 147 cases. Am J Sports Med. 2014;42(6):1323-1332.
17. Ahmad CS, Grantham WJ, Greiwe RM. Public perceptions of Tommy John surgery. Phys Sportsmed. 2012;40(2):64-72.
18. Rettig AC, Sherrill C, Snead DS, Mendler JC, Mieling P. Nonoperative treatment of ulnar collateral ligament injuries in throwing athletes. Am J Sports Med. 2001;29(1):15-17.
19. Podesta L, Crow SA, Volkmer D, Bert T, Yocum LA. Treatment of partial ulnar collateral ligament tears in the elbow with platelet-rich plasma. Am J Sports Med. 2013;41(7):1689-1694.

Unusual Form and Location of a Tumor: Multiosseous Ewing Sarcoma in the Foot
Ewing sarcomas are characterized as primitive malignant round cell tumors.1 These tumors are diagnosed by neuroectodermal differentiation and by their common histologic and immunohistochemical properties.2 Ewing sarcoma is the second most common malignant bone tumor in adolescents and young adults. It is the fourth most common primary malignant tumor, accounting for about 9% of all malignant tumors of bone. The most common primary bone tumors are multiple myeloma, osteosarcoma, and chondrosarcoma.3
The diaphyses of long bones (eg, femur, tibia, humerus) and flat bones (eg, pelvis, scapula) are the most commonly involved sites. Involvement of bones in the hands and feet is uncommon (3%-5% of reported cases).4 The foot bones most commonly involved include the calcaneus and the metatarsals, in the series by Casadei and colleagues.5
About 90% of Ewing sarcoma cases present before age 20 years (mean age, 13 years).6 Typical presentation is that of localized pain at the involved site. Some patients have systemic symptoms, such as fever, malaise, weight loss, leukocytosis, and increased erythrocyte sedimentation rate (ESR) mimicking infection. Radiographically, Ewing sarcoma appears as a permeative destructive bone lesion with a moth-eaten appearance (almost 76% of cases).7 This is usually associated with lamellated periosteal new bone formation or an “onion skin” appearance. Less commonly, a sunburst configuration with an associated soft-tissue mass can be seen. Computed tomography (CT) and magnetic resonance imaging (MRI) show the osseous extent of the tumor and the presence or absence of the soft-tissue component of the tumor. Radionuclide bone scans show increased technetium-99m methylene diphosphonate accumulation and are typically hot.6
Histopathologically, the tumor is composed of small, uniformly sized cells characterized by an almost clear eosinophilic cytoplasm and very little intercellular matrix. There are lobules and strands divided by prominent septa. Macroscopically, appearance can range from a soft, fleshy solid mass to an almost liquid form, as the lesion does not produce any matrix. At time of surgery, the tumor may have a liquefied component and the appearance of pus.6 Prognostic factors are tumor site in foot and treatment according to the series by Casadei and colleagues.5 Patients with large central tumors, especially in the pelvis, have worse outcomes than patients with distal tumors.8
In this article, we report a case of multifocal Ewing sarcoma involving multiple bones in the foot. Given the multifocal nature of the disease confined to the foot, the initial impression was that of osteomyelitis. We describe the histologic, radiologic, and diagnostic features of the tumor and outline treatment and prognosis. To our knowledge, this is the first report of multifocal Ewing sarcoma involving multiple bones in the foot. The patient provided written informed consent for print and electronic publication of this case report.
Case Report
A 19-year-old man visited our clinic with the chief complaints of left foot pain and swelling. The pain started 10 months earlier and was followed by swelling. Complaints started after a minor local trauma. The man sought outside medical attention 8 months after pain onset. At his first visit at another institution, an initial radiograph was reported as normal, and all laboratory measures, including complete blood cell count (CBC) differential, ESR, and C-reactive protein (CRP) level, were within normal limits. Under the erroneous diagnosis of infection, the patient was treated with cloxacillin 500 mg 4 times a day for 4 weeks.
The patient’s pain had started 10 months before presentation (2 months after antibiotic therapy was initiated) (Figure 1). Physical examination at our institution revealed a palpable mass on the dorsum of the left foot. Anteroposterior and lateral plain radiographs showed a permeative lytic lesion with cortical destruction in the left calcaneus, navicular, cuboid, and cuneiform bones and in all metatarsal bones except the first (Figure 2). A soft-tissue mass around the involved bones was noted as well. The talus was not involved (Figure 3).
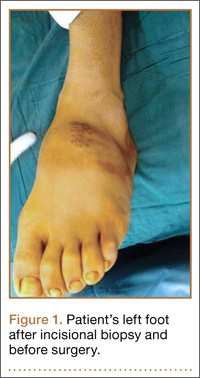
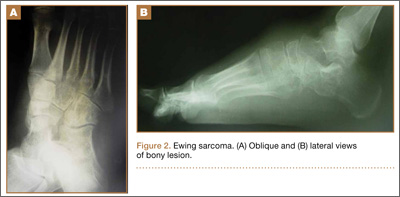
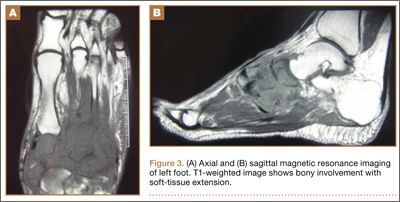
CT showed permeative destruction of left foot bones, including the calcaneus, navicular, cuboid, and cuneiform bones and all metatarsal bones except the first. Invasion through the overlying cortex of the involved bones indicated aggressive biological activity of the tumor (Figure 4). MRI showed a destructive bony lesion of the mentioned bones associated with the soft-tissue mass (Figure 3).
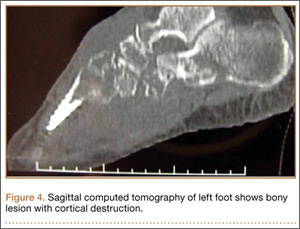
Bone scan showed increased uptake in the involved areas (Figure 5). Chest plain radiographs and CT showed no distant metastasis. An incisional biopsy was performed, and histopathology showed a malignant small round cell tumor, identified as Ewing sarcoma (Figure 6). An immunohistochemistry study demonstrated positive CD99 and negative cytokeratin, leukocyte common antigen, desmin, and synaptophysin.
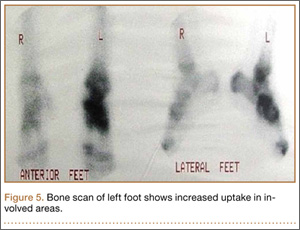
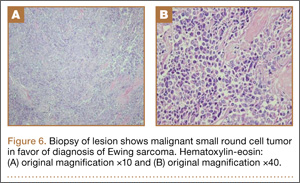
The patient was started on 4 cycles of adjuvant chemotherapy. Cycles 1 and 3 involved cyclophosphamide 2 g, vincristine 2 g, and doxorubicin 50 mg; cycles 2 and 4 involved ifosfamide 3.5 g and etoposide 200 mg. Tumor shrinkage occurred after chemotherapy. Clinical response to preoperative chemotherapy was documented by a decrease in tumor size at follow-ups. The patient underwent below-knee amputation.
Postoperative histopathology confirmed the diagnosis of Ewing sarcoma of the calcaneus, navicular, cuboid, and cuneiform bones and all metatarsal bones except the first (Figure 7). At 2-year follow-up, the patient had no evidence of local recurrence or distant metastasis based on chest CT and clinical examination of the affected site.
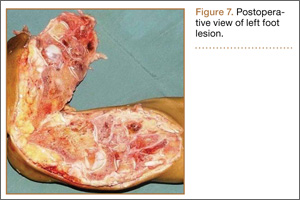
Discussion
Ewing sarcoma is the prototype of round small cell malignancies that arise from the long bones and the flat bones. It seldom involves the hands or feet. To our knowledge, this is the first report of Ewing sarcoma of the foot with multiple-bone involvement. Our literature review found a case of Ewing sarcoma of the first phalanx of the third toe, the second metatarsal bone, the cuneiform, the cuboid, and the talus, with lesser soft-tissue extension compared with our patient’s case.9
As this foot tumor is rare, there are few reports on its clinical aspects, appropriate treatment, and long-term outcome. For treatment of nonmetastatic Ewing sarcoma, limb-salvage surgery is advised if response has been good and there is a reasonable expectation of negative margins and good functional results.
Radiation and surgery may be part of the overall treatment plan. Radiation without surgery has a unique role in pelvic Ewing sarcoma, in contrast to extremity Ewing sarcoma. In our opinion, margins and histologic necrosis in the resection specimen are examined after surgery, and, if the margins are widely negative and histologic response is good, no further local control is advised. If the margin is positive, postoperative radiation therapy is recommended.1 Amputation has gradually become a (rare) choice in the treatment of extremity sarcomas.9 In our patient’s case, surgery was preferred over radiation therapy after chemotherapy because of the low risk of local side effects and the expected high efficacy. In addition, radiation at such high doses for Ewing sarcoma in the foot causes functional impairment. Because of the multiple-bone involvement, a salvage procedure was not possible for our patient. Given the calcaneal involvement, however, below-knee amputation was considered safer than ankle disarticulation.
Multiple-bone involvement occurs in the advanced stage of Ewing sarcoma, usually after visceral and pulmonary metastases are detected.9 The case reported by Rammal and colleagues9 had both multiple-bone involvement in the foot and pulmonary metastasis. The authors indicated that hematogenous spread of the tumor was discerned because the lesions were noncontiguous.9 Our patient had no distant metastases. We think his tumor originated in a tarsal or midtarsal bone and extended to adjacent bones. Therefore, it probably spread through its capsular and ligamentous attachment among tarsal and midtarsal bones, as the involvement was contiguous rather than distinct.
Average delay from symptom onset to diagnosis was reported to be 34 weeks.3 Average physician delay from initial visit to correct diagnosis was reported to be 19 weeks.3 Patients may have erythema, fever, and swelling, suggestive of osteomyelitis.3 Laboratory results may show increased white blood cell count and elevated ESR and CRP level.3 In addition, needle biopsy of the tumor may reveal an appearance grossly similar to that of pus.3 Therefore, physicians may send all the tissue out for microbiological analysis (according to the erroneous diagnosis of infection) and none out for pathologic analysis. The situation can be further complicated when Ewing sarcoma occurs in the foot, an uncommon site. In this special case, multiple-bone involvement can present a misleading clinical picture of infection.10 In other words, infection is one of the best choices in the differential diagnosis.7 Also to be considered are multicentric giant cell tumor, fibrosarcoma,11 and osteosarcoma.12
1. Herring JA. Malignant tumors of bone. In: Herring JA, ed. Tachdjian’s Pediatric Orthopaedics. Philadelphia, PA: Saunders Elsevier; 2008:2324-2327.
2. Cavazzana AO, Miser JS, Jefferson J, Triche TJ. Experimental evidence for a neural origin of Ewing’s sarcoma of bone. Am J Pathol. 1987;127(3):507-518.
3. Canale ST, Beaty JH. Malignant tumors of bone. In: Canale ST, ed. Campbell’s Operative Orthopaedics. Philadelphia, PA: Mosby Elsevier; 2008:910-913.
4. Unni KK. Ewing sarcoma. In: Unni KK, ed. Dahlin’s Bone Tumor: General Aspects and Data on 11087 Cases. Philadelphia, PA: Lippincott-Raven; 1996:121-142.
5. Casadei R, Magnani M, Biagini R, Mercuri M. Prognostic factors in Ewing’s sarcoma of the foot. Clin Orthop. 2004;(420):230-238.
6. Greenspan A, Jundt G, Remagen W. Bone-forming (osteogenic) lesions. In: Greenspan A, Jundt G, Remagen W, eds. Differential Diagnosis in Orthopaedic Oncology. 2nd ed. Philadelphia, PA: Lippincott Williams & Wilkins; 2007:114.
7. Metcalfe JE, Grimer RJ. Ewing’s sarcoma of the foot masquerading as osteomyelitis. Foot Ankle Surg. 2004;10(1):29-33.
8. Hoffmann C, Ahrens S, Dunst J, et al. Pelvis Ewing sarcoma: a retrospective analysis of 241 cases. Cancer. 1999;85(4):869-877.
9. Rammal H, Ghanem I, Torbey PH, Dagher F, Kharrat K. Multifocal Ewing sarcoma of the foot. J Pediatr Hematol Oncol. 2008;30(4):298-300.
10. Ledermann HP, Morrison WB, Schweitzer ME. MR image analysis of pedal osteomyelitis: distribution, patterns of spread, and frequency of associated ulceration and septic arthritis. Radiology. 2002;223(3):747-755.
11. Dhillon MS, Prabhudev Prasad AP, Virk MS, Aggarwal S. Multicentric giant cell tumor involving the same foot: a case report and review of literature. Indian J Orthop. 2007;41(2):154-157.
12. Baraga JJ, Amarami KK, Swee RG, Wold L, Unni KK. Radiographic features of Ewing’s sarcoma of the bones of the hand and feet. Skeletal Radiol. 2001;30(3):121-126.
Ewing sarcomas are characterized as primitive malignant round cell tumors.1 These tumors are diagnosed by neuroectodermal differentiation and by their common histologic and immunohistochemical properties.2 Ewing sarcoma is the second most common malignant bone tumor in adolescents and young adults. It is the fourth most common primary malignant tumor, accounting for about 9% of all malignant tumors of bone. The most common primary bone tumors are multiple myeloma, osteosarcoma, and chondrosarcoma.3
The diaphyses of long bones (eg, femur, tibia, humerus) and flat bones (eg, pelvis, scapula) are the most commonly involved sites. Involvement of bones in the hands and feet is uncommon (3%-5% of reported cases).4 The foot bones most commonly involved include the calcaneus and the metatarsals, in the series by Casadei and colleagues.5
About 90% of Ewing sarcoma cases present before age 20 years (mean age, 13 years).6 Typical presentation is that of localized pain at the involved site. Some patients have systemic symptoms, such as fever, malaise, weight loss, leukocytosis, and increased erythrocyte sedimentation rate (ESR) mimicking infection. Radiographically, Ewing sarcoma appears as a permeative destructive bone lesion with a moth-eaten appearance (almost 76% of cases).7 This is usually associated with lamellated periosteal new bone formation or an “onion skin” appearance. Less commonly, a sunburst configuration with an associated soft-tissue mass can be seen. Computed tomography (CT) and magnetic resonance imaging (MRI) show the osseous extent of the tumor and the presence or absence of the soft-tissue component of the tumor. Radionuclide bone scans show increased technetium-99m methylene diphosphonate accumulation and are typically hot.6
Histopathologically, the tumor is composed of small, uniformly sized cells characterized by an almost clear eosinophilic cytoplasm and very little intercellular matrix. There are lobules and strands divided by prominent septa. Macroscopically, appearance can range from a soft, fleshy solid mass to an almost liquid form, as the lesion does not produce any matrix. At time of surgery, the tumor may have a liquefied component and the appearance of pus.6 Prognostic factors are tumor site in foot and treatment according to the series by Casadei and colleagues.5 Patients with large central tumors, especially in the pelvis, have worse outcomes than patients with distal tumors.8
In this article, we report a case of multifocal Ewing sarcoma involving multiple bones in the foot. Given the multifocal nature of the disease confined to the foot, the initial impression was that of osteomyelitis. We describe the histologic, radiologic, and diagnostic features of the tumor and outline treatment and prognosis. To our knowledge, this is the first report of multifocal Ewing sarcoma involving multiple bones in the foot. The patient provided written informed consent for print and electronic publication of this case report.
Case Report
A 19-year-old man visited our clinic with the chief complaints of left foot pain and swelling. The pain started 10 months earlier and was followed by swelling. Complaints started after a minor local trauma. The man sought outside medical attention 8 months after pain onset. At his first visit at another institution, an initial radiograph was reported as normal, and all laboratory measures, including complete blood cell count (CBC) differential, ESR, and C-reactive protein (CRP) level, were within normal limits. Under the erroneous diagnosis of infection, the patient was treated with cloxacillin 500 mg 4 times a day for 4 weeks.
The patient’s pain had started 10 months before presentation (2 months after antibiotic therapy was initiated) (Figure 1). Physical examination at our institution revealed a palpable mass on the dorsum of the left foot. Anteroposterior and lateral plain radiographs showed a permeative lytic lesion with cortical destruction in the left calcaneus, navicular, cuboid, and cuneiform bones and in all metatarsal bones except the first (Figure 2). A soft-tissue mass around the involved bones was noted as well. The talus was not involved (Figure 3).
CT showed permeative destruction of left foot bones, including the calcaneus, navicular, cuboid, and cuneiform bones and all metatarsal bones except the first. Invasion through the overlying cortex of the involved bones indicated aggressive biological activity of the tumor (Figure 4). MRI showed a destructive bony lesion of the mentioned bones associated with the soft-tissue mass (Figure 3).
Bone scan showed increased uptake in the involved areas (Figure 5). Chest plain radiographs and CT showed no distant metastasis. An incisional biopsy was performed, and histopathology showed a malignant small round cell tumor, identified as Ewing sarcoma (Figure 6). An immunohistochemistry study demonstrated positive CD99 and negative cytokeratin, leukocyte common antigen, desmin, and synaptophysin.
The patient was started on 4 cycles of adjuvant chemotherapy. Cycles 1 and 3 involved cyclophosphamide 2 g, vincristine 2 g, and doxorubicin 50 mg; cycles 2 and 4 involved ifosfamide 3.5 g and etoposide 200 mg. Tumor shrinkage occurred after chemotherapy. Clinical response to preoperative chemotherapy was documented by a decrease in tumor size at follow-ups. The patient underwent below-knee amputation.
Postoperative histopathology confirmed the diagnosis of Ewing sarcoma of the calcaneus, navicular, cuboid, and cuneiform bones and all metatarsal bones except the first (Figure 7). At 2-year follow-up, the patient had no evidence of local recurrence or distant metastasis based on chest CT and clinical examination of the affected site.
Discussion
Ewing sarcoma is the prototype of round small cell malignancies that arise from the long bones and the flat bones. It seldom involves the hands or feet. To our knowledge, this is the first report of Ewing sarcoma of the foot with multiple-bone involvement. Our literature review found a case of Ewing sarcoma of the first phalanx of the third toe, the second metatarsal bone, the cuneiform, the cuboid, and the talus, with lesser soft-tissue extension compared with our patient’s case.9
As this foot tumor is rare, there are few reports on its clinical aspects, appropriate treatment, and long-term outcome. For treatment of nonmetastatic Ewing sarcoma, limb-salvage surgery is advised if response has been good and there is a reasonable expectation of negative margins and good functional results.
Radiation and surgery may be part of the overall treatment plan. Radiation without surgery has a unique role in pelvic Ewing sarcoma, in contrast to extremity Ewing sarcoma. In our opinion, margins and histologic necrosis in the resection specimen are examined after surgery, and, if the margins are widely negative and histologic response is good, no further local control is advised. If the margin is positive, postoperative radiation therapy is recommended.1 Amputation has gradually become a (rare) choice in the treatment of extremity sarcomas.9 In our patient’s case, surgery was preferred over radiation therapy after chemotherapy because of the low risk of local side effects and the expected high efficacy. In addition, radiation at such high doses for Ewing sarcoma in the foot causes functional impairment. Because of the multiple-bone involvement, a salvage procedure was not possible for our patient. Given the calcaneal involvement, however, below-knee amputation was considered safer than ankle disarticulation.
Multiple-bone involvement occurs in the advanced stage of Ewing sarcoma, usually after visceral and pulmonary metastases are detected.9 The case reported by Rammal and colleagues9 had both multiple-bone involvement in the foot and pulmonary metastasis. The authors indicated that hematogenous spread of the tumor was discerned because the lesions were noncontiguous.9 Our patient had no distant metastases. We think his tumor originated in a tarsal or midtarsal bone and extended to adjacent bones. Therefore, it probably spread through its capsular and ligamentous attachment among tarsal and midtarsal bones, as the involvement was contiguous rather than distinct.
Average delay from symptom onset to diagnosis was reported to be 34 weeks.3 Average physician delay from initial visit to correct diagnosis was reported to be 19 weeks.3 Patients may have erythema, fever, and swelling, suggestive of osteomyelitis.3 Laboratory results may show increased white blood cell count and elevated ESR and CRP level.3 In addition, needle biopsy of the tumor may reveal an appearance grossly similar to that of pus.3 Therefore, physicians may send all the tissue out for microbiological analysis (according to the erroneous diagnosis of infection) and none out for pathologic analysis. The situation can be further complicated when Ewing sarcoma occurs in the foot, an uncommon site. In this special case, multiple-bone involvement can present a misleading clinical picture of infection.10 In other words, infection is one of the best choices in the differential diagnosis.7 Also to be considered are multicentric giant cell tumor, fibrosarcoma,11 and osteosarcoma.12
1. Herring JA. Malignant tumors of bone. In: Herring JA, ed. Tachdjian’s Pediatric Orthopaedics. Philadelphia, PA: Saunders Elsevier; 2008:2324-2327.
2. Cavazzana AO, Miser JS, Jefferson J, Triche TJ. Experimental evidence for a neural origin of Ewing’s sarcoma of bone. Am J Pathol. 1987;127(3):507-518.
3. Canale ST, Beaty JH. Malignant tumors of bone. In: Canale ST, ed. Campbell’s Operative Orthopaedics. Philadelphia, PA: Mosby Elsevier; 2008:910-913.
4. Unni KK. Ewing sarcoma. In: Unni KK, ed. Dahlin’s Bone Tumor: General Aspects and Data on 11087 Cases. Philadelphia, PA: Lippincott-Raven; 1996:121-142.
5. Casadei R, Magnani M, Biagini R, Mercuri M. Prognostic factors in Ewing’s sarcoma of the foot. Clin Orthop. 2004;(420):230-238.
6. Greenspan A, Jundt G, Remagen W. Bone-forming (osteogenic) lesions. In: Greenspan A, Jundt G, Remagen W, eds. Differential Diagnosis in Orthopaedic Oncology. 2nd ed. Philadelphia, PA: Lippincott Williams & Wilkins; 2007:114.
7. Metcalfe JE, Grimer RJ. Ewing’s sarcoma of the foot masquerading as osteomyelitis. Foot Ankle Surg. 2004;10(1):29-33.
8. Hoffmann C, Ahrens S, Dunst J, et al. Pelvis Ewing sarcoma: a retrospective analysis of 241 cases. Cancer. 1999;85(4):869-877.
9. Rammal H, Ghanem I, Torbey PH, Dagher F, Kharrat K. Multifocal Ewing sarcoma of the foot. J Pediatr Hematol Oncol. 2008;30(4):298-300.
10. Ledermann HP, Morrison WB, Schweitzer ME. MR image analysis of pedal osteomyelitis: distribution, patterns of spread, and frequency of associated ulceration and septic arthritis. Radiology. 2002;223(3):747-755.
11. Dhillon MS, Prabhudev Prasad AP, Virk MS, Aggarwal S. Multicentric giant cell tumor involving the same foot: a case report and review of literature. Indian J Orthop. 2007;41(2):154-157.
12. Baraga JJ, Amarami KK, Swee RG, Wold L, Unni KK. Radiographic features of Ewing’s sarcoma of the bones of the hand and feet. Skeletal Radiol. 2001;30(3):121-126.