User login
Evaluating Management and Change in Glycemic Control After Discontinuation of Metformin in Patients With Elevated Serum Creatinine (FULL)
According to the American Diabetes Association (ADA), about 29 million Americans have diabetes mellitus (DM). Uncontrolled DM causes various microvascular and macrovascular complications and leads to significant mortality. In 2011, DM was the seventh leading cause of death.1 The ADA recommends setting a hemoglobin A1c (HbA1c) goal of < 7% to prevent microvascular and macrovascular complications.1
The treatment cost of DM continues to rise and accounts for about $245 billion annually.1 Given its effectiveness, low cost, and low adverse-event (AE) profile, metformin has been the cornerstone of therapy in DM over the past 20 years. The ADA recommends metformin as first-line therapy in type 2 DM (T2DM). In 2014, 14.4 million Americans were dispensed a metformin-containing product.2 Metformin exerts its effect mainly by decreasing hepatic glucose production and increasing insulin sensitivity. Study results suggest gluconeogenesis may be decreased up to 75% in these patients.3 Metformin is effective in reducing the level of HbA1c by an average of 1.5%.3
Background
Metformin-induced lactic acidosis is a rare concern in patients with renal impairment (0.03 case/1,000 patient-years).4 Much of this concern stems from the high incidence of lactic acidosis associated with the medication phenformin, which was approved in the 1950s but taken off the market because of its high incidence of lactic acidosis in patients with a serum creatinine (SCr) level > 1.4 mg/dL.
Although phenformin and metformin are both biguanide class medications, they vastly differ. Increased phenformin levels in the blood are correlated with decreased glucose oxidation and increased lactate production. Conversely, metformin may enhance glucose oxidation, and there seems to be no correlation between metformin levels with lactate levels. Lactic acidosis occurred 10 to 20 times more often with phenformin than it does with metformin.5 In studies in which patients with an estimated glomerular filtration rate (eGFR) of 30 to 60 mL/min/1.73 m2 continued to use metformin, lactic acidosis was rare, even in the presence of comorbid conditions that may promote lactic acidosis, such as chronic obstructive pulmonary disease, congestive heart failure, and liver disease.6 In 2012, the National Kidney Foundation (NKF) suggested an eGFR cutoff be considered when prescribing metformin.7
When the present study was initiated, metformin was contraindicated in patients with renal dysfunction (SCr levels ≥ 1.5 mg/dL in males≥ 1.4 mg/dL in females).5 The estimated incidence of renal dysfunction in patients with T2DM is 12%. Under this labeling, metformin use is prohibited in at least 2.5 million people. Study results have shown that, when package insert guidelines were disregarded and metformin was given against renal recommendations, the rate of AEs was not increased, and patients benefited clinically.8 Data suggest that the rate of lactic acidosis may be increased in patients with advanced kidney disease.8
In April 2016, the FDA started requiring that manufacturers update their labeling to indicate metformin may be used safely in cases of mild-to-moderate renal impairment. The FDA also changed a recommendation: now, before starting metformin, health care professionals should obtain the patient’s eGFR, which provides a more accurate determination of kidney function by taking into account age, sex, and race. Metformin is contraindicated in patients with an eGFR < 30 mL/min/1.73 m2 and is not recommended to be initiated in patients with an eGFR of 30 to 45 mL/min/1.73 m2. The suggestion for patients already using metformin is to obtain eGFR at least annually. In addition, when eGFR drops to between 30 and 45 mL/min/1.73 m2, the risks and benefits of continuing metformin should be weighed on a patient-specific basis.2,4
Methods
The authors retrospectively reviewed the charts of 199 randomly selected patients at Huntington VAMC in West Virginia who had metformin discontinued because of elevated SCr (defined as ≥ 1.5 mg/dL) between September 1, 2009 and September 1, 2014. Clinician notes written at time of discontinuation were assessed for other reasons for discontinuation, and patients thus identified were excluded. Change in glycemic control was assessed by comparing first HbA1c level 60 to 365 days after discontinuation of metformin with the most recent HbA1c level before discontinuation. Other data analyzed included age, time to next recorded SCr level, reinitiation of metformin (yes or no), and change in diabetic medication regimen. Class of medication initiated was recorded but not dose or insulin type. Subgroup analysis was performed on patients initiated on insulin after discontinuation of metformin. Evaluations were made of most recent HbA1c level at time of discontinuation of metformin, first HbA1c level after discontinuation, and HbA1c level 1 year after discontinuation in patients on insulin.
The primary endpoint of the study was change in HbA1c after discontinuation of metformin. This was studied to justify the value of metformin in T2DM and to evaluate whether patients could remain on metformin with mild-to-moderate renal impairment without AEs. Secondary endpoints were time to next recorded SCr level after discontinuation of metformin, reinitiation of metformin (yes or no), when next recorded SCr level was < 1.5 mg/dL, change in medication regimen after discontinuation of metformin, and incidence of lactic acidosis. Study inclusion criteria were male sex, age between 18 and 89 years, discontinuation of metformin because of elevated SCr, and documented repeat HbA1c level 60 to 365 days after discontinuation of metformin. Exclusion criteria were insulin therapy at time of discontinuation of metformin and type 1 DM diagnosis. A 2-sided t test was used to compare change in HbA1c level.
Results
Of the 199 patients who had metformin discontinued because of elevated SCr (> 1.5 mg/dL), 106 were excluded for reasons listed in Figure 1; the other 93 met the study inclusion criteria and had their cases analyzed for change in glycemic control after discontinuation of metformin. 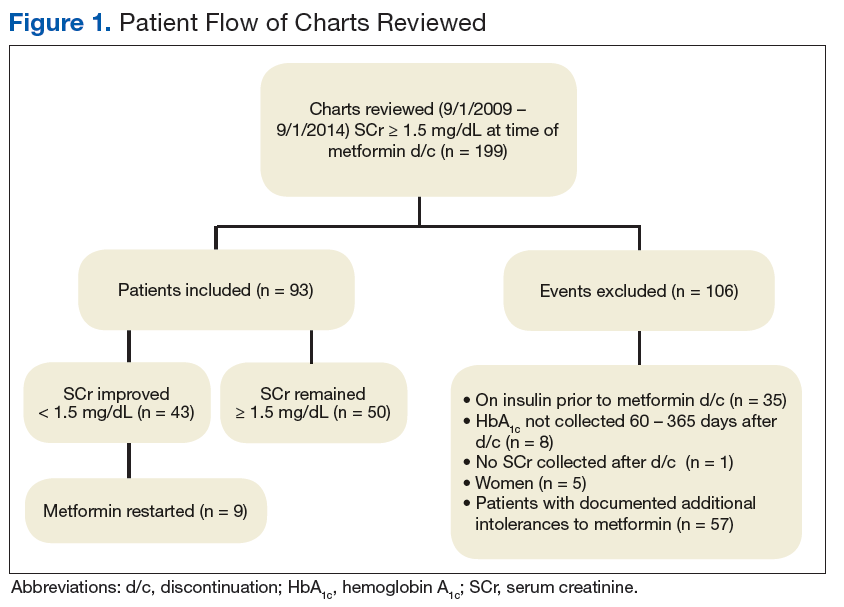
The mean age was 68.2 years and mean weight was 97.36 kg for the included patients. Four were African American, and 89 were white. At time of discontinuation of metformin, mean SCr level was 1.65 mg/dL, and mean eGFR was 43.25 mL/min/1.73 m2 (Table). Mean (SD) HbA1c level was 7.2% (1.1%) before discontinuation of metformin and 7.7% (1.5%) after discontinuation (P < .05) (Figure 2). Subgroup analysis of patients initiated on insulin after discontinuation of metformin (n = 47) revealed mean (SD) HbA1c levels of 7.5% (1.1%) before discontinuation and 8.3% (1.3%) after discontinuation (P < .05). One year or more after discontinuation of metformin in patients in whom insulin was initiated, mean HbA1c level decreased to the prediscontinuation (baseline) level of 7.5% (P = .91).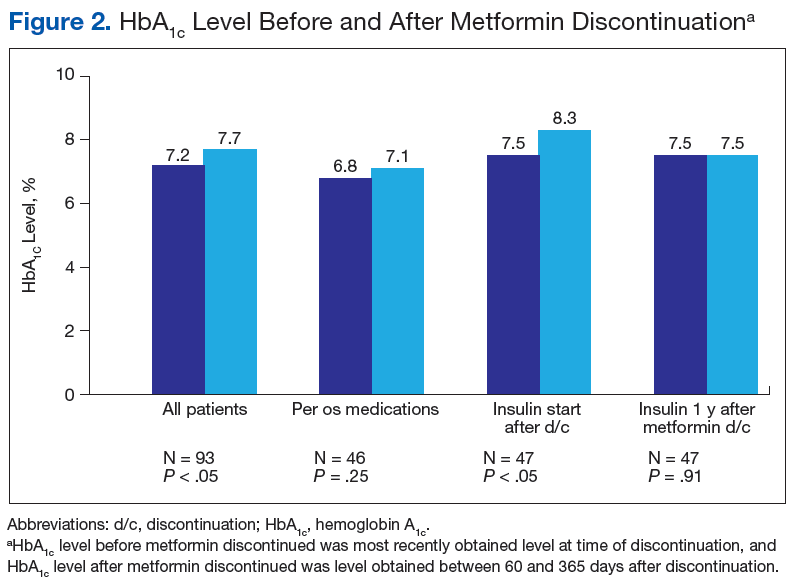
Twenty of these patients initiated on insulin had improved renal function and would have met the criteria for restarting metformin. After discontinuation of metformin, mean (SD) time to next recorded SCr level was 95.7 (89.9) days. Of the 93 study patients, 43 met the criterion for reinitiating metformin (rechecked SCr level, < 1.5 mg/dL), but in only 9 (21%) of these patients was metformin restarted.
Discussion
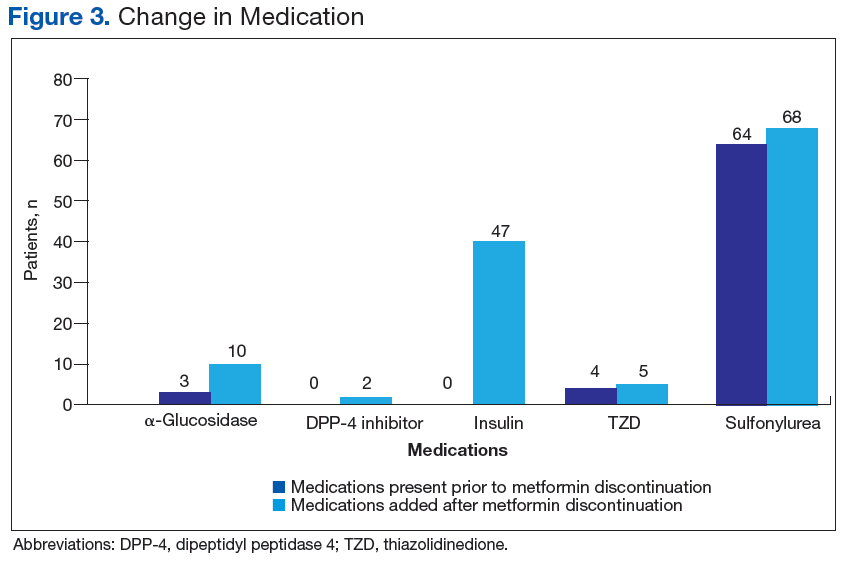
Overall, a decline in glycemic control was found in patients who had metformin discontinued. This anticipated decline prompted clinicians to replace metformin with other oral medications as well as insulin. Despite DM medication regimen changes, mean HbA1c level increased significantly after discontinuation of metformin. The initial decline in glycemic control after starting insulin could be attributable either to clinician preference in insulin initiation—starting at lower doses to avoid hypoglycemia—or to a delay in initiating insulin, as opposed to initiating insulin at time of discontinuation of metformin. Subgroup analysis of the large number of patients who started on insulin after discontinuation of metformin (51%) revealed the same HbA1c levels before and 1 year after discontinuation. This finding is clinically relevant because many patients showed a decline in glycemic control for a year, despite initiation of insulin therapy.
In 43 (46%) of the 93 patients studied, SCr level improved to < 1.5 mg/dL after discontinuation of metformin. Of the patients in the subgroup started on insulin, 20 had improved renal function. This finding suggests that many of the patients who were initiated on insulin showed an improvement in renal function and potentially could have had metformin reinitiated. If these patients had continued or restarted metformin, insulin therapy may have been avoided or delayed. Overall, many opportunities to resume metformin were missed; only 9 of the 43 patients with improved SCr levels (< 1.5 mg/dL) on recheck were restarted on metformin. Many clinicians seemed hesitant to restart metformin even after kidney function improved. In addition, mean time to next recorded SCr level after discontinuation of metformin was 95.7 days. If SCr levels are more closely monitored after discontinuation of metformin, metformin possibly could be restarted sooner, leading to improved glycemic control and prevention of both microvascular and macrovascular complications.
In its 2012 update, the NKF suggested that it may be reasonable to consider using an eGFR cutoff when prescribing metformin. Clearance of metformin is reduced by 75% when eGFR is under 60 mL/min/1.73m2 but declines no further until eGFR is < 30 mL/min/1.73 m2.7 A systematic review of 65 articles found that, overall, levels of metformin remained in the therapeutic range, and lactate concentrations did not increase significantly in mild-to-moderate renal impairment (eGFR, 30-60 mL/min/1.73 m2).8 This finding corresponds to the updated 2016 FDA recommendations regarding use of metformin in mild-to-moderate renal impairment.
In the present study, patients who had metformin discontinued earlier, under strict package labeling, may have been able to continue metformin with use of eGFR under the revised labeling. Thirty-seven patients had an eGFR > 45 mL/min/1.73 m2 at the time of discontinuation of metformin, 49 had an eGFR between 45 and 30 mL/min/1.73 m2, and 7 had an eGFR < 30 mL/min/1.73 m2. Only 7 (8%) of the 93 patients would have had a contraindication to continuing metformin on the basis of current FDA recommendations. Forty-nine patients (53%) could have continued metformin if the benefit outweighed the risk, and 37 (39%) could have continued metformin given an eGFR > 45 mL/min/1.73 m2. The earlier labeling required initial discontinuation of metformin in these patients, but new FDA recommendations would allow more of them with mild-to-moderate renal impairment to benefit from treatment with metformin.
Limitations
This study had a few limitations. Its design was retrospective, and its narrow demographics may not permit generalizability to other patient populations. In addition, the study evaluated initiation of new medications at time of discontinuation of metformin but not dosage adjustments of current medications. Insulin type and dosage were not evaluated—only whether insulin was initiated. Further, follow-up time was limited; change in long-term glycemic control requires more study. Another limitation was that adherence could not be assessed.
Conclusion
After discontinuation of metformin, there was a statistically significant increase in HbA1c level. Insulin was initiated in 51% of patients after discontinuation of metformin. Subgroup analysis of the patients who started insulin after discontinuation of metformin revealed the same HbA1c levels before and 1 year after discontinuation with a loss of glycemic control throughout the year. Of the 47 patients who were initiated on insulin, 20 had their SCr level decrease to < 1.5 mg/dL and could have been restarted on metformin. This finding indicates that many patients may have been able to delay time to insulin initiation and maintain the same glycemic control if metformin could have been continued. With more study, long-term change in glycemic control after discontinuation of metformin can be determined. In many patients, metformin is needed for adequate glycemic control. The revised FDA labeling allows many patients with mild-to-moderate kidney disease to benefit from treatment with metformin.
Click here to read the digital edition.
1. American Diabetes Association. Statistics about diabetes. http://www.diabetes.org/diabetesbasics/statistics/#sthash.3vJD53aO.dpuf. Accessed August 31, 2017.
2. U.S. Food and Drug Administration. FDA drug safety communication: FDA revises warnings regarding use of the diabetes medicine metformin in certain patients with reduced kidney function. https://www.fda.gov/Drugs/DrugSafety/ucm493244.htm. Published April 8, 2016. Updated April 5, 2017. Accessed August 31, 2017.
3. Fowler MJ. Diabetes treatment, part 2: oral agents for glycemic management. Clin Diabetes. 2007;25(4):131-134.
4. Metformin [package insert]. Princeton, NJ: Bristol-Myers Squibb Company; 2015.
5. Lipska KJ, Baily CJ, Inzucchi SE. Use of metformin in the setting of mild-to-moderate renal insufficiency. Diabetes Care. 2011;34(6):1431-1437.
6. Triplitt CL, Reasner CA. Chapter 83. Diabetes mellitus. In: DiPiro JT, Talbert RL, Yee GC, Matzke GR, Wells BG, Posey L. eds. Pharmacotherapy: A Pathophysiologic Approach. 8th ed. New York, NY: McGraw-Hill; 2011:chap 83.
7. National Kidney Foundation. KDOQI clinical practice guideline for diabetes and CKD: 2012 update. Am J Kidney Dis. 2012;60(5):850-886.
8. Inzucchi SE, Lipska KJ, Mayo H, Bailey CJ, McGuire DK. Metformin in patients with type 2 diabetes and kidney disease. JAMA. 2014;312(24):2668-2675.
According to the American Diabetes Association (ADA), about 29 million Americans have diabetes mellitus (DM). Uncontrolled DM causes various microvascular and macrovascular complications and leads to significant mortality. In 2011, DM was the seventh leading cause of death.1 The ADA recommends setting a hemoglobin A1c (HbA1c) goal of < 7% to prevent microvascular and macrovascular complications.1
The treatment cost of DM continues to rise and accounts for about $245 billion annually.1 Given its effectiveness, low cost, and low adverse-event (AE) profile, metformin has been the cornerstone of therapy in DM over the past 20 years. The ADA recommends metformin as first-line therapy in type 2 DM (T2DM). In 2014, 14.4 million Americans were dispensed a metformin-containing product.2 Metformin exerts its effect mainly by decreasing hepatic glucose production and increasing insulin sensitivity. Study results suggest gluconeogenesis may be decreased up to 75% in these patients.3 Metformin is effective in reducing the level of HbA1c by an average of 1.5%.3
Background
Metformin-induced lactic acidosis is a rare concern in patients with renal impairment (0.03 case/1,000 patient-years).4 Much of this concern stems from the high incidence of lactic acidosis associated with the medication phenformin, which was approved in the 1950s but taken off the market because of its high incidence of lactic acidosis in patients with a serum creatinine (SCr) level > 1.4 mg/dL.
Although phenformin and metformin are both biguanide class medications, they vastly differ. Increased phenformin levels in the blood are correlated with decreased glucose oxidation and increased lactate production. Conversely, metformin may enhance glucose oxidation, and there seems to be no correlation between metformin levels with lactate levels. Lactic acidosis occurred 10 to 20 times more often with phenformin than it does with metformin.5 In studies in which patients with an estimated glomerular filtration rate (eGFR) of 30 to 60 mL/min/1.73 m2 continued to use metformin, lactic acidosis was rare, even in the presence of comorbid conditions that may promote lactic acidosis, such as chronic obstructive pulmonary disease, congestive heart failure, and liver disease.6 In 2012, the National Kidney Foundation (NKF) suggested an eGFR cutoff be considered when prescribing metformin.7
When the present study was initiated, metformin was contraindicated in patients with renal dysfunction (SCr levels ≥ 1.5 mg/dL in males≥ 1.4 mg/dL in females).5 The estimated incidence of renal dysfunction in patients with T2DM is 12%. Under this labeling, metformin use is prohibited in at least 2.5 million people. Study results have shown that, when package insert guidelines were disregarded and metformin was given against renal recommendations, the rate of AEs was not increased, and patients benefited clinically.8 Data suggest that the rate of lactic acidosis may be increased in patients with advanced kidney disease.8
In April 2016, the FDA started requiring that manufacturers update their labeling to indicate metformin may be used safely in cases of mild-to-moderate renal impairment. The FDA also changed a recommendation: now, before starting metformin, health care professionals should obtain the patient’s eGFR, which provides a more accurate determination of kidney function by taking into account age, sex, and race. Metformin is contraindicated in patients with an eGFR < 30 mL/min/1.73 m2 and is not recommended to be initiated in patients with an eGFR of 30 to 45 mL/min/1.73 m2. The suggestion for patients already using metformin is to obtain eGFR at least annually. In addition, when eGFR drops to between 30 and 45 mL/min/1.73 m2, the risks and benefits of continuing metformin should be weighed on a patient-specific basis.2,4
Methods
The authors retrospectively reviewed the charts of 199 randomly selected patients at Huntington VAMC in West Virginia who had metformin discontinued because of elevated SCr (defined as ≥ 1.5 mg/dL) between September 1, 2009 and September 1, 2014. Clinician notes written at time of discontinuation were assessed for other reasons for discontinuation, and patients thus identified were excluded. Change in glycemic control was assessed by comparing first HbA1c level 60 to 365 days after discontinuation of metformin with the most recent HbA1c level before discontinuation. Other data analyzed included age, time to next recorded SCr level, reinitiation of metformin (yes or no), and change in diabetic medication regimen. Class of medication initiated was recorded but not dose or insulin type. Subgroup analysis was performed on patients initiated on insulin after discontinuation of metformin. Evaluations were made of most recent HbA1c level at time of discontinuation of metformin, first HbA1c level after discontinuation, and HbA1c level 1 year after discontinuation in patients on insulin.
The primary endpoint of the study was change in HbA1c after discontinuation of metformin. This was studied to justify the value of metformin in T2DM and to evaluate whether patients could remain on metformin with mild-to-moderate renal impairment without AEs. Secondary endpoints were time to next recorded SCr level after discontinuation of metformin, reinitiation of metformin (yes or no), when next recorded SCr level was < 1.5 mg/dL, change in medication regimen after discontinuation of metformin, and incidence of lactic acidosis. Study inclusion criteria were male sex, age between 18 and 89 years, discontinuation of metformin because of elevated SCr, and documented repeat HbA1c level 60 to 365 days after discontinuation of metformin. Exclusion criteria were insulin therapy at time of discontinuation of metformin and type 1 DM diagnosis. A 2-sided t test was used to compare change in HbA1c level.
Results
Of the 199 patients who had metformin discontinued because of elevated SCr (> 1.5 mg/dL), 106 were excluded for reasons listed in Figure 1; the other 93 met the study inclusion criteria and had their cases analyzed for change in glycemic control after discontinuation of metformin.
The mean age was 68.2 years and mean weight was 97.36 kg for the included patients. Four were African American, and 89 were white. At time of discontinuation of metformin, mean SCr level was 1.65 mg/dL, and mean eGFR was 43.25 mL/min/1.73 m2 (Table). Mean (SD) HbA1c level was 7.2% (1.1%) before discontinuation of metformin and 7.7% (1.5%) after discontinuation (P < .05) (Figure 2). Subgroup analysis of patients initiated on insulin after discontinuation of metformin (n = 47) revealed mean (SD) HbA1c levels of 7.5% (1.1%) before discontinuation and 8.3% (1.3%) after discontinuation (P < .05). One year or more after discontinuation of metformin in patients in whom insulin was initiated, mean HbA1c level decreased to the prediscontinuation (baseline) level of 7.5% (P = .91).
Twenty of these patients initiated on insulin had improved renal function and would have met the criteria for restarting metformin. After discontinuation of metformin, mean (SD) time to next recorded SCr level was 95.7 (89.9) days. Of the 93 study patients, 43 met the criterion for reinitiating metformin (rechecked SCr level, < 1.5 mg/dL), but in only 9 (21%) of these patients was metformin restarted.
Discussion
Overall, a decline in glycemic control was found in patients who had metformin discontinued. This anticipated decline prompted clinicians to replace metformin with other oral medications as well as insulin. Despite DM medication regimen changes, mean HbA1c level increased significantly after discontinuation of metformin. The initial decline in glycemic control after starting insulin could be attributable either to clinician preference in insulin initiation—starting at lower doses to avoid hypoglycemia—or to a delay in initiating insulin, as opposed to initiating insulin at time of discontinuation of metformin. Subgroup analysis of the large number of patients who started on insulin after discontinuation of metformin (51%) revealed the same HbA1c levels before and 1 year after discontinuation. This finding is clinically relevant because many patients showed a decline in glycemic control for a year, despite initiation of insulin therapy.
In 43 (46%) of the 93 patients studied, SCr level improved to < 1.5 mg/dL after discontinuation of metformin. Of the patients in the subgroup started on insulin, 20 had improved renal function. This finding suggests that many of the patients who were initiated on insulin showed an improvement in renal function and potentially could have had metformin reinitiated. If these patients had continued or restarted metformin, insulin therapy may have been avoided or delayed. Overall, many opportunities to resume metformin were missed; only 9 of the 43 patients with improved SCr levels (< 1.5 mg/dL) on recheck were restarted on metformin. Many clinicians seemed hesitant to restart metformin even after kidney function improved. In addition, mean time to next recorded SCr level after discontinuation of metformin was 95.7 days. If SCr levels are more closely monitored after discontinuation of metformin, metformin possibly could be restarted sooner, leading to improved glycemic control and prevention of both microvascular and macrovascular complications.
In its 2012 update, the NKF suggested that it may be reasonable to consider using an eGFR cutoff when prescribing metformin. Clearance of metformin is reduced by 75% when eGFR is under 60 mL/min/1.73m2 but declines no further until eGFR is < 30 mL/min/1.73 m2.7 A systematic review of 65 articles found that, overall, levels of metformin remained in the therapeutic range, and lactate concentrations did not increase significantly in mild-to-moderate renal impairment (eGFR, 30-60 mL/min/1.73 m2).8 This finding corresponds to the updated 2016 FDA recommendations regarding use of metformin in mild-to-moderate renal impairment.
In the present study, patients who had metformin discontinued earlier, under strict package labeling, may have been able to continue metformin with use of eGFR under the revised labeling. Thirty-seven patients had an eGFR > 45 mL/min/1.73 m2 at the time of discontinuation of metformin, 49 had an eGFR between 45 and 30 mL/min/1.73 m2, and 7 had an eGFR < 30 mL/min/1.73 m2. Only 7 (8%) of the 93 patients would have had a contraindication to continuing metformin on the basis of current FDA recommendations. Forty-nine patients (53%) could have continued metformin if the benefit outweighed the risk, and 37 (39%) could have continued metformin given an eGFR > 45 mL/min/1.73 m2. The earlier labeling required initial discontinuation of metformin in these patients, but new FDA recommendations would allow more of them with mild-to-moderate renal impairment to benefit from treatment with metformin.
Limitations
This study had a few limitations. Its design was retrospective, and its narrow demographics may not permit generalizability to other patient populations. In addition, the study evaluated initiation of new medications at time of discontinuation of metformin but not dosage adjustments of current medications. Insulin type and dosage were not evaluated—only whether insulin was initiated. Further, follow-up time was limited; change in long-term glycemic control requires more study. Another limitation was that adherence could not be assessed.
Conclusion
After discontinuation of metformin, there was a statistically significant increase in HbA1c level. Insulin was initiated in 51% of patients after discontinuation of metformin. Subgroup analysis of the patients who started insulin after discontinuation of metformin revealed the same HbA1c levels before and 1 year after discontinuation with a loss of glycemic control throughout the year. Of the 47 patients who were initiated on insulin, 20 had their SCr level decrease to < 1.5 mg/dL and could have been restarted on metformin. This finding indicates that many patients may have been able to delay time to insulin initiation and maintain the same glycemic control if metformin could have been continued. With more study, long-term change in glycemic control after discontinuation of metformin can be determined. In many patients, metformin is needed for adequate glycemic control. The revised FDA labeling allows many patients with mild-to-moderate kidney disease to benefit from treatment with metformin.
Click here to read the digital edition.
1. American Diabetes Association. Statistics about diabetes. http://www.diabetes.org/diabetesbasics/statistics/#sthash.3vJD53aO.dpuf. Accessed August 31, 2017.
2. U.S. Food and Drug Administration. FDA drug safety communication: FDA revises warnings regarding use of the diabetes medicine metformin in certain patients with reduced kidney function. https://www.fda.gov/Drugs/DrugSafety/ucm493244.htm. Published April 8, 2016. Updated April 5, 2017. Accessed August 31, 2017.
3. Fowler MJ. Diabetes treatment, part 2: oral agents for glycemic management. Clin Diabetes. 2007;25(4):131-134.
4. Metformin [package insert]. Princeton, NJ: Bristol-Myers Squibb Company; 2015.
5. Lipska KJ, Baily CJ, Inzucchi SE. Use of metformin in the setting of mild-to-moderate renal insufficiency. Diabetes Care. 2011;34(6):1431-1437.
6. Triplitt CL, Reasner CA. Chapter 83. Diabetes mellitus. In: DiPiro JT, Talbert RL, Yee GC, Matzke GR, Wells BG, Posey L. eds. Pharmacotherapy: A Pathophysiologic Approach. 8th ed. New York, NY: McGraw-Hill; 2011:chap 83.
7. National Kidney Foundation. KDOQI clinical practice guideline for diabetes and CKD: 2012 update. Am J Kidney Dis. 2012;60(5):850-886.
8. Inzucchi SE, Lipska KJ, Mayo H, Bailey CJ, McGuire DK. Metformin in patients with type 2 diabetes and kidney disease. JAMA. 2014;312(24):2668-2675.
Concentrated Insulins: A Review and Recommendations (FULL)
For a long time, 500 U/mL (U-500) insulin was the only concentrated insulin available on the market. With many diabetes mellitus (DM) patients requiring larger doses, additional 200 U/mL (U-200) and 300 U/mL (U-300) concentrations became available. As clinical guidelines lack specific recommendations for optimal use of U-200 and U-300 insulins, clinical discretion is warranted in identifying patients for whom use of these insulins is appropriate. U-500 insulin is recommended in cases that require ≥ 200 U/d or > 2 U/kg/d. Given the ongoing DM and obesity epidemics, increased use of concentrated insulins is likely. Clinicians must stay well informed about the characteristics and benefits of concentrated insulins to remain confident recommending, prescribing, and adjusting these medications.
U-200 Insulin Lispro
Pharmacokinetics/Pharmacodynamics
The amino acid structure of U-200 insulin lispro is different from that of endogenous insulin. In U-200 lispro, lysine replaces a proline at position B28, and proline replaces a lysine at position B29.
In a euglycemic clamp study of patients without DM, a 20-U dose of U-200 lispro and a single 20-U dose of U-100 lispro were found to have similar mean area under the glucose infusion rate curves, mean area under the serum insulin concentration-time curves from time 0 to infinity, mean peak serum insulin levels, and time to maximum glucose-lowering effects.1 For both U-200 lispro and U-100 lispro, time to maximum effect was 1 hour.2
Even numbers are marked on the dial of the pen. Odd numbers are not marked, but longer lines appear in their place. U-200 lispro should not be mixed with any other insulin, whereas U-100 lispro can be mixed with neutral protamine Hagedorn insulin.
Safety/Efficacy
There has been 1 bioequivalence study of euglycemic patients without type 2 DM (T2DM) but no studies of the safety or efficacy of U-200 lispro in patients with DM.3,4 U-100 lispro converts 1:1 to U-200 lispro (eg, 60 U of U-100 lispro converts to 60 U of U-200 lispro).1 The volume of U-200 lispro would be smaller than that of U-100 lispro.
Economic Analysis
There are no published U-200 lispro economic analyses.
Dosing
U-200 lispro should be converted from other bolus insulins in a 1:1 ratio.1
Recommendations
Definitive recommendations await efficacy trials comparing use of U-200 lispro and other bolus insulins in patients with DM. Currently, U-200 lispro may be considered for patients with DM who require high doses of bolus insulin and who may benefit from smaller volumes of lispro.
U-200 Insulin Degludec
Pharmacokinetics/Pharmacodynamics
The basal insulin degludec (Tresiba) is available in U-100 and U-200 concentrations in a pen. After subcutaneous injection, degludec forms gradually dissociating multihexamer chains, which account for its flat and stable PK/PD profile. U-100 degludec and U-200 degludec have similar duration of action (≥ 42 hours) and time to steady state (2-3 days).5,6 A patient who misses a regularly scheduled dose should allow at least 8 hours between injections. Taking degludec at variable times does not decrease efficacy as long as this 8-hour minimum interval is observed.7
Safety/Efficacy
During its development, degludec was evaluated in more than 5,000 patients across 11 therapeutic trials.8 The key studies that led to the approval of degludec used insulin glargine as a comparator. In a 52-week study of 1,030 insulin-naïve patients with T2DM, degludec was noninferior to glargine in hemoglobin A1c (HbA1c) reduction (1.06% vs 1.19%). Overall hypoglycemia rates were similar, though there were fewer nocturnal hypoglycemia episodes with degludec than with glargine (0.25 vs 0.39 per patient-year of exposure; P = .38).9
The BEGIN Basal-Bolus trial series evaluated use of degludec combined with bolus insulin aspart in insulin-experienced patients with T2DM (n = 992) and type 1 DM (T1DM) (n = 629) over 52 weeks.10,11 Both trials found noninferiority in A1c reduction: 1.1% (degludec) and 1.18% (glargine) in patients with T2DM and 0.4% (degludec) and 0.39% (glargine) in those with T1DM.10,11 Significantly fewer episodes of overall hypoglycemia (11.09 vs 13.63 per patient-year) and nocturnal hypoglycemia (1.39 vs 1.84 per patient-year) were found with degludec in patients with T2DM.5 Overall hypoglycemia rates were similar, though there was a 25% lower rate of nocturnal hypoglycemia with degludec in patients with T1DM.11
A meta-analysis of 7 phase 3a trials that compared degludec with glargine revealed significantly lower rates of overall, nocturnal, and severe hypoglycemia with degludec in insulin-naïve patients.12 The analysis confirmed findings of significantly lower rates of overall and nocturnal hypoglycemia with degludec in the overall T2DM population and significantly lower rates of nocturnal hypoglycemia in the T1DM population.12
In the DEVOTE trial, which included 7,637 T2DM patients at high risk for a cardiovascular event, degludec and glargine were compared on the composite primary outcome of death with a cardiovascular cause, nonfatal myocardial infarction, or nonfatal stroke. After a median of 1.99 years, the primary outcome occurred in 8.5% of degludec patients and 9.3% of glargine patients (hazard ratio, 0.91; 95% confidence interval, 0.78-1.06; P < .001 for noninferiority). Mean HbA1c level was 7.5 in both groups; severe hypoglycemia occurred more often in the glargine group (odds ratio, 0.73; P < .001 for superiority).13 Findings from the randomized, crossover SWITCH 1 and SWITCH 2 trials confirmed lower rates of symptomatic hypoglycemia with degludec compared with glargine in patients with T1DM and T2DM, respectively.14,15 No statistically significant differences in weight gain were observed in the clinical trials comparing degludec and glargine.
Economic Analysis
Weatherall and colleagues used a budget impact model to evaluate the costs of degludec and glargine for commercially insured patients with DM in the U.S.16 Three treatment groups were analyzed: basal/bolus combination in T1DM and T2DM, and basal/oral combination in T2DM. Although degludec cost more, overall cost was reduced in T1DM because of reduced insulin usage and fewer hypoglycemic episodes in T2DM with basal/oral combination therapy. The authors acknowledged the many assumptions needed and the potential oversimplification of their model.16 In other countries, economic analyses had similar findings.17-19
Dosing
Degludec converts 1:1 to other basal insulins. Recommended starting doses for U-200 degludec are 10 U once daily for insulin-naïve adults with T2DM and one-third to one-half the total weight-based daily insulin dose for insulin-naïve adults with T1DM.4
Recommendations
For some patients, lower PD variability may make degludec a desirable alternative. As degludec retains its efficacy with variable dosing times, it may be ideal for patients who have difficulty with a once-daily dosing schedule. It is important to inform patients that the degludec pen allows for 2-U increments. Given the lower frequency of nocturnal hypoglycemic events with degludec compared with glargine, degludec is an appropriate basal insulin option for patients with nocturnal hypoglycemia. In addition, U-200 degludec may be considered for DM patients who require high doses of basal insulin and who may benefit from smaller volumes of degludec.
U-300 Isulin Glargine
Pharmacokinetics/Pharmacodynamics
U-300 glargine is a concentrated basal insulin. There are notable differences between its U-100 and U-300 concentrations. For U-300 glargine dosed at 0.4 U/kg, duration of action is 24 hours; for U-300 glargine dosed at 0.6 U/kg or higher, longer duration is expected.20 Steady state is reached after 5 days.21 The U-300 glargine pen contains 1.5 mL, less than the 3 mL in the U-100 pen. U-300 glargine typically is administered in 1 injection once daily if the dose is < 80 U; 2 injections are required if the dose is > 80 U.
Safety/Efficacy
In the EDITION trials, which compared U-300 and U-100 glargine in patients with T1DM and T2DM, the primary endpoint was 6-month HbA1c reduction.22-24 Comparable HbA1c reductions were found in all of the studies. In EDITION 1, in which 2,474 patients with T2DM were taking concomitant bolus insulin with or without metformin, 11% more U-300 glargine than U-100 glargine was needed to achieve similar results.22 In EDITION 4, in which bolus insulin was used in combination in 546 patients with T1DM, 17.5% more U-300 glargine than U-100 glargine was needed to achieve similar glycemic goals.25
Economic Analysis
Compared with other insulins, U-300 glargine has limited published data and economic analyses. Using a cost-utility model to compare U-300 with U-100 glargine in Spanish patients with T2DM, and reporting results in euros per quality-adjusted life years, Monero and colleagues concluded that the hypoglycemia reduction and possible time-of-dose flexibility found with U-300 glargine may contribute to its cost-effectiveness.26
Dosing
U-300 glargine should be converted in a 1:1 ratio from U-100 glargine or detemir. The U-300 glargine dose should be reduced by 20% when switching from NPH insulin.21
Recommendations
A meta-analysis of the EDITION trials 1 to 3 revealed a lower incidence of daytime and nocturnal hypoglycemia with use of U-300 glargine over U-100 glargine and a beneficial shorter hold time after injection of U-300 glargine (5 seconds) compared with U-100 glargine (10 seconds).27 There was statistically lower weight gain with U-300 glargine compared with U-100 glargine however weight gain was < 1 kg in both groups.27 These characteristics of U-300 glargine may prove advantageous for individual patients.
U-500 Insulin
Pharmacokinetics/Pharmacodynamics
U-500 insulin (Humulin R) has been available in a vial since 1997, but other formulations have been used therapeutically since 1952.28 The U-500 KwikPen device, recently added to the market, has improved the vial and syringe dosing. The new U-500 BD (Becton, Dickinson, Franklin Lakes, NJ) syringes allow doses up to 250 U, and the U-500 KwikPens provide up to 300 U per injection.29 When it was first introduced, U-500 insulin had no dedicated delivery device and dose conversion was required to deliver the appropriate dose using an allergy or TB syringe. As a consequence, confusion often resulted between prescribers, pharmacists and patients.30,31 U-500 insulin acts as basal and bolus insulins do. Onset of action is ~15 minutes, time to peak is 4 to 8 hours, and duration of action is ≤ 21 hours.32 As its onset of action is similar to that of U-100, U-500 should be injected 30 minutes before meals.
A single-site, randomized, double-blind, crossover euglycemic clamp study that compared equivalent doses of U-500 and U-100 in healthy obese patients found the formulations had similar overall exposures and effects—the only differences were that U-500 had an extended time to peak and a prolonged post-peak effect. The longer post-peak effect contributes to longer duration of action and allows for fewer daily injections.33
Safety/Efficacy
In the Humulin R U-500 Initiation trial, both of these algorithms improved glycemic control and were associated with a low incidence of severe hypoglycemia. In addition, the associated weight gains were similar. Last, the rate of nonsevere hypoglycemia was slightly lower for the 3-times-daily than for the 2-times-daily regimen.34 A real-world outcome analysis of U-500 initiation confirmed the benefits of switching from U-100 to U-500. A clinically significant improvement in glycemic control was found in all the study participants. Dose and frequency of administration, however, were not reported.35
According to a secondary analysis in the Humulin R U-500 Initiation trial, baseline U-100 total daily dose did not yield a difference in efficacy or safety between the 2-times-a-day and 3-times-a-day arms—allowing use of a simpler 2-times-a-day schedule without regard to baseline total daily dose.28,36 The 2-times-a-day regimen is preferred in clinical practice given that the 2 regimens are equivalent in safety and efficacy and that the 2-times-a-day regimen is simpler, allows for easier titrations, improves patient perceptions of the effect of insulin on daily life function and psychological health, lowers daily injection burden, and maximizes adherence.37
Economic Analysis
A retrospective database analysis revealed lower overall cost and lower pharmacy cost associated with U-500 in comparison with high-dose U-100, as well as reduced hypoglycemia-specific costs or resource utilization, even though U-500 was associated with a slightly higher incidence of hypoglycemia.28 However, the fact that hypoglycemia was reported with a billing code (ICD-9) implies the hypoglycemic event was severe enough to require medical attention. Given these findings, 2-times-a-day U-500 seems more cost-effective than high-dose U-100.
Dosing
The U-500 Humulin R package insert recommends converting a dose to U-500 on the basis of most recent HbA1c level. U-500 can be dosed 2 times daily (60%, 40%) or 3 times daily (40%, 30%, 30%). If HbA1c is > 8%, then the starting total daily dose (TDD) of U-500 is 100% of the U-100 TDD. If HbA1c is ≤ 8%, then the starting TDD of U-500 is 80% of the final U-100 TDD (20% reduction). Dose adjustments may range from 5% to 10% depending on subsequent blood glucose readings.32
Recommendations
U-500 is a safe and effective monotherapy alternative for patients who require high doses of U-100. Initial conversion from U-100 is based on HbA1c level. The total daily dose of U-500 is then divided by 2 (60%, 40%) or 3 (40%, 30%, 30%). The 2-times-a-day regimen enhances adherence and thus may be preferred.
Discussion
It has been suggested that large volumes or depots of insulin approaching 100 units impedes absorption and are more painful compared with smaller volume injections.37 For patients with DM who require higher doses of insulin, concentrated insulins offer the advantage of smaller volumes. Also smaller volumes are a substantial benefit in addressing the growing epidemic of DM and the progressive nature of insulin resistance. Furthermore, concentrated insulins are available in pens. Compared with syringes and vials, pens are associated with a lower risk of dosing errors. The major advantages to the use of concentrated insulins include patient acceptability and the potential for decreased volumes and frequency of injections.
Potential disadvantages also exist for the use of concentrated insulins. Depending on insurance coverage, concentrated insulins may be more expensive than U-100 insulin options. Additionally, thorough counseling and education are of paramount importance when concentrated insulins are initiated or switched in patients with DM. The dosing errors that occur with concentrated insulins could increase the risk of hypoglycemia. Pharmacists should provide detailed counseling to DM patients initiating or switching concentrated insulins. It is important to implement or revise institution and clinic safe practices for concentrated insulins to avoid errors in prescribing, distributing, administering, and monitoring these medications.
Conclusion
Concentrated insulins provide expanded treatment options for patients with DM. Clinicians must stay well informed about concentrated insulin characteristics and dosing strategies to optimize DM treatment. As more evidence becomes available, standardized recommendations can be developed to guide clinicians in the appropriate use of concentrated insulins.
Click here to read the digital edition.
1. Humalog [package insert]. Indianapolis, IN: Eli Lilly & Co; 2015.
2. de la Peña A, Seger M, Soon D, et al. Bioequivalence and comparative pharmacodynamics of insulin lispro 200 U/mL relative to insulin lispro (Humalog®) 100 U/mL. Clin Pharmacol Drug Dev. 2016;5(1):69-75.
3. VA Pharmacy Benefits Management Services, Medical Advisory Panel, VISN Phar macist Executives. Insulin Lispro 200units/mL (Humalog) KwikPen abbreviated review. https://www.pbm.va.gov/PBM/clinicalguidance/abbreviatedre views/Insu lin_Lispro_200units_per_mL_Abbreviated_Review.pdf. Published February 2016. Accessed August 22, 2017.
4. Painter NA, Sisson E. An overview of concentrated insulin products. Diabetes Spectr. 2016;29(3):136-140.
5. Korsatko S, Deller S, Koehler G, et al. A comparison of the steady-state pharmacokinetic and pharmacodynamic profiles of 100 and 200 U/mL formulations of ultra-long-acting insulin degludec. Clin Drug Investig. 2013;33(7):515-521.
6. Goldman-Levine JD, Patel DK, Schnee DM. Insulin degludec: a novel basal insulin analogue. Ann Pharmacother. 2013;47(2):269-277.
7. Meneghini L, Atkin SL, Gouch SC, et al; NN1250-3668 (BEGIN FLEX) Trial Investigators. The efficacy and safety of insulin degludec given in variable once-daily dosing intervals compared with insulin glargine and insulin degludec dosed at the same time daily: a 26-week, randomized, open-label, parallel-group, treat-to-target trial in individuals with type 2 diabetes. Diabetes Care. 2013;36(4):858-864.
8. Rendell M. United States experience of insulin degludec alone or in combination for type 1 and type 2 diabetes. Drug Des Dev Ther. 2017;11:1209-1220.
9. Zinman B, Philis-Tsimikas A, Caropi B, et al; NN1250-3579 (BEGIN Once Long) Trial Investigators. Insulin degludec versus insulin glargine in insulin-naive patients with type 2 diabetes: a 1-year, randomized, treat-to-target trial (BEGIN Once Long). Diabetes Care. 2012;35(12):2464-2471.
10. Garber AJ, King AB, Del Prato S, et al; NN1250-3582 (BEGIN BB T2D) Trial Investigators. Insulin degludec, an ultra-longacting basal insulin, versus insulin glargine in basal-bolus treatment with mealtime insulin aspart in type 2 diabetes (BEGIN Basal-Bolus Type 2): a phase 3, randomised, open-label, treat-to-target non-inferiority trial. Lancet. 2012;379(9825):1498-1507.
11. Heller S, Buse J, Fisher M, et al; BEGIN Basal-Bolus Type 1 Trial Investigators. Insulin degludec, an ultra-longacting basal insulin, versus insulin glargine in basal-bolus treatment with mealtime insulin aspart in type 1 diabetes (BEGIN Basal-Bolus Type 1): a phase 3, randomised, open-label, treat-to-target non-inferiority trial. Lancet. 2012;379(9825):1489-1497.
12. Ratner RE, Gough SC, Mathieu C, et al. Hypoglycaemia risk with insulin degludec compared with insulin glargine in type 2 and type 1 diabetes: a pre-planned meta-analysis of phase 3 trials. Diabetes Obes Metab. 2013;15(2):175-184.
13. Marso SP, McGuire DK, Zinman B, et al; DEVOTE Study Group. Efficacy and safety of degludec versus glargine in type 2 diabetes. N Engl J Med. 2017;377(8):723-732.
14. Lane W, Bailey TS, Gerety G, et al; Group Information; SWITCH 1. Effect of insulin degludec vs insulin glargine U100 on hypoglycemia in patients with type 1 diabetes: the SWITCH 1 randomized clinical trial. JAMA. 2017;318(1):33-44.
15. Wysham C, Bhargava A, Chaykin L, et al. Effect of insulin degludec vs insulin glargine U100 on hypoglycemia in patients with type 2 diabetes: the SWITCH 2 randomized clinical trial. JAMA. 2017;318(1):45-56.
16. Weatherall J, Bludek L, Buchs S. Budget impact of treating commercially insured type 1 and type 2 diabetes patients in the United States with insulin degludec compared to insulin glargine. Curr Med Res Opin. 2017;33(2):231-238.
17. Mezquita-Raya P, Darbà J, Ascanio M, Ramírez de Arellano A. Cost-effectiveness analysis of insulin degludec compared with insulin glargine u100 for the management of type 1 and type 2 diabetes mellitus—from the Spanish National Health System perspective. Expert Rev Pharmacoecon Outcomes Res. 2017:1-9. [Epub ahead of print.]
18. Landstedt-Hallin L, Gundgaard J, Ericsson Å, Ellfors-Zetterlund S. Cost-effectiveness of switching to insulin degludec from other basal insulins: evidence from Swedish real-world data. Curr Med Res Opin. 2017;33(4):647-655.
19. Pollock RF, Tikkanen CK. A short-term cost-utility analysis of insulin degludec versus insulin glargine U100 in patients with type 1 or type 2 diabetes in Denmark. J Med Econ. 2017;20(3):213-220.
20. Becker RH, Dahmen R, Bergmann K, Lehmann A, Jax T, Heise T. New insulin glargine 300 units · mL-1 provides a more even activity profile and prolonged glycemic control at steady state compared with insulin glargine 100 units · mL-1. Diabetes Care. 2015;38(4):637-643.
21. Toujeo [package insert]. Bridgewater, NJ: Sanofi-Aventis; 2015.
22. Riddle MC, Bolli GB, Ziemen M, Muehlen-Bartmer I, Bizet F, Home PD; EDITION 1 Study Investigators. New insulin glargine 300 units/mL versus glargine 100 units/mL in people with type 2 diabetes using basal and mealtime insulin: glucose control and hypoglycemia in a 6-month randomized controlled trial (EDITION 1). Diabetes Care. 2014;37(10):2755-2762.
23. Yki-Järvinen H, Bergenstal R, Ziemen M, et al; EDITION 2 Study Investigators. New insulin glargine 300 units/mL versus glargine 100 units/mL in people with type 2 diabetes using oral agents and basal insulin: glucose control and hypoglycemia in a 6-month randomized controlled trial (EDITION 2). Diabetes Care. 2014;37(12):3235-3243.
24. Bolli GB, Riddle MC, Bergenstal RM, et al; on behalf of the EDITION 3 Study Investigators. New insulin glargine 300 U/ml compared with glargine 100 U/ml in insulin-naïve people with type 2 diabetes on oral glucose-lowering drugs: a randomized controlled trial (EDITION 3). Diabetes Obes Metab. 2015;17(4):386-394.
25. Home PD, Bergenstal RM, Bolli GB, et al. New insulin glargine 300 units/mL versus glargine 100 units/mL in people with type 1 diabetes: a randomized, phase 3a, open-label clinical trial (EDITION 4). Diabetes Care. 2015;38(12):2217-2225.
26. Monero S, Delgado M, Rubio M, Gasche D, Fournier M. Cost-utility evaluation of insulin glargine 300 (GLA-300) versus insulin glargine 100 (GLA-100) in patients with type 2 diabetes mellitus (T2DM). Poster presented at: International Society for Pharmacoeconomics and Outcomes Research (ISPOR) 19th Annual European Congress; October 29-November 2, 2016; Vienna, Austria.
27. Ritzel R, Roussel R, Bolli GB, et al. Patient-level meta-analysis of the EDITION 1, 2 and 3 studies: glycaemic control and hypoglycaemia with new insulin glargine 300 U/ml versus glargine 100 U/ml in people with type 2 diabetes. Diabetes Obes Metab. 2015;17(9):859-867.
28. Eby EL, Wang P, Curtis BH, et al. Cost, healthcare resource utilization, and adherence of individuals with diabetes using U-500 or U-100 insulin: a retrospective database analysis. J Med Econ. 2013;16(4):529-538.
29. Lilly USA. Pharmacy tips about Humulin R U-500 KwikPen syringe and vial. http://www.humulin.com/pharmacy-tips.aspx#about-the-u500-syringe_and_vial. Accessed
30. Meneghini, L. New insulin preparations: a primer for the clinician. Cleve Clin J Med. 2016;83(5 suppl 1):S27-S33.
31. Humulin R U-500 KwikPen [package insert]. Indianapolis, IN: Eli Lilly & Co; 2016.
32. de la Peña A, Riddle M, Morrow LA, et al. Pharmacokinetics and pharmacodynamics of high-dose human regular U-500 insulin versus human regular U-100 insulin in healthy obese subjects. Diabetes Care. 2011;34(12):2496-2501.
33. Hood RC, Arakaki RF, Wysham C, Li YG, Settles JA, Jackson JA. Two treatment approaches for human regular U-500 insulin in patients with type 2 diabetes not achieving adequate glycemic control on high-dose U-100 insulin therapy with or without oral agents: a randomized, titration-to-target clinical trial. Endocr Pract. 2015;21(7):782-793.
34. Eby EL, Curtis BH, Gelwicks SC, et al. Initiation of human regular U-500 insulin use is associated with improved glycemic control: a real-world US cohort study. BMJ Open Diabetes Res Care. 2015;3(1):e000074.
35. Wysham C, Hood RC, Warren ML, Wang T, Morwick TM, Jackson JA. Effect of total daily dose on efficacy, dosing, and safety of 2 dose titration regimens of human regular U500 insulin in severely insulin-resistant patients with type 2 diabetes. Endocr Pract. 2016;22(6):653-665.
36. Kabul S, Hood RC, Duan R, DeLozier AM, Settles J. Patient-reported outcomes in transition from high-dose U-100 insulin to human regular U-500 insulin in severely insulin-resistant patients with type 2 diabetes: analysis of a randomized clinical trial. Health Qual Life Outcomes. 2016;14(1):139.
37. Hirsch IB. Lipodystrophy: metabolic and clinical aspects. https://www.endo crine.org/~/media/endosociety/files/education/lypodystrophy-files/hirsch_tdeg-2013_lrc_final.pdf?la=en. Accessed September 7, 2017.
For a long time, 500 U/mL (U-500) insulin was the only concentrated insulin available on the market. With many diabetes mellitus (DM) patients requiring larger doses, additional 200 U/mL (U-200) and 300 U/mL (U-300) concentrations became available. As clinical guidelines lack specific recommendations for optimal use of U-200 and U-300 insulins, clinical discretion is warranted in identifying patients for whom use of these insulins is appropriate. U-500 insulin is recommended in cases that require ≥ 200 U/d or > 2 U/kg/d. Given the ongoing DM and obesity epidemics, increased use of concentrated insulins is likely. Clinicians must stay well informed about the characteristics and benefits of concentrated insulins to remain confident recommending, prescribing, and adjusting these medications.
U-200 Insulin Lispro
Pharmacokinetics/Pharmacodynamics
The amino acid structure of U-200 insulin lispro is different from that of endogenous insulin. In U-200 lispro, lysine replaces a proline at position B28, and proline replaces a lysine at position B29.
In a euglycemic clamp study of patients without DM, a 20-U dose of U-200 lispro and a single 20-U dose of U-100 lispro were found to have similar mean area under the glucose infusion rate curves, mean area under the serum insulin concentration-time curves from time 0 to infinity, mean peak serum insulin levels, and time to maximum glucose-lowering effects.1 For both U-200 lispro and U-100 lispro, time to maximum effect was 1 hour.2
Even numbers are marked on the dial of the pen. Odd numbers are not marked, but longer lines appear in their place. U-200 lispro should not be mixed with any other insulin, whereas U-100 lispro can be mixed with neutral protamine Hagedorn insulin.
Safety/Efficacy
There has been 1 bioequivalence study of euglycemic patients without type 2 DM (T2DM) but no studies of the safety or efficacy of U-200 lispro in patients with DM.3,4 U-100 lispro converts 1:1 to U-200 lispro (eg, 60 U of U-100 lispro converts to 60 U of U-200 lispro).1 The volume of U-200 lispro would be smaller than that of U-100 lispro.
Economic Analysis
There are no published U-200 lispro economic analyses.
Dosing
U-200 lispro should be converted from other bolus insulins in a 1:1 ratio.1
Recommendations
Definitive recommendations await efficacy trials comparing use of U-200 lispro and other bolus insulins in patients with DM. Currently, U-200 lispro may be considered for patients with DM who require high doses of bolus insulin and who may benefit from smaller volumes of lispro.
U-200 Insulin Degludec
Pharmacokinetics/Pharmacodynamics
The basal insulin degludec (Tresiba) is available in U-100 and U-200 concentrations in a pen. After subcutaneous injection, degludec forms gradually dissociating multihexamer chains, which account for its flat and stable PK/PD profile. U-100 degludec and U-200 degludec have similar duration of action (≥ 42 hours) and time to steady state (2-3 days).5,6 A patient who misses a regularly scheduled dose should allow at least 8 hours between injections. Taking degludec at variable times does not decrease efficacy as long as this 8-hour minimum interval is observed.7
Safety/Efficacy
During its development, degludec was evaluated in more than 5,000 patients across 11 therapeutic trials.8 The key studies that led to the approval of degludec used insulin glargine as a comparator. In a 52-week study of 1,030 insulin-naïve patients with T2DM, degludec was noninferior to glargine in hemoglobin A1c (HbA1c) reduction (1.06% vs 1.19%). Overall hypoglycemia rates were similar, though there were fewer nocturnal hypoglycemia episodes with degludec than with glargine (0.25 vs 0.39 per patient-year of exposure; P = .38).9
The BEGIN Basal-Bolus trial series evaluated use of degludec combined with bolus insulin aspart in insulin-experienced patients with T2DM (n = 992) and type 1 DM (T1DM) (n = 629) over 52 weeks.10,11 Both trials found noninferiority in A1c reduction: 1.1% (degludec) and 1.18% (glargine) in patients with T2DM and 0.4% (degludec) and 0.39% (glargine) in those with T1DM.10,11 Significantly fewer episodes of overall hypoglycemia (11.09 vs 13.63 per patient-year) and nocturnal hypoglycemia (1.39 vs 1.84 per patient-year) were found with degludec in patients with T2DM.5 Overall hypoglycemia rates were similar, though there was a 25% lower rate of nocturnal hypoglycemia with degludec in patients with T1DM.11
A meta-analysis of 7 phase 3a trials that compared degludec with glargine revealed significantly lower rates of overall, nocturnal, and severe hypoglycemia with degludec in insulin-naïve patients.12 The analysis confirmed findings of significantly lower rates of overall and nocturnal hypoglycemia with degludec in the overall T2DM population and significantly lower rates of nocturnal hypoglycemia in the T1DM population.12
In the DEVOTE trial, which included 7,637 T2DM patients at high risk for a cardiovascular event, degludec and glargine were compared on the composite primary outcome of death with a cardiovascular cause, nonfatal myocardial infarction, or nonfatal stroke. After a median of 1.99 years, the primary outcome occurred in 8.5% of degludec patients and 9.3% of glargine patients (hazard ratio, 0.91; 95% confidence interval, 0.78-1.06; P < .001 for noninferiority). Mean HbA1c level was 7.5 in both groups; severe hypoglycemia occurred more often in the glargine group (odds ratio, 0.73; P < .001 for superiority).13 Findings from the randomized, crossover SWITCH 1 and SWITCH 2 trials confirmed lower rates of symptomatic hypoglycemia with degludec compared with glargine in patients with T1DM and T2DM, respectively.14,15 No statistically significant differences in weight gain were observed in the clinical trials comparing degludec and glargine.
Economic Analysis
Weatherall and colleagues used a budget impact model to evaluate the costs of degludec and glargine for commercially insured patients with DM in the U.S.16 Three treatment groups were analyzed: basal/bolus combination in T1DM and T2DM, and basal/oral combination in T2DM. Although degludec cost more, overall cost was reduced in T1DM because of reduced insulin usage and fewer hypoglycemic episodes in T2DM with basal/oral combination therapy. The authors acknowledged the many assumptions needed and the potential oversimplification of their model.16 In other countries, economic analyses had similar findings.17-19
Dosing
Degludec converts 1:1 to other basal insulins. Recommended starting doses for U-200 degludec are 10 U once daily for insulin-naïve adults with T2DM and one-third to one-half the total weight-based daily insulin dose for insulin-naïve adults with T1DM.4
Recommendations
For some patients, lower PD variability may make degludec a desirable alternative. As degludec retains its efficacy with variable dosing times, it may be ideal for patients who have difficulty with a once-daily dosing schedule. It is important to inform patients that the degludec pen allows for 2-U increments. Given the lower frequency of nocturnal hypoglycemic events with degludec compared with glargine, degludec is an appropriate basal insulin option for patients with nocturnal hypoglycemia. In addition, U-200 degludec may be considered for DM patients who require high doses of basal insulin and who may benefit from smaller volumes of degludec.
U-300 Isulin Glargine
Pharmacokinetics/Pharmacodynamics
U-300 glargine is a concentrated basal insulin. There are notable differences between its U-100 and U-300 concentrations. For U-300 glargine dosed at 0.4 U/kg, duration of action is 24 hours; for U-300 glargine dosed at 0.6 U/kg or higher, longer duration is expected.20 Steady state is reached after 5 days.21 The U-300 glargine pen contains 1.5 mL, less than the 3 mL in the U-100 pen. U-300 glargine typically is administered in 1 injection once daily if the dose is < 80 U; 2 injections are required if the dose is > 80 U.
Safety/Efficacy
In the EDITION trials, which compared U-300 and U-100 glargine in patients with T1DM and T2DM, the primary endpoint was 6-month HbA1c reduction.22-24 Comparable HbA1c reductions were found in all of the studies. In EDITION 1, in which 2,474 patients with T2DM were taking concomitant bolus insulin with or without metformin, 11% more U-300 glargine than U-100 glargine was needed to achieve similar results.22 In EDITION 4, in which bolus insulin was used in combination in 546 patients with T1DM, 17.5% more U-300 glargine than U-100 glargine was needed to achieve similar glycemic goals.25
Economic Analysis
Compared with other insulins, U-300 glargine has limited published data and economic analyses. Using a cost-utility model to compare U-300 with U-100 glargine in Spanish patients with T2DM, and reporting results in euros per quality-adjusted life years, Monero and colleagues concluded that the hypoglycemia reduction and possible time-of-dose flexibility found with U-300 glargine may contribute to its cost-effectiveness.26
Dosing
U-300 glargine should be converted in a 1:1 ratio from U-100 glargine or detemir. The U-300 glargine dose should be reduced by 20% when switching from NPH insulin.21
Recommendations
A meta-analysis of the EDITION trials 1 to 3 revealed a lower incidence of daytime and nocturnal hypoglycemia with use of U-300 glargine over U-100 glargine and a beneficial shorter hold time after injection of U-300 glargine (5 seconds) compared with U-100 glargine (10 seconds).27 There was statistically lower weight gain with U-300 glargine compared with U-100 glargine however weight gain was < 1 kg in both groups.27 These characteristics of U-300 glargine may prove advantageous for individual patients.
U-500 Insulin
Pharmacokinetics/Pharmacodynamics
U-500 insulin (Humulin R) has been available in a vial since 1997, but other formulations have been used therapeutically since 1952.28 The U-500 KwikPen device, recently added to the market, has improved the vial and syringe dosing. The new U-500 BD (Becton, Dickinson, Franklin Lakes, NJ) syringes allow doses up to 250 U, and the U-500 KwikPens provide up to 300 U per injection.29 When it was first introduced, U-500 insulin had no dedicated delivery device and dose conversion was required to deliver the appropriate dose using an allergy or TB syringe. As a consequence, confusion often resulted between prescribers, pharmacists and patients.30,31 U-500 insulin acts as basal and bolus insulins do. Onset of action is ~15 minutes, time to peak is 4 to 8 hours, and duration of action is ≤ 21 hours.32 As its onset of action is similar to that of U-100, U-500 should be injected 30 minutes before meals.
A single-site, randomized, double-blind, crossover euglycemic clamp study that compared equivalent doses of U-500 and U-100 in healthy obese patients found the formulations had similar overall exposures and effects—the only differences were that U-500 had an extended time to peak and a prolonged post-peak effect. The longer post-peak effect contributes to longer duration of action and allows for fewer daily injections.33
Safety/Efficacy
In the Humulin R U-500 Initiation trial, both of these algorithms improved glycemic control and were associated with a low incidence of severe hypoglycemia. In addition, the associated weight gains were similar. Last, the rate of nonsevere hypoglycemia was slightly lower for the 3-times-daily than for the 2-times-daily regimen.34 A real-world outcome analysis of U-500 initiation confirmed the benefits of switching from U-100 to U-500. A clinically significant improvement in glycemic control was found in all the study participants. Dose and frequency of administration, however, were not reported.35
According to a secondary analysis in the Humulin R U-500 Initiation trial, baseline U-100 total daily dose did not yield a difference in efficacy or safety between the 2-times-a-day and 3-times-a-day arms—allowing use of a simpler 2-times-a-day schedule without regard to baseline total daily dose.28,36 The 2-times-a-day regimen is preferred in clinical practice given that the 2 regimens are equivalent in safety and efficacy and that the 2-times-a-day regimen is simpler, allows for easier titrations, improves patient perceptions of the effect of insulin on daily life function and psychological health, lowers daily injection burden, and maximizes adherence.37
Economic Analysis
A retrospective database analysis revealed lower overall cost and lower pharmacy cost associated with U-500 in comparison with high-dose U-100, as well as reduced hypoglycemia-specific costs or resource utilization, even though U-500 was associated with a slightly higher incidence of hypoglycemia.28 However, the fact that hypoglycemia was reported with a billing code (ICD-9) implies the hypoglycemic event was severe enough to require medical attention. Given these findings, 2-times-a-day U-500 seems more cost-effective than high-dose U-100.
Dosing
The U-500 Humulin R package insert recommends converting a dose to U-500 on the basis of most recent HbA1c level. U-500 can be dosed 2 times daily (60%, 40%) or 3 times daily (40%, 30%, 30%). If HbA1c is > 8%, then the starting total daily dose (TDD) of U-500 is 100% of the U-100 TDD. If HbA1c is ≤ 8%, then the starting TDD of U-500 is 80% of the final U-100 TDD (20% reduction). Dose adjustments may range from 5% to 10% depending on subsequent blood glucose readings.32
Recommendations
U-500 is a safe and effective monotherapy alternative for patients who require high doses of U-100. Initial conversion from U-100 is based on HbA1c level. The total daily dose of U-500 is then divided by 2 (60%, 40%) or 3 (40%, 30%, 30%). The 2-times-a-day regimen enhances adherence and thus may be preferred.
Discussion
It has been suggested that large volumes or depots of insulin approaching 100 units impedes absorption and are more painful compared with smaller volume injections.37 For patients with DM who require higher doses of insulin, concentrated insulins offer the advantage of smaller volumes. Also smaller volumes are a substantial benefit in addressing the growing epidemic of DM and the progressive nature of insulin resistance. Furthermore, concentrated insulins are available in pens. Compared with syringes and vials, pens are associated with a lower risk of dosing errors. The major advantages to the use of concentrated insulins include patient acceptability and the potential for decreased volumes and frequency of injections.
Potential disadvantages also exist for the use of concentrated insulins. Depending on insurance coverage, concentrated insulins may be more expensive than U-100 insulin options. Additionally, thorough counseling and education are of paramount importance when concentrated insulins are initiated or switched in patients with DM. The dosing errors that occur with concentrated insulins could increase the risk of hypoglycemia. Pharmacists should provide detailed counseling to DM patients initiating or switching concentrated insulins. It is important to implement or revise institution and clinic safe practices for concentrated insulins to avoid errors in prescribing, distributing, administering, and monitoring these medications.
Conclusion
Concentrated insulins provide expanded treatment options for patients with DM. Clinicians must stay well informed about concentrated insulin characteristics and dosing strategies to optimize DM treatment. As more evidence becomes available, standardized recommendations can be developed to guide clinicians in the appropriate use of concentrated insulins.
Click here to read the digital edition.
1. Humalog [package insert]. Indianapolis, IN: Eli Lilly & Co; 2015.
2. de la Peña A, Seger M, Soon D, et al. Bioequivalence and comparative pharmacodynamics of insulin lispro 200 U/mL relative to insulin lispro (Humalog®) 100 U/mL. Clin Pharmacol Drug Dev. 2016;5(1):69-75.
3. VA Pharmacy Benefits Management Services, Medical Advisory Panel, VISN Phar macist Executives. Insulin Lispro 200units/mL (Humalog) KwikPen abbreviated review. https://www.pbm.va.gov/PBM/clinicalguidance/abbreviatedre views/Insu lin_Lispro_200units_per_mL_Abbreviated_Review.pdf. Published February 2016. Accessed August 22, 2017.
4. Painter NA, Sisson E. An overview of concentrated insulin products. Diabetes Spectr. 2016;29(3):136-140.
5. Korsatko S, Deller S, Koehler G, et al. A comparison of the steady-state pharmacokinetic and pharmacodynamic profiles of 100 and 200 U/mL formulations of ultra-long-acting insulin degludec. Clin Drug Investig. 2013;33(7):515-521.
6. Goldman-Levine JD, Patel DK, Schnee DM. Insulin degludec: a novel basal insulin analogue. Ann Pharmacother. 2013;47(2):269-277.
7. Meneghini L, Atkin SL, Gouch SC, et al; NN1250-3668 (BEGIN FLEX) Trial Investigators. The efficacy and safety of insulin degludec given in variable once-daily dosing intervals compared with insulin glargine and insulin degludec dosed at the same time daily: a 26-week, randomized, open-label, parallel-group, treat-to-target trial in individuals with type 2 diabetes. Diabetes Care. 2013;36(4):858-864.
8. Rendell M. United States experience of insulin degludec alone or in combination for type 1 and type 2 diabetes. Drug Des Dev Ther. 2017;11:1209-1220.
9. Zinman B, Philis-Tsimikas A, Caropi B, et al; NN1250-3579 (BEGIN Once Long) Trial Investigators. Insulin degludec versus insulin glargine in insulin-naive patients with type 2 diabetes: a 1-year, randomized, treat-to-target trial (BEGIN Once Long). Diabetes Care. 2012;35(12):2464-2471.
10. Garber AJ, King AB, Del Prato S, et al; NN1250-3582 (BEGIN BB T2D) Trial Investigators. Insulin degludec, an ultra-longacting basal insulin, versus insulin glargine in basal-bolus treatment with mealtime insulin aspart in type 2 diabetes (BEGIN Basal-Bolus Type 2): a phase 3, randomised, open-label, treat-to-target non-inferiority trial. Lancet. 2012;379(9825):1498-1507.
11. Heller S, Buse J, Fisher M, et al; BEGIN Basal-Bolus Type 1 Trial Investigators. Insulin degludec, an ultra-longacting basal insulin, versus insulin glargine in basal-bolus treatment with mealtime insulin aspart in type 1 diabetes (BEGIN Basal-Bolus Type 1): a phase 3, randomised, open-label, treat-to-target non-inferiority trial. Lancet. 2012;379(9825):1489-1497.
12. Ratner RE, Gough SC, Mathieu C, et al. Hypoglycaemia risk with insulin degludec compared with insulin glargine in type 2 and type 1 diabetes: a pre-planned meta-analysis of phase 3 trials. Diabetes Obes Metab. 2013;15(2):175-184.
13. Marso SP, McGuire DK, Zinman B, et al; DEVOTE Study Group. Efficacy and safety of degludec versus glargine in type 2 diabetes. N Engl J Med. 2017;377(8):723-732.
14. Lane W, Bailey TS, Gerety G, et al; Group Information; SWITCH 1. Effect of insulin degludec vs insulin glargine U100 on hypoglycemia in patients with type 1 diabetes: the SWITCH 1 randomized clinical trial. JAMA. 2017;318(1):33-44.
15. Wysham C, Bhargava A, Chaykin L, et al. Effect of insulin degludec vs insulin glargine U100 on hypoglycemia in patients with type 2 diabetes: the SWITCH 2 randomized clinical trial. JAMA. 2017;318(1):45-56.
16. Weatherall J, Bludek L, Buchs S. Budget impact of treating commercially insured type 1 and type 2 diabetes patients in the United States with insulin degludec compared to insulin glargine. Curr Med Res Opin. 2017;33(2):231-238.
17. Mezquita-Raya P, Darbà J, Ascanio M, Ramírez de Arellano A. Cost-effectiveness analysis of insulin degludec compared with insulin glargine u100 for the management of type 1 and type 2 diabetes mellitus—from the Spanish National Health System perspective. Expert Rev Pharmacoecon Outcomes Res. 2017:1-9. [Epub ahead of print.]
18. Landstedt-Hallin L, Gundgaard J, Ericsson Å, Ellfors-Zetterlund S. Cost-effectiveness of switching to insulin degludec from other basal insulins: evidence from Swedish real-world data. Curr Med Res Opin. 2017;33(4):647-655.
19. Pollock RF, Tikkanen CK. A short-term cost-utility analysis of insulin degludec versus insulin glargine U100 in patients with type 1 or type 2 diabetes in Denmark. J Med Econ. 2017;20(3):213-220.
20. Becker RH, Dahmen R, Bergmann K, Lehmann A, Jax T, Heise T. New insulin glargine 300 units · mL-1 provides a more even activity profile and prolonged glycemic control at steady state compared with insulin glargine 100 units · mL-1. Diabetes Care. 2015;38(4):637-643.
21. Toujeo [package insert]. Bridgewater, NJ: Sanofi-Aventis; 2015.
22. Riddle MC, Bolli GB, Ziemen M, Muehlen-Bartmer I, Bizet F, Home PD; EDITION 1 Study Investigators. New insulin glargine 300 units/mL versus glargine 100 units/mL in people with type 2 diabetes using basal and mealtime insulin: glucose control and hypoglycemia in a 6-month randomized controlled trial (EDITION 1). Diabetes Care. 2014;37(10):2755-2762.
23. Yki-Järvinen H, Bergenstal R, Ziemen M, et al; EDITION 2 Study Investigators. New insulin glargine 300 units/mL versus glargine 100 units/mL in people with type 2 diabetes using oral agents and basal insulin: glucose control and hypoglycemia in a 6-month randomized controlled trial (EDITION 2). Diabetes Care. 2014;37(12):3235-3243.
24. Bolli GB, Riddle MC, Bergenstal RM, et al; on behalf of the EDITION 3 Study Investigators. New insulin glargine 300 U/ml compared with glargine 100 U/ml in insulin-naïve people with type 2 diabetes on oral glucose-lowering drugs: a randomized controlled trial (EDITION 3). Diabetes Obes Metab. 2015;17(4):386-394.
25. Home PD, Bergenstal RM, Bolli GB, et al. New insulin glargine 300 units/mL versus glargine 100 units/mL in people with type 1 diabetes: a randomized, phase 3a, open-label clinical trial (EDITION 4). Diabetes Care. 2015;38(12):2217-2225.
26. Monero S, Delgado M, Rubio M, Gasche D, Fournier M. Cost-utility evaluation of insulin glargine 300 (GLA-300) versus insulin glargine 100 (GLA-100) in patients with type 2 diabetes mellitus (T2DM). Poster presented at: International Society for Pharmacoeconomics and Outcomes Research (ISPOR) 19th Annual European Congress; October 29-November 2, 2016; Vienna, Austria.
27. Ritzel R, Roussel R, Bolli GB, et al. Patient-level meta-analysis of the EDITION 1, 2 and 3 studies: glycaemic control and hypoglycaemia with new insulin glargine 300 U/ml versus glargine 100 U/ml in people with type 2 diabetes. Diabetes Obes Metab. 2015;17(9):859-867.
28. Eby EL, Wang P, Curtis BH, et al. Cost, healthcare resource utilization, and adherence of individuals with diabetes using U-500 or U-100 insulin: a retrospective database analysis. J Med Econ. 2013;16(4):529-538.
29. Lilly USA. Pharmacy tips about Humulin R U-500 KwikPen syringe and vial. http://www.humulin.com/pharmacy-tips.aspx#about-the-u500-syringe_and_vial. Accessed
30. Meneghini, L. New insulin preparations: a primer for the clinician. Cleve Clin J Med. 2016;83(5 suppl 1):S27-S33.
31. Humulin R U-500 KwikPen [package insert]. Indianapolis, IN: Eli Lilly & Co; 2016.
32. de la Peña A, Riddle M, Morrow LA, et al. Pharmacokinetics and pharmacodynamics of high-dose human regular U-500 insulin versus human regular U-100 insulin in healthy obese subjects. Diabetes Care. 2011;34(12):2496-2501.
33. Hood RC, Arakaki RF, Wysham C, Li YG, Settles JA, Jackson JA. Two treatment approaches for human regular U-500 insulin in patients with type 2 diabetes not achieving adequate glycemic control on high-dose U-100 insulin therapy with or without oral agents: a randomized, titration-to-target clinical trial. Endocr Pract. 2015;21(7):782-793.
34. Eby EL, Curtis BH, Gelwicks SC, et al. Initiation of human regular U-500 insulin use is associated with improved glycemic control: a real-world US cohort study. BMJ Open Diabetes Res Care. 2015;3(1):e000074.
35. Wysham C, Hood RC, Warren ML, Wang T, Morwick TM, Jackson JA. Effect of total daily dose on efficacy, dosing, and safety of 2 dose titration regimens of human regular U500 insulin in severely insulin-resistant patients with type 2 diabetes. Endocr Pract. 2016;22(6):653-665.
36. Kabul S, Hood RC, Duan R, DeLozier AM, Settles J. Patient-reported outcomes in transition from high-dose U-100 insulin to human regular U-500 insulin in severely insulin-resistant patients with type 2 diabetes: analysis of a randomized clinical trial. Health Qual Life Outcomes. 2016;14(1):139.
37. Hirsch IB. Lipodystrophy: metabolic and clinical aspects. https://www.endo crine.org/~/media/endosociety/files/education/lypodystrophy-files/hirsch_tdeg-2013_lrc_final.pdf?la=en. Accessed September 7, 2017.
Smart insoles reduce ‘high-risk’ diabetic foot ulcer recurrence
BERLIN – Smart insoles that warn diabetic individuals of high plantar pressures could be a simple solution to help them avoid recurrent foot ulcers, according to the results of a randomized trial.
Study participants with a history of diabetic foot ulcers wore the plantar pressure–sensing insoles (SurroSense Rx) and received feedback via sensor linked to a smart watch worn and were 71% less likely to experience a recurrent foot ulceration than were those who wore the insoles but did not get the pressure feedback (incidence rate ratio, 0.29; 95% confidence interval, 0.09-0.93; P = .037). The device has been cleared by the Food and Drug Administration.
Overall, there were few ulcers that occurred in the study, with 10 ulcers from 8,638 person-days from six patients reported in the control group and four ulcers from 11,835 person-days from four patients in the intervention group.
“Diabetic foot ulcers are a major global health and economic burden, but, in theory at least, they are ultimately preventable,” said study investigator Neil Reeves, PhD,, who presented the findings at the annual meeting of the European Association for the Study of Diabetes.
Data suggest that recurrence rates for ulceration are as high as 65% at 6 years, he said, with up to a quarter of ulcers progressing to the point where some form of amputation is needed.
“In the laboratory, we can measure plantar pressures, and these are considered as a relatively accurate proxy for diabetic foot ulcer risk. So we can discriminate between those with diabetic neuropathy, and those without, and also those with a previous history of ulceration,” Dr. Reeves said.
Dr. Reeves, who is professor of musculoskeletal biomechanics at Manchester (England) Metropolitan University, observed that the rationale behind the development of the smart insoles was to move plantar pressure measurement out of the laboratory and into the real world.
The smart insoles incorporate eight discreet pressure sensors that are connected to pod worn on the front of the participant’s own shoe and that wirelessly relay pressure information to a smartwatch. Both the control and the intervention groups received the same device, Dr. Reeves pointed out, but the difference was that the only the intervention group got any pressure feedback from the sensors to the smartwatch.
“When high pressure was experienced in the intervention group on any of these sensors, the patient was alerted both by an auditory alarm and also by being able to see this on the smartwatch,” Dr. Reeves explained.
“The patient would be alerted as to where the pressure was high on the foot and that would be a trigger to offload this high pressure.” Patients would then be instructed via the smartwatch to try to offload the pressure by either walking around for 2 minutes, actively taking the weight off the foot, or removing the shoe to check for any foreign bodies.
In all, there were 58 study participants – 32 randomized to the intervention group and 26 to the control group – who had a history of diabetic foot ulcers and peripheral neuropathy but who were able to walk independently for at least 30 steps. The mean age of patients in the intervention group was 59 years, 88% were male, 72% had type 2 diabetes mellitus, with the mean duration of diabetes was 22 years. Corresponding data in the control group were 67 years, 89% male, 85% had type 2 diabetes, and 21 years’ diabetes duration.
Patients were reviewed monthly over a period of 18 months or until plantar ulceration occurred. Information on diabetic foot ulcers was collected and standardized using a previously developed mobile app (Diabetes Sci Technol. 2018;12[1]:169-73) and then confirmed via blinded assessment by two experts.
Dr. Reeves noted that there was no significant difference in the time to ulceration between the groups, with 77.5% and 68.4% of the intervention and control group remaining ulcer free at 18 months (P = .30). When the data were adjusted for compliance, there was an 86% reduction in the risk of reulceration in the intervention versus the control group (IRR, 0.14; 95% CI, 0.03-0.63; P = .011). This analysis took into account only those study participants who had 4.5 hours or more of daily wear of the smart insoles (n = 40). On average, the insoles were worn for 6.1 hours in the control group and by 6.9 hours in the intervention group.
“We suggest that the mechanism for this beneficial effect in the present study is likely pressure offloading, which has been afforded by providing patients in the intervention group with this plantar-pressure feedback,” said Dr. Reeves.
“That’s feedback that they’ve lost naturally many years ago due to diabetic peripheral neuropathy,” he added. “So, in that respect, we would suggest that patients have really been empowered here to take control of their foot health in a way that they haven’t been able to since the onset of significant diabetic peripheral neuropathy.”
Diabetes UK provided the primary funding for the study (years 1-3), with Orpyx Medical Technologies, Canada, providing funding during the study extension (year 4). Dr. Reeves did not have any disclosures.
REPORTING FROM EASD 2018
Key clinical point: Pressure-sensing smart insoles could help warn “high-risk” individuals to offload excess pressure on their feet.
Major finding: A 71% reduction in the risk of reulceration was observed when compared with the intervention with the control group (P = .037).
Study details: Randomized, single-blind controlled randomized study of 58 adults with a history of plantar diabetic foot ulcers.
Disclosures: Diabetes UK provided the primary funding for the study (years 1-3), with Orpyx Medical Technologies providing funding during the study extension (year 4). Dr. Reeves did not have any disclosures.
Platelet-rich patch helps heal difficult diabetic foot ulcers
BERLIN –
With the LeucoPatch – which contained study participants’ own cells (platelets, fibrin, and leukocytes) – 34.1% of ulcers healed within 20 weeks versus 21.6% of ulcers that were treated using the best standard care (unadjusted odds ratio, 1.58; 95% confidence interval, 1.06-2.25; P = .02). Healing was defined as complete epithelialization maintained for 4 weeks, as confirmed by an observer blinded to the treatment group.
Results remained significant after adjusting for baseline wound size (adjusted OR 1.89; P = .02) and following a per-protocol analysis (aOR, 1.75; P = .048).
Furthermore, time to healing was shorter in the intervention group (P = .02), lead study investigator Frances Game, MD, of the Derby (England) Teaching Hospitals National Health Service Foundation Trust, reported at the annual meeting of the European Association for the Study of Diabetes.
“Successive systematic reviews from the International Working Group of the Diabetic Foot have shown that there’s very poor evidence for many of the things that we do in day-to-day practice,” she said.
“Having said that, there have been some positive studies using platelets or platelet-rich plasma to improve healing of the diabetic foot,” Dr. Game noted, although results have been inconsistent. From this the idea of the LeucoPatch was born. This is an autologous active cell therapy, which according to the Danish company Reapplix that markets it, helps patients “heal themselves.”
The LeucoPatch system is made by taking 18 mL of a patient’s blood and spinning the collection tube in a centrifuge for 20 minutes to generate a three-layered disc that contains fibrin, platelets, and leukocytes. This can then be applied to the surface of the diabetic foot ulcer. Dr. Game noted that 18 mL of blood will make a 5-cm patch and more than one patch can be made from the blood sample.
“It looks like a bit of wet skin when it comes out of the centrifuge and you just put it on sole side down. It’s taking the patient’s own cells, that often aren’t getting to the ulcer because of the morbidity of the patient and vascular disease, and actually putting them where they need to be,” she explained. The patch usually becomes absorbed within a week; depending on the ulcer, reapplication may be required.
“It’s quite a straightforward procedure that’s performed the bedside,” Dr. Game observed. “That’s how we were able to recruit so many patients, as it’s quite simple.” Indeed, almost 600 people with diabetic foot ulcers agreed to participate in the study, but only those with difficult-to-treat ulcers were included after a 4-week run-in period. The 269 patients who were finally randomized were treated at 32 specialist diabetic foot clinics in the United Kingdom, Denmark, and Sweden.
The majority of participants were male (82%) and had type 2 diabetes mellitus (83%). The mean age was 62 years and the median duration of diabetes was 16 years. The mean ulcer area was 240 mm2, with 87% being superficial, 10% reaching down to the tendon, and 3% down to the bone. In 78% of cases, the total forefoot was affected, with the plantar forefoot and hind foot affected in a respective 42% and 22% of cases.
The LeucoPatch system is already being used in several European countries, including Germany and Belgium, Dr. Game noted. However, this is the first randomized, controlled trial to demonstrate a clinical and statistically significant benefit. The data show that the weekly application of LeucoPatch is clearly of benefit in a population of patients with hard-to-heal diabetic foot ulcers.
“The low drop-out numbers suggest a good patient acceptability,” she noted, and “the treatment was without apparent increase in adverse events, particularly without evidence of new onset anemia.”
Cost-effectiveness data were collected throughout the study and will be available at a future date when these have been analyzed, Dr. Game said.
The LeucoPatch system received Food and Drug Administration approval in April 2017.
The research was published online in the Lancet Diabetes & Endocrinology ahead of the presentation.
The trial was funded by Reapplix. Dr. Game reported receiving research funding from the company.
SOURCES: Game F et al. EASD 2018, Abstract 9.
REPORTING FROM EASD 2018
Key clinical point: Weekly application of LeucoPatch enabled greater healing in a shorter time frame than standard care.
Major finding: Within 20 weeks, 34.1% versus 21.6% of diabetic foot ulcers had healed (unadjusted odds ratio, 1.58; 95% confidence interval, 1.06-2.25; P = .02).
Study details: A multicenter, multinational, observer-blinded, randomized, controlled trial of 269 patients with hard-to-heal diabetic foot ulcers.
Disclosures: The trial was funded by Reapplix. Dr. Game reported receiving research funding from the company.
Sources: Game F et al. EASD 2018, Abstract 9.
Diabetes Programs Aren’t Reaching Their Targets
The CDC’s lifestyle change program (LCP), part of the National Diabetes Prevention Program, teaches people with prediabetes practical, real-life changes. Those changes can be enough to reduce the risk of type 2 diabetes by as much as 58%—or even 71% for people aged > 60 years. But are enough people getting the opportunity to participate?
CDC researchers assessed the availability of in-person LCP classes by diabetes incidence and socioeconomic status at the county level. They mapped 1,558 LCP class locations. They found classes in 711 (23%) US counties as of March 2017 (there may be more now, the researchers say).
But the classes were not necessarily located where they could do the most good, the researchers found. Only 17% of the counties with the highest diabetes incidence and 10% of counties with the most socioeconomic disadvantage had a publicly available class location. By contrast, 26.8% of counties in the lowest tertile of incidence had class locations.
The researchers say policy makers, program planners, and others engaged in expanding the availability of the classes can use the information to prioritize locations, especially for underrepresented populations.
Optimizing Insulin Therapy: Basal Insulin and Beyond
Supplement to The Journal of Family Practice
Financial support provided by Sanofi US, Inc.
Vol. 67, No. 10 | OCTOBER 2018
This video roundtable was peer reviewed by The Journal of Family Practice.
CLICK HERE TO VIEW THE VIDEOS

Abstract
Data suggest that in patients with type 2 diabetes, there has been little or no improvement in glycated hemoglobin (A1C) and other glycemic parameters over recent decades. In this digital roundtable discussion, the speakers address challenges faced every day in clinical practice, and provide practical advice regarding how primary care clinicians can overcome clinical inertia. The speakers particularly focus on how to manage patients who are treated with basal insulin, yet are unable to achieve good glycemic control. The discussion is broken down into 3 main parts.
First, the speakers discuss reasons why clinicians don’t move forward with therapy. These reasons may include not recognizing the importance of treatment intensification, clinicians' concerns about hypoglycemia in their patients, and delays in initiating injectable therapy.
Second, the speakers discuss when clinicians should move forward with therapy. American Diabetes Association (ADA) guidelines state that patients who do not meet A1C goals on current medication should intensify therapy within 3 months. Importantly, patients intensifying oral antidiabetic drugs therapy with basal insulin who do not achieve A1C goals of <7% within 12 months have been shown to have a very low conditional probability to do so thereafter, highlighting the importance of timely intensification.
Finally, the speakers discuss options for therapeutic intensification, and their respective benefits and risks. These options include glucagon-like peptide-1 receptor agonists (GLP-1 RAs), fixed-ratio combinations of basal insulin and GLP-1 RA, basal/bolus insulin, and continued basal insulin titration. Further, the speakers discuss the role of patient counseling and how clinicians can be supported in patient management.
CLICK HERE TO VIEW THE VIDEOS
About the panel
Vanita Aroda, MD, Brigham and Women’s Hospital, Harvard Medical School, Boston, MA
Eric L. Johnson, MD, Department of Family and Community Medicine, University of North Dakota, Grand Forks, ND
Lucia Novak, MSN, ANP-BC, Riverside Diabetes Center, Riverdale, MD
Neil Skolnik, MD, Abington Family Medicine, Jenkintown, PA
Disclosures
Dr. Aroda has had research contracts (clinical trials) within the past 12 months from: AstraZeneca/BMS, Calibra, Eisai, Elcelyx, Janssen, Novo Nordisk, Sanofi, and Theracos; has performed consultant activities within the past 12 months for the American Diabetes Association, Medscape, Novo Nordisk, Sanofi, and Tufts.
Dr. Johhnson serves or has served on the speakers’ bureaus for Medtronic and Novo Nordisk; serves or has served on advisory panels for Novo Nordisk and Sanofi.
Ms. Novak serves or has served on the speakers’ bureaus for AstraZeneca, Janssen, and Novo Nordisk; serves or has served on advisory boards and as a consultant for Novo Nordisk and Sanofi.
Dr. Skolnik serves or has served on the advisory boards for AstraZeneca, Boehringer Ingelheim, Intarcia, Janssen Pharmaceuticals, Lilly, Sanofi, and Teva; serves or has served on the speakers’ bureaus for AstraZeneca and Boehringer Ingelheim; received research support from AstraZeneca and Sanofi.
Acknowledgements
The authors wish to acknowledge the comments and review provided by Miss Davida Kruger. This review was funded by Sanofi US, Inc. The authors received writing/editorial support in the preparation of this material provided by Michael Van der Veer, PhD, of Excerpta Medica, funded by Sanofi US, Inc.
CLICK HERE TO VIEW THE VIDEOS
Supplement to The Journal of Family Practice
Financial support provided by Sanofi US, Inc.
Vol. 67, No. 10 | OCTOBER 2018
This video roundtable was peer reviewed by The Journal of Family Practice.
CLICK HERE TO VIEW THE VIDEOS
Abstract
Data suggest that in patients with type 2 diabetes, there has been little or no improvement in glycated hemoglobin (A1C) and other glycemic parameters over recent decades. In this digital roundtable discussion, the speakers address challenges faced every day in clinical practice, and provide practical advice regarding how primary care clinicians can overcome clinical inertia. The speakers particularly focus on how to manage patients who are treated with basal insulin, yet are unable to achieve good glycemic control. The discussion is broken down into 3 main parts.
First, the speakers discuss reasons why clinicians don’t move forward with therapy. These reasons may include not recognizing the importance of treatment intensification, clinicians' concerns about hypoglycemia in their patients, and delays in initiating injectable therapy.
Second, the speakers discuss when clinicians should move forward with therapy. American Diabetes Association (ADA) guidelines state that patients who do not meet A1C goals on current medication should intensify therapy within 3 months. Importantly, patients intensifying oral antidiabetic drugs therapy with basal insulin who do not achieve A1C goals of <7% within 12 months have been shown to have a very low conditional probability to do so thereafter, highlighting the importance of timely intensification.
Finally, the speakers discuss options for therapeutic intensification, and their respective benefits and risks. These options include glucagon-like peptide-1 receptor agonists (GLP-1 RAs), fixed-ratio combinations of basal insulin and GLP-1 RA, basal/bolus insulin, and continued basal insulin titration. Further, the speakers discuss the role of patient counseling and how clinicians can be supported in patient management.
CLICK HERE TO VIEW THE VIDEOS
About the panel
Vanita Aroda, MD, Brigham and Women’s Hospital, Harvard Medical School, Boston, MA
Eric L. Johnson, MD, Department of Family and Community Medicine, University of North Dakota, Grand Forks, ND
Lucia Novak, MSN, ANP-BC, Riverside Diabetes Center, Riverdale, MD
Neil Skolnik, MD, Abington Family Medicine, Jenkintown, PA
Disclosures
Dr. Aroda has had research contracts (clinical trials) within the past 12 months from: AstraZeneca/BMS, Calibra, Eisai, Elcelyx, Janssen, Novo Nordisk, Sanofi, and Theracos; has performed consultant activities within the past 12 months for the American Diabetes Association, Medscape, Novo Nordisk, Sanofi, and Tufts.
Dr. Johhnson serves or has served on the speakers’ bureaus for Medtronic and Novo Nordisk; serves or has served on advisory panels for Novo Nordisk and Sanofi.
Ms. Novak serves or has served on the speakers’ bureaus for AstraZeneca, Janssen, and Novo Nordisk; serves or has served on advisory boards and as a consultant for Novo Nordisk and Sanofi.
Dr. Skolnik serves or has served on the advisory boards for AstraZeneca, Boehringer Ingelheim, Intarcia, Janssen Pharmaceuticals, Lilly, Sanofi, and Teva; serves or has served on the speakers’ bureaus for AstraZeneca and Boehringer Ingelheim; received research support from AstraZeneca and Sanofi.
Acknowledgements
The authors wish to acknowledge the comments and review provided by Miss Davida Kruger. This review was funded by Sanofi US, Inc. The authors received writing/editorial support in the preparation of this material provided by Michael Van der Veer, PhD, of Excerpta Medica, funded by Sanofi US, Inc.
CLICK HERE TO VIEW THE VIDEOS
Serious Mental Illness and Its Impact on Diabetes Care in a VA Nurse/Pharmacist-Managed Population (FULL)
Diabetes mellitus (DM) is considered one of the most psychologically and behaviorally demanding chronic medical conditions. Patients with DM and serious mental illness (SMI), including schizophrenia, schizoaffective disorder, major depressive disorder (MDD), and bipolar disorder, are more likely to have poor adherence to medications as well as poor adherence to diet and lifestyle recommendations, which can lead to poor glycemic control, decreased quality of life, and increased health care expenses.1-4 Up to 27% of patients with DM have a depression diagnosis, and up to 60% of patients with DM experience depressive symptoms.5 Additionally, 1 in 4 patients with schizophrenia have a DM diagnosis.6 Serious mental illness can compromise DM self-management and glycemic control, which increases the risk of DM-related complications.7
These factors combine to make DM self-management essential for optimal glycemic control and prevention of DM-related complications. The American Diabetes Association recommends coordinated management of DM and SMI to achieve DM treatment targets.8 Interventions involving collaborative care teams have assisted in managing patients with concurrent SMI and DM. Collaborative interventions have reduced all-cause mortality, increased the number of patients reaching hemoglobin A1c (HbA1c) targets, increased overall improvement in HbA1c, increased rates of depression remission, and increased medication adherence.9-12
Background
Collaborative interventions have improved glycemic control in patients with concurrent SMI and DM. A study by Desai and colleagues examined the relationship between psychiatric disorders and the quality of DM care in a national sample of veterans.7 Data were collected using chart-abstracted quality data from administrative database records for a sample of veterans with DM who had at least 3 outpatient visits in the previous year (n = 38,020). About 25% of the sample had a diagnosed psychiatric disorder, 91.5% of veterans completed an HbA1c test, and most veterans with a psychiatric disorder completed the 5 quality indicators for DM care (foot inspection, HbA1c determination, pedal pulses examination, foot sensory examination, and retina examination). Veterans with psychiatric disorders did not have a poorer quality of care for secondary prevention of DM compared with that of other veterans.7
In the PROSPECT study (Prevention of Suicide in Primary Care Elderly: Collaborative Trial), a primary care-based depression management program assessed a collaborative intervention to improve care in patients with depression and DM.9 Fifteen depression care managers, including trained social workers, registered nurses (RNs), and psychologists, collaborated with primary care physicians (PCPs) to assist in recognizing depression, offer guideline-based treatment recommendations, and provide algorithm-based care, monitoring, and follow-up. After a median follow-up of 52 months, patients with depression and DM in the intervention group were less likely to die during the 5-year follow-up period compared with those in usual care (adjusted hazard ratio, 0.49 [95% confidence interval (CI), 0.24-0.98]). The study authors concluded that integrated depression care management significantly reduced all-cause mortality in patients with depression and DM.9
A single-blind, randomized, controlled trial conducted by Katon and colleagues examined patients with poorly controlled DM, coronary artery disease (CAD), or both, and concurrent depression in 14 primary care clinics (n = 214).10 The intervention consisted of nurse care managers who were trained RNs with experience in DM education and supervised by PCPs, providing guideline-based, collaborative care over 12 months to improve glycemic control, blood pressure (BP), and lipid control. The nurse care managers followed up with patients every 2 to3 weeks at office visits, and the intervention was compared with usual care by a physician. At 12 months, patients in the intervention group had significant improvement in HbA1c, low-density lipoprotein cholesterol, systolic BP, and depression compared with that of those under usual care. At 12 months, the HbA1c in the patients in the intervention group was significantly improved with an overall percentage change of 0.81 compared with 0.23 in the usual care group (estimated between-group difference, -0.56 [95% CI, -0.85 to -0.27]). The study authors concluded that integrated management and proactive follow-up of medical and psychological illnesses improved both medical outcomes and depression in patients with DM, CAD, or both.10
Another study by Bogner and colleagues investigated an integrated care intervention for patients with depression and DM to improve adherence to antidepressant and antidiabetic medications, glycemic control, and depression remission.11 Two trained research coordinators (a bachelor’s level and a master’s level) administered all intervention activities. The integrated care managers collaborated with physicians, offering education and guideline-based treatment recommendations to patients to monitor medication adherence and clinical status. The intervention supplemented regular primary care follow-up visits and was compared with usual care. At 12 weeks, patients in the integrated care group were more likely to achieve an HbA1c < 7% (60.9% vs 35.7%; P < .001) and remission of depression (58.7% vs 30.7%; P < .001) compared with those in usual care. There also was a significant improvement in adherence to DM and antidepressant medications in the intervention group compared with those in usual care during the study period.11
A systematic review and meta-analysis by Huang and colleagues assessed randomized controlled trials of collaborative care for diabetic patients with depression.12 Trials that reported depression treatment response, depression remission, HbA1c values, and adherence to antidepressant and/or hypoglycemic medications were included. A total of 8 trials randomized 2,238 patients with concurrent depression and DM and compared collaborative care with usual care. Collaborative care was associated with a significant increase in depression treatment response, reduction in HbA1c, and significant improvement in adherence rates for antidepressant and hypoglycemic medications compared with that of usual care. A reduction in HbA1c favored the collaborative care group; however, this reduction was not significant (mean difference, -0.13 [95% CI, -0.46 to 0.19]; P = .08 for heterogeneity; I2 = 51%). The study authors concluded that a collaborative care model significantly improved depression outcomes and adherence to medications in patients with concurrent DM and depression and recommended continued collaborative care for this population.12
Methods
The current study examines a novel service involving the collaboration of a registered nurse-certified DM educator (RN CDE) and clinical pharmacy specialist (PharmD) to improve access to care and maximize DM outcomes. The Louis Stokes Cleveland VAMC defines the PharmD scope of practice. One of the pharmacist’s clinical obligations includes serving as a preceptor for the RN CDE, a collaboration that has not been investigated in previous studies. A primary care provider (PCP) refers veterans to the RN CDE/PharmD clinic, with HbA1c ≥ 8%.
The RN CDE/PharmD clinic tends to receive referrals for the most challenging veterans who may have very elevated HbA1c readings, complex multidrug regimens, or basal/bolus insulin regimens. The RN CDE sees veterans in individual appointments and takes manual BP readings, checks point-of-care glucose/HbA1c readings, downloads home glucometer results into the electronic medical record (EMR), and provides education on DM management specific to the veteran’s individual needs. Because there is no established treatment algorithm for the RN CDE to follow, all medication changes are determined by a preceptor in real time.
When the RN CDE clinic was established, the RN CDE presented veterans to their PCP who determined the veteran’s plan of care. However, this plan was frustrating for the RN CDE because the PCP was not always readily available, causing delays in the workflow of the RN CDE clinic. Since the PharmD has a scope of practice and is more frequently available to discuss veteran cases, RN CDE/PharmD collaboration was initiated. Based on information gathered during the appointment, medication additions, titrations, and changes are precepted with the PharmD. Veterans can be seen in clinic every 2 to 4 weeks, allowing for continued medication adjustments if warranted until their HbA1c target is achieved. Veterans are discharged to their PCP once their HbA1c is at target.
Within the primary care clinic, this service was compared with usual care by a PCP and was associated with a clinically significant reduction in HbA1c by 2.5% compared with usual care after 1 year (P < .001).13 The same study population was investigated to determine whether there was a difference in glycemic control between veterans with SMI compared with veterans without SMI (non-SMI) to provide insight and better support for veterans with SMI and their DM care.
A retrospective review of the veterans referred to the RN CDE/PharmD clinic from January 1, 2011 to December 31, 2014 was performed with institutional review board approval. Veterans were identified using a pharmacy-generated list searching for clinic note titles from the Computerized Patient Record System (CPRS).
The primary objective of this study was to determine the percentage change in mean HbA1c in veterans with SMI compared with that of veterans without SMI after referral to the RN CDE/PharmD clinic. The following secondary objectives also were investigated: the difference in the percentage of veterans with glycemic relapse after the intervention in veterans with SMI compared with that of veterans without SMI, and the difference in time to glycemic relapse between veterans with SMI compared with that of veterans without SMI. Serious mental illness was defined as schizophrenia, schizoaffective disorder, bipolar disorder, and MDD and identified in CPRS using ICD-9 and ICD-10 codes, medicine progress notes, and psychiatry progress notes. Glycemic relapse was defined as > 1% increase in HbA1c from the lowest HbA1c within 1 year of being followed by the RN CDE/PharmD clinic (nadir).
Veterans were included in the study if they were aged ≥ 18 years, referred to the RN CDE/PharmD clinic from January 1, 2011 to December 31, 2014, had at least 2 clinic visits, an HbA1c > 8% at the date of the first clinic visit, and at least 1 HbA1c test at baseline and 1 HbA1c test at least 2 months after referral to the clinic. Veterans were excluded from the study if they met the following criteria: diagnosed with SMI during the study period, followed by the RN CDE or PharmD in other primary care clinics prior to referral, followed by the PharmD clinic within 365 days after the initial RN CDE/PharmD clinic visit, referred to or followed by endocrinology, or veterans enrolled in a VA DM research trial. Veterans continued to be enrolled until target enrollment was met.
Medical records were reviewed to capture the following information: demographics (age and gender), type of SMI, date diagnosed with SMI, number of mental health-related visits, antidepressant and antipsychotic use, HbA1c prior to referral to the RN CDE/PharmD clinic (initial HbA1c) and date, HbA1c nadir and date, and highest postnadir HbA1c (glycemic relapse) and date, number of clinic visits, time followed by the clinic, and reason for glycemic relapse.
A total sample size of 100 veterans was needed to determine a medium effect size of 0.25 for between-group treatment effect on veterans with SMI compared with that of veterans without SMI, using a 2-group by 2 time-point repeated measures analysis of variance (ANOVA) with a power of 80% and alpha of 0.05. Of the 100 veterans, 50 veterans in each group were necessary to meet power. The percentage change in mean HbA1c from the initial time point to nadir was analyzed using a 2-time point by 2-group repeated measures ANOVA analysis. The secondary objectives were analyzed using descriptive statistics, a repeated measures ANOVA test to determine the percentage change in mean HbA1c from nadir to relapse, and an independent samples Student t test to analyze time to glycemic relapse.
Results
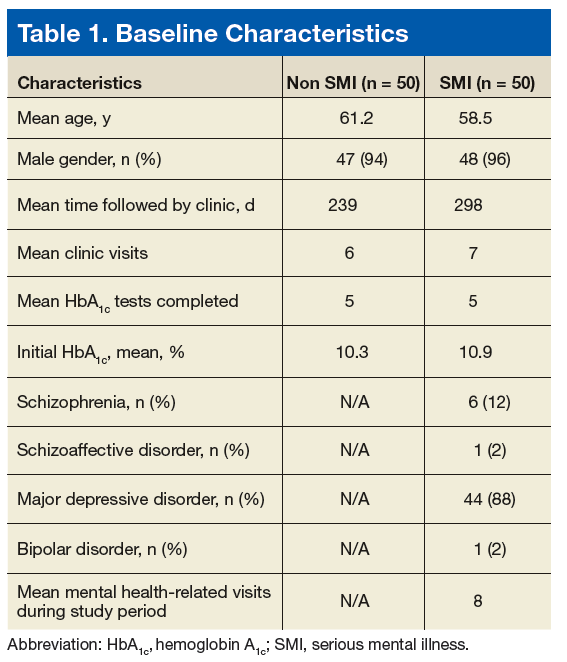
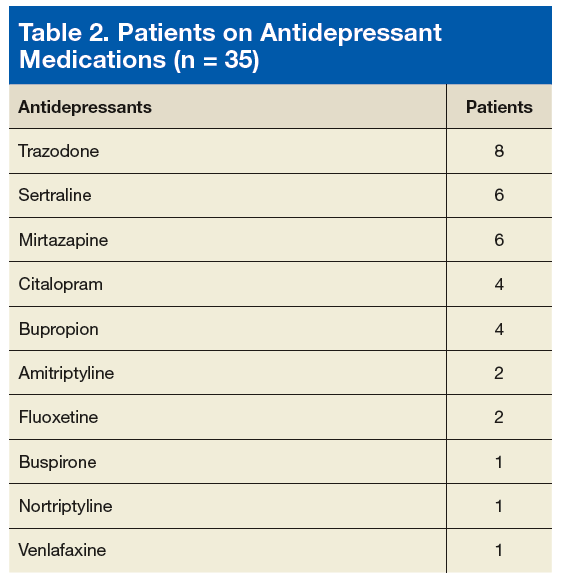
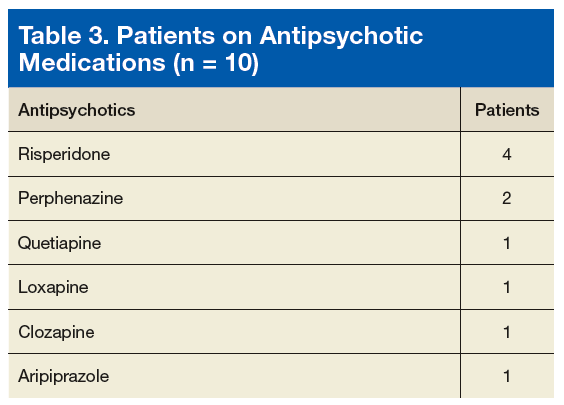
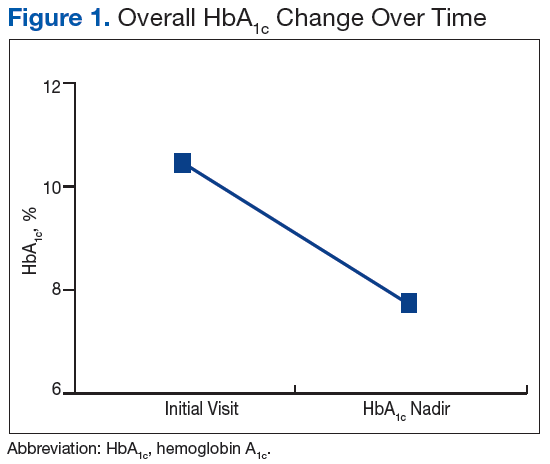
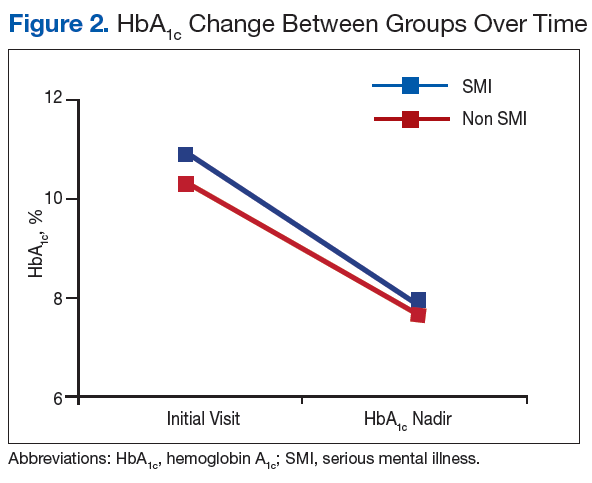
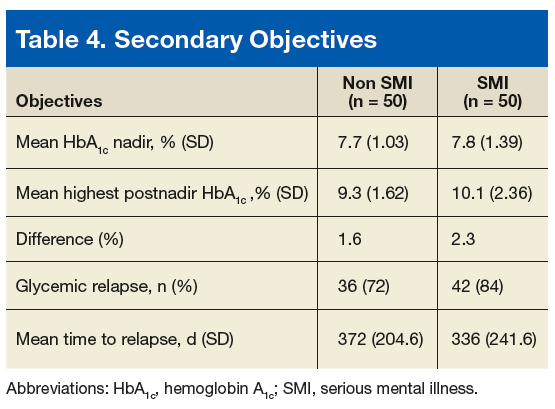
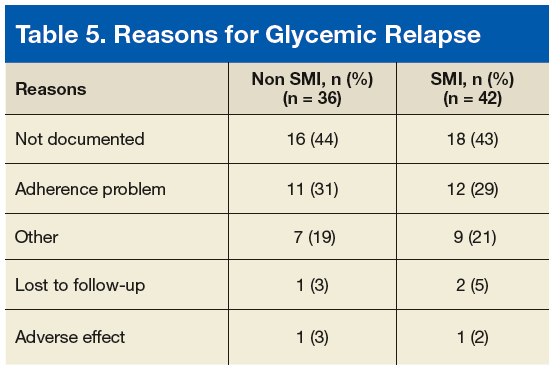
Discussion
Collaborative interventions have improved glycemic control in patients with concurrent SMI and DM. Although there was not a significant difference in mean HbA1c from the initial HbA1c to the nadir HbA1c between study groups, this study provided valuable insight for the RN CDE/PharmD clinic. The mean HbA1c decreased over time in both study groups, demonstrating that the collaborative intervention was effective in improving glycemic control in veterans with SMI and veterans without SMI. The mean HbA1c decrease in the SMI group was slightly higher compared with that of the non-SMI group, but the difference was not significant. The decrease in mean HbA1c also demonstrated that the RN CDE/PharmD interventions were effective in each group. Contrary to this study’s hypothesis that veterans with SMI would have worse glycemic control compared with that of veterans without SMI, this study demonstrated that there was no difference in glycemic control between groups.
Veterans in the SMI group had a significantly greater percentage increase in mean HbA1c postnadir, indicating that their glycemic control worsened postnadir compared with that of the non-SMI group. If veterans with SMI relapsed, they tended to relapse to a greater extent compared with veterans without SMI, as indicated by a larger percentage increase in mean HbA1c. Time to relapse was shorter in veterans with SMI compared with that of veterans without SMI, but the difference was not significant. Using the information gathered, if veterans with SMI relapsed, they tended to relapse sooner and with a greater percentage increase in HbA1c compared with that of veterans without SMI.
Limitations
As a retrospective study, data collection was limited to the information found in the veteran’s EMR: Data collected were dependent on accurate and comprehensive documentation in the veteran’s problem list and progress notes. Additionally, the time between HbA1c tests was not analyzed when determining the differences in mean HbA1c. These data may be helpful in identifying reasons for glycemic relapse. Glycemic relapse depended on the number of HbA1c tests that the veteran completed. Time to glycemic relapse may occur sooner in veterans who completed more frequent HbA1c testing.
Conclusion
There was a significant decrease in mean HbA1c for the entire group over time. In comparing the percentage change in mean HbA1c between groups, there was not a significant difference in the decrease in mean HbA1c from initial to nadir HbA1c in veterans with SMI compared with that of veterans without SMI. However, veterans with SMI had a significantly larger increase in HbA1c postnadir compared with that of veterans without SMI, indicating that support would likely be needed after the veteran achieves his or her HbA1c target. Strategies such as extending the follow-up time in the RN CDE/PharmD clinic, expanding collaborative services with behavioral medicine and psychiatry, additional shared medical appointments or support groups for veterans with DM and SMI, and health literacy assessments may need to be adapted to assist in maintaining glycemic control in veterans with concurrent SMI and DM.
Click here to read the digital edition.
1. Razzano LA, Cook JA, Yost C, et al. Factors associated with co-occurring medical conditions among adults with serious mental disorders. Schizophr Res. 2015;161(2-3):458-464.
2. Lustman PJ, Clouse RE. Depression in diabetic patients: the relationship between mood and glycemic control. J Diabetes Complications. 2005;19(2):113-122.
3. Lustman PJ, Griffith LS, Freeland KE, Clouse RE. The course of major depression in diabetes. Gen Hosp Psychiatry. 1997;19(2):138-143.
4. Cox DJ, Gonder-Fredrick L. Major developments in behavioral diabetes research. J Consult Clin Psychol. 1992;60(4):628-638.
5. Gavard JA, Lustman PJ, Clouse RE. Prevalence of depression in adults with diabetes. An epidemiological evaluation. Diabetes Care. 1993;16(8):1167-1178.
6. Dixon L, Weiden P, Delahanty J, et al. Prevalence and correlates of diabetes in national schizophrenia samples. Schizophr Bull. 2000;26(4):903-912.
7. Desai MM, Rosenheck RA, Druss BG, Perlin JB. Mental disorders and quality of diabetes care in the veterans health administration. Am J Psychiatry. 2002;159(9):1584-1590.
8. American Diabetes Association. Standards of medical care in diabetes—2017. Diabetes Care. 2017;40(suppl 1):S25-S43.
9. Bogner HR, Morales KH, Post EP, Bruce ML. Diabetes, depression, and death: a randomized controlled trial of a depression treatment program for older adults based in primary care (PROSPECT). Diabetes Care. 2007;30(12):3005-3010.
10. Katon WJ, Lin EHB, Von Korff M, et al. Collaborative care for patients with depression and chronic illnesses. N Engl J Med. 2010;363(27):2611-2620.
11. Bogner HR, Morales KH, de Vries HF, Cappola AR. Integrated management of type 2 diabetes mellitus and depression treatment to improve medication adherence: a randomized controlled trial. Ann Fam Med. 2012;10(1):15-22.
12. Huang Y, Wei X, Wu T, Chen R, Guo A. Collaborative care for patients with depression and diabetes mellitus: a systematic review and meta-analysis. BMC Psychiatry. 2013;13(260):1-11.
13. James A, Leciejewski K, Pascuzzi K. Effect on diabetes care by a nurse certified diabetes educator with pharmacist support within a primary care clinic in a Veterans Affairs hospital. Abstract presented at: Ohio College of Clinical Pharmacy Spring Meeting; May 29, 2015; Cleveland, Ohio.
Diabetes mellitus (DM) is considered one of the most psychologically and behaviorally demanding chronic medical conditions. Patients with DM and serious mental illness (SMI), including schizophrenia, schizoaffective disorder, major depressive disorder (MDD), and bipolar disorder, are more likely to have poor adherence to medications as well as poor adherence to diet and lifestyle recommendations, which can lead to poor glycemic control, decreased quality of life, and increased health care expenses.1-4 Up to 27% of patients with DM have a depression diagnosis, and up to 60% of patients with DM experience depressive symptoms.5 Additionally, 1 in 4 patients with schizophrenia have a DM diagnosis.6 Serious mental illness can compromise DM self-management and glycemic control, which increases the risk of DM-related complications.7
These factors combine to make DM self-management essential for optimal glycemic control and prevention of DM-related complications. The American Diabetes Association recommends coordinated management of DM and SMI to achieve DM treatment targets.8 Interventions involving collaborative care teams have assisted in managing patients with concurrent SMI and DM. Collaborative interventions have reduced all-cause mortality, increased the number of patients reaching hemoglobin A1c (HbA1c) targets, increased overall improvement in HbA1c, increased rates of depression remission, and increased medication adherence.9-12
Background
Collaborative interventions have improved glycemic control in patients with concurrent SMI and DM. A study by Desai and colleagues examined the relationship between psychiatric disorders and the quality of DM care in a national sample of veterans.7 Data were collected using chart-abstracted quality data from administrative database records for a sample of veterans with DM who had at least 3 outpatient visits in the previous year (n = 38,020). About 25% of the sample had a diagnosed psychiatric disorder, 91.5% of veterans completed an HbA1c test, and most veterans with a psychiatric disorder completed the 5 quality indicators for DM care (foot inspection, HbA1c determination, pedal pulses examination, foot sensory examination, and retina examination). Veterans with psychiatric disorders did not have a poorer quality of care for secondary prevention of DM compared with that of other veterans.7
In the PROSPECT study (Prevention of Suicide in Primary Care Elderly: Collaborative Trial), a primary care-based depression management program assessed a collaborative intervention to improve care in patients with depression and DM.9 Fifteen depression care managers, including trained social workers, registered nurses (RNs), and psychologists, collaborated with primary care physicians (PCPs) to assist in recognizing depression, offer guideline-based treatment recommendations, and provide algorithm-based care, monitoring, and follow-up. After a median follow-up of 52 months, patients with depression and DM in the intervention group were less likely to die during the 5-year follow-up period compared with those in usual care (adjusted hazard ratio, 0.49 [95% confidence interval (CI), 0.24-0.98]). The study authors concluded that integrated depression care management significantly reduced all-cause mortality in patients with depression and DM.9
A single-blind, randomized, controlled trial conducted by Katon and colleagues examined patients with poorly controlled DM, coronary artery disease (CAD), or both, and concurrent depression in 14 primary care clinics (n = 214).10 The intervention consisted of nurse care managers who were trained RNs with experience in DM education and supervised by PCPs, providing guideline-based, collaborative care over 12 months to improve glycemic control, blood pressure (BP), and lipid control. The nurse care managers followed up with patients every 2 to3 weeks at office visits, and the intervention was compared with usual care by a physician. At 12 months, patients in the intervention group had significant improvement in HbA1c, low-density lipoprotein cholesterol, systolic BP, and depression compared with that of those under usual care. At 12 months, the HbA1c in the patients in the intervention group was significantly improved with an overall percentage change of 0.81 compared with 0.23 in the usual care group (estimated between-group difference, -0.56 [95% CI, -0.85 to -0.27]). The study authors concluded that integrated management and proactive follow-up of medical and psychological illnesses improved both medical outcomes and depression in patients with DM, CAD, or both.10
Another study by Bogner and colleagues investigated an integrated care intervention for patients with depression and DM to improve adherence to antidepressant and antidiabetic medications, glycemic control, and depression remission.11 Two trained research coordinators (a bachelor’s level and a master’s level) administered all intervention activities. The integrated care managers collaborated with physicians, offering education and guideline-based treatment recommendations to patients to monitor medication adherence and clinical status. The intervention supplemented regular primary care follow-up visits and was compared with usual care. At 12 weeks, patients in the integrated care group were more likely to achieve an HbA1c < 7% (60.9% vs 35.7%; P < .001) and remission of depression (58.7% vs 30.7%; P < .001) compared with those in usual care. There also was a significant improvement in adherence to DM and antidepressant medications in the intervention group compared with those in usual care during the study period.11
A systematic review and meta-analysis by Huang and colleagues assessed randomized controlled trials of collaborative care for diabetic patients with depression.12 Trials that reported depression treatment response, depression remission, HbA1c values, and adherence to antidepressant and/or hypoglycemic medications were included. A total of 8 trials randomized 2,238 patients with concurrent depression and DM and compared collaborative care with usual care. Collaborative care was associated with a significant increase in depression treatment response, reduction in HbA1c, and significant improvement in adherence rates for antidepressant and hypoglycemic medications compared with that of usual care. A reduction in HbA1c favored the collaborative care group; however, this reduction was not significant (mean difference, -0.13 [95% CI, -0.46 to 0.19]; P = .08 for heterogeneity; I2 = 51%). The study authors concluded that a collaborative care model significantly improved depression outcomes and adherence to medications in patients with concurrent DM and depression and recommended continued collaborative care for this population.12
Methods
The current study examines a novel service involving the collaboration of a registered nurse-certified DM educator (RN CDE) and clinical pharmacy specialist (PharmD) to improve access to care and maximize DM outcomes. The Louis Stokes Cleveland VAMC defines the PharmD scope of practice. One of the pharmacist’s clinical obligations includes serving as a preceptor for the RN CDE, a collaboration that has not been investigated in previous studies. A primary care provider (PCP) refers veterans to the RN CDE/PharmD clinic, with HbA1c ≥ 8%.
The RN CDE/PharmD clinic tends to receive referrals for the most challenging veterans who may have very elevated HbA1c readings, complex multidrug regimens, or basal/bolus insulin regimens. The RN CDE sees veterans in individual appointments and takes manual BP readings, checks point-of-care glucose/HbA1c readings, downloads home glucometer results into the electronic medical record (EMR), and provides education on DM management specific to the veteran’s individual needs. Because there is no established treatment algorithm for the RN CDE to follow, all medication changes are determined by a preceptor in real time.
When the RN CDE clinic was established, the RN CDE presented veterans to their PCP who determined the veteran’s plan of care. However, this plan was frustrating for the RN CDE because the PCP was not always readily available, causing delays in the workflow of the RN CDE clinic. Since the PharmD has a scope of practice and is more frequently available to discuss veteran cases, RN CDE/PharmD collaboration was initiated. Based on information gathered during the appointment, medication additions, titrations, and changes are precepted with the PharmD. Veterans can be seen in clinic every 2 to 4 weeks, allowing for continued medication adjustments if warranted until their HbA1c target is achieved. Veterans are discharged to their PCP once their HbA1c is at target.
Within the primary care clinic, this service was compared with usual care by a PCP and was associated with a clinically significant reduction in HbA1c by 2.5% compared with usual care after 1 year (P < .001).13 The same study population was investigated to determine whether there was a difference in glycemic control between veterans with SMI compared with veterans without SMI (non-SMI) to provide insight and better support for veterans with SMI and their DM care.
A retrospective review of the veterans referred to the RN CDE/PharmD clinic from January 1, 2011 to December 31, 2014 was performed with institutional review board approval. Veterans were identified using a pharmacy-generated list searching for clinic note titles from the Computerized Patient Record System (CPRS).
The primary objective of this study was to determine the percentage change in mean HbA1c in veterans with SMI compared with that of veterans without SMI after referral to the RN CDE/PharmD clinic. The following secondary objectives also were investigated: the difference in the percentage of veterans with glycemic relapse after the intervention in veterans with SMI compared with that of veterans without SMI, and the difference in time to glycemic relapse between veterans with SMI compared with that of veterans without SMI. Serious mental illness was defined as schizophrenia, schizoaffective disorder, bipolar disorder, and MDD and identified in CPRS using ICD-9 and ICD-10 codes, medicine progress notes, and psychiatry progress notes. Glycemic relapse was defined as > 1% increase in HbA1c from the lowest HbA1c within 1 year of being followed by the RN CDE/PharmD clinic (nadir).
Veterans were included in the study if they were aged ≥ 18 years, referred to the RN CDE/PharmD clinic from January 1, 2011 to December 31, 2014, had at least 2 clinic visits, an HbA1c > 8% at the date of the first clinic visit, and at least 1 HbA1c test at baseline and 1 HbA1c test at least 2 months after referral to the clinic. Veterans were excluded from the study if they met the following criteria: diagnosed with SMI during the study period, followed by the RN CDE or PharmD in other primary care clinics prior to referral, followed by the PharmD clinic within 365 days after the initial RN CDE/PharmD clinic visit, referred to or followed by endocrinology, or veterans enrolled in a VA DM research trial. Veterans continued to be enrolled until target enrollment was met.
Medical records were reviewed to capture the following information: demographics (age and gender), type of SMI, date diagnosed with SMI, number of mental health-related visits, antidepressant and antipsychotic use, HbA1c prior to referral to the RN CDE/PharmD clinic (initial HbA1c) and date, HbA1c nadir and date, and highest postnadir HbA1c (glycemic relapse) and date, number of clinic visits, time followed by the clinic, and reason for glycemic relapse.
A total sample size of 100 veterans was needed to determine a medium effect size of 0.25 for between-group treatment effect on veterans with SMI compared with that of veterans without SMI, using a 2-group by 2 time-point repeated measures analysis of variance (ANOVA) with a power of 80% and alpha of 0.05. Of the 100 veterans, 50 veterans in each group were necessary to meet power. The percentage change in mean HbA1c from the initial time point to nadir was analyzed using a 2-time point by 2-group repeated measures ANOVA analysis. The secondary objectives were analyzed using descriptive statistics, a repeated measures ANOVA test to determine the percentage change in mean HbA1c from nadir to relapse, and an independent samples Student t test to analyze time to glycemic relapse.
Results
Discussion
Collaborative interventions have improved glycemic control in patients with concurrent SMI and DM. Although there was not a significant difference in mean HbA1c from the initial HbA1c to the nadir HbA1c between study groups, this study provided valuable insight for the RN CDE/PharmD clinic. The mean HbA1c decreased over time in both study groups, demonstrating that the collaborative intervention was effective in improving glycemic control in veterans with SMI and veterans without SMI. The mean HbA1c decrease in the SMI group was slightly higher compared with that of the non-SMI group, but the difference was not significant. The decrease in mean HbA1c also demonstrated that the RN CDE/PharmD interventions were effective in each group. Contrary to this study’s hypothesis that veterans with SMI would have worse glycemic control compared with that of veterans without SMI, this study demonstrated that there was no difference in glycemic control between groups.
Veterans in the SMI group had a significantly greater percentage increase in mean HbA1c postnadir, indicating that their glycemic control worsened postnadir compared with that of the non-SMI group. If veterans with SMI relapsed, they tended to relapse to a greater extent compared with veterans without SMI, as indicated by a larger percentage increase in mean HbA1c. Time to relapse was shorter in veterans with SMI compared with that of veterans without SMI, but the difference was not significant. Using the information gathered, if veterans with SMI relapsed, they tended to relapse sooner and with a greater percentage increase in HbA1c compared with that of veterans without SMI.
Limitations
As a retrospective study, data collection was limited to the information found in the veteran’s EMR: Data collected were dependent on accurate and comprehensive documentation in the veteran’s problem list and progress notes. Additionally, the time between HbA1c tests was not analyzed when determining the differences in mean HbA1c. These data may be helpful in identifying reasons for glycemic relapse. Glycemic relapse depended on the number of HbA1c tests that the veteran completed. Time to glycemic relapse may occur sooner in veterans who completed more frequent HbA1c testing.
Conclusion
There was a significant decrease in mean HbA1c for the entire group over time. In comparing the percentage change in mean HbA1c between groups, there was not a significant difference in the decrease in mean HbA1c from initial to nadir HbA1c in veterans with SMI compared with that of veterans without SMI. However, veterans with SMI had a significantly larger increase in HbA1c postnadir compared with that of veterans without SMI, indicating that support would likely be needed after the veteran achieves his or her HbA1c target. Strategies such as extending the follow-up time in the RN CDE/PharmD clinic, expanding collaborative services with behavioral medicine and psychiatry, additional shared medical appointments or support groups for veterans with DM and SMI, and health literacy assessments may need to be adapted to assist in maintaining glycemic control in veterans with concurrent SMI and DM.
Click here to read the digital edition.
1. Razzano LA, Cook JA, Yost C, et al. Factors associated with co-occurring medical conditions among adults with serious mental disorders. Schizophr Res. 2015;161(2-3):458-464.
2. Lustman PJ, Clouse RE. Depression in diabetic patients: the relationship between mood and glycemic control. J Diabetes Complications. 2005;19(2):113-122.
3. Lustman PJ, Griffith LS, Freeland KE, Clouse RE. The course of major depression in diabetes. Gen Hosp Psychiatry. 1997;19(2):138-143.
4. Cox DJ, Gonder-Fredrick L. Major developments in behavioral diabetes research. J Consult Clin Psychol. 1992;60(4):628-638.
5. Gavard JA, Lustman PJ, Clouse RE. Prevalence of depression in adults with diabetes. An epidemiological evaluation. Diabetes Care. 1993;16(8):1167-1178.
6. Dixon L, Weiden P, Delahanty J, et al. Prevalence and correlates of diabetes in national schizophrenia samples. Schizophr Bull. 2000;26(4):903-912.
7. Desai MM, Rosenheck RA, Druss BG, Perlin JB. Mental disorders and quality of diabetes care in the veterans health administration. Am J Psychiatry. 2002;159(9):1584-1590.
8. American Diabetes Association. Standards of medical care in diabetes—2017. Diabetes Care. 2017;40(suppl 1):S25-S43.
9. Bogner HR, Morales KH, Post EP, Bruce ML. Diabetes, depression, and death: a randomized controlled trial of a depression treatment program for older adults based in primary care (PROSPECT). Diabetes Care. 2007;30(12):3005-3010.
10. Katon WJ, Lin EHB, Von Korff M, et al. Collaborative care for patients with depression and chronic illnesses. N Engl J Med. 2010;363(27):2611-2620.
11. Bogner HR, Morales KH, de Vries HF, Cappola AR. Integrated management of type 2 diabetes mellitus and depression treatment to improve medication adherence: a randomized controlled trial. Ann Fam Med. 2012;10(1):15-22.
12. Huang Y, Wei X, Wu T, Chen R, Guo A. Collaborative care for patients with depression and diabetes mellitus: a systematic review and meta-analysis. BMC Psychiatry. 2013;13(260):1-11.
13. James A, Leciejewski K, Pascuzzi K. Effect on diabetes care by a nurse certified diabetes educator with pharmacist support within a primary care clinic in a Veterans Affairs hospital. Abstract presented at: Ohio College of Clinical Pharmacy Spring Meeting; May 29, 2015; Cleveland, Ohio.
Bolus Insulin Prescribing Recommendations for Patients With Type 2 Diabetes Mellitus (FULL)
Individuals with type 2 diabetes mellitus (T2DM) spend between 5 and 10 years with elevated hemoglobin A1c (HbA1c) before initiation of insulin.1 Once the basal insulin is initiated, the patient can go years with only adjustment of the basal insulin, resulting in over-basalization. In general, the total daily dose (TDD) of insulin should be composed of about 50% basal “background” insulin and 50% bolus “meal” insulin. When the fasting glucose readings are on target but HbA1c is still above the mutually set goal range, postprandial readings need to be evaluated.
This article focuses on initiating and titrating bolus insulin in nonpregnant patients with T2DM. Before initiation of bolus insulin, it is important for the patient to be actively engaged with a diabetes educator for diabetes self-management education and support (DSME/S), including the understanding of the correct use of insulin, carbohydrate counting, and increasing physical activities. Ensuring the correct technique of insulin administration and self-monitoring of blood glucose (SMBG) is critical. A knowledge deficit of carbohydrate information can lead to uncontrolled blood glucose (BG). The authors have encountered numerous times when patients were drinking sugary beverages or consuming large amounts of “healthy” food without realizing the carbohydrate content. Therefore, treatment in concert with a registered dietitian and certified diabetes educator is highly recommended.
Initiation of Bolus Insulin
There are 3 options of postprandial coverage with bolus insulin when a patient is taking basal insulin: basal plus, basal-bolus, or premix insulin. A possible fourth option for postprandial coverage is to add glucagon-like peptide-1 receptor agonist (GLP-1 RA), an injectable noninsulin antihyperglycemic agent, which has shown noninferior efficacy to adding bolus insulin and a favorable effect on weight with less risk of hypoglycemia.2-5 Although it can be expensive, combining GLP-1 RA to basal insulin results in lowering HbA1c of 0.66 up to 1.74% (or lowering mmol/mol of 7 up to 19) from the baseline.6 However, adding bolus insulin may be the only option to avoid glucotoxicity and prevent further diabetes complications when the HbA1c level is well above the goal range. It is usually recommended to discontinue sulfonylurea when bolus insulin is added due to the β-cell exhaustion with advancing natural history of diabetes.7,8
Method 1: Basal Plus
The health care provider (HCP) needs to consider whether the patient is over-basalized when the HbAlc and postprandial BG readings are still not at goal despite careful titration of basal insulin dose to > 0.5 U/kg/d.9 This is the time to discuss with the patient the coverage of mealtime glucose excursions. In the basal plus regimen, the prescribing provider may add 1 bolus insulin injection for the meal with the highest amount of carbohydrates or add 2 bolus injections for the most and second most meals with carbohydrates. Multiple types of bolus insulin are available in the current U.S. market (Table 1).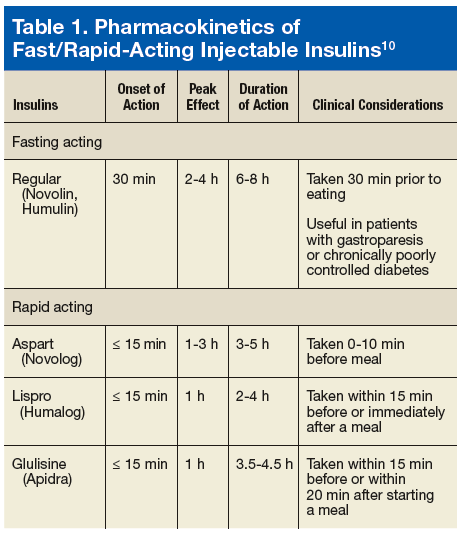
There are 2 ways to add bolus insulin: fixed and flexible. In the fixed regimen, the patient will take the same amount of bolus insulin regardless of premeal BG readings and carbohydrate content of the food. The authors recommend adding bolus insulin of about 4 to 6 units once or twice a day with meals, depending on the number of meals a day, carbohydrate content of the meal, current and desired degree of diabetes control, and physical activities. Another way to calculate a bolus insulin dose is to start at 0.1 U/kg if adding to the basal insulin.10 Flexible regimen allows various bolus doses based on premeal BG, carbohydrate intake, and activities. Information on this regimen, will be discussed more later.
Patient Cases
Tables 2 and 3 describe 2 patient cases. For example, patient 1 weighs 80 kg. If the prescribing HCP and patient decide to add only 1 bolus to the largest carbohydrate meal at dinnertime, then the patient may take 8 units (80 kg × 0.1 U/kg/meal = 8 units for meal). The patient’s current insulin dose, medical comorbidities, current diabetes control status, living situations, and overall cognition also should be considered.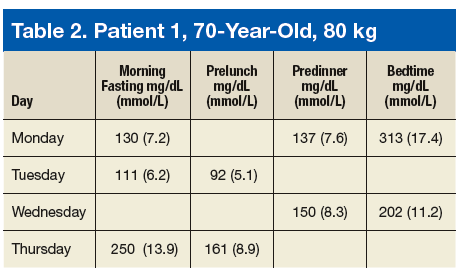
Imagine patient 1 is taking 14 units daily of a long-acting insulin (LAI). If the patient is taking a fairly low dose of LAI, has multiple comorbidities, recent BG log/HgAlc, and lives alone but demonstrates good cognition to follow instructions, the prescriber may consider adding the bolus insulin of 4 units for dinner; thus, the bolus dose is about one-third of total basal insulin dose. However, if the patient is on 40 units of LAI and has symptoms of hyperglycemia, 6 to 8 units for the dinner is reasonable. An important point to convey to this patient is to make sure there is carbohydrate consistency. The patient’s premeal BG was 137 mg/dL (7.6 mmol/L) on Monday, but it rose significantly to 313 mg/dL (17.4 mmol/L) after dinner. On Wednesday, the patient’s premeal BG prior to dinner was 150 mg/dL (8.3 mmol/L); it rose to 202 mg/dL (11.2 mmol/L) after dinner, which is high but not as high as on Monday.
Multiple factors may affect this variability; for example, on Monday the patient may have consumed more than the usual amount of carbohydrates for dinner, forgot to take oral medication for dinner, or missed his/her usual after-dinner walk. Or simply, the patient may have eaten a lot less than the usual amount of carbohydrates, walked the neighborhood, or vacuumed the entire house after dinner on Wednesday. Thus, it is imperative to carefully assess the patient’s lifestyle and recommend carbohydrate consistency at each meal.
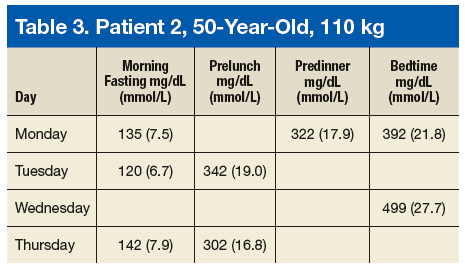
Method 2: Basal-Bolus
When basal plus is insufficient to get the HbA1c and BG readings to goal, taking bolus insulin for all main meals containing carbohydrates must be considered. This is often called basal-bolus, multiple daily injections, or intensive insulin therapy.
In order to understand the concept of basal-bolus, HCPs should consider normal physiology. The pancreas releases a constant amount of insulin, aka background insulin, to cover glucose produced by the liver to the cells between meals. In addition, a burst of insulin, aka bolus insulin, to meet the blood glucose elevation from food to maintain homeostasis. In patients with T2DM, the relative amount produced by the pancreas is insufficient to meet the demand due to pancreatic exhaustion or insulin resistance. This necessitates the need to replace background and bolus insulin.7
The ideal final total bolus insulin amount (the sum of all meal bolus doses) should be about half the basal dosing. Calculation of starting bolus dosing can be done as in the basal plus regimen, either 4 to 6 units per meal or 0.1 U/kg/d.10 Alternatively, if the patient is on 60 units of long-acting analog and BGs are well above goal range, the prescriber could consider about 20 units of bolus dose (60 U divided by 3 meals) if the patient eats 3 routine meals a day with at least 30 g of carbohydrates, and physical activity levels are fairly consistent. If the patient eats the most carbohydrates at lunchtime, consider more bolus at lunch (ie, 18 U of bolus for breakfast and dinner and 24 U of bolus for lunch coverage).
Patients need to separate the time between the bolus doses, usually a minimum of 4 hours apart, to avoid insulin stacking, which is a common reason for hypoglycemia. Insulin stacking occurs when additional quick or rapid insulin is injected when the previous insulin is still in the body or when there is insulin on board.8,11 Typically, bolus analogs stay in the body for about 4 to 6 hours, thus necessitating separation of the doses at least 4 hours apart. Patients sometimes inject more bolus insulin after high postprandial readings, which can result in insulin stacking. In some cases, the patient may misunderstand and take mealtime insulin at a scheduled time instead of at the time of the meal.
Injecting bolus insulin for every snack must be avoided to prevent a vicious cycle: Postprandial hyperglycemia –> extra bolus insulin, resulting in insulin stacking –> hypoglycemia –> overtreatment with food –> hyperglycemia –> extra bolus insulin, resulting in insulin stacking –> and so on. Whenever there are readings in the hypoglycemic and hyperglycemic range, address hypoglycemia first because hyperglycemia often is due to overtreatment of hypoglycemia.
Method 3: Premix or Split-Mix (Patient-Mix) Insulin
Postprandial BG excursions can be minimized by changing basal insulin to premix or split-mix (patient-mix) insulin that has a mixture of mealtime and intermediate action insulin (Table 4).12-16 The use of premixed insulin is a viable option due to its ease of use and for those who have restrictions based on the complexity of the basal-bolus regimen.7 If a patient has routine meals and prefers not to carry around insulin for lunch, the schedule of premix insulin taken at breakfast and dinner is ideal.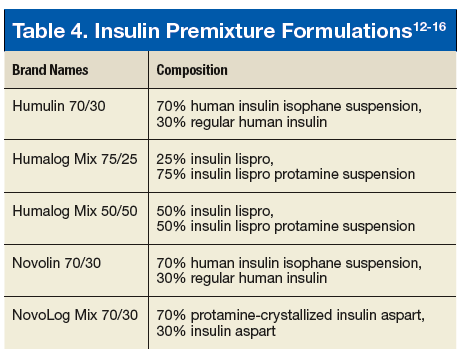
Some caveats for safe prescribing should be understood. A recent summary of premixed insulin regimens noted that they seem to have a similar efficacy and safety profile compared with regimens that include basal insulin with or without mealtime insulin; however, cost and patient adherence are improved.17 It is important to monitor insulin-naïve patients for hypoglycemia and reduced efficacy when used twice daily compared with basal plus 3-times daily prandial insulin in patients needing insulin intensification.17
A randomized trial noted that hypoglycemia rates were twice as high with premixed insulin compared with basal-bolus insulin.18 This study also noted that the premixed insulin group experienced the highest dropout rate, partly due to hypoglycemia. A regimen of basal insulin with the option to add a single prandial insulin injection at the main meal was as effective in reducing HbA1c with less hypoglycemia. The premixed insulin is convenient but does not allow a separate correction of either mealtime or intermediate-acting insulin doses. If the premixed dose needs to be adjusted due to fasting hyperglycemia > 180 mg/dL(10.0 mmol/L), the TDD can be increased by 10%.2
In contrast, a split-mix (patient-mix) insulin regimen allows for the ability to vary the amount/ratio of combinations and adjustment of bolus and intermediate insulin doses. The disadvantages of split-mix insulin include the inconvenience of manually mixing of insulin and the potential for dosing errors. The patient needs to be taught additional steps on how to mix both insulins. Ensure the correct mixing order to maintain insulin potency; regular first, then neutral protamine Hagedorn (NPH). An HCP should remember the RN acronym if the patient is combining regular insulin and NPH. If there is doubt about the patient’s insulin injection technique, HCPs should ask the patient to demonstrate how to correctly pull up a dose of normal saline and inject it during a clinic visit. The only basal insulin that can be physically mixed with quick or rapid insulin is NPH. It should never be mixed with long-acting analogs. The patient should not even use the same syringe to draw up bolus analog insulin and inject it and then use the same syringe to draw up long-acting analog insulin.
One caveat to a fixed regimen (same amount of insulin dose) is that providers often expect that the patient will eat a consistent amount of carbohydrates at each meal and premeal glucose readings are fairly stable. Oftentimes, this is not true. If a patient took a bolus dose of 8 units of rapid-acting insulin and ate a 6 oz steak, 3 oz baked potato, steamed broccoli at a dinner; and no bread, the after dinner BG might register 145 mg/dL (8.1 mmol/L). Then, the next day for dinner, if he or she took the same amount of 8 units of rapid-acting insulin and ate 1 cup of spaghetti, ½ cup of spaghetti meat sauce, and 2 slices of garlic bread, the after dinner reading might be 322 mg/dL (17.9 mmol/L). The patient’s BG was higher on the second day because of the higher carbohydrate content of the meal. If the rapid-acting insulin was increased to 12 units of bolus based on the high carbohydrate meal and the patient ate a lower carbohydrate meal, hypoglycemia could ensue. Thus, it is important to work with the patient regarding the consumption of a consistent amount of carbohydrates and refer to a registered dietitian for carbohydrate consistency.
For the flexible regimen, the prescriber may consider using an insulin to carbohydrate (IC) ratio and sensitivity factor (SF), also called sliding scale or correction factor. The IC ratio represents how much insulin is needed to cover consumed carbohydrates. For instance, if the patient uses IC ratio of 1:15, 1 unit of bolus insulin will cover 15 g of carbohydrates. If the patient eats a meal with 60 g of carbohydrates and is using IC ratio of 1:15, the patient will inject 4 units of bolus insulin. Sensitivity factor represents how much BG will be lowered in mg/dL by taking 1 unit of bolus insulin. For example, if the patient uses SF of 1:50, 1 unit of bolus insulin will lower BG by 50 mg/dL (2.8 mmol/L). When the desired (target) BG reading is 100 mg/dL (5.6 mmol/L) and the patient’s current BG is 200 mg/dL (11.1 mmol/L), the patient will divide 100 mg/dL (5.6 mmol/L) by 50 (derived from SF of 1:50). The net result is 2 units of bolus insulin are needed to lower BG by 100 mg/dL (5.6 mmol/L). If the premeal BG is 200 mg/dL (11.1 mmol/L) and 60 g of carbohydrates are eaten, then the patient will need a total of 6 units (4 U for carbohydrate and 2 U for high BG) bolus before the meal. For additional information, readers are encouraged to read the articles by Petznick and by Joslin Diabetes Center for IC and SF.19,20
Bolus Insulin Titration
When the difference in BG readings before and 2 hours after a meal, called the Δ value, is > 50 mg/dL (2.8 mmol/L), the bolus insulin may need to be adjusted after ensuring the patient is ingesting consistent carbohydrates and performs the usual amount of activities around mealtime. For example, if the premeal reading was 130 mg/dL (7.2 mmol/L) but the 2-hour postprandial reading is > 180 mg/dL (10.0 mmol/L), the prescriber can increase the mealtime insulin by 1 unit if the mealtime insulin is < 10 units, by 2 units if < 20 units, or by 10% of the mealtime insulin dose. If the premeal BG is < 80 mg/dL (4.4 mmol/L) and the drop in BG is > Δ value of 50 mg/dL (2.8 mmol/L), the prescriber can decrease the mealtime insulin using the same calculation. Monitoring BG and titration recommendations are shown in Table 5. When adjusting the bolus insulin dose, it is best to make adjustments gradually rather than making several changes at once.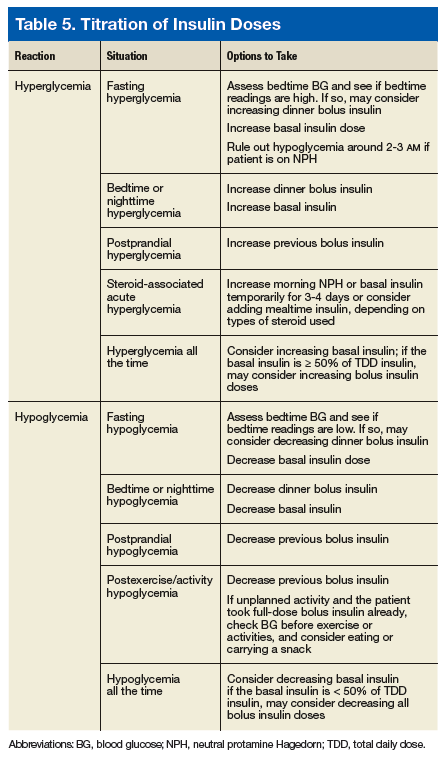
The 15/15 rule needs to be followed in cases involving hypoglycemia.21 When the BG is ≤ 70 mg/dL (3.9 mmol/L) and the patient is conscious and able to eat or drink, it is recommended they eat 15 g (30 g if BG is below 50) of carbohydrates then repeat BG check every 15 minutes until the BG is in the target range.22,23 If the patient is unconscious, providers should administer glucagon (if available), place the patient in a lateral position to avoid aspiration, and call 911. If hyperkalemia is an issue in chronic kidney disease, patients should consume apple juice rather than orange juice due to its lower potassium content. If the patient is taking α glucosidase inhibitors (AGI) like acarbose or miglitol, only pure glucose like glucose tablets needs to be given to treat hypoglycemia instead of regular soda or candy, as the AGI will slow absorption of other types of carbohydrates.24,25 After the severe hypoglycemic episode, it is imperative to assess for the cause and explore ways to prevent subsequent hypoglycemia. Providers also should advise the patient to wear medical emergency identification.
Conclusion
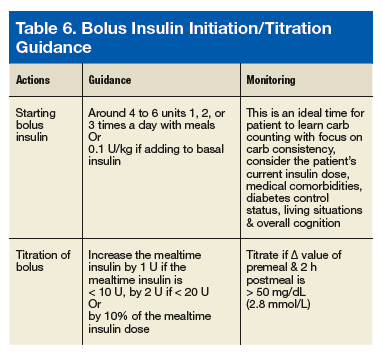
Click here to read the digital edition.
1. Brown JB, Nichols GA, Perry A. The burden of treatment failure in type 2 diabetes. Diabetes Care. 2004;27(7):1535-1540.
2. American Association of Clinical Endocrinologists. AACE/ACE comprehensive type 2 diabetes management algorithm 2017. https://www.aace.com/publications/algorithm. Accessed August 24, 2017.
3. American Diabetes Association. Standards of medical care in diabetes—2016: summary of revisions. Diabetes Care. 2016;39(suppl 1):S4-S5.
4. Diamant M, Nauck MA, Shaginian R, et al; 4B Study Group. Glucagon-like peptide 1 receptor agonist or bolus insulin with optimized basal insulin in type 2 diabetes. Diabetes Care. 2014;37(10):2763-2773.
5. Rosenstock J, Fonseca VA, Gross JL, et al; Harmony 6 Study Group. Advancing basal insulin replacement in type 2 diabetes inadequately controlled with insulin glargine plus oral agents: a comparison of adding albiglutide, a weekly GLP-1 receptor agonist, versus thrice-daily prandial insulin lispro. Diabetes Care. 2014;37(8):2317-2325.
6. Vora J. Combining incretin-based therapies with insulin: realizing the potential in type 2 diabetes. Diabetes Care. 2013;36(suppl 2):S226-S232.
7. Inzucchi SE, Bergenstal RM, Buse JB, et al. Management of hyperglycemia in type 2 diabetes, 2015: a patient-centered approach: update to a position statement of the American Diabetes Association and the European Association for the study of diabetes. Diabetes Care. 2015;38(1):140-149.
8. McCulloch DK. Insulin therapy in type 2 diabetes mellitus. http://www.uptodate.com/contents/insulin-therapy-in-type-2-diabetes-mellitus?source=machineLearning&search=insulin+on+board&selectedTitle=3%7E150§ionRank=5&anchor=H24#H1331866. Updated July, 21, 2017. Accessed August 24, 2017.
9. Guthrie D, Guthrie R. Management of Diabetes Mellitus: A Guide to the Pattern Approach. 6th ed. New York, NY: Springer Publishing Co; 2008.
10. Presswala L, Shubrook J. What to do after basal insulin: 3 Tx strategies for type 2 diabetes. J Fam Pract. 2015;64(4):214-220.
11. McCulloch DK. Management of blood glucose in adults with type 1 diabetes mellitus. http://www.uptodate.com/contents/management-of-blood-glucose-in-adults -with-type-1-diabetes-mellitus?source=machineLearning&search=insulin+injection+frequency&selectedTitle=7%7E150§ionRank=1&anchor=H17221321#H17221321. Updated July 21, 2017. Accessed August 24, 2017.
12. Humulin 70/30. [package insert]. Indianapolis, IN: Eli Lilly and Co; 2017.
13. Humalog Mix 75/25. [package insert]. Indianapolis, IN: Eli Lilly and Co; 2017.
14. Humalog Mix 50/50. [package insert]. Indianapolis, IN: Eli Lilly and Co; 2017.
15. Novolin 70/30. [package insert]. Plainsboro, NJ: Novo Nordisk Inc; 2016.
16. Novolog Mix 70/30. [package insert]. Plainsboro, NJ: Novo Nordisk Inc; 2017.
17. Tsapas A, Karagiannis T, Bekiari E. Premixed insulin regimens for type 2 diabetes. Endocrine. 2016;51(3):387-389.
18. Riddle MC, Rosenstock J, Vlajnic A, Gao L. Randomized, 1-year comparison of three ways to initiate and advance insulin for type 2 diabetes: twice-daily premixed insulin versus basal insulin with either basal-plus one prandial insulin or basal-bolus up to three prandial injections. Diabetes Obes Metab. 2014;16(5):396-402.
19. Petznick A. Insulin management of type 2 diabetes mellitus. Am Fam Physician. 2011;84(2):183-190.
20. Joslin Diabetes Center. Dosing insulin. http://www.joslin.org/info/dosing-insulin.html. Accessed September 8, 2017.
21. National Institutes of Health. 15-15 rule. https://medlineplus.gov/ency/imagepages/19815.htm. Updated April 15, 2017. Accessed September 3, 2017.
22. University of Michigan Comprehensive Diabetes Center. Diabetes: low blood sugar. http://www.med.umich.edu/1libr/MEND/Diabetes-Hypoglycemia.pdf. Revised July 2017. Accessed September 3, 2017.
23. Diabetes Research Institute, University of Miami. Low blood sugar: hypoglycemia. http://www.diabetesresearch.org/document.doc?id=275. Accessed August 29, 2017.24. Cavanaugh KL. Diabetes management issues for patients with chronic kidney disease. Clin Diabetes. 2007;25(3):90-97.
25. National Institute of Diabetes and Digestive and Kidney Diseases. Low blood glucose (hypoglycemia). http://www.niddk.nih.gov/health-information/health-topics/Diabetes/hypoglycemia/Pages/index.aspx. Accessed August 29, 2017.
26. Deakin TA, McShane CE,Cade JE, Williams R. Group based training for self-management strategies in people with type 2 diabetes mellitus. Cochrane Database Syst Rev. 2005;(2): CD003417.
Individuals with type 2 diabetes mellitus (T2DM) spend between 5 and 10 years with elevated hemoglobin A1c (HbA1c) before initiation of insulin.1 Once the basal insulin is initiated, the patient can go years with only adjustment of the basal insulin, resulting in over-basalization. In general, the total daily dose (TDD) of insulin should be composed of about 50% basal “background” insulin and 50% bolus “meal” insulin. When the fasting glucose readings are on target but HbA1c is still above the mutually set goal range, postprandial readings need to be evaluated.
This article focuses on initiating and titrating bolus insulin in nonpregnant patients with T2DM. Before initiation of bolus insulin, it is important for the patient to be actively engaged with a diabetes educator for diabetes self-management education and support (DSME/S), including the understanding of the correct use of insulin, carbohydrate counting, and increasing physical activities. Ensuring the correct technique of insulin administration and self-monitoring of blood glucose (SMBG) is critical. A knowledge deficit of carbohydrate information can lead to uncontrolled blood glucose (BG). The authors have encountered numerous times when patients were drinking sugary beverages or consuming large amounts of “healthy” food without realizing the carbohydrate content. Therefore, treatment in concert with a registered dietitian and certified diabetes educator is highly recommended.
Initiation of Bolus Insulin
There are 3 options of postprandial coverage with bolus insulin when a patient is taking basal insulin: basal plus, basal-bolus, or premix insulin. A possible fourth option for postprandial coverage is to add glucagon-like peptide-1 receptor agonist (GLP-1 RA), an injectable noninsulin antihyperglycemic agent, which has shown noninferior efficacy to adding bolus insulin and a favorable effect on weight with less risk of hypoglycemia.2-5 Although it can be expensive, combining GLP-1 RA to basal insulin results in lowering HbA1c of 0.66 up to 1.74% (or lowering mmol/mol of 7 up to 19) from the baseline.6 However, adding bolus insulin may be the only option to avoid glucotoxicity and prevent further diabetes complications when the HbA1c level is well above the goal range. It is usually recommended to discontinue sulfonylurea when bolus insulin is added due to the β-cell exhaustion with advancing natural history of diabetes.7,8
Method 1: Basal Plus
The health care provider (HCP) needs to consider whether the patient is over-basalized when the HbAlc and postprandial BG readings are still not at goal despite careful titration of basal insulin dose to > 0.5 U/kg/d.9 This is the time to discuss with the patient the coverage of mealtime glucose excursions. In the basal plus regimen, the prescribing provider may add 1 bolus insulin injection for the meal with the highest amount of carbohydrates or add 2 bolus injections for the most and second most meals with carbohydrates. Multiple types of bolus insulin are available in the current U.S. market (Table 1).
There are 2 ways to add bolus insulin: fixed and flexible. In the fixed regimen, the patient will take the same amount of bolus insulin regardless of premeal BG readings and carbohydrate content of the food. The authors recommend adding bolus insulin of about 4 to 6 units once or twice a day with meals, depending on the number of meals a day, carbohydrate content of the meal, current and desired degree of diabetes control, and physical activities. Another way to calculate a bolus insulin dose is to start at 0.1 U/kg if adding to the basal insulin.10 Flexible regimen allows various bolus doses based on premeal BG, carbohydrate intake, and activities. Information on this regimen, will be discussed more later.
Patient Cases
Tables 2 and 3 describe 2 patient cases. For example, patient 1 weighs 80 kg. If the prescribing HCP and patient decide to add only 1 bolus to the largest carbohydrate meal at dinnertime, then the patient may take 8 units (80 kg × 0.1 U/kg/meal = 8 units for meal). The patient’s current insulin dose, medical comorbidities, current diabetes control status, living situations, and overall cognition also should be considered.
Imagine patient 1 is taking 14 units daily of a long-acting insulin (LAI). If the patient is taking a fairly low dose of LAI, has multiple comorbidities, recent BG log/HgAlc, and lives alone but demonstrates good cognition to follow instructions, the prescriber may consider adding the bolus insulin of 4 units for dinner; thus, the bolus dose is about one-third of total basal insulin dose. However, if the patient is on 40 units of LAI and has symptoms of hyperglycemia, 6 to 8 units for the dinner is reasonable. An important point to convey to this patient is to make sure there is carbohydrate consistency. The patient’s premeal BG was 137 mg/dL (7.6 mmol/L) on Monday, but it rose significantly to 313 mg/dL (17.4 mmol/L) after dinner. On Wednesday, the patient’s premeal BG prior to dinner was 150 mg/dL (8.3 mmol/L); it rose to 202 mg/dL (11.2 mmol/L) after dinner, which is high but not as high as on Monday.
Multiple factors may affect this variability; for example, on Monday the patient may have consumed more than the usual amount of carbohydrates for dinner, forgot to take oral medication for dinner, or missed his/her usual after-dinner walk. Or simply, the patient may have eaten a lot less than the usual amount of carbohydrates, walked the neighborhood, or vacuumed the entire house after dinner on Wednesday. Thus, it is imperative to carefully assess the patient’s lifestyle and recommend carbohydrate consistency at each meal.
Method 2: Basal-Bolus
When basal plus is insufficient to get the HbA1c and BG readings to goal, taking bolus insulin for all main meals containing carbohydrates must be considered. This is often called basal-bolus, multiple daily injections, or intensive insulin therapy.
In order to understand the concept of basal-bolus, HCPs should consider normal physiology. The pancreas releases a constant amount of insulin, aka background insulin, to cover glucose produced by the liver to the cells between meals. In addition, a burst of insulin, aka bolus insulin, to meet the blood glucose elevation from food to maintain homeostasis. In patients with T2DM, the relative amount produced by the pancreas is insufficient to meet the demand due to pancreatic exhaustion or insulin resistance. This necessitates the need to replace background and bolus insulin.7
The ideal final total bolus insulin amount (the sum of all meal bolus doses) should be about half the basal dosing. Calculation of starting bolus dosing can be done as in the basal plus regimen, either 4 to 6 units per meal or 0.1 U/kg/d.10 Alternatively, if the patient is on 60 units of long-acting analog and BGs are well above goal range, the prescriber could consider about 20 units of bolus dose (60 U divided by 3 meals) if the patient eats 3 routine meals a day with at least 30 g of carbohydrates, and physical activity levels are fairly consistent. If the patient eats the most carbohydrates at lunchtime, consider more bolus at lunch (ie, 18 U of bolus for breakfast and dinner and 24 U of bolus for lunch coverage).
Patients need to separate the time between the bolus doses, usually a minimum of 4 hours apart, to avoid insulin stacking, which is a common reason for hypoglycemia. Insulin stacking occurs when additional quick or rapid insulin is injected when the previous insulin is still in the body or when there is insulin on board.8,11 Typically, bolus analogs stay in the body for about 4 to 6 hours, thus necessitating separation of the doses at least 4 hours apart. Patients sometimes inject more bolus insulin after high postprandial readings, which can result in insulin stacking. In some cases, the patient may misunderstand and take mealtime insulin at a scheduled time instead of at the time of the meal.
Injecting bolus insulin for every snack must be avoided to prevent a vicious cycle: Postprandial hyperglycemia –> extra bolus insulin, resulting in insulin stacking –> hypoglycemia –> overtreatment with food –> hyperglycemia –> extra bolus insulin, resulting in insulin stacking –> and so on. Whenever there are readings in the hypoglycemic and hyperglycemic range, address hypoglycemia first because hyperglycemia often is due to overtreatment of hypoglycemia.
Method 3: Premix or Split-Mix (Patient-Mix) Insulin
Postprandial BG excursions can be minimized by changing basal insulin to premix or split-mix (patient-mix) insulin that has a mixture of mealtime and intermediate action insulin (Table 4).12-16 The use of premixed insulin is a viable option due to its ease of use and for those who have restrictions based on the complexity of the basal-bolus regimen.7 If a patient has routine meals and prefers not to carry around insulin for lunch, the schedule of premix insulin taken at breakfast and dinner is ideal.
Some caveats for safe prescribing should be understood. A recent summary of premixed insulin regimens noted that they seem to have a similar efficacy and safety profile compared with regimens that include basal insulin with or without mealtime insulin; however, cost and patient adherence are improved.17 It is important to monitor insulin-naïve patients for hypoglycemia and reduced efficacy when used twice daily compared with basal plus 3-times daily prandial insulin in patients needing insulin intensification.17
A randomized trial noted that hypoglycemia rates were twice as high with premixed insulin compared with basal-bolus insulin.18 This study also noted that the premixed insulin group experienced the highest dropout rate, partly due to hypoglycemia. A regimen of basal insulin with the option to add a single prandial insulin injection at the main meal was as effective in reducing HbA1c with less hypoglycemia. The premixed insulin is convenient but does not allow a separate correction of either mealtime or intermediate-acting insulin doses. If the premixed dose needs to be adjusted due to fasting hyperglycemia > 180 mg/dL(10.0 mmol/L), the TDD can be increased by 10%.2
In contrast, a split-mix (patient-mix) insulin regimen allows for the ability to vary the amount/ratio of combinations and adjustment of bolus and intermediate insulin doses. The disadvantages of split-mix insulin include the inconvenience of manually mixing of insulin and the potential for dosing errors. The patient needs to be taught additional steps on how to mix both insulins. Ensure the correct mixing order to maintain insulin potency; regular first, then neutral protamine Hagedorn (NPH). An HCP should remember the RN acronym if the patient is combining regular insulin and NPH. If there is doubt about the patient’s insulin injection technique, HCPs should ask the patient to demonstrate how to correctly pull up a dose of normal saline and inject it during a clinic visit. The only basal insulin that can be physically mixed with quick or rapid insulin is NPH. It should never be mixed with long-acting analogs. The patient should not even use the same syringe to draw up bolus analog insulin and inject it and then use the same syringe to draw up long-acting analog insulin.
One caveat to a fixed regimen (same amount of insulin dose) is that providers often expect that the patient will eat a consistent amount of carbohydrates at each meal and premeal glucose readings are fairly stable. Oftentimes, this is not true. If a patient took a bolus dose of 8 units of rapid-acting insulin and ate a 6 oz steak, 3 oz baked potato, steamed broccoli at a dinner; and no bread, the after dinner BG might register 145 mg/dL (8.1 mmol/L). Then, the next day for dinner, if he or she took the same amount of 8 units of rapid-acting insulin and ate 1 cup of spaghetti, ½ cup of spaghetti meat sauce, and 2 slices of garlic bread, the after dinner reading might be 322 mg/dL (17.9 mmol/L). The patient’s BG was higher on the second day because of the higher carbohydrate content of the meal. If the rapid-acting insulin was increased to 12 units of bolus based on the high carbohydrate meal and the patient ate a lower carbohydrate meal, hypoglycemia could ensue. Thus, it is important to work with the patient regarding the consumption of a consistent amount of carbohydrates and refer to a registered dietitian for carbohydrate consistency.
For the flexible regimen, the prescriber may consider using an insulin to carbohydrate (IC) ratio and sensitivity factor (SF), also called sliding scale or correction factor. The IC ratio represents how much insulin is needed to cover consumed carbohydrates. For instance, if the patient uses IC ratio of 1:15, 1 unit of bolus insulin will cover 15 g of carbohydrates. If the patient eats a meal with 60 g of carbohydrates and is using IC ratio of 1:15, the patient will inject 4 units of bolus insulin. Sensitivity factor represents how much BG will be lowered in mg/dL by taking 1 unit of bolus insulin. For example, if the patient uses SF of 1:50, 1 unit of bolus insulin will lower BG by 50 mg/dL (2.8 mmol/L). When the desired (target) BG reading is 100 mg/dL (5.6 mmol/L) and the patient’s current BG is 200 mg/dL (11.1 mmol/L), the patient will divide 100 mg/dL (5.6 mmol/L) by 50 (derived from SF of 1:50). The net result is 2 units of bolus insulin are needed to lower BG by 100 mg/dL (5.6 mmol/L). If the premeal BG is 200 mg/dL (11.1 mmol/L) and 60 g of carbohydrates are eaten, then the patient will need a total of 6 units (4 U for carbohydrate and 2 U for high BG) bolus before the meal. For additional information, readers are encouraged to read the articles by Petznick and by Joslin Diabetes Center for IC and SF.19,20
Bolus Insulin Titration
When the difference in BG readings before and 2 hours after a meal, called the Δ value, is > 50 mg/dL (2.8 mmol/L), the bolus insulin may need to be adjusted after ensuring the patient is ingesting consistent carbohydrates and performs the usual amount of activities around mealtime. For example, if the premeal reading was 130 mg/dL (7.2 mmol/L) but the 2-hour postprandial reading is > 180 mg/dL (10.0 mmol/L), the prescriber can increase the mealtime insulin by 1 unit if the mealtime insulin is < 10 units, by 2 units if < 20 units, or by 10% of the mealtime insulin dose. If the premeal BG is < 80 mg/dL (4.4 mmol/L) and the drop in BG is > Δ value of 50 mg/dL (2.8 mmol/L), the prescriber can decrease the mealtime insulin using the same calculation. Monitoring BG and titration recommendations are shown in Table 5. When adjusting the bolus insulin dose, it is best to make adjustments gradually rather than making several changes at once.
The 15/15 rule needs to be followed in cases involving hypoglycemia.21 When the BG is ≤ 70 mg/dL (3.9 mmol/L) and the patient is conscious and able to eat or drink, it is recommended they eat 15 g (30 g if BG is below 50) of carbohydrates then repeat BG check every 15 minutes until the BG is in the target range.22,23 If the patient is unconscious, providers should administer glucagon (if available), place the patient in a lateral position to avoid aspiration, and call 911. If hyperkalemia is an issue in chronic kidney disease, patients should consume apple juice rather than orange juice due to its lower potassium content. If the patient is taking α glucosidase inhibitors (AGI) like acarbose or miglitol, only pure glucose like glucose tablets needs to be given to treat hypoglycemia instead of regular soda or candy, as the AGI will slow absorption of other types of carbohydrates.24,25 After the severe hypoglycemic episode, it is imperative to assess for the cause and explore ways to prevent subsequent hypoglycemia. Providers also should advise the patient to wear medical emergency identification.
Conclusion
Click here to read the digital edition.
1. Brown JB, Nichols GA, Perry A. The burden of treatment failure in type 2 diabetes. Diabetes Care. 2004;27(7):1535-1540.
2. American Association of Clinical Endocrinologists. AACE/ACE comprehensive type 2 diabetes management algorithm 2017. https://www.aace.com/publications/algorithm. Accessed August 24, 2017.
3. American Diabetes Association. Standards of medical care in diabetes—2016: summary of revisions. Diabetes Care. 2016;39(suppl 1):S4-S5.
4. Diamant M, Nauck MA, Shaginian R, et al; 4B Study Group. Glucagon-like peptide 1 receptor agonist or bolus insulin with optimized basal insulin in type 2 diabetes. Diabetes Care. 2014;37(10):2763-2773.
5. Rosenstock J, Fonseca VA, Gross JL, et al; Harmony 6 Study Group. Advancing basal insulin replacement in type 2 diabetes inadequately controlled with insulin glargine plus oral agents: a comparison of adding albiglutide, a weekly GLP-1 receptor agonist, versus thrice-daily prandial insulin lispro. Diabetes Care. 2014;37(8):2317-2325.
6. Vora J. Combining incretin-based therapies with insulin: realizing the potential in type 2 diabetes. Diabetes Care. 2013;36(suppl 2):S226-S232.
7. Inzucchi SE, Bergenstal RM, Buse JB, et al. Management of hyperglycemia in type 2 diabetes, 2015: a patient-centered approach: update to a position statement of the American Diabetes Association and the European Association for the study of diabetes. Diabetes Care. 2015;38(1):140-149.
8. McCulloch DK. Insulin therapy in type 2 diabetes mellitus. http://www.uptodate.com/contents/insulin-therapy-in-type-2-diabetes-mellitus?source=machineLearning&search=insulin+on+board&selectedTitle=3%7E150§ionRank=5&anchor=H24#H1331866. Updated July, 21, 2017. Accessed August 24, 2017.
9. Guthrie D, Guthrie R. Management of Diabetes Mellitus: A Guide to the Pattern Approach. 6th ed. New York, NY: Springer Publishing Co; 2008.
10. Presswala L, Shubrook J. What to do after basal insulin: 3 Tx strategies for type 2 diabetes. J Fam Pract. 2015;64(4):214-220.
11. McCulloch DK. Management of blood glucose in adults with type 1 diabetes mellitus. http://www.uptodate.com/contents/management-of-blood-glucose-in-adults -with-type-1-diabetes-mellitus?source=machineLearning&search=insulin+injection+frequency&selectedTitle=7%7E150§ionRank=1&anchor=H17221321#H17221321. Updated July 21, 2017. Accessed August 24, 2017.
12. Humulin 70/30. [package insert]. Indianapolis, IN: Eli Lilly and Co; 2017.
13. Humalog Mix 75/25. [package insert]. Indianapolis, IN: Eli Lilly and Co; 2017.
14. Humalog Mix 50/50. [package insert]. Indianapolis, IN: Eli Lilly and Co; 2017.
15. Novolin 70/30. [package insert]. Plainsboro, NJ: Novo Nordisk Inc; 2016.
16. Novolog Mix 70/30. [package insert]. Plainsboro, NJ: Novo Nordisk Inc; 2017.
17. Tsapas A, Karagiannis T, Bekiari E. Premixed insulin regimens for type 2 diabetes. Endocrine. 2016;51(3):387-389.
18. Riddle MC, Rosenstock J, Vlajnic A, Gao L. Randomized, 1-year comparison of three ways to initiate and advance insulin for type 2 diabetes: twice-daily premixed insulin versus basal insulin with either basal-plus one prandial insulin or basal-bolus up to three prandial injections. Diabetes Obes Metab. 2014;16(5):396-402.
19. Petznick A. Insulin management of type 2 diabetes mellitus. Am Fam Physician. 2011;84(2):183-190.
20. Joslin Diabetes Center. Dosing insulin. http://www.joslin.org/info/dosing-insulin.html. Accessed September 8, 2017.
21. National Institutes of Health. 15-15 rule. https://medlineplus.gov/ency/imagepages/19815.htm. Updated April 15, 2017. Accessed September 3, 2017.
22. University of Michigan Comprehensive Diabetes Center. Diabetes: low blood sugar. http://www.med.umich.edu/1libr/MEND/Diabetes-Hypoglycemia.pdf. Revised July 2017. Accessed September 3, 2017.
23. Diabetes Research Institute, University of Miami. Low blood sugar: hypoglycemia. http://www.diabetesresearch.org/document.doc?id=275. Accessed August 29, 2017.24. Cavanaugh KL. Diabetes management issues for patients with chronic kidney disease. Clin Diabetes. 2007;25(3):90-97.
25. National Institute of Diabetes and Digestive and Kidney Diseases. Low blood glucose (hypoglycemia). http://www.niddk.nih.gov/health-information/health-topics/Diabetes/hypoglycemia/Pages/index.aspx. Accessed August 29, 2017.
26. Deakin TA, McShane CE,Cade JE, Williams R. Group based training for self-management strategies in people with type 2 diabetes mellitus. Cochrane Database Syst Rev. 2005;(2): CD003417.
Six PAD diagnostic tests vary widely in patients with diabetes
Six different clinical tests used to identify peripheral arterial disease (PAD) were found to be significantly different in their ability to detect PAD in a population of 50 patients with diabetes, according to a report published online in Primary Care Diabetes.
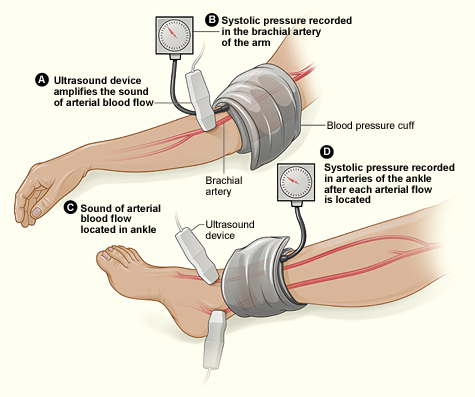
This study assessed the same group of participants with each of the following six tests: Doppler Waveform, toe-brachial pressure index (TBPI), ankle-brachial pressure index (ABPI), posterior tibial artery pulse (ATP), transcutaneous oxygen pressure (TCPO), and pulse palpation. The right and left foot were assessed in each participant, yeilding100 limbs for analysis, according to Yvonne Midolo Azzopardi, MD, of the University of Malta in Msida and her colleagues.
The highest percent of participants who were found to have PAD was 93%, as detected by Doppler Waveform, followed by TBPI (72%), ABPI (57%), ATP (35%), TCPO (30%), and pulse palpation (23%). The difference between these percentages was significant at P less than .0005.
“The reported observations suggest that use of only one screening tool in isolation could yield high false results since it is clear that these tests do not concur with each other to a large extent,” the authors stated.
Dr. Azzopardi and her colleagues pointed out that the use of more specialized tools, such as duplex scanning, could be compared with these six modalities to detect PAD but that such methods were unlikely to be routinely available to primary care physicians who are at the front lines of making the determination of PAD in patients with diabetes.
“The authors advocate for urgent, more robust studies utilizing a gold standard modality for the diagnosis of PAD in order to provide evidence regarding which noninvasive screening modalities would yield the most valid results. This would significantly reduce the proportion of patients with diabetes who would be falsely identified as having no PAD and subsequently denied beneficial and effective secondary risk factor control,” Dr. Azzopardi and her colleagues concluded.
The authors reported that they had no conflicts of interest.
SOURCE: Azzopardi YM et al. 2018. Prim Care Diabetes.. doi: 10.1016/j.pcd.2018.08.005.
Six different clinical tests used to identify peripheral arterial disease (PAD) were found to be significantly different in their ability to detect PAD in a population of 50 patients with diabetes, according to a report published online in Primary Care Diabetes.
This study assessed the same group of participants with each of the following six tests: Doppler Waveform, toe-brachial pressure index (TBPI), ankle-brachial pressure index (ABPI), posterior tibial artery pulse (ATP), transcutaneous oxygen pressure (TCPO), and pulse palpation. The right and left foot were assessed in each participant, yeilding100 limbs for analysis, according to Yvonne Midolo Azzopardi, MD, of the University of Malta in Msida and her colleagues.
The highest percent of participants who were found to have PAD was 93%, as detected by Doppler Waveform, followed by TBPI (72%), ABPI (57%), ATP (35%), TCPO (30%), and pulse palpation (23%). The difference between these percentages was significant at P less than .0005.
“The reported observations suggest that use of only one screening tool in isolation could yield high false results since it is clear that these tests do not concur with each other to a large extent,” the authors stated.
Dr. Azzopardi and her colleagues pointed out that the use of more specialized tools, such as duplex scanning, could be compared with these six modalities to detect PAD but that such methods were unlikely to be routinely available to primary care physicians who are at the front lines of making the determination of PAD in patients with diabetes.
“The authors advocate for urgent, more robust studies utilizing a gold standard modality for the diagnosis of PAD in order to provide evidence regarding which noninvasive screening modalities would yield the most valid results. This would significantly reduce the proportion of patients with diabetes who would be falsely identified as having no PAD and subsequently denied beneficial and effective secondary risk factor control,” Dr. Azzopardi and her colleagues concluded.
The authors reported that they had no conflicts of interest.
SOURCE: Azzopardi YM et al. 2018. Prim Care Diabetes.. doi: 10.1016/j.pcd.2018.08.005.
FROM PRIMARY CARE DIABETES
Key clinical point: Six different tests used to identify PAD differed significantly in their ability to detect the disease.
Major finding: Detection ranged from 93% to 23% in the same group of patients.
Study details: Both legs of 50 patients with diabetes were assessed for PAD using six screening modalities.
Disclosures: The authors reported that they had no conflicts of interest.
Source: Azzopardi YM et al. 2018. Prim Care Diabetes. doi: 10.1016/j.pcd.2018.08.005.
Obesity tied to improved inpatient survival of patients with PAD
The obesity paradox appears alive and well in the treatment of peripheral arterial disease (PAD), according to the results of a 10-year, 5.6-million patient database study.

The researchers found that coding for obesity is associated with lower in-hospital mortality in PAD patients relative to those who were normal weight or overweight. This obesity survival paradox was independent of age, sex, and comorbidities and was seen in all obesity classes, according to Karsten Keller, MD, of the University Medical Center Mainz (Germany), and his colleagues.
In total, 5,611,827 inpatients aged 18 years or older with PAD were treated between 2005 and 2015 in Germany, 5,611,484 of whom (64.8% men) were eligible for analysis. Among these, 500,027 (8.9%) were coded with obesity and 16,620 (0.3%) were coded as underweight; 5,094,837 (90.8%) were in neither classification (considered healthy/overweight) and served as the reference group for comparison, according to Dr. Keller and his colleagues.
Obese PAD patients were younger, more frequently women, and had less cancer but were diagnosed more often with cardiovascular disease risk factors such as diabetes and hypertension, compared with the reference group. In addition, there were higher levels of coronary artery disease, heart failure, renal insufficiency, and chronic obstructive pulmonary disease (COPD) in obese patients.
Obese patients had lower mortality (3.2% vs. 5.1%; P less than .001), compared with the reference group, and showed a reduced risk of in-hospital mortality (odds ratio, 0.617; P less than .001). Univariate logistic regression analyses showed the association of obesity and reduced in-hospital mortality was consistent and significant, even with adjustment for age, sex, and comorbidities.
In contrast, underweight patients were significantly more likely to die than those in the reference group (6% vs. 5.1%; P less than .001), according to the researchers. Underweight was associated with an increased risk for in-hospital mortality (OR, 1.18; P less than .001), and this was consistent throughout univariate analysis.
Underweight PAD patients also had significantly higher frequencies of cancer and COPD, but lower rates of diabetes mellitus, hypertension, coronary artery disease, and heart failure, compared with the reference group. Both obese and underweight PAD patients stayed longer in the hospital than the PAD patients who were not coded as underweight or obese.
Obese PAD patients had slight but significantly higher rates of MI (3.9% vs. 3.4%; P less than .001) and venous thromboembolic events, and more often had to undergo amputation surgery (8.3% vs. 8.1%; P less than .001), including a higher relative number of minor amputations (6.3% vs. 5.5%; P less than .001). However, major amputation rates were significantly lower in obese patients (2.6% vs. 3.2%; P less than .001), with univariate analysis showing a significant association between obesity and a lower risk of major amputation (OR, 0.82; P less than .001), which remained stable after multivariate adjustment.
Limitations of the study reported by the researchers included a lower than expected percent obesity in the 10-year database, compared with current rates, and the inability to follow tobacco use or to determine the socioeconomic status of the patients.
“Obesity is associated with lower in-hospital mortality in PAD patients relative to those with normal weight/overweight. ... Therefore, greater concern should be directed to the thinner patients with PAD who are particularly at increased risk of mortality,” the researchers concluded.
This study was supported by the German Federal Ministry of Education and Research; the authors reported that they had no disclosures.
SOURCE: Keller K et al. Clin Nutr. 2018 Oct 3. doi: 10.1016/j.clnu.2018.09.031.
The obesity paradox appears alive and well in the treatment of peripheral arterial disease (PAD), according to the results of a 10-year, 5.6-million patient database study.
The researchers found that coding for obesity is associated with lower in-hospital mortality in PAD patients relative to those who were normal weight or overweight. This obesity survival paradox was independent of age, sex, and comorbidities and was seen in all obesity classes, according to Karsten Keller, MD, of the University Medical Center Mainz (Germany), and his colleagues.
In total, 5,611,827 inpatients aged 18 years or older with PAD were treated between 2005 and 2015 in Germany, 5,611,484 of whom (64.8% men) were eligible for analysis. Among these, 500,027 (8.9%) were coded with obesity and 16,620 (0.3%) were coded as underweight; 5,094,837 (90.8%) were in neither classification (considered healthy/overweight) and served as the reference group for comparison, according to Dr. Keller and his colleagues.
Obese PAD patients were younger, more frequently women, and had less cancer but were diagnosed more often with cardiovascular disease risk factors such as diabetes and hypertension, compared with the reference group. In addition, there were higher levels of coronary artery disease, heart failure, renal insufficiency, and chronic obstructive pulmonary disease (COPD) in obese patients.
Obese patients had lower mortality (3.2% vs. 5.1%; P less than .001), compared with the reference group, and showed a reduced risk of in-hospital mortality (odds ratio, 0.617; P less than .001). Univariate logistic regression analyses showed the association of obesity and reduced in-hospital mortality was consistent and significant, even with adjustment for age, sex, and comorbidities.
In contrast, underweight patients were significantly more likely to die than those in the reference group (6% vs. 5.1%; P less than .001), according to the researchers. Underweight was associated with an increased risk for in-hospital mortality (OR, 1.18; P less than .001), and this was consistent throughout univariate analysis.
Underweight PAD patients also had significantly higher frequencies of cancer and COPD, but lower rates of diabetes mellitus, hypertension, coronary artery disease, and heart failure, compared with the reference group. Both obese and underweight PAD patients stayed longer in the hospital than the PAD patients who were not coded as underweight or obese.
Obese PAD patients had slight but significantly higher rates of MI (3.9% vs. 3.4%; P less than .001) and venous thromboembolic events, and more often had to undergo amputation surgery (8.3% vs. 8.1%; P less than .001), including a higher relative number of minor amputations (6.3% vs. 5.5%; P less than .001). However, major amputation rates were significantly lower in obese patients (2.6% vs. 3.2%; P less than .001), with univariate analysis showing a significant association between obesity and a lower risk of major amputation (OR, 0.82; P less than .001), which remained stable after multivariate adjustment.
Limitations of the study reported by the researchers included a lower than expected percent obesity in the 10-year database, compared with current rates, and the inability to follow tobacco use or to determine the socioeconomic status of the patients.
“Obesity is associated with lower in-hospital mortality in PAD patients relative to those with normal weight/overweight. ... Therefore, greater concern should be directed to the thinner patients with PAD who are particularly at increased risk of mortality,” the researchers concluded.
This study was supported by the German Federal Ministry of Education and Research; the authors reported that they had no disclosures.
SOURCE: Keller K et al. Clin Nutr. 2018 Oct 3. doi: 10.1016/j.clnu.2018.09.031.
FROM CLINICAL NUTRITION
Key clinical point: Obesity is associated with lower in-hospital mortality in patients with peripheral arterial disease relative to those who were healthy weight or overweight.
Major finding: Obese patients had a lower mortality (3.2% vs. 5.1%; P less than .001), compared with the reference group.
Study details: A database study of 5,611,484 inpatients diagnosed with peripheral arterial disease.
Disclosures: This study was supported by the German Federal Ministry of Education and Research; the authors reported that they had no disclosures.
Source: Keller K et al. Clin Nutr. 2018 Oct 3. doi: 10.1016/j.clnu.2018.09.031.