User login
Defending access to reproductive health care
The 1973 Supreme Court of the United States (SCOTUS) decision in Roe v Wade was a landmark ruling,1 establishing that the United States Constitution provides a fundamental “right to privacy,” protecting pregnant people’s freedom to access all available reproductive health care options. Recognizing that the right to abortion was not absolute, the majority of justices supported a trimester system. In the first trimester, decisions about abortion care are fully controlled by patients and clinicians, and no government could place restrictions on access to abortion. In the second trimester, SCOTUS ruled that states may choose to regulate abortion to protect maternal health. (As an example of such state restrictions, in Massachusetts, for many years, but no longer, the state required that abortions occur in a hospital when the patient was between 18 and 24 weeks’ gestation in order to facilitate comprehensive emergency care for complications.) Beginning in the third trimester, a point at which a fetus could be viable, the Court ruled that a government could prohibit abortion except when an abortion was necessary to protect the life or health of the pregnant person. In 1992, the SCOTUS decision in Planned Parenthood v Casey2 rejected the trimester system, reaffirming the right to an abortion before fetal viability, and adopting a new standard that states may not create an undue burden on a person seeking an abortion b
If, as anticipated, the 2022 SCOTUS decision in Dobbs v Jackson Women’s Health Organization3 overturns the precedents set in Roe v Wade and Planned Parenthood v Casey, decisions on abortion law will be relegated to elected legislators and state courts.4 It is expected that at least 26 state legislatures and governors will enact stringent new restrictions on access to abortion. This cataclysmic reversal of judicial opinion creates a historic challenge to obstetrician-gynecologists and their patients and could threaten access to other vital reproductive services beyond abortion, like contraception. We will be fighting, state by state, for people’s right to access all available reproductive health procedures. This will also significantly affect the ability for providers in women’s reproductive health to obtain appropriate and necessary education and training in a critical skills. If access to safe abortion is restricted, we fear patients may be forced to consider unsafe abortion, raising the specter of a return to the 1960s, when an epidemic of unsafe abortion caused countless injuries and deaths.5,6
How do we best prepare for these challenges?
- We will need to be flexible and continually evolve our clinical practices to be adherent with state and local legislation and regulation.
- To reduce unintended pregnancies, we need to strengthen our efforts to ensure that every patient has ready access to all available contraceptive options with no out-of-pocket cost.
- When a contraceptive is desired, we will focus on educating people about effectiveness, and offering them highly reliable contraception, such as the implant or intrauterine devices.
- We need to ensure timely access to abortion if state-based laws permit abortion before 6 or 7 weeks’ gestation. Providing medication abortion without an in-person visit using a telehealth option would be one option to expand rapid access to early first trimester abortion.
- Clinicians in states with access to abortion services will need to collaborate with colleagues in states with restrictions on abortion services to improve patient access across state borders.
On a national level, advancing our effective advocacy in Congress may lead to national legislation passed and signed by the President. This could supersede most state laws prohibiting access to comprehensive women’s reproductive health and create a unified, national approach to abortion care, allowing for the appropriate training of all obstetrician-gynecologists. We will also need to develop teams in every state capable of advocating for laws that ensure access to all reproductive health care options. The American College of Obstetricians and Gynecologists has leaders trained and tasked with legislative advocacy in every state.7 This network will be a foundation upon which to build additional advocacy efforts.
As women’s health care professionals, our responsibility to our patients, is to work to ensure universal access to safe and effective comprehensive reproductive options, and to ensure that our workforce is prepared to meet the needs of our patients by defending the patient-clinician relationship. Abortion care saves lives of pregnant patients and reduces maternal morbidity.8 Access to safe abortion care as part of comprehensive reproductive services is an important component of health care. ●
- Roe v Wade, 410 U.S. 113 (1973).
- Planned Parenthood v Casey, 505 U.S. 833 (1992).
- Dobbs v Jackson Women’s Health Organization, 19-1392. https://www.supremecourt.gov/search .aspx?filename=/docket/docketfiles/html /public/19-1392.html. Accessed May 18, 2022.
- Gerstein J, Ward A. Supreme Court has voted to overturn abortion rights, draft opinion shows. Politico. May 5, 2022. Updated May 3, 2022.
- Gold RB. Lessons from before Roe: will past be prologue? Guttmacher Institute. March 1, 2003. https://www.guttmacher.org/gpr/2003/03 /lessons-roe-will-past-be-prologue. Accessed May 18, 2022.
- Edelin KC. Broken Justice: A True Story of Race, Sex and Revenge in a Boston Courtroom. Pond View Press; 2007.
- The American College of Obstetricians and Gynecologists. Get involved in your state. ACOG web site. https://www.acog.org/advocacy /get-involved/get-involved-in-your-state. Accessed May 18, 2022.
- Institute of Medicine (US) Committee on Improving Birth Outcomes. Bale JR, Stoll BJ, Lucas AO, eds. Reducing maternal mortality and morbidity. In: Improving Birth Outcomes: Meeting the Challenge in the Developing World. Washington, DC: National Academies Press (US); 2003.
The 1973 Supreme Court of the United States (SCOTUS) decision in Roe v Wade was a landmark ruling,1 establishing that the United States Constitution provides a fundamental “right to privacy,” protecting pregnant people’s freedom to access all available reproductive health care options. Recognizing that the right to abortion was not absolute, the majority of justices supported a trimester system. In the first trimester, decisions about abortion care are fully controlled by patients and clinicians, and no government could place restrictions on access to abortion. In the second trimester, SCOTUS ruled that states may choose to regulate abortion to protect maternal health. (As an example of such state restrictions, in Massachusetts, for many years, but no longer, the state required that abortions occur in a hospital when the patient was between 18 and 24 weeks’ gestation in order to facilitate comprehensive emergency care for complications.) Beginning in the third trimester, a point at which a fetus could be viable, the Court ruled that a government could prohibit abortion except when an abortion was necessary to protect the life or health of the pregnant person. In 1992, the SCOTUS decision in Planned Parenthood v Casey2 rejected the trimester system, reaffirming the right to an abortion before fetal viability, and adopting a new standard that states may not create an undue burden on a person seeking an abortion b
If, as anticipated, the 2022 SCOTUS decision in Dobbs v Jackson Women’s Health Organization3 overturns the precedents set in Roe v Wade and Planned Parenthood v Casey, decisions on abortion law will be relegated to elected legislators and state courts.4 It is expected that at least 26 state legislatures and governors will enact stringent new restrictions on access to abortion. This cataclysmic reversal of judicial opinion creates a historic challenge to obstetrician-gynecologists and their patients and could threaten access to other vital reproductive services beyond abortion, like contraception. We will be fighting, state by state, for people’s right to access all available reproductive health procedures. This will also significantly affect the ability for providers in women’s reproductive health to obtain appropriate and necessary education and training in a critical skills. If access to safe abortion is restricted, we fear patients may be forced to consider unsafe abortion, raising the specter of a return to the 1960s, when an epidemic of unsafe abortion caused countless injuries and deaths.5,6
How do we best prepare for these challenges?
- We will need to be flexible and continually evolve our clinical practices to be adherent with state and local legislation and regulation.
- To reduce unintended pregnancies, we need to strengthen our efforts to ensure that every patient has ready access to all available contraceptive options with no out-of-pocket cost.
- When a contraceptive is desired, we will focus on educating people about effectiveness, and offering them highly reliable contraception, such as the implant or intrauterine devices.
- We need to ensure timely access to abortion if state-based laws permit abortion before 6 or 7 weeks’ gestation. Providing medication abortion without an in-person visit using a telehealth option would be one option to expand rapid access to early first trimester abortion.
- Clinicians in states with access to abortion services will need to collaborate with colleagues in states with restrictions on abortion services to improve patient access across state borders.
On a national level, advancing our effective advocacy in Congress may lead to national legislation passed and signed by the President. This could supersede most state laws prohibiting access to comprehensive women’s reproductive health and create a unified, national approach to abortion care, allowing for the appropriate training of all obstetrician-gynecologists. We will also need to develop teams in every state capable of advocating for laws that ensure access to all reproductive health care options. The American College of Obstetricians and Gynecologists has leaders trained and tasked with legislative advocacy in every state.7 This network will be a foundation upon which to build additional advocacy efforts.
As women’s health care professionals, our responsibility to our patients, is to work to ensure universal access to safe and effective comprehensive reproductive options, and to ensure that our workforce is prepared to meet the needs of our patients by defending the patient-clinician relationship. Abortion care saves lives of pregnant patients and reduces maternal morbidity.8 Access to safe abortion care as part of comprehensive reproductive services is an important component of health care. ●
- Roe v Wade, 410 U.S. 113 (1973).
- Planned Parenthood v Casey, 505 U.S. 833 (1992).
- Dobbs v Jackson Women’s Health Organization, 19-1392. https://www.supremecourt.gov/search .aspx?filename=/docket/docketfiles/html /public/19-1392.html. Accessed May 18, 2022.
- Gerstein J, Ward A. Supreme Court has voted to overturn abortion rights, draft opinion shows. Politico. May 5, 2022. Updated May 3, 2022.
- Gold RB. Lessons from before Roe: will past be prologue? Guttmacher Institute. March 1, 2003. https://www.guttmacher.org/gpr/2003/03 /lessons-roe-will-past-be-prologue. Accessed May 18, 2022.
- Edelin KC. Broken Justice: A True Story of Race, Sex and Revenge in a Boston Courtroom. Pond View Press; 2007.
- The American College of Obstetricians and Gynecologists. Get involved in your state. ACOG web site. https://www.acog.org/advocacy /get-involved/get-involved-in-your-state. Accessed May 18, 2022.
- Institute of Medicine (US) Committee on Improving Birth Outcomes. Bale JR, Stoll BJ, Lucas AO, eds. Reducing maternal mortality and morbidity. In: Improving Birth Outcomes: Meeting the Challenge in the Developing World. Washington, DC: National Academies Press (US); 2003.

Substance use the main cause of physician license actions
Despite a sharp uptick in 2011, substance use–specific license actions taken against physicians dropped in frequency between 2004 and 2020.
More than three fourths (76.3%) of license actions taken against physicians were related to substance use, according to a recent study published in JAMA. Psychological impairment was the reason associated with more than 1 in 10 (11.5%) actions taken against physicians’ licenses, while physical impairment was the reason behind approximately 12% of such actions, per the study.
Researchers analyzed 5032 actions taken against the licenses of U.S. physicians. The actions were reported to the National Practitioner Data Bank and were related to substance use, psychological impairment, and physical impairment. The National Practitioner Data Bank is a web-based repository of reports with information on medical malpractice payments and certain adverse actions related to healthcare practitioners, providers, and suppliers. It is provided by the Department of Health & Human Services.
“While there has been increased attention [on] the mental health of physicians, we wanted to understand the extent to which changes in attitudes and practices were reflected in actions taken by hospitals or licensing boards, which are reported in the National Practitioner Data Bank,” Lisa Rotenstein, MD, a primary care physician at Boston’s Brigham and Women’s Hospital and lead author of the study, told this news organization.
Dr. Rotenstein, who is an assistant professor at Harvard Medical School, Boston, studies issues of mental health among physicians and trainees. Dr. Rotenstein was the lead author of a 2016 study that found that more than a quarter (27.2%) of medical students have depressive symptoms. She was also lead author of a 2018 study published in JAMA on the prevalence of burnout among attending physicians.
Actions against physicians trending downward
2011 marked the peak in actions taken against physicians’ licenses for substance use, per the study, but actions related to substance use have otherwise maintained a steady decline over the past 17 years. Researchers found that physicians with license actions as a result of substance use or psychological impairment were more likely to receive indefinite penalties, while also having emergency action taken against their license to practice.
In addition, physicians who had actions taken against their licenses because of substance use or psychological impairment were more likely to accrue a greater number of actions over the course of their careers, according to the study.
About 47% of physicians reported experiencing burnout per Medscape’s Physician Burnout and Depression Report 2022: Stress, Anxiety, and Anger report. Burnout among emergency physicians spiked from 43% in 2020 to 60% in 2021, according to the report.
More than one quarter (26%) of physicians reported drinking alcohol to cope with burnout in 2020, according to Medscape’s 2021 Physician Burnout and Suicide Report. Per the 2021 report, 48% of physicians chose exercise to deal with burnout, while 35% indulged in eating junk food.
Peter Grinspoon, MD, a Boston-based primary care physician, wrote in The Los Angeles Times in 2016 that the rate of substance abuse among physicians starts at 10% and can go as high as 15%; by comparison, rates of substance use among the general population are 8%-10%. “What appears to account for the difference is physician distress, and in the case of drug abuse, plentiful access,” he added.
Dr. Grinspoon wrote a 2016 book called “Free Refills: A Doctor Confronts His Addiction,” which chronicles his experience in recovery and relapse as a physician who was dependent on opioid painkillers.
The findings from the recent study in JAMA “suggest we have made some progress in addressing issues related to substance use in ways that don’t result in license actions or even in meeting physicians’ need for support related to substance use,” said Dr. Rotenstein.
Still, she insists that there’s “substantial opportunity to improve mental health and support offerings for physicians and to reduce stigma related to seeking and receiving mental health support, ideally averting the need for license actions.”
According to Dr. Rotenstein, the cases listed in the National Practitioner Data Bank represent the most severe cases; these reports have risen to a high level of attention or concern and are the result of adverse action reports submitted by healthcare institutions and state licensing boards.
“There are many, many more physicians whose cases are not represented here but who struggle with depression, anxiety, substance use, and more,” said Dr. Rotenstein.
A version of this article first appeared on Medscape.com.
FROM JAMA
Gastroenterologists’ income up 12%, most happy with career pick
Gastroenterologists, like many other physicians, fared better financially in 2021 than during the height of the pandemic in 2020, according to the 2022 Medscape Gastroenterology Compensation Report.
Gastroenterologists’ average annual income rose from $406,000 in 2020 to $453,000 in 2021 – an increase of 12% over the prior year, second only to otolaryngologists (+13%).
“Compensation for most physicians is trending back up as demand for physicians accelerates,” says James Taylor, group president and chief operating officer of AMN Healthcare’s Physician & Leadership Solutions. “The market for physicians has done a complete 180 over just 7 or 8 months.”
In terms of 2021 income gains, gastroenterologists finished toward the top of the 29+ specialties surveyed by Medscape. The average bonus gastroenterologists earned was also higher in 2021 than in 2020 ($74,000 vs. $60,000).
Competition, side gigs
This year, Medscape asked gastroenterologists how competition affects their income; 16% cited nonphysician practitioners as a source of competition (same as physicians overall).
Eight percent cited telemedicine as a source of competition; 5% cited “minute clinics” and other walk-in clinics in pharmacies. Roughly three-quarters said their income is not affected by competition from these sources.
About 30% of gastroenterologists added responsibilities to their medical workload. A few even have side jobs outside of medicine.
However, gastroenterologists are somewhat less likely to take on extra work than other specialties (36%).
“Physicians are fortunate to have a huge array of potential side gigs available to them,” notes Sylvie Stacy, MD, MPH, author of 50 Nonclinical Careers for Physicians. “Supplemental income that pays well is not difficult to find.” She says most who do take on side jobs are motivated to fund early retirement or desire greater financial independence. They also have high levels of student debt to pay off.
Getting paid well is one thing; feeling adequately paid can be another. Gastroenterologists landed toward the middle (53%) of all physicians in terms of feeling fairly compensated for their work. Neurologists were the least (42%), while public health and preventive medicine providers (72%) were most apt to feel fairly compensated.
Challenges and rewards
The challenges of working during the pandemic and the overall changing tone of medicine prompted some physicians to leave the profession, while disenchanting many others.
This year, a smaller percentage of gastroenterologists said they would enter medicine again, compared with last year (75% vs. 81%).
Yet most gastroenterologists surveyed this year said they would choose their specialty again (95%), which is similar to last year (93%). Family physicians and internists would be less willing than most other physicians to repeat their choice.
Gastroenterologists spend an average 14.3 hours each week handling paperwork and administration, placing them among the middle third of all physicians. This year, the average for physicians overall was about 15.5 hours per week.
Most gastroenterologists (73%) plan to continue taking Medicare and/or Medicaid patients. However, that rate is smaller than in last year’s report (80%).
Compared with last year, about the same number of gastroenterologists say they won’t take new Medicaid patients (about 4% vs. 3%), while a somewhat higher percentage are undecided (about 22% vs. 16%). Overall, 70% of physicians said they plan to continue taking Medicare and/or Medicaid patients.
Nearly one-quarter (23%) of gastroenterologists indicated that they would drop low-paying insurers, but most would not because of business, ethical, or other reasons.
What is most rewarding about being a gastroenterologist? Being good at what they do/finding answers, diagnoses tops the list (31%), followed by relationships with and gratitude from patients (29%), making the world a better place/helping others (15%), and making good money at a job they like (11%). A few cited teaching (6%) and pride in their profession (5%)
The most challenging part of their job is having to follow so many rules and regulations (21%). Other challenges include trouble getting fair reimbursement (18%), dealing with difficult patients (17%), having to work long hours (14%), and working with electronic health record systems (10%).
A version of this article first appeared on Medscape.com.
Surgeons, who see it up close, offer ways to stop gun violence
Their strategies can work regardless of where you stand on the Second Amendment of the Constitution, said Patricia Turner, MD. “Our proposals are embraced by both gun owners and non–gun owners alike, and we are unique in that regard.”
These “implementable solutions” could prevent the next massacre, Dr. Turner, executive director of the American College of Surgeons, said during a news briefing the group sponsored on June 2.
“Our future – indeed all of our futures – depend on our ability to find durable, actionable steps that we can implement tomorrow to save lives,” she said.
Firsthand perspective
“Sadly I’m here today as a trauma surgeon who has cared for two of the largest mass shootings in modern U.S. history,” said Ronald Stewart, MD, chair of the department of surgery at University Hospital in San Antonio, Texas.
Dr. Stewart treated victims of the 2017 Sutherland Springs First Baptist Church shooting – where 27 people died, including the shooter – and the recent Uvalde school shooting, both in Texas.
“The injuries inflicted by high-velocity weapons used at both of these attacks are horrific. A high-capacity, magazine-fed automatic rifle such as the AR-15 causes extremely destructive tissue wounds,” he said.
One of the group’s proposals is to increase the regulation of high-velocity weapons, including AR-15s.
“These wounds are horribly lethal at close range, and sadly, most victims do not survive long enough to make it to a trauma center,” Dr. Stewart said.
On a positive note, “all of our current [Uvalde] patients are improving, which really brings us joy in this dark time,” he said. “But all of them have a long road to deal with recovery with both the physical and emotional impact of their injuries.”
Jeffrey Kerby, MD, agreed.
“Trauma surgeons see the short-term physical effects of these injuries and watch patients struggle with the long-term impact of these wounds,” said Dr. Kerby, director of trauma and acute care surgery at the University of Alabama at Birmingham.
Surgeons feel ‘profound impact’ of shootings
“Firearm violence has a profound impact on surgeons, and we are the undisputed subject matter experts in treating the tragic results,” said Patrick Bailey, MD, medical director for advocacy at the American College of Surgeons.
“This impacts surgeons as well,” said Dr. Kerby, chair of the Committee on Trauma for the surgeons’ group. “We are human, and we can’t help but share in the grief, the pain, and the suffering that our patients endure.
“As a pediatric surgeon ... I have too often witnessed the impact of firearm violence, and obviously, the devastation extends beyond the victims to their families,” he said. “To put it succinctly, in our culture, parents are not supposed to be put in a position of burying their children.”
A public health crisis
“It’s important to recognize that we’ve been talking about a public health approach,” said Eileen Bulger, MD, acting chief of the trauma division at the University of Washington in Seattle. That strategy is important for engaging both firearm owners and communities that have a higher risk for firearm violence, she said.
A committee of the American College of Surgeons developed specific recommendations in 2018, which are still valid today. The group brought together surgeons from across the U.S. including “passionate firearm owners and experts in firearm safety,” Dr. Bulger said.
The committee, for example, agreed on 10 specific recommendations “that we believe are bipartisan and could have an immediate impact in saving lives.”
“I’m a lifelong gun owner,” Dr. Bailey said, emphasizing that the team’s process included participation and perspective from other surgeons “who, like me, are also gun owners, but gun owners who also seek to reduce the impact of firearm violence in our country.”
The recommendations address these areas:
- Gun ownership
- Firearm registration
- Licensure
- Education and training
- Ownership responsibilities
- Mandatory reporting and risk reduction
- Safety innovation and technology
- Research
- The culture of violence
- Social isolation and mental health
For example, “we currently have certain classes of weapons with significant offensive capability,” Dr. Bulger said, “that are appropriately restricted and regulated under the National Firearms Act as Class 3 weapons.”
This group includes fully automatic machine guns, explosive devices, and short-barrel shotguns.
“We recommend a formal reassessment of the firearms designated within each of these national firearms classifications,” Dr. Bulger said.
For example, high-capacity, magazine-fed semiautomatic rifles, such as the AR-15, should be considered for reclassification as NFA Class 3 firearms, or they should get a new designation with tighter regulation.
The ACS endorses formal firearm safety training for all new gun owners. Also, owners who do not provide reasonably safe firearm storage should be held responsible for events related to the discharge of their firearms, Dr. Bulger said. And people who are deemed an imminent threat to themselves or others through firearm ownership should be temporarily or permanently restricted, with due process.
Research and reporting reforms
The ACS is also calling for research on firearm injuries and firearm injury prevention to be federally funded, Dr. Bulger said. The research should be done in a nonpartisan manner, she said.
“We have concerns that the manner and tone in which information is released to the public may lead to copycat mass killers,” she said. “The ACS recommends that law enforcement officials and the press take steps to eliminate the notoriety of the shooter, for example.”
Dr. Bulger also addressed the mental health angle. “We encourage recognition of mental health warning signs and social isolation by teachers, counselors, peers, and parents.” When identified, immediate referral to professionals is needed.
In addition to these recommendations, another team from the American College of Surgeons has published an overview of ways to address the inequities that contribute to violence. “We advocate for federal funding to support the development of hospital-based and community programs for violence intervention and prevention,” Dr. Bulger said.
Dr. Bailey said that as a gun owner himself, he thinks other gun owners would support these recommendations.
“I do not believe that the steps recommended ... pose undue burden on the rights of individual gun owners,” he said.
The time is now
Most firearm injuries are not from mass shooting events, Dr. Kerby said.
“My own trauma center has seen a 40% increase in the number of firearm injuries just in the last 2 years,” he added, “and these numbers continue to grow.”
A version of this article first appeared on WebMD.com.
High rates of med student burnout during COVID
NEW ORLEANS –
Researchers surveyed 613 medical students representing all years of a medical program during the last week of the Spring semester of 2021.
Based on the Maslach Burnout Inventory-Student Survey (MBI-SS), more than half (54%) of the students had symptoms of burnout.
Eighty percent of students scored high on emotional exhaustion, 57% scored high on cynicism, and 36% scored low on academic effectiveness.
Compared with male medical students, female medical students were more apt to exhibit signs of burnout (60% vs. 44%), emotional exhaustion (80% vs. 73%), and cynicism (62% vs. 49%).
After adjusting for associated factors, female medical students were significantly more likely to suffer from burnout than male students (odds ratio, 1.90; 95% confidence interval, 1.34-2.70; P < .001).
Smoking was also linked to higher likelihood of burnout among medical students (OR, 2.12; 95% CI, 1.18-3.81; P < .05). The death of a family member from COVID-19 also put medical students at heightened risk for burnout (OR, 1.60; 95% CI, 1.08-2.36; P < .05).
The survey results were presented at the American Psychiatric Association (APA) Annual Meeting.
The findings point to the need to study burnout prevalence in universities and develop strategies to promote the mental health of future physicians, presenter Sofia Jezzini-Martínez, fourth-year medical student, Autonomous University of Nuevo Leon, Monterrey, Mexico, wrote in her conference abstract.
In related research presented at the APA meeting, researchers surveyed second-, third-, and fourth-year medical students from California during the pandemic.
Roughly 80% exhibited symptoms of anxiety and 68% exhibited depressive symptoms, of whom about 18% also reported having thoughts of suicide.
Yet only about half of the medical students exhibiting anxiety or depressive symptoms sought help from a mental health professional, and 20% reported using substances to cope with stress.
“Given that the pandemic is ongoing, we hope to draw attention to mental health needs of medical students and influence medical schools to direct appropriate and timely resources to this group,” presenter Sarthak Angal, MD, psychiatry resident, Kaiser Permanente San Jose Medical Center, California, wrote in his conference abstract.
Managing expectations
Weighing in on medical student burnout, Ihuoma Njoku, MD, department of psychiatry and neurobehavioral sciences, University of Virginia, Charlottesville, noted that, “particularly for women in multiple fields, including medicine, there’s a lot of burden placed on them.”
“Women are pulled in a lot of different directions and have increased demands, which may help explain their higher rate of burnout,” Dr. Njoku commented.
She noted that these surveys were conducted during the COVID-19 pandemic, “a period when students’ education experience was a lot different than what they expected and maybe what they wanted.”
Dr. Njoku noted that the challenges of the pandemic are particularly hard on fourth-year medical students.
“A big part of fourth year is applying to residency, and many were doing virtual interviews for residency. That makes it hard to really get an appreciation of the place you will spend the next three to eight years of your life,” she told this news organization.
A version of this article first appeared on Medscape.com.
FROM APA 2022
‘Unlimited’ cancer costs: The Medicare Part D dilemma
Learning that a family member has cancer can be devastating enough. Waiting to find out whether a loved one can afford their treatment takes the concern to another level.
That was the case for health policy expert Stacie B. Dusetzina, PhD, when her mother was diagnosed with metastatic breast cancer.
“There is this period where you are waiting to learn more about the cancer type and treatment options, and, of course, what might be covered by your health plan,” Dr. Dusetzina, an associate professor at Vanderbilt University Medical Center, Nashville, Tenn., said in an interview. “Knowing as much as I do about coverage for prescription drugs in Medicare Part D, I was worried we would be in a situation where my mom had to spend over $15,000 out-of-pocket every year for one of these drugs.”
That $15,000 would have taken a large chunk of her retirement income and could make treatment unaffordable down the line.
This situation is hardly unique.
Many patients with cancer who rely on Medicare Part D face an impossible choice: “Your money or your life,” Dr. Dusetzina said.
In a recent perspective in the New England Journal of Medicine,
The difference in cost comes down to whether drugs are delivered as pills or infusions. Oral agents are almost always covered under a health plan’s pharmacy benefit (Medicare Part D), while physician-administered drugs are covered under the medical benefit (Medicare Part B).
According to Dr. Dusetzina, Medicare beneficiaries can face substantial, possibly “unlimited,” out-of-pocket costs for drugs covered under Part D if they don’t qualify for low-income subsidies. On the other hand, most beneficiaries receiving physician-administered drugs covered under Part B have supplemental coverage, which reduces or eliminates out-of-pocket costs.
Dr. Dusetzina broke down the expected first fill and yearly out-of-pocket costs associated with 10 oral cancer drugs covered under Part D. These costs ranged from $3,100 to $3,392 for a first fill and $10,592 to $14,067 for one year.
In a candid Twitter thread, Dr. Dusetzina opened up more about the issues highlighted in her piece: “This paper is about #PartD and Cancer. It is also about #pharmacoequity ... This is about how screwed you are if you need cancer treatment and your treatment happens to be covered by #PartD and not #PartB.”
“This is ARBITRARY and INEQUITABLE,” she added.
What’s “arbitrary,” Dr. Dusetzina explains, is that a rather small, chance distinction in cancer type or subtype can be the difference between affording and not affording treatment – and potentially between life and death.
Take the drug costs for two similar patients with breast cancer.
Patient A has hormone receptor–positive, human epidermal growth factor receptor type 2 (HER2)–negative breast cancer and thus would likely receive first-line therapy with two oral agents: an aromatase inhibitor and cyclin-dependent kinases 4 and 6 (CDK4/6) inhibitor, most often palbociclib (Ibrance).
For palbociclib alone, out-of-pocket costs would come to $3,100 for the first fill and nearly $10,600 over a year for a Part D beneficiary who doesn’t qualify for low-income subsidies.
Now take patient B who has HER2–positive metastatic breast cancer. This person would likely receive first-line treatment with trastuzumab (Herceptin), pertuzumab (Perjeta), and a taxane – a combination covered under Part B, which would be subject to an out-of-pocket cap or covered with limited or no cost sharing.
This difference in cancer subtype leaves some patients “paying substantially more for their cancer treatment than others, despite the same goal of extending or improving their lives,” Dr. Dusetzina writes.
Another arbitrary difference: who qualifies for low-income subsidies under Part D. A single woman making the current median income, for instance, would not qualify for a Part D subsidy. If she was diagnosed with breast cancer and needed palbociclib, her cost for that drug alone would be nearly half her annual income, and that does not include premiums and other health care costs.
The high cost can mean foregoing treatment, stopping treatment early, or reducing spending on necessities such as food and housing. In fact, a recent study from Dr. Dusetzina and colleagues showed that for beneficiaries with cancer who do not receive subsidies under Part D, nearly 30% of initial prescriptions for specialty oncology drugs go unfilled.
Fortunately, that wasn’t the case for Dr. Dusetzina’s mother.
“Her cancer subtype is best treated with drugs covered under her medical benefit, and she has an out-of-pocket limit on that benefit,” she said. “That makes the financial difficulty less of a concern right now.”
But with a different subtype, it could have easily gone another way.
On Twitter, Dr. Dusetzina called for congressional action: “There is a lot going on now, but @SenateDems & @SenateGOP this needs to be fixed. #Medicare beneficiaries are counting on you to make sure that they can afford the drugs they need. We know that 1 in 3 people in #PartD don’t fill their cancer drugs. That is unacceptable.”
Dr. Dusetzina’s work is supported by the Commonwealth Fund. She reported relationships with the Institute for Clinical and Economic Review, the Laura and John Arnold Foundation, Leukemia and Lymphoma Society, National Academy for State Health Policy, and West Health Council, including grant funding/contracts and/or consulting work. She also serves as a commissioner for the Medicare Payment Advisory Commission (MedPAC).
A version of this article first appeared on Medscape.com.
FROM THE NEW ENGLAND JOURNAL OF MEDICINE
Where Does the Hospital Belong? Perspectives on Hospital at Home in the 21st Century
From Medically Home Group, Boston, MA.
Brick-and-mortar hospitals in the United States have historically been considered the dominant setting for providing care to patients. The coordination and delivery of care has previously been bound to physical hospitals largely because multidisciplinary services were only accessible in an individual location. While the fundamental make-up of these services remains unchanged, these services are now available in alternate settings. Some of these services include access to a patient care team, supplies, diagnostics, pharmacy, and advanced therapeutic interventions. Presently, the physical environment is becoming increasingly irrelevant as the core of what makes the traditional hospital—the professional staff, collaborative work processes, and the dynamics of the space—have all been translated into a modern digitally integrated environment. The elements necessary to providing safe, effective care in a physical hospital setting are now available in a patient’s home.
Impetus for the Model
As hospitals reconsider how and where they deliver patient care because of limited resources, the hospital-at-home model has gained significant momentum and interest. This model transforms a home into a hospital. The inpatient acute care episode is entirely substituted with an intensive at-home hospital admission enabled by technology, multidisciplinary teams, and ancillary services. Furthermore, patients requiring post-acute support can be transitioned to their next phase of care seamlessly. Given the nationwide nursing shortage, aging population, challenges uncovered by the COVID-19 pandemic, rising hospital costs, nurse/provider burnout related to challenging work environments, and capacity constraints, a shift toward the combination of virtual and in-home care is imperative. The hospital-at-home model has been associated with superior patient outcomes, including reduced risks of delirium, improved functional status, improved patient and family member satisfaction, reduced mortality, reduced readmissions, and significantly lower costs.1 COVID-19 alone has unmasked major facility-based deficiencies and limitations of our health care system. While the pandemic is not the impetus for the hospital-at-home model, the extended stress of this event has created a unique opportunity to reimagine and transform our health care delivery system so that it is less fragmented and more flexible.
Nursing in the Model
Nursing is central to the hospital-at-home model. Virtual nurses provide meticulous care plan oversight, assessment, and documentation across in-home service providers, to ensure holistic, safe, transparent, and continuous progression toward care plan milestones. The virtual nurse monitors patients using in-home technology that is set up at the time of admission. Connecting with patients to verify social and medical needs, the virtual nurse advocates for their patients and uses these technologies to care and deploy on-demand hands-on services to the patient. Service providers such as paramedics, infusion nurses, or home health nurses may be deployed to provide services in the patient’s home. By bringing in supplies, therapeutics, and interdisciplinary team members, the capabilities of a brick-and-mortar hospital are replicated in the home. All actions that occur wherever the patient is receiving care are overseen by professional nursing staff; in short, virtual nurses are the equivalent of bedside nurses in the brick-and-mortar health care facilities.
Potential Benefits
There are many benefits to the hospital-at-home model (Table). This health care model can be particularly helpful for patients who require frequent admission to acute care facilities, and is well suited for patients with a range of conditions, including those with COVID-19, pneumonia, cellulitis, or congestive heart failure. This care model helps eliminate some of the stressors for patients who have chronic illnesses or other conditions that require frequent hospital admissions. Patients can independently recover at home and can also be surrounded by their loved ones and pets while recovering. This care approach additionally eliminates the risk of hospital-acquired infections and injuries. The hospital-at-home model allows for increased mobility,2 as patients are familiar with their surroundings, resulting in reduced onset of delirium. Additionally, patients with improved mobility performance are less likely to experience negative health outcomes.3 There is less chance of sleep disruption as the patient is sleeping in their own bed—no unfamiliar roommate, no call bells or health care personnel frequently coming into the room. The in-home technology set up for remote patient monitoring is designed with the user in mind. Ease of use empowers the patient to collaborate with their care team on their own terms and center the priorities of themselves and their families.

Positive Outcomes
The hospital-at-home model is associated with positive outcomes. The authors of a systematic review identified 10 randomized controlled trials of hospital-at-home programs (with a total of 1372 patients), but were able to obtain data for only 5 of these trials (with a total of 844 patients).4 They found a 38% reduction in 6-month mortality for patients who received hospital care at home, as well as significantly higher patient satisfaction across a range of medical conditions, including patients with cellulitis and community-acquired pneumonia, as well as elderly patients with multiple medical conditions. The authors concluded that hospital care at home was less expensive than admission to an acute care hospital.4 Similarly, a meta-analysis done by Caplan et al5 that included 61 randomized controlled trials concluded that hospital at home is associated with reductions in mortality, readmission rates, and cost, and increases in patient and caregiver satisfaction. Levine et al2 found reduced costs and utilization with home hospitalization compared to in-hospital care, as well as improved patient mobility status.
The home is the ideal place to empower patients and caregivers to engage in self-management.2 Receiving hospital care at home eliminates the need for dealing with transportation arrangements, traffic, road tolls, and time/scheduling constraints, or finding care for a dependent family member, some of the many stressors that may be experienced by patients who require frequent trips to the hospital. For patients who may not be clinically suitable candidates for hospital at home, such as those requiring critical care intervention and support, the brick-and-mortar hospital is still the appropriate site of care. The hospital-at-home model helps prevent bed shortages in brick-and-mortar hospital settings by allowing hospital care at home for patients who meet preset criteria. These patients can be hospitalized in alternative locations such as their own homes or the residence of a friend. This helps increase health system capacity as well as resiliency.
In addition to expanding safe and appropriate treatment spaces, the hospital-at-home model helps increase access to care for patients during nonstandard hours, including weekends, holidays, or when the waiting time in the emergency room is painfully long. Furthermore, providing care in the home gives the clinical team valuable insight into the patient’s daily life and routine. Performing medication reconciliation with the medicine cabinet in sight and dietary education in a patient’s kitchen are powerful touch points.2 For example, a patient with congestive heart failure who must undergo diuresis is much more likely to meet their care goals when their home diet is aligned with the treatment goal. By being able to see exactly what is in a patient’s pantry and fridge, the care team can create a much more tailored approach to sodium intake and fluid management. Providers can create and execute true patient-centric care as they gain direct insight into the patient’s lifestyle, which is clearly valuable when creating care plans for complex chronic health issues.
Challenges to Implementation and Scaling
Although there are clear benefits to hospital at home, how to best implement and scale this model presents a challenge. In addition to educating patients and families about this model of care, health care systems must expand their hospital-at-home programs and provide education about this model to clinical staff and trainees, and insurers must create reimbursement paradigms. Patients meeting eligibility criteria to enroll in hospital at home is the easiest hurdle, as hospital-at-home programs function best when they enroll and service as many patients as possible, including underserved populations.
Upfront Costs and Cost Savings
While there are upfront costs to set up technology and coordinate services, hospital at home also provides significant total cost savings when compared to coordination associated with brick-and-mortar admission. Hospital care accounts for about one-third of total medical expenditures and is a leading cause of debt.2 Eliminating fixed hospital costs such as facility, overhead, and equipment costs through adoption of the hospital-at-home model can lead to a reduction in expenditures. It has been found that fewer laboratory and diagnostic tests are ordered for hospital-at-home patients when compared to similar patients in brick-and-mortar hospital settings, with comparable or better clinical patient outcomes.6 Furthermore, it is estimated that there are cost savings of 19% to 30% when compared to traditional inpatient care.6 Without legislative action, upon the end of the current COVID-19 public health emergency, the Centers for Medicare & Medicaid Service’s Acute Hospital Care at Home waiver will terminate. This could slow down scaling of the model.However, over the past 2 years there has been enough buy-in from major health systems and patients to continue the momentum of the model’s growth. When setting up a hospital-at-home program, it would be wise to consider a few factors: where in the hospital or health system entity structure the hospital-at-home program will reside, which existing resources can be leveraged within the hospital or health system, and what are the state or federal regulatory requirements for such a program. This type of program continues to fill gaps within the US health care system, meeting the needs of widely overlooked populations and increasing access to essential ancillary services.
Conclusion
It is time to consider our bias toward hospital-first options when managing the care needs of our patients. Health care providers have the option to advocate for holistic care, better experience, and better outcomes. Home-based options are safe, equitable, and patient-centric. Increased costs, consumerism, and technology have pushed us to think about alternative approaches to patient care delivery, and the pandemic created a unique opportunity to see just how far the health care system could stretch itself with capacity constraints, insufficient resources, and staff shortages. In light of new possibilities, it is time to reimagine and transform our health care delivery system so that it is unified, seamless, cohesive, and flexible.
Corresponding author: Payal Sharma, DNP, MSN, RN, FNP-BC, CBN; [email protected].
Disclosures: None reported.
1. Cai S, Laurel PA, Makineni R, Marks ML. Evaluation of a hospital-in-home program implemented among veterans. Am J Manag Care. 2017;23(8):482-487.
2. Levine DM, Ouchi K, Blanchfield B, et al. Hospital-level care at home for acutely ill adults: a pilot randomized controlled trial. J Gen Intern Med. 2018;33(5):729-736. doi:10.1007/s11606-018-4307-z
3. Shuman V, Coyle PC, Perera S,et al. Association between improved mobility and distal health outcomes. J Gerontol A Biol Sci Med Sci. 2020;75(12):2412-2417. doi:10.1093/gerona/glaa086
4. Shepperd S, Doll H, Angus RM, et al. Avoiding hospital admission through provision of hospital care at home: a systematic review and meta-analysis of individual patient data. CMAJ. 2009;180(2):175-182. doi:10.1503/cmaj.081491
5. Caplan GA, Sulaiman NS, Mangin DA, et al. A meta-analysis of “hospital in the home”. Med J Aust. 2012;197(9):512-519. doi:10.5694/mja12.10480
6. Hospital at Home. Johns Hopkins Medicine. Healthcare Solutions. Accessed May 20, 2022. https://www.johnshopkinssolutions.com/solution/hospital-at-home/
From Medically Home Group, Boston, MA.
Brick-and-mortar hospitals in the United States have historically been considered the dominant setting for providing care to patients. The coordination and delivery of care has previously been bound to physical hospitals largely because multidisciplinary services were only accessible in an individual location. While the fundamental make-up of these services remains unchanged, these services are now available in alternate settings. Some of these services include access to a patient care team, supplies, diagnostics, pharmacy, and advanced therapeutic interventions. Presently, the physical environment is becoming increasingly irrelevant as the core of what makes the traditional hospital—the professional staff, collaborative work processes, and the dynamics of the space—have all been translated into a modern digitally integrated environment. The elements necessary to providing safe, effective care in a physical hospital setting are now available in a patient’s home.
Impetus for the Model
As hospitals reconsider how and where they deliver patient care because of limited resources, the hospital-at-home model has gained significant momentum and interest. This model transforms a home into a hospital. The inpatient acute care episode is entirely substituted with an intensive at-home hospital admission enabled by technology, multidisciplinary teams, and ancillary services. Furthermore, patients requiring post-acute support can be transitioned to their next phase of care seamlessly. Given the nationwide nursing shortage, aging population, challenges uncovered by the COVID-19 pandemic, rising hospital costs, nurse/provider burnout related to challenging work environments, and capacity constraints, a shift toward the combination of virtual and in-home care is imperative. The hospital-at-home model has been associated with superior patient outcomes, including reduced risks of delirium, improved functional status, improved patient and family member satisfaction, reduced mortality, reduced readmissions, and significantly lower costs.1 COVID-19 alone has unmasked major facility-based deficiencies and limitations of our health care system. While the pandemic is not the impetus for the hospital-at-home model, the extended stress of this event has created a unique opportunity to reimagine and transform our health care delivery system so that it is less fragmented and more flexible.
Nursing in the Model
Nursing is central to the hospital-at-home model. Virtual nurses provide meticulous care plan oversight, assessment, and documentation across in-home service providers, to ensure holistic, safe, transparent, and continuous progression toward care plan milestones. The virtual nurse monitors patients using in-home technology that is set up at the time of admission. Connecting with patients to verify social and medical needs, the virtual nurse advocates for their patients and uses these technologies to care and deploy on-demand hands-on services to the patient. Service providers such as paramedics, infusion nurses, or home health nurses may be deployed to provide services in the patient’s home. By bringing in supplies, therapeutics, and interdisciplinary team members, the capabilities of a brick-and-mortar hospital are replicated in the home. All actions that occur wherever the patient is receiving care are overseen by professional nursing staff; in short, virtual nurses are the equivalent of bedside nurses in the brick-and-mortar health care facilities.
Potential Benefits
There are many benefits to the hospital-at-home model (Table). This health care model can be particularly helpful for patients who require frequent admission to acute care facilities, and is well suited for patients with a range of conditions, including those with COVID-19, pneumonia, cellulitis, or congestive heart failure. This care model helps eliminate some of the stressors for patients who have chronic illnesses or other conditions that require frequent hospital admissions. Patients can independently recover at home and can also be surrounded by their loved ones and pets while recovering. This care approach additionally eliminates the risk of hospital-acquired infections and injuries. The hospital-at-home model allows for increased mobility,2 as patients are familiar with their surroundings, resulting in reduced onset of delirium. Additionally, patients with improved mobility performance are less likely to experience negative health outcomes.3 There is less chance of sleep disruption as the patient is sleeping in their own bed—no unfamiliar roommate, no call bells or health care personnel frequently coming into the room. The in-home technology set up for remote patient monitoring is designed with the user in mind. Ease of use empowers the patient to collaborate with their care team on their own terms and center the priorities of themselves and their families.
Positive Outcomes
The hospital-at-home model is associated with positive outcomes. The authors of a systematic review identified 10 randomized controlled trials of hospital-at-home programs (with a total of 1372 patients), but were able to obtain data for only 5 of these trials (with a total of 844 patients).4 They found a 38% reduction in 6-month mortality for patients who received hospital care at home, as well as significantly higher patient satisfaction across a range of medical conditions, including patients with cellulitis and community-acquired pneumonia, as well as elderly patients with multiple medical conditions. The authors concluded that hospital care at home was less expensive than admission to an acute care hospital.4 Similarly, a meta-analysis done by Caplan et al5 that included 61 randomized controlled trials concluded that hospital at home is associated with reductions in mortality, readmission rates, and cost, and increases in patient and caregiver satisfaction. Levine et al2 found reduced costs and utilization with home hospitalization compared to in-hospital care, as well as improved patient mobility status.
The home is the ideal place to empower patients and caregivers to engage in self-management.2 Receiving hospital care at home eliminates the need for dealing with transportation arrangements, traffic, road tolls, and time/scheduling constraints, or finding care for a dependent family member, some of the many stressors that may be experienced by patients who require frequent trips to the hospital. For patients who may not be clinically suitable candidates for hospital at home, such as those requiring critical care intervention and support, the brick-and-mortar hospital is still the appropriate site of care. The hospital-at-home model helps prevent bed shortages in brick-and-mortar hospital settings by allowing hospital care at home for patients who meet preset criteria. These patients can be hospitalized in alternative locations such as their own homes or the residence of a friend. This helps increase health system capacity as well as resiliency.
In addition to expanding safe and appropriate treatment spaces, the hospital-at-home model helps increase access to care for patients during nonstandard hours, including weekends, holidays, or when the waiting time in the emergency room is painfully long. Furthermore, providing care in the home gives the clinical team valuable insight into the patient’s daily life and routine. Performing medication reconciliation with the medicine cabinet in sight and dietary education in a patient’s kitchen are powerful touch points.2 For example, a patient with congestive heart failure who must undergo diuresis is much more likely to meet their care goals when their home diet is aligned with the treatment goal. By being able to see exactly what is in a patient’s pantry and fridge, the care team can create a much more tailored approach to sodium intake and fluid management. Providers can create and execute true patient-centric care as they gain direct insight into the patient’s lifestyle, which is clearly valuable when creating care plans for complex chronic health issues.
Challenges to Implementation and Scaling
Although there are clear benefits to hospital at home, how to best implement and scale this model presents a challenge. In addition to educating patients and families about this model of care, health care systems must expand their hospital-at-home programs and provide education about this model to clinical staff and trainees, and insurers must create reimbursement paradigms. Patients meeting eligibility criteria to enroll in hospital at home is the easiest hurdle, as hospital-at-home programs function best when they enroll and service as many patients as possible, including underserved populations.
Upfront Costs and Cost Savings
While there are upfront costs to set up technology and coordinate services, hospital at home also provides significant total cost savings when compared to coordination associated with brick-and-mortar admission. Hospital care accounts for about one-third of total medical expenditures and is a leading cause of debt.2 Eliminating fixed hospital costs such as facility, overhead, and equipment costs through adoption of the hospital-at-home model can lead to a reduction in expenditures. It has been found that fewer laboratory and diagnostic tests are ordered for hospital-at-home patients when compared to similar patients in brick-and-mortar hospital settings, with comparable or better clinical patient outcomes.6 Furthermore, it is estimated that there are cost savings of 19% to 30% when compared to traditional inpatient care.6 Without legislative action, upon the end of the current COVID-19 public health emergency, the Centers for Medicare & Medicaid Service’s Acute Hospital Care at Home waiver will terminate. This could slow down scaling of the model.However, over the past 2 years there has been enough buy-in from major health systems and patients to continue the momentum of the model’s growth. When setting up a hospital-at-home program, it would be wise to consider a few factors: where in the hospital or health system entity structure the hospital-at-home program will reside, which existing resources can be leveraged within the hospital or health system, and what are the state or federal regulatory requirements for such a program. This type of program continues to fill gaps within the US health care system, meeting the needs of widely overlooked populations and increasing access to essential ancillary services.
Conclusion
It is time to consider our bias toward hospital-first options when managing the care needs of our patients. Health care providers have the option to advocate for holistic care, better experience, and better outcomes. Home-based options are safe, equitable, and patient-centric. Increased costs, consumerism, and technology have pushed us to think about alternative approaches to patient care delivery, and the pandemic created a unique opportunity to see just how far the health care system could stretch itself with capacity constraints, insufficient resources, and staff shortages. In light of new possibilities, it is time to reimagine and transform our health care delivery system so that it is unified, seamless, cohesive, and flexible.
Corresponding author: Payal Sharma, DNP, MSN, RN, FNP-BC, CBN; [email protected].
Disclosures: None reported.
1. Cai S, Laurel PA, Makineni R, Marks ML. Evaluation of a hospital-in-home program implemented among veterans. Am J Manag Care. 2017;23(8):482-487.
2. Levine DM, Ouchi K, Blanchfield B, et al. Hospital-level care at home for acutely ill adults: a pilot randomized controlled trial. J Gen Intern Med. 2018;33(5):729-736. doi:10.1007/s11606-018-4307-z
3. Shuman V, Coyle PC, Perera S,et al. Association between improved mobility and distal health outcomes. J Gerontol A Biol Sci Med Sci. 2020;75(12):2412-2417. doi:10.1093/gerona/glaa086
4. Shepperd S, Doll H, Angus RM, et al. Avoiding hospital admission through provision of hospital care at home: a systematic review and meta-analysis of individual patient data. CMAJ. 2009;180(2):175-182. doi:10.1503/cmaj.081491
5. Caplan GA, Sulaiman NS, Mangin DA, et al. A meta-analysis of “hospital in the home”. Med J Aust. 2012;197(9):512-519. doi:10.5694/mja12.10480
6. Hospital at Home. Johns Hopkins Medicine. Healthcare Solutions. Accessed May 20, 2022. https://www.johnshopkinssolutions.com/solution/hospital-at-home/
The Intersection of Clinical Quality Improvement Research and Implementation Science
The Institute of Medicine brought much-needed attention to the need for process improvement in medicine with its seminal report To Err Is Human: Building a Safer Health System, which was issued in 1999, leading to the quality movement’s call to close health care performance gaps in Crossing the Quality Chasm: A New Health System for the 21st Century.1,2 Quality improvement science in medicine has evolved over the past 2 decades to include a broad spectrum of approaches, from agile improvement to continuous learning and improvement. Current efforts focus on Lean-based process improvement along with a reduction in variation in clinical practice to align practice with the principles of evidence-based medicine in a patient-centered approach.3 Further, the definition of quality improvement under the Affordable Care Act was framed as an equitable, timely, value-based, patient-centered approach to achieving population-level health goals.4 Thus, the science of quality improvement drives the core principles of care delivery improvement, and the rigorous evidence needed to expand innovation is embedded within the same framework.5,6 In clinical practice, quality improvement projects aim to define gaps and then specific steps are undertaken to improve the evidence-based practice of a specific process. The overarching goal is to enhance the efficacy of the practice by reducing waste within a particular domain. Thus, quality improvement and implementation research eventually unify how clinical practice is advanced concurrently to bridge identified gaps.7
System redesign through a patient-centered framework forms the core of an overarching strategy to support system-level processes. Both require a deep understanding of the fields of quality improvement science and implementation science.8 Furthermore, aligning clinical research needs, system aims, patients’ values, and clinical care give the new design a clear path forward. Patient-centered improvement includes the essential elements of system redesign around human factors, including communication, physical resources, and updated information during episodes of care. The patient-centered improvement design is juxtaposed with care planning and establishing continuum of care processes.9 It is essential to note that safety is rooted within the quality domain as a top priority in medicine.10 The best implementation methods and approaches are discussed and debated, and the improvement progress continues on multiple fronts.11 Patient safety systems are implemented simultaneously during the redesign phase. Moreover, identifying and testing the health care delivery methods in the era of competing strategic priorities to achieve the desirable clinical outcomes highlights the importance of implementation, while contemplating the methods of dissemination, scalability, and sustainability of the best evidence-based clinical practice.
The cycle of quality improvement research completes the system implementation efforts. The conceptual framework of quality improvement includes multiple areas of care and transition, along with applying the best clinical practices in a culture that emphasizes continuous improvement and learning. At the same time, the operating principles should include continuous improvement in a simple and continuous system of learning as a core concept. Our proposed implementation approach involves taking simple and practical steps while separating the process from the outcomes measures, extracting effectiveness throughout the process. It is essential to keep in mind that building a proactive and systematic improvement environment requires a framework for safety, reliability, and effective care, as well as the alignment of the physical system, communication, and professional environment and culture (Figure).

In summary, system design for quality improvement research should incorporate the principles and conceptual framework that embody effective implementation strategies, with a focus on operational and practical steps. Continuous improvement will be reached through the multidimensional development of current health care system metrics and the incorporation of implementation science methods.
Corresponding author: Ebrahim Barkoudah, MD, MPH, Department of Medicine, Brigham and Women’s Hospital, Boston, MA; [email protected]
Disclosures: None reported.
1. Institute of Medicine (US) Committee on Quality of Health Care in America. To Err is Human: Building a Safer Health System. Kohn LT, Corrigan JM, Donaldson MS, editors. Washington (DC): National Academies Press (US); 2000.
2. Institute of Medicine (US) Committee on Quality of Health Care in America. Crossing the Quality Chasm: A New Health System for the 21st Century. Washington (DC): National Academies Press (US); 2001.
3. Berwick DM. The science of improvement. JAMA. 2008;299(10):1182-1184. doi:10.1001/jama.299.10.1182
4. Mazurenko O, Balio CP, Agarwal R, Carroll AE, Menachemi N. The effects of Medicaid expansion under the ACA: a systematic review. Health Affairs. 2018;37(6):944-950. doi: 10.1377/hlthaff.2017.1491
5. Fan E, Needham DM. The science of quality improvement. JAMA. 2008;300(4):390-391. doi:10.1001/jama.300.4.390-b
6. Alexander JA, Hearld LR. The science of quality improvement implementation: developing capacity to make a difference. Med Care. 2011:S6-20. doi:10.1097/MLR.0b013e3181e1709c
7. Rohweder C, Wangen M, Black M, et al. Understanding quality improvement collaboratives through an implementation science lens. Prev Med. 2019;129:105859. doi: 10.1016/j.ypmed.2019.105859
8. Bergeson SC, Dean JD. A systems approach to patient-centered care. JAMA. 2006;296(23):2848-2851. doi:10.1001/jama.296.23.2848
9. Leonard M, Graham S, Bonacum D. The human factor: the critical importance of effective teamwork and communication in providing safe care. Qual Saf Health Care. 2004;13 Suppl 1(Suppl 1):i85-90. doi:10.1136/qhc.13.suppl_1.i85
10. Leape LL, Berwick DM, Bates DW. What practices will most improve safety? Evidence-based medicine meets patient safety. JAMA. 2002;288(4):501-507. doi:10.1001/jama.288.4.501
11. Auerbach AD, Landefeld CS, Shojania KG. The tension between needing to improve care and knowing how to do it. N Engl J Med. 2007;357(6):608-613. doi:10.1056/NEJMsb070738
The Institute of Medicine brought much-needed attention to the need for process improvement in medicine with its seminal report To Err Is Human: Building a Safer Health System, which was issued in 1999, leading to the quality movement’s call to close health care performance gaps in Crossing the Quality Chasm: A New Health System for the 21st Century.1,2 Quality improvement science in medicine has evolved over the past 2 decades to include a broad spectrum of approaches, from agile improvement to continuous learning and improvement. Current efforts focus on Lean-based process improvement along with a reduction in variation in clinical practice to align practice with the principles of evidence-based medicine in a patient-centered approach.3 Further, the definition of quality improvement under the Affordable Care Act was framed as an equitable, timely, value-based, patient-centered approach to achieving population-level health goals.4 Thus, the science of quality improvement drives the core principles of care delivery improvement, and the rigorous evidence needed to expand innovation is embedded within the same framework.5,6 In clinical practice, quality improvement projects aim to define gaps and then specific steps are undertaken to improve the evidence-based practice of a specific process. The overarching goal is to enhance the efficacy of the practice by reducing waste within a particular domain. Thus, quality improvement and implementation research eventually unify how clinical practice is advanced concurrently to bridge identified gaps.7
System redesign through a patient-centered framework forms the core of an overarching strategy to support system-level processes. Both require a deep understanding of the fields of quality improvement science and implementation science.8 Furthermore, aligning clinical research needs, system aims, patients’ values, and clinical care give the new design a clear path forward. Patient-centered improvement includes the essential elements of system redesign around human factors, including communication, physical resources, and updated information during episodes of care. The patient-centered improvement design is juxtaposed with care planning and establishing continuum of care processes.9 It is essential to note that safety is rooted within the quality domain as a top priority in medicine.10 The best implementation methods and approaches are discussed and debated, and the improvement progress continues on multiple fronts.11 Patient safety systems are implemented simultaneously during the redesign phase. Moreover, identifying and testing the health care delivery methods in the era of competing strategic priorities to achieve the desirable clinical outcomes highlights the importance of implementation, while contemplating the methods of dissemination, scalability, and sustainability of the best evidence-based clinical practice.
The cycle of quality improvement research completes the system implementation efforts. The conceptual framework of quality improvement includes multiple areas of care and transition, along with applying the best clinical practices in a culture that emphasizes continuous improvement and learning. At the same time, the operating principles should include continuous improvement in a simple and continuous system of learning as a core concept. Our proposed implementation approach involves taking simple and practical steps while separating the process from the outcomes measures, extracting effectiveness throughout the process. It is essential to keep in mind that building a proactive and systematic improvement environment requires a framework for safety, reliability, and effective care, as well as the alignment of the physical system, communication, and professional environment and culture (Figure).
In summary, system design for quality improvement research should incorporate the principles and conceptual framework that embody effective implementation strategies, with a focus on operational and practical steps. Continuous improvement will be reached through the multidimensional development of current health care system metrics and the incorporation of implementation science methods.
Corresponding author: Ebrahim Barkoudah, MD, MPH, Department of Medicine, Brigham and Women’s Hospital, Boston, MA; [email protected]
Disclosures: None reported.
1. Institute of Medicine (US) Committee on Quality of Health Care in America. To Err is Human: Building a Safer Health System. Kohn LT, Corrigan JM, Donaldson MS, editors. Washington (DC): National Academies Press (US); 2000.
2. Institute of Medicine (US) Committee on Quality of Health Care in America. Crossing the Quality Chasm: A New Health System for the 21st Century. Washington (DC): National Academies Press (US); 2001.
3. Berwick DM. The science of improvement. JAMA. 2008;299(10):1182-1184. doi:10.1001/jama.299.10.1182
4. Mazurenko O, Balio CP, Agarwal R, Carroll AE, Menachemi N. The effects of Medicaid expansion under the ACA: a systematic review. Health Affairs. 2018;37(6):944-950. doi: 10.1377/hlthaff.2017.1491
5. Fan E, Needham DM. The science of quality improvement. JAMA. 2008;300(4):390-391. doi:10.1001/jama.300.4.390-b
6. Alexander JA, Hearld LR. The science of quality improvement implementation: developing capacity to make a difference. Med Care. 2011:S6-20. doi:10.1097/MLR.0b013e3181e1709c
7. Rohweder C, Wangen M, Black M, et al. Understanding quality improvement collaboratives through an implementation science lens. Prev Med. 2019;129:105859. doi: 10.1016/j.ypmed.2019.105859
8. Bergeson SC, Dean JD. A systems approach to patient-centered care. JAMA. 2006;296(23):2848-2851. doi:10.1001/jama.296.23.2848
9. Leonard M, Graham S, Bonacum D. The human factor: the critical importance of effective teamwork and communication in providing safe care. Qual Saf Health Care. 2004;13 Suppl 1(Suppl 1):i85-90. doi:10.1136/qhc.13.suppl_1.i85
10. Leape LL, Berwick DM, Bates DW. What practices will most improve safety? Evidence-based medicine meets patient safety. JAMA. 2002;288(4):501-507. doi:10.1001/jama.288.4.501
11. Auerbach AD, Landefeld CS, Shojania KG. The tension between needing to improve care and knowing how to do it. N Engl J Med. 2007;357(6):608-613. doi:10.1056/NEJMsb070738
A Quantification Method to Compare the Value of Surgery and Palliative Care in Patients With Complex Cardiac Disease: A Concept
From the Department of Cardiothoracic Surgery, Stanford University, Stanford, CA.
Abstract
Complex cardiac patients are often referred for surgery or palliative care based on the risk of perioperative mortality. This decision ignores factors such as quality of life or duration of life in either surgery or the palliative path. Here, we propose a model to numerically assess and compare the value of surgery vs palliation. This model includes quality and duration of life, as well as risk of perioperative mortality, and involves a patient’s preferences in the decision-making process.
For each pathway, surgery or palliative care, a value is calculated and compared to a normal life value (no disease symptoms and normal life expectancy). The formula is adjusted for the risk of operative mortality. The model produces a ratio of the value of surgery to the value of palliative care that signifies the superiority of one or another. This model calculation presents an objective estimated numerical value to compare the value of surgery and palliative care. It can be applied to every decision-making process before surgery. In general, if a procedure has the potential to significantly extend life in a patient who otherwise has a very short life expectancy with palliation only, performing high-risk surgery would be a reasonable option. A model that provides a numerical value for surgery vs palliative care and includes quality and duration of life in each pathway could be a useful tool for cardiac surgeons in decision making regarding high-risk surgery.
Keywords: high-risk surgery, palliative care, quality of life, life expectancy.
Patients with complex cardiovascular disease are occasionally considered inoperable due to the high risk of surgical mortality. When the risk of perioperative mortality (POM) is predicted to be too high, surgical intervention is denied, and patients are often referred to palliative care. The risk of POM in cardiac surgery is often calculated using large-scale databases, such as the Society of Thoracic Surgeons (STS) records. The STS risk models, which are regularly updated, are based on large data sets and incorporate precise statistical methods for risk adjustment.1 In general, these calculators provide a percentage value that defines the magnitude of the risk of death, and then an arbitrary range is selected to categorize the procedure as low, medium, or high risk or inoperable status. The STS database does not set a cutoff point or range to define “operability.” Assigning inoperable status to a certain risk rate is problematic, with many ethical, legal, and moral implications, and for this reason, it has mostly remained undefined. In contrast, the low- and medium-risk ranges are easier to define. Another limitation encountered in the STS database is the lack of risk data for less common but very high-risk procedures, such as a triple valve replacement.
A common example where risk classification has been defined is in patients who are candidates for surgical vs transcatheter aortic valve replacement. Some groups have described a risk of <4% as low risk, 4% to 8% as intermediate risk, >8% as high risk, and >15% as inoperable2; for some other groups, a risk of POM >50% is considered extreme risk or inoperable.3,4 This procedure-specific classification is a useful decision-making tool and helps the surgeon perform an initial risk assessment to allocate a specific patient to a group—operable or nonoperable—only by calculating the risk of surgical death. However, this allocation method does not provide any information on how and when death occurs in either group. These 2 parameters of how and when death occurs define the quality of life (QOL) and the duration of life (DOL), respectively, and together could be considered as the value of life in each pathway. A survivor of a high-risk surgery may benefit from good quality and extended life (a high value), or, on the other end of the spectrum, a high-risk patient who does not undergo surgery is spared the mortality risk of the surgery but dies sooner (low value) with symptoms due to the natural course of the untreated disease.
The central question is, if a surgery is high risk but has the potential of providing a good value (for those who survive it), what QOL and DOL values are acceptable to risk or to justify accepting and proceeding with a risky surgery? Or how high a POM risk is justified to proceed with surgery rather than the alternative palliative care with a certain quality and duration? It is obvious that a decision-making process that is based on POM cannot compare the value of surgery (Vs) and the value of palliation (Vp). Furthermore, it ignores patient preferences and their input, as these are excluded from this decision-making process.
To be able to include QOL and DOL in any decision making, one must precisely describe these parameters. Both QOL and DOL are used for estimation of disease burden by health care administrators, public health experts, insurance agencies, and others. Multiple models have been proposed and used to estimate the overall burden of the disease. Most of the models for this purpose are created for large-scale economic purposes and not for decision making in individual cases.
An important measure is the quality-adjusted life year (QALY). This is an important parameter since it includes both measures of quality and quantity of life.5,6 QALY is a simplified measure to assess the value of health outcomes, and it has been used in economic calculations to assess mainly the cost-effectiveness of various interventions. We sought to evaluate the utility of a similar method in adding further insight into the surgical decision-making process. In this article, we propose a simple model to compare the value of surgery vs palliative care, similar to QALY. This model includes and adjusts for the quality and the quantity of life, in addition to the risk of POM, in the decision-making process for high-risk patients.
The Model
The 2 decision pathways, surgery and palliative care, are compared for their value. We define the value as the product of QOL and DOL in each pathway and use the severity of the symptoms as a surrogate for QOL. If duration and quality were depicted on the x and y axes of a graph (Figure 1), then the area under the curve would represent the collective value in each situation. Figure 2 shows the timeline and the different pathways with each decision. The value in each situation is calculated in relation to the full value, which is represented as the value of normal life (Vn), that is, life without disease and with normal life expectancy. The values of each decision pathway, the value of surgery (Vs) and the value of palliation (Vp), are then compared to define the benefit for each decision as follows:
If Vs/Vp > 1, the benefit is toward surgery;
If Vs/Vp < 1, the benefit is for palliative care.
 and in different disease pathways taken from a single sample")

Definitions
Both quality and duration of life are presented on a 1-10 scale, 1 being the lowest and 10 the highest value, to yield a product with a value of 100 in normal, disease-free life. Any lower value is presented as a percentage to represent the comparison to the full value. QOL is determined by degradation of full quality with the average level of symptoms. DOL is calculated as a lost time (
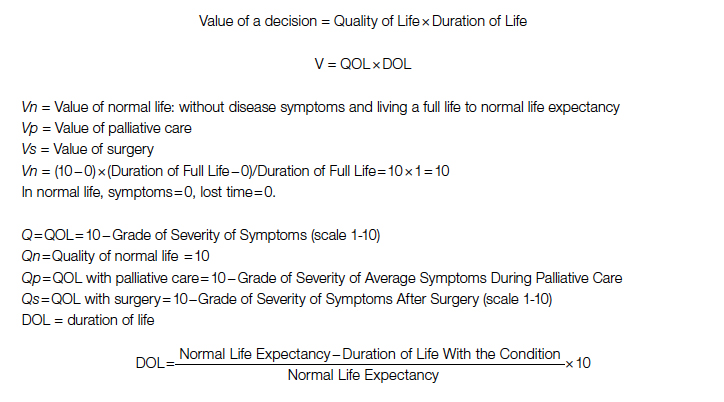
For the DOL under any condition, a 10-year survival rate could be used as a surrogate in this formula. Compared to life expectancy value, using the 10-year survival rate simplifies the calculation since cardiac diseases are more prevalent in older age, close to or beyond the average life expectancy value.
Using the time intervals from the timeline in Figure 2:
dh = time interval from diagnosis to death at life expectancy
dg = time interval from diagnosis to death after successful surgery
df = time interval from diagnosis to death after palliative care
Duration for palliative care:

Duration for surgery:
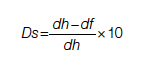
Adjustment: This value is calculated for those who survive the surgery. To adjust for the POM, it is multiplied by the 100 − POM risk.
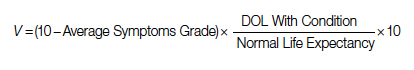
Since value is the base for comparison in this model, and it is the product of 2 equally important factors in the formula (
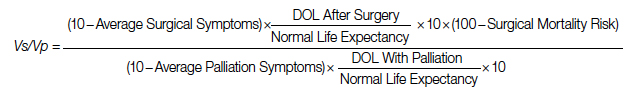
After elimination of normal life expectancy, form the numerator and denominator:
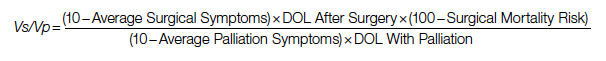
To adjust for surgical outcomes in special circumstances where less than optimal or standard surgical results are expected (eg, in very rare surgeries, limited resource institutions, or suboptimal postoperative surgical care), an optional coefficient R can be added to the numerator (surgical value). This optional coefficient, with values such as 0.8, 0.9 (to degrade the value of surgery) or 1 (standard surgical outcome), adjusts for variability in interinstitutional surgical results or surgeon variability. No coefficient is added to the denominator since palliative care provides minimal differences between clinicians and hospitals. Thus, the final adjusted formula would be as follows:
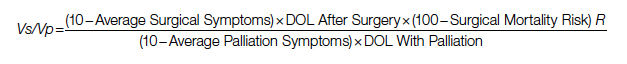
Example
A 60-year-old patient with a 10% POM risk needs to be allocated to surgical or palliative care. With palliative care, if this patient lived 6 years with average symptoms grade 4, the Vp would be 20; that is, 20% of the normal life value (if he lived 18 years instead without the disease).
Using the formula for calculation of value in each pathway:
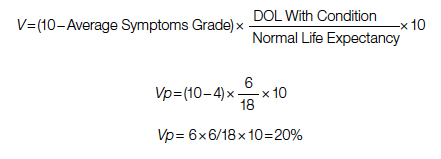
If the same patient undergoes a surgery with a 10% risk of POM, with an average grade 2 related to surgical recovery symptoms for 1 year and then is symptom-free and lives 12 years (instead of 18 years [life expectancy]), his Vs would be 53, or 53% out of the normal life value that is saved if the surgery is 100% successful; adjusted Vs with (chance of survival of 90%) would be 53 × 90% = 48%.
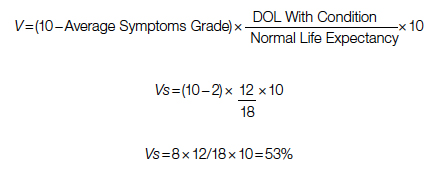
With adjustment of 90% survival chance in surgery, 53 × 90% = 48%. In this example, Vs/Vp = 48/20 = 2.4, showing a significant benefit for surgical care. Notably, the unknown value of normal life expectancy is not needed for the calculation of Vs/Vp, since it is the same in both pathways and it is eliminated by calculation in fraction.
Based on this formula, since the duration of surgical symptoms is short, no matter how severe these are, if the potential duration of life after surgery is high (represented by smaller area under the curve in Figure 1), the numerator becomes larger and the value of the surgery grows. For example, if a patient with a 15% risk of POM, which is generally considered inoperable, lives 5 years, as opposed to 2 years with palliative care with mild symptoms (eg 3/10), Vs/Vp would be 2.7, still showing a significant benefit for surgical care.
Discussion
Any surgical intervention is offered with 2 goals in mind, improving QOL and extending DOL. In a high-risk patient, surgery might be declined due to a high risk of POM, and the patient is offered palliative care, which other than providing symptom relief does not change the course of disease and eventually the patient will die due to the untreated disease. In this decision-making method, mostly completed by a care team only, a potential risk of death due to surgery which possibly could cure the patient is traded for immediate survival; however, the symptomatic course ensues until death. This mostly unilateral decision-making process by a care team, which incorporates minimal input from the patient or ignores patient preferences altogether, is based only on POM risk, and roughly includes a single parameter: years of potential life lost (YPLL). YPLL is a measure of premature mortality, and in the setting of surgical intervention, YPLL is the number of years a patient would lose unless a successful surgery were undertaken. Obviously, patients would live longer if a surgery that was intended to save them failed.
In this article, we proposed a simple method to quantify each decision to decide whether to operate or choose surgical care vs palliative care. Since quality and duration of life are both end factors clinicians and patients aspire to in each decision, they can be considered together as the value of each decision. We believe a numerical framework would provide an objective way to assist both the patient at high risk and the care team in the decision-making process.
The 2 parameters we consider are DOL and QOL. DOL, or survival, can be extracted from large-scale data using statistical methods that have been developed to predict survival under various conditions, such as Kaplan-Meier curves. These methods present the chance of survival in percentages in a defined time frame, such as a 5- or 10-year period.
While the DOL is a numerical parameter and quantifiable, the QOL is a more complex entity. This subjective parameter bears multiple definitions, aspects, and categories, and therefore multiple scales for quantification of QOL have been proposed. These scales have been used extensively for the purpose of health determination in health care policy and economic planning. Most scales acknowledge that QOL is multifactorial and includes interrelated aspects such as mental and socioeconomic factors. We have also noticed that QOL is better determined by the palliative care team than surgeons, so including these care providers in the decision-making process might reduce surgeon bias.
Since our purpose here is only to assist with the decision on medical intervention, we focus on physical QOL. Multiple scales are used to assess health-related QOL, such as the Assessment of Quality of Life (AQoL)-8D,7 EuroQol-5 Dimension (EQ-5D),8 15D,9 and the 36-Item Short Form Survey (SF-36).10 These complex scales are built for systematic reviews, and they are not practical for a clinical user. To simplify and keep this practical, we define QOL by using the severity or grade of symptoms related to the disease the patient has on a scale of 0 to 10. The severity of symptoms can be easily determined using available scales. An applicable scale for this purpose is the Edmonton Symptom Assessment Scale (ESAS), which has been in use for years and has evolved as a useful tool in the medical field.11
Once DOL and QOL are determined on a 1-10 scale, the multiplied value then provides a product that we consider a value. The highest value hoped for in each decision is the achievement of the best QOL and DOL, a value of 100. In Figure 1, a graphic presentation of value in each decision is best seen as the area under the curve. As shown, a successful surgery, even when accompanied by significant symptoms during initial recovery, has a chance (100 – risk of POM%) to gain a larger area under curve (value) by achieving a longer life with no or fewer symptoms. However, in palliative care, progressing disease and even palliated symptoms with a shorter life expectancy impose a large burden on the patient and a much lower value. Note that in this calculation, life expectancy, which is an important but unpredictable factor, is initially included; however, by ratio comparison, it is eliminated, simplifying the calculation further.
Using this formula in different settings reveals that high-risk surgery has a greater potential to reduce YPLL in the general population. Based on this formula, compared to a surgery with potential to significantly extend DOL, a definite shorter and symptomatic life course with palliative care makes it a significantly less favorable option. In fact, in the cardiovascular field, palliative care has minimal or no effect on natural history, as the mechanism of illness is mechanical, such as occlusion of coronary arteries or valve dysfunction, leading eventually to heart failure and death. In a study by Xu et al, although palliative care reduced readmission rates and improved symptoms on a variety of scales, there was no effect on mortality and QOL in patients with heart failure.12
No model in this field has proven to be ideal, and this model bears multiple limitations as well. We have used severity of symptoms as a surrogate for QOL based on the fact that cardiac patients with different pathologies who are untreated will have a common final pathway with development of heart failure symptoms that dictate their QOL. Also, grading QOL is a difficult task at times. Even a model such as QALY, which is one of the most used, is not a perfect model and is not free of problems.6 The difference in surgical results and life expectancy between sexes and ethnic groups might be a source of bias in this formula. Also, multiple factors directly and indirectly affect QOL and DOL and create inaccuracies; therefore, making an exact science from an inexact one naturally relies on multiple assumptions. Although it has previously been shown that most POM occurs in a short period of time after cardiac surgery,13 long-term complications that potentially degrade QOL are not included in this model. By applying this model, one must assume indefinite economic resources. Moreover, applying a single mathematical model in a biologic system and in the general population has intrinsic shortcomings, and it must overlook many other factors (eg, ethical, legal). For example, it will be hard to justify a failed surgery with 15% risk of POM undertaken to eliminate the severe long-lasting symptoms of a disease, while the outcome of a successful surgery with a 20% risk of POM that adds life and quality would be ignored in the current health care system. Thus, regardless of the significant potential, most surgeons would waive a surgery based solely on the percentage rate of POM, perhaps using other terms such as ”peri-nonoperative mortality.”
Conclusion
We have proposed a simple and practical formula for decision making regarding surgical vs palliative care in high-risk patients. By assigning a value that is composed of QOL and DOL in each pathway and including the risk of POM, a ratio of values provides a numerical estimation that can be used to show preference over a specific decision. An advantage of this formula, in addition to presenting an arithmetic value that is easier to understand, is that it can be used in shared decision making with patients. We emphasize that this model is only a preliminary concept at this time and has not been tested or validated for clinical use. Validation of such a model will require extensive work and testing within a large-scale population. We hope that this article will serve as a starting point for the development of other models, and that this formula will become more sophisticated with fewer limitations through larger multidisciplinary efforts in the future.
Corresponding author: Rabin Gerrah, MD, Good Samaritan Regional Medical Center, 3640 NW Samaritan Drive, Suite 100B, Corvallis, OR 97330; [email protected].
Disclosures: None reported.
1. O’Brien SM, Feng L, He X, et al. The Society of Thoracic Surgeons 2018 Adult Cardiac Surgery Risk Models: Part 2-statistical methods and results. Ann Thorac Surg. 2018;105(5):1419-1428. doi: 10.1016/j.athoracsur.2018.03.003
2. Hurtado Rendón IS, Bittenbender P, Dunn JM, Firstenberg MS. Chapter 8: Diagnostic workup and evaluation: eligibility, risk assessment, FDA guidelines. In: Transcatheter Heart Valve Handbook: A Surgeons’ and Interventional Council Review. Akron City Hospital, Summa Health System, Akron, OH.
3. Herrmann HC, Thourani VH, Kodali SK, et al; PARTNER Investigators. One-year clinical outcomes with SAPIEN 3 transcatheter aortic valve replacement in high-risk and inoperable patients with severe aortic stenosis. Circulation. 2016;134:130-140. doi:10.1161/CIRCULATIONAHA
4. Ho C, Argáez C. Transcatheter Aortic Valve Implantation for Patients with Severe Aortic Stenosis at Various Levels of Surgical Risk: A Review of Clinical Effectiveness. Ottawa (ON): Canadian Agency for Drugs and Technologies in Health; March 19, 2018.
5. Rios-Diaz AJ, Lam J, Ramos MS, et al. Global patterns of QALY and DALY use in surgical cost-utility analyses: a systematic review. PLoS One. 2016:10;11:e0148304. doi:10.1371/journal.pone.0148304
6. Prieto L, Sacristán JA. Health, Problems and solutions in calculating quality-adjusted life years (QALYs). Qual Life Outcomes. 2003:19;1:80.
7. Centre for Health Economics. Assessment of Quality of Life. 2014. Accessed May 13, 2022. http://www.aqol.com.au/
8. EuroQol Research Foundation. EQ-5D. Accessed May 13, 2022. https://euroqol.org/
9. 15D Instrument. Accessed May 13, 2022. http://www.15d-instrument.net/15d/
10. Rand Corporation. 36-Item Short Form Survey (SF-36).Accessed May 12, 2022. https://www.rand.org/health-care/surveys_tools/mos/36-item-short-form.html
11. Hui D, Bruera E. The Edmonton Symptom Assessment System 25 years later: past, present, and future developments. J Pain Symptom Manage. 2017:53:630-643. doi:10.1016/j.jpainsymman.2016
12. Xu Z, Chen L, Jin S, Yang B, Chen X, Wu Z. Effect of palliative care for patients with heart failure. Int Heart J. 2018:30;59:503-509. doi:10.1536/ihj.17-289
13. Mazzeffi M, Zivot J, Buchman T, Halkos M. In-hospital mortality after cardiac surgery: patient characteristics, timing, and association with postoperative length of intensive care unit and hospital stay. Ann Thorac Surg. 2014;97:1220-1225. doi:10.1016/j.athoracsur.2013.10.040
From the Department of Cardiothoracic Surgery, Stanford University, Stanford, CA.
Abstract
Complex cardiac patients are often referred for surgery or palliative care based on the risk of perioperative mortality. This decision ignores factors such as quality of life or duration of life in either surgery or the palliative path. Here, we propose a model to numerically assess and compare the value of surgery vs palliation. This model includes quality and duration of life, as well as risk of perioperative mortality, and involves a patient’s preferences in the decision-making process.
For each pathway, surgery or palliative care, a value is calculated and compared to a normal life value (no disease symptoms and normal life expectancy). The formula is adjusted for the risk of operative mortality. The model produces a ratio of the value of surgery to the value of palliative care that signifies the superiority of one or another. This model calculation presents an objective estimated numerical value to compare the value of surgery and palliative care. It can be applied to every decision-making process before surgery. In general, if a procedure has the potential to significantly extend life in a patient who otherwise has a very short life expectancy with palliation only, performing high-risk surgery would be a reasonable option. A model that provides a numerical value for surgery vs palliative care and includes quality and duration of life in each pathway could be a useful tool for cardiac surgeons in decision making regarding high-risk surgery.
Keywords: high-risk surgery, palliative care, quality of life, life expectancy.
Patients with complex cardiovascular disease are occasionally considered inoperable due to the high risk of surgical mortality. When the risk of perioperative mortality (POM) is predicted to be too high, surgical intervention is denied, and patients are often referred to palliative care. The risk of POM in cardiac surgery is often calculated using large-scale databases, such as the Society of Thoracic Surgeons (STS) records. The STS risk models, which are regularly updated, are based on large data sets and incorporate precise statistical methods for risk adjustment.1 In general, these calculators provide a percentage value that defines the magnitude of the risk of death, and then an arbitrary range is selected to categorize the procedure as low, medium, or high risk or inoperable status. The STS database does not set a cutoff point or range to define “operability.” Assigning inoperable status to a certain risk rate is problematic, with many ethical, legal, and moral implications, and for this reason, it has mostly remained undefined. In contrast, the low- and medium-risk ranges are easier to define. Another limitation encountered in the STS database is the lack of risk data for less common but very high-risk procedures, such as a triple valve replacement.
A common example where risk classification has been defined is in patients who are candidates for surgical vs transcatheter aortic valve replacement. Some groups have described a risk of <4% as low risk, 4% to 8% as intermediate risk, >8% as high risk, and >15% as inoperable2; for some other groups, a risk of POM >50% is considered extreme risk or inoperable.3,4 This procedure-specific classification is a useful decision-making tool and helps the surgeon perform an initial risk assessment to allocate a specific patient to a group—operable or nonoperable—only by calculating the risk of surgical death. However, this allocation method does not provide any information on how and when death occurs in either group. These 2 parameters of how and when death occurs define the quality of life (QOL) and the duration of life (DOL), respectively, and together could be considered as the value of life in each pathway. A survivor of a high-risk surgery may benefit from good quality and extended life (a high value), or, on the other end of the spectrum, a high-risk patient who does not undergo surgery is spared the mortality risk of the surgery but dies sooner (low value) with symptoms due to the natural course of the untreated disease.
The central question is, if a surgery is high risk but has the potential of providing a good value (for those who survive it), what QOL and DOL values are acceptable to risk or to justify accepting and proceeding with a risky surgery? Or how high a POM risk is justified to proceed with surgery rather than the alternative palliative care with a certain quality and duration? It is obvious that a decision-making process that is based on POM cannot compare the value of surgery (Vs) and the value of palliation (Vp). Furthermore, it ignores patient preferences and their input, as these are excluded from this decision-making process.
To be able to include QOL and DOL in any decision making, one must precisely describe these parameters. Both QOL and DOL are used for estimation of disease burden by health care administrators, public health experts, insurance agencies, and others. Multiple models have been proposed and used to estimate the overall burden of the disease. Most of the models for this purpose are created for large-scale economic purposes and not for decision making in individual cases.
An important measure is the quality-adjusted life year (QALY). This is an important parameter since it includes both measures of quality and quantity of life.5,6 QALY is a simplified measure to assess the value of health outcomes, and it has been used in economic calculations to assess mainly the cost-effectiveness of various interventions. We sought to evaluate the utility of a similar method in adding further insight into the surgical decision-making process. In this article, we propose a simple model to compare the value of surgery vs palliative care, similar to QALY. This model includes and adjusts for the quality and the quantity of life, in addition to the risk of POM, in the decision-making process for high-risk patients.
The Model
The 2 decision pathways, surgery and palliative care, are compared for their value. We define the value as the product of QOL and DOL in each pathway and use the severity of the symptoms as a surrogate for QOL. If duration and quality were depicted on the x and y axes of a graph (Figure 1), then the area under the curve would represent the collective value in each situation. Figure 2 shows the timeline and the different pathways with each decision. The value in each situation is calculated in relation to the full value, which is represented as the value of normal life (Vn), that is, life without disease and with normal life expectancy. The values of each decision pathway, the value of surgery (Vs) and the value of palliation (Vp), are then compared to define the benefit for each decision as follows:
If Vs/Vp > 1, the benefit is toward surgery;
If Vs/Vp < 1, the benefit is for palliative care.
Definitions
Both quality and duration of life are presented on a 1-10 scale, 1 being the lowest and 10 the highest value, to yield a product with a value of 100 in normal, disease-free life. Any lower value is presented as a percentage to represent the comparison to the full value. QOL is determined by degradation of full quality with the average level of symptoms. DOL is calculated as a lost time (
For the DOL under any condition, a 10-year survival rate could be used as a surrogate in this formula. Compared to life expectancy value, using the 10-year survival rate simplifies the calculation since cardiac diseases are more prevalent in older age, close to or beyond the average life expectancy value.
Using the time intervals from the timeline in Figure 2:
dh = time interval from diagnosis to death at life expectancy
dg = time interval from diagnosis to death after successful surgery
df = time interval from diagnosis to death after palliative care
Duration for palliative care:
Duration for surgery:
Adjustment: This value is calculated for those who survive the surgery. To adjust for the POM, it is multiplied by the 100 − POM risk.
Since value is the base for comparison in this model, and it is the product of 2 equally important factors in the formula (
After elimination of normal life expectancy, form the numerator and denominator:
To adjust for surgical outcomes in special circumstances where less than optimal or standard surgical results are expected (eg, in very rare surgeries, limited resource institutions, or suboptimal postoperative surgical care), an optional coefficient R can be added to the numerator (surgical value). This optional coefficient, with values such as 0.8, 0.9 (to degrade the value of surgery) or 1 (standard surgical outcome), adjusts for variability in interinstitutional surgical results or surgeon variability. No coefficient is added to the denominator since palliative care provides minimal differences between clinicians and hospitals. Thus, the final adjusted formula would be as follows:
Example
A 60-year-old patient with a 10% POM risk needs to be allocated to surgical or palliative care. With palliative care, if this patient lived 6 years with average symptoms grade 4, the Vp would be 20; that is, 20% of the normal life value (if he lived 18 years instead without the disease).
Using the formula for calculation of value in each pathway:
If the same patient undergoes a surgery with a 10% risk of POM, with an average grade 2 related to surgical recovery symptoms for 1 year and then is symptom-free and lives 12 years (instead of 18 years [life expectancy]), his Vs would be 53, or 53% out of the normal life value that is saved if the surgery is 100% successful; adjusted Vs with (chance of survival of 90%) would be 53 × 90% = 48%.
With adjustment of 90% survival chance in surgery, 53 × 90% = 48%. In this example, Vs/Vp = 48/20 = 2.4, showing a significant benefit for surgical care. Notably, the unknown value of normal life expectancy is not needed for the calculation of Vs/Vp, since it is the same in both pathways and it is eliminated by calculation in fraction.
Based on this formula, since the duration of surgical symptoms is short, no matter how severe these are, if the potential duration of life after surgery is high (represented by smaller area under the curve in Figure 1), the numerator becomes larger and the value of the surgery grows. For example, if a patient with a 15% risk of POM, which is generally considered inoperable, lives 5 years, as opposed to 2 years with palliative care with mild symptoms (eg 3/10), Vs/Vp would be 2.7, still showing a significant benefit for surgical care.
Discussion
Any surgical intervention is offered with 2 goals in mind, improving QOL and extending DOL. In a high-risk patient, surgery might be declined due to a high risk of POM, and the patient is offered palliative care, which other than providing symptom relief does not change the course of disease and eventually the patient will die due to the untreated disease. In this decision-making method, mostly completed by a care team only, a potential risk of death due to surgery which possibly could cure the patient is traded for immediate survival; however, the symptomatic course ensues until death. This mostly unilateral decision-making process by a care team, which incorporates minimal input from the patient or ignores patient preferences altogether, is based only on POM risk, and roughly includes a single parameter: years of potential life lost (YPLL). YPLL is a measure of premature mortality, and in the setting of surgical intervention, YPLL is the number of years a patient would lose unless a successful surgery were undertaken. Obviously, patients would live longer if a surgery that was intended to save them failed.
In this article, we proposed a simple method to quantify each decision to decide whether to operate or choose surgical care vs palliative care. Since quality and duration of life are both end factors clinicians and patients aspire to in each decision, they can be considered together as the value of each decision. We believe a numerical framework would provide an objective way to assist both the patient at high risk and the care team in the decision-making process.
The 2 parameters we consider are DOL and QOL. DOL, or survival, can be extracted from large-scale data using statistical methods that have been developed to predict survival under various conditions, such as Kaplan-Meier curves. These methods present the chance of survival in percentages in a defined time frame, such as a 5- or 10-year period.
While the DOL is a numerical parameter and quantifiable, the QOL is a more complex entity. This subjective parameter bears multiple definitions, aspects, and categories, and therefore multiple scales for quantification of QOL have been proposed. These scales have been used extensively for the purpose of health determination in health care policy and economic planning. Most scales acknowledge that QOL is multifactorial and includes interrelated aspects such as mental and socioeconomic factors. We have also noticed that QOL is better determined by the palliative care team than surgeons, so including these care providers in the decision-making process might reduce surgeon bias.
Since our purpose here is only to assist with the decision on medical intervention, we focus on physical QOL. Multiple scales are used to assess health-related QOL, such as the Assessment of Quality of Life (AQoL)-8D,7 EuroQol-5 Dimension (EQ-5D),8 15D,9 and the 36-Item Short Form Survey (SF-36).10 These complex scales are built for systematic reviews, and they are not practical for a clinical user. To simplify and keep this practical, we define QOL by using the severity or grade of symptoms related to the disease the patient has on a scale of 0 to 10. The severity of symptoms can be easily determined using available scales. An applicable scale for this purpose is the Edmonton Symptom Assessment Scale (ESAS), which has been in use for years and has evolved as a useful tool in the medical field.11
Once DOL and QOL are determined on a 1-10 scale, the multiplied value then provides a product that we consider a value. The highest value hoped for in each decision is the achievement of the best QOL and DOL, a value of 100. In Figure 1, a graphic presentation of value in each decision is best seen as the area under the curve. As shown, a successful surgery, even when accompanied by significant symptoms during initial recovery, has a chance (100 – risk of POM%) to gain a larger area under curve (value) by achieving a longer life with no or fewer symptoms. However, in palliative care, progressing disease and even palliated symptoms with a shorter life expectancy impose a large burden on the patient and a much lower value. Note that in this calculation, life expectancy, which is an important but unpredictable factor, is initially included; however, by ratio comparison, it is eliminated, simplifying the calculation further.
Using this formula in different settings reveals that high-risk surgery has a greater potential to reduce YPLL in the general population. Based on this formula, compared to a surgery with potential to significantly extend DOL, a definite shorter and symptomatic life course with palliative care makes it a significantly less favorable option. In fact, in the cardiovascular field, palliative care has minimal or no effect on natural history, as the mechanism of illness is mechanical, such as occlusion of coronary arteries or valve dysfunction, leading eventually to heart failure and death. In a study by Xu et al, although palliative care reduced readmission rates and improved symptoms on a variety of scales, there was no effect on mortality and QOL in patients with heart failure.12
No model in this field has proven to be ideal, and this model bears multiple limitations as well. We have used severity of symptoms as a surrogate for QOL based on the fact that cardiac patients with different pathologies who are untreated will have a common final pathway with development of heart failure symptoms that dictate their QOL. Also, grading QOL is a difficult task at times. Even a model such as QALY, which is one of the most used, is not a perfect model and is not free of problems.6 The difference in surgical results and life expectancy between sexes and ethnic groups might be a source of bias in this formula. Also, multiple factors directly and indirectly affect QOL and DOL and create inaccuracies; therefore, making an exact science from an inexact one naturally relies on multiple assumptions. Although it has previously been shown that most POM occurs in a short period of time after cardiac surgery,13 long-term complications that potentially degrade QOL are not included in this model. By applying this model, one must assume indefinite economic resources. Moreover, applying a single mathematical model in a biologic system and in the general population has intrinsic shortcomings, and it must overlook many other factors (eg, ethical, legal). For example, it will be hard to justify a failed surgery with 15% risk of POM undertaken to eliminate the severe long-lasting symptoms of a disease, while the outcome of a successful surgery with a 20% risk of POM that adds life and quality would be ignored in the current health care system. Thus, regardless of the significant potential, most surgeons would waive a surgery based solely on the percentage rate of POM, perhaps using other terms such as ”peri-nonoperative mortality.”
Conclusion
We have proposed a simple and practical formula for decision making regarding surgical vs palliative care in high-risk patients. By assigning a value that is composed of QOL and DOL in each pathway and including the risk of POM, a ratio of values provides a numerical estimation that can be used to show preference over a specific decision. An advantage of this formula, in addition to presenting an arithmetic value that is easier to understand, is that it can be used in shared decision making with patients. We emphasize that this model is only a preliminary concept at this time and has not been tested or validated for clinical use. Validation of such a model will require extensive work and testing within a large-scale population. We hope that this article will serve as a starting point for the development of other models, and that this formula will become more sophisticated with fewer limitations through larger multidisciplinary efforts in the future.
Corresponding author: Rabin Gerrah, MD, Good Samaritan Regional Medical Center, 3640 NW Samaritan Drive, Suite 100B, Corvallis, OR 97330; [email protected].
Disclosures: None reported.
1. O’Brien SM, Feng L, He X, et al. The Society of Thoracic Surgeons 2018 Adult Cardiac Surgery Risk Models: Part 2-statistical methods and results. Ann Thorac Surg. 2018;105(5):1419-1428. doi: 10.1016/j.athoracsur.2018.03.003
2. Hurtado Rendón IS, Bittenbender P, Dunn JM, Firstenberg MS. Chapter 8: Diagnostic workup and evaluation: eligibility, risk assessment, FDA guidelines. In: Transcatheter Heart Valve Handbook: A Surgeons’ and Interventional Council Review. Akron City Hospital, Summa Health System, Akron, OH.
3. Herrmann HC, Thourani VH, Kodali SK, et al; PARTNER Investigators. One-year clinical outcomes with SAPIEN 3 transcatheter aortic valve replacement in high-risk and inoperable patients with severe aortic stenosis. Circulation. 2016;134:130-140. doi:10.1161/CIRCULATIONAHA
4. Ho C, Argáez C. Transcatheter Aortic Valve Implantation for Patients with Severe Aortic Stenosis at Various Levels of Surgical Risk: A Review of Clinical Effectiveness. Ottawa (ON): Canadian Agency for Drugs and Technologies in Health; March 19, 2018.
5. Rios-Diaz AJ, Lam J, Ramos MS, et al. Global patterns of QALY and DALY use in surgical cost-utility analyses: a systematic review. PLoS One. 2016:10;11:e0148304. doi:10.1371/journal.pone.0148304
6. Prieto L, Sacristán JA. Health, Problems and solutions in calculating quality-adjusted life years (QALYs). Qual Life Outcomes. 2003:19;1:80.
7. Centre for Health Economics. Assessment of Quality of Life. 2014. Accessed May 13, 2022. http://www.aqol.com.au/
8. EuroQol Research Foundation. EQ-5D. Accessed May 13, 2022. https://euroqol.org/
9. 15D Instrument. Accessed May 13, 2022. http://www.15d-instrument.net/15d/
10. Rand Corporation. 36-Item Short Form Survey (SF-36).Accessed May 12, 2022. https://www.rand.org/health-care/surveys_tools/mos/36-item-short-form.html
11. Hui D, Bruera E. The Edmonton Symptom Assessment System 25 years later: past, present, and future developments. J Pain Symptom Manage. 2017:53:630-643. doi:10.1016/j.jpainsymman.2016
12. Xu Z, Chen L, Jin S, Yang B, Chen X, Wu Z. Effect of palliative care for patients with heart failure. Int Heart J. 2018:30;59:503-509. doi:10.1536/ihj.17-289
13. Mazzeffi M, Zivot J, Buchman T, Halkos M. In-hospital mortality after cardiac surgery: patient characteristics, timing, and association with postoperative length of intensive care unit and hospital stay. Ann Thorac Surg. 2014;97:1220-1225. doi:10.1016/j.athoracsur.2013.10.040
Are docs getting fed up with hearing about burnout?
There is a feeling of exhaustion, being unable to shake a lingering cold, suffering from frequent headaches and gastrointestinal disturbances, sleeplessness and shortness of breath ...
That was how burnout was described by clinical psychologist Herbert Freudenberger, PhD, who first used the phrase in a paper back in 1974, after observing the emotional depletion and accompanying psychosomatic symptoms among volunteer staff of a free clinic in New York City. He called it “burnout,” a term borrowed from the slang of substance abusers.
It has now been established beyond a shadow of a doubt that burnout is a serious issue facing physicians across specialties, albeit some more intensely than others. But with the constant barrage of stories published on an almost daily basis, along with studies and surveys, it begs the question:
Some have suggested that the focus should be more on tackling burnout and instituting viable solutions rather than rehashing the problem.
There haven’t been studies or surveys on this question, but several experts have offered their opinion.
Jonathan Fisher, MD, a cardiologist and organizational well-being and resiliency leader at Novant Health, Charlotte, N.C., cautioned that he hesitates to speak about what physicians in general believe. “We are a diverse group of nearly 1 million in the United States alone,” he said.
But he noted that there is a specific phenomenon among burned-out health care providers who are “burned out on burnout.”
“Essentially, the underlying thought is ‘talk is cheap and we want action,’” said Dr. Fisher, who is chair and co-founder of the Ending Physician Burnout Global Summit that was held in 2021. “This reaction is often a reflection of disheartened physicians’ sense of hopelessness and cynicism that systemic change to improve working conditions will happen in our lifetime.”
Dr. Fisher explained that “typically, anyone suffering – physicians or nonphysicians – cares more about ending the suffering as soon as possible than learning its causes, but to alleviate suffering at its core – including the emotional suffering of burnout – we must understand the many causes.”
“To address both the organizational and individual drivers of burnout requires a keen awareness of the thoughts, fears, and dreams of physicians, health care executives, and all other stakeholders in health care,” he added.
Burnout, of course, is a very real problem. The 2022 Medscape Physician Burnout & Depression Report found that nearly half of all respondents (47%) said they are burned out, which was higher than the prior year. Perhaps not surprisingly, burnout among emergency physicians took the biggest leap, jumping from 43% in 2021 to 60% this year. More than half of critical care physicians (56%) also reported that they were burned out.
The World Health Organization’s International Classification of Diseases (ICD-11) – the official compendium of diseases – has categorized burnout as a “syndrome” that results from “chronic workplace stress that has not been successfully managed.” It is considered to be an occupational phenomenon and is not classified as a medical condition.
But whether or not physicians are burned out on hearing about burnout remains unclear. “I am not sure if physicians are tired of hearing about ‘burnout,’ but I do think that they want to hear about solutions that go beyond just telling them to take better care of themselves,” said Anne Thorndike, MD, MPH, an internal medicine physician at Massachusetts General Hospital and associate professor of medicine at Harvard Medical School, Boston. “There are major systematic factors that contribute to physicians burning out.”
Why talk about negative outcomes?
Jonathan Ripp, MD, MPH, however, is familiar with this sentiment. “‘Why do we keep identifying a problem without solutions’ is certainly a sentiment that is being expressed,” he said. “It’s a negative outcome, so why do we keep talking about negative outcomes?”
Dr. Ripp, who is a professor of medicine, medical education, and geriatrics and palliative medicine; the senior associate dean for well-being and resilience; and chief wellness officer at Icahn School of Medicine at Mount Sinai, New York, is also a well-known expert and researcher in burnout and physician well-being.
He noted that burnout was one of the first “tools” used as a metric to measure well-being, but it is a negative measurement. “It’s been around a long time, so it has a lot of evidence,” said Dr. Ripp. “But that said, there are other ways of measuring well-being without a negative association, and ways of measuring meaning in work – fulfillment and satisfaction, and so on. It should be balanced.”
But for the average physician not familiar with the long legacy of research, they may be frustrated by this situation. “Then they ask, ‘Why are you just showing me more of this instead of doing something about it?’ but we are actually doing something about it,” said Dr. Ripp.
There are many efforts underway, he explained, but it’s a challenging and complex issue. “There are numerous drivers impacting the well-being of any given segment within the health care workforce,” he said. “It will also vary by discipline and location, and there are also a host of individual factors that may have very little to do with the work environment. There are some very well-established efforts for an organizational approach, but it remains to be seen which is the most effective.”
But in broad strokes, he continued, it’s about tackling the system and not about making an individual more resilient. “Individuals that do engage in activities that improve resilience do better, but that’s not what this is about – it’s not going to solve the problem,” said Dr. Ripp. “Those of us like myself, who are working in this space, are trying to promote a culture of well-being – at the system level.”
The question is how to enable the workforce to do their best work in an efficient way so that the balance of their activities are not the meaningless aspects. “And instead, shoot that balance to the meaningful aspects of work,” he added. “There are enormous challenges, but even though we are working on solutions, I can see how the individual may not see that – they may say, ‘Stop telling me to be resilient, stop telling me there’s a problem,’ but we’re working on it.”
Moving medicine forward
James Jerzak, MD, a family physician in Green Bay, Wisc., and physician lead at Bellin Health, noted that “it seems to me that doctors aren’t burned out talking about burnout, but they are burned out hearing that the solution to burnout is simply for them to become more resilient,” he said. “In actuality, the path to dealing with this huge problem is to make meaningful systemic changes in how medicine is practiced.”
He reiterated that medical care has become increasingly complex, with the aging of the population; the increasing incidence of chronic diseases, such as diabetes; the challenges with the increasing cost of care, higher copays, and lack of health insurance for a large portion of the country; and general incivility toward health care workers that was exacerbated by the pandemic.
“This has all led to significantly increased stress levels for medical workers,” he said. “Couple all of that with the increased work involved in meeting the demands of the electronic health record, and it is clear that the current situation is unsustainable.”
In his own health care system, moving medicine forward has meant advancing team-based care, which translates to expanding teams to include adequate support for physicians. This strategy addressed problems in health care delivery, part of which is burnout.
“In many systems practicing advanced team-based care, the ancillary staff – medical assistants, LPNs, and RNs – play an enhanced role in the patient visit and perform functions such as quality care gap closure, medication review and refill pending, pending orders, and helping with documentation,” he said. “Although the current health care workforce shortages has created challenges, there are a lot of innovative approaches being tried [that are] aimed at providing solutions.”
The second key factor is for systems is to develop robust support for their providers with a broad range of team members, such as case managers, clinical pharmacists, diabetic educators, care coordinators, and others. “The day has passed where individual physicians can effectivity manage all of the complexities of care, especially since there are so many nonclinical factors affecting care,” said Dr. Jerzak.
“The recent focus on the social determinants of health and health equity underlies the fact that it truly takes a team of health care professionals working together to provide optimal care for patients,” he said.
Dr. Thorndike, who mentors premedical and medical trainees, has pointed out that burnout begins way before an individual enters the workplace as a doctor. Burnout begins in the earliest stages of medical practice, with the application process to medical school. The admissions process extends over a 12-month period, causing a great deal of “toxic stress.”
One study found that, compared with non-premedical students, premedical students had greater depression severity and emotional exhaustion.
“The current system of medical school admissions ignores the toll that the lengthy and emotionally exhausting process takes on aspiring physicians,” she said. “This is just one example of many in training and health care that requires physicians to set aside their own lives to achieve their goals and to provide the best possible care to others.”
A version of this article first appeared on Medscape.com.