User login
For MD-IQ use only
Fellowship procedure logs: A word of advice for fellows and a call to action for fellowship programs
As a GI fellow, I never would have imagined I would be writing an article on GI fellowship procedure logs. At the time, in my naiveté, I looked at the procedure log as a necessary evil and part of the “red tape” imposed on fellowship programs by the Accreditation Council for Graduate Medical Education (ACGME). While the importance of keeping a log was highlighted and enforced by my program, the large majority of the recommended numbers were easily achievable. As a result, even my sporadic tracking of completed procedures was sufficient to meet the requirements. My poor compliance wasn’t because I was lazy or careless, but rather because of the absence of a formal system, which resulted in homegrown methods that were highly inaccurate. I wasn’t alone in my follies. As I discussed this issue with fellows across the nation, I learned that these sentiments were universally shared. It seemed that everyone had come up with their own unique way of keeping a log – from Word and Excel documents, to a binder of patient stickers, to a daily folded sheet of paper with scribbled technical notes – all of which were an inconvenience to trainees already stretched thin. However, when the time came for employee credentialing, I came to realize the importance of keeping an accurate record. This once-neglected document would become the ultimate record of my capabilities for independent practice. The pitfalls and shortcomings of how we currently log procedures is why it was the first thing I worked on improving once I was an academic faculty member. There had to be a better way!

I started by reviewing what ACGME actually mandates trainees in GI to track, and to my surprise, they no longer set minimum procedure requirements, but rather competencies. The current requirements state that “Fellows must demonstrate competence in performance of ... procedures”1 and specifically state that competence should “not be based solely on a minimum number of procedures performed.” So, where does the need for a procedure log and minimum numbers come from? Your fellowship programs’ review committee. Programs recognize that, in order to approve requests for independent practice privileges, they need to substantiate the competency of the fellow, which ultimately is best evidenced through procedure logs. Therefore, the committee sets the minimum number of cases they believe is necessary for trainees to practice safely and independently.2 Our program leadership at UConn Health in Farmington, Conn., annually assesses our procedure activity and, over the years, has settled on the procedure guideline numbers provided to fellows at orientation and reviewed with them semiannually.
Once I understood exactly why we need procedure logs, I started looking at how other specialties handle them, particularly surgical programs in which accurate procedure logs are vitally important. It turns out that they universally use, and look favorably on, the ACGME Case Log System - an online, all encompassing, tracking software. This system is provided to surgical programs despite ACGME’s focus on competencies rather than numbers. Why this system is not offered for GI programs is unclear. However, in my endeavor, I was able to find the American Gastroenterological Association (AGA) Procedure Log system. When we reviewed the system in 2015 for use in our program, it was more of a concept than an all-encompassing tool. Fortunately, the AGA Information Technology (IT) and Training departments were kind enough to work with us to develop a complete online tracking tool that could be used nationally by all trainees in GI. Finally, we had a system to keep an accurate, secure log online and in real time.
A plea to fellows
With this, understand that in today’s document driven and litigious world, your procedure log is as vital to endoscopy as the scope itself. Without it, you may not be granted permission to do x, y, or z procedure. Indirectly, it can lead to delays in patient care and may prevent you from performing certain tasks and ultimately lead to repetitive training. Treat it as an official legal document of what you’ve done and what you are capable of doing. Recognize that it will be used by your mentors as supporting evidence regarding your competency for independent practice. Ask your training program to provide a clear list of expectations and requirements for graduation and a method for you to accurately track them, such as the AGA Procedure Log. An online, mobile system will allow you to document cases immediately after you finish while the procedure is fresh in your mind. Taking an extra minute after each case will prevent headaches down the road. The faculty and your cofellows all know of the end of the year “procedure scavenger” (i.e., the fellow who searches for procedures and takes them from others to make sure they meet their numbers for graduation). Please don’t be that person.
A request for program directors
As GI educators, we all know the mention of procedure logs to fellows is typically accompanied by eye rolls. It doesn’t have to be that way. Provide your fellows with clear expectations and a quick, easy, and accurate way to track their accomplishments. Help them recognize the importance of an accurate and complete procedure log. Consider an online tracking system such as the AGA Procedure Log. Studies have demonstrated that a computer-based system increases compliance and accuracy.3 Not providing one will surely lead to difficulties in the long run and is a disservice to those we work to empower, educate, and prepare for success.
References
1. ACGME Program Requirements for Graduate Medical Education in Gastroenterology. Accreditation Council for Graduate Medical Education. 2020 Jul 1. pp 21, 28. Accessed Sept. 13, 2020. https://www.acgme.org/Portals/0/PFAssets/ProgramRequirements/144_Gastroenterology_2020.pdf.
2. Steven J et al. J Grad Med Educat. 2012;4(2):257-60.
3. Rowe BH et al. Can Fam Physician. 1995;41:2113–20.
Dr. Rezaizadeh is an assistant professor of medicine, associate program director, gastroenterology fellowship program, UConn Health, Farmington, Conn.
As a GI fellow, I never would have imagined I would be writing an article on GI fellowship procedure logs. At the time, in my naiveté, I looked at the procedure log as a necessary evil and part of the “red tape” imposed on fellowship programs by the Accreditation Council for Graduate Medical Education (ACGME). While the importance of keeping a log was highlighted and enforced by my program, the large majority of the recommended numbers were easily achievable. As a result, even my sporadic tracking of completed procedures was sufficient to meet the requirements. My poor compliance wasn’t because I was lazy or careless, but rather because of the absence of a formal system, which resulted in homegrown methods that were highly inaccurate. I wasn’t alone in my follies. As I discussed this issue with fellows across the nation, I learned that these sentiments were universally shared. It seemed that everyone had come up with their own unique way of keeping a log – from Word and Excel documents, to a binder of patient stickers, to a daily folded sheet of paper with scribbled technical notes – all of which were an inconvenience to trainees already stretched thin. However, when the time came for employee credentialing, I came to realize the importance of keeping an accurate record. This once-neglected document would become the ultimate record of my capabilities for independent practice. The pitfalls and shortcomings of how we currently log procedures is why it was the first thing I worked on improving once I was an academic faculty member. There had to be a better way!
I started by reviewing what ACGME actually mandates trainees in GI to track, and to my surprise, they no longer set minimum procedure requirements, but rather competencies. The current requirements state that “Fellows must demonstrate competence in performance of ... procedures”1 and specifically state that competence should “not be based solely on a minimum number of procedures performed.” So, where does the need for a procedure log and minimum numbers come from? Your fellowship programs’ review committee. Programs recognize that, in order to approve requests for independent practice privileges, they need to substantiate the competency of the fellow, which ultimately is best evidenced through procedure logs. Therefore, the committee sets the minimum number of cases they believe is necessary for trainees to practice safely and independently.2 Our program leadership at UConn Health in Farmington, Conn., annually assesses our procedure activity and, over the years, has settled on the procedure guideline numbers provided to fellows at orientation and reviewed with them semiannually.
Once I understood exactly why we need procedure logs, I started looking at how other specialties handle them, particularly surgical programs in which accurate procedure logs are vitally important. It turns out that they universally use, and look favorably on, the ACGME Case Log System - an online, all encompassing, tracking software. This system is provided to surgical programs despite ACGME’s focus on competencies rather than numbers. Why this system is not offered for GI programs is unclear. However, in my endeavor, I was able to find the American Gastroenterological Association (AGA) Procedure Log system. When we reviewed the system in 2015 for use in our program, it was more of a concept than an all-encompassing tool. Fortunately, the AGA Information Technology (IT) and Training departments were kind enough to work with us to develop a complete online tracking tool that could be used nationally by all trainees in GI. Finally, we had a system to keep an accurate, secure log online and in real time.
A plea to fellows
With this, understand that in today’s document driven and litigious world, your procedure log is as vital to endoscopy as the scope itself. Without it, you may not be granted permission to do x, y, or z procedure. Indirectly, it can lead to delays in patient care and may prevent you from performing certain tasks and ultimately lead to repetitive training. Treat it as an official legal document of what you’ve done and what you are capable of doing. Recognize that it will be used by your mentors as supporting evidence regarding your competency for independent practice. Ask your training program to provide a clear list of expectations and requirements for graduation and a method for you to accurately track them, such as the AGA Procedure Log. An online, mobile system will allow you to document cases immediately after you finish while the procedure is fresh in your mind. Taking an extra minute after each case will prevent headaches down the road. The faculty and your cofellows all know of the end of the year “procedure scavenger” (i.e., the fellow who searches for procedures and takes them from others to make sure they meet their numbers for graduation). Please don’t be that person.
A request for program directors
As GI educators, we all know the mention of procedure logs to fellows is typically accompanied by eye rolls. It doesn’t have to be that way. Provide your fellows with clear expectations and a quick, easy, and accurate way to track their accomplishments. Help them recognize the importance of an accurate and complete procedure log. Consider an online tracking system such as the AGA Procedure Log. Studies have demonstrated that a computer-based system increases compliance and accuracy.3 Not providing one will surely lead to difficulties in the long run and is a disservice to those we work to empower, educate, and prepare for success.
References
1. ACGME Program Requirements for Graduate Medical Education in Gastroenterology. Accreditation Council for Graduate Medical Education. 2020 Jul 1. pp 21, 28. Accessed Sept. 13, 2020. https://www.acgme.org/Portals/0/PFAssets/ProgramRequirements/144_Gastroenterology_2020.pdf.
2. Steven J et al. J Grad Med Educat. 2012;4(2):257-60.
3. Rowe BH et al. Can Fam Physician. 1995;41:2113–20.
Dr. Rezaizadeh is an assistant professor of medicine, associate program director, gastroenterology fellowship program, UConn Health, Farmington, Conn.
HM20 Virtual: Combating racism in medicine
HM20 Virtual session title
When Grief and Crises Intersect: Perspectives of a Black Physician in the Time of Two Pandemics
Presenter
Kimberly Manning, MD, FACP, FAAP
Session summary
Dr. Kimberly Manning, associate vice chair of diversity, equity, and inclusion at Emory University, Atlanta, masterfully discussed the dual pandemics of COVID-19 and racism that we are currently experiencing and tried to describe the unique perspective of Black Americans.
Though it is easy to see that COVID-19 is a pandemic, racism is not always seen in this way. Dr. Manning demonstrated that when a pandemic is defined as “that which occurs over a wide geographic area and affects a high proportion of the population,” racism is absolutely a pandemic. She gave a great analogy: when sticking your hand into a bowl of Lucky Charms cereal, you do not expect to always end up with marshmallows alone, yet repeatedly, we see that Black Americans have been disproportionately affected by COVID-19. We often hear that we are in unprecedented times but as far as racism is concerned, there is nothing new about this.
Dr. Manning discussed the life stories of her grandfather, her father, and even her own life’s milestones such as starting college, getting into medical school, finishing residency – all the way to becoming a full professor. She described how each of these instances, though marked by something beautiful, was also marked by something truly awful. Each time she had a reason to smile and laugh, there was something awful happening in the country simultaneously that showed us how racism was still present. Though this was one person’s story, all Black Americans, not just those working in health care, can recount similar stories, emotions, and feelings of grief.
Dr. Manning concluded by telling us how we can “Do the Work” to combat the pandemic of racism:
- Broaden your fund of knowledge: Read books, listen to podcasts, watch documentaries.
- Remember that people are grieving.
- Explore your implicit biases.
- Be a brave bystander.
- Avoid performative allyship.
Key takeaways
- Though the COVID-19 pandemic is unprecedented, the pandemic of racism is not.
- The story of COVID-19 is the story of social determinants of health.
- We all must “Do the Work” to combat everyday racism and be cognizant of what our Black colleagues are going through every day.
Dr. Doraiswamy is an assistant professor of medicine and pediatrics and a med-peds hospitalist at The Ohio State University and Nationwide Children’s Hospital, Columbus.
DAPA-CKD resets eGFR floor for safe SGLT2 inhibitor use
The dramatically positive safety and efficacy results from the DAPA-CKD trial, which showed that treatment with the sodium-glucose transporter 2 (SGLT2) inhibitor dapagliflozin significantly cut both chronic kidney disease progression and all-cause death in patients with or without type 2 diabetes, were also notable for broadening the population of patients eligible for this treatment to those in the upper range of stage 4 CKD.

Of the 4,304 CKD patients enrolled in DAPA-CKD, 624 (14%) had an estimated glomerular filtration rate (eGFR) of 25-29 mL/min per 1.73m2, an unprecedented population to receive a drug from the SGLT2 inhibitor class in a reported study. The results provided definitive evidence for efficacy and safety in this range of renal function, said Hiddo J.L. Heerspink, Ph.D., at the virtual annual meeting of the European Association for the Study of Diabetes.
Until now, the widely accepted lowest level for starting an SGLT2 inhibitor in routine practice has been an eGFR as low as 30 mL/min per 1.73 m2.
Using SGLT2 inhibitors when eGFR is as low as 25
“It’s time to reduce the eGFR level for initiating an SGLT2 inhibitor to as low as 25,” said Dr. Heerspink, a professor of clinical pharmacology at the University of Groningen (the Netherlands).
While conceding that this is primarily a decision to be made by guideline writers and regulatory bodies, he declared what he believed was established by the DAPA-CKD findings: “We’ve shown that dapagliflozin can be safely used in these patients. It is effective across the spectrum of kidney function.”
Other experts not associated with the study agreed.
The trial researchers were “brave” to enroll patients with eGFRs as low as 25 mL/min per 1.73 m2, and “we urgently need these agents in patients with an eGFR this low,” commented Chantal Mathieu, MD, an endocrinologist and professor of medicine at Catholic University in Leuven, Belgium, and designated discussant for the report. Overall, she called the findings “spectacular,” a “landmark trial,” and a “winner.”
The study also set an new, lower floor for the level of albuminuria that can be usefully treated with dapagliflozin (Farxiga) by enrolling patients with a urinary albumin-to-creatinine ratio as low as 200 mg/g; the previous lower limit had been 300 mg/g, noted Dr. Mathieu. The new findings pose challenges to guideline writers, regulators who approve drug labels, and payers to a quickly make changes that will bring dapagliflozin to a wider number of patients with CKD.
Once the full DAPA-CKD results are reported, “it will change practice, and push the eGFR needle down” to as low as 25. It will also lower the albuminuria threshold for using dapagliflozin or other drugs in the class, commented David Z.I. Cherney, MD, a nephrologist at the University of Toronto. “It’s just one study,” he admitted, but the consistent renal benefits seen across several studies involving all four drugs in the SGLT2 inhibitor class will help hasten this change in identifying treatable patients, as well as expand the drug class to patients with CKD but no type 2 diabetes (T2D).
“I don’t think we’ve ever had stronger evidence” for drugs that can benefit both heart and renal function, plus the drug class is “very safe, and really easy to start” and maintain in patients, Dr. Cherney said in an interview. “It’s wonderful for these patients that we now have something new for treatment,” a drug with a “very favorable benefit-to-risk ratio.”
Results show many dapagliflozin benefits
While this broadening of the range of patients proven to tolerate and benefit from an SGLT2 inhibitor was an important consequence of DAPA-CKD, the study’s primary finding – that dapagliflozin was as safe and effective for slowing CKD progression in patients regardless of whether they also had T2D – will have an even bigger impact on expanding the target patient population. Showing efficacy in patients with CKD but without a T2D etiology, the status of about a third of the enrolled 4,304 patients, makes this treatment an option for “millions” of additional patients worldwide, said Dr. Heerspink. “These are the most common patients nephrologists see.” A major challenge now will be to do a better job finding patients with CKD who could benefit from dapagliflozin.
DAPA-CKD enrolled CKD patients based primarily on prespecified albuminuria and eGFR levels at more than 300 centers in 34 countries, including the United States. Virtually all patients, 97%, were on the only treatment now available with proven efficacy for slowing CKD, either an ACE inhibitor or an angiotensin receptor blocker. The small number of patients not on one of these drugs was because of poor tolerance.
The study’s primary endpoint was the combined rate of cardiovascular death, renal death, end-stage renal disease, or a drop in eGFR of at least 50% from baseline. This occurred in 14.5% of patients who received placebo and in 9.2% of those who received dapagliflozin during a median follow-up of 2.4 years, a highly significant 39% relative risk reduction. Concurrently with the report at the virtual meeting the results also appeared online in the New England Journal of Medicine. This 5.3% cut in the absolute rate of the combined, primary adverse outcome converted into a number needed to treat of 19 to prevent 1 event during 2.4 years, a “much lower” number needed to treat than reported for renin-angiotensin system inhibitors in these types of patients, Dr. Heerspink said.
Notable positive secondary outcomes included a significant 31% relative cut (a 2% absolute decline) in all-cause mortality, “a major highlight” of the findings, Dr. Heerspink said. Dapagliflozin treatment also linked with a significant 29% relative cut in the incidence of cardiovascular death or hospitalization for heart failure.
“Cardiovascular disease is the most common cause of death in patients with CKD,” explained David C. Wheeler, MD, a coinvestigator on the study and professor of kidney medicine at University College London. “The heart and kidney are intertwined. This is about cardiorenal disease.”
DAPA-CKD was funded by AstraZeneca, the company that markets dapagliflozin. Dr. Heerspink has been a consultant to and received research funding from AstraZeneca. He has also received personal fees from Mundipharma and Novo Nordisk, and he has also served as consultant to several other companies with the honoraria being paid to his institution. Dr. Mathieu has had relationships with AstraZeneca and several other companies. Dr. Cherney has been a consultant to and has received research funding from AstraZeneca and several other companies. Dr. Wheeler has received personal fees from AstraZeneca and from several other companies.
SOURCE: Heerspink HJL et al. EASD 2020 and N Engl J Med. 2020 Sep 24. doi: 10.1056/NEJMoa2024816.
The dramatically positive safety and efficacy results from the DAPA-CKD trial, which showed that treatment with the sodium-glucose transporter 2 (SGLT2) inhibitor dapagliflozin significantly cut both chronic kidney disease progression and all-cause death in patients with or without type 2 diabetes, were also notable for broadening the population of patients eligible for this treatment to those in the upper range of stage 4 CKD.
Of the 4,304 CKD patients enrolled in DAPA-CKD, 624 (14%) had an estimated glomerular filtration rate (eGFR) of 25-29 mL/min per 1.73m2, an unprecedented population to receive a drug from the SGLT2 inhibitor class in a reported study. The results provided definitive evidence for efficacy and safety in this range of renal function, said Hiddo J.L. Heerspink, Ph.D., at the virtual annual meeting of the European Association for the Study of Diabetes.
Until now, the widely accepted lowest level for starting an SGLT2 inhibitor in routine practice has been an eGFR as low as 30 mL/min per 1.73 m2.
Using SGLT2 inhibitors when eGFR is as low as 25
“It’s time to reduce the eGFR level for initiating an SGLT2 inhibitor to as low as 25,” said Dr. Heerspink, a professor of clinical pharmacology at the University of Groningen (the Netherlands).
While conceding that this is primarily a decision to be made by guideline writers and regulatory bodies, he declared what he believed was established by the DAPA-CKD findings: “We’ve shown that dapagliflozin can be safely used in these patients. It is effective across the spectrum of kidney function.”
Other experts not associated with the study agreed.
The trial researchers were “brave” to enroll patients with eGFRs as low as 25 mL/min per 1.73 m2, and “we urgently need these agents in patients with an eGFR this low,” commented Chantal Mathieu, MD, an endocrinologist and professor of medicine at Catholic University in Leuven, Belgium, and designated discussant for the report. Overall, she called the findings “spectacular,” a “landmark trial,” and a “winner.”
The study also set an new, lower floor for the level of albuminuria that can be usefully treated with dapagliflozin (Farxiga) by enrolling patients with a urinary albumin-to-creatinine ratio as low as 200 mg/g; the previous lower limit had been 300 mg/g, noted Dr. Mathieu. The new findings pose challenges to guideline writers, regulators who approve drug labels, and payers to a quickly make changes that will bring dapagliflozin to a wider number of patients with CKD.
Once the full DAPA-CKD results are reported, “it will change practice, and push the eGFR needle down” to as low as 25. It will also lower the albuminuria threshold for using dapagliflozin or other drugs in the class, commented David Z.I. Cherney, MD, a nephrologist at the University of Toronto. “It’s just one study,” he admitted, but the consistent renal benefits seen across several studies involving all four drugs in the SGLT2 inhibitor class will help hasten this change in identifying treatable patients, as well as expand the drug class to patients with CKD but no type 2 diabetes (T2D).
“I don’t think we’ve ever had stronger evidence” for drugs that can benefit both heart and renal function, plus the drug class is “very safe, and really easy to start” and maintain in patients, Dr. Cherney said in an interview. “It’s wonderful for these patients that we now have something new for treatment,” a drug with a “very favorable benefit-to-risk ratio.”
Results show many dapagliflozin benefits
While this broadening of the range of patients proven to tolerate and benefit from an SGLT2 inhibitor was an important consequence of DAPA-CKD, the study’s primary finding – that dapagliflozin was as safe and effective for slowing CKD progression in patients regardless of whether they also had T2D – will have an even bigger impact on expanding the target patient population. Showing efficacy in patients with CKD but without a T2D etiology, the status of about a third of the enrolled 4,304 patients, makes this treatment an option for “millions” of additional patients worldwide, said Dr. Heerspink. “These are the most common patients nephrologists see.” A major challenge now will be to do a better job finding patients with CKD who could benefit from dapagliflozin.
DAPA-CKD enrolled CKD patients based primarily on prespecified albuminuria and eGFR levels at more than 300 centers in 34 countries, including the United States. Virtually all patients, 97%, were on the only treatment now available with proven efficacy for slowing CKD, either an ACE inhibitor or an angiotensin receptor blocker. The small number of patients not on one of these drugs was because of poor tolerance.
The study’s primary endpoint was the combined rate of cardiovascular death, renal death, end-stage renal disease, or a drop in eGFR of at least 50% from baseline. This occurred in 14.5% of patients who received placebo and in 9.2% of those who received dapagliflozin during a median follow-up of 2.4 years, a highly significant 39% relative risk reduction. Concurrently with the report at the virtual meeting the results also appeared online in the New England Journal of Medicine. This 5.3% cut in the absolute rate of the combined, primary adverse outcome converted into a number needed to treat of 19 to prevent 1 event during 2.4 years, a “much lower” number needed to treat than reported for renin-angiotensin system inhibitors in these types of patients, Dr. Heerspink said.
Notable positive secondary outcomes included a significant 31% relative cut (a 2% absolute decline) in all-cause mortality, “a major highlight” of the findings, Dr. Heerspink said. Dapagliflozin treatment also linked with a significant 29% relative cut in the incidence of cardiovascular death or hospitalization for heart failure.
“Cardiovascular disease is the most common cause of death in patients with CKD,” explained David C. Wheeler, MD, a coinvestigator on the study and professor of kidney medicine at University College London. “The heart and kidney are intertwined. This is about cardiorenal disease.”
DAPA-CKD was funded by AstraZeneca, the company that markets dapagliflozin. Dr. Heerspink has been a consultant to and received research funding from AstraZeneca. He has also received personal fees from Mundipharma and Novo Nordisk, and he has also served as consultant to several other companies with the honoraria being paid to his institution. Dr. Mathieu has had relationships with AstraZeneca and several other companies. Dr. Cherney has been a consultant to and has received research funding from AstraZeneca and several other companies. Dr. Wheeler has received personal fees from AstraZeneca and from several other companies.
SOURCE: Heerspink HJL et al. EASD 2020 and N Engl J Med. 2020 Sep 24. doi: 10.1056/NEJMoa2024816.
FROM EASD 2020
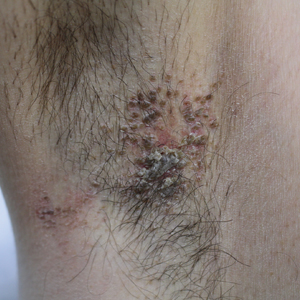
Pruritic Axillary Plaques
The Diagnosis: Granular Parakeratosis
Microscopic examination of a punch biopsy from the left axilla revealed verruciform epidermal hyperplasia with overlying parakeratosis and retention of keratohyalin granules in the stratum corneum (Figure). There was no evidence of acantholysis, dyskeratosis, epidermal neutrophils, or neutrophilic microabscesses.
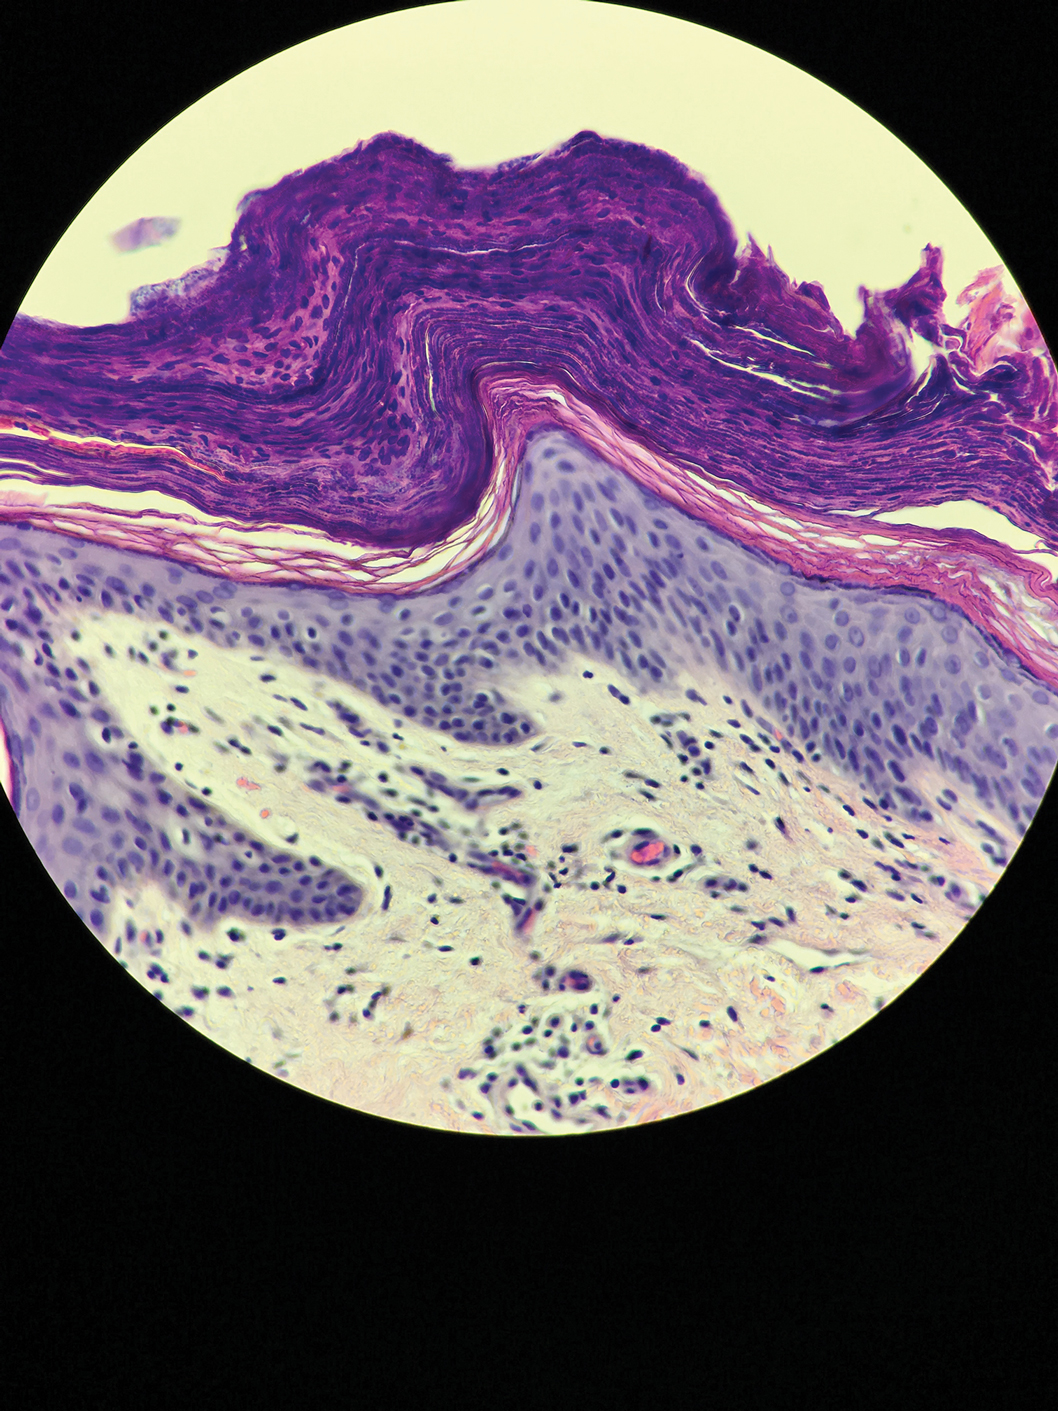
The patient's history and characteristic histopathologic findings confirmed the diagnosis of granular parakeratosis (GP). He was instructed to discontinue his current antiperspirant and began treatment with topical fluocinolone oil 0.01% every morning and urea cream 20% every night. Complete resolution was achieved within 2 weeks, and he reported no recurrence at a 2-year follow-up visit.
Granular parakeratosis is a rare idiopathic skin condition characterized by hyperkeratotic papules and plaques, most often in intertriginous areas. Described by Northcutt et al1 as a contact reaction to antiperspirant in the axillae, GP also has been reported in the submammary and inguinal creases2 and rarely in nonintertriginous sites such as the abdomen.3 Although deodorants and antiperspirants in roll-on or stick form classically are implicated in GP, the condition also has been observed with exposure to laundry detergents containing benzalkonium chloride.4 Lesions with GP histology also have been incidentally observed in association with dermatophytosis,5 dermatomyositis,6 molluscum contagiosum,7 and carcinomas.8 Ding et al9 proposed that GP be reclassified as a reaction pattern observed in the skin as opposed to being a distinct disease entity.
Clinically, GP presents as pruritic intertriginous papules and coalescent plaques that most commonly are seen in the axillae but also may involve the groin or other sites.2,3 Both pruritus and disease burden can be aggravated by heat, sweating, or friction. There may be a history of a new irritant exposure prior to symptom onset, but GP has been observed in the absence of identifiable exposures and in the setting of long-term antiperspirant or deodorant use.3 Although a family history may be helpful, it can be difficult to distinguish GP from entities such as Hailey-Hailey disease or Darier disease based on history and examination alone; a biopsy often is necessary for definitive diagnosis.
Histologically, GP demonstrates acanthosis with parakeratosis and retention of keratohyalin granules in the stratum corneum.1 The stratum granulosum is preserved. On cursory examination, GP may resemble a psoriasiform dermatosis as can be seen in inverse psoriasis; however, neutrophilic microabscesses and infiltrates are not seen. Absence of acantholysis and dyskeratosis further differentiates GP from the clinically similar Hailey-Hailey disease and Darier disease. Spongiosis that is prominently found in allergic contact dermatitis also is absent.
Although a benign disorder, GP warrants treatment to achieve symptomatic relief. A mainstay of treatment is to eliminate exposure to suspected aggravating or inciting factors such as antiperspirants or deodorants. A variety of treatments including laser therapy, corticosteroids, isotretinoin, and vitamin D analogs such as calcipotriene and calcitriol have been reported to be effective treatments of GP in case studies and series.3,10 Large-scale clinical trials are not available because of the rarity of this condition. Our patient's clinical course suggests topical fluocinolone and urea in combination can be considered to achieve rapid resolution.
- Northcutt AD, Nelson DM, Tschen JA. Axillary granular parakeratosis. J Am Acad Dermatol. 1991;24:541-544.
- Burford C. Granular parakeratosis of multiple intertriginous areas. Australas J Dermatol. 2008;49:35-38.
- Samrao A, Reis M, Neidt G, et al. Granular parakeratosis: response to calcipotriene and brief review of current therapeutic options. Skinmed. 2010;8:357-359.
- Robinson AJ, Foster RS, Halbert AR, et al. Granular parakeratosis induced by benzalkonium chloride exposure from laundry rinse aids. Australas J Dermatol. 2017;58:E138-E140.
- Resnik KS, Kantor GR, DiLeonardo M. Dermatophyte-related granular parakeratosis. Am J Dermatopathol. 2004;26:70-71.
- Pock L, Hercogová J. Incidental granular parakeratosis associated with dermatomyositis. Am J Dermatopathol. 2006;28:147-149.
- Pock L, Cermáková A, Zipfelová J, et al. Incidental granular parakeratosis associated with molluscum contagiosum. Am J Dermatopathol. 2006;28:45-47.
- Resnik KS, DiLeonardo M. Incidental granular parakeratotic cornification in carcinomas. Am J Dermatopathol. 2007;29:264-269.
- Ding CY, Liu H, Khachemoune A. Granular parakeratosis: a comprehensive review and a critical reappraisal. Am J Clin Dermatol. 2015;16:495-500.
- Patel U, Patel T, Skinner RB. Resolution of granular parakeratosis with topical calcitriol. Arch Dermatol. 2011;147:997-998.
The Diagnosis: Granular Parakeratosis
Microscopic examination of a punch biopsy from the left axilla revealed verruciform epidermal hyperplasia with overlying parakeratosis and retention of keratohyalin granules in the stratum corneum (Figure). There was no evidence of acantholysis, dyskeratosis, epidermal neutrophils, or neutrophilic microabscesses.
The patient's history and characteristic histopathologic findings confirmed the diagnosis of granular parakeratosis (GP). He was instructed to discontinue his current antiperspirant and began treatment with topical fluocinolone oil 0.01% every morning and urea cream 20% every night. Complete resolution was achieved within 2 weeks, and he reported no recurrence at a 2-year follow-up visit.
Granular parakeratosis is a rare idiopathic skin condition characterized by hyperkeratotic papules and plaques, most often in intertriginous areas. Described by Northcutt et al1 as a contact reaction to antiperspirant in the axillae, GP also has been reported in the submammary and inguinal creases2 and rarely in nonintertriginous sites such as the abdomen.3 Although deodorants and antiperspirants in roll-on or stick form classically are implicated in GP, the condition also has been observed with exposure to laundry detergents containing benzalkonium chloride.4 Lesions with GP histology also have been incidentally observed in association with dermatophytosis,5 dermatomyositis,6 molluscum contagiosum,7 and carcinomas.8 Ding et al9 proposed that GP be reclassified as a reaction pattern observed in the skin as opposed to being a distinct disease entity.
Clinically, GP presents as pruritic intertriginous papules and coalescent plaques that most commonly are seen in the axillae but also may involve the groin or other sites.2,3 Both pruritus and disease burden can be aggravated by heat, sweating, or friction. There may be a history of a new irritant exposure prior to symptom onset, but GP has been observed in the absence of identifiable exposures and in the setting of long-term antiperspirant or deodorant use.3 Although a family history may be helpful, it can be difficult to distinguish GP from entities such as Hailey-Hailey disease or Darier disease based on history and examination alone; a biopsy often is necessary for definitive diagnosis.
Histologically, GP demonstrates acanthosis with parakeratosis and retention of keratohyalin granules in the stratum corneum.1 The stratum granulosum is preserved. On cursory examination, GP may resemble a psoriasiform dermatosis as can be seen in inverse psoriasis; however, neutrophilic microabscesses and infiltrates are not seen. Absence of acantholysis and dyskeratosis further differentiates GP from the clinically similar Hailey-Hailey disease and Darier disease. Spongiosis that is prominently found in allergic contact dermatitis also is absent.
Although a benign disorder, GP warrants treatment to achieve symptomatic relief. A mainstay of treatment is to eliminate exposure to suspected aggravating or inciting factors such as antiperspirants or deodorants. A variety of treatments including laser therapy, corticosteroids, isotretinoin, and vitamin D analogs such as calcipotriene and calcitriol have been reported to be effective treatments of GP in case studies and series.3,10 Large-scale clinical trials are not available because of the rarity of this condition. Our patient's clinical course suggests topical fluocinolone and urea in combination can be considered to achieve rapid resolution.
- Northcutt AD, Nelson DM, Tschen JA. Axillary granular parakeratosis. J Am Acad Dermatol. 1991;24:541-544.
- Burford C. Granular parakeratosis of multiple intertriginous areas. Australas J Dermatol. 2008;49:35-38.
- Samrao A, Reis M, Neidt G, et al. Granular parakeratosis: response to calcipotriene and brief review of current therapeutic options. Skinmed. 2010;8:357-359.
- Robinson AJ, Foster RS, Halbert AR, et al. Granular parakeratosis induced by benzalkonium chloride exposure from laundry rinse aids. Australas J Dermatol. 2017;58:E138-E140.
- Resnik KS, Kantor GR, DiLeonardo M. Dermatophyte-related granular parakeratosis. Am J Dermatopathol. 2004;26:70-71.
- Pock L, Hercogová J. Incidental granular parakeratosis associated with dermatomyositis. Am J Dermatopathol. 2006;28:147-149.
- Pock L, Cermáková A, Zipfelová J, et al. Incidental granular parakeratosis associated with molluscum contagiosum. Am J Dermatopathol. 2006;28:45-47.
- Resnik KS, DiLeonardo M. Incidental granular parakeratotic cornification in carcinomas. Am J Dermatopathol. 2007;29:264-269.
- Ding CY, Liu H, Khachemoune A. Granular parakeratosis: a comprehensive review and a critical reappraisal. Am J Clin Dermatol. 2015;16:495-500.
- Patel U, Patel T, Skinner RB. Resolution of granular parakeratosis with topical calcitriol. Arch Dermatol. 2011;147:997-998.
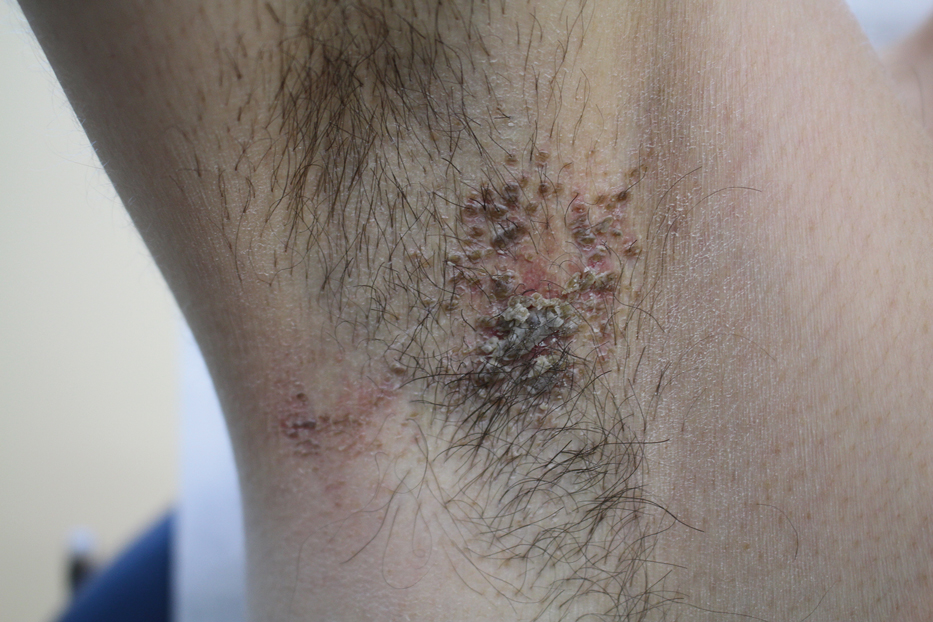
A 42-year-old man presented with pruritic axillary plaques of 6 months’ duration that were exacerbated by heat and friction. He maintained a very active lifestyle and used an antiperspirant regularly. He denied any family history of similar lesions. Thick emollients provided no relief. Physical examination demonstrated numerous soft, hyperkeratotic, waxy, yellowish brown papules coalescing into plaques localized to the bilateral axillary vaults, affecting the right axilla more than the left. Although some papules were firmly adherent to the skin, others were friable and easily removed with a cotton-tipped applicator, revealing an underlying, faintly erythematous base.
Physicians, make a plan to vote
In March 2020, following the announcement of the United States’ first death related to COVID-19, many physicians began using their voices to discuss the shortage of personal protective equipment (PPE). Many physicians, myself included, petitioned elected leaders at the community, state, and federal levels to address the PPE shortage.
Historically, physicians have advocated for improved public health. From seat belt laws in the 1980s and 1990s to the Affordable Care Act in the 2000s, physicians have testified at the community, state, and federal levels to advocate for the health and safety of our patients and the public. Yet while we have been making our voices heard, we are often silent at the ballot box.
In the 1996 and 2000 elections, physicians voted 9% less often than the general public, and compared with lawyers – professionals with similar educational attainment and finances – physicians voted 22% less often.1 It is unclear why physicians are less likely to vote. In a 2016 article, David Grande, MD, and Katrina Armstrong, MD, postulated that physicians may not vote because our work hours create barriers to visiting polls.2
Despite our lack of engagement at the ballot box, voting is important to improving our patients’ social determinants of health. In a recently published systematic review, the authors found several studies supporting the association between voting and social determinants of health. Their review found that, when large numbers of people from communities participated in voting, it translated into greater influence over determining who held political power in that community. Those with power introduced and supported policies responding to their constituents’ needs, ultimately influencing their constituents’ social determinants of health.3 By voting, we as physicians are helping to address the social determinants of health in our communities.
Many medical students have been doing their part to improve the social determinants of health in their communities by pledging to vote. In 2018, the American Medical Student Association launched their “Med Out the Vote” initiative prior to the election. The organization called on all health care providers and providers in training to pledge to vote in the election.4 They are continuing these efforts for the 2020 elections.
We should join our nation’s medical students by also pledging to vote. To begin, we can all Make A Plan To Vote. Each plan should include the following:
- Register to vote: In many states eligible voters can register online.
- Request an absentee ballot: Many states require registered voters to request absentee ballots online or by mail.
- Vote: Submit an absentee ballot prior to election or vote in-person on election day. Some counties allow voting early in person.
In practice, our plans will differ slightly because each state has its own election laws.
This election season let us ensure all physician voices are heard. Make A Plan To Vote for your patients and communities.
Dr. Kumar is the pediatric editor of The Hospitalist. She is clinical assistant professor of pediatrics at the Cleveland Clinic Lerner College of Medicine at Case Western Reserve University and a pediatric hospitalist at Cleveland Clinic Children’s.
References
1. Grande D et al. Do Doctors Vote? J Gen Intern Med. 2007 May;22(5):585-9.
2. Grande D, Armstrong K. Will Physicians Vote? Ann Intern Med. 2016;165:814-5.
3. Brown CL et al. Voting, health and interventions in healthcare settings: A scoping review. Public Health Rev. 2020 Jul. doi: 10.1186/s40985-020-00133-6.
4. American Medical Student Association. AMSA Launches Med Out the Vote Campaign, Call to Action. 2018 Jul 29. Accessed 2020 Sep 14. https://www.amsa.org/about/amsa-press-room/amsa-launches-med-out-the-vote-campaign-call-to-action/
Social media and health information: Empowering or misleading?
The search engine giants, Dr. Google or Dr. Bing, are visited by most of our patients before seeking medical help. In 1976, medical student Tom Ferguson, MD, first coined the term e-Patient. It means a health consumer who uses the Internet to gather information about a medical condition for themselves or on behalf of family and friends and uses electronic communication tools to cope with medical conditions. Dr. Ferguson described e-Patients as “empowered medical consumers.”1

During the COVID-19 pandemic, social media and networking platforms – such as Facebook, Twitter, Instagram, Snapchat, YouTube, WhatsApp, online health support groups – are used increasingly by e-Patients to gather critical health information. Health care providers often take a conflicted stand on the use of social media. Though we want our patients to read about their illnesses and make informed choices, we often get frustrated by misdiagnoses, misinformation, and disinformation that comes with it.
According to a study investigating the differential diffusion of news stories distributed on Twitter from 2006 to 2017, fake news was considered more novel than true news, and people were more likely to share novel information.2 Bots accelerated the spread of true and fake news at the same rate, implying that fake news spreads more than the truth because humans, not robots, are more likely to spread it. Social media has promoted some of the best health campaigns, like public cancer awareness, the ALS Ice Bucket Challenge, World Heart Day, and others. At the same time, it has also provided a platform for antivaccination activists, dangerous and unproven alternative cancer therapies, weight loss pills, and nutrition plans.
According to a Pew Research Center survey, 72% of adult Internet users had searched online for information about a range of health issues of their own or for others in the past 12 months.3 A survey from 2019-2020 showed that those who relied on social media for news were among the least knowledgeable about key facts during the COVID-19 outbreak.4 About 74% of public posts about COVID-19 were linked to news organizations, while just 1% linked to health and science sites.5 While social media has emerged as one of the most significant health information sources, it famously has only a few safeguards in place against medical misinformation. Requiring responsibility and regulations for accurate or evidence-based information walks a thin line on infringing freedom of speech. Medical misinformation related to COVID-19 has become as contagious as the virus itself.
In February 2020, the World Health Organization warned that a massive ‘Infodemic’ had accompanied the COVID-19 outbreak, with an overabundance of information, some accurate and some not, making it difficult for people to find reliable sources and trustworthy information.6 The Black immunity myth, groups opposing vaccines, campaigns against 5G mobile phone networks, suggestions that SARS-CoV-2 was an engineered bioweapon, and online rumors leading to mob attacks in India and mass poisonings in Iran are some of the misleading health information that has circulated related to COVID-19.
In the Web 2.0 era, in which credible health information comes packaged with divisive and misleading information, social media’s full impact on health care, health outcomes, and mental health has yet to be explored. Social networks and media sharing networks have recently announced initiatives to stop misinformation and disinformation by fact-checking, flagging, issuing warnings, and deleting misinformation or misleading content. Providing links to more and correct information and partnering with health and science organizations can also encourage the spread of verifiable information.
While we have yet to see if social media safeguards are adequate, the medical community needs to proactively educate patients on the appropriate use of social media for health information, e-Health literacy, and media health literacy. Like health care providers evaluating scientific papers, we need to cultivate e-Patients’ ability to seek, evaluate, understand, and convey health information from electronic sources. Although the measurement and training tools for e-Health and media health literacy are still scarce, a good place to start could be to have simple conversations with patients. Encouraging patients to critically analyze online information, use credible social media sources, and recognizing the warnings, red flags, and links on unreliable information are some of the discussions worth considering. Equally important is to discourage patients from changing health behaviors or practices based on unverified social media resources and discussing the possible impact of medical misinformation.
A practical approach for e-Patients could be to ask the Five Ws, considered fundamental in information gathering: Who, What, Why, When, and Where.7,8
- Who runs the website? Examine the authors, sponsors, and sources. Federal agencies’ website addresses end in “.gov,” educational institutions maintain “.edu,” large professional or nonprofit organizations often use “.org,” and commercial websites use “.com.”
- What is offered, and What is the evidence? Does it provide unbelievable solutions or quick, miracle cures?
- Why was the site created? Is the mission or goal to inform, explain, or sell health or medical products? Check details on “About This Site” or “About Us.”
- When was the information written or the webpage last updated?
- Where are the privacy policies? Is your privacy protected?
The anonymity of sources, sponsors, financial interests, or the lack of medical credentials and reputable medical research, the use of testimonials as evidence, outdated or incomplete information, and emotional or exaggerated language should raise suspicion about the reliability of the information. Tools like the online tutorial and a checklist from the National Institute of Health’s National Library of Medicine can also be offered to e-Patients to learn how to evaluate health information online.9,10
Online health support groups widely used by patients can be an additional layer of support but can also be a source of misinformation. Since they have fewer gatekeepers than traditional face-to-face communication, keeping a check on the credibility of the information can be difficult. Support groups affiliated with local hospitals or national organizations, or those endorsed by well-known scientific societies, can be encouraged instead of less credible sources. Some online support groups, run by non–health care professionals but with experienced and reliable scientific panels, can be useful resources. However, patients must check for the credibility and reliability of the information.
Lastly, just as hospitalists take a social history of our patients, we could also ask for a “social media history” to understand patients’ sources of health information. We can then guide them toward more credible sources to make them truly empowered medical consumers.
Dr. Saigal is a hospitalist and clinical assistant professor of medicine in the division of hospital medicine at the Ohio State University Wexner Medical Center, Columbus.
References
1. Nelson R. Informatics: Empowering ePatients to drive health care reform - part I. Online J Issues Nurs. 2016 Sep 13;21(3):9.
2. Vosoughi S et al. The spread of true and false news online. Science. 2012;359(6380):1146-51.
3. Fox S. The social life of health information. Pew Research Center: Fact Tank. 2014 Jan 15. Accessed 2020 Jul 31.
4. Mitchel A, Jurkowitz M, Oliphant JB, Shearer E. Americans Who Mainly Get Their News on Social Media Are Less Engaged, Less Knowledgeable. Pew Research Center: Journalism & Media. 2020 Jul 30. Accessed 2020 Jul 31.
5. Stocking G, Matsa KE, Khuzam M. As COVID-19 Emerged in U.S., Facebook Posts About It Appeared in a Wide Range of Public Pages, Groups Pew Research Center: Journalism & Media. 2020 Jun 24. Accessed 2020 Jul 31.
6. Munich Security Conference. World Health Organization. 2020 Feb 15. Accessed 2020 Jul 31.
7. Levin-Zamir D, Bertschi I. Media health literacy, eHealth literacy, and the role of the social environment in context. Int J Environ Res Public Health. 2018 Aug 3;15(8):1643.
8. Online Health Information: Is It Reliable? National Institute on Aging, National Institutes of Health. 2018 Oct 31. Accessed 2020 Aug 10.
9. How To Evaluate Health Information on the Internet: Questions and Answers. Office of Dietary Supplements, National Institutes of Health. 2011 Jun 24. Accessed 2020 Aug 10.
10. Evaluating Internet Health Information: A Tutorial From the National Library of Medicine. Medline Plus. 2020 Mar 6. Accessed 2020 Aug 10.
The search engine giants, Dr. Google or Dr. Bing, are visited by most of our patients before seeking medical help. In 1976, medical student Tom Ferguson, MD, first coined the term e-Patient. It means a health consumer who uses the Internet to gather information about a medical condition for themselves or on behalf of family and friends and uses electronic communication tools to cope with medical conditions. Dr. Ferguson described e-Patients as “empowered medical consumers.”1
During the COVID-19 pandemic, social media and networking platforms – such as Facebook, Twitter, Instagram, Snapchat, YouTube, WhatsApp, online health support groups – are used increasingly by e-Patients to gather critical health information. Health care providers often take a conflicted stand on the use of social media. Though we want our patients to read about their illnesses and make informed choices, we often get frustrated by misdiagnoses, misinformation, and disinformation that comes with it.
According to a study investigating the differential diffusion of news stories distributed on Twitter from 2006 to 2017, fake news was considered more novel than true news, and people were more likely to share novel information.2 Bots accelerated the spread of true and fake news at the same rate, implying that fake news spreads more than the truth because humans, not robots, are more likely to spread it. Social media has promoted some of the best health campaigns, like public cancer awareness, the ALS Ice Bucket Challenge, World Heart Day, and others. At the same time, it has also provided a platform for antivaccination activists, dangerous and unproven alternative cancer therapies, weight loss pills, and nutrition plans.
According to a Pew Research Center survey, 72% of adult Internet users had searched online for information about a range of health issues of their own or for others in the past 12 months.3 A survey from 2019-2020 showed that those who relied on social media for news were among the least knowledgeable about key facts during the COVID-19 outbreak.4 About 74% of public posts about COVID-19 were linked to news organizations, while just 1% linked to health and science sites.5 While social media has emerged as one of the most significant health information sources, it famously has only a few safeguards in place against medical misinformation. Requiring responsibility and regulations for accurate or evidence-based information walks a thin line on infringing freedom of speech. Medical misinformation related to COVID-19 has become as contagious as the virus itself.
In February 2020, the World Health Organization warned that a massive ‘Infodemic’ had accompanied the COVID-19 outbreak, with an overabundance of information, some accurate and some not, making it difficult for people to find reliable sources and trustworthy information.6 The Black immunity myth, groups opposing vaccines, campaigns against 5G mobile phone networks, suggestions that SARS-CoV-2 was an engineered bioweapon, and online rumors leading to mob attacks in India and mass poisonings in Iran are some of the misleading health information that has circulated related to COVID-19.
In the Web 2.0 era, in which credible health information comes packaged with divisive and misleading information, social media’s full impact on health care, health outcomes, and mental health has yet to be explored. Social networks and media sharing networks have recently announced initiatives to stop misinformation and disinformation by fact-checking, flagging, issuing warnings, and deleting misinformation or misleading content. Providing links to more and correct information and partnering with health and science organizations can also encourage the spread of verifiable information.
While we have yet to see if social media safeguards are adequate, the medical community needs to proactively educate patients on the appropriate use of social media for health information, e-Health literacy, and media health literacy. Like health care providers evaluating scientific papers, we need to cultivate e-Patients’ ability to seek, evaluate, understand, and convey health information from electronic sources. Although the measurement and training tools for e-Health and media health literacy are still scarce, a good place to start could be to have simple conversations with patients. Encouraging patients to critically analyze online information, use credible social media sources, and recognizing the warnings, red flags, and links on unreliable information are some of the discussions worth considering. Equally important is to discourage patients from changing health behaviors or practices based on unverified social media resources and discussing the possible impact of medical misinformation.
A practical approach for e-Patients could be to ask the Five Ws, considered fundamental in information gathering: Who, What, Why, When, and Where.7,8
- Who runs the website? Examine the authors, sponsors, and sources. Federal agencies’ website addresses end in “.gov,” educational institutions maintain “.edu,” large professional or nonprofit organizations often use “.org,” and commercial websites use “.com.”
- What is offered, and What is the evidence? Does it provide unbelievable solutions or quick, miracle cures?
- Why was the site created? Is the mission or goal to inform, explain, or sell health or medical products? Check details on “About This Site” or “About Us.”
- When was the information written or the webpage last updated?
- Where are the privacy policies? Is your privacy protected?
The anonymity of sources, sponsors, financial interests, or the lack of medical credentials and reputable medical research, the use of testimonials as evidence, outdated or incomplete information, and emotional or exaggerated language should raise suspicion about the reliability of the information. Tools like the online tutorial and a checklist from the National Institute of Health’s National Library of Medicine can also be offered to e-Patients to learn how to evaluate health information online.9,10
Online health support groups widely used by patients can be an additional layer of support but can also be a source of misinformation. Since they have fewer gatekeepers than traditional face-to-face communication, keeping a check on the credibility of the information can be difficult. Support groups affiliated with local hospitals or national organizations, or those endorsed by well-known scientific societies, can be encouraged instead of less credible sources. Some online support groups, run by non–health care professionals but with experienced and reliable scientific panels, can be useful resources. However, patients must check for the credibility and reliability of the information.
Lastly, just as hospitalists take a social history of our patients, we could also ask for a “social media history” to understand patients’ sources of health information. We can then guide them toward more credible sources to make them truly empowered medical consumers.
Dr. Saigal is a hospitalist and clinical assistant professor of medicine in the division of hospital medicine at the Ohio State University Wexner Medical Center, Columbus.
References
1. Nelson R. Informatics: Empowering ePatients to drive health care reform - part I. Online J Issues Nurs. 2016 Sep 13;21(3):9.
2. Vosoughi S et al. The spread of true and false news online. Science. 2012;359(6380):1146-51.
3. Fox S. The social life of health information. Pew Research Center: Fact Tank. 2014 Jan 15. Accessed 2020 Jul 31.
4. Mitchel A, Jurkowitz M, Oliphant JB, Shearer E. Americans Who Mainly Get Their News on Social Media Are Less Engaged, Less Knowledgeable. Pew Research Center: Journalism & Media. 2020 Jul 30. Accessed 2020 Jul 31.
5. Stocking G, Matsa KE, Khuzam M. As COVID-19 Emerged in U.S., Facebook Posts About It Appeared in a Wide Range of Public Pages, Groups Pew Research Center: Journalism & Media. 2020 Jun 24. Accessed 2020 Jul 31.
6. Munich Security Conference. World Health Organization. 2020 Feb 15. Accessed 2020 Jul 31.
7. Levin-Zamir D, Bertschi I. Media health literacy, eHealth literacy, and the role of the social environment in context. Int J Environ Res Public Health. 2018 Aug 3;15(8):1643.
8. Online Health Information: Is It Reliable? National Institute on Aging, National Institutes of Health. 2018 Oct 31. Accessed 2020 Aug 10.
9. How To Evaluate Health Information on the Internet: Questions and Answers. Office of Dietary Supplements, National Institutes of Health. 2011 Jun 24. Accessed 2020 Aug 10.
10. Evaluating Internet Health Information: A Tutorial From the National Library of Medicine. Medline Plus. 2020 Mar 6. Accessed 2020 Aug 10.
Evaluating a paper: Take care not to be confounded
In an earlier article, we looked at the meaning of the P value.1 This time we will look at another crucial statistical concept: that of confounding.
Confounding, as the name implies, is the recognition that crude associations may not reflect reality, but may instead be the result of outside factors. To illustrate, imagine that you want to study whether smoking increases the risk of death (in statistical terms, smoking is the exposure, and death is the outcome). You follow 5,000 people who smoke and 5,000 people who do not smoke for 10 years. At the end of the follow-up you find that about 40% of nonsmokers died, compared with only 10% of smokers. What do you conclude? At face value it would seem that smoking prevents death. However, before reaching this conclusion you might want to look at other factors. A look at the dataset shows that the average baseline age among nonsmokers was 60 years, whereas among smokers was 40 years. Could this be the cause of the results? You repeat the analysis based on strata of age (i.e., you compare smokers who were aged 60-70 years at baseline with nonsmokers who were aged 60-70 years, smokers who were aged 50-60 years with nonsmokers who were aged 50-60 years, and so on). What you find is that, for each category of age, the percentage of death among smokers was higher. Hence, you now reach the opposite conclusion, namely that smoking does increase the risk of death.
What happened? Why the different result? The answer is that, in this case, age was a confounder. What we initially thought was the effect of smoking was, in reality, at least in part, the effect of age. Overall, more deaths occurred among nonsmokers in the first analysis because they were older at baseline. When we compare people with similar age but who differ on smoking status, then the difference in mortality between them is not because of age (they have the same age) but smoking. Thus, in the second analysis we took age into account, or, in statistical terms, we adjusted for age, whereas the first analysis was, in statistical terms, an unadjusted or crude analysis. We should always be aware of studies with only crude results, because they might be biased/misleading.2
In the example above, age is not the only factor that might influence mortality. Alcohol or drug use, cancer or heart disease, body mass index, or physical activity can also influence death, independently of smoking. How to adjust for all these factors? We cannot do stratified analyses as we did above, because the strata would be too many. The solution is to do a multivariable regression analysis. This is a statistical tool to adjust for multiple factors (or variables) at the same time. When we adjust for all these factors, we are comparing the effect of smoking in people who are the same with regard to all these factors but who differ on smoking status. In statistical terms, we study the effect of smoking, keeping everything else constant. In this way we “isolate” the effect of smoking on death by taking into account all other factors, or, in statistical terms, we study the effect of smoking independently of other factors.
How many factors should be included in a multivariable analysis? As a general rule, the more the better, to reduce confounding. However, the number of variables to include in a regression model is limited by the sample size. The general rule of thumb is that, for every 10 events (for dichotomous outcomes) or 10 people (for continuous outcomes), we can add one variable in the model. If we add more variables than that, then in statistical terms the model becomes overfitted (i.e., it gives results that are specific to that dataset, but may not be applicable to other datasets). Overfitted models can be as biased/misleading as crude models.3
What are we to do about other factors that may affect mortality independently of smoking (e.g., diet), but which are not found in our dataset? Unfortunately, nothing. Since we do not have that information, we cannot adjust for it. In this case, diet is in statistical terms an unmeasured confounder. Unfortunately, in all observational studies there is always at least some degree of unmeasured confounding, because there may be many factors that can influence the outcome (and the exposure) which are not part of the dataset. While some statistical tools have been developed to estimate unmeasured confounding, and therefore interpret the results in its light, unmeasured confounding remains one of the major limitations of observational studies.4
Randomized, controlled trials (RCTs) on the other side do not have this problem in theory. With properly designed RCTs, all confounders, both measured and unmeasured, will be balanced between the two groups. For example, imagine an RCT where some patients are randomized to take drug A or drug B. Because patients are randomly allocated to one group or the other, it is assumed that all other factors are also randomly distributed. Hence, the two groups should be equal to each other with respect to all other factors except our active intervention, namely the type of drug they are taking (A or B). For this reason, in RCTs there is no need to adjust for multiple factors with a multivariable regression analysis, and crude unadjusted results can be presented as unbiased.
There is however a caveat. What happens if one patient who was randomized to take drug A takes drug B instead? Should she still be counted in analysis under drug A (as randomized) or under drug B (as she took it)? The usual practice is to do this and present both. In the first case, we will have the intention-to-treat (ITT) analysis, and in the second case, the per-protocol analysis (PPA). The advantage of the ITT is that it keeps the strength of randomization, namely the balancing of confounders, and therefore can present unbiased results. The advantage of the PPA is that it measures what was actually done in reality. However, in this case there is a departure from the original randomization, and hence there is the possibility of introducing confounding, because now patients are not randomly allocated to one treatment or the other. The larger the departure from randomization, the more probable the introduction of bias/confounding. For example, what if patients with more severe disease took drug A, even though they were randomized to take drug B? That will have an influence the outcome. For this reason, outcomes of the ITT analysis are considered the main results of RCTs, because PPA results can be confounded.
In summary, when reading studies, do not simply accept the results as they are presented, but rather ask yourself: “Could they be confounded by other factors, and therefore be unreliable? What steps did the authors take to reduce confounding? If they presented only crude analyses, and this was not justified by a RCT design, do they recognize it as a major limitation?” There are many nuances in every paper that can be appreciated only through a careful reading of the methods section. Hopefully, this article can shed some light on these issues and help the readers to not be confounded.
References
1. The P value: What to make of it? A simple guide for the uninitiated. GI and Hepatology News. 2019 Sep 23. https://www.mdedge.com/gihepnews/article/208601/mixed-topics/p-value-what-make-it-simple-guide-uninitiated
2. VanderWeele TJ et al. Ann Stat. 2013 Feb;41(1):196-220.
3. Concato J et al. Ann Intern Med. 1993 Feb 1;118(3):201-10.
4. VanderWeele TJ et al. Ann Intern Med. 2017 Aug 15;167(4):268-74.
Dr. Jovani is a therapeutic endoscopy fellow in the division of gastroenterology and hepatology at Johns Hopkins Hospital, Baltimore.
Novel calculator predicts cancer risk in patients with CVD
Individualized 10-year and lifetime risks of cancer can now for the first time be estimated in patients with established cardiovascular disease, Cilie C. van ’t Klooster, MD, reported at the virtual annual congress of the European Society of Cardiology.

She and her coinvestigators have developed an easy-to-use predictive model that generates individualized risk estimates for total cancer, lung cancer, and colorectal cancer. The tool relies on nine readily available clinical variables: age, sex, smoking, weight, height, alcohol use, diabetes, antiplatelet drug use, and C-reactive protein level. The cancer risk calculator factors in an individual’s competing risk of death because of cardiovascular disease (CVD).
The risk calculator was developed using data on 7,280 patients with established CVD enrolled in the ongoing long-term Dutch UCC-SMART (Utrecht Cardiovascular Cohort – Second Manifestations of Arterial Disease) study, then independently validated in 9,322 patients in the double-blind CANTOS (Canakinumab Anti-Inflammatory Thrombosis Outcomes) trial, explained Dr. van ’t Klooster of Utrecht (the Netherlands) University.
Several other prediction models estimate the risk of a specific type of cancer, most commonly breast cancer or lung cancer. But the new Utrecht prediction tool is the first one to estimate total cancer risk. It’s also the first to apply specifically to patients with known CVD, thus filling an unmet need, because patients with established CVD are known to be on average at 19% increased risk of total cancer and 56% greater risk for lung cancer, compared with the general population. This is thought to be caused mainly by shared risk factors, including smoking, obesity, and low-grade systemic inflammation.
As the Utrecht/CANTOS analysis shows, however, that 19% increased relative risk for cancer in patients with CVD doesn’t tell the whole story. While the median lifetime and 10-year risks of total cancer in CANTOS were 26% and 10%, respectively, the individual patient risks for total cancer estimated using the Dutch prediction model ranged from 1% to 52% for lifetime and from 1% to 31% for 10-year risk. The same was true for lung cancer risk: median 5% lifetime and 2% 10-year risks, with individual patient risks ranging from 0% to 37% and from 0% to 24%. Likewise for colorectal cancer: a median 4% lifetime risk, ranging from 0% to 6%, and a median 2% risk over the next 10 years, with personalized risks ranging as high as 13% for lifetime risk and 6% for 10-year colorectal cancer risk.
The risk calculator performed “reasonably well,” according to Dr. van ’t Klooster. She pointed to a C-statistic of 0.74 for lung cancer, 0.63 for total cancer, and 0.64 for colorectal cancer. It’s possible the risk predictor’s performance could be further enhanced by incorporation of several potentially important factors that weren’t available in the UCC-SMART derivation cohort, including race, education level, and socioeconomic status, she added.
Potential applications for the risk calculator in clinical practice require further study, but include using the lifetime risk prediction for cancer as a motivational aid in conversations with patients about the importance of behavioral change in support of a healthier lifestyle. Also, a high predicted 10-year lung cancer risk could potentially be used to lower the threshold for a screening chest CT, resulting in earlier detection and treatment of lung cancer, Dr. van ’t Klooster noted.
In an interview, Bonnie Ky, MD, MSCE, praised the risk prediction study as rigorously executed, topical, and clinically significant.
“This paper signifies the overlap between our two disciplines of cancer and cardiovascular disease in terms of the risks that we face together when we care for this patient population,” said Dr. Ky, a cardiologist at the University of Pennsylvania, Philadelphia.
“Many of us in medicine believe in the importance of risk prediction: identifying who’s at high risk and doing everything we can to mitigate that risk. This paper speaks to that and moves us one step closer to accomplishing that aim,” added Dr. Ky, who is editor in chief of JACC: CardioOncology, which published the study simultaneously with Dr. van ’t Klooster’s presentation at ESC 2020. The paper provides direct access to the risk calculator.
Dr. van ’t Klooster reported having no financial conflicts regarding her study. UCC-SMART is funded by a Utrecht University grant, and CANTOS was funded by Novartis.
SOURCE: van ’t Klooster CC. ESC 2020 and JACC CardioOncol. 2020 Aug. doi: 10.1016/j.jaccao.2020.07.001.
Individualized 10-year and lifetime risks of cancer can now for the first time be estimated in patients with established cardiovascular disease, Cilie C. van ’t Klooster, MD, reported at the virtual annual congress of the European Society of Cardiology.
She and her coinvestigators have developed an easy-to-use predictive model that generates individualized risk estimates for total cancer, lung cancer, and colorectal cancer. The tool relies on nine readily available clinical variables: age, sex, smoking, weight, height, alcohol use, diabetes, antiplatelet drug use, and C-reactive protein level. The cancer risk calculator factors in an individual’s competing risk of death because of cardiovascular disease (CVD).
The risk calculator was developed using data on 7,280 patients with established CVD enrolled in the ongoing long-term Dutch UCC-SMART (Utrecht Cardiovascular Cohort – Second Manifestations of Arterial Disease) study, then independently validated in 9,322 patients in the double-blind CANTOS (Canakinumab Anti-Inflammatory Thrombosis Outcomes) trial, explained Dr. van ’t Klooster of Utrecht (the Netherlands) University.
Several other prediction models estimate the risk of a specific type of cancer, most commonly breast cancer or lung cancer. But the new Utrecht prediction tool is the first one to estimate total cancer risk. It’s also the first to apply specifically to patients with known CVD, thus filling an unmet need, because patients with established CVD are known to be on average at 19% increased risk of total cancer and 56% greater risk for lung cancer, compared with the general population. This is thought to be caused mainly by shared risk factors, including smoking, obesity, and low-grade systemic inflammation.
As the Utrecht/CANTOS analysis shows, however, that 19% increased relative risk for cancer in patients with CVD doesn’t tell the whole story. While the median lifetime and 10-year risks of total cancer in CANTOS were 26% and 10%, respectively, the individual patient risks for total cancer estimated using the Dutch prediction model ranged from 1% to 52% for lifetime and from 1% to 31% for 10-year risk. The same was true for lung cancer risk: median 5% lifetime and 2% 10-year risks, with individual patient risks ranging from 0% to 37% and from 0% to 24%. Likewise for colorectal cancer: a median 4% lifetime risk, ranging from 0% to 6%, and a median 2% risk over the next 10 years, with personalized risks ranging as high as 13% for lifetime risk and 6% for 10-year colorectal cancer risk.
The risk calculator performed “reasonably well,” according to Dr. van ’t Klooster. She pointed to a C-statistic of 0.74 for lung cancer, 0.63 for total cancer, and 0.64 for colorectal cancer. It’s possible the risk predictor’s performance could be further enhanced by incorporation of several potentially important factors that weren’t available in the UCC-SMART derivation cohort, including race, education level, and socioeconomic status, she added.
Potential applications for the risk calculator in clinical practice require further study, but include using the lifetime risk prediction for cancer as a motivational aid in conversations with patients about the importance of behavioral change in support of a healthier lifestyle. Also, a high predicted 10-year lung cancer risk could potentially be used to lower the threshold for a screening chest CT, resulting in earlier detection and treatment of lung cancer, Dr. van ’t Klooster noted.
In an interview, Bonnie Ky, MD, MSCE, praised the risk prediction study as rigorously executed, topical, and clinically significant.
“This paper signifies the overlap between our two disciplines of cancer and cardiovascular disease in terms of the risks that we face together when we care for this patient population,” said Dr. Ky, a cardiologist at the University of Pennsylvania, Philadelphia.
“Many of us in medicine believe in the importance of risk prediction: identifying who’s at high risk and doing everything we can to mitigate that risk. This paper speaks to that and moves us one step closer to accomplishing that aim,” added Dr. Ky, who is editor in chief of JACC: CardioOncology, which published the study simultaneously with Dr. van ’t Klooster’s presentation at ESC 2020. The paper provides direct access to the risk calculator.
Dr. van ’t Klooster reported having no financial conflicts regarding her study. UCC-SMART is funded by a Utrecht University grant, and CANTOS was funded by Novartis.
SOURCE: van ’t Klooster CC. ESC 2020 and JACC CardioOncol. 2020 Aug. doi: 10.1016/j.jaccao.2020.07.001.
FROM ESC CONGRESS 2020
In a time of two pandemics, a recommitment to work together
Overwhelmed. As if we weren’t already overwhelmed. For decades, hospitalists have been on the forefront of improving acute care amidst a rapidly changing environment. These last few decades have seen tremendous advances in medicine, technology, safety culture, innovations in payment models, transformation in business models, and a rising tide of health care policy. There was never a year we didn’t face major change … and adapt to it. Then 2020 came upon us.

This year, we adapt to more than a score and 4 years’ worth of change.
The two pandemics that have come upon us are like tsunamis. And many of us are drowning. We know of threats of pandemics: influenza, Ebola, and the like. But SARS-CoV-2 is new and like no other. We live in fear and isolation, each and every day learning new information and debunking others. We also know of racial injustice and racism, implicit or explicit in our nation, whether we live it or just read of it. George Floyd’s death in my hometown marked another tsunami, a great realization in our nation, and a great unmasking of our denial.
Yet our country is not united.
Hospital medicine is not immune to this disunity. At a time that we are all treading water, staying afloat in our own hospitals and communities, confronting these issues beyond our immediate spheres of influence is overwhelming. We are impacted by these pandemics, personally and professionally. And admittedly, we can be both victim and perpetrator.
In the face of a novel infectious agent, medicine responded quickly and pushed us beyond our limits. We have developed new infection prevention guidelines. We worked creatively to solve PPE shortages. We fashioned new work flows and new care models. We accelerated telehealth applications. We expanded the boundaries on home-based programs and reached out to vulnerable elderly in congregate living – an isolation no older person should have to endure. We cared for our colleagues, neighbors, and family members who fell ill, some who recovered, and sadly, some who fell. We developed best-practice guidelines, research protocols, created new order sets, note templates, and documentation standards. We flexed into EDs, ICUs, and field hospitals. Amidst the turmoil, we took pay cuts and saw colleagues go on furlough. And still, we mentored leaders in our schools, churches, synagogues, mosques, and civic communities.
And just when we thought we could endure no more, on May 25, we witnessed a black man in Minneapolis killed by a policeman’s knee. The same knee that divided Americans when black American athletes knelt to protest the injustice their people have endured for centuries. A knee that has been confused for insolence, when it was meant for justice ... yes, justice, for all. So, in early June, around the nation in support of black lives we also knelt, for almost 9 minutes.
This was the third time I cried during the pandemics.
For many of us, structural racism in America had finally been unmasked. The nation protested and rioted for weeks, and some communities have continued. Indeed, these two pandemics are still surging.
Side by side COVID-19 case conferences we lay transparent data demonstrating health disparities that we have tolerated for so long. We have vowed to resource equity work, and we opened dialogue, not only with patients and communities of color, but also with colleagues of color – some ready and some not yet ready to share and relive the traumas of their past and their present.
And still, we are not united.
While we physically mask to prevent the spread of COVID-19, we must make efforts to unmask the truths of SARS-CoV-2, the failings of our health system, the richness of our communities of color, and the injustice in the fabric of our society. More importantly, we must work together to create solutions. While we have diverse interests and priorities, at SHM, we can find common ground with kindred spirits, enhance the role of our specialty, and advance the health of our patients.
Let’s not be mistaken. These pandemics add to a growing list of interwoven issues in our society. In 2018, I wrote a piece on the role of hospitalists in addressing rural health disparities.1 According to the Sheps Center for Health Services Research, 129 rural hospitals have closed since 2010, closures that have accelerated with the COVID-19 pandemic.2 More than ever, we must stand above our inner and outer conflicts and be united to promote the health of our nation during these pandemics, because “all policy is health policy.”3
Most SHM presidents and president-elects come in with a platform, a priority for the specialty and for the society. This year, the platform has chosen us. For 20 years, I have witnessed SHM be a workshop for our members to address the pressing needs of our specialty and our patients. In 2020, we’ve continued to see SHM as a workshop for our members and a tour de force addressing these pandemics, from just in time publications of research and perspectives in the Journal of Hospital Medicine, to webinars and open access education in the Learning Portal, to advocacy on Capitol Hill. All of that work has been informed by you and for you. While there is still so much to do, we need not be overwhelmed when we do it together.
A score and 4 years ago, Robert Wachter, MD, and Lee Goldman, MD, dubbed us “hospitalists.” A year later, our shared workshop was born. Through one name change and now our first CEO transition from Larry Wellikson, MD, to Eric Howell, MD, SHM will continue to be where hospitalists both adapt and shape our nation through solutions that put an end to these pandemics. Let’s recommit to this work together.
Dr. Siy is division medical director, hospital specialties, in the departments of hospital medicine and community senior and palliative care, at HealthPartners in Bloomington, Minn. He is president-elect of SHM.
Sources
1. Hardeman RR et al. Stolen Breaths. N Engl J Med. 2020 Jul 16;383:197-9.
2. Siy JC. Reviving Rural Health Care. The Hospitalist. 2018 Sep 24.
3. The Cecil G. Sheps Center For Health Services Research. Rural Hospital Closures. 2014. https://www.shepscenter.unc.edu/programs-projects/rural-health/rural-hospital-closures/
Overwhelmed. As if we weren’t already overwhelmed. For decades, hospitalists have been on the forefront of improving acute care amidst a rapidly changing environment. These last few decades have seen tremendous advances in medicine, technology, safety culture, innovations in payment models, transformation in business models, and a rising tide of health care policy. There was never a year we didn’t face major change … and adapt to it. Then 2020 came upon us.
This year, we adapt to more than a score and 4 years’ worth of change.
The two pandemics that have come upon us are like tsunamis. And many of us are drowning. We know of threats of pandemics: influenza, Ebola, and the like. But SARS-CoV-2 is new and like no other. We live in fear and isolation, each and every day learning new information and debunking others. We also know of racial injustice and racism, implicit or explicit in our nation, whether we live it or just read of it. George Floyd’s death in my hometown marked another tsunami, a great realization in our nation, and a great unmasking of our denial.
Yet our country is not united.
Hospital medicine is not immune to this disunity. At a time that we are all treading water, staying afloat in our own hospitals and communities, confronting these issues beyond our immediate spheres of influence is overwhelming. We are impacted by these pandemics, personally and professionally. And admittedly, we can be both victim and perpetrator.
In the face of a novel infectious agent, medicine responded quickly and pushed us beyond our limits. We have developed new infection prevention guidelines. We worked creatively to solve PPE shortages. We fashioned new work flows and new care models. We accelerated telehealth applications. We expanded the boundaries on home-based programs and reached out to vulnerable elderly in congregate living – an isolation no older person should have to endure. We cared for our colleagues, neighbors, and family members who fell ill, some who recovered, and sadly, some who fell. We developed best-practice guidelines, research protocols, created new order sets, note templates, and documentation standards. We flexed into EDs, ICUs, and field hospitals. Amidst the turmoil, we took pay cuts and saw colleagues go on furlough. And still, we mentored leaders in our schools, churches, synagogues, mosques, and civic communities.
And just when we thought we could endure no more, on May 25, we witnessed a black man in Minneapolis killed by a policeman’s knee. The same knee that divided Americans when black American athletes knelt to protest the injustice their people have endured for centuries. A knee that has been confused for insolence, when it was meant for justice ... yes, justice, for all. So, in early June, around the nation in support of black lives we also knelt, for almost 9 minutes.
This was the third time I cried during the pandemics.
For many of us, structural racism in America had finally been unmasked. The nation protested and rioted for weeks, and some communities have continued. Indeed, these two pandemics are still surging.
Side by side COVID-19 case conferences we lay transparent data demonstrating health disparities that we have tolerated for so long. We have vowed to resource equity work, and we opened dialogue, not only with patients and communities of color, but also with colleagues of color – some ready and some not yet ready to share and relive the traumas of their past and their present.
And still, we are not united.
While we physically mask to prevent the spread of COVID-19, we must make efforts to unmask the truths of SARS-CoV-2, the failings of our health system, the richness of our communities of color, and the injustice in the fabric of our society. More importantly, we must work together to create solutions. While we have diverse interests and priorities, at SHM, we can find common ground with kindred spirits, enhance the role of our specialty, and advance the health of our patients.
Let’s not be mistaken. These pandemics add to a growing list of interwoven issues in our society. In 2018, I wrote a piece on the role of hospitalists in addressing rural health disparities.1 According to the Sheps Center for Health Services Research, 129 rural hospitals have closed since 2010, closures that have accelerated with the COVID-19 pandemic.2 More than ever, we must stand above our inner and outer conflicts and be united to promote the health of our nation during these pandemics, because “all policy is health policy.”3
Most SHM presidents and president-elects come in with a platform, a priority for the specialty and for the society. This year, the platform has chosen us. For 20 years, I have witnessed SHM be a workshop for our members to address the pressing needs of our specialty and our patients. In 2020, we’ve continued to see SHM as a workshop for our members and a tour de force addressing these pandemics, from just in time publications of research and perspectives in the Journal of Hospital Medicine, to webinars and open access education in the Learning Portal, to advocacy on Capitol Hill. All of that work has been informed by you and for you. While there is still so much to do, we need not be overwhelmed when we do it together.
A score and 4 years ago, Robert Wachter, MD, and Lee Goldman, MD, dubbed us “hospitalists.” A year later, our shared workshop was born. Through one name change and now our first CEO transition from Larry Wellikson, MD, to Eric Howell, MD, SHM will continue to be where hospitalists both adapt and shape our nation through solutions that put an end to these pandemics. Let’s recommit to this work together.
Dr. Siy is division medical director, hospital specialties, in the departments of hospital medicine and community senior and palliative care, at HealthPartners in Bloomington, Minn. He is president-elect of SHM.
Sources
1. Hardeman RR et al. Stolen Breaths. N Engl J Med. 2020 Jul 16;383:197-9.
2. Siy JC. Reviving Rural Health Care. The Hospitalist. 2018 Sep 24.
3. The Cecil G. Sheps Center For Health Services Research. Rural Hospital Closures. 2014. https://www.shepscenter.unc.edu/programs-projects/rural-health/rural-hospital-closures/
Hospital medicine in a worldwide pandemic
SHM releases 2020 State of Hospital Medicine report
Every 2 years the Society of Hospital Medicine’s Practice Analysis Committee (PAC) surveys hospitalist groups nationwide on such key practice parameters as compensation, services provided, hours of work, and participation in leadership roles. Combined with compensation and productivity data on adult and pediatric hospitalists collected by the Medical Group Management Association, licensed to SHM for inclusion in this report, the State of Hospital Medicine (SoHM) report is the most authoritative and comprehensive source of information regarding contemporary hospitalist practice.

This year’s biannual report is based on survey responses submitted between Jan. 6 and Feb. 28, 2020, by 502 hospitalist group practices. That’s slightly fewer groups reporting data than for past surveys, but these groups were larger, on average, resulting in more full-time equivalents (FTEs) incorporated into the results, said PAC member Leslie Flores, MHA, SFHM, of Nelson Flores Hospital Medicine Consultants. A total of 19.7% of the reporting groups provided pediatric hospital medicine data only, a much larger proportion than in past years.
The report is slated for publication in September, and SHM members can purchase it at a discount in print or electronic versions. “Our sense is that a lot of the fundamental information in the report will not have changed that much from 2018,” Ms. Flores said. “But these results convey the state of the field prior to the world-altering impact of the COVID-19 pandemic on hospitals of all sizes and settings.” How the hospital business and the practice of hospitalist groups have been and will be impacted by the pandemic, obviously, aren’t reflected in the data.
“We are finalizing a supplemental survey to go out to members at the end of the summer, specifically asking how COVID has impacted their hospitalist groups,” Ms. Flores said. These COVID-19 supplemental results will be released after the main report, sometime around the end of September. But results from the main survey, showing consistency in a number of key parameters, indicate that hospitalists continue to have a large and essential role in the U.S. health care system.
The leadership offered by hospitalists in the U.S. health care system’s response to surges of COVID-19 patients in many hospitals only underscores their importance, Ms. Flores added. “Hospitalists have definitely proven their worth. Imagine what the pandemic would have been like for hospitals if our specialty hadn’t been well-positioned to respond.” Hospitalists also showed an ability to adapt quickly to crises on the ground. But financial pressures imposed by the pandemic, combined with other trends previously in play, suggest that demands to cut costs and do more with less will be relentless as the field – and the world – tries to pull out of the pandemic crisis.
Compensation trends
One of the most eagerly anticipated findings in the SoHM is compensation. The median compensation for all adult hospitalists at the beginning of 2020 was $307,633 (with an average of $317,640), higher in the Midwest and lower in the East. The average base rate share of hospitalist compensation was 81.3%, with 11.6% based on productivity and 7.1% for performance – scored on such measures as patient satisfaction; accuracy and/or timeliness of documentation, billing, and coding; clinical processes; early morning discharge orders and times; and readmissions rates. A total of 46.6% of responding groups said they anticipated an increase in budgeted FTEs in the next year, while 51.2% expected to stay the same.
Subsidies or financial support for hospitalist practices break down in different ways, but in 2020 the median figure for financial support provided per adult hospitalist FTE was $198,750 (average, $201,760). This suggests that hospitals continue to see hospitalists as valued partners in health care, with useful knowledge of how the various components of the health care system work, said Tresa McNeal, MD, a hospitalist at Baylor Scott & White Medical Center, Temple, Tex., and a member of the PAC.
Scope of practice
Scope of practice for the hospitalist model continues to evolve, with increased demand for comanagement roles as other medical specialties are less inclined to visit patients in the hospital. Surgical comanagement accounted for much of that growth, but there were significant rates of comanagement for neurology, gastrointestinal and liver medicine, cardiology, and palliative care.
“Comanagement is a broad term without a single clear definition,” Ms. Flores said. “But when I talk about it, I refer to a broader array of hospitalists interacting with specialists.” The hospitalist‘s role could be as a consultant, or taking responsibility for admitting and attending.
Other identified roles played by hospitalists in adult-only groups included providing care for patients in the ICU (59.6% of reporting groups); primary responsibility for observation/short stay units, rapid response teams or code blue/cardiac arrest teams; cross-coverage for patients admitted without a hospitalist; and performing procedures such as vascular access, lumbar puncture, paracentesis, and thoracentesis. The hospitalist role’s in the ICU likely increased in many hospitals confronting COVID surges, Ms. Flores said.
The median number of shifts performed per year by a full-time hospitalist physician was 182.0 (average, 182.3), with 12 hours as the most common average duration for a shift in a daytime schedule. The 7-days-on/7-days-off model remained the most popular way to schedule adult hospitalists, at the same rate as in 2018. Backup coverage is another important issue for hospitalist groups, with 52.6% reporting no formal backup system. For those with a backup system, the highest proportion paid no additional compensation to the physician for being on the on-call schedule, but additional compensation was paid if called into the hospital.
Presence of nocturnists was reported by 71.9% of responding groups, slightly down from 2018, but increasing with the size of the group. “We continue to see a trend for dedicated nocturnists,” said Dr. McNeal. Hospitals see the benefits from the presence of a nocturnist, reflected in pay differentials or requiring fewer full-time shifts from nocturnists. It’s more consistent, higher quality of care delivered by people who are dedicated to that role.
In other findings from the survey, turnover in adult hospitalist groups is 10.9%t, which is up from 2018 but down from 2016. Unit-based assignment, also known as geographical rounding, was utilized by 42.7% of responding adult groups, with likelihood increasing with the size of the group. Unfilled positions were reported by 73.5% of groups, with an average of 11.2% of positions unfilled at the time of the survey.
The use of telemedicine in the hospital setting is evolving, likely considerably accelerated of necessity by the pandemic. “Many of us are using telemedicine with COVID patients in order to decrease clinicians’ time in the room, and to find a way to use a work force that has to be on leave,” Dr. McNeal said.
Nurse practitioners and physician assistants
The role for nurse practitioners and physician assistants in adult hospital medicine groups continues to increase, with 83.3% of groups reporting the presence of PAs and NPs, up from 77% in 2018. NPs/PAs are more likely in multistate hospitalist groups or integrated delivery system practices in hospitals/health systems.
The most common billing model for their professional services is a combination of independent billing by the PA/NP where allowed and shared services billing under a supervisory physician’s provider number – although 8.1% of groups report that their NPs/PAs didn’t generally provide billable services or submit bills for payment.
NPs and PAs spend one-fifth of their time, on average, on nonbillable, value-added work, including dedicated cross-coverage shifts, scheduling, patient assignments, nonbillable clinical work such as glycemic control, and quality improvement and performance improvement activities. “This is one example of the changing skill mix for the hospitalist group, helping the practice become more efficient,” Ms. Flores said.
NPs and PAs provide valuable services, Dr. McNeal added. “But it also takes some investment in time and training for them to be able to practice at the top of their license. My own hospitalist group has a training program for newly hired NPs/PAs. Everyone goes through this orientation for around 6-10 weeks, largely in a shadowing role starting out, until they gradually adjust to more clinical autonomy.”
This onboarding includes real-time evaluations and self-evaluations, and opportunities for conversations with experienced clinicians, working from a list of 30 “bread-and-butter” topics in hospital medicine, she noted.
Pediatric hospital medicine
The 2020 SoHM report includes a greater representation for pediatric hospital medicine, with a 200% increase in the proportion of reporting hospitalist groups that only take care of children. Thus, the pediatric data are more robust – and helpful – than in prior year surveys, said Sandra Gage, MD, SFHM, a pediatric hospitalist at Phoenix Children’s Hospital. Dr. Gage headed up the PAC’s expanded pediatric data initiative, with targeted outreach to pediatric groups to encourage their participation. She also convened a task force to come up with pediatric-specific questions that were more pertinent and user friendly.
One of the important questions for pediatric hospitalists involves scheduling – including variations in length of shifts – which can vary dramatically in pediatric HM groups. “This year we reported by number of hours expected for a clinical FTE, which should be more useful for group leaders,” Dr. Gage said. The median number of hours required per FTE from pediatric hospitalists was fairly consistent at 1,800 per year, with minor variations based on region and academic status.
“I don’t know that there’s anything too surprising in most of the data,” she said, but noted that SHM will now have a better pediatric baseline going forward. The survey also asked how many pediatric hospitalists were board certified in the new subspecialty of pediatric hospital medicine under the program launched last year by the American Board of Pediatrics. Its first qualifying exam was in November 2019. The average was 26%, but the variation between academic and nonacademic programs was unexpected, Dr. Gage said.
Pediatric hospitalists come from a variety of professional specialties besides pediatrics. Nearly half of all programs had at least one med/peds provider, while a smaller number of programs had providers from family medicine, internal medicine, emergency medicine, or palliative care, she noted. Half of pediatric hospitalists reported joining their practice directly out of residency. About 26% of pediatric hospital medicine (PHM) physicians were described as part time, and 34.3% of pediatric groups had the presence of an NP or PA.
“I think PHM evolved a little later than for adult hospitalists, but it has clearly come into its own as a field,” Dr. Gage said. In the COVID-19 crisis, some pediatric hospitalists have been asked to care for adult patients, which necessitated a flurry of activity to refresh their medical knowledge. Where pediatric units existed within the walls of adult hospitals and were temporarily closed for COVID, it’s not clear how many will reopen – perhaps ever.
Long-term impacts of the crisis
Some of the hospitalist group leaders Ms. Flores has spoken with in recent months point out that, while New York and some other early COVID-19 hot spots experienced a tremendous surge of patients and hospital crowding in March and April 2020, other hospitals didn’t see anywhere near the impact.
“For some, there was nothing going on with COVID where they were,” she said. Elective surgeries were widely canceled, but with no corresponding increase of COVID admissions; and with fewer patients showing up in EDs, some physicians found themselves idled.
What will be the longer-term impact of COVID-19? How will it change hospital medicine? “I definitely think things are going to change,” Ms. Flores said, speculating that licensing boards could find a way to make it easier for physicians to practice across state lines in response to crises like the pandemic. “Do we need to think at the national level about what we can do to create more surge capacity, to move people when and where they need to go in a crisis? Are there things SHM could do to help?”
Ms. Flores expects more hospital closures than followed the 2008-2009 economic recession, which likely will further drive the trend toward mergers and acquisitions – both of hospitalist groups and of hospitals.
“From the point of view of hospitals, financial pressures will only get worse, pressing us to reinvent how hospitalists work and how that could be made more efficient,” she said. “I hear hospitals saying: ‘We can’t sustain current trends.’ Meanwhile, specialists are saying they need more help from hospitalists, and frontline hospitalists are saying they’re already working too hard. What will we do about burnout?”
These competing trends were all headed toward a perfect storm even before the epidemic hit, Ms. Flores said. “The response will require some innovations we haven’t yet conceived of. Incremental change won’t get us where we need to be. But the hospitalist’s role will be more essential than ever.”
The 2020 data show that a lot of things have been fairly steady for hospitalists, said Thomas Frederickson, MD, a member of SHM’s PAC and a specialist in hospital medicine at CHI Health in Omaha, Neb. But one concern about this stability is that, while hospitalist compensation continues to go up, workload and by extension productivity remain relatively flat. “That has been a trend over the past decade, and some of us find it hard to make sense of that.”
Dr. Frederickson, too, sees a need for disruptive innovation. “I just wish I knew what that will be.” Perhaps, just as hospitalists played a large role in the quality revolution in hospitals over the past decade, maybe in the next decade they will come to play a large role in the right-sizing of hospital care in health systems, he said.
One other important finding: the number of hospitalists per group who play roles as physician leaders has also increased, with an average of 3.2 physicians per group in a formal leadership role (median of 2). But currently, 73% of the highest-ranking leaders in hospitalist groups are male, and they are disproportionally white. As reported in Medscape in 2019, 40% of working hospitalists are women and only 36% of hospitalists overall self-identified as White.1
“When you think of the demographics of actual working hospitalists, we could say the field of hospital medicine could and should do better in creating opportunities for diversity in leadership roles,” Ms. Flores said.
Reference
1. Martin KL. Hospitalist Compensation Report for 2019. Medscape. 2019 Jun 5. https://www.medscape.com/slideshow/2019-compensation-hospitalist-6011429#3.
SHM releases 2020 State of Hospital Medicine report
SHM releases 2020 State of Hospital Medicine report
Every 2 years the Society of Hospital Medicine’s Practice Analysis Committee (PAC) surveys hospitalist groups nationwide on such key practice parameters as compensation, services provided, hours of work, and participation in leadership roles. Combined with compensation and productivity data on adult and pediatric hospitalists collected by the Medical Group Management Association, licensed to SHM for inclusion in this report, the State of Hospital Medicine (SoHM) report is the most authoritative and comprehensive source of information regarding contemporary hospitalist practice.
This year’s biannual report is based on survey responses submitted between Jan. 6 and Feb. 28, 2020, by 502 hospitalist group practices. That’s slightly fewer groups reporting data than for past surveys, but these groups were larger, on average, resulting in more full-time equivalents (FTEs) incorporated into the results, said PAC member Leslie Flores, MHA, SFHM, of Nelson Flores Hospital Medicine Consultants. A total of 19.7% of the reporting groups provided pediatric hospital medicine data only, a much larger proportion than in past years.
The report is slated for publication in September, and SHM members can purchase it at a discount in print or electronic versions. “Our sense is that a lot of the fundamental information in the report will not have changed that much from 2018,” Ms. Flores said. “But these results convey the state of the field prior to the world-altering impact of the COVID-19 pandemic on hospitals of all sizes and settings.” How the hospital business and the practice of hospitalist groups have been and will be impacted by the pandemic, obviously, aren’t reflected in the data.
“We are finalizing a supplemental survey to go out to members at the end of the summer, specifically asking how COVID has impacted their hospitalist groups,” Ms. Flores said. These COVID-19 supplemental results will be released after the main report, sometime around the end of September. But results from the main survey, showing consistency in a number of key parameters, indicate that hospitalists continue to have a large and essential role in the U.S. health care system.
The leadership offered by hospitalists in the U.S. health care system’s response to surges of COVID-19 patients in many hospitals only underscores their importance, Ms. Flores added. “Hospitalists have definitely proven their worth. Imagine what the pandemic would have been like for hospitals if our specialty hadn’t been well-positioned to respond.” Hospitalists also showed an ability to adapt quickly to crises on the ground. But financial pressures imposed by the pandemic, combined with other trends previously in play, suggest that demands to cut costs and do more with less will be relentless as the field – and the world – tries to pull out of the pandemic crisis.
Compensation trends
One of the most eagerly anticipated findings in the SoHM is compensation. The median compensation for all adult hospitalists at the beginning of 2020 was $307,633 (with an average of $317,640), higher in the Midwest and lower in the East. The average base rate share of hospitalist compensation was 81.3%, with 11.6% based on productivity and 7.1% for performance – scored on such measures as patient satisfaction; accuracy and/or timeliness of documentation, billing, and coding; clinical processes; early morning discharge orders and times; and readmissions rates. A total of 46.6% of responding groups said they anticipated an increase in budgeted FTEs in the next year, while 51.2% expected to stay the same.
Subsidies or financial support for hospitalist practices break down in different ways, but in 2020 the median figure for financial support provided per adult hospitalist FTE was $198,750 (average, $201,760). This suggests that hospitals continue to see hospitalists as valued partners in health care, with useful knowledge of how the various components of the health care system work, said Tresa McNeal, MD, a hospitalist at Baylor Scott & White Medical Center, Temple, Tex., and a member of the PAC.
Scope of practice
Scope of practice for the hospitalist model continues to evolve, with increased demand for comanagement roles as other medical specialties are less inclined to visit patients in the hospital. Surgical comanagement accounted for much of that growth, but there were significant rates of comanagement for neurology, gastrointestinal and liver medicine, cardiology, and palliative care.
“Comanagement is a broad term without a single clear definition,” Ms. Flores said. “But when I talk about it, I refer to a broader array of hospitalists interacting with specialists.” The hospitalist‘s role could be as a consultant, or taking responsibility for admitting and attending.
Other identified roles played by hospitalists in adult-only groups included providing care for patients in the ICU (59.6% of reporting groups); primary responsibility for observation/short stay units, rapid response teams or code blue/cardiac arrest teams; cross-coverage for patients admitted without a hospitalist; and performing procedures such as vascular access, lumbar puncture, paracentesis, and thoracentesis. The hospitalist role’s in the ICU likely increased in many hospitals confronting COVID surges, Ms. Flores said.
The median number of shifts performed per year by a full-time hospitalist physician was 182.0 (average, 182.3), with 12 hours as the most common average duration for a shift in a daytime schedule. The 7-days-on/7-days-off model remained the most popular way to schedule adult hospitalists, at the same rate as in 2018. Backup coverage is another important issue for hospitalist groups, with 52.6% reporting no formal backup system. For those with a backup system, the highest proportion paid no additional compensation to the physician for being on the on-call schedule, but additional compensation was paid if called into the hospital.
Presence of nocturnists was reported by 71.9% of responding groups, slightly down from 2018, but increasing with the size of the group. “We continue to see a trend for dedicated nocturnists,” said Dr. McNeal. Hospitals see the benefits from the presence of a nocturnist, reflected in pay differentials or requiring fewer full-time shifts from nocturnists. It’s more consistent, higher quality of care delivered by people who are dedicated to that role.
In other findings from the survey, turnover in adult hospitalist groups is 10.9%t, which is up from 2018 but down from 2016. Unit-based assignment, also known as geographical rounding, was utilized by 42.7% of responding adult groups, with likelihood increasing with the size of the group. Unfilled positions were reported by 73.5% of groups, with an average of 11.2% of positions unfilled at the time of the survey.
The use of telemedicine in the hospital setting is evolving, likely considerably accelerated of necessity by the pandemic. “Many of us are using telemedicine with COVID patients in order to decrease clinicians’ time in the room, and to find a way to use a work force that has to be on leave,” Dr. McNeal said.
Nurse practitioners and physician assistants
The role for nurse practitioners and physician assistants in adult hospital medicine groups continues to increase, with 83.3% of groups reporting the presence of PAs and NPs, up from 77% in 2018. NPs/PAs are more likely in multistate hospitalist groups or integrated delivery system practices in hospitals/health systems.
The most common billing model for their professional services is a combination of independent billing by the PA/NP where allowed and shared services billing under a supervisory physician’s provider number – although 8.1% of groups report that their NPs/PAs didn’t generally provide billable services or submit bills for payment.
NPs and PAs spend one-fifth of their time, on average, on nonbillable, value-added work, including dedicated cross-coverage shifts, scheduling, patient assignments, nonbillable clinical work such as glycemic control, and quality improvement and performance improvement activities. “This is one example of the changing skill mix for the hospitalist group, helping the practice become more efficient,” Ms. Flores said.
NPs and PAs provide valuable services, Dr. McNeal added. “But it also takes some investment in time and training for them to be able to practice at the top of their license. My own hospitalist group has a training program for newly hired NPs/PAs. Everyone goes through this orientation for around 6-10 weeks, largely in a shadowing role starting out, until they gradually adjust to more clinical autonomy.”
This onboarding includes real-time evaluations and self-evaluations, and opportunities for conversations with experienced clinicians, working from a list of 30 “bread-and-butter” topics in hospital medicine, she noted.
Pediatric hospital medicine
The 2020 SoHM report includes a greater representation for pediatric hospital medicine, with a 200% increase in the proportion of reporting hospitalist groups that only take care of children. Thus, the pediatric data are more robust – and helpful – than in prior year surveys, said Sandra Gage, MD, SFHM, a pediatric hospitalist at Phoenix Children’s Hospital. Dr. Gage headed up the PAC’s expanded pediatric data initiative, with targeted outreach to pediatric groups to encourage their participation. She also convened a task force to come up with pediatric-specific questions that were more pertinent and user friendly.
One of the important questions for pediatric hospitalists involves scheduling – including variations in length of shifts – which can vary dramatically in pediatric HM groups. “This year we reported by number of hours expected for a clinical FTE, which should be more useful for group leaders,” Dr. Gage said. The median number of hours required per FTE from pediatric hospitalists was fairly consistent at 1,800 per year, with minor variations based on region and academic status.
“I don’t know that there’s anything too surprising in most of the data,” she said, but noted that SHM will now have a better pediatric baseline going forward. The survey also asked how many pediatric hospitalists were board certified in the new subspecialty of pediatric hospital medicine under the program launched last year by the American Board of Pediatrics. Its first qualifying exam was in November 2019. The average was 26%, but the variation between academic and nonacademic programs was unexpected, Dr. Gage said.
Pediatric hospitalists come from a variety of professional specialties besides pediatrics. Nearly half of all programs had at least one med/peds provider, while a smaller number of programs had providers from family medicine, internal medicine, emergency medicine, or palliative care, she noted. Half of pediatric hospitalists reported joining their practice directly out of residency. About 26% of pediatric hospital medicine (PHM) physicians were described as part time, and 34.3% of pediatric groups had the presence of an NP or PA.
“I think PHM evolved a little later than for adult hospitalists, but it has clearly come into its own as a field,” Dr. Gage said. In the COVID-19 crisis, some pediatric hospitalists have been asked to care for adult patients, which necessitated a flurry of activity to refresh their medical knowledge. Where pediatric units existed within the walls of adult hospitals and were temporarily closed for COVID, it’s not clear how many will reopen – perhaps ever.
Long-term impacts of the crisis
Some of the hospitalist group leaders Ms. Flores has spoken with in recent months point out that, while New York and some other early COVID-19 hot spots experienced a tremendous surge of patients and hospital crowding in March and April 2020, other hospitals didn’t see anywhere near the impact.
“For some, there was nothing going on with COVID where they were,” she said. Elective surgeries were widely canceled, but with no corresponding increase of COVID admissions; and with fewer patients showing up in EDs, some physicians found themselves idled.
What will be the longer-term impact of COVID-19? How will it change hospital medicine? “I definitely think things are going to change,” Ms. Flores said, speculating that licensing boards could find a way to make it easier for physicians to practice across state lines in response to crises like the pandemic. “Do we need to think at the national level about what we can do to create more surge capacity, to move people when and where they need to go in a crisis? Are there things SHM could do to help?”
Ms. Flores expects more hospital closures than followed the 2008-2009 economic recession, which likely will further drive the trend toward mergers and acquisitions – both of hospitalist groups and of hospitals.
“From the point of view of hospitals, financial pressures will only get worse, pressing us to reinvent how hospitalists work and how that could be made more efficient,” she said. “I hear hospitals saying: ‘We can’t sustain current trends.’ Meanwhile, specialists are saying they need more help from hospitalists, and frontline hospitalists are saying they’re already working too hard. What will we do about burnout?”
These competing trends were all headed toward a perfect storm even before the epidemic hit, Ms. Flores said. “The response will require some innovations we haven’t yet conceived of. Incremental change won’t get us where we need to be. But the hospitalist’s role will be more essential than ever.”
The 2020 data show that a lot of things have been fairly steady for hospitalists, said Thomas Frederickson, MD, a member of SHM’s PAC and a specialist in hospital medicine at CHI Health in Omaha, Neb. But one concern about this stability is that, while hospitalist compensation continues to go up, workload and by extension productivity remain relatively flat. “That has been a trend over the past decade, and some of us find it hard to make sense of that.”
Dr. Frederickson, too, sees a need for disruptive innovation. “I just wish I knew what that will be.” Perhaps, just as hospitalists played a large role in the quality revolution in hospitals over the past decade, maybe in the next decade they will come to play a large role in the right-sizing of hospital care in health systems, he said.
One other important finding: the number of hospitalists per group who play roles as physician leaders has also increased, with an average of 3.2 physicians per group in a formal leadership role (median of 2). But currently, 73% of the highest-ranking leaders in hospitalist groups are male, and they are disproportionally white. As reported in Medscape in 2019, 40% of working hospitalists are women and only 36% of hospitalists overall self-identified as White.1
“When you think of the demographics of actual working hospitalists, we could say the field of hospital medicine could and should do better in creating opportunities for diversity in leadership roles,” Ms. Flores said.
Reference
1. Martin KL. Hospitalist Compensation Report for 2019. Medscape. 2019 Jun 5. https://www.medscape.com/slideshow/2019-compensation-hospitalist-6011429#3.