User login
For MD-IQ use only
The must-read acute care medicine articles from 2021
When 2021 began, there appeared to be light at the end of the long and dark COVID-19 pandemic. A vaccine was introduced, the “curve” had been flattened, and by spring, businesses were slowly starting to open. Whereas the medical literature of 2020 seemed to be almost entirely focused on COVID-19, medical writers, researchers, and educators seemed to slowly start turning more attention back to non–COVID-related topics in 2021.
Unfortunately, as I write this, the Omicron variant of the coronavirus is in full swing, and much of our attention has once again turned back to COVID-19. However, we are able to look back on 2021 and acknowledge a wealth of fantastic original research articles and guidelines which have improved patient care in many ways.
Specifically, I have chosen articles that did not appear to gain widespread notoriety in emergency medicine but are, nevertheless, worthy of your time and attention. Note that this write-up serves as a summary only, and I encourage interested readers to peruse the full manuscripts for further details. I am limiting my recap to two articles.
Recommendations on difficult airway management
Emergency physicians are well trained in airway management, and a major part of that training includes the preintubation anatomic assessment of the airway. However, there are few recommendations on the physiological considerations for airway management.
A set of recommendations from the Society for Airway Management was written primarily with anesthesiologists in mind, but many of the recommendations listed below are very relevant to emergency physicians as well. The authors make recommendations for patients who are hypoxic or hypotensive prior to induction, for patients with right ventricular dysfunction, for patients with severe metabolic acidosis, and for neurologically injured patients. Some of the key pearls follow.
Patients with hypoxemia
- The importance of preoxygenation before intubation is once again emphasized, and this can be performed using high-flow oxygen for at least 3 minutes, or (in a cooperative patient) with eight vital capacity breaths.
- Maintenance of oxygenation during the apneic period should be continued. Apneic oxygenation can be provided with a nasal cannula at 15 liters per minute or with a high-flow nasal oxygen system at 40-70 LPM.
- For patients with significant shunt physiology or reduced functional residual capacity (for example, late pregnancy, obesity, or acute respiratory distress syndrome), preoxygenation should be performed with positive end expiratory pressure (PEEP) using noninvasive positive pressure ventilation or bag-valve mask ventilation with a PEEP valve. When higher levels of PEEP are required, an extraglottic device should be considered during preoxygenation.
- For patients with refractory hypoxemia, awake intubation to maintain spontaneous respirations should be considered.
- Patients should be preoxygenated in the upright position when possible.
- Ramped-up position (head elevated so as to bring the external auditory canal in the same horizontal line as the sternal notch) should be performed when possible in order to improve the grade of view, improve oxygenation, and reduce aspiration.
Patients with hypotension
- Patients should be screened for high risk for hemodynamic collapse prior to administration of induction medications and intubation by assessing the stroke index. A stroke index greater than 0.7 predicts a high risk. These patients should receive hemodynamic optimization (for example, intravenous fluids, administration of vasopressors) whenever possible, prior to administration of induction medications and intubation.
- Vasopressor infusions are preferable to bolus-dosed vasopressors. However, if vasopressor infusions are not possible, bolus-dosed vasopressors should be available and used to maintain systemic pressure during and after the intubation until an infusion can be started. When bolus-dosed vasopressors are used, diluted epinephrine should be considered as the vasopressor of choice in patients with depressed myocardial function.
Patients with right ventricular (RV) dysfunction
- Patients should be screened for significant RV dysfunction prior to intubation because of their high risk for hemodynamic decompensation with positive pressure ventilation.
- RV dysfunction may sometimes worsen with fluid administration. Fluid-intolerant patients may instead need RV afterload reduction with inhaled or intravenous pulmonary vasodilators.
- Patients with RV failure–induced shock should be considered for preintubation extracorporeal membrane oxygenation if available.
- Patients with RV volume overload should receive diuresis prior to intubation.
- Ventilator settings should aim to avoid hypercapnia, maintain low airway pressures, and use a higher PEEP to avoid atelectasis.
Patients with severe metabolic acidosis
- Patients with severe metabolic acidosis are at high risk for decompensation after intubation because of volume depletion and inadequate alveolar ventilation, resulting in profound acidosis.
- Patients with high minute ventilation prior to intubation should be considered for awake intubation to maintain spontaneous respirations. Otherwise, consider a spontaneous breathing mode after intubation with a high minute ventilation (that is, use a higher-than-normal respiratory rate on the ventilator in order to reproduce the preintubation minute ventilation). Apnea time should be minimized in order to minimize worsening acidosis.
- Preintubation bicarbonate boluses to prevent worsening acidosis are controversial and lack data showing any benefit.
Neurologically injured patients
- Eucapnia and normoxia should be maintained before, during, and after intubation to maintain stable cerebral blood flow.
- Hemodynamically neutral induction agents should be used.
- Patients should be positioned with the head of bed elevated to 30° upright when possible.
- Limit PEEP post intubation in order to promote venous drainage.
Evidence update for the treatment of anaphylaxis
The treatment of anaphylaxis is considered bread and butter in emergency and acute care medicine, but a great deal of what we have learned over the years is not well supported by the literature. In an article published in Resuscitation, the Anaphylaxis Working Group of the Resuscitation Council of the United Kingdom performed an evidence review regarding the emergency treatment of anaphylaxis.
A summary of key points includes:
- Anaphylaxis is defined as a systemic hypersensitivity reaction, usually rapid in onset, with potentially life-threatening compromise in airway, breathing, and/or circulation.
- The most important treatment is epinephrine (EPI), with an initial recommended dose in adults of 0.5 mg administered via the intramuscular (IM) route. Up to 10% of patients have a suboptimal response to one dose, but 98% will respond by the third dose; therefore, these authors recommend repeating the IM EPI every 5 minutes, if needed, up to three doses. There is no evidence to support any alternative or additional vasopressors, and so they should only be used if EPI is ineffective. Intravenous EPI is not recommended initially except in the perioperative setting where close monitoring can be performed. If intravenous EPI is used, the authors recommend an intravenous infusion rather than bolus dosing.
- Intravenous fluid bolus dosing is recommended in the majority of cases of anaphylaxis, regardless of presence or absence of hemodynamic compromise, because of the profound reduction in venous tone and third-spacing that typically occurs.
- Antihistamines are not recommended in early treatment. They are only effective for reversing skin manifestations of anaphylaxis (which EPI treats as well), and the sedation they produce can confound the proper ongoing evaluation of the patient. Furthermore, the use of antihistamines early in the treatment of anaphylaxis has been found to produce delays in proper use of EPI.
- Steroids are not recommended in early treatment. They help only with the late phase of inflammatory response, but despite that, there is no good evidence that they decrease the biphasic response of anaphylaxis. There is some emerging evidence that the use of steroids may actually be associated with increased morbidity even after correcting for anaphylaxis severity. The authors recommended the use of steroids in anaphylaxis only for patients with poorly controlled asthma and possibly for patients with refractory anaphylaxis. Inhaled beta-agonists are recommended in anaphylaxis only for patients with lower respiratory tract symptoms caused by anaphylaxis, but warned that the inhaled beta-agonists should not delay proper use of EPI.
- The optimal observation period before discharge for stable patients is unknown. The authors noted the recommendations of the Joint Task Force on Practice Parameters of the American Academy of Allergy, Asthma, & Immunology and the American College of Allergy, Asthma, and Immunology: Biphasic reactions were more common in patients with severe initial symptoms – for example, those requiring more than one dose of EPI; therefore, these patients are recommended to have “extended observation.” Lower-risk patients with resolved symptoms of anaphylaxis can be observed for 1 hour, which would capture 95% of biphasic reactions in this group of patients.
Summary and other honorable mentions
There you have it. My two favorite practice-changing (non–COVID-19) articles of 2021. Not surprisingly, both articles deal largely with airway and hemodynamic concerns – the ABC’s of emergency medicine. Although these bulleted pearls provide key points from these two articles, the full discussions of those key points in the articles would provide a great deal more education than I can provide in this brief write-up, and so I strongly encourage everyone to read the full articles.
I also encourage readers to peruse the following “honorable mention” articles: Stiell and colleagues published a “Best Practices Checklist” on behalf of the Canadian Association of Emergency Physicians pertaining to the management of acute atrial fibrillation and atrial flutter; and on behalf of the American Heart Association (in collaboration with several other major organizations), Gulati and colleagues published the 2021 Guideline for the Evaluation and Diagnosis of Chest Pain. Both publications show us how we should strive to manage atrial fibrillation and chest pain, respectively, in the emergency department for years to come.
Amal Mattu, MD, is a professor, vice chair of education, and codirector of the emergency cardiology fellowship in the department of emergency medicine at the University of Maryland, Baltimore.
A version of this article first appeared on Medscape.com.
New AAD guidelines eye comorbidities in adults with atopic dermatitis
While it’s well established that atopic dermatitis (AD) in adults is associated with asthma, allergic rhinitis, and other atopic conditions, the links between AD and other comorbidities are coming into clearer focus.
, published evidence supports an association between AD and comorbidities that may not be on the radar of clinicians and patients, including substance use, attention-deficit/hyperactivity disorder (ADHD), elements of metabolic syndrome, and various cardiovascular conditions.

“There are more comorbidities with AD than we anticipated, that are supported by data in the literature,” Dawn M.R. Davis, MD, cochair and an author of the guidelines, told this news organization. “We are learning more about the interconnectivity of various medical conditions,” she continued. “Many skin diseases over time have been noted to be impactful to the whole person and not only the skin. A classic example of that is psoriasis. We now understand that psoriasis is a multisystem inflammatory disorder.”
As for AD, “we’ve always appreciated that AD patients tend to be at higher risk for other atopic diseases such as asthma, allergic rhinoconjunctivitis, and food allergies,” said Dr. Davis, of the departments of dermatology and pediatrics at the Mayo Clinic, Rochester, Minn. “With further research, we are now able to delineate those associations more intimately and have data to support our suspicions. Additionally, we’re now understanding that these inflammatory conditions can impact more than the end organ involved, such as the skin and AD. We wanted to look at how AD can affect the whole patient.”
For the guidelines, which are the first of their kind and were published online in the Journal of the American Academy of Dermatology, Dr. Davis and project cochair Robert Sidbury, MD, MPH, chief of dermatology at Seattle Children’s Hospital, led a multidisciplinary group of 12 experts to review the association between AD and selected comorbidities. They applied the Grading of Recommendations, Assessment, Development, and Evaluation (GRADE) for prognosis approach for assessing the certainty of the evidence and provided statements of association based on the available evidence.
With respect to highlights for atopic and allergic conditions, the guideline authors found high-quality evidence that AD in adults is associated with food allergies, moderate-quality evidence that AD is associated with asthma, and low-quality evidence that AD in adults may be associated with eosinophilic esophagitis.
In the realm of mental health and substance use, ample evidence exists to support an association between AD and mental health conditions such as depression and anxiety, the guidelines state. “For many patients, low mood may be driven by the symptoms of AD, including chronic itch and poor sleep,” Dr. Davis and her coauthors wrote. “Successfully treating AD may alleviate depressive symptoms for some patients; for others, assessment and treatment specific to their mental health may be needed.”
The guidelines also state that low-quality evidence exists to suggest that AD in adults may be associated with alcohol abuse disorders and cigarette smoking.
The authors noted “limited but consistent evidence” supporting a link between AD and adverse bone health, including osteoporosis and fractures, while associations between AD and cardiovascular risk factors and comorbidities, including hypertension, myocardial infarction, and stroke, are more controversial.
“I have published on bone health and AD so that was not as surprising to me,” Dr. Davis said in the interview. “I found a lot of the evidence in the guidelines to be validating of patterns that we see in our patients. The most significant learning point for me was [the link to] cardiovascular disease and the link to specific mental health and substance use disorders. It validates how impactful AD is to the individual.”
According to the guidelines, moderate-quality evidence exists linking AD in adults to both alopecia areata and urticaria. “Because we are dermatologists and take care of both of those diseases, be mindful of that in your daily practice,” Dr. Davis advised. “I would also encourage our colleagues to remember to educate patients on the comorbidities of AD so that they are empowered, and to screen for those comorbidities in your office based on the patient and their history and physical exam, to the level that you think is appropriate for that person’s individual’s care.”
Christine Ko, MD, who was asked to comment on the guidelines, characterized some of the reported comorbidity associations as predictable, such as asthma, food allergy, allergic rhinitis, and skin infections. “As the authors comment, ‘associations between AD and other atopic and allergic conditions have been recognized for decades and even contribute to diagnostic criteria for AD,’ ” said Dr. Ko, professor of dermatology and pathology at Yale University, New Haven, Conn, who was not involved with the guidelines. “I was a bit surprised to see that atopic dermatitis in adults is associated with osteoporosis and fractures. As the authors suggest, this could be secondary to treatment with oral prednisone, and it is possible that use of dupilumab and JAK inhibitors may lessen this association.”
Shawn G. Kwatra, MD, of the department of dermatology at Johns Hopkins University, Baltimore, who was not involved with the guidelines, and was also asked to comment, said that the guidelines underscore the importance of informing adults with AD “of the risks of unchecked inflammation and the potential for multiple disease comorbidities.” Dr. Kwatra, who has AD, added that “these results make me want to be more proactive in treating my eczema to reduce the potential for development of these comorbidities.”
He pointed out that the guidelines did not address racial and ethnic differences in the observed comorbidities. “Unfortunately, minority populations have a greater comorbidity burden in many inflammatory skin diseases so this will be another area needing further investigation,” he said. “As an example, our group found from multicenter data that black patients with atopic dermatitis have higher levels of C-reactive protein, blood eosinophils, and other inflammatory biomarkers.”
The AAD guidelines are the first in a four-part series on AD expected to be published over the next 1-2 years, Dr. Davis said. The subsequent guidelines will address topicals, phototherapy/systemics, and pediatrics.
The study was funded by internal funds from the AAD. Dr. Davis reported having no financial disclosures. Dr. Sidbury disclosed that he serves as an advisory board member for Pfizer, a principal investigator for Regeneron, and an investigator for Brickell Biotech and Galderma. He is also a consultant for Galderma Global and Microes. Dr. Ko reported having no financial disclosures. Dr. Kwatra is a member of the board of directors of the Skin of Color Society. He is also an advisory board member/consultant for AbbVie, Galderma, Incyte, Pfizer, Regeneron Pharmaceuticals, and Sanofi, and has served as an investigator for Galderma, Pfizer, and Sanofi.
While it’s well established that atopic dermatitis (AD) in adults is associated with asthma, allergic rhinitis, and other atopic conditions, the links between AD and other comorbidities are coming into clearer focus.
, published evidence supports an association between AD and comorbidities that may not be on the radar of clinicians and patients, including substance use, attention-deficit/hyperactivity disorder (ADHD), elements of metabolic syndrome, and various cardiovascular conditions.
“There are more comorbidities with AD than we anticipated, that are supported by data in the literature,” Dawn M.R. Davis, MD, cochair and an author of the guidelines, told this news organization. “We are learning more about the interconnectivity of various medical conditions,” she continued. “Many skin diseases over time have been noted to be impactful to the whole person and not only the skin. A classic example of that is psoriasis. We now understand that psoriasis is a multisystem inflammatory disorder.”
As for AD, “we’ve always appreciated that AD patients tend to be at higher risk for other atopic diseases such as asthma, allergic rhinoconjunctivitis, and food allergies,” said Dr. Davis, of the departments of dermatology and pediatrics at the Mayo Clinic, Rochester, Minn. “With further research, we are now able to delineate those associations more intimately and have data to support our suspicions. Additionally, we’re now understanding that these inflammatory conditions can impact more than the end organ involved, such as the skin and AD. We wanted to look at how AD can affect the whole patient.”
For the guidelines, which are the first of their kind and were published online in the Journal of the American Academy of Dermatology, Dr. Davis and project cochair Robert Sidbury, MD, MPH, chief of dermatology at Seattle Children’s Hospital, led a multidisciplinary group of 12 experts to review the association between AD and selected comorbidities. They applied the Grading of Recommendations, Assessment, Development, and Evaluation (GRADE) for prognosis approach for assessing the certainty of the evidence and provided statements of association based on the available evidence.
With respect to highlights for atopic and allergic conditions, the guideline authors found high-quality evidence that AD in adults is associated with food allergies, moderate-quality evidence that AD is associated with asthma, and low-quality evidence that AD in adults may be associated with eosinophilic esophagitis.
In the realm of mental health and substance use, ample evidence exists to support an association between AD and mental health conditions such as depression and anxiety, the guidelines state. “For many patients, low mood may be driven by the symptoms of AD, including chronic itch and poor sleep,” Dr. Davis and her coauthors wrote. “Successfully treating AD may alleviate depressive symptoms for some patients; for others, assessment and treatment specific to their mental health may be needed.”
The guidelines also state that low-quality evidence exists to suggest that AD in adults may be associated with alcohol abuse disorders and cigarette smoking.
The authors noted “limited but consistent evidence” supporting a link between AD and adverse bone health, including osteoporosis and fractures, while associations between AD and cardiovascular risk factors and comorbidities, including hypertension, myocardial infarction, and stroke, are more controversial.
“I have published on bone health and AD so that was not as surprising to me,” Dr. Davis said in the interview. “I found a lot of the evidence in the guidelines to be validating of patterns that we see in our patients. The most significant learning point for me was [the link to] cardiovascular disease and the link to specific mental health and substance use disorders. It validates how impactful AD is to the individual.”
According to the guidelines, moderate-quality evidence exists linking AD in adults to both alopecia areata and urticaria. “Because we are dermatologists and take care of both of those diseases, be mindful of that in your daily practice,” Dr. Davis advised. “I would also encourage our colleagues to remember to educate patients on the comorbidities of AD so that they are empowered, and to screen for those comorbidities in your office based on the patient and their history and physical exam, to the level that you think is appropriate for that person’s individual’s care.”
Christine Ko, MD, who was asked to comment on the guidelines, characterized some of the reported comorbidity associations as predictable, such as asthma, food allergy, allergic rhinitis, and skin infections. “As the authors comment, ‘associations between AD and other atopic and allergic conditions have been recognized for decades and even contribute to diagnostic criteria for AD,’ ” said Dr. Ko, professor of dermatology and pathology at Yale University, New Haven, Conn, who was not involved with the guidelines. “I was a bit surprised to see that atopic dermatitis in adults is associated with osteoporosis and fractures. As the authors suggest, this could be secondary to treatment with oral prednisone, and it is possible that use of dupilumab and JAK inhibitors may lessen this association.”
Shawn G. Kwatra, MD, of the department of dermatology at Johns Hopkins University, Baltimore, who was not involved with the guidelines, and was also asked to comment, said that the guidelines underscore the importance of informing adults with AD “of the risks of unchecked inflammation and the potential for multiple disease comorbidities.” Dr. Kwatra, who has AD, added that “these results make me want to be more proactive in treating my eczema to reduce the potential for development of these comorbidities.”
He pointed out that the guidelines did not address racial and ethnic differences in the observed comorbidities. “Unfortunately, minority populations have a greater comorbidity burden in many inflammatory skin diseases so this will be another area needing further investigation,” he said. “As an example, our group found from multicenter data that black patients with atopic dermatitis have higher levels of C-reactive protein, blood eosinophils, and other inflammatory biomarkers.”
The AAD guidelines are the first in a four-part series on AD expected to be published over the next 1-2 years, Dr. Davis said. The subsequent guidelines will address topicals, phototherapy/systemics, and pediatrics.
The study was funded by internal funds from the AAD. Dr. Davis reported having no financial disclosures. Dr. Sidbury disclosed that he serves as an advisory board member for Pfizer, a principal investigator for Regeneron, and an investigator for Brickell Biotech and Galderma. He is also a consultant for Galderma Global and Microes. Dr. Ko reported having no financial disclosures. Dr. Kwatra is a member of the board of directors of the Skin of Color Society. He is also an advisory board member/consultant for AbbVie, Galderma, Incyte, Pfizer, Regeneron Pharmaceuticals, and Sanofi, and has served as an investigator for Galderma, Pfizer, and Sanofi.
FROM JOURNAL OF THE AMERICAN ACADEMY OF DERMATOLOGY
Infectious disease pop quiz: Clinical challenge #12 for the ObGyn
What are the best office-based tests for the diagnosis of bacterial vaginosis?
Continue to the answer...
In patients with bacterial vaginosis, the vaginal pH typically is elevated in the range of 4.5. When a drop of potassium hydroxide solution is added to the vaginal secretions, a characteristic fishlike (amine) odor is liberated (positive “whiff test”). With saline microscopy, the key findings are a relative absence of lactobacilli in the background, an abundance of small cocci and bacilli, and the presence of clue cells, which are epithelial cells studded with bacteria along their outer margin.
- Duff P. Maternal and perinatal infections: bacterial. In: Landon MB, Galan HL, Jauniaux ERM, et al. Gabbe’s Obstetrics: Normal and Problem Pregnancies. 8th ed. Elsevier; 2021:1124-1146.
- Duff P. Maternal and fetal infections. In: Resnik R, Lockwood CJ, Moore TJ, et al. Creasy & Resnik’s Maternal-Fetal Medicine: Principles and Practice. 8th ed. Elsevier; 2019:862-919.

Dr. Edwards is a Resident in the Department of Medicine, University of Florida College of Medicine, Gainesville.

Dr. Duff is Professor of Maternal-Fetal Medicine, Department of Obstetrics and Gynecology, University of Florida College of Medicine, Gainesville.
The authors report no financial relationships relevant to this article.
Dr. Edwards is a Resident in the Department of Medicine, University of Florida College of Medicine, Gainesville.
Dr. Duff is Professor of Maternal-Fetal Medicine, Department of Obstetrics and Gynecology, University of Florida College of Medicine, Gainesville.
The authors report no financial relationships relevant to this article.
What are the best office-based tests for the diagnosis of bacterial vaginosis?
Continue to the answer...
In patients with bacterial vaginosis, the vaginal pH typically is elevated in the range of 4.5. When a drop of potassium hydroxide solution is added to the vaginal secretions, a characteristic fishlike (amine) odor is liberated (positive “whiff test”). With saline microscopy, the key findings are a relative absence of lactobacilli in the background, an abundance of small cocci and bacilli, and the presence of clue cells, which are epithelial cells studded with bacteria along their outer margin.
- Duff P. Maternal and perinatal infections: bacterial. In: Landon MB, Galan HL, Jauniaux ERM, et al. Gabbe’s Obstetrics: Normal and Problem Pregnancies. 8th ed. Elsevier; 2021:1124-1146.
- Duff P. Maternal and fetal infections. In: Resnik R, Lockwood CJ, Moore TJ, et al. Creasy & Resnik’s Maternal-Fetal Medicine: Principles and Practice. 8th ed. Elsevier; 2019:862-919.
Should we always offer CPR?
Some details have been changed to protect the patient’s identity.
The first thing I noticed about Mr. Barry as I entered the intensive care unit was his left foot: Half of it was black, shriveled, and gangrenous, jutting out from under the white blanket. The soft rays of the morning sun illuminated his gaunt, unshaven, hollow cheeks. Sedated on propofol, with a green endotracheal tube sticking out of his chapped lips, he looked frail. His nurse, Becky, had just cleaned him after he passed tarry, maroon-colored stool. As she turned him over, I saw that the skin over his tailbone was broken. He had a large decubitus ulcer, the edges of which were now dried and black. The Foley bag, hanging next to his bed, was empty; there had been no urine for several hours now.
No one knew much about Mr. Barry. I don’t mean his current medical status – I mean what he did in life, who he loved, whether he had kids, what he valued. All we knew was that he was 83 years old and lived alone. No prior records in our system. No advanced directives. No information on any family. One of his neighbors called 911 after he was not seen for at least 10 days. Emergency medical services found Mr. Barry in bed, nearly lifeless. In the emergency room, he was noted to be in shock, with a dangerously low blood pressure. He was dry as a bone with markedly elevated sodium levels. His laboratory makers for kidney and liver function were deranged. He was admitted to the medical ICU with a diagnosis of hypovolemic shock and/or septic shock with multiorgan dysfunction. With 48 hours of supportive management with intravenous fluids and antibiotics, he did not improve. Blood cultures were positive for gram-positive cocci. The doses for medications used to maintain the blood pressure increased steadily. He also developed gastrointestinal bleeding.
Futile vs. potentially inappropriate
I was called for a cardiology consult because he had transient ST elevation in inferolateral leads on the monitor. Given his clinical scenario, the likelihood of type 1 myocardial infarction from plaque rupture was low; the ST elevations were probably related to vasospasm from increasing pressor requirement. Diagnostic cardiac catheterization showed clean coronary arteries. Continuous renal replacement therapy was soon started. Given Mr Barry’s multiorgan dysfunction and extremely poor prognosis, I recommended making all efforts to find his family or surrogate decision-maker to discuss goals of care or having a two-physician sign-off to place a DNR order.
Despite all efforts, we could not trace the family. We physicians vary individually on how we define value as related to life. We also vary on the degree of uncertainty about prognostication that we are comfortable with. This is one of the reasons the term “futility” is controversial and there is a push to use “potentially inappropriate” instead. The primary team had a different threshold for placing a DNR order and did not do it. That night, after I left the hospital, Mr Barry had a PEA (pulseless electrical activity) arrest and was resuscitated after 10 minutes of CPR. The next day, I noticed his bruised chest. He was on multiple medications to support his blood pressure.
My patient and a Hemingway protagonist
Whether by coincidence or irony, I started reading Ernest Hemingway’s short story “The Snows of Kilimanjaro” the same day that I met Mr. Barry. He reminded me of the story’s protagonist, Harry, lying on the cot with a gangrenous leg, waiting to die. Harry could sense death approaching. He reminisced about his past. All he wanted was to drink his “whiskey-soda.” “Darling, don’t drink that. We have to do everything we can,” his wife said. “You do it. I am tired,” Harry said, and continued to drink his whiskey-soda.
Mr. Barry looked tired. Tired of life? I can’t say with certainty. However, if I had to guess, the medical team’s heroics meant nothing to him. Unfortunately, he was not awake like Harry and could not do what he wished. I wondered what snippets of his life flashed before him as he lay on his bed at home for days. Did he want to have a whiskey-soda before dying? But we are not letting him die. Not easily anyway. We have to do everything we can: medications, coronary angiogram, dialysis, multiple rounds of CPR. Why?
In this country, we need permission to forgo CPR. If there are no advanced directives or next of kin available to discuss end-of-life care, performing CPR is the default status for all hospitalized patients, irrespective of the underlying severity of the illness. A unilateral DNR order written by a physician in good conscience (in a medically futile situation), but to which the patient has not consented, is generally invalid in most U.S. states. If health directives are not available, CPR will be administered on the presumption that the patient would want us to “do everything we can.” The medicolegal consequences and fear of not administering CPR is more profound than being found wrong and defying a patient’s wishes against CPR.
In patients with outside-hospital cardiac arrest, especially if related to ventricular fibrillation, early bystander CPR improves the survival rate. Hence, it makes sense for first responders and paramedics to administer CPR as the default option, focusing on the technique, rather than thinking about its utility based on the patient’s underlying comorbidities.
In the inpatient setting, however, physicians have enough information to comprehensively evaluate the patient. In a cohort of 5,690 critically ill ICU patients, obtained from a U.S. registry, the rate of survival to discharge after inpatient cardiac arrest is very low at 12.5%. Chronic health conditions, malignancy, end-stage renal disease, multiorgan dysfunction, need for vasopressor support, prior CPR, initial rhythm of asystole, or PEA advanced age were all associated with a less than 10% survival rate after CPR.
Dying is a process. Administering CPR to a dying patient is of little to no value. For Mr. Barry, it resulted in a bruised chest and broken ribs. James R. Jude, MD, one of the pioneers of closed chest compression, or modern-day CPR, wrote in 1965 that “resuscitation of the dying patient with irreparable damage to lungs, heart, kidneys, brain or any other vital system of the body has no medical, ethical, or moral justification. The techniques described in this monograph were designed to resuscitate the victim of acute insult, whether be it from drowning, electrical shock, untoward effect of drugs, anesthetic accident, heart block, acute myocardial infarction, or surgery.”
Yet, doctors continue to provide futile treatments at end of life for a variety of reasons: concerns about medico-legal risks, discomfort or inexperience with death and dying, uncertainty in prognostication, family requests, and organizational barriers such as lack of palliative services that can help lead end-of-life care discussions. Despite knowing that CPR has little benefit in critically ill patients with terminal illness and multiorgan dysfunction, we often ask the patient and their surrogate decision-makers: “If your heart stops, do you want us to restore your heart by pressing on the chest and giving electric shocks?” The very act of asking the question implies that CPR may be beneficial. We often do not go over the risks or offer an opinion on whether CPR should be performed. We take a neutral stance.
Anoxic brain injury, pain from broken ribs, and low likelihood of survival to discharge with acceptable neurologic recovery are rarely discussed in detail. Laypeople may overestimate the chances of survival after CPR and they may not comprehend that it does not reverse the dying process in patients with a terminal illness. When you ask about CPR, most families hear: “Do you want your loved one to live?” and the answer is nearly always “Yes.” We then administer CPR, thinking that we are respecting the patient’s autonomy in the medical decision-making process. However, in end-of-life care, elderly patients or surrogates may not fully understand the complexities involved or the outcomes of CPR. So, are we truly respecting their autonomy?
When to offer CPR?
In 2011, Billings and Krakauer, palliative care specialists from Massachusetts General Hospital, Boston, suggested that we focus on understanding our patient’s values and goals of care, and then decide whether to offer CPR, rather than taking a neutral stance. With this approach, we continue to respect the patient’s autonomy and also affirm our responsibility in providing care consistent with medical reality. We need to have the humility to accept that death is inevitable.
It has been 10 years since a group of physicians from Columbia University Medical Center, Harvard Medical School, MGH, and Boston Children’s Hospital proposed changes to how we determine resuscitation status. Instead of assuming that CPR is always wanted, they suggested three distinct approaches: consider CPR when the benefits versus risks are uncertain, and the patient is not end stage; recommend against CPR when there is a low likelihood of benefit and high likelihood of harm (e.g., patients with anoxic brain injury, advanced incurable cancer, or end-stage multiorgan dysfunction); and do not offer CPR to patients who will die imminently and have no chance of surviving CPR (e.g., patients with multiorgan dysfunction, increasing pressor requirements, and those who are actively dying without a single immediately reversible cause). I agree with their proposal.
Mr. Barry was actively dying. Unfortunately, we had neither his advanced directives nor access to family members or surrogates to discuss values and goals of care. Given the futility of administering CPR again, and based on our humanitarian principles, a moral and ethical responsibility to ensure a peaceful dying process, I and another ICU attending placed the DNR order. He passed away, peacefully, within a few hours.
That evening, as I was sitting on my porch reading the last page of “The Snows of Kilimanjaro,” my phone pinged. It was an email asking me to complete the final attestation for the death certificate. I imagined that Mr. Barry knew where he was going. He probably had his own special place – something beautiful and majestic, great and tall, dazzlingly white in the hot sun, like the snow-capped mountain of Kilimanjaro that Harry saw at the time of his death.
Dr. Mallidi is a general cardiologist at Zuckerberg San Francisco General Hospital, UCSF. He disclosed no relevant financial relationships.
A version of this article first appeared on Medscape.com.
More frequent secukinumab dosing found to benefit overweight psoriasis patients
, results from a multicenter, double-blind, parallel-group trial showed.
The more frequent dosing was also associated with comparable safety, consistent with the established secukinumab safety profile.
“Weight may have an impact on pharmacokinetics and, therefore, on the clinical outcome of biologic treatment for psoriasis,” Matthias Augustin, MD, and colleagues wrote in the study, published recently in the British Journal of Dermatology. “Dose optimization may be highly beneficial for patients with higher body weight,” they noted, adding that their study supports previous study findings and pharmacokinetic/pharmacodynamic modelling data, showing that secukinumab dosed every 2 weeks “leads to a clinically and statistically significant advantage in PASI 90 response,” compared with standard dosing every 4 weeks in patients who weight 90 kg (about 198 pounds) or more, after 16 weeks of treatment, which was maintained until week 52.

For the study, Dr. Augustin, of the Institute for Health Services Research in Dermatology and Nursing at University Medical Center Hamburg-Eppendorf (Germany), and colleagues randomized 331 patients with moderate to severe chronic plaque psoriasis who weighed 90 kg or more to receive secukinumab 300 mg every 2 weeks, or secukinumab 300 mg every 4 weeks. The mean age of the patients was 47 years, 75% were male, 92% were White, and their mean body weight was 111.1 kg, with a mean body mass index of 36.1 kg/m2.
Patients who did not achieve a Psoriasis Area and Severity Index (PASI) 90 at week 16 on the monthly regimen (Q4W) either remained on that regimen or were up-titrated to dosing every 2 weeks (Q2W). Of the 331 patients, 165 received Q2W dosing and 166 received Q4W dosing. The researchers found that, at 16 weeks, patients in the Q2W dosing group had significantly higher PASI 90 responses, compared with those in the Q4W group (73.2% vs. 55.5%, respectively; P = .0003; odds ratio estimate, 2.3).
At 52 weeks, a greater proportion of patients in the Q2W group maintained responses to several outcome measures, compared with those in the Q4W group, including PASI 75 (88.9% vs. 74.8%), PASI 90 (76.4% vs. 52.4%), and PASI 100 (46.7% vs. 27.3%) scores; Investigator’s Global Assessment score of 0 or 1 (75.9% vs. 55.6%); and Dermatology Life Quality Index scores of 0 or 1 (66.1% vs. 48.8%).
In addition, those who had not had a PASI 90 response at week 16 who were up-titrated to Q2W dosing demonstrated higher efficacy responses at week 32, compared with those who remained on the Q4W regimen, with PASI 90 scores of 37.7% versus 16.5%, respectively.
Both regimens were well-tolerated, consistent with the known secukinumab safety profile; safety was comparable in the treatment arms, and there was “no clear dose-response relationship seen” for the incidence of overall adverse events, serious AEs, and AEs leading to discontinuation of the study treatment, “or AEs related to the identified risks” of infections, hypersensitivity, neutropenia and potential risk of major adverse cardiovascular events, the authors wrote.
“Despite more frequent dosing, the incidence of Candida infections was numerically lower in the Q2W group versus the Q4W group,” although there were not many cases, three patients versus six patients, respectively.
Need for individualized treatment
“Despite a decades-long revolution in development of highly efficacious biologic treatments for psoriasis, we are only in the early stages of developing personalized clinical approaches,” said Raj Chovatiya, MD, PhD, a dermatologist at Northwestern University, Chicago, who was asked to comment on the study. “The need for individualized treatment in psoriasis is very real; not every patient may respond to therapy in the same way. Obesity is one important comorbidity of psoriasis, and increased body mass index may be associated with variable treatment outcomes with systemic therapy.”

The data from this study, he added, “suggest that dose optimization may be an important strategy to enhance psoriasis clearance in patients with suboptimal treatment outcomes on standard dosing, including those with increased weight. Future studies should examine optimal regimen of biologic therapy across a variety of patient factors.”
The study was funded by Novartis, the manufacturer of secukinumab (Cosentyx); several authors were company employees. Dr. Augustin disclosed that he has served as a consultant for or has been a paid speaker for clinical trials sponsored by companies that manufacture drugs used for the treatment of psoriasis, including AbbVie, Almirall, Amgen, Biogen, Boehringer Ingelheim, Celgene, Centocor, Eli Lilly, GlaxoSmithKline, Janssen-Cilag, LEO Pharma, Medac, Merck, MSD, Novartis, Pfizer, UCB, and Xenoport. Dr. Chovatiya disclosed that he is a consultant to, a speaker for, and/or a member of the advisory board for AbbVie, Arcutis, Arena, Incyte, Pfizer, Regeneron, and Sanofi Genzyme.
, results from a multicenter, double-blind, parallel-group trial showed.
The more frequent dosing was also associated with comparable safety, consistent with the established secukinumab safety profile.
“Weight may have an impact on pharmacokinetics and, therefore, on the clinical outcome of biologic treatment for psoriasis,” Matthias Augustin, MD, and colleagues wrote in the study, published recently in the British Journal of Dermatology. “Dose optimization may be highly beneficial for patients with higher body weight,” they noted, adding that their study supports previous study findings and pharmacokinetic/pharmacodynamic modelling data, showing that secukinumab dosed every 2 weeks “leads to a clinically and statistically significant advantage in PASI 90 response,” compared with standard dosing every 4 weeks in patients who weight 90 kg (about 198 pounds) or more, after 16 weeks of treatment, which was maintained until week 52.
For the study, Dr. Augustin, of the Institute for Health Services Research in Dermatology and Nursing at University Medical Center Hamburg-Eppendorf (Germany), and colleagues randomized 331 patients with moderate to severe chronic plaque psoriasis who weighed 90 kg or more to receive secukinumab 300 mg every 2 weeks, or secukinumab 300 mg every 4 weeks. The mean age of the patients was 47 years, 75% were male, 92% were White, and their mean body weight was 111.1 kg, with a mean body mass index of 36.1 kg/m2.
Patients who did not achieve a Psoriasis Area and Severity Index (PASI) 90 at week 16 on the monthly regimen (Q4W) either remained on that regimen or were up-titrated to dosing every 2 weeks (Q2W). Of the 331 patients, 165 received Q2W dosing and 166 received Q4W dosing. The researchers found that, at 16 weeks, patients in the Q2W dosing group had significantly higher PASI 90 responses, compared with those in the Q4W group (73.2% vs. 55.5%, respectively; P = .0003; odds ratio estimate, 2.3).
At 52 weeks, a greater proportion of patients in the Q2W group maintained responses to several outcome measures, compared with those in the Q4W group, including PASI 75 (88.9% vs. 74.8%), PASI 90 (76.4% vs. 52.4%), and PASI 100 (46.7% vs. 27.3%) scores; Investigator’s Global Assessment score of 0 or 1 (75.9% vs. 55.6%); and Dermatology Life Quality Index scores of 0 or 1 (66.1% vs. 48.8%).
In addition, those who had not had a PASI 90 response at week 16 who were up-titrated to Q2W dosing demonstrated higher efficacy responses at week 32, compared with those who remained on the Q4W regimen, with PASI 90 scores of 37.7% versus 16.5%, respectively.
Both regimens were well-tolerated, consistent with the known secukinumab safety profile; safety was comparable in the treatment arms, and there was “no clear dose-response relationship seen” for the incidence of overall adverse events, serious AEs, and AEs leading to discontinuation of the study treatment, “or AEs related to the identified risks” of infections, hypersensitivity, neutropenia and potential risk of major adverse cardiovascular events, the authors wrote.
“Despite more frequent dosing, the incidence of Candida infections was numerically lower in the Q2W group versus the Q4W group,” although there were not many cases, three patients versus six patients, respectively.
Need for individualized treatment
“Despite a decades-long revolution in development of highly efficacious biologic treatments for psoriasis, we are only in the early stages of developing personalized clinical approaches,” said Raj Chovatiya, MD, PhD, a dermatologist at Northwestern University, Chicago, who was asked to comment on the study. “The need for individualized treatment in psoriasis is very real; not every patient may respond to therapy in the same way. Obesity is one important comorbidity of psoriasis, and increased body mass index may be associated with variable treatment outcomes with systemic therapy.”
The data from this study, he added, “suggest that dose optimization may be an important strategy to enhance psoriasis clearance in patients with suboptimal treatment outcomes on standard dosing, including those with increased weight. Future studies should examine optimal regimen of biologic therapy across a variety of patient factors.”
The study was funded by Novartis, the manufacturer of secukinumab (Cosentyx); several authors were company employees. Dr. Augustin disclosed that he has served as a consultant for or has been a paid speaker for clinical trials sponsored by companies that manufacture drugs used for the treatment of psoriasis, including AbbVie, Almirall, Amgen, Biogen, Boehringer Ingelheim, Celgene, Centocor, Eli Lilly, GlaxoSmithKline, Janssen-Cilag, LEO Pharma, Medac, Merck, MSD, Novartis, Pfizer, UCB, and Xenoport. Dr. Chovatiya disclosed that he is a consultant to, a speaker for, and/or a member of the advisory board for AbbVie, Arcutis, Arena, Incyte, Pfizer, Regeneron, and Sanofi Genzyme.
FROM THE BRITISH JOURNAL OF DERMATOLOGY
Identifying and preventing IPV: Are clinicians doing enough?
Violence against women remains a global dilemma in need of attention. Physical violence in particular, is the most prevalent type of violence across all genders, races, and nationalities.
The Centers for Disease Control and Prevention says more than 43 million women and 38 million men report experiencing psychological aggression by an intimate partner in their lifetime. Meanwhile, 11 million women and 5 million men report enduring sexual or physical violence and intimate partner violence (IPV), and/or stalking by an intimate partner during their lifetimes, according to the CDC.1

Women who have endured this kind of violence might present differently from men. Some studies, for example, show a more significant association between mutual violence, depression, and substance use among women than men.2 Studies on the phenomenon of IPV victims/survivors becoming perpetrators of abuse are limited, but that this happens in some cases.
Having a psychiatric disorder is associated with a higher likelihood of being physically violent with a partner.3,4 One recent study of 250 female psychiatric patients who were married and had no history of drug abuse found that almost 68% reported psychological abuse, 52% reported sexual abuse, 38% social abuse, 37% reported economic abuse, and 25% reported physical abuse.5
Given those statistics and trends, it is incumbent upon clinicians – including those in primary care, psychiatry, and emergency medicine – to learn to quickly identify IPV survivors, and to use available prognostic tools to monitor perpetrators and survivors.
COVID pandemic’s influence
Isolation tied to the COVID-19 pandemic has been linked to increased IPV. A study conducted by researchers at the University of California, Davis, suggested that extra stress experienced during the COVID-19 pandemic caused by income loss, and the inability to pay for housing and food exacerbated the prevalence of IPV early during the pandemic.6

That study, where researchers collected in surveys of nearly 400 adults in the beginning in April 2020 for 10 weeks, showed that more services and communication are needed so that frontline health care and food bank workers, for example, in addition to social workers, doctors, and therapists, can spot the signs and ask clients questions about potential IPV. They could then link survivors to pertinent assistance and resources.
Furthermore, multiple factors probably have played a pivotal role in increasing the prevalence of IPV during the COVID-19 pandemic. For instance, disruption to usual health and social services as well as diminished access to support systems, such as shelters, and charity helplines negatively affected the reporting of domestic violence.
Long before the pandemic, over the past decade, international and national bodies have played a crucial role in terms of improving the awareness and response to domestic violence.7,8 In addition, several policies have been introduced in countries around the globe emphasizing the need to inquire routinely about domestic violence. Nevertheless, mental health services often fail to adequately address domestic violence in clinical encounters. A systematic review of domestic violence assessment screening performed in a variety of health care settings found that evidence was insufficient to conclude that routine inquiry improved morbidity and mortality among victims of IPV.9 So the question becomes: How can we get our patients to tell us about these experiences so we can intervene?
Gender differences in perpetuating IPV
Several studies have found that abuse can result in various mental illnesses, such as depression, PTSD, anxiety, and suicidal ideation. Again, men have a disproportionately higher rate of perpetrating IPV, compared with women. This theory has been a source of debate in the academic community for years, but recent research has confirmed that women do perpetuate violence against their partners to some extent.10,11

Some members of the LGBTQ+ community also report experiencing violence from partners, so as clinicians, we also need to raise our awareness about the existence of violence among same-sex couples. In fact, a team of Italian researchers report more than 50% of gay men and almost 75% of lesbian women reported that they had been psychologically abused by a partner.12 More research into this area is needed.
Our role as health care professionals
The U.S. Preventive Services Task Force advises that all clinic visits include regular IPV screening.13 But these screenings are all too rare. In fact, a meta-analysis of 19 trials of more than 1,600 participants showed only 9%-40% of doctors routinely test for IPV.14 That research clearly shows how important it is for all clinicians to execute IPV screening. However, numerous challenges toward screening exist, including personal discomfort, limited time during appointments, insufficient resources, and inadequate training.
One ongoing debate revolves around which clinician should screen for IPV. Should the psychiatrist carry out this role – or perhaps the primary care physician, nurse, or social worker? These issues become even more fraught when clinicians worry about offending the patient – especially if the clinician is a male.15

The bottom line is that physicians should inquire about intimate partner violence, because research indicates that women are more likely to reveal abuse when prompted. In addition, during physician appointments, they can use the physician-patient therapeutic connection to conduct a domestic violence evaluation, give resources to victims, and provide ongoing care. Patients who exhibit treatment resistance, persistent pain, depression, sleeplessness, and headaches should prompt psychiatrists to conduct additional investigations into the likelihood of intimate partner violence and domestic abuse.
W also should be attentive when counseling patients about domestic violence when suggesting life-changing events such as pregnancy, employment loss, separation, or divorce. Similar to the recommendations of the USPSTF that all women and men should be screened for IPV, it is suggested that physicians be conscious of facilitating a conversation and not being overtly judgmental while observing body cues. Using the statements such as “we have been hearing a lot of violence in our community lately” could be a segue to introduce the subject.
Asking the question of whether you are being hit rather than being abused has allowed more women to open up more about domestic violence. While physicians are aware that most victims might recant and often go back to their abusers, victims need to be counseled that the abuse might intensify and lead to death.
For women who perpetuate IPV and survivors of IPV, safety is the priority. Physicians should provide safety options and be the facilitators. Studies have shown that fewer victims get the referral to the supporting agencies when IPV is indicated, which puts their safety at risk. In women who commit IPV, clinicians should assess the role of the individual in an IPV disclosure. There are various treatment modalities, whether the violence is performed through self-defense, bidirectionally, or because of aggression.
With the advancement of technology, web-based training on how to ask for IPV, documentation, acknowledgment, and structured referral increase physicians’ confidence when faced with an IPV disclosure than none.16 Treatment modalities should include medication reconciliation and cognitive-behavioral therapy – focusing on emotion regulation.
Using instruments such as the danger assessment tool can help physicians intervene early, reducing the risk of domestic violence and IPV recurrence instead of using clinical assessment alone.17 Physicians should convey empathy, validate victims, and help, especially when abuse is reported.

Also, it is important to evaluate survivors’ safety. Counseling can help people rebuild their self-esteem. Structured referrals for psychiatric help and support services are needed to help survivors on the long road to recovery.
Training all physicians, regardless of specialty, is essential to improve prompt IPV identification and bring awareness to resources available to survivors when IPV is disclosed. Although we described an association between IPV victims becoming possible perpetrators of IPV, more long-term studies are required to show the various processes that influence IPV perpetration rates, especially by survivors.
We would also like international and national regulatory bodies to increase the awareness of IPV and adequately address IPV with special emphasis on how mental health services should assess, identify, and respond to services for people who are survivors and perpetrators of IPV.
Dr. Kumari, Dr. Otite, Dr. Afzal, Dr. Alcera, and Dr. Doumas are affiliated with Hackensack Meridian Health at Ocean Medical Center, Brick, N.J. They have no conflicts of interest.
References
1. Centers for Disease Control and Prevention. Preventing intimate partner violence. 2020 Oct 9.
2. Yu R et al. PLOS Med. 16(12):e1002995. doi: 10.1371/journal.pmed.1002995.
3. Oram S et al. Epidemiol Psychiatr Sci. 2014 Dec;23(4):361-76.
4. Munro OE and Sellbom M. Pers Ment Health. 2020 Mar 11. doi: 10.1002/pmh.1480.
5. Sahraian A et al. Asian J Psychiatry. 2020 Jun. doi: 10.1016/j.ajp.2020.102062.
6. Nikos-Rose K. “COVID-19 Isolation Linked to Increased Domestic Violence, Researchers Suggest.” 2021 Feb 24. University of California, Davis.
7. World Health Organization. “Responding to intimate partner violence and sexual violence against women.” WHO clinical policy guidelines. 2013.
8. National Institute for Health and Care Excellence. “Domestic violence and abuse: Multi-agency working.” PH50. 2014 Feb 26.
9. Feder GS et al. Arch Intern Med. 2006;166(1):22-37.
10. Gondolf EW. Violence Against Women. 2014 Dec;20(12)1539-46.
11. Hamberger LK and Larsen SE. J Fam Violence. 2015;30(6):699-717.
12. Rollè L et al. Front Psychol. 21 Aug 2018. doi: 10.3389/fpsyg.2018.01506.
13. Paterno MT and Draughon JE. J Midwif Women Health. 2016;61(31):370-5.
14. Kalra N et al. Cochrane Database Syst Rev. 2021 May 31;5(5)CD012423.
15. Larsen SE and Hamberger LK. J Fam Viol. 2015;30:1007-30.
16. Kalra N et al. Cochrane Database Syst Rev. 2017 Feb;2017(2):CD012423.
17. Campbell JC et al. J Interpers Violence. 2009;24(4):653-74.
Violence against women remains a global dilemma in need of attention. Physical violence in particular, is the most prevalent type of violence across all genders, races, and nationalities.
The Centers for Disease Control and Prevention says more than 43 million women and 38 million men report experiencing psychological aggression by an intimate partner in their lifetime. Meanwhile, 11 million women and 5 million men report enduring sexual or physical violence and intimate partner violence (IPV), and/or stalking by an intimate partner during their lifetimes, according to the CDC.1
Women who have endured this kind of violence might present differently from men. Some studies, for example, show a more significant association between mutual violence, depression, and substance use among women than men.2 Studies on the phenomenon of IPV victims/survivors becoming perpetrators of abuse are limited, but that this happens in some cases.
Having a psychiatric disorder is associated with a higher likelihood of being physically violent with a partner.3,4 One recent study of 250 female psychiatric patients who were married and had no history of drug abuse found that almost 68% reported psychological abuse, 52% reported sexual abuse, 38% social abuse, 37% reported economic abuse, and 25% reported physical abuse.5
Given those statistics and trends, it is incumbent upon clinicians – including those in primary care, psychiatry, and emergency medicine – to learn to quickly identify IPV survivors, and to use available prognostic tools to monitor perpetrators and survivors.
COVID pandemic’s influence
Isolation tied to the COVID-19 pandemic has been linked to increased IPV. A study conducted by researchers at the University of California, Davis, suggested that extra stress experienced during the COVID-19 pandemic caused by income loss, and the inability to pay for housing and food exacerbated the prevalence of IPV early during the pandemic.6
That study, where researchers collected in surveys of nearly 400 adults in the beginning in April 2020 for 10 weeks, showed that more services and communication are needed so that frontline health care and food bank workers, for example, in addition to social workers, doctors, and therapists, can spot the signs and ask clients questions about potential IPV. They could then link survivors to pertinent assistance and resources.
Furthermore, multiple factors probably have played a pivotal role in increasing the prevalence of IPV during the COVID-19 pandemic. For instance, disruption to usual health and social services as well as diminished access to support systems, such as shelters, and charity helplines negatively affected the reporting of domestic violence.
Long before the pandemic, over the past decade, international and national bodies have played a crucial role in terms of improving the awareness and response to domestic violence.7,8 In addition, several policies have been introduced in countries around the globe emphasizing the need to inquire routinely about domestic violence. Nevertheless, mental health services often fail to adequately address domestic violence in clinical encounters. A systematic review of domestic violence assessment screening performed in a variety of health care settings found that evidence was insufficient to conclude that routine inquiry improved morbidity and mortality among victims of IPV.9 So the question becomes: How can we get our patients to tell us about these experiences so we can intervene?
Gender differences in perpetuating IPV
Several studies have found that abuse can result in various mental illnesses, such as depression, PTSD, anxiety, and suicidal ideation. Again, men have a disproportionately higher rate of perpetrating IPV, compared with women. This theory has been a source of debate in the academic community for years, but recent research has confirmed that women do perpetuate violence against their partners to some extent.10,11
Some members of the LGBTQ+ community also report experiencing violence from partners, so as clinicians, we also need to raise our awareness about the existence of violence among same-sex couples. In fact, a team of Italian researchers report more than 50% of gay men and almost 75% of lesbian women reported that they had been psychologically abused by a partner.12 More research into this area is needed.
Our role as health care professionals
The U.S. Preventive Services Task Force advises that all clinic visits include regular IPV screening.13 But these screenings are all too rare. In fact, a meta-analysis of 19 trials of more than 1,600 participants showed only 9%-40% of doctors routinely test for IPV.14 That research clearly shows how important it is for all clinicians to execute IPV screening. However, numerous challenges toward screening exist, including personal discomfort, limited time during appointments, insufficient resources, and inadequate training.
One ongoing debate revolves around which clinician should screen for IPV. Should the psychiatrist carry out this role – or perhaps the primary care physician, nurse, or social worker? These issues become even more fraught when clinicians worry about offending the patient – especially if the clinician is a male.15
The bottom line is that physicians should inquire about intimate partner violence, because research indicates that women are more likely to reveal abuse when prompted. In addition, during physician appointments, they can use the physician-patient therapeutic connection to conduct a domestic violence evaluation, give resources to victims, and provide ongoing care. Patients who exhibit treatment resistance, persistent pain, depression, sleeplessness, and headaches should prompt psychiatrists to conduct additional investigations into the likelihood of intimate partner violence and domestic abuse.
W also should be attentive when counseling patients about domestic violence when suggesting life-changing events such as pregnancy, employment loss, separation, or divorce. Similar to the recommendations of the USPSTF that all women and men should be screened for IPV, it is suggested that physicians be conscious of facilitating a conversation and not being overtly judgmental while observing body cues. Using the statements such as “we have been hearing a lot of violence in our community lately” could be a segue to introduce the subject.
Asking the question of whether you are being hit rather than being abused has allowed more women to open up more about domestic violence. While physicians are aware that most victims might recant and often go back to their abusers, victims need to be counseled that the abuse might intensify and lead to death.
For women who perpetuate IPV and survivors of IPV, safety is the priority. Physicians should provide safety options and be the facilitators. Studies have shown that fewer victims get the referral to the supporting agencies when IPV is indicated, which puts their safety at risk. In women who commit IPV, clinicians should assess the role of the individual in an IPV disclosure. There are various treatment modalities, whether the violence is performed through self-defense, bidirectionally, or because of aggression.
With the advancement of technology, web-based training on how to ask for IPV, documentation, acknowledgment, and structured referral increase physicians’ confidence when faced with an IPV disclosure than none.16 Treatment modalities should include medication reconciliation and cognitive-behavioral therapy – focusing on emotion regulation.
Using instruments such as the danger assessment tool can help physicians intervene early, reducing the risk of domestic violence and IPV recurrence instead of using clinical assessment alone.17 Physicians should convey empathy, validate victims, and help, especially when abuse is reported.
Also, it is important to evaluate survivors’ safety. Counseling can help people rebuild their self-esteem. Structured referrals for psychiatric help and support services are needed to help survivors on the long road to recovery.
Training all physicians, regardless of specialty, is essential to improve prompt IPV identification and bring awareness to resources available to survivors when IPV is disclosed. Although we described an association between IPV victims becoming possible perpetrators of IPV, more long-term studies are required to show the various processes that influence IPV perpetration rates, especially by survivors.
We would also like international and national regulatory bodies to increase the awareness of IPV and adequately address IPV with special emphasis on how mental health services should assess, identify, and respond to services for people who are survivors and perpetrators of IPV.
Dr. Kumari, Dr. Otite, Dr. Afzal, Dr. Alcera, and Dr. Doumas are affiliated with Hackensack Meridian Health at Ocean Medical Center, Brick, N.J. They have no conflicts of interest.
References
1. Centers for Disease Control and Prevention. Preventing intimate partner violence. 2020 Oct 9.
2. Yu R et al. PLOS Med. 16(12):e1002995. doi: 10.1371/journal.pmed.1002995.
3. Oram S et al. Epidemiol Psychiatr Sci. 2014 Dec;23(4):361-76.
4. Munro OE and Sellbom M. Pers Ment Health. 2020 Mar 11. doi: 10.1002/pmh.1480.
5. Sahraian A et al. Asian J Psychiatry. 2020 Jun. doi: 10.1016/j.ajp.2020.102062.
6. Nikos-Rose K. “COVID-19 Isolation Linked to Increased Domestic Violence, Researchers Suggest.” 2021 Feb 24. University of California, Davis.
7. World Health Organization. “Responding to intimate partner violence and sexual violence against women.” WHO clinical policy guidelines. 2013.
8. National Institute for Health and Care Excellence. “Domestic violence and abuse: Multi-agency working.” PH50. 2014 Feb 26.
9. Feder GS et al. Arch Intern Med. 2006;166(1):22-37.
10. Gondolf EW. Violence Against Women. 2014 Dec;20(12)1539-46.
11. Hamberger LK and Larsen SE. J Fam Violence. 2015;30(6):699-717.
12. Rollè L et al. Front Psychol. 21 Aug 2018. doi: 10.3389/fpsyg.2018.01506.
13. Paterno MT and Draughon JE. J Midwif Women Health. 2016;61(31):370-5.
14. Kalra N et al. Cochrane Database Syst Rev. 2021 May 31;5(5)CD012423.
15. Larsen SE and Hamberger LK. J Fam Viol. 2015;30:1007-30.
16. Kalra N et al. Cochrane Database Syst Rev. 2017 Feb;2017(2):CD012423.
17. Campbell JC et al. J Interpers Violence. 2009;24(4):653-74.
This doc still supports NP/PA-led care ... with caveats
Two years ago, I argued that independent care from nurse practitioners (NPs) and physician assistants (PAs) would not have ill effects on health outcomes. To the surprise of no one, NPs and PAs embraced the argument; physicians clobbered it.
My case had three pegs: One was that medicine isn’t rocket science and clinicians control a lot less than we think we do. The second peg was that technology levels the playing field of clinical care. High-sensitivity troponin assays, for instance, make missing MI a lot less likely. The third peg was empirical: Studies have found little difference in MD versus non–MD-led care. Looking back, I now see empiricism as the weakest part of the argument because the studies had so many limitations.
I update this viewpoint now because health care is increasingly delivered by NPs and PAs. And there are two concerning trends regarding NP education and experience. First is that nurses are turning to advanced practitioner training earlier in their careers – without gathering much bedside experience. And these training programs are increasingly likely to be online, with minimal hands-on clinical tutoring.
Education and experience pop in my head often. Not every day, but many days I think back to my lucky 7 years in Indiana learning under the supervision of master clinicians – at a time when trainees were allowed the leeway to make decisions ... and mistakes. Then, when I joined private practice, I continued to learn from experienced practitioners.
It would be foolish to argue that training and experience aren’t important.
But here’s the thing:
I will make three points: First, I will bolster two of my old arguments as to why we shouldn’t be worried about non-MD clinicians, then I will propose some ideas to increase confidence in NP and PA care.
Health care does not equal health
On the matter of how much clinicians affect outcomes, a recently published randomized controlled trial performed in India found that subsidizing insurance care led to increased utilization of hospital services but had no significant effect on health outcomes. This follows the RAND and Oregon Health Insurance studies in the United States, which largely reported similar results.
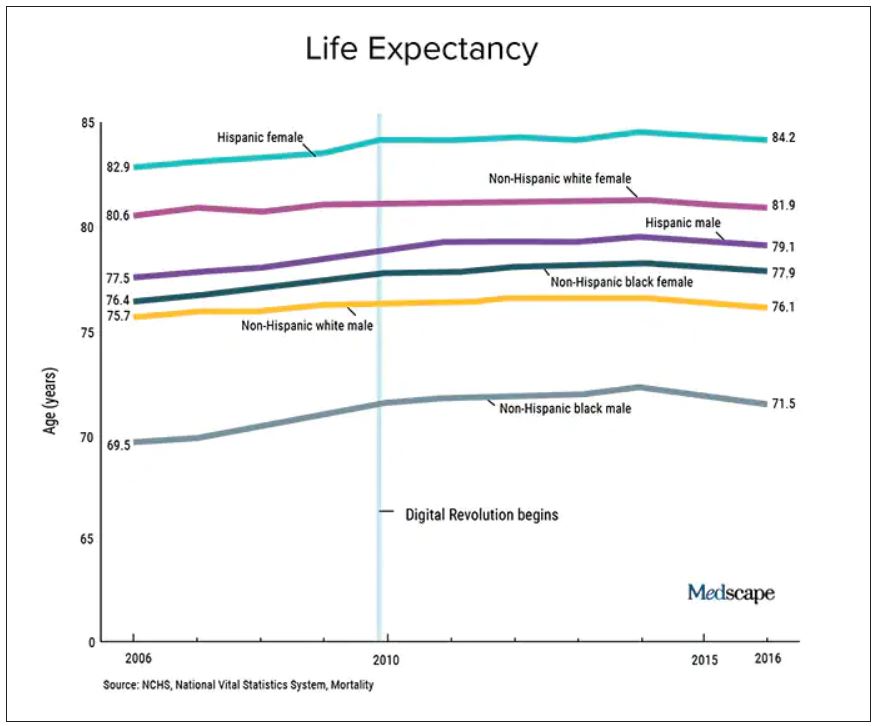
We should also not dismiss the fact that – despite the massive technology gains over the past half-century in digital health and artificial intelligence and increased use of quality measures, new drugs and procedures, and mega-medical centers – the average lifespan of Americans is flat to declining (in most ethnic and racial groups). Worse than no gains in longevity, perhaps, is that death from diseases like dementia and Parkinson’s disease are on the rise.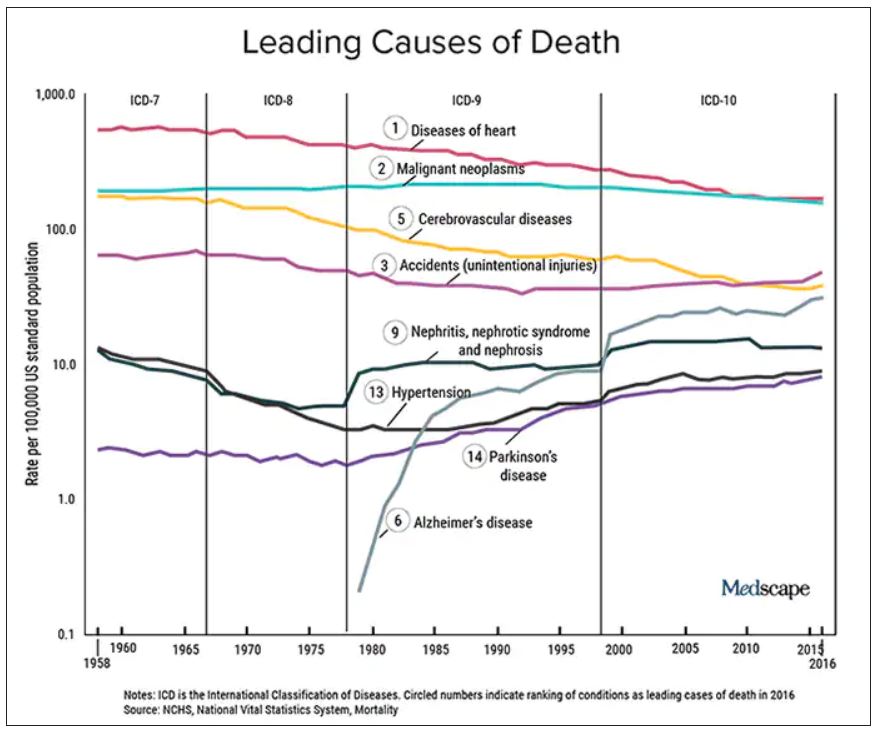
A neutral Martian would look down and wonder why all this health care hasn’t translated to longer and better lives. The causes of this paradox remain speculative, and are for another column, but the point remains that – on average – more health care is clearly not delivering more health. And if that is true, one may deduce that much of U.S. health care is marginal when it comes to affecting major outcomes.
It’s about the delta
Logos trumps pathos. Sure, my physician colleagues can tell scary anecdotes of bad outcomes caused by an inexperienced NP or PA. I would counter that by saying I have sat on our hospital’s peer review committee for 2 decades, including the era before NPs or PAs were practicing, and I have plenty of stories of physician errors. These include, of course, my own errors.
Logos: We must consider the difference between non–MD-led care and MD-led care.
My arguments from 2020 remain relevant today. Most medical problems are not engineering puzzles. Many, perhaps most, patients fall into an easy protocol – say, chest pain, dyspnea, or atrial fibrillation. With basic training, a motivated serious person quickly gains skill in recognizing and treating everyday problems.
And just 2 years on, technology further levels the playing field. Consider radiology in 2022 – it’s easy to take for granted the speed of the CT scan, the fidelity of the MRI, and the easy access to both in the U.S. hospital system. Less experienced clinicians have never had more tools to assist with diagnostics and therapeutics.
The expansion of team-based care has also mitigated the effects of inexperience. It took Americans longer than Canadians to figure out how helpful pharmacists could be. Pharmacists in my hospital now help us dose complicated medicines and protect us against prescribing errors.
Then there is the immediate access to online information. Gone are the days when you had to memorize long-QT syndromes. Book knowledge – that I spent years acquiring – now comes in seconds. The other day an NP corrected me. I asked, Are you sure? Boom, she took out her phone and showed me the evidence.
In sum, if it were even possible to measure the clinical competence of care from NP and PA versus physicians, there would be two bell-shaped curves with a tremendous amount of overlap. And that overlap would steadily increase as a given NP or PA gathered experience. (The NP in our electrophysiology division has more than 25 years’ experience in heart rhythm care, and it is common for colleagues to call her before one of us docs. Rightly so.)
Three basic proposals regarding NP and PA care
To ensure quality of care, I have three proposals.
It has always seemed strange to me that an NP or PA can flip from one field to another without a period of training. I can’t just change practice from electrophysiology to dermatology without doing a residency. But NPs and PAs can.
My first proposal would be that NPs and PAs spend a substantial period of training in a field before practice – a legit apprenticeship. The duration of this period is a matter of debate, but it ought to be standardized.
My second proposal is that, if physicians are required to pass certification exams, so should NPs. (PAs have an exam every 10 years.) The exam should be the same as (or very similar to) the physician exam, and it should be specific to their field of practice.
While I have argued (and still feel) that the American Board of Internal Medicine brand of certification is dubious, the fact remains that physicians must maintain proficiency in their field. Requiring NPs and PAs to do the same would help foster specialization. And while I can’t cite empirical evidence, specialization seems super-important. We have NPs at my hospital who have been in the same area for years, and they exude clinical competence.
Finally, I have come to believe that the best way for nearly any clinician to practice medicine is as part of a team. (The exception being primary care in rural areas where there are clinician shortages.)
On the matter of team care, I’ve practiced for a long time, but nearly every day I run situations by a colleague; often this person is an NP. The economist Friedrich Hayek proposed that dispersed knowledge always outpaces the wisdom of any individual. That notion pertains well to the increasing complexities and specialization of modern medical practice.
A person who commits to learning one area of medicine, enjoys helping people, asks often for help, and has the support of colleagues is set up to be a successful clinician – whether the letters after their name are APRN, PA, DO, or MD.
Dr. Mandrola practices cardiac electrophysiology in Louisville, Ky. He did not report any relevant financial disclosures. A version of this article first appeared on Medscape.com.
Two years ago, I argued that independent care from nurse practitioners (NPs) and physician assistants (PAs) would not have ill effects on health outcomes. To the surprise of no one, NPs and PAs embraced the argument; physicians clobbered it.
My case had three pegs: One was that medicine isn’t rocket science and clinicians control a lot less than we think we do. The second peg was that technology levels the playing field of clinical care. High-sensitivity troponin assays, for instance, make missing MI a lot less likely. The third peg was empirical: Studies have found little difference in MD versus non–MD-led care. Looking back, I now see empiricism as the weakest part of the argument because the studies had so many limitations.
I update this viewpoint now because health care is increasingly delivered by NPs and PAs. And there are two concerning trends regarding NP education and experience. First is that nurses are turning to advanced practitioner training earlier in their careers – without gathering much bedside experience. And these training programs are increasingly likely to be online, with minimal hands-on clinical tutoring.
Education and experience pop in my head often. Not every day, but many days I think back to my lucky 7 years in Indiana learning under the supervision of master clinicians – at a time when trainees were allowed the leeway to make decisions ... and mistakes. Then, when I joined private practice, I continued to learn from experienced practitioners.
It would be foolish to argue that training and experience aren’t important.
But here’s the thing:
I will make three points: First, I will bolster two of my old arguments as to why we shouldn’t be worried about non-MD clinicians, then I will propose some ideas to increase confidence in NP and PA care.
Health care does not equal health
On the matter of how much clinicians affect outcomes, a recently published randomized controlled trial performed in India found that subsidizing insurance care led to increased utilization of hospital services but had no significant effect on health outcomes. This follows the RAND and Oregon Health Insurance studies in the United States, which largely reported similar results.
We should also not dismiss the fact that – despite the massive technology gains over the past half-century in digital health and artificial intelligence and increased use of quality measures, new drugs and procedures, and mega-medical centers – the average lifespan of Americans is flat to declining (in most ethnic and racial groups). Worse than no gains in longevity, perhaps, is that death from diseases like dementia and Parkinson’s disease are on the rise.
A neutral Martian would look down and wonder why all this health care hasn’t translated to longer and better lives. The causes of this paradox remain speculative, and are for another column, but the point remains that – on average – more health care is clearly not delivering more health. And if that is true, one may deduce that much of U.S. health care is marginal when it comes to affecting major outcomes.
It’s about the delta
Logos trumps pathos. Sure, my physician colleagues can tell scary anecdotes of bad outcomes caused by an inexperienced NP or PA. I would counter that by saying I have sat on our hospital’s peer review committee for 2 decades, including the era before NPs or PAs were practicing, and I have plenty of stories of physician errors. These include, of course, my own errors.
Logos: We must consider the difference between non–MD-led care and MD-led care.
My arguments from 2020 remain relevant today. Most medical problems are not engineering puzzles. Many, perhaps most, patients fall into an easy protocol – say, chest pain, dyspnea, or atrial fibrillation. With basic training, a motivated serious person quickly gains skill in recognizing and treating everyday problems.
And just 2 years on, technology further levels the playing field. Consider radiology in 2022 – it’s easy to take for granted the speed of the CT scan, the fidelity of the MRI, and the easy access to both in the U.S. hospital system. Less experienced clinicians have never had more tools to assist with diagnostics and therapeutics.
The expansion of team-based care has also mitigated the effects of inexperience. It took Americans longer than Canadians to figure out how helpful pharmacists could be. Pharmacists in my hospital now help us dose complicated medicines and protect us against prescribing errors.
Then there is the immediate access to online information. Gone are the days when you had to memorize long-QT syndromes. Book knowledge – that I spent years acquiring – now comes in seconds. The other day an NP corrected me. I asked, Are you sure? Boom, she took out her phone and showed me the evidence.
In sum, if it were even possible to measure the clinical competence of care from NP and PA versus physicians, there would be two bell-shaped curves with a tremendous amount of overlap. And that overlap would steadily increase as a given NP or PA gathered experience. (The NP in our electrophysiology division has more than 25 years’ experience in heart rhythm care, and it is common for colleagues to call her before one of us docs. Rightly so.)
Three basic proposals regarding NP and PA care
To ensure quality of care, I have three proposals.
It has always seemed strange to me that an NP or PA can flip from one field to another without a period of training. I can’t just change practice from electrophysiology to dermatology without doing a residency. But NPs and PAs can.
My first proposal would be that NPs and PAs spend a substantial period of training in a field before practice – a legit apprenticeship. The duration of this period is a matter of debate, but it ought to be standardized.
My second proposal is that, if physicians are required to pass certification exams, so should NPs. (PAs have an exam every 10 years.) The exam should be the same as (or very similar to) the physician exam, and it should be specific to their field of practice.
While I have argued (and still feel) that the American Board of Internal Medicine brand of certification is dubious, the fact remains that physicians must maintain proficiency in their field. Requiring NPs and PAs to do the same would help foster specialization. And while I can’t cite empirical evidence, specialization seems super-important. We have NPs at my hospital who have been in the same area for years, and they exude clinical competence.
Finally, I have come to believe that the best way for nearly any clinician to practice medicine is as part of a team. (The exception being primary care in rural areas where there are clinician shortages.)
On the matter of team care, I’ve practiced for a long time, but nearly every day I run situations by a colleague; often this person is an NP. The economist Friedrich Hayek proposed that dispersed knowledge always outpaces the wisdom of any individual. That notion pertains well to the increasing complexities and specialization of modern medical practice.
A person who commits to learning one area of medicine, enjoys helping people, asks often for help, and has the support of colleagues is set up to be a successful clinician – whether the letters after their name are APRN, PA, DO, or MD.
Dr. Mandrola practices cardiac electrophysiology in Louisville, Ky. He did not report any relevant financial disclosures. A version of this article first appeared on Medscape.com.
Oral penicillin advised for high-risk rheumatic heart disease
Some patients with rheumatic heart disease who are thought to have an allergic response to injectable penicillin may actually be experiencing a cardiac reaction to the injection, new information suggests.
This has resulted in new advice from the American Heart Association suggesting that oral penicillin may be a safer option for people with rheumatic heart disease who are at high risk of a cardiac reaction.
Those at high risk of a cardiac reaction include those with rheumatic heart disease and severe valvular heart disease with or without reduced ventricular function, those with aortic insufficiency or decreased left ventricular systolic function, and those who have active symptoms of rheumatic heart disease.
This new guidance is the subject of an AHA “presidential advisory” published online in the Journal of the American Heart Association on Jan. 20, 2022.
The advisory notes that more than 39 million people worldwide have rheumatic heart disease, a condition in which the heart’s valves are permanently damaged by rheumatic fever, which can occur if a strep throat infection or scarlet fever is untreated or inadequately treated.
Most cases of rheumatic heart disease occur in people living in low- and middle-income countries, where the condition is often diagnosed after severe valvular heart disease or other cardiovascular complications have already developed, leading to higher rates of death and lower life expectancy.
The recommended treatment for rheumatic heart disease is an intramuscular injection of benzathine penicillin G (BPG) given every 3-4 weeks for many years or even lifelong. Treatment with BPG for rheumatic heart disease has been limited in part because of patients’ and clinicians’ fears of anaphylaxis.
However, a growing number of reports of BPG-related deaths have not shown the features of classic anaphylaxis and instead point to a cardiovascular reaction, specifically, a vasovagal episode, the advisory states.
Signs of a vasovagal episode often occur immediately after administration of BPG, sometimes even during injection, and include low blood pressure, which can improve if patients are put into a supine position, slow heart rate, and fainting, all of which may lead to low blood flow to the heart, irregular heart rhythm, and sudden cardiac death.
On the other hand, signs of anaphylaxis after BPG injection are usually slightly delayed after the injection, even up to an hour later, and include coughing, respiratory distress, rapid heart rate, low blood pressure that doesn’t respond to position change, fainting, itching and redness at the injection site, the document notes.
The risks of a cardiovascular reaction to BPG are highest among individuals with severe mitral stenosis, aortic stenosis, aortic insufficiency or decreased left ventricular systolic function (ejection fraction <50%), and those who have active symptoms of rheumatic heart disease. For these patients, treatment with oral penicillin should be strongly considered.
People with rheumatic heart disease who are at low risk of this cardiovascular reaction and who do not have a history of being allergic to penicillin or anaphylaxis can still be prescribed BPG for treatment and prevention of rheumatic heart disease, which has been proven to be the best treatment for prevention of recurrent rheumatic fever.
The advisory recommended the following standard practices for all patients receiving BPG for rheumatic heart disease:
- Reducing injection pain and patient anxiety, both of which are known risk factors for injection-related fainting. Methods for pain reduction include applying firm pressure to the site for 10 seconds or application of an ice pack or the use of analgesics (such as acetaminophen, ibuprofen, or other NSAIDs).
- Patients should be well hydrated prior to injection and should drink at least 500 mL of water before injection to prevent reflexive fainting.
- Eating a small amount of solid food within the hour before injection.
- Receiving the injection while lying down, which may reduce the risk of blood pooling in the extremities.
- Providers who administer BPG should be taught how to recognize and quickly treat symptoms such as low blood pressure, low heart rate, or fainting.
A version of this article first appeared on Medscape.com.
FROM THE JOURNAL OF THE AMERICAN HEART ASSOCIATION
Infectious disease pop quiz: Clinical challenge #11 for the ObGyn
In a pregnant woman with a history of recurrent herpes simplex virus infection, what is the best way to prevent an outbreak of lesions near term?
Continue to the answer...
Obstetric patients with a history of recurrent herpes simplex infection should be treated with acyclovir 400 mg orally 3 times daily from 36 weeks until delivery. This regimen significantly reduces the likelihood of a recurrent outbreak near the time of delivery, which if it occurred, would necessitate a cesarean delivery. In patients at increased risk for preterm delivery, the prophylactic regimen should be started earlier.
Valacyclovir, 500 mg orally twice daily, is an acceptable alternative but is significantly more expensive.
- Duff P. Maternal and perinatal infections: bacterial. In: Landon MB, Galan HL, Jauniaux ERM, et al. Gabbe’s Obstetrics: Normal and Problem Pregnancies. 8th ed. Elsevier; 2021:1124-1146.
- Duff P. Maternal and fetal infections. In: Resnik R, Lockwood CJ, Moore TJ, et al. Creasy & Resnik’s Maternal-Fetal Medicine: Principles and Practice. 8th ed. Elsevier; 2019:862-919.

Dr. Edwards is a Resident in the Department of Medicine, University of Florida College of Medicine, Gainesville.

Dr. Duff is Professor of Maternal-Fetal Medicine, Department of Obstetrics and Gynecology, University of Florida College of Medicine, Gainesville.
The authors report no financial relationships relevant to this article.
Dr. Edwards is a Resident in the Department of Medicine, University of Florida College of Medicine, Gainesville.
Dr. Duff is Professor of Maternal-Fetal Medicine, Department of Obstetrics and Gynecology, University of Florida College of Medicine, Gainesville.
The authors report no financial relationships relevant to this article.
In a pregnant woman with a history of recurrent herpes simplex virus infection, what is the best way to prevent an outbreak of lesions near term?
Continue to the answer...
Obstetric patients with a history of recurrent herpes simplex infection should be treated with acyclovir 400 mg orally 3 times daily from 36 weeks until delivery. This regimen significantly reduces the likelihood of a recurrent outbreak near the time of delivery, which if it occurred, would necessitate a cesarean delivery. In patients at increased risk for preterm delivery, the prophylactic regimen should be started earlier.
Valacyclovir, 500 mg orally twice daily, is an acceptable alternative but is significantly more expensive.
- Duff P. Maternal and perinatal infections: bacterial. In: Landon MB, Galan HL, Jauniaux ERM, et al. Gabbe’s Obstetrics: Normal and Problem Pregnancies. 8th ed. Elsevier; 2021:1124-1146.
- Duff P. Maternal and fetal infections. In: Resnik R, Lockwood CJ, Moore TJ, et al. Creasy & Resnik’s Maternal-Fetal Medicine: Principles and Practice. 8th ed. Elsevier; 2019:862-919.
DKMS: Small nonprofit to world’s largest stem cell donor registry
When Mechtild Harf was diagnosed with acute leukemia in 1990, physicians told her and her husband Peter that a bone marrow transplant was her best hope for survival. Back then, her native Germany had only 3,000 registered donors, and none was a match.
“My dad just went crazy, you know, to save his wife,” recalled Katharina Harf, who was a young teen at the time of her mother’s diagnosis.
In the course of 1 year, the Harfs recruited more than 68,000 potential bone marrow donors, but their heroic efforts couldn’t save Mechtild.
“She unfortunately didn’t make it. She died because of leukemia,” Katharina said.
Although Mechtild Harf did not survive, her legacy lives on in the bone marrow and stem cell donor recruitment organization DKMS (Deutsche Knochenmarkspenderdatei, or German Bone Marrow Donor Center).
In May of 1991, Peter Harf and Gerhard Ehninger, MD, the hematologist who treated Mechtild, founded DKMS with the mission, as its website states, “to provide as many blood cancer patients as possible with a second chance at life.”
From its German roots, the nonprofit organization has extended its mission to the United States (where it was initially known as Delete Blood Cancer DKMS), Poland, the United Kingdom, Chile, and in 2021, to South Africa.
Three decades after her mother’s death, Katharina Harf serves as Executive Chairwoman of DKMS U.S., based in New York.
World’s largest registry
“DKMS has the largest number of unrelated donors of any organization in the world,” noted Richard E. Champlin, MD, chair of the department of stem cell transplantation and cellular therapy at the University of Texas MD Anderson Cancer Center in Houston.
“In a large fraction of our donor searches, we find matches that are in the DKMS registry,” he said in an interview,
Alexander Schmidt, MD, PhD, global chief medical officer for DKMS, said that approximately 25% of all registered donors worldwide were recruited by his organization, and 39% of all unrelated donor transplants are made with peripheral blood stem cell or bone marrow products, donated by volunteers who are recruited by DKMS.
Since its founding, DKMS has registered 7.1 million potential donors in Germany, who made a total of 80,000 stem cell donations. DKMS U.S., which began operations in 2004, has registered 1.1 million donors and enabled 4,700 donations.
Global partners
DKMS partners with donor centers and recruitment organizations in each country where it operates. In the United States, DKMS works with the National Marrow Donor Program (NMDP) and its “Be The Match” donor registry.
“DKMS donors, both those from DKMS in Germany and those from DKMS in the United States are also listed in the NMDP registry, to make it easier for US search coordinators to accept these donors,” Dr. Schmidt explained in an interview.
The international cooperation and coordination makes it possible for a donor in the UK, for example, to save a life of a patient in Germany, the U.S., Chile, India, or many other parts of the world – anywhere that can be reached in time for a patient in need to receive a stem cell donation.
Pandemic affects donations
But, as with just about every aspect of life, the COVID-19 pandemic has created enormous challenges for recruiters, donor centers, and stem cell transplant centers.
Dr. Schmidt said that decline in donations during the pandemic was less severe than initially feared, with a decrease of just 3.5% in 2020, compared with the prepandemic year of 2019. In contrast, though, the average annual growth rate for donations prior to the pandemic was about 4%.
“Nevertheless, at the beginning of the pandemic in March 2020, for a few days things looked quite terrible, because all the borders were closed and flights were canceled, and about 50% of all stem cell products go abroad, and between 20% and 25% go intercontinental,” Dr. Schmidt said.
However, close cooperation and coordination between donor centers and national health authorities soon resolved the problem and helped insure that the flow of life-saving donations could continue with minimal disruption, he noted.
“I don’t think we had any product that could not be delivered at the end of the day, due to the pandemic,” he told this news organization.
Workforce and clinical problems
Although the flow of donations within and between nations has continued, the COVID-19 pandemic has had profound negative effects on transplant centers, particularly during the wave of infections caused by the Omicron variant, according to a transplant expert.
“With this most recent strain and how transmissible it is, what we’re dealing with is mass workforce shortages,” said Yi-Bin Chen, MD, director of the bone marrow transplant program at Massachusetts General Hospital in Boston.
“On top of a short-staffed hospital, you then take a very transmissible variant and deplete it even more due to the need to quarantine,” he said in an interview.
Both Dr. Champlin and Dr. Chen said that on-again, off-again pandemic travel bans and donor illnesses have necessitated first obtaining products and cryopreserving them before starting the recipient on a conditioning regimen for the transplant.
“The problem is that, while you can preserve peripheral blood stem cells pretty reliably, cryopreserving bone marrow is a bit more difficult,” Dr. Chen said.
In addition, evidence from recent studies comparing stem cell sources suggest that outcomes are less good with cryopreserved products than with fresh products, and with peripheral blood stem cells compared with bone marrow.
“But you’ve got to make do. A transplant with a cryopreserved product is better than no transplant,” Dr. Chen said.
To make things even more frustrating, as the pandemic waxed and waned throughout 2020 and 2021, the recommendations from donor centers seesawed between using fresh or cryopreserved product, making it difficult to plan a transplant for an individual patient.
The Omicron wave has also resulted in a much higher rate of donor dropout than anticipated, making it that much harder to schedule a transplant, Dr. Chen noted.
‘Every patient saved’
The pandemic will eventually subside, however, while the need for stem cell transplantation to treat hematologic malignancies will continue.
DKMS recently launched special aid programs to improve access to stem cell transplants in developing nations by offering financial support, free HLA typing, and other services.
In addition to its core mission of recruiting donors, DKMS is dedicated to improving the quality and efficiency of stem cell transplants. For example, in 2017 scientists in DKMS’ Life Science Lab created an antibody test for donor cytomegalovirus (CMV) infection, using a simple buccal swab rather than a more invasive blood sample. CMV infections can compromise the integrity of stem cell grafts and could be fatal to immunocompromised transplant recipients.
The last word goes to Mechtild Harf’s daughter Katharina.
“My big dream is that every patient will be saved from blood cancer,” she said in a video posted on the DKMS website. “When they get sick, we have a solution for them, whether it’s because they need a donor, with research, building hospitals, providing them with the best medical care we can. I will just keep fighting and keep spreading the word, recruiting donors, raising money – all the things that it takes for us to delete blood cancer.”
“I have to believe that this dream will come true because otherwise, why dream, right?” she said.
Dr. Champlin was the recipient of a Mechtild Harf Science Award and is a member of the board of DKMS U.S. Dr. Schmidt is employed by DKMS. Dr. Chen reported having no relevant disclosures.