User login
Quality of Life and Population Health in Behavioral Health Care: A Retrospective, Cross-Sectional Study
From Milwaukee County Behavioral Health Services, Milwaukee, WI.
Abstract
Objectives: The goal of this study was to determine whether a single-item quality of life (QOL) measure could serve as a useful population health–level metric within the Quadruple Aim framework in a publicly funded behavioral health system.
Design: This was a retrospective, cross-sectional study that examined the correlation between the single-item QOL measure and several other key measures of the social determinants of health and a composite measure of acute service utilization for all patients receiving mental health and substance use services in a community behavioral health system.
Methods: Data were collected for 4488 patients who had at least 1 assessment between October 1, 2020, and September 30, 2021. Data on social determinants of health were obtained through patient self-report; acute service use data were obtained from electronic health records.
Results: Statistical analyses revealed results in the expected direction for all relationships tested. Patients with higher QOL were more likely to report “Good” or better self-rated physical health, be employed, have a private residence, and report recent positive social interactions, and were less likely to have received acute services in the previous 90 days.
Conclusion: A single-item QOL measure shows promise as a general, minimally burdensome whole-system metric that can function as a target for population health management efforts in a large behavioral health system. Future research should explore whether this QOL measure is sensitive to change over time and examine its temporal relationship with other key outcome metrics.
Keywords: Quadruple Aim, single-item measures, social determinants of health, acute service utilization metrics.
The Triple Aim for health care—improving the individual experience of care, increasing the health of populations, and reducing the costs of care—was first proposed in 2008.1 More recently, some have advocated for an expanded focus to include a fourth aim: the quality of staff work life.2 Since this seminal paper was published, many health care systems have endeavored to adopt and implement the Quadruple Aim3,4; however, the concepts representing each of the aims are not universally defined,3 nor are the measures needed to populate the Quadruple Aim always available within the health system in question.5
Although several assessment models and frameworks that provide guidance to stakeholders have been developed,6,7 it is ultimately up to organizations themselves to determine which measures they should deploy to best represent the different quadrants of the Quadruple Aim.6 Evidence suggests, however, that quality measurement, and the administrative time required to conduct it, can be both financially and emotionally burdensome to providers and health systems.8-10 Thus, it is incumbent on organizations to select a set of measures that are not only meaningful but as parsimonious as possible.6,11,12
Quality of life (QOL) is a potential candidate to assess the aim of population health. Brief health-related QOL questions have long been used in epidemiological surveys, such as the Behavioral Risk Factor Surveillance System survey.13 Such questions are also a key component of community health frameworks, such as the County Health Rankings developed by the University of Wisconsin Population Health Institute.14 Furthermore, Humana recently revealed that increasing the number of physical and mental health “Healthy Days” (which are among the Centers for Disease Control and Prevention’s Health-Related Quality of Life questions15) among the members enrolled in their insurance plan would become a major goal for the organization.16,17 Many of these measures, while brief, focus on QOL as a function of health, often as a self-rated construct (from “Poor” to “Excellent”) or in the form of days of poor physical or mental health in the past 30 days,15 rather than evaluating QOL itself; however, several authors have pointed out that health status and QOL are related but distinct concepts.18,19
Brief single-item assessments focused specifically on QOL have been developed and implemented within nonclinical20 and clinical populations, including individuals with cancer,21 adults with disabilities,22 individuals with cystic fibrosis,23 and children with epilepsy.24 Despite the long history of QOL assessment in behavioral health treatment,25 single-item measures have not been widely implemented in this population.
Milwaukee County Behavioral Health Services (BHS), a publicly funded, county-based behavioral health care system in Milwaukee, Wisconsin, provides inpatient and ambulatory treatment, psychiatric emergency care, withdrawal management, care management, crisis services, and other support services to individuals in Milwaukee County. In 2018 the community services arm of BHS began implementing a single QOL question from the World Health Organization’s WHOQOL-BREF26: On a 5-point rating scale of “Very Poor” to “Very Good,” “How would you rate your overall quality of life right now?” Previous research by Atroszko and colleagues,20 which used a similar approach with the same item from the WHOQOL-BREF, reported correlations in the expected direction of the single-item QOL measure with perceived stress, depression, anxiety, loneliness, and daily hours of sleep. This study’s sample, however, comprised opportunistically recruited college students, not a clinical population. Further, the researchers did not examine the relationship of QOL with acute service utilization or other measures of the social determinants of health, such as housing, employment, or social connectedness.
The following study was designed to extend these results by focusing on a clinical population—individuals with mental health or substance use issues—being served in a large, publicly funded behavioral health system in Milwaukee, Wisconsin. The objective of this study was to determine whether a single-item QOL measure could be used as a brief, parsimonious measure of overall population health by examining its relationship with other key outcome measures for patients receiving services from BHS. This study was reviewed and approved by BHS’s Institutional Review Board.
Methods
All patients engaged in nonacute community services are offered a standardized assessment that includes, among other measures, items related to QOL, housing status, employment status, self-rated physical health, and social connectedness. This assessment is administered at intake, discharge, and every 6 months while patients are enrolled in services. Patients who received at least 1 assessment between October 1, 2020, and September 30, 2021, were included in the analyses. Patients receiving crisis, inpatient, or withdrawal management services alone (ie, did not receive any other community-based services) were not offered the standard assessment and thus were not included in the analyses. If patients had more than 1 assessment during this time period, QOL data from the last assessment were used. Data on housing (private residence status, defined as adults living alone or with others without supervision in a house or apartment), employment status, self-rated physical health, and social connectedness (measured by asking people whether they have had positive interactions with family or friends in the past 30 days) were extracted from the same timepoint as well.
Also included in the analyses were rates of acute service utilization, in which any patient with at least 1 visit to BHS’s psychiatric emergency department, withdrawal management facility, or psychiatric inpatient facility in the 90 days prior to the date of the assessment received a code of “Yes,” and any patient who did not receive any of these services received a code of “No.” Chi-square analyses were conducted to determine the relationship between QOL rankings (“Very Poor,” “Poor,” “Neither Good nor Poor,” “Good,” and “Very Good”) and housing, employment, self-rated physical health, social connectedness, and 90-day acute service use. All acute service utilization data were obtained from BHS’s electronic health records system. All data used in the study were stored on a secure, password-protected server. All analyses were conducted with SPSS software (SPSS 28; IBM).
Results
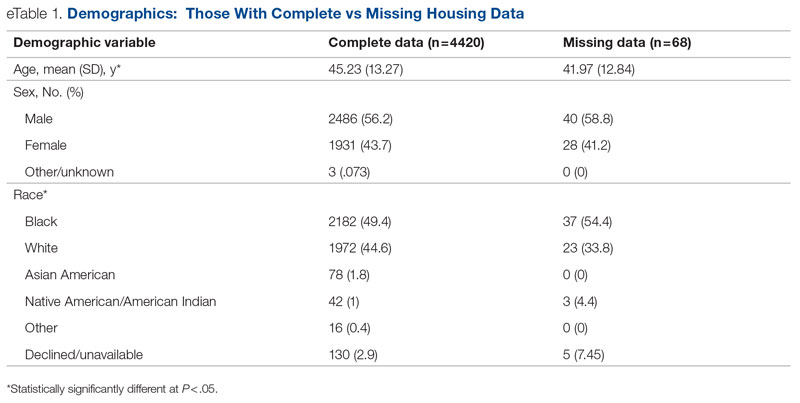
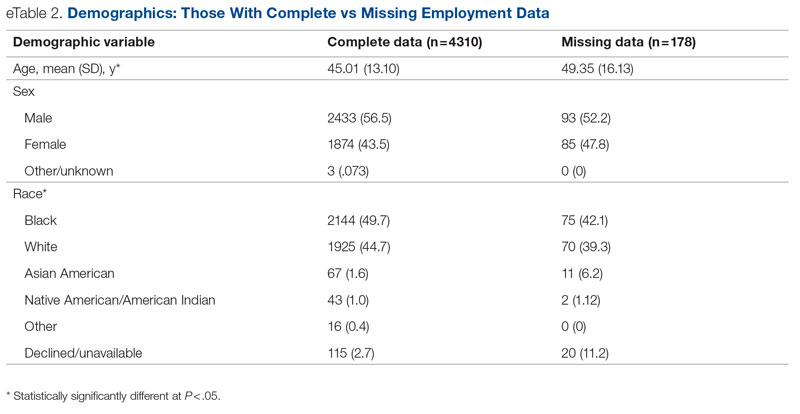
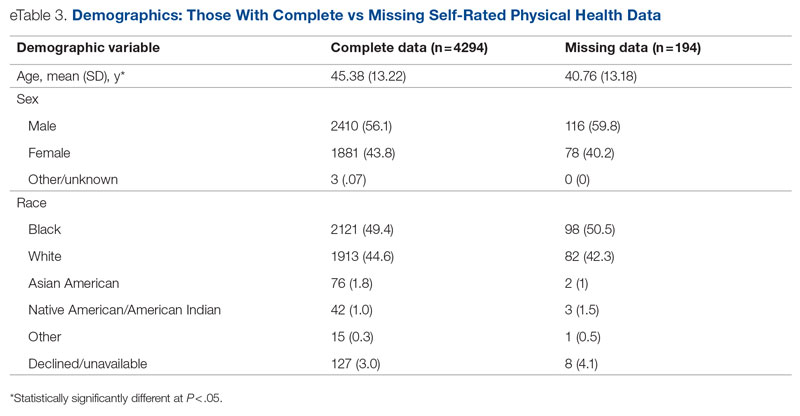
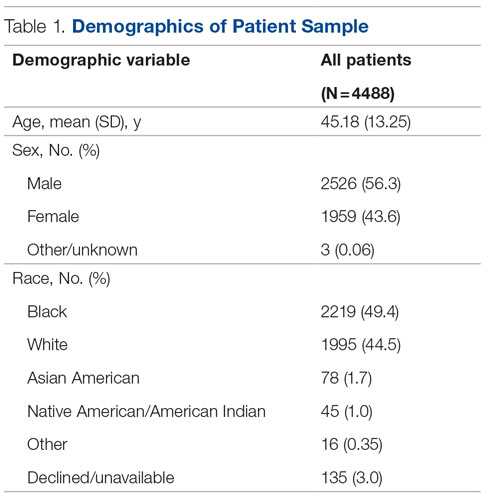
Data were available for 4488 patients who received an assessment between October 1, 2020, and September 30, 2021 (total numbers per item vary because some items had missing data; see supplementary eTables 1-3 for sample size per item). Demographics of the patient sample are listed in Table 1; the demographics of the patients who were missing data for specific outcomes are presented in eTables 1-3.
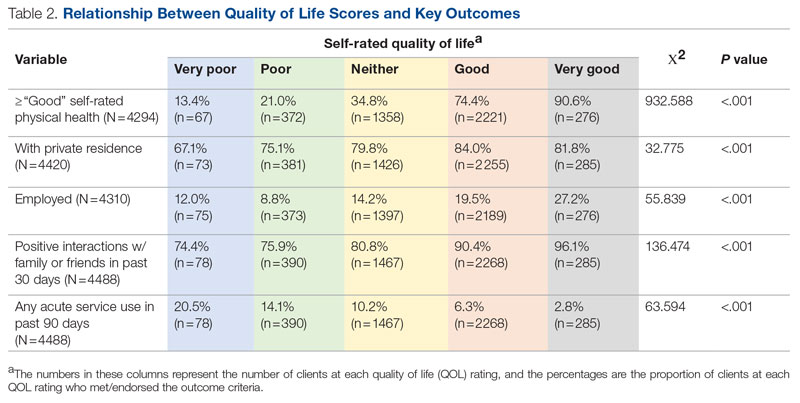
Statistical analyses revealed results in the expected direction for all relationships tested (Table 2). As patients’ self-reported QOL improved, so did the likelihood of higher rates of self-reported “Good” or better physical health, which was 576% higher among individuals who reported “Very Good” QOL relative to those who reported “Very Poor” QOL. Similarly, when compared with individuals with “Very Poor” QOL, individuals who reported “Very Good” QOL were 21.91% more likely to report having a private residence, 126.7% more likely to report being employed, and 29.17% more likely to report having had positive social interactions with family and friends in the past 30 days. There was an inverse relationship between QOL and the likelihood that a patient had received at least 1 admission for an acute service in the previous 90 days, such that patients who reported “Very Good” QOL were 86.34% less likely to have had an admission compared to patients with “Very Poor” QOL (2.8% vs 20.5%, respectively). The relationships among the criterion variables used in this study are presented in Table 3.
Discussion
The results of this preliminary analysis suggest that self-rated QOL is related to key health, social determinants of health, and acute service utilization metrics. These data are important for several reasons. First, because QOL is a diagnostically agnostic measure, it is a cross-cutting measure to use with clinically diverse populations receiving an array of different services. Second, at 1 item, the QOL measure is extremely brief and therefore minimally onerous to implement for both patients and administratively overburdened providers. Third, its correlation with other key metrics suggests that it can function as a broad population health measure for health care organizations because individuals with higher QOL will also likely have better outcomes in other key areas. This suggests that it has the potential to broadly represent the overall status of a population of patients, thus functioning as a type of “whole system” measure, which the Institute for Healthcare Improvement describes as “a small set of measures that reflect a health system’s overall performance on core dimensions of quality guided by the Triple Aim.”7 These whole system measures can help focus an organization’s strategic initiatives and efforts on the issues that matter most to the patients and community it serves.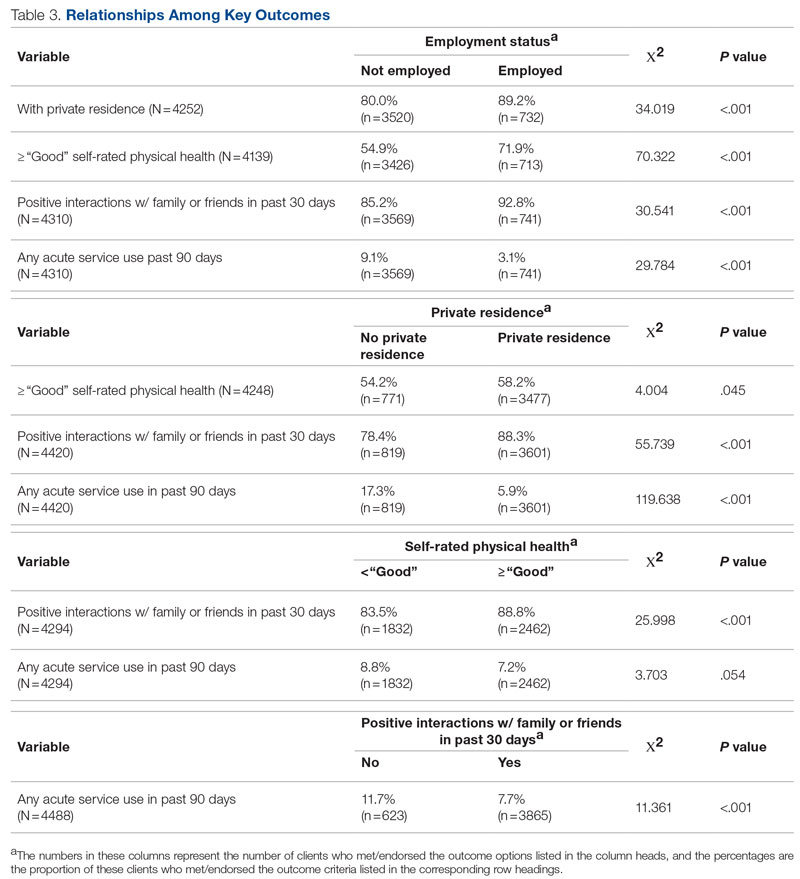
The relationship of QOL to acute service utilization deserves special mention. As an administrative measure, utilization is not susceptible to the same response bias as the other self-reported variables. Furthermore, acute services are costly to health systems, and hospital readmissions are associated with payment reductions in the Centers for Medicare and Medicaid Services (CMS) Hospital Readmissions Reduction Program for hospitals that fail to meet certain performance targets.27 Thus, because of its alignment with federal mandates, improved QOL (and potentially concomitant decreases in acute service use) may have significant financial implications for health systems as well.
This study was limited by several factors. First, it was focused on a population receiving publicly funded behavioral health services with strict eligibility requirements, one of which stipulated that individuals must be at 200% or less of the Federal Poverty Level; therefore, the results might not be applicable to health systems with a more clinically or socioeconomically diverse patient population. Second, because these data are cross-sectional, it was not possible to determine whether QOL improved over time or whether changes in QOL covaried longitudinally with the other metrics under observation. For example, if patients’ QOL improved from the first to last assessment, did their employment or residential status improve as well, or were these patients more likely to be employed at their first assessment? Furthermore, if there was covariance, did changes in employment, housing status, and so on precede changes in QOL or vice versa? Multiple longitudinal observations would help to address these questions and will be the focus of future analyses.
Conclusion
This preliminary study suggests that a single-item QOL measure may be a valuable population health–level metric for health systems. It requires little administrative effort on the part of either the clinician or patient. It is also agnostic with regard to clinical issue or treatment approach and can therefore admit of a range of diagnoses or patient-specific, idiosyncratic recovery goals. It is correlated with other key health, social determinants of health, and acute service utilization indicators and can therefore serve as a “whole system” measure because of its ability to broadly represent improvements in an entire population. Furthermore, QOL is patient-centered in that data are obtained through patient self-report, which is a high priority for CMS and other health care organizations.28 In summary, a single-item QOL measure holds promise for health care organizations looking to implement the Quadruple Aim and assess the health of the populations they serve in a manner that is simple, efficient, and patient-centered.
Acknowledgments: The author thanks Jennifer Wittwer for her thoughtful comments on the initial draft of this manuscript and Gary Kraft for his help extracting the data used in the analyses.
Corresponding author: Walter Matthew Drymalski, PhD; [email protected]
Disclosures: None reported.
1. Berwick DM, Nolan TW, Whittington J. The triple aim: care, health, and cost. Health Aff (Millwood). 2008;27(3):759-769. doi:10.1377/hlthaff.27.3.759
2. Bodenheimer T, Sinsky C. From triple to quadruple aim: care of the patient requires care of the provider. Ann Fam Med. 2014;12(6):573-576. doi:10.1370/afm.1713
3. Hendrikx RJP, Drewes HW, Spreeuwenberg M, et al. Which triple aim related measures are being used to evaluate population management initiatives? An international comparative analysis. Health Policy. 2016;120(5):471-485. doi:10.1016/j.healthpol.2016.03.008
4. Whittington JW, Nolan K, Lewis N, Torres T. Pursuing the triple aim: the first 7 years. Milbank Q. 2015;93(2):263-300. doi:10.1111/1468-0009.12122
5. Ryan BL, Brown JB, Glazier RH, Hutchison B. Examining primary healthcare performance through a triple aim lens. Healthc Policy. 2016;11(3):19-31.
6. Stiefel M, Nolan K. A guide to measuring the Triple Aim: population health, experience of care, and per capita cost. Institute for Healthcare Improvement; 2012. Accessed November 1, 2022. https://nhchc.org/wp-content/uploads/2019/08/ihiguidetomeasuringtripleaimwhitepaper2012.pdf
7. Martin L, Nelson E, Rakover J, Chase A. Whole system measures 2.0: a compass for health system leaders. Institute for Healthcare Improvement; 2016. Accessed November 1, 2022. http://www.ihi.org:80/resources/Pages/IHIWhitePapers/Whole-System-Measures-Compass-for-Health-System-Leaders.aspx
8. Casalino LP, Gans D, Weber R, et al. US physician practices spend more than $15.4 billion annually to report quality measures. Health Aff (Millwood). 2016;35(3):401-406. doi:10.1377/hlthaff.2015.1258
9. Rao SK, Kimball AB, Lehrhoff SR, et al. The impact of administrative burden on academic physicians: results of a hospital-wide physician survey. Acad Med. 2017;92(2):237-243. doi:10.1097/ACM.0000000000001461
10. Woolhandler S, Himmelstein DU. Administrative work consumes one-sixth of U.S. physicians’ working hours and lowers their career satisfaction. Int J Health Serv. 2014;44(4):635-642. doi:10.2190/HS.44.4.a
11. Meyer GS, Nelson EC, Pryor DB, et al. More quality measures versus measuring what matters: a call for balance and parsimony. BMJ Qual Saf. 2012;21(11):964-968. doi:10.1136/bmjqs-2012-001081
12. Vital Signs: Core Metrics for Health and Health Care Progress. Washington, DC: National Academies Press; 2015. doi:10.17226/19402
13. Centers for Disease Control and Prevention. BRFSS questionnaires. Accessed November 1, 2022. https://www.cdc.gov/brfss/questionnaires/index.htm
14. County Health Rankings and Roadmaps. Measures & data sources. University of Wisconsin Population Health Institute. Accessed November 1, 2022. https://www.countyhealthrankings.org/explore-health-rankings/measures-data-sources
15. Centers for Disease Control and Prevention. Healthy days core module (CDC HRQOL-4). Accessed November 1, 2022. https://www.cdc.gov/hrqol/hrqol14_measure.htm
16. Cordier T, Song Y, Cambon J, et al. A bold goal: more healthy days through improved community health. Popul Health Manag. 2018;21(3):202-208. doi:10.1089/pop.2017.0142
17. Slabaugh SL, Shah M, Zack M, et al. Leveraging health-related quality of life in population health management: the case for healthy days. Popul Health Manag. 2017;20(1):13-22. doi:10.1089/pop.2015.0162
18. Karimi M, Brazier J. Health, health-related quality of life, and quality of life: what is the difference? Pharmacoeconomics. 2016;34(7):645-649. doi:10.1007/s40273-016-0389-9
19. Smith KW, Avis NE, Assmann SF. Distinguishing between quality of life and health status in quality of life research: a meta-analysis. Qual Life Res. 1999;8(5):447-459. doi:10.1023/a:1008928518577
20. Atroszko PA, Baginska P, Mokosinska M, et al. Validity and reliability of single-item self-report measures of general quality of life, general health and sleep quality. In: CER Comparative European Research 2015. Sciemcee Publishing; 2015:207-211.
21. Singh JA, Satele D, Pattabasavaiah S, et al. Normative data and clinically significant effect sizes for single-item numerical linear analogue self-assessment (LASA) scales. Health Qual Life Outcomes. 2014;12:187. doi:10.1186/s12955-014-0187-z
22. Siebens HC, Tsukerman D, Adkins RH, et al. Correlates of a single-item quality-of-life measure in people aging with disabilities. Am J Phys Med Rehabil. 2015;94(12):1065-1074. doi:10.1097/PHM.0000000000000298
23. Yohannes AM, Dodd M, Morris J, Webb K. Reliability and validity of a single item measure of quality of life scale for adult patients with cystic fibrosis. Health Qual Life Outcomes. 2011;9:105. doi:10.1186/1477-7525-9-105
24. Conway L, Widjaja E, Smith ML. Single-item measure for assessing quality of life in children with drug-resistant epilepsy. Epilepsia Open. 2017;3(1):46-54. doi:10.1002/epi4.12088
25. Barry MM, Zissi A. Quality of life as an outcome measure in evaluating mental health services: a review of the empirical evidence. Soc Psychiatry Psychiatr Epidemiol. 1997;32(1):38-47. doi:10.1007/BF00800666
26. Skevington SM, Lotfy M, O’Connell KA. The World Health Organization’s WHOQOL-BREF quality of life assessment: psychometric properties and results of the international field trial. Qual Life Res. 2004;13(2):299-310. doi:10.1023/B:QURE.0000018486.91360.00
27. Centers for Medicare & Medicaid Services. Hospital readmissions reduction program (HRRP). Accessed November 1, 2022. https://www.cms.gov/Medicare/Medicare-Fee-for-Service-Payment/AcuteInpatientPPS/Readmissions-Reduction-Program
28. Centers for Medicare & Medicaid Services. Patient-reported outcome measures. CMS Measures Management System. Published May 2022. Accessed November 1, 2022. https://www.cms.gov/files/document/blueprint-patient-reported-outcome-measures.pdf
From Milwaukee County Behavioral Health Services, Milwaukee, WI.
Abstract
Objectives: The goal of this study was to determine whether a single-item quality of life (QOL) measure could serve as a useful population health–level metric within the Quadruple Aim framework in a publicly funded behavioral health system.
Design: This was a retrospective, cross-sectional study that examined the correlation between the single-item QOL measure and several other key measures of the social determinants of health and a composite measure of acute service utilization for all patients receiving mental health and substance use services in a community behavioral health system.
Methods: Data were collected for 4488 patients who had at least 1 assessment between October 1, 2020, and September 30, 2021. Data on social determinants of health were obtained through patient self-report; acute service use data were obtained from electronic health records.
Results: Statistical analyses revealed results in the expected direction for all relationships tested. Patients with higher QOL were more likely to report “Good” or better self-rated physical health, be employed, have a private residence, and report recent positive social interactions, and were less likely to have received acute services in the previous 90 days.
Conclusion: A single-item QOL measure shows promise as a general, minimally burdensome whole-system metric that can function as a target for population health management efforts in a large behavioral health system. Future research should explore whether this QOL measure is sensitive to change over time and examine its temporal relationship with other key outcome metrics.
Keywords: Quadruple Aim, single-item measures, social determinants of health, acute service utilization metrics.
The Triple Aim for health care—improving the individual experience of care, increasing the health of populations, and reducing the costs of care—was first proposed in 2008.1 More recently, some have advocated for an expanded focus to include a fourth aim: the quality of staff work life.2 Since this seminal paper was published, many health care systems have endeavored to adopt and implement the Quadruple Aim3,4; however, the concepts representing each of the aims are not universally defined,3 nor are the measures needed to populate the Quadruple Aim always available within the health system in question.5
Although several assessment models and frameworks that provide guidance to stakeholders have been developed,6,7 it is ultimately up to organizations themselves to determine which measures they should deploy to best represent the different quadrants of the Quadruple Aim.6 Evidence suggests, however, that quality measurement, and the administrative time required to conduct it, can be both financially and emotionally burdensome to providers and health systems.8-10 Thus, it is incumbent on organizations to select a set of measures that are not only meaningful but as parsimonious as possible.6,11,12
Quality of life (QOL) is a potential candidate to assess the aim of population health. Brief health-related QOL questions have long been used in epidemiological surveys, such as the Behavioral Risk Factor Surveillance System survey.13 Such questions are also a key component of community health frameworks, such as the County Health Rankings developed by the University of Wisconsin Population Health Institute.14 Furthermore, Humana recently revealed that increasing the number of physical and mental health “Healthy Days” (which are among the Centers for Disease Control and Prevention’s Health-Related Quality of Life questions15) among the members enrolled in their insurance plan would become a major goal for the organization.16,17 Many of these measures, while brief, focus on QOL as a function of health, often as a self-rated construct (from “Poor” to “Excellent”) or in the form of days of poor physical or mental health in the past 30 days,15 rather than evaluating QOL itself; however, several authors have pointed out that health status and QOL are related but distinct concepts.18,19
Brief single-item assessments focused specifically on QOL have been developed and implemented within nonclinical20 and clinical populations, including individuals with cancer,21 adults with disabilities,22 individuals with cystic fibrosis,23 and children with epilepsy.24 Despite the long history of QOL assessment in behavioral health treatment,25 single-item measures have not been widely implemented in this population.
Milwaukee County Behavioral Health Services (BHS), a publicly funded, county-based behavioral health care system in Milwaukee, Wisconsin, provides inpatient and ambulatory treatment, psychiatric emergency care, withdrawal management, care management, crisis services, and other support services to individuals in Milwaukee County. In 2018 the community services arm of BHS began implementing a single QOL question from the World Health Organization’s WHOQOL-BREF26: On a 5-point rating scale of “Very Poor” to “Very Good,” “How would you rate your overall quality of life right now?” Previous research by Atroszko and colleagues,20 which used a similar approach with the same item from the WHOQOL-BREF, reported correlations in the expected direction of the single-item QOL measure with perceived stress, depression, anxiety, loneliness, and daily hours of sleep. This study’s sample, however, comprised opportunistically recruited college students, not a clinical population. Further, the researchers did not examine the relationship of QOL with acute service utilization or other measures of the social determinants of health, such as housing, employment, or social connectedness.
The following study was designed to extend these results by focusing on a clinical population—individuals with mental health or substance use issues—being served in a large, publicly funded behavioral health system in Milwaukee, Wisconsin. The objective of this study was to determine whether a single-item QOL measure could be used as a brief, parsimonious measure of overall population health by examining its relationship with other key outcome measures for patients receiving services from BHS. This study was reviewed and approved by BHS’s Institutional Review Board.
Methods
All patients engaged in nonacute community services are offered a standardized assessment that includes, among other measures, items related to QOL, housing status, employment status, self-rated physical health, and social connectedness. This assessment is administered at intake, discharge, and every 6 months while patients are enrolled in services. Patients who received at least 1 assessment between October 1, 2020, and September 30, 2021, were included in the analyses. Patients receiving crisis, inpatient, or withdrawal management services alone (ie, did not receive any other community-based services) were not offered the standard assessment and thus were not included in the analyses. If patients had more than 1 assessment during this time period, QOL data from the last assessment were used. Data on housing (private residence status, defined as adults living alone or with others without supervision in a house or apartment), employment status, self-rated physical health, and social connectedness (measured by asking people whether they have had positive interactions with family or friends in the past 30 days) were extracted from the same timepoint as well.
Also included in the analyses were rates of acute service utilization, in which any patient with at least 1 visit to BHS’s psychiatric emergency department, withdrawal management facility, or psychiatric inpatient facility in the 90 days prior to the date of the assessment received a code of “Yes,” and any patient who did not receive any of these services received a code of “No.” Chi-square analyses were conducted to determine the relationship between QOL rankings (“Very Poor,” “Poor,” “Neither Good nor Poor,” “Good,” and “Very Good”) and housing, employment, self-rated physical health, social connectedness, and 90-day acute service use. All acute service utilization data were obtained from BHS’s electronic health records system. All data used in the study were stored on a secure, password-protected server. All analyses were conducted with SPSS software (SPSS 28; IBM).
Results
Data were available for 4488 patients who received an assessment between October 1, 2020, and September 30, 2021 (total numbers per item vary because some items had missing data; see supplementary eTables 1-3 for sample size per item). Demographics of the patient sample are listed in Table 1; the demographics of the patients who were missing data for specific outcomes are presented in eTables 1-3.
Statistical analyses revealed results in the expected direction for all relationships tested (Table 2). As patients’ self-reported QOL improved, so did the likelihood of higher rates of self-reported “Good” or better physical health, which was 576% higher among individuals who reported “Very Good” QOL relative to those who reported “Very Poor” QOL. Similarly, when compared with individuals with “Very Poor” QOL, individuals who reported “Very Good” QOL were 21.91% more likely to report having a private residence, 126.7% more likely to report being employed, and 29.17% more likely to report having had positive social interactions with family and friends in the past 30 days. There was an inverse relationship between QOL and the likelihood that a patient had received at least 1 admission for an acute service in the previous 90 days, such that patients who reported “Very Good” QOL were 86.34% less likely to have had an admission compared to patients with “Very Poor” QOL (2.8% vs 20.5%, respectively). The relationships among the criterion variables used in this study are presented in Table 3.
Discussion
The results of this preliminary analysis suggest that self-rated QOL is related to key health, social determinants of health, and acute service utilization metrics. These data are important for several reasons. First, because QOL is a diagnostically agnostic measure, it is a cross-cutting measure to use with clinically diverse populations receiving an array of different services. Second, at 1 item, the QOL measure is extremely brief and therefore minimally onerous to implement for both patients and administratively overburdened providers. Third, its correlation with other key metrics suggests that it can function as a broad population health measure for health care organizations because individuals with higher QOL will also likely have better outcomes in other key areas. This suggests that it has the potential to broadly represent the overall status of a population of patients, thus functioning as a type of “whole system” measure, which the Institute for Healthcare Improvement describes as “a small set of measures that reflect a health system’s overall performance on core dimensions of quality guided by the Triple Aim.”7 These whole system measures can help focus an organization’s strategic initiatives and efforts on the issues that matter most to the patients and community it serves.
The relationship of QOL to acute service utilization deserves special mention. As an administrative measure, utilization is not susceptible to the same response bias as the other self-reported variables. Furthermore, acute services are costly to health systems, and hospital readmissions are associated with payment reductions in the Centers for Medicare and Medicaid Services (CMS) Hospital Readmissions Reduction Program for hospitals that fail to meet certain performance targets.27 Thus, because of its alignment with federal mandates, improved QOL (and potentially concomitant decreases in acute service use) may have significant financial implications for health systems as well.
This study was limited by several factors. First, it was focused on a population receiving publicly funded behavioral health services with strict eligibility requirements, one of which stipulated that individuals must be at 200% or less of the Federal Poverty Level; therefore, the results might not be applicable to health systems with a more clinically or socioeconomically diverse patient population. Second, because these data are cross-sectional, it was not possible to determine whether QOL improved over time or whether changes in QOL covaried longitudinally with the other metrics under observation. For example, if patients’ QOL improved from the first to last assessment, did their employment or residential status improve as well, or were these patients more likely to be employed at their first assessment? Furthermore, if there was covariance, did changes in employment, housing status, and so on precede changes in QOL or vice versa? Multiple longitudinal observations would help to address these questions and will be the focus of future analyses.
Conclusion
This preliminary study suggests that a single-item QOL measure may be a valuable population health–level metric for health systems. It requires little administrative effort on the part of either the clinician or patient. It is also agnostic with regard to clinical issue or treatment approach and can therefore admit of a range of diagnoses or patient-specific, idiosyncratic recovery goals. It is correlated with other key health, social determinants of health, and acute service utilization indicators and can therefore serve as a “whole system” measure because of its ability to broadly represent improvements in an entire population. Furthermore, QOL is patient-centered in that data are obtained through patient self-report, which is a high priority for CMS and other health care organizations.28 In summary, a single-item QOL measure holds promise for health care organizations looking to implement the Quadruple Aim and assess the health of the populations they serve in a manner that is simple, efficient, and patient-centered.
Acknowledgments: The author thanks Jennifer Wittwer for her thoughtful comments on the initial draft of this manuscript and Gary Kraft for his help extracting the data used in the analyses.
Corresponding author: Walter Matthew Drymalski, PhD; [email protected]
Disclosures: None reported.
From Milwaukee County Behavioral Health Services, Milwaukee, WI.
Abstract
Objectives: The goal of this study was to determine whether a single-item quality of life (QOL) measure could serve as a useful population health–level metric within the Quadruple Aim framework in a publicly funded behavioral health system.
Design: This was a retrospective, cross-sectional study that examined the correlation between the single-item QOL measure and several other key measures of the social determinants of health and a composite measure of acute service utilization for all patients receiving mental health and substance use services in a community behavioral health system.
Methods: Data were collected for 4488 patients who had at least 1 assessment between October 1, 2020, and September 30, 2021. Data on social determinants of health were obtained through patient self-report; acute service use data were obtained from electronic health records.
Results: Statistical analyses revealed results in the expected direction for all relationships tested. Patients with higher QOL were more likely to report “Good” or better self-rated physical health, be employed, have a private residence, and report recent positive social interactions, and were less likely to have received acute services in the previous 90 days.
Conclusion: A single-item QOL measure shows promise as a general, minimally burdensome whole-system metric that can function as a target for population health management efforts in a large behavioral health system. Future research should explore whether this QOL measure is sensitive to change over time and examine its temporal relationship with other key outcome metrics.
Keywords: Quadruple Aim, single-item measures, social determinants of health, acute service utilization metrics.
The Triple Aim for health care—improving the individual experience of care, increasing the health of populations, and reducing the costs of care—was first proposed in 2008.1 More recently, some have advocated for an expanded focus to include a fourth aim: the quality of staff work life.2 Since this seminal paper was published, many health care systems have endeavored to adopt and implement the Quadruple Aim3,4; however, the concepts representing each of the aims are not universally defined,3 nor are the measures needed to populate the Quadruple Aim always available within the health system in question.5
Although several assessment models and frameworks that provide guidance to stakeholders have been developed,6,7 it is ultimately up to organizations themselves to determine which measures they should deploy to best represent the different quadrants of the Quadruple Aim.6 Evidence suggests, however, that quality measurement, and the administrative time required to conduct it, can be both financially and emotionally burdensome to providers and health systems.8-10 Thus, it is incumbent on organizations to select a set of measures that are not only meaningful but as parsimonious as possible.6,11,12
Quality of life (QOL) is a potential candidate to assess the aim of population health. Brief health-related QOL questions have long been used in epidemiological surveys, such as the Behavioral Risk Factor Surveillance System survey.13 Such questions are also a key component of community health frameworks, such as the County Health Rankings developed by the University of Wisconsin Population Health Institute.14 Furthermore, Humana recently revealed that increasing the number of physical and mental health “Healthy Days” (which are among the Centers for Disease Control and Prevention’s Health-Related Quality of Life questions15) among the members enrolled in their insurance plan would become a major goal for the organization.16,17 Many of these measures, while brief, focus on QOL as a function of health, often as a self-rated construct (from “Poor” to “Excellent”) or in the form of days of poor physical or mental health in the past 30 days,15 rather than evaluating QOL itself; however, several authors have pointed out that health status and QOL are related but distinct concepts.18,19
Brief single-item assessments focused specifically on QOL have been developed and implemented within nonclinical20 and clinical populations, including individuals with cancer,21 adults with disabilities,22 individuals with cystic fibrosis,23 and children with epilepsy.24 Despite the long history of QOL assessment in behavioral health treatment,25 single-item measures have not been widely implemented in this population.
Milwaukee County Behavioral Health Services (BHS), a publicly funded, county-based behavioral health care system in Milwaukee, Wisconsin, provides inpatient and ambulatory treatment, psychiatric emergency care, withdrawal management, care management, crisis services, and other support services to individuals in Milwaukee County. In 2018 the community services arm of BHS began implementing a single QOL question from the World Health Organization’s WHOQOL-BREF26: On a 5-point rating scale of “Very Poor” to “Very Good,” “How would you rate your overall quality of life right now?” Previous research by Atroszko and colleagues,20 which used a similar approach with the same item from the WHOQOL-BREF, reported correlations in the expected direction of the single-item QOL measure with perceived stress, depression, anxiety, loneliness, and daily hours of sleep. This study’s sample, however, comprised opportunistically recruited college students, not a clinical population. Further, the researchers did not examine the relationship of QOL with acute service utilization or other measures of the social determinants of health, such as housing, employment, or social connectedness.
The following study was designed to extend these results by focusing on a clinical population—individuals with mental health or substance use issues—being served in a large, publicly funded behavioral health system in Milwaukee, Wisconsin. The objective of this study was to determine whether a single-item QOL measure could be used as a brief, parsimonious measure of overall population health by examining its relationship with other key outcome measures for patients receiving services from BHS. This study was reviewed and approved by BHS’s Institutional Review Board.
Methods
All patients engaged in nonacute community services are offered a standardized assessment that includes, among other measures, items related to QOL, housing status, employment status, self-rated physical health, and social connectedness. This assessment is administered at intake, discharge, and every 6 months while patients are enrolled in services. Patients who received at least 1 assessment between October 1, 2020, and September 30, 2021, were included in the analyses. Patients receiving crisis, inpatient, or withdrawal management services alone (ie, did not receive any other community-based services) were not offered the standard assessment and thus were not included in the analyses. If patients had more than 1 assessment during this time period, QOL data from the last assessment were used. Data on housing (private residence status, defined as adults living alone or with others without supervision in a house or apartment), employment status, self-rated physical health, and social connectedness (measured by asking people whether they have had positive interactions with family or friends in the past 30 days) were extracted from the same timepoint as well.
Also included in the analyses were rates of acute service utilization, in which any patient with at least 1 visit to BHS’s psychiatric emergency department, withdrawal management facility, or psychiatric inpatient facility in the 90 days prior to the date of the assessment received a code of “Yes,” and any patient who did not receive any of these services received a code of “No.” Chi-square analyses were conducted to determine the relationship between QOL rankings (“Very Poor,” “Poor,” “Neither Good nor Poor,” “Good,” and “Very Good”) and housing, employment, self-rated physical health, social connectedness, and 90-day acute service use. All acute service utilization data were obtained from BHS’s electronic health records system. All data used in the study were stored on a secure, password-protected server. All analyses were conducted with SPSS software (SPSS 28; IBM).
Results
Data were available for 4488 patients who received an assessment between October 1, 2020, and September 30, 2021 (total numbers per item vary because some items had missing data; see supplementary eTables 1-3 for sample size per item). Demographics of the patient sample are listed in Table 1; the demographics of the patients who were missing data for specific outcomes are presented in eTables 1-3.
Statistical analyses revealed results in the expected direction for all relationships tested (Table 2). As patients’ self-reported QOL improved, so did the likelihood of higher rates of self-reported “Good” or better physical health, which was 576% higher among individuals who reported “Very Good” QOL relative to those who reported “Very Poor” QOL. Similarly, when compared with individuals with “Very Poor” QOL, individuals who reported “Very Good” QOL were 21.91% more likely to report having a private residence, 126.7% more likely to report being employed, and 29.17% more likely to report having had positive social interactions with family and friends in the past 30 days. There was an inverse relationship between QOL and the likelihood that a patient had received at least 1 admission for an acute service in the previous 90 days, such that patients who reported “Very Good” QOL were 86.34% less likely to have had an admission compared to patients with “Very Poor” QOL (2.8% vs 20.5%, respectively). The relationships among the criterion variables used in this study are presented in Table 3.
Discussion
The results of this preliminary analysis suggest that self-rated QOL is related to key health, social determinants of health, and acute service utilization metrics. These data are important for several reasons. First, because QOL is a diagnostically agnostic measure, it is a cross-cutting measure to use with clinically diverse populations receiving an array of different services. Second, at 1 item, the QOL measure is extremely brief and therefore minimally onerous to implement for both patients and administratively overburdened providers. Third, its correlation with other key metrics suggests that it can function as a broad population health measure for health care organizations because individuals with higher QOL will also likely have better outcomes in other key areas. This suggests that it has the potential to broadly represent the overall status of a population of patients, thus functioning as a type of “whole system” measure, which the Institute for Healthcare Improvement describes as “a small set of measures that reflect a health system’s overall performance on core dimensions of quality guided by the Triple Aim.”7 These whole system measures can help focus an organization’s strategic initiatives and efforts on the issues that matter most to the patients and community it serves.
The relationship of QOL to acute service utilization deserves special mention. As an administrative measure, utilization is not susceptible to the same response bias as the other self-reported variables. Furthermore, acute services are costly to health systems, and hospital readmissions are associated with payment reductions in the Centers for Medicare and Medicaid Services (CMS) Hospital Readmissions Reduction Program for hospitals that fail to meet certain performance targets.27 Thus, because of its alignment with federal mandates, improved QOL (and potentially concomitant decreases in acute service use) may have significant financial implications for health systems as well.
This study was limited by several factors. First, it was focused on a population receiving publicly funded behavioral health services with strict eligibility requirements, one of which stipulated that individuals must be at 200% or less of the Federal Poverty Level; therefore, the results might not be applicable to health systems with a more clinically or socioeconomically diverse patient population. Second, because these data are cross-sectional, it was not possible to determine whether QOL improved over time or whether changes in QOL covaried longitudinally with the other metrics under observation. For example, if patients’ QOL improved from the first to last assessment, did their employment or residential status improve as well, or were these patients more likely to be employed at their first assessment? Furthermore, if there was covariance, did changes in employment, housing status, and so on precede changes in QOL or vice versa? Multiple longitudinal observations would help to address these questions and will be the focus of future analyses.
Conclusion
This preliminary study suggests that a single-item QOL measure may be a valuable population health–level metric for health systems. It requires little administrative effort on the part of either the clinician or patient. It is also agnostic with regard to clinical issue or treatment approach and can therefore admit of a range of diagnoses or patient-specific, idiosyncratic recovery goals. It is correlated with other key health, social determinants of health, and acute service utilization indicators and can therefore serve as a “whole system” measure because of its ability to broadly represent improvements in an entire population. Furthermore, QOL is patient-centered in that data are obtained through patient self-report, which is a high priority for CMS and other health care organizations.28 In summary, a single-item QOL measure holds promise for health care organizations looking to implement the Quadruple Aim and assess the health of the populations they serve in a manner that is simple, efficient, and patient-centered.
Acknowledgments: The author thanks Jennifer Wittwer for her thoughtful comments on the initial draft of this manuscript and Gary Kraft for his help extracting the data used in the analyses.
Corresponding author: Walter Matthew Drymalski, PhD; [email protected]
Disclosures: None reported.
1. Berwick DM, Nolan TW, Whittington J. The triple aim: care, health, and cost. Health Aff (Millwood). 2008;27(3):759-769. doi:10.1377/hlthaff.27.3.759
2. Bodenheimer T, Sinsky C. From triple to quadruple aim: care of the patient requires care of the provider. Ann Fam Med. 2014;12(6):573-576. doi:10.1370/afm.1713
3. Hendrikx RJP, Drewes HW, Spreeuwenberg M, et al. Which triple aim related measures are being used to evaluate population management initiatives? An international comparative analysis. Health Policy. 2016;120(5):471-485. doi:10.1016/j.healthpol.2016.03.008
4. Whittington JW, Nolan K, Lewis N, Torres T. Pursuing the triple aim: the first 7 years. Milbank Q. 2015;93(2):263-300. doi:10.1111/1468-0009.12122
5. Ryan BL, Brown JB, Glazier RH, Hutchison B. Examining primary healthcare performance through a triple aim lens. Healthc Policy. 2016;11(3):19-31.
6. Stiefel M, Nolan K. A guide to measuring the Triple Aim: population health, experience of care, and per capita cost. Institute for Healthcare Improvement; 2012. Accessed November 1, 2022. https://nhchc.org/wp-content/uploads/2019/08/ihiguidetomeasuringtripleaimwhitepaper2012.pdf
7. Martin L, Nelson E, Rakover J, Chase A. Whole system measures 2.0: a compass for health system leaders. Institute for Healthcare Improvement; 2016. Accessed November 1, 2022. http://www.ihi.org:80/resources/Pages/IHIWhitePapers/Whole-System-Measures-Compass-for-Health-System-Leaders.aspx
8. Casalino LP, Gans D, Weber R, et al. US physician practices spend more than $15.4 billion annually to report quality measures. Health Aff (Millwood). 2016;35(3):401-406. doi:10.1377/hlthaff.2015.1258
9. Rao SK, Kimball AB, Lehrhoff SR, et al. The impact of administrative burden on academic physicians: results of a hospital-wide physician survey. Acad Med. 2017;92(2):237-243. doi:10.1097/ACM.0000000000001461
10. Woolhandler S, Himmelstein DU. Administrative work consumes one-sixth of U.S. physicians’ working hours and lowers their career satisfaction. Int J Health Serv. 2014;44(4):635-642. doi:10.2190/HS.44.4.a
11. Meyer GS, Nelson EC, Pryor DB, et al. More quality measures versus measuring what matters: a call for balance and parsimony. BMJ Qual Saf. 2012;21(11):964-968. doi:10.1136/bmjqs-2012-001081
12. Vital Signs: Core Metrics for Health and Health Care Progress. Washington, DC: National Academies Press; 2015. doi:10.17226/19402
13. Centers for Disease Control and Prevention. BRFSS questionnaires. Accessed November 1, 2022. https://www.cdc.gov/brfss/questionnaires/index.htm
14. County Health Rankings and Roadmaps. Measures & data sources. University of Wisconsin Population Health Institute. Accessed November 1, 2022. https://www.countyhealthrankings.org/explore-health-rankings/measures-data-sources
15. Centers for Disease Control and Prevention. Healthy days core module (CDC HRQOL-4). Accessed November 1, 2022. https://www.cdc.gov/hrqol/hrqol14_measure.htm
16. Cordier T, Song Y, Cambon J, et al. A bold goal: more healthy days through improved community health. Popul Health Manag. 2018;21(3):202-208. doi:10.1089/pop.2017.0142
17. Slabaugh SL, Shah M, Zack M, et al. Leveraging health-related quality of life in population health management: the case for healthy days. Popul Health Manag. 2017;20(1):13-22. doi:10.1089/pop.2015.0162
18. Karimi M, Brazier J. Health, health-related quality of life, and quality of life: what is the difference? Pharmacoeconomics. 2016;34(7):645-649. doi:10.1007/s40273-016-0389-9
19. Smith KW, Avis NE, Assmann SF. Distinguishing between quality of life and health status in quality of life research: a meta-analysis. Qual Life Res. 1999;8(5):447-459. doi:10.1023/a:1008928518577
20. Atroszko PA, Baginska P, Mokosinska M, et al. Validity and reliability of single-item self-report measures of general quality of life, general health and sleep quality. In: CER Comparative European Research 2015. Sciemcee Publishing; 2015:207-211.
21. Singh JA, Satele D, Pattabasavaiah S, et al. Normative data and clinically significant effect sizes for single-item numerical linear analogue self-assessment (LASA) scales. Health Qual Life Outcomes. 2014;12:187. doi:10.1186/s12955-014-0187-z
22. Siebens HC, Tsukerman D, Adkins RH, et al. Correlates of a single-item quality-of-life measure in people aging with disabilities. Am J Phys Med Rehabil. 2015;94(12):1065-1074. doi:10.1097/PHM.0000000000000298
23. Yohannes AM, Dodd M, Morris J, Webb K. Reliability and validity of a single item measure of quality of life scale for adult patients with cystic fibrosis. Health Qual Life Outcomes. 2011;9:105. doi:10.1186/1477-7525-9-105
24. Conway L, Widjaja E, Smith ML. Single-item measure for assessing quality of life in children with drug-resistant epilepsy. Epilepsia Open. 2017;3(1):46-54. doi:10.1002/epi4.12088
25. Barry MM, Zissi A. Quality of life as an outcome measure in evaluating mental health services: a review of the empirical evidence. Soc Psychiatry Psychiatr Epidemiol. 1997;32(1):38-47. doi:10.1007/BF00800666
26. Skevington SM, Lotfy M, O’Connell KA. The World Health Organization’s WHOQOL-BREF quality of life assessment: psychometric properties and results of the international field trial. Qual Life Res. 2004;13(2):299-310. doi:10.1023/B:QURE.0000018486.91360.00
27. Centers for Medicare & Medicaid Services. Hospital readmissions reduction program (HRRP). Accessed November 1, 2022. https://www.cms.gov/Medicare/Medicare-Fee-for-Service-Payment/AcuteInpatientPPS/Readmissions-Reduction-Program
28. Centers for Medicare & Medicaid Services. Patient-reported outcome measures. CMS Measures Management System. Published May 2022. Accessed November 1, 2022. https://www.cms.gov/files/document/blueprint-patient-reported-outcome-measures.pdf
1. Berwick DM, Nolan TW, Whittington J. The triple aim: care, health, and cost. Health Aff (Millwood). 2008;27(3):759-769. doi:10.1377/hlthaff.27.3.759
2. Bodenheimer T, Sinsky C. From triple to quadruple aim: care of the patient requires care of the provider. Ann Fam Med. 2014;12(6):573-576. doi:10.1370/afm.1713
3. Hendrikx RJP, Drewes HW, Spreeuwenberg M, et al. Which triple aim related measures are being used to evaluate population management initiatives? An international comparative analysis. Health Policy. 2016;120(5):471-485. doi:10.1016/j.healthpol.2016.03.008
4. Whittington JW, Nolan K, Lewis N, Torres T. Pursuing the triple aim: the first 7 years. Milbank Q. 2015;93(2):263-300. doi:10.1111/1468-0009.12122
5. Ryan BL, Brown JB, Glazier RH, Hutchison B. Examining primary healthcare performance through a triple aim lens. Healthc Policy. 2016;11(3):19-31.
6. Stiefel M, Nolan K. A guide to measuring the Triple Aim: population health, experience of care, and per capita cost. Institute for Healthcare Improvement; 2012. Accessed November 1, 2022. https://nhchc.org/wp-content/uploads/2019/08/ihiguidetomeasuringtripleaimwhitepaper2012.pdf
7. Martin L, Nelson E, Rakover J, Chase A. Whole system measures 2.0: a compass for health system leaders. Institute for Healthcare Improvement; 2016. Accessed November 1, 2022. http://www.ihi.org:80/resources/Pages/IHIWhitePapers/Whole-System-Measures-Compass-for-Health-System-Leaders.aspx
8. Casalino LP, Gans D, Weber R, et al. US physician practices spend more than $15.4 billion annually to report quality measures. Health Aff (Millwood). 2016;35(3):401-406. doi:10.1377/hlthaff.2015.1258
9. Rao SK, Kimball AB, Lehrhoff SR, et al. The impact of administrative burden on academic physicians: results of a hospital-wide physician survey. Acad Med. 2017;92(2):237-243. doi:10.1097/ACM.0000000000001461
10. Woolhandler S, Himmelstein DU. Administrative work consumes one-sixth of U.S. physicians’ working hours and lowers their career satisfaction. Int J Health Serv. 2014;44(4):635-642. doi:10.2190/HS.44.4.a
11. Meyer GS, Nelson EC, Pryor DB, et al. More quality measures versus measuring what matters: a call for balance and parsimony. BMJ Qual Saf. 2012;21(11):964-968. doi:10.1136/bmjqs-2012-001081
12. Vital Signs: Core Metrics for Health and Health Care Progress. Washington, DC: National Academies Press; 2015. doi:10.17226/19402
13. Centers for Disease Control and Prevention. BRFSS questionnaires. Accessed November 1, 2022. https://www.cdc.gov/brfss/questionnaires/index.htm
14. County Health Rankings and Roadmaps. Measures & data sources. University of Wisconsin Population Health Institute. Accessed November 1, 2022. https://www.countyhealthrankings.org/explore-health-rankings/measures-data-sources
15. Centers for Disease Control and Prevention. Healthy days core module (CDC HRQOL-4). Accessed November 1, 2022. https://www.cdc.gov/hrqol/hrqol14_measure.htm
16. Cordier T, Song Y, Cambon J, et al. A bold goal: more healthy days through improved community health. Popul Health Manag. 2018;21(3):202-208. doi:10.1089/pop.2017.0142
17. Slabaugh SL, Shah M, Zack M, et al. Leveraging health-related quality of life in population health management: the case for healthy days. Popul Health Manag. 2017;20(1):13-22. doi:10.1089/pop.2015.0162
18. Karimi M, Brazier J. Health, health-related quality of life, and quality of life: what is the difference? Pharmacoeconomics. 2016;34(7):645-649. doi:10.1007/s40273-016-0389-9
19. Smith KW, Avis NE, Assmann SF. Distinguishing between quality of life and health status in quality of life research: a meta-analysis. Qual Life Res. 1999;8(5):447-459. doi:10.1023/a:1008928518577
20. Atroszko PA, Baginska P, Mokosinska M, et al. Validity and reliability of single-item self-report measures of general quality of life, general health and sleep quality. In: CER Comparative European Research 2015. Sciemcee Publishing; 2015:207-211.
21. Singh JA, Satele D, Pattabasavaiah S, et al. Normative data and clinically significant effect sizes for single-item numerical linear analogue self-assessment (LASA) scales. Health Qual Life Outcomes. 2014;12:187. doi:10.1186/s12955-014-0187-z
22. Siebens HC, Tsukerman D, Adkins RH, et al. Correlates of a single-item quality-of-life measure in people aging with disabilities. Am J Phys Med Rehabil. 2015;94(12):1065-1074. doi:10.1097/PHM.0000000000000298
23. Yohannes AM, Dodd M, Morris J, Webb K. Reliability and validity of a single item measure of quality of life scale for adult patients with cystic fibrosis. Health Qual Life Outcomes. 2011;9:105. doi:10.1186/1477-7525-9-105
24. Conway L, Widjaja E, Smith ML. Single-item measure for assessing quality of life in children with drug-resistant epilepsy. Epilepsia Open. 2017;3(1):46-54. doi:10.1002/epi4.12088
25. Barry MM, Zissi A. Quality of life as an outcome measure in evaluating mental health services: a review of the empirical evidence. Soc Psychiatry Psychiatr Epidemiol. 1997;32(1):38-47. doi:10.1007/BF00800666
26. Skevington SM, Lotfy M, O’Connell KA. The World Health Organization’s WHOQOL-BREF quality of life assessment: psychometric properties and results of the international field trial. Qual Life Res. 2004;13(2):299-310. doi:10.1023/B:QURE.0000018486.91360.00
27. Centers for Medicare & Medicaid Services. Hospital readmissions reduction program (HRRP). Accessed November 1, 2022. https://www.cms.gov/Medicare/Medicare-Fee-for-Service-Payment/AcuteInpatientPPS/Readmissions-Reduction-Program
28. Centers for Medicare & Medicaid Services. Patient-reported outcome measures. CMS Measures Management System. Published May 2022. Accessed November 1, 2022. https://www.cms.gov/files/document/blueprint-patient-reported-outcome-measures.pdf
Best Practice Implementation and Clinical Inertia
From the Department of Medicine, Brigham and Women’s Hospital, and Harvard Medical School, Boston, MA.
Clinical inertia is defined as the failure of clinicians to initiate or escalate guideline-directed medical therapy to achieve treatment goals for well-defined clinical conditions.1,2 Evidence-based guidelines recommend optimal disease management with readily available medical therapies throughout the phases of clinical care. Unfortunately, the care provided to individual patients undergoes multiple modifications throughout the disease course, resulting in divergent pathways, significant deviations from treatment guidelines, and failure of “safeguard” checkpoints to reinstate, initiate, optimize, or stop treatments. Clinical inertia generally describes rigidity or resistance to change around implementing evidence-based guidelines. Furthermore, this term describes treatment behavior on the part of an individual clinician, not organizational inertia, which generally encompasses both internal (immediate clinical practice settings) and external factors (national and international guidelines and recommendations), eventually leading to resistance to optimizing disease treatment and therapeutic regimens. Individual clinicians’ clinical inertia in the form of resistance to guideline implementation and evidence-based principles can be one factor that drives organizational inertia. In turn, such individual behavior can be dictated by personal beliefs, knowledge, interpretation, skills, management principles, and biases. The terms therapeutic inertia or clinical inertia should not be confused with nonadherence from the patient’s standpoint when the clinician follows the best practice guidelines.3
Clinical inertia has been described in several clinical domains, including diabetes,4,5 hypertension,6,7 heart failure,8 depression,9 pulmonary medicine,10 and complex disease management.11 Clinicians can set suboptimal treatment goals due to specific beliefs and attitudes around optimal therapeutic goals. For example, when treating a patient with a chronic disease that is presently stable, a clinician could elect to initiate suboptimal treatment, as escalation of treatment might not be the priority in stable disease; they also may have concerns about overtreatment. Other factors that can contribute to clinical inertia (ie, undertreatment in the presence of indications for treatment) include those related to the patient, the clinical setting, and the organization, along with the importance of individualizing therapies in specific patients. Organizational inertia is the initial global resistance by the system to implementation, which can slow the dissemination and adaptation of best practices but eventually declines over time. Individual clinical inertia, on the other hand, will likely persist after the system-level rollout of guideline-based approaches.
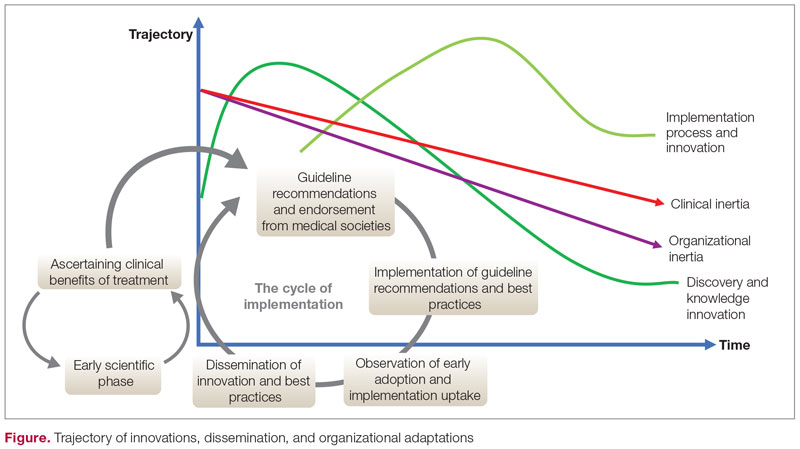
The trajectory of dissemination, implementation, and adaptation of innovations and best practices is illustrated in the Figure. When the guidelines and medical societies endorse the adaptation of innovations or practice change after the benefits of such innovations/change have been established by the regulatory bodies, uptake can be hindered by both organizational and clinical inertia. Overcoming inertia to system-level changes requires addressing individual clinicians, along with practice and organizational factors, in order to ensure systematic adaptations. From the clinicians’ view, training and cognitive interventions to improve the adaptation and coping skills can improve understanding of treatment options through standardized educational and behavioral modification tools, direct and indirect feedback around performance, and decision support through a continuous improvement approach on both individual and system levels.
Addressing inertia in clinical practice requires a deep understanding of the individual and organizational elements that foster resistance to adapting best practice models. Research that explores tools and approaches to overcome inertia in managing complex diseases is a key step in advancing clinical innovation and disseminating best practices.
Corresponding author: Ebrahim Barkoudah, MD, MPH; [email protected]
Disclosures: None reported.
1. Phillips LS, Branch WT, Cook CB, et al. Clinical inertia. Ann Intern Med. 2001;135(9):825-834. doi:10.7326/0003-4819-135-9-200111060-00012
2. Allen JD, Curtiss FR, Fairman KA. Nonadherence, clinical inertia, or therapeutic inertia? J Manag Care Pharm. 2009;15(8):690-695. doi:10.18553/jmcp.2009.15.8.690
3. Zafar A, Davies M, Azhar A, Khunti K. Clinical inertia in management of T2DM. Prim Care Diabetes. 2010;4(4):203-207. doi:10.1016/j.pcd.2010.07.003
4. Khunti K, Davies MJ. Clinical inertia—time to reappraise the terminology? Prim Care Diabetes. 2017;11(2):105-106. doi:10.1016/j.pcd.2017.01.007
5. O’Connor PJ. Overcome clinical inertia to control systolic blood pressure. Arch Intern Med. 2003;163(22):2677-2678. doi:10.1001/archinte.163.22.2677
6. Faria C, Wenzel M, Lee KW, et al. A narrative review of clinical inertia: focus on hypertension. J Am Soc Hypertens. 2009;3(4):267-276. doi:10.1016/j.jash.2009.03.001
7. Jarjour M, Henri C, de Denus S, et al. Care gaps in adherence to heart failure guidelines: clinical inertia or physiological limitations? JACC Heart Fail. 2020;8(9):725-738. doi:10.1016/j.jchf.2020.04.019
8. Henke RM, Zaslavsky AM, McGuire TG, et al. Clinical inertia in depression treatment. Med Care. 2009;47(9):959-67. doi:10.1097/MLR.0b013e31819a5da0
9. Cooke CE, Sidel M, Belletti DA, Fuhlbrigge AL. Clinical inertia in the management of chronic obstructive pulmonary disease. COPD. 2012;9(1):73-80. doi:10.3109/15412555.2011.631957
10. Whitford DL, Al-Anjawi HA, Al-Baharna MM. Impact of clinical inertia on cardiovascular risk factors in patients with diabetes. Prim Care Diabetes. 2014;8(2):133-138. doi:10.1016/j.pcd.2013.10.007
From the Department of Medicine, Brigham and Women’s Hospital, and Harvard Medical School, Boston, MA.
Clinical inertia is defined as the failure of clinicians to initiate or escalate guideline-directed medical therapy to achieve treatment goals for well-defined clinical conditions.1,2 Evidence-based guidelines recommend optimal disease management with readily available medical therapies throughout the phases of clinical care. Unfortunately, the care provided to individual patients undergoes multiple modifications throughout the disease course, resulting in divergent pathways, significant deviations from treatment guidelines, and failure of “safeguard” checkpoints to reinstate, initiate, optimize, or stop treatments. Clinical inertia generally describes rigidity or resistance to change around implementing evidence-based guidelines. Furthermore, this term describes treatment behavior on the part of an individual clinician, not organizational inertia, which generally encompasses both internal (immediate clinical practice settings) and external factors (national and international guidelines and recommendations), eventually leading to resistance to optimizing disease treatment and therapeutic regimens. Individual clinicians’ clinical inertia in the form of resistance to guideline implementation and evidence-based principles can be one factor that drives organizational inertia. In turn, such individual behavior can be dictated by personal beliefs, knowledge, interpretation, skills, management principles, and biases. The terms therapeutic inertia or clinical inertia should not be confused with nonadherence from the patient’s standpoint when the clinician follows the best practice guidelines.3
Clinical inertia has been described in several clinical domains, including diabetes,4,5 hypertension,6,7 heart failure,8 depression,9 pulmonary medicine,10 and complex disease management.11 Clinicians can set suboptimal treatment goals due to specific beliefs and attitudes around optimal therapeutic goals. For example, when treating a patient with a chronic disease that is presently stable, a clinician could elect to initiate suboptimal treatment, as escalation of treatment might not be the priority in stable disease; they also may have concerns about overtreatment. Other factors that can contribute to clinical inertia (ie, undertreatment in the presence of indications for treatment) include those related to the patient, the clinical setting, and the organization, along with the importance of individualizing therapies in specific patients. Organizational inertia is the initial global resistance by the system to implementation, which can slow the dissemination and adaptation of best practices but eventually declines over time. Individual clinical inertia, on the other hand, will likely persist after the system-level rollout of guideline-based approaches.
The trajectory of dissemination, implementation, and adaptation of innovations and best practices is illustrated in the Figure. When the guidelines and medical societies endorse the adaptation of innovations or practice change after the benefits of such innovations/change have been established by the regulatory bodies, uptake can be hindered by both organizational and clinical inertia. Overcoming inertia to system-level changes requires addressing individual clinicians, along with practice and organizational factors, in order to ensure systematic adaptations. From the clinicians’ view, training and cognitive interventions to improve the adaptation and coping skills can improve understanding of treatment options through standardized educational and behavioral modification tools, direct and indirect feedback around performance, and decision support through a continuous improvement approach on both individual and system levels.
Addressing inertia in clinical practice requires a deep understanding of the individual and organizational elements that foster resistance to adapting best practice models. Research that explores tools and approaches to overcome inertia in managing complex diseases is a key step in advancing clinical innovation and disseminating best practices.
Corresponding author: Ebrahim Barkoudah, MD, MPH; [email protected]
Disclosures: None reported.
From the Department of Medicine, Brigham and Women’s Hospital, and Harvard Medical School, Boston, MA.
Clinical inertia is defined as the failure of clinicians to initiate or escalate guideline-directed medical therapy to achieve treatment goals for well-defined clinical conditions.1,2 Evidence-based guidelines recommend optimal disease management with readily available medical therapies throughout the phases of clinical care. Unfortunately, the care provided to individual patients undergoes multiple modifications throughout the disease course, resulting in divergent pathways, significant deviations from treatment guidelines, and failure of “safeguard” checkpoints to reinstate, initiate, optimize, or stop treatments. Clinical inertia generally describes rigidity or resistance to change around implementing evidence-based guidelines. Furthermore, this term describes treatment behavior on the part of an individual clinician, not organizational inertia, which generally encompasses both internal (immediate clinical practice settings) and external factors (national and international guidelines and recommendations), eventually leading to resistance to optimizing disease treatment and therapeutic regimens. Individual clinicians’ clinical inertia in the form of resistance to guideline implementation and evidence-based principles can be one factor that drives organizational inertia. In turn, such individual behavior can be dictated by personal beliefs, knowledge, interpretation, skills, management principles, and biases. The terms therapeutic inertia or clinical inertia should not be confused with nonadherence from the patient’s standpoint when the clinician follows the best practice guidelines.3
Clinical inertia has been described in several clinical domains, including diabetes,4,5 hypertension,6,7 heart failure,8 depression,9 pulmonary medicine,10 and complex disease management.11 Clinicians can set suboptimal treatment goals due to specific beliefs and attitudes around optimal therapeutic goals. For example, when treating a patient with a chronic disease that is presently stable, a clinician could elect to initiate suboptimal treatment, as escalation of treatment might not be the priority in stable disease; they also may have concerns about overtreatment. Other factors that can contribute to clinical inertia (ie, undertreatment in the presence of indications for treatment) include those related to the patient, the clinical setting, and the organization, along with the importance of individualizing therapies in specific patients. Organizational inertia is the initial global resistance by the system to implementation, which can slow the dissemination and adaptation of best practices but eventually declines over time. Individual clinical inertia, on the other hand, will likely persist after the system-level rollout of guideline-based approaches.
The trajectory of dissemination, implementation, and adaptation of innovations and best practices is illustrated in the Figure. When the guidelines and medical societies endorse the adaptation of innovations or practice change after the benefits of such innovations/change have been established by the regulatory bodies, uptake can be hindered by both organizational and clinical inertia. Overcoming inertia to system-level changes requires addressing individual clinicians, along with practice and organizational factors, in order to ensure systematic adaptations. From the clinicians’ view, training and cognitive interventions to improve the adaptation and coping skills can improve understanding of treatment options through standardized educational and behavioral modification tools, direct and indirect feedback around performance, and decision support through a continuous improvement approach on both individual and system levels.
Addressing inertia in clinical practice requires a deep understanding of the individual and organizational elements that foster resistance to adapting best practice models. Research that explores tools and approaches to overcome inertia in managing complex diseases is a key step in advancing clinical innovation and disseminating best practices.
Corresponding author: Ebrahim Barkoudah, MD, MPH; [email protected]
Disclosures: None reported.
1. Phillips LS, Branch WT, Cook CB, et al. Clinical inertia. Ann Intern Med. 2001;135(9):825-834. doi:10.7326/0003-4819-135-9-200111060-00012
2. Allen JD, Curtiss FR, Fairman KA. Nonadherence, clinical inertia, or therapeutic inertia? J Manag Care Pharm. 2009;15(8):690-695. doi:10.18553/jmcp.2009.15.8.690
3. Zafar A, Davies M, Azhar A, Khunti K. Clinical inertia in management of T2DM. Prim Care Diabetes. 2010;4(4):203-207. doi:10.1016/j.pcd.2010.07.003
4. Khunti K, Davies MJ. Clinical inertia—time to reappraise the terminology? Prim Care Diabetes. 2017;11(2):105-106. doi:10.1016/j.pcd.2017.01.007
5. O’Connor PJ. Overcome clinical inertia to control systolic blood pressure. Arch Intern Med. 2003;163(22):2677-2678. doi:10.1001/archinte.163.22.2677
6. Faria C, Wenzel M, Lee KW, et al. A narrative review of clinical inertia: focus on hypertension. J Am Soc Hypertens. 2009;3(4):267-276. doi:10.1016/j.jash.2009.03.001
7. Jarjour M, Henri C, de Denus S, et al. Care gaps in adherence to heart failure guidelines: clinical inertia or physiological limitations? JACC Heart Fail. 2020;8(9):725-738. doi:10.1016/j.jchf.2020.04.019
8. Henke RM, Zaslavsky AM, McGuire TG, et al. Clinical inertia in depression treatment. Med Care. 2009;47(9):959-67. doi:10.1097/MLR.0b013e31819a5da0
9. Cooke CE, Sidel M, Belletti DA, Fuhlbrigge AL. Clinical inertia in the management of chronic obstructive pulmonary disease. COPD. 2012;9(1):73-80. doi:10.3109/15412555.2011.631957
10. Whitford DL, Al-Anjawi HA, Al-Baharna MM. Impact of clinical inertia on cardiovascular risk factors in patients with diabetes. Prim Care Diabetes. 2014;8(2):133-138. doi:10.1016/j.pcd.2013.10.007
1. Phillips LS, Branch WT, Cook CB, et al. Clinical inertia. Ann Intern Med. 2001;135(9):825-834. doi:10.7326/0003-4819-135-9-200111060-00012
2. Allen JD, Curtiss FR, Fairman KA. Nonadherence, clinical inertia, or therapeutic inertia? J Manag Care Pharm. 2009;15(8):690-695. doi:10.18553/jmcp.2009.15.8.690
3. Zafar A, Davies M, Azhar A, Khunti K. Clinical inertia in management of T2DM. Prim Care Diabetes. 2010;4(4):203-207. doi:10.1016/j.pcd.2010.07.003
4. Khunti K, Davies MJ. Clinical inertia—time to reappraise the terminology? Prim Care Diabetes. 2017;11(2):105-106. doi:10.1016/j.pcd.2017.01.007
5. O’Connor PJ. Overcome clinical inertia to control systolic blood pressure. Arch Intern Med. 2003;163(22):2677-2678. doi:10.1001/archinte.163.22.2677
6. Faria C, Wenzel M, Lee KW, et al. A narrative review of clinical inertia: focus on hypertension. J Am Soc Hypertens. 2009;3(4):267-276. doi:10.1016/j.jash.2009.03.001
7. Jarjour M, Henri C, de Denus S, et al. Care gaps in adherence to heart failure guidelines: clinical inertia or physiological limitations? JACC Heart Fail. 2020;8(9):725-738. doi:10.1016/j.jchf.2020.04.019
8. Henke RM, Zaslavsky AM, McGuire TG, et al. Clinical inertia in depression treatment. Med Care. 2009;47(9):959-67. doi:10.1097/MLR.0b013e31819a5da0
9. Cooke CE, Sidel M, Belletti DA, Fuhlbrigge AL. Clinical inertia in the management of chronic obstructive pulmonary disease. COPD. 2012;9(1):73-80. doi:10.3109/15412555.2011.631957
10. Whitford DL, Al-Anjawi HA, Al-Baharna MM. Impact of clinical inertia on cardiovascular risk factors in patients with diabetes. Prim Care Diabetes. 2014;8(2):133-138. doi:10.1016/j.pcd.2013.10.007
Anesthetic Choices and Postoperative Delirium Incidence: Propofol vs Sevoflurane
Study 1 Overview (Chang et al)
Objective: To assess the incidence of postoperative delirium (POD) following propofol- vs sevoflurane-based anesthesia in geriatric spine surgery patients.
Design: Retrospective, single-blinded observational study of propofol- and sevoflurane-based anesthesia cohorts.
Setting and participants: Patients eligible for this study were aged 65 years or older admitted to the SMG-SNU Boramae Medical Center (Seoul, South Korea). All patients underwent general anesthesia either via intravenous propofol or inhalational sevoflurane for spine surgery between January 2015 and December 2019. Patients were retrospectively identified via electronic medical records. Patient exclusion criteria included preoperative delirium, history of dementia, psychiatric disease, alcoholism, hepatic or renal dysfunction, postoperative mechanical ventilation dependence, other surgery within the recent 6 months, maintenance of intraoperative anesthesia with combined anesthetics, or incomplete medical record.
Main outcome measures: The primary outcome was the incidence of POD after administration of propofol- and sevoflurane-based anesthesia during hospitalization. Patients were screened for POD regularly by attending nurses using the Nursing Delirium Screening Scale (disorientation, inappropriate behavior, inappropriate communication, hallucination, and psychomotor retardation) during the entirety of the patient’s hospital stay; if 1 or more screening criteria were met, a psychiatrist was consulted for the proper diagnosis and management of delirium. A psychiatric diagnosis was required for a case to be counted toward the incidence of POD in this study. Secondary outcomes included postoperative 30-day complications (angina, myocardial infarction, transient ischemic attack/stroke, pneumonia, deep vein thrombosis, pulmonary embolism, acute kidney injury, or infection) and length of postoperative hospital stay.
Main results: POD occurred in 29 patients (10.3%) out of the total cohort of 281. POD was more common in the sevoflurane group than in the propofol group (15.7% vs 5.0%; P = .003). Using multivariable logistic regression, inhalational sevoflurane was associated with an increased risk of POD as compared to propofol-based anesthesia (odds ratio [OR], 4.120; 95% CI, 1.549-10.954; P = .005). There was no association between choice of anesthetic and postoperative 30-day complications or the length of postoperative hospital stay. Both older age (OR, 1.242; 95% CI, 1.130-1.366; P < .001) and higher pain score at postoperative day 1 (OR, 1.338; 95% CI, 1.056-1.696; P = .016) were associated with increased risk of POD.
Conclusion: Propofol-based anesthesia was associated with a lower incidence of and risk for POD than sevoflurane-based anesthesia in older patients undergoing spine surgery.
Study 2 Overview (Mei et al)
Objective: To determine the incidence and duration of POD in older patients after total knee/hip replacement (TKR/THR) under intravenous propofol or inhalational sevoflurane general anesthesia.
Design: Randomized clinical trial of propofol and sevoflurane groups.
Setting and participants: This study was conducted at the Shanghai Tenth People’s Hospital and involved 209 participants enrolled between June 2016 and November 2019. All participants were 60 years of age or older, scheduled for TKR/THR surgery under general anesthesia, American Society of Anesthesiologists (ASA) class I to III, and assessed to be of normal cognitive function preoperatively via a Mini-Mental State Examination. Participant exclusion criteria included preexisting delirium as assessed by the Confusion Assessment Method (CAM), prior diagnosed neurological diseases (eg, Parkinson’s disease), prior diagnosed mental disorders (eg, schizophrenia), or impaired vision or hearing that would influence cognitive assessments. All participants were randomly assigned to either sevoflurane or propofol anesthesia for their surgery via a computer-generated list. Of these, 103 received inhalational sevoflurane and 106 received intravenous propofol. All participants received standardized postoperative care.
Main outcome measures: All participants were interviewed by investigators, who were blinded to the anesthesia regimen, twice daily on postoperative days 1, 2, and 3 using CAM and a CAM-based scoring system (CAM-S) to assess delirium severity. The CAM encapsulated 4 criteria: acute onset and fluctuating course, agitation, disorganized thinking, and altered level of consciousness. To diagnose delirium, both the first and second criteria must be met, in addition to either the third or fourth criterion. The averages of the scores across the 3 postoperative days indicated delirium severity, while the incidence and duration of delirium was assessed by the presence of delirium as determined by CAM on any postoperative day.
Main results: All eligible participants (N = 209; mean [SD] age 71.2 [6.7] years; 29.2% male) were included in the final analysis. The incidence of POD was not statistically different between the propofol and sevoflurane groups (33.0% vs 23.3%; P = .119, Chi-square test). It was estimated that 316 participants in each arm of the study were needed to detect statistical differences. The number of days of POD per person were higher with propofol anesthesia as compared to sevoflurane (0.5 [0.8] vs 0.3 [0.5]; P = .049, Student’s t-test).
Conclusion: This underpowered study showed a 9.7% difference in the incidence of POD between older adults who received propofol (33.0%) and sevoflurane (23.3%) after THR/TKR. Further studies with a larger sample size are needed to compare general anesthetics and their role in POD.
Commentary
Delirium is characterized by an acute state of confusion with fluctuating mental status, inattention, disorganized thinking, and altered level of consciousness. It is often caused by medications and/or their related adverse effects, infections, electrolyte imbalances, and other clinical etiologies. Delirium often manifests in post-surgical settings, disproportionately affecting older patients and leading to increased risk of morbidity, mortality, hospital length of stay, and health care costs.1 Intraoperative risk factors for POD are determined by the degree of operative stress (eg, lower-risk surgeries put the patient at reduced risk for POD as compared to higher-risk surgeries) and are additive to preexisting patient-specific risk factors, such as older age and functional impairment.1 Because operative stress is associated with risk for POD, limiting operative stress in controlled ways, such as through the choice of anesthetic agent administered, may be a pragmatic way to manage operative risks and optimize outcomes, especially when serving a surgically vulnerable population.
In Study 1, Chang et al sought to assess whether 2 commonly utilized general anesthetics, propofol and sevoflurane, in older patients undergoing spine surgery differentially affected the incidence of POD. In this retrospective, single-blinded observational study of 281 geriatric patients, the researchers found that sevoflurane was associated with a higher risk of POD as compared to propofol. However, these anesthetics were not associated with surgical outcomes such as postoperative 30-day complications or the length of postoperative hospital stay. While these findings added new knowledge to this field of research, several limitations should be kept in mind when interpreting this study’s results. For instance, the sample size was relatively small, with all cases selected from a single center utilizing a retrospective analysis. In addition, although a standardized nursing screening tool was used as a method for delirium detection, hypoactive delirium or less symptomatic delirium may have been missed, which in turn would lead to an underestimation of POD incidence. The latter is a common limitation in delirium research.
In Study 2, Mei et al similarly explored the effects of general anesthetics on POD in older surgical patients. Specifically, using a randomized clinical trial design, the investigators compared propofol with sevoflurane in older patients who underwent TKR/THR, and their roles in POD severity and duration. Although the incidence of POD was higher in those who received propofol compared to sevoflurane, this trial was underpowered and the results did not reach statistical significance. In addition, while the duration of POD was slightly longer in the propofol group compared to the sevoflurane group (0.5 vs 0.3 days), it was unclear if this finding was clinically significant. Similar to many research studies in POD, limitations of Study 2 included a small sample size of 209 patients, with all participants enrolled from a single center. On the other hand, this study illustrated the feasibility of a method that allowed reproducible prospective assessment of POD time course using CAM and CAM-S.
Applications for Clinical Practice and System Implementation
The delineation of risk factors that contribute to delirium after surgery in older patients is key to mitigating risks for POD and improving clinical outcomes. An important step towards a better understanding of these modifiable risk factors is to clearly quantify intraoperative risk of POD attributable to specific anesthetics. While preclinical studies have shown differential neurotoxicity effects of propofol and sevoflurane, their impact on clinically important neurologic outcomes such as delirium and cognitive decline remains poorly understood. Although Studies 1 and 2 both provided head-to-head comparisons of propofol and sevoflurane as risk factors for POD in high-operative-stress surgeries in older patients, the results were inconsistent. That being said, this small incremental increase in knowledge was not unexpected in the course of discovery around a clinically complex research question. Importantly, these studies provided evidence regarding the methodological approaches that could be taken to further this line of research.
The mediating factors of the differences on neurologic outcomes between anesthetic agents are likely pharmacological, biological, and methodological. Pharmacologically, the differences between target receptors, such as GABAA (propofol, etomidate) or NMDA (ketamine), could be a defining feature in the difference in incidence of POD. Additionally, secondary actions of anesthetic agents on glycine, nicotinic, and acetylcholine receptors could play a role as well. Biologically, genes such as CYP2E1, CYP2B6, CYP2C9, GSTP1, UGT1A9, SULT1A1, and NQO1 have all been identified as genetic factors in the metabolism of anesthetics, and variations in such genes could result in different responses to anesthetics.2 Methodologically, routes of anesthetic administration (eg, inhalation vs intravenous), preexisting anatomical structures, or confounding medical conditions (eg, lower respiratory volume due to older age) may influence POD incidence, duration, or severity. Moreover, methodological differences between Studies 1 and 2, such as surgeries performed (spinal vs TKR/THR), patient populations (South Korean vs Chinese), and the diagnosis and monitoring of delirium (retrospective screening and diagnosis vs prospective CAM/CAM-S) may impact delirium outcomes. Thus, these factors should be considered in the design of future clinical trials undertaken to investigate the effects of anesthetics on POD.
Given the high prevalence of delirium and its associated adverse outcomes in the immediate postoperative period in older patients, further research is warranted to determine how anesthetics affect POD in order to optimize perioperative care and mitigate risks in this vulnerable population. Moreover, parallel investigations into how anesthetics differentially impact the development of transient or longer-term cognitive impairment after a surgical procedure (ie, postoperative cognitive dysfunction) in older adults are urgently needed in order to improve their cognitive health.
Practice Points
- Intravenous propofol and inhalational sevoflurane may be differentially associated with incidence, duration, and severity of POD in geriatric surgical patients.
- Further larger-scale studies are warranted to clarify the role of anesthetic choice in POD in order to optimize surgical outcomes in older patients.
–Jared Doan, BS, and Fred Ko, MD
Icahn School of Medicine at Mount Sinai
1. Dasgupta M, Dumbrell AC. Preoperative risk assessment for delirium after noncardiac surgery: a systematic review. J Am Geriatr Soc. 2006;54(10):1578-1589. doi:10.1111/j.1532-5415.2006.00893.x
2. Mikstacki A, Skrzypczak-Zielinska M, Tamowicz B, et al. The impact of genetic factors on response to anaesthetics. Adv Med Sci. 2013;58(1):9-14. doi:10.2478/v10039-012-0065-z
Study 1 Overview (Chang et al)
Objective: To assess the incidence of postoperative delirium (POD) following propofol- vs sevoflurane-based anesthesia in geriatric spine surgery patients.
Design: Retrospective, single-blinded observational study of propofol- and sevoflurane-based anesthesia cohorts.
Setting and participants: Patients eligible for this study were aged 65 years or older admitted to the SMG-SNU Boramae Medical Center (Seoul, South Korea). All patients underwent general anesthesia either via intravenous propofol or inhalational sevoflurane for spine surgery between January 2015 and December 2019. Patients were retrospectively identified via electronic medical records. Patient exclusion criteria included preoperative delirium, history of dementia, psychiatric disease, alcoholism, hepatic or renal dysfunction, postoperative mechanical ventilation dependence, other surgery within the recent 6 months, maintenance of intraoperative anesthesia with combined anesthetics, or incomplete medical record.
Main outcome measures: The primary outcome was the incidence of POD after administration of propofol- and sevoflurane-based anesthesia during hospitalization. Patients were screened for POD regularly by attending nurses using the Nursing Delirium Screening Scale (disorientation, inappropriate behavior, inappropriate communication, hallucination, and psychomotor retardation) during the entirety of the patient’s hospital stay; if 1 or more screening criteria were met, a psychiatrist was consulted for the proper diagnosis and management of delirium. A psychiatric diagnosis was required for a case to be counted toward the incidence of POD in this study. Secondary outcomes included postoperative 30-day complications (angina, myocardial infarction, transient ischemic attack/stroke, pneumonia, deep vein thrombosis, pulmonary embolism, acute kidney injury, or infection) and length of postoperative hospital stay.
Main results: POD occurred in 29 patients (10.3%) out of the total cohort of 281. POD was more common in the sevoflurane group than in the propofol group (15.7% vs 5.0%; P = .003). Using multivariable logistic regression, inhalational sevoflurane was associated with an increased risk of POD as compared to propofol-based anesthesia (odds ratio [OR], 4.120; 95% CI, 1.549-10.954; P = .005). There was no association between choice of anesthetic and postoperative 30-day complications or the length of postoperative hospital stay. Both older age (OR, 1.242; 95% CI, 1.130-1.366; P < .001) and higher pain score at postoperative day 1 (OR, 1.338; 95% CI, 1.056-1.696; P = .016) were associated with increased risk of POD.
Conclusion: Propofol-based anesthesia was associated with a lower incidence of and risk for POD than sevoflurane-based anesthesia in older patients undergoing spine surgery.
Study 2 Overview (Mei et al)
Objective: To determine the incidence and duration of POD in older patients after total knee/hip replacement (TKR/THR) under intravenous propofol or inhalational sevoflurane general anesthesia.
Design: Randomized clinical trial of propofol and sevoflurane groups.
Setting and participants: This study was conducted at the Shanghai Tenth People’s Hospital and involved 209 participants enrolled between June 2016 and November 2019. All participants were 60 years of age or older, scheduled for TKR/THR surgery under general anesthesia, American Society of Anesthesiologists (ASA) class I to III, and assessed to be of normal cognitive function preoperatively via a Mini-Mental State Examination. Participant exclusion criteria included preexisting delirium as assessed by the Confusion Assessment Method (CAM), prior diagnosed neurological diseases (eg, Parkinson’s disease), prior diagnosed mental disorders (eg, schizophrenia), or impaired vision or hearing that would influence cognitive assessments. All participants were randomly assigned to either sevoflurane or propofol anesthesia for their surgery via a computer-generated list. Of these, 103 received inhalational sevoflurane and 106 received intravenous propofol. All participants received standardized postoperative care.
Main outcome measures: All participants were interviewed by investigators, who were blinded to the anesthesia regimen, twice daily on postoperative days 1, 2, and 3 using CAM and a CAM-based scoring system (CAM-S) to assess delirium severity. The CAM encapsulated 4 criteria: acute onset and fluctuating course, agitation, disorganized thinking, and altered level of consciousness. To diagnose delirium, both the first and second criteria must be met, in addition to either the third or fourth criterion. The averages of the scores across the 3 postoperative days indicated delirium severity, while the incidence and duration of delirium was assessed by the presence of delirium as determined by CAM on any postoperative day.
Main results: All eligible participants (N = 209; mean [SD] age 71.2 [6.7] years; 29.2% male) were included in the final analysis. The incidence of POD was not statistically different between the propofol and sevoflurane groups (33.0% vs 23.3%; P = .119, Chi-square test). It was estimated that 316 participants in each arm of the study were needed to detect statistical differences. The number of days of POD per person were higher with propofol anesthesia as compared to sevoflurane (0.5 [0.8] vs 0.3 [0.5]; P = .049, Student’s t-test).
Conclusion: This underpowered study showed a 9.7% difference in the incidence of POD between older adults who received propofol (33.0%) and sevoflurane (23.3%) after THR/TKR. Further studies with a larger sample size are needed to compare general anesthetics and their role in POD.
Commentary
Delirium is characterized by an acute state of confusion with fluctuating mental status, inattention, disorganized thinking, and altered level of consciousness. It is often caused by medications and/or their related adverse effects, infections, electrolyte imbalances, and other clinical etiologies. Delirium often manifests in post-surgical settings, disproportionately affecting older patients and leading to increased risk of morbidity, mortality, hospital length of stay, and health care costs.1 Intraoperative risk factors for POD are determined by the degree of operative stress (eg, lower-risk surgeries put the patient at reduced risk for POD as compared to higher-risk surgeries) and are additive to preexisting patient-specific risk factors, such as older age and functional impairment.1 Because operative stress is associated with risk for POD, limiting operative stress in controlled ways, such as through the choice of anesthetic agent administered, may be a pragmatic way to manage operative risks and optimize outcomes, especially when serving a surgically vulnerable population.
In Study 1, Chang et al sought to assess whether 2 commonly utilized general anesthetics, propofol and sevoflurane, in older patients undergoing spine surgery differentially affected the incidence of POD. In this retrospective, single-blinded observational study of 281 geriatric patients, the researchers found that sevoflurane was associated with a higher risk of POD as compared to propofol. However, these anesthetics were not associated with surgical outcomes such as postoperative 30-day complications or the length of postoperative hospital stay. While these findings added new knowledge to this field of research, several limitations should be kept in mind when interpreting this study’s results. For instance, the sample size was relatively small, with all cases selected from a single center utilizing a retrospective analysis. In addition, although a standardized nursing screening tool was used as a method for delirium detection, hypoactive delirium or less symptomatic delirium may have been missed, which in turn would lead to an underestimation of POD incidence. The latter is a common limitation in delirium research.
In Study 2, Mei et al similarly explored the effects of general anesthetics on POD in older surgical patients. Specifically, using a randomized clinical trial design, the investigators compared propofol with sevoflurane in older patients who underwent TKR/THR, and their roles in POD severity and duration. Although the incidence of POD was higher in those who received propofol compared to sevoflurane, this trial was underpowered and the results did not reach statistical significance. In addition, while the duration of POD was slightly longer in the propofol group compared to the sevoflurane group (0.5 vs 0.3 days), it was unclear if this finding was clinically significant. Similar to many research studies in POD, limitations of Study 2 included a small sample size of 209 patients, with all participants enrolled from a single center. On the other hand, this study illustrated the feasibility of a method that allowed reproducible prospective assessment of POD time course using CAM and CAM-S.
Applications for Clinical Practice and System Implementation
The delineation of risk factors that contribute to delirium after surgery in older patients is key to mitigating risks for POD and improving clinical outcomes. An important step towards a better understanding of these modifiable risk factors is to clearly quantify intraoperative risk of POD attributable to specific anesthetics. While preclinical studies have shown differential neurotoxicity effects of propofol and sevoflurane, their impact on clinically important neurologic outcomes such as delirium and cognitive decline remains poorly understood. Although Studies 1 and 2 both provided head-to-head comparisons of propofol and sevoflurane as risk factors for POD in high-operative-stress surgeries in older patients, the results were inconsistent. That being said, this small incremental increase in knowledge was not unexpected in the course of discovery around a clinically complex research question. Importantly, these studies provided evidence regarding the methodological approaches that could be taken to further this line of research.
The mediating factors of the differences on neurologic outcomes between anesthetic agents are likely pharmacological, biological, and methodological. Pharmacologically, the differences between target receptors, such as GABAA (propofol, etomidate) or NMDA (ketamine), could be a defining feature in the difference in incidence of POD. Additionally, secondary actions of anesthetic agents on glycine, nicotinic, and acetylcholine receptors could play a role as well. Biologically, genes such as CYP2E1, CYP2B6, CYP2C9, GSTP1, UGT1A9, SULT1A1, and NQO1 have all been identified as genetic factors in the metabolism of anesthetics, and variations in such genes could result in different responses to anesthetics.2 Methodologically, routes of anesthetic administration (eg, inhalation vs intravenous), preexisting anatomical structures, or confounding medical conditions (eg, lower respiratory volume due to older age) may influence POD incidence, duration, or severity. Moreover, methodological differences between Studies 1 and 2, such as surgeries performed (spinal vs TKR/THR), patient populations (South Korean vs Chinese), and the diagnosis and monitoring of delirium (retrospective screening and diagnosis vs prospective CAM/CAM-S) may impact delirium outcomes. Thus, these factors should be considered in the design of future clinical trials undertaken to investigate the effects of anesthetics on POD.
Given the high prevalence of delirium and its associated adverse outcomes in the immediate postoperative period in older patients, further research is warranted to determine how anesthetics affect POD in order to optimize perioperative care and mitigate risks in this vulnerable population. Moreover, parallel investigations into how anesthetics differentially impact the development of transient or longer-term cognitive impairment after a surgical procedure (ie, postoperative cognitive dysfunction) in older adults are urgently needed in order to improve their cognitive health.
Practice Points
- Intravenous propofol and inhalational sevoflurane may be differentially associated with incidence, duration, and severity of POD in geriatric surgical patients.
- Further larger-scale studies are warranted to clarify the role of anesthetic choice in POD in order to optimize surgical outcomes in older patients.
–Jared Doan, BS, and Fred Ko, MD
Icahn School of Medicine at Mount Sinai
Study 1 Overview (Chang et al)
Objective: To assess the incidence of postoperative delirium (POD) following propofol- vs sevoflurane-based anesthesia in geriatric spine surgery patients.
Design: Retrospective, single-blinded observational study of propofol- and sevoflurane-based anesthesia cohorts.
Setting and participants: Patients eligible for this study were aged 65 years or older admitted to the SMG-SNU Boramae Medical Center (Seoul, South Korea). All patients underwent general anesthesia either via intravenous propofol or inhalational sevoflurane for spine surgery between January 2015 and December 2019. Patients were retrospectively identified via electronic medical records. Patient exclusion criteria included preoperative delirium, history of dementia, psychiatric disease, alcoholism, hepatic or renal dysfunction, postoperative mechanical ventilation dependence, other surgery within the recent 6 months, maintenance of intraoperative anesthesia with combined anesthetics, or incomplete medical record.
Main outcome measures: The primary outcome was the incidence of POD after administration of propofol- and sevoflurane-based anesthesia during hospitalization. Patients were screened for POD regularly by attending nurses using the Nursing Delirium Screening Scale (disorientation, inappropriate behavior, inappropriate communication, hallucination, and psychomotor retardation) during the entirety of the patient’s hospital stay; if 1 or more screening criteria were met, a psychiatrist was consulted for the proper diagnosis and management of delirium. A psychiatric diagnosis was required for a case to be counted toward the incidence of POD in this study. Secondary outcomes included postoperative 30-day complications (angina, myocardial infarction, transient ischemic attack/stroke, pneumonia, deep vein thrombosis, pulmonary embolism, acute kidney injury, or infection) and length of postoperative hospital stay.
Main results: POD occurred in 29 patients (10.3%) out of the total cohort of 281. POD was more common in the sevoflurane group than in the propofol group (15.7% vs 5.0%; P = .003). Using multivariable logistic regression, inhalational sevoflurane was associated with an increased risk of POD as compared to propofol-based anesthesia (odds ratio [OR], 4.120; 95% CI, 1.549-10.954; P = .005). There was no association between choice of anesthetic and postoperative 30-day complications or the length of postoperative hospital stay. Both older age (OR, 1.242; 95% CI, 1.130-1.366; P < .001) and higher pain score at postoperative day 1 (OR, 1.338; 95% CI, 1.056-1.696; P = .016) were associated with increased risk of POD.
Conclusion: Propofol-based anesthesia was associated with a lower incidence of and risk for POD than sevoflurane-based anesthesia in older patients undergoing spine surgery.
Study 2 Overview (Mei et al)
Objective: To determine the incidence and duration of POD in older patients after total knee/hip replacement (TKR/THR) under intravenous propofol or inhalational sevoflurane general anesthesia.
Design: Randomized clinical trial of propofol and sevoflurane groups.
Setting and participants: This study was conducted at the Shanghai Tenth People’s Hospital and involved 209 participants enrolled between June 2016 and November 2019. All participants were 60 years of age or older, scheduled for TKR/THR surgery under general anesthesia, American Society of Anesthesiologists (ASA) class I to III, and assessed to be of normal cognitive function preoperatively via a Mini-Mental State Examination. Participant exclusion criteria included preexisting delirium as assessed by the Confusion Assessment Method (CAM), prior diagnosed neurological diseases (eg, Parkinson’s disease), prior diagnosed mental disorders (eg, schizophrenia), or impaired vision or hearing that would influence cognitive assessments. All participants were randomly assigned to either sevoflurane or propofol anesthesia for their surgery via a computer-generated list. Of these, 103 received inhalational sevoflurane and 106 received intravenous propofol. All participants received standardized postoperative care.
Main outcome measures: All participants were interviewed by investigators, who were blinded to the anesthesia regimen, twice daily on postoperative days 1, 2, and 3 using CAM and a CAM-based scoring system (CAM-S) to assess delirium severity. The CAM encapsulated 4 criteria: acute onset and fluctuating course, agitation, disorganized thinking, and altered level of consciousness. To diagnose delirium, both the first and second criteria must be met, in addition to either the third or fourth criterion. The averages of the scores across the 3 postoperative days indicated delirium severity, while the incidence and duration of delirium was assessed by the presence of delirium as determined by CAM on any postoperative day.
Main results: All eligible participants (N = 209; mean [SD] age 71.2 [6.7] years; 29.2% male) were included in the final analysis. The incidence of POD was not statistically different between the propofol and sevoflurane groups (33.0% vs 23.3%; P = .119, Chi-square test). It was estimated that 316 participants in each arm of the study were needed to detect statistical differences. The number of days of POD per person were higher with propofol anesthesia as compared to sevoflurane (0.5 [0.8] vs 0.3 [0.5]; P = .049, Student’s t-test).
Conclusion: This underpowered study showed a 9.7% difference in the incidence of POD between older adults who received propofol (33.0%) and sevoflurane (23.3%) after THR/TKR. Further studies with a larger sample size are needed to compare general anesthetics and their role in POD.
Commentary
Delirium is characterized by an acute state of confusion with fluctuating mental status, inattention, disorganized thinking, and altered level of consciousness. It is often caused by medications and/or their related adverse effects, infections, electrolyte imbalances, and other clinical etiologies. Delirium often manifests in post-surgical settings, disproportionately affecting older patients and leading to increased risk of morbidity, mortality, hospital length of stay, and health care costs.1 Intraoperative risk factors for POD are determined by the degree of operative stress (eg, lower-risk surgeries put the patient at reduced risk for POD as compared to higher-risk surgeries) and are additive to preexisting patient-specific risk factors, such as older age and functional impairment.1 Because operative stress is associated with risk for POD, limiting operative stress in controlled ways, such as through the choice of anesthetic agent administered, may be a pragmatic way to manage operative risks and optimize outcomes, especially when serving a surgically vulnerable population.
In Study 1, Chang et al sought to assess whether 2 commonly utilized general anesthetics, propofol and sevoflurane, in older patients undergoing spine surgery differentially affected the incidence of POD. In this retrospective, single-blinded observational study of 281 geriatric patients, the researchers found that sevoflurane was associated with a higher risk of POD as compared to propofol. However, these anesthetics were not associated with surgical outcomes such as postoperative 30-day complications or the length of postoperative hospital stay. While these findings added new knowledge to this field of research, several limitations should be kept in mind when interpreting this study’s results. For instance, the sample size was relatively small, with all cases selected from a single center utilizing a retrospective analysis. In addition, although a standardized nursing screening tool was used as a method for delirium detection, hypoactive delirium or less symptomatic delirium may have been missed, which in turn would lead to an underestimation of POD incidence. The latter is a common limitation in delirium research.
In Study 2, Mei et al similarly explored the effects of general anesthetics on POD in older surgical patients. Specifically, using a randomized clinical trial design, the investigators compared propofol with sevoflurane in older patients who underwent TKR/THR, and their roles in POD severity and duration. Although the incidence of POD was higher in those who received propofol compared to sevoflurane, this trial was underpowered and the results did not reach statistical significance. In addition, while the duration of POD was slightly longer in the propofol group compared to the sevoflurane group (0.5 vs 0.3 days), it was unclear if this finding was clinically significant. Similar to many research studies in POD, limitations of Study 2 included a small sample size of 209 patients, with all participants enrolled from a single center. On the other hand, this study illustrated the feasibility of a method that allowed reproducible prospective assessment of POD time course using CAM and CAM-S.
Applications for Clinical Practice and System Implementation
The delineation of risk factors that contribute to delirium after surgery in older patients is key to mitigating risks for POD and improving clinical outcomes. An important step towards a better understanding of these modifiable risk factors is to clearly quantify intraoperative risk of POD attributable to specific anesthetics. While preclinical studies have shown differential neurotoxicity effects of propofol and sevoflurane, their impact on clinically important neurologic outcomes such as delirium and cognitive decline remains poorly understood. Although Studies 1 and 2 both provided head-to-head comparisons of propofol and sevoflurane as risk factors for POD in high-operative-stress surgeries in older patients, the results were inconsistent. That being said, this small incremental increase in knowledge was not unexpected in the course of discovery around a clinically complex research question. Importantly, these studies provided evidence regarding the methodological approaches that could be taken to further this line of research.
The mediating factors of the differences on neurologic outcomes between anesthetic agents are likely pharmacological, biological, and methodological. Pharmacologically, the differences between target receptors, such as GABAA (propofol, etomidate) or NMDA (ketamine), could be a defining feature in the difference in incidence of POD. Additionally, secondary actions of anesthetic agents on glycine, nicotinic, and acetylcholine receptors could play a role as well. Biologically, genes such as CYP2E1, CYP2B6, CYP2C9, GSTP1, UGT1A9, SULT1A1, and NQO1 have all been identified as genetic factors in the metabolism of anesthetics, and variations in such genes could result in different responses to anesthetics.2 Methodologically, routes of anesthetic administration (eg, inhalation vs intravenous), preexisting anatomical structures, or confounding medical conditions (eg, lower respiratory volume due to older age) may influence POD incidence, duration, or severity. Moreover, methodological differences between Studies 1 and 2, such as surgeries performed (spinal vs TKR/THR), patient populations (South Korean vs Chinese), and the diagnosis and monitoring of delirium (retrospective screening and diagnosis vs prospective CAM/CAM-S) may impact delirium outcomes. Thus, these factors should be considered in the design of future clinical trials undertaken to investigate the effects of anesthetics on POD.
Given the high prevalence of delirium and its associated adverse outcomes in the immediate postoperative period in older patients, further research is warranted to determine how anesthetics affect POD in order to optimize perioperative care and mitigate risks in this vulnerable population. Moreover, parallel investigations into how anesthetics differentially impact the development of transient or longer-term cognitive impairment after a surgical procedure (ie, postoperative cognitive dysfunction) in older adults are urgently needed in order to improve their cognitive health.
Practice Points
- Intravenous propofol and inhalational sevoflurane may be differentially associated with incidence, duration, and severity of POD in geriatric surgical patients.
- Further larger-scale studies are warranted to clarify the role of anesthetic choice in POD in order to optimize surgical outcomes in older patients.
–Jared Doan, BS, and Fred Ko, MD
Icahn School of Medicine at Mount Sinai
1. Dasgupta M, Dumbrell AC. Preoperative risk assessment for delirium after noncardiac surgery: a systematic review. J Am Geriatr Soc. 2006;54(10):1578-1589. doi:10.1111/j.1532-5415.2006.00893.x
2. Mikstacki A, Skrzypczak-Zielinska M, Tamowicz B, et al. The impact of genetic factors on response to anaesthetics. Adv Med Sci. 2013;58(1):9-14. doi:10.2478/v10039-012-0065-z
1. Dasgupta M, Dumbrell AC. Preoperative risk assessment for delirium after noncardiac surgery: a systematic review. J Am Geriatr Soc. 2006;54(10):1578-1589. doi:10.1111/j.1532-5415.2006.00893.x
2. Mikstacki A, Skrzypczak-Zielinska M, Tamowicz B, et al. The impact of genetic factors on response to anaesthetics. Adv Med Sci. 2013;58(1):9-14. doi:10.2478/v10039-012-0065-z
Electrolyte disturbances a harbinger of eating disorders?
Electrolyte abnormalities may serve as a precursor to a future eating disorder diagnosis, a finding that may help pinpoint candidates for screening.
Researchers found that adolescents and adults with electrolyte abnormalities on routine outpatient lab work were twice as likely as those without these disturbances to be subsequently diagnosed with an eating disorder.
“These electrolyte abnormalities were in fact seen well ahead (> 1 year on average) of the time when patients were diagnosed with eating disorders,” study investigator Gregory Hundemer, MD, department of nephrology, University of Ottawa, told this news organization.
“Incidentally discovered outpatient electrolyte abnormalities may help to identify individuals who may benefit from more targeted screening into an underlying eating disorder. This, in turn, may allow for earlier diagnosis and therapeutic intervention,” Dr. Hundemer said.
The study was published online in JAMA Network Open.
Tailored screening?
Electrolyte abnormalities are often found when an individual is diagnosed with an eating disorder, but it’s largely unknown whether electrolyte abnormalities prior to the acute presentation of an eating disorder are associated with the future diagnosis of an eating disorder.
To investigate, the researchers used administrative health data to match 6,970 individuals (mean age, 28 years; 13% male) with an eating disorder diagnosis to 27,878 controls without an eating disorder diagnosis.
They found that individuals with an eating disorder were more likely to have a preceding electrolyte abnormality, compared with peers without an eating disorder (18.4% vs. 7.5%).
An outpatient electrolyte abnormality present 3 years to 30 days prior to diagnosis was associated with about a twofold higher odds for subsequent eating disorder diagnosis (adjusted odds ratio, 2.12; 95% confidence interval, 1.86-2.41).
The median time from the earliest electrolyte abnormality to eating disorder diagnosis was 386 days (range, 157-716 days).
Hypokalemia was the most common electrolyte abnormality (present in 12% of cases vs. 5% of controls), while hyponatremia, hypernatremia, hypophosphatemia, and metabolic alkalosis were the most specific for a subsequent eating disorder diagnosis.
Severe hypokalemia (serum potassium levels of 3.0 mmol/L or lower) and severe hyponatremia (serum sodium, 128 mmol/L or lower) were associated with over sevenfold and fivefold higher odds for the diagnosis of an eating disorder, respectively.
The U.S. Preventive Services Task Force issued its first-ever statement on screening for eating disorders earlier this year.
The task force concluded that there is insufficient evidence to weigh the balance of benefits and harms of screening for eating disorders in adolescents and adults with no signs or symptoms of an eating disorder or concerns about their eating and who have not previously been diagnosed with an eating disorder.
Dr. Hundemer and colleagues believe an incidental electrolyte abnormality may identify candidates at high risk for an underlying eating disorder who many benefit from screening.
Several screening tools of varying complexity have been developed that are validated and accurate in identifying individuals with a potential eating disorder.
They include the SCOFF questionnaire, the Eating Disorder Screen for Primary Care, the Eating Attitudes Test, and the Primary Care Evaluation of Mental Disorders Patient Health Questionnaire.
Underdiagnosed, undertreated
Offering perspective on the findings, Kamryn T. Eddy, PhD, codirector, Eating Disorders Clinical and Research Program, Massachusetts General Hospital, Boston, said the notion “that a physical sign may help to promote eating disorder assessment is important particularly given that early detection can improve outcomes.”
“But this finding appears in the current context of eating disorders going largely underdetected, underdiagnosed, and undertreated across medical and psychiatric settings,” said Dr. Eddy, associate professor, department of psychiatry, Harvard Medical School, Boston.
“Indeed, eating disorders are prevalent and cut across age, sex, gender, weight, race, ethnicity, and socioeconomic strata, and still, many providers do not routinely assess for eating disorders,” Dr. Eddy said.
“I might suggest that perhaps in addition to letting electrolyte abnormalities be a cue to screen for eating disorders, an even more powerful shift toward routine screening and assessment of eating disorders by medical providers be made,” Dr. Eddy said in an interview.
This study was supported by ICES, which is funded by an annual grant from the Ontario Ministry of Health and the Ministry of Health and Long-Term Care. Dr. Hundemer and Dr. Eddy have disclosed no relevant financial relationships.
A version of this article first appeared on Medscape.com.
Electrolyte abnormalities may serve as a precursor to a future eating disorder diagnosis, a finding that may help pinpoint candidates for screening.
Researchers found that adolescents and adults with electrolyte abnormalities on routine outpatient lab work were twice as likely as those without these disturbances to be subsequently diagnosed with an eating disorder.
“These electrolyte abnormalities were in fact seen well ahead (> 1 year on average) of the time when patients were diagnosed with eating disorders,” study investigator Gregory Hundemer, MD, department of nephrology, University of Ottawa, told this news organization.
“Incidentally discovered outpatient electrolyte abnormalities may help to identify individuals who may benefit from more targeted screening into an underlying eating disorder. This, in turn, may allow for earlier diagnosis and therapeutic intervention,” Dr. Hundemer said.
The study was published online in JAMA Network Open.
Tailored screening?
Electrolyte abnormalities are often found when an individual is diagnosed with an eating disorder, but it’s largely unknown whether electrolyte abnormalities prior to the acute presentation of an eating disorder are associated with the future diagnosis of an eating disorder.
To investigate, the researchers used administrative health data to match 6,970 individuals (mean age, 28 years; 13% male) with an eating disorder diagnosis to 27,878 controls without an eating disorder diagnosis.
They found that individuals with an eating disorder were more likely to have a preceding electrolyte abnormality, compared with peers without an eating disorder (18.4% vs. 7.5%).
An outpatient electrolyte abnormality present 3 years to 30 days prior to diagnosis was associated with about a twofold higher odds for subsequent eating disorder diagnosis (adjusted odds ratio, 2.12; 95% confidence interval, 1.86-2.41).
The median time from the earliest electrolyte abnormality to eating disorder diagnosis was 386 days (range, 157-716 days).
Hypokalemia was the most common electrolyte abnormality (present in 12% of cases vs. 5% of controls), while hyponatremia, hypernatremia, hypophosphatemia, and metabolic alkalosis were the most specific for a subsequent eating disorder diagnosis.
Severe hypokalemia (serum potassium levels of 3.0 mmol/L or lower) and severe hyponatremia (serum sodium, 128 mmol/L or lower) were associated with over sevenfold and fivefold higher odds for the diagnosis of an eating disorder, respectively.
The U.S. Preventive Services Task Force issued its first-ever statement on screening for eating disorders earlier this year.
The task force concluded that there is insufficient evidence to weigh the balance of benefits and harms of screening for eating disorders in adolescents and adults with no signs or symptoms of an eating disorder or concerns about their eating and who have not previously been diagnosed with an eating disorder.
Dr. Hundemer and colleagues believe an incidental electrolyte abnormality may identify candidates at high risk for an underlying eating disorder who many benefit from screening.
Several screening tools of varying complexity have been developed that are validated and accurate in identifying individuals with a potential eating disorder.
They include the SCOFF questionnaire, the Eating Disorder Screen for Primary Care, the Eating Attitudes Test, and the Primary Care Evaluation of Mental Disorders Patient Health Questionnaire.
Underdiagnosed, undertreated
Offering perspective on the findings, Kamryn T. Eddy, PhD, codirector, Eating Disorders Clinical and Research Program, Massachusetts General Hospital, Boston, said the notion “that a physical sign may help to promote eating disorder assessment is important particularly given that early detection can improve outcomes.”
“But this finding appears in the current context of eating disorders going largely underdetected, underdiagnosed, and undertreated across medical and psychiatric settings,” said Dr. Eddy, associate professor, department of psychiatry, Harvard Medical School, Boston.
“Indeed, eating disorders are prevalent and cut across age, sex, gender, weight, race, ethnicity, and socioeconomic strata, and still, many providers do not routinely assess for eating disorders,” Dr. Eddy said.
“I might suggest that perhaps in addition to letting electrolyte abnormalities be a cue to screen for eating disorders, an even more powerful shift toward routine screening and assessment of eating disorders by medical providers be made,” Dr. Eddy said in an interview.
This study was supported by ICES, which is funded by an annual grant from the Ontario Ministry of Health and the Ministry of Health and Long-Term Care. Dr. Hundemer and Dr. Eddy have disclosed no relevant financial relationships.
A version of this article first appeared on Medscape.com.
Electrolyte abnormalities may serve as a precursor to a future eating disorder diagnosis, a finding that may help pinpoint candidates for screening.
Researchers found that adolescents and adults with electrolyte abnormalities on routine outpatient lab work were twice as likely as those without these disturbances to be subsequently diagnosed with an eating disorder.
“These electrolyte abnormalities were in fact seen well ahead (> 1 year on average) of the time when patients were diagnosed with eating disorders,” study investigator Gregory Hundemer, MD, department of nephrology, University of Ottawa, told this news organization.
“Incidentally discovered outpatient electrolyte abnormalities may help to identify individuals who may benefit from more targeted screening into an underlying eating disorder. This, in turn, may allow for earlier diagnosis and therapeutic intervention,” Dr. Hundemer said.
The study was published online in JAMA Network Open.
Tailored screening?
Electrolyte abnormalities are often found when an individual is diagnosed with an eating disorder, but it’s largely unknown whether electrolyte abnormalities prior to the acute presentation of an eating disorder are associated with the future diagnosis of an eating disorder.
To investigate, the researchers used administrative health data to match 6,970 individuals (mean age, 28 years; 13% male) with an eating disorder diagnosis to 27,878 controls without an eating disorder diagnosis.
They found that individuals with an eating disorder were more likely to have a preceding electrolyte abnormality, compared with peers without an eating disorder (18.4% vs. 7.5%).
An outpatient electrolyte abnormality present 3 years to 30 days prior to diagnosis was associated with about a twofold higher odds for subsequent eating disorder diagnosis (adjusted odds ratio, 2.12; 95% confidence interval, 1.86-2.41).
The median time from the earliest electrolyte abnormality to eating disorder diagnosis was 386 days (range, 157-716 days).
Hypokalemia was the most common electrolyte abnormality (present in 12% of cases vs. 5% of controls), while hyponatremia, hypernatremia, hypophosphatemia, and metabolic alkalosis were the most specific for a subsequent eating disorder diagnosis.
Severe hypokalemia (serum potassium levels of 3.0 mmol/L or lower) and severe hyponatremia (serum sodium, 128 mmol/L or lower) were associated with over sevenfold and fivefold higher odds for the diagnosis of an eating disorder, respectively.
The U.S. Preventive Services Task Force issued its first-ever statement on screening for eating disorders earlier this year.
The task force concluded that there is insufficient evidence to weigh the balance of benefits and harms of screening for eating disorders in adolescents and adults with no signs or symptoms of an eating disorder or concerns about their eating and who have not previously been diagnosed with an eating disorder.
Dr. Hundemer and colleagues believe an incidental electrolyte abnormality may identify candidates at high risk for an underlying eating disorder who many benefit from screening.
Several screening tools of varying complexity have been developed that are validated and accurate in identifying individuals with a potential eating disorder.
They include the SCOFF questionnaire, the Eating Disorder Screen for Primary Care, the Eating Attitudes Test, and the Primary Care Evaluation of Mental Disorders Patient Health Questionnaire.
Underdiagnosed, undertreated
Offering perspective on the findings, Kamryn T. Eddy, PhD, codirector, Eating Disorders Clinical and Research Program, Massachusetts General Hospital, Boston, said the notion “that a physical sign may help to promote eating disorder assessment is important particularly given that early detection can improve outcomes.”
“But this finding appears in the current context of eating disorders going largely underdetected, underdiagnosed, and undertreated across medical and psychiatric settings,” said Dr. Eddy, associate professor, department of psychiatry, Harvard Medical School, Boston.
“Indeed, eating disorders are prevalent and cut across age, sex, gender, weight, race, ethnicity, and socioeconomic strata, and still, many providers do not routinely assess for eating disorders,” Dr. Eddy said.
“I might suggest that perhaps in addition to letting electrolyte abnormalities be a cue to screen for eating disorders, an even more powerful shift toward routine screening and assessment of eating disorders by medical providers be made,” Dr. Eddy said in an interview.
This study was supported by ICES, which is funded by an annual grant from the Ontario Ministry of Health and the Ministry of Health and Long-Term Care. Dr. Hundemer and Dr. Eddy have disclosed no relevant financial relationships.
A version of this article first appeared on Medscape.com.
FROM JAMA NETWORK OPEN
Postpartum posttraumatic stress disorder: An underestimated reality?
PAU, FRANCE – Postpartum posttraumatic stress disorder tends to get worse over the months following the birth of a child. Therefore, it’s necessary to screen for it as early on as possible and to ensure that women who are affected are given the proper treatment. This was the message delivered during the Infogyn 2022 conference by Ludivine Franchitto, MD, a child psychiatrist at Toulouse University Hospital, France. Because postpartum PTSD is still not fully recognized, treatment remains inadequate and poorly documented.
Impact on the caregivers as well
“The situation is the same as what we saw with postpartum depression. The debate went on for 20 years before its existence was formally declared,” Dr. Franchitto noted. But for her, the important thing is not knowing whether a traumatic stress state may be experienced by the mother who had complications during pregnancy or delivery. Instead, it’s about focusing on the repercussions for the child.
During her presentation, Dr. Franchitto also pointed out that it’s necessary to recognize that caregivers who work in maternity wards may also be negatively impacted, as they routinely see the complications that women have during pregnancy and delivery. These workers may also develop a PTSD state, requiring support so that they can properly carry out their duties.
According to the Diagnostic and Statistical Manual of Mental Disorders, Fifth Edition (DSM-V), posttraumatic stress disorder arises after exposure to actual (or threatened) death, serious injury, or sexual violence. Individuals who have witnessed a traumatic event in person or who have experienced repeated (or extreme) exposure to aversive details of traumatic events may also develop PTSD.
Dr. Franchitto mentioned some of the criteria needed to make the diagnosis. “Intrusive distressing memories of the event, recurrent distressing dreams related to the event, persistent avoidance of stimuli associated with the traumatic event, or negative alterations in cognitions and mood associated with the traumatic event. And the duration of the disturbance is more than 1 month.” There may also be marked alterations in arousal and reactivity associated with the traumatic event (for example, irritable behavior, loss of awareness of present surroundings).
Prevalent in 18% of women in high-risk groups
According to the studies, there is a wide variability of PTSD rates. If referring only to traumatic symptoms (for example, depressive syndrome, suicidal ideation, hyperreactivity, and persistent avoidance), the rate could reach up to 40%. A 2016 meta-analysis of 59 studies found that the prevalence of childbirth-related PTSD was 5.9%.
The authors distinguished two groups of women: those without complications during pregnancy or during delivery and those with severe complications related to the pregnancy, a fear of giving birth, a difficult delivery, an emergency C-section, a baby born prematurely with birth defects, etc. Their analysis showed PTSD rates of 4% and 18.5%, respectively.
Surprisingly, the major risk factor for PTSD turned out to be uncontrollable vomiting during pregnancy (seen in 40% of postpartum PTSD cases). The birth of a baby with birth defects was the second risk factor (35%), and the third, a history of violence in the mother’s childhood (34%). Women who experienced depression during the delivery were also at higher risk.
Other risk factors identified were lack of communication with the health care team, lack of consent, lack of support from the medical staff, and a long labor. Conversely, a sense of control and the support of a partner play a protective role.
Early screening
“If the symptoms of posttraumatic stress disorder aren’t treated after delivery, they tend to get worse over the period of 1 to 6 months following the child’s birth,” Dr. Franchitto indicated. This is why it’s necessary to screen for it as early as possible – in particular, by having the women fill out the City Birth Trauma Scale questionnaire – and provide proper treatment accordingly. When seeking to limit the effects of stress, early intervention by a psychologist may be beneficial.
Psychotherapy is the recommended first-line treatment for PTSD, especially cognitive behavioral therapy and Eye Movement Desensitization and Reprocessing therapy. This approach aims to limit the mental and behavioral avoidance that prevents the traumatic memory from being integrated and processed as a regular memory.
The consequences that the mother’s PTSD state has on the child are well documented. “Children whose mothers had PTSD during pregnancy have a lower birth weight and a shorter breast-feeding duration,” Dr. Franchitto reported. With respect to the quality of the mother-child relationship and the long-term development of the child, “the studies have highly conflicting findings.”
At the end of the presentation, Professor Israël Nisand, MD, an ob.gyn. at the American Hospital of Paris and the former president of the National College of French Gynecologists and Obstetricians, made the following comment: “I often think that we underestimate the consequences that the mother’s posttraumatic stress has on the child postpartum.” He added, “Postpartum posttraumatic stress disorder is a reality. Yet it isn’t screened for, let alone treated, even though it has serious consequences for the child.”
Dr. Franchitto also brought up the impact on members of the health care staff, the “second victims” of the traumatic events that occur while caring for the women in the maternity ward. “The estimated prevalence of PTSD symptoms among midwives is 22.9%,” which could lead to “a loss of confidence and a desire to leave the profession.”
Providing psychoeducation to health care staff
Dr. Franchitto believes that it’s essential to also protect caregivers who work in maternity wards. “It’s important to have the support of colleagues” – in particular, of team leaders – “and to share one’s experiences,” as long as one knows how to recognize the symptoms of posttraumatic stress through one’s emotions and is able to verbalize them.
She went on to say that providing psychoeducation to health care staff is therefore to be encouraged, as is “simulation-based training, for learning how to manage problematic situations.”
This content was originally published on Medscape French edition. A translated version appeared on Medscape.com.
PAU, FRANCE – Postpartum posttraumatic stress disorder tends to get worse over the months following the birth of a child. Therefore, it’s necessary to screen for it as early on as possible and to ensure that women who are affected are given the proper treatment. This was the message delivered during the Infogyn 2022 conference by Ludivine Franchitto, MD, a child psychiatrist at Toulouse University Hospital, France. Because postpartum PTSD is still not fully recognized, treatment remains inadequate and poorly documented.
Impact on the caregivers as well
“The situation is the same as what we saw with postpartum depression. The debate went on for 20 years before its existence was formally declared,” Dr. Franchitto noted. But for her, the important thing is not knowing whether a traumatic stress state may be experienced by the mother who had complications during pregnancy or delivery. Instead, it’s about focusing on the repercussions for the child.
During her presentation, Dr. Franchitto also pointed out that it’s necessary to recognize that caregivers who work in maternity wards may also be negatively impacted, as they routinely see the complications that women have during pregnancy and delivery. These workers may also develop a PTSD state, requiring support so that they can properly carry out their duties.
According to the Diagnostic and Statistical Manual of Mental Disorders, Fifth Edition (DSM-V), posttraumatic stress disorder arises after exposure to actual (or threatened) death, serious injury, or sexual violence. Individuals who have witnessed a traumatic event in person or who have experienced repeated (or extreme) exposure to aversive details of traumatic events may also develop PTSD.
Dr. Franchitto mentioned some of the criteria needed to make the diagnosis. “Intrusive distressing memories of the event, recurrent distressing dreams related to the event, persistent avoidance of stimuli associated with the traumatic event, or negative alterations in cognitions and mood associated with the traumatic event. And the duration of the disturbance is more than 1 month.” There may also be marked alterations in arousal and reactivity associated with the traumatic event (for example, irritable behavior, loss of awareness of present surroundings).
Prevalent in 18% of women in high-risk groups
According to the studies, there is a wide variability of PTSD rates. If referring only to traumatic symptoms (for example, depressive syndrome, suicidal ideation, hyperreactivity, and persistent avoidance), the rate could reach up to 40%. A 2016 meta-analysis of 59 studies found that the prevalence of childbirth-related PTSD was 5.9%.
The authors distinguished two groups of women: those without complications during pregnancy or during delivery and those with severe complications related to the pregnancy, a fear of giving birth, a difficult delivery, an emergency C-section, a baby born prematurely with birth defects, etc. Their analysis showed PTSD rates of 4% and 18.5%, respectively.
Surprisingly, the major risk factor for PTSD turned out to be uncontrollable vomiting during pregnancy (seen in 40% of postpartum PTSD cases). The birth of a baby with birth defects was the second risk factor (35%), and the third, a history of violence in the mother’s childhood (34%). Women who experienced depression during the delivery were also at higher risk.
Other risk factors identified were lack of communication with the health care team, lack of consent, lack of support from the medical staff, and a long labor. Conversely, a sense of control and the support of a partner play a protective role.
Early screening
“If the symptoms of posttraumatic stress disorder aren’t treated after delivery, they tend to get worse over the period of 1 to 6 months following the child’s birth,” Dr. Franchitto indicated. This is why it’s necessary to screen for it as early as possible – in particular, by having the women fill out the City Birth Trauma Scale questionnaire – and provide proper treatment accordingly. When seeking to limit the effects of stress, early intervention by a psychologist may be beneficial.
Psychotherapy is the recommended first-line treatment for PTSD, especially cognitive behavioral therapy and Eye Movement Desensitization and Reprocessing therapy. This approach aims to limit the mental and behavioral avoidance that prevents the traumatic memory from being integrated and processed as a regular memory.
The consequences that the mother’s PTSD state has on the child are well documented. “Children whose mothers had PTSD during pregnancy have a lower birth weight and a shorter breast-feeding duration,” Dr. Franchitto reported. With respect to the quality of the mother-child relationship and the long-term development of the child, “the studies have highly conflicting findings.”
At the end of the presentation, Professor Israël Nisand, MD, an ob.gyn. at the American Hospital of Paris and the former president of the National College of French Gynecologists and Obstetricians, made the following comment: “I often think that we underestimate the consequences that the mother’s posttraumatic stress has on the child postpartum.” He added, “Postpartum posttraumatic stress disorder is a reality. Yet it isn’t screened for, let alone treated, even though it has serious consequences for the child.”
Dr. Franchitto also brought up the impact on members of the health care staff, the “second victims” of the traumatic events that occur while caring for the women in the maternity ward. “The estimated prevalence of PTSD symptoms among midwives is 22.9%,” which could lead to “a loss of confidence and a desire to leave the profession.”
Providing psychoeducation to health care staff
Dr. Franchitto believes that it’s essential to also protect caregivers who work in maternity wards. “It’s important to have the support of colleagues” – in particular, of team leaders – “and to share one’s experiences,” as long as one knows how to recognize the symptoms of posttraumatic stress through one’s emotions and is able to verbalize them.
She went on to say that providing psychoeducation to health care staff is therefore to be encouraged, as is “simulation-based training, for learning how to manage problematic situations.”
This content was originally published on Medscape French edition. A translated version appeared on Medscape.com.
PAU, FRANCE – Postpartum posttraumatic stress disorder tends to get worse over the months following the birth of a child. Therefore, it’s necessary to screen for it as early on as possible and to ensure that women who are affected are given the proper treatment. This was the message delivered during the Infogyn 2022 conference by Ludivine Franchitto, MD, a child psychiatrist at Toulouse University Hospital, France. Because postpartum PTSD is still not fully recognized, treatment remains inadequate and poorly documented.
Impact on the caregivers as well
“The situation is the same as what we saw with postpartum depression. The debate went on for 20 years before its existence was formally declared,” Dr. Franchitto noted. But for her, the important thing is not knowing whether a traumatic stress state may be experienced by the mother who had complications during pregnancy or delivery. Instead, it’s about focusing on the repercussions for the child.
During her presentation, Dr. Franchitto also pointed out that it’s necessary to recognize that caregivers who work in maternity wards may also be negatively impacted, as they routinely see the complications that women have during pregnancy and delivery. These workers may also develop a PTSD state, requiring support so that they can properly carry out their duties.
According to the Diagnostic and Statistical Manual of Mental Disorders, Fifth Edition (DSM-V), posttraumatic stress disorder arises after exposure to actual (or threatened) death, serious injury, or sexual violence. Individuals who have witnessed a traumatic event in person or who have experienced repeated (or extreme) exposure to aversive details of traumatic events may also develop PTSD.
Dr. Franchitto mentioned some of the criteria needed to make the diagnosis. “Intrusive distressing memories of the event, recurrent distressing dreams related to the event, persistent avoidance of stimuli associated with the traumatic event, or negative alterations in cognitions and mood associated with the traumatic event. And the duration of the disturbance is more than 1 month.” There may also be marked alterations in arousal and reactivity associated with the traumatic event (for example, irritable behavior, loss of awareness of present surroundings).
Prevalent in 18% of women in high-risk groups
According to the studies, there is a wide variability of PTSD rates. If referring only to traumatic symptoms (for example, depressive syndrome, suicidal ideation, hyperreactivity, and persistent avoidance), the rate could reach up to 40%. A 2016 meta-analysis of 59 studies found that the prevalence of childbirth-related PTSD was 5.9%.
The authors distinguished two groups of women: those without complications during pregnancy or during delivery and those with severe complications related to the pregnancy, a fear of giving birth, a difficult delivery, an emergency C-section, a baby born prematurely with birth defects, etc. Their analysis showed PTSD rates of 4% and 18.5%, respectively.
Surprisingly, the major risk factor for PTSD turned out to be uncontrollable vomiting during pregnancy (seen in 40% of postpartum PTSD cases). The birth of a baby with birth defects was the second risk factor (35%), and the third, a history of violence in the mother’s childhood (34%). Women who experienced depression during the delivery were also at higher risk.
Other risk factors identified were lack of communication with the health care team, lack of consent, lack of support from the medical staff, and a long labor. Conversely, a sense of control and the support of a partner play a protective role.
Early screening
“If the symptoms of posttraumatic stress disorder aren’t treated after delivery, they tend to get worse over the period of 1 to 6 months following the child’s birth,” Dr. Franchitto indicated. This is why it’s necessary to screen for it as early as possible – in particular, by having the women fill out the City Birth Trauma Scale questionnaire – and provide proper treatment accordingly. When seeking to limit the effects of stress, early intervention by a psychologist may be beneficial.
Psychotherapy is the recommended first-line treatment for PTSD, especially cognitive behavioral therapy and Eye Movement Desensitization and Reprocessing therapy. This approach aims to limit the mental and behavioral avoidance that prevents the traumatic memory from being integrated and processed as a regular memory.
The consequences that the mother’s PTSD state has on the child are well documented. “Children whose mothers had PTSD during pregnancy have a lower birth weight and a shorter breast-feeding duration,” Dr. Franchitto reported. With respect to the quality of the mother-child relationship and the long-term development of the child, “the studies have highly conflicting findings.”
At the end of the presentation, Professor Israël Nisand, MD, an ob.gyn. at the American Hospital of Paris and the former president of the National College of French Gynecologists and Obstetricians, made the following comment: “I often think that we underestimate the consequences that the mother’s posttraumatic stress has on the child postpartum.” He added, “Postpartum posttraumatic stress disorder is a reality. Yet it isn’t screened for, let alone treated, even though it has serious consequences for the child.”
Dr. Franchitto also brought up the impact on members of the health care staff, the “second victims” of the traumatic events that occur while caring for the women in the maternity ward. “The estimated prevalence of PTSD symptoms among midwives is 22.9%,” which could lead to “a loss of confidence and a desire to leave the profession.”
Providing psychoeducation to health care staff
Dr. Franchitto believes that it’s essential to also protect caregivers who work in maternity wards. “It’s important to have the support of colleagues” – in particular, of team leaders – “and to share one’s experiences,” as long as one knows how to recognize the symptoms of posttraumatic stress through one’s emotions and is able to verbalize them.
She went on to say that providing psychoeducation to health care staff is therefore to be encouraged, as is “simulation-based training, for learning how to manage problematic situations.”
This content was originally published on Medscape French edition. A translated version appeared on Medscape.com.
‘A huge deal’: Millions have long COVID, and more are expected
with symptoms that have lasted 3 months or longer, according to the latest U.S. government survey done in October. More than a quarter say their condition is severe enough to significantly limit their day-to-day activities – yet the problem is only barely starting to get the attention of employers, the health care system, and policymakers.
With no cure or treatment in sight, long COVID is already burdening not only the health care system, but also the economy – and that burden is set to grow. Many experts worry about the possible long-term ripple effects, from increased spending on medical care costs to lost wages due to not being able to work, as well as the policy implications that come with addressing these issues.
“At this point, anyone who’s looking at this seriously would say this is a huge deal,” says senior Brookings Institution fellow Katie Bach, the author of a study that analyzed long COVID’s impact on the labor market.
“We need a real concerted focus on treating these people, which means both research and the clinical side, and figuring out how to build a labor market that is more inclusive of people with disabilities,” she said.
It’s not only that many people are affected. It’s that they are often affected for months and possibly even years.
The U.S. government figures suggest more than 18 million people could have symptoms of long COVID right now. The latest Household Pulse Survey by the Census Bureau and the National Center for Health Statistics takes data from 41,415 people.
A preprint of a study by researchers from City University of New York, posted on medRxiv in September and based on a similar population survey done between June 30 and July 2, drew comparable results. The study has not been peer reviewed.
More than 7% of all those who answered said they had long COVID at the time of the survey, which the researchers said corresponded to approximately 18.5 million U.S. adults. The same study found that a quarter of those, or an estimated 4.7 million adults, said their daily activities were impacted “a lot.”
This can translate into pain not only for the patients, but for governments and employers, too.
In high-income countries around the world, government surveys and other studies are shedding light on the extent to which post-COVID-19 symptoms – commonly known as long COVID – are affecting populations. While results vary, they generally fall within similar ranges.
The World Health Organization estimates that between 10% and 20% of those with COVID-19 go on to have an array of medium- to long-term post-COVID-19 symptoms that range from mild to debilitating. The U.S. Government Accountability Office puts that estimate at 10% to 30%; one of the latest studies published at the end of October in The Journal of the American Medical Association found that 15% of U.S. adults who had tested positive for COVID-19 reported current long COVID symptoms. Elsewhere, a study from the Netherlands published in The Lancet in August found that one in eight COVID-19 cases, or 12.7%, were likely to become long COVID.
“It’s very clear that the condition is devastating people’s lives and livelihoods,” WHO Director-General Tedros Adhanom Ghebreyesus wrote in an article for The Guardian newspaper in October.
“The world has already lost a significant number of the workforce to illness, death, fatigue, unplanned retirement due to an increase in long-term disability, which not only impacts the health system, but is a hit to the overarching economy … the impact of long COVID for all countries is very serious and needs immediate and sustained action equivalent to its scale.”
Global snapshot: Lasting symptoms, impact on activities
Patients describe a spectrum of persistent issues, with extreme fatigue, brain fog or cognitive problems, and shortness of breath among the most common complaints. Many also have manageable symptoms that worsen significantly after even mild physical or mental exertion.
Women appear almost twice as likely as men to get long COVID. Many patients have other medical conditions and disabilities that make them more vulnerable to the condition. Those who face greater obstacles accessing health care due to discrimination or socioeconomic inequity are at higher risk as well.
While many are older, a large number are also in their prime working age. The Census Bureau data show that people ages 40-49 are more likely than any other group to get long COVID, which has broader implications for labor markets and the global economy. Already, experts have estimated that long COVID is likely to cost the U.S. trillions of dollars and affect multiple industries.
“Whether they’re in the financial world, the medical system, lawyers, they’re telling me they’re sitting at the computer screen and they’re unable to process the data,” said Zachary Schwartz, MD, medical director for Vancouver General Hospital’s Post-COVID-19 Recovery Clinic.
“That is what’s most distressing for people, in that they’re not working, they’re not making money, and they don’t know when, or if, they’re going to get better.”
Nearly a third of respondents in the Census Bureau’s Household Pulse Survey who said they have had COVID-19 reported symptoms that lasted 3 months or longer. People between the ages of 30 and 59 were the most affected, with about 32% reporting symptoms. Across the entire adult U.S. population, the survey found that 1 in 7 adults have had long COVID at some point during the pandemic, with about 1 in 18 saying it limited their activity to some degree, and 1 in 50 saying they have faced “a lot” of limits on their activities. Any way these numbers are dissected, long COVID has impacted a large swath of the population.
Yet research into the causes and possible treatments of long COVID is just getting underway.
“The amount of energy and time devoted to it is way, way less than it should, given how many people are likely affected,” said David Cutler, PhD, professor of economics at Harvard University, Cambridge, Mass., who has written about the economic cost of long COVID. “We’re way, way underdoing it here. And I think that’s really a terrible thing.”
Population surveys and studies from around the world show that long COVID lives up to its name, with people reporting serious symptoms for months on end.
In October, Statistics Canada and the Public Health Agency of Canada published early results from a questionnaire done between spring and summer 2022 that found just under 15% of adults who had a confirmed or suspected case of COVID-19 went on to have new or continuing symptoms 3 or more months later. Nearly half, or 47.3%, dealt with symptoms that lasted a year or more. More than one in five said their symptoms “often or always” limited their day-to-day activities, which included routine tasks such as preparing meals, doing errands and chores, and basic functions such as personal care and moving around in their homes.
Nearly three-quarters of workers or students said they missed an average of 20 days of work or school.
“We haven’t yet been able to determine exactly when symptoms resolve,” said Rainu Kaushal, MD, the senior associate dean for clinical research at Weill Cornell Medicine in New York. She is co-leading a national study on long COVID in adults and children, funded by the National Institutes of Health RECOVER Initiative.
“But there does seem to be, for many of the milder symptoms, resolution at about 4-6 weeks. There seems to be a second point of resolution around 6 months for certain symptoms, and then some symptoms do seem to be permanent, and those tend to be patients who have underlying conditions,” she said.
Reducing the risk
Given all the data so far, experts recommend urgent policy changes to help people with long COVID.
“The population needs to be prepared, that understanding long COVID is going to be a very long and difficult process,” said Alexander Charney, MD, PhD, associate professor and the lead principal investigator of the RECOVER adult cohort at Icahn School of Medicine at Mount Sinai in New York. He said the government can do a great deal to help, including setting up a network of connected clinics treating long COVID, standardizing best practices, and sharing information.
“That would go a long way towards making sure that every person feels like they’re not too far away from a clinic where they can get treated for this particular condition,” he said.
But the only known way to prevent long COVID is to prevent COVID-19 infections in the first place, experts say. That means equitable access to tests, therapeutics, and vaccines.
“I will say that avoiding COVID remains the best treatment in the arsenal right now,” said Dr. Kaushal. This means masking, avoiding crowded places with poor ventilation and high exposure risk, and being up to date on vaccinations, she said.
A number of papers – including a large U.K. study published in May 2022, another one from July, and the JAMA study from October – all suggest that vaccinations can help reduce the risk of long COVID.
“I am absolutely of the belief that vaccination has reduced the incidence and overall amount of long COVID … [and is] still by far the best thing the public can do,” said Dr. Schwartz.
A version of this article first appeared on WebMD.com.
with symptoms that have lasted 3 months or longer, according to the latest U.S. government survey done in October. More than a quarter say their condition is severe enough to significantly limit their day-to-day activities – yet the problem is only barely starting to get the attention of employers, the health care system, and policymakers.
With no cure or treatment in sight, long COVID is already burdening not only the health care system, but also the economy – and that burden is set to grow. Many experts worry about the possible long-term ripple effects, from increased spending on medical care costs to lost wages due to not being able to work, as well as the policy implications that come with addressing these issues.
“At this point, anyone who’s looking at this seriously would say this is a huge deal,” says senior Brookings Institution fellow Katie Bach, the author of a study that analyzed long COVID’s impact on the labor market.
“We need a real concerted focus on treating these people, which means both research and the clinical side, and figuring out how to build a labor market that is more inclusive of people with disabilities,” she said.
It’s not only that many people are affected. It’s that they are often affected for months and possibly even years.
The U.S. government figures suggest more than 18 million people could have symptoms of long COVID right now. The latest Household Pulse Survey by the Census Bureau and the National Center for Health Statistics takes data from 41,415 people.
A preprint of a study by researchers from City University of New York, posted on medRxiv in September and based on a similar population survey done between June 30 and July 2, drew comparable results. The study has not been peer reviewed.
More than 7% of all those who answered said they had long COVID at the time of the survey, which the researchers said corresponded to approximately 18.5 million U.S. adults. The same study found that a quarter of those, or an estimated 4.7 million adults, said their daily activities were impacted “a lot.”
This can translate into pain not only for the patients, but for governments and employers, too.
In high-income countries around the world, government surveys and other studies are shedding light on the extent to which post-COVID-19 symptoms – commonly known as long COVID – are affecting populations. While results vary, they generally fall within similar ranges.
The World Health Organization estimates that between 10% and 20% of those with COVID-19 go on to have an array of medium- to long-term post-COVID-19 symptoms that range from mild to debilitating. The U.S. Government Accountability Office puts that estimate at 10% to 30%; one of the latest studies published at the end of October in The Journal of the American Medical Association found that 15% of U.S. adults who had tested positive for COVID-19 reported current long COVID symptoms. Elsewhere, a study from the Netherlands published in The Lancet in August found that one in eight COVID-19 cases, or 12.7%, were likely to become long COVID.
“It’s very clear that the condition is devastating people’s lives and livelihoods,” WHO Director-General Tedros Adhanom Ghebreyesus wrote in an article for The Guardian newspaper in October.
“The world has already lost a significant number of the workforce to illness, death, fatigue, unplanned retirement due to an increase in long-term disability, which not only impacts the health system, but is a hit to the overarching economy … the impact of long COVID for all countries is very serious and needs immediate and sustained action equivalent to its scale.”
Global snapshot: Lasting symptoms, impact on activities
Patients describe a spectrum of persistent issues, with extreme fatigue, brain fog or cognitive problems, and shortness of breath among the most common complaints. Many also have manageable symptoms that worsen significantly after even mild physical or mental exertion.
Women appear almost twice as likely as men to get long COVID. Many patients have other medical conditions and disabilities that make them more vulnerable to the condition. Those who face greater obstacles accessing health care due to discrimination or socioeconomic inequity are at higher risk as well.
While many are older, a large number are also in their prime working age. The Census Bureau data show that people ages 40-49 are more likely than any other group to get long COVID, which has broader implications for labor markets and the global economy. Already, experts have estimated that long COVID is likely to cost the U.S. trillions of dollars and affect multiple industries.
“Whether they’re in the financial world, the medical system, lawyers, they’re telling me they’re sitting at the computer screen and they’re unable to process the data,” said Zachary Schwartz, MD, medical director for Vancouver General Hospital’s Post-COVID-19 Recovery Clinic.
“That is what’s most distressing for people, in that they’re not working, they’re not making money, and they don’t know when, or if, they’re going to get better.”
Nearly a third of respondents in the Census Bureau’s Household Pulse Survey who said they have had COVID-19 reported symptoms that lasted 3 months or longer. People between the ages of 30 and 59 were the most affected, with about 32% reporting symptoms. Across the entire adult U.S. population, the survey found that 1 in 7 adults have had long COVID at some point during the pandemic, with about 1 in 18 saying it limited their activity to some degree, and 1 in 50 saying they have faced “a lot” of limits on their activities. Any way these numbers are dissected, long COVID has impacted a large swath of the population.
Yet research into the causes and possible treatments of long COVID is just getting underway.
“The amount of energy and time devoted to it is way, way less than it should, given how many people are likely affected,” said David Cutler, PhD, professor of economics at Harvard University, Cambridge, Mass., who has written about the economic cost of long COVID. “We’re way, way underdoing it here. And I think that’s really a terrible thing.”
Population surveys and studies from around the world show that long COVID lives up to its name, with people reporting serious symptoms for months on end.
In October, Statistics Canada and the Public Health Agency of Canada published early results from a questionnaire done between spring and summer 2022 that found just under 15% of adults who had a confirmed or suspected case of COVID-19 went on to have new or continuing symptoms 3 or more months later. Nearly half, or 47.3%, dealt with symptoms that lasted a year or more. More than one in five said their symptoms “often or always” limited their day-to-day activities, which included routine tasks such as preparing meals, doing errands and chores, and basic functions such as personal care and moving around in their homes.
Nearly three-quarters of workers or students said they missed an average of 20 days of work or school.
“We haven’t yet been able to determine exactly when symptoms resolve,” said Rainu Kaushal, MD, the senior associate dean for clinical research at Weill Cornell Medicine in New York. She is co-leading a national study on long COVID in adults and children, funded by the National Institutes of Health RECOVER Initiative.
“But there does seem to be, for many of the milder symptoms, resolution at about 4-6 weeks. There seems to be a second point of resolution around 6 months for certain symptoms, and then some symptoms do seem to be permanent, and those tend to be patients who have underlying conditions,” she said.
Reducing the risk
Given all the data so far, experts recommend urgent policy changes to help people with long COVID.
“The population needs to be prepared, that understanding long COVID is going to be a very long and difficult process,” said Alexander Charney, MD, PhD, associate professor and the lead principal investigator of the RECOVER adult cohort at Icahn School of Medicine at Mount Sinai in New York. He said the government can do a great deal to help, including setting up a network of connected clinics treating long COVID, standardizing best practices, and sharing information.
“That would go a long way towards making sure that every person feels like they’re not too far away from a clinic where they can get treated for this particular condition,” he said.
But the only known way to prevent long COVID is to prevent COVID-19 infections in the first place, experts say. That means equitable access to tests, therapeutics, and vaccines.
“I will say that avoiding COVID remains the best treatment in the arsenal right now,” said Dr. Kaushal. This means masking, avoiding crowded places with poor ventilation and high exposure risk, and being up to date on vaccinations, she said.
A number of papers – including a large U.K. study published in May 2022, another one from July, and the JAMA study from October – all suggest that vaccinations can help reduce the risk of long COVID.
“I am absolutely of the belief that vaccination has reduced the incidence and overall amount of long COVID … [and is] still by far the best thing the public can do,” said Dr. Schwartz.
A version of this article first appeared on WebMD.com.
with symptoms that have lasted 3 months or longer, according to the latest U.S. government survey done in October. More than a quarter say their condition is severe enough to significantly limit their day-to-day activities – yet the problem is only barely starting to get the attention of employers, the health care system, and policymakers.
With no cure or treatment in sight, long COVID is already burdening not only the health care system, but also the economy – and that burden is set to grow. Many experts worry about the possible long-term ripple effects, from increased spending on medical care costs to lost wages due to not being able to work, as well as the policy implications that come with addressing these issues.
“At this point, anyone who’s looking at this seriously would say this is a huge deal,” says senior Brookings Institution fellow Katie Bach, the author of a study that analyzed long COVID’s impact on the labor market.
“We need a real concerted focus on treating these people, which means both research and the clinical side, and figuring out how to build a labor market that is more inclusive of people with disabilities,” she said.
It’s not only that many people are affected. It’s that they are often affected for months and possibly even years.
The U.S. government figures suggest more than 18 million people could have symptoms of long COVID right now. The latest Household Pulse Survey by the Census Bureau and the National Center for Health Statistics takes data from 41,415 people.
A preprint of a study by researchers from City University of New York, posted on medRxiv in September and based on a similar population survey done between June 30 and July 2, drew comparable results. The study has not been peer reviewed.
More than 7% of all those who answered said they had long COVID at the time of the survey, which the researchers said corresponded to approximately 18.5 million U.S. adults. The same study found that a quarter of those, or an estimated 4.7 million adults, said their daily activities were impacted “a lot.”
This can translate into pain not only for the patients, but for governments and employers, too.
In high-income countries around the world, government surveys and other studies are shedding light on the extent to which post-COVID-19 symptoms – commonly known as long COVID – are affecting populations. While results vary, they generally fall within similar ranges.
The World Health Organization estimates that between 10% and 20% of those with COVID-19 go on to have an array of medium- to long-term post-COVID-19 symptoms that range from mild to debilitating. The U.S. Government Accountability Office puts that estimate at 10% to 30%; one of the latest studies published at the end of October in The Journal of the American Medical Association found that 15% of U.S. adults who had tested positive for COVID-19 reported current long COVID symptoms. Elsewhere, a study from the Netherlands published in The Lancet in August found that one in eight COVID-19 cases, or 12.7%, were likely to become long COVID.
“It’s very clear that the condition is devastating people’s lives and livelihoods,” WHO Director-General Tedros Adhanom Ghebreyesus wrote in an article for The Guardian newspaper in October.
“The world has already lost a significant number of the workforce to illness, death, fatigue, unplanned retirement due to an increase in long-term disability, which not only impacts the health system, but is a hit to the overarching economy … the impact of long COVID for all countries is very serious and needs immediate and sustained action equivalent to its scale.”
Global snapshot: Lasting symptoms, impact on activities
Patients describe a spectrum of persistent issues, with extreme fatigue, brain fog or cognitive problems, and shortness of breath among the most common complaints. Many also have manageable symptoms that worsen significantly after even mild physical or mental exertion.
Women appear almost twice as likely as men to get long COVID. Many patients have other medical conditions and disabilities that make them more vulnerable to the condition. Those who face greater obstacles accessing health care due to discrimination or socioeconomic inequity are at higher risk as well.
While many are older, a large number are also in their prime working age. The Census Bureau data show that people ages 40-49 are more likely than any other group to get long COVID, which has broader implications for labor markets and the global economy. Already, experts have estimated that long COVID is likely to cost the U.S. trillions of dollars and affect multiple industries.
“Whether they’re in the financial world, the medical system, lawyers, they’re telling me they’re sitting at the computer screen and they’re unable to process the data,” said Zachary Schwartz, MD, medical director for Vancouver General Hospital’s Post-COVID-19 Recovery Clinic.
“That is what’s most distressing for people, in that they’re not working, they’re not making money, and they don’t know when, or if, they’re going to get better.”
Nearly a third of respondents in the Census Bureau’s Household Pulse Survey who said they have had COVID-19 reported symptoms that lasted 3 months or longer. People between the ages of 30 and 59 were the most affected, with about 32% reporting symptoms. Across the entire adult U.S. population, the survey found that 1 in 7 adults have had long COVID at some point during the pandemic, with about 1 in 18 saying it limited their activity to some degree, and 1 in 50 saying they have faced “a lot” of limits on their activities. Any way these numbers are dissected, long COVID has impacted a large swath of the population.
Yet research into the causes and possible treatments of long COVID is just getting underway.
“The amount of energy and time devoted to it is way, way less than it should, given how many people are likely affected,” said David Cutler, PhD, professor of economics at Harvard University, Cambridge, Mass., who has written about the economic cost of long COVID. “We’re way, way underdoing it here. And I think that’s really a terrible thing.”
Population surveys and studies from around the world show that long COVID lives up to its name, with people reporting serious symptoms for months on end.
In October, Statistics Canada and the Public Health Agency of Canada published early results from a questionnaire done between spring and summer 2022 that found just under 15% of adults who had a confirmed or suspected case of COVID-19 went on to have new or continuing symptoms 3 or more months later. Nearly half, or 47.3%, dealt with symptoms that lasted a year or more. More than one in five said their symptoms “often or always” limited their day-to-day activities, which included routine tasks such as preparing meals, doing errands and chores, and basic functions such as personal care and moving around in their homes.
Nearly three-quarters of workers or students said they missed an average of 20 days of work or school.
“We haven’t yet been able to determine exactly when symptoms resolve,” said Rainu Kaushal, MD, the senior associate dean for clinical research at Weill Cornell Medicine in New York. She is co-leading a national study on long COVID in adults and children, funded by the National Institutes of Health RECOVER Initiative.
“But there does seem to be, for many of the milder symptoms, resolution at about 4-6 weeks. There seems to be a second point of resolution around 6 months for certain symptoms, and then some symptoms do seem to be permanent, and those tend to be patients who have underlying conditions,” she said.
Reducing the risk
Given all the data so far, experts recommend urgent policy changes to help people with long COVID.
“The population needs to be prepared, that understanding long COVID is going to be a very long and difficult process,” said Alexander Charney, MD, PhD, associate professor and the lead principal investigator of the RECOVER adult cohort at Icahn School of Medicine at Mount Sinai in New York. He said the government can do a great deal to help, including setting up a network of connected clinics treating long COVID, standardizing best practices, and sharing information.
“That would go a long way towards making sure that every person feels like they’re not too far away from a clinic where they can get treated for this particular condition,” he said.
But the only known way to prevent long COVID is to prevent COVID-19 infections in the first place, experts say. That means equitable access to tests, therapeutics, and vaccines.
“I will say that avoiding COVID remains the best treatment in the arsenal right now,” said Dr. Kaushal. This means masking, avoiding crowded places with poor ventilation and high exposure risk, and being up to date on vaccinations, she said.
A number of papers – including a large U.K. study published in May 2022, another one from July, and the JAMA study from October – all suggest that vaccinations can help reduce the risk of long COVID.
“I am absolutely of the belief that vaccination has reduced the incidence and overall amount of long COVID … [and is] still by far the best thing the public can do,” said Dr. Schwartz.
A version of this article first appeared on WebMD.com.
Meditation equal to first-line medication for anxiety
“I would encourage clinicians to list meditation training as one possible treatment option for patients who are diagnosed with anxiety disorders. Doctors should feel comfortable recommending in-person, group-based meditation classes,” study investigator Elizabeth A. Hoge, MD, director, Anxiety Disorders Research Program, Georgetown University Medical Center, Washington, told this news organization.
The findings were published online in JAMA Psychiatry.
Screening recommended
Anxiety disorders, including generalized anxiety, social anxiety, panic disorder, and agoraphobia, are the most common type of mental disorder, affecting an estimated 301 million people worldwide. Owing to their high prevalence, the United States Preventive Services Task Force recommends screening for anxiety disorders.
Effective treatments for anxiety disorders include medications and cognitive-behavioral therapy. However, not all patients have access to these interventions, respond to them, or are comfortable seeking care in a psychiatric setting.
Mindfulness meditation, which has risen in popularity in recent years, may help people experiencing intrusive, anxious thoughts. “By practicing mindfulness meditation, people learn not to be overwhelmed by those thoughts,” said Dr. Hoge.
The study included 276 adult patients with an anxiety disorder, mostly generalized anxiety or social anxiety. The mean age of the study population was 33 years; 75% were women, 59% were White, 15% were Black, and 20% were Asian.
Researchers randomly assigned 136 patients to receive MBSR and 140 to receive the selective serotonin reuptake inhibitor escitalopram, a first-line medication for treating anxiety disorders.
The MBSR intervention included a weekly 2.5-hour class and a day-long weekend class. Participants also completed daily 45-minute guided meditation sessions at home. They learned mindfulness meditation exercises, including breath awareness, body scanning, and mindful movement.
Those in the escitalopram group initially received 10 mg of the oral drug daily. The dose was increased to 20 mg daily at week 2 if well tolerated.
The primary outcome was the score on the Clinical Global Impression of Severity (CGI-S) scale for anxiety, assessed by clinicians blinded to treatment allocation. This instrument measures overall symptom severity on a scale from 1 (not at all ill) to 7 (most extremely ill) and can be used to assess different types of anxiety disorders, said Dr. Hoge.
Among the 208 participants who completed the study, the baseline mean CGI-S score was 4.44 for MBSR and 4.51 for escitalopram. At week 8, on the CGI-S scale, the MBSR group’s score improved by a mean of 1.35 points, and the escitalopram group’s score improved by 1.43 points (difference of –0.07; 95% CI, –0.38 to 0.23; P = .65).
The lower end of the confidence interval (–0.38) was smaller than the prespecified noninferiority margin of –0.495, indicating noninferiority of MBSR, compared with escitalopram.
Remarkable results
“What was remarkable was that the medication worked great, like it always does, but the meditation also worked great; we saw about a 30% drop in symptoms for both groups,” said Dr. Hoge. “That helps us know that meditation, and in particular mindfulness meditation, could be useful as a first-line treatment for patients with anxiety disorders.”
The patient-reported outcome of the Overall Anxiety Severity and Impairment Scale also showed no significant group differences. “It’s important to have the self-reports, because that gives us two ways to look at the information,” said Dr. Hoge.
Anecdotally, participants noted that the meditation helped with their personal relationships and with being “kinder to themselves,” said Dr. Hoge. “In meditation, there’s an implicit teaching to be accepting and nonjudgmental towards your own thoughts, and that teaches people to be more self-compassionate.”
Just over 78% of patients in the escitalopram group had at least one treatment-related adverse event (AE), which included sleep disturbances, nausea, fatigue, and headache, compared with 15.4% in the MBSR group.
The most common AE in the meditation group was anxiety, which is “counterintuitive” but represents “a momentary anxiety,” said Dr. Hoge. “People who are meditating have feelings come up that maybe they didn’t pay attention to before. This gives them an opportunity to process through those emotions.”
Fatigue was the next most common AE for meditators, which “makes sense,” since they’re putting away their phones and not being stimulated, said Dr. Hoge.
MBSR was delivered in person, which limits extrapolation to mindfulness apps or programs delivered over the internet. Dr. Hoge believes apps would likely be less effective because they don’t have the face-to-face component, instructors available for consultation, or fellow participants contributing group support.
But online classes might work if “the exact same class,” including all its components, is moved online, she said.
MBSR is available in all major U.S. cities, doesn’t require finding a therapist, and is available outside a mental health environment – for example, at yoga centers and some places of employment. Anyone can learn MBSR, although it takes time and commitment, said Dr. Hoge.
A time-tested intervention
Commenting on the study, psychiatrist Gregory Scott Brown, MD, affiliate faculty, University of Texas Dell Medical School, and author of “The Self-Healing Mind: An Essential Five-Step Practice for Overcoming Anxiety and Depression and Revitalizing Your Life,” said the results aren’t surprising inasmuch as mindfulness, including spirituality, breath work, and meditation, is a “time-tested and evidence-based” intervention.

“I’m encouraged by the fact studies like this are now being conducted and there’s more evidence that supports these mindfulness-based interventions, so they can start to make their way into standard-of-care treatments.” he said.
He noted that mindfulness can produce “long-term, sustainable improvements” and that the 45-minute daily home exercise included in the study “is not a huge time commitment when you talk about benefits you can potentially glean from incorporating that time.”
Because most study participants were women and “men are anxious too,” Dr. Brown said he would like to see the study replicated “with a more diverse pool of participants.”
The study was supported by the Patient-Centered Outcomes Research Institute. Dr. Hoge and Dr. Brown have reported no relevant financial relationships.
A version of this article first appeared on Medscape.com.
“I would encourage clinicians to list meditation training as one possible treatment option for patients who are diagnosed with anxiety disorders. Doctors should feel comfortable recommending in-person, group-based meditation classes,” study investigator Elizabeth A. Hoge, MD, director, Anxiety Disorders Research Program, Georgetown University Medical Center, Washington, told this news organization.
The findings were published online in JAMA Psychiatry.
Screening recommended
Anxiety disorders, including generalized anxiety, social anxiety, panic disorder, and agoraphobia, are the most common type of mental disorder, affecting an estimated 301 million people worldwide. Owing to their high prevalence, the United States Preventive Services Task Force recommends screening for anxiety disorders.
Effective treatments for anxiety disorders include medications and cognitive-behavioral therapy. However, not all patients have access to these interventions, respond to them, or are comfortable seeking care in a psychiatric setting.
Mindfulness meditation, which has risen in popularity in recent years, may help people experiencing intrusive, anxious thoughts. “By practicing mindfulness meditation, people learn not to be overwhelmed by those thoughts,” said Dr. Hoge.
The study included 276 adult patients with an anxiety disorder, mostly generalized anxiety or social anxiety. The mean age of the study population was 33 years; 75% were women, 59% were White, 15% were Black, and 20% were Asian.
Researchers randomly assigned 136 patients to receive MBSR and 140 to receive the selective serotonin reuptake inhibitor escitalopram, a first-line medication for treating anxiety disorders.
The MBSR intervention included a weekly 2.5-hour class and a day-long weekend class. Participants also completed daily 45-minute guided meditation sessions at home. They learned mindfulness meditation exercises, including breath awareness, body scanning, and mindful movement.
Those in the escitalopram group initially received 10 mg of the oral drug daily. The dose was increased to 20 mg daily at week 2 if well tolerated.
The primary outcome was the score on the Clinical Global Impression of Severity (CGI-S) scale for anxiety, assessed by clinicians blinded to treatment allocation. This instrument measures overall symptom severity on a scale from 1 (not at all ill) to 7 (most extremely ill) and can be used to assess different types of anxiety disorders, said Dr. Hoge.
Among the 208 participants who completed the study, the baseline mean CGI-S score was 4.44 for MBSR and 4.51 for escitalopram. At week 8, on the CGI-S scale, the MBSR group’s score improved by a mean of 1.35 points, and the escitalopram group’s score improved by 1.43 points (difference of –0.07; 95% CI, –0.38 to 0.23; P = .65).
The lower end of the confidence interval (–0.38) was smaller than the prespecified noninferiority margin of –0.495, indicating noninferiority of MBSR, compared with escitalopram.
Remarkable results
“What was remarkable was that the medication worked great, like it always does, but the meditation also worked great; we saw about a 30% drop in symptoms for both groups,” said Dr. Hoge. “That helps us know that meditation, and in particular mindfulness meditation, could be useful as a first-line treatment for patients with anxiety disorders.”
The patient-reported outcome of the Overall Anxiety Severity and Impairment Scale also showed no significant group differences. “It’s important to have the self-reports, because that gives us two ways to look at the information,” said Dr. Hoge.
Anecdotally, participants noted that the meditation helped with their personal relationships and with being “kinder to themselves,” said Dr. Hoge. “In meditation, there’s an implicit teaching to be accepting and nonjudgmental towards your own thoughts, and that teaches people to be more self-compassionate.”
Just over 78% of patients in the escitalopram group had at least one treatment-related adverse event (AE), which included sleep disturbances, nausea, fatigue, and headache, compared with 15.4% in the MBSR group.
The most common AE in the meditation group was anxiety, which is “counterintuitive” but represents “a momentary anxiety,” said Dr. Hoge. “People who are meditating have feelings come up that maybe they didn’t pay attention to before. This gives them an opportunity to process through those emotions.”
Fatigue was the next most common AE for meditators, which “makes sense,” since they’re putting away their phones and not being stimulated, said Dr. Hoge.
MBSR was delivered in person, which limits extrapolation to mindfulness apps or programs delivered over the internet. Dr. Hoge believes apps would likely be less effective because they don’t have the face-to-face component, instructors available for consultation, or fellow participants contributing group support.
But online classes might work if “the exact same class,” including all its components, is moved online, she said.
MBSR is available in all major U.S. cities, doesn’t require finding a therapist, and is available outside a mental health environment – for example, at yoga centers and some places of employment. Anyone can learn MBSR, although it takes time and commitment, said Dr. Hoge.
A time-tested intervention
Commenting on the study, psychiatrist Gregory Scott Brown, MD, affiliate faculty, University of Texas Dell Medical School, and author of “The Self-Healing Mind: An Essential Five-Step Practice for Overcoming Anxiety and Depression and Revitalizing Your Life,” said the results aren’t surprising inasmuch as mindfulness, including spirituality, breath work, and meditation, is a “time-tested and evidence-based” intervention.
“I’m encouraged by the fact studies like this are now being conducted and there’s more evidence that supports these mindfulness-based interventions, so they can start to make their way into standard-of-care treatments.” he said.
He noted that mindfulness can produce “long-term, sustainable improvements” and that the 45-minute daily home exercise included in the study “is not a huge time commitment when you talk about benefits you can potentially glean from incorporating that time.”
Because most study participants were women and “men are anxious too,” Dr. Brown said he would like to see the study replicated “with a more diverse pool of participants.”
The study was supported by the Patient-Centered Outcomes Research Institute. Dr. Hoge and Dr. Brown have reported no relevant financial relationships.
A version of this article first appeared on Medscape.com.
“I would encourage clinicians to list meditation training as one possible treatment option for patients who are diagnosed with anxiety disorders. Doctors should feel comfortable recommending in-person, group-based meditation classes,” study investigator Elizabeth A. Hoge, MD, director, Anxiety Disorders Research Program, Georgetown University Medical Center, Washington, told this news organization.
The findings were published online in JAMA Psychiatry.
Screening recommended
Anxiety disorders, including generalized anxiety, social anxiety, panic disorder, and agoraphobia, are the most common type of mental disorder, affecting an estimated 301 million people worldwide. Owing to their high prevalence, the United States Preventive Services Task Force recommends screening for anxiety disorders.
Effective treatments for anxiety disorders include medications and cognitive-behavioral therapy. However, not all patients have access to these interventions, respond to them, or are comfortable seeking care in a psychiatric setting.
Mindfulness meditation, which has risen in popularity in recent years, may help people experiencing intrusive, anxious thoughts. “By practicing mindfulness meditation, people learn not to be overwhelmed by those thoughts,” said Dr. Hoge.
The study included 276 adult patients with an anxiety disorder, mostly generalized anxiety or social anxiety. The mean age of the study population was 33 years; 75% were women, 59% were White, 15% were Black, and 20% were Asian.
Researchers randomly assigned 136 patients to receive MBSR and 140 to receive the selective serotonin reuptake inhibitor escitalopram, a first-line medication for treating anxiety disorders.
The MBSR intervention included a weekly 2.5-hour class and a day-long weekend class. Participants also completed daily 45-minute guided meditation sessions at home. They learned mindfulness meditation exercises, including breath awareness, body scanning, and mindful movement.
Those in the escitalopram group initially received 10 mg of the oral drug daily. The dose was increased to 20 mg daily at week 2 if well tolerated.
The primary outcome was the score on the Clinical Global Impression of Severity (CGI-S) scale for anxiety, assessed by clinicians blinded to treatment allocation. This instrument measures overall symptom severity on a scale from 1 (not at all ill) to 7 (most extremely ill) and can be used to assess different types of anxiety disorders, said Dr. Hoge.
Among the 208 participants who completed the study, the baseline mean CGI-S score was 4.44 for MBSR and 4.51 for escitalopram. At week 8, on the CGI-S scale, the MBSR group’s score improved by a mean of 1.35 points, and the escitalopram group’s score improved by 1.43 points (difference of –0.07; 95% CI, –0.38 to 0.23; P = .65).
The lower end of the confidence interval (–0.38) was smaller than the prespecified noninferiority margin of –0.495, indicating noninferiority of MBSR, compared with escitalopram.
Remarkable results
“What was remarkable was that the medication worked great, like it always does, but the meditation also worked great; we saw about a 30% drop in symptoms for both groups,” said Dr. Hoge. “That helps us know that meditation, and in particular mindfulness meditation, could be useful as a first-line treatment for patients with anxiety disorders.”
The patient-reported outcome of the Overall Anxiety Severity and Impairment Scale also showed no significant group differences. “It’s important to have the self-reports, because that gives us two ways to look at the information,” said Dr. Hoge.
Anecdotally, participants noted that the meditation helped with their personal relationships and with being “kinder to themselves,” said Dr. Hoge. “In meditation, there’s an implicit teaching to be accepting and nonjudgmental towards your own thoughts, and that teaches people to be more self-compassionate.”
Just over 78% of patients in the escitalopram group had at least one treatment-related adverse event (AE), which included sleep disturbances, nausea, fatigue, and headache, compared with 15.4% in the MBSR group.
The most common AE in the meditation group was anxiety, which is “counterintuitive” but represents “a momentary anxiety,” said Dr. Hoge. “People who are meditating have feelings come up that maybe they didn’t pay attention to before. This gives them an opportunity to process through those emotions.”
Fatigue was the next most common AE for meditators, which “makes sense,” since they’re putting away their phones and not being stimulated, said Dr. Hoge.
MBSR was delivered in person, which limits extrapolation to mindfulness apps or programs delivered over the internet. Dr. Hoge believes apps would likely be less effective because they don’t have the face-to-face component, instructors available for consultation, or fellow participants contributing group support.
But online classes might work if “the exact same class,” including all its components, is moved online, she said.
MBSR is available in all major U.S. cities, doesn’t require finding a therapist, and is available outside a mental health environment – for example, at yoga centers and some places of employment. Anyone can learn MBSR, although it takes time and commitment, said Dr. Hoge.
A time-tested intervention
Commenting on the study, psychiatrist Gregory Scott Brown, MD, affiliate faculty, University of Texas Dell Medical School, and author of “The Self-Healing Mind: An Essential Five-Step Practice for Overcoming Anxiety and Depression and Revitalizing Your Life,” said the results aren’t surprising inasmuch as mindfulness, including spirituality, breath work, and meditation, is a “time-tested and evidence-based” intervention.
“I’m encouraged by the fact studies like this are now being conducted and there’s more evidence that supports these mindfulness-based interventions, so they can start to make their way into standard-of-care treatments.” he said.
He noted that mindfulness can produce “long-term, sustainable improvements” and that the 45-minute daily home exercise included in the study “is not a huge time commitment when you talk about benefits you can potentially glean from incorporating that time.”
Because most study participants were women and “men are anxious too,” Dr. Brown said he would like to see the study replicated “with a more diverse pool of participants.”
The study was supported by the Patient-Centered Outcomes Research Institute. Dr. Hoge and Dr. Brown have reported no relevant financial relationships.
A version of this article first appeared on Medscape.com.
FROM JAMA PSYCHIATRY
Meditation for children
Meditation has become a popular practice in the United States over the last decade. It is not limited to adults, but can be learned and practiced by children and teenagers also. Variants are being used in many schools as parts of a social and emotional learning curriculum, and different kinds of mindfulness practices are common parts of psychological treatments. In this month’s column, we will review the evidence that supports the efficacy of a meditation practice to treat the mental health problems that are common in children and adolescents, and review how it might be a useful adjunct to the screening, education, and treatments that you offer your young patients.

There are many different types of meditation practices, but the unifying feature is known as mindfulness. Most broadly, mindfulness refers to a state of nonjudgmental awareness of one’s thoughts, feelings, or sensations. A mindfulness meditation practice involves physical stillness and focused attention, typically on the physical sensations of one’s breath. When thoughts, feelings, or physical sensations intrude on the stillness, one learns to cultivate a nonjudgmental awareness of those experiences without disrupting the state of quiet concentration. It could be said that meditation is easy to learn and difficult to master, and that is why it should be practiced regularly. Part of its growing popularity has undoubtedly been served by the ease with which people can access a variety of guided meditations (through apps, YouTube, and beyond) that make it relatively easy to access a variety of methods to learn how to practice mindfulness meditation.
The benefits of meditation in adults are well-established, including lower blood pressure, lower rates of heart disease, lower markers of inflammation, better sleep, and self-described levels of well-being. Meditation appears to be especially effective at mitigating the cardiovascular, metabolic, autoimmune, and inflammatory consequences of high-stress or unhealthy lifestyles in adults. Children and adolescents typically do not suffer from these diseases, but there is growing evidence that mindfulness practices can improve self-reported stress management skills, well-being, and sleep in young people; skills that can protect their physical and mental health. In addition, there is some evidence that mindfulness can be effective as a treatment for the common psychiatric illnesses of youth.
Anxiety
There is robust evidence for the efficacy of mindfulness-based interventions (including a regular mindfulness meditation practice) in the treatment of anxiety disorders in youth. Multiple studies and meta-analyses have demonstrated significant and sustained improvement in anxiety symptoms in these young patients. This makes sense when one considers that most psychotherapy treatments for anxiety include the cultivation of self-awareness and the ability to recognize the feelings of anxiety. This is critical as youth with anxiety disorders often mistake these feelings for facts. The treatment then shifts toward practice tolerating these feelings to help children develop an appreciation that they can face and manage anxiety and that it does not need to be avoided. Part of tolerating these feelings includes building skills to facilitate calm and physical relaxation in the face of these anxious feelings.
This is the core of exposure-based psychotherapies. Mindfulness practices echo the cultivation of self-awareness with focus and physical calm. Studies have shown that mindfulness-based interventions have significant and lasting effects on the symptoms of anxiety disorders in youth, including those youth with comorbid ADHD and learning disabilities. It is important to be aware that, for youth who have experienced trauma, mindfulness meditation can trigger a flood of re-experiencing phenomena, and it is important that those youth also are receiving treatment for PTSD.
Depression
There is evidence that some of the symptoms that occur as part of depression in adolescents improve with mindfulness-based interventions. In particular, symptoms of anger, irritability, disruptive behaviors, suicidality, and even impulsive self-injury improve with mindfulness-based interventions. Dialectical behavioral therapy (DBT) and acceptance and commitment therapy (ACT) have the nonjudgmental self-awareness of mindfulness built in as a component of the therapy. But mindfulness practices without explicit cognitive and behavioral components of psychotherapy for depression are not effective as stand-alone treatment of major depressive disorder in youth.

Multiple meta-analyses have demonstrated that stimulant treatment is more effective than behavioral or environmental interventions in the treatment of ADHD in children and adolescents, and combined treatments have not shown substantial additional improvement over medications alone in randomized controlled studies. But there is a lot of interest in finding effective treatments beyond medications that will help children with ADHD build important cognitive and behavioral skills that may lag developmentally.
Now there is an emerging body of evidence indicating that mindfulness skills in children with ADHD are quite effective for improving their sustained attention, social skills, behavioral control, and even hyperactivity. Additionally, methods to teach mindfulness skills to children who struggle with stillness and focused attention have been developed for these studies (“mindful martial arts”). Again, this intervention has not yet shown the same level of efficacy as medication treatments for ADHD symptoms, but it has demonstrated promise in early trials. Interestingly, it has also shown promise as a component of parenting interventions for youth with ADHD.
You do not need to wait for decisive evidence from randomized controlled trials to recommend mindfulness training for your patients with anxiety, ADHD, or even depression. Indeed, this practice alone may be adequate as a treatment for mild to moderate anxiety disorders. But you can also recommend it as an empowering and effective adjunctive treatment for almost every psychiatric illness and subclinical syndrome, and one that is affordable and easy for families to access. It would be valuable for you to recommend that your patients and their parents both try a mindfulness practice alongside your recommendations about healthy sleep, exercise, and nutrition. There are free apps such as Smiling Mind, Sound Mind, and Thrive Global that families can try together. Some children may need to move physically to be able to practice mindfulness, so yoga or walking meditations can be a better practice for them. When parents can try mindfulness practice alongside their children, it will facilitate their child’s efforts to develop these skills, and the improved sleep, focus, and stress management skills in parents can make a significant difference in the health and well-being of the whole family.
Dr. Swick is physician in chief at Ohana, Center for Child and Adolescent Behavioral Health, Community Hospital of the Monterey (Calif.) Peninsula. Dr. Jellinek is professor emeritus of psychiatry and pediatrics, Harvard Medical School, Boston. Email them at [email protected].
Meditation has become a popular practice in the United States over the last decade. It is not limited to adults, but can be learned and practiced by children and teenagers also. Variants are being used in many schools as parts of a social and emotional learning curriculum, and different kinds of mindfulness practices are common parts of psychological treatments. In this month’s column, we will review the evidence that supports the efficacy of a meditation practice to treat the mental health problems that are common in children and adolescents, and review how it might be a useful adjunct to the screening, education, and treatments that you offer your young patients.
There are many different types of meditation practices, but the unifying feature is known as mindfulness. Most broadly, mindfulness refers to a state of nonjudgmental awareness of one’s thoughts, feelings, or sensations. A mindfulness meditation practice involves physical stillness and focused attention, typically on the physical sensations of one’s breath. When thoughts, feelings, or physical sensations intrude on the stillness, one learns to cultivate a nonjudgmental awareness of those experiences without disrupting the state of quiet concentration. It could be said that meditation is easy to learn and difficult to master, and that is why it should be practiced regularly. Part of its growing popularity has undoubtedly been served by the ease with which people can access a variety of guided meditations (through apps, YouTube, and beyond) that make it relatively easy to access a variety of methods to learn how to practice mindfulness meditation.
The benefits of meditation in adults are well-established, including lower blood pressure, lower rates of heart disease, lower markers of inflammation, better sleep, and self-described levels of well-being. Meditation appears to be especially effective at mitigating the cardiovascular, metabolic, autoimmune, and inflammatory consequences of high-stress or unhealthy lifestyles in adults. Children and adolescents typically do not suffer from these diseases, but there is growing evidence that mindfulness practices can improve self-reported stress management skills, well-being, and sleep in young people; skills that can protect their physical and mental health. In addition, there is some evidence that mindfulness can be effective as a treatment for the common psychiatric illnesses of youth.
Anxiety
There is robust evidence for the efficacy of mindfulness-based interventions (including a regular mindfulness meditation practice) in the treatment of anxiety disorders in youth. Multiple studies and meta-analyses have demonstrated significant and sustained improvement in anxiety symptoms in these young patients. This makes sense when one considers that most psychotherapy treatments for anxiety include the cultivation of self-awareness and the ability to recognize the feelings of anxiety. This is critical as youth with anxiety disorders often mistake these feelings for facts. The treatment then shifts toward practice tolerating these feelings to help children develop an appreciation that they can face and manage anxiety and that it does not need to be avoided. Part of tolerating these feelings includes building skills to facilitate calm and physical relaxation in the face of these anxious feelings.
This is the core of exposure-based psychotherapies. Mindfulness practices echo the cultivation of self-awareness with focus and physical calm. Studies have shown that mindfulness-based interventions have significant and lasting effects on the symptoms of anxiety disorders in youth, including those youth with comorbid ADHD and learning disabilities. It is important to be aware that, for youth who have experienced trauma, mindfulness meditation can trigger a flood of re-experiencing phenomena, and it is important that those youth also are receiving treatment for PTSD.
Depression
There is evidence that some of the symptoms that occur as part of depression in adolescents improve with mindfulness-based interventions. In particular, symptoms of anger, irritability, disruptive behaviors, suicidality, and even impulsive self-injury improve with mindfulness-based interventions. Dialectical behavioral therapy (DBT) and acceptance and commitment therapy (ACT) have the nonjudgmental self-awareness of mindfulness built in as a component of the therapy. But mindfulness practices without explicit cognitive and behavioral components of psychotherapy for depression are not effective as stand-alone treatment of major depressive disorder in youth.
Multiple meta-analyses have demonstrated that stimulant treatment is more effective than behavioral or environmental interventions in the treatment of ADHD in children and adolescents, and combined treatments have not shown substantial additional improvement over medications alone in randomized controlled studies. But there is a lot of interest in finding effective treatments beyond medications that will help children with ADHD build important cognitive and behavioral skills that may lag developmentally.
Now there is an emerging body of evidence indicating that mindfulness skills in children with ADHD are quite effective for improving their sustained attention, social skills, behavioral control, and even hyperactivity. Additionally, methods to teach mindfulness skills to children who struggle with stillness and focused attention have been developed for these studies (“mindful martial arts”). Again, this intervention has not yet shown the same level of efficacy as medication treatments for ADHD symptoms, but it has demonstrated promise in early trials. Interestingly, it has also shown promise as a component of parenting interventions for youth with ADHD.
You do not need to wait for decisive evidence from randomized controlled trials to recommend mindfulness training for your patients with anxiety, ADHD, or even depression. Indeed, this practice alone may be adequate as a treatment for mild to moderate anxiety disorders. But you can also recommend it as an empowering and effective adjunctive treatment for almost every psychiatric illness and subclinical syndrome, and one that is affordable and easy for families to access. It would be valuable for you to recommend that your patients and their parents both try a mindfulness practice alongside your recommendations about healthy sleep, exercise, and nutrition. There are free apps such as Smiling Mind, Sound Mind, and Thrive Global that families can try together. Some children may need to move physically to be able to practice mindfulness, so yoga or walking meditations can be a better practice for them. When parents can try mindfulness practice alongside their children, it will facilitate their child’s efforts to develop these skills, and the improved sleep, focus, and stress management skills in parents can make a significant difference in the health and well-being of the whole family.
Dr. Swick is physician in chief at Ohana, Center for Child and Adolescent Behavioral Health, Community Hospital of the Monterey (Calif.) Peninsula. Dr. Jellinek is professor emeritus of psychiatry and pediatrics, Harvard Medical School, Boston. Email them at [email protected].
Meditation has become a popular practice in the United States over the last decade. It is not limited to adults, but can be learned and practiced by children and teenagers also. Variants are being used in many schools as parts of a social and emotional learning curriculum, and different kinds of mindfulness practices are common parts of psychological treatments. In this month’s column, we will review the evidence that supports the efficacy of a meditation practice to treat the mental health problems that are common in children and adolescents, and review how it might be a useful adjunct to the screening, education, and treatments that you offer your young patients.
There are many different types of meditation practices, but the unifying feature is known as mindfulness. Most broadly, mindfulness refers to a state of nonjudgmental awareness of one’s thoughts, feelings, or sensations. A mindfulness meditation practice involves physical stillness and focused attention, typically on the physical sensations of one’s breath. When thoughts, feelings, or physical sensations intrude on the stillness, one learns to cultivate a nonjudgmental awareness of those experiences without disrupting the state of quiet concentration. It could be said that meditation is easy to learn and difficult to master, and that is why it should be practiced regularly. Part of its growing popularity has undoubtedly been served by the ease with which people can access a variety of guided meditations (through apps, YouTube, and beyond) that make it relatively easy to access a variety of methods to learn how to practice mindfulness meditation.
The benefits of meditation in adults are well-established, including lower blood pressure, lower rates of heart disease, lower markers of inflammation, better sleep, and self-described levels of well-being. Meditation appears to be especially effective at mitigating the cardiovascular, metabolic, autoimmune, and inflammatory consequences of high-stress or unhealthy lifestyles in adults. Children and adolescents typically do not suffer from these diseases, but there is growing evidence that mindfulness practices can improve self-reported stress management skills, well-being, and sleep in young people; skills that can protect their physical and mental health. In addition, there is some evidence that mindfulness can be effective as a treatment for the common psychiatric illnesses of youth.
Anxiety
There is robust evidence for the efficacy of mindfulness-based interventions (including a regular mindfulness meditation practice) in the treatment of anxiety disorders in youth. Multiple studies and meta-analyses have demonstrated significant and sustained improvement in anxiety symptoms in these young patients. This makes sense when one considers that most psychotherapy treatments for anxiety include the cultivation of self-awareness and the ability to recognize the feelings of anxiety. This is critical as youth with anxiety disorders often mistake these feelings for facts. The treatment then shifts toward practice tolerating these feelings to help children develop an appreciation that they can face and manage anxiety and that it does not need to be avoided. Part of tolerating these feelings includes building skills to facilitate calm and physical relaxation in the face of these anxious feelings.
This is the core of exposure-based psychotherapies. Mindfulness practices echo the cultivation of self-awareness with focus and physical calm. Studies have shown that mindfulness-based interventions have significant and lasting effects on the symptoms of anxiety disorders in youth, including those youth with comorbid ADHD and learning disabilities. It is important to be aware that, for youth who have experienced trauma, mindfulness meditation can trigger a flood of re-experiencing phenomena, and it is important that those youth also are receiving treatment for PTSD.
Depression
There is evidence that some of the symptoms that occur as part of depression in adolescents improve with mindfulness-based interventions. In particular, symptoms of anger, irritability, disruptive behaviors, suicidality, and even impulsive self-injury improve with mindfulness-based interventions. Dialectical behavioral therapy (DBT) and acceptance and commitment therapy (ACT) have the nonjudgmental self-awareness of mindfulness built in as a component of the therapy. But mindfulness practices without explicit cognitive and behavioral components of psychotherapy for depression are not effective as stand-alone treatment of major depressive disorder in youth.
Multiple meta-analyses have demonstrated that stimulant treatment is more effective than behavioral or environmental interventions in the treatment of ADHD in children and adolescents, and combined treatments have not shown substantial additional improvement over medications alone in randomized controlled studies. But there is a lot of interest in finding effective treatments beyond medications that will help children with ADHD build important cognitive and behavioral skills that may lag developmentally.
Now there is an emerging body of evidence indicating that mindfulness skills in children with ADHD are quite effective for improving their sustained attention, social skills, behavioral control, and even hyperactivity. Additionally, methods to teach mindfulness skills to children who struggle with stillness and focused attention have been developed for these studies (“mindful martial arts”). Again, this intervention has not yet shown the same level of efficacy as medication treatments for ADHD symptoms, but it has demonstrated promise in early trials. Interestingly, it has also shown promise as a component of parenting interventions for youth with ADHD.
You do not need to wait for decisive evidence from randomized controlled trials to recommend mindfulness training for your patients with anxiety, ADHD, or even depression. Indeed, this practice alone may be adequate as a treatment for mild to moderate anxiety disorders. But you can also recommend it as an empowering and effective adjunctive treatment for almost every psychiatric illness and subclinical syndrome, and one that is affordable and easy for families to access. It would be valuable for you to recommend that your patients and their parents both try a mindfulness practice alongside your recommendations about healthy sleep, exercise, and nutrition. There are free apps such as Smiling Mind, Sound Mind, and Thrive Global that families can try together. Some children may need to move physically to be able to practice mindfulness, so yoga or walking meditations can be a better practice for them. When parents can try mindfulness practice alongside their children, it will facilitate their child’s efforts to develop these skills, and the improved sleep, focus, and stress management skills in parents can make a significant difference in the health and well-being of the whole family.
Dr. Swick is physician in chief at Ohana, Center for Child and Adolescent Behavioral Health, Community Hospital of the Monterey (Calif.) Peninsula. Dr. Jellinek is professor emeritus of psychiatry and pediatrics, Harvard Medical School, Boston. Email them at [email protected].
ED visits for kids with suicidal thoughts increasing: Study
A new study sheds light on the escalating youth suicide crisis, revealing that emergency room visits for suicidal thoughts among kids and teens steeply increased even before the start of the COVID-19 pandemic.
Emergency room visits for “suicidal ideation” (or suicidal thoughts) among 5- to 19-year-olds increased 59% from 2016 to 2021, and hospitalizations rose 57% from fall 2019 to the fall of 2020, according to the study published in Pediatrics.
“A lot of people have talked about mental health problems in youth during the pandemic, but it was happening before the pandemic,” said author Audrey Brewer, MD, MPH, in a news release from the Ann and Robert H. Lurie Children’s Hospital of Chicago. “This has been an issue for so long, and it’s getting worse.”
Researchers looked at data for 81,105 emergency room visits across 205 Illinois hospitals from 2016 to 2021 for kids between the ages of 5 and 19.
The researchers found “there was a very sharp spike in fall 2019, followed by a similar spike during the pandemic fall of 2020, with the highest number of monthly visits during October 2020,” the authors said. “Youth aged 14-17 years had the highest frequency of [suicidal ideation emergency room] monthly visits, with visits in this group greater than the other age groups combined.”
Last year, the Centers for Disease Control and Prevention announced that suicide is the second leading cause of death among 10- to 19-year-olds.
The new research is being called a benchmark because it evaluates emergency room data for suicidal thoughts – a critical point of care for serving youths’ mental health needs. The data showed that providers were increasingly likely to list suicidal thoughts as the main diagnosis.
“Suicidal ideation can be thought about as two types: actively thinking about suicide or having thoughts, but not having a plan,” Dr. Brewer said in the news release. “That could be the difference in why someone might get admitted to the hospital.”
The researchers hypothesize that care in 2019 (when the initial spike occurred) was delayed in the early days of the pandemic, and that delay possibly contributed to the increase in providers identifying suicidal ideation as the main diagnosis.
“The early pandemic period coincided with constrained access to pediatric mental health services through schools, pediatric primary care homes, and mental health clinics for many children and their families,” the authors wrote. “The proportion of child mental health visits increased relative to other types as patients avoided ED visits during the early wave of the COVID-19 pandemic. Thus, the increase in hospitalizations during fall 2020 may reflect patients’ deferring care until symptoms became even more severe.”
Other health care scholars agreed the study spurred questions about whether the pandemic was truly the source of the crisis.
“Was it the pandemic that exacerbated the increase or is this a growing trend?” wrote Lisa M. Horowitz, PhD, MPH, and Jeffrey A. Bridge, PhD, in a commentary published along with the study. “These rising rates underscore the worsening mental health crisis for youth, as noted by the 2022 Surgeon General report and several youth mental health organizations.”
A version of this article first appeared on WebMD.com.
A new study sheds light on the escalating youth suicide crisis, revealing that emergency room visits for suicidal thoughts among kids and teens steeply increased even before the start of the COVID-19 pandemic.
Emergency room visits for “suicidal ideation” (or suicidal thoughts) among 5- to 19-year-olds increased 59% from 2016 to 2021, and hospitalizations rose 57% from fall 2019 to the fall of 2020, according to the study published in Pediatrics.
“A lot of people have talked about mental health problems in youth during the pandemic, but it was happening before the pandemic,” said author Audrey Brewer, MD, MPH, in a news release from the Ann and Robert H. Lurie Children’s Hospital of Chicago. “This has been an issue for so long, and it’s getting worse.”
Researchers looked at data for 81,105 emergency room visits across 205 Illinois hospitals from 2016 to 2021 for kids between the ages of 5 and 19.
The researchers found “there was a very sharp spike in fall 2019, followed by a similar spike during the pandemic fall of 2020, with the highest number of monthly visits during October 2020,” the authors said. “Youth aged 14-17 years had the highest frequency of [suicidal ideation emergency room] monthly visits, with visits in this group greater than the other age groups combined.”
Last year, the Centers for Disease Control and Prevention announced that suicide is the second leading cause of death among 10- to 19-year-olds.
The new research is being called a benchmark because it evaluates emergency room data for suicidal thoughts – a critical point of care for serving youths’ mental health needs. The data showed that providers were increasingly likely to list suicidal thoughts as the main diagnosis.
“Suicidal ideation can be thought about as two types: actively thinking about suicide or having thoughts, but not having a plan,” Dr. Brewer said in the news release. “That could be the difference in why someone might get admitted to the hospital.”
The researchers hypothesize that care in 2019 (when the initial spike occurred) was delayed in the early days of the pandemic, and that delay possibly contributed to the increase in providers identifying suicidal ideation as the main diagnosis.
“The early pandemic period coincided with constrained access to pediatric mental health services through schools, pediatric primary care homes, and mental health clinics for many children and their families,” the authors wrote. “The proportion of child mental health visits increased relative to other types as patients avoided ED visits during the early wave of the COVID-19 pandemic. Thus, the increase in hospitalizations during fall 2020 may reflect patients’ deferring care until symptoms became even more severe.”
Other health care scholars agreed the study spurred questions about whether the pandemic was truly the source of the crisis.
“Was it the pandemic that exacerbated the increase or is this a growing trend?” wrote Lisa M. Horowitz, PhD, MPH, and Jeffrey A. Bridge, PhD, in a commentary published along with the study. “These rising rates underscore the worsening mental health crisis for youth, as noted by the 2022 Surgeon General report and several youth mental health organizations.”
A version of this article first appeared on WebMD.com.
A new study sheds light on the escalating youth suicide crisis, revealing that emergency room visits for suicidal thoughts among kids and teens steeply increased even before the start of the COVID-19 pandemic.
Emergency room visits for “suicidal ideation” (or suicidal thoughts) among 5- to 19-year-olds increased 59% from 2016 to 2021, and hospitalizations rose 57% from fall 2019 to the fall of 2020, according to the study published in Pediatrics.
“A lot of people have talked about mental health problems in youth during the pandemic, but it was happening before the pandemic,” said author Audrey Brewer, MD, MPH, in a news release from the Ann and Robert H. Lurie Children’s Hospital of Chicago. “This has been an issue for so long, and it’s getting worse.”
Researchers looked at data for 81,105 emergency room visits across 205 Illinois hospitals from 2016 to 2021 for kids between the ages of 5 and 19.
The researchers found “there was a very sharp spike in fall 2019, followed by a similar spike during the pandemic fall of 2020, with the highest number of monthly visits during October 2020,” the authors said. “Youth aged 14-17 years had the highest frequency of [suicidal ideation emergency room] monthly visits, with visits in this group greater than the other age groups combined.”
Last year, the Centers for Disease Control and Prevention announced that suicide is the second leading cause of death among 10- to 19-year-olds.
The new research is being called a benchmark because it evaluates emergency room data for suicidal thoughts – a critical point of care for serving youths’ mental health needs. The data showed that providers were increasingly likely to list suicidal thoughts as the main diagnosis.
“Suicidal ideation can be thought about as two types: actively thinking about suicide or having thoughts, but not having a plan,” Dr. Brewer said in the news release. “That could be the difference in why someone might get admitted to the hospital.”
The researchers hypothesize that care in 2019 (when the initial spike occurred) was delayed in the early days of the pandemic, and that delay possibly contributed to the increase in providers identifying suicidal ideation as the main diagnosis.
“The early pandemic period coincided with constrained access to pediatric mental health services through schools, pediatric primary care homes, and mental health clinics for many children and their families,” the authors wrote. “The proportion of child mental health visits increased relative to other types as patients avoided ED visits during the early wave of the COVID-19 pandemic. Thus, the increase in hospitalizations during fall 2020 may reflect patients’ deferring care until symptoms became even more severe.”
Other health care scholars agreed the study spurred questions about whether the pandemic was truly the source of the crisis.
“Was it the pandemic that exacerbated the increase or is this a growing trend?” wrote Lisa M. Horowitz, PhD, MPH, and Jeffrey A. Bridge, PhD, in a commentary published along with the study. “These rising rates underscore the worsening mental health crisis for youth, as noted by the 2022 Surgeon General report and several youth mental health organizations.”
A version of this article first appeared on WebMD.com.
FROM PEDIATRICS
Watching violent TV in preschool linked with emotional, behavioral issues at age 12
Preschoolers who watch violent television are more likely to have emotional and behavioral issues at the age of 12, according to investigators.
These findings align with previous studies that have shown the negative effects of watching violent content, reinforcing the importance of restricting childhood screen time, lead author Linda S. Pagani, PhD, of Université de Montréal and colleagues reported.
Past research measured the immediate or short-term effects of seeing violent media. This study examined how TV violence could be leading to issues almost a decade later, the investigators wrote in the Journal of Developmental & Behavioral Pediatrics.
Their study looked at 1,976 children from the Quebec Longitudinal Study of Child Development, a random representative cohort of boys and girls followed since their births in 1997 and 1998.
At the cohort study follow-ups at ages 3.5 and 4.5 years, the parents of these children reported if their kids watched violent TV, showing that about half of them were exposed. At age 12, the same children were scored by their teachers on a range of psychosocial outcomes, including emotional distress, inattentive behavior, disorderly behavior, social withdrawal, classroom engagement, and overall academic achievement. At this second time point, the children also scored themselves on their own academic motivation and confidence in writing.
To adjust for other factors that could be playing a role, the investigators accounted for participant characteristics at various ages between 5 months and 12 years, as well as differences in parenting styles, home environment, and socioeconomic status.
Dr. Pagani noted that these were not “garden-variety” statistical techniques.
“We did them in such a way that we set ourselves up for not finding results,” Dr. Pagani said in an interview. “That’s why this is really interesting.”
She and her colleagues found that watching TV violence during preschool was significantly associated with multiple negative outcomes at age 12.
For girls, negative outcomes included greater emotional distress, less classroom engagement, lower academic achievement, and less academic motivation. Boys showed greater emotional distress, decreased attention, disorderly behavior, social withdrawal, less classroom engagement, lower academic achievement, and less academic motivation.
“As expected, early screen violence exposure seems to come at a cost,” the investigators wrote.
Seeing TV through a child’s eyes
According to Dr. Pagani, many parents think that TV shows watched by preschoolers – like cartoons – are harmless, but these parents need to understand that the brains of children are not yet fully developed.
“The kid has an interpretation that’s very concrete,” Dr. Pagani said. “They don’t have abstract thinking.”
Because of this, kids who see “good guys” beating up “bad guys” don’t understand that the violence is comical and justified; they just see violence being used to address social disagreement, Dr. Pagani said. This leads children to believe that violence is an acceptable way to solve problems in daily life. Children are also more likely to see hostility in others when it isn’t present, leading to conflict.
Although the natural response to these findings is to restrict childhood exposure to violent content, this may be easier said than done, the investigators noted, particularly because TV is no longer the only screen in the home, as it was when this study began. Nowadays, parents need to monitor multiple devices, including smartphones, tablets, and computers, all of which may negatively impact normal brain development.
“People think this technology is innocuous,” Dr. Pagani said. “We are asleep at the wheel.”
She advised parents to wake up and follow the World Health Organization guidelines for sedentary screen time. The guidelines call for no screen time at all until a child is at least 2 years old, and then less than 1 hour per day until age 5.
“It’s the parents who should be in charge,” she said. “They’re the ones who have the cognitive ability to make decisions for their children.”
Choosing quality time over screen time
Loredana Marchica, PhD, of Montreal Children’s Hospital and McGill University, also in Montreal, expressed confidence in the study findings, because the results line up with past research, and because the investigators accounted for other explanations.
There is a “very strong probability” that watching violent TV in preschool leads to psychological issues down the line, Dr. Marchica said.
If a child is exposed to violent content, then parents should help children understand the difference between what happens in TV shows and real life, she added, as this can reduce negative effects on behavior.
“Parents need to explain that it’s a TV show,” Dr. Marchica said. “It’s not real, and if [that violent act] happened in real life, it would actually hurt a person.”
In addition to limiting screen time and explaining any violent content, she encouraged parents to spend quality time with their children, especially during the preschool years.
“Those are the years to fortify the attachment you have with that child,” Dr. Marchica said. “Even 15 minutes a day of quality, interactive play time can make such a difference in their development, their imagination, and their social engagement and abilities.”
Parents should also try to have conversations with their young children, she said, noting that it’s okay to share personal feelings, as this teaches kids how to manage their own emotions.
“Not everything is wonderful in life, and we’re allowed to talk about that,” Dr. Marchica said. “[Parents can say,] ‘Mommy had a bad day today. This bad thing happened. But here’s what I did to make myself feel better.’ ”
Dr. Pagani and coauthors termed their findings “robust,” but also cautioned that, in their correlational study, TV violence cannot be interpreted as causal. In other limitations, they noted that the study relies on a single parent-reported item that yielded a low rate of reported exposure. Or the findings could result from other things, such as family chaos or parenting style or something else.
The longitudinal study was supported by Fondation Lucie et André Chagnon, the Institut de la Statistique du Québec, the Ministère de l’Éducation et de l’Enseignement supérieur, and others. The investigators and Dr. Marchica reported no relevant conflicts of interest.
Preschoolers who watch violent television are more likely to have emotional and behavioral issues at the age of 12, according to investigators.
These findings align with previous studies that have shown the negative effects of watching violent content, reinforcing the importance of restricting childhood screen time, lead author Linda S. Pagani, PhD, of Université de Montréal and colleagues reported.
Past research measured the immediate or short-term effects of seeing violent media. This study examined how TV violence could be leading to issues almost a decade later, the investigators wrote in the Journal of Developmental & Behavioral Pediatrics.
Their study looked at 1,976 children from the Quebec Longitudinal Study of Child Development, a random representative cohort of boys and girls followed since their births in 1997 and 1998.
At the cohort study follow-ups at ages 3.5 and 4.5 years, the parents of these children reported if their kids watched violent TV, showing that about half of them were exposed. At age 12, the same children were scored by their teachers on a range of psychosocial outcomes, including emotional distress, inattentive behavior, disorderly behavior, social withdrawal, classroom engagement, and overall academic achievement. At this second time point, the children also scored themselves on their own academic motivation and confidence in writing.
To adjust for other factors that could be playing a role, the investigators accounted for participant characteristics at various ages between 5 months and 12 years, as well as differences in parenting styles, home environment, and socioeconomic status.
Dr. Pagani noted that these were not “garden-variety” statistical techniques.
“We did them in such a way that we set ourselves up for not finding results,” Dr. Pagani said in an interview. “That’s why this is really interesting.”
She and her colleagues found that watching TV violence during preschool was significantly associated with multiple negative outcomes at age 12.
For girls, negative outcomes included greater emotional distress, less classroom engagement, lower academic achievement, and less academic motivation. Boys showed greater emotional distress, decreased attention, disorderly behavior, social withdrawal, less classroom engagement, lower academic achievement, and less academic motivation.
“As expected, early screen violence exposure seems to come at a cost,” the investigators wrote.
Seeing TV through a child’s eyes
According to Dr. Pagani, many parents think that TV shows watched by preschoolers – like cartoons – are harmless, but these parents need to understand that the brains of children are not yet fully developed.
“The kid has an interpretation that’s very concrete,” Dr. Pagani said. “They don’t have abstract thinking.”
Because of this, kids who see “good guys” beating up “bad guys” don’t understand that the violence is comical and justified; they just see violence being used to address social disagreement, Dr. Pagani said. This leads children to believe that violence is an acceptable way to solve problems in daily life. Children are also more likely to see hostility in others when it isn’t present, leading to conflict.
Although the natural response to these findings is to restrict childhood exposure to violent content, this may be easier said than done, the investigators noted, particularly because TV is no longer the only screen in the home, as it was when this study began. Nowadays, parents need to monitor multiple devices, including smartphones, tablets, and computers, all of which may negatively impact normal brain development.
“People think this technology is innocuous,” Dr. Pagani said. “We are asleep at the wheel.”
She advised parents to wake up and follow the World Health Organization guidelines for sedentary screen time. The guidelines call for no screen time at all until a child is at least 2 years old, and then less than 1 hour per day until age 5.
“It’s the parents who should be in charge,” she said. “They’re the ones who have the cognitive ability to make decisions for their children.”
Choosing quality time over screen time
Loredana Marchica, PhD, of Montreal Children’s Hospital and McGill University, also in Montreal, expressed confidence in the study findings, because the results line up with past research, and because the investigators accounted for other explanations.
There is a “very strong probability” that watching violent TV in preschool leads to psychological issues down the line, Dr. Marchica said.
If a child is exposed to violent content, then parents should help children understand the difference between what happens in TV shows and real life, she added, as this can reduce negative effects on behavior.
“Parents need to explain that it’s a TV show,” Dr. Marchica said. “It’s not real, and if [that violent act] happened in real life, it would actually hurt a person.”
In addition to limiting screen time and explaining any violent content, she encouraged parents to spend quality time with their children, especially during the preschool years.
“Those are the years to fortify the attachment you have with that child,” Dr. Marchica said. “Even 15 minutes a day of quality, interactive play time can make such a difference in their development, their imagination, and their social engagement and abilities.”
Parents should also try to have conversations with their young children, she said, noting that it’s okay to share personal feelings, as this teaches kids how to manage their own emotions.
“Not everything is wonderful in life, and we’re allowed to talk about that,” Dr. Marchica said. “[Parents can say,] ‘Mommy had a bad day today. This bad thing happened. But here’s what I did to make myself feel better.’ ”
Dr. Pagani and coauthors termed their findings “robust,” but also cautioned that, in their correlational study, TV violence cannot be interpreted as causal. In other limitations, they noted that the study relies on a single parent-reported item that yielded a low rate of reported exposure. Or the findings could result from other things, such as family chaos or parenting style or something else.
The longitudinal study was supported by Fondation Lucie et André Chagnon, the Institut de la Statistique du Québec, the Ministère de l’Éducation et de l’Enseignement supérieur, and others. The investigators and Dr. Marchica reported no relevant conflicts of interest.
Preschoolers who watch violent television are more likely to have emotional and behavioral issues at the age of 12, according to investigators.
These findings align with previous studies that have shown the negative effects of watching violent content, reinforcing the importance of restricting childhood screen time, lead author Linda S. Pagani, PhD, of Université de Montréal and colleagues reported.
Past research measured the immediate or short-term effects of seeing violent media. This study examined how TV violence could be leading to issues almost a decade later, the investigators wrote in the Journal of Developmental & Behavioral Pediatrics.
Their study looked at 1,976 children from the Quebec Longitudinal Study of Child Development, a random representative cohort of boys and girls followed since their births in 1997 and 1998.
At the cohort study follow-ups at ages 3.5 and 4.5 years, the parents of these children reported if their kids watched violent TV, showing that about half of them were exposed. At age 12, the same children were scored by their teachers on a range of psychosocial outcomes, including emotional distress, inattentive behavior, disorderly behavior, social withdrawal, classroom engagement, and overall academic achievement. At this second time point, the children also scored themselves on their own academic motivation and confidence in writing.
To adjust for other factors that could be playing a role, the investigators accounted for participant characteristics at various ages between 5 months and 12 years, as well as differences in parenting styles, home environment, and socioeconomic status.
Dr. Pagani noted that these were not “garden-variety” statistical techniques.
“We did them in such a way that we set ourselves up for not finding results,” Dr. Pagani said in an interview. “That’s why this is really interesting.”
She and her colleagues found that watching TV violence during preschool was significantly associated with multiple negative outcomes at age 12.
For girls, negative outcomes included greater emotional distress, less classroom engagement, lower academic achievement, and less academic motivation. Boys showed greater emotional distress, decreased attention, disorderly behavior, social withdrawal, less classroom engagement, lower academic achievement, and less academic motivation.
“As expected, early screen violence exposure seems to come at a cost,” the investigators wrote.
Seeing TV through a child’s eyes
According to Dr. Pagani, many parents think that TV shows watched by preschoolers – like cartoons – are harmless, but these parents need to understand that the brains of children are not yet fully developed.
“The kid has an interpretation that’s very concrete,” Dr. Pagani said. “They don’t have abstract thinking.”
Because of this, kids who see “good guys” beating up “bad guys” don’t understand that the violence is comical and justified; they just see violence being used to address social disagreement, Dr. Pagani said. This leads children to believe that violence is an acceptable way to solve problems in daily life. Children are also more likely to see hostility in others when it isn’t present, leading to conflict.
Although the natural response to these findings is to restrict childhood exposure to violent content, this may be easier said than done, the investigators noted, particularly because TV is no longer the only screen in the home, as it was when this study began. Nowadays, parents need to monitor multiple devices, including smartphones, tablets, and computers, all of which may negatively impact normal brain development.
“People think this technology is innocuous,” Dr. Pagani said. “We are asleep at the wheel.”
She advised parents to wake up and follow the World Health Organization guidelines for sedentary screen time. The guidelines call for no screen time at all until a child is at least 2 years old, and then less than 1 hour per day until age 5.
“It’s the parents who should be in charge,” she said. “They’re the ones who have the cognitive ability to make decisions for their children.”
Choosing quality time over screen time
Loredana Marchica, PhD, of Montreal Children’s Hospital and McGill University, also in Montreal, expressed confidence in the study findings, because the results line up with past research, and because the investigators accounted for other explanations.
There is a “very strong probability” that watching violent TV in preschool leads to psychological issues down the line, Dr. Marchica said.
If a child is exposed to violent content, then parents should help children understand the difference between what happens in TV shows and real life, she added, as this can reduce negative effects on behavior.
“Parents need to explain that it’s a TV show,” Dr. Marchica said. “It’s not real, and if [that violent act] happened in real life, it would actually hurt a person.”
In addition to limiting screen time and explaining any violent content, she encouraged parents to spend quality time with their children, especially during the preschool years.
“Those are the years to fortify the attachment you have with that child,” Dr. Marchica said. “Even 15 minutes a day of quality, interactive play time can make such a difference in their development, their imagination, and their social engagement and abilities.”
Parents should also try to have conversations with their young children, she said, noting that it’s okay to share personal feelings, as this teaches kids how to manage their own emotions.
“Not everything is wonderful in life, and we’re allowed to talk about that,” Dr. Marchica said. “[Parents can say,] ‘Mommy had a bad day today. This bad thing happened. But here’s what I did to make myself feel better.’ ”
Dr. Pagani and coauthors termed their findings “robust,” but also cautioned that, in their correlational study, TV violence cannot be interpreted as causal. In other limitations, they noted that the study relies on a single parent-reported item that yielded a low rate of reported exposure. Or the findings could result from other things, such as family chaos or parenting style or something else.
The longitudinal study was supported by Fondation Lucie et André Chagnon, the Institut de la Statistique du Québec, the Ministère de l’Éducation et de l’Enseignement supérieur, and others. The investigators and Dr. Marchica reported no relevant conflicts of interest.
FROM THE JOURNAL OF DEVELOPMENTAL & BEHAVIORAL PEDIATRICS