User login
Single-dose influenza drug baloxavir similar to oseltamivir in efficacy
A new single-dose influenza antiviral drug appears significantly better than placebo at relieving the symptoms of infection, and reduces viral load faster than does oseltamivir, new research suggests.
Baloxavir marboxil – a selective inhibitor of influenza cap-dependent endonuclease – was tested in two randomized, double-blind, controlled trials. The first was a double-blind, placebo-controlled, dose-ranging, phase 2 randomized trial of 389 Japanese adults aged 20-64 years with acute uncomplicated influenza from December 2015 through March 2016. The second was a phase 3 randomized controlled trial of 1,366 patients comparing baloxavir with placebo and oseltamivir.
The phase 2 study showed patients treated with 10 mg, 20 mg or 40 mg oral dose of baloxavir experienced a significantly shorter median time to symptom alleviation compared with placebo (54.2, 51, 49.5, and 77.7 hours, respectively), according to a paper published in the Sept. 6 edition of the New England Journal of Medicine.
In addition, all three doses showed significantly greater reductions in influenza virus titers on days 2 and 3, compared with placebo.
The phase 3 trial CAPSTONE-1 (NCT02954354) was a double-blind, placebo- and oseltamivir-controlled, randomized trial that enrolled outpatients aged 12-64 years with influenza-like illness in the United States and Japan from December 2016 through March 2017. Patients aged 20-64 years received a single, weight-based oral dose of baloxavir (40 mg for patients weighing more than 80 kg, 80 mg for those weighing 80 kg or less) on day 1 only or oseltamivir at a dose of 75 mg twice daily or matching placebos on a 5-day regimen.
Patients aged 12-19 years were randomly assigned to receive either baloxavir or placebo on day 1 only, according to the researchers.
The median time to alleviation of symptoms was similar in the baloxavir (53.5 hours) and oseltamivir group (53.8 hours). However, patients taking baloxavir had significantly faster declines in infectious viral load compared with those taking oseltamivir, which was taken as a 75-mg dose twice daily for 5 days. In addition, patients who were treated with baloxavir within 24 hours of symptom onset showed significantly shorter time to alleviation of symptoms compared with placebo than did those who started treatment more than 24 hours after symptoms began.
Adverse events related to the study drug were more common among patients taking oseltamivir (8.4%) compared with those taking baloxavir (4.4%) or placebo (3.9%). In the phase 2 study, the adverse event rate was lower in the three baloxavir dosage groups compared with the placebo group. The study also showed a similar low frequency of complications requiring antibiotic treatment in both the baloxavir, oseltamivir, and placebo arms.
Some patients did show evidence of decreased susceptibility to baloxavir; for example, PA I38T/M amino acid substitutions were seen in 9.7% of the patients taking baloxavir but none of randomly selected patients in the placebo group of the phase 3 trial.
“These trials showed that single doses of the cap-dependent endonuclease inhibitor baloxavir were superior to placebo in alleviating influenza symptoms in patients with uncomplicated influenza, without clinically significant side effects,” wrote Dr. Frederick G. Hayden of the University of Virginia, Charlottesville, and his coauthors.
“The antiviral effects that were observed with baloxavir in patients with uncomplicated influenza provide encouragement with respect to its potential value in treating complicated or severe influenza infections,” they noted.
Because the treatment was inhibitory for influenza virus strains that were resistant to neuraminidase inhibitors or M2 ion-channel inhibitors, it could be a treatment option for patients infected with those viruses, the researchers added.
CAPSTONE-2, a randomized, controlled trial involving patients at high risk for influenza complications (NCT02949011) is in progress.
The study was supported by Shionogi, which developed baloxavir. Seven authors declared fees from the pharmaceutical industry, including Shionogi. Six authors were employees of Shionogi, one also holding stock. No other conflicts of interest were declared.
SOURCE: Hayden F et al. N Engl J Med. 2018;379:913-23. doi: 10.1056/NEJMoa1716197.
These two studies of baloxavir show that the drug has a clinical benefit similar to that of oseltamivir in individuals with uncomplicated influenza infection. As a single-dose treatment, baloxavir has the advantage in reducing concerns about adherence compared to the treatment regimen for oseltamivir, which requires 5 days of twice-daily dosing.
However, these studies should be viewed as the first step. While baloxavir showed significantly greater reductions in viral load at 24 hours and a shorter duration of infectious virus detection than did oseltamivir or placebo, it also induced the emergence of viral escape mutants with reduced susceptibility.
It’s not yet known whether these influenza viruses with reduced susceptibility are transmissible, and whether surveillance for I38T and other markers will be needed. We also need trials to identify which patients are most likely to benefit from baloxavir, and the timing for treatment.
Timothy M. Uyeki, MD, is with the Influenza Division at the National Center for Immunization and Respiratory Diseases, Centers for Disease Control and Prevention. These comments are taken from an editorial (N Engl J Med. 2018;397:975-7. doi: 10.1056/NEJMe1810815. No conflicts of interest were declared.
A new single-dose influenza antiviral drug appears significantly better than placebo at relieving the symptoms of infection, and reduces viral load faster than does oseltamivir, new research suggests.
Baloxavir marboxil – a selective inhibitor of influenza cap-dependent endonuclease – was tested in two randomized, double-blind, controlled trials. The first was a double-blind, placebo-controlled, dose-ranging, phase 2 randomized trial of 389 Japanese adults aged 20-64 years with acute uncomplicated influenza from December 2015 through March 2016. The second was a phase 3 randomized controlled trial of 1,366 patients comparing baloxavir with placebo and oseltamivir.
The phase 2 study showed patients treated with 10 mg, 20 mg or 40 mg oral dose of baloxavir experienced a significantly shorter median time to symptom alleviation compared with placebo (54.2, 51, 49.5, and 77.7 hours, respectively), according to a paper published in the Sept. 6 edition of the New England Journal of Medicine.
In addition, all three doses showed significantly greater reductions in influenza virus titers on days 2 and 3, compared with placebo.
The phase 3 trial CAPSTONE-1 (NCT02954354) was a double-blind, placebo- and oseltamivir-controlled, randomized trial that enrolled outpatients aged 12-64 years with influenza-like illness in the United States and Japan from December 2016 through March 2017. Patients aged 20-64 years received a single, weight-based oral dose of baloxavir (40 mg for patients weighing more than 80 kg, 80 mg for those weighing 80 kg or less) on day 1 only or oseltamivir at a dose of 75 mg twice daily or matching placebos on a 5-day regimen.
Patients aged 12-19 years were randomly assigned to receive either baloxavir or placebo on day 1 only, according to the researchers.
The median time to alleviation of symptoms was similar in the baloxavir (53.5 hours) and oseltamivir group (53.8 hours). However, patients taking baloxavir had significantly faster declines in infectious viral load compared with those taking oseltamivir, which was taken as a 75-mg dose twice daily for 5 days. In addition, patients who were treated with baloxavir within 24 hours of symptom onset showed significantly shorter time to alleviation of symptoms compared with placebo than did those who started treatment more than 24 hours after symptoms began.
Adverse events related to the study drug were more common among patients taking oseltamivir (8.4%) compared with those taking baloxavir (4.4%) or placebo (3.9%). In the phase 2 study, the adverse event rate was lower in the three baloxavir dosage groups compared with the placebo group. The study also showed a similar low frequency of complications requiring antibiotic treatment in both the baloxavir, oseltamivir, and placebo arms.
Some patients did show evidence of decreased susceptibility to baloxavir; for example, PA I38T/M amino acid substitutions were seen in 9.7% of the patients taking baloxavir but none of randomly selected patients in the placebo group of the phase 3 trial.
“These trials showed that single doses of the cap-dependent endonuclease inhibitor baloxavir were superior to placebo in alleviating influenza symptoms in patients with uncomplicated influenza, without clinically significant side effects,” wrote Dr. Frederick G. Hayden of the University of Virginia, Charlottesville, and his coauthors.
“The antiviral effects that were observed with baloxavir in patients with uncomplicated influenza provide encouragement with respect to its potential value in treating complicated or severe influenza infections,” they noted.
Because the treatment was inhibitory for influenza virus strains that were resistant to neuraminidase inhibitors or M2 ion-channel inhibitors, it could be a treatment option for patients infected with those viruses, the researchers added.
CAPSTONE-2, a randomized, controlled trial involving patients at high risk for influenza complications (NCT02949011) is in progress.
The study was supported by Shionogi, which developed baloxavir. Seven authors declared fees from the pharmaceutical industry, including Shionogi. Six authors were employees of Shionogi, one also holding stock. No other conflicts of interest were declared.
SOURCE: Hayden F et al. N Engl J Med. 2018;379:913-23. doi: 10.1056/NEJMoa1716197.
FROM THE NEW ENGLAND JOURNAL OF MEDICINE
Key clinical point: Single-dose influenza antiviral baloxavir shows efficacy similar to that of oseltamivir.
Major finding: Baloxavir shows similar time to alleviation of influenza symptoms compared with oseltamivir, but greater reductions in viral load.
Study details: Phase 2 and phase 3 randomized controlled trials in 389 and 1,366 otherwise healthy patients with influenza.
Disclosures: The study was supported by Shionogi, which developed baloxavir. Seven authors declared fees from the pharmaceutical industry, including Shionogi. Six authors were employees of Shionogi, one also holding stock. No other conflicts of interest were declared.
Source: Hayden F et al. N Engl J Med 2018;379:913-23. doi: 10.1056/NEJMoa1716197.
Live attenuated flu vaccine gets ACIP nod for 2018-2019 season
The latest seasonal influenza vaccine recommendations from the Advisory Committee on Immunization Practices provide several key updates that will impact clinical practice in the 2018-2019 influenza season.
Of note, , following two seasons in which the committee recommended it not be used.
ACIP also updated its recommendations for individuals with a history of egg allergy, described the vaccine strains chosen for 2018-2019 season, and detailed the changes in age indications for Afluria Quadrivalent and Fluarix Quadrivalent that have been made since publication of its previous guidelines.
Published in MMWR Recommendations and Reports, the updated ACIP recommendations reflect discussions and decisions from the three public meetings of ACIP that have taken place since the last annual update.
All individuals 6 months of age and older who have no contraindications to influenza vaccine should receive routine annual influenza vaccine, ACIP also said in its report, reinforcing a key recommendation that has been in place since 2010.
“To avoid missed opportunities for vaccination, providers should offer vaccination during routine health care visits and hospitalizations,” wrote authors of the report, including lead author Lisa A. Grohskopf, MD, of the National Center for Immunization and Respiratory Diseases, Centers for Disease Control and Prevention, Atlanta.
Dr. Grohskopf and coauthors made no specific recommendations on which vaccine to use. They said providers should choose licensed, age-appropriate recommended vaccines expected to be available for the 2018-2019 season, including inactivated influenza vaccines (IIV), a recombinant influenza vaccine (RIV4), and the LAIV option.
FluMist Quadrivalent, the one LAIV product expected to be available for the 2018-2019 season, is licensed for individuals aged 2-49 years.
In its deliberations over the updated LAIV recommendation, ACIP reviewed observational data from previous seasons suggesting that the vaccine was poorly effective, and significantly less effective than IIV, against influenza A(H1N1) pdm09 viruses.
The current formulation of FluMist includes a new H1N1pdm09-like vaccine virus. While no effectiveness estimates were available at the time of review, ACIP said it did consider manufacturer data on shedding and immunogenicity for the current vaccine in children between the ages of 24 months through less than 4 years.
“These data suggest that this new H1N1pdm09-like virus has improved replicative fitness over previous H1N1pdm09-like viruses included in LAIV,” Dr. Grohskopf and colleagues wrote.
Individuals with an egg allergy history also can receive any licensed, recommended, age-appropriate IIV, RIV, or LAIV vaccine, said ACIP. This updated recommendation was based in part on the committee’s review and discussion of three studies that showed no cases of anaphylaxis in egg-allergic children receiving LAIV.
The ACIP recommendation update also outlines the strains selected earlier this year for the 2018-2019 season. Trivalent influenza vaccines in the United States will include an A/Michigan/45/2015 (H1N1) pdm09–like virus, an A/Singapore/INFIMH-16-0019/2016 (H3N2)-like virus, and a B/Colorado/06/2017–like virus (Victoria lineage). Quadrivalent vaccines will include those strains plus a B/Phuket/3073/2013–like virus (Yamagata lineage).
The report also acknowledges the recent expansion of age indication for two vaccines that have occurred since the last ACIP recommendations.
Afluria Quadrivalent was previously licensed for individuals 18 years of age and older. In August 2017, the Food and Drug Administration approved expansion of the indication to individuals 5 years of age or older. In January 2018, FDA approved expansion of the Fluarix Quadrivalent indication, previously licensed for age 3 and older, to individuals 6 months and older.
Report coauthor Emmanuel B. Walter disclosed grants from Novavax and Merck. The remaining report authors reported no relevant financial disclosures.
SOURCE: Grohskopf LA et al. MMWR Recomm Rep. 2018 Aug 24;67(3):1-20.
FROM MMWR
Simple tool improves inpatient influenza vaccination rates
TORONTO –
“When we looked at the immunization status of children in New York City, we found that one of the vaccines most commonly missed was influenza vaccine, especially from 2011 through 2014,” one of the study authors, Anmol Goyal, MD, of SUNY Downstate Medical Center, Brooklyn, N.Y., said in an interview at the Pediatric Academic Societies meeting.

“Given this year’s epidemic of influenza and the increasing deaths, we decided to look back on interventions we had done in the past to see if any can be reimplemented to help improve the vaccination status for these children,” he said. “The national goal is 80%, but if we look at the recent trend, even though we have been able to improve vaccination status, it is still below the national goal.” For example, he said, according to New York Department of Health data, the 2012-2013 influenza vaccination rates in New York City were 65% among children 6 months to 5 years old, 47% among those 5-8 years old, and 31% among those 9-18 years old, which were well below the national goal.
In an effort to improve influenza vaccine access, lead author Stephan Kohlhoff, MD, a pediatric infectious disease specialist at the medical center, and his associates, implemented a simple vaccine screening tool to use in the inpatient setting as an opportunity to improve vaccination rates among children in New York City. It consisted of nursing staff assessing the patient’s influenza immunization status on admission and conducting source verification using the citywide immunization registry, or with vaccine cards brought by parents or guardians during admission. Influenza vaccine was administered as a standing order before discharge, unless refused by the parents or guardians. The study population comprised 602 patients between the ages of 6 months and 21 years who were admitted to the inpatient unit during 2 months of the influenza season (November and December) from 2011 to 2013.
Dr. Goyal, a second-year pediatric resident at the medical center, reported that the influenza vaccination status on admission was positive in only 31% of children in 2011, 30% in 2012, and 34% in 2013. The vaccine screening tool was implemented in 64% of admitted children in 2012 and 70% in 2013. Following implementation, the researchers observed a 5% increase in immunization rates in 2012 and an 11% increase in 2013, with an overall increase of 8% over 2 years (P less than .001). He was quick to point out that the influenza rate could have been improved by an additional 22% had 77% of patients not refused vaccination.
“Unfortunately, as our primary objective was to assess the utility of our screening tool in improving inpatient immunization status, we had very limited data points toward refusal of vaccine,” Dr. Goyal said. “Some of the reasons for refusal that were gathered during screening included preferred vaccination by their primary care provider after discharge. Or, maybe they don’t want the vaccine because they feel that the vaccine will make their kids sick. We don’t have enough data to point to any particular reason. This study provides information on acceptance rate of inpatient immunization, which may be useful for implementing additional educational initiatives to overcome potential barriers and help us reach our national goal.”
The researchers reported having no financial disclosures.
TORONTO –
“When we looked at the immunization status of children in New York City, we found that one of the vaccines most commonly missed was influenza vaccine, especially from 2011 through 2014,” one of the study authors, Anmol Goyal, MD, of SUNY Downstate Medical Center, Brooklyn, N.Y., said in an interview at the Pediatric Academic Societies meeting.
“Given this year’s epidemic of influenza and the increasing deaths, we decided to look back on interventions we had done in the past to see if any can be reimplemented to help improve the vaccination status for these children,” he said. “The national goal is 80%, but if we look at the recent trend, even though we have been able to improve vaccination status, it is still below the national goal.” For example, he said, according to New York Department of Health data, the 2012-2013 influenza vaccination rates in New York City were 65% among children 6 months to 5 years old, 47% among those 5-8 years old, and 31% among those 9-18 years old, which were well below the national goal.
In an effort to improve influenza vaccine access, lead author Stephan Kohlhoff, MD, a pediatric infectious disease specialist at the medical center, and his associates, implemented a simple vaccine screening tool to use in the inpatient setting as an opportunity to improve vaccination rates among children in New York City. It consisted of nursing staff assessing the patient’s influenza immunization status on admission and conducting source verification using the citywide immunization registry, or with vaccine cards brought by parents or guardians during admission. Influenza vaccine was administered as a standing order before discharge, unless refused by the parents or guardians. The study population comprised 602 patients between the ages of 6 months and 21 years who were admitted to the inpatient unit during 2 months of the influenza season (November and December) from 2011 to 2013.
Dr. Goyal, a second-year pediatric resident at the medical center, reported that the influenza vaccination status on admission was positive in only 31% of children in 2011, 30% in 2012, and 34% in 2013. The vaccine screening tool was implemented in 64% of admitted children in 2012 and 70% in 2013. Following implementation, the researchers observed a 5% increase in immunization rates in 2012 and an 11% increase in 2013, with an overall increase of 8% over 2 years (P less than .001). He was quick to point out that the influenza rate could have been improved by an additional 22% had 77% of patients not refused vaccination.
“Unfortunately, as our primary objective was to assess the utility of our screening tool in improving inpatient immunization status, we had very limited data points toward refusal of vaccine,” Dr. Goyal said. “Some of the reasons for refusal that were gathered during screening included preferred vaccination by their primary care provider after discharge. Or, maybe they don’t want the vaccine because they feel that the vaccine will make their kids sick. We don’t have enough data to point to any particular reason. This study provides information on acceptance rate of inpatient immunization, which may be useful for implementing additional educational initiatives to overcome potential barriers and help us reach our national goal.”
The researchers reported having no financial disclosures.
AT PAS 18
Key clinical point: The inpatient setting can be used to successfully improve influenza vaccine rates.
Major finding: Following implementation of a simple inpatient vaccine screening tool, a 5% increase in immunization rates occurred in 2012 and an 11% increase occurred in 2013.
Study details: A review of 602 patients between the ages of 6 months and 21 years who were admitted to the inpatient unit during 2 months of the influenza season (November and December) from 2011 to 2013.
Disclosures: The researchers reported having no financial disclosures.
ESBL-B before colorectal surgery ups risk of surgical site infection
MADRID – Patients who are carriers of , despite a standard prophylactic antibiotic regimen.
Surgical site infections (SSIs) occurred in 23% of those who tested positive for the pathogens preoperatively, compared with 10.5% of ESBL-B–negative patients – a significant increased risk of 2.25, Yehuda Carmeli, MD, said at the European Congress of Clinical Microbiology and Infectious Diseases annual congress.
ESBL-B was not the infective pathogen in most infection cases, but being a carrier increased the likelihood of an ESBL-B SSI. ESBL-B was the pathogen in 7.2% of the carriers and 1.6% of the noncarriers. However, investigators are still working to determine if the species present in the wound infection are the same as the ones present at baseline, said Dr. Carmeli of Tel Aviv Medical Center.
All of these results are emerging from the WP4 study, which was carried out in three hospitals in Serbia, Switzerland, and Israel. Designed as a before-and-after trial, it tested the theory that identifying ESBL carriers and targeting presurgical antibiotic prophylaxis could improve their surgical outcomes.
WP4 was one of five studies in the multinational R-GNOSIS project. “Resistance in Gram-Negative Organisms: Studying Intervention Strategies” is a 12-million-euro, 5-year European collaborative research project designed to identify effective interventions for reducing the carriage, infection, and spread of multi-drug resistant Gram-negative bacteria. From 2012 to 2017, WP4 enrolled almost 4,000 adults scheduled to undergo colorectal surgery (excluding appendectomy or minor anorectal procedures).
Several of the studies were reported at ECCMID 2018.
This portion of R-GNOSIS was intended to investigate the relationship between ESBL-B carriage and postoperative surgical site infections among colorectal surgery patients.
The study comprised 3,626 patients who were preoperatively screened for ESBL-B within 2 weeks of colorectal surgery. The ESBL-B carriage rate was 15.3% overall, but ranged from 12% to 20% by site. Of the carriers, 222 were included in this study sample. They were randomly matched with 444 noncarriers.
Anywhere from 2 weeks to 2 days before surgery, all of the patients received a standard prophylactic antibiotic. This was most often an infusion of 1.5 g cefuroxime plus 500 mg metronidazole. Other cephalosporins were allowed at the clinician’s discretion.
Patients were a mean of 62 years old. Nearly half (48%) had cardiovascular disease and about a third had undergone a prior colorectal surgical procedure. Cancer was the surgical indication in about 70%. Other indications were inflammatory bowel disease and diverticular disease.

A multivariate analysis controlled for age, cardiovascular disease, indication for surgery, and whether the procedure included a rectal resection, retention of drain at the surgical site, or stoma. The model also controlled for National Nosocomial Infection Surveillance score, a three-point scale that estimates surgical infection risk. Among this cohort, 48% were at low risk, 43% at moderate risk, and 10% at high risk.
Dr. Carmeli made no financial disclosures.
SOURCE: Carmeli et al, ECCMID 2018, Oral Abstract O1133.
MADRID – Patients who are carriers of , despite a standard prophylactic antibiotic regimen.
Surgical site infections (SSIs) occurred in 23% of those who tested positive for the pathogens preoperatively, compared with 10.5% of ESBL-B–negative patients – a significant increased risk of 2.25, Yehuda Carmeli, MD, said at the European Congress of Clinical Microbiology and Infectious Diseases annual congress.
ESBL-B was not the infective pathogen in most infection cases, but being a carrier increased the likelihood of an ESBL-B SSI. ESBL-B was the pathogen in 7.2% of the carriers and 1.6% of the noncarriers. However, investigators are still working to determine if the species present in the wound infection are the same as the ones present at baseline, said Dr. Carmeli of Tel Aviv Medical Center.
All of these results are emerging from the WP4 study, which was carried out in three hospitals in Serbia, Switzerland, and Israel. Designed as a before-and-after trial, it tested the theory that identifying ESBL carriers and targeting presurgical antibiotic prophylaxis could improve their surgical outcomes.
WP4 was one of five studies in the multinational R-GNOSIS project. “Resistance in Gram-Negative Organisms: Studying Intervention Strategies” is a 12-million-euro, 5-year European collaborative research project designed to identify effective interventions for reducing the carriage, infection, and spread of multi-drug resistant Gram-negative bacteria. From 2012 to 2017, WP4 enrolled almost 4,000 adults scheduled to undergo colorectal surgery (excluding appendectomy or minor anorectal procedures).
Several of the studies were reported at ECCMID 2018.
This portion of R-GNOSIS was intended to investigate the relationship between ESBL-B carriage and postoperative surgical site infections among colorectal surgery patients.
The study comprised 3,626 patients who were preoperatively screened for ESBL-B within 2 weeks of colorectal surgery. The ESBL-B carriage rate was 15.3% overall, but ranged from 12% to 20% by site. Of the carriers, 222 were included in this study sample. They were randomly matched with 444 noncarriers.
Anywhere from 2 weeks to 2 days before surgery, all of the patients received a standard prophylactic antibiotic. This was most often an infusion of 1.5 g cefuroxime plus 500 mg metronidazole. Other cephalosporins were allowed at the clinician’s discretion.
Patients were a mean of 62 years old. Nearly half (48%) had cardiovascular disease and about a third had undergone a prior colorectal surgical procedure. Cancer was the surgical indication in about 70%. Other indications were inflammatory bowel disease and diverticular disease.
A multivariate analysis controlled for age, cardiovascular disease, indication for surgery, and whether the procedure included a rectal resection, retention of drain at the surgical site, or stoma. The model also controlled for National Nosocomial Infection Surveillance score, a three-point scale that estimates surgical infection risk. Among this cohort, 48% were at low risk, 43% at moderate risk, and 10% at high risk.
Dr. Carmeli made no financial disclosures.
SOURCE: Carmeli et al, ECCMID 2018, Oral Abstract O1133.
REPORTING FROM ECCMID 2018
Key clinical point: ESBL-B colonization increased the risk of surgical site infections after colorectal surgery, despite use of standard preoperative antibiotics.
Major finding: ESBL-B carriage more than doubled the risk of a colorectal surgical site infection by (OR 2.25).
Study details: The prospective study comprised 222 carriers and 444 noncarriers.
Disclosures: The study is part of the R-GNOSIS project, a 12-million-euro, 5-year European collaborative research project designed to identify effective interventions for reducing the carriage, infection, and spread of multi-drug resistant Gram-negative bacteria.
Source: Carmeli Y et al. ECCMID 2018, Oral Abstract O1130.
Phase 2 ‘universal flu vaccine’ trial announced
The National Institute of Allergy and Infectious Diseases (NIAID), part of the National Institutes of Health, announced on May 4 that is sponsoring a phase 2 trial of a universal flu vaccine, M-001. The trial will test the experimental vaccine for safety and its ability to produce potentially broad protective immune responses, both on its own and when followed by a standard seasonal influenza vaccine. It is being conducted at four U.S. sites that are part of the Vaccine and Treatment Evaluation Units, funded by NIAID.
“An effective universal influenza vaccine would lessen the public health burden of influenza, alleviate suffering, and save lives,” said NIAID Director Anthony S. Fauci, MD. Such a vaccine would help eliminate the problem of unanticipated seasonal variation in the flu virus mix, which can make the chosen vaccine combination for that season less effective.
The study is a randomized, double-blind, placebo-controlled trial that will enroll 120 men and nonpregnant women, aged 18-49 years, inclusive, and is designed to assess the safety, reactogenicity, and immunogenicity of two priming doses of M-001 followed by a seasonal quadrivalent inactivated influenza vaccine.
The primary objectives are to assess the safety as measured by vaccine-related adverse events, reactogenicity, and laboratory adverse events; and to assess the T-cell responses to M-001 component peptides.
More information about the study can be found at ClinicalTrials.gov, using the identifier NCT03058692.
Common infections are potent risk factor for MI, stroke
ORLANDO – , according to a “big data” registry study from the United Kingdom.
“Our data show infection was just as much a risk factor or more compared with the traditional atherosclerotic cardiovascular disease risk factors,” Paul Carter, MD, said at the annual meeting of the American College of Cardiology.

Dr. Carter of Aston Medical School in Birmingham, England, presented a retrospective analysis from the ACALM (Algorithm for Comorbidities Associated with Length of stay and Mortality) study of administrative data on all of the more than 1.22 million patients admitted to seven U.K. hospitals in 2000-2013. His analysis included all 34,027 adults aged 40 years or older admitted with a urinary tract or respiratory infection on their index hospitalization who had no history of ischemic heart disease or ischemic stroke.
These patients, with a mean age of 73 years, 59% of whom were women, were compared with an equal number of age- and gender-matched adults whose index hospitalization was for reasons other than ischemic heart disease, stroke, urinary tract infection (UTI), or respiratory infection – the two most common infections resulting in hospitalization in the United Kingdom.
Patients with a respiratory infection or UTI had a 9.9% incidence of new-onset ischemic heart disease and a 4.1% rate of ischemic stroke during follow-up starting upon discharge from their index hospitalization, significantly higher than the 5.9% and 1.5% rates in controls. In a multivariate logistic regression analysis adjusted for demographics, standard cardiovascular risk factors, and the top 10 causes of mortality in the United Kingdom, patients with respiratory infection or UTI as their admitting diagnosis had a 1.36-fold increased likelihood of developing ischemic heart disease post discharge and a 2.5-fold greater risk of ischemic stroke than matched controls.
Moreover, mortality following diagnosis of ischemic heart disease was 75.2% in patients whose index hospitalization was for infection, compared with 51.1% in controls who developed ischemic heart disease without a history of hospitalization for infection, for an adjusted 2.98-fold increased likelihood of death. Similarly, mortality after an ischemic stroke was 59.8% in patients with a prior severe infection, compared with 30.8% in controls, which translated to an adjusted 3.1-fold increased risk of death post stroke in patients with a prior hospitalization for infection.
In the multivariate analysis, hospitalization for infection was a stronger risk factor for subsequent ischemic stroke than was atrial fibrillation, heart failure, type 1 or type 2 diabetes, hypertension, or hyperlipidemia. The risk of ischemic heart disease in patients with an infectious disease hospitalization was similar to the risks associated with most of those recognized risk factors.
Two possible mechanisms by which infection might predispose to subsequent ischemic heart disease and stroke are via a direct effect whereby pathogens such as Chlamydia pneumoniae are taken up into arterial plaques, where they cause a local inflammatory response, or an indirect effect in which systemic inflammation primes the atherosclerotic plaque through distribution of inflammatory cytokines, according to Dr. Carter.
He said the ACALM findings are particularly intriguing when considered in the context of the 2017 results of the landmark CANTOS trial, in which canakinumab (Ilaris), a targeted anti-inflammatory agent that inhibits the interleukin-1 beta innate immunity pathway, reduced recurrent ischemic events in post-MI patients who had high systemic inflammation as evidenced by their elevated C-reactive protein level but a normal-range LDL cholesterol (N Engl J Med. 2017 Aug 27. doi: 10.1056/NEJMoa1707914).
“If atherosclerosis is an inflammatory condition, this begs the question of whether other inflammatory conditions, like infection, which induces a large systemic inflammatory response, might drive atherosclerosis,” Dr. Carter commented.
“It’s now very well understood that inflammatory mediators, cells, and processes are involved in every step from the initial endothelial dysfunction that leads to uptake of LDL, inflammatory cells, and monocytes all the way through to plaque progression and rupture, where Th1 cytokines have been implicated in causing that rupture, and ultimately in patient presentation at the hospital,” he added.
He sees the ACALM findings as hypothesis generating, serving to help lay the groundwork for future clinical trials of vaccine or anti-inflammatory antibiotic therapies.
Dr. Carter reported having no financial conflicts related to his presentation.
SOURCE: Carter P. ACC 2018, Abstract 1325M-0.
ORLANDO – , according to a “big data” registry study from the United Kingdom.
“Our data show infection was just as much a risk factor or more compared with the traditional atherosclerotic cardiovascular disease risk factors,” Paul Carter, MD, said at the annual meeting of the American College of Cardiology.
Dr. Carter of Aston Medical School in Birmingham, England, presented a retrospective analysis from the ACALM (Algorithm for Comorbidities Associated with Length of stay and Mortality) study of administrative data on all of the more than 1.22 million patients admitted to seven U.K. hospitals in 2000-2013. His analysis included all 34,027 adults aged 40 years or older admitted with a urinary tract or respiratory infection on their index hospitalization who had no history of ischemic heart disease or ischemic stroke.
These patients, with a mean age of 73 years, 59% of whom were women, were compared with an equal number of age- and gender-matched adults whose index hospitalization was for reasons other than ischemic heart disease, stroke, urinary tract infection (UTI), or respiratory infection – the two most common infections resulting in hospitalization in the United Kingdom.
Patients with a respiratory infection or UTI had a 9.9% incidence of new-onset ischemic heart disease and a 4.1% rate of ischemic stroke during follow-up starting upon discharge from their index hospitalization, significantly higher than the 5.9% and 1.5% rates in controls. In a multivariate logistic regression analysis adjusted for demographics, standard cardiovascular risk factors, and the top 10 causes of mortality in the United Kingdom, patients with respiratory infection or UTI as their admitting diagnosis had a 1.36-fold increased likelihood of developing ischemic heart disease post discharge and a 2.5-fold greater risk of ischemic stroke than matched controls.
Moreover, mortality following diagnosis of ischemic heart disease was 75.2% in patients whose index hospitalization was for infection, compared with 51.1% in controls who developed ischemic heart disease without a history of hospitalization for infection, for an adjusted 2.98-fold increased likelihood of death. Similarly, mortality after an ischemic stroke was 59.8% in patients with a prior severe infection, compared with 30.8% in controls, which translated to an adjusted 3.1-fold increased risk of death post stroke in patients with a prior hospitalization for infection.
In the multivariate analysis, hospitalization for infection was a stronger risk factor for subsequent ischemic stroke than was atrial fibrillation, heart failure, type 1 or type 2 diabetes, hypertension, or hyperlipidemia. The risk of ischemic heart disease in patients with an infectious disease hospitalization was similar to the risks associated with most of those recognized risk factors.
Two possible mechanisms by which infection might predispose to subsequent ischemic heart disease and stroke are via a direct effect whereby pathogens such as Chlamydia pneumoniae are taken up into arterial plaques, where they cause a local inflammatory response, or an indirect effect in which systemic inflammation primes the atherosclerotic plaque through distribution of inflammatory cytokines, according to Dr. Carter.
He said the ACALM findings are particularly intriguing when considered in the context of the 2017 results of the landmark CANTOS trial, in which canakinumab (Ilaris), a targeted anti-inflammatory agent that inhibits the interleukin-1 beta innate immunity pathway, reduced recurrent ischemic events in post-MI patients who had high systemic inflammation as evidenced by their elevated C-reactive protein level but a normal-range LDL cholesterol (N Engl J Med. 2017 Aug 27. doi: 10.1056/NEJMoa1707914).
“If atherosclerosis is an inflammatory condition, this begs the question of whether other inflammatory conditions, like infection, which induces a large systemic inflammatory response, might drive atherosclerosis,” Dr. Carter commented.
“It’s now very well understood that inflammatory mediators, cells, and processes are involved in every step from the initial endothelial dysfunction that leads to uptake of LDL, inflammatory cells, and monocytes all the way through to plaque progression and rupture, where Th1 cytokines have been implicated in causing that rupture, and ultimately in patient presentation at the hospital,” he added.
He sees the ACALM findings as hypothesis generating, serving to help lay the groundwork for future clinical trials of vaccine or anti-inflammatory antibiotic therapies.
Dr. Carter reported having no financial conflicts related to his presentation.
SOURCE: Carter P. ACC 2018, Abstract 1325M-0.
REPORTING FROM ACC 2018
Key clinical point: Once patients have been hospitalized for a respiratory infection or UTI, their postdischarge risk of ischemic stroke is 2.5-fold greater than in those without such a history.
Major finding: Patients with a history of hospitalization for UTI or a respiratory infection who later develop ischemic heart disease or stroke have a threefold higher mortality risk than those without such a hospitalization.
Study details: This was a retrospective study of more than 68,000 subjects in the U.K. ACALM registry study.
Disclosures: The study presenter reported having no financial conflicts of interest.
Source: Carter P. ACC 2018, Abstract 1325M-0.
Flu activity continues to decline
The 2017-2018 flu season continued to loosen its grip on the country as both outpatient activity and pediatric deaths dropped during the week ending March 3, according to the Centers for Disease Control and Prevention.
After five consecutive weeks of double-digit pediatric deaths related to influenza-like illness (ILI), five deaths were reported for the week ending March 3, four of which occurred in previous weeks. The total for the 2017-2018 season is now 119, the CDC said in its weekly surveillance report.
The proportion of outpatient visits for ILI was 3.7% for the week, which is down from 4.9% the week before and less than half of the seasonal high of 7.5% that was recorded for the week of Feb. 3, CDC data show. The national baseline level of outpatient activity is 2.2%.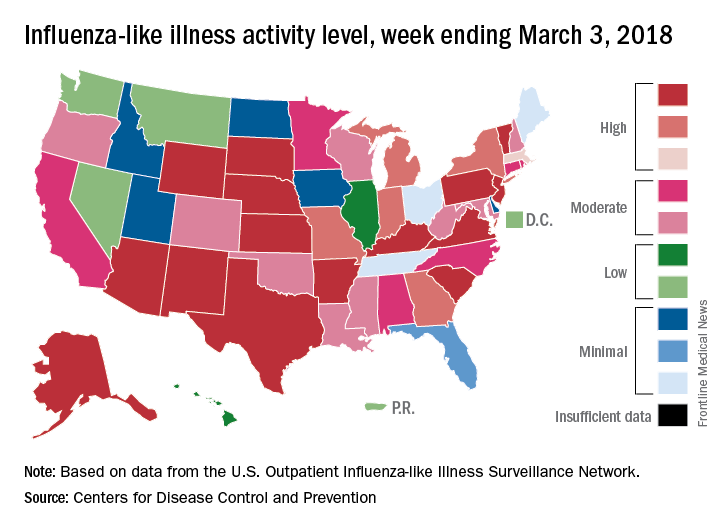
The cumulative hospitalization rate for the 2017-2018 flu season climbed from 84.2 the previous week to 86.3 per 100,000 population – well above the rate of 57.2 per 100,000 that was recorded for the corresponding week of the hospitalization-record-setting 2014-2015 season, FluView data show.
Flu activity takes another turn for the better
Outpatient influenza-like illness activity continues to drop, but pediatric deaths for 2017-2018 are already higher than either of the last two entire seasons, according to the Centers for Disease and Prevention.

An additional 17 influenza-like illness-related (ILI) pediatric deaths were reported during the week ending Feb. 24, eight of which occurred in previous weeks. That brings the total to 114 for the 2017-2018 flu season so far, compared with 110 for the entire 2016-2017 season and 93 for the 2015-2016 season, the CDC reported Mar. 2.
The proportion of outpatient visits for ILI took another big drop, falling to 5.0% for the week, which was down from 6.4% the previous week and the seasonal high of 7.4% the 2 weeks before that (Feb. 10 and Feb. 3), CDC data show.
Flu-related hospitalizations, however, continued to rise to new highs, as the cumulative rate hit 81.7 per 100,000 population. In 2014-2015, the season with the highest number of hospitalizations since the CDC started keeping track, the cumulative rate for the corresponding week was 55.9 per 100,000, according to the CDC’s Fluview website.
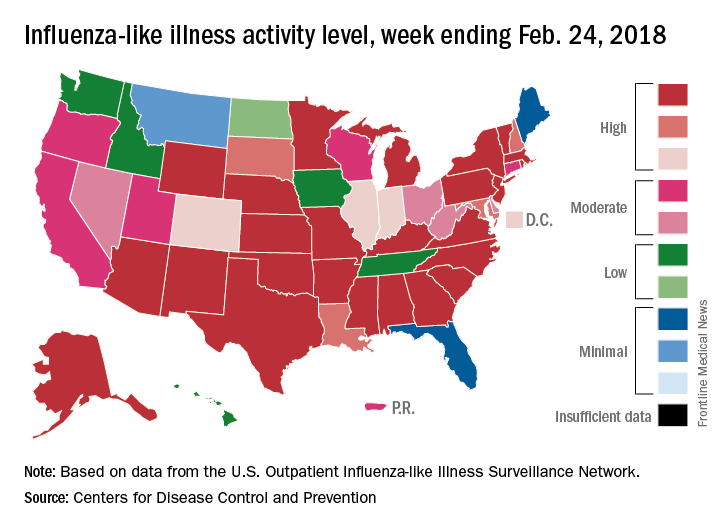
The map of state-reported ILI activity shows that 25 states are at level 10 on the CDC’s 1-10 scale, which is down from 33 the week before. Eight other states and the District of Columbia were in the “high” range with activity at levels 8 and 9 for the week ending Feb. 24, the CDC said.
Outpatient influenza-like illness activity continues to drop, but pediatric deaths for 2017-2018 are already higher than either of the last two entire seasons, according to the Centers for Disease and Prevention.
An additional 17 influenza-like illness-related (ILI) pediatric deaths were reported during the week ending Feb. 24, eight of which occurred in previous weeks. That brings the total to 114 for the 2017-2018 flu season so far, compared with 110 for the entire 2016-2017 season and 93 for the 2015-2016 season, the CDC reported Mar. 2.
The proportion of outpatient visits for ILI took another big drop, falling to 5.0% for the week, which was down from 6.4% the previous week and the seasonal high of 7.4% the 2 weeks before that (Feb. 10 and Feb. 3), CDC data show.
Flu-related hospitalizations, however, continued to rise to new highs, as the cumulative rate hit 81.7 per 100,000 population. In 2014-2015, the season with the highest number of hospitalizations since the CDC started keeping track, the cumulative rate for the corresponding week was 55.9 per 100,000, according to the CDC’s Fluview website.
The map of state-reported ILI activity shows that 25 states are at level 10 on the CDC’s 1-10 scale, which is down from 33 the week before. Eight other states and the District of Columbia were in the “high” range with activity at levels 8 and 9 for the week ending Feb. 24, the CDC said.
2 new influenza strains recommended for next season
SILVER SPRING, MD. – In an effort to better match the vaccine to the virus, federal advisors have recommended two new strains be swapped into the 2018-2019 quadrivalent influenza vaccine.
Singapore A(H3N2) and the B/Colorado/06/2017-like virus (B/Victoria/2/87 lineage) are recommended be added to A/Michigan/45/2015 (H1N1)pdm09-like virus and B/Phuket/3073/2013-like virus (B/Yamagata/16/88 lineage) for the upcoming season, according to a near-unanimous vote at a meeting of the Food and Drug Administration Vaccines and Related Biological Products Advisory Committee.
Trivalent vaccines should include the same strains, with the exception of B/Phuket/3073/2013-like virus (B/Yamagata/16/88 lineage), the committee recommended.
The panel voted separately on the strains, and all votes were unanimous, except for the vote on the B/Colorado/06/2017-like virus (B/Victoria/2/87 lineage) in the trivalent vaccine, which was supported with 11 positive votes with 1 abstention.
The advisory committee’s recommendation is identical to the recommendations recently made by the World Health Organization for next season’s influenza vaccines in the Northern Hemisphere. The WHO recommended that trivalent vaccines contain A/Michigan/45/2015 (H1N1)pdm09-like virus, A/Singapore/INFIMH-16-0019/2016 (H3N2)-like virus, and B/Colorado/06/2017-like virus (B/Victoria/2/87 lineage). WHO also recommended that quadrivalent vaccines contain all of the above strains and B/Phuket/3073/2013-like virus (B/Yamagata/16/88 lineage) as the second influenza B strain.
Most of the influenza activity in the United States this season is due to influenza A (H3N2) viruses (67%), according to Lisa Grohskopf, MD, associate chief for policy & liaison in the Influenza Division at the Centers for Disease Control and Prevention. Fortunately, the majority of circulating strains are similar to those contained in the 2017-2018 vaccine. Only strains with B/Victoria lineage displayed antigenic drift, but represented less than 1% of all circulating viruses.
Hospitalization rates for laboratory-confirmed influenza this season have been markedly higher among people aged 65 years and older, compared with younger age groups, and have increased since last season. As of Feb. 17, the preliminary estimate of hospitalizations in this age group was 322.7 cases per 100,000 people, compared with about 290.5 per 100,000 during the 2016-2017 season. There have been 97 pediatric deaths associated with influenza, compared with 110 reported during the 2016-2017 season, 93 during 2015-2016, and 148 during 2014-2015.
These data are not final because the flu season is still ongoing, but a full analysis will be provided at the end of the season, Dr. Grohskopf pointed out.With H3N2 strains of influenza A predominating, questions on the effectiveness of the newly recommended Singapore A(H3N2) were raised by the committee. Jacqueline Katz, PhD, director of the WHO Collaborating Center for Surveillance, Epidemiology, and Control of Influenza, reassured the committee.
“Yes, in fact, it does cover them very well. The majority of the viruses that we’ve tested at the CDC were that emerging 3C2a2 [clade of H3N2] group, and the Singapore virus covered those very well. In general, that’s why we went with Singapore,” she said.
Dr. Katz added that one of the reasons Singapore is so effective is because of its position in the lineage of these flu strains. “It’s at the base of the [phylogenetic] tree; it’s not on the tip of the tree where things are changing, so it’s a more conservative selection.”
The CDC estimate of current vaccine effectiveness (VE) against influenza A (H3N2) viruses is 25%, as of Feb. 3. Effectiveness is even higher for all influenza viruses, with an estimated VE of 36%, indicating that the flu vaccine reduced a person’s risk of having to seek medical care at a doctor’s office for flu illness by 36% (MMWR. 2018;67:180-5).
While the FDA usually follows the recommendations of its panel members, it is not obligated to do so. None of the committee members disclosed relevant financial conflicts of interest.
REPORTING FROM AN FDA ADVISORY COMMITTEE MEETING
Vaccines: Effectiveness vs. efficacy
During the influenza portion of the Feb. 21, 2018, Centers for Diseases Control and Prevention’s Advisory Committee on Immunization Practices meeting, two pleas from the audience asked the CDC/ACIP to make messages very clear about how protective influenza vaccine really is.
We hear apparently conflicting percentages from Australia, Canada, Europe, and the United States from the many stories/press releases in the news media and from official public health outlets. And the gloomiest ones get the most exposure.1 It can be confusing even for medical care providers who are supposed to advise families on such matters.
A key misunderstanding in many medical and lay news stories is about what vaccine effectiveness and vaccine efficacy really mean. What? Aren’t those the same thing? Nope. They are quite different. And are we sure of what those 95% confidence intervals (CI) mean? Let’s review the “math” so we can explain this to families.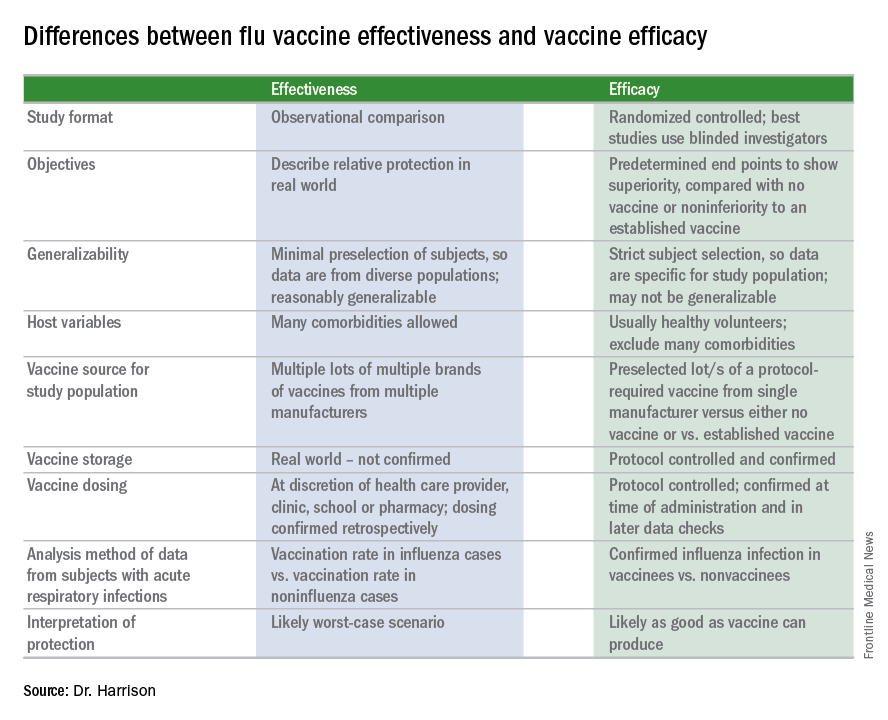
Vaccine effectiveness (VE)2,3
The first thing to know is that the CDC and similar public health agencies in other countries do not report vaccine efficacy. Instead, the percentage reported is VE during (interim estimated VE) and just after (final adjusted VE) each influenza season. This means that VE is generally a retrospective analysis of data, most of which were collected prospectively. Further, VE is likely the worst case scenario. VE is a measure of real-world benefit to patients for whom vaccine is recommended, by analyzing specific geographically diverse populations (population-based) without excluding most underlying illness or comorbidities (note that immunosuppressed persons are excluded). Subjects in VE studies receive their vaccine in the real world and, therefore, vaccinees may receive their vaccines from any number of the usual outlets (e.g., primary care provider, urgent care or emergency department, public health department, pharmacy, school, or nursing home). There are multiple lots of multiple brands from multiple vaccine manufacturers. Children who need two doses of influenza vaccine do not necessarily receive those doses according to the package insert’s schedule. VE studies do not have the capability to confirm that vaccine was stored, handled, and administered in a precisely correct manner according to manufacturer’s and CDC’s recommendations.
VE is calculated using a “test-negative” (case-control) analysis of patients presenting with acute respiratory infections (ARIs). People who are not in vaccine research can find this methodology confusing. Briefly, the VE compares the odds of vaccination in ARIs due to confirmed influenza to the odds of vaccination in ARIs not due to influenza. Additional statistical tools can adjust VE for specific factors. VE is also calculated by factors of interest, such as age, gender, pregnancy, influenza type, region of the country, presence of asthma or other comorbidity, etc. Whether the VE value is the “truth in the universe” is related to having enough subjects in each analyzed group and the degree to which the studied populations actually represent the whole country. So, VE is more accurate when there are large subject numbers.
Remember also that VE is usually calculated from outpatients, so it does not really measure all the benefits of vaccination. Prevention rates for severe influenza (such as influenza hospitalizations) are higher but usually unavailable until after the entire season.
VE studies generally measure real-world and likely worst-case-scenario benefit for the overall population being protected against outpatient influenza medical visits.
Vaccine efficacy2,3
Vaccine efficacy measures how the vaccine performs under ideal circumstances in a regimented protocol in relatively normal hosts – likely the best-case-scenario benefit. Vaccine efficacy is the percent difference in confirmed influenza episodes in vaccinees getting the “experimental” vaccine vs. episodes in nonvaccinees (or vaccinees getting an established vaccine). Vaccine efficacy, therefore, is usually calculated based on prospective well-controlled studies under ideal circumstances in subjects who received their vaccines on time per the recommended schedule. Most such studies are performed on otherwise healthy children or adults, with most comorbidities excluded. The “experimental” vaccine is generally from a single manufacturer from a single lot, and chain-of-custody is well controlled. The vaccine is administered at selected research sites according to a strict protocol; vaccine storage is ensured to be as recommended.
Confidence intervals
To assess whether the “protection” is “significant,” the calculations derive 95% confidence intervals (CI). If the 95% CI range is wide, such as many tens of percents, then there is less confidence that the calculation is correct. And if the lower CI is less than 0, then the result is not significant. For example, a VE of 20% is not highly protective, but can be significant if the 95% CI ranges from 10 to 28 (the lower value of 10 is above zero). It would not be significant if the 95% CI lower limit was –10. Values for seasons 2004-2005 and 2005-2006 were similar to this. Consider however that a VE of 55% seems great, but may not be significant if the 95% CI range is –20 to 89 (the lower value is less than zero). In the ideal world, the VE would be greater than 50% and the 95% CI range would be tight with the lower CI value far above zero; for example, VE of 70% with 95% CI ranging from 60 to 80. The 2010-2011 season was close to this.
Type and age-specific VE
Aside from overall VE, there are subset analyses that can be revealing. This year there are the concerning mid-season VE estimates of approximately 25% for the United States and 17% in Canada, for one specific type, H3N2, which unfortunately has been the dominant circulating U.S. type. That number is what everybody seems to have focused on. But remember influenza B becomes dominant late in most seasons (increasing at the time of writing this article). Interim 2017-2018 VE for influenza B was in the mid 60% range, making the box plot near 40% overall.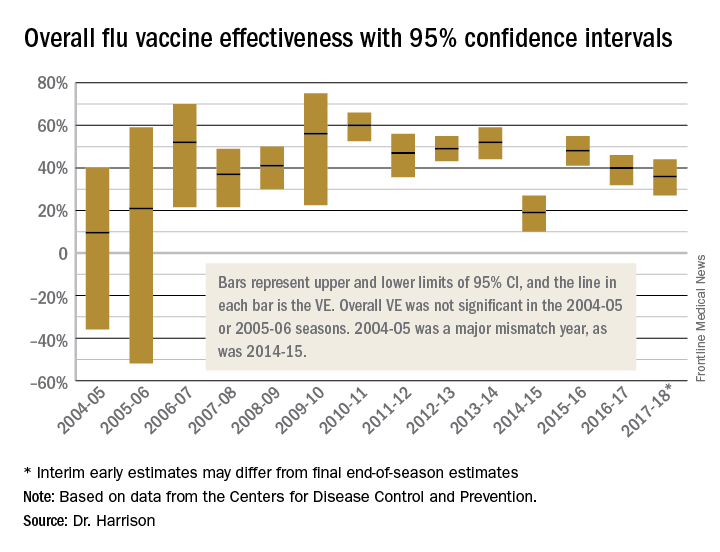
Age-related VE analysis can show difference; for example, the best benefit for H3N2 this season has been in young children and the worst in elderly and 9- to 17-year-olds.
Take-home message
The simplest way to think of overall VE is that it is the real-world, worst-case-scenario value for influenza protection by vaccine against the several circulating types of influenza.

Dr. Harrison is professor of pediatrics and pediatric infectious diseases at Children’s Mercy Hospitals and Clinics, Kansas City, Mo. Children’s Mercy Hospital receives grant funding for Dr. Harrison’s work as an investigator from GSK for MMR and rotavirus vaccine studies, from Merck for in vitro and clinical antibiotic studies, from Allergan for clinical antibiotic studies, from Pfizer for pneumococcal seroepidemiology studies, and from Regeneron for RSV studies. Dr. Harrison received support for travel and to present seroepidemiology data at one meeting. Email him at [email protected].
References
1. MMWR Weekly. 2017 Feb 17;66(6):167-71.
2. Dev Biol Stand. 1998;95:195-201.
3. Lancet Infect Dis. 2012 Jan;12(1):36-44.
During the influenza portion of the Feb. 21, 2018, Centers for Diseases Control and Prevention’s Advisory Committee on Immunization Practices meeting, two pleas from the audience asked the CDC/ACIP to make messages very clear about how protective influenza vaccine really is.
We hear apparently conflicting percentages from Australia, Canada, Europe, and the United States from the many stories/press releases in the news media and from official public health outlets. And the gloomiest ones get the most exposure.1 It can be confusing even for medical care providers who are supposed to advise families on such matters.
A key misunderstanding in many medical and lay news stories is about what vaccine effectiveness and vaccine efficacy really mean. What? Aren’t those the same thing? Nope. They are quite different. And are we sure of what those 95% confidence intervals (CI) mean? Let’s review the “math” so we can explain this to families.
Vaccine effectiveness (VE)2,3
The first thing to know is that the CDC and similar public health agencies in other countries do not report vaccine efficacy. Instead, the percentage reported is VE during (interim estimated VE) and just after (final adjusted VE) each influenza season. This means that VE is generally a retrospective analysis of data, most of which were collected prospectively. Further, VE is likely the worst case scenario. VE is a measure of real-world benefit to patients for whom vaccine is recommended, by analyzing specific geographically diverse populations (population-based) without excluding most underlying illness or comorbidities (note that immunosuppressed persons are excluded). Subjects in VE studies receive their vaccine in the real world and, therefore, vaccinees may receive their vaccines from any number of the usual outlets (e.g., primary care provider, urgent care or emergency department, public health department, pharmacy, school, or nursing home). There are multiple lots of multiple brands from multiple vaccine manufacturers. Children who need two doses of influenza vaccine do not necessarily receive those doses according to the package insert’s schedule. VE studies do not have the capability to confirm that vaccine was stored, handled, and administered in a precisely correct manner according to manufacturer’s and CDC’s recommendations.
VE is calculated using a “test-negative” (case-control) analysis of patients presenting with acute respiratory infections (ARIs). People who are not in vaccine research can find this methodology confusing. Briefly, the VE compares the odds of vaccination in ARIs due to confirmed influenza to the odds of vaccination in ARIs not due to influenza. Additional statistical tools can adjust VE for specific factors. VE is also calculated by factors of interest, such as age, gender, pregnancy, influenza type, region of the country, presence of asthma or other comorbidity, etc. Whether the VE value is the “truth in the universe” is related to having enough subjects in each analyzed group and the degree to which the studied populations actually represent the whole country. So, VE is more accurate when there are large subject numbers.
Remember also that VE is usually calculated from outpatients, so it does not really measure all the benefits of vaccination. Prevention rates for severe influenza (such as influenza hospitalizations) are higher but usually unavailable until after the entire season.
VE studies generally measure real-world and likely worst-case-scenario benefit for the overall population being protected against outpatient influenza medical visits.
Vaccine efficacy2,3
Vaccine efficacy measures how the vaccine performs under ideal circumstances in a regimented protocol in relatively normal hosts – likely the best-case-scenario benefit. Vaccine efficacy is the percent difference in confirmed influenza episodes in vaccinees getting the “experimental” vaccine vs. episodes in nonvaccinees (or vaccinees getting an established vaccine). Vaccine efficacy, therefore, is usually calculated based on prospective well-controlled studies under ideal circumstances in subjects who received their vaccines on time per the recommended schedule. Most such studies are performed on otherwise healthy children or adults, with most comorbidities excluded. The “experimental” vaccine is generally from a single manufacturer from a single lot, and chain-of-custody is well controlled. The vaccine is administered at selected research sites according to a strict protocol; vaccine storage is ensured to be as recommended.
Confidence intervals
To assess whether the “protection” is “significant,” the calculations derive 95% confidence intervals (CI). If the 95% CI range is wide, such as many tens of percents, then there is less confidence that the calculation is correct. And if the lower CI is less than 0, then the result is not significant. For example, a VE of 20% is not highly protective, but can be significant if the 95% CI ranges from 10 to 28 (the lower value of 10 is above zero). It would not be significant if the 95% CI lower limit was –10. Values for seasons 2004-2005 and 2005-2006 were similar to this. Consider however that a VE of 55% seems great, but may not be significant if the 95% CI range is –20 to 89 (the lower value is less than zero). In the ideal world, the VE would be greater than 50% and the 95% CI range would be tight with the lower CI value far above zero; for example, VE of 70% with 95% CI ranging from 60 to 80. The 2010-2011 season was close to this.
Type and age-specific VE
Aside from overall VE, there are subset analyses that can be revealing. This year there are the concerning mid-season VE estimates of approximately 25% for the United States and 17% in Canada, for one specific type, H3N2, which unfortunately has been the dominant circulating U.S. type. That number is what everybody seems to have focused on. But remember influenza B becomes dominant late in most seasons (increasing at the time of writing this article). Interim 2017-2018 VE for influenza B was in the mid 60% range, making the box plot near 40% overall.
Age-related VE analysis can show difference; for example, the best benefit for H3N2 this season has been in young children and the worst in elderly and 9- to 17-year-olds.
Take-home message
The simplest way to think of overall VE is that it is the real-world, worst-case-scenario value for influenza protection by vaccine against the several circulating types of influenza.
Dr. Harrison is professor of pediatrics and pediatric infectious diseases at Children’s Mercy Hospitals and Clinics, Kansas City, Mo. Children’s Mercy Hospital receives grant funding for Dr. Harrison’s work as an investigator from GSK for MMR and rotavirus vaccine studies, from Merck for in vitro and clinical antibiotic studies, from Allergan for clinical antibiotic studies, from Pfizer for pneumococcal seroepidemiology studies, and from Regeneron for RSV studies. Dr. Harrison received support for travel and to present seroepidemiology data at one meeting. Email him at [email protected].
References
1. MMWR Weekly. 2017 Feb 17;66(6):167-71.
2. Dev Biol Stand. 1998;95:195-201.
3. Lancet Infect Dis. 2012 Jan;12(1):36-44.