User login
The Association of Discharge Before Noon and Length of Stay in Hospitalized Pediatric Patients
Many hospitals and emergency departments (EDs) face challenges posed by overcrowding and hospital throughput. Slow ED throughput has been associated with worse patient outcomes.1 One strategy increasingly employed to improve hospital throughput is to increase the rate of inpatient discharges earlier in the day, which is often defined as discharges before noon (DCBNs). The hypothesis behind DCBN is that earlier hospital discharges will allow for earlier ED admissions and thus mitigate ED overcrowding while optimizing inpatient hospital flow. Previous quality improvement efforts to increase the percentage of DCBNs have been successfully implemented. For example, Wertheimer et al. implemented a process for earlier discharges and reported a 27-percentage point (11% to 38%) increase in DCBN on general medicine units.2 In a recent survey among leaders in hospital medicine programs, a majority reported early discharge as an important institutional goal.3
Studies of the effectiveness of DCBN initiatives on improving throughput and shortening length of stay (LOS) in adult patients have had mixed results. Computer modeling has supported the idea that earlier inpatient discharges would shorten ED patient boarding time.4
A question of interest for hospitals is if DCBN is a good indicator of shorter LOS, or is DCBN an arbitrary indicator, as morning discharges might just be the result of a delayed discharge of a patient ready for discharge the prior afternoon/evening. Our study objectives were: (1) to determine whether DCBN is associated with a shorter LOS in a pediatric population at an academic medical center, and (2) to examine separately this association in medical and surgical patients given the different provider workflow and patient clinical characteristics in those groups.
PATIENTS AND METHODS
Patients and Settings
We included patients 21 years or younger with an inpatient admission to any of the following pediatric medical or surgical services: cardiac surgery, cardiology, endocrinology, gastroenterology, general services, hematology/oncology, nephrology, orthopedics, otolaryngology, plastic surgery, pulmonology, and urology. Patients whose stay did not extend beyond one midnight were excluded because discharge time of day for these short stays was strongly related to the time of admission. We also excluded patients whose stay extended beyond two standard deviations of the average LOS for the discharge service under the assumption that these patients represented atypical circumstances. Finally, we excluded patients who died or left against medical advice. A consortium diagram of all exclusion criteria can be found in Supplemental Figure 1. Discharge data were extracted from the Carolina Database Warehouse, a data repository of the University of North Carolina Health System. The University of North Carolina Institutional Review Board reviewed and approved this study (IRB 17-0500).
Measures
The outcome of interest was LOS, defined as discharge date and time minus admission date and time, and thus a continuous measure of time in the hospital rather than a number of midnights. Rajkomar et al. used the same definition of LOS.6 The independent variable of interest was whether the discharge occurred before noon. Because discharges between midnight and 8:00
All model covariates were collected at the patient level (Table 1)
Statistical Analysis
Student t tests and χ2 statistics were used to compare baseline characteristics of hospitalizations of patients DCBN and after noon. We used ordinary least squares (OLS) regression models to assess the association between DCBN and LOS. Because DCBN may be correlated with patient characteristics, we used propensity score weighted models. Propensity scores were estimated using a logistic regression predicting DCBN using the variables given in Table 1 (excluding the outcome variable LOS). To estimate the average treatment effect on the entire sample for each model, we weighted each observation by the inverse-probability of treatment as per recent propensity score methods detailed by Garrido et al.9 In the inverse-probability weighted models, we clustered on attending physician to adjust for the autocorrelation caused by unobservable similarities of discharges by the same attending. We tested for multicollinearity using the variance inflation factor (VIF). To test our secondary hypothesis that there was a difference in the relationship between DCBN and LOS based on service type (medical versus surgical), we tested if the service type moderated any of the coefficients using a joint Wald test on the 10 coefficients interacted with the service type.
For our sensitivity analysis, we reran all surgical and medical discharges models changing the LOS outlier exclusion criteria to greater than three and then four standard deviations. Statistical modeling and analysis were completed using Stata version 14 (StataCorp, College Station, Texas).
RESULTS
Our study sample comprised 8,226 pediatric hospitalizations with a LOS mean of 5.10 and a median of 3.91 days respectively (range, 1.25-32.83 days). There were 1,531 (18.6%) DCBNs. Compared to those discharged after noon, patients with DCBN had a higher probability of being surgical patients, having commercial insurance, discharge home with self-care, discharge on the weekend, and discharge from a nonquality improvement unit (Table 1). Patients with DCBN were also more likely to be white, non-Hispanic, and male.
Our propensity score weighted ordinary least score (OLS) LOS regression results are presented in Table 2. In the bivariate analysis, DCBN was associated with an average 0.40 day, or roughly 10 hours, shorter LOS (P < .001). In the multivariate model of all discharges, we found that DCBN was associated with a mean of 0.27 day (P = .010) shorter LOS when compared to discharge in the afternoon when controlling for age, race, ethnicity, weekend discharge, discharge from quality improvement unit, discharge service type, CMI, insurance type, and discharge disposition. 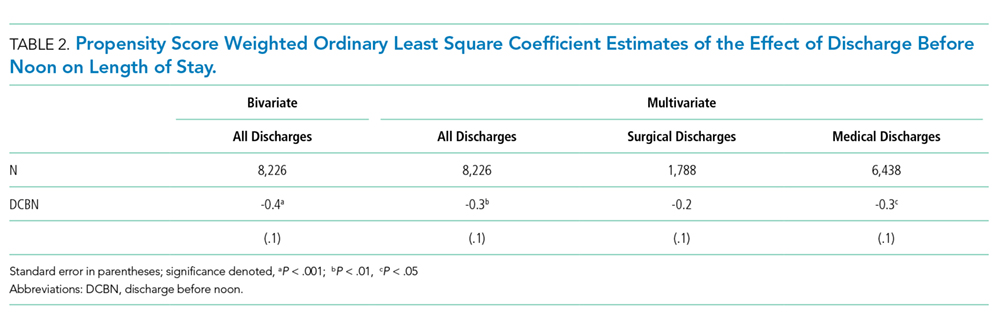
There was no evidence of multicollinearity (mean VIF of 1.14). The Wald test returned an F statistic of 27.50 (P < .001) indicating there was a structural difference in the relationship between LOS and DCBN dependent on discharge service type; thus, we ran separate surgical and medical discharge models to interpret model coefficients for both service types. When we analyzed surgical and medical discharges in separate models, the effect of DCBN on LOS in the medical discharges model was significantly associated with a 0.30 day (P = .017) shorter LOS (Table 2). The association was not significant in the surgical discharges model.
To further test the analysis, we increased the LOS outlier exclusion criteria to three and four standard deviations.
DISCUSSION
The differential effect of DCBN on LOS in surgical and medical discharges suggests that the relationship between DCBN and LOS may be related to provider team workflow. For example, surgical teams may tend to round one time per day early in the morning before spending the entire day in the operating room, and thus completing more early morning discharge orders compared to medical teams. However, if a patient on a surgical service is not ready for discharge first thing in the morning, the patient may be more likely to wait until the following morning for a discharge order. On medical services, physician schedules may allow for more flexibility for rounding and responding with a discharge order when a patient becomes ready; however, medical services may round later in the day compared to surgeons and for a longer period of time, delaying discharges beyond noon that could have been made earlier. Another possibility, given UNC pediatric services are loosely regionalized with surgical patients concentrated more in one unit, is that unit-level differences in how staff processed discharges could have contributed to the difference observed between medical and surgical patients, particularly as there was a unit-level quality improvement effort for decreasing discharge time on one of two medical floors. However, we analyzed for differences based on the discharging unit and found no association. The influence of outliers on the association between DCBN and LOS increases also suggests that this group of children who have extremely long hospital stays might need further exploration.
Our study has some similar and some contrasting results with prior studies in adult patients. Our findings support the modeling literature that suggests DCBN may improve discharge efficiency by shortening patient LOS for some discharges.4 These findings contrast with Rajkomar et al., who reported that DCBN was associated with a longer LOS in adult patients.6 The contrasting findings could be due to differences in pediatric versus adult patients.
Our study has several limitations. While we controlled for observable characteristics using covariates and propensity score weighted analyses, there are likely unobservable characteristics that confound our analysis. We did not measure other factors that may affect discharge time of day such as high occupancy, staffing levels, patient transportation availability, and patient and family preferences. Given these limitations, we caution against interpreting a causal relationship between independent variables and the outcome. Finally, this analysis was conducted at a single tertiary care, academic medical center. The majority of pediatric admissions at this institution are either transferred from other hospitals or scheduled admissions for medical or surgical care. A smaller proportion of discharges are acute, unplanned admissions through our emergency department in children with or without underlying medical complexity. These factors plus the exclusion of observation, extended recovery, and all the less than two-day stays in this study contribute to a relatively higher average LOS. These factors potentially limit generalizability to other care settings. Additionally, the majority of the care teams involve care by resident physicians, and they are often the primary caregivers and write the majority of orders in patient charts such as discharge orders. While we were not able to control for within resident physician similarities between patients, we did control for autocorrelation at the attending level.
CONCLUSION
The results of our study suggest that DCBN is associated with a decreased LOS for medical but not surgical pediatric patients. DCBN may not be an appropriate measure for all services. Further research should be done to identify other feasible but more valid indicators for shorter LOS.
Disclosures
The authors have no financial relationships relative to this article to disclose. The authors have no conflicts of interest relevant to this article to disclose.
Funding
There were no external sources of funding for this work.
1. Bernstein SL, Aronsky D, Duseja R, et al. The effect of emergency department crowding on clinically oriented outcomes. Acad Emerg Med. 2009;16(1):1-10. doi:10.1111/j.1553-2712.2008.00295.x. PubMed
2. Wertheimer B, Jacobs RE, Bailey M, et al. Discharge before noon: an achievable hospital goal. J Hosp Med. 2014;9(4):210-214. doi: 10.1002/jhm.2154. PubMed
3. Patel H, Fang MC, Mourad M, et al. Hospitalist and internal medicine leaders’ perspectives of early discharge challenges at academic medical centers. J Hosp Med. 2017;13(6):388-391. doi: 10.12788/jhm.2885. PubMed
4. Powell ES, Khare RK, Venkatesh AK, Van Roo BD, Adams JG, Reinhardt G. The relationship between inpatient discharge timing and emergency department boarding. J Emerg Med. 2012;42(2):186-196. doi:10.1016/j.jemermed.2010.06.028. PubMed
5. Wertheimer B, Jacobs RE, Iturrate E, Bailey M, Hochman K. Discharge before noon: effect on throughput and sustainability. J Hosp Med. 2015;10(10):664-669. doi:10.1002/jhm.2412. PubMed
6. Rajkomar A, Valencia V, Novelero M, Mourad M, Auerbach A. The association between discharge before noon and length of stay in medical and surgical patients. J Hosp Med. 2016;11(12):859-861. doi:10.1002/jhm.2529. PubMed
7. Shine D. Discharge before noon: an urban legend. Am J Med. 2015;128(5):445-446. doi:10.1016/j.amjmed.2014.12.011. PubMed
8. Sauer B, Brookhart MA, Roy JA, VanderWeele TJ. Covariate selection. In: Velentgas P, Dreyer NA, Nourjah P, Smith SR, Torchia MM, eds. Developing a Protocol for Observational Comparative Effectiveness Research: A User’s Guide. Rockville, MD: Agency for Healthcare Research and Quality (US); 2013. PubMed
9. Garrido MM, Kelley AS, Paris J, et al. Methods for constructing and assessing propensity scores. Health Serv Res. 2014;49(5):1701-1720. doi:10.1111/1475-6773.12182. PubMed
10. Maguire P. Do discharge-before-noon Intiatives work? 2016. https://www.todayshospitalist.com/do-discharge-before-noon-initiatives-work/. Accessed April, 2018.
Many hospitals and emergency departments (EDs) face challenges posed by overcrowding and hospital throughput. Slow ED throughput has been associated with worse patient outcomes.1 One strategy increasingly employed to improve hospital throughput is to increase the rate of inpatient discharges earlier in the day, which is often defined as discharges before noon (DCBNs). The hypothesis behind DCBN is that earlier hospital discharges will allow for earlier ED admissions and thus mitigate ED overcrowding while optimizing inpatient hospital flow. Previous quality improvement efforts to increase the percentage of DCBNs have been successfully implemented. For example, Wertheimer et al. implemented a process for earlier discharges and reported a 27-percentage point (11% to 38%) increase in DCBN on general medicine units.2 In a recent survey among leaders in hospital medicine programs, a majority reported early discharge as an important institutional goal.3
Studies of the effectiveness of DCBN initiatives on improving throughput and shortening length of stay (LOS) in adult patients have had mixed results. Computer modeling has supported the idea that earlier inpatient discharges would shorten ED patient boarding time.4
A question of interest for hospitals is if DCBN is a good indicator of shorter LOS, or is DCBN an arbitrary indicator, as morning discharges might just be the result of a delayed discharge of a patient ready for discharge the prior afternoon/evening. Our study objectives were: (1) to determine whether DCBN is associated with a shorter LOS in a pediatric population at an academic medical center, and (2) to examine separately this association in medical and surgical patients given the different provider workflow and patient clinical characteristics in those groups.
PATIENTS AND METHODS
Patients and Settings
We included patients 21 years or younger with an inpatient admission to any of the following pediatric medical or surgical services: cardiac surgery, cardiology, endocrinology, gastroenterology, general services, hematology/oncology, nephrology, orthopedics, otolaryngology, plastic surgery, pulmonology, and urology. Patients whose stay did not extend beyond one midnight were excluded because discharge time of day for these short stays was strongly related to the time of admission. We also excluded patients whose stay extended beyond two standard deviations of the average LOS for the discharge service under the assumption that these patients represented atypical circumstances. Finally, we excluded patients who died or left against medical advice. A consortium diagram of all exclusion criteria can be found in Supplemental Figure 1. Discharge data were extracted from the Carolina Database Warehouse, a data repository of the University of North Carolina Health System. The University of North Carolina Institutional Review Board reviewed and approved this study (IRB 17-0500).
Measures
The outcome of interest was LOS, defined as discharge date and time minus admission date and time, and thus a continuous measure of time in the hospital rather than a number of midnights. Rajkomar et al. used the same definition of LOS.6 The independent variable of interest was whether the discharge occurred before noon. Because discharges between midnight and 8:00
All model covariates were collected at the patient level (Table 1)
Statistical Analysis
Student t tests and χ2 statistics were used to compare baseline characteristics of hospitalizations of patients DCBN and after noon. We used ordinary least squares (OLS) regression models to assess the association between DCBN and LOS. Because DCBN may be correlated with patient characteristics, we used propensity score weighted models. Propensity scores were estimated using a logistic regression predicting DCBN using the variables given in Table 1 (excluding the outcome variable LOS). To estimate the average treatment effect on the entire sample for each model, we weighted each observation by the inverse-probability of treatment as per recent propensity score methods detailed by Garrido et al.9 In the inverse-probability weighted models, we clustered on attending physician to adjust for the autocorrelation caused by unobservable similarities of discharges by the same attending. We tested for multicollinearity using the variance inflation factor (VIF). To test our secondary hypothesis that there was a difference in the relationship between DCBN and LOS based on service type (medical versus surgical), we tested if the service type moderated any of the coefficients using a joint Wald test on the 10 coefficients interacted with the service type.
For our sensitivity analysis, we reran all surgical and medical discharges models changing the LOS outlier exclusion criteria to greater than three and then four standard deviations. Statistical modeling and analysis were completed using Stata version 14 (StataCorp, College Station, Texas).
RESULTS
Our study sample comprised 8,226 pediatric hospitalizations with a LOS mean of 5.10 and a median of 3.91 days respectively (range, 1.25-32.83 days). There were 1,531 (18.6%) DCBNs. Compared to those discharged after noon, patients with DCBN had a higher probability of being surgical patients, having commercial insurance, discharge home with self-care, discharge on the weekend, and discharge from a nonquality improvement unit (Table 1). Patients with DCBN were also more likely to be white, non-Hispanic, and male.
Our propensity score weighted ordinary least score (OLS) LOS regression results are presented in Table 2. In the bivariate analysis, DCBN was associated with an average 0.40 day, or roughly 10 hours, shorter LOS (P < .001). In the multivariate model of all discharges, we found that DCBN was associated with a mean of 0.27 day (P = .010) shorter LOS when compared to discharge in the afternoon when controlling for age, race, ethnicity, weekend discharge, discharge from quality improvement unit, discharge service type, CMI, insurance type, and discharge disposition.
There was no evidence of multicollinearity (mean VIF of 1.14). The Wald test returned an F statistic of 27.50 (P < .001) indicating there was a structural difference in the relationship between LOS and DCBN dependent on discharge service type; thus, we ran separate surgical and medical discharge models to interpret model coefficients for both service types. When we analyzed surgical and medical discharges in separate models, the effect of DCBN on LOS in the medical discharges model was significantly associated with a 0.30 day (P = .017) shorter LOS (Table 2). The association was not significant in the surgical discharges model.
To further test the analysis, we increased the LOS outlier exclusion criteria to three and four standard deviations.
DISCUSSION
The differential effect of DCBN on LOS in surgical and medical discharges suggests that the relationship between DCBN and LOS may be related to provider team workflow. For example, surgical teams may tend to round one time per day early in the morning before spending the entire day in the operating room, and thus completing more early morning discharge orders compared to medical teams. However, if a patient on a surgical service is not ready for discharge first thing in the morning, the patient may be more likely to wait until the following morning for a discharge order. On medical services, physician schedules may allow for more flexibility for rounding and responding with a discharge order when a patient becomes ready; however, medical services may round later in the day compared to surgeons and for a longer period of time, delaying discharges beyond noon that could have been made earlier. Another possibility, given UNC pediatric services are loosely regionalized with surgical patients concentrated more in one unit, is that unit-level differences in how staff processed discharges could have contributed to the difference observed between medical and surgical patients, particularly as there was a unit-level quality improvement effort for decreasing discharge time on one of two medical floors. However, we analyzed for differences based on the discharging unit and found no association. The influence of outliers on the association between DCBN and LOS increases also suggests that this group of children who have extremely long hospital stays might need further exploration.
Our study has some similar and some contrasting results with prior studies in adult patients. Our findings support the modeling literature that suggests DCBN may improve discharge efficiency by shortening patient LOS for some discharges.4 These findings contrast with Rajkomar et al., who reported that DCBN was associated with a longer LOS in adult patients.6 The contrasting findings could be due to differences in pediatric versus adult patients.
Our study has several limitations. While we controlled for observable characteristics using covariates and propensity score weighted analyses, there are likely unobservable characteristics that confound our analysis. We did not measure other factors that may affect discharge time of day such as high occupancy, staffing levels, patient transportation availability, and patient and family preferences. Given these limitations, we caution against interpreting a causal relationship between independent variables and the outcome. Finally, this analysis was conducted at a single tertiary care, academic medical center. The majority of pediatric admissions at this institution are either transferred from other hospitals or scheduled admissions for medical or surgical care. A smaller proportion of discharges are acute, unplanned admissions through our emergency department in children with or without underlying medical complexity. These factors plus the exclusion of observation, extended recovery, and all the less than two-day stays in this study contribute to a relatively higher average LOS. These factors potentially limit generalizability to other care settings. Additionally, the majority of the care teams involve care by resident physicians, and they are often the primary caregivers and write the majority of orders in patient charts such as discharge orders. While we were not able to control for within resident physician similarities between patients, we did control for autocorrelation at the attending level.
CONCLUSION
The results of our study suggest that DCBN is associated with a decreased LOS for medical but not surgical pediatric patients. DCBN may not be an appropriate measure for all services. Further research should be done to identify other feasible but more valid indicators for shorter LOS.
Disclosures
The authors have no financial relationships relative to this article to disclose. The authors have no conflicts of interest relevant to this article to disclose.
Funding
There were no external sources of funding for this work.
1. Bernstein SL, Aronsky D, Duseja R, et al. The effect of emergency department crowding on clinically oriented outcomes. Acad Emerg Med. 2009;16(1):1-10. doi:10.1111/j.1553-2712.2008.00295.x. PubMed
2. Wertheimer B, Jacobs RE, Bailey M, et al. Discharge before noon: an achievable hospital goal. J Hosp Med. 2014;9(4):210-214. doi: 10.1002/jhm.2154. PubMed
3. Patel H, Fang MC, Mourad M, et al. Hospitalist and internal medicine leaders’ perspectives of early discharge challenges at academic medical centers. J Hosp Med. 2017;13(6):388-391. doi: 10.12788/jhm.2885. PubMed
4. Powell ES, Khare RK, Venkatesh AK, Van Roo BD, Adams JG, Reinhardt G. The relationship between inpatient discharge timing and emergency department boarding. J Emerg Med. 2012;42(2):186-196. doi:10.1016/j.jemermed.2010.06.028. PubMed
5. Wertheimer B, Jacobs RE, Iturrate E, Bailey M, Hochman K. Discharge before noon: effect on throughput and sustainability. J Hosp Med. 2015;10(10):664-669. doi:10.1002/jhm.2412. PubMed
6. Rajkomar A, Valencia V, Novelero M, Mourad M, Auerbach A. The association between discharge before noon and length of stay in medical and surgical patients. J Hosp Med. 2016;11(12):859-861. doi:10.1002/jhm.2529. PubMed
7. Shine D. Discharge before noon: an urban legend. Am J Med. 2015;128(5):445-446. doi:10.1016/j.amjmed.2014.12.011. PubMed
8. Sauer B, Brookhart MA, Roy JA, VanderWeele TJ. Covariate selection. In: Velentgas P, Dreyer NA, Nourjah P, Smith SR, Torchia MM, eds. Developing a Protocol for Observational Comparative Effectiveness Research: A User’s Guide. Rockville, MD: Agency for Healthcare Research and Quality (US); 2013. PubMed
9. Garrido MM, Kelley AS, Paris J, et al. Methods for constructing and assessing propensity scores. Health Serv Res. 2014;49(5):1701-1720. doi:10.1111/1475-6773.12182. PubMed
10. Maguire P. Do discharge-before-noon Intiatives work? 2016. https://www.todayshospitalist.com/do-discharge-before-noon-initiatives-work/. Accessed April, 2018.
© 2019 Society of Hospital Medicine
Screening for Humoral Immunodeficiency in Patients with Community-Acquired Pneumonia
Community-acquired pneumonia (CAP) is the most common infection in hospitalized patients and the eighth most common cause of death in the United States.1 Mortality from CAP is estimated to be 5.1% in the outpatient population,13.6% in hospitalized patients, and 35.1% in patients admitted to the intensive care unit.2,3 CAP accounts for more than 50,000 deaths annually in the United States.2 There are multiple risk factors for CAP, including tobacco use, malnutrition, chronic obstructive pulmonary disease (COPD), bronchiectasis, cystic fibrosis, and mechanical bronchial obstruction. Underlying immunodeficiency, specifically humoral immunodeficiency, is also a risk factor for CAP.
Primary immunodeficiency (PIDD) is estimated to affect one in 1,800 individuals in the United States.4 The National Institutes of Health (NIH) estimates that only one out of three individuals with PIDD are appropriately diagnosed. Based on probability calculations on known PIDD patients versus incidence of disease, the NIH estimates that more than 500,000 individuals with PIDD remain undiagnosed in the United States.4 Further, there exists an average diagnostic delay of at least five years. This delay increases both morbidity and mortality and leads to increased healthcare utilization.5,6
The most common form of primary immunodeficiency is due to humoral immunodeficiency, including selective IgA deficiency, specific antibody deficiency, and common variable immunodeficiency. Specific antibody deficiency is defined as a lack of response to polysaccharide antigens in the setting of low to normal Ig levels and an intact response to peptide antigens.7 Selective IgA deficiency is defined as the isolated deficiency of serum IgA in the setting of normal serum levels of IgG and IgM in an individual older than four years in whom other causes of hypogammaglobinemia have been excluded.8 Common variable immunodeficiency (CVID) is defined as a decreased serum concentration of IgG in combination with low levels of IgA and/or IgM with a poor or absent response to immunization in the absence of other defined immunodeficiency state.9 In addition to experiencing recurrent infections—namely bronchitis, sinusitis, otitis, and pneumonia—patients with CVID are also at increased risk of autoimmunity and malignancy. In adults, secondary immunodeficiency is more common than primary immunodeficiency. Secondary immunodeficiency occurs commonly with disease states like HIV infection, diabetes, cirrhosis, malnutrition, and autoimmune conditions.10 Additional causes of secondary immune defects due to humoral immunodeficiency include immune-modulating drugs—such as rituximab and ibrutinib—and hematologic malignancies, including chronic lymphocytic leukemia and multiple myeloma. Recurrent infections remain the leading cause of morbidity and mortality in patients with both primary and secondary immunodeficiency.11,12
Evaluation of the humoral immune system begins with measurement of serum immunoglobulin (Ig) levels. Although abnormal Ig levels are not diagnostic of immunodeficiency, abnormal results may prompt additional evaluation. Screening strategies may assist in making an earlier diagnoses, potentially decreasing morbidity and mortality in patients with immunodeficiency.13-15 To date, there have been no studies evaluating the utility of screening Ig levels to evaluate for underlying humoral immunodeficiency in patients hospitalized for CAP.
METHODS
Study Design
This was a prospective cohort study conducted at Rochester General Hospital, a 528-bed tertiary care medical center, from February 2017 to April 2017. We enrolled 100 consecutive patients admitted to the inpatient internal medicine service with a physician diagnosis of CAP. Written consent was obtained from each patient. The study was approved by the institutional review board at Rochester General Hospital.
Case Definition
The following criteria were used to diagnose CAP: (1) Respiratory symptoms of productive cough or pleuritic chest pain, (2) Fever >38°C before or at the time of admission, and (3) chest imaging with infiltrate. Exclusion criteria included a diagnosis of hospital-acquired pneumonia, prior diagnosis of primary immunodeficiency, immunosuppression due to an underlying condition, such as HIV or malignancy, therapy with immunosuppressive medications including chemotherapy, Ig replacement within the past six months, or treatment with >10 mg prednisone for greater than 14 days before hospital admission.
Patients underwent an additional evaluation by a clinical immunologist if they met one of the following criteria: any hypergammaglobinemia (elevated IgG, IgM, or IgA), IgG hypogammaglobinemia <550 mg/dL, undetectable IgM or IgA, or if IgG, IgM, and IgA were all below the lower limit of normal.
CURB-65 was used for estimation of the severity of illness with CAP. The components of the score include age ≥65, confusion, BUN >19 mg/dl, respiratory rate ≥30 breaths per minute and systolic blood pressure <90 mm Hg or diastolic blood pressure ≤60 mm Hg. Each component is scored zero if absent or one if present. Predicted mortality ranges from 0.6% for a score of zero to 27.8% for a score of 5.
Data Collection
Patient health information including age, race, gender, medical history, admission notes, results of chest imaging studies, and relevant laboratory studies including serum levels of IgG, IgM, IgA, IgE on admission was obtained from the electronic medical health record. An additional evaluation by the immunologist occurred within three months of hospital discharge and included repeat Ig levels, pre- and postvaccination titers of polysaccharide and peptide antigens, serum protein electrophoresis, and B & T cell panels.
Description of Normal Levels
The normal levels of immunoglobulins were defined based on standard reference ranges at the laboratory at Rochester General Hospital; IgG (700-1,600 mg/dl), IgM (50-300 mg/dl), IgA (70-400 mg/dl), and IgE (0-378 IU/ml). Although there is no established classification regarding the degree of IgG hypogammaglobinemia,16 clinical immunologists commonly classify the severity of IgG hypogammaglobinemia as follows: mild (550-699 mg/dL), moderate (400-549 mg/dL), and severe (<400 mg/dL) IgG hypogammaglobinemia.
Statistical Analysis
Statistical analysis was performed using STATA software (StataCorp LLC, College Station, Texas). We conducted a Wilcoxon rank-sum test to compare the median difference in length of stay between groups with a low versus normal range of immunoglobulins. A Kruskal–Wallis test was performed to check for the median difference in IgG levels across degrees of illness severity (CURB-65 score categories). We conducted a simple linear regression analysis using the logarithmic data of the length of stay and IgG level variables. A chi-square test was used to determine the association between comorbidities and Ig levels.
RESULTS
Baseline Characteristics
There were 100 patients with CAP enrolled in this study with a median age of 65.04 ± 18.8, and 53% were female. Forty-seven patients reported a previous history of pneumonia and 18 reported a history of recurrent sinusitis or otitis media. Of the 100 enrolled patients, 46 had received pneumococcal polysaccharide vaccine (PPV23), 26 had received the 13-valent pneumococcal conjugate vaccine (PCV13), and 22 had received both (Table 1). The mean white blood cell count on admission was 12.9 ± 7 × 10³/uL with 75 ± 12.5% neutrophils. Total protein (6.5 ± 0.8) and albumin (3.7 ± 0.5) were within the normal range for the study population.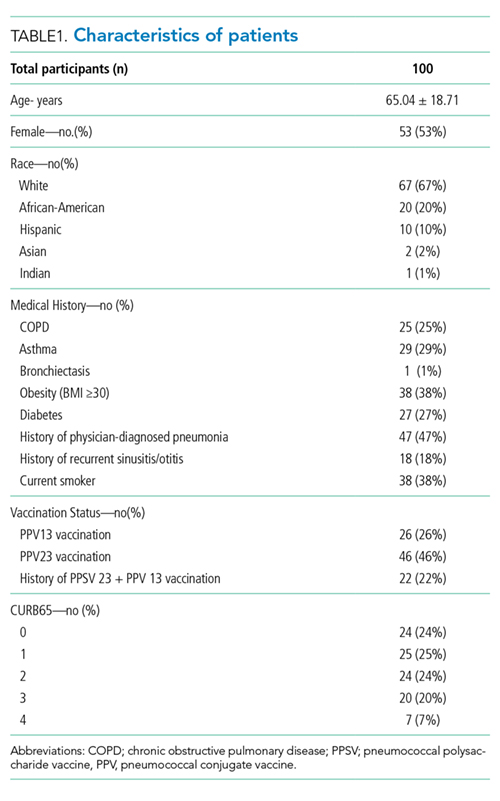
Immunoglobulin Analyses
The prevalence of hypogammaglobinemia in the study was 38% (95% CI: 28.47% to 48.25%). The median values of Ig levels for the entire study population and in patients with hypogammaglobinemia are summarized in Table 2.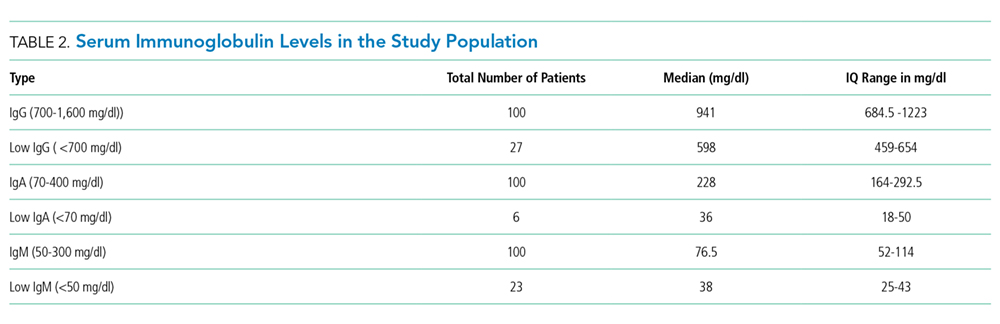
- IgG hypogammaglobinemia (<700 mg/dl) was found in 27/100 patients, with a median level of 598 mg/dL, IQ range: 459-654. The median age in this group was 76.5 years, and 13 were female. Of these 27 patients, 10 had low IgM, four had low IgA, and four had an elevated IgE. In this group, 11 patients had received PPSV23, nine had received PCV13, and six had received both PPV23 and PCV13 before the index hospital admission.
- IgG hypergammaglobinemia (>1,600 mg/dl) was found in 9/100 patients, with a median level of 1,381 mg/dL, IQ range: 1,237-1,627. The median age was 61 years, and six were female. Of these nine patients, three had low IgM, one had low IgA, and four had elevated IgE.
- IgM hypogammaglobinemia (<50 mg/dl) was found in 23/100 patients with a median level of 38 mg/dL, IQ range: 25-43. In this group, the median age was 69 years, and 10 were female. Of these 23 patients, 10 had low IgG, and three had an elevated IgG.
- IgM hypergammaglobinemia (>300 mg/dl) was noted in two patients, with a median level of 491 mg/dL, IQ range: 418-564. Both patients were female, and one had elevated IgG.
- IgA hypogammaglobinemia (<70 mg/dl) was discovered in six patients, with a median level of 36 mg/dL, IQ range: 18-50. In this group, four patients had low IgG, four had low IgM, one had elevated IgE, and one had elevated IgG.
- IgA hypergammaglobinemia (>400 mg/dl) was noted in five patients, with a median level of 561 mg/dL, IQ range: 442-565: Two patients were female. Of these five patients, one had high IgG, and one had low IgG.
Length of Stay and Severity of Pneumonia
The median length of stay in the hospital for the entire study population was three days (IQ range: 2-5.5 days). Among patients with IgG hypogammaglobinemia, the median length of stay was two days longer as compared with patients who had IgG levels in the normal range (5 days, IQ range [3-10] vs 3days, IQ range [2-5], P = .0085).
The median CURB-65 score for the entire study population was two (IQ range: 1-3). The median CURB-65 score did not differ between patients with low and normal ranges of IgG levels (Median: 2, IQ range [1-3] vs Median: 1, IQ range [0-3], P = .2922). The CURB-65 score was not correlated with IgG levels (ρ = −0.0776, P = .4428). Length of stay, however, was positively correlated with CURB-65 score (ρ = .4673, P = .000)
A simple linear regression analysis using the logarithmic transformation of both length of stay and IgG level revealed a linear relationship between serum IgG levels and hospital length of stay (P = .0335, [R2 = .0453]).
Comorbidities and New Diagnoses
No significant association was found between smoking status, obesity, COPD, asthma, diabetes mellitus, and hypogammaglobinemia.
Fourteen patients with abnormal Ig levels as defined by (1) the presence of hypergammaglobinemia (elevated IgG, IgM, or IgA), (2) IgG levels <550, (3) undetectable IgA or IgM, and (4) either IgG or both IgM and IgA below the lower limit of normal underwent further evaluation. Of these 14 patients, one was diagnosed with multiple myeloma, one with selective IgA deficiency, and three with specific antibody deficiency (Table 3).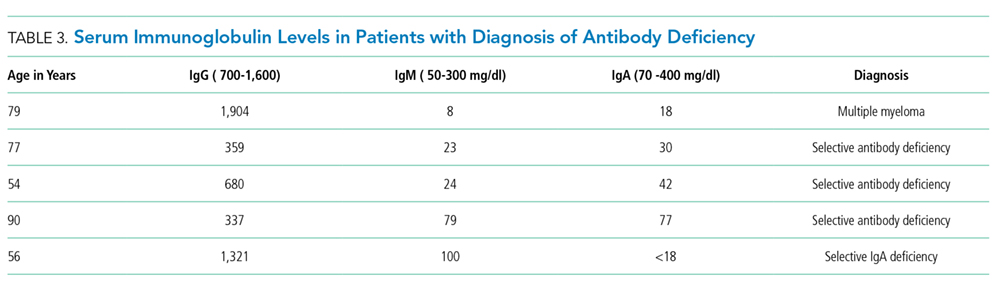
DISCUSSION
Previous research has evaluated the humoral immune system during an episode of CAP.17-20 Studies on Ig levels in patients with CAP have shown hypogammaglobinemia to be associated with ICU admission and increased ICU mortality.17,20 Additionally, patients with CAP have been shown to have lower IgG2 levels than healthy controls. The goal of our study was to evaluate patients with CAP for humoral immunodeficiency.
In our study, the prevalence of low Ig levels in CAP was 38%, with IgG hypogammaglobinemia being the most common class of hypogammaglobinemia. This rate is slightly higher than that found in a previous work by de la Torri et al.,21 who reported a prevalence of 28.9% in the inpatient population. The lower prevalence in the de la Torri et al. study was likely secondary to the exclusion of patients who did not have recorded Ig levels.21 Additionally, de la Torri et al. noted an inverse relationship between serum IgG levels and CURB-65. These results were not replicated in our analysis. This is likely due to the relatively low number of patients in each category of CURB-65 score in our study focusing only on inpatients. However, low IgG levels were associated with increased length of stay (5 days, IQ range [3-10] vs 3 days, IQ range [2-5]).
Sepsis can cause hypogammaglobinemia.22,23 The mechanism behind this phenomenon remain unclear, but several theories have been proposed. Sepsis results in endothelial dysfunction, vascular leakage, lymphopenia, and quantitative and qualitative defects in T and B cells.23 This potentially leads to impaired production and increased catabolism of immunoglobulins. Immunoglobulins play an essential role in recovery from sepsis, and there may be increased consumption during acute illness.24-28 Regardless of the mechanism, hypogammaglobinemia with SIRS, sepsis, and septic shock has been shown to be a risk factor for increased mortality in these patients.22,23 There is currently no consensus on the optimal time to screen for humoral immunodeficiency or evaluate the immune system after infection, such as CAP. Some would argue that Ig levels are lower during an active illness and, therefore, this may not be an appropriate time to evaluate Ig levels. However, we believe that inpatient hospitalization for CAP provides a window of opportunity to selectively screen these patients at higher risk for PIDD for underlying immune defects. A hospital-based approach as demonstrated in this study may be more productive than relying on an outpatient evaluation, which often may not occur due to patient recall and/or fragmentation of care, thus leading to the well-recognized delay in diagnosis of immunodeficiency.5,6In our study, one patient was diagnosed with multiple myeloma, three were diagnosed with specific antibody deficiency, and one was diagnosed with selective IgA deficiency. The patient with multiple myeloma was a 79-year old male who presented with his first ever episode of CAP, along with modest anemia and a creatinine of 1.6. His only other infectious history included an episode of sinusitis and one episode of pharyngitis. Additional evaluation included serum and urine electrophoresis, followed by bone marrow biopsy. This patient’s multiple myeloma diagnoses may have been missed if Ig levels had not been evaluated. Three patients were diagnosed with specific antibody deficiency. All these patients were above 50 years of age; two out of the three patients in this group had experienced a previous episode of pneumonia, and one had a history of recurrent sinusitis. Lastly, one patient was diagnosed with selective IgA deficiency as defined by undetectable IgA in the setting of normal IgG and IgM. This 56-year-old patient had a history of multiple episodes of sinusitis and three previous episodes of pneumonia, one requiring inpatient hospitalization. Earlier diagnosis of patients with specific antibody deficiency and selective IgA deficiency can guide management, which focuses on appropriate vaccination, the use of prophylactic antibiotics, and the possible role of Ig replacement in patients with specific antibody deficiency.
Of the 100 patients who underwent screening for immunodeficiency in the setting of CAP, five were found to have clinically significant humoral immunodeficiency, resulting in a number needed to screen of 20 to detect a clinically meaningful immunodeficiency in the setting of CAP. The number needed to screen by colonoscopy to detect one large bowel neoplasm in patients >50 years of age is 23.29 The number needed to screen to diagnose one occult cancer after an unprovoked DVT is 91.30 Based on this information, we feel that future, larger studies are required to evaluate the utility and cost-effectiveness of routine Ig screening for CAP requiring inpatient hospital admission.
We acknowledge limitations to this study. First, this study only evaluated adults in the inpatient floor setting, and therefore the results cannot be applied to the pediatric population or patients in the outpatient or ICU setting. Second, rather than completing a follow-up evaluation in all patients with abnormal immunoglobulins, we selected patients for additional evaluation based on criteria predefined by an immunologist. Although our rationale was to minimize additional diagnostic testing in individuals with mild hypogammaglobinemia, we acknowledge that this could have led to missing subtler humoral defects, such as a patient with near-normal Ig levels but a suboptimal response to vaccination. Third, due to the design of the study, we did not have a healthy matched control group. Despite these limitations, we believe our results are clinically meaningful and warrant future, larger scale investigation.
In conclusion, there is a high prevalence of hypogammaglobinemia in patients admitted with the diagnosis of CAP. IgG hypogammaglobinemia is the most commonly decreased class of Ig, and hospital length of stay is significantly longer in patients with low levels of IgG during admission for CAP. Additional immune evaluation of patients with CAP and abnormal Ig levels may also result in the identification of underlying antibody deficiency or immunoproliferative disorders.
Disclosures
The authors have nothing to disclose
1. File TM, Marrie TJ. Burden of community-acquired pneumonia in North American adults. Postgrad Med. 2010;122(2):130-141. doi: 10.3810/pgm.2010.03.2130. PubMed
2. Solomon CG, Wunderink RG, Waterer GW. Community-acquired pneumonia. N Engl J Med. 2014;370(6):543-551. doi: 10.1056/NEJMcp1214869.
3. Fine MJ, Smith MA, Carson CA, et al. Prognosis and outcomes of patients with community-acquired pneumonia. A meta-analysis. JAMA. 1996;275(2):134-141. doi: 10.1001/jama.1996.03530260048030. PubMed
4. Dantas EO, Aranda CS, Nobre FA, et al. The medical awareness concerning primary immunodeficiency diseases (PID) in the city of Sao Paulo, Brazil. J Allergy Clin Immunol. 2012;129(2):AB86. doi: 10.1016/j.jaci.2011.12.648.
5. Kobrynski L, Powell RW, Bowen S. Prevalence and morbidity of primary immunodeficiency diseases, United States 2001–2007. J Clin Immunol. 2014;34(8):954-961. doi: 10.1007/s10875-014-0102-8. PubMed
6. Seymour B, Miles J, Haeney M. Primary antibody deficiency and diagnostic delay. J Clin Pathol. 2005;58(5):546-547. doi: 10.1136/jcp.2004.016204. PubMed
7. Orange JS, Ballow M, Stiehm ER, et al. Use and interpretation of diagnostic vaccination in primary immunodeficiency: A working group report of the Basic and Clinical Immunology Interest Section of the American Academy of Allergy, Asthma & Immunology. J Allergy Clin Immunol. 2012;130(3 SUPPL.). doi: 10.1016/j.jaci.2012.07.002. PubMed
8. Yel L. Selective IgA deficiency. J Clin Immunol. 2010;30(1):10-16. doi: 10.1007/s10875-009-9357-x. PubMed
9. Conley ME, Notarangelo LD, Etzioni A. Diagnostic criteria for primary immunodeficiencies. Representing PAGID (Pan-American Group for Immunodeficiency) and ESID (European Society for Immunodeficiencies). Clin Immunol. 1999;93(3):190-197. doi: 10.1006/clim.1999.4799. PubMed
10. Chinen J, Shearer WT. Secondary immunodeficiencies, including HIV infection. J Allergy Clin Immunol. 2010;125(2 Suppl 2):S195-S203. doi: 10.1016/j.jaci.2009.08.040. PubMed
11. Blimark C, Holmberg E, Mellqvist UH, et al. Multiple myeloma and infections: A population-based study on 9253 multiple myeloma patients. Haematologica. 2015;100(1):107-113. doi: 10.3324/haematol.2014.107714. PubMed
12. Strati P, Chaffee K, Achenbach S, et al. Disease progression and complications are the main cause of death in patients with chronic lymphocytic leukemia (CLL) independent of age and comorbidities at diagnosis. Blood. 2015;126(23):5265.
13. Holding S, Jolles S. Current screening approaches for antibody deficiency. Curr Opin Allergy Clin Immunol. 2015;15(6):547-555. doi: 10.1097/ACI.0000000000000222. PubMed
14. Azar AE, Ballas ZK. Evaluation of the adult with suspected immunodeficiency. Am J Med. 2007;120(9):764-768. doi: 10.1016/j.amjmed.2006.12.013. PubMed
15. Stoop JW, Zegers BJM, Sander PC, Ballieux RE. Serum immunoglobulin levels in healthy children and adults. Clin Exp Immunol. 1969;4(1):101-112. PubMed
16. Agarwal S, Cunningham-Rundles C. Assessment and clinical interpretation of reduced IgG values. Ann Allergy Asthma Immunol. 2007;9(3):281-283. doi: 10.1016/S1081-1206(10)60665-5. PubMed
17. Justel M, Socias L, Almansa R, et al. IgM levels in plasma predict outcome in severe pandemic influenza. J Clin Virol. 2013;58(3):564-567. doi: 10.1016/j.jcv.2013.09.006. PubMed
18. Gordon CL, Holmes NE, Grayson ML, et al. Comparison of immunoglobulin G subclass concentrations in severe community-acquired pneumonia and severe pandemic 2009 influenza A (H1N1) infection. Clin Vaccine Immunol. 2012;19(3):446-448. doi: 10.1128/CVI.05518-11. PubMed
19. Gordon CL, Johnson PD, Permezel M, et al. Association between severe pandemic 2009 influenza A (H1N1) virus infection and immunoglobulin G(2) subclass deficiency. Clin Infect Dis. 2010;50(5):672-678. doi: 10.1086/650462. PubMed
20. Feldman C, Mahomed AG, Mahida P, et al. IgG subclasses in previously healthy adult patients with acute community-acquired pneumonia. S Afr Med J. 1996;86(5 Suppl):600-602. PubMed
21. de la Torre MC, Torán P, Serra-Prat M, et al. Serum levels of immunoglobulins and severity of community-acquired pneumonia. BMJ Open Respir Res. 2016;3(1):e000152. doi:1 0.1136/bmjresp-2016-000152. PubMed
22. Prucha M, Zazula R, Herold I, Dostal M, Hyanek T, Bellingan G. Presence of hypogammaglobulinemia in patients with severe sepsis, septic shock, and SIRS is associated with increased mortality. J Infect. 2014;68(3):297-299. doi: 10.1016/j.jinf.2013.11.003. PubMed
23. Shankar-Hari M, Culshaw N, Post B, et al. Endogenous IgG hypogammaglobulinaemia in critically ill adults with sepsis: systematic review and meta-analysis. Intensive Care Med. 2015;41(8):1393-1401. doi: 10.1007/s00134-015-3845-7. PubMed
24. Drewry A, Samra N, Skrupky L, Fuller B, Compton S, Hotchkiss R. Persistent lymphopenia after diagnosis of sepsis predicts mortality. Shock. 2014;42(5):383-391. doi: 10.1097/SHK.0000000000000234. PubMed
25. Boomer JS, Shuherk-Shaffer J, Hotchkiss RS, Green JM. A prospective analysis of lymphocyte phenotype and function over the course of acute sepsis. Crit Care. 2012;16(3). doi: 10.1186/cc11404. PubMed
26. Nordenfelt P, Waldemarson S, Linder A, et al. Antibody orientation at bacterial surfaces is related to invasive infection. J Exp Med. 2012;209(13):2367-2381. doi: 10.1084/jem.20120325. PubMed
27. Michaelsen TE, Sandlie I, Bratlie DB, Sandin RH, Ihle O. Structural difference in the complement activation site of human IgG1 and IgG3. Scand J Immunol. 2009;70(6):553-564. doi: 10.1111/j.1365-3083.2009.02338.x. PubMed
28. Lee WL, Slutsky AS. Sepsis and endothelial permeability. N Engl J Med. 2010;363(7):689-691. doi: 10.1056/NEJMcibr1007320. PubMed
29. Regula J, Rupinski M, Kraszewska E, et al. Colonoscopy in colorectal-cancer screening for detection of advanced neoplasia. N Engl J Med. 2006;355(18):1863-1872. doi: 10.1056/NEJMoa054967. PubMed
30. Van Es N, Le Gal G, Otten HM, et al. Screening for occult cancer in patients with unprovoked venous thromboembolism. Ann Intern Med. 2017;167(6):410-417. doi: 10.7326/M17-0868. PubMed
Community-acquired pneumonia (CAP) is the most common infection in hospitalized patients and the eighth most common cause of death in the United States.1 Mortality from CAP is estimated to be 5.1% in the outpatient population,13.6% in hospitalized patients, and 35.1% in patients admitted to the intensive care unit.2,3 CAP accounts for more than 50,000 deaths annually in the United States.2 There are multiple risk factors for CAP, including tobacco use, malnutrition, chronic obstructive pulmonary disease (COPD), bronchiectasis, cystic fibrosis, and mechanical bronchial obstruction. Underlying immunodeficiency, specifically humoral immunodeficiency, is also a risk factor for CAP.
Primary immunodeficiency (PIDD) is estimated to affect one in 1,800 individuals in the United States.4 The National Institutes of Health (NIH) estimates that only one out of three individuals with PIDD are appropriately diagnosed. Based on probability calculations on known PIDD patients versus incidence of disease, the NIH estimates that more than 500,000 individuals with PIDD remain undiagnosed in the United States.4 Further, there exists an average diagnostic delay of at least five years. This delay increases both morbidity and mortality and leads to increased healthcare utilization.5,6
The most common form of primary immunodeficiency is due to humoral immunodeficiency, including selective IgA deficiency, specific antibody deficiency, and common variable immunodeficiency. Specific antibody deficiency is defined as a lack of response to polysaccharide antigens in the setting of low to normal Ig levels and an intact response to peptide antigens.7 Selective IgA deficiency is defined as the isolated deficiency of serum IgA in the setting of normal serum levels of IgG and IgM in an individual older than four years in whom other causes of hypogammaglobinemia have been excluded.8 Common variable immunodeficiency (CVID) is defined as a decreased serum concentration of IgG in combination with low levels of IgA and/or IgM with a poor or absent response to immunization in the absence of other defined immunodeficiency state.9 In addition to experiencing recurrent infections—namely bronchitis, sinusitis, otitis, and pneumonia—patients with CVID are also at increased risk of autoimmunity and malignancy. In adults, secondary immunodeficiency is more common than primary immunodeficiency. Secondary immunodeficiency occurs commonly with disease states like HIV infection, diabetes, cirrhosis, malnutrition, and autoimmune conditions.10 Additional causes of secondary immune defects due to humoral immunodeficiency include immune-modulating drugs—such as rituximab and ibrutinib—and hematologic malignancies, including chronic lymphocytic leukemia and multiple myeloma. Recurrent infections remain the leading cause of morbidity and mortality in patients with both primary and secondary immunodeficiency.11,12
Evaluation of the humoral immune system begins with measurement of serum immunoglobulin (Ig) levels. Although abnormal Ig levels are not diagnostic of immunodeficiency, abnormal results may prompt additional evaluation. Screening strategies may assist in making an earlier diagnoses, potentially decreasing morbidity and mortality in patients with immunodeficiency.13-15 To date, there have been no studies evaluating the utility of screening Ig levels to evaluate for underlying humoral immunodeficiency in patients hospitalized for CAP.
METHODS
Study Design
This was a prospective cohort study conducted at Rochester General Hospital, a 528-bed tertiary care medical center, from February 2017 to April 2017. We enrolled 100 consecutive patients admitted to the inpatient internal medicine service with a physician diagnosis of CAP. Written consent was obtained from each patient. The study was approved by the institutional review board at Rochester General Hospital.
Case Definition
The following criteria were used to diagnose CAP: (1) Respiratory symptoms of productive cough or pleuritic chest pain, (2) Fever >38°C before or at the time of admission, and (3) chest imaging with infiltrate. Exclusion criteria included a diagnosis of hospital-acquired pneumonia, prior diagnosis of primary immunodeficiency, immunosuppression due to an underlying condition, such as HIV or malignancy, therapy with immunosuppressive medications including chemotherapy, Ig replacement within the past six months, or treatment with >10 mg prednisone for greater than 14 days before hospital admission.
Patients underwent an additional evaluation by a clinical immunologist if they met one of the following criteria: any hypergammaglobinemia (elevated IgG, IgM, or IgA), IgG hypogammaglobinemia <550 mg/dL, undetectable IgM or IgA, or if IgG, IgM, and IgA were all below the lower limit of normal.
CURB-65 was used for estimation of the severity of illness with CAP. The components of the score include age ≥65, confusion, BUN >19 mg/dl, respiratory rate ≥30 breaths per minute and systolic blood pressure <90 mm Hg or diastolic blood pressure ≤60 mm Hg. Each component is scored zero if absent or one if present. Predicted mortality ranges from 0.6% for a score of zero to 27.8% for a score of 5.
Data Collection
Patient health information including age, race, gender, medical history, admission notes, results of chest imaging studies, and relevant laboratory studies including serum levels of IgG, IgM, IgA, IgE on admission was obtained from the electronic medical health record. An additional evaluation by the immunologist occurred within three months of hospital discharge and included repeat Ig levels, pre- and postvaccination titers of polysaccharide and peptide antigens, serum protein electrophoresis, and B & T cell panels.
Description of Normal Levels
The normal levels of immunoglobulins were defined based on standard reference ranges at the laboratory at Rochester General Hospital; IgG (700-1,600 mg/dl), IgM (50-300 mg/dl), IgA (70-400 mg/dl), and IgE (0-378 IU/ml). Although there is no established classification regarding the degree of IgG hypogammaglobinemia,16 clinical immunologists commonly classify the severity of IgG hypogammaglobinemia as follows: mild (550-699 mg/dL), moderate (400-549 mg/dL), and severe (<400 mg/dL) IgG hypogammaglobinemia.
Statistical Analysis
Statistical analysis was performed using STATA software (StataCorp LLC, College Station, Texas). We conducted a Wilcoxon rank-sum test to compare the median difference in length of stay between groups with a low versus normal range of immunoglobulins. A Kruskal–Wallis test was performed to check for the median difference in IgG levels across degrees of illness severity (CURB-65 score categories). We conducted a simple linear regression analysis using the logarithmic data of the length of stay and IgG level variables. A chi-square test was used to determine the association between comorbidities and Ig levels.
RESULTS
Baseline Characteristics
There were 100 patients with CAP enrolled in this study with a median age of 65.04 ± 18.8, and 53% were female. Forty-seven patients reported a previous history of pneumonia and 18 reported a history of recurrent sinusitis or otitis media. Of the 100 enrolled patients, 46 had received pneumococcal polysaccharide vaccine (PPV23), 26 had received the 13-valent pneumococcal conjugate vaccine (PCV13), and 22 had received both (Table 1). The mean white blood cell count on admission was 12.9 ± 7 × 10³/uL with 75 ± 12.5% neutrophils. Total protein (6.5 ± 0.8) and albumin (3.7 ± 0.5) were within the normal range for the study population.
Immunoglobulin Analyses
The prevalence of hypogammaglobinemia in the study was 38% (95% CI: 28.47% to 48.25%). The median values of Ig levels for the entire study population and in patients with hypogammaglobinemia are summarized in Table 2.
- IgG hypogammaglobinemia (<700 mg/dl) was found in 27/100 patients, with a median level of 598 mg/dL, IQ range: 459-654. The median age in this group was 76.5 years, and 13 were female. Of these 27 patients, 10 had low IgM, four had low IgA, and four had an elevated IgE. In this group, 11 patients had received PPSV23, nine had received PCV13, and six had received both PPV23 and PCV13 before the index hospital admission.
- IgG hypergammaglobinemia (>1,600 mg/dl) was found in 9/100 patients, with a median level of 1,381 mg/dL, IQ range: 1,237-1,627. The median age was 61 years, and six were female. Of these nine patients, three had low IgM, one had low IgA, and four had elevated IgE.
- IgM hypogammaglobinemia (<50 mg/dl) was found in 23/100 patients with a median level of 38 mg/dL, IQ range: 25-43. In this group, the median age was 69 years, and 10 were female. Of these 23 patients, 10 had low IgG, and three had an elevated IgG.
- IgM hypergammaglobinemia (>300 mg/dl) was noted in two patients, with a median level of 491 mg/dL, IQ range: 418-564. Both patients were female, and one had elevated IgG.
- IgA hypogammaglobinemia (<70 mg/dl) was discovered in six patients, with a median level of 36 mg/dL, IQ range: 18-50. In this group, four patients had low IgG, four had low IgM, one had elevated IgE, and one had elevated IgG.
- IgA hypergammaglobinemia (>400 mg/dl) was noted in five patients, with a median level of 561 mg/dL, IQ range: 442-565: Two patients were female. Of these five patients, one had high IgG, and one had low IgG.
Length of Stay and Severity of Pneumonia
The median length of stay in the hospital for the entire study population was three days (IQ range: 2-5.5 days). Among patients with IgG hypogammaglobinemia, the median length of stay was two days longer as compared with patients who had IgG levels in the normal range (5 days, IQ range [3-10] vs 3days, IQ range [2-5], P = .0085).
The median CURB-65 score for the entire study population was two (IQ range: 1-3). The median CURB-65 score did not differ between patients with low and normal ranges of IgG levels (Median: 2, IQ range [1-3] vs Median: 1, IQ range [0-3], P = .2922). The CURB-65 score was not correlated with IgG levels (ρ = −0.0776, P = .4428). Length of stay, however, was positively correlated with CURB-65 score (ρ = .4673, P = .000)
A simple linear regression analysis using the logarithmic transformation of both length of stay and IgG level revealed a linear relationship between serum IgG levels and hospital length of stay (P = .0335, [R2 = .0453]).
Comorbidities and New Diagnoses
No significant association was found between smoking status, obesity, COPD, asthma, diabetes mellitus, and hypogammaglobinemia.
Fourteen patients with abnormal Ig levels as defined by (1) the presence of hypergammaglobinemia (elevated IgG, IgM, or IgA), (2) IgG levels <550, (3) undetectable IgA or IgM, and (4) either IgG or both IgM and IgA below the lower limit of normal underwent further evaluation. Of these 14 patients, one was diagnosed with multiple myeloma, one with selective IgA deficiency, and three with specific antibody deficiency (Table 3).
DISCUSSION
Previous research has evaluated the humoral immune system during an episode of CAP.17-20 Studies on Ig levels in patients with CAP have shown hypogammaglobinemia to be associated with ICU admission and increased ICU mortality.17,20 Additionally, patients with CAP have been shown to have lower IgG2 levels than healthy controls. The goal of our study was to evaluate patients with CAP for humoral immunodeficiency.
In our study, the prevalence of low Ig levels in CAP was 38%, with IgG hypogammaglobinemia being the most common class of hypogammaglobinemia. This rate is slightly higher than that found in a previous work by de la Torri et al.,21 who reported a prevalence of 28.9% in the inpatient population. The lower prevalence in the de la Torri et al. study was likely secondary to the exclusion of patients who did not have recorded Ig levels.21 Additionally, de la Torri et al. noted an inverse relationship between serum IgG levels and CURB-65. These results were not replicated in our analysis. This is likely due to the relatively low number of patients in each category of CURB-65 score in our study focusing only on inpatients. However, low IgG levels were associated with increased length of stay (5 days, IQ range [3-10] vs 3 days, IQ range [2-5]).
Sepsis can cause hypogammaglobinemia.22,23 The mechanism behind this phenomenon remain unclear, but several theories have been proposed. Sepsis results in endothelial dysfunction, vascular leakage, lymphopenia, and quantitative and qualitative defects in T and B cells.23 This potentially leads to impaired production and increased catabolism of immunoglobulins. Immunoglobulins play an essential role in recovery from sepsis, and there may be increased consumption during acute illness.24-28 Regardless of the mechanism, hypogammaglobinemia with SIRS, sepsis, and septic shock has been shown to be a risk factor for increased mortality in these patients.22,23 There is currently no consensus on the optimal time to screen for humoral immunodeficiency or evaluate the immune system after infection, such as CAP. Some would argue that Ig levels are lower during an active illness and, therefore, this may not be an appropriate time to evaluate Ig levels. However, we believe that inpatient hospitalization for CAP provides a window of opportunity to selectively screen these patients at higher risk for PIDD for underlying immune defects. A hospital-based approach as demonstrated in this study may be more productive than relying on an outpatient evaluation, which often may not occur due to patient recall and/or fragmentation of care, thus leading to the well-recognized delay in diagnosis of immunodeficiency.5,6In our study, one patient was diagnosed with multiple myeloma, three were diagnosed with specific antibody deficiency, and one was diagnosed with selective IgA deficiency. The patient with multiple myeloma was a 79-year old male who presented with his first ever episode of CAP, along with modest anemia and a creatinine of 1.6. His only other infectious history included an episode of sinusitis and one episode of pharyngitis. Additional evaluation included serum and urine electrophoresis, followed by bone marrow biopsy. This patient’s multiple myeloma diagnoses may have been missed if Ig levels had not been evaluated. Three patients were diagnosed with specific antibody deficiency. All these patients were above 50 years of age; two out of the three patients in this group had experienced a previous episode of pneumonia, and one had a history of recurrent sinusitis. Lastly, one patient was diagnosed with selective IgA deficiency as defined by undetectable IgA in the setting of normal IgG and IgM. This 56-year-old patient had a history of multiple episodes of sinusitis and three previous episodes of pneumonia, one requiring inpatient hospitalization. Earlier diagnosis of patients with specific antibody deficiency and selective IgA deficiency can guide management, which focuses on appropriate vaccination, the use of prophylactic antibiotics, and the possible role of Ig replacement in patients with specific antibody deficiency.
Of the 100 patients who underwent screening for immunodeficiency in the setting of CAP, five were found to have clinically significant humoral immunodeficiency, resulting in a number needed to screen of 20 to detect a clinically meaningful immunodeficiency in the setting of CAP. The number needed to screen by colonoscopy to detect one large bowel neoplasm in patients >50 years of age is 23.29 The number needed to screen to diagnose one occult cancer after an unprovoked DVT is 91.30 Based on this information, we feel that future, larger studies are required to evaluate the utility and cost-effectiveness of routine Ig screening for CAP requiring inpatient hospital admission.
We acknowledge limitations to this study. First, this study only evaluated adults in the inpatient floor setting, and therefore the results cannot be applied to the pediatric population or patients in the outpatient or ICU setting. Second, rather than completing a follow-up evaluation in all patients with abnormal immunoglobulins, we selected patients for additional evaluation based on criteria predefined by an immunologist. Although our rationale was to minimize additional diagnostic testing in individuals with mild hypogammaglobinemia, we acknowledge that this could have led to missing subtler humoral defects, such as a patient with near-normal Ig levels but a suboptimal response to vaccination. Third, due to the design of the study, we did not have a healthy matched control group. Despite these limitations, we believe our results are clinically meaningful and warrant future, larger scale investigation.
In conclusion, there is a high prevalence of hypogammaglobinemia in patients admitted with the diagnosis of CAP. IgG hypogammaglobinemia is the most commonly decreased class of Ig, and hospital length of stay is significantly longer in patients with low levels of IgG during admission for CAP. Additional immune evaluation of patients with CAP and abnormal Ig levels may also result in the identification of underlying antibody deficiency or immunoproliferative disorders.
Disclosures
The authors have nothing to disclose
1. File TM, Marrie TJ. Burden of community-acquired pneumonia in North American adults. Postgrad Med. 2010;122(2):130-141. doi: 10.3810/pgm.2010.03.2130. PubMed
2. Solomon CG, Wunderink RG, Waterer GW. Community-acquired pneumonia. N Engl J Med. 2014;370(6):543-551. doi: 10.1056/NEJMcp1214869.
3. Fine MJ, Smith MA, Carson CA, et al. Prognosis and outcomes of patients with community-acquired pneumonia. A meta-analysis. JAMA. 1996;275(2):134-141. doi: 10.1001/jama.1996.03530260048030. PubMed
4. Dantas EO, Aranda CS, Nobre FA, et al. The medical awareness concerning primary immunodeficiency diseases (PID) in the city of Sao Paulo, Brazil. J Allergy Clin Immunol. 2012;129(2):AB86. doi: 10.1016/j.jaci.2011.12.648.
5. Kobrynski L, Powell RW, Bowen S. Prevalence and morbidity of primary immunodeficiency diseases, United States 2001–2007. J Clin Immunol. 2014;34(8):954-961. doi: 10.1007/s10875-014-0102-8. PubMed
6. Seymour B, Miles J, Haeney M. Primary antibody deficiency and diagnostic delay. J Clin Pathol. 2005;58(5):546-547. doi: 10.1136/jcp.2004.016204. PubMed
7. Orange JS, Ballow M, Stiehm ER, et al. Use and interpretation of diagnostic vaccination in primary immunodeficiency: A working group report of the Basic and Clinical Immunology Interest Section of the American Academy of Allergy, Asthma & Immunology. J Allergy Clin Immunol. 2012;130(3 SUPPL.). doi: 10.1016/j.jaci.2012.07.002. PubMed
8. Yel L. Selective IgA deficiency. J Clin Immunol. 2010;30(1):10-16. doi: 10.1007/s10875-009-9357-x. PubMed
9. Conley ME, Notarangelo LD, Etzioni A. Diagnostic criteria for primary immunodeficiencies. Representing PAGID (Pan-American Group for Immunodeficiency) and ESID (European Society for Immunodeficiencies). Clin Immunol. 1999;93(3):190-197. doi: 10.1006/clim.1999.4799. PubMed
10. Chinen J, Shearer WT. Secondary immunodeficiencies, including HIV infection. J Allergy Clin Immunol. 2010;125(2 Suppl 2):S195-S203. doi: 10.1016/j.jaci.2009.08.040. PubMed
11. Blimark C, Holmberg E, Mellqvist UH, et al. Multiple myeloma and infections: A population-based study on 9253 multiple myeloma patients. Haematologica. 2015;100(1):107-113. doi: 10.3324/haematol.2014.107714. PubMed
12. Strati P, Chaffee K, Achenbach S, et al. Disease progression and complications are the main cause of death in patients with chronic lymphocytic leukemia (CLL) independent of age and comorbidities at diagnosis. Blood. 2015;126(23):5265.
13. Holding S, Jolles S. Current screening approaches for antibody deficiency. Curr Opin Allergy Clin Immunol. 2015;15(6):547-555. doi: 10.1097/ACI.0000000000000222. PubMed
14. Azar AE, Ballas ZK. Evaluation of the adult with suspected immunodeficiency. Am J Med. 2007;120(9):764-768. doi: 10.1016/j.amjmed.2006.12.013. PubMed
15. Stoop JW, Zegers BJM, Sander PC, Ballieux RE. Serum immunoglobulin levels in healthy children and adults. Clin Exp Immunol. 1969;4(1):101-112. PubMed
16. Agarwal S, Cunningham-Rundles C. Assessment and clinical interpretation of reduced IgG values. Ann Allergy Asthma Immunol. 2007;9(3):281-283. doi: 10.1016/S1081-1206(10)60665-5. PubMed
17. Justel M, Socias L, Almansa R, et al. IgM levels in plasma predict outcome in severe pandemic influenza. J Clin Virol. 2013;58(3):564-567. doi: 10.1016/j.jcv.2013.09.006. PubMed
18. Gordon CL, Holmes NE, Grayson ML, et al. Comparison of immunoglobulin G subclass concentrations in severe community-acquired pneumonia and severe pandemic 2009 influenza A (H1N1) infection. Clin Vaccine Immunol. 2012;19(3):446-448. doi: 10.1128/CVI.05518-11. PubMed
19. Gordon CL, Johnson PD, Permezel M, et al. Association between severe pandemic 2009 influenza A (H1N1) virus infection and immunoglobulin G(2) subclass deficiency. Clin Infect Dis. 2010;50(5):672-678. doi: 10.1086/650462. PubMed
20. Feldman C, Mahomed AG, Mahida P, et al. IgG subclasses in previously healthy adult patients with acute community-acquired pneumonia. S Afr Med J. 1996;86(5 Suppl):600-602. PubMed
21. de la Torre MC, Torán P, Serra-Prat M, et al. Serum levels of immunoglobulins and severity of community-acquired pneumonia. BMJ Open Respir Res. 2016;3(1):e000152. doi:1 0.1136/bmjresp-2016-000152. PubMed
22. Prucha M, Zazula R, Herold I, Dostal M, Hyanek T, Bellingan G. Presence of hypogammaglobulinemia in patients with severe sepsis, septic shock, and SIRS is associated with increased mortality. J Infect. 2014;68(3):297-299. doi: 10.1016/j.jinf.2013.11.003. PubMed
23. Shankar-Hari M, Culshaw N, Post B, et al. Endogenous IgG hypogammaglobulinaemia in critically ill adults with sepsis: systematic review and meta-analysis. Intensive Care Med. 2015;41(8):1393-1401. doi: 10.1007/s00134-015-3845-7. PubMed
24. Drewry A, Samra N, Skrupky L, Fuller B, Compton S, Hotchkiss R. Persistent lymphopenia after diagnosis of sepsis predicts mortality. Shock. 2014;42(5):383-391. doi: 10.1097/SHK.0000000000000234. PubMed
25. Boomer JS, Shuherk-Shaffer J, Hotchkiss RS, Green JM. A prospective analysis of lymphocyte phenotype and function over the course of acute sepsis. Crit Care. 2012;16(3). doi: 10.1186/cc11404. PubMed
26. Nordenfelt P, Waldemarson S, Linder A, et al. Antibody orientation at bacterial surfaces is related to invasive infection. J Exp Med. 2012;209(13):2367-2381. doi: 10.1084/jem.20120325. PubMed
27. Michaelsen TE, Sandlie I, Bratlie DB, Sandin RH, Ihle O. Structural difference in the complement activation site of human IgG1 and IgG3. Scand J Immunol. 2009;70(6):553-564. doi: 10.1111/j.1365-3083.2009.02338.x. PubMed
28. Lee WL, Slutsky AS. Sepsis and endothelial permeability. N Engl J Med. 2010;363(7):689-691. doi: 10.1056/NEJMcibr1007320. PubMed
29. Regula J, Rupinski M, Kraszewska E, et al. Colonoscopy in colorectal-cancer screening for detection of advanced neoplasia. N Engl J Med. 2006;355(18):1863-1872. doi: 10.1056/NEJMoa054967. PubMed
30. Van Es N, Le Gal G, Otten HM, et al. Screening for occult cancer in patients with unprovoked venous thromboembolism. Ann Intern Med. 2017;167(6):410-417. doi: 10.7326/M17-0868. PubMed
© 2018 Society of Hospital Medicine
Less Lumens-Less Risk: A Pilot Intervention to Increase the Use of Single-Lumen Peripherally Inserted Central Catheters
Vascular access is a cornerstone of safe and effective medical care. The use of peripherally inserted central catheters (PICCs) to meet vascular access needs has recently increased.1,2 PICCs offer several advantages over other central venous catheters. These advantages include increased reliability over intermediate to long-term use and reductions in complication rates during insertion.3,4
Multiple studies have suggested a strong association between the number of PICC lumens and risk of complications, such as central-line associated bloodstream infection (CLABSI), venous thrombosis, and catheter occlusion.5-8,9,10-12 These complications may lead to device failure, interrupt therapy, prolonged length of stay, and increased healthcare costs.13-15 Thus, available guidelines recommend using PICCs with the least clinically necessary number of lumens.1,16 Quality improvement strategies that have targeted decreasing the number of PICC lumens have reduced complications and healthcare costs.17-19 However, variability exists in the selection of the number of PICC lumens, and many providers request multilumen devices “just in case” additional lumens are needed.20,21 Such variation in device selection may stem from the paucity of information that defines the appropriate indications for the use of single- versus multi-lumen PICCs.
Therefore, to ensure appropriateness of PICC use, we designed an intervention to improve selection of the number of PICC lumens.
METHODS
We conducted this pre–post quasi-experimental study in accordance with SQUIRE guidelines.22 Details regarding clinical parameters associated with the decision to place a PICC, patient characteristics, comorbidities, complications, and laboratory values were collected from the medical records of patients. All PICCs were placed by the Vascular Access Service Team (VAST) during the study period.
Intervention
The intervention consisted of three components: first, all hospitalists, pharmacists, and VAST nurses received education in the form of a CME lecture that emphasized use of the Michigan Appropriateness Guide for Intravenous Catheters (MAGIC).1 These criteria define when use of a PICC is appropriate and emphasize how best to select the most appropriate device characteristics such as lumens and catheter gauge. Next, a multidisciplinary task force that consisted of hospitalists, VAST nurses, and pharmacists developed a list of indications specifying when use of a multilumen PICC was appropriate.1 Third, the order for a PICC in our electronic medical record (EMR) system was modified to set single-lumen PICCs as default. If a multilumen PICC was requested, text-based justification from the ordering clinician was required.
As an additional safeguard, a VAST nurse reviewed the number of lumens and clinical scenario for each PICC order prior to insertion. If the number of lumens ordered was considered inappropriate on the basis of the developed list of MAGIC recommendations, the case was referred to a pharmacist for additional review. The pharmacist then reviewed active and anticipated medications, explored options for adjusting the medication delivery plan, and discussed these options with the ordering clinician to determine the most appropriate number of lumens.
Measures and Definitions
In accordance with the criteria set by the Centers for Disease Control National Healthcare Safety Network,23 CLABSI was defined as a confirmed positive blood culture with a PICC in place for 48 hours or longer without another identified infection source or a positive PICC tip culture in the setting of clinically suspected infection. Venous thrombosis was defined as symptomatic upper extremity deep vein thromboembolism or pulmonary embolism that was radiographically confirmed after the placement of a PICC or within one week of device removal. Catheter occlusion was captured when documented or when tPA was administered for problems related to the PICC. The appropriateness of the number of PICC lumens was independently adjudicated by an attending physician and clinical pharmacist by comparing the indications of the device placed against predefined appropriateness criteria.
Outcomes
The primary outcome of interest was the change in the proportion of single-lumen PICCs placed. Secondary outcomes included (1) the placement of PICCs with an appropriate number of lumens, (2) the occurrence of PICC-related complications (CLABSI, venous thrombosis, and catheter occlusion), and (3) the need for a second procedure to place a multilumen device or additional vascular access.
Statistical Analysis
Descriptive statistics were used to tabulate and summarize patient and PICC characteristics. Differences between pre- and postintervention populations were assessed using χ2, Fishers exact, t-, and Wilcoxon rank sum tests. Differences in complications were assessed using the two-sample tests of proportions. Results were reported as medians (IQR) and percentages with corresponding 95% confidence intervals. All statistical tests were two-sided, with P < .05 considered statistically significant. Analyses were conducted with Stata v.14 (stataCorp, College Station, Texas).
Ethical and Regulatory Oversight
This study was approved by the Institutional Review Board at the University of Michigan (IRB#HUM00118168).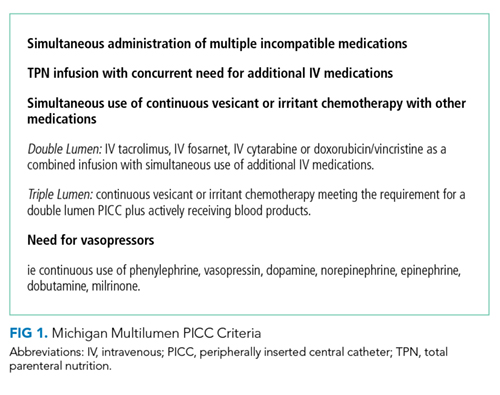
RESULTS
Of the 133 PICCs placed preintervention, 64.7% (n = 86) were single lumen, 33.1% (n = 44) were double lumen, and 2.3% (n = 3) were triple lumen. Compared with the preintervention period, the use of single-lumen PICCs significantly increased following the intervention (64.7% to 93.6%; P < .001; Figure 1). As well, the proportion of PICCs with an inappropriate number of lumens decreased from 25.6% to 2.2% (P < .001; Table 1).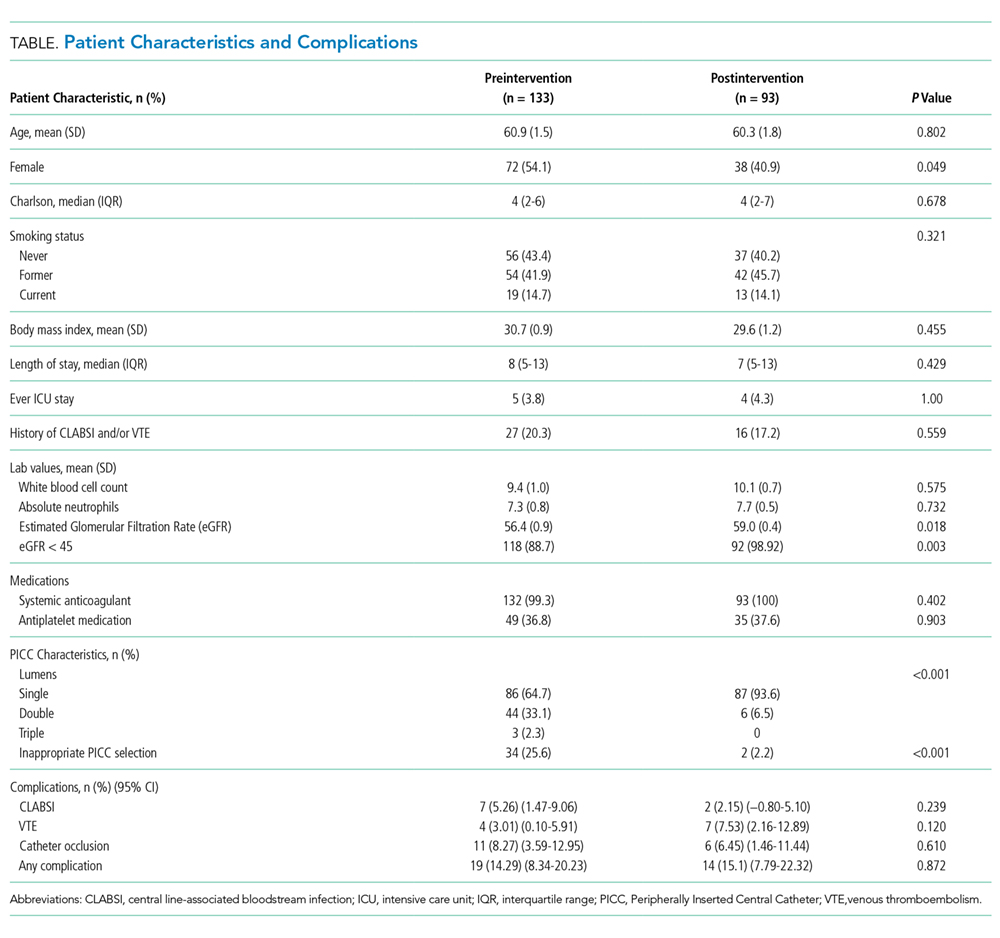
Preintervention, 14.3% (95% CI = 8.34-20.23) of the patients with PICCs experienced at least one complication (n = 19). Following the intervention, 15.1% (95% CI = 7.79-22.32) of the 93 patients with PICCs experienced at least one complication (absolute difference = 0.8%, P = .872). With respect to individual complications, CLABSI decreased from 5.3% (n = 7; 95% CI = 1.47-9.06) to 2.2% (n = 2; 95% CI = −0.80-5.10) (P = .239). Similarly, the incidence of catheter occlusion decreased from 8.3% (n = 11; 95% CI = 3.59-12.95) to 6.5% (n = 6; 95% CI = 1.46-11.44; P = .610; Table). Notably, only 12.1% (n = 21) of patients with a single-lumen PICC experienced any complication, whereas 20.0% (n = 10) of patients with a double lumen, and 66.7% (n = 2) with a triple lumen experienced a PICC-associated complication (P = .022). Patients with triple lumens had a significantly higher incidence of catheter occlusion compared with patients that received double- and single-lumen PICCs (66.7% vs. 12.0% and 5.2%, respectively; P = .003).
No patient who received a single-lumen device required a second procedure for the placement of a device with additional lumens. Similarly, no documentation suggesting an insufficient number of PICC lumens or the need for additional vascular access (eg, placement of additional PICCs) was found in medical records of patients postintervention. Pharmacists supporting the interventions and VAST team members reported no disagreements when discussing number of lumens or appropriateness of catheter choice.
DISCUSSION
In this single center, pre–post quasi-experimental study, a multimodal intervention based on the MAGIC criteria significantly reduced the use of multilumen PICCs. Additionally, a trend toward reductions in complications, including CLABSI and catheter occlusion, was also observed. Notably, these changes in ordering practices did not lead to requests for additional devices or replacement with a multilumen PICC when a single-lumen device was inserted. Collectively, our findings suggest that the use of single-lumen devices in a large direct care service can be feasibly and safely increased through this approach. Larger scale studies that implement MAGIC to inform placement of multilumen PICCs and reduce PICC-related complications now appear necessary.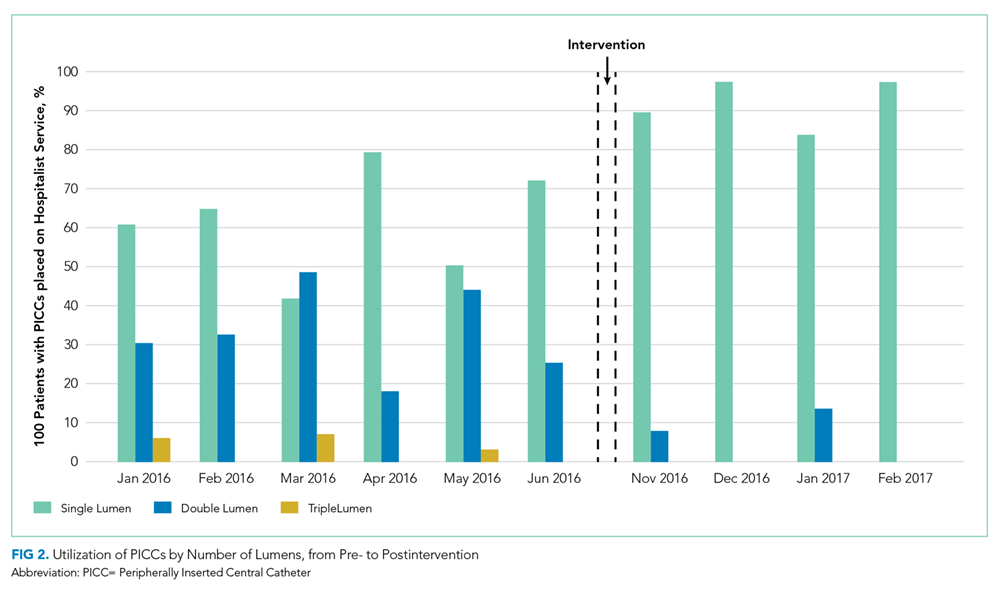
The presence of a PICC, even for short periods, significantly increases the risk of CLABSI and is one of the strongest predictors of venous thrombosis risk in the hospital setting.19,24,25 Although some factors that lead to this increased risk are patient-related and not modifiable (eg, malignancy or intensive care unit status), increased risk linked to the gauge of PICCs and the number of PICC lumens can be modified by improving device selection.9,18,26 Deliberate use of PICCs with the least numbers of clinically necessary lumens decreases risk of CLABSI, venous thrombosis and overall cost.17,19,26 Additionally, greater rates of occlusion with each additional PICC lumen may result in the interruption of intravenous therapy, the administration of costly medications (eg, tissue plasminogen activator) to salvage the PICC, and premature removal of devices should the occlusion prove irreversible.8
We observed a trend toward decreased PICC complications following implementation of our criteria, especially for the outcomes of CLABSI and catheter occlusion. Given the pilot nature of this study, we were underpowered to detect a statistically significant change in PICC adverse events. However, we did observe a statistically significant increase in the rate of single-lumen PICC use following our intervention. Notably, this increase occurred in the setting of high rates of single-lumen PICC use at baseline (64%). Therefore, an important takeaway from our findings is that room for improving PICC appropriateness exists even among high performers. This finding In turn, high baseline use of single-lumen PICCs may also explain why a robust reduction in PICC complications was not observed in our study, given that other studies showing reduction in the rates of complications began with considerably low rates of single-lumen device use.19 Outcomes may improve, however, if we expand and sustain these changes or expand to larger settings. For example, (based on assumptions from a previously published simulation study and our average hospital medicine daily census of 98 patients) the increased use of single-over multilumen PICCs is expected to decrease CLABSI events and venous thrombosis episodes by 2.4-fold in our hospital medicine service with an associated cost savings of $74,300 each year.17 Additionally, we would also expect the increase in the proportion of single-lumen PICCs to reduce rates of catheter occlusion. This reduction, in turn, would lessen interruptions in intravenous therapy, the need for medications to treat occlusion, and the need for device replacement all leading to reduced costs.27 Overall, then, our intervention (informed by appropriateness criteria) provides substantial benefits to hospital savings and patient safety.
After our intervention, 98% of all PICCs placed were found to comply with appropriate criteria for multilumen PICC use. We unexpectedly found that the most important factor driving our findings was not oversight or order modification by the pharmacy team or VAST nurses, but rather better decisions made by physicians at the outset. Specifically, we did not find a single instance wherein the original PICC order was changed to a device with a different number of lumens after review from the VAST team. We attribute this finding to receptiveness of physicians to change ordering practices following education and the redesign of the default EMR PICC order, both of which provided a scientific rationale for multilumen PICC use. Clarifying the risk and criteria of the use of multilumen devices along with providing an EMR ordering process that supports best practice helped hospitalists “do the right thing”. Additionally, setting single-lumen devices as the preselected EMR order and requiring text-based justification for placement of a multilumen PICC helped provide a nudge to physicians, much as it has done with antibiotic choices.28
Our study has limitations. First, we were only able to identify complications that were captured by our EMR. Given that over 70% of the patients in our study were discharged with a PICC in place, we do not know whether complications may have developed outside the hospital. Second, our intervention was resource intensive and required partnership with pharmacy, VAST, and hospitalists. Thus, the generalizability of our intervention to other institutions without similar support is unclear. Third, despite an increase in the use of single-lumen PICCs and a decrease in multilumen devices, we did not observe a significant reduction in all types of complications. While our high rate of single-lumen PICC use may account for these findings, larger scale studies are needed to better study the impact of MAGIC and appropriateness criteria on PICC complications. Finally, given our approach, we cannot identify the most effective modality within our bundled intervention. Stepped wedge or single-component studies are needed to further address this question.
In conclusion, we piloted a multimodal intervention to promote the use of single-lumen PICCs while lowering the use of multilumen devices. By using MAGIC to create appropriate indications, the use of multilumen PICCs declined and complications trended downwards. Larger, multicenter studies to validate our findings and examine the sustainability of this intervention would be welcomed.
Disclosures
The authors have nothing to disclose.
1. Chopra V, Flanders SA, Saint S, et al. The Michigan Appropriateness Guide for Intravenous Catheters (MAGIC): Results from a multispecialty panel using the RAND/UCLA appropriateness method. Ann Intern Med. 2015;163(6 Suppl):S1-S40. doi: 10.7326/M15-0744. PubMed
2. Taylor RW, Palagiri AV. Central venous catheterization. Crit Care Med. 2007;35(5):1390-1396. doi: 10.1097/01.CCM.0000260241.80346.1B. PubMed
3. Pikwer A, Akeson J, Lindgren S. Complications associated with peripheral or central routes for central venous cannulation. Anaesthesia. 2012;67(1):65-71. doi: 10.1111/j.1365-2044.2011.06911.x. PubMed
4. Johansson E, Hammarskjold F, Lundberg D, Arnlind MH. Advantages and disadvantages of peripherally inserted central venous catheters (PICC) compared to other central venous lines: a systematic review of the literature. Acta Onco. 2013;52(5):886-892. doi: 10.3109/0284186X.2013.773072. PubMed
5. Pan L, Zhao Q, Yang X. Risk factors for venous thrombosis associated with peripherally inserted central venous catheters. Int J Clin Exp Med. 2014;7(12):5814-5819. PubMed
6. Herc E, Patel P, Washer LL, Conlon A, Flanders SA, Chopra V. A model to predict central-line-associated bloodstream infection among patients with peripherally inserted central catheters: The MPC score. Infect Cont Hosp Ep. 2017;38(10):1155-1166. doi: 10.1017/ice.2017.167. PubMed
7. Maki DG, Kluger DM, Crnich CJ. The risk of bloodstream infection in adults with different intravascular devices: a systematic review of 200 published prospective studies. Mayo Clin Proc. 2006;81(9):1159–1171. doi: 10.4065/81.9.1159. PubMed
8. Smith SN, Moureau N, Vaughn VM, et al. Patterns and predictors of peripherally inserted central catheter occlusion: The 3P-O study. J Vasc Interv Radiol. 2017;28(5):749-756.e742. doi: 10.1016/j.jvir.2017.02.005. PubMed
9. Chopra V, Anand S, Hickner A, et al. Risk of venous thromboembolism associated with peripherally inserted central catheters: a systematic review and meta-analysis. Lancet. 2013;382(9889):311-325. doi: 10.1016/S0140-6736(13)60592-9. PubMed
10. Chopra V, Ratz D, Kuhn L, Lopus T, Lee A, Krein S. Peripherally inserted central catheter-related deep vein thrombosis: contemporary patterns and predictors. J Thromb Haemost. 2014;12(6):847-854. doi: 10.1111/jth.12549. PubMed
11. Carter JH, Langley JM, Kuhle S, Kirkland S. Risk factors for central venous catheter-associated bloodstream infection in pediatric patients: A cohort study. Infect Control Hosp Epidemiol. 2016;37(8):939-945. doi: 10.1017/ice.2016.83. PubMed
12. Chopra V, Ratz D, Kuhn L, Lopus T, Chenoweth C, Krein S. PICC-associated bloodstream infections: prevalence, patterns, and predictors. Am J Med. 2014;127(4):319-328. doi: 10.1016/j.amjmed.2014.01.001. PubMed
13. O’Grady NP, Alexander M, Burns LA, et al. Guidelines for the prevention of intravascular catheter-related infections. Clin Infect Dis. 2011;52(9):e162-e193. doi: 10.1093/cid/cir257. PubMed
14. Parkinson R, Gandhi M, Harper J, Archibald C. Establishing an ultrasound guided peripherally inserted central catheter (PICC) insertion service. Clin Radiol. 1998;53(1):33-36. doi: 10.1016/S0009-9260(98)80031-7. PubMed
15. Shannon RP, Patel B, Cummins D, Shannon AH, Ganguli G, Lu Y. Economics of central line--associated bloodstream infections. Am J Med Qual. 2006;21(6 Suppl):7s–16s. doi: 10.1177/1062860606294631. PubMed
16. Mermis JD, Strom JC, Greenwood JP, et al. Quality improvement initiative to reduce deep vein thrombosis associated with peripherally inserted central catheters in adults with cystic fibrosis. Ann Am Thorac Soc. 2014;11(9):1404-1410. doi: 10.1513/AnnalsATS.201404-175OC. PubMed
17. Ratz D, Hofer T, Flanders SA, Saint S, Chopra V. Limiting the number of lumens in peripherally inserted central catheters to improve outcomes and reduce cost: A simulation study. Infect Control Hosp Epidemiol. 2016;37(7):811-817. doi: 10.1017/ice.2016.55. PubMed
18. Chopra V, Anand S, Krein SL, Chenoweth C, Saint S. Bloodstream infection, venous thrombosis, and peripherally inserted central catheters: reappraising the evidence. Am J Med. 2012;125(8):733-741. doi: 10.1016/j.amjmed.2012.04.010. PubMed
19. O’Brien J, Paquet F, Lindsay R, Valenti D. Insertion of PICCs with minimum number of lumens reduces complications and costs. J Am Coll Radiol. 2013;10(11):864-868. doi: 10.1016/j.jacr.2013.06.003. PubMed
20. Tiwari MM, Hermsen ED, Charlton ME, Anderson JR, Rupp ME. Inappropriate intravascular device use: a prospective study. J Hosp Infect. 2011;78(2):128-132. doi: 10.1016/j.jhin.2011.03.004. PubMed
21. Chopra V, Kuhn L, Flanders SA, Saint S, Krein SL. Hospitalist experiences, practice, opinions, and knowledge regarding peripherally inserted central catheters: results of a national survey. J Hosp Med. 2013;8(11):635-638. doi: 10.1002/jhm.2095. PubMed
22. Goodman D, Ogrinc G, Davies L, et al. Explanation and elaboration of the SQUIRE (Standards for Quality Improvement Reporting Excellence) Guidelines, V.2.0: examples of SQUIRE elements in the healthcare improvement literature. BMJ Qual Saf. 2016;25(12):e7. doi: 10.1136/bmjqs-2015-004480. PubMed
23. CDC Bloodstream Infection/Device Associated Infection Module. https://wwwcdcgov/nhsn/pdfs/pscmanual/4psc_clabscurrentpdf 2017. Accessed April 11, 2017.
24. Woller SC, Stevens SM, Jones JP, et al. Derivation and validation of a simple model to identify venous thromboembolism risk in medical patients. Am J Med. 2011;124(10):947-954.e2. doi: 10.1016/j.amjmed.2011.06.004. PubMed
25. Paje D, Conlon A, Kaatz S, et al. Patterns and predictors of short-term peripherally inserted central catheter use: A multicenter prospective cohort study. J Hosp Med. 2018;13(2):76-82. doi: 10.12788/jhm.2847. PubMed
26. Evans RS, Sharp JH, Linford LH, et al. Reduction of peripherally inserted central catheter-associated DVT. Chest. 2013;143(3):627-633. doi: 10.1378/chest.12-0923. PubMed
27. Smith S, Moureau N, Vaughn VM, et al. Patterns and predictors of peripherally inserted central catheter occlusion: The 3P-O study. J Vasc Interv Radiol. 2017;28(5):749-756.e2. doi: 10.1016/j.jvir.2017.02.005. PubMed
28. Vaughn VM, Linder JA. Thoughtless design of the electronic health record drives overuse, but purposeful design can nudge improved patient care. BMJ Qual Saf. 2018;27(8):583-586. doi: 10.1136/bmjqs-2017-007578. PubMed
Vascular access is a cornerstone of safe and effective medical care. The use of peripherally inserted central catheters (PICCs) to meet vascular access needs has recently increased.1,2 PICCs offer several advantages over other central venous catheters. These advantages include increased reliability over intermediate to long-term use and reductions in complication rates during insertion.3,4
Multiple studies have suggested a strong association between the number of PICC lumens and risk of complications, such as central-line associated bloodstream infection (CLABSI), venous thrombosis, and catheter occlusion.5-8,9,10-12 These complications may lead to device failure, interrupt therapy, prolonged length of stay, and increased healthcare costs.13-15 Thus, available guidelines recommend using PICCs with the least clinically necessary number of lumens.1,16 Quality improvement strategies that have targeted decreasing the number of PICC lumens have reduced complications and healthcare costs.17-19 However, variability exists in the selection of the number of PICC lumens, and many providers request multilumen devices “just in case” additional lumens are needed.20,21 Such variation in device selection may stem from the paucity of information that defines the appropriate indications for the use of single- versus multi-lumen PICCs.
Therefore, to ensure appropriateness of PICC use, we designed an intervention to improve selection of the number of PICC lumens.
METHODS
We conducted this pre–post quasi-experimental study in accordance with SQUIRE guidelines.22 Details regarding clinical parameters associated with the decision to place a PICC, patient characteristics, comorbidities, complications, and laboratory values were collected from the medical records of patients. All PICCs were placed by the Vascular Access Service Team (VAST) during the study period.
Intervention
The intervention consisted of three components: first, all hospitalists, pharmacists, and VAST nurses received education in the form of a CME lecture that emphasized use of the Michigan Appropriateness Guide for Intravenous Catheters (MAGIC).1 These criteria define when use of a PICC is appropriate and emphasize how best to select the most appropriate device characteristics such as lumens and catheter gauge. Next, a multidisciplinary task force that consisted of hospitalists, VAST nurses, and pharmacists developed a list of indications specifying when use of a multilumen PICC was appropriate.1 Third, the order for a PICC in our electronic medical record (EMR) system was modified to set single-lumen PICCs as default. If a multilumen PICC was requested, text-based justification from the ordering clinician was required.
As an additional safeguard, a VAST nurse reviewed the number of lumens and clinical scenario for each PICC order prior to insertion. If the number of lumens ordered was considered inappropriate on the basis of the developed list of MAGIC recommendations, the case was referred to a pharmacist for additional review. The pharmacist then reviewed active and anticipated medications, explored options for adjusting the medication delivery plan, and discussed these options with the ordering clinician to determine the most appropriate number of lumens.
Measures and Definitions
In accordance with the criteria set by the Centers for Disease Control National Healthcare Safety Network,23 CLABSI was defined as a confirmed positive blood culture with a PICC in place for 48 hours or longer without another identified infection source or a positive PICC tip culture in the setting of clinically suspected infection. Venous thrombosis was defined as symptomatic upper extremity deep vein thromboembolism or pulmonary embolism that was radiographically confirmed after the placement of a PICC or within one week of device removal. Catheter occlusion was captured when documented or when tPA was administered for problems related to the PICC. The appropriateness of the number of PICC lumens was independently adjudicated by an attending physician and clinical pharmacist by comparing the indications of the device placed against predefined appropriateness criteria.
Outcomes
The primary outcome of interest was the change in the proportion of single-lumen PICCs placed. Secondary outcomes included (1) the placement of PICCs with an appropriate number of lumens, (2) the occurrence of PICC-related complications (CLABSI, venous thrombosis, and catheter occlusion), and (3) the need for a second procedure to place a multilumen device or additional vascular access.
Statistical Analysis
Descriptive statistics were used to tabulate and summarize patient and PICC characteristics. Differences between pre- and postintervention populations were assessed using χ2, Fishers exact, t-, and Wilcoxon rank sum tests. Differences in complications were assessed using the two-sample tests of proportions. Results were reported as medians (IQR) and percentages with corresponding 95% confidence intervals. All statistical tests were two-sided, with P < .05 considered statistically significant. Analyses were conducted with Stata v.14 (stataCorp, College Station, Texas).
Ethical and Regulatory Oversight
This study was approved by the Institutional Review Board at the University of Michigan (IRB#HUM00118168).
RESULTS
Of the 133 PICCs placed preintervention, 64.7% (n = 86) were single lumen, 33.1% (n = 44) were double lumen, and 2.3% (n = 3) were triple lumen. Compared with the preintervention period, the use of single-lumen PICCs significantly increased following the intervention (64.7% to 93.6%; P < .001; Figure 1). As well, the proportion of PICCs with an inappropriate number of lumens decreased from 25.6% to 2.2% (P < .001; Table 1).
Preintervention, 14.3% (95% CI = 8.34-20.23) of the patients with PICCs experienced at least one complication (n = 19). Following the intervention, 15.1% (95% CI = 7.79-22.32) of the 93 patients with PICCs experienced at least one complication (absolute difference = 0.8%, P = .872). With respect to individual complications, CLABSI decreased from 5.3% (n = 7; 95% CI = 1.47-9.06) to 2.2% (n = 2; 95% CI = −0.80-5.10) (P = .239). Similarly, the incidence of catheter occlusion decreased from 8.3% (n = 11; 95% CI = 3.59-12.95) to 6.5% (n = 6; 95% CI = 1.46-11.44; P = .610; Table). Notably, only 12.1% (n = 21) of patients with a single-lumen PICC experienced any complication, whereas 20.0% (n = 10) of patients with a double lumen, and 66.7% (n = 2) with a triple lumen experienced a PICC-associated complication (P = .022). Patients with triple lumens had a significantly higher incidence of catheter occlusion compared with patients that received double- and single-lumen PICCs (66.7% vs. 12.0% and 5.2%, respectively; P = .003).
No patient who received a single-lumen device required a second procedure for the placement of a device with additional lumens. Similarly, no documentation suggesting an insufficient number of PICC lumens or the need for additional vascular access (eg, placement of additional PICCs) was found in medical records of patients postintervention. Pharmacists supporting the interventions and VAST team members reported no disagreements when discussing number of lumens or appropriateness of catheter choice.
DISCUSSION
In this single center, pre–post quasi-experimental study, a multimodal intervention based on the MAGIC criteria significantly reduced the use of multilumen PICCs. Additionally, a trend toward reductions in complications, including CLABSI and catheter occlusion, was also observed. Notably, these changes in ordering practices did not lead to requests for additional devices or replacement with a multilumen PICC when a single-lumen device was inserted. Collectively, our findings suggest that the use of single-lumen devices in a large direct care service can be feasibly and safely increased through this approach. Larger scale studies that implement MAGIC to inform placement of multilumen PICCs and reduce PICC-related complications now appear necessary.
The presence of a PICC, even for short periods, significantly increases the risk of CLABSI and is one of the strongest predictors of venous thrombosis risk in the hospital setting.19,24,25 Although some factors that lead to this increased risk are patient-related and not modifiable (eg, malignancy or intensive care unit status), increased risk linked to the gauge of PICCs and the number of PICC lumens can be modified by improving device selection.9,18,26 Deliberate use of PICCs with the least numbers of clinically necessary lumens decreases risk of CLABSI, venous thrombosis and overall cost.17,19,26 Additionally, greater rates of occlusion with each additional PICC lumen may result in the interruption of intravenous therapy, the administration of costly medications (eg, tissue plasminogen activator) to salvage the PICC, and premature removal of devices should the occlusion prove irreversible.8
We observed a trend toward decreased PICC complications following implementation of our criteria, especially for the outcomes of CLABSI and catheter occlusion. Given the pilot nature of this study, we were underpowered to detect a statistically significant change in PICC adverse events. However, we did observe a statistically significant increase in the rate of single-lumen PICC use following our intervention. Notably, this increase occurred in the setting of high rates of single-lumen PICC use at baseline (64%). Therefore, an important takeaway from our findings is that room for improving PICC appropriateness exists even among high performers. This finding In turn, high baseline use of single-lumen PICCs may also explain why a robust reduction in PICC complications was not observed in our study, given that other studies showing reduction in the rates of complications began with considerably low rates of single-lumen device use.19 Outcomes may improve, however, if we expand and sustain these changes or expand to larger settings. For example, (based on assumptions from a previously published simulation study and our average hospital medicine daily census of 98 patients) the increased use of single-over multilumen PICCs is expected to decrease CLABSI events and venous thrombosis episodes by 2.4-fold in our hospital medicine service with an associated cost savings of $74,300 each year.17 Additionally, we would also expect the increase in the proportion of single-lumen PICCs to reduce rates of catheter occlusion. This reduction, in turn, would lessen interruptions in intravenous therapy, the need for medications to treat occlusion, and the need for device replacement all leading to reduced costs.27 Overall, then, our intervention (informed by appropriateness criteria) provides substantial benefits to hospital savings and patient safety.
After our intervention, 98% of all PICCs placed were found to comply with appropriate criteria for multilumen PICC use. We unexpectedly found that the most important factor driving our findings was not oversight or order modification by the pharmacy team or VAST nurses, but rather better decisions made by physicians at the outset. Specifically, we did not find a single instance wherein the original PICC order was changed to a device with a different number of lumens after review from the VAST team. We attribute this finding to receptiveness of physicians to change ordering practices following education and the redesign of the default EMR PICC order, both of which provided a scientific rationale for multilumen PICC use. Clarifying the risk and criteria of the use of multilumen devices along with providing an EMR ordering process that supports best practice helped hospitalists “do the right thing”. Additionally, setting single-lumen devices as the preselected EMR order and requiring text-based justification for placement of a multilumen PICC helped provide a nudge to physicians, much as it has done with antibiotic choices.28
Our study has limitations. First, we were only able to identify complications that were captured by our EMR. Given that over 70% of the patients in our study were discharged with a PICC in place, we do not know whether complications may have developed outside the hospital. Second, our intervention was resource intensive and required partnership with pharmacy, VAST, and hospitalists. Thus, the generalizability of our intervention to other institutions without similar support is unclear. Third, despite an increase in the use of single-lumen PICCs and a decrease in multilumen devices, we did not observe a significant reduction in all types of complications. While our high rate of single-lumen PICC use may account for these findings, larger scale studies are needed to better study the impact of MAGIC and appropriateness criteria on PICC complications. Finally, given our approach, we cannot identify the most effective modality within our bundled intervention. Stepped wedge or single-component studies are needed to further address this question.
In conclusion, we piloted a multimodal intervention to promote the use of single-lumen PICCs while lowering the use of multilumen devices. By using MAGIC to create appropriate indications, the use of multilumen PICCs declined and complications trended downwards. Larger, multicenter studies to validate our findings and examine the sustainability of this intervention would be welcomed.
Disclosures
The authors have nothing to disclose.
1. Chopra V, Flanders SA, Saint S, et al. The Michigan Appropriateness Guide for Intravenous Catheters (MAGIC): Results from a multispecialty panel using the RAND/UCLA appropriateness method. Ann Intern Med. 2015;163(6 Suppl):S1-S40. doi: 10.7326/M15-0744. PubMed
2. Taylor RW, Palagiri AV. Central venous catheterization. Crit Care Med. 2007;35(5):1390-1396. doi: 10.1097/01.CCM.0000260241.80346.1B. PubMed
3. Pikwer A, Akeson J, Lindgren S. Complications associated with peripheral or central routes for central venous cannulation. Anaesthesia. 2012;67(1):65-71. doi: 10.1111/j.1365-2044.2011.06911.x. PubMed
4. Johansson E, Hammarskjold F, Lundberg D, Arnlind MH. Advantages and disadvantages of peripherally inserted central venous catheters (PICC) compared to other central venous lines: a systematic review of the literature. Acta Onco. 2013;52(5):886-892. doi: 10.3109/0284186X.2013.773072. PubMed
5. Pan L, Zhao Q, Yang X. Risk factors for venous thrombosis associated with peripherally inserted central venous catheters. Int J Clin Exp Med. 2014;7(12):5814-5819. PubMed
6. Herc E, Patel P, Washer LL, Conlon A, Flanders SA, Chopra V. A model to predict central-line-associated bloodstream infection among patients with peripherally inserted central catheters: The MPC score. Infect Cont Hosp Ep. 2017;38(10):1155-1166. doi: 10.1017/ice.2017.167. PubMed
7. Maki DG, Kluger DM, Crnich CJ. The risk of bloodstream infection in adults with different intravascular devices: a systematic review of 200 published prospective studies. Mayo Clin Proc. 2006;81(9):1159–1171. doi: 10.4065/81.9.1159. PubMed
8. Smith SN, Moureau N, Vaughn VM, et al. Patterns and predictors of peripherally inserted central catheter occlusion: The 3P-O study. J Vasc Interv Radiol. 2017;28(5):749-756.e742. doi: 10.1016/j.jvir.2017.02.005. PubMed
9. Chopra V, Anand S, Hickner A, et al. Risk of venous thromboembolism associated with peripherally inserted central catheters: a systematic review and meta-analysis. Lancet. 2013;382(9889):311-325. doi: 10.1016/S0140-6736(13)60592-9. PubMed
10. Chopra V, Ratz D, Kuhn L, Lopus T, Lee A, Krein S. Peripherally inserted central catheter-related deep vein thrombosis: contemporary patterns and predictors. J Thromb Haemost. 2014;12(6):847-854. doi: 10.1111/jth.12549. PubMed
11. Carter JH, Langley JM, Kuhle S, Kirkland S. Risk factors for central venous catheter-associated bloodstream infection in pediatric patients: A cohort study. Infect Control Hosp Epidemiol. 2016;37(8):939-945. doi: 10.1017/ice.2016.83. PubMed
12. Chopra V, Ratz D, Kuhn L, Lopus T, Chenoweth C, Krein S. PICC-associated bloodstream infections: prevalence, patterns, and predictors. Am J Med. 2014;127(4):319-328. doi: 10.1016/j.amjmed.2014.01.001. PubMed
13. O’Grady NP, Alexander M, Burns LA, et al. Guidelines for the prevention of intravascular catheter-related infections. Clin Infect Dis. 2011;52(9):e162-e193. doi: 10.1093/cid/cir257. PubMed
14. Parkinson R, Gandhi M, Harper J, Archibald C. Establishing an ultrasound guided peripherally inserted central catheter (PICC) insertion service. Clin Radiol. 1998;53(1):33-36. doi: 10.1016/S0009-9260(98)80031-7. PubMed
15. Shannon RP, Patel B, Cummins D, Shannon AH, Ganguli G, Lu Y. Economics of central line--associated bloodstream infections. Am J Med Qual. 2006;21(6 Suppl):7s–16s. doi: 10.1177/1062860606294631. PubMed
16. Mermis JD, Strom JC, Greenwood JP, et al. Quality improvement initiative to reduce deep vein thrombosis associated with peripherally inserted central catheters in adults with cystic fibrosis. Ann Am Thorac Soc. 2014;11(9):1404-1410. doi: 10.1513/AnnalsATS.201404-175OC. PubMed
17. Ratz D, Hofer T, Flanders SA, Saint S, Chopra V. Limiting the number of lumens in peripherally inserted central catheters to improve outcomes and reduce cost: A simulation study. Infect Control Hosp Epidemiol. 2016;37(7):811-817. doi: 10.1017/ice.2016.55. PubMed
18. Chopra V, Anand S, Krein SL, Chenoweth C, Saint S. Bloodstream infection, venous thrombosis, and peripherally inserted central catheters: reappraising the evidence. Am J Med. 2012;125(8):733-741. doi: 10.1016/j.amjmed.2012.04.010. PubMed
19. O’Brien J, Paquet F, Lindsay R, Valenti D. Insertion of PICCs with minimum number of lumens reduces complications and costs. J Am Coll Radiol. 2013;10(11):864-868. doi: 10.1016/j.jacr.2013.06.003. PubMed
20. Tiwari MM, Hermsen ED, Charlton ME, Anderson JR, Rupp ME. Inappropriate intravascular device use: a prospective study. J Hosp Infect. 2011;78(2):128-132. doi: 10.1016/j.jhin.2011.03.004. PubMed
21. Chopra V, Kuhn L, Flanders SA, Saint S, Krein SL. Hospitalist experiences, practice, opinions, and knowledge regarding peripherally inserted central catheters: results of a national survey. J Hosp Med. 2013;8(11):635-638. doi: 10.1002/jhm.2095. PubMed
22. Goodman D, Ogrinc G, Davies L, et al. Explanation and elaboration of the SQUIRE (Standards for Quality Improvement Reporting Excellence) Guidelines, V.2.0: examples of SQUIRE elements in the healthcare improvement literature. BMJ Qual Saf. 2016;25(12):e7. doi: 10.1136/bmjqs-2015-004480. PubMed
23. CDC Bloodstream Infection/Device Associated Infection Module. https://wwwcdcgov/nhsn/pdfs/pscmanual/4psc_clabscurrentpdf 2017. Accessed April 11, 2017.
24. Woller SC, Stevens SM, Jones JP, et al. Derivation and validation of a simple model to identify venous thromboembolism risk in medical patients. Am J Med. 2011;124(10):947-954.e2. doi: 10.1016/j.amjmed.2011.06.004. PubMed
25. Paje D, Conlon A, Kaatz S, et al. Patterns and predictors of short-term peripherally inserted central catheter use: A multicenter prospective cohort study. J Hosp Med. 2018;13(2):76-82. doi: 10.12788/jhm.2847. PubMed
26. Evans RS, Sharp JH, Linford LH, et al. Reduction of peripherally inserted central catheter-associated DVT. Chest. 2013;143(3):627-633. doi: 10.1378/chest.12-0923. PubMed
27. Smith S, Moureau N, Vaughn VM, et al. Patterns and predictors of peripherally inserted central catheter occlusion: The 3P-O study. J Vasc Interv Radiol. 2017;28(5):749-756.e2. doi: 10.1016/j.jvir.2017.02.005. PubMed
28. Vaughn VM, Linder JA. Thoughtless design of the electronic health record drives overuse, but purposeful design can nudge improved patient care. BMJ Qual Saf. 2018;27(8):583-586. doi: 10.1136/bmjqs-2017-007578. PubMed
© 2019 Society of Hospital Medicine
Things We Do for No Reason: Intermittent Pneumatic Compression for Medical Ward Patients?
Inspired by the ABIM Foundation's Choosing Wisely campaign, the “Things We Do for No Reason” series reviews practices that have become common parts of hospital care but may provide little value to our patients. Practices reviewed in the TWDFNR series do not represent “black and white” conclusions or clinical practice standards, but are meant as a starting place for research and active discussions among hospitalists and patients. We invite you to be part of that discussion. https://www.choosingwisely.org/

CLINICAL SCENARIO
A 74-year-old man with a history of diabetes and gastrointestinal bleeding two months prior, presents with nausea/vomiting and diarrhea after eating unrefrigerated leftovers. Body mass index is 25. Labs are unremarkable except for a blood urea nitrogen of 37 mg/dL, serum creatinine of 1.6 mg/dL up from 1.3, and white blood cell count of 12 K/µL. He is afebrile with blood pressure of 100/60 mm Hg. He lives alone and is fully ambulatory at baseline. The Emergency Department physician requests observation admission for “dehydration/gastroenteritis.” The admitting hospitalist orders intermittent pneumatic compression (IPC) for venous thromboembolism (VTE) prophylaxis.
BACKGROUND
The American Public Health Association has called VTE prophylaxis a “public health crisis” due to the gap between existing evidence and implementation.1 The incidence of symptomatic deep venous thrombosis (DVT) and pulmonary embolism (PE) in hospitalized medical patients managed without prophylaxis is 0.96% and 1.2%, respectively,2 whereas that of asymptomatic DVT in hospitalized patients is approximately 1.8%.2,3 IPC is widely used, and an international registry of 15,156 hospitalized acutely ill medical patients found that 22% of United States patients received IPC for VTE prophylaxis compared with 0.2% of patients in other countries.4
WHY YOU MIGHT THINK IPC IS THE BEST OPTION FOR VTE PROPHYLAXIS IN MEDICAL WARD PATIENTS
The main reason clinicians opt to use IPC for VTE prophylaxis is the wish to avoid the bleeding risk associated with heparin. The American College of Chest Physicians antithrombotic guideline 9th edition (ACCP-AT9) recommends mechanical prophylaxis for patients at increased risk for thrombosis who are either bleeding or at “high risk for major bleeding.”5 The guideline considered patients to have an excessive bleeding risk if they had an active gastroduodenal ulcer, bleeding within the past three months, a platelet count below 50,000/ml, or more than one of the following risk factors: age ≥ 85, hepatic failure with INR >1.5, severe renal failure with GFR <30 mL/min/m2, ICU/CCU admission, central venous catheter, rheumatic disease, current cancer, or male gender.5 IPC also avoids the risk of heparin-induced thrombocytopenia, which is a rare but potentially devastating condition.
WHY IPC MIGHT NOT BE AS HELPFUL IN MEDICAL WARD PATIENTS
IPC devices are frequently not worn or turned on. A study at two university-affiliated level one trauma centers found IPC to be functioning properly in only 19% of trauma patients.10 In another study of gynecologic oncology patients, 52% of IPCs were functioning improperly and 25% of patients experienced some discomfort, inconvenience, or problems with external pneumatic compression.11 Redness, itching, or discomfort was cited by 26% of patients, and patients removed IPCs 11% of the time when nurses left the room.11,12 In another study, skin breakdown occurred in 3% of IPC patients as compared with 1% in the control group.7
Concerns about a possible link between IPC and increased fall risk was raised by a 2005 report of 40 falls by the Pennsylvania Patient Safety Reporting System,13 and IPC accounted for 16 of 3,562 hospital falls according to Boelig and colleagues.14 Ritsema et al. found that the most important perceived barriers to IPC compliance according to patient surveys were that the devices “prevented walking or getting up” (47%), “were tethering or tangling” (25%), and “woke the patient from sleep” (15%).15
IPC devices are not created equally, differing in “anatomical location of the sleeve garment, number and location of air bladders, patterns for compression cycles and duration of inflation time and deflation time.”16 Comparative effectiveness may differ. A study comparing a rapid inflation asymmetrical compression device by Venaflow with a sequential circumferential compression device by Kendall in a high-risk post knee replacement population produced DVT rates of 6.9% versus 15%, respectively (P = .007).16,17 Furthermore, the type of sleeve and device may affect comfort and compliance as some sleeves are considered “breathable.”
Perhaps most importantly, data supporting IPC efficacy in general medical ward patients are virtually nonexistent. Ho’s meta-analysis of IPC after excluding surgical patients found a relative risk (RR) of 0.53 (95% CI: 0.35-0.81, P < .01) for DVT in nine trials and a nonstatistically significant RR of 0.64 (95% CI: 0.29-1.42. P = .27) for PE in six trials.6 However, if high-risk populations such as trauma, critical care, and stroke are excluded, then
IPC is expensive. The cost for pneumatic compression boots is quoted in the literature at $120 with a range of $80-$250.21 Furthermore, patients averaged 2.5 pairs per hospitalization.22 An online search of retail prices revealed a pair of knee-length Covidien 5329 compression sleeves at $299.19 per pair23 and knee-length Kendall 7325-2 compression sleeves at $433.76 per pair24 with pumps costing $7,518.07 for Venodyne 610 Advantage,25 $6,965.98 for VenaFlow Elite,26 and $5,750.50 for Covidien 29525 700 series Kendall SCD.27 However, using these prices would be overestimating costs given that hospitals do not pay retail prices. A prior surgical cost/benefit analysis used a prevalence of 6.9% and a 69% reduction of DVT.28 However, recent data showed that VTE incidence in 31,219 medical patients was only 0.57% and RR for a large VTE prevention initiative was a nonsignificant 10% reduction.29 Even if we use a VTE prevalence of 1% for the general medical floor and 0.5% RR reduction, 200 patients would need to be treated to prevent one symptomatic VTE and would cost about $24,000 for IPC sleeves alone (estimating $120 per patient) without factoring in additional costs of pump purchase or rental and six additional episodes of anticipated skin breakdown. In comparison, the cost for VTE treatment ranges from $7,712 to $16,644.30
WHAT SHOULD WE DO INSTEAD?
First, one should consider if VTE prophylaxis is needed based on risk assessment. According to the Agency for Healthcare Research and Quality (AHRQ), the most widely used risk stratification model is the University of California San Diego “3 bucket model” (Table 1) derived from tables in ACCP-AT8 guidelines.31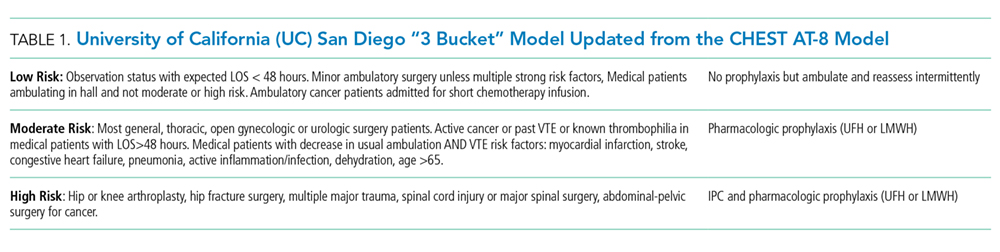
RECOMMENDATIONS
- The VTE risk of general medicine ward patients should be assessed, preferably with the “3 bucket” or Padua risk assessment models.
- For low-risk patients, no VTE prophylaxis is indicated. Ambulation ought to be encouraged for low-risk patients.
- If prophylaxis is indicated, then bleeding risk should be assessed to determine a contraindication to pharmacologic prophylaxis. If there is excessive bleeding risk, then treatment with IPC may be considered even though there are only data to support this in high-risk populations such as surgical, stroke, trauma, and critical care patients.
- If using IPC, then strategies that ensure compliance and consider patient comfort based on type and location of sleeves should be implemented.
- Combined IPC and pharmacologic prophylaxis should be used for high-risk trauma or surgical patients.
CONCLUSIONS
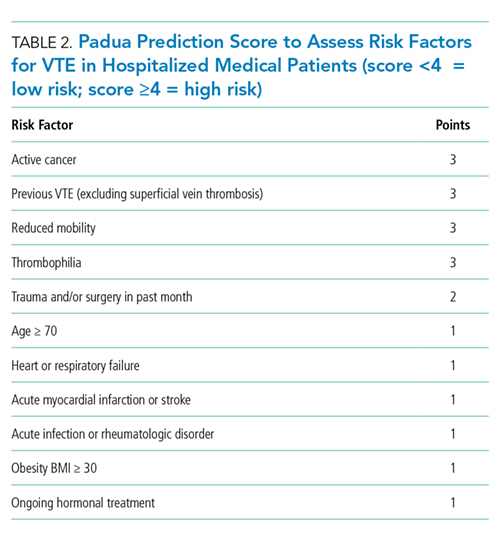
Do you think this is a low-value practice? Is this truly a “Thing We Do for No Reason?” Share what you do in your practice and join in the conversation online by retweeting it on Twitter (#TWDFNR) and liking it on Facebook. We invite you to propose ideas for other “Things We Do for No Reason” topics by emailing[email protected].
Disclosures
The authors have nothing to disclose.
1. Association APH. Deep-vein thrombosis: advancing awareness to protect patient lives. WHITE Paper. Public Health Leadership Conference on Deep-Vein Thrombosis.
2. Lederle FA, Zylla D, MacDonald R, Wilt TJ. Venous thromboembolism prophylaxis in hospitalized medical patients and those with stroke: a background review for an American College of Physicians Clinical Practice Guideline. Ann Intern Med. 2011;155(9):602-615. doi: 10.7326/0003-4819-155-9-201111010-00008. PubMed
3. Zubrow MT, Urie J, Jurkovitz C, et al. Asymptomatic deep vein thrombosis in patients undergoing screening duplex ultrasonography. J Hosp Med. 2014;9(1):19-22. doi: 10.1002/jhm.2112. PubMed
4. Tapson VF, Decousus H, Pini M, et al. Venous thromboembolism prophylaxis in acutely ill hospitalized medical patients: findings from the International Medical Prevention Registry on Venous Thromboembolism. Chest. 2007;132(3):936-945. doi: 10.1378/chest.06-2993. PubMed
5. Guyatt GH, Eikelboom JW, Gould MK, et al. Approach to outcome measurement in the prevention of thrombosis in surgical and medical patients: Antithrombotic Therapy and Prevention of Thrombosis, 9th ed: American College of Chest Physicians Evidence-Based Clinical Practice Guidelines. Chest. 2012;141(2 Suppl):e185S-e194S. doi: 10.1378/chest.11-2289. PubMed
6. Ho KM, Tan JA. Stratified meta-analysis of intermittent pneumatic compression of the lower limbs to prevent venous thromboembolism in hospitalized patients. Circulation. 2013;128(9):1003-1020. doi: 10.1161/CIRCULATIONAHA.113.002690. PubMed
7. CLOTS (Clots in Legs Or sTockings after Stroke) Trials Collaboration, Dennis M, Sandercock P, et al. Effectiveness of intermittent pneumatic compression in reduction of risk of deep vein thrombosis in patients who have had a stroke (CLOTS 3): a multicentre randomised controlled trial. Lancet. 2013;382(9891):516-524. doi: 10.1016/S0140-6736(13)61050-8. PubMed
8. Park J, Lee JM, Lee JS, Cho YJ. Pharmacological and mechanical thromboprophylaxis in critically ill patients: a network meta-analysis of 12 trials. J Korean Med Sci. 2016;31(11):1828-1837. doi: 10.3346/jkms.2016.31.11.1828. PubMed
9. Kakkos SK, Caprini JA, Geroulakos G, et al. Combined intermittent pneumatic leg compression and pharmacological prophylaxis for prevention of venous thromboembolism. Cochrane Database Syst Rev. 2016;9:CD005258:CD005258. doi: 10.1002/14651858.CD005258.pub3. PubMed
10. Cornwell EE, 3rd, Chang D, Velmahos G, et al. Compliance with sequential compression device prophylaxis in at-risk trauma patients: a prospective analysis. Am Surg. 2002;68(5):470-473. PubMed
11. Maxwell GL, Synan I, Hayes RP, Clarke-Pearson DL. Preference and compliance in postoperative thromboembolism prophylaxis among gynecologic oncology patients. Obstet Gynecol. 2002;100(3):451-455. doi: 10.1016/S0029-7844(02)02162-2. PubMed
12. Wood KB, Kos PB, Abnet JK, Ista C. Prevention of deep-vein thrombosis after major spinal surgery: a comparison study of external devices. J Spinal Disord. 1997;10(3):209-214. PubMed
13. Unexpected risk from a beneficial device: sequential compression devices and patient falls. PA-PSRS Patient Saf Advis. 2005 Sep;2(3):13-5.
14. Boelig MM, Streiff MB, Hobson DB, Kraus PS, Pronovost PJ, Haut ER. Are sequential compression devices commonly associated with in-hospital falls? A myth-busters review using the patient safety net database. J Patient Saf. 2011;7(2):77-79. doi: 10.1097/PTS.0b013e3182110706. PubMed
15. Ritsema DF, Watson JM, Stiteler AP, Nguyen MM. Sequential compression devices in postoperative urologic patients: an observational trial and survey study on the influence of patient and hospital factors on compliance. BMC Urol. 2013;13:20. doi: 10.1186/1471-2490-13-20. PubMed
16. Pavon JM, Williams JW, Jr, Adam SS, et al. Effectiveness of intermittent pneumatic compression devices for venous thromboembolism prophylaxis in high-risk surgical and medical patients. J Arthroplasty. 2016;31(2):524-532. doi: 10.1016/j.arth.2015.09.043. PubMed
17. Lachiewicz PF, Kelley SS, Haden LR. Two mechanical devices for prophylaxis of thromboembolism after total knee arthroplasty. A prospective, randomised study. J Bone Joint Surg Br. 2004;86(8):1137-1141. doi: 10.1302/0301-620X.86B8.15438. PubMed
18. Salzman EW, Sobel M, Lewis J, Sweeney J, Hussey S, Kurland G. Prevention of venous thromboembolism in unstable angina pectoris. N Engl J Med. 1982;306(16):991. doi: 10.1056/NEJM198204223061614. PubMed
19. Guyatt GH, Akl EA, Crowther M, Gutterman DD, Schuünemann HJ, American College of Chest Physicians Antithrombotic Therapy and Prevention of Thrombosis Panel. Executive summary: Antithrombotic Therapy and Prevention of Thrombosis, 9th ed: American College of Chest Physicians Evidence-Based Clinical Practice Guidelines. Chest. 2012;141(2 Suppl):7S-47S. doi: 10.1378/chest.1412S3. PubMed
20. Qaseem A, Chou R, Humphrey LL, Starkey M, Shekelle P, Clinical Guidelines Committee of the American College of Physicians. Venous thromboembolism prophylaxis in hospitalized patients: a clinical practice guideline from the American College of Physicians. Ann Intern Med. 2011;155(9):625-632. doi: 10.7326/0003-4819-155-9-201111010-00011. PubMed
21. Casele H, Grobman WA. Cost-effectiveness of thromboprophylaxis with intermittent pneumatic compression at cesarean delivery. Obstet Gynecol. 2006;108(3 Pt 1):535-540. doi: 10.1097/01.AOG.0000227780.76353.05. PubMed
22. Dennis M, Sandercock P, Graham C, Forbes J, CLOTS Trials Collaboration, Smith J, Smith J. The Clots in Legs or sTockings after Stroke (CLOTS) 3 trial: a randomised controlled trial to determine whether or not intermittent pneumatic compression reduces the risk of post-stroke deep vein thrombosis and to estimate its cost-effectiveness. Health Technol Assess. 2015;19(76):1-90. doi: 10.3310/hta19760. PubMed
23. Amazon.com. Covidien 5329 Sleeve, SCD Knee Length. https://www.amazon.com/Covidien-5329-Sleeve-Knee-Length/dp/B01BSFZM76. Accessed September 14, 2018.
24. Amazon.com. 2270870 SCD Sleeve Knee Length. https://www.amazon.com/s/ref=nb_sb_noss?url=search-alias%3Daps&field-keywords=kendall+7325-2&rh=i%3Aaps%2Ck%3Akendall+7325-2. Accessed September 14, 2018.
25. Amazon.com. 2281540 Venodyne Advantage 610DVT. https://www.amazon.com/Individually-MODEL-610-Microtek-Medical/dp/B00IK4MUUG/ref=sr_1_fkmr0_2?ie=UTF8&qid=1540914574&sr=8-2-fkmr0&keywords=venodyne+scd. Accessed Osctober 30, 2018.
26. Amazon.com. 2339896 Venaflow System w/Battery Elite. https://www.amazon.com/indivdually-Individually-30B-B-DJO-Inc/dp/B00IK4MS3A/ref=sr_1_2?ie=UTF8&qid=1536972486&sr=8-2&keywords=venaflow+elite+system. Accessed September 14, 2018.
27. Amazon.com. Covidien 29525 700 Series Kendall SCD Controller. https://www.amazon.com/Covidien-29525-700-Kendall-Controller/dp/B01BQI5BI0/ref=sr_1_1?ie=UTF8&qid=1536972026&sr=8-1&keywords=covidien+29525. Accessed September 14, 2018.
28. Nicolaides A, Goldhaber SZ, Maxwell GL, et al. Cost benefit of intermittent pneumatic compression for venous thromboembolism prophylaxis in general surgery. Int Angiol. 2008;27(6):500-506. PubMed
29. Jenkins IH, White RH, Amin AN, et al. Reducing the incidence of hospital-associated venous thromboembolism within a network of academic hospitals: findings from five University of California medical centers. J Hosp Med. 2016;11(Suppl 2):S22-S28. doi: 10.1002/jhm.2658. PubMed
30. Dobesh PP. Economic burden of venous thromboembolism in hospitalized patients. Pharmacotherapy. 2009;29(8):943-953. doi: 10.1592/phco.29.8.943. PubMed
31. Maynard, G. Preventing Hospital-Associated Venous Thromboembolism. A Guide for Effective Quality Improvement. AHRQ Publication No. 16-0001-EF; 2015.
32. Decousus H, Tapson VF, Bergmann JF, et al. Factors at admission associated with bleeding risk in medical patients: findings from the IMPROVE investigators. Chest. 2011;139(1):69-79. doi: 10.1378/chest.09-3081. PubMed
Inspired by the ABIM Foundation's Choosing Wisely campaign, the “Things We Do for No Reason” series reviews practices that have become common parts of hospital care but may provide little value to our patients. Practices reviewed in the TWDFNR series do not represent “black and white” conclusions or clinical practice standards, but are meant as a starting place for research and active discussions among hospitalists and patients. We invite you to be part of that discussion. https://www.choosingwisely.org/
CLINICAL SCENARIO
A 74-year-old man with a history of diabetes and gastrointestinal bleeding two months prior, presents with nausea/vomiting and diarrhea after eating unrefrigerated leftovers. Body mass index is 25. Labs are unremarkable except for a blood urea nitrogen of 37 mg/dL, serum creatinine of 1.6 mg/dL up from 1.3, and white blood cell count of 12 K/µL. He is afebrile with blood pressure of 100/60 mm Hg. He lives alone and is fully ambulatory at baseline. The Emergency Department physician requests observation admission for “dehydration/gastroenteritis.” The admitting hospitalist orders intermittent pneumatic compression (IPC) for venous thromboembolism (VTE) prophylaxis.
BACKGROUND
The American Public Health Association has called VTE prophylaxis a “public health crisis” due to the gap between existing evidence and implementation.1 The incidence of symptomatic deep venous thrombosis (DVT) and pulmonary embolism (PE) in hospitalized medical patients managed without prophylaxis is 0.96% and 1.2%, respectively,2 whereas that of asymptomatic DVT in hospitalized patients is approximately 1.8%.2,3 IPC is widely used, and an international registry of 15,156 hospitalized acutely ill medical patients found that 22% of United States patients received IPC for VTE prophylaxis compared with 0.2% of patients in other countries.4
WHY YOU MIGHT THINK IPC IS THE BEST OPTION FOR VTE PROPHYLAXIS IN MEDICAL WARD PATIENTS
The main reason clinicians opt to use IPC for VTE prophylaxis is the wish to avoid the bleeding risk associated with heparin. The American College of Chest Physicians antithrombotic guideline 9th edition (ACCP-AT9) recommends mechanical prophylaxis for patients at increased risk for thrombosis who are either bleeding or at “high risk for major bleeding.”5 The guideline considered patients to have an excessive bleeding risk if they had an active gastroduodenal ulcer, bleeding within the past three months, a platelet count below 50,000/ml, or more than one of the following risk factors: age ≥ 85, hepatic failure with INR >1.5, severe renal failure with GFR <30 mL/min/m2, ICU/CCU admission, central venous catheter, rheumatic disease, current cancer, or male gender.5 IPC also avoids the risk of heparin-induced thrombocytopenia, which is a rare but potentially devastating condition.
WHY IPC MIGHT NOT BE AS HELPFUL IN MEDICAL WARD PATIENTS
IPC devices are frequently not worn or turned on. A study at two university-affiliated level one trauma centers found IPC to be functioning properly in only 19% of trauma patients.10 In another study of gynecologic oncology patients, 52% of IPCs were functioning improperly and 25% of patients experienced some discomfort, inconvenience, or problems with external pneumatic compression.11 Redness, itching, or discomfort was cited by 26% of patients, and patients removed IPCs 11% of the time when nurses left the room.11,12 In another study, skin breakdown occurred in 3% of IPC patients as compared with 1% in the control group.7
Concerns about a possible link between IPC and increased fall risk was raised by a 2005 report of 40 falls by the Pennsylvania Patient Safety Reporting System,13 and IPC accounted for 16 of 3,562 hospital falls according to Boelig and colleagues.14 Ritsema et al. found that the most important perceived barriers to IPC compliance according to patient surveys were that the devices “prevented walking or getting up” (47%), “were tethering or tangling” (25%), and “woke the patient from sleep” (15%).15
IPC devices are not created equally, differing in “anatomical location of the sleeve garment, number and location of air bladders, patterns for compression cycles and duration of inflation time and deflation time.”16 Comparative effectiveness may differ. A study comparing a rapid inflation asymmetrical compression device by Venaflow with a sequential circumferential compression device by Kendall in a high-risk post knee replacement population produced DVT rates of 6.9% versus 15%, respectively (P = .007).16,17 Furthermore, the type of sleeve and device may affect comfort and compliance as some sleeves are considered “breathable.”
Perhaps most importantly, data supporting IPC efficacy in general medical ward patients are virtually nonexistent. Ho’s meta-analysis of IPC after excluding surgical patients found a relative risk (RR) of 0.53 (95% CI: 0.35-0.81, P < .01) for DVT in nine trials and a nonstatistically significant RR of 0.64 (95% CI: 0.29-1.42. P = .27) for PE in six trials.6 However, if high-risk populations such as trauma, critical care, and stroke are excluded, then
IPC is expensive. The cost for pneumatic compression boots is quoted in the literature at $120 with a range of $80-$250.21 Furthermore, patients averaged 2.5 pairs per hospitalization.22 An online search of retail prices revealed a pair of knee-length Covidien 5329 compression sleeves at $299.19 per pair23 and knee-length Kendall 7325-2 compression sleeves at $433.76 per pair24 with pumps costing $7,518.07 for Venodyne 610 Advantage,25 $6,965.98 for VenaFlow Elite,26 and $5,750.50 for Covidien 29525 700 series Kendall SCD.27 However, using these prices would be overestimating costs given that hospitals do not pay retail prices. A prior surgical cost/benefit analysis used a prevalence of 6.9% and a 69% reduction of DVT.28 However, recent data showed that VTE incidence in 31,219 medical patients was only 0.57% and RR for a large VTE prevention initiative was a nonsignificant 10% reduction.29 Even if we use a VTE prevalence of 1% for the general medical floor and 0.5% RR reduction, 200 patients would need to be treated to prevent one symptomatic VTE and would cost about $24,000 for IPC sleeves alone (estimating $120 per patient) without factoring in additional costs of pump purchase or rental and six additional episodes of anticipated skin breakdown. In comparison, the cost for VTE treatment ranges from $7,712 to $16,644.30
WHAT SHOULD WE DO INSTEAD?
First, one should consider if VTE prophylaxis is needed based on risk assessment. According to the Agency for Healthcare Research and Quality (AHRQ), the most widely used risk stratification model is the University of California San Diego “3 bucket model” (Table 1) derived from tables in ACCP-AT8 guidelines.31
RECOMMENDATIONS
- The VTE risk of general medicine ward patients should be assessed, preferably with the “3 bucket” or Padua risk assessment models.
- For low-risk patients, no VTE prophylaxis is indicated. Ambulation ought to be encouraged for low-risk patients.
- If prophylaxis is indicated, then bleeding risk should be assessed to determine a contraindication to pharmacologic prophylaxis. If there is excessive bleeding risk, then treatment with IPC may be considered even though there are only data to support this in high-risk populations such as surgical, stroke, trauma, and critical care patients.
- If using IPC, then strategies that ensure compliance and consider patient comfort based on type and location of sleeves should be implemented.
- Combined IPC and pharmacologic prophylaxis should be used for high-risk trauma or surgical patients.
CONCLUSIONS
Do you think this is a low-value practice? Is this truly a “Thing We Do for No Reason?” Share what you do in your practice and join in the conversation online by retweeting it on Twitter (#TWDFNR) and liking it on Facebook. We invite you to propose ideas for other “Things We Do for No Reason” topics by emailing[email protected].
Disclosures
The authors have nothing to disclose.
1. Association APH. Deep-vein thrombosis: advancing awareness to protect patient lives. WHITE Paper. Public Health Leadership Conference on Deep-Vein Thrombosis.
2. Lederle FA, Zylla D, MacDonald R, Wilt TJ. Venous thromboembolism prophylaxis in hospitalized medical patients and those with stroke: a background review for an American College of Physicians Clinical Practice Guideline. Ann Intern Med. 2011;155(9):602-615. doi: 10.7326/0003-4819-155-9-201111010-00008. PubMed
3. Zubrow MT, Urie J, Jurkovitz C, et al. Asymptomatic deep vein thrombosis in patients undergoing screening duplex ultrasonography. J Hosp Med. 2014;9(1):19-22. doi: 10.1002/jhm.2112. PubMed
4. Tapson VF, Decousus H, Pini M, et al. Venous thromboembolism prophylaxis in acutely ill hospitalized medical patients: findings from the International Medical Prevention Registry on Venous Thromboembolism. Chest. 2007;132(3):936-945. doi: 10.1378/chest.06-2993. PubMed
5. Guyatt GH, Eikelboom JW, Gould MK, et al. Approach to outcome measurement in the prevention of thrombosis in surgical and medical patients: Antithrombotic Therapy and Prevention of Thrombosis, 9th ed: American College of Chest Physicians Evidence-Based Clinical Practice Guidelines. Chest. 2012;141(2 Suppl):e185S-e194S. doi: 10.1378/chest.11-2289. PubMed
6. Ho KM, Tan JA. Stratified meta-analysis of intermittent pneumatic compression of the lower limbs to prevent venous thromboembolism in hospitalized patients. Circulation. 2013;128(9):1003-1020. doi: 10.1161/CIRCULATIONAHA.113.002690. PubMed
7. CLOTS (Clots in Legs Or sTockings after Stroke) Trials Collaboration, Dennis M, Sandercock P, et al. Effectiveness of intermittent pneumatic compression in reduction of risk of deep vein thrombosis in patients who have had a stroke (CLOTS 3): a multicentre randomised controlled trial. Lancet. 2013;382(9891):516-524. doi: 10.1016/S0140-6736(13)61050-8. PubMed
8. Park J, Lee JM, Lee JS, Cho YJ. Pharmacological and mechanical thromboprophylaxis in critically ill patients: a network meta-analysis of 12 trials. J Korean Med Sci. 2016;31(11):1828-1837. doi: 10.3346/jkms.2016.31.11.1828. PubMed
9. Kakkos SK, Caprini JA, Geroulakos G, et al. Combined intermittent pneumatic leg compression and pharmacological prophylaxis for prevention of venous thromboembolism. Cochrane Database Syst Rev. 2016;9:CD005258:CD005258. doi: 10.1002/14651858.CD005258.pub3. PubMed
10. Cornwell EE, 3rd, Chang D, Velmahos G, et al. Compliance with sequential compression device prophylaxis in at-risk trauma patients: a prospective analysis. Am Surg. 2002;68(5):470-473. PubMed
11. Maxwell GL, Synan I, Hayes RP, Clarke-Pearson DL. Preference and compliance in postoperative thromboembolism prophylaxis among gynecologic oncology patients. Obstet Gynecol. 2002;100(3):451-455. doi: 10.1016/S0029-7844(02)02162-2. PubMed
12. Wood KB, Kos PB, Abnet JK, Ista C. Prevention of deep-vein thrombosis after major spinal surgery: a comparison study of external devices. J Spinal Disord. 1997;10(3):209-214. PubMed
13. Unexpected risk from a beneficial device: sequential compression devices and patient falls. PA-PSRS Patient Saf Advis. 2005 Sep;2(3):13-5.
14. Boelig MM, Streiff MB, Hobson DB, Kraus PS, Pronovost PJ, Haut ER. Are sequential compression devices commonly associated with in-hospital falls? A myth-busters review using the patient safety net database. J Patient Saf. 2011;7(2):77-79. doi: 10.1097/PTS.0b013e3182110706. PubMed
15. Ritsema DF, Watson JM, Stiteler AP, Nguyen MM. Sequential compression devices in postoperative urologic patients: an observational trial and survey study on the influence of patient and hospital factors on compliance. BMC Urol. 2013;13:20. doi: 10.1186/1471-2490-13-20. PubMed
16. Pavon JM, Williams JW, Jr, Adam SS, et al. Effectiveness of intermittent pneumatic compression devices for venous thromboembolism prophylaxis in high-risk surgical and medical patients. J Arthroplasty. 2016;31(2):524-532. doi: 10.1016/j.arth.2015.09.043. PubMed
17. Lachiewicz PF, Kelley SS, Haden LR. Two mechanical devices for prophylaxis of thromboembolism after total knee arthroplasty. A prospective, randomised study. J Bone Joint Surg Br. 2004;86(8):1137-1141. doi: 10.1302/0301-620X.86B8.15438. PubMed
18. Salzman EW, Sobel M, Lewis J, Sweeney J, Hussey S, Kurland G. Prevention of venous thromboembolism in unstable angina pectoris. N Engl J Med. 1982;306(16):991. doi: 10.1056/NEJM198204223061614. PubMed
19. Guyatt GH, Akl EA, Crowther M, Gutterman DD, Schuünemann HJ, American College of Chest Physicians Antithrombotic Therapy and Prevention of Thrombosis Panel. Executive summary: Antithrombotic Therapy and Prevention of Thrombosis, 9th ed: American College of Chest Physicians Evidence-Based Clinical Practice Guidelines. Chest. 2012;141(2 Suppl):7S-47S. doi: 10.1378/chest.1412S3. PubMed
20. Qaseem A, Chou R, Humphrey LL, Starkey M, Shekelle P, Clinical Guidelines Committee of the American College of Physicians. Venous thromboembolism prophylaxis in hospitalized patients: a clinical practice guideline from the American College of Physicians. Ann Intern Med. 2011;155(9):625-632. doi: 10.7326/0003-4819-155-9-201111010-00011. PubMed
21. Casele H, Grobman WA. Cost-effectiveness of thromboprophylaxis with intermittent pneumatic compression at cesarean delivery. Obstet Gynecol. 2006;108(3 Pt 1):535-540. doi: 10.1097/01.AOG.0000227780.76353.05. PubMed
22. Dennis M, Sandercock P, Graham C, Forbes J, CLOTS Trials Collaboration, Smith J, Smith J. The Clots in Legs or sTockings after Stroke (CLOTS) 3 trial: a randomised controlled trial to determine whether or not intermittent pneumatic compression reduces the risk of post-stroke deep vein thrombosis and to estimate its cost-effectiveness. Health Technol Assess. 2015;19(76):1-90. doi: 10.3310/hta19760. PubMed
23. Amazon.com. Covidien 5329 Sleeve, SCD Knee Length. https://www.amazon.com/Covidien-5329-Sleeve-Knee-Length/dp/B01BSFZM76. Accessed September 14, 2018.
24. Amazon.com. 2270870 SCD Sleeve Knee Length. https://www.amazon.com/s/ref=nb_sb_noss?url=search-alias%3Daps&field-keywords=kendall+7325-2&rh=i%3Aaps%2Ck%3Akendall+7325-2. Accessed September 14, 2018.
25. Amazon.com. 2281540 Venodyne Advantage 610DVT. https://www.amazon.com/Individually-MODEL-610-Microtek-Medical/dp/B00IK4MUUG/ref=sr_1_fkmr0_2?ie=UTF8&qid=1540914574&sr=8-2-fkmr0&keywords=venodyne+scd. Accessed Osctober 30, 2018.
26. Amazon.com. 2339896 Venaflow System w/Battery Elite. https://www.amazon.com/indivdually-Individually-30B-B-DJO-Inc/dp/B00IK4MS3A/ref=sr_1_2?ie=UTF8&qid=1536972486&sr=8-2&keywords=venaflow+elite+system. Accessed September 14, 2018.
27. Amazon.com. Covidien 29525 700 Series Kendall SCD Controller. https://www.amazon.com/Covidien-29525-700-Kendall-Controller/dp/B01BQI5BI0/ref=sr_1_1?ie=UTF8&qid=1536972026&sr=8-1&keywords=covidien+29525. Accessed September 14, 2018.
28. Nicolaides A, Goldhaber SZ, Maxwell GL, et al. Cost benefit of intermittent pneumatic compression for venous thromboembolism prophylaxis in general surgery. Int Angiol. 2008;27(6):500-506. PubMed
29. Jenkins IH, White RH, Amin AN, et al. Reducing the incidence of hospital-associated venous thromboembolism within a network of academic hospitals: findings from five University of California medical centers. J Hosp Med. 2016;11(Suppl 2):S22-S28. doi: 10.1002/jhm.2658. PubMed
30. Dobesh PP. Economic burden of venous thromboembolism in hospitalized patients. Pharmacotherapy. 2009;29(8):943-953. doi: 10.1592/phco.29.8.943. PubMed
31. Maynard, G. Preventing Hospital-Associated Venous Thromboembolism. A Guide for Effective Quality Improvement. AHRQ Publication No. 16-0001-EF; 2015.
32. Decousus H, Tapson VF, Bergmann JF, et al. Factors at admission associated with bleeding risk in medical patients: findings from the IMPROVE investigators. Chest. 2011;139(1):69-79. doi: 10.1378/chest.09-3081. PubMed
© 2019 Society of Hospital Medicine
The Basement Flight
A 14-year-old girl with a history of asthma presented to the Emergency Department (ED) with three months of persistent, nonproductive cough, and progressive shortness of breath. She reported fatigue, chest tightness, orthopnea, and dyspnea with exertion. She denied fever, rhinorrhea, congestion, hemoptysis, or paroxysmal nocturnal dyspnea.
Her age and past medical history of asthma are incongruent with her new symptoms, as asthma is typified by intermittent exacerbations, not progressive symptoms. Thus, another process, in addition to asthma, is most likely present; it is also important to question the accuracy of previous diagnoses in light of new information. Her symptoms may signify an underlying cardiopulmonary process, such as infiltrative diseases (eg, lymphoma or sarcoidosis), atypical infections, genetic conditions (eg, variant cystic fibrosis), autoimmune conditions, or cardiomyopathy. A detailed symptom history, family history, and careful physical examination will help expand and then refine the differential diagnosis. At this stage, typical infections are less likely.
She had presented two months prior with nonproductive cough and dyspnea. At that presentation, her temperature was 36.3°C, heart rate 110 beats per minute, blood pressure 119/63 mm Hg, respiratory rate 43 breaths per minute, and oxygen saturation 86% while breathing ambient air. A chest CT with contrast demonstrated diffuse patchy multifocal ground-glass opacities in the bilateral lungs as well as a mixture of atelectasis and lobular emphysema in the dependent lobes bilaterally (Figure 1). Her main pulmonary artery was dilated at 3.6 cm (mean of 2.42 cm with SD 0.22). She was diagnosed with atypical pneumonia. She was administered azithromycin, weaned off oxygen, and discharged after a seven-day hospitalization.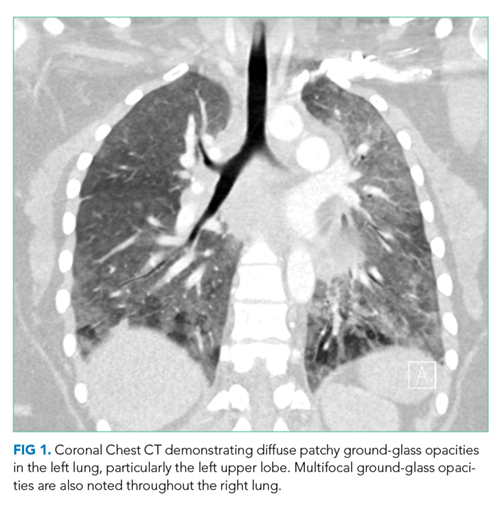
Two months prior, she had marked tachypnea, tachycardia, and hypoxemia, and imaging revealed diffuse ground-glass opacities. The differential diagnosis for this constellation of symptoms is extensive and includes many conditions that have an inflammatory component, such as atypical pneumonia caused by Mycoplasma or Chlamydia pneumoniae or a common respiratory virus such as rhinovirus or human metapneumovirus. However, two findings make an acute pneumonia unlikely to be the sole cause of her symptoms: underlying emphysema and an enlarged pulmonary artery. Emphysema is an uncommon finding in children and can be related to congenital or acquired causes; congenital lobar emphysema most often presents earlier in life and is focal, not diffuse. Alpha-1-anti-trypin deficiency and mutations in connective tissue genes such as those encoding for elastin and fibrillin can lead to pulmonary disease. While not diagnostic of pulmonary hypertension, her dilated pulmonary artery, coupled with her history, makes pulmonary hypertension a strong possibility. While her pulmonary hypertension is most likely secondary to chronic lung disease based on the emphysematous changes on CT, it could still be related to a cardiac etiology.
The patient had a history of seasonal allergies and well-controlled asthma. She was hospitalized at age six for an asthma exacerbation associated with a respiratory infection. She was discharged with an albuterol inhaler, but seldom used it. Her parents denied any regular coughing during the day or night. She was morbidly obese. Her tonsils and adenoids were removed to treat obstructive sleep apnea (OSA) at age seven, and a subsequent polysomnography was normal. Her medications included intranasal fluticasone propionate and oral iron supplementation. She had no known allergies or recent travels. She had never smoked. She had two pet cats and a dog. Her mother had a history of obesity, OSA, and eczema. Her father had diabetes and eczema.
The patient’s history prior to the recent few months sheds little light on the cause of her current symptoms. While it is possible that her current symptoms are related to the worsening of a process that had been present for many years which mimicked asthma, this seems implausible given the long period of time between her last asthma exacerbation and her present symptoms. Similarly, while tonsillar and adenoidal hypertrophy can be associated with infiltrative diseases (such as lymphoma), this is less common than the usual (and normal) disproportionate increase in size of the adenoids compared to other airway structures during growth in children.
She was admitted to the hospital. On initial examination, her temperature was 37.4°C, heart rate 125 beats per minute, blood pressure 143/69 mm Hg, respiratory rate 48 breaths per minute, and oxygen saturation 86% breathing ambient air. Her BMI was 58 kg/m2. Her exam demonstrated increased work of breathing with accessory muscle use, and decreased breath sounds at the bases. There were no wheezes or crackles. Cardiovascular, abdominal, and skin exams were normal except for tachycardia. At rest, later in the hospitalization, her oxygen saturation was 97% breathing ambient air and heart rate 110 bpm. After two minutes of walking, her oxygen saturation was 77% and heart rate 132 bpm. Two minutes after resting, her oxygen saturation increased to 91%.
Her white blood cell count was 11.9 x 10 9 /L (67% neutrophils, 24.2% lymphocytes, 6% monocytes, and 2% eosinophils), hemoglobin 11.2 g/dL, and platelet count 278,000/mm 3 . Her complete metabolic panel was normal. The C-reactive protein (CRP) was 24 mg/L (normal range, < 4.9) and erythrocyte sedimentation rate (ESR) 103 mm/hour (normal range, 0-32). A venous blood gas (VBG) showed a pH of 7.42 and pCO2 39. An EKG demonstrated sinus tachycardia.
The combination of the patient’s tachypnea, hypoxemia, respiratory distress, and obesity is striking. Her lack of adventitious lung sounds is surprising given her CT findings, but the sensitivity of chest auscultation may be limited in obese patients. Her laboratory findings help narrow the diagnostic frame: she has mild anemia and leukocytosis along with significant inflammation. The normal CO2 concentration on VBG is concerning given the degree of her tachypnea and reflects significant alveolar hypoventilation.
This marked inflammation with diffuse lung findings again raises the possibility of an inflammatory or, less likely, infectious disorder. Sjogren’s syndrome, systemic lupus erythematosus (SLE), and juvenile dermatomyositis can present in young women with interstitial lung disease. She does have exposure to pets and hypersensitivity pneumonitis can worsen rapidly with continued exposure. Another possibility is that she has an underlying immunodeficiency such as common variable immunodeficiency, although a history of recurrent infections such as pneumonia, bacteremia, or sinusitis is lacking.
An echocardiogram should be performed. In addition, laboratory evaluation for the aforementioned autoimmune causes of interstitial lung disease, immunoglobulin levels, pulmonary function testing (if available as an inpatient), and potentially a bronchoscopy with bronchoalveolar lavage (BAL), and biopsy should be pursued. The BAL and biopsy would be helpful in evaluating for infection and interstitial lung disease in an expeditious manner.
A chest CT without contrast was done and compared to the scan from two months prior. New diffuse, ill-defined centrilobular ground-glass opacities were evident throughout the lung fields; dilation of the main pulmonary artery was unchanged, and previously seen ground-glass opacities had resolved. There were patchy areas of air-trapping and mosaic attenuation in the lower lobes (Figure 2).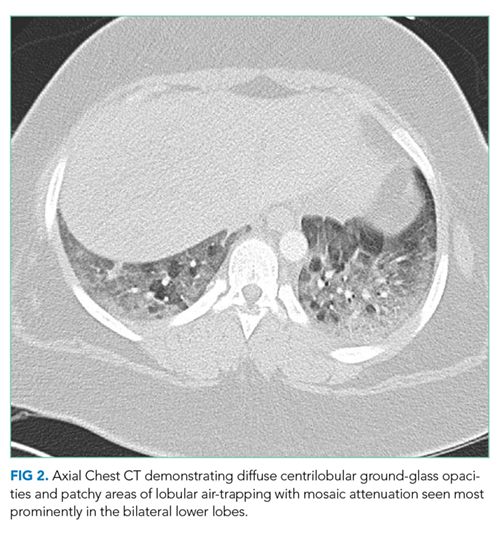
Transthoracic echocardiogram demonstrated a right ventricular systolic pressure of 58 mm Hg with flattened intraventricular septum during systole. Left and right ventricular systolic function were normal. The left ventricular diastolic function was normal. Pulmonary function testing demonstrated a FEV1/FVC ratio of 100 (112% predicted), FVC 1.07 L (35 % predicted) and FEV1 1.07 L (39% predicted), and total lung capacity was 2.7L (56% predicted) (Figure 3). Single-breath carbon monoxide uptake in the lung was not interpretable based on 2017 European Respiratory Society (ERS)/American Thoracic Society (ATS) technical standards.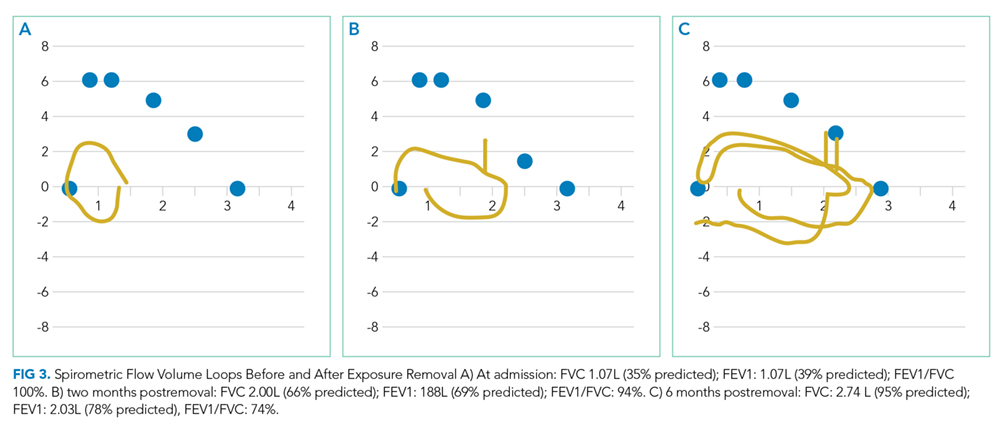
This information is helpful in classifying whether this patient’s primary condition is cardiac or pulmonary in nature. Her normal left ventricular systolic and diastolic function make a cardiac etiology for her pulmonary hypertension less likely. Further, the combination of pulmonary hypertension, a restrictive pattern on pulmonary function testing, and findings consistent with interstitial lung disease on cross-sectional imaging all suggest a primary pulmonary etiology rather than a cardiac, infectious, or thromboembolic condition. While chronic thromboembolic hypertension can result in nonspecific mosaic attenuation, it typically would not cause centrilobular ground-glass opacities nor restrictive lung disease. Thus, it seems most likely that this patient has a progressive pulmonary process resulting in hypoxia, pulmonary hypertension, centrilobular opacities, and lower-lobe mosaic attenuation. Considerations for this process can be broadly categorized as one of the childhood interstitial lung disease (chILD). While this differential diagnosis is broad, strong consideration should be given to hypersensitivity pneumonitis, chronic aspiration, sarcoidosis, and Sjogren’s syndrome. An intriguing possibility is that the patient’s “response to azithromycin” two months prior was due to the avoidance of an inhaled antigen while she was in the hospital; a detailed environmental history should be explored. The normal polysomnography after tonsilloadenoidectomy makes it unlikely that OSA is a major contributor to her current presentation. However, since the surgery was seven years ago, and her BMI is presently 58 kg/m2 she remains at risk for OSA and obesity-hypoventilation syndrome. Polysomnography should be done after her acute symptoms improve.
She was started on 5 mm Hg of continuous positive airway pressure (CPAP) at night after a sleep study on room air demonstrated severe OSA with a respiratory disturbance index of 13 events per hour. Antinuclear antibodies (ANA), anti-neutrophil cytoplasmic antibody (ANCA), anti-Jo-1 antibody, anti-RNP antibody, anti-Smith antibody, anti-Ro/SSA and anti-La/SSB antibody were negative as was the histoplasmin antibody. Serum angiotensin-converting enzyme (ACE) level was normal. Mycoplasma IgM and IgG were negative. IgE was 529 kU/L (normal range, <114).
This evaluation reduces the likelihood the patient has Sjogren’s syndrome, SLE, dermatomyositis, or ANCA-associated pulmonary disease. While many patients with dermatomyositis may have negative serologic evaluations, other findings usually present such as rash and myositis are lacking. The negative ANCA evaluation makes granulomatosis with polyangiitis and microscopic polyangiitis very unlikely given the high sensitivity of the ANCA assay for these conditions. ANCA assays are less sensitive for eosinophilic granulomatosis with polyangiitis (EGPA), but the lack of eosinophilia significantly decreases the likelihood of EGPA. ACE levels have relatively poor operating characteristics in the evaluation of sarcoidosis; however, sarcoidosis seems unlikely in this case, especially as patients with sarcoidosis tend to have low or normal IgE levels. Patients with asthma can have elevated IgE levels. However, very elevated IgE levels are more common in other conditions, including allergic bronchopulmonary aspergillosis (ABPA) and the Hyper-IgE syndrome. The latter manifests with recurrent infections and eczema, and is inherited in an autosomal dominant manner. However, both the Hyper-IgE syndrome and ABPA have much higher IgE levels than seen in this case. Allergen-specific IgE testing (including for antibodies to Aspergillus) should be sent. It seems that an interstitial lung disease is present; the waxing and waning pattern and clinical presentation, along with the lack of other systemic findings, make hypersensitivity pneumonitis most likely.
The family lived in an apartment building. Her symptoms started when the family’s neighbor recently moved his outdoor pigeon coop into his basement. The patient often smelled the pigeons and noted feathers coming through the holes in the wall.
One of the key diagnostic features of hypersensitivity pneumonitis (HP) is the history of exposure to a potential offending antigen—in this case likely bird feathers—along with worsening upon reexposure to that antigen. HP is primarily a clinical diagnosis, and testing for serum precipitants has limited value, given the high false negative rate and the frequent lack of clinical symptoms accompanying positive testing. Bronchoalveolar lavage fluid may reveal lymphocytosis and reduced CD4:CD8 ratio. Crackles are commonly heard on examination, but in this case were likely not auscultated due to her obese habitus. The most important treatment is withdrawal of the offending antigen. Limited data suggest that corticosteroid therapy may be helpful in certain HP cases, including subacute, chronic and severe cases as well as patients with hypoxemia, significant imaging findings, and those with significant abnormalities on pulmonary function testing (PFT).
A hypersensitivity pneumonitis precipitins panel was sent with positive antibodies to M. faeni, T. Vulgaris, A. Fumigatus 1 and 6, A. Flavus, and pigeon serum. Her symptoms gradually improved within five days of oral prednisone (60 mg). She was discharged home without dyspnea and normal oxygen saturation while breathing ambient air. A repeat echocardiogram after nighttime CPAP for 1 week demonstrated a right ventricular systolic pressure of 17 mm Hg consistent with improved pulmonary hypertension.
Three weeks later, she returned to clinic for follow up. She had re-experienced dyspnea, cough, and wheezing, which improved when she was outdoors. She was afebrile, tachypneic, tachycardic, and her oxygen saturation was 92% on ambient air.
Her steroid-responsive interstitial lung disease and rapid improvement upon avoidance of the offending antigen is consistent with HP. The positive serum precipitins assay lends further credence to the diagnosis of HP, although serologic analysis with such antibody assays is limited by false positives and false negatives; further, individuals exposed to pigeons often have antibodies present without evidence of HP. History taking at this visit should ask specifically about further pigeon exposure: were the pigeons removed from the home completely, were heating-cooling filters changed, carpets cleaned, and bedding laundered? An in-home evaluation may be helpful before conducting further diagnostic testing.
She was admitted for oxygen therapy and a bronchoscopy, which showed mucosal friability and cobblestoning, suggesting inflammation. BAL revealed a normal CD4:CD8 ratio of 3; BAL cultures were sterile. Her shortness of breath significantly improved following a prolonged course of systemic steroids and removal from the triggering environment. PFTs improved with a FEV1/FVC ratio of 94 (105% predicted), FVC of 2.00 L (66% predicted), FEV1 of 1.88L (69% predicted) (Figure 3B). Her presenting symptoms of persistent cough and progressive dyspnea on exertion, characteristic CT, sterile BAL cultures, positive serum precipitants against pigeon serum, and resolution of her symptoms with withdrawal of the offending antigen were diagnostic of hypersensitivity pneumonitis due to pigeon exposure, also known as bird fancier’s disease.
COMMENTARY
The patient’s original presentation of dyspnea, tachypnea, and hypoxia is commonly associated with pediatric pneumonia and asthma exacerbations.1 However, an alternative diagnosis was suggested by the lack of wheezing, absence of fever, and recurrent presentations with progressive symptoms.
Hypersensitivity pneumonitis (HP) represents an exaggerated T-cell meditated immune response to inhalation of an offending antigen that results in a restrictive ventilatory defect and interstitial infiltrates.2 Bird pneumonitis (also known as bird fancier’s disease) is a frequent cause of HP, accounting for approximately 65-70% of cases.3 HP, however, only manifests in a small number of subjects exposed to culprit antigens, suggesting an underlying genetic susceptibility.4 Prevalence estimates vary depending on bird species, county, climate, and other possible factors.
There are no standard criteria for the diagnosis of HP, though a combination of findings is suggestive. A recent prospective multicenter study created a scoring system for HP based on factors associated with the disease to aid in accurate diagnosis. The most relevant criteria included antigen exposure, recurrent symptoms noted within 4-8 hours after antigen exposure, weight loss, presence of specific IgG antibodies to avian antigens, and inspiratory crackles on exam. Using this rule, the probability that our patient has HP based on clinical characteristics was 93% with an area under the receiver operating curve of 0.93 (96% confidence interval: 0.90-0.95)5. Chest imaging (high resolution CT) often consists of a mosaic pattern of air trapping, as seen in this patient in combination with ground-glass opacities6. Bronchoalveolar lavage (BAL) is sensitive in detecting lung inflammation in a patient with suspected HP. On BAL, a lymphocytic alveolitis can be seen, but absence of this finding does not exclude HP.5,7,8 Pulmonary function tests (PFTs) may be normal in acute HP. When abnormal, PFTs may reveal a restrictive pattern and reduction in carbon monoxide diffusing capacity.7 However, BAL and PFT results are neither specific nor diagnostic of HP; it is important to consider results in the context of the clinical picture.
The respiratory response to inhalation of the avian antigen has traditionally been classified as acute, subacute, or chronic.9 The acute response occurs within hours of exposure to the offending agent and usually resolves within 24 hours after antigen withdrawal. The subacute presentation involves cough and dyspnea over several days to weeks, and can progress to chronic and permanent lung damage if unrecognized and untreated. In chronic presentations, lung abnormalities may persist despite antigen avoidance and pharmacologic interventions.4,10 The patient’s symptoms occurred over a six-month period which coincided with pigeon exposure and resolved during each hospitalization with steroid treatment and removal from the offending agent. Her presentation was consistent with a subacute time course of HP.
The dilated pulmonary artery, elevated right systolic ventricular pressure, and normal right ventricular function in our patient suggested pulmonary hypertension of chronic duration. Her risk factors for pulmonary hypertension included asthma, sleep apnea, possible obesity-hypoventilation syndrome, and HP-associated interstitial lung disease.11
The most important intervention in HP is avoidance of the causative antigen. Medical therapy without removal of antigen is inadequate. Systemic corticosteroids can help ameliorate acute symptoms though dosing and duration remains unclear. For chronic patients unresponsive to steroid therapy, lung transplantation can be considered.4
The key to diagnosis of HP in this patient—and to minimizing repeat testing upon the patient’s recrudescence of symptoms—was the clinician’s consideration that the major impetus for the patient’s improvement in the hospital was removal from the offending antigen in her home environment. As in this case, taking time to delve deeply into a patient’s environment—even by descending the basement stairs—may lead to the diagnosis.
LEARNING POINTS
- Consider hypersensitivity pneumonitis (HP) in patients with recurrent respiratory distress, offending exposure, and resolution of symptoms with removal of culprit antigen.
- The most important treatment of HP is removal of offending antigen; systemic and/or inhaled corticosteroids are indicated until the full resolution of respiratory symptoms.
- Prognosis is dependent on early diagnosis and removal of offending exposures.
- Failure to treat HP might result in end-stage lung disease from pulmonary fibrosis secondary to long-term inflammation.
Disclosures
Dr. Manesh is supported by the Jeremiah A. Barondess Fellowship in the Clinical Transaction of the New York Academy of Medicine, in collaboration with the Accreditation Council for Graduate Medical Education (ACGME). The authors declare no conflicts of interests.
1. Ebell MH. Clinical diagnosis of pneumonia in children. Am Fam Physician. 2010;82(2):192-193. PubMed
2. Cormier Y, Lacasse Y. Hypersensitivity pneumonitis and organic dust toxic syndrome. In: Malo J-L, Chan-Yeung M, Bernstein DI, eds. Asthma in the Workplace. Vol 32. Boca Raton, FL: Fourth Informa Healthcare; 2013:392-405.
3. Chan AL, Juarez MM, Leslie KO, Ismail HA, Albertson TE. Bird fancier’s lung: a state-of-the-art review. Clin Rev Allergy Immunol. 2012;43(1-2):69-83. doi: 10.1007/s12016-011-8282-y. PubMed
4. Camarena A, Juárez A, Mejía M, et al. Major histocompatibility complex and tumor necrosis factor-α polymorphisms in pigeon breeder’s disease. Am J Respir Crit Care Med. 2001;163(7):1528-1533. https:/doi.org/10.1164/ajrccm.163.7.2004023. PubMed
5. Lacasse Y, Selman M, Costabel U, et al. Clinical diagnosis of hypersensitivity pneumonitis. Am J Respir Crit Care Med. 2003;168(8):952-958. doi: 10.1164/rccm.200301-137OC. PubMed
6. Glazer CS, Rose CS, Lynch DA. Clinical and radiologic manifestations of hypersensitivity pneumonitis. J Thorac Imaging. 2002;17(4):261-272. PubMed
7. Selman M, Pardo A, King TE Jr. Hypersensitivity pneumonitis: insights in diagnosis and pathobiology. Am J Respir Crit Care Med. 2012;186(4):314-324. doi: 10.1164/rccm.201203-0513CI. PubMed
8. Calillad DM, Vergnon, JM, Madroszyk A, et al. Bronchoalveolar lavage in hypersensitivity pneumonitis: a series of 139 patients. Inflamm Allergy Drug Targets. 2012;11(1):15-19. doi: 10.2174/187152812798889330. PubMed
9. Richerson HB, Bernstein IL, Fink JN, et al. Guidelines for the clinical evaluation of hypersensitivity pneumonitis. Report of the Subcommittee on Hypersensitivity Pneumonitis. J Allergy Clin Immunol. 1989;84(5 Pt 2):839-844. doi: 10.1016/0091-6749(89)90349-7. PubMed
10. Zacharisen MC, Schlueter DP, Kurup VP, Fink JN. The long-term outcome in acute, subacute, and chronic forms of pigeon breeder’s disease hypersensitivity pneumonitis. Ann Allergy Asthma Immunol. 2002;88(2):175-182. doi: 10.1016/S1081-1206(10)61993-X. PubMed
11. Raymond TE, Khabbaza JE, Yadav R, Tonelli AR. Significance of main pulmonary artery dilation on imaging studies. Ann Am Thorac Soc. 2014;11(10):1623-1632. doi: 10.1513/AnnalsATS.201406-253PP. PubMed
A 14-year-old girl with a history of asthma presented to the Emergency Department (ED) with three months of persistent, nonproductive cough, and progressive shortness of breath. She reported fatigue, chest tightness, orthopnea, and dyspnea with exertion. She denied fever, rhinorrhea, congestion, hemoptysis, or paroxysmal nocturnal dyspnea.
Her age and past medical history of asthma are incongruent with her new symptoms, as asthma is typified by intermittent exacerbations, not progressive symptoms. Thus, another process, in addition to asthma, is most likely present; it is also important to question the accuracy of previous diagnoses in light of new information. Her symptoms may signify an underlying cardiopulmonary process, such as infiltrative diseases (eg, lymphoma or sarcoidosis), atypical infections, genetic conditions (eg, variant cystic fibrosis), autoimmune conditions, or cardiomyopathy. A detailed symptom history, family history, and careful physical examination will help expand and then refine the differential diagnosis. At this stage, typical infections are less likely.
She had presented two months prior with nonproductive cough and dyspnea. At that presentation, her temperature was 36.3°C, heart rate 110 beats per minute, blood pressure 119/63 mm Hg, respiratory rate 43 breaths per minute, and oxygen saturation 86% while breathing ambient air. A chest CT with contrast demonstrated diffuse patchy multifocal ground-glass opacities in the bilateral lungs as well as a mixture of atelectasis and lobular emphysema in the dependent lobes bilaterally (Figure 1). Her main pulmonary artery was dilated at 3.6 cm (mean of 2.42 cm with SD 0.22). She was diagnosed with atypical pneumonia. She was administered azithromycin, weaned off oxygen, and discharged after a seven-day hospitalization.
Two months prior, she had marked tachypnea, tachycardia, and hypoxemia, and imaging revealed diffuse ground-glass opacities. The differential diagnosis for this constellation of symptoms is extensive and includes many conditions that have an inflammatory component, such as atypical pneumonia caused by Mycoplasma or Chlamydia pneumoniae or a common respiratory virus such as rhinovirus or human metapneumovirus. However, two findings make an acute pneumonia unlikely to be the sole cause of her symptoms: underlying emphysema and an enlarged pulmonary artery. Emphysema is an uncommon finding in children and can be related to congenital or acquired causes; congenital lobar emphysema most often presents earlier in life and is focal, not diffuse. Alpha-1-anti-trypin deficiency and mutations in connective tissue genes such as those encoding for elastin and fibrillin can lead to pulmonary disease. While not diagnostic of pulmonary hypertension, her dilated pulmonary artery, coupled with her history, makes pulmonary hypertension a strong possibility. While her pulmonary hypertension is most likely secondary to chronic lung disease based on the emphysematous changes on CT, it could still be related to a cardiac etiology.
The patient had a history of seasonal allergies and well-controlled asthma. She was hospitalized at age six for an asthma exacerbation associated with a respiratory infection. She was discharged with an albuterol inhaler, but seldom used it. Her parents denied any regular coughing during the day or night. She was morbidly obese. Her tonsils and adenoids were removed to treat obstructive sleep apnea (OSA) at age seven, and a subsequent polysomnography was normal. Her medications included intranasal fluticasone propionate and oral iron supplementation. She had no known allergies or recent travels. She had never smoked. She had two pet cats and a dog. Her mother had a history of obesity, OSA, and eczema. Her father had diabetes and eczema.
The patient’s history prior to the recent few months sheds little light on the cause of her current symptoms. While it is possible that her current symptoms are related to the worsening of a process that had been present for many years which mimicked asthma, this seems implausible given the long period of time between her last asthma exacerbation and her present symptoms. Similarly, while tonsillar and adenoidal hypertrophy can be associated with infiltrative diseases (such as lymphoma), this is less common than the usual (and normal) disproportionate increase in size of the adenoids compared to other airway structures during growth in children.
She was admitted to the hospital. On initial examination, her temperature was 37.4°C, heart rate 125 beats per minute, blood pressure 143/69 mm Hg, respiratory rate 48 breaths per minute, and oxygen saturation 86% breathing ambient air. Her BMI was 58 kg/m2. Her exam demonstrated increased work of breathing with accessory muscle use, and decreased breath sounds at the bases. There were no wheezes or crackles. Cardiovascular, abdominal, and skin exams were normal except for tachycardia. At rest, later in the hospitalization, her oxygen saturation was 97% breathing ambient air and heart rate 110 bpm. After two minutes of walking, her oxygen saturation was 77% and heart rate 132 bpm. Two minutes after resting, her oxygen saturation increased to 91%.
Her white blood cell count was 11.9 x 10 9 /L (67% neutrophils, 24.2% lymphocytes, 6% monocytes, and 2% eosinophils), hemoglobin 11.2 g/dL, and platelet count 278,000/mm 3 . Her complete metabolic panel was normal. The C-reactive protein (CRP) was 24 mg/L (normal range, < 4.9) and erythrocyte sedimentation rate (ESR) 103 mm/hour (normal range, 0-32). A venous blood gas (VBG) showed a pH of 7.42 and pCO2 39. An EKG demonstrated sinus tachycardia.
The combination of the patient’s tachypnea, hypoxemia, respiratory distress, and obesity is striking. Her lack of adventitious lung sounds is surprising given her CT findings, but the sensitivity of chest auscultation may be limited in obese patients. Her laboratory findings help narrow the diagnostic frame: she has mild anemia and leukocytosis along with significant inflammation. The normal CO2 concentration on VBG is concerning given the degree of her tachypnea and reflects significant alveolar hypoventilation.
This marked inflammation with diffuse lung findings again raises the possibility of an inflammatory or, less likely, infectious disorder. Sjogren’s syndrome, systemic lupus erythematosus (SLE), and juvenile dermatomyositis can present in young women with interstitial lung disease. She does have exposure to pets and hypersensitivity pneumonitis can worsen rapidly with continued exposure. Another possibility is that she has an underlying immunodeficiency such as common variable immunodeficiency, although a history of recurrent infections such as pneumonia, bacteremia, or sinusitis is lacking.
An echocardiogram should be performed. In addition, laboratory evaluation for the aforementioned autoimmune causes of interstitial lung disease, immunoglobulin levels, pulmonary function testing (if available as an inpatient), and potentially a bronchoscopy with bronchoalveolar lavage (BAL), and biopsy should be pursued. The BAL and biopsy would be helpful in evaluating for infection and interstitial lung disease in an expeditious manner.
A chest CT without contrast was done and compared to the scan from two months prior. New diffuse, ill-defined centrilobular ground-glass opacities were evident throughout the lung fields; dilation of the main pulmonary artery was unchanged, and previously seen ground-glass opacities had resolved. There were patchy areas of air-trapping and mosaic attenuation in the lower lobes (Figure 2).
Transthoracic echocardiogram demonstrated a right ventricular systolic pressure of 58 mm Hg with flattened intraventricular septum during systole. Left and right ventricular systolic function were normal. The left ventricular diastolic function was normal. Pulmonary function testing demonstrated a FEV1/FVC ratio of 100 (112% predicted), FVC 1.07 L (35 % predicted) and FEV1 1.07 L (39% predicted), and total lung capacity was 2.7L (56% predicted) (Figure 3). Single-breath carbon monoxide uptake in the lung was not interpretable based on 2017 European Respiratory Society (ERS)/American Thoracic Society (ATS) technical standards.
This information is helpful in classifying whether this patient’s primary condition is cardiac or pulmonary in nature. Her normal left ventricular systolic and diastolic function make a cardiac etiology for her pulmonary hypertension less likely. Further, the combination of pulmonary hypertension, a restrictive pattern on pulmonary function testing, and findings consistent with interstitial lung disease on cross-sectional imaging all suggest a primary pulmonary etiology rather than a cardiac, infectious, or thromboembolic condition. While chronic thromboembolic hypertension can result in nonspecific mosaic attenuation, it typically would not cause centrilobular ground-glass opacities nor restrictive lung disease. Thus, it seems most likely that this patient has a progressive pulmonary process resulting in hypoxia, pulmonary hypertension, centrilobular opacities, and lower-lobe mosaic attenuation. Considerations for this process can be broadly categorized as one of the childhood interstitial lung disease (chILD). While this differential diagnosis is broad, strong consideration should be given to hypersensitivity pneumonitis, chronic aspiration, sarcoidosis, and Sjogren’s syndrome. An intriguing possibility is that the patient’s “response to azithromycin” two months prior was due to the avoidance of an inhaled antigen while she was in the hospital; a detailed environmental history should be explored. The normal polysomnography after tonsilloadenoidectomy makes it unlikely that OSA is a major contributor to her current presentation. However, since the surgery was seven years ago, and her BMI is presently 58 kg/m2 she remains at risk for OSA and obesity-hypoventilation syndrome. Polysomnography should be done after her acute symptoms improve.
She was started on 5 mm Hg of continuous positive airway pressure (CPAP) at night after a sleep study on room air demonstrated severe OSA with a respiratory disturbance index of 13 events per hour. Antinuclear antibodies (ANA), anti-neutrophil cytoplasmic antibody (ANCA), anti-Jo-1 antibody, anti-RNP antibody, anti-Smith antibody, anti-Ro/SSA and anti-La/SSB antibody were negative as was the histoplasmin antibody. Serum angiotensin-converting enzyme (ACE) level was normal. Mycoplasma IgM and IgG were negative. IgE was 529 kU/L (normal range, <114).
This evaluation reduces the likelihood the patient has Sjogren’s syndrome, SLE, dermatomyositis, or ANCA-associated pulmonary disease. While many patients with dermatomyositis may have negative serologic evaluations, other findings usually present such as rash and myositis are lacking. The negative ANCA evaluation makes granulomatosis with polyangiitis and microscopic polyangiitis very unlikely given the high sensitivity of the ANCA assay for these conditions. ANCA assays are less sensitive for eosinophilic granulomatosis with polyangiitis (EGPA), but the lack of eosinophilia significantly decreases the likelihood of EGPA. ACE levels have relatively poor operating characteristics in the evaluation of sarcoidosis; however, sarcoidosis seems unlikely in this case, especially as patients with sarcoidosis tend to have low or normal IgE levels. Patients with asthma can have elevated IgE levels. However, very elevated IgE levels are more common in other conditions, including allergic bronchopulmonary aspergillosis (ABPA) and the Hyper-IgE syndrome. The latter manifests with recurrent infections and eczema, and is inherited in an autosomal dominant manner. However, both the Hyper-IgE syndrome and ABPA have much higher IgE levels than seen in this case. Allergen-specific IgE testing (including for antibodies to Aspergillus) should be sent. It seems that an interstitial lung disease is present; the waxing and waning pattern and clinical presentation, along with the lack of other systemic findings, make hypersensitivity pneumonitis most likely.
The family lived in an apartment building. Her symptoms started when the family’s neighbor recently moved his outdoor pigeon coop into his basement. The patient often smelled the pigeons and noted feathers coming through the holes in the wall.
One of the key diagnostic features of hypersensitivity pneumonitis (HP) is the history of exposure to a potential offending antigen—in this case likely bird feathers—along with worsening upon reexposure to that antigen. HP is primarily a clinical diagnosis, and testing for serum precipitants has limited value, given the high false negative rate and the frequent lack of clinical symptoms accompanying positive testing. Bronchoalveolar lavage fluid may reveal lymphocytosis and reduced CD4:CD8 ratio. Crackles are commonly heard on examination, but in this case were likely not auscultated due to her obese habitus. The most important treatment is withdrawal of the offending antigen. Limited data suggest that corticosteroid therapy may be helpful in certain HP cases, including subacute, chronic and severe cases as well as patients with hypoxemia, significant imaging findings, and those with significant abnormalities on pulmonary function testing (PFT).
A hypersensitivity pneumonitis precipitins panel was sent with positive antibodies to M. faeni, T. Vulgaris, A. Fumigatus 1 and 6, A. Flavus, and pigeon serum. Her symptoms gradually improved within five days of oral prednisone (60 mg). She was discharged home without dyspnea and normal oxygen saturation while breathing ambient air. A repeat echocardiogram after nighttime CPAP for 1 week demonstrated a right ventricular systolic pressure of 17 mm Hg consistent with improved pulmonary hypertension.
Three weeks later, she returned to clinic for follow up. She had re-experienced dyspnea, cough, and wheezing, which improved when she was outdoors. She was afebrile, tachypneic, tachycardic, and her oxygen saturation was 92% on ambient air.
Her steroid-responsive interstitial lung disease and rapid improvement upon avoidance of the offending antigen is consistent with HP. The positive serum precipitins assay lends further credence to the diagnosis of HP, although serologic analysis with such antibody assays is limited by false positives and false negatives; further, individuals exposed to pigeons often have antibodies present without evidence of HP. History taking at this visit should ask specifically about further pigeon exposure: were the pigeons removed from the home completely, were heating-cooling filters changed, carpets cleaned, and bedding laundered? An in-home evaluation may be helpful before conducting further diagnostic testing.
She was admitted for oxygen therapy and a bronchoscopy, which showed mucosal friability and cobblestoning, suggesting inflammation. BAL revealed a normal CD4:CD8 ratio of 3; BAL cultures were sterile. Her shortness of breath significantly improved following a prolonged course of systemic steroids and removal from the triggering environment. PFTs improved with a FEV1/FVC ratio of 94 (105% predicted), FVC of 2.00 L (66% predicted), FEV1 of 1.88L (69% predicted) (Figure 3B). Her presenting symptoms of persistent cough and progressive dyspnea on exertion, characteristic CT, sterile BAL cultures, positive serum precipitants against pigeon serum, and resolution of her symptoms with withdrawal of the offending antigen were diagnostic of hypersensitivity pneumonitis due to pigeon exposure, also known as bird fancier’s disease.
COMMENTARY
The patient’s original presentation of dyspnea, tachypnea, and hypoxia is commonly associated with pediatric pneumonia and asthma exacerbations.1 However, an alternative diagnosis was suggested by the lack of wheezing, absence of fever, and recurrent presentations with progressive symptoms.
Hypersensitivity pneumonitis (HP) represents an exaggerated T-cell meditated immune response to inhalation of an offending antigen that results in a restrictive ventilatory defect and interstitial infiltrates.2 Bird pneumonitis (also known as bird fancier’s disease) is a frequent cause of HP, accounting for approximately 65-70% of cases.3 HP, however, only manifests in a small number of subjects exposed to culprit antigens, suggesting an underlying genetic susceptibility.4 Prevalence estimates vary depending on bird species, county, climate, and other possible factors.
There are no standard criteria for the diagnosis of HP, though a combination of findings is suggestive. A recent prospective multicenter study created a scoring system for HP based on factors associated with the disease to aid in accurate diagnosis. The most relevant criteria included antigen exposure, recurrent symptoms noted within 4-8 hours after antigen exposure, weight loss, presence of specific IgG antibodies to avian antigens, and inspiratory crackles on exam. Using this rule, the probability that our patient has HP based on clinical characteristics was 93% with an area under the receiver operating curve of 0.93 (96% confidence interval: 0.90-0.95)5. Chest imaging (high resolution CT) often consists of a mosaic pattern of air trapping, as seen in this patient in combination with ground-glass opacities6. Bronchoalveolar lavage (BAL) is sensitive in detecting lung inflammation in a patient with suspected HP. On BAL, a lymphocytic alveolitis can be seen, but absence of this finding does not exclude HP.5,7,8 Pulmonary function tests (PFTs) may be normal in acute HP. When abnormal, PFTs may reveal a restrictive pattern and reduction in carbon monoxide diffusing capacity.7 However, BAL and PFT results are neither specific nor diagnostic of HP; it is important to consider results in the context of the clinical picture.
The respiratory response to inhalation of the avian antigen has traditionally been classified as acute, subacute, or chronic.9 The acute response occurs within hours of exposure to the offending agent and usually resolves within 24 hours after antigen withdrawal. The subacute presentation involves cough and dyspnea over several days to weeks, and can progress to chronic and permanent lung damage if unrecognized and untreated. In chronic presentations, lung abnormalities may persist despite antigen avoidance and pharmacologic interventions.4,10 The patient’s symptoms occurred over a six-month period which coincided with pigeon exposure and resolved during each hospitalization with steroid treatment and removal from the offending agent. Her presentation was consistent with a subacute time course of HP.
The dilated pulmonary artery, elevated right systolic ventricular pressure, and normal right ventricular function in our patient suggested pulmonary hypertension of chronic duration. Her risk factors for pulmonary hypertension included asthma, sleep apnea, possible obesity-hypoventilation syndrome, and HP-associated interstitial lung disease.11
The most important intervention in HP is avoidance of the causative antigen. Medical therapy without removal of antigen is inadequate. Systemic corticosteroids can help ameliorate acute symptoms though dosing and duration remains unclear. For chronic patients unresponsive to steroid therapy, lung transplantation can be considered.4
The key to diagnosis of HP in this patient—and to minimizing repeat testing upon the patient’s recrudescence of symptoms—was the clinician’s consideration that the major impetus for the patient’s improvement in the hospital was removal from the offending antigen in her home environment. As in this case, taking time to delve deeply into a patient’s environment—even by descending the basement stairs—may lead to the diagnosis.
LEARNING POINTS
- Consider hypersensitivity pneumonitis (HP) in patients with recurrent respiratory distress, offending exposure, and resolution of symptoms with removal of culprit antigen.
- The most important treatment of HP is removal of offending antigen; systemic and/or inhaled corticosteroids are indicated until the full resolution of respiratory symptoms.
- Prognosis is dependent on early diagnosis and removal of offending exposures.
- Failure to treat HP might result in end-stage lung disease from pulmonary fibrosis secondary to long-term inflammation.
Disclosures
Dr. Manesh is supported by the Jeremiah A. Barondess Fellowship in the Clinical Transaction of the New York Academy of Medicine, in collaboration with the Accreditation Council for Graduate Medical Education (ACGME). The authors declare no conflicts of interests.
1. Ebell MH. Clinical diagnosis of pneumonia in children. Am Fam Physician. 2010;82(2):192-193. PubMed
2. Cormier Y, Lacasse Y. Hypersensitivity pneumonitis and organic dust toxic syndrome. In: Malo J-L, Chan-Yeung M, Bernstein DI, eds. Asthma in the Workplace. Vol 32. Boca Raton, FL: Fourth Informa Healthcare; 2013:392-405.
3. Chan AL, Juarez MM, Leslie KO, Ismail HA, Albertson TE. Bird fancier’s lung: a state-of-the-art review. Clin Rev Allergy Immunol. 2012;43(1-2):69-83. doi: 10.1007/s12016-011-8282-y. PubMed
4. Camarena A, Juárez A, Mejía M, et al. Major histocompatibility complex and tumor necrosis factor-α polymorphisms in pigeon breeder’s disease. Am J Respir Crit Care Med. 2001;163(7):1528-1533. https:/doi.org/10.1164/ajrccm.163.7.2004023. PubMed
5. Lacasse Y, Selman M, Costabel U, et al. Clinical diagnosis of hypersensitivity pneumonitis. Am J Respir Crit Care Med. 2003;168(8):952-958. doi: 10.1164/rccm.200301-137OC. PubMed
6. Glazer CS, Rose CS, Lynch DA. Clinical and radiologic manifestations of hypersensitivity pneumonitis. J Thorac Imaging. 2002;17(4):261-272. PubMed
7. Selman M, Pardo A, King TE Jr. Hypersensitivity pneumonitis: insights in diagnosis and pathobiology. Am J Respir Crit Care Med. 2012;186(4):314-324. doi: 10.1164/rccm.201203-0513CI. PubMed
8. Calillad DM, Vergnon, JM, Madroszyk A, et al. Bronchoalveolar lavage in hypersensitivity pneumonitis: a series of 139 patients. Inflamm Allergy Drug Targets. 2012;11(1):15-19. doi: 10.2174/187152812798889330. PubMed
9. Richerson HB, Bernstein IL, Fink JN, et al. Guidelines for the clinical evaluation of hypersensitivity pneumonitis. Report of the Subcommittee on Hypersensitivity Pneumonitis. J Allergy Clin Immunol. 1989;84(5 Pt 2):839-844. doi: 10.1016/0091-6749(89)90349-7. PubMed
10. Zacharisen MC, Schlueter DP, Kurup VP, Fink JN. The long-term outcome in acute, subacute, and chronic forms of pigeon breeder’s disease hypersensitivity pneumonitis. Ann Allergy Asthma Immunol. 2002;88(2):175-182. doi: 10.1016/S1081-1206(10)61993-X. PubMed
11. Raymond TE, Khabbaza JE, Yadav R, Tonelli AR. Significance of main pulmonary artery dilation on imaging studies. Ann Am Thorac Soc. 2014;11(10):1623-1632. doi: 10.1513/AnnalsATS.201406-253PP. PubMed
© 2019 Society of Hospital Medicine
Random Drug Testing of Physicians: A Complex Issue Framed in 7 Questions
Should physicians be subject to random drug testing? It’s a controversial topic. One in 10 Americans suffer from a drug use disorder at some point in their lives.1 Although physicians engaging in drug diversion is very rare, we recognize, in the context of rising rates of opiate use, that drug misuse and addiction can involve physicians.2,3 When it occurs, addiction can drive behaviors that endanger both clinicians and patients. Media reports on drug diversion describe an anesthesiologist who died of overdose from diverted fentanyl and a surgical technician with HIV who used and replaced opioids in the operating room, resulting in thousands of patients needing to be tested for infection.4 Multiple outbreaks of hepatitis C involving more than a dozen hospitals in eight states were traced to a single health care provider diverting narcotics.5 An investigation of outbreaks at various medical centers in the United States over a 10-year period identified nearly 30,000 patients that were potentially exposed and more than 100 iatrogenic infections.6
The profession of medicine holds a special place in the esteem of the public, with healthcare providers being among the most trusted professions. Patients rely on us to keep them safe when they are at their most vulnerable. This trust is predicated on the belief that the profession of medicine will self-regulate. Drug diversion by clinicians is a violation of this trust.
Our hospital utilizes existing structures to address substance use disorder; such structures include regular education on recognizing impairment for the medical staff, an impaired clinician policy for suspicion of impairment, and a state physician health program that provides nonpunitive evaluation and treatment for substance use by clinicians. In response to the imperative to mitigate the potential for drug diversion, our health system undertook a number of additional initiatives. These initiatives, included inventory control and tracking of controlled substances, and random testing and trigger-based audits of returned medications to ensure the entire amount had been accounted for. As part of this system-wide initiative, UCHealth began random drug testing of employees in safety-sensitive positions (for whom impairment would represent the potential for harm to others). Medical staff are not employees of the health system and were not initially subject to testing. The key questions at the time included the following:
- Is our organization doing everything possible to prevent drug diversion?
- If nurses and other staff are subject to random drug testing, why would physicians be exempt?
The University of Colorado Hospital (UCH) is the academic medical center within UCHealth. The structure of the relationship between the hospital and its medical staff requires the question of drug testing for physicians to be addressed by the UCH Medical Board (Medical Executive Committee). Medical staff leadership and key opinion leaders were engaged in the process of considering random drug testing of the medical staff. In the process, medical staff leadership raised additional questions about the process of decision making:
- “How should this issue be handled in the context of physician autonomy?”
- “How do we assure the concerns of the medical staff are heard and addressed?”
The guiding principles considered by the medical staff leadership in the implementation of random drug testing included the following: (1) as a matter of medical professionalism, for random drug testing to be implemented, the medical staff must elect to submit to mandatory testing; (2) the random drug testing program must be designed to minimize harm; and (3) the process for random drug testing program design needs to engage front-line clinicians. This resulted in a series of communications, meetings, and outreach to groups within the medical staff.
From front-line medical staff members, we heard overwhelming consensus for the moral case to prevent patient harm resulting from drug diversion, our professional duty to address the issue, and the need to maintain public trust in the institution of medicine. At the same time, medical staff members often expressed skepticism regarding the efficacy of random drug testing as a tactic, concerns about operational implementation, and fears regarding the unintended consequences:
- How strong is the evidence that random drug testing prevents drug diversion?
- How can we be confident that false-positive tests will not cause innocent clinicians to be incorrectly accused of drug use?
The efficacy of random drug testing in preventing drug diversion is not settled. The discussion of how to proceed in the absence of well-designed studies on the tactic was robust. One common principle we heard from members of the medical staff was that our response be driven by an authentic organizational desire to reduce patient harm. They expressed that the process of testing needs to respect the boundaries between work and home life and to avoid the disruption of clinical responsibilities. Whether targeting testing to “higher risk” groups of clinicians is appropriate and whether or not alcohol and/or marijuana would be tested came up often.
Other concerns expressed also included the intrusion of the institution into the private medical conditions of the medical staff members, breach of confidentiality, or accessibility of the information obtained as a result of the program for unrelated legal proceedings. One of the most prominent fears expressed was the possible impact of false-positive tests on the clinicians’ careers.
Following the listening tour by the medical staff and hospital leadership and extensive discussions, the Medical Board voted to approve a policy to implement random drug testing. The deliberative process lasted for approximately eight months. We sought input from other healthcare systems, such as the Veterans Administration and Cleveland Clinic, that conduct random drug tests on employed physicians. A physician from Massachusetts General Hospital who led the 2004 implementation of random drug testing for anesthesiologists was invited to come to Colorado to give grand rounds about the experience in his department and answer questions about the implementation of random drug testing at a Medical Board meeting.7 The policy went into effect January 2017.
The design of the program sought to explicitly address the issues raised by the front-line clinicians. In the interest of equity, all specialties, including Radiology and Pathology, are subject to testing. Medical staff are selected for testing using a random number generator and retained in the random selection pool at all times, regardless of previous selection for testing. Consistent with the underlying objective of identifying drug diversion, testing is limited to drugs at higher risk for diversion (eg, amphetamine, barbiturate, benzodiazepine, butorphanol, cocaine metabolite, fentanyl, ketamine, meperidine, methadone, nalbuphine, opiates, oxycodone, and tramadol). Although alcohol and marijuana are substances of abuse, they are not substances of healthcare diversion and thus are excluded from random drug testing (although included in testing for impairment). Random drug testing is conducted only for medical staff who are onsite and providing clinical services. The individuals selected for random drug testing are notified by Employee Health, or their clinical supervisor, to present to Employee Health that day to provide a urine sample. The involvement of the clinical supervisor in specific departments and the flexibility in time of presentation was implemented to address the concerns of the medical staff regarding harm from the disruption of acute patient care.
To address the concern regarding false-positive tests, an external medical laboratory that performs testing compliant with Substance Abuse and Mental Health Services and governmental standards is used. Samples are split providing the ability to perform independent testing of two samples. The thresholds are set to minimize false-positive tests. Positive results are sent to an independent medical review officer who confidentially contacts the medical staff member to assess for valid prescriptions to explain the test results. Unexplained positive test results trigger the testing of the second half of the split sample.
To address issues of dignity, privacy, and confidentiality, Employee Health discretely oversees the urine collection. The test results are not part of the individual’s medical record. Only the coordinator for random drug testing in Human Resources compliance can access the test results, which are stored in a separate, secure database. The medical review officer shares no information about the medical staff members’ medical conditions. A positive drug assay attributable to a valid medical explanation is reported as a negative test.
Positive test results, which would be reported to the President of the Medical Staff, would trigger further investigation, potential Medical Board action consistent with medical staff bylaws, and reporting to licensing bodies as appropriate. We recognize that most addiction is not associated with diversion, and all individuals struggling with substance use need support. The medical staff and hospital leadership committed through this process to connecting medical staff members who are identified by random drug testing to help for substance use disorder, starting with the State Physician Health Program.
The Medical Executive Committees of all hospitals within UCHealth have also approved random drug testing of medical staff. We are not the first healthcare organization to tackle the potential for drug diversion by healthcare workers. To our knowledge, we are the largest health system to have nonemployed medical staff leadership vote for the entire medical staff to be subject to random drug testing. Along the journey, the approach of random drug testing for physicians was vigorously debated. In this regard, we proffer one final question:
- How would you have voted?
Disclosures
The authors have nothing to disclose.
1. Grant BF, Saha TD, Ruan WJ, et al. Epidemiology of DSM-5 drug use disorder: results from the National Epidemiologic Survey on Alcohol and Related Conditions-III. JAMA Psychiatry. 2016;73(1):39-47. doi: 10.1001/jamapsychiatry.2015.2132. PubMed
2. Oreskovich MR, Shanafelt T, Dyrbye LN, et al. The prevalence of substance use disorders in American physicians. Am J Addict. 2015;24(1):30-38. doi: 10.1111/ajad.12173. PubMed
3. Hughes PH, Brandenburg N, Baldwin DC Jr., et al. Prevalence of substance use among US physicians. JAMA. 1992;267(17):2333-2339. doi:10.1001/jama.1992.03480170059029. PubMed
4. Olinger D, Osher CN. Denver Post- Drug-addicted, dangerous and licensed for the operating room. https://www.denverpost.com/2016/04/23/drug-addicted-dangerous-and-licensed-for-the-operating-room/ Published April 23, 2016. Updated June 2, 2016. Accessed June 7, 2018.
5. Federal Bureau of Investigations. Press Release. Former Employee of Exeter Hospital Pleads Guilty to Charges Related to Multi-State Hepatitis C Outbreak. https://archives.fbi.gov/archives/boston/press-releases/2013/former-employee-of-exeter-hospital-pleads-guilty-to-charges-related-to-multi-state-hepatitis-c-outbreak. Accessed June 7, 2018.
6. Schaefer MK, Perz JF. Outbreaks of infections associated with drug diversion by US healthcare personnel. Mayo Clin Proc. 2014;89(7):878-887. doi: 10.1016/j.mayocp.2014.04.007. PubMed
7. Fitzsimons MG, Baker K, Malhotra R, Gottlieb A, Lowenstein E, Zapol WM. Reducing the incidence of substance use disorders in anesthesiology residents: 13 years of comprehensive urine drug screening. Anesthesiology. 2018;129:821-828. doi: 10.1097/ALN.0000000000002348. In press. PubMed
Should physicians be subject to random drug testing? It’s a controversial topic. One in 10 Americans suffer from a drug use disorder at some point in their lives.1 Although physicians engaging in drug diversion is very rare, we recognize, in the context of rising rates of opiate use, that drug misuse and addiction can involve physicians.2,3 When it occurs, addiction can drive behaviors that endanger both clinicians and patients. Media reports on drug diversion describe an anesthesiologist who died of overdose from diverted fentanyl and a surgical technician with HIV who used and replaced opioids in the operating room, resulting in thousands of patients needing to be tested for infection.4 Multiple outbreaks of hepatitis C involving more than a dozen hospitals in eight states were traced to a single health care provider diverting narcotics.5 An investigation of outbreaks at various medical centers in the United States over a 10-year period identified nearly 30,000 patients that were potentially exposed and more than 100 iatrogenic infections.6
The profession of medicine holds a special place in the esteem of the public, with healthcare providers being among the most trusted professions. Patients rely on us to keep them safe when they are at their most vulnerable. This trust is predicated on the belief that the profession of medicine will self-regulate. Drug diversion by clinicians is a violation of this trust.
Our hospital utilizes existing structures to address substance use disorder; such structures include regular education on recognizing impairment for the medical staff, an impaired clinician policy for suspicion of impairment, and a state physician health program that provides nonpunitive evaluation and treatment for substance use by clinicians. In response to the imperative to mitigate the potential for drug diversion, our health system undertook a number of additional initiatives. These initiatives, included inventory control and tracking of controlled substances, and random testing and trigger-based audits of returned medications to ensure the entire amount had been accounted for. As part of this system-wide initiative, UCHealth began random drug testing of employees in safety-sensitive positions (for whom impairment would represent the potential for harm to others). Medical staff are not employees of the health system and were not initially subject to testing. The key questions at the time included the following:
- Is our organization doing everything possible to prevent drug diversion?
- If nurses and other staff are subject to random drug testing, why would physicians be exempt?
The University of Colorado Hospital (UCH) is the academic medical center within UCHealth. The structure of the relationship between the hospital and its medical staff requires the question of drug testing for physicians to be addressed by the UCH Medical Board (Medical Executive Committee). Medical staff leadership and key opinion leaders were engaged in the process of considering random drug testing of the medical staff. In the process, medical staff leadership raised additional questions about the process of decision making:
- “How should this issue be handled in the context of physician autonomy?”
- “How do we assure the concerns of the medical staff are heard and addressed?”
The guiding principles considered by the medical staff leadership in the implementation of random drug testing included the following: (1) as a matter of medical professionalism, for random drug testing to be implemented, the medical staff must elect to submit to mandatory testing; (2) the random drug testing program must be designed to minimize harm; and (3) the process for random drug testing program design needs to engage front-line clinicians. This resulted in a series of communications, meetings, and outreach to groups within the medical staff.
From front-line medical staff members, we heard overwhelming consensus for the moral case to prevent patient harm resulting from drug diversion, our professional duty to address the issue, and the need to maintain public trust in the institution of medicine. At the same time, medical staff members often expressed skepticism regarding the efficacy of random drug testing as a tactic, concerns about operational implementation, and fears regarding the unintended consequences:
- How strong is the evidence that random drug testing prevents drug diversion?
- How can we be confident that false-positive tests will not cause innocent clinicians to be incorrectly accused of drug use?
The efficacy of random drug testing in preventing drug diversion is not settled. The discussion of how to proceed in the absence of well-designed studies on the tactic was robust. One common principle we heard from members of the medical staff was that our response be driven by an authentic organizational desire to reduce patient harm. They expressed that the process of testing needs to respect the boundaries between work and home life and to avoid the disruption of clinical responsibilities. Whether targeting testing to “higher risk” groups of clinicians is appropriate and whether or not alcohol and/or marijuana would be tested came up often.
Other concerns expressed also included the intrusion of the institution into the private medical conditions of the medical staff members, breach of confidentiality, or accessibility of the information obtained as a result of the program for unrelated legal proceedings. One of the most prominent fears expressed was the possible impact of false-positive tests on the clinicians’ careers.
Following the listening tour by the medical staff and hospital leadership and extensive discussions, the Medical Board voted to approve a policy to implement random drug testing. The deliberative process lasted for approximately eight months. We sought input from other healthcare systems, such as the Veterans Administration and Cleveland Clinic, that conduct random drug tests on employed physicians. A physician from Massachusetts General Hospital who led the 2004 implementation of random drug testing for anesthesiologists was invited to come to Colorado to give grand rounds about the experience in his department and answer questions about the implementation of random drug testing at a Medical Board meeting.7 The policy went into effect January 2017.
The design of the program sought to explicitly address the issues raised by the front-line clinicians. In the interest of equity, all specialties, including Radiology and Pathology, are subject to testing. Medical staff are selected for testing using a random number generator and retained in the random selection pool at all times, regardless of previous selection for testing. Consistent with the underlying objective of identifying drug diversion, testing is limited to drugs at higher risk for diversion (eg, amphetamine, barbiturate, benzodiazepine, butorphanol, cocaine metabolite, fentanyl, ketamine, meperidine, methadone, nalbuphine, opiates, oxycodone, and tramadol). Although alcohol and marijuana are substances of abuse, they are not substances of healthcare diversion and thus are excluded from random drug testing (although included in testing for impairment). Random drug testing is conducted only for medical staff who are onsite and providing clinical services. The individuals selected for random drug testing are notified by Employee Health, or their clinical supervisor, to present to Employee Health that day to provide a urine sample. The involvement of the clinical supervisor in specific departments and the flexibility in time of presentation was implemented to address the concerns of the medical staff regarding harm from the disruption of acute patient care.
To address the concern regarding false-positive tests, an external medical laboratory that performs testing compliant with Substance Abuse and Mental Health Services and governmental standards is used. Samples are split providing the ability to perform independent testing of two samples. The thresholds are set to minimize false-positive tests. Positive results are sent to an independent medical review officer who confidentially contacts the medical staff member to assess for valid prescriptions to explain the test results. Unexplained positive test results trigger the testing of the second half of the split sample.
To address issues of dignity, privacy, and confidentiality, Employee Health discretely oversees the urine collection. The test results are not part of the individual’s medical record. Only the coordinator for random drug testing in Human Resources compliance can access the test results, which are stored in a separate, secure database. The medical review officer shares no information about the medical staff members’ medical conditions. A positive drug assay attributable to a valid medical explanation is reported as a negative test.
Positive test results, which would be reported to the President of the Medical Staff, would trigger further investigation, potential Medical Board action consistent with medical staff bylaws, and reporting to licensing bodies as appropriate. We recognize that most addiction is not associated with diversion, and all individuals struggling with substance use need support. The medical staff and hospital leadership committed through this process to connecting medical staff members who are identified by random drug testing to help for substance use disorder, starting with the State Physician Health Program.
The Medical Executive Committees of all hospitals within UCHealth have also approved random drug testing of medical staff. We are not the first healthcare organization to tackle the potential for drug diversion by healthcare workers. To our knowledge, we are the largest health system to have nonemployed medical staff leadership vote for the entire medical staff to be subject to random drug testing. Along the journey, the approach of random drug testing for physicians was vigorously debated. In this regard, we proffer one final question:
- How would you have voted?
Disclosures
The authors have nothing to disclose.
1. Grant BF, Saha TD, Ruan WJ, et al. Epidemiology of DSM-5 drug use disorder: results from the National Epidemiologic Survey on Alcohol and Related Conditions-III. JAMA Psychiatry. 2016;73(1):39-47. doi: 10.1001/jamapsychiatry.2015.2132. PubMed
2. Oreskovich MR, Shanafelt T, Dyrbye LN, et al. The prevalence of substance use disorders in American physicians. Am J Addict. 2015;24(1):30-38. doi: 10.1111/ajad.12173. PubMed
3. Hughes PH, Brandenburg N, Baldwin DC Jr., et al. Prevalence of substance use among US physicians. JAMA. 1992;267(17):2333-2339. doi:10.1001/jama.1992.03480170059029. PubMed
4. Olinger D, Osher CN. Denver Post- Drug-addicted, dangerous and licensed for the operating room. https://www.denverpost.com/2016/04/23/drug-addicted-dangerous-and-licensed-for-the-operating-room/ Published April 23, 2016. Updated June 2, 2016. Accessed June 7, 2018.
5. Federal Bureau of Investigations. Press Release. Former Employee of Exeter Hospital Pleads Guilty to Charges Related to Multi-State Hepatitis C Outbreak. https://archives.fbi.gov/archives/boston/press-releases/2013/former-employee-of-exeter-hospital-pleads-guilty-to-charges-related-to-multi-state-hepatitis-c-outbreak. Accessed June 7, 2018.
6. Schaefer MK, Perz JF. Outbreaks of infections associated with drug diversion by US healthcare personnel. Mayo Clin Proc. 2014;89(7):878-887. doi: 10.1016/j.mayocp.2014.04.007. PubMed
7. Fitzsimons MG, Baker K, Malhotra R, Gottlieb A, Lowenstein E, Zapol WM. Reducing the incidence of substance use disorders in anesthesiology residents: 13 years of comprehensive urine drug screening. Anesthesiology. 2018;129:821-828. doi: 10.1097/ALN.0000000000002348. In press. PubMed
© 2019 Society of Hospital Medicine
Clinical Operations Research: A New Frontier for Inquiry in Academic Health Systems
Patient throughput in healthcare systems is increasingly important to policymakers, hospital leaders, clinicians, and patients alike. In 1983, Congress passed legislation instructing the Centers for Medicare and Medicaid Services (CMS) to implement the “prospective payment system,” which sets reimbursement for CMS hospitalizations to a fixed rate, regardless of the length of stay (LOS). Policy changes such as this coupled with increased market consolidation (ie, fewer hospitals for more patients) and increased patient acuity have created significant challenges for hospital leaders to manage patient throughput and reduce or maintain LOS.1 Additionally, emergency department (ED) overcrowding and intensive care unit (ICU) capacity strain studies have demonstrated associations with adverse patient outcomes and quality of care.2-5 Finally, and perhaps most importantly, the impact of these forces on clinicians and patients has compromised the patient-clinician relationship and patient experience. As patient throughput is important to multiple stakeholders, novel approaches to understanding and mitigating bottlenecks are imperative.
The article by Mishra and colleagues in this month’s issue of the Journal of Hospital Medicine (JHM) describes one such novel methodology to evaluate patient throughput at a major academic hospital.6 The authors utilized process mapping, time and motion study, and hospital data to simulate four discrete future states for internal medicine patients that were under consideration for implementation at their institution: (1) localizing housestaff teams and patients to specific wards; (2) adding an additional 26-bed ward; (3) adding an additional hospitalist team; and (4) adding an additional ward and team and allowing for four additional patient admissions per day. Each of these approaches improved certain metrics with the tradeoff of worsening other metrics. Interestingly, geographic localization of housestaff teams and patients alone (Future State 1) resulted in decreased rounding time and patient dispersion but increased LOS and ED boarding time. Adding an additional ward (Future State 2) had the opposite effect (ie, decreased LOS and ED boarding time but increased rounding time and patient dispersion). Adding an additional hospitalist team (Future State 3) did not change LOS or ED boarding time but reduced patient dispersion and team census. Finally, adding both a ward and hospitalist team (Future State 4) reduced LOS and ED boarding time but increased rounding time and patient dispersion. These results provide a compelling case for modeling changes in clinical operations to weigh the risks and benefits of each approach with hospital priorities prior to implementation of one strategy versus another.
This study is an important step forward in bringing a rigorous scientific approach to clinical operations. If every academic center, or potentially every hospital, were to implement the approach described in this study, the potential for improvement in patient outcomes, quality metrics, and cost reduction that have been the intents of policymakers for over 30 years could be dramatic. But even if this approach were implemented (or possibly as a result of implementation), additional aspects of hospital operations might be uncovered given the infancy of this critical field. Indeed, we can think of at least five additional factors and approaches to consider as next steps to move this field forward. First, as the authors noted, multiple additional simulation inputs could be considered, including multidisciplinary workflow (eg, housestaff, hospitalists, nurses, clinical pharmacists, respiratory therapists, social workers, case managers, physical and occupational therapists, speech and language pathologists, etc.) and allowing for patients to transfer wards and teams during their hospitalizations. Second, qualitative investigation regarding clinician burnout, multidisciplinary cohesiveness, and patient satisfaction are crucial to implementation success. Third, repeat time and motion studies would aid in assessing for changes in time spent with patients and for educational purposes under the new care models. Fourth, medicine wards and teams do not operate in isolation within a hospital. It would be important to evaluate the impact of such changes on other wards and services, as all hospital wards and services are interdependent. And finally, determining costs associated with these models is critical for hospital leadership, resource allocation, implementation, and sustainability. For example, Future State 4 would increase admissions by 1,080 per year, but would that offset the cost of opening a new ward and hiring additional clinicians?
In addition, the authors feature the profoundly important concept of “geographic localization.” This construct has been investigated primarily among critically ill patients. Geographic dispersion has been shown to be associated with adverse clinical outcomes and quality metrics.7 Although this has begun to be studied among ward patients,8 the authors take this a step further by modeling future states incorporating geographic localization. Future State 4 resulted in the best overall outcomes but increased rounding time and patient dispersion, although these differences were not statistically significant. This piques our curiosity about the possibility of a fifth future state: adding geographic localization to Future State 4. Adding a new ward and new clinician team might provide a
Indeed, these results raise much broader and interesting questions surrounding ward capacity strain, that is, when patients’ demand for clinical resources exceeds availability.9 At our institution, we conducted a study to define the construct of ward capacity strain and demonstrated that among patients admitted to wards from EDs and ICUs in three University of Pennsylvania Health System hospitals, selected measures of patient volume, staff workload, and overall acuity were associated with longer ED and ICU boarding times. These same factors accounted for decreased patient throughput to varying, but sometimes large, degrees.10 We subsequently used this same definition of ward capacity strain to evaluate the association with 30-day hospital readmissions. We demonstrated that ward capacity strain metrics improved prediction of 30-day hospital readmission risk in nearly one out of three hospital wards, with medications administered, hospital discharges, and census being three of the five strongest predictors of 30-day hospital readmissions.11 These findings from our own institution further underscore the importance of the work by Mishra et al. and suggest future directions that could combine different measures of hospital throughput and patient outcomes into a more data-driven process for optimizing hospital resources, supporting the efforts of clinicians, and providing high-quality patient care.
This study is a breakthrough in the scientific rigor of hospital operations. It will lay the groundwork for a multitude of subsequent questions and studies that will move clinical operations into evidence-based practices. We find this work exciting and inspiring. We look forward to additional work from Mishra et al. and look forward to applying similar approaches to clinical operations at our institution.
Disclosures
The authors have nothing to disclose.
Funding
Dr. Kohn was supported by NIH/NHLBI F32 HL139107-01.
1. Centers for Medicare & Medicaid Services Prospective Payment Systems. https://www.cms.gov/Medicare/Medicare-Fee-for-Service-Payment/ProspMedicareFeeSvcPmtGen/index.html. Accessed September 26, 2018.
2. Rose L, Scales DC, Atzema C, et al. Emergency department length of stay for critical care admissions. A population-based study. Ann Am Thorac Soc. 2016;13(8):1324-1332. doi: 10.1513/AnnalsATS.201511-773OC. PubMed
3. Pines JM, Localio AR, Hollander JE, et al. The impact of emergency department crowding measures on time to antibiotics for patients with community-acquired pneumonia. Ann Emerg Med. 2007;50(5):510-516. doi: 10.1016/j.annemergmed.2007.07.021. PubMed
4. Gabler NB, Ratcliffe SJ, Wagner J, et al. Mortality among patients admitted to strained intensive care units. Am J Respir Crit Care Med. 2013;188(7):800-806. doi: 10.1164/rccm.201304-0622OC. PubMed
5. Weissman GE, Gabler NB, Brown SE, Halpern SD. Intensive care unit capacity strain and adherence to prophylaxis guidelines. J Crit Care. 2015;30(6):1303-1309. doi: 10.1016/j.jcrc.2015.08.015. PubMed
6. Mishra V, Tu S-P, Heim J, Masters H, Hall L. Predicting the future: using simulation modeling to forecast patient flow on general medicine units. J Hosp Med. 2018. In Press. PubMed
7. Vishnupriya K, Falade O, Workneh A, et al. Does sepsis treatment differ between primary and overflow intensive care units? J Hosp Med. 2012;7(8):600-605. doi: 10.1002/jhm.1955. PubMed
8. Bai AD, Srivastava S, Tomlinson GA, Smith CA, Bell CM, Gill SS. Mortality of hospitalised internal medicine patients bedspaced to non-internal medicine inpatient units: retrospective cohort study. BMJ Qual Saf. 2018;27(1):11-20. PubMed
9. Halpern SD. ICU capacity strain and the quality and allocation of critical care. Curr Opin Crit Care. 2011;17(6):648-657. doi: 10.1097/MCC.0b013e32834c7a53. PubMed
10. Kohn R, Bayes B, Ratcliffe SJ, Halpern SD, Kerlin MP. Ward capacity strain: Defining a new construct based on ED boarding time and ICU transfers. Am J Respir Crit Care Med. 2017;195:A7085.
11. Kohn R, Harhay MO, Bayes B, et al. Ward capacity strain: A novel predictor of 30-day hospital readmissions. J Gen Intern Med. 2018. doi: 10.1007/s11606-018-4564-x. PubMed
Patient throughput in healthcare systems is increasingly important to policymakers, hospital leaders, clinicians, and patients alike. In 1983, Congress passed legislation instructing the Centers for Medicare and Medicaid Services (CMS) to implement the “prospective payment system,” which sets reimbursement for CMS hospitalizations to a fixed rate, regardless of the length of stay (LOS). Policy changes such as this coupled with increased market consolidation (ie, fewer hospitals for more patients) and increased patient acuity have created significant challenges for hospital leaders to manage patient throughput and reduce or maintain LOS.1 Additionally, emergency department (ED) overcrowding and intensive care unit (ICU) capacity strain studies have demonstrated associations with adverse patient outcomes and quality of care.2-5 Finally, and perhaps most importantly, the impact of these forces on clinicians and patients has compromised the patient-clinician relationship and patient experience. As patient throughput is important to multiple stakeholders, novel approaches to understanding and mitigating bottlenecks are imperative.
The article by Mishra and colleagues in this month’s issue of the Journal of Hospital Medicine (JHM) describes one such novel methodology to evaluate patient throughput at a major academic hospital.6 The authors utilized process mapping, time and motion study, and hospital data to simulate four discrete future states for internal medicine patients that were under consideration for implementation at their institution: (1) localizing housestaff teams and patients to specific wards; (2) adding an additional 26-bed ward; (3) adding an additional hospitalist team; and (4) adding an additional ward and team and allowing for four additional patient admissions per day. Each of these approaches improved certain metrics with the tradeoff of worsening other metrics. Interestingly, geographic localization of housestaff teams and patients alone (Future State 1) resulted in decreased rounding time and patient dispersion but increased LOS and ED boarding time. Adding an additional ward (Future State 2) had the opposite effect (ie, decreased LOS and ED boarding time but increased rounding time and patient dispersion). Adding an additional hospitalist team (Future State 3) did not change LOS or ED boarding time but reduced patient dispersion and team census. Finally, adding both a ward and hospitalist team (Future State 4) reduced LOS and ED boarding time but increased rounding time and patient dispersion. These results provide a compelling case for modeling changes in clinical operations to weigh the risks and benefits of each approach with hospital priorities prior to implementation of one strategy versus another.
This study is an important step forward in bringing a rigorous scientific approach to clinical operations. If every academic center, or potentially every hospital, were to implement the approach described in this study, the potential for improvement in patient outcomes, quality metrics, and cost reduction that have been the intents of policymakers for over 30 years could be dramatic. But even if this approach were implemented (or possibly as a result of implementation), additional aspects of hospital operations might be uncovered given the infancy of this critical field. Indeed, we can think of at least five additional factors and approaches to consider as next steps to move this field forward. First, as the authors noted, multiple additional simulation inputs could be considered, including multidisciplinary workflow (eg, housestaff, hospitalists, nurses, clinical pharmacists, respiratory therapists, social workers, case managers, physical and occupational therapists, speech and language pathologists, etc.) and allowing for patients to transfer wards and teams during their hospitalizations. Second, qualitative investigation regarding clinician burnout, multidisciplinary cohesiveness, and patient satisfaction are crucial to implementation success. Third, repeat time and motion studies would aid in assessing for changes in time spent with patients and for educational purposes under the new care models. Fourth, medicine wards and teams do not operate in isolation within a hospital. It would be important to evaluate the impact of such changes on other wards and services, as all hospital wards and services are interdependent. And finally, determining costs associated with these models is critical for hospital leadership, resource allocation, implementation, and sustainability. For example, Future State 4 would increase admissions by 1,080 per year, but would that offset the cost of opening a new ward and hiring additional clinicians?
In addition, the authors feature the profoundly important concept of “geographic localization.” This construct has been investigated primarily among critically ill patients. Geographic dispersion has been shown to be associated with adverse clinical outcomes and quality metrics.7 Although this has begun to be studied among ward patients,8 the authors take this a step further by modeling future states incorporating geographic localization. Future State 4 resulted in the best overall outcomes but increased rounding time and patient dispersion, although these differences were not statistically significant. This piques our curiosity about the possibility of a fifth future state: adding geographic localization to Future State 4. Adding a new ward and new clinician team might provide a
Indeed, these results raise much broader and interesting questions surrounding ward capacity strain, that is, when patients’ demand for clinical resources exceeds availability.9 At our institution, we conducted a study to define the construct of ward capacity strain and demonstrated that among patients admitted to wards from EDs and ICUs in three University of Pennsylvania Health System hospitals, selected measures of patient volume, staff workload, and overall acuity were associated with longer ED and ICU boarding times. These same factors accounted for decreased patient throughput to varying, but sometimes large, degrees.10 We subsequently used this same definition of ward capacity strain to evaluate the association with 30-day hospital readmissions. We demonstrated that ward capacity strain metrics improved prediction of 30-day hospital readmission risk in nearly one out of three hospital wards, with medications administered, hospital discharges, and census being three of the five strongest predictors of 30-day hospital readmissions.11 These findings from our own institution further underscore the importance of the work by Mishra et al. and suggest future directions that could combine different measures of hospital throughput and patient outcomes into a more data-driven process for optimizing hospital resources, supporting the efforts of clinicians, and providing high-quality patient care.
This study is a breakthrough in the scientific rigor of hospital operations. It will lay the groundwork for a multitude of subsequent questions and studies that will move clinical operations into evidence-based practices. We find this work exciting and inspiring. We look forward to additional work from Mishra et al. and look forward to applying similar approaches to clinical operations at our institution.
Disclosures
The authors have nothing to disclose.
Funding
Dr. Kohn was supported by NIH/NHLBI F32 HL139107-01.
1. Centers for Medicare & Medicaid Services Prospective Payment Systems. https://www.cms.gov/Medicare/Medicare-Fee-for-Service-Payment/ProspMedicareFeeSvcPmtGen/index.html. Accessed September 26, 2018.
2. Rose L, Scales DC, Atzema C, et al. Emergency department length of stay for critical care admissions. A population-based study. Ann Am Thorac Soc. 2016;13(8):1324-1332. doi: 10.1513/AnnalsATS.201511-773OC. PubMed
3. Pines JM, Localio AR, Hollander JE, et al. The impact of emergency department crowding measures on time to antibiotics for patients with community-acquired pneumonia. Ann Emerg Med. 2007;50(5):510-516. doi: 10.1016/j.annemergmed.2007.07.021. PubMed
4. Gabler NB, Ratcliffe SJ, Wagner J, et al. Mortality among patients admitted to strained intensive care units. Am J Respir Crit Care Med. 2013;188(7):800-806. doi: 10.1164/rccm.201304-0622OC. PubMed
5. Weissman GE, Gabler NB, Brown SE, Halpern SD. Intensive care unit capacity strain and adherence to prophylaxis guidelines. J Crit Care. 2015;30(6):1303-1309. doi: 10.1016/j.jcrc.2015.08.015. PubMed
6. Mishra V, Tu S-P, Heim J, Masters H, Hall L. Predicting the future: using simulation modeling to forecast patient flow on general medicine units. J Hosp Med. 2018. In Press. PubMed
7. Vishnupriya K, Falade O, Workneh A, et al. Does sepsis treatment differ between primary and overflow intensive care units? J Hosp Med. 2012;7(8):600-605. doi: 10.1002/jhm.1955. PubMed
8. Bai AD, Srivastava S, Tomlinson GA, Smith CA, Bell CM, Gill SS. Mortality of hospitalised internal medicine patients bedspaced to non-internal medicine inpatient units: retrospective cohort study. BMJ Qual Saf. 2018;27(1):11-20. PubMed
9. Halpern SD. ICU capacity strain and the quality and allocation of critical care. Curr Opin Crit Care. 2011;17(6):648-657. doi: 10.1097/MCC.0b013e32834c7a53. PubMed
10. Kohn R, Bayes B, Ratcliffe SJ, Halpern SD, Kerlin MP. Ward capacity strain: Defining a new construct based on ED boarding time and ICU transfers. Am J Respir Crit Care Med. 2017;195:A7085.
11. Kohn R, Harhay MO, Bayes B, et al. Ward capacity strain: A novel predictor of 30-day hospital readmissions. J Gen Intern Med. 2018. doi: 10.1007/s11606-018-4564-x. PubMed
© 2019 Society of Hospital Medicine
The Interplay between Financial Incentives, Institutional Culture, and Physician Behavior: An Incompletely Understood Relationship Worth Elucidating
The United States spends approximately 18% of its gross domestic product on healthcare, nearly double the average expenditure by other high-income countries.1 This increased financial investment does not consistently correlate with better care, as quality outcomes in the US rank well below many developed nations that spend far less on clinical care on a per capita basis.1,2 These troubling and unsustainable spending trends have compelled national and regional policymakers, health system leaders, and researchers to search for ways to curb healthcare spending and improve healthcare value.
Approximately 32% of overall healthcare spending in the US occurs in hospitals,3 and there is broad acknowledgment that inpatient care can be delivered more cost effectively.4 In recent years, numerous policy interventions – including Medicare’s hospital readmission reductions program, hospital-acquired condition reductions program, hospital value-based purchasing program, and the Bundled Payment for Care Improvement program – have been implemented in an effort to improve the quality and costs of inpatient care.4,5
These policies attempt to increase care value by utilizing innovative reimbursement techniques designed to hold clinical systems financially accountable for outcomes and spending. They are designed to move our system away from the traditional fee-for-service paradigm, which encourages overuse and has been identified as a major driver of bloated healthcare costs in the US.6,7 The success of certain national payment reform pilots, such as the Comprehensive Care for Joint Replacement Model, indicate that payment models which hold clinicians and systems accountable hold promise for both reducing costs and improving outcomes.8
However, to influence clinical outcomes and costs, these national payment reforms must prompt local changes in how care is delivered and financed. Understanding systems- and clinician-level factors that enable the delivery of higher value care is, therefore, paramount for effectively translating national policies into local improvements in care value. Among hospitalists and hospital-based clinicians, institutional and clinical cultures represent an important lever for influencing physician practice patterns and, by extension, the quality and costs of care. Hospital and departmental cultures have been shown to influence physician behaviors profoundly in ways that improve quality and value, primarily via top-down initiatives focused on education and improving awareness. Examples of cultural success stories include efforts to reduce unnecessary utilization of diagnostic testing,9 improve adoption of hand-washing techniques on wards,10 and translate education about high-value care into sustained increases in the delivery of high-value clinical services.11
In “The Association of Hospitals Productivity Payments and High-Value Care Culture,” Gupta et al. present the results of a study examining associations between how hospitals compensate their hospitalists – specifically the provision of performance-based incentives – and the strength of a hospital’s high-value care culture.12 The authors administered the High-Value Care Culture SurveyTM (HVCCS), a validated survey instrument designed to assess the degree to which a hospital’s culture promotes the delivery of high-value care, to 255 hospitalists across 12 hospitals, including safety-net, community, and university-based hospitals. The hospitals’ predominant physician compensation models were grouped into three categories: salary model (no performance-based bonus), salary model with a productivity adjustment (ie, a bonus based on clinical volumes), and a salary model with a quality/value adjustment (ie, a bonus for delivering higher value care). The authors found that hospitalists who were salaried but also received productivity adjustments reported significantly lower mean HVCCS scores than salaried hospitalists who did not receive bonuses or adjustments. Compared with salaried hospitalists, hospitalists receiving compensation via salary plus value-based adjustments were nonsignificantly more likely to have higher HVCCS scores.
How are we to interpret these results? While we must be exceedingly careful about presuming causal mechanisms underlying these associations, they are nonetheless intriguing and should prompt further discussion about the relationship between payment incentives, provider behavior, and organizational culture. One potential explanation for these findings is that hospitals that rely on high clinical volumes to drive their financial performance may use productivity bonuses as a way to align hospitalists’ incentives with those of their institution, thereby promoting volume at the expense of value.
Behavioral economics theory provides an alternative lens through which to interpret the work of Gupta et al. The relationship between incentives and nonfinancial sources of personal motivation remain an important consideration in financial incentive design.13 A basic concept in behavioral economics is that there are two fundamental types of motivation of human behavior: extrinsic motivation, where people are motivated to act by the prospect of material rewards or punishments, and intrinsic motivation, a source of motivation that leads people to behave in ways that do not produce an obvious personal or material reward.13 Substantial evidence indicates that external rewards can have counterproductive effects on an individual’s intrinsic motivation, leading to a “crowding-out” effect that decreases the individual’s internal drive. When the “crowding-out” effect occurs, behaviors may be motivated by a desire to follow the rules, rather than true intrinsic drive. This change in the underlying forces motivating behavior can have a negative impact on self-esteem and result in a perceived loss of professional autonomy.13,14 Perhaps more than any other professional group, healthcare professionals are fueled by intrinsic motivation and a yearning for professional autonomy. It is therefore plausible that doctors are particularly sensitive to, and disturbed by, the feeling that external rewards are “crowding out” this internal drive. Thus, the inverse association between productivity payments – volume-based rewards – and HVCCS scores may reflect this tension between intrinsic and extrinsic drives.
Of course, we need to interpret the authors’ findings cautiously in light of the cross-sectional study design and the potential for residual confounding. Indeed, the presence of an association between how hospitalists are compensated and their perceptions of the degree to which their institution’s culture promotes the delivery of high-value care does not prove that these two things are causally linked. Additionally, the small sample size limits the generalizability of these findings and efforts to draw robust conclusions from this work regarding the interplay between how a hospital pays its physicians, hospital culture, and the value of care delivered in this institution. Moreover, a more rigorous characterization of the nature of productivity payments compared with value-based performance payments and pure salaried wages would have been extremely useful to help interpret the likelihood that these payment models influenced the behavior of clinicians and perceptions of culture. In particular, how payment models define “productivity” and “quality” thresholds for achieving performance-based payments and the degree of control that physicians have on achieving them are critical determinants of the power of these incentives to influence clinician behavior and of clinicians’ perceptions of the degree to which their institution cultivates a high-value culture.14
Despite these limitations, this study raises a number of interesting hypotheses regarding the relationship between clinician payment models, incentive design, and clinical culture that warrant further investigation. For example, how do financial incentives designed to improve the value of inpatient care actually influence the practice patterns of hospitalists? Surprisingly little is known about this topic. Does the physician payment model design generally and implementation of targeted financial incentives for delivering higher value care in particular directly influence clinical culture? If so, how? Also, does the cultural effect actually undermine the goals of the financial incentive?
More broadly, systematic efforts to evaluate how clinical and hospital cultures impact the ability of financial incentives to motivate desired changes in clinicians’ behaviors will help healthcare leaders use financial incentives more effectively to motivate the delivery of higher quality, more cost-effective care. Increasing use and evaluation of different alternative payment models across hospitals nationwide represents an opportunity to characterize associations between different payment models and the delivery of high-quality, cost-effective care.15 Parallel efforts to characterize the clinical culture of these hospitals could help to better understand if and how hospital culture mediates this relationship. Moreover, because inpatient care is increasing and, in many hospitals, primarily provided by multidisciplinary teams, additional research is needed to understand how different payment models influence inpatient clinical team performance.
The connection between culture, financial incentives, and value-based care remains difficult to determine, but essential to clarify. Gupta et al. demonstrated that how a clinical system pays its physicians appears to be associated with physicians’ perceptions of how strongly the hospital’s culture emphasizes the delivery of high-value care. Work culture is a profound determinant of employee happiness, satisfaction, and productivity. The consistent delivery of high-value care is undoubtedly harder in clinical cultures that do not prize and support this end. Health system leaders focused on improving care value would be wise to pay close attention to their employees’ perceptions of their culture – and use these perceptions as one of several measures of their progress toward enabling their organization to deliver higher value care consistently.
Disclosures
Dr. Blumenthal is the Associate Chief Medical Officer of Devoted Health. Dr. Bergethon has nothing to disclose.
1. Papanicolas I, Woskie LR, Jha AK. Health care spending in the United States and other high-income countries. JAMA. 2018;319(10):1024-1039. doi: 10.1001/jama.2018.1150. PubMed
2. Fullman N, Yearwood J, Abay SM, et al. Measuring performance on the Healthcare Access and Quality Index for 195 countries and territories and selected subnational locations: a systematic analysis from the Global Burden of Disease Study 2016. Lancet. 2018;391(10136):2236-2271. doi: 10.1016/S0140-6736(18)30994-2. PubMed
3. Hartman M, Martin AB, Espinosa N, Catlin A, National Health Expenditure Accounts Team. National health care spending in 2016: spending and enrollment growth slow after initial coverage expansions. Health Aff. 2017;37(1):150-160. doi: 10.1377/hlthaff.2017.1655. PubMed
4. Nussbaum S, McClellan M, Metlay G. Principles for a framework for alternative payment models. JAMA. 2018;319(7):653-654. doi: 10.1001/jama.2017.20226. PubMed
5. Morden NE, Colla CH, Sequist TD, Rosenthal MB. Choosing wisely- the politics and economics of labeling low-value services. N Engl J Med. 2014;370(7):589-592. doi: 10.1056/NEJMp1314965. PubMed
6. Laugesen MJ, Glied SA. Higher fees paid to US physicians drive higher spending for physician services compared to other countries. Health Aff. 2011;30(9):1647-1656. doi: 10.1377/hlthaff.2010.0204. PubMed
7. Korda H, Eldridge GN. Payment incentives and integrated care delivery: Levers for health system reform and cost containment. Inquiry. 2011;48(4):277-287. doi: 10.5034/inquiryjrnl_48.04.01. PubMed
8. Dummit LA, Kahvecioglu D, Marrufo G, et al. Association between hospital participation in a Medicare bundled payment initiative and payments and quality outcomes for lower extremity joint replacement episodes. JAMA. 2016;316(12):1267-1278. doi: 10.1001/jama.2016.12717. PubMed
9. Korenstein D, Husain S, Gennarelli R, White C, Masciale J, Roman B. Impact of clinical specialty on attitudes regarding overuse of inpatient laboratory testing. J Hosp Med. 2018;E1-E4. doi: 10.12788/jhm.2978. PubMed
10. Jain R, Kralovic SM, Evans ME, et al. Veterans Affairs initiative to prevent methicillin-resistant Staphylococcus aureus infections. N Engl J Med. 2011;364(15):1419-1430. doi: 10.1056/NEJMoa1007474. PubMed
11. Stammen LA, Stalmeijer RE, Paternotte E, et al. Training physicians to provide high-value, cost-conscious care a systematic review. JAMA. 2015;314(22):2384-2400. doi: 10.1001/jama.2015.16353. PubMed
12. Gupta R, Steers N, Moriates C, Ong M. Association between hospitalist productivity payments and high-value care culture [published online ahead of print October 31, 2018]. J Hosp Med. 2018. In press. doi: 10.12788/jhm.3084. PubMed
13. Marshall M, Harrison S. It’s about more than money: financial incentives and internal motivation. Qual Saf Health Care. 2005;14(1):4-5. doi: 10.1136/qshc.2004.013193. PubMed
14. Conrad DA. The theory of value-based payment incentives and their application to health care. Health Serv Res. 2015;50(Suppl 2):2057-2089. doi: 10.1111/1475-6773.12408. PubMed
15. Schwartz AL, Chernew ME, Landon BE, McWilliams JM. Changes in low-value services in year 1 of the medicare pioneer accountable care organization program. JAMA Intern Med. 2015;175(11):1815-1825. doi: 10.1001/jamainternmed.2016.2827. PubMed
The United States spends approximately 18% of its gross domestic product on healthcare, nearly double the average expenditure by other high-income countries.1 This increased financial investment does not consistently correlate with better care, as quality outcomes in the US rank well below many developed nations that spend far less on clinical care on a per capita basis.1,2 These troubling and unsustainable spending trends have compelled national and regional policymakers, health system leaders, and researchers to search for ways to curb healthcare spending and improve healthcare value.
Approximately 32% of overall healthcare spending in the US occurs in hospitals,3 and there is broad acknowledgment that inpatient care can be delivered more cost effectively.4 In recent years, numerous policy interventions – including Medicare’s hospital readmission reductions program, hospital-acquired condition reductions program, hospital value-based purchasing program, and the Bundled Payment for Care Improvement program – have been implemented in an effort to improve the quality and costs of inpatient care.4,5
These policies attempt to increase care value by utilizing innovative reimbursement techniques designed to hold clinical systems financially accountable for outcomes and spending. They are designed to move our system away from the traditional fee-for-service paradigm, which encourages overuse and has been identified as a major driver of bloated healthcare costs in the US.6,7 The success of certain national payment reform pilots, such as the Comprehensive Care for Joint Replacement Model, indicate that payment models which hold clinicians and systems accountable hold promise for both reducing costs and improving outcomes.8
However, to influence clinical outcomes and costs, these national payment reforms must prompt local changes in how care is delivered and financed. Understanding systems- and clinician-level factors that enable the delivery of higher value care is, therefore, paramount for effectively translating national policies into local improvements in care value. Among hospitalists and hospital-based clinicians, institutional and clinical cultures represent an important lever for influencing physician practice patterns and, by extension, the quality and costs of care. Hospital and departmental cultures have been shown to influence physician behaviors profoundly in ways that improve quality and value, primarily via top-down initiatives focused on education and improving awareness. Examples of cultural success stories include efforts to reduce unnecessary utilization of diagnostic testing,9 improve adoption of hand-washing techniques on wards,10 and translate education about high-value care into sustained increases in the delivery of high-value clinical services.11
In “The Association of Hospitals Productivity Payments and High-Value Care Culture,” Gupta et al. present the results of a study examining associations between how hospitals compensate their hospitalists – specifically the provision of performance-based incentives – and the strength of a hospital’s high-value care culture.12 The authors administered the High-Value Care Culture SurveyTM (HVCCS), a validated survey instrument designed to assess the degree to which a hospital’s culture promotes the delivery of high-value care, to 255 hospitalists across 12 hospitals, including safety-net, community, and university-based hospitals. The hospitals’ predominant physician compensation models were grouped into three categories: salary model (no performance-based bonus), salary model with a productivity adjustment (ie, a bonus based on clinical volumes), and a salary model with a quality/value adjustment (ie, a bonus for delivering higher value care). The authors found that hospitalists who were salaried but also received productivity adjustments reported significantly lower mean HVCCS scores than salaried hospitalists who did not receive bonuses or adjustments. Compared with salaried hospitalists, hospitalists receiving compensation via salary plus value-based adjustments were nonsignificantly more likely to have higher HVCCS scores.
How are we to interpret these results? While we must be exceedingly careful about presuming causal mechanisms underlying these associations, they are nonetheless intriguing and should prompt further discussion about the relationship between payment incentives, provider behavior, and organizational culture. One potential explanation for these findings is that hospitals that rely on high clinical volumes to drive their financial performance may use productivity bonuses as a way to align hospitalists’ incentives with those of their institution, thereby promoting volume at the expense of value.
Behavioral economics theory provides an alternative lens through which to interpret the work of Gupta et al. The relationship between incentives and nonfinancial sources of personal motivation remain an important consideration in financial incentive design.13 A basic concept in behavioral economics is that there are two fundamental types of motivation of human behavior: extrinsic motivation, where people are motivated to act by the prospect of material rewards or punishments, and intrinsic motivation, a source of motivation that leads people to behave in ways that do not produce an obvious personal or material reward.13 Substantial evidence indicates that external rewards can have counterproductive effects on an individual’s intrinsic motivation, leading to a “crowding-out” effect that decreases the individual’s internal drive. When the “crowding-out” effect occurs, behaviors may be motivated by a desire to follow the rules, rather than true intrinsic drive. This change in the underlying forces motivating behavior can have a negative impact on self-esteem and result in a perceived loss of professional autonomy.13,14 Perhaps more than any other professional group, healthcare professionals are fueled by intrinsic motivation and a yearning for professional autonomy. It is therefore plausible that doctors are particularly sensitive to, and disturbed by, the feeling that external rewards are “crowding out” this internal drive. Thus, the inverse association between productivity payments – volume-based rewards – and HVCCS scores may reflect this tension between intrinsic and extrinsic drives.
Of course, we need to interpret the authors’ findings cautiously in light of the cross-sectional study design and the potential for residual confounding. Indeed, the presence of an association between how hospitalists are compensated and their perceptions of the degree to which their institution’s culture promotes the delivery of high-value care does not prove that these two things are causally linked. Additionally, the small sample size limits the generalizability of these findings and efforts to draw robust conclusions from this work regarding the interplay between how a hospital pays its physicians, hospital culture, and the value of care delivered in this institution. Moreover, a more rigorous characterization of the nature of productivity payments compared with value-based performance payments and pure salaried wages would have been extremely useful to help interpret the likelihood that these payment models influenced the behavior of clinicians and perceptions of culture. In particular, how payment models define “productivity” and “quality” thresholds for achieving performance-based payments and the degree of control that physicians have on achieving them are critical determinants of the power of these incentives to influence clinician behavior and of clinicians’ perceptions of the degree to which their institution cultivates a high-value culture.14
Despite these limitations, this study raises a number of interesting hypotheses regarding the relationship between clinician payment models, incentive design, and clinical culture that warrant further investigation. For example, how do financial incentives designed to improve the value of inpatient care actually influence the practice patterns of hospitalists? Surprisingly little is known about this topic. Does the physician payment model design generally and implementation of targeted financial incentives for delivering higher value care in particular directly influence clinical culture? If so, how? Also, does the cultural effect actually undermine the goals of the financial incentive?
More broadly, systematic efforts to evaluate how clinical and hospital cultures impact the ability of financial incentives to motivate desired changes in clinicians’ behaviors will help healthcare leaders use financial incentives more effectively to motivate the delivery of higher quality, more cost-effective care. Increasing use and evaluation of different alternative payment models across hospitals nationwide represents an opportunity to characterize associations between different payment models and the delivery of high-quality, cost-effective care.15 Parallel efforts to characterize the clinical culture of these hospitals could help to better understand if and how hospital culture mediates this relationship. Moreover, because inpatient care is increasing and, in many hospitals, primarily provided by multidisciplinary teams, additional research is needed to understand how different payment models influence inpatient clinical team performance.
The connection between culture, financial incentives, and value-based care remains difficult to determine, but essential to clarify. Gupta et al. demonstrated that how a clinical system pays its physicians appears to be associated with physicians’ perceptions of how strongly the hospital’s culture emphasizes the delivery of high-value care. Work culture is a profound determinant of employee happiness, satisfaction, and productivity. The consistent delivery of high-value care is undoubtedly harder in clinical cultures that do not prize and support this end. Health system leaders focused on improving care value would be wise to pay close attention to their employees’ perceptions of their culture – and use these perceptions as one of several measures of their progress toward enabling their organization to deliver higher value care consistently.
Disclosures
Dr. Blumenthal is the Associate Chief Medical Officer of Devoted Health. Dr. Bergethon has nothing to disclose.
1. Papanicolas I, Woskie LR, Jha AK. Health care spending in the United States and other high-income countries. JAMA. 2018;319(10):1024-1039. doi: 10.1001/jama.2018.1150. PubMed
2. Fullman N, Yearwood J, Abay SM, et al. Measuring performance on the Healthcare Access and Quality Index for 195 countries and territories and selected subnational locations: a systematic analysis from the Global Burden of Disease Study 2016. Lancet. 2018;391(10136):2236-2271. doi: 10.1016/S0140-6736(18)30994-2. PubMed
3. Hartman M, Martin AB, Espinosa N, Catlin A, National Health Expenditure Accounts Team. National health care spending in 2016: spending and enrollment growth slow after initial coverage expansions. Health Aff. 2017;37(1):150-160. doi: 10.1377/hlthaff.2017.1655. PubMed
4. Nussbaum S, McClellan M, Metlay G. Principles for a framework for alternative payment models. JAMA. 2018;319(7):653-654. doi: 10.1001/jama.2017.20226. PubMed
5. Morden NE, Colla CH, Sequist TD, Rosenthal MB. Choosing wisely- the politics and economics of labeling low-value services. N Engl J Med. 2014;370(7):589-592. doi: 10.1056/NEJMp1314965. PubMed
6. Laugesen MJ, Glied SA. Higher fees paid to US physicians drive higher spending for physician services compared to other countries. Health Aff. 2011;30(9):1647-1656. doi: 10.1377/hlthaff.2010.0204. PubMed
7. Korda H, Eldridge GN. Payment incentives and integrated care delivery: Levers for health system reform and cost containment. Inquiry. 2011;48(4):277-287. doi: 10.5034/inquiryjrnl_48.04.01. PubMed
8. Dummit LA, Kahvecioglu D, Marrufo G, et al. Association between hospital participation in a Medicare bundled payment initiative and payments and quality outcomes for lower extremity joint replacement episodes. JAMA. 2016;316(12):1267-1278. doi: 10.1001/jama.2016.12717. PubMed
9. Korenstein D, Husain S, Gennarelli R, White C, Masciale J, Roman B. Impact of clinical specialty on attitudes regarding overuse of inpatient laboratory testing. J Hosp Med. 2018;E1-E4. doi: 10.12788/jhm.2978. PubMed
10. Jain R, Kralovic SM, Evans ME, et al. Veterans Affairs initiative to prevent methicillin-resistant Staphylococcus aureus infections. N Engl J Med. 2011;364(15):1419-1430. doi: 10.1056/NEJMoa1007474. PubMed
11. Stammen LA, Stalmeijer RE, Paternotte E, et al. Training physicians to provide high-value, cost-conscious care a systematic review. JAMA. 2015;314(22):2384-2400. doi: 10.1001/jama.2015.16353. PubMed
12. Gupta R, Steers N, Moriates C, Ong M. Association between hospitalist productivity payments and high-value care culture [published online ahead of print October 31, 2018]. J Hosp Med. 2018. In press. doi: 10.12788/jhm.3084. PubMed
13. Marshall M, Harrison S. It’s about more than money: financial incentives and internal motivation. Qual Saf Health Care. 2005;14(1):4-5. doi: 10.1136/qshc.2004.013193. PubMed
14. Conrad DA. The theory of value-based payment incentives and their application to health care. Health Serv Res. 2015;50(Suppl 2):2057-2089. doi: 10.1111/1475-6773.12408. PubMed
15. Schwartz AL, Chernew ME, Landon BE, McWilliams JM. Changes in low-value services in year 1 of the medicare pioneer accountable care organization program. JAMA Intern Med. 2015;175(11):1815-1825. doi: 10.1001/jamainternmed.2016.2827. PubMed
© 2019 Society of Hospital Medicine
Discharge by Noon: The Time Has Come for More Times to be the Right Time
Hospitalists have become well versed in campaigns championing safe, efficient, and timely discharges, as well as in the pragmatic challenges of achieving them. Successfully discharging a patient from the hospital requires synchronizing several elements; as a result, improvement efforts focus on promoting shared mental models and team identification of early discharges. The urgency for timely discharges, much like (and unlike1) hotel check-out times, becomes increasingly relevant when hospitals are functioning at or beyond full capacity. As inpatient medical care grows increasingly more specialized, promoting high-quality discharges theoretically allows for not only more beds, but also that the right bed is available for the right patient at the right time. In addition, financial realities in terms of reimbursement and the high cost of adding capacity imply that hospitals need to maximize throughput from the beds they already have. For these reasons, hospital administrators and operational leaders have focused on early discharges as a goal—and have often used discharge before noon (DCBN) as the metric to measure performance.
In this issue of the Journal of Hospital Medicine, Destino et al. reported that it is possible to achieve a higher percentage of early discharges, which allowed for decompression of post-anesthesia care and emergency areas without a measurable negative impact on patient or family satisfaction or length of stay (LOS).2 The improvement they report is remarkable. However, it will be important for them to report back, as quality improvement projects often revert to prior state unless the processes are reinforced and embedded in hospital culture. In addition, what goes unreported in Destino et al. are the unmeasured and unanticipated outcomes related to focusing on a single, laudable goal. This study and others have yet to confirm that systems have enough resiliency to improve discharge timeliness without diverting resources from other aspects of care.3 In other words, can inpatient teams do everything at the same time without sacrificing quality; ie, improve discharge timeliness, accept and admit new patients faster, respond to deteriorating patients, spend enough time with patients and families to meet their needs (and validated survey expectations), and in educational settings, meet the learning needs of trainees?4 This may prove to be true if implementation techniques are individualized to hospitals, services, and units and are incorporated into existing workflows, minimizing extraneous “asks” on already overtaxed providers. Evidence to support this would go a long way in engaging stakeholders to prioritize quality discharges.
In this issue, too, James, et al. ask the question “if DCBN is a good indicator of shorter LOS or is DCBN an arbitrary indicator.”5 The answer may be yes, no, both, maybe, and it depends. Certainly, no pathophysiological reasons exist for a certain time of day to be the “right” time for discharge. The key question for hospitalists and health systems leaders is whether setting time goals leads clinicians to delay discharges of medically and logistically ready patients in the afternoon or evening, particularly if the metric is linked to monetary performance incentives. This is also likely a matter of degrees, ie, set the DCBN goal at 80%-100% and gaming is much more likely; set the goal at 20%-30% and this might reflect a realistic range and be less likely to incentivize gaming. Notably, the hospital in the James study did not have a DCBN goal. It would be interesting to see what would happen in that hospital or another hospital before and after implementing a DCBN goal—and further assess a dose-response curve. Another approach would be to perform qualitative analysis of readiness for discharge via chart reviews and determine if patients could have left in the afternoon or evening but might have been delayed to buff up the performance on the DCBN metric.
James et al. additionally demonstrate differences for medical and surgical patients, underscoring that a DCBN goal is unlikely to yield the same results in different patient cohorts or settings. The authors note several workflow reasons for this variation, but other considerations are regularity of timelines for recovery being different for surgical patients, role of elective admissions scheduled in advance, and the potential use of conditional orders (ie, orders entered before dawn that nurses can activate as patients meet criteria).
Much as we have adopted cultural changes over the years to raise awareness regarding patient safety such as nosocomial infections and hand hygiene, an emphasis on high-quality discharges too needs to become integral to hospital practices to sustain performance and any associated metrics. As to what to measure? A validated “medical readiness to discharge” may be the gold standard but may be difficult to attain. Until then, carefully constructed approaches to prioritizing early discharges through proactive planning, shared mental models, interdisciplinary teamwork, and appropriate incentives to those who do it well could yield the results we want as hospitalists, as patients, and as families.
Disclosures
Dr. Kane and Dr. Fieldston have nothing to disclose.
1. Iantorno S, Fieldston E. Hospitals are not hotels: high-quality discharges occur around the clock. JAMA Pediatr. 2013;167(7):596-597. doi: 10.1001/jamapediatrics.2013.2252. PubMed
2. Destino L BD, Acuna C, Asch S, Platchek T. Improving patient flow: analysis of an initiative to improve early discharge. J Hosp Med. 2019;14(1):22-27. doi: 10.12788/JHM.3133.
3. Lorch SA, Millman AM, Zhang X, et.al. Impact of admission-day crowding on the length of stay of pediatric hospitalizations. Pediatrics. 2008;121(4):e718-e730. doi: 10.1542/peds.2007-1280. PubMed
4. Haferbecker D, Fakeye O, Medina SP, Fieldston ES. Perceptions of educational experience and inpatient workload among pediatric residents. Hosp Pediatri. 2013;3(3):276-284. doi: 10.1542/hpeds.2012-0068. PubMed
5. James H, Steiner MJ, Holmes GM, Stephens JR. The association of discharge before noon and length of stay in hospitalized pediatric patients. J Hosp Med. 2019:14(1):28-32. doi: 10.12788/jhm.3111.
6. White CM, Statile AM, White DL, et al. Using quality improvement to optimize paediatric discharge efficiency. BMJ Qual Saf. 2014;23(5):428-436. doi: 10.1136/bmjqs-2013-002556.
Hospitalists have become well versed in campaigns championing safe, efficient, and timely discharges, as well as in the pragmatic challenges of achieving them. Successfully discharging a patient from the hospital requires synchronizing several elements; as a result, improvement efforts focus on promoting shared mental models and team identification of early discharges. The urgency for timely discharges, much like (and unlike1) hotel check-out times, becomes increasingly relevant when hospitals are functioning at or beyond full capacity. As inpatient medical care grows increasingly more specialized, promoting high-quality discharges theoretically allows for not only more beds, but also that the right bed is available for the right patient at the right time. In addition, financial realities in terms of reimbursement and the high cost of adding capacity imply that hospitals need to maximize throughput from the beds they already have. For these reasons, hospital administrators and operational leaders have focused on early discharges as a goal—and have often used discharge before noon (DCBN) as the metric to measure performance.
In this issue of the Journal of Hospital Medicine, Destino et al. reported that it is possible to achieve a higher percentage of early discharges, which allowed for decompression of post-anesthesia care and emergency areas without a measurable negative impact on patient or family satisfaction or length of stay (LOS).2 The improvement they report is remarkable. However, it will be important for them to report back, as quality improvement projects often revert to prior state unless the processes are reinforced and embedded in hospital culture. In addition, what goes unreported in Destino et al. are the unmeasured and unanticipated outcomes related to focusing on a single, laudable goal. This study and others have yet to confirm that systems have enough resiliency to improve discharge timeliness without diverting resources from other aspects of care.3 In other words, can inpatient teams do everything at the same time without sacrificing quality; ie, improve discharge timeliness, accept and admit new patients faster, respond to deteriorating patients, spend enough time with patients and families to meet their needs (and validated survey expectations), and in educational settings, meet the learning needs of trainees?4 This may prove to be true if implementation techniques are individualized to hospitals, services, and units and are incorporated into existing workflows, minimizing extraneous “asks” on already overtaxed providers. Evidence to support this would go a long way in engaging stakeholders to prioritize quality discharges.
In this issue, too, James, et al. ask the question “if DCBN is a good indicator of shorter LOS or is DCBN an arbitrary indicator.”5 The answer may be yes, no, both, maybe, and it depends. Certainly, no pathophysiological reasons exist for a certain time of day to be the “right” time for discharge. The key question for hospitalists and health systems leaders is whether setting time goals leads clinicians to delay discharges of medically and logistically ready patients in the afternoon or evening, particularly if the metric is linked to monetary performance incentives. This is also likely a matter of degrees, ie, set the DCBN goal at 80%-100% and gaming is much more likely; set the goal at 20%-30% and this might reflect a realistic range and be less likely to incentivize gaming. Notably, the hospital in the James study did not have a DCBN goal. It would be interesting to see what would happen in that hospital or another hospital before and after implementing a DCBN goal—and further assess a dose-response curve. Another approach would be to perform qualitative analysis of readiness for discharge via chart reviews and determine if patients could have left in the afternoon or evening but might have been delayed to buff up the performance on the DCBN metric.
James et al. additionally demonstrate differences for medical and surgical patients, underscoring that a DCBN goal is unlikely to yield the same results in different patient cohorts or settings. The authors note several workflow reasons for this variation, but other considerations are regularity of timelines for recovery being different for surgical patients, role of elective admissions scheduled in advance, and the potential use of conditional orders (ie, orders entered before dawn that nurses can activate as patients meet criteria).
Much as we have adopted cultural changes over the years to raise awareness regarding patient safety such as nosocomial infections and hand hygiene, an emphasis on high-quality discharges too needs to become integral to hospital practices to sustain performance and any associated metrics. As to what to measure? A validated “medical readiness to discharge” may be the gold standard but may be difficult to attain. Until then, carefully constructed approaches to prioritizing early discharges through proactive planning, shared mental models, interdisciplinary teamwork, and appropriate incentives to those who do it well could yield the results we want as hospitalists, as patients, and as families.
Disclosures
Dr. Kane and Dr. Fieldston have nothing to disclose.
1. Iantorno S, Fieldston E. Hospitals are not hotels: high-quality discharges occur around the clock. JAMA Pediatr. 2013;167(7):596-597. doi: 10.1001/jamapediatrics.2013.2252. PubMed
2. Destino L BD, Acuna C, Asch S, Platchek T. Improving patient flow: analysis of an initiative to improve early discharge. J Hosp Med. 2019;14(1):22-27. doi: 10.12788/JHM.3133.
3. Lorch SA, Millman AM, Zhang X, et.al. Impact of admission-day crowding on the length of stay of pediatric hospitalizations. Pediatrics. 2008;121(4):e718-e730. doi: 10.1542/peds.2007-1280. PubMed
4. Haferbecker D, Fakeye O, Medina SP, Fieldston ES. Perceptions of educational experience and inpatient workload among pediatric residents. Hosp Pediatri. 2013;3(3):276-284. doi: 10.1542/hpeds.2012-0068. PubMed
5. James H, Steiner MJ, Holmes GM, Stephens JR. The association of discharge before noon and length of stay in hospitalized pediatric patients. J Hosp Med. 2019:14(1):28-32. doi: 10.12788/jhm.3111.
6. White CM, Statile AM, White DL, et al. Using quality improvement to optimize paediatric discharge efficiency. BMJ Qual Saf. 2014;23(5):428-436. doi: 10.1136/bmjqs-2013-002556.
© 2019 Society of Hospital Medicine
Predicting the Future: Using Simulation Modeling to Forecast Patient Flow on General Medicine Units
Hospitals are complex adaptive systems within which practitioners, technology, physical resources, and other components adapt interdependently to attempt to best meet the needs of patients.1 Hospitals must provide a stable, dependable level of care while also surging to respond to times of high demand, such as patient emergencies or swells in patient volume. Given the critical and resource-intensive nature of this work, optimizing the system is essential; however, because of the complexity of the system, making changes can result in unexpected and possibly deleterious effects. We need to approach change in hospital processes carefully and thoughtfully.
The Institute of Medicine, the National Academy of Engineering, and the President’s Council of Advisors on Science and Technology have recommended the application of systems engineering approaches to improve health care delivery.2,3 Systems engineering seeks to coordinate, synchronize, and integrate complex systems of people, information, materials, technology, and financial resources.4,5 To determine how complex systems can be improved, engineers apply analytic methods to describe how such systems operate and what the impact of changes might be. These methodologies have improved patient care and reduced costs at several hospitals.6 For example, a decision support system that combined simulation, optimization, and machine learning methods in an emergency department (ED) resulted in a 33% reduction in length of stay (LOS) and a 28% decrease in ED readmissions.7 Other strategies to improve patient flow include shaping demand (decreasing variation in surgical scheduling, relocating low acuity care ED visit to primary care, etc.), redesigning systems (early discharges, improving efficiency, and coordination of hospital discharge process, decreasing care variation, etc.), or aligning capacity and demand. Another approach, real-time demand capacity (RTDC), is based on management principles and queuing and constraint theory and has been implemented successfully in a variety of health care organizations. RTDC represents a promising approach to improve hospitalwide patient flow and can be integrated into current bed management processes.8 Unfortunately, many of these approaches are not well known to clinicians and would benefit from greater awareness and input from healthcare practitioners.
One systems engineering tool that can be used to describe, analyze, and evaluate proposed changes in care is simulation.9 Simulation creates a model within which what-if scenarios (ie, adjusting various inputs into the simulation) allow researchers to define the likelihood of consequences from various courses of action and determine the optimal change to a system. Such analyses can predict the impact of a proposed change on patients and healthcare practitioners.10-13
A critical concern for hospitals that simulation may help address is managing the volume of inpatients. A high inpatient census is necessary for financial solvency, yet too high a census of inpatients or an unexpected surge in acuity can overwhelm hospital resources. Many hospitals, pressured by growing numbers of increasingly complex patients, have seen medical inpatients spread across multiple nonmedical nursing units (NUs) of their institution such that a particular medical team may have only a couple patients assigned to each nursing unit.14 This dispersion may hinder communication between physicians and nurses and limits the time physicians have to interact with patients.15 Additionally, coordination of care may become more challenging for discharge planning.16 Aligning medical teams with NUs may benefit the quality and efficiency of care or may create a barrier to patient flow, which worsens these problems.15,17 Alternatively, hospitals might meet the increasing demands for care by choosing to add capacity by opening new NUs or hiring additional healthcare providers.
This article describes the application of simulation to model the interconnected variables and subsequent future states created by several possible
METHODS
Setting and Present State
Virginia Commonwealth University (VCU) is a 865-bed tertiary academic medical center, with inpatient care activities spread between four connected buildings and 50 different NUs. The occupancy rate had been over 92% during the time period of this project with admission volume limited primarily by the capacity of the facility. Three of the NUs were primarily allocated to general medicine (GIM) patients. However, over the years, GIM inpatients grew to over 7500 admissions annually, resulting in nearly 50% of GIM patients being admitted to a non-GIM nursing unit.
Additionally, patients on each medical team had a high degree of spread across NUs due to several factors. Admissions and discharges from the hospital did not align across the day. While discharges clumped in the late afternoon, admission occurred throughout the day with a surge in the later afternoon. This mismatch frequently led to patients waiting in the ED for a bed, medical team, or both, and patients were typically assigned to the first available bed and team. For medical team assignments, newly admitted patients were distributed relatively equally across five hospitalist teams and five housestaff teams (that include residents, interns, and medical students). This steady distribution of patients through the day supported meeting housestaff work-hour restrictions of 80 hours each week.18 Yet, as a result of the high occupancy rate, the patterns of patient admissions and discharges, and the distribution of patients among medical teams and across NUs, medical teams and NUs rarely shared more than a few patients.
Leaders at our institution outlined several possible options to address these challenges, including aligning medical teams with NU, adding an additional hospitalist team, or adding an additional nursing unit. In addition, institutional leaders were concerned about the impact of continued growth in admission volume and the impact of patient dispersion on trainees and students. The overall goal of creating a simulation model was to determine the impact of an increased volume of patients and these possible strategic decisions on operational metrics, including number of patients waiting in the ED, ED boarding time per patient, time in system per patient (ED boarding time plus inpatient LOS), team utilization, and rounding travel time.
Simulation Modeling
To model the impact of some possible system changes on patient care, we applied Kelton and Law’s simulation study framework,19 including data collection; model building and validation; and what-if scenario testing (Figure 1).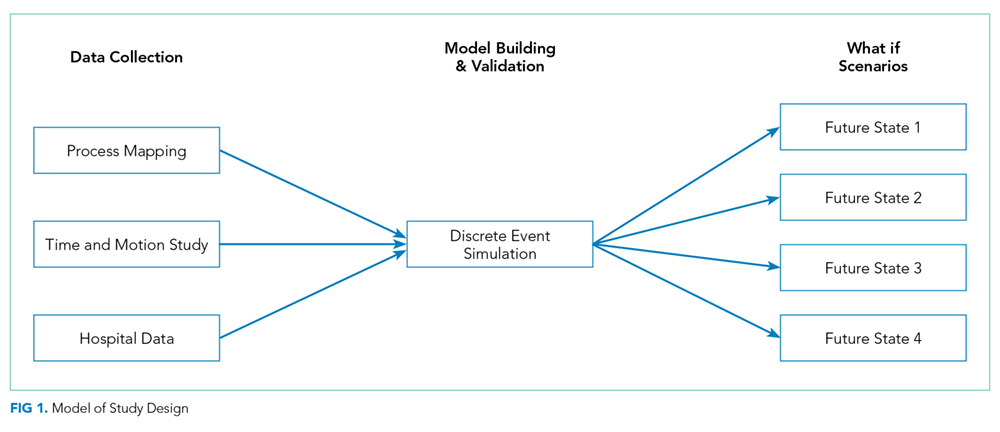
Data Collection
Process Flow Map
We created a complex process flow map of patient care activities on medical teams. The map was developed by four general medicine physicians (R.C., H.M., V.M., and S.P.T.) who all provided medical care on the hospital-based services and ensured expert input on the patient care activities captured by the simulation modeling.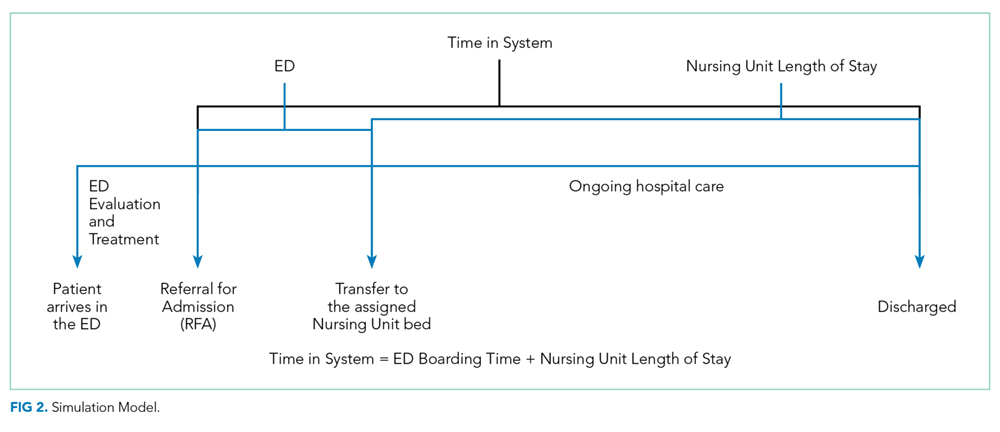
Time and Motion Studies
Time and motion study is a well-established technique used to evaluate the efficiency of work processes.20,21 Originally applied to increase productivity in manufacturing, this technique uses first-hand observations to measure the time allotted to different work tasks to systematically analyze workflow.22 Workflow in healthcare, like manufacturing tasks, tends to have a repetitive pattern, making time and motion studies a highly applicable tool.
A research assistant observed a total of 30 hospitalist work cycles to describe the work of our inpatient clinicians. A work cycle, defined as one complete process flow,23 began when the hospitalist started a daytime shift of patient care and concluded after the physician “signed out” to the physician who was assuming responsibility for ongoing medical care of the patients (ie, cross-coverage). Time spent on different activities identified by the process flow map was captured throughout the cycle. These activities included time spent traveling to evaluate patients located on different NUs. To minimize disruptions in patient care and adhere to privacy standards, no observations were conducted in patient rooms, and details of computer work were not recorded. To ensure stable estimates of the mean and standard deviation of the time spent at each step, at least 30 cycles of observation are recommended. Thus, 300 hours of observations over the course of 30 separate days were collected.
Hospital Data
We extracted admission and discharge data from the electronic health records (EHR) for general medicine patients admitted from the ED for the calendar year 2013. These records were used to establish means and standard deviations for admission date and time, distribution of patients across NUs, and LOS.
Model Building and Internal Validation
On the basis of these data inputs and using SIMIO® Simulation Software version 7, we constructed a discrete event simulation (DES) model representing the patient care activities of general medicine teams. Each patient was assigned a bed on a nursing unit through a probability distribution based on prior EHR data and then randomly assigned to a general medicine team. We replicated the model 200 times, and each model ran for 365 days. Each team was limited to 16 assigned patients, the maximum number of patients per housestaff team allowed by VCU protocol; henceforth, this number is referred to as team-patient capacity. The model assumed patients remained on the assigned nursing unit and medical team for the entirety of their hospital stay and that each patient was seen by their assigned medical team every day. The results of the present state model, including mean number of patients on each nursing unit, mean team census, patient dispersion (ie, the number of NUs on which each medical team had patients), and team utilization (ie, mean team census divided by team patient capacity), were compared with actual data from 2013 to internally validate the model.
What-If Scenario Testing
We constructed four what-if scenarios based on possible strategic directions identified by leadership. These models evaluated:
- constraining patients on housestaff (but not hospitalist) teams to the three general medicine NUs (Future State 1),
- increasing bed capacity for general medicine patients by adding one additional nursing unit of 26 beds (Future State 2),
- increasing the number of general medicine teams by adding one additional hospitalist team of up to 16 patients (Future State 3),
- modeling the impact of increased patient admissions from 21 per day to 25 per day while also adding a nursing unit and an additional medical team (Future State 4).
For Future States 1-3, admission volume was held constant. The model generated nursing unit LOS using a random continuous exponential probability distribution with a mean of 133 hours to match the LOS distribution derived from health system data. As patients entered the system for admission, the model assigned a bed to the patient, but the patient could not move to the assigned bed until a bed and care team were both available. We were only interested in the steady-state behavior of the system, so collecting performance statistics only after the model had been populated and steady state had been achieved was important.
Table 1 summarizes the input data, fixed, and dynamic variable for each future state model.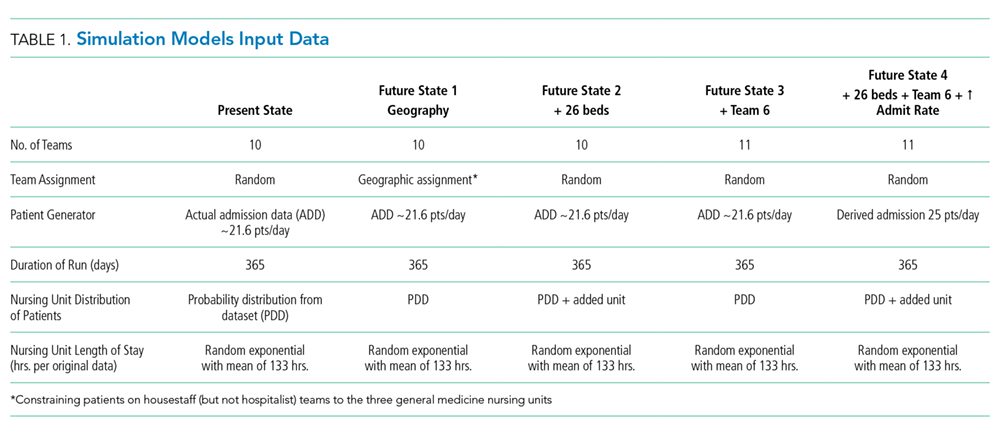
We examined the impact of these scenarios on the following variables (Table 2): (1) average time in system; (2) average number of patients waiting for a bed; (3) average ED boarding time; (4) total daily general medicine census; (5) average housestaff team census per team; (6) average hospitalist team census per team; (7) average combined housestaff and hospitalist team census per team; (8) average housestaff team utilization (ie, mean team census divided by team patient capacity of 16); (9) average hospitalist team utilization (ie, mean team census divided by team patient capacity of 16); (10) average nursing unit utilization (ie, mean nursing unit census divided by maximum number of patients that can be cared for on each nursing unit); (11) patient dispersion to NUs (ie, average number of NUs on which each general medicine team has patients); 12) estimated average rounding time per general medicine team.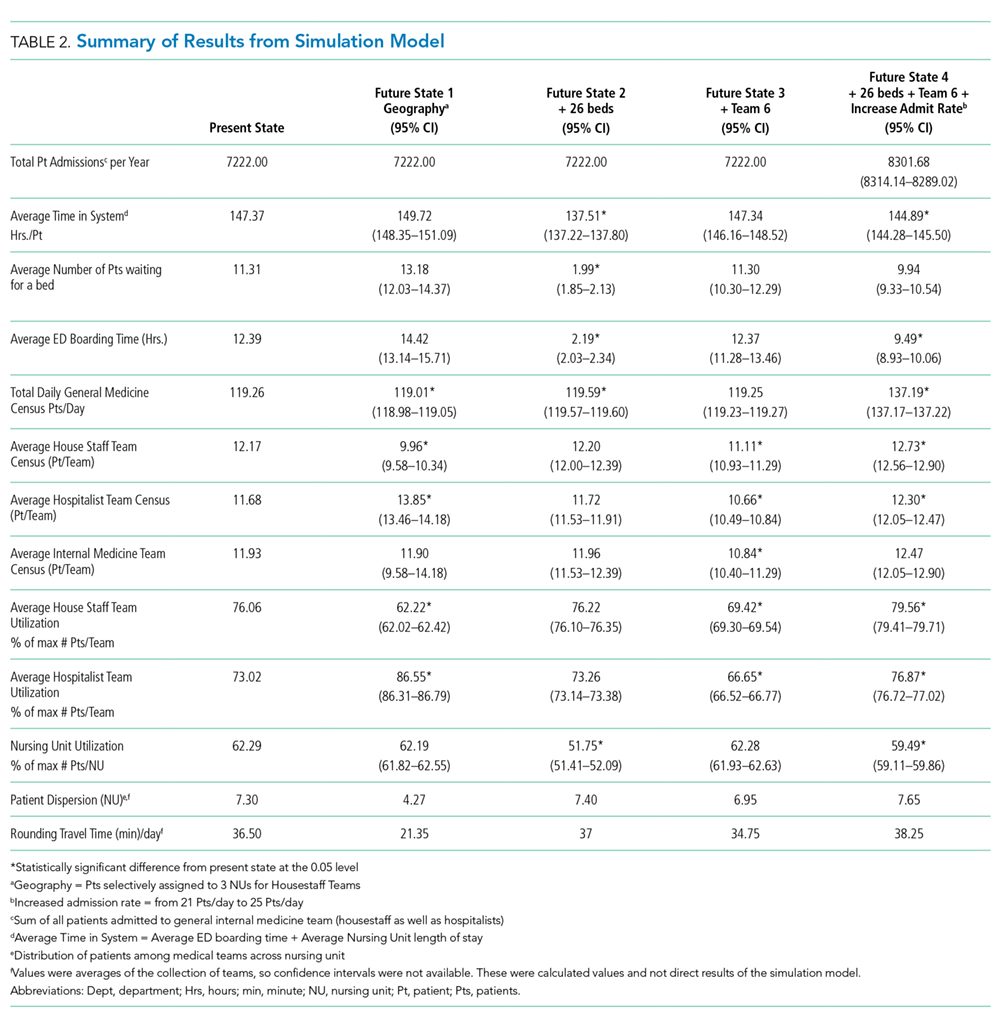
Of note, the average time in the system included time patients spent waiting for bed and team assignments (ED boarding time) in addition to the time they spent in the assigned nursing unit (nursing LOS). The difference between the nursing LOS (ie, time on the nursing unit) and total time in the system is one indicator of system efficiency around hospital admission.
The Institutional Review Board of Virginia Commonwealth University approved this study.
RESULTS
Time and Motion Data
The mean time spent with each patient was nine minutes. The mean time traveling between NUs Healthcare Quality for Children and Adolescents with Suicidality Admitted to Acute Care Hospitals in the United States was five minutes. Average rounding time was noted to be two hours, 53 minutes. Thirty-seven minutes, about ~21% of the time, was wasted in traveling. Each team, on average, traveled to seven different NUs to round on their daily census, averaging 1.6 patients in each nursing unit.
Hospital Data
Between January 1, 2011 to December 31, 2013, a total of 7,902 patients were admitted to the general medicine teams, spanning 23 NU. The average number of admissions per day was 21.6, and the average nursing unit LOS was 133 hours. Average team census was derived from historical data across all GIM team for 2013 and was noted to be 11.5 patients per team, and these patients were spread over seven NU.
Model Validation
The mean number of patients admitted to different NUs was estimated from the simulation model then compared with the EHR data from 2013. None were statistically different (P > .05), which signified that the validated simulation model is similar to the EHR data from 2013 despite the underlying assumptions.
Model Outputs
Analysis of the models indicated that steady-state (based upon hospital census) was realized at approximately 800 hours or after 680 patients were admitted to the GIM teams. Statistics collection, therefore, was started after 800 hours of simulated time and reflected the admission of the remaining 7222 patients in the model validation sample (Table 2).
In the model, the total daily general medicine patient census was 119.26. Average time in the system per patient was noted to be 147.37 hours, which was 14.37 hours more than the average nursing unit LOS of 133 hours. Average number of patients waiting for a bed was noted to be 11.31, while the average wait time for a patient to get a bed was 12.39 hours.
Average housestaff team and hospitalist team utilization were 76.06% and 73.02%, respectively, with average team utilization of 74.54% (range: 72.88%-76.19%). Housestaff team and hospitalist team averaged 12.17 and 11.68 patients per care team, respectively. General medicine teams had patients on 7.30 NUs on average. GIM teams rounding travel time was 36.5 minutes.
What-If Scenario Testing
Simulation outputs for the four future states are summarized in Table 2. With Future State 1, through which patients were selectively assigned to housestaff teams aligned with three NUs, the average time in the system per patient increased by 2.35 hours, with 1.87 more patients waiting for a bed and waiting for 2.03 more hours as compared with the present state. A marked disparity was observed in hospitalist and housestaff team utilization of 62.22% and 86.55% respectively. Patient dispersion to various NUs significantly decreased, and rounding time correspondingly decreased by approximately 41%.
Future State 2, adding a nursing unit, decreased average time in the system per patient by 9.86 hours, with 9.32 fewer patients waiting for a bed as compared with the present state. A slight increase in patient dispersion and rounding time was observed. Overall, patients spent 137.51 hours in the system, which demonstrated improved efficiency of the system.
Future State 3, adding an additional medical team, interestingly did not have a significant effect on patients’ average time in system or the number of patients waiting for a bed even though a decrease occurred in average team census, team utilization, and patient dispersion.
Finally, Future State 4, increasing admissions while also adding a nursing unit and a hospitalist team, resulted in an increase in admission volume while maintaining similar utilization rates for teams and NU. Patients spent about 2.48 hours less in the system, while only 9.94 patients were noted to be waiting for a bed as compared with 11.21 patients in the present state model. The total daily general medicine patient census was noted to be 137.19. Average team census and average team utilization were noted to be similar to those of the present state model, while admissions were up by approximately 1,080 per year. Both patient dispersion and rounding were slightly worsened.
Sensitivity Analysis
Overall, average time in system was most affected by the number of patient arrivals. This became particularly significant as the volume of patient arrivals approached and exceeded the capacity of the rounding teams. Adding a nursing unit had more impact on decreasing average time in the system than adding a medical team or aligning teams with NUs under the conditions defined by the model. However, under different conditions, such as increasing admission volume, the relative benefit of different approaches may vary.
DISCUSSION
Given that hospitals are large, complex systems,2 the impact of system-level changes can have unpredictable and potentially deleterious effects. Simulation provides a technique for modeling the impact of changes to understand the ramifications of these interventions more thoroughly.3 In this study, we describe the process of building a simulation model for the admission and discharge of patients from general medicine services in a tertiary care hospital, internally validating this model, and examining the outcomes from several potential changes to the system.
The outcomes for these what-if scenarios provided some important insights about the secondary effect of system changes and the need for multiple, simultaneous interventions. Given that hospitals often function at near capacity, adding a hospitalist team or nursing unit might be seen as a reasonable strategy to improve the system metrics, number of patient discharges, or average LOS. On the basis of our analysis, adding a nursing unit would have more benefit than adding a hospitalist team. Leaders who want to increase capacity may need to consider both adding a hospitalist team and a nursing unit, and model the impact of each choice as described with a simulation.
Additionally, assigning patients to medical teams aligned with NUs seems theoretically appealing to improve interprofessional communication and decrease the time spent in transit between patients by physicians. While our findings supported a decrease in rounding time and patient dispersion, the teams not aligned with a nursing unit (ie, the hospitalists) exceeded 80% utilization, the threshold at which efficiency is known to decrease.24 Potentially, benefits resulting from teams being aligned with NUs were offset by decrements in performance of the teams not aligned with NU. If medical teams and NUs become aligned, then a higher number of teams may be necessary to maintain patient throughput.
Simulation models identify these unexpected consequences prior to investing resources in a significant change; however, modeling is not simple. Simulation models depend on the characteristics of the model and the quality of the input data. For example, we used an expert approach to map physician workflow as an underpinning of the model, but we may have missed an important variation in physician workflow. Understanding this variation could strengthen the model and provide some testable variables for future study. Likewise, understanding nursing workflow and how variation in physician workflow shapes nursing workflow, and vice versa, is worth exploring.
Other data could also be added to, and help interpret, the outputs of this model. For example, the impact of various levels of team and unit utilization on diversion time for the hospital ED may help determine whether adding team capacity or unit capacity is more beneficial for the system. Likewise, aligning medical teams with NUs seems to hinder patient throughput on this analysis, but benefits in patient satisfaction or decreased readmissions might improve reimbursement and outweigh the revenue lost from throughput. Underpinning each of these types of decisions is a need to model the system well and thoughtfully choose the inputs, processes, and outputs. Pursuing a new strategic decision usually involves cost; simulation modeling provides data to help leaders weigh the benefits in terms of the needed investment.
The major limitations of the study stem from these choices. Our study focused on matching capacity and demand while limiting other changes in the system, such as changes in nursing unit LOS. Future work to quantify the relationship of other variables on parameters, such as the impact of decreased team dispersion on LOS, early discharges, and decreasing care variation, would make future models more robust. This model does not consider other strategies to improve patient flow, such as shaping demand, adaptive team assignment algorithms, or creating surge capacity. We also used only hospitalist time and motion data in our model; housestaff workflow is likely different. In addition, we modeled all patients as having a general level of nursing care and did not account for admissions or transfers to intensive care units or other services. These parameters could be added in future iterations. Finally, the biggest limitation in any simulation is the underlying assumptions made to construct the model. While we validated the model retrospectively, prospective validation and refinement should also be performed with attention to how the model functions under extreme conditions, such as a very high patient load.
CONCLUSION
Major system changes are expensive and must be made carefully. Systems engineering techniques, such as DES, provide techniques to estimate the impact of changes on pertinent care delivery variables. Results from this study underscore the complexity of patient care delivery and how simulation models can integrate multiple system components to provide a data-driven approach to inform decision making in a complex system.
Acknowledgments
The simulation software used in this study was awarded as an educational software grant from SIMIO®. We would like to acknowledge support from the Department of Internal Medicine at Virginia Commonwealth University for this project and thank Lena Rivera for her assistance with the manuscript preparation.
Dislosures
Dr. Heim recived a consulting fee for programming guidance from Virginia Commonwealth University. All other authors have nothing to disclose.
1. James BC. Learning opportunities for health care. In: Grossmann C, Goolsby WA, Olsen LA, McGinnis JM, eds. Engineering a Learning Healthcare System: A Look at the Future: Workshop Summary. Washington, DC: National Academies Press; 2011:31-46. PubMed
2. Reid PP, Compton WD, Grossman J, Fanjiang G. Building a Better Delivery System: A New Engineering/Health Care Partnership. Washington, DC: National Academy of Engineering and Institute of Medicine, National Academies Press; 2005. PubMed
3. President’s Council of Advisors on Science and Technology (US). Report to the President, better health care and lower costs: accelerating improvement through systems engineering. Washington, DC; 2014.
4. Kossiakoff A, Sweet W. Systems Engineering Principles and Practice. New York: Wiley; 2003.
5. Kopach-Konrad R, Lawley M, Criswell M, et al. Applying systems engineering principles in improving health care delivery. J Gen Intern Med. 2007;22(Suppl 3):431-437. doi: 10.1007/s11606-007-0292-3. PubMed
6. Weed J. Factory efficiency comes to the hospital. The New York Times; July 9, 2010.
7. Lee EK, Atallah HY, Wright MD, et al. Transforming hospital emergency department workflow and patient care. Interfaces. 2015;45(1):58-82. doi: 10.1287/inte.2014.0788.
8. Resar R, Nolan K, Kaczynski D, Jensen K. Using real-time demand capacity management to improve hospitalwide patient flow. Joint Comm J Qual Patient Saf. 2011;37(5):217-227. doi: 10.1016/S1553-7250(11)37029-8. PubMed
9. McJoynt TA, Hirzallah MA, Satele DV et al. Building a protocol expressway: the case of Mayo Clinic Cancer Center. J Clin Oncol. 2009;27(23):3855-3860. doi: 10.1200/JCO.2008.21.4338. PubMed
10. Blanchard BS, Fabrycky WJ. Systems Engineering and Analysis. 5th ed. Englewood Cliffs: Prentice Hall; 2010.
11. Segev D, Levi R, Dunn PF, Sandberg WS. Modeling the impact of changing patient transportation systems on peri-operative process performance in a large hospital: insights from a computer simulation study. Health Care Manag Sci. 2012;15(2):155-169. doi: 10.1007/s10729-012-9191-1. PubMed
12. Schoenmeyr T, Dunn PF, Gamarnik D, et al. A model for understanding the impacts of demand and capacity on waiting time to enter a congested recovery room. Anesthesiology. 2009;110(6):1293-1304. doi: 10.1097/ALN.0b013e3181a16983 PubMed
13. Levin SR, Dittus R, Aronsky D, et al. Optimizing cardiology capacity to reduce emergency department boarding: a systems engineering approach. Am Heart J. 2008;156(6):1202-1209. doi: 10.1016/j.ahj.2008.07.007. PubMed
14. Bryson C, Boynton G, Stepczynski A, et al. Geographical assignment of hospitalists in an urban teaching hospital: feasibility and impact on efficiency and provider satisfaction. Hosp Pract. 2017;45(4):135-142. doi: 10.1080/21548331.2017.1353884. PubMed
15. Artenstein AW, Higgins TL, Seiler A, et al. Promoting high value inpatient care via a coaching model of structured, interdisciplinary team rounds. Br J Hosp Med (Lond). 2015;76(1):41-45. doi: 10.12968/hmed.2015.76.1.41. PubMed
16. O’Leary KJ, Wayne DB, Landler MP, et al. Impact of localizing physicians to hospital units on nurse-physician communication and agreement on the plan of care. J Gen Intern Med. 2009;24(11):1223-1227. doi: 10.1007/s11606-009-1113-7. PubMed
17. Dunn AS, Reyna M, Radbill B, et al. The impact of bedside interdisciplinary rounds on length of stay and complications. J Hosp Med. 2017;12(3):137-142. doi: 10.12788/jhm.2695. PubMed
18. Accreditation Council for Graduate Medical Education. Common program requirements. Chicago, IL; 2011.
19. Eldabi T, Irani Z, Paul RJ. A proposed approach for modelling health-care systems for understanding. J Manag Med. 2002;16(2-3):170-187. PubMed
20. Block L, Habicht R, Wu AW, et al. In the wake of the 2003 and 2011 duty hours regulations, how do internal medicine interns spend their time? J Gen Intern Med. 2013;28(8):1042-1047. doi: 10.1007/s11606-013-2376-6. PubMed
21. Tipping MD, Forth VE, Magill DB, Englert K, Williams MV. Systematic review of time studies evaluating physicians in the hospital setting. J Hosp Med. 2010;5(6):353-359. doi: 10.1002/jhm.647. PubMed
22. Cady R, Finkelstein S, Lindgren B, et al. Exploring the translational impact of a home telemonitoring intervention using time-motion study. Telemed J e Health. 2010;16(5):576-584. doi: 10.1089/tmj.2009.0148. PubMed
23. Rother M, Shook J. Learning to See: Value Stream Mapping to Add Value and Eliminate Muda. Cambridge, MA: Lean Enterprise Institute, Inc; 2009.
24. Terwiesch C, Diwas KC, Kahn JM. Working with capacity limitations: operations management in critical care. Crit Care. 2011;15(4):308. doi: 10.1186/cc10217. PubMed
Hospitals are complex adaptive systems within which practitioners, technology, physical resources, and other components adapt interdependently to attempt to best meet the needs of patients.1 Hospitals must provide a stable, dependable level of care while also surging to respond to times of high demand, such as patient emergencies or swells in patient volume. Given the critical and resource-intensive nature of this work, optimizing the system is essential; however, because of the complexity of the system, making changes can result in unexpected and possibly deleterious effects. We need to approach change in hospital processes carefully and thoughtfully.
The Institute of Medicine, the National Academy of Engineering, and the President’s Council of Advisors on Science and Technology have recommended the application of systems engineering approaches to improve health care delivery.2,3 Systems engineering seeks to coordinate, synchronize, and integrate complex systems of people, information, materials, technology, and financial resources.4,5 To determine how complex systems can be improved, engineers apply analytic methods to describe how such systems operate and what the impact of changes might be. These methodologies have improved patient care and reduced costs at several hospitals.6 For example, a decision support system that combined simulation, optimization, and machine learning methods in an emergency department (ED) resulted in a 33% reduction in length of stay (LOS) and a 28% decrease in ED readmissions.7 Other strategies to improve patient flow include shaping demand (decreasing variation in surgical scheduling, relocating low acuity care ED visit to primary care, etc.), redesigning systems (early discharges, improving efficiency, and coordination of hospital discharge process, decreasing care variation, etc.), or aligning capacity and demand. Another approach, real-time demand capacity (RTDC), is based on management principles and queuing and constraint theory and has been implemented successfully in a variety of health care organizations. RTDC represents a promising approach to improve hospitalwide patient flow and can be integrated into current bed management processes.8 Unfortunately, many of these approaches are not well known to clinicians and would benefit from greater awareness and input from healthcare practitioners.
One systems engineering tool that can be used to describe, analyze, and evaluate proposed changes in care is simulation.9 Simulation creates a model within which what-if scenarios (ie, adjusting various inputs into the simulation) allow researchers to define the likelihood of consequences from various courses of action and determine the optimal change to a system. Such analyses can predict the impact of a proposed change on patients and healthcare practitioners.10-13
A critical concern for hospitals that simulation may help address is managing the volume of inpatients. A high inpatient census is necessary for financial solvency, yet too high a census of inpatients or an unexpected surge in acuity can overwhelm hospital resources. Many hospitals, pressured by growing numbers of increasingly complex patients, have seen medical inpatients spread across multiple nonmedical nursing units (NUs) of their institution such that a particular medical team may have only a couple patients assigned to each nursing unit.14 This dispersion may hinder communication between physicians and nurses and limits the time physicians have to interact with patients.15 Additionally, coordination of care may become more challenging for discharge planning.16 Aligning medical teams with NUs may benefit the quality and efficiency of care or may create a barrier to patient flow, which worsens these problems.15,17 Alternatively, hospitals might meet the increasing demands for care by choosing to add capacity by opening new NUs or hiring additional healthcare providers.
This article describes the application of simulation to model the interconnected variables and subsequent future states created by several possible
METHODS
Setting and Present State
Virginia Commonwealth University (VCU) is a 865-bed tertiary academic medical center, with inpatient care activities spread between four connected buildings and 50 different NUs. The occupancy rate had been over 92% during the time period of this project with admission volume limited primarily by the capacity of the facility. Three of the NUs were primarily allocated to general medicine (GIM) patients. However, over the years, GIM inpatients grew to over 7500 admissions annually, resulting in nearly 50% of GIM patients being admitted to a non-GIM nursing unit.
Additionally, patients on each medical team had a high degree of spread across NUs due to several factors. Admissions and discharges from the hospital did not align across the day. While discharges clumped in the late afternoon, admission occurred throughout the day with a surge in the later afternoon. This mismatch frequently led to patients waiting in the ED for a bed, medical team, or both, and patients were typically assigned to the first available bed and team. For medical team assignments, newly admitted patients were distributed relatively equally across five hospitalist teams and five housestaff teams (that include residents, interns, and medical students). This steady distribution of patients through the day supported meeting housestaff work-hour restrictions of 80 hours each week.18 Yet, as a result of the high occupancy rate, the patterns of patient admissions and discharges, and the distribution of patients among medical teams and across NUs, medical teams and NUs rarely shared more than a few patients.
Leaders at our institution outlined several possible options to address these challenges, including aligning medical teams with NU, adding an additional hospitalist team, or adding an additional nursing unit. In addition, institutional leaders were concerned about the impact of continued growth in admission volume and the impact of patient dispersion on trainees and students. The overall goal of creating a simulation model was to determine the impact of an increased volume of patients and these possible strategic decisions on operational metrics, including number of patients waiting in the ED, ED boarding time per patient, time in system per patient (ED boarding time plus inpatient LOS), team utilization, and rounding travel time.
Simulation Modeling
To model the impact of some possible system changes on patient care, we applied Kelton and Law’s simulation study framework,19 including data collection; model building and validation; and what-if scenario testing (Figure 1).
Data Collection
Process Flow Map
We created a complex process flow map of patient care activities on medical teams. The map was developed by four general medicine physicians (R.C., H.M., V.M., and S.P.T.) who all provided medical care on the hospital-based services and ensured expert input on the patient care activities captured by the simulation modeling.
Time and Motion Studies
Time and motion study is a well-established technique used to evaluate the efficiency of work processes.20,21 Originally applied to increase productivity in manufacturing, this technique uses first-hand observations to measure the time allotted to different work tasks to systematically analyze workflow.22 Workflow in healthcare, like manufacturing tasks, tends to have a repetitive pattern, making time and motion studies a highly applicable tool.
A research assistant observed a total of 30 hospitalist work cycles to describe the work of our inpatient clinicians. A work cycle, defined as one complete process flow,23 began when the hospitalist started a daytime shift of patient care and concluded after the physician “signed out” to the physician who was assuming responsibility for ongoing medical care of the patients (ie, cross-coverage). Time spent on different activities identified by the process flow map was captured throughout the cycle. These activities included time spent traveling to evaluate patients located on different NUs. To minimize disruptions in patient care and adhere to privacy standards, no observations were conducted in patient rooms, and details of computer work were not recorded. To ensure stable estimates of the mean and standard deviation of the time spent at each step, at least 30 cycles of observation are recommended. Thus, 300 hours of observations over the course of 30 separate days were collected.
Hospital Data
We extracted admission and discharge data from the electronic health records (EHR) for general medicine patients admitted from the ED for the calendar year 2013. These records were used to establish means and standard deviations for admission date and time, distribution of patients across NUs, and LOS.
Model Building and Internal Validation
On the basis of these data inputs and using SIMIO® Simulation Software version 7, we constructed a discrete event simulation (DES) model representing the patient care activities of general medicine teams. Each patient was assigned a bed on a nursing unit through a probability distribution based on prior EHR data and then randomly assigned to a general medicine team. We replicated the model 200 times, and each model ran for 365 days. Each team was limited to 16 assigned patients, the maximum number of patients per housestaff team allowed by VCU protocol; henceforth, this number is referred to as team-patient capacity. The model assumed patients remained on the assigned nursing unit and medical team for the entirety of their hospital stay and that each patient was seen by their assigned medical team every day. The results of the present state model, including mean number of patients on each nursing unit, mean team census, patient dispersion (ie, the number of NUs on which each medical team had patients), and team utilization (ie, mean team census divided by team patient capacity), were compared with actual data from 2013 to internally validate the model.
What-If Scenario Testing
We constructed four what-if scenarios based on possible strategic directions identified by leadership. These models evaluated:
- constraining patients on housestaff (but not hospitalist) teams to the three general medicine NUs (Future State 1),
- increasing bed capacity for general medicine patients by adding one additional nursing unit of 26 beds (Future State 2),
- increasing the number of general medicine teams by adding one additional hospitalist team of up to 16 patients (Future State 3),
- modeling the impact of increased patient admissions from 21 per day to 25 per day while also adding a nursing unit and an additional medical team (Future State 4).
For Future States 1-3, admission volume was held constant. The model generated nursing unit LOS using a random continuous exponential probability distribution with a mean of 133 hours to match the LOS distribution derived from health system data. As patients entered the system for admission, the model assigned a bed to the patient, but the patient could not move to the assigned bed until a bed and care team were both available. We were only interested in the steady-state behavior of the system, so collecting performance statistics only after the model had been populated and steady state had been achieved was important.
Table 1 summarizes the input data, fixed, and dynamic variable for each future state model.
We examined the impact of these scenarios on the following variables (Table 2): (1) average time in system; (2) average number of patients waiting for a bed; (3) average ED boarding time; (4) total daily general medicine census; (5) average housestaff team census per team; (6) average hospitalist team census per team; (7) average combined housestaff and hospitalist team census per team; (8) average housestaff team utilization (ie, mean team census divided by team patient capacity of 16); (9) average hospitalist team utilization (ie, mean team census divided by team patient capacity of 16); (10) average nursing unit utilization (ie, mean nursing unit census divided by maximum number of patients that can be cared for on each nursing unit); (11) patient dispersion to NUs (ie, average number of NUs on which each general medicine team has patients); 12) estimated average rounding time per general medicine team.
Of note, the average time in the system included time patients spent waiting for bed and team assignments (ED boarding time) in addition to the time they spent in the assigned nursing unit (nursing LOS). The difference between the nursing LOS (ie, time on the nursing unit) and total time in the system is one indicator of system efficiency around hospital admission.
The Institutional Review Board of Virginia Commonwealth University approved this study.
RESULTS
Time and Motion Data
The mean time spent with each patient was nine minutes. The mean time traveling between NUs Healthcare Quality for Children and Adolescents with Suicidality Admitted to Acute Care Hospitals in the United States was five minutes. Average rounding time was noted to be two hours, 53 minutes. Thirty-seven minutes, about ~21% of the time, was wasted in traveling. Each team, on average, traveled to seven different NUs to round on their daily census, averaging 1.6 patients in each nursing unit.
Hospital Data
Between January 1, 2011 to December 31, 2013, a total of 7,902 patients were admitted to the general medicine teams, spanning 23 NU. The average number of admissions per day was 21.6, and the average nursing unit LOS was 133 hours. Average team census was derived from historical data across all GIM team for 2013 and was noted to be 11.5 patients per team, and these patients were spread over seven NU.
Model Validation
The mean number of patients admitted to different NUs was estimated from the simulation model then compared with the EHR data from 2013. None were statistically different (P > .05), which signified that the validated simulation model is similar to the EHR data from 2013 despite the underlying assumptions.
Model Outputs
Analysis of the models indicated that steady-state (based upon hospital census) was realized at approximately 800 hours or after 680 patients were admitted to the GIM teams. Statistics collection, therefore, was started after 800 hours of simulated time and reflected the admission of the remaining 7222 patients in the model validation sample (Table 2).
In the model, the total daily general medicine patient census was 119.26. Average time in the system per patient was noted to be 147.37 hours, which was 14.37 hours more than the average nursing unit LOS of 133 hours. Average number of patients waiting for a bed was noted to be 11.31, while the average wait time for a patient to get a bed was 12.39 hours.
Average housestaff team and hospitalist team utilization were 76.06% and 73.02%, respectively, with average team utilization of 74.54% (range: 72.88%-76.19%). Housestaff team and hospitalist team averaged 12.17 and 11.68 patients per care team, respectively. General medicine teams had patients on 7.30 NUs on average. GIM teams rounding travel time was 36.5 minutes.
What-If Scenario Testing
Simulation outputs for the four future states are summarized in Table 2. With Future State 1, through which patients were selectively assigned to housestaff teams aligned with three NUs, the average time in the system per patient increased by 2.35 hours, with 1.87 more patients waiting for a bed and waiting for 2.03 more hours as compared with the present state. A marked disparity was observed in hospitalist and housestaff team utilization of 62.22% and 86.55% respectively. Patient dispersion to various NUs significantly decreased, and rounding time correspondingly decreased by approximately 41%.
Future State 2, adding a nursing unit, decreased average time in the system per patient by 9.86 hours, with 9.32 fewer patients waiting for a bed as compared with the present state. A slight increase in patient dispersion and rounding time was observed. Overall, patients spent 137.51 hours in the system, which demonstrated improved efficiency of the system.
Future State 3, adding an additional medical team, interestingly did not have a significant effect on patients’ average time in system or the number of patients waiting for a bed even though a decrease occurred in average team census, team utilization, and patient dispersion.
Finally, Future State 4, increasing admissions while also adding a nursing unit and a hospitalist team, resulted in an increase in admission volume while maintaining similar utilization rates for teams and NU. Patients spent about 2.48 hours less in the system, while only 9.94 patients were noted to be waiting for a bed as compared with 11.21 patients in the present state model. The total daily general medicine patient census was noted to be 137.19. Average team census and average team utilization were noted to be similar to those of the present state model, while admissions were up by approximately 1,080 per year. Both patient dispersion and rounding were slightly worsened.
Sensitivity Analysis
Overall, average time in system was most affected by the number of patient arrivals. This became particularly significant as the volume of patient arrivals approached and exceeded the capacity of the rounding teams. Adding a nursing unit had more impact on decreasing average time in the system than adding a medical team or aligning teams with NUs under the conditions defined by the model. However, under different conditions, such as increasing admission volume, the relative benefit of different approaches may vary.
DISCUSSION
Given that hospitals are large, complex systems,2 the impact of system-level changes can have unpredictable and potentially deleterious effects. Simulation provides a technique for modeling the impact of changes to understand the ramifications of these interventions more thoroughly.3 In this study, we describe the process of building a simulation model for the admission and discharge of patients from general medicine services in a tertiary care hospital, internally validating this model, and examining the outcomes from several potential changes to the system.
The outcomes for these what-if scenarios provided some important insights about the secondary effect of system changes and the need for multiple, simultaneous interventions. Given that hospitals often function at near capacity, adding a hospitalist team or nursing unit might be seen as a reasonable strategy to improve the system metrics, number of patient discharges, or average LOS. On the basis of our analysis, adding a nursing unit would have more benefit than adding a hospitalist team. Leaders who want to increase capacity may need to consider both adding a hospitalist team and a nursing unit, and model the impact of each choice as described with a simulation.
Additionally, assigning patients to medical teams aligned with NUs seems theoretically appealing to improve interprofessional communication and decrease the time spent in transit between patients by physicians. While our findings supported a decrease in rounding time and patient dispersion, the teams not aligned with a nursing unit (ie, the hospitalists) exceeded 80% utilization, the threshold at which efficiency is known to decrease.24 Potentially, benefits resulting from teams being aligned with NUs were offset by decrements in performance of the teams not aligned with NU. If medical teams and NUs become aligned, then a higher number of teams may be necessary to maintain patient throughput.
Simulation models identify these unexpected consequences prior to investing resources in a significant change; however, modeling is not simple. Simulation models depend on the characteristics of the model and the quality of the input data. For example, we used an expert approach to map physician workflow as an underpinning of the model, but we may have missed an important variation in physician workflow. Understanding this variation could strengthen the model and provide some testable variables for future study. Likewise, understanding nursing workflow and how variation in physician workflow shapes nursing workflow, and vice versa, is worth exploring.
Other data could also be added to, and help interpret, the outputs of this model. For example, the impact of various levels of team and unit utilization on diversion time for the hospital ED may help determine whether adding team capacity or unit capacity is more beneficial for the system. Likewise, aligning medical teams with NUs seems to hinder patient throughput on this analysis, but benefits in patient satisfaction or decreased readmissions might improve reimbursement and outweigh the revenue lost from throughput. Underpinning each of these types of decisions is a need to model the system well and thoughtfully choose the inputs, processes, and outputs. Pursuing a new strategic decision usually involves cost; simulation modeling provides data to help leaders weigh the benefits in terms of the needed investment.
The major limitations of the study stem from these choices. Our study focused on matching capacity and demand while limiting other changes in the system, such as changes in nursing unit LOS. Future work to quantify the relationship of other variables on parameters, such as the impact of decreased team dispersion on LOS, early discharges, and decreasing care variation, would make future models more robust. This model does not consider other strategies to improve patient flow, such as shaping demand, adaptive team assignment algorithms, or creating surge capacity. We also used only hospitalist time and motion data in our model; housestaff workflow is likely different. In addition, we modeled all patients as having a general level of nursing care and did not account for admissions or transfers to intensive care units or other services. These parameters could be added in future iterations. Finally, the biggest limitation in any simulation is the underlying assumptions made to construct the model. While we validated the model retrospectively, prospective validation and refinement should also be performed with attention to how the model functions under extreme conditions, such as a very high patient load.
CONCLUSION
Major system changes are expensive and must be made carefully. Systems engineering techniques, such as DES, provide techniques to estimate the impact of changes on pertinent care delivery variables. Results from this study underscore the complexity of patient care delivery and how simulation models can integrate multiple system components to provide a data-driven approach to inform decision making in a complex system.
Acknowledgments
The simulation software used in this study was awarded as an educational software grant from SIMIO®. We would like to acknowledge support from the Department of Internal Medicine at Virginia Commonwealth University for this project and thank Lena Rivera for her assistance with the manuscript preparation.
Dislosures
Dr. Heim recived a consulting fee for programming guidance from Virginia Commonwealth University. All other authors have nothing to disclose.
1. James BC. Learning opportunities for health care. In: Grossmann C, Goolsby WA, Olsen LA, McGinnis JM, eds. Engineering a Learning Healthcare System: A Look at the Future: Workshop Summary. Washington, DC: National Academies Press; 2011:31-46. PubMed
2. Reid PP, Compton WD, Grossman J, Fanjiang G. Building a Better Delivery System: A New Engineering/Health Care Partnership. Washington, DC: National Academy of Engineering and Institute of Medicine, National Academies Press; 2005. PubMed
3. President’s Council of Advisors on Science and Technology (US). Report to the President, better health care and lower costs: accelerating improvement through systems engineering. Washington, DC; 2014.
4. Kossiakoff A, Sweet W. Systems Engineering Principles and Practice. New York: Wiley; 2003.
5. Kopach-Konrad R, Lawley M, Criswell M, et al. Applying systems engineering principles in improving health care delivery. J Gen Intern Med. 2007;22(Suppl 3):431-437. doi: 10.1007/s11606-007-0292-3. PubMed
6. Weed J. Factory efficiency comes to the hospital. The New York Times; July 9, 2010.
7. Lee EK, Atallah HY, Wright MD, et al. Transforming hospital emergency department workflow and patient care. Interfaces. 2015;45(1):58-82. doi: 10.1287/inte.2014.0788.
8. Resar R, Nolan K, Kaczynski D, Jensen K. Using real-time demand capacity management to improve hospitalwide patient flow. Joint Comm J Qual Patient Saf. 2011;37(5):217-227. doi: 10.1016/S1553-7250(11)37029-8. PubMed
9. McJoynt TA, Hirzallah MA, Satele DV et al. Building a protocol expressway: the case of Mayo Clinic Cancer Center. J Clin Oncol. 2009;27(23):3855-3860. doi: 10.1200/JCO.2008.21.4338. PubMed
10. Blanchard BS, Fabrycky WJ. Systems Engineering and Analysis. 5th ed. Englewood Cliffs: Prentice Hall; 2010.
11. Segev D, Levi R, Dunn PF, Sandberg WS. Modeling the impact of changing patient transportation systems on peri-operative process performance in a large hospital: insights from a computer simulation study. Health Care Manag Sci. 2012;15(2):155-169. doi: 10.1007/s10729-012-9191-1. PubMed
12. Schoenmeyr T, Dunn PF, Gamarnik D, et al. A model for understanding the impacts of demand and capacity on waiting time to enter a congested recovery room. Anesthesiology. 2009;110(6):1293-1304. doi: 10.1097/ALN.0b013e3181a16983 PubMed
13. Levin SR, Dittus R, Aronsky D, et al. Optimizing cardiology capacity to reduce emergency department boarding: a systems engineering approach. Am Heart J. 2008;156(6):1202-1209. doi: 10.1016/j.ahj.2008.07.007. PubMed
14. Bryson C, Boynton G, Stepczynski A, et al. Geographical assignment of hospitalists in an urban teaching hospital: feasibility and impact on efficiency and provider satisfaction. Hosp Pract. 2017;45(4):135-142. doi: 10.1080/21548331.2017.1353884. PubMed
15. Artenstein AW, Higgins TL, Seiler A, et al. Promoting high value inpatient care via a coaching model of structured, interdisciplinary team rounds. Br J Hosp Med (Lond). 2015;76(1):41-45. doi: 10.12968/hmed.2015.76.1.41. PubMed
16. O’Leary KJ, Wayne DB, Landler MP, et al. Impact of localizing physicians to hospital units on nurse-physician communication and agreement on the plan of care. J Gen Intern Med. 2009;24(11):1223-1227. doi: 10.1007/s11606-009-1113-7. PubMed
17. Dunn AS, Reyna M, Radbill B, et al. The impact of bedside interdisciplinary rounds on length of stay and complications. J Hosp Med. 2017;12(3):137-142. doi: 10.12788/jhm.2695. PubMed
18. Accreditation Council for Graduate Medical Education. Common program requirements. Chicago, IL; 2011.
19. Eldabi T, Irani Z, Paul RJ. A proposed approach for modelling health-care systems for understanding. J Manag Med. 2002;16(2-3):170-187. PubMed
20. Block L, Habicht R, Wu AW, et al. In the wake of the 2003 and 2011 duty hours regulations, how do internal medicine interns spend their time? J Gen Intern Med. 2013;28(8):1042-1047. doi: 10.1007/s11606-013-2376-6. PubMed
21. Tipping MD, Forth VE, Magill DB, Englert K, Williams MV. Systematic review of time studies evaluating physicians in the hospital setting. J Hosp Med. 2010;5(6):353-359. doi: 10.1002/jhm.647. PubMed
22. Cady R, Finkelstein S, Lindgren B, et al. Exploring the translational impact of a home telemonitoring intervention using time-motion study. Telemed J e Health. 2010;16(5):576-584. doi: 10.1089/tmj.2009.0148. PubMed
23. Rother M, Shook J. Learning to See: Value Stream Mapping to Add Value and Eliminate Muda. Cambridge, MA: Lean Enterprise Institute, Inc; 2009.
24. Terwiesch C, Diwas KC, Kahn JM. Working with capacity limitations: operations management in critical care. Crit Care. 2011;15(4):308. doi: 10.1186/cc10217. PubMed
© 2019 Society of Hospital Medicine