User login
Leadership and Professional Development: The Healing Power of Laughter
“The most radical act anyone can commit is to be happy.”
—Patch Adams
“The most radical act anyone can commit is to be happy.”
—Patch Adams
“The most radical act anyone can commit is to be happy.”
—Patch Adams
© 2019 Society of Hospital Medicine
Electronic health records linked to lower patient safety
Higher reliance on electronic health records (EHRs) in ambulatory oncology practice was significantly associated with reduced safety actions among oncology nurses and prescribers, according to results of a statewide survey.
“The purpose of this study was to investigate the degree to which EHRs, satisfaction with technology, and clinician communication enable a safety culture in ambulatory oncology treatment settings,” wrote Minal R. Patel, PhD, MPH, of the University of Michigan, Ann Arbor, and colleagues. The report is published in the Journal of Oncology Practice.
The researchers conducted a statewide survey of 297 oncology nurses and prescribers in 29 ambulatory oncology practices in Michigan. They obtained quantitative data for May to October 2017 from clinician surveys and practice logs at these clinical sites.
The study methodology was built by use of the sociotechnical framework, which examined how EHR technologies influenced the safe administration of chemotherapy.
Eligible survey participants included physicians, nurses, physician assistants, and nurse practitioners who cared for adult patients receiving infusion treatments for cancer.
A total of 438 clinicians were recruited and confirmed to be eligible, and 297 (68%) completed a survey.
After analysis, the researchers found that higher reliance on electronic health records in practice was associated with reduced safety scores (P less than .001). The mean safety score was reported to be 5.3 (standard deviation, 1.1; practice-level range, 4.9-5.4).
In an opposite manner, increased satisfaction with technology and better-quality communication were associated with higher safety actions.
The researchers acknowledged a key limitation of the study was cross-sectional design. As a result, confounding factors could influence the findings.
“Careful attention to technology adoption and updates coupled with high-quality communication skills across clinicians are promising strategies to administer high-risk treatments safely in ambulatory oncology settings,” they concluded.
The study was supported by grant funding from the Agency for Healthcare Research and Quality and the National Cancer Institute. No conflicts of interest were reported.
SOURCE: Patel MR et al. J Oncol Pract. 2019 Apr 22. doi: 10.1200/JOP.18.00507.
FROM JOURNAL OF ONCOLOGY PRACTICE
Focus on Science, Not Format: Introducing No Hassle Submissions to the Journal of Hospital Medicine
The Journal of Hospital Medicine® is committed to continually improving the author experience. Our goal is to allow authors to focus more time on communicating their message and less time on navigating the submission and publication process. We commit to three initial areas of emphasis: (1) Make it easy for authors to submit their work; (2) Make timely disposition decisions; and (3) Facilitate dissemination of work that we publish.
We are pleased to introduce a new “No hassle” process for initial original research and brief report manuscript submissions. There is no universally followed format for manuscript submission to medical journals.1-3 As a result, authors spend considerable time reformatting manuscripts for submission to meet each journal’s unique requirements before knowing whether or not their manuscript will be accepted for publication—or even sent for peer review. To streamline the submission process and eliminate unnecessary and burdensome reformatting, we have eased formatting requirements for initial manuscript submissions. We will even accept all manuscript elements in a single PDF (portable document format) file in another journal’s format if your manuscript was submitted elsewhere first but not accepted for publication. Tables and figures can be included in the single document or uploaded separately, depending on your preference. Of course, common elements necessary to assess a manuscript, including declaration of funding sources and conflicts of interest, are required on the title page.1 Journal-specific formatting and signed disclosure and copyright forms will be deferred until a revision request.
We also seek to make timely decisions. Our rapid turnaround allows authors to submit elsewhere expeditiously if not accepted by the Journal of Hospital Medicine. We reject approximately 50% of original research and brief report manuscripts without formal peer review. The rationale for this approach is two-fold. We want to be respectful of how we engage our peer reviewers and we would rather not have them spend time reviewing manuscripts that we are unlikely to publish. We also want to be respectful of our authors’ time. If we are unlikely to publish a manuscript based on lower priority scores assigned by the Editor-in-Chief and other journal editors, we prefer to return the manuscript to authors for timely submission elsewhere. Our average time from submission to rejection without formal peer review is 1.3 days (median, <1 day). If we send a manuscript out for peer review, our time from submission to first decision is 23 days. Further, if we request a manuscript revision, we sincerely hope to publish the manuscript. Thus, most manuscripts for which we request a revision are ultimately accepted for publication. We are also tracking how quickly we can publish accepted manuscripts with a goal of 120 or fewer days from submission to publication and 60 or fewer days from acceptance to publication.
We highlight our published research in many ways to facilitate dissemination. We promote articles through formal press releases, tweets, visual abstracts, and, more recently, graphic medicine abstracts or comics. Select articles are discussed through our online journal club (#JHMChat).4 Other synergistic methods of dissemination are being planned and we’ll share these ideas with you in the coming year.
We are grateful to receive a large number of submissions and are honored that authors view the Journal of Hospital Medicine as an important venue to showcase their work. We continually strive to improve the author experience and welcome your input.
1. International Committee of Medical Journal Editors. Recommendations for the conduct, reporting, editing, and publication of scholarly work in medical journals. Updated December 2018. www.icmje.org/recommendations/browse/. Accessed April 2, 2019. PubMed
2. Schriger DL, Arora S, Altman DG. The content of medical journal instructions for authors. Ann Emerg Med. 2006;48(6):743-749. doi: 10.1016/j.annemergmed.2006.03.028 PubMed
3. Barron JP. The uniform requirements for manuscripts submitted to biomedical journals recommended by the International Committee of Medical Journal Editors. Chest. 2006;129(4):1098-1099. doi: 10.1378/chest.129.4.1098. PubMed
4. Wray CM, Auerbach AD, Arora VM. The adoption of an online journal club to improve research dissemination and social media engagement among hospitalists. J Hosp Med. 2018;13(11):764-769. doi: 10.12788/jhm.2987. PubMed
The Journal of Hospital Medicine® is committed to continually improving the author experience. Our goal is to allow authors to focus more time on communicating their message and less time on navigating the submission and publication process. We commit to three initial areas of emphasis: (1) Make it easy for authors to submit their work; (2) Make timely disposition decisions; and (3) Facilitate dissemination of work that we publish.
We are pleased to introduce a new “No hassle” process for initial original research and brief report manuscript submissions. There is no universally followed format for manuscript submission to medical journals.1-3 As a result, authors spend considerable time reformatting manuscripts for submission to meet each journal’s unique requirements before knowing whether or not their manuscript will be accepted for publication—or even sent for peer review. To streamline the submission process and eliminate unnecessary and burdensome reformatting, we have eased formatting requirements for initial manuscript submissions. We will even accept all manuscript elements in a single PDF (portable document format) file in another journal’s format if your manuscript was submitted elsewhere first but not accepted for publication. Tables and figures can be included in the single document or uploaded separately, depending on your preference. Of course, common elements necessary to assess a manuscript, including declaration of funding sources and conflicts of interest, are required on the title page.1 Journal-specific formatting and signed disclosure and copyright forms will be deferred until a revision request.
We also seek to make timely decisions. Our rapid turnaround allows authors to submit elsewhere expeditiously if not accepted by the Journal of Hospital Medicine. We reject approximately 50% of original research and brief report manuscripts without formal peer review. The rationale for this approach is two-fold. We want to be respectful of how we engage our peer reviewers and we would rather not have them spend time reviewing manuscripts that we are unlikely to publish. We also want to be respectful of our authors’ time. If we are unlikely to publish a manuscript based on lower priority scores assigned by the Editor-in-Chief and other journal editors, we prefer to return the manuscript to authors for timely submission elsewhere. Our average time from submission to rejection without formal peer review is 1.3 days (median, <1 day). If we send a manuscript out for peer review, our time from submission to first decision is 23 days. Further, if we request a manuscript revision, we sincerely hope to publish the manuscript. Thus, most manuscripts for which we request a revision are ultimately accepted for publication. We are also tracking how quickly we can publish accepted manuscripts with a goal of 120 or fewer days from submission to publication and 60 or fewer days from acceptance to publication.
We highlight our published research in many ways to facilitate dissemination. We promote articles through formal press releases, tweets, visual abstracts, and, more recently, graphic medicine abstracts or comics. Select articles are discussed through our online journal club (#JHMChat).4 Other synergistic methods of dissemination are being planned and we’ll share these ideas with you in the coming year.
We are grateful to receive a large number of submissions and are honored that authors view the Journal of Hospital Medicine as an important venue to showcase their work. We continually strive to improve the author experience and welcome your input.
1. International Committee of Medical Journal Editors. Recommendations for the conduct, reporting, editing, and publication of scholarly work in medical journals. Updated December 2018. www.icmje.org/recommendations/browse/. Accessed April 2, 2019. PubMed
2. Schriger DL, Arora S, Altman DG. The content of medical journal instructions for authors. Ann Emerg Med. 2006;48(6):743-749. doi: 10.1016/j.annemergmed.2006.03.028 PubMed
3. Barron JP. The uniform requirements for manuscripts submitted to biomedical journals recommended by the International Committee of Medical Journal Editors. Chest. 2006;129(4):1098-1099. doi: 10.1378/chest.129.4.1098. PubMed
4. Wray CM, Auerbach AD, Arora VM. The adoption of an online journal club to improve research dissemination and social media engagement among hospitalists. J Hosp Med. 2018;13(11):764-769. doi: 10.12788/jhm.2987. PubMed
© 2019 Society of Hospital Medicine
Things We Do For No Reason: HIT Testing in Low Probability Patients
Inspired by the ABIM Foundation’s Choosing Wisely® campaign, the “Things We Do for No Reason” series reviews practices which have become common parts of hospital care but which may provide little value to our patients. Practices reviewed in the TWDFNR series do not represent “black and white” conclusions or clinical practice standards, but are meant as a starting place for research and active discussions among hospitalists and patients. We invite you to be part of that discussion.
CLINICAL SCENARIO
A 59-year-old man with cirrhosis secondary to nonalcoholic steatohepatitis was admitted to the intensive care unit (ICU) for management of hepatorenal syndrome and work-up for liver transplantation. On admission, his platelet count was 90 × 109/L (normal 150-400 × 109/L), and he was started on thromboprophylaxis with unfractionated heparin (UFH) 5,000 units subcutaneously twice daily. His platelet count began to fall two days after admission. He did have a history of prior heparin exposure associated with his hemodialysis sessions in the past 30 days. During this period, he also had an episode of fever, and antibiotics were initiated for a presumed line infection. He also required periodic vasopressor support for hypotension. His platelet count reached 14 × 109/L by the end of two weeks. He did not have any symptoms of thrombosis, skin necrosis, or reaction to heparin exposure.
BACKGROUND
Thrombocytopenia is common, especially during critical illness, occurring in up to 50% of patients.1 In this population, thrombocytopenia is often due to sepsis, hemorrhage, liver dysfunction, and drug reactions.1,2 Heparin-induced thrombocytopenia (HIT) is an acquired thrombotic drug reaction resulting from platelet activation secondary to antibodies formed against the heparin-modified platelet factor 4 (PF4) complexes.3 This leads to platelet aggregation and dysregulation of the coagulation cascade, which can result in arterial or venous thromboembolic events in up to 50% of patients.3 Mortality associated with HIT can be as high as 30% in this critically ill population.3 Diagnosis of HIT can be made initially through the enzyme-linked immunosorbent assay (ELISA). Management of HIT involves immediate cessation of heparin and initiation of therapeutic anticoagulation with nonheparin agents in order to prevent or treat the thrombotic events.4,5
The true incidence of HIT remains low, occurring in 0.2% to 5% of patients exposed to heparin and less than 1% in the ICU population.2,3,6,7 However, given the high incidence of thrombocytopenia in the ICU, the diagnosis of HIT is often considered, resulting in over-testing in this population. Studies suggest that more than 200 ELISAs are requested per year at many hospitals.8,9 This can lead to significant clinical and economic consequences.
WHY YOU MIGHT THINK HIT TESTING WITH ELISA IS HELPFUL
Thrombocytopenia is common in hospitalized patients while heparin is frequently used for thromboprophylaxis or therapeutic anticoagulation. As a result, a diagnosis of HIT is often considered.1 The high stakes of the inpatient environment, coupled with the increased frequency of thrombocytopenia and heparin exposure, has led to increased use of HIT testing in this population.10
The most widely available diagnostic test for HIT is the ELISA which detects anti-PF4-heparin antibodies but also nonpathogenic antibodies.11 As a result, the ELISA has a sensitivity close to 100%, allowing physicians to rule out HIT if the test is negative, as indicated by an optical density (OD) of less than 0.4.7 Confirmatory testing with the functional serotonin release assay (SRA) is the reference standard as it confers both a high sensitivity and specificity for HIT.11 Due to technical aspects, SRA, unlike the ELISA, is not available in every center and is often outsourced to external labs. Turn-around time for external SRA testing can vary from days to weeks versus hours for the ELISA. The cost for SRA is approximately $120 (USD) per test compared to $30 (USD) per ELISA. Therefore, the ELISA is the recommended initial test due to its quick turn-around time and lower costs.12,13 For these reasons, the SRA test should not be used initially, but rather to confirm the diagnosis of HIT in patients with a positive ELISA.
WHY YOU SHOULD NOT TEST LOW PROBABILITY PATIENTS FOR HIT
The “4T’s” scoring system is a clinical scoring system that estimates the pretest probability of HIT using clinical and basic laboratory parameters (Table).14 The 4T’s score provides a pretest probability for HIT using four parameters: platelet count, timing of platelet fall, presence of thrombotic events, and the likelihood of another cause of thrombocytopenia. Based on these parameters, the pretest probability for HIT can be divided into three categories: low (4T’s score of ≤3), intermediate (score 4-5), or high (score 6-8).14-16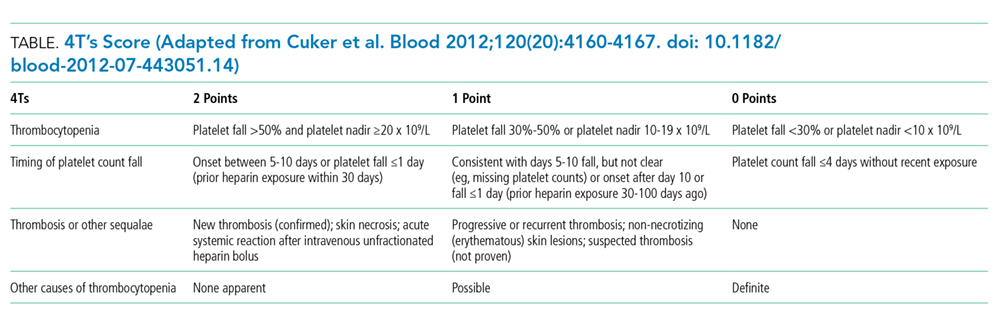
Validation of the 4T’s score has shown that a low probability score carries a negative predictive value of 99% in a patient population with varying HIT prevalence rates.14 Therefore, having a low score is sufficient to rule out HIT without the need for further laboratory testing.14-16 Although the HIT ELISA confers high sensitivity, due to its detection of nonpathogenic antibodies, its specificity can range from 74% to 84%.15 Therefore, in the setting of a low 4T’s score, HIT testing is not only unnecessary, it can be harmful due to the risk of treating a false positive result. For instance, assuming an average HIT prevalence of 1% and a false positive rate of 16% (specificity 84%), 1/17 (5.6%) patients with a positive ELISA will have HIT if testing is pursued in an indiscriminate manner. The American Society of Hematology Choosing Wisely® Campaign has highlighted this concern by advising physicians that they should “not test or treat for suspected HIT in patients with a low pretest probability of HIT.”17
False positive results on HIT tests are not a trivial concern. The most recognizable adverse event associated with HIT treatment is an elevated risk of bleeding while receiving nonheparin agents. Availability of nonheparin anticoagulants vary by center; however, the most commonly used agents include argatroban, danaparoid, bivalirudin, and off-label fondaparinux.4 Due to its short half-life and hepatic clearance, argatroban is commonly used for cases of confirmed or suspected HIT. A retrospective study assessing the bleeding risk of critically ill patients on argatroban therapy suggests a major bleeding risk of 10% within two days of argatroban initiation.18 In addition, factors such as the presence of elevated bilirubin, major surgery, weight >90 kg, and platelet count <70 × 109/L were found to be associated with increased risk for major bleeding.18 These identified risk factors are very common in the inpatient setting. As a result, monitoring and titration of argatroban can be
Over-diagnosis and over-treatment can also lead to significant costs to the healthcare system. A retrospective study assessing the use of HIT testing found that out of 218 HIT ELISA’s sent over a one-year period at a single institution, 161 (74%) were sent inappropriately (ie, in patients with a low pretest probability), with only one resulting in confirmed HIT by SRA. This incurred an additional cost of $33,000 (USD) for testing alone.8 A retrospective study of 85 patients assessed the costs of treating patients with a false positive HIT assay. They found that the average duration of treatment with a nonheparin agent was three days and the total cost per patient was $982 (USD).19 Treatment with a nonheparin agent such as argatroban costs more than $700 (USD) per day while the continuation of unfractionated heparin for prophylaxis costs less than $10 (USD) per day.20Lastly, a diagnosis of HIT can also result in late consequences due to heparin re-exposure. Clinicians may be wary of exposing patients to heparin in situations where heparin may be the most appropriate agent such as cardiovascular surgery, percutaneous interventions, routine thromboprophylaxis, or therapeutic anticoagulation. In these situations when heparin is the agent of choice, determining safety for re-exposure requires further antibody testing which may delay procedures or result in the use of alternative agents with their associated risks and cost implications.4
WHEN HIT TESTING WITH ELISA MAY BE HELPFUL
Laboratory testing for HIT is appropriate when the pretest probability for HIT is intermediate or high based on the 4T’s score.14-16 Studies assessing the application of the 4T’s score have shown that a moderate or high pretest probability carries a probability of having true HIT in 14% and 64% of the cases respectively.14 However, due to the subjective nature of the 4T’s score components, it is important to recognize that in nonexpert hands, the 4T’s scoring system can suffer from a lack of interrater reliability.16
As discussed above, a negative ELISA (OD < 0.4) helps to rule out HIT and allow heparin to be safely reintroduced without any further testing. If ELISA is positive (OD ≥ 0.4) confirmation testing with SRA should be performed.5 However, studies suggest that the magnitude of the OD is associated with increased likelihood for true HIT, with an OD of greater than 2.00 associated with a positive SRA approximately 90% of the time.21 This suggests that if OD values are strongly positive (≥2.00), SRA can be deferred.5
Due to the SRA limited availability, confirmatory testing is not always possible or in some situations, SRA results may be negative despite a positive OD. In both these cases, discussion with the Hematology service is recommended.
WHAT WE SHOULD DO INSTEAD OF SENDING ELISA
When presented with a case of thrombocytopenia, it is important for clinicians to consider a broad approach in their differential diagnosis. Hospitalists should investigate common etiologies, consider the coagulation parameters, liver enzymes, nutritional status, peripheral blood smear, and a detailed history and physical exam to identify other common potential cause such as sepsis.
The 4T’s score should be applied in patients who have had recent heparin exposure. A score of ≤3 indicates a low pretest probability; therefore, HIT is unlikely and further testing is not needed. A score of ≥4 indicates an intermediate or high pretest probability and should prompt clinicians to consider further HIT testing with ELISA. In these situations, heparin should be held, and nonheparin agents should be initiated to prevent thromboembolic complications. In their study of ICU patients, Pierce et al. found that 17% of patients did not have a concurrent cessation of heparin and initiation of alternative agents despite a high clinical suspicion for HIT.1 Lastly, if hospitalists have concerns regarding HIT testing or management, expert consultation with the Hematology service is recommended.
RECOMMENDATIONS
- Consider a broad differential diagnosis when presented with a hospitalized patient with new thrombocytopenia given the low incidence of HIT (<5%).
- Apply the 4T’s score in those who have thrombocytopenia and recent heparin exposure. A low scores 4T’s score (≤3) predicts a low pretest probability and further testing is not required.
- Patients with moderate or high 4T’s score (≥4) should have the ELISA test. During this time, heparin should be discontinued and nonheparin agents initiated while waiting for test results.
- Confirmatory testing with SRA should be performed for all positive ELISAs; however, they can be deferred in patients with strongly positive OD (≥2.00) on ELISA.
CONCLUSION
In the opening clinical scenario, the 4T’s score would have been 2 (1 point for the platelet count, 1 point for the platelet count fall after 10 days, 0 points for thrombosis, and 0 points for an alternative cause of thrombocytopenia), indicating a low pretest probability. Further HIT testing should be deferred as the likelihood for HIT is low. In this case, the more likely etiology for his thrombocytopenia would be sepsis. Therefore, heparin can be safely reinitiated once the platelet count recovers. This case helps to illustrate the importance of keeping a broad differential in cases of thrombocytopenia in the hospitalized patient while concurrently applying the 4T’s score to determine appropriateness for further HIT testing. Ultimately by choosing wisely, we can help reduce the cost and safety implications of a falsely positive HIT diagnosis.
What do you do?
Do you think this is a low-value practice? Is this truly a “Thing We Do for No Reason”? Let us know what you do in your practice and propose ideas for other “Things We Do for No Reason” topics. Please join in the conversation online at Twitter (#TWDFNR)/Facebook and don’t forget to “Like It” on Facebook or retweet it on Twitter.
Disclosures
The authors report no conflict of interest.
1. Pierce W, Mazur J, Greenberg C, Mueller J, Foster J, Lazarchick J. Evaluation of heparin-induced thrombocytopenia (HIT) laboratory testing and the 4Ts scoring system in the intensive care unit. Ann Clin Lab Sci. 2013;43(4):429-435. PubMed
2. Harada MY, Hoang DM, Zaw AA, et al. Overtreatment of heparin-induced thrombocytopenia in the surgical ICU. Crit Care Med. 2017;45(1):28-34. doi:10.1097/ccm.0000000000002002. PubMed
3. Warkentin TE, Sheppard JAI, Heels-Ansdell D, et al. Heparin-induced thrombocytopenia in medical-surgical critical illness. Chest. 2013;144(3):848-858. doi: 10.1378/chest.13-0057. PubMed
4. Linkins LA, Dans AL, Moores LK, et al. Treatment and prevention of heparin-induced thrombocytopenia. Chest. 2012;141(2):e495S-e530S. doi: 10.1378/chest.11-2303. PubMed
5. Cuker A, Arepally GM, Chong BH, et al. American Society of Hematology 2018 guidelines for management of venous thromboembolism: heparin-induced thrombocytopenia. Blood Adv. 2018;2(22):3360-3392. doi: 10.1182/bloodadvances.2018024489. PubMed
6. Lo GK, Juhl D, Warkentin TE, Sigouin CS, Eichler P, Greinacher A. Evaluation of pretest clinical score (4 T’s) for the diagnosis of heparin-induced thrombocytopenia in two clinical settings. J Thromb Haemost. 2006;4(4):759-765. doi: 10.1111/j.1538-7836.2006.01787.x PubMed
7. Cuker A, Cines DB. How I treat heparin-induced thrombocytopenia. Blood. 2012;119(10):2209-2218. doi: 10.1182/blood-2011-11-376293. PubMed
8. Elmer P, Passero FC, Xavier M. Retrospective Analysis of Heparin-Induced Thrombocytopenia Management at a Large Tertiary Hospital. J Hematol. 2014;3(2):27-33. doi: http://dx.doi.org/10.14740/jh157w.
9. Goldman R, Ustun B, Levine RL. Retrospective cost analysis of testing for HIT antibodies in a community hospital. Blood. 2008;112(11):4544.
10. Cuker A. Heparin-induced thrombocytopenia (HIT) in 2011: an epidemic of overdiagnosis. Thromb Haemost. 2011;106(6):993-994. doi: 10.1160/TH11-09-0677.
11. Warkentin TE. Heparin-induced thrombocytopenia in critically ill patients. Semin Thromb Hemost. 2015;41(5):49-60. doi: 10.1055/s-0034-1398381. PubMed
12. Caton S, O’Brien E, Pannelay AJ, Cook RG. Assessing the clinical and cost impact of on-demand immunoassay testing for the diagnosis of heparin-induced thrombocytopenia. Thromb Res. 2016;140:155-162. doi: 10.1016/j.thromres.2016.01.025 PubMed
13. Nanwa N, Mittmann N, Knowles S, et al. The direct medical costs associated with suspected heparin-induced thrombocytopenia. Pharmacoeconomics. 2011;29(6):511-520. doi: 10.2165/11584330-000000000-00000. PubMed
14. Cuker A, Gimotty PA, Crowther MA, Warkentin TE. Predictive value of the 4Ts scoring system for heparin-induced thrombocytopenia: a systematic review and meta-analysis. Blood. 2012;120(20):4160-4167. doi: 10.1182/blood-2012-07-443051. PubMed
15. Fiorenza MA, Frazee EN, Personett HA, Dierkhising RA, Schramm GE. Assessment of a modified 4T scoring system for heparin-induced thrombocytopenia in critically ill patients. J Crit Care. 2014;29(3):426-431. doi: 10.1016/j.jcrc.2013.12.010. PubMed
16. Crowther M, Cook D, Guyatt G, et al. Heparin-induced thrombocytopenia in the critically ill: interpreting the 4Ts test in a randomized trial. J Crit Care. 2014;29(3):470.e7-470.e15 doi: 10.1016/j.jcrc.2014.02.004. PubMed
17. Hicks LK, Bering H, Carson KR, et al. The ASH Choosing Wisely campaign: five hematologic tests and treatments to question. Blood. 2013;122(24):3879-3883. doi: 10.1182/blood-2013-07-518423. PubMed
18. Doepker B, Mount KL, Ryder LJ, Gerlach AT, Murphy CV, Philips GS. Bleeding risk factors associated with argatroban therapy in the critically ill. J Thromb Thrombolysis. 2012;34(4):491-498. doi: 10.1007/s11239-012-0758-y. PubMed
19. Marler J, Unzaga J, Stelts S, Oliphant CS. Consequences of treating false positive heparin-induced thrombocytopenia. J Thromb Thrombolysis. 2015;40(4):512-514. doi: 10.1007/s11239-015-1236-0. PubMed
20. Fowler RA, Mittmann N, Geerts W, et al. Cost-effectiveness of dalteparin vs unfractionated heparin for the prevention of venous thromboembolism in critically ill patients. JAMA. 2014;312(20):2135-2145. doi: 10.1001/jama.2014.15101. PubMed
21. Warkentin TE, Sheppard JI, Moore JC, Sigouin CS, Kelton JG. Quantitative interpretation of optical density measurements using PF4-dependent enzyme-immunoassays. J Thromb Haemost. 2008;6(8):1304-1312. doi: 10.1111/j.1538-7836.2008.03025.x. PubMed
Inspired by the ABIM Foundation’s Choosing Wisely® campaign, the “Things We Do for No Reason” series reviews practices which have become common parts of hospital care but which may provide little value to our patients. Practices reviewed in the TWDFNR series do not represent “black and white” conclusions or clinical practice standards, but are meant as a starting place for research and active discussions among hospitalists and patients. We invite you to be part of that discussion.
CLINICAL SCENARIO
A 59-year-old man with cirrhosis secondary to nonalcoholic steatohepatitis was admitted to the intensive care unit (ICU) for management of hepatorenal syndrome and work-up for liver transplantation. On admission, his platelet count was 90 × 109/L (normal 150-400 × 109/L), and he was started on thromboprophylaxis with unfractionated heparin (UFH) 5,000 units subcutaneously twice daily. His platelet count began to fall two days after admission. He did have a history of prior heparin exposure associated with his hemodialysis sessions in the past 30 days. During this period, he also had an episode of fever, and antibiotics were initiated for a presumed line infection. He also required periodic vasopressor support for hypotension. His platelet count reached 14 × 109/L by the end of two weeks. He did not have any symptoms of thrombosis, skin necrosis, or reaction to heparin exposure.
BACKGROUND
Thrombocytopenia is common, especially during critical illness, occurring in up to 50% of patients.1 In this population, thrombocytopenia is often due to sepsis, hemorrhage, liver dysfunction, and drug reactions.1,2 Heparin-induced thrombocytopenia (HIT) is an acquired thrombotic drug reaction resulting from platelet activation secondary to antibodies formed against the heparin-modified platelet factor 4 (PF4) complexes.3 This leads to platelet aggregation and dysregulation of the coagulation cascade, which can result in arterial or venous thromboembolic events in up to 50% of patients.3 Mortality associated with HIT can be as high as 30% in this critically ill population.3 Diagnosis of HIT can be made initially through the enzyme-linked immunosorbent assay (ELISA). Management of HIT involves immediate cessation of heparin and initiation of therapeutic anticoagulation with nonheparin agents in order to prevent or treat the thrombotic events.4,5
The true incidence of HIT remains low, occurring in 0.2% to 5% of patients exposed to heparin and less than 1% in the ICU population.2,3,6,7 However, given the high incidence of thrombocytopenia in the ICU, the diagnosis of HIT is often considered, resulting in over-testing in this population. Studies suggest that more than 200 ELISAs are requested per year at many hospitals.8,9 This can lead to significant clinical and economic consequences.
WHY YOU MIGHT THINK HIT TESTING WITH ELISA IS HELPFUL
Thrombocytopenia is common in hospitalized patients while heparin is frequently used for thromboprophylaxis or therapeutic anticoagulation. As a result, a diagnosis of HIT is often considered.1 The high stakes of the inpatient environment, coupled with the increased frequency of thrombocytopenia and heparin exposure, has led to increased use of HIT testing in this population.10
The most widely available diagnostic test for HIT is the ELISA which detects anti-PF4-heparin antibodies but also nonpathogenic antibodies.11 As a result, the ELISA has a sensitivity close to 100%, allowing physicians to rule out HIT if the test is negative, as indicated by an optical density (OD) of less than 0.4.7 Confirmatory testing with the functional serotonin release assay (SRA) is the reference standard as it confers both a high sensitivity and specificity for HIT.11 Due to technical aspects, SRA, unlike the ELISA, is not available in every center and is often outsourced to external labs. Turn-around time for external SRA testing can vary from days to weeks versus hours for the ELISA. The cost for SRA is approximately $120 (USD) per test compared to $30 (USD) per ELISA. Therefore, the ELISA is the recommended initial test due to its quick turn-around time and lower costs.12,13 For these reasons, the SRA test should not be used initially, but rather to confirm the diagnosis of HIT in patients with a positive ELISA.
WHY YOU SHOULD NOT TEST LOW PROBABILITY PATIENTS FOR HIT
The “4T’s” scoring system is a clinical scoring system that estimates the pretest probability of HIT using clinical and basic laboratory parameters (Table).14 The 4T’s score provides a pretest probability for HIT using four parameters: platelet count, timing of platelet fall, presence of thrombotic events, and the likelihood of another cause of thrombocytopenia. Based on these parameters, the pretest probability for HIT can be divided into three categories: low (4T’s score of ≤3), intermediate (score 4-5), or high (score 6-8).14-16
Validation of the 4T’s score has shown that a low probability score carries a negative predictive value of 99% in a patient population with varying HIT prevalence rates.14 Therefore, having a low score is sufficient to rule out HIT without the need for further laboratory testing.14-16 Although the HIT ELISA confers high sensitivity, due to its detection of nonpathogenic antibodies, its specificity can range from 74% to 84%.15 Therefore, in the setting of a low 4T’s score, HIT testing is not only unnecessary, it can be harmful due to the risk of treating a false positive result. For instance, assuming an average HIT prevalence of 1% and a false positive rate of 16% (specificity 84%), 1/17 (5.6%) patients with a positive ELISA will have HIT if testing is pursued in an indiscriminate manner. The American Society of Hematology Choosing Wisely® Campaign has highlighted this concern by advising physicians that they should “not test or treat for suspected HIT in patients with a low pretest probability of HIT.”17
False positive results on HIT tests are not a trivial concern. The most recognizable adverse event associated with HIT treatment is an elevated risk of bleeding while receiving nonheparin agents. Availability of nonheparin anticoagulants vary by center; however, the most commonly used agents include argatroban, danaparoid, bivalirudin, and off-label fondaparinux.4 Due to its short half-life and hepatic clearance, argatroban is commonly used for cases of confirmed or suspected HIT. A retrospective study assessing the bleeding risk of critically ill patients on argatroban therapy suggests a major bleeding risk of 10% within two days of argatroban initiation.18 In addition, factors such as the presence of elevated bilirubin, major surgery, weight >90 kg, and platelet count <70 × 109/L were found to be associated with increased risk for major bleeding.18 These identified risk factors are very common in the inpatient setting. As a result, monitoring and titration of argatroban can be
Over-diagnosis and over-treatment can also lead to significant costs to the healthcare system. A retrospective study assessing the use of HIT testing found that out of 218 HIT ELISA’s sent over a one-year period at a single institution, 161 (74%) were sent inappropriately (ie, in patients with a low pretest probability), with only one resulting in confirmed HIT by SRA. This incurred an additional cost of $33,000 (USD) for testing alone.8 A retrospective study of 85 patients assessed the costs of treating patients with a false positive HIT assay. They found that the average duration of treatment with a nonheparin agent was three days and the total cost per patient was $982 (USD).19 Treatment with a nonheparin agent such as argatroban costs more than $700 (USD) per day while the continuation of unfractionated heparin for prophylaxis costs less than $10 (USD) per day.20Lastly, a diagnosis of HIT can also result in late consequences due to heparin re-exposure. Clinicians may be wary of exposing patients to heparin in situations where heparin may be the most appropriate agent such as cardiovascular surgery, percutaneous interventions, routine thromboprophylaxis, or therapeutic anticoagulation. In these situations when heparin is the agent of choice, determining safety for re-exposure requires further antibody testing which may delay procedures or result in the use of alternative agents with their associated risks and cost implications.4
WHEN HIT TESTING WITH ELISA MAY BE HELPFUL
Laboratory testing for HIT is appropriate when the pretest probability for HIT is intermediate or high based on the 4T’s score.14-16 Studies assessing the application of the 4T’s score have shown that a moderate or high pretest probability carries a probability of having true HIT in 14% and 64% of the cases respectively.14 However, due to the subjective nature of the 4T’s score components, it is important to recognize that in nonexpert hands, the 4T’s scoring system can suffer from a lack of interrater reliability.16
As discussed above, a negative ELISA (OD < 0.4) helps to rule out HIT and allow heparin to be safely reintroduced without any further testing. If ELISA is positive (OD ≥ 0.4) confirmation testing with SRA should be performed.5 However, studies suggest that the magnitude of the OD is associated with increased likelihood for true HIT, with an OD of greater than 2.00 associated with a positive SRA approximately 90% of the time.21 This suggests that if OD values are strongly positive (≥2.00), SRA can be deferred.5
Due to the SRA limited availability, confirmatory testing is not always possible or in some situations, SRA results may be negative despite a positive OD. In both these cases, discussion with the Hematology service is recommended.
WHAT WE SHOULD DO INSTEAD OF SENDING ELISA
When presented with a case of thrombocytopenia, it is important for clinicians to consider a broad approach in their differential diagnosis. Hospitalists should investigate common etiologies, consider the coagulation parameters, liver enzymes, nutritional status, peripheral blood smear, and a detailed history and physical exam to identify other common potential cause such as sepsis.
The 4T’s score should be applied in patients who have had recent heparin exposure. A score of ≤3 indicates a low pretest probability; therefore, HIT is unlikely and further testing is not needed. A score of ≥4 indicates an intermediate or high pretest probability and should prompt clinicians to consider further HIT testing with ELISA. In these situations, heparin should be held, and nonheparin agents should be initiated to prevent thromboembolic complications. In their study of ICU patients, Pierce et al. found that 17% of patients did not have a concurrent cessation of heparin and initiation of alternative agents despite a high clinical suspicion for HIT.1 Lastly, if hospitalists have concerns regarding HIT testing or management, expert consultation with the Hematology service is recommended.
RECOMMENDATIONS
- Consider a broad differential diagnosis when presented with a hospitalized patient with new thrombocytopenia given the low incidence of HIT (<5%).
- Apply the 4T’s score in those who have thrombocytopenia and recent heparin exposure. A low scores 4T’s score (≤3) predicts a low pretest probability and further testing is not required.
- Patients with moderate or high 4T’s score (≥4) should have the ELISA test. During this time, heparin should be discontinued and nonheparin agents initiated while waiting for test results.
- Confirmatory testing with SRA should be performed for all positive ELISAs; however, they can be deferred in patients with strongly positive OD (≥2.00) on ELISA.
CONCLUSION
In the opening clinical scenario, the 4T’s score would have been 2 (1 point for the platelet count, 1 point for the platelet count fall after 10 days, 0 points for thrombosis, and 0 points for an alternative cause of thrombocytopenia), indicating a low pretest probability. Further HIT testing should be deferred as the likelihood for HIT is low. In this case, the more likely etiology for his thrombocytopenia would be sepsis. Therefore, heparin can be safely reinitiated once the platelet count recovers. This case helps to illustrate the importance of keeping a broad differential in cases of thrombocytopenia in the hospitalized patient while concurrently applying the 4T’s score to determine appropriateness for further HIT testing. Ultimately by choosing wisely, we can help reduce the cost and safety implications of a falsely positive HIT diagnosis.
What do you do?
Do you think this is a low-value practice? Is this truly a “Thing We Do for No Reason”? Let us know what you do in your practice and propose ideas for other “Things We Do for No Reason” topics. Please join in the conversation online at Twitter (#TWDFNR)/Facebook and don’t forget to “Like It” on Facebook or retweet it on Twitter.
Disclosures
The authors report no conflict of interest.
1. Pierce W, Mazur J, Greenberg C, Mueller J, Foster J, Lazarchick J. Evaluation of heparin-induced thrombocytopenia (HIT) laboratory testing and the 4Ts scoring system in the intensive care unit. Ann Clin Lab Sci. 2013;43(4):429-435. PubMed
2. Harada MY, Hoang DM, Zaw AA, et al. Overtreatment of heparin-induced thrombocytopenia in the surgical ICU. Crit Care Med. 2017;45(1):28-34. doi:10.1097/ccm.0000000000002002. PubMed
3. Warkentin TE, Sheppard JAI, Heels-Ansdell D, et al. Heparin-induced thrombocytopenia in medical-surgical critical illness. Chest. 2013;144(3):848-858. doi: 10.1378/chest.13-0057. PubMed
4. Linkins LA, Dans AL, Moores LK, et al. Treatment and prevention of heparin-induced thrombocytopenia. Chest. 2012;141(2):e495S-e530S. doi: 10.1378/chest.11-2303. PubMed
5. Cuker A, Arepally GM, Chong BH, et al. American Society of Hematology 2018 guidelines for management of venous thromboembolism: heparin-induced thrombocytopenia. Blood Adv. 2018;2(22):3360-3392. doi: 10.1182/bloodadvances.2018024489. PubMed
6. Lo GK, Juhl D, Warkentin TE, Sigouin CS, Eichler P, Greinacher A. Evaluation of pretest clinical score (4 T’s) for the diagnosis of heparin-induced thrombocytopenia in two clinical settings. J Thromb Haemost. 2006;4(4):759-765. doi: 10.1111/j.1538-7836.2006.01787.x PubMed
7. Cuker A, Cines DB. How I treat heparin-induced thrombocytopenia. Blood. 2012;119(10):2209-2218. doi: 10.1182/blood-2011-11-376293. PubMed
8. Elmer P, Passero FC, Xavier M. Retrospective Analysis of Heparin-Induced Thrombocytopenia Management at a Large Tertiary Hospital. J Hematol. 2014;3(2):27-33. doi: http://dx.doi.org/10.14740/jh157w.
9. Goldman R, Ustun B, Levine RL. Retrospective cost analysis of testing for HIT antibodies in a community hospital. Blood. 2008;112(11):4544.
10. Cuker A. Heparin-induced thrombocytopenia (HIT) in 2011: an epidemic of overdiagnosis. Thromb Haemost. 2011;106(6):993-994. doi: 10.1160/TH11-09-0677.
11. Warkentin TE. Heparin-induced thrombocytopenia in critically ill patients. Semin Thromb Hemost. 2015;41(5):49-60. doi: 10.1055/s-0034-1398381. PubMed
12. Caton S, O’Brien E, Pannelay AJ, Cook RG. Assessing the clinical and cost impact of on-demand immunoassay testing for the diagnosis of heparin-induced thrombocytopenia. Thromb Res. 2016;140:155-162. doi: 10.1016/j.thromres.2016.01.025 PubMed
13. Nanwa N, Mittmann N, Knowles S, et al. The direct medical costs associated with suspected heparin-induced thrombocytopenia. Pharmacoeconomics. 2011;29(6):511-520. doi: 10.2165/11584330-000000000-00000. PubMed
14. Cuker A, Gimotty PA, Crowther MA, Warkentin TE. Predictive value of the 4Ts scoring system for heparin-induced thrombocytopenia: a systematic review and meta-analysis. Blood. 2012;120(20):4160-4167. doi: 10.1182/blood-2012-07-443051. PubMed
15. Fiorenza MA, Frazee EN, Personett HA, Dierkhising RA, Schramm GE. Assessment of a modified 4T scoring system for heparin-induced thrombocytopenia in critically ill patients. J Crit Care. 2014;29(3):426-431. doi: 10.1016/j.jcrc.2013.12.010. PubMed
16. Crowther M, Cook D, Guyatt G, et al. Heparin-induced thrombocytopenia in the critically ill: interpreting the 4Ts test in a randomized trial. J Crit Care. 2014;29(3):470.e7-470.e15 doi: 10.1016/j.jcrc.2014.02.004. PubMed
17. Hicks LK, Bering H, Carson KR, et al. The ASH Choosing Wisely campaign: five hematologic tests and treatments to question. Blood. 2013;122(24):3879-3883. doi: 10.1182/blood-2013-07-518423. PubMed
18. Doepker B, Mount KL, Ryder LJ, Gerlach AT, Murphy CV, Philips GS. Bleeding risk factors associated with argatroban therapy in the critically ill. J Thromb Thrombolysis. 2012;34(4):491-498. doi: 10.1007/s11239-012-0758-y. PubMed
19. Marler J, Unzaga J, Stelts S, Oliphant CS. Consequences of treating false positive heparin-induced thrombocytopenia. J Thromb Thrombolysis. 2015;40(4):512-514. doi: 10.1007/s11239-015-1236-0. PubMed
20. Fowler RA, Mittmann N, Geerts W, et al. Cost-effectiveness of dalteparin vs unfractionated heparin for the prevention of venous thromboembolism in critically ill patients. JAMA. 2014;312(20):2135-2145. doi: 10.1001/jama.2014.15101. PubMed
21. Warkentin TE, Sheppard JI, Moore JC, Sigouin CS, Kelton JG. Quantitative interpretation of optical density measurements using PF4-dependent enzyme-immunoassays. J Thromb Haemost. 2008;6(8):1304-1312. doi: 10.1111/j.1538-7836.2008.03025.x. PubMed
© 2019 Society of Hospital Medicine
Occupational Hazard: Disruptive Behavior in Patients
While private or other public health care organizations can refuse to care for patients who have displayed disruptive behavior (DB), the VA Response to Disruptive Behavior of Patients law (38 CFR §17.107) prohibits the Veterans Health Administration (VHA) of the Department of Veterans Affairs (VA) from refusing care to veterans who display DB.1 The VHA defines DB as any behavior that is intimidating, threatening, or dangerous or that has, or could, jeopardize the health or safety of patients, VHA staff, or others.2
VA Response to DB Law
The VA Response to Disruptive Behavior of Patients requires the VHA to provide alternative care options that minimize risk while ensuring services; for example, providing care at a different location and/or time when additional staff are available to assist and monitor the patient. This can provide a unique opportunity to capture data on DB and the results of alternative forms of caring for this population.
The reason public health care organizations refuse care to persons who display DB is clear: DBs hinder business operations, are financially taxing, and put health care workers at risk.3-10 “In 2009, the VHA spent close to $5.5 million on workers’ compensation and medical expenditures for 425 incidents–or about $130,000 per DB incident (Hodgson M, Drummond D, Van Male L. Unpublished data, 2010).” In another study, 106 of 762 nurses in 1 hospital system reported an assault by a patient, and 30 required medical attention, which resulted in a total cost of $94,156.8 From 2002 to 2013, incidents of serious workplace violence requiring days off for an injured worker to recover on average were 4 times more common in health care than in other industries.6-11 Incidents of patient violence and aggression toward staff transcend specialization; however, hospital nurses and staff from the emergency, rehabilitation and gerontology departments, psychiatric unit, and home-based services are more susceptible and vulnerable to DB incidents than are other types of employees.8,10-19
Data reported by health care staff suggest that patients rather than staff members or visitors initiate > 70% of serious physical attacks against health care workers.9,13,20-23 A 2015 study of VHA health care providers (HCPs) found that > 60% had experienced some form of DB, verbal abuse being the most prevalent, followed by sexual abuse and physical abuse.20 Of 72,000 VHA staff responding to a nationwide survey, 13% experienced, on average, ≥ 1 assault by a veteran (eg, something was thrown at them; they were pushed, kicked, slapped; or were threatened or injured by a weapon).8,21
To meet its legal obligations and deliver empathetic care, the VHA documents and analyzes data on all patients who exhibit DB. A local DB Committee (DBC) reviews the data, whether it occurs in an inpatient or outpatient setting, such as community-based outpatient clinics. Once a DB incident is reported, the DBC begins an evidence-based risk evaluation, including the option of contacting the persons who displayed or experienced the DB. Goals are to (1) prevent future DB incidents; (2) detect vulnerabilities in the environment; and (3) collaborate with HCPs and patients to provide optimal care while improving the patient/provider interactions.
Effects of Disruptive Behavior
DB has negative consequences for both patients and health care workers and results in poor evaluations of care from both groups.27-32 Aside from interfering with safe medical care, DB also impacts care for other patients by delaying access to care and increasing appointment wait times due to employee absenteeism and staff shortages.3,4,20,32,33 For HCPs, patient violence is associated with unwillingness to provide care, briefer treatment periods, and decreases in occupational satisfaction, performance, and commitment
Harmful health effects experienced by HCPs who have been victims of DB include fear, mood disorders, anxiety, all symptoms of psychological distress and posttraumatic stress disorder (PTSD).10,22,30,34-36 In a study of the impact on productivity of PTSD triggered by job-related DB, PTSD symptoms were associated with withdrawal from or minimizing encounters with patients, job turnover, and troubles with thinking
Reporting Disruptive Behavior
The literature suggests that consistent and effective DB reporting is pivotal to improving the outcome and quality of care for those displaying DB.37-39 To provide high-quality health services to veterans who display DB, the VHA must promote the management and reporting of DB. Without knowledge of the full spectrum of DB events at VHA facilities, efforts to prevent or manage DB and ensure safety may have limited impact.7,37 Reports can be used for clinical decision making to optimize staff training in delivery of quality care while assuring staff safety. More than 80% of DB incidents occur during interactions with patients, thus this is a clinical issue that can affect the outcome of patient care.8,21
Documented DB reports are used to analyze the degree, frequency, and nature of incidents, which might reveal risk factors and develop preventive efforts and training for specific hazards.8,39 Some have argued that implementing a standardized DB reporting system is a crucial first step toward minimizing hazards and improving health care.38,40,41
When DB incidents were recorded through a hospital electronic reporting system and discussed in meetings, staff reported: (1) increased awareness of DB; (2) improved ability to manage DB incidents; and (3) amplified reporting of incidents.38,41,42 These findings support similar results from studies of an intervention implemented at VA Community Living Centers (CLCs) from 2013 to 2017: Staff Training in Assisted Living Residences (STAR-VA).4,12,19 The aim of STAR-VA was to minimize challenging dementia-related DB in CLCs. The intervention initially was established to train direct-care, assisted-living staff to provide better care to older patients displaying DB. Data revealed that documentation of DBs was, the first step to ensuring staff and patient safety.18,40
VHA Reporting System
In 2013, the VA Office of Inspector General (OIG) found no standardized documentation of DB events across the VA health care system.42 Instead, DB events were documented in multiple records in various locations, including administrative and progress notes in the electronic health record (EHR), police reports, e-mails, or letters submitted to DBC chairs.42 This situation reduced administrators’ ability to consider all relevant information and render appropriate decisions in DB cases.42 In 2015, based on OIG recommendations, the VHA implemented the Disruptive Behavior Reporting System (DBRS) nationwide, which allowed all VHA staff to report DB events. The DBRS was designed to address factors likely to impede reporting and management of DB, namely, complexity of and lack of access to a central reporting system.43,44 The DBRS is currently the primary VHA tool to document DB events.
The DBRS consists of 32 questions in 5 sections relating to the (1) location and time of DB event; (2) reporter; (3) disrupter; (4) DB event details; and (5) the person who experienced (experiencer) the event. The system also provides a list of the types of DB, such as inappropriate communication, bullying and/or intimidation, verbal or written threat of physical harm, physical violence, sexual harassment, sexual assault, and property damage. The DBRS has the potential to provide useful data on DB and DB reporting, such as the typical staff entering data and the number and/or types of DB occurring.
The DBRS complements the preexisting VHA policies and committees for care of veterans who display DB.1-3,14,21,24,25 The VHA Workplace Violence Prevention Program (WVPP) required facilities to submit data on DB events through a Workplace Behavioral Risk report. Data for the report were obtained from police reports, patient safety reports, DBC records, and notes in the EHR. Following implementations of DBRS, the number of DB events per year became a part of facility performance standards.
VHA is creating novel approaches to handling DB that allow health care workers to render care in a safe and effective manner guided by documented information. For example, DBCs can recommend the use of Category I Patient Record Flags (PRFs) following documented DB, which informs staff of the potential risk of DB and provides guidance on protective methods to use when meeting with the patient.2,21,24 A survey of 140 VA hospital chiefs of staff indicated that DBC procedures were related to a decrease in the rates of assaults.1 Additionally, VA provides training for staff in techniques to promote personal safety, such as identifying signs that precede DB, using verbal deescalation, and practicing therapeutic containment.
Resistance to Reporting
Many health care employees and employers are reticent to report DBs.22,31,43,45-48 Studies suggest health care organizations can cultivate a culture that is resistant to reporting DB.49,50 This complicates the ability of the health care system to design and maintain safety protocols and safer treatment plans.3,41,51 Worldwide, < 30% of DBs are reported.47 One barrier may be that supervisors may not wish to acknowledge DBs on their units or may not provide sufficient staff time for training or reporting.31,46,47 HCPs may worry that a DB report will stigmatize patients, especially those who are elderly or have cognitive impairment, brain injury, psychological illness, or developmental disability. Patients with cognitive conditions are reportedly 20% more likely to be violent toward caregivers and providers.31 A dementia diagnosis, for example, is associated with a high likelihood for DB.30,52 More than 80% of DB events displayed by patients with dementia may go unreported.26,31,50,52
Some clinicians may attribute DB to physiologic conditions that need to be treated, not reported. However, employers can face various legal liabilities if steps are not taken to protect employees.47,51 Federal and state statutes require that organizations provide a healthy and safe employment environment for workers. This requires that employers institute reasonable protective measures, such as procedures to intervene, policies on addressing DB incidents, and/or training to minimize or deescalate DB.51,53 Also, employees may sue employers if security measures are inadequate or deficient in properly investigating current and past evidence of DB or identifying vulnerabilities in the workplace. Unwillingness to investigate DB and safety-related workplace concerns have contributed to increased workplace violence and legal liability.52,53 The mission of caring and trust is consistent with assuring a safe environment.
Training and Empathetic Care
To combat cultural resistance to reporting DBs, more and perhaps different contextual approaches to education and training may be needed that address ethical dilemmas and concerns of providers. The success of training relies on administrators supporting staff in reporting DB. Training must address providers’ conflicting beliefs and assist with identifying strategies to provide the best possible care for patients who display DB.1,38 HCPs are less likely to document a DB if they feel that administrators are creating documentation that will have negative consequences for a patient. Thus, leadership is responsible for ensuring that misconceptions are dispelled through training and other efforts and information on how reported DB data will be used is communicated through strategic channels.
Education and training must consider empathic care that attempts to understand why patients behave as they do through the information gathered.55 Empathy in health care is multifaceted: It involves comprehending a patient’s viewpoint, circumstances, and feelings and the capacity to analyze whether one is comprehending these accurately in order to demonstrate supportive care.54,55
Improving patient and staff interaction once a problematic behavior is identified is the aim of empathic care. Increasing empathic care can improve compassionate, patient-centered interactions that begin once the patient seeks care. This approach has proven to decrease DB by patients with dementia and improve their care, lessen staff problems during interactions, and increase staff morale.20 Experts call for the adoption of an interpersonal approach to patient encounters, and there is evidence that creating organizational change by moving toward compassionate care can lead to a positive impact for patients.54,55
Future Studies
There are growth opportunities in utilization of the DBRS. Analysis of the DBRS database by the VA Central Office (VACO) showed that the system is underutilized by facilities across the VA system.56 In response to this current underutilization, VACO is taking steps to close these gaps through increasing training to staff and promotion of the use of the DBRS. A 2015 pilot study of VHA providers showed that > 70% of providers had experienced a DB as defined by VHA, but only 34% of them reported their most recently experienced DB within the past 12 months.20 Thus, DBRS use must be studied within the context that patient-perpetrated DB is underreported in health care organizations.5,9,29,41,43,57,58 Studies addressing national DBRS utilization patterns and the cost associated with implementing the DBRS also are needed. One study suggests that there is an association between measures of facility complexity and staff perceptions of safety, which should be considered in analyzing DBRS usage.57 Studies addressing the role of the DBRS and misconceptions that the tool may represent a punitive tool also are needed. VHA should consider how the attribution “disruptive behavior” assigns a negative connotation and leads HCPs to avoid using the DBRS. Additionally, DB reporting may increase when HCPs understand that DB reporting is part of the comprehensive, consultative strategy to provide the best care to patients.
Conclusion
Accurate reporting of DB events enables the development of strategies for multidisciplinary teams to work together to minimize hazards and to provide interventions that provide for the safe delivery of health care to all patients. Improving reporting ensures there is an accurate representation of how disruptive events impact care provided within a facility—and what types of variables may be associated with increased risk for these types of events.
Additionally, ensuring that reporting is maximized also provides the VHA with opportunities for DBCs to offer evidence-based risk assessment of violence and consultation to staff members who may benefit from improved competencies in working with patients who display DB. These potential improvements are consistent with the VHA I CARE values and will provide data that can inform recommendations for health care in other agencies/health care organizations.
Acknowledgments
This work was supported by the Center of Innovation on Disability and Rehabilitation Research (CINDRR) of the Health Services Research and Development Service, Office of Research and Development, Department of Veterans Affairs.
1. Hodgson MJ, Mohr DC, Drummond DJ, Bell M, Van Male L. Managing disruptive patients in health care: necessary solutions to a difficult problem. Am J Ind Med. 2012;55(11):1009-1017.
2. US Department of Veterans Affairs, Veterans Health Administration. VHA Directive 2010-053. Patient Record Flags. https://www.va.gov/vhapublications/ViewPublication.asp?pub_ID=2341 Published December 3, 2010. Accessed March 29, 2019.
3. US Department of Veterans Affairs, Veterans Health Administration. VHA Directive 2012-026. Sexual Assaults and Other Defined Public Safety Incidents in VHA Facilities. https://www.va.gov/vhapublications/ViewPublication.asp?pub_ID=2797. Published September 27, 2012. Accessed March 29, 2019.
4. Curyto KJ, McCurry SM, Luci K, Karlin BE, Teri L, Karel MJ. Managing challenging behaviors of dementia in veterans: identifying and changing activators and consequences using STAR-VA. J Gerontol Nurs. 2017;43(2):33-43.
5. Speroni KG, Fitch T, Dawson E, Dugan L, Atherton M. Incidence and cost of nurse workplace violence perpetrated by hospital patients or patient visitors. J Emerg Nurs. 2014;40(3):218-228.
6. Phillips JP. Workplace violence against health care workers in the United States. NEJM. 2016;374(17):1661-1669.
7. Janocha JA, Smith RT. Workplace safety and health in the health care and social assistance industry, 2003–07. https://www.bls.gov/opub/mlr/cwc/workplace-safety-and-health-in-the-health-care-and-social-assistance-industry-2003-07.pdf. Published August 30, 2010. Accessed February 19, 2019.
8. US Department of Labor, Occupational Safety and Health Administration. Workplace violence in healthcare: understanding the challenge. https://www.osha.gov/Publications/OSHA3826.pdf. Published December 2015. Accessed February 19, 2019.
9. US Department of Labor, Occupational Safety and Health Administration. Prevention of Workplace Violence in Healthcare and Social Assistance. Occupational Safety and Health Administration, https://www.govinfo.gov/content/pkg/FR-2016-12-07/pdf/2016-29197.pdf. Accessed January 20, 2017.
10. Gerberich SG, Church TR, McGovern PM, et al. An epidemiological study of the magnitude and consequences of work related violence: the Minnesota Nurses’ Study. Occup Environ Med. 2004;61(6):495-503.
11. Sherman MF, Gershon RRM, Samar SM, Pearson JM, Canton AN, Damsky MR. Safety factors predictive of job satisfaction and job retention among home healthcare aides. J Occup Environ Med. 2008;50(12):1430-1441.
12. Karel MJ, Teri L, McConnell E, Visnic S, Karlin BE. Effectiveness of expanded implementation of STAR-VA for managing dementia-related behaviors among veterans. Gerontologist. 2016;56(1):126-134.
13. US Department of Labor, Bureau of Labor Statistics. Nonfatal occupational injuries and illnesses requiring days away from work. https://www.bls.gov/news.release/archives/osh2_11192015.htm. Published November 19, 2015.
14. Beech B, Leather P. Workplace violence in the health care sector: A review of staff training and integration of training evaluation models. Aggression Violent Behav. 2006;11(1):27-43.
15. Campbell CL, McCoy S, Burg MA, Hoffman N. Enhancing home care staff safety through reducing client aggression and violence in noninstitutional care settings: a systematic review. Home Health Care Manage Pract. 2014;26(1):3-10.
16. Gallant-Roman MA. Strategies and tools to reduce workplace violence. AAOHNJ. 2008;56(11):449-454.
17. Weinberger LE, Sreenivasan S, Smee DE, McGuire J, Garrick T. Balancing safety against obstruction to health care access: an examination of behavioral flags in the VA health care system. J Threat Assess Manage. 2018;5(1):35-41.
18. Elbogen EB, Johnson SC, Wagner HR, et al. Protective factors and risk modification of violence in Iraq and Afghanistan war veterans. J Clin Psychiatry. 2012;73(6):e767-e773.
19. Karlin BE, Visnic S, McGee JS, Teri L. Results from the multisite implementation of STAR-VA: a multicomponent psychosocial intervention for managing challenging dementia-related behaviors of veterans. Psychol Serv. 2014;11(2):200-208.
20. Semeah LM, Campbell CL, Cowper DC, Peet AC. Serving our homeless veterans: patient perpetrated violence as a barrier to health care access. J Pub Nonprofit Aff. 2017;3(2):223-234.
21. Hodgson MJ, Reed R, Craig T, et al. Violence in healthcare facilities: lessons from the Veterans Health Administration. J Occup Environ Med. 2004;46(11):1158-1165.
22. Farrell GA, Bobrowski C, Bobrowski P. Scoping workplace aggression in nursing: findings from an Australian study. J Adv Nurs. 2006;55(6):778-787.
23. Barling J, Rogers AG, Kelloway EK. Behind closed doors: in-home workers’ experience of sexual harassment and workplace violence. J Occup Health Psychol. 2001;6(3):255-269.
24. Pompeii LA, Schoenfisch AL, Lipscomb HJ, Dement JM, Smith CD, Upadhyaya M. Physical assault, physical threat, and verbal abuse perpetrated against hospital workers by patients or visitors in six U.S. hospitals. Am J Ind Med. 2015;58(11):1194-1204.
25. Sippel LM, Mota NP, Kachadourian LK, et al. The burden of hostility in U.S. veterans: results from the National Health and Resilience in Veterans Study. Psychiatry Res. 2016;243(suppl C):421-430.
26. Campbell C. Patient Violence and Aggression in Non-Institutional Health Care Settings: Predictors of Reporting By Healthcare Providers [doctoral dissertation]. Orlando: University of Central Florida; 2016.
27. Galinsky T, Feng HA, Streit J, et al. Risk factors associated with patient assaults of home healthcare workers. Rehabil Nurs. 2010;35(5):206-215.
28. Campbell CL. Incident reporting by health-care workers in noninstitutional care settings. Trauma, Violence Abuse. 2017;18(4):445-456.
29. Arnetz JE, Arnetz BB. Violence towards health care staff and possible effects on the quality of patient care. Soc Sci Med. 2001;52(3):417-427.
30. Gates D, Fitzwater E, Succop P. Relationships of stressors, strain, and anger to caregiver assaults. Issues Ment Health Nurs. 2003;24(8):775-793.
31. Brillhart B, Kruse B, Heard L. Safety concerns for rehabilitation nurses in home care. Rehabil Nurs. 2004;29(6):227-229.
32. Taylor H. Patient violence against clinicians: managing the risk. Innov Clin Neurosci. 2013;10(3):40-42.
33. US Department of Veterans Affairs, Office of Public and Intergovernmental Affairs. The Joint Commission releases results of surveys of the VA health care system. https://www.va.gov/opa/pressrel/pressrelease.cfm?id=2808. Updated August 5, 2014. Accessed February 19, 2019.
34. Büssing A, Höge T. Aggression and violence against home care workers. J Occup Health Psychol. 2004;9(3):206-219.
35. Geiger-Brown J, Muntaner C, McPhaul K, Lipscomb J, Trinkoff A. Abuse and violence during home care work as predictor of worker depression. Home Health Care Serv Q. 2007;26(1):59-77.
36. Gates DM, Gillespie GL, Succop P. Violence against nurses and its impact on stress and productivity. Nurs Econ. 2011;29(2):59-66.
37. Petterson IL, Arnetz BB. Psychosocial stressors and well-being in health care workers: the impact of an intervention program. Soc Sci Med. 1998;47(11):1763-1772.
38. Arnetz JE, Arnetz BB. Implementation and evaluation of a practical intervention programme for dealing with violence towards health care workers. J Adv Nurs. 2000;31(3):668-680.
39. Arnetz JE, Hamblin L, Russell J, et al. Preventing patient-to-worker violence in hospitals: outcome of a randomized controlled intervention. J Occup Environ Med. 2017;59(1):18-27.
40. Elbogen EB, Tomkins AJ, Pothuloori AP, Scalora MJ. Documentation of violence risk information in psychiatric hospital patient charts: an empirical examination. J Am Acad Psychiatry Law. 2003;31(1):58-64.
41. Winsvold Prang I, Jelson-Jorgensen LP. Should I report? A qualitative study of barriers to incident reporting among nurses working in nursing homes. Geriatr Nurs. 2014;35(6):441-447.
42. US Department of Veterans Affairs, Office of Inspector General. Healthcare inspection: management of disruptive patient behavior at VA medical facilities. Report No. 11-02585-129. https://www.va.gov/oig/pubs/VAOIG-11-02585-129.pdf. Published Mrach 7, 2013. Accessed February 21, 2019.
43. Lipscomb J, London M. Not Part of the Job: How to Take a Stand Against Violence in the Work Setting. Silver Spring, MD: American Nurses Association; 2015.
44. May DD, Grubbs LM. The extent, nature, and precipitating factors of nurse assault among three groups of registered nurses in a regional medical center. J Emerg Nurs. 2002;28(1):11-17.
45. Wharton TC, Ford BK. What is known about dementia care recipient violence and aggression against caregivers? J Gerontol Soc Work. 2014;57(5):460-477.
46. Brennan C, Worrall-Davies A, McMillan D, Gilbody S, House A. The hospital anxiety and depression scale: a diagnostic meta-analysis of case-finding ability. J Psychosom Res. 2010;69(4):371-378.
47. McPhaul K, Lipscomb J, Johnson J. Assessing risk for violence on home health visits. Home Healthc Nurse. 2010;28(5):278-289.
48. McPhaul KM, London M, Murrett K, Flannery K, Rosen J, Lipscomb J. Environmental evaluation for workplace violence in healthcare and social services. J Safety Res. 2008;39(2):237-250.
49. Kelly JA, Somlai AM, DiFranceisco WJ, et al. Bridging the gap between the science and service of HIV prevention: transferring effective research-based HIV prevention interventions to community AIDS service providers. Am J Public Health. 2000;90(7):1082-1088.
50. Pawlin S. Reporting violence. Emerg Nurse. 2008;16(4):16-21.
51. Brakel SJ. Legal liability and workplace violence. J Am Acad Psychiatry Law. 1998;26(4):553-562.
52. Neuman JH, Baron RA. Workplace violence and workplace aggression: evidence concerning specific forms, potential causes, and preferred targets. J Manage. 1998;24(3):391-419.53. Ferns T, Chojnacka I. Angels and swingers, matrons and sinners: nursing stereotypes. Br J Nurs. 2005;14(19):1028-1032.
54. Mercer SW, Reynolds WJ. Empathy and quality of care. Br J Gen Pract 2002;52(suppl):S9-S12.
55. Lee TH. An Epidemic of Empathy in Healthcare: How to Deliver Compassionate, Connected Patient Care That Creates a Competitive Advantage. Columbus, OH: McGraw-Hill Education; 2015.
56. US Department of Veterans Affairs, Veterans Health Administrastion. Veterans Health Administration workplace violence prevention program (WVPP): disruptive behavior reporting system utilization report. Published 2017. https://vaww.portal2.va.gov/sites/wvpp/Shared%20Documents/DBRS%20Utilization%20Reports/FY2017%20DBRS%20Quarterly%20Utilization%20Report%20(Quarter%201).pdf. [Source not verified.]
57. Campbell CL, Burg, MA, Gammonley D. Measures for incident reporting of patient violence and aggression towards healthcare providers: a systematic review. Aggression Violent Behav. 2015;25(part B):314-322.
58. Carney PT, West P, Neily J, Mills PD, Bagian JP. The effect of facility complexity on perceptions of safety climate in the operating room: size matters. Am J Med Qual. 2010;25(6):457-461.
While private or other public health care organizations can refuse to care for patients who have displayed disruptive behavior (DB), the VA Response to Disruptive Behavior of Patients law (38 CFR §17.107) prohibits the Veterans Health Administration (VHA) of the Department of Veterans Affairs (VA) from refusing care to veterans who display DB.1 The VHA defines DB as any behavior that is intimidating, threatening, or dangerous or that has, or could, jeopardize the health or safety of patients, VHA staff, or others.2
VA Response to DB Law
The VA Response to Disruptive Behavior of Patients requires the VHA to provide alternative care options that minimize risk while ensuring services; for example, providing care at a different location and/or time when additional staff are available to assist and monitor the patient. This can provide a unique opportunity to capture data on DB and the results of alternative forms of caring for this population.
The reason public health care organizations refuse care to persons who display DB is clear: DBs hinder business operations, are financially taxing, and put health care workers at risk.3-10 “In 2009, the VHA spent close to $5.5 million on workers’ compensation and medical expenditures for 425 incidents–or about $130,000 per DB incident (Hodgson M, Drummond D, Van Male L. Unpublished data, 2010).” In another study, 106 of 762 nurses in 1 hospital system reported an assault by a patient, and 30 required medical attention, which resulted in a total cost of $94,156.8 From 2002 to 2013, incidents of serious workplace violence requiring days off for an injured worker to recover on average were 4 times more common in health care than in other industries.6-11 Incidents of patient violence and aggression toward staff transcend specialization; however, hospital nurses and staff from the emergency, rehabilitation and gerontology departments, psychiatric unit, and home-based services are more susceptible and vulnerable to DB incidents than are other types of employees.8,10-19
Data reported by health care staff suggest that patients rather than staff members or visitors initiate > 70% of serious physical attacks against health care workers.9,13,20-23 A 2015 study of VHA health care providers (HCPs) found that > 60% had experienced some form of DB, verbal abuse being the most prevalent, followed by sexual abuse and physical abuse.20 Of 72,000 VHA staff responding to a nationwide survey, 13% experienced, on average, ≥ 1 assault by a veteran (eg, something was thrown at them; they were pushed, kicked, slapped; or were threatened or injured by a weapon).8,21
To meet its legal obligations and deliver empathetic care, the VHA documents and analyzes data on all patients who exhibit DB. A local DB Committee (DBC) reviews the data, whether it occurs in an inpatient or outpatient setting, such as community-based outpatient clinics. Once a DB incident is reported, the DBC begins an evidence-based risk evaluation, including the option of contacting the persons who displayed or experienced the DB. Goals are to (1) prevent future DB incidents; (2) detect vulnerabilities in the environment; and (3) collaborate with HCPs and patients to provide optimal care while improving the patient/provider interactions.
Effects of Disruptive Behavior
DB has negative consequences for both patients and health care workers and results in poor evaluations of care from both groups.27-32 Aside from interfering with safe medical care, DB also impacts care for other patients by delaying access to care and increasing appointment wait times due to employee absenteeism and staff shortages.3,4,20,32,33 For HCPs, patient violence is associated with unwillingness to provide care, briefer treatment periods, and decreases in occupational satisfaction, performance, and commitment
Harmful health effects experienced by HCPs who have been victims of DB include fear, mood disorders, anxiety, all symptoms of psychological distress and posttraumatic stress disorder (PTSD).10,22,30,34-36 In a study of the impact on productivity of PTSD triggered by job-related DB, PTSD symptoms were associated with withdrawal from or minimizing encounters with patients, job turnover, and troubles with thinking
Reporting Disruptive Behavior
The literature suggests that consistent and effective DB reporting is pivotal to improving the outcome and quality of care for those displaying DB.37-39 To provide high-quality health services to veterans who display DB, the VHA must promote the management and reporting of DB. Without knowledge of the full spectrum of DB events at VHA facilities, efforts to prevent or manage DB and ensure safety may have limited impact.7,37 Reports can be used for clinical decision making to optimize staff training in delivery of quality care while assuring staff safety. More than 80% of DB incidents occur during interactions with patients, thus this is a clinical issue that can affect the outcome of patient care.8,21
Documented DB reports are used to analyze the degree, frequency, and nature of incidents, which might reveal risk factors and develop preventive efforts and training for specific hazards.8,39 Some have argued that implementing a standardized DB reporting system is a crucial first step toward minimizing hazards and improving health care.38,40,41
When DB incidents were recorded through a hospital electronic reporting system and discussed in meetings, staff reported: (1) increased awareness of DB; (2) improved ability to manage DB incidents; and (3) amplified reporting of incidents.38,41,42 These findings support similar results from studies of an intervention implemented at VA Community Living Centers (CLCs) from 2013 to 2017: Staff Training in Assisted Living Residences (STAR-VA).4,12,19 The aim of STAR-VA was to minimize challenging dementia-related DB in CLCs. The intervention initially was established to train direct-care, assisted-living staff to provide better care to older patients displaying DB. Data revealed that documentation of DBs was, the first step to ensuring staff and patient safety.18,40
VHA Reporting System
In 2013, the VA Office of Inspector General (OIG) found no standardized documentation of DB events across the VA health care system.42 Instead, DB events were documented in multiple records in various locations, including administrative and progress notes in the electronic health record (EHR), police reports, e-mails, or letters submitted to DBC chairs.42 This situation reduced administrators’ ability to consider all relevant information and render appropriate decisions in DB cases.42 In 2015, based on OIG recommendations, the VHA implemented the Disruptive Behavior Reporting System (DBRS) nationwide, which allowed all VHA staff to report DB events. The DBRS was designed to address factors likely to impede reporting and management of DB, namely, complexity of and lack of access to a central reporting system.43,44 The DBRS is currently the primary VHA tool to document DB events.
The DBRS consists of 32 questions in 5 sections relating to the (1) location and time of DB event; (2) reporter; (3) disrupter; (4) DB event details; and (5) the person who experienced (experiencer) the event. The system also provides a list of the types of DB, such as inappropriate communication, bullying and/or intimidation, verbal or written threat of physical harm, physical violence, sexual harassment, sexual assault, and property damage. The DBRS has the potential to provide useful data on DB and DB reporting, such as the typical staff entering data and the number and/or types of DB occurring.
The DBRS complements the preexisting VHA policies and committees for care of veterans who display DB.1-3,14,21,24,25 The VHA Workplace Violence Prevention Program (WVPP) required facilities to submit data on DB events through a Workplace Behavioral Risk report. Data for the report were obtained from police reports, patient safety reports, DBC records, and notes in the EHR. Following implementations of DBRS, the number of DB events per year became a part of facility performance standards.
VHA is creating novel approaches to handling DB that allow health care workers to render care in a safe and effective manner guided by documented information. For example, DBCs can recommend the use of Category I Patient Record Flags (PRFs) following documented DB, which informs staff of the potential risk of DB and provides guidance on protective methods to use when meeting with the patient.2,21,24 A survey of 140 VA hospital chiefs of staff indicated that DBC procedures were related to a decrease in the rates of assaults.1 Additionally, VA provides training for staff in techniques to promote personal safety, such as identifying signs that precede DB, using verbal deescalation, and practicing therapeutic containment.
Resistance to Reporting
Many health care employees and employers are reticent to report DBs.22,31,43,45-48 Studies suggest health care organizations can cultivate a culture that is resistant to reporting DB.49,50 This complicates the ability of the health care system to design and maintain safety protocols and safer treatment plans.3,41,51 Worldwide, < 30% of DBs are reported.47 One barrier may be that supervisors may not wish to acknowledge DBs on their units or may not provide sufficient staff time for training or reporting.31,46,47 HCPs may worry that a DB report will stigmatize patients, especially those who are elderly or have cognitive impairment, brain injury, psychological illness, or developmental disability. Patients with cognitive conditions are reportedly 20% more likely to be violent toward caregivers and providers.31 A dementia diagnosis, for example, is associated with a high likelihood for DB.30,52 More than 80% of DB events displayed by patients with dementia may go unreported.26,31,50,52
Some clinicians may attribute DB to physiologic conditions that need to be treated, not reported. However, employers can face various legal liabilities if steps are not taken to protect employees.47,51 Federal and state statutes require that organizations provide a healthy and safe employment environment for workers. This requires that employers institute reasonable protective measures, such as procedures to intervene, policies on addressing DB incidents, and/or training to minimize or deescalate DB.51,53 Also, employees may sue employers if security measures are inadequate or deficient in properly investigating current and past evidence of DB or identifying vulnerabilities in the workplace. Unwillingness to investigate DB and safety-related workplace concerns have contributed to increased workplace violence and legal liability.52,53 The mission of caring and trust is consistent with assuring a safe environment.
Training and Empathetic Care
To combat cultural resistance to reporting DBs, more and perhaps different contextual approaches to education and training may be needed that address ethical dilemmas and concerns of providers. The success of training relies on administrators supporting staff in reporting DB. Training must address providers’ conflicting beliefs and assist with identifying strategies to provide the best possible care for patients who display DB.1,38 HCPs are less likely to document a DB if they feel that administrators are creating documentation that will have negative consequences for a patient. Thus, leadership is responsible for ensuring that misconceptions are dispelled through training and other efforts and information on how reported DB data will be used is communicated through strategic channels.
Education and training must consider empathic care that attempts to understand why patients behave as they do through the information gathered.55 Empathy in health care is multifaceted: It involves comprehending a patient’s viewpoint, circumstances, and feelings and the capacity to analyze whether one is comprehending these accurately in order to demonstrate supportive care.54,55
Improving patient and staff interaction once a problematic behavior is identified is the aim of empathic care. Increasing empathic care can improve compassionate, patient-centered interactions that begin once the patient seeks care. This approach has proven to decrease DB by patients with dementia and improve their care, lessen staff problems during interactions, and increase staff morale.20 Experts call for the adoption of an interpersonal approach to patient encounters, and there is evidence that creating organizational change by moving toward compassionate care can lead to a positive impact for patients.54,55
Future Studies
There are growth opportunities in utilization of the DBRS. Analysis of the DBRS database by the VA Central Office (VACO) showed that the system is underutilized by facilities across the VA system.56 In response to this current underutilization, VACO is taking steps to close these gaps through increasing training to staff and promotion of the use of the DBRS. A 2015 pilot study of VHA providers showed that > 70% of providers had experienced a DB as defined by VHA, but only 34% of them reported their most recently experienced DB within the past 12 months.20 Thus, DBRS use must be studied within the context that patient-perpetrated DB is underreported in health care organizations.5,9,29,41,43,57,58 Studies addressing national DBRS utilization patterns and the cost associated with implementing the DBRS also are needed. One study suggests that there is an association between measures of facility complexity and staff perceptions of safety, which should be considered in analyzing DBRS usage.57 Studies addressing the role of the DBRS and misconceptions that the tool may represent a punitive tool also are needed. VHA should consider how the attribution “disruptive behavior” assigns a negative connotation and leads HCPs to avoid using the DBRS. Additionally, DB reporting may increase when HCPs understand that DB reporting is part of the comprehensive, consultative strategy to provide the best care to patients.
Conclusion
Accurate reporting of DB events enables the development of strategies for multidisciplinary teams to work together to minimize hazards and to provide interventions that provide for the safe delivery of health care to all patients. Improving reporting ensures there is an accurate representation of how disruptive events impact care provided within a facility—and what types of variables may be associated with increased risk for these types of events.
Additionally, ensuring that reporting is maximized also provides the VHA with opportunities for DBCs to offer evidence-based risk assessment of violence and consultation to staff members who may benefit from improved competencies in working with patients who display DB. These potential improvements are consistent with the VHA I CARE values and will provide data that can inform recommendations for health care in other agencies/health care organizations.
Acknowledgments
This work was supported by the Center of Innovation on Disability and Rehabilitation Research (CINDRR) of the Health Services Research and Development Service, Office of Research and Development, Department of Veterans Affairs.
1. Hodgson MJ, Mohr DC, Drummond DJ, Bell M, Van Male L. Managing disruptive patients in health care: necessary solutions to a difficult problem. Am J Ind Med. 2012;55(11):1009-1017.
2. US Department of Veterans Affairs, Veterans Health Administration. VHA Directive 2010-053. Patient Record Flags. https://www.va.gov/vhapublications/ViewPublication.asp?pub_ID=2341 Published December 3, 2010. Accessed March 29, 2019.
3. US Department of Veterans Affairs, Veterans Health Administration. VHA Directive 2012-026. Sexual Assaults and Other Defined Public Safety Incidents in VHA Facilities. https://www.va.gov/vhapublications/ViewPublication.asp?pub_ID=2797. Published September 27, 2012. Accessed March 29, 2019.
4. Curyto KJ, McCurry SM, Luci K, Karlin BE, Teri L, Karel MJ. Managing challenging behaviors of dementia in veterans: identifying and changing activators and consequences using STAR-VA. J Gerontol Nurs. 2017;43(2):33-43.
5. Speroni KG, Fitch T, Dawson E, Dugan L, Atherton M. Incidence and cost of nurse workplace violence perpetrated by hospital patients or patient visitors. J Emerg Nurs. 2014;40(3):218-228.
6. Phillips JP. Workplace violence against health care workers in the United States. NEJM. 2016;374(17):1661-1669.
7. Janocha JA, Smith RT. Workplace safety and health in the health care and social assistance industry, 2003–07. https://www.bls.gov/opub/mlr/cwc/workplace-safety-and-health-in-the-health-care-and-social-assistance-industry-2003-07.pdf. Published August 30, 2010. Accessed February 19, 2019.
8. US Department of Labor, Occupational Safety and Health Administration. Workplace violence in healthcare: understanding the challenge. https://www.osha.gov/Publications/OSHA3826.pdf. Published December 2015. Accessed February 19, 2019.
9. US Department of Labor, Occupational Safety and Health Administration. Prevention of Workplace Violence in Healthcare and Social Assistance. Occupational Safety and Health Administration, https://www.govinfo.gov/content/pkg/FR-2016-12-07/pdf/2016-29197.pdf. Accessed January 20, 2017.
10. Gerberich SG, Church TR, McGovern PM, et al. An epidemiological study of the magnitude and consequences of work related violence: the Minnesota Nurses’ Study. Occup Environ Med. 2004;61(6):495-503.
11. Sherman MF, Gershon RRM, Samar SM, Pearson JM, Canton AN, Damsky MR. Safety factors predictive of job satisfaction and job retention among home healthcare aides. J Occup Environ Med. 2008;50(12):1430-1441.
12. Karel MJ, Teri L, McConnell E, Visnic S, Karlin BE. Effectiveness of expanded implementation of STAR-VA for managing dementia-related behaviors among veterans. Gerontologist. 2016;56(1):126-134.
13. US Department of Labor, Bureau of Labor Statistics. Nonfatal occupational injuries and illnesses requiring days away from work. https://www.bls.gov/news.release/archives/osh2_11192015.htm. Published November 19, 2015.
14. Beech B, Leather P. Workplace violence in the health care sector: A review of staff training and integration of training evaluation models. Aggression Violent Behav. 2006;11(1):27-43.
15. Campbell CL, McCoy S, Burg MA, Hoffman N. Enhancing home care staff safety through reducing client aggression and violence in noninstitutional care settings: a systematic review. Home Health Care Manage Pract. 2014;26(1):3-10.
16. Gallant-Roman MA. Strategies and tools to reduce workplace violence. AAOHNJ. 2008;56(11):449-454.
17. Weinberger LE, Sreenivasan S, Smee DE, McGuire J, Garrick T. Balancing safety against obstruction to health care access: an examination of behavioral flags in the VA health care system. J Threat Assess Manage. 2018;5(1):35-41.
18. Elbogen EB, Johnson SC, Wagner HR, et al. Protective factors and risk modification of violence in Iraq and Afghanistan war veterans. J Clin Psychiatry. 2012;73(6):e767-e773.
19. Karlin BE, Visnic S, McGee JS, Teri L. Results from the multisite implementation of STAR-VA: a multicomponent psychosocial intervention for managing challenging dementia-related behaviors of veterans. Psychol Serv. 2014;11(2):200-208.
20. Semeah LM, Campbell CL, Cowper DC, Peet AC. Serving our homeless veterans: patient perpetrated violence as a barrier to health care access. J Pub Nonprofit Aff. 2017;3(2):223-234.
21. Hodgson MJ, Reed R, Craig T, et al. Violence in healthcare facilities: lessons from the Veterans Health Administration. J Occup Environ Med. 2004;46(11):1158-1165.
22. Farrell GA, Bobrowski C, Bobrowski P. Scoping workplace aggression in nursing: findings from an Australian study. J Adv Nurs. 2006;55(6):778-787.
23. Barling J, Rogers AG, Kelloway EK. Behind closed doors: in-home workers’ experience of sexual harassment and workplace violence. J Occup Health Psychol. 2001;6(3):255-269.
24. Pompeii LA, Schoenfisch AL, Lipscomb HJ, Dement JM, Smith CD, Upadhyaya M. Physical assault, physical threat, and verbal abuse perpetrated against hospital workers by patients or visitors in six U.S. hospitals. Am J Ind Med. 2015;58(11):1194-1204.
25. Sippel LM, Mota NP, Kachadourian LK, et al. The burden of hostility in U.S. veterans: results from the National Health and Resilience in Veterans Study. Psychiatry Res. 2016;243(suppl C):421-430.
26. Campbell C. Patient Violence and Aggression in Non-Institutional Health Care Settings: Predictors of Reporting By Healthcare Providers [doctoral dissertation]. Orlando: University of Central Florida; 2016.
27. Galinsky T, Feng HA, Streit J, et al. Risk factors associated with patient assaults of home healthcare workers. Rehabil Nurs. 2010;35(5):206-215.
28. Campbell CL. Incident reporting by health-care workers in noninstitutional care settings. Trauma, Violence Abuse. 2017;18(4):445-456.
29. Arnetz JE, Arnetz BB. Violence towards health care staff and possible effects on the quality of patient care. Soc Sci Med. 2001;52(3):417-427.
30. Gates D, Fitzwater E, Succop P. Relationships of stressors, strain, and anger to caregiver assaults. Issues Ment Health Nurs. 2003;24(8):775-793.
31. Brillhart B, Kruse B, Heard L. Safety concerns for rehabilitation nurses in home care. Rehabil Nurs. 2004;29(6):227-229.
32. Taylor H. Patient violence against clinicians: managing the risk. Innov Clin Neurosci. 2013;10(3):40-42.
33. US Department of Veterans Affairs, Office of Public and Intergovernmental Affairs. The Joint Commission releases results of surveys of the VA health care system. https://www.va.gov/opa/pressrel/pressrelease.cfm?id=2808. Updated August 5, 2014. Accessed February 19, 2019.
34. Büssing A, Höge T. Aggression and violence against home care workers. J Occup Health Psychol. 2004;9(3):206-219.
35. Geiger-Brown J, Muntaner C, McPhaul K, Lipscomb J, Trinkoff A. Abuse and violence during home care work as predictor of worker depression. Home Health Care Serv Q. 2007;26(1):59-77.
36. Gates DM, Gillespie GL, Succop P. Violence against nurses and its impact on stress and productivity. Nurs Econ. 2011;29(2):59-66.
37. Petterson IL, Arnetz BB. Psychosocial stressors and well-being in health care workers: the impact of an intervention program. Soc Sci Med. 1998;47(11):1763-1772.
38. Arnetz JE, Arnetz BB. Implementation and evaluation of a practical intervention programme for dealing with violence towards health care workers. J Adv Nurs. 2000;31(3):668-680.
39. Arnetz JE, Hamblin L, Russell J, et al. Preventing patient-to-worker violence in hospitals: outcome of a randomized controlled intervention. J Occup Environ Med. 2017;59(1):18-27.
40. Elbogen EB, Tomkins AJ, Pothuloori AP, Scalora MJ. Documentation of violence risk information in psychiatric hospital patient charts: an empirical examination. J Am Acad Psychiatry Law. 2003;31(1):58-64.
41. Winsvold Prang I, Jelson-Jorgensen LP. Should I report? A qualitative study of barriers to incident reporting among nurses working in nursing homes. Geriatr Nurs. 2014;35(6):441-447.
42. US Department of Veterans Affairs, Office of Inspector General. Healthcare inspection: management of disruptive patient behavior at VA medical facilities. Report No. 11-02585-129. https://www.va.gov/oig/pubs/VAOIG-11-02585-129.pdf. Published Mrach 7, 2013. Accessed February 21, 2019.
43. Lipscomb J, London M. Not Part of the Job: How to Take a Stand Against Violence in the Work Setting. Silver Spring, MD: American Nurses Association; 2015.
44. May DD, Grubbs LM. The extent, nature, and precipitating factors of nurse assault among three groups of registered nurses in a regional medical center. J Emerg Nurs. 2002;28(1):11-17.
45. Wharton TC, Ford BK. What is known about dementia care recipient violence and aggression against caregivers? J Gerontol Soc Work. 2014;57(5):460-477.
46. Brennan C, Worrall-Davies A, McMillan D, Gilbody S, House A. The hospital anxiety and depression scale: a diagnostic meta-analysis of case-finding ability. J Psychosom Res. 2010;69(4):371-378.
47. McPhaul K, Lipscomb J, Johnson J. Assessing risk for violence on home health visits. Home Healthc Nurse. 2010;28(5):278-289.
48. McPhaul KM, London M, Murrett K, Flannery K, Rosen J, Lipscomb J. Environmental evaluation for workplace violence in healthcare and social services. J Safety Res. 2008;39(2):237-250.
49. Kelly JA, Somlai AM, DiFranceisco WJ, et al. Bridging the gap between the science and service of HIV prevention: transferring effective research-based HIV prevention interventions to community AIDS service providers. Am J Public Health. 2000;90(7):1082-1088.
50. Pawlin S. Reporting violence. Emerg Nurse. 2008;16(4):16-21.
51. Brakel SJ. Legal liability and workplace violence. J Am Acad Psychiatry Law. 1998;26(4):553-562.
52. Neuman JH, Baron RA. Workplace violence and workplace aggression: evidence concerning specific forms, potential causes, and preferred targets. J Manage. 1998;24(3):391-419.53. Ferns T, Chojnacka I. Angels and swingers, matrons and sinners: nursing stereotypes. Br J Nurs. 2005;14(19):1028-1032.
54. Mercer SW, Reynolds WJ. Empathy and quality of care. Br J Gen Pract 2002;52(suppl):S9-S12.
55. Lee TH. An Epidemic of Empathy in Healthcare: How to Deliver Compassionate, Connected Patient Care That Creates a Competitive Advantage. Columbus, OH: McGraw-Hill Education; 2015.
56. US Department of Veterans Affairs, Veterans Health Administrastion. Veterans Health Administration workplace violence prevention program (WVPP): disruptive behavior reporting system utilization report. Published 2017. https://vaww.portal2.va.gov/sites/wvpp/Shared%20Documents/DBRS%20Utilization%20Reports/FY2017%20DBRS%20Quarterly%20Utilization%20Report%20(Quarter%201).pdf. [Source not verified.]
57. Campbell CL, Burg, MA, Gammonley D. Measures for incident reporting of patient violence and aggression towards healthcare providers: a systematic review. Aggression Violent Behav. 2015;25(part B):314-322.
58. Carney PT, West P, Neily J, Mills PD, Bagian JP. The effect of facility complexity on perceptions of safety climate in the operating room: size matters. Am J Med Qual. 2010;25(6):457-461.

Effects of Process Improvement on Guideline-Concordant Cardiac Enzyme Testing
In recent years, driven by accelerating health care costs and desire for improved health care value, major specialty group guidelines have incorporated resource utilization and value calculations into their recommendations. High-value care has the characteristics of enhancing outcomes, safety, and patient satisfaction at a reasonable cost. As one example, the American College of Cardiology (ACC) recently published a consensus statement on its clinical practice guidelines with a specific focus on cost and value.1 This guideline acknowledges the difficulty in incorporating value into clinical decision making but stresses a need for increased transparency and consistency to boost value in everyday practice.
Chest pain and related symptoms were listed as the second leading principle reasons for emergency department visits in the US in 2011 with 14% of patients undergoing cardiac enzyme testing.2 The ACC guidelines advocate use of troponin as the preferred laboratory test for the initial evaluation of acute coronary syndrome (ACS). Fractionated creatine kinase (CK-MB) is an acceptable alternative only when a cardiac troponin test is not available.3 Furthermore, troponins should be obtained no more than 3 times for the initial evaluation of a single event, and further trending provides no additional benefit or prognostic information.
A recent study from an academic hospital showed that process improvement interventions focused on eliminating unnecessary cardiac enzyme testing led to a 1-year cost savings of $1.25 million while increasing the rate of ACS diagnosis.4 Common clinical practice at Naval Medical Center Portsmouth (NMCP) in Virginia still routinely includes both troponin as well as a CK panel comprised of CK, CK-MB, and a calculated CK-MB/CK index. Our study focuses on the implementation of quality improvement efforts described by Larochelle and colleagues at NMCP.4 The study aimed to determine the impact of implementing interventions designed to improve the ordering practices and reduce the cost of cardiac enzyme testing.
Methods
The primary focus of the intervention was on ordering practices of the emergency medicine department (EMD), internal medicine (IM) inpatient services, and cardiology inpatient services. Specific interventions were: (1) removal of the CK panel from the chest pain order set in the EMD electronic health record (EHR); (2) removal of the CK panel from the inpatient cardiology order set; (3) education of staff on the changes in CK panel utility via direct communication during IM academic seminars; (4) education of nursing staff ordering laboratory results on behalf of physicians on the cardiology service at the morning and evening huddles; and (5) addition of “max of 3 tests indicated” comment to the inpatient EHR ordering page of the troponin test
Data Source
The process improvement interventions were considered exempt from institutional review board (IRB) approval; however, we obtained expedited IRB approval with waiver of consent for the research aspect of the project. We obtained clinical administrative data from the Military Health System Data Repository (MDR). We identified all adult patients aged ≥ 18 years who had a troponin test, CK-MB, or both drawn at NMCP on the following services: the EMD, IM, and cardiology. A troponin or CK-MB test was defined using Current Procedural Terminology (CPT) codes and unique Logical Observation Identifiers Names and Codes (LOINC).
Measures
The study was divided into 3 periods: the preintervention period from August 1, 2013 to July 31, 2014; the intervention period from August 1, 2014 to January 31, 2015; and the postintervention period February 1, 2015 to January 31, 2016.
The primary outcomes measured were the frequency of guideline concordance and total costs for tests ordered per month using the Centers for Medicare and Medicaid Services (CMS) clinical laboratory fee schedule of $13.40 for troponin and $16.17 for CK-MB.5Concordance was defined as ≤ 3 troponin tests and no CK-MB tests ordered during 1 encounter for a patient without an ACS diagnosis in the preceding 7 days. Due to faster cellular release kinetics of CK-MB compared with that of troponin, this test has utility in evaluating new or worsening chest pain in the setting of a recent myocardial infarction (MI). Therefore, we excluded any patient who had a MI within the preceding 7 days of an order for either CK-MB or troponin tests. Additionally, the number of tests, both CK-MB and troponin, ordered per patient encounter (hereafter referred to as an episode) were measured. Finally, we measured the monthly prevalence of ACS diagnosis and percentage of visits having that diagnosis.
Data Analysis
Descriptive statistics were used to calculate population demographics of age group, sex, beneficiary category, sponsor service, and clinical setting. Monthly data were grouped into the preintervention and postintervention periods. The analysis was performed using t tests to compare mean values and CIs before and after the intervention. Simple linear regression with attention to correlation was used to create best fit lines with confidence bands before and after the intervention. Interrupted time series (ITS) regression was used to describe all data points throughout the study. Consistency between these various methods was verified. Mean values and CIs were reported from the t tests. Statistical significance was reported when appropriate. Equations and confidence predictions on the simple linear regressions were produced and reported. These were used to identify values at the start, midpoint, and end of the pre- and postintervention periods.
Results
There were a total of 6,281 patients in the study population. More patients were seen during the postintervention period than in the preintervention period. The mean age of patients was slightly higher during the preintervention period (Table 1). 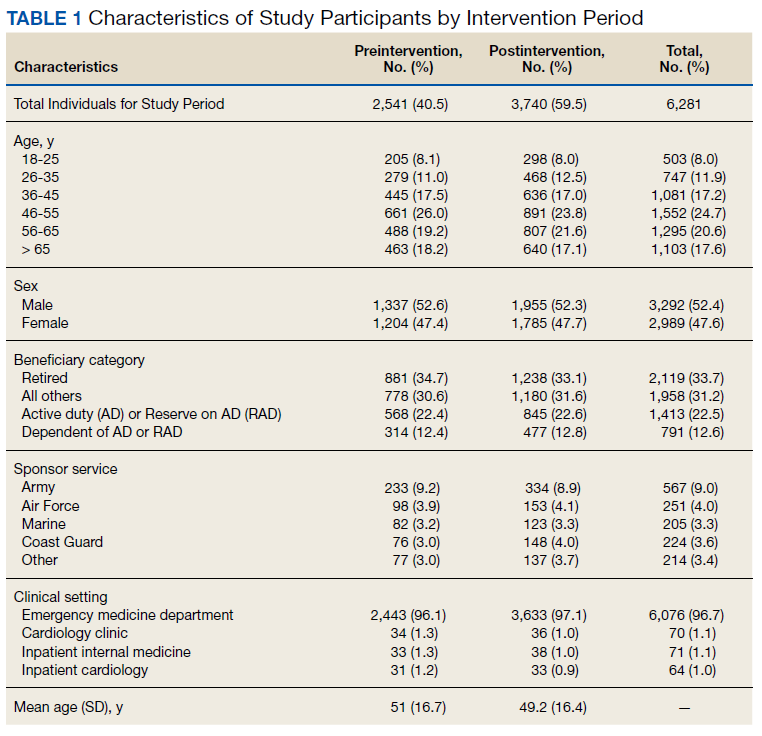
Guideline Concordance
To determine whether ordering practices for cardiac enzyme testing improved, we assessed the changes in the frequency of guideline concordance during the pre- and postintervention period. On average during the preintervention year, the percentage of tests ordered that met guideline concordance was 10.1% (95% CI, 7.4%-12.9%), increasing by 0.80% (95% CI, 0.17%-1.42%) each month. 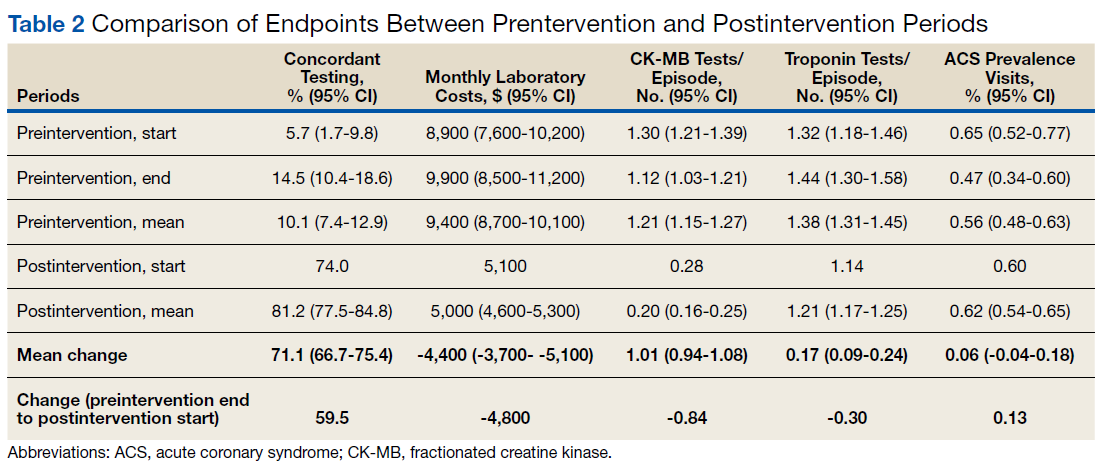
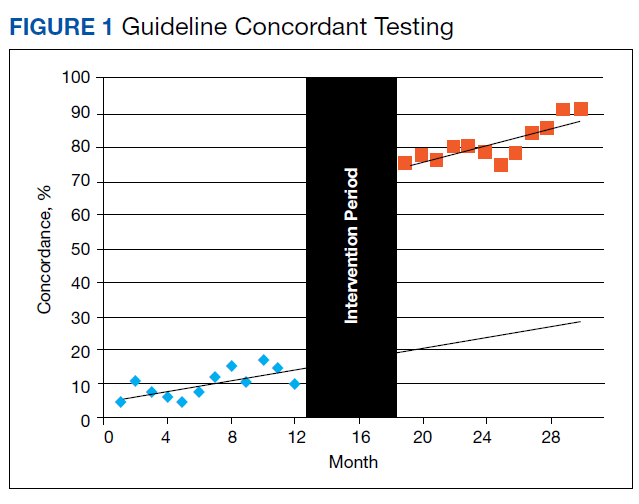
Costs
We assessed changes in total dollars spent on cardiac enzyme testing during the pre- and postintervention periods. During the preintervention year, $9,400 (95% CI, $8,700-$10,100) was spent on average each month, which did not change significantly throughout the period. During the postintervention year, the cost was stable at $5,000 (95% CI, $4,600-$5,300) on average each month, a reduction of $4,400 (95% CI, $3,700-$5,100) (Figure 2). 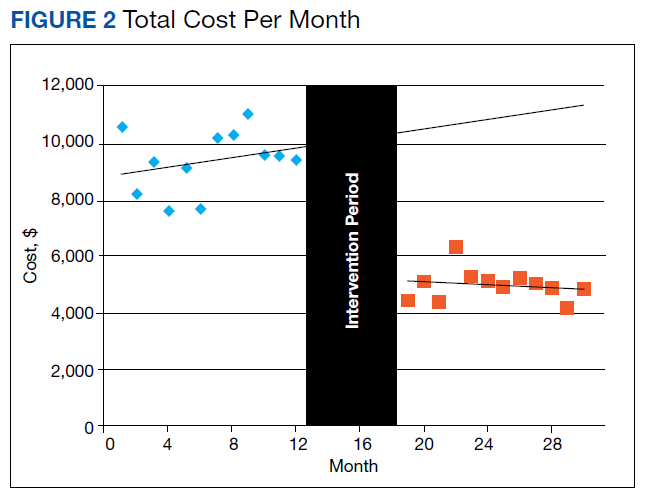
CK-MB and Troponin Tests per Patient
To further assess ordering practices for cardiac enzyme testing, we compared the changes in the monthly number of tests and the average number of CK-MB and troponin tests ordered per episode pre- and postintervention. On average during the preintervention year, 297 tests (95% CI, 278-315) were run per month, with an average of 1.21 CK tests (95% CI, 1.15-1.27) per episode (Table 2, Figure 3). 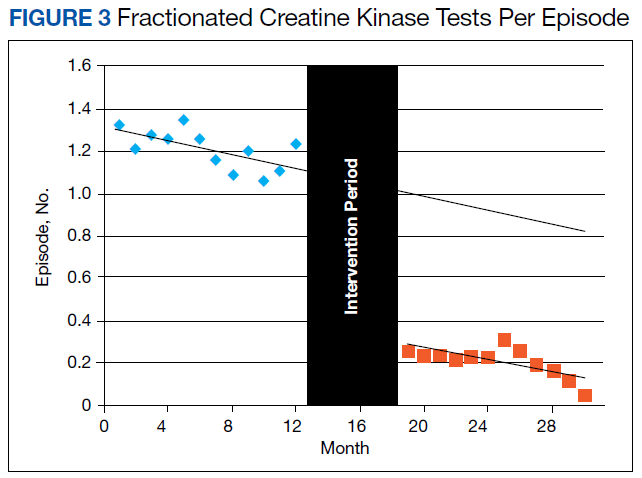
The changes in troponin testing were not as dramatic. The counts of tests each month remained similar, with a preintervention year average of 341 (95% CI, 306-377) and postintervention year average of 310 (95% CI, 287-332), which were not statistically different. However, there was a statistically significant decrease in the number of tests per episode. During the preintervention year, 1.38 troponin tests (95% CI, 1.31-1.45) were ordered per patient on average. This dropped by 0.17 (95% CI, 0.09-0.24) to the postintervention average of 1.21 (95% CI, 1.17-1.25) (Table 2, Figure 4). 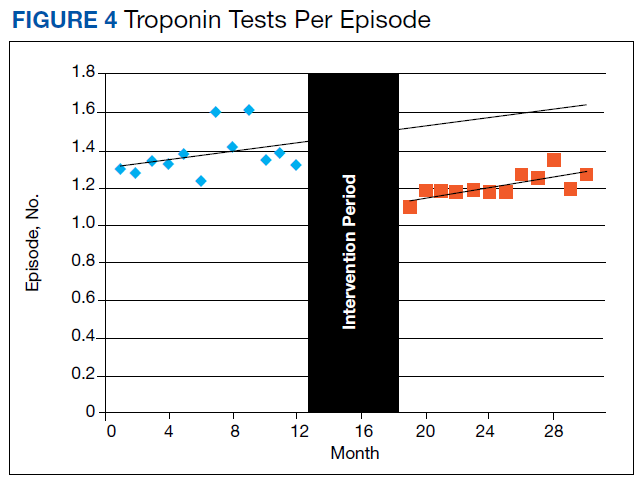
ACS Prevalence
To determine whether there was an impact on ACS diagnoses, we looked at the numbers of ACS diagnoses and their prevalence among visits before and after the intervention. During the preintervention year, the average monthly number of diagnoses was 29.7 (95% CI, 26.1-33.2), and prevalence of ACS was 0.56% (95% CI, 0.48%-0.63%) of all episodes. Although the monthly rate was statistically decreasing by 0.022% (95% CI, 0.003-0.41), this has little meaning since the level of correlation (r2 = 0.2522, not displayed) was poor due to the essentially nonexistent correlation in number of visits each month (r2 = 0.0112, not displayed). During the postintervention year, the average number of diagnoses was 32.2 (95% CI, 27.9-36.6), and the prevalence of ACS was 0.62% (95% CI, 0.54-0.65). Neither of these values changed significantly between the pre- and postintervention period. All ICD-9 and ICD-10 diagnosis codes used for the analysis are available upon request from the authors.
Discussion
Our data demonstrate the ability of simple process improvement interventions to decrease unnecessary testing in the workup of ACS, increasing the rate of guideline concordant testing by > 70% at a single military treatment facility (MTF). In particular, with the now widespread use of EHR, the order set presents a high-yield target for process improvement in an easily implemented, durable fashion. We had expected to see some decrease in the efficacy of the intervention at a time of staff turnover in the summer of 2015 because ongoing dedicated teaching sessions were not performed. Despite that, the intervention remained effective without further dedicated teaching sessions. This outcome was certainly attributable to the hardwired interventions made (mainly via order sets), but possibly indicates an institutional memory that can take hold after an initial concerted effort is made.
We reduced the estimated preintervention annual cost of $113,000 by $53,000 (95% CI, $42,000-$64,000). Although on a much smaller scale than the study by Larochelle, our study represents a nearly 50% reduction in the total cost of initial testing for possible ACS and a > 80% reduction in unnecessary CK-MB testing.4 This result was achieved with no statistical change in the prevalence of ACS. The cost reduction does not account for the labor costs to clinically follow-up and address additional unnecessary lab results. The estimated cost of intervention was limited to the time required to educate residents, interns, and nursing staff as well as the implementation of the automated, reflexive laboratory results ordering process.
Unique to our study, we also demonstrated an intervention that satisfied all the major stakeholders in the ordering of these laboratory results. By instituting the reflexive ordering of CK-MB tests for positive troponins, we obtained the support of the facility’s interventional cardiology department, which finds value in that data. Appreciating the time-sensitive nature of an ACS diagnosis, the reflexive ordering minimized the delay in receiving these data while still greatly reducing the number of tests performed. That being said, if the current trend away from CK-MB in favor of exclusively testing troponin continues, removing the reflexive ordering for positive laboratory results protocol would be an easy follow-on intervention.
Limitations
Our study presented several limitations. First, reporting errors due to improper or insufficient medical coding as well as data entry errors may exist within the MDR; therefore, the results of this analysis may be over- or underestimated. Specifically, CPT codes for troponin and CK-MB were available only in 1 of the 2 data sets used for this study, which primarily contains outpatient patient encounters. For this reason, most of the laboratory testing comes from the EMD rather than from inpatient services. However, because we excluded all patients who eventually had an ACS diagnosis (patients who likely had more inpatient time and better indication for repeat troponin), we feel that our intervention was still thoroughly investigated. Second, the number of tests drawn per patient was significantly < 2, the expected minimum number of tests to rule out ACS in patients with appropriate symptoms.
This study was not designed to answer the source of variation from guidelines. Many patients had only 1 test, which we feel represents an opportunity for future study to identify other ways cardiac enzyme testing is being used clinically. These tests might be used for patients without convincing symptoms and signs of coronary syndromes or for patients with other primary problems. Third, by using the ITS analysis, we assumed that the outcome during each intervention period follows a linear pattern. However, changes may follow a nonlinear pattern over a long period. Finally, our intervention was limited to only a single MTF, which may limit generalizability to other facilities across military medicine. However, we feel this study should serve as a guide for other MTFs as well as US Department of Veterans Affairs facilities that could institute similar process improvements.
Conclusion
We made easily implemented and durable process improvement interventions that changed institution-wide ordering practices. These changes dramatically increased the rate of guideline-concordant testing, decreasing cost and furthering the goal of high-value medical care.
1. Anderson JL, Heidenreich PA, Barnett PG, et al; ACC/AHA Task Force on Performance Measures; ACC/AHA Task Force on Practice Guidelines. ACC/AHA statement on cost/value methodology in clinical practice guidelines and performance measures: a report of the American College of Cardiology/American Heart Association Task Force on Performance Measures and Task Force on Practice Guidelines. Circulation. 2014;129(22):2329-2345.
2. Centers for Disease Control and Prevention, National Center for Health Statistics. National hospital ambulatory medical care survey: 2010 emergency department summary tables. https://www.cdc.gov/nchs/data/ahcd/nhamcs_emergency/2010_ed_web_tables.pdf. Accessed March 15, 2019.
3. Morrow DA, Cannon CP, Jesse RL, et al; National Academy of Clinical Biochemistry. National Academy of Clinical Biochemistry Laboratory Medicine Practice Guidelines: Clinical characteristics and utilization of biochemical markers in acute coronary syndromes. Circulation. 2007;115(13):e356-e375.
4. Larochelle MR, Knight AM, Pantle H, Riedel S, Trost JC. Reducing excess cardiac biomarker testing at an academic medical center. J Gen Intern Med. 2014;29(11):1468-1474.
5. Centers for Medicare and Medicaid Services. 2016 clinical laboratory fee schedule. https://www.cms.gov/Medicare/Medicare-Fee -for-Service-Payment/ClinicalLabFeeSched/Clinical-Laboratory-Fee-Schedule-Files-Items/16CLAB.html?DLPage=1&DLEntries=10&DLSort=2&DLSortDir=descending. Accessed March 15, 2019.
In recent years, driven by accelerating health care costs and desire for improved health care value, major specialty group guidelines have incorporated resource utilization and value calculations into their recommendations. High-value care has the characteristics of enhancing outcomes, safety, and patient satisfaction at a reasonable cost. As one example, the American College of Cardiology (ACC) recently published a consensus statement on its clinical practice guidelines with a specific focus on cost and value.1 This guideline acknowledges the difficulty in incorporating value into clinical decision making but stresses a need for increased transparency and consistency to boost value in everyday practice.
Chest pain and related symptoms were listed as the second leading principle reasons for emergency department visits in the US in 2011 with 14% of patients undergoing cardiac enzyme testing.2 The ACC guidelines advocate use of troponin as the preferred laboratory test for the initial evaluation of acute coronary syndrome (ACS). Fractionated creatine kinase (CK-MB) is an acceptable alternative only when a cardiac troponin test is not available.3 Furthermore, troponins should be obtained no more than 3 times for the initial evaluation of a single event, and further trending provides no additional benefit or prognostic information.
A recent study from an academic hospital showed that process improvement interventions focused on eliminating unnecessary cardiac enzyme testing led to a 1-year cost savings of $1.25 million while increasing the rate of ACS diagnosis.4 Common clinical practice at Naval Medical Center Portsmouth (NMCP) in Virginia still routinely includes both troponin as well as a CK panel comprised of CK, CK-MB, and a calculated CK-MB/CK index. Our study focuses on the implementation of quality improvement efforts described by Larochelle and colleagues at NMCP.4 The study aimed to determine the impact of implementing interventions designed to improve the ordering practices and reduce the cost of cardiac enzyme testing.
Methods
The primary focus of the intervention was on ordering practices of the emergency medicine department (EMD), internal medicine (IM) inpatient services, and cardiology inpatient services. Specific interventions were: (1) removal of the CK panel from the chest pain order set in the EMD electronic health record (EHR); (2) removal of the CK panel from the inpatient cardiology order set; (3) education of staff on the changes in CK panel utility via direct communication during IM academic seminars; (4) education of nursing staff ordering laboratory results on behalf of physicians on the cardiology service at the morning and evening huddles; and (5) addition of “max of 3 tests indicated” comment to the inpatient EHR ordering page of the troponin test
Data Source
The process improvement interventions were considered exempt from institutional review board (IRB) approval; however, we obtained expedited IRB approval with waiver of consent for the research aspect of the project. We obtained clinical administrative data from the Military Health System Data Repository (MDR). We identified all adult patients aged ≥ 18 years who had a troponin test, CK-MB, or both drawn at NMCP on the following services: the EMD, IM, and cardiology. A troponin or CK-MB test was defined using Current Procedural Terminology (CPT) codes and unique Logical Observation Identifiers Names and Codes (LOINC).
Measures
The study was divided into 3 periods: the preintervention period from August 1, 2013 to July 31, 2014; the intervention period from August 1, 2014 to January 31, 2015; and the postintervention period February 1, 2015 to January 31, 2016.
The primary outcomes measured were the frequency of guideline concordance and total costs for tests ordered per month using the Centers for Medicare and Medicaid Services (CMS) clinical laboratory fee schedule of $13.40 for troponin and $16.17 for CK-MB.5Concordance was defined as ≤ 3 troponin tests and no CK-MB tests ordered during 1 encounter for a patient without an ACS diagnosis in the preceding 7 days. Due to faster cellular release kinetics of CK-MB compared with that of troponin, this test has utility in evaluating new or worsening chest pain in the setting of a recent myocardial infarction (MI). Therefore, we excluded any patient who had a MI within the preceding 7 days of an order for either CK-MB or troponin tests. Additionally, the number of tests, both CK-MB and troponin, ordered per patient encounter (hereafter referred to as an episode) were measured. Finally, we measured the monthly prevalence of ACS diagnosis and percentage of visits having that diagnosis.
Data Analysis
Descriptive statistics were used to calculate population demographics of age group, sex, beneficiary category, sponsor service, and clinical setting. Monthly data were grouped into the preintervention and postintervention periods. The analysis was performed using t tests to compare mean values and CIs before and after the intervention. Simple linear regression with attention to correlation was used to create best fit lines with confidence bands before and after the intervention. Interrupted time series (ITS) regression was used to describe all data points throughout the study. Consistency between these various methods was verified. Mean values and CIs were reported from the t tests. Statistical significance was reported when appropriate. Equations and confidence predictions on the simple linear regressions were produced and reported. These were used to identify values at the start, midpoint, and end of the pre- and postintervention periods.
Results
There were a total of 6,281 patients in the study population. More patients were seen during the postintervention period than in the preintervention period. The mean age of patients was slightly higher during the preintervention period (Table 1).
Guideline Concordance
To determine whether ordering practices for cardiac enzyme testing improved, we assessed the changes in the frequency of guideline concordance during the pre- and postintervention period. On average during the preintervention year, the percentage of tests ordered that met guideline concordance was 10.1% (95% CI, 7.4%-12.9%), increasing by 0.80% (95% CI, 0.17%-1.42%) each month.
Costs
We assessed changes in total dollars spent on cardiac enzyme testing during the pre- and postintervention periods. During the preintervention year, $9,400 (95% CI, $8,700-$10,100) was spent on average each month, which did not change significantly throughout the period. During the postintervention year, the cost was stable at $5,000 (95% CI, $4,600-$5,300) on average each month, a reduction of $4,400 (95% CI, $3,700-$5,100) (Figure 2).
CK-MB and Troponin Tests per Patient
To further assess ordering practices for cardiac enzyme testing, we compared the changes in the monthly number of tests and the average number of CK-MB and troponin tests ordered per episode pre- and postintervention. On average during the preintervention year, 297 tests (95% CI, 278-315) were run per month, with an average of 1.21 CK tests (95% CI, 1.15-1.27) per episode (Table 2, Figure 3).
The changes in troponin testing were not as dramatic. The counts of tests each month remained similar, with a preintervention year average of 341 (95% CI, 306-377) and postintervention year average of 310 (95% CI, 287-332), which were not statistically different. However, there was a statistically significant decrease in the number of tests per episode. During the preintervention year, 1.38 troponin tests (95% CI, 1.31-1.45) were ordered per patient on average. This dropped by 0.17 (95% CI, 0.09-0.24) to the postintervention average of 1.21 (95% CI, 1.17-1.25) (Table 2, Figure 4).
ACS Prevalence
To determine whether there was an impact on ACS diagnoses, we looked at the numbers of ACS diagnoses and their prevalence among visits before and after the intervention. During the preintervention year, the average monthly number of diagnoses was 29.7 (95% CI, 26.1-33.2), and prevalence of ACS was 0.56% (95% CI, 0.48%-0.63%) of all episodes. Although the monthly rate was statistically decreasing by 0.022% (95% CI, 0.003-0.41), this has little meaning since the level of correlation (r2 = 0.2522, not displayed) was poor due to the essentially nonexistent correlation in number of visits each month (r2 = 0.0112, not displayed). During the postintervention year, the average number of diagnoses was 32.2 (95% CI, 27.9-36.6), and the prevalence of ACS was 0.62% (95% CI, 0.54-0.65). Neither of these values changed significantly between the pre- and postintervention period. All ICD-9 and ICD-10 diagnosis codes used for the analysis are available upon request from the authors.
Discussion
Our data demonstrate the ability of simple process improvement interventions to decrease unnecessary testing in the workup of ACS, increasing the rate of guideline concordant testing by > 70% at a single military treatment facility (MTF). In particular, with the now widespread use of EHR, the order set presents a high-yield target for process improvement in an easily implemented, durable fashion. We had expected to see some decrease in the efficacy of the intervention at a time of staff turnover in the summer of 2015 because ongoing dedicated teaching sessions were not performed. Despite that, the intervention remained effective without further dedicated teaching sessions. This outcome was certainly attributable to the hardwired interventions made (mainly via order sets), but possibly indicates an institutional memory that can take hold after an initial concerted effort is made.
We reduced the estimated preintervention annual cost of $113,000 by $53,000 (95% CI, $42,000-$64,000). Although on a much smaller scale than the study by Larochelle, our study represents a nearly 50% reduction in the total cost of initial testing for possible ACS and a > 80% reduction in unnecessary CK-MB testing.4 This result was achieved with no statistical change in the prevalence of ACS. The cost reduction does not account for the labor costs to clinically follow-up and address additional unnecessary lab results. The estimated cost of intervention was limited to the time required to educate residents, interns, and nursing staff as well as the implementation of the automated, reflexive laboratory results ordering process.
Unique to our study, we also demonstrated an intervention that satisfied all the major stakeholders in the ordering of these laboratory results. By instituting the reflexive ordering of CK-MB tests for positive troponins, we obtained the support of the facility’s interventional cardiology department, which finds value in that data. Appreciating the time-sensitive nature of an ACS diagnosis, the reflexive ordering minimized the delay in receiving these data while still greatly reducing the number of tests performed. That being said, if the current trend away from CK-MB in favor of exclusively testing troponin continues, removing the reflexive ordering for positive laboratory results protocol would be an easy follow-on intervention.
Limitations
Our study presented several limitations. First, reporting errors due to improper or insufficient medical coding as well as data entry errors may exist within the MDR; therefore, the results of this analysis may be over- or underestimated. Specifically, CPT codes for troponin and CK-MB were available only in 1 of the 2 data sets used for this study, which primarily contains outpatient patient encounters. For this reason, most of the laboratory testing comes from the EMD rather than from inpatient services. However, because we excluded all patients who eventually had an ACS diagnosis (patients who likely had more inpatient time and better indication for repeat troponin), we feel that our intervention was still thoroughly investigated. Second, the number of tests drawn per patient was significantly < 2, the expected minimum number of tests to rule out ACS in patients with appropriate symptoms.
This study was not designed to answer the source of variation from guidelines. Many patients had only 1 test, which we feel represents an opportunity for future study to identify other ways cardiac enzyme testing is being used clinically. These tests might be used for patients without convincing symptoms and signs of coronary syndromes or for patients with other primary problems. Third, by using the ITS analysis, we assumed that the outcome during each intervention period follows a linear pattern. However, changes may follow a nonlinear pattern over a long period. Finally, our intervention was limited to only a single MTF, which may limit generalizability to other facilities across military medicine. However, we feel this study should serve as a guide for other MTFs as well as US Department of Veterans Affairs facilities that could institute similar process improvements.
Conclusion
We made easily implemented and durable process improvement interventions that changed institution-wide ordering practices. These changes dramatically increased the rate of guideline-concordant testing, decreasing cost and furthering the goal of high-value medical care.
1. Anderson JL, Heidenreich PA, Barnett PG, et al; ACC/AHA Task Force on Performance Measures; ACC/AHA Task Force on Practice Guidelines. ACC/AHA statement on cost/value methodology in clinical practice guidelines and performance measures: a report of the American College of Cardiology/American Heart Association Task Force on Performance Measures and Task Force on Practice Guidelines. Circulation. 2014;129(22):2329-2345.
2. Centers for Disease Control and Prevention, National Center for Health Statistics. National hospital ambulatory medical care survey: 2010 emergency department summary tables. https://www.cdc.gov/nchs/data/ahcd/nhamcs_emergency/2010_ed_web_tables.pdf. Accessed March 15, 2019.
3. Morrow DA, Cannon CP, Jesse RL, et al; National Academy of Clinical Biochemistry. National Academy of Clinical Biochemistry Laboratory Medicine Practice Guidelines: Clinical characteristics and utilization of biochemical markers in acute coronary syndromes. Circulation. 2007;115(13):e356-e375.
4. Larochelle MR, Knight AM, Pantle H, Riedel S, Trost JC. Reducing excess cardiac biomarker testing at an academic medical center. J Gen Intern Med. 2014;29(11):1468-1474.
5. Centers for Medicare and Medicaid Services. 2016 clinical laboratory fee schedule. https://www.cms.gov/Medicare/Medicare-Fee -for-Service-Payment/ClinicalLabFeeSched/Clinical-Laboratory-Fee-Schedule-Files-Items/16CLAB.html?DLPage=1&DLEntries=10&DLSort=2&DLSortDir=descending. Accessed March 15, 2019.
Clinical Pharmacist Credentialing and Privileging: A Process for Ensuring High-Quality Patient Care
The Red Lake Indian Health Service (IHS) health care facility is in north-central Minnesota within the Red Lake Nation. The facility supports primary care, emergency, urgent care, pharmacy, inpatient, optometry, dental, radiology, laboratory, physical therapy, and behavioral health services to about 10,000 Red Lake Band of Chippewa Indian patients. The Red Lake pharmacy provides inpatient and outpatient medication services and pharmacist-managed clinical patient care.
In 2013, the Red Lake IHS medical staff endorsed the implementation of comprehensive clinical pharmacy services to increase health care access and optimize clinical outcomes for patients. During the evolution of pharmacy-based patient-centric care, the clinical programs offered by Red Lake IHS pharmacy expanded from 1 anticoagulation clinic to multiple advanced-practice clinical pharmacy services. This included pharmacy primary care, medication-assisted therapy, naloxone, hepatitis C, and behavioral health medication management clinics.
The immense clinical growth of the pharmacy department demonstrated a need to assess and monitor pharmacist competency to ensure the delivery of quality patient care. Essential quality improvement processes were lacking. To fill these quality improvement gaps, a robust pharmacist credentialing and privileging program was implemented in 2015.
Patient Care
As efforts within health care establishments across the US focus on the delivery of efficient, high-quality, affordable health care, pharmacists have become increasingly instrumental in providing patient care within expanded clinical roles.1-8 Many clinical pharmacy models have evolved into interdisciplinary approaches to care.9 Within these models, abiding by state and federal laws, pharmacists practice under the indirect supervision of licensed independent practitioners (LIPs), such as physicians, nurse practitioners, and physician assistants.8 Under collaborative practice agreements (CPAs), patients are initially diagnosed by LIPs, then referred to clinical pharmacists for therapeutic management.5,7
Clinical pharmacist functions encompass comprehensive medication management (ie, prescribing, monitoring, and adjustment of medications), nonpharmacologic guidance, and coordination of care. Interdisciplinary collaboration allows pharmacists opportunities to provide direct patient care or consultations by telecommunication in many different clinical environments, including disease management, primary care, or specialty care. Pharmacists may manage chronic or acute illnesses associated with endocrine, cardiovascular, respiratory, gastrointestinal, or other systems.
Pharmacists may also provide comprehensive medication review services, such as medication therapy management (MTM), transitions of care, or chronic care management. Examples of specialized areas include psychiatric, opioid use disorder, palliative care, infectious disease, chronic pain, or oncology services. For hospitalized patients, pharmacists may monitor pharmacokinetics and adjust dosing, transition patients from IV to oral medications, or complete medication reconciliation.10 Within these clinical roles, pharmacists assist in providing patient care during shortages of other health care providers (HCPs), improve patient outcomes, decrease health care-associated costs by preventing emergency department and hospital admissions or readmissions, increase access to patient care, and increase revenue through pharmacist-managed clinics and services.11
Pharmacist Credentialing
With the advancement of modern clinical pharmacy practice, many pharmacists have undertaken responsibilities to fulfill the complex duties of clinical care and diverse patient situations, but with few or no requirements to prove initial or ongoing clinical competency.2 Traditionally, pharmacist credentialing is limited to a onetime or periodic review of education and licensure, with little to no involvement in privileging and ongoing monitoring of clinical proficiency.10 These quality assurance disparities can be met and satisfied through credentialing and privileging processes. Credentialing and privileging are systematic, evidence-based processes that provide validation to HCPs, employers, and patients that pharmacists are qualified to practice clinically. 2,9 According to the Council on Credentialing in Pharmacy, clinical pharmacists should be held accountable for demonstrating competency and providing quality care through credentialing and privileging, as required for other HCPs.2,12
Credentialing and recredentialing is a primary source verification process. These processes ensure that there are no license restrictions or revocations; certifications are current; mandatory courses, certificates, and continuing education are complete; training and orientation are satisfactory; and any disciplinary action, malpractice claims, or history of impairment is reported. Privileging is the review of credentials and evaluation of clinical training and competence by the Clinical Director and Medical Executive Committee to determine whether a clinical pharmacist is competent to practice within requested privileges.11
Credentialing and privileging processes are designed not only to initially confirm that a pharmacist is competent to practice clinically, but also monitor ongoing performance.2,13 Participation in professional practice evaluations, which includes peer reviews, ongoing professional practice evaluations, and focused professional practice evaluations, is required for all credentialed and privileged practitioners. These evaluations are used to identify, assess, and correct unsatisfactory trends. Individual practices, documentation, and processes are evaluated against existing department standards (eg, CPAs, policies, processes)11,13 The results of individual professional practice evaluations are reviewed with practitioners on a regular basis and performance improvement plans implemented as needed.
Since 2015, 17 pharmacists at the Red Lake IHS health care facility have been granted membership to the medical staff as credentialed and privileged practitioners. In a retrospective review of professional practice evaluations by the Red Lake IHS pharmacy clinical coordinator, 971 outpatient clinical peer reviews, including the evaluation of 21,526 peer-review elements were completed by pharmacists from fiscal year 2015 through 2018. Peer-review elements assessed
Conclusion
Pharmacists have become increasingly instrumental in providing effective, cost-efficient, and accessible clinical services by continuing to move toward expanding and evolving roles within comprehensive, patient-centered clinical pharmacy practice settings.5,6 Multifaceted clinical responsibilities associated with health care delivery necessitate assessment and monitoring of pharmacist performance. Credentialing and privileging is an established and trusted systematic process that assures HCPs, employers, and patients that pharmacists are qualified and competent to practice clinically.2,4,12 Implementation of professional practice evaluations suggest improved staff compliance with visit documentation, patient care standards, and clinic processes required by CPAs, policies, and department standards to ensure the delivery of safe, high-quality patient care.
1. Giberson S, Yoder S, Lee MP. Improving patient and health system outcomes through advanced pharmacy practice. https://www.accp.com/docs/positions/misc/Improving_Patient_and_Health_System_Outcomes.pdf. Published December 2011. Accessed March 15, 2019.
2. Rouse MJ, Vlasses PH, Webb CE; Council on Credentialing in Pharmacy. Credentialing and privileging of pharmacists: a resource paper from the Council on Credentialing in Pharmacy. Am J Health Syst Pharm. 2014;71(21):e109-e118.
3. Berwick DM, Nolan TW, Whittington J. The triple aim: care, health, and cost. Health Aff (Millwood). 2008;27(3):759-769.
4. Blair MM, Carmichael J, Young E, Thrasher K; Qualified Provider Model Ad Hoc Committee. Pharmacist privileging in a health system: report of the Qualified Provider Model Ad Hoc Committee. Am J Health Syst Pharm. 2007;64(22):2373-2381.
5. Claxton KI, Wojtal P. Design and implementation of a credentialing and privileging model for ambulatory care pharmacists. Am J Health Syst Pharm. 2006;63(17):1627-1632.
6. Jordan TA, Hennenfent JA, Lewin JJ III, Nesbit TW, Weber R. Elevating pharmacists’ scope of practice through a health-system clinical privileging process. Am J Health Syst Pharm. 2016;73(18):1395-1405.
7. Centers for Disease Control and Prevention. Collaborative practice agreements and pharmacists’ patient care services: a resource for doctors, nurses, physician assistants, and other providers. https://www.cdc.gov/dhdsp/pubs/docs/Translational_Tools_Providers.pdf. Published October 2013. Accessed March 18, 2019.
8. Council on Credentialing in Pharmacy, Albanese NP, Rouse MJ. Scope of contemporary pharmacy practice: roles, responsibilities, and functions of practitioners and pharmacy technicians. J Am Pharm Assoc (2003). 2010;50(2):e35-e69.
9. Philip B, Weber R. Enhancing pharmacy practice models through pharmacists’ privileging. Hosp Pharm. 2013; 48(2):160-165.
10. Galt KA. Credentialing and privileging of pharmacists. Am J Health Syst Pharm. 2004;61(7):661-670.
11. Smith ML, Gemelas MF; US Public Health Service; Indian Health Service. Indian Health Service medical staff credentialing and privileging guide. https://www.ihs.gov/riskmanagement/includes/themes/newihstheme/display_objects/documents/IHS-Medical-Staff-Credentialing-and-Privileging-Guide.pdf. Published September 2005. Accessed March 15, 2019.
12. US Department of Health and Human Services, Indian Health Service. Indian health manual: medical credentials and privileges review process. https://www.ihs.gov/ihm/pc/part-3/p3c1. Accessed March 15, 2019.
13. Holley SL, Ketel C. Ongoing professional practice evaluation and focused professional practice evaluation: an overview for advanced practice clinicians. J Midwifery Women Health. 2014;59(4):452-459.
The Red Lake Indian Health Service (IHS) health care facility is in north-central Minnesota within the Red Lake Nation. The facility supports primary care, emergency, urgent care, pharmacy, inpatient, optometry, dental, radiology, laboratory, physical therapy, and behavioral health services to about 10,000 Red Lake Band of Chippewa Indian patients. The Red Lake pharmacy provides inpatient and outpatient medication services and pharmacist-managed clinical patient care.
In 2013, the Red Lake IHS medical staff endorsed the implementation of comprehensive clinical pharmacy services to increase health care access and optimize clinical outcomes for patients. During the evolution of pharmacy-based patient-centric care, the clinical programs offered by Red Lake IHS pharmacy expanded from 1 anticoagulation clinic to multiple advanced-practice clinical pharmacy services. This included pharmacy primary care, medication-assisted therapy, naloxone, hepatitis C, and behavioral health medication management clinics.
The immense clinical growth of the pharmacy department demonstrated a need to assess and monitor pharmacist competency to ensure the delivery of quality patient care. Essential quality improvement processes were lacking. To fill these quality improvement gaps, a robust pharmacist credentialing and privileging program was implemented in 2015.
Patient Care
As efforts within health care establishments across the US focus on the delivery of efficient, high-quality, affordable health care, pharmacists have become increasingly instrumental in providing patient care within expanded clinical roles.1-8 Many clinical pharmacy models have evolved into interdisciplinary approaches to care.9 Within these models, abiding by state and federal laws, pharmacists practice under the indirect supervision of licensed independent practitioners (LIPs), such as physicians, nurse practitioners, and physician assistants.8 Under collaborative practice agreements (CPAs), patients are initially diagnosed by LIPs, then referred to clinical pharmacists for therapeutic management.5,7
Clinical pharmacist functions encompass comprehensive medication management (ie, prescribing, monitoring, and adjustment of medications), nonpharmacologic guidance, and coordination of care. Interdisciplinary collaboration allows pharmacists opportunities to provide direct patient care or consultations by telecommunication in many different clinical environments, including disease management, primary care, or specialty care. Pharmacists may manage chronic or acute illnesses associated with endocrine, cardiovascular, respiratory, gastrointestinal, or other systems.
Pharmacists may also provide comprehensive medication review services, such as medication therapy management (MTM), transitions of care, or chronic care management. Examples of specialized areas include psychiatric, opioid use disorder, palliative care, infectious disease, chronic pain, or oncology services. For hospitalized patients, pharmacists may monitor pharmacokinetics and adjust dosing, transition patients from IV to oral medications, or complete medication reconciliation.10 Within these clinical roles, pharmacists assist in providing patient care during shortages of other health care providers (HCPs), improve patient outcomes, decrease health care-associated costs by preventing emergency department and hospital admissions or readmissions, increase access to patient care, and increase revenue through pharmacist-managed clinics and services.11
Pharmacist Credentialing
With the advancement of modern clinical pharmacy practice, many pharmacists have undertaken responsibilities to fulfill the complex duties of clinical care and diverse patient situations, but with few or no requirements to prove initial or ongoing clinical competency.2 Traditionally, pharmacist credentialing is limited to a onetime or periodic review of education and licensure, with little to no involvement in privileging and ongoing monitoring of clinical proficiency.10 These quality assurance disparities can be met and satisfied through credentialing and privileging processes. Credentialing and privileging are systematic, evidence-based processes that provide validation to HCPs, employers, and patients that pharmacists are qualified to practice clinically. 2,9 According to the Council on Credentialing in Pharmacy, clinical pharmacists should be held accountable for demonstrating competency and providing quality care through credentialing and privileging, as required for other HCPs.2,12
Credentialing and recredentialing is a primary source verification process. These processes ensure that there are no license restrictions or revocations; certifications are current; mandatory courses, certificates, and continuing education are complete; training and orientation are satisfactory; and any disciplinary action, malpractice claims, or history of impairment is reported. Privileging is the review of credentials and evaluation of clinical training and competence by the Clinical Director and Medical Executive Committee to determine whether a clinical pharmacist is competent to practice within requested privileges.11
Credentialing and privileging processes are designed not only to initially confirm that a pharmacist is competent to practice clinically, but also monitor ongoing performance.2,13 Participation in professional practice evaluations, which includes peer reviews, ongoing professional practice evaluations, and focused professional practice evaluations, is required for all credentialed and privileged practitioners. These evaluations are used to identify, assess, and correct unsatisfactory trends. Individual practices, documentation, and processes are evaluated against existing department standards (eg, CPAs, policies, processes)11,13 The results of individual professional practice evaluations are reviewed with practitioners on a regular basis and performance improvement plans implemented as needed.
Since 2015, 17 pharmacists at the Red Lake IHS health care facility have been granted membership to the medical staff as credentialed and privileged practitioners. In a retrospective review of professional practice evaluations by the Red Lake IHS pharmacy clinical coordinator, 971 outpatient clinical peer reviews, including the evaluation of 21,526 peer-review elements were completed by pharmacists from fiscal year 2015 through 2018. Peer-review elements assessed
Conclusion
Pharmacists have become increasingly instrumental in providing effective, cost-efficient, and accessible clinical services by continuing to move toward expanding and evolving roles within comprehensive, patient-centered clinical pharmacy practice settings.5,6 Multifaceted clinical responsibilities associated with health care delivery necessitate assessment and monitoring of pharmacist performance. Credentialing and privileging is an established and trusted systematic process that assures HCPs, employers, and patients that pharmacists are qualified and competent to practice clinically.2,4,12 Implementation of professional practice evaluations suggest improved staff compliance with visit documentation, patient care standards, and clinic processes required by CPAs, policies, and department standards to ensure the delivery of safe, high-quality patient care.
1. Giberson S, Yoder S, Lee MP. Improving patient and health system outcomes through advanced pharmacy practice. https://www.accp.com/docs/positions/misc/Improving_Patient_and_Health_System_Outcomes.pdf. Published December 2011. Accessed March 15, 2019.
2. Rouse MJ, Vlasses PH, Webb CE; Council on Credentialing in Pharmacy. Credentialing and privileging of pharmacists: a resource paper from the Council on Credentialing in Pharmacy. Am J Health Syst Pharm. 2014;71(21):e109-e118.
3. Berwick DM, Nolan TW, Whittington J. The triple aim: care, health, and cost. Health Aff (Millwood). 2008;27(3):759-769.
4. Blair MM, Carmichael J, Young E, Thrasher K; Qualified Provider Model Ad Hoc Committee. Pharmacist privileging in a health system: report of the Qualified Provider Model Ad Hoc Committee. Am J Health Syst Pharm. 2007;64(22):2373-2381.
5. Claxton KI, Wojtal P. Design and implementation of a credentialing and privileging model for ambulatory care pharmacists. Am J Health Syst Pharm. 2006;63(17):1627-1632.
6. Jordan TA, Hennenfent JA, Lewin JJ III, Nesbit TW, Weber R. Elevating pharmacists’ scope of practice through a health-system clinical privileging process. Am J Health Syst Pharm. 2016;73(18):1395-1405.
7. Centers for Disease Control and Prevention. Collaborative practice agreements and pharmacists’ patient care services: a resource for doctors, nurses, physician assistants, and other providers. https://www.cdc.gov/dhdsp/pubs/docs/Translational_Tools_Providers.pdf. Published October 2013. Accessed March 18, 2019.
8. Council on Credentialing in Pharmacy, Albanese NP, Rouse MJ. Scope of contemporary pharmacy practice: roles, responsibilities, and functions of practitioners and pharmacy technicians. J Am Pharm Assoc (2003). 2010;50(2):e35-e69.
9. Philip B, Weber R. Enhancing pharmacy practice models through pharmacists’ privileging. Hosp Pharm. 2013; 48(2):160-165.
10. Galt KA. Credentialing and privileging of pharmacists. Am J Health Syst Pharm. 2004;61(7):661-670.
11. Smith ML, Gemelas MF; US Public Health Service; Indian Health Service. Indian Health Service medical staff credentialing and privileging guide. https://www.ihs.gov/riskmanagement/includes/themes/newihstheme/display_objects/documents/IHS-Medical-Staff-Credentialing-and-Privileging-Guide.pdf. Published September 2005. Accessed March 15, 2019.
12. US Department of Health and Human Services, Indian Health Service. Indian health manual: medical credentials and privileges review process. https://www.ihs.gov/ihm/pc/part-3/p3c1. Accessed March 15, 2019.
13. Holley SL, Ketel C. Ongoing professional practice evaluation and focused professional practice evaluation: an overview for advanced practice clinicians. J Midwifery Women Health. 2014;59(4):452-459.
Use of GBCA in MRIs for High-Risk Patients
To the Editor:
We read with interest the case report of nephrogenic systemic fibrosis (NSF) by Chuang, Kaneshiro, and Betancourt in the June 2018 issue of Federal Practitioner.1 It was reported that a 61-year-old Hispanic male patient with a history of IV heroin abuse with end-stage renal disease (ESRD) secondary to membranous glomerulonephritis on hemodialysis and chronic hepatitis C infection received 15 mL gadoversetamide, a linear gadolinium-based contrast agent (GBCA) during magnetic resonance imaging (MRI) of the brain. Hemodialysis was performed 18 hours after the contrast administration.
Eight weeks after his initial presentation, the patient developed pyoderma gangrenosum on his right forearm, which was treated with high-dose steroids. He then developed thickening and induration of his bilateral forearm skin with peau d’orange appearance. NSF was confirmed by a skin biopsy. The patient developed contractures of his upper and lower extremities and was finally wheelchair bound.
This case is very concerning since no NSF cases in patients receiving GBCA have been published since 2009. Unfortunately, the authors give no information on the occurrence of this particular case. Thus, it is unclear whether this case was observed before or after the switch to macrocyclic agents in patients with reduced renal function. The reported patient with ESRD was on hemodialysis and received 15 mL gadoversetamide during MRI of the brain. In 2007 the ESUR (European Society of Urogenital Radiology) published guidelines indicating linear GBCA (gadodiamide, gadoversetamide, gadopentetate dimeglumine) as high-risk agents that may not be used in patients with eGFR < 30 mL/min/1.73 m2.2,3
Consequently in 2007, the European Medicines Agency contraindicated these linear GBCA in patients with chronic kidney disease grades 4 and 5. Also in 2007 the US Food and Drug Administration (FDA) requested a revision of the prescribing information for all 5 GBCA approved in the US.4 In response to accumulating more informative data, in 2010 the FDA again used this class labeling approach to more explicitly describe differences in NSF risks among the agents.4 FDA regulation and contraindication of the use of low-stability GBCA in patients with advanced renal impairment and robust local policies on the safe use of these agents have resulted in marked reduction in the prevalence of NSF in the US. This case report needs to clarify why a high-risk linear agent was administered to a patient with ESRD.
In 2006 Grobner and Marckmann and colleagues reported their observations of a previously unrecognized link between exposure to gadodiamide and the development of NSF.5,6 It soon became clear that NSF is a delayed adverse contrast reaction that may cause severe disability and even death. Advanced renal disease and high-risk linear GBCA are the main factors in the pathogenesis of NSF. Additionally, the dose of the agent may play a role. NSF can occur from hours to years after exposure to GBCA. Not all patients with severe kidney disease exposed to high-risk agents developed NSF. Thus, additional factors were proposed to play a role in the pathogenesis of NSF. Among those factors were erythropoietin, metabolic acidosis, anion gap, iron, increased phosphate, zinc loss, proinflammatory conditions/inflammation and angiotensin-converting enzyme (ACE) inhibitors.7 Although there is little proof with these assumptions, special care must be taken as shown by this reported patient with multiple inflammatory disorders.
- Gertraud Heinz, MD, MBA; Aart van der Molen, MD; and Giles Roditi, MD; on behalf of the ESUR Contrast Media Safety Committee
Author affiliations: Gertraud Heinz is former President ESUR and Head of the Department of Radiology, Diagnostics and Intervention University Hospital St. Pölten Karl Landsteiner University of Health Sciences.
Correspondence: Gertraud Heinz (gertraud.heinz@stpoelten .lknoe.at)
Disclosures: The authors report no conflict of interest with regard to this article.
References
1. Chuang K, Kaneshiro C, Betancourt J. Nephrogenic systemic fibrosis in a patient with multiple inflammatory disorders. Fed Pract. 2018;35(6):40-43.
2. Thomsen HS; European Society of Urogenital Radiology (ESUR). ESUR guideline: gadolinium based contrast media and nephrogenic systemic fibrosis. Eur Radiol. 2007;17(10):2692-2696.
3. Thomsen HS, Morcos SK, Almén T, et al; ESUR Contrast Medium Safety Committee. Nephrogenic systemic fibrosis and gadolinium-based contrast media: updated ESUR Contrast Media Safety Committee guidelines. Eur Radiol. 2013;23(2):307-318
4. Yang L, Krefting I, Gorovets A, et al. Nephrogenic systemic fibrosis and class labeling of gadolinium-based agents by the Food and Drug Administration. Radiology. 2012;265(1):248-253.
5. Grobner T. Gadolinium—a specific trigger for the development of nephrogenic fibrosing dermopathy and nephrogenic systemic fibrosis? Nephrol Dial Transplant. 2006;21(4):1104-1108.
6. Marckmann P, Skov L, Rossen K, et al. Nephrogenic systemic fibrosis: suspected causative role of gadodiamide used for contrast-enhanced magnetic resonance imaging. J Am Soc Nephrol. 2006;17(9):2359-2362.
7. Thomsen HS, Bennett CL. Six years after. Acta Radiol. 2012;53(8):827-829.
To the Editor:
With great interest, I read the case report by Chuang, Kaneshiro, and Betancourt.1 Patients with nephrogenic systemic fibrosis (NSF) are of special interest because the disease is still unclear as mentioned by the authors. Although new cases may occur,2 this case raises some concerns that I would like to address.
First, it would be of great interest to know the date when the patient received the high-risk gadolinium-based contrast agent (GBCA) gadoversetamide. Unfortunately, the authors did not mention the date of the injection of the GBCA that probably caused NSF. Due to the obvious association between the applications of special GBCAs in 2006, the US Food and Drug Administration (FDA) warned physicians not to inject these contrast agents in patients with compromised kidney function.3 Moreover, in 2007 the American College of Radiology (ACR) published guidelines for the safe use of GBCAs in patients with renal failure.4 Also, the European Medicines Agency (EMA) demanded that companies provide warning in product inserts about the acquisition of NSF in patients with severe kidney injury.5
Second, the clinical illustration of the case is inadequate. In the manuscript, we read that the patient acquired NSF-characteristic lesions like peau d’orange skin lesions and contractures of his extremities, but unfortunately, Chuang, Kaneshiro, and Betancourt did not provide figures that show them. On the other hand, Figure 1 shows an uncharacteristic dermal induration around inflammatory and ulcerated skin lesion (pyoderma gangrenosum).1 Such clinical signs are well known and occur perilesional of different conditions independently of NSF.6-8
Third, the histological features described as presence of fibrotic tissue in the deep dermis in Figure 2, and dermal fibrosis with thick collagen deposition in Figure 31 do not confirm the existence of NSF.
Taken together, the case presented by Chuang, Kaneshiro, and Betancourt contains some unclear aspects; therefore, it is questionable whether the published case describes a patient with NSF or not. In the current presentation, the diagnosis NSF seems to be an overestimation.
NSF still is a poorly understood disorder. Therefore, exactly documented new cases could be of clinical value when providing interesting information. Even single cases could shed some light in the darkness of the pathological mechanisms of this entity. On the other hand, we should not mix the existing cohort of published NSF cases with other scleroderma-like diseases, because this will lead to a confusion. Moreover, such a practice could inhibit the discovery of the pathophysiology of NSF.
- Ingrid Böhm, MD
Author affiliations: Ingrid Böhm is a Physician in the Department of Diagnostics, Interventional and Pediatric Radiology at the University Hospital of Bern, Inselspital, University of Bern in Bern, Switzerland.
Correspondence: Ingrid Böhm ([email protected])
Disclosures: The author reports no conflict of interest with regard to this article.
References
1. Chuang K, Kaneshiro C, Betancourt J. Nephrogenic systemic fibrosis in a patient with multiple inflammatory disorders. Fed Pract . 2018;35(6):40-43.
2. Larson KN, Gagnon AL, Darling MD, Patterson JW, Cropley TG. Nephrogenic systemic fibrosis manifesting a decade after exposure to gadolinium. JAMA Dermatol. 2015;151(10):1117-1120.
3. US Food and Drug Administration. A Public Health Advisory. Gadolinium-containing contrast agents for magnetic resonance imaging (MRI). http://wayback.archive-it.org/7993/20170112033022/http://www.fda.gov/Drugs/DrugSafety/PostmarketDrugSafetyInformation forPatientsandProviders/ucm053112.htm. Published June 8, 2006. Accessed March 15, 2019.
4. Kanal E, Barkovich AJ, Bell C, et al; ACR Blue Ribbon Panel on MR Safety. ACR guidance document for safe MR practices: 2007. AJR Am J Roentgenol. 2007;188(6):1447-1474.
5. European Medicines Agency. Public statement: Vasovist and nephrogenic systemic fibrosis (NSF). https://www.ema.europa.eu/en/news/public-statement-vasovist-nephrogenic-systemic-fibrosis-nsf. Published February 7, 2007. Accessed March 15, 2019.
6. Luke JC. The etiology and modern treatment of varicose ulcer. Can Med Assoc J. 1940;43(3):217-221.
7. Paulsen E, Bygum A. Keratin gel as an adjuvant in the treatment of recalcitrant pyoderma gangrenosum ulcers: a case report. Acta Derm Venereol. 2019;99(2):234-235.
8. Boehm I, Bauer R. Low-dose methotrexate controls a severe form of polyarteritis nodosa. Arch Dermatol. 2000; 136(2):167-169.
Response:
We thank Drs. Heinz, van der Molen, and Roditi for their valuable response. The following is the opinion of the authors and is not representative of the views or policies of our institution. The patient in this case received a gadolinium-based contrast agent (GBCA) in 2015 and was diagnosed with nephrogenic systemic fibrosis (NSF) 8 weeks later. We agree with the correspondents that linear GBCAs should not be used in patients with eGFR < 30 mL/min/1.73 m2. To date, a few cases of patients who received GBCA and developed NSF since 2009 have unfortunately continued to be reported in the literature.1-3 Our intention in publishing this case was to provide ongoing education to the medical community regarding this serious condition to ensure prevention of future cases.
We thank Dr. Böhm for her important inquiry. The patient received a histopathologic diagnosis of NSF. The report from the patient’s left dorsal forearm skin punch biopsy was read by our pathologist as “fibrosis and inflammation consistent with nephrogenic systemic fibrosis,” a diagnosis agreed upon by our colleagues in the dermatology and rheumatology departments based on the rapidity of his symptom onset and progression. While we acknowledge that this patient had other inflammatory disorders of the skin that may have coexisted with the diagnosis, after weighing the preponderance of clinical evidence in support of the biopsy results, we believe that this represents a case of NSF, which is associated with high morbidity and mortality. Thankfully, the patient in this case engaged extensively in physical and occupational therapy and is still alive nearly 4 years later. We would like to thank all the letter writers for their correspondence.
Author Affiliations: Kelley Chuang and Casey Kaneshiro are Hospitalists and Jaime Betancourt is a Pulmonologist, all in the Department of Medicine at the VA Greater Los Angeles Healthcare System in California.
Correspondence: Kelley Chuang ([email protected])
Disclosures: The authors report no conflict of interest with regard to this article.
References
1. Aggarwal A, Froehlich AA, Essah P, Brinster N, High WA, Downs RW. Complications of nephrogenic systemic fibrosis following repeated exposure to gadolinium in a man with hypothyroidism: a case report. J Med Case Rep. 2011;5:566.
2. Fuah KW, Lim CT. Erythema nodosum masking nephrogenic systemic fibrosis as initial skin manifestation. BMC Nephrol. 2017;18(1):249.
3. Koratala A, Bhatti V. Nephrogenic systemic fibrosis. Clin Case Rep. 2017;5(7):1184-1185.
To the Editor:
We read with interest the case report of nephrogenic systemic fibrosis (NSF) by Chuang, Kaneshiro, and Betancourt in the June 2018 issue of Federal Practitioner.1 It was reported that a 61-year-old Hispanic male patient with a history of IV heroin abuse with end-stage renal disease (ESRD) secondary to membranous glomerulonephritis on hemodialysis and chronic hepatitis C infection received 15 mL gadoversetamide, a linear gadolinium-based contrast agent (GBCA) during magnetic resonance imaging (MRI) of the brain. Hemodialysis was performed 18 hours after the contrast administration.
Eight weeks after his initial presentation, the patient developed pyoderma gangrenosum on his right forearm, which was treated with high-dose steroids. He then developed thickening and induration of his bilateral forearm skin with peau d’orange appearance. NSF was confirmed by a skin biopsy. The patient developed contractures of his upper and lower extremities and was finally wheelchair bound.
This case is very concerning since no NSF cases in patients receiving GBCA have been published since 2009. Unfortunately, the authors give no information on the occurrence of this particular case. Thus, it is unclear whether this case was observed before or after the switch to macrocyclic agents in patients with reduced renal function. The reported patient with ESRD was on hemodialysis and received 15 mL gadoversetamide during MRI of the brain. In 2007 the ESUR (European Society of Urogenital Radiology) published guidelines indicating linear GBCA (gadodiamide, gadoversetamide, gadopentetate dimeglumine) as high-risk agents that may not be used in patients with eGFR < 30 mL/min/1.73 m2.2,3
Consequently in 2007, the European Medicines Agency contraindicated these linear GBCA in patients with chronic kidney disease grades 4 and 5. Also in 2007 the US Food and Drug Administration (FDA) requested a revision of the prescribing information for all 5 GBCA approved in the US.4 In response to accumulating more informative data, in 2010 the FDA again used this class labeling approach to more explicitly describe differences in NSF risks among the agents.4 FDA regulation and contraindication of the use of low-stability GBCA in patients with advanced renal impairment and robust local policies on the safe use of these agents have resulted in marked reduction in the prevalence of NSF in the US. This case report needs to clarify why a high-risk linear agent was administered to a patient with ESRD.
In 2006 Grobner and Marckmann and colleagues reported their observations of a previously unrecognized link between exposure to gadodiamide and the development of NSF.5,6 It soon became clear that NSF is a delayed adverse contrast reaction that may cause severe disability and even death. Advanced renal disease and high-risk linear GBCA are the main factors in the pathogenesis of NSF. Additionally, the dose of the agent may play a role. NSF can occur from hours to years after exposure to GBCA. Not all patients with severe kidney disease exposed to high-risk agents developed NSF. Thus, additional factors were proposed to play a role in the pathogenesis of NSF. Among those factors were erythropoietin, metabolic acidosis, anion gap, iron, increased phosphate, zinc loss, proinflammatory conditions/inflammation and angiotensin-converting enzyme (ACE) inhibitors.7 Although there is little proof with these assumptions, special care must be taken as shown by this reported patient with multiple inflammatory disorders.
- Gertraud Heinz, MD, MBA; Aart van der Molen, MD; and Giles Roditi, MD; on behalf of the ESUR Contrast Media Safety Committee
Author affiliations: Gertraud Heinz is former President ESUR and Head of the Department of Radiology, Diagnostics and Intervention University Hospital St. Pölten Karl Landsteiner University of Health Sciences.
Correspondence: Gertraud Heinz (gertraud.heinz@stpoelten .lknoe.at)
Disclosures: The authors report no conflict of interest with regard to this article.
References
1. Chuang K, Kaneshiro C, Betancourt J. Nephrogenic systemic fibrosis in a patient with multiple inflammatory disorders. Fed Pract. 2018;35(6):40-43.
2. Thomsen HS; European Society of Urogenital Radiology (ESUR). ESUR guideline: gadolinium based contrast media and nephrogenic systemic fibrosis. Eur Radiol. 2007;17(10):2692-2696.
3. Thomsen HS, Morcos SK, Almén T, et al; ESUR Contrast Medium Safety Committee. Nephrogenic systemic fibrosis and gadolinium-based contrast media: updated ESUR Contrast Media Safety Committee guidelines. Eur Radiol. 2013;23(2):307-318
4. Yang L, Krefting I, Gorovets A, et al. Nephrogenic systemic fibrosis and class labeling of gadolinium-based agents by the Food and Drug Administration. Radiology. 2012;265(1):248-253.
5. Grobner T. Gadolinium—a specific trigger for the development of nephrogenic fibrosing dermopathy and nephrogenic systemic fibrosis? Nephrol Dial Transplant. 2006;21(4):1104-1108.
6. Marckmann P, Skov L, Rossen K, et al. Nephrogenic systemic fibrosis: suspected causative role of gadodiamide used for contrast-enhanced magnetic resonance imaging. J Am Soc Nephrol. 2006;17(9):2359-2362.
7. Thomsen HS, Bennett CL. Six years after. Acta Radiol. 2012;53(8):827-829.
To the Editor:
With great interest, I read the case report by Chuang, Kaneshiro, and Betancourt.1 Patients with nephrogenic systemic fibrosis (NSF) are of special interest because the disease is still unclear as mentioned by the authors. Although new cases may occur,2 this case raises some concerns that I would like to address.
First, it would be of great interest to know the date when the patient received the high-risk gadolinium-based contrast agent (GBCA) gadoversetamide. Unfortunately, the authors did not mention the date of the injection of the GBCA that probably caused NSF. Due to the obvious association between the applications of special GBCAs in 2006, the US Food and Drug Administration (FDA) warned physicians not to inject these contrast agents in patients with compromised kidney function.3 Moreover, in 2007 the American College of Radiology (ACR) published guidelines for the safe use of GBCAs in patients with renal failure.4 Also, the European Medicines Agency (EMA) demanded that companies provide warning in product inserts about the acquisition of NSF in patients with severe kidney injury.5
Second, the clinical illustration of the case is inadequate. In the manuscript, we read that the patient acquired NSF-characteristic lesions like peau d’orange skin lesions and contractures of his extremities, but unfortunately, Chuang, Kaneshiro, and Betancourt did not provide figures that show them. On the other hand, Figure 1 shows an uncharacteristic dermal induration around inflammatory and ulcerated skin lesion (pyoderma gangrenosum).1 Such clinical signs are well known and occur perilesional of different conditions independently of NSF.6-8
Third, the histological features described as presence of fibrotic tissue in the deep dermis in Figure 2, and dermal fibrosis with thick collagen deposition in Figure 31 do not confirm the existence of NSF.
Taken together, the case presented by Chuang, Kaneshiro, and Betancourt contains some unclear aspects; therefore, it is questionable whether the published case describes a patient with NSF or not. In the current presentation, the diagnosis NSF seems to be an overestimation.
NSF still is a poorly understood disorder. Therefore, exactly documented new cases could be of clinical value when providing interesting information. Even single cases could shed some light in the darkness of the pathological mechanisms of this entity. On the other hand, we should not mix the existing cohort of published NSF cases with other scleroderma-like diseases, because this will lead to a confusion. Moreover, such a practice could inhibit the discovery of the pathophysiology of NSF.
- Ingrid Böhm, MD
Author affiliations: Ingrid Böhm is a Physician in the Department of Diagnostics, Interventional and Pediatric Radiology at the University Hospital of Bern, Inselspital, University of Bern in Bern, Switzerland.
Correspondence: Ingrid Böhm ([email protected])
Disclosures: The author reports no conflict of interest with regard to this article.
References
1. Chuang K, Kaneshiro C, Betancourt J. Nephrogenic systemic fibrosis in a patient with multiple inflammatory disorders. Fed Pract . 2018;35(6):40-43.
2. Larson KN, Gagnon AL, Darling MD, Patterson JW, Cropley TG. Nephrogenic systemic fibrosis manifesting a decade after exposure to gadolinium. JAMA Dermatol. 2015;151(10):1117-1120.
3. US Food and Drug Administration. A Public Health Advisory. Gadolinium-containing contrast agents for magnetic resonance imaging (MRI). http://wayback.archive-it.org/7993/20170112033022/http://www.fda.gov/Drugs/DrugSafety/PostmarketDrugSafetyInformation forPatientsandProviders/ucm053112.htm. Published June 8, 2006. Accessed March 15, 2019.
4. Kanal E, Barkovich AJ, Bell C, et al; ACR Blue Ribbon Panel on MR Safety. ACR guidance document for safe MR practices: 2007. AJR Am J Roentgenol. 2007;188(6):1447-1474.
5. European Medicines Agency. Public statement: Vasovist and nephrogenic systemic fibrosis (NSF). https://www.ema.europa.eu/en/news/public-statement-vasovist-nephrogenic-systemic-fibrosis-nsf. Published February 7, 2007. Accessed March 15, 2019.
6. Luke JC. The etiology and modern treatment of varicose ulcer. Can Med Assoc J. 1940;43(3):217-221.
7. Paulsen E, Bygum A. Keratin gel as an adjuvant in the treatment of recalcitrant pyoderma gangrenosum ulcers: a case report. Acta Derm Venereol. 2019;99(2):234-235.
8. Boehm I, Bauer R. Low-dose methotrexate controls a severe form of polyarteritis nodosa. Arch Dermatol. 2000; 136(2):167-169.
Response:
We thank Drs. Heinz, van der Molen, and Roditi for their valuable response. The following is the opinion of the authors and is not representative of the views or policies of our institution. The patient in this case received a gadolinium-based contrast agent (GBCA) in 2015 and was diagnosed with nephrogenic systemic fibrosis (NSF) 8 weeks later. We agree with the correspondents that linear GBCAs should not be used in patients with eGFR < 30 mL/min/1.73 m2. To date, a few cases of patients who received GBCA and developed NSF since 2009 have unfortunately continued to be reported in the literature.1-3 Our intention in publishing this case was to provide ongoing education to the medical community regarding this serious condition to ensure prevention of future cases.
We thank Dr. Böhm for her important inquiry. The patient received a histopathologic diagnosis of NSF. The report from the patient’s left dorsal forearm skin punch biopsy was read by our pathologist as “fibrosis and inflammation consistent with nephrogenic systemic fibrosis,” a diagnosis agreed upon by our colleagues in the dermatology and rheumatology departments based on the rapidity of his symptom onset and progression. While we acknowledge that this patient had other inflammatory disorders of the skin that may have coexisted with the diagnosis, after weighing the preponderance of clinical evidence in support of the biopsy results, we believe that this represents a case of NSF, which is associated with high morbidity and mortality. Thankfully, the patient in this case engaged extensively in physical and occupational therapy and is still alive nearly 4 years later. We would like to thank all the letter writers for their correspondence.
Author Affiliations: Kelley Chuang and Casey Kaneshiro are Hospitalists and Jaime Betancourt is a Pulmonologist, all in the Department of Medicine at the VA Greater Los Angeles Healthcare System in California.
Correspondence: Kelley Chuang ([email protected])
Disclosures: The authors report no conflict of interest with regard to this article.
References
1. Aggarwal A, Froehlich AA, Essah P, Brinster N, High WA, Downs RW. Complications of nephrogenic systemic fibrosis following repeated exposure to gadolinium in a man with hypothyroidism: a case report. J Med Case Rep. 2011;5:566.
2. Fuah KW, Lim CT. Erythema nodosum masking nephrogenic systemic fibrosis as initial skin manifestation. BMC Nephrol. 2017;18(1):249.
3. Koratala A, Bhatti V. Nephrogenic systemic fibrosis. Clin Case Rep. 2017;5(7):1184-1185.
Revering Furry Valor
National K9 Veterans Day celebrates the loyalty, bravery, and sacrifice of canine warriors. On March 13, 1942, canines officially became members of the Armed Services, with the Army’s founding of its New War Dog Program, more popularly known as the K9 Corps. The dogs underwent basic training and then entered more specialized preparation just as human soldiers did.2 There had been unofficial dogs of war who served courageously and selflessly in almost all of our armed conflicts.3 Indeed, the title of this column is taken from a wonderful article of the same name narrating the heroism of dogs in the 2 world wars.4
The dedication of canines to those who serve is not confined to combat or even active duty. Thousands of military and veteran men and women have benefited immensely from their relationship with service and emotional support dogs.
Before I continue, let me state 2 important limitations of this column. First, I am a dog person. Of course, veterans have formed healing and caring relationships with many types of companions. Equine therapy is increasingly recognized as a powerful means of helping veterans reduce distress and find purpose.5 Nevertheless, for this column, I will focus exclusively on dogs. Second, there are many worthy organizations, projects, and programs that pair veterans with therapeutic dogs inside and outside the VA. I am in no way an expert and will invariably neglect many of these positive initiatives in this brief review.
The long, proud history of canines in the military and the many moving stories of men and women in and out of uniform for whom dogs have been life changing, if not life-saving, have created 2 ethical dilemmas for the VA that I examine here. Both dilemmas pivot on the terms of official recognition of service dogs, the benefits, and who can qualify for them in the VA.
Under VA regulation and VHA policy, a service companion only can be a dog that is individually trained to do work or perform tasks to assist a person with a disability; dogs whose sole function is to provide emotional support, well-being, comfort, or companionship are not considered service pets.6
Prior to the widespread implementation of VHA Directive 1188, some VA medical centers had, pardon the pun, “gone to the dogs,” in the sense that depending on the facility, emotional support companions were found in almost every area of hospitals and clinics. Their presence enabled many patients to feel comfortable enough to seek medical and mental health care, as the canine companion gave them a sense of security and calm. But some dogs had not received the extensive training that enables a service dog to follow commands and handle the stimulation of a large, busy hospital with all its sights, sounds, and smells. Infectious disease, police, and public health authorities raised legitimate public health and safety risks about the increasing number of dogs on VA grounds who were not formally certified as service dogs. In response to those concerns, in August 2015, VHA declared a uniform policy that restricted service dogs access to VA property.7 This was, as with most health policy, a necessary, albeit utilitarian decision, that the common good outweighed that of individual veterans. Unfortunately, some veterans experienced the decision as a form of psychological rejection, and others no longer felt able mentally or physically to master the stresses of seeking health care without a canine companion.
A valid question to ask is why couldn’t the most vulnerable of these veterans, for instance those with severe mental health conditions, have service dogs that could accompany them into at least most areas of the medical center? Part of the reason is cost: Some training organizations estimate it may cost as much as $27,000 to train service dogs.8 Though there are many wonderful volunteer and not-for-profit organizations that train mostly shelter dogs and their veteran handlers—a double rescue—the lengthy process and expense means that many veterans wait years for a companion. 
Congressional representatives, ethicists, veterans advocates, and canine therapy groups claim that this was unjust discrimination against those suffering with the equally, if not more disabling, mental health conditions.9 For many years, the VA has done a very good deed: For those who qualify for a service dog, VA pays for veterinary care and the equipment to handle the dog, but not boarding, grooming, food, and other miscellaneous expenses.10 But until 2016, those veterans approved for service dogs in the main had sensory or physical disabilities.
A partial breakthrough emerged when the Center for Compassionate Care Innovation launched the Mental Health Mobility Service Dogs Program that expanded veterinary health benefits to veterans with a “substantial mobility limitation.” For example, veterans whose hypervigilance and hyperarousal are so severe that they cannot attend medical appointments.11
VA experts argue that at this time there is insufficient evidence to fund service dogs as even adjunctive PTSD therapy for the hundreds of veterans who might potentially qualify. It becomes an ethical question of prudent stewardship of public funds and trust. There is certainly plenty of compelling anecdotal testimony that companion canines are a high-benefit, relatively low-risk form of complementary and integrated therapy for the spectrum of trauma disorders that afflict many of the men and women who served in our conflicts. Demonstrating those positive effects scientifically may be more difficult than it seems, although early evidence is promising, and the VA is intensively researching the question.12 For some veterans and their legislators, the VA has not gone far enough, fast enough in mainstreaming therapy dogs, they are calling for VA to expand veterans’ benefits to include mental health service dogs and to define what benefits would be covered.
National K9 Veterans Day is an important step toward giving dogs of war the homage they have earned, as are increasing efforts to ensure care for military canines throughout their life cycle. But as the seventeenth century poet John Milton wrote when he reflected on his own worth despite his blindness, “Those also serve who only stand and wait.”13 The institutions charged to care for those the battle has most burdened are still trying to discover how to properly and proportionately revere that kind of furry valor.
1. Schweitzer A. Civilization and Ethics. Naish JP, trans. London, England: A. & C. Black; 1923.
2. Bergeron AW Jr. War dogs: the birth of the K-9 Corps. https://www.army.mil/article/7463/war_dogs_the_birth_of_the_k_9_corps. Published February 14, 2008. Accessed March 22, 2019.
3. Nye L. A brief history of dogs in warfare. https://www.military.com/undertheradar/2017/03/brief-history-dogs-warfare. Published March 20, 2017. Accessed March 24, 2019.
4. Liao S. Furry valor: The tactical dogs of WW I and II. Vet Herit. 2016;39(1):24-29.
5. Romaniuk M, Evans J, Kidd C. Evaluation of an equine-assisted therapy program for veterans who identify as ‘wounded, injured, or ill’ and their partners. PLoS One. 2018;13(9):e0203943.
6. US Department of Veterans Affairs. Frequently asked questions: service animals on VA property. https://www.blogs.va.gov/VAntage/wp-content/uploads/2015/08/FAQs_RegulationsAboutAnimalsonVAProperty.pdf. Published Accessed March 24, 2019.
7. US Department of Veterans Affairs, Veterans Health Administration. VHA Directive 1188: animals on Veterans Health Administration (VHA) property. https://www.boise.va.gov/docs/Service_Animal_Policy.pdf August 26, 2015.
8. Brulliard K. For military veterans suffering from PTSD, are service dogs good therapy? Washington Post. March 27, 2018.
9. Weinmeyer R. Service dogs for veterans with post-traumatic stress disorder. AMA J Ethics. 2015;17(6):547-552.
10. US Department of Veterans Affairs, Veterans Health Administration, Office of Patient Care Services. Guide and service dogs. https://www.prosthetics.va.gov/serviceandguidedogs.asp. Updated August 18, 2016. Accessed March 24, 2019.
11. US Department of Veterans Affairs. VA pilots program to expand veterinary benefits for mental health mobility service dogs. https://www.blogs.va.gov/VAntage/33379/va-pilots-program-to-expand-veterinary-health-benefit-for-mental-health-mobility-service-dogs. Published Accessed March 24, 2019.
12. Yarborough BJH, Stumbo SP, Yarborough MT, Owen-Smith A, Green CA. Benefits and challenges of using service dogs for veterans with posttraumatic stress disorder. Psychiatr Rehabil J. 2018;41(2):118-124.
National K9 Veterans Day celebrates the loyalty, bravery, and sacrifice of canine warriors. On March 13, 1942, canines officially became members of the Armed Services, with the Army’s founding of its New War Dog Program, more popularly known as the K9 Corps. The dogs underwent basic training and then entered more specialized preparation just as human soldiers did.2 There had been unofficial dogs of war who served courageously and selflessly in almost all of our armed conflicts.3 Indeed, the title of this column is taken from a wonderful article of the same name narrating the heroism of dogs in the 2 world wars.4
The dedication of canines to those who serve is not confined to combat or even active duty. Thousands of military and veteran men and women have benefited immensely from their relationship with service and emotional support dogs.
Before I continue, let me state 2 important limitations of this column. First, I am a dog person. Of course, veterans have formed healing and caring relationships with many types of companions. Equine therapy is increasingly recognized as a powerful means of helping veterans reduce distress and find purpose.5 Nevertheless, for this column, I will focus exclusively on dogs. Second, there are many worthy organizations, projects, and programs that pair veterans with therapeutic dogs inside and outside the VA. I am in no way an expert and will invariably neglect many of these positive initiatives in this brief review.
The long, proud history of canines in the military and the many moving stories of men and women in and out of uniform for whom dogs have been life changing, if not life-saving, have created 2 ethical dilemmas for the VA that I examine here. Both dilemmas pivot on the terms of official recognition of service dogs, the benefits, and who can qualify for them in the VA.
Under VA regulation and VHA policy, a service companion only can be a dog that is individually trained to do work or perform tasks to assist a person with a disability; dogs whose sole function is to provide emotional support, well-being, comfort, or companionship are not considered service pets.6
Prior to the widespread implementation of VHA Directive 1188, some VA medical centers had, pardon the pun, “gone to the dogs,” in the sense that depending on the facility, emotional support companions were found in almost every area of hospitals and clinics. Their presence enabled many patients to feel comfortable enough to seek medical and mental health care, as the canine companion gave them a sense of security and calm. But some dogs had not received the extensive training that enables a service dog to follow commands and handle the stimulation of a large, busy hospital with all its sights, sounds, and smells. Infectious disease, police, and public health authorities raised legitimate public health and safety risks about the increasing number of dogs on VA grounds who were not formally certified as service dogs. In response to those concerns, in August 2015, VHA declared a uniform policy that restricted service dogs access to VA property.7 This was, as with most health policy, a necessary, albeit utilitarian decision, that the common good outweighed that of individual veterans. Unfortunately, some veterans experienced the decision as a form of psychological rejection, and others no longer felt able mentally or physically to master the stresses of seeking health care without a canine companion.
A valid question to ask is why couldn’t the most vulnerable of these veterans, for instance those with severe mental health conditions, have service dogs that could accompany them into at least most areas of the medical center? Part of the reason is cost: Some training organizations estimate it may cost as much as $27,000 to train service dogs.8 Though there are many wonderful volunteer and not-for-profit organizations that train mostly shelter dogs and their veteran handlers—a double rescue—the lengthy process and expense means that many veterans wait years for a companion.
Congressional representatives, ethicists, veterans advocates, and canine therapy groups claim that this was unjust discrimination against those suffering with the equally, if not more disabling, mental health conditions.9 For many years, the VA has done a very good deed: For those who qualify for a service dog, VA pays for veterinary care and the equipment to handle the dog, but not boarding, grooming, food, and other miscellaneous expenses.10 But until 2016, those veterans approved for service dogs in the main had sensory or physical disabilities.
A partial breakthrough emerged when the Center for Compassionate Care Innovation launched the Mental Health Mobility Service Dogs Program that expanded veterinary health benefits to veterans with a “substantial mobility limitation.” For example, veterans whose hypervigilance and hyperarousal are so severe that they cannot attend medical appointments.11
VA experts argue that at this time there is insufficient evidence to fund service dogs as even adjunctive PTSD therapy for the hundreds of veterans who might potentially qualify. It becomes an ethical question of prudent stewardship of public funds and trust. There is certainly plenty of compelling anecdotal testimony that companion canines are a high-benefit, relatively low-risk form of complementary and integrated therapy for the spectrum of trauma disorders that afflict many of the men and women who served in our conflicts. Demonstrating those positive effects scientifically may be more difficult than it seems, although early evidence is promising, and the VA is intensively researching the question.12 For some veterans and their legislators, the VA has not gone far enough, fast enough in mainstreaming therapy dogs, they are calling for VA to expand veterans’ benefits to include mental health service dogs and to define what benefits would be covered.
National K9 Veterans Day is an important step toward giving dogs of war the homage they have earned, as are increasing efforts to ensure care for military canines throughout their life cycle. But as the seventeenth century poet John Milton wrote when he reflected on his own worth despite his blindness, “Those also serve who only stand and wait.”13 The institutions charged to care for those the battle has most burdened are still trying to discover how to properly and proportionately revere that kind of furry valor.
1. Schweitzer A. Civilization and Ethics. Naish JP, trans. London, England: A. & C. Black; 1923.
2. Bergeron AW Jr. War dogs: the birth of the K-9 Corps. https://www.army.mil/article/7463/war_dogs_the_birth_of_the_k_9_corps. Published February 14, 2008. Accessed March 22, 2019.
3. Nye L. A brief history of dogs in warfare. https://www.military.com/undertheradar/2017/03/brief-history-dogs-warfare. Published March 20, 2017. Accessed March 24, 2019.
4. Liao S. Furry valor: The tactical dogs of WW I and II. Vet Herit. 2016;39(1):24-29.
5. Romaniuk M, Evans J, Kidd C. Evaluation of an equine-assisted therapy program for veterans who identify as ‘wounded, injured, or ill’ and their partners. PLoS One. 2018;13(9):e0203943.
6. US Department of Veterans Affairs. Frequently asked questions: service animals on VA property. https://www.blogs.va.gov/VAntage/wp-content/uploads/2015/08/FAQs_RegulationsAboutAnimalsonVAProperty.pdf. Published Accessed March 24, 2019.
7. US Department of Veterans Affairs, Veterans Health Administration. VHA Directive 1188: animals on Veterans Health Administration (VHA) property. https://www.boise.va.gov/docs/Service_Animal_Policy.pdf August 26, 2015.
8. Brulliard K. For military veterans suffering from PTSD, are service dogs good therapy? Washington Post. March 27, 2018.
9. Weinmeyer R. Service dogs for veterans with post-traumatic stress disorder. AMA J Ethics. 2015;17(6):547-552.
10. US Department of Veterans Affairs, Veterans Health Administration, Office of Patient Care Services. Guide and service dogs. https://www.prosthetics.va.gov/serviceandguidedogs.asp. Updated August 18, 2016. Accessed March 24, 2019.
11. US Department of Veterans Affairs. VA pilots program to expand veterinary benefits for mental health mobility service dogs. https://www.blogs.va.gov/VAntage/33379/va-pilots-program-to-expand-veterinary-health-benefit-for-mental-health-mobility-service-dogs. Published Accessed March 24, 2019.
12. Yarborough BJH, Stumbo SP, Yarborough MT, Owen-Smith A, Green CA. Benefits and challenges of using service dogs for veterans with posttraumatic stress disorder. Psychiatr Rehabil J. 2018;41(2):118-124.

Managing Eating Disorders on a General Pediatrics Unit: A Centralized Video Monitoring Pilot
Hospitalizations for nutritional rehabilitation of patients with restrictive eating disorders are increasing.1 Among primary mental health admissions at free-standing children’s hospitals, eating disorders represent 5.5% of hospitalizations and are associated with the longest length of stay (LOS; mean 14.3 days) and costliest care (mean $46,130).2 Admission is necessary to ensure initial weight restoration and monitoring for symptoms of refeeding syndrome, including electrolyte shifts and vital sign abnormalities.3-5
Supervision is generally considered an essential element of caring for hospitalized patients with eating disorders, who may experience difficulty adhering to nutritional treatment, perform excessive movement or exercise, or demonstrate purging or self-harming behaviors. Supervision is presumed to prevent counterproductive behaviors, facilitating weight gain and earlier discharge to psychiatric treatment. Best practices for patient supervision to address these challenges have not been established but often include meal time or continuous one-to-one supervision by nursing assistants (NAs) or other staff.6,7 While meal supervision has been shown to decrease medical LOS, it is costly, reduces staff availability for the care of other patient care, and can be a barrier to caring for patients with eating disorders in many institutions.8
Although not previously used in patients with eating disorders, centralized video monitoring (CVM) may provide an additional mode of supervision. CVM is an emerging technology consisting of real-time video streaming, without video recording, enabling tracking of patient movement, redirection of behaviors, and communication with unit nurses when necessary. CVM has been used in multiple patient safety initiatives to reduce falls, address staffing shortages, reduce costs,9,10 supervise patients at risk for self-harm or elopement, and prevent controlled medication diversion.10,11
We sought to pilot a novel use of CVM to replace our institution’s standard practice of continuous one-to-one nursing assistant (NA) supervision of patients admitted for medical stabilization of an eating disorder. Our objective was to evaluate the supervision cost and feasibility of CVM, using LOS and days to weight gain as balancing measures.
METHODS
Setting and Participants
This retrospective cohort study included patients 12-18 years old admitted to the pediatric hospital medicine service on a general unit of an academic quaternary care children’s hospital for medical stabilization of an eating disorder between September 2013 and March 2017. Patients were identified using administrative data based on primary or secondary diagnosis of anorexia nervosa, eating disorder not other wise specified, or another specified eating disorder (ICD 9 3071, 20759, or ICD 10 f5000, 5001, f5089, f509).12,13 This research study was considered exempt by the University of Wisconsin School of Medicine and Public Health’s Institutional Review Board.
Supervision Interventions
A standard medical stabilization protocol was used for patients admitted with an eating disorder throughout the study period (Appendix). All patients received continuous one-to-one NA supervision until they reached the target calorie intake and demonstrated the ability to follow the nutritional meal protocol. Beginning July 2015, patients received continuous CVM supervision unless they expressed suicidal ideation (SI), which triggered one-to-one NA supervision until they no longer endorsed suicidality.
Centralized Video Monitoring Implementation
Institutional CVM technology was AvaSys TeleSitter Solution (AvaSure, Inc). Our institution purchased CVM devices for use in adult settings, and one was assigned for pediatric CVM. Mobile CVM video carts were deployed to patient rooms and generated live video streams, without recorded capture, which were supervised by CVM technicians. These technicians were NAs hired and trained specifically for this role; worked four-, eight-, and 12-hour shifts; and observed up to eight camera feeds on a single monitor in a centralized room. Patients and family members could refuse CVM, which would trigger one-to-one NA supervision. Patients were not observed by CVM while in the restroom; staff were notified by either the patient or technician, and one-to-one supervision was provided. CVM had two-way audio communication, which allowed technicians to redirect patients verbally. Technicians could contact nursing staff directly by phone when additional intervention was needed.
Supervision Costs
NA supervision costs were estimated at $19/hour, based upon institutional human resources average NA salaries at that time. No additional mealtime supervision was included, as in-person supervision was already occurring.
CVM supervision costs were defined as the sum of the device cost plus CVM technician costs and two hours of one-to-one NA mealtime supervision per day. The CVM device cost was estimated at $2.10/hour, assuming a 10-year machine life expectancy (single unit cost $82,893 in 2015, 3,944 hours of use in fiscal year of 2018). CVM technician costs were $19/hour, based upon institutional human resources average CVM technician salaries at that time. Because technicians monitored an average of six patients simultaneously during this study, one-sixth of a CVM technician’s salary (ie, $3.17/hour) was used for each hour of CVM monitoring. Patients with mixed (NA and CVM) supervision were analyzed with those having CVM supervision. These patients’ costs were the sum of their NA supervision costs plus their CVM supervision costs.
Data Collection
Descriptive variables including age, gender, race/ethnicity, insurance, and LOS were collected from administrative data. The duration and type of supervision for all patients were collected from daily staffing logs. The eating disorder protocol standardized the process of obtaining daily weights (Appendix). Days to weight gain following admission were defined as the total number of days from admission to the first day of weight gain that was followed by another day of weight gain or maintaining the same weight
Data Analysis
Patient and hospitalization characteristics were summarized. A sample size of at least 14 in each group was estimated as necessary to detect a 50% reduction in supervision cost between the groups using alpha = 0.05, a power of 80%, a mean cost of $4,400 in the NA group, and a standard deviation of $1,600.Wilcoxon rank-sum tests were used to assess differences in median supervision cost between NA and CVM use. Differences in mean LOS and days to weight gain between NA and CVM use were assessed with t-tests because these data were normally distributed.
RESULTS
Patient Characteristics and Supervision Costs
The study included 37 consecutive admissions (NA = 23 and CVM = 14) with 35 unique patients. Patients were female, primarily non-Hispanic White, and privately insured (Table 1). Median supervision cost for the NA was statistically significantly more expensive at $4,104/admission versus $1,166/admission for CVM (P < .001, Table 2).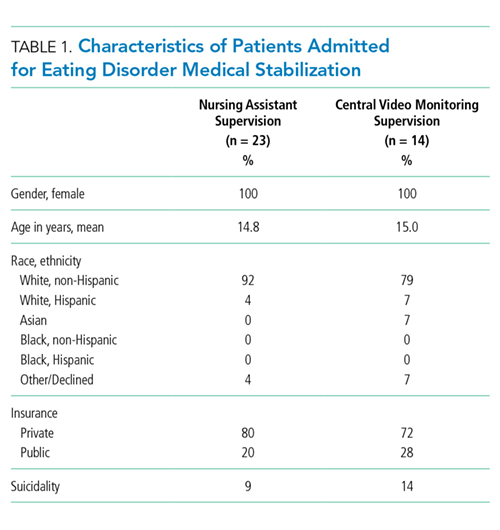
Balancing Measures, Acceptability, and Feasibility
Mean LOS was 11.7 days for NA and 9.8 days for CVM (P = .27; Table 2). The mean number of days to weight gain was 3.1 and 3.6 days, respectively (P = .28). No patients converted from CVM to NA supervision. One patient with SI converted to CVM after SI resolved and two patients required ongoing NA supervision due to continued SI. There were no reported refusals, technology failures, or unplanned discontinuations of CVM. One patient/family reported excessive CVM redirection of behavior.
DISCUSSION
This is the first description of CVM use in adolescent patients or patients with eating disorders. Our results suggest that CVM appears feasible and less costly in this population than one-to-one NA supervision, without statistically significant differences in LOS or time to weight gain. Patients with CVM with any NA supervision (except mealtime alone) were analyzed in the CVM group; therefore, this study may underestimate cost savings from CVM supervision. This innovative use of CVM may represent an opportunity for hospitals to repurpose monitoring technology for more efficient supervision of patients with eating disorders.
This pediatric pilot study adds to the growing body of literature in adult patients suggesting CVM supervision may be a feasible inpatient cost-reduction strategy.9,10 One single-center study demonstrated that the use of CVM with adult inpatients led to fewer unsafe behaviors, eg, patient removal of intravenous catheters and oxygen therapy. Personnel savings exceeded the original investment cost of the monitor within one fiscal quarter.9 Results of another study suggest that CVM use with hospitalized adults who required supervision to prevent falls was associated with improved patient and family satisfaction.14 In the absence of a gold standard for supervision of patients hospitalized with eating disorders, CVM technology is a tool that may balance cost, care quality, and patient experience. Given the upfront investment in CVM units, this technology may be most appropriate for institutions already using CVM for other inpatient indications.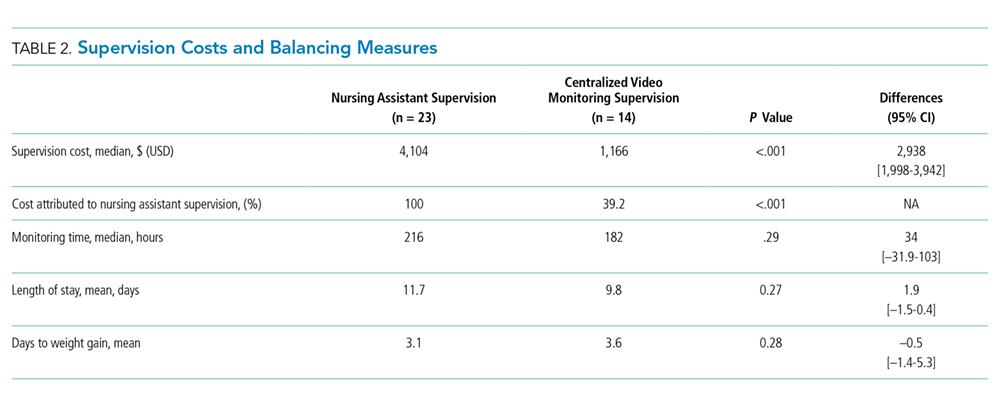
Although our institutional cost of CVM use was similar to that reported by other institutions,11,15 the single-center design of this pilot study limits the generalizability of our findings. Unadjusted results of this observational study may be confounded by indication bias. As this was a pilot study, it was powered to detect a clinically significant difference in cost between NA and CVM supervision. While statistically significant differences were not seen in LOS or weight gain, this pilot study was not powered to detect potential differences or to adjust for all potential confounders (eg, other mental health conditions or comorbidities, eating disorder type, previous hospitalizations). Future studies should include these considerations in estimating sample sizes. The ability to conduct a robust cost-effectiveness analysis was also limited by cost data availability and reliance on staffing assumptions to calculate supervision costs. However, these findings will be important for valid effect size estimates for future interventional studies that rigorously evaluate CVM effectiveness and safety. Patients and families were not formally surveyed about their experiences with CVM, and the patient and family experience is another important outcome to consider in future studies.
CONCLUSION
The results of this pilot study suggest that supervision costs for patients admitted for medical stabilization of eating disorders were statistically significantly lower with CVM when compared with one-to-one NA supervision, without a change in hospitalization LOS or time to weight gain. These findings are particularly important as hospitals seek opportunities to reduce costs while providing safe and effective care. Future efforts should focus on evaluating clinical outcomes and patient experiences with this technology and strategies to maximize efficiency to offset the initial device cost.
Disclosures
The authors have no financial relationships relevant to this article to disclose. The authors have no conflicts of interest relevant to this article to disclose.
1. Zhao Y, Encinosa W. An update on hospitalizations for eating disorders, 1999 to 2009: statistical brief #120. In: Healthcare Cost and Utilization Project (HCUP) Statistical Briefs. Rockville, MD: Agency for Healthcare Research and Quality (US); 2006. PubMed
2. Bardach NS, Coker TR, Zima BT, et al. Common and costly hospitalizations for pediatric mental health disorders. Pediatrics. 2014;133(4):602-609. doi: 10.1542/peds.2013-3165. PubMed
3. Society for Adolescent H, Medicine, Golden NH, et al. Position Paper of the Society for Adolescent Health and Medicine: medical management of restrictive eating disorders in adolescents and young adults. J Adolesc Health. 2015;56(1):121-125. doi: 10.1016/j.jadohealth.2014.10.259. PubMed
4. Katzman DK. Medical complications in adolescents with anorexia nervosa: a review of the literature. Int J Eat Disord. 2005;37(S1):S52-S59; discussion S87-S59. doi: 10.1002/eat.20118. PubMed
5. Strandjord SE, Sieke EH, Richmond M, Khadilkar A, Rome ES. Medical stabilization of adolescents with nutritional insufficiency: a clinical care path. Eat Weight Disord. 2016;21(3):403-410. doi: 10.1007/s40519-015-0245-5. PubMed
6. Kells M, Davidson K, Hitchko L, O’Neil K, Schubert-Bob P, McCabe M. Examining supervised meals in patients with restrictive eating disorders. Appl Nurs Res. 2013;26(2):76-79. doi: 10.1016/j.apnr.2012.06.003. PubMed
7. Leclerc A, Turrini T, Sherwood K, Katzman DK. Evaluation of a nutrition rehabilitation protocol in hospitalized adolescents with restrictive eating disorders. J Adolesc Health. 2013;53(5):585-589. doi: 10.1016/j.jadohealth.2013.06.001. PubMed
8. Kells M, Schubert-Bob P, Nagle K, et al. Meal supervision during medical hospitalization for eating disorders. Clin Nurs Res. 2017;26(4):525-537. doi: 10.1177/1054773816637598. PubMed
9. Jeffers S, Searcey P, Boyle K, et al. Centralized video monitoring for patient safety: a Denver Health Lean journey. Nurs Econ. 2013;31(6):298-306. PubMed
10. Sand-Jecklin K, Johnson JR, Tylka S. Protecting patient safety: can video monitoring prevent falls in high-risk patient populations? J Nurs Care Qual. 2016;31(2):131-138. doi: 10.1097/NCQ.0000000000000163. PubMed
11. Burtson PL, Vento L. Sitter reduction through mobile video monitoring: a nurse-driven sitter protocol and administrative oversight. J Nurs Adm. 2015;45(7-8):363-369. doi: 10.1097/NNA.0000000000000216. PubMed
12. Prevention CfDCa. ICD-9-CM Guidelines, 9th ed. https://www.cdc.gov/nchs/data/icd/icd9cm_guidelines_2011.pdf. Accessed April 11, 2018.
13. Prevention CfDca. IDC-9-CM Code Conversion Table. https://www.cdc.gov/nchs/data/icd/icd-9-cm_fy14_cnvtbl_final.pdf. Accessed April 11, 2018.
14. Cournan M, Fusco-Gessick B, Wright L. Improving patient safety through video monitoring. Rehabil Nurs. 2016. doi: 10.1002/rnj.308. PubMed
15. Rochefort CM, Ward L, Ritchie JA, Girard N, Tamblyn RM. Patient and nurse staffing characteristics associated with high sitter use costs. J Adv Nurs. 2012;68(8):1758-1767. doi: 10.1111/j.1365-2648.2011.05864.x. PubMed
Hospitalizations for nutritional rehabilitation of patients with restrictive eating disorders are increasing.1 Among primary mental health admissions at free-standing children’s hospitals, eating disorders represent 5.5% of hospitalizations and are associated with the longest length of stay (LOS; mean 14.3 days) and costliest care (mean $46,130).2 Admission is necessary to ensure initial weight restoration and monitoring for symptoms of refeeding syndrome, including electrolyte shifts and vital sign abnormalities.3-5
Supervision is generally considered an essential element of caring for hospitalized patients with eating disorders, who may experience difficulty adhering to nutritional treatment, perform excessive movement or exercise, or demonstrate purging or self-harming behaviors. Supervision is presumed to prevent counterproductive behaviors, facilitating weight gain and earlier discharge to psychiatric treatment. Best practices for patient supervision to address these challenges have not been established but often include meal time or continuous one-to-one supervision by nursing assistants (NAs) or other staff.6,7 While meal supervision has been shown to decrease medical LOS, it is costly, reduces staff availability for the care of other patient care, and can be a barrier to caring for patients with eating disorders in many institutions.8
Although not previously used in patients with eating disorders, centralized video monitoring (CVM) may provide an additional mode of supervision. CVM is an emerging technology consisting of real-time video streaming, without video recording, enabling tracking of patient movement, redirection of behaviors, and communication with unit nurses when necessary. CVM has been used in multiple patient safety initiatives to reduce falls, address staffing shortages, reduce costs,9,10 supervise patients at risk for self-harm or elopement, and prevent controlled medication diversion.10,11
We sought to pilot a novel use of CVM to replace our institution’s standard practice of continuous one-to-one nursing assistant (NA) supervision of patients admitted for medical stabilization of an eating disorder. Our objective was to evaluate the supervision cost and feasibility of CVM, using LOS and days to weight gain as balancing measures.
METHODS
Setting and Participants
This retrospective cohort study included patients 12-18 years old admitted to the pediatric hospital medicine service on a general unit of an academic quaternary care children’s hospital for medical stabilization of an eating disorder between September 2013 and March 2017. Patients were identified using administrative data based on primary or secondary diagnosis of anorexia nervosa, eating disorder not other wise specified, or another specified eating disorder (ICD 9 3071, 20759, or ICD 10 f5000, 5001, f5089, f509).12,13 This research study was considered exempt by the University of Wisconsin School of Medicine and Public Health’s Institutional Review Board.
Supervision Interventions
A standard medical stabilization protocol was used for patients admitted with an eating disorder throughout the study period (Appendix). All patients received continuous one-to-one NA supervision until they reached the target calorie intake and demonstrated the ability to follow the nutritional meal protocol. Beginning July 2015, patients received continuous CVM supervision unless they expressed suicidal ideation (SI), which triggered one-to-one NA supervision until they no longer endorsed suicidality.
Centralized Video Monitoring Implementation
Institutional CVM technology was AvaSys TeleSitter Solution (AvaSure, Inc). Our institution purchased CVM devices for use in adult settings, and one was assigned for pediatric CVM. Mobile CVM video carts were deployed to patient rooms and generated live video streams, without recorded capture, which were supervised by CVM technicians. These technicians were NAs hired and trained specifically for this role; worked four-, eight-, and 12-hour shifts; and observed up to eight camera feeds on a single monitor in a centralized room. Patients and family members could refuse CVM, which would trigger one-to-one NA supervision. Patients were not observed by CVM while in the restroom; staff were notified by either the patient or technician, and one-to-one supervision was provided. CVM had two-way audio communication, which allowed technicians to redirect patients verbally. Technicians could contact nursing staff directly by phone when additional intervention was needed.
Supervision Costs
NA supervision costs were estimated at $19/hour, based upon institutional human resources average NA salaries at that time. No additional mealtime supervision was included, as in-person supervision was already occurring.
CVM supervision costs were defined as the sum of the device cost plus CVM technician costs and two hours of one-to-one NA mealtime supervision per day. The CVM device cost was estimated at $2.10/hour, assuming a 10-year machine life expectancy (single unit cost $82,893 in 2015, 3,944 hours of use in fiscal year of 2018). CVM technician costs were $19/hour, based upon institutional human resources average CVM technician salaries at that time. Because technicians monitored an average of six patients simultaneously during this study, one-sixth of a CVM technician’s salary (ie, $3.17/hour) was used for each hour of CVM monitoring. Patients with mixed (NA and CVM) supervision were analyzed with those having CVM supervision. These patients’ costs were the sum of their NA supervision costs plus their CVM supervision costs.
Data Collection
Descriptive variables including age, gender, race/ethnicity, insurance, and LOS were collected from administrative data. The duration and type of supervision for all patients were collected from daily staffing logs. The eating disorder protocol standardized the process of obtaining daily weights (Appendix). Days to weight gain following admission were defined as the total number of days from admission to the first day of weight gain that was followed by another day of weight gain or maintaining the same weight
Data Analysis
Patient and hospitalization characteristics were summarized. A sample size of at least 14 in each group was estimated as necessary to detect a 50% reduction in supervision cost between the groups using alpha = 0.05, a power of 80%, a mean cost of $4,400 in the NA group, and a standard deviation of $1,600.Wilcoxon rank-sum tests were used to assess differences in median supervision cost between NA and CVM use. Differences in mean LOS and days to weight gain between NA and CVM use were assessed with t-tests because these data were normally distributed.
RESULTS
Patient Characteristics and Supervision Costs
The study included 37 consecutive admissions (NA = 23 and CVM = 14) with 35 unique patients. Patients were female, primarily non-Hispanic White, and privately insured (Table 1). Median supervision cost for the NA was statistically significantly more expensive at $4,104/admission versus $1,166/admission for CVM (P < .001, Table 2).
Balancing Measures, Acceptability, and Feasibility
Mean LOS was 11.7 days for NA and 9.8 days for CVM (P = .27; Table 2). The mean number of days to weight gain was 3.1 and 3.6 days, respectively (P = .28). No patients converted from CVM to NA supervision. One patient with SI converted to CVM after SI resolved and two patients required ongoing NA supervision due to continued SI. There were no reported refusals, technology failures, or unplanned discontinuations of CVM. One patient/family reported excessive CVM redirection of behavior.
DISCUSSION
This is the first description of CVM use in adolescent patients or patients with eating disorders. Our results suggest that CVM appears feasible and less costly in this population than one-to-one NA supervision, without statistically significant differences in LOS or time to weight gain. Patients with CVM with any NA supervision (except mealtime alone) were analyzed in the CVM group; therefore, this study may underestimate cost savings from CVM supervision. This innovative use of CVM may represent an opportunity for hospitals to repurpose monitoring technology for more efficient supervision of patients with eating disorders.
This pediatric pilot study adds to the growing body of literature in adult patients suggesting CVM supervision may be a feasible inpatient cost-reduction strategy.9,10 One single-center study demonstrated that the use of CVM with adult inpatients led to fewer unsafe behaviors, eg, patient removal of intravenous catheters and oxygen therapy. Personnel savings exceeded the original investment cost of the monitor within one fiscal quarter.9 Results of another study suggest that CVM use with hospitalized adults who required supervision to prevent falls was associated with improved patient and family satisfaction.14 In the absence of a gold standard for supervision of patients hospitalized with eating disorders, CVM technology is a tool that may balance cost, care quality, and patient experience. Given the upfront investment in CVM units, this technology may be most appropriate for institutions already using CVM for other inpatient indications.
Although our institutional cost of CVM use was similar to that reported by other institutions,11,15 the single-center design of this pilot study limits the generalizability of our findings. Unadjusted results of this observational study may be confounded by indication bias. As this was a pilot study, it was powered to detect a clinically significant difference in cost between NA and CVM supervision. While statistically significant differences were not seen in LOS or weight gain, this pilot study was not powered to detect potential differences or to adjust for all potential confounders (eg, other mental health conditions or comorbidities, eating disorder type, previous hospitalizations). Future studies should include these considerations in estimating sample sizes. The ability to conduct a robust cost-effectiveness analysis was also limited by cost data availability and reliance on staffing assumptions to calculate supervision costs. However, these findings will be important for valid effect size estimates for future interventional studies that rigorously evaluate CVM effectiveness and safety. Patients and families were not formally surveyed about their experiences with CVM, and the patient and family experience is another important outcome to consider in future studies.
CONCLUSION
The results of this pilot study suggest that supervision costs for patients admitted for medical stabilization of eating disorders were statistically significantly lower with CVM when compared with one-to-one NA supervision, without a change in hospitalization LOS or time to weight gain. These findings are particularly important as hospitals seek opportunities to reduce costs while providing safe and effective care. Future efforts should focus on evaluating clinical outcomes and patient experiences with this technology and strategies to maximize efficiency to offset the initial device cost.
Disclosures
The authors have no financial relationships relevant to this article to disclose. The authors have no conflicts of interest relevant to this article to disclose.
1. Zhao Y, Encinosa W. An update on hospitalizations for eating disorders, 1999 to 2009: statistical brief #120. In: Healthcare Cost and Utilization Project (HCUP) Statistical Briefs. Rockville, MD: Agency for Healthcare Research and Quality (US); 2006. PubMed
2. Bardach NS, Coker TR, Zima BT, et al. Common and costly hospitalizations for pediatric mental health disorders. Pediatrics. 2014;133(4):602-609. doi: 10.1542/peds.2013-3165. PubMed
3. Society for Adolescent H, Medicine, Golden NH, et al. Position Paper of the Society for Adolescent Health and Medicine: medical management of restrictive eating disorders in adolescents and young adults. J Adolesc Health. 2015;56(1):121-125. doi: 10.1016/j.jadohealth.2014.10.259. PubMed
4. Katzman DK. Medical complications in adolescents with anorexia nervosa: a review of the literature. Int J Eat Disord. 2005;37(S1):S52-S59; discussion S87-S59. doi: 10.1002/eat.20118. PubMed
5. Strandjord SE, Sieke EH, Richmond M, Khadilkar A, Rome ES. Medical stabilization of adolescents with nutritional insufficiency: a clinical care path. Eat Weight Disord. 2016;21(3):403-410. doi: 10.1007/s40519-015-0245-5. PubMed
6. Kells M, Davidson K, Hitchko L, O’Neil K, Schubert-Bob P, McCabe M. Examining supervised meals in patients with restrictive eating disorders. Appl Nurs Res. 2013;26(2):76-79. doi: 10.1016/j.apnr.2012.06.003. PubMed
7. Leclerc A, Turrini T, Sherwood K, Katzman DK. Evaluation of a nutrition rehabilitation protocol in hospitalized adolescents with restrictive eating disorders. J Adolesc Health. 2013;53(5):585-589. doi: 10.1016/j.jadohealth.2013.06.001. PubMed
8. Kells M, Schubert-Bob P, Nagle K, et al. Meal supervision during medical hospitalization for eating disorders. Clin Nurs Res. 2017;26(4):525-537. doi: 10.1177/1054773816637598. PubMed
9. Jeffers S, Searcey P, Boyle K, et al. Centralized video monitoring for patient safety: a Denver Health Lean journey. Nurs Econ. 2013;31(6):298-306. PubMed
10. Sand-Jecklin K, Johnson JR, Tylka S. Protecting patient safety: can video monitoring prevent falls in high-risk patient populations? J Nurs Care Qual. 2016;31(2):131-138. doi: 10.1097/NCQ.0000000000000163. PubMed
11. Burtson PL, Vento L. Sitter reduction through mobile video monitoring: a nurse-driven sitter protocol and administrative oversight. J Nurs Adm. 2015;45(7-8):363-369. doi: 10.1097/NNA.0000000000000216. PubMed
12. Prevention CfDCa. ICD-9-CM Guidelines, 9th ed. https://www.cdc.gov/nchs/data/icd/icd9cm_guidelines_2011.pdf. Accessed April 11, 2018.
13. Prevention CfDca. IDC-9-CM Code Conversion Table. https://www.cdc.gov/nchs/data/icd/icd-9-cm_fy14_cnvtbl_final.pdf. Accessed April 11, 2018.
14. Cournan M, Fusco-Gessick B, Wright L. Improving patient safety through video monitoring. Rehabil Nurs. 2016. doi: 10.1002/rnj.308. PubMed
15. Rochefort CM, Ward L, Ritchie JA, Girard N, Tamblyn RM. Patient and nurse staffing characteristics associated with high sitter use costs. J Adv Nurs. 2012;68(8):1758-1767. doi: 10.1111/j.1365-2648.2011.05864.x. PubMed
© 2019 Society of Hospital Medicine