User login
Inpatient Management of Acute Severe Ulcerative Colitis
Ulcerative colitis (UC) is a chronic inflammatory condition of the colonic mucosa. Classically, it starts in the rectum and can extend continuously from the distal to the proximal colon. The defining clinical symptom of UC is bloody diarrhea, typically accompanied by rectal urgency and mucus discharge. The natural history of this disease includes periods of exacerbations and remissions occurring spontaneously or in response to medical treatment.1
Acute severe ulcerative colitis (ASUC) is a potentially life-threatening complication of UC that typically requires hospitalization and interdisciplinary care between hospitalists, gastroenterologists, and colorectal or general surgeons. The risk of a patient with UC requiring hospitalization for ASUC ranges from 15%-25%2,3 and, in total, UC accounts for 30,000 hospital visits annually.4 The direct medical costs exceed $4 billion annually, with hospital costs of over $960 million.5 Historically, mortality from ASUC was as high as 24% but decreased substantially to 7% after the introduction of systemic corticosteroid therapy.6 Further advances in care have reduced mortality to approximately 1% or less.7,8 Nonetheless, up to 20% of patients admitted with ASUC have a colectomy on their first admission, and this rate rises to 40% after two admissions.2
DEFINING ACUTE SEVERE ULCERATIVE COLITIS
To categorize UC severity, assess patients using the Truelove and Witt’s criteria. The system classifies patients as having mild, moderate, severe, or fulminant disease. Severe disease by these criteria includes patients with >6 bloody bowel movements per day and at least one of the following clinical features: fever (>37.8°C), tachycardia (>90 bpm), anemia (hemoglobin <10.5 g/dl), or elevated inflammatory markers (traditionally, erythrocyte sedimentation rate greater than 30 mm/h or, more recently, C-reactive protein (CRP) greater than 30 mg/L. (Table 1).6,9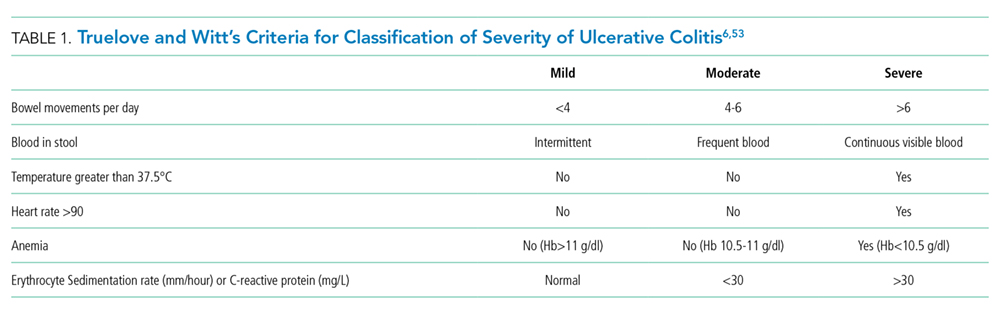
Fulminant colitis refers to a subgroup of patients with more than 10 stools per day, continuous bleeding, abdominal pain, colonic dilatation on abdominal X-ray film, and severe toxic symptoms including fever and anorexia. Such patients are at risk of progressing to toxic megacolon and bowel perforation.10
INDICATIONS FOR HOSPITALIZATION AND INPATIENT LEVEL OF CARE
Patients with ASUC almost always require hospitalization for their disease management. In many cases, these patients have been receiving outpatient oral prednisone 40-60 mg daily but continue to have ongoing disease activity.11 Most patients will require close clinical monitoring, frequent blood testing, endoscopic or radiologic evaluation, as well as administration of intravenous corticosteroids. The average length of stay (LOS) ranges from 4.6 to 12.5 days, depending on disease severity.12 Not surprisingly, Kelso et al. reported that predictors of hospital LOS greater than four days include initiating a biologic drug in the hospital, undergoing two or more imaging modalities and treatment with intravenous steroids,13 and so it is rare that patients do not meet billing requirements for an inpatient level of care.
INITIAL EVALUATION
The multifaceted initial inpatient evaluation of patients with ASUC aims to assess disease severity, identify and prevent potential complications, and initiate planning for potential failure of first-line pharmacologic therapy. Due to the accumulating evidence that involving physicians with expertise in managing ASUC improves outcomes, gastroenterologists should be involved in the care of patients with ASUC from the time of their admission.14,15 Additionally, creating standardized care pathways for the management of ASUC can reduce cost, LOS, and improve quality.16
History and Physical Examination
Patients should be asked about fever, abdominal pain, nausea, emesis, bloating, weight loss, and bowel movements (frequency, consistency, the presence of blood, urgency, nighttime awakenings). The number of bowel movements over a 24-hour period should be quantified as this helps assess the overall disease severity (Table 1).
The patient’s initial inflammatory bowel disease (IBD) history is also essential. The review of pertinent information regarding the patient’s initial diagnosis of UC includes the severity and anatomic extent of disease, extraintestinal manifestations, previous medical therapies, and surgical interventions. Exposure to nonsteroidal anti-inflammatory drugs (NSAIDs) or antibiotics should be identified as they may precipitate flares.17 Travel history may be pertinent as travel increases the risk of infections with food-borne or parasitic pathogens.18
Physical examination begins with an assessment of vital signs and volume status. Abdominal examination should include evaluation of bowel sounds, an assessment of distention, location, the extent of abdominal tenderness, and peritoneal signs. The abdominal exam should be interpreted in the context of the patient’s medications, as the use of steroid or analgesic therapies may affect the sensitivity for detecting complications. An external rectal exam evaluating perianal disease should be performed, as perianal disease raises concern for Crohn’s, a disease whose surgical management differs from UC.
A careful exam for extraintestinal manifestations is also essential. The skin should be evaluated for any new rashes, especially on the anterior shin consistent with erythema nodosum or ulcerated lesions on the skin suggestive of pyoderma gangrenosum. The peripheral joints should also be examined for any synovitis. Additional examinations should be performed based on any reported symptoms (eg, the ophthalmic exam for uveitis or scleritis if visual changes or eye pain are reported). Some extraintestinal manifestations require subspecialty consultation and comanagement to guide disease therapy. Patients with underlying pyoderma gangrenosum may require a dermatology consultation to guide management. Ocular inflammation requires ophthalmology involvement, and inflammatory arthritis is best comanaged with rheumatology.19
Laboratory Testing
Initial testing should include a complete blood count with differential, basic metabolic panel, and liver chemistries including alkaline phosphatase and albumin. When relevant, pregnancy testing should be performed. Measure CRP on admission so that its trajectory can be followed during therapy. However, a normal CRP does not exclude the presence of a UC flare as a subset of patients with ASUC will have a normal CRP despite severe mucosal inflammation.20
Since one-third of patients do not respond to intravenous corticosteroids and will require rescue therapy during the hospitalization with infliximab or cyclosporine, anticipatory testing for these medications should be performed on admission to avoid delays in the administration of rescue therapy.6,21 This should include an interferon-gamma release assay (eg, quantiferon gold) to test for latent tuberculosis and hepatitis B serologies in anticipation of possible treatment with infliximab. An interferon-gamma release assay is preferred to a tuberculin skin test because patients may be anergic, and a skin test does not provide a control to determine whether a negative test is due to anergy. In contrast, although a quantiferon gold test can be indeterminate in ASUC due to disease activity and systemic steroids, the results indicate if the patient is anergic so that one will not rely on a false-negative result. In the event of an equivocal result, a careful clinical assessment for risks of TB exposures should be elicited, and a chest radiograph should be obtained.22 In patients with prior high risk of tuberculosis exposures or a positive test for tuberculosis, an infectious disease specialist should be consulted early to advise if therapy should be started in preparation for the potential use of infliximab.23 In cases where cyclosporine may be considered, magnesium and total cholesterol level should be checked. Sending thiopurine methyltranferase (TPMT) enzyme activity should be considered as well, in case of a need for future thiopurine use for maintenance of disease activity.24
Infectious diarrhea may be indistinguishable from ASUC and may also be the trigger of a flare; thus, it is important to rule out infection with stool microbiologic studies. Most importantly, Clostridium difficile infection must be ruled out in all patients with ASUC. Although patients with IBD, especially those with UC, have significantly higher rates of asymptomatic C. difficile carriage than the general population, a positive polymerase chain reaction test for C. difficile in a patient with ASUC should prompt treatment with oral vancomycin.25 However, if carriage if suspected and a subsequent enzyme-linked immunoassay for C. difficile toxin is negative, treatment can be discontinued. Active C. difficile infection in patients with IBD is associated with increased disease severity, greater length of hospital stay, and increased the likelihood of colectomy and mortality.26,27 Other bacterial infections including Escherichia coli, Campylobacter, Shigella, Salmonella, Yersinia, Entamoeba histolytica, as well as other parasitic infestations may mimic UC. Testing should be considered in cases of foreign travel, immunosuppression or contact with other persons with diarrhea.7,28 Routine testing of these other enteric infections without a clear exposure risk is of little benefit and may raise costs.23,29
Radiologic Evaluation
A plain X-ray film of the abdomen should be obtained in all patients on admission to evaluate for evolving colonic dilation or undiagnosed free air. Small bowel distension >3 cm may predict an increased risk of colectomy.30 Clinicians must be mindful that steroids can mask peritoneal signs and that retroperitoneal perforations may not be apparent on plain X-ray films. Nonetheless, a CT of the abdomen is usually not necessary and should be reserved for cases with severe abdominal pain out of proportion to clinical signs in which a plain X-ray film is unrevealing. Judicious use of CT imaging is especially important in younger patients, as there is growing concern that patients with IBD may be exposed to potentially harmful cumulative levels of radiation in their lifetime from repeated CT imaging.31
Endoscopic Evaluation
Flexible sigmoidoscopy aids in the assessment of disease severity and extent and biopsies can assist in ruling out a diagnosis of cytomegalovirus (CMV) colitis in patients already on immunosuppression. For this reason, many clinicians prefer to perform a sigmoidoscopy on admission.23 If one is not performed on admission, a sigmoidoscopy is advised in all patients who are not responding adequately after 72 hours of intravenous steroid therapy in order to rule out superimposed CMV colitis.28
Sigmoidoscopy should be avoided in patients with toxic megacolon and when there is a concern for peritonitis. A complete colonoscopy is rarely indicated in the acute setting and carries a theoretical risk of colonic perforation.7
INITIAL THERAPY
The first therapeutic steps aim to reduce inflammation with the use of systemic corticosteroids, avoid colonic and extraintestinal complications, and plan for the potential need for rescue therapy.
Intravenous Corticosteroids
The cornerstone of ASUC management is treatment with intravenous corticosteroids. Their initiation should not be delayed in patients with an established diagnosis of UC while waiting for results of evaluations for infectious colitis. Even among patients who have failed oral steroids, a meta-regression analysis showed that two-thirds of patients will still respond to intravenous corticosteroids.21,32 Methylprednisolone 20 mg IV three times daily (or hydrocortisone 100 mg IV three times daily) is a standard regimen; higher doses do not provide additional benefit.21 Patients’ response to intravenous steroids should be assessed with repeat labs including CRP and an assessment of the total number of bowel movements over a 24-hour period, with special attention to their overall response after three days of treatment.33-36
Intravenous Fluids
Many patients admitted with ASUC will have significant volume depletion, and intravenous fluids should be administered in a manner like other volume-depleted or oral-intake-restricted patients.
Venous Thromboembolism Prophylaxis
The risk of VTE in hospitalized patients with IBD exceeds that of inpatients without IBD, approximately 2%, a risk similar to patients with respiratory failure.37 Additionally, VTE in hospitalized patients with IBD is associated with a 2.5-fold increase in mortality.38,39 Therefore, all patients hospitalized with ASUC should receive subcutaneous unfractionated or low molecular weight heparin or fondaparinux for VTE prophylaxis. Rectal bleeding, expected in ASUC, is not a contraindication to chemo-prophylaxis. Additionally, it is important to check if patients are receiving the ordered VTE prophylaxis.40,41 Pleet et al. found that only 7% of patients at a tertiary center had adequate prophylaxis for greater than 80% of their hospitalization.41
Unnecessary or Potentially Harmful Medications
Several medications have the potential for misuse in patients hospitalized with UC.
Antimotility Agents
Loperamide, diphenoxylate, and opiate antidiarrheals should not be used as they may provoke toxic megacolon.42 Similarly, drugs with antimotility side effects (eg, anticholinergics) should be avoided.
Opiates
In addition to their undesirable antimotility effect, the use of opiates has been associated with poor outcomes among inpatients and outpatients with IBD, including increased morbidity and mortality.43,44 Pain severe enough to require opiates should raise suspicion for toxic megacolon, perforation, or a noninflammatory etiology. If opiates are utilized, they should be ordered as one-time doses and the patient should be reassessed for each dose.
Nonsteroidal Anti-inflammatory Drugs
These drugs, which include oral NSAIDs, intravenous ketorolac, and topic diclofenac gels, may increase disease activity in inflammatory bowel disease and should be avoided.17
5-aminosalicylates (5-ASA)
A small proportion of patients experience a paradoxical worsening of diarrhea due to the use of 5-ASA agents such as mesalamine. It is reasonable to discontinue or avoid the use of 5-ASA agents in hospitalized patients, especially as there is little to no benefit from combining a 5-ASA with a biologic or immunosuppressive drug.45
Antibiotics
There is no role for the routine use of antibiotics in patients hospitalized with ASUC. 23,46,47 Inappropriate use of antibiotics raises the risk of C. difficile infection and antibiotic resistance. However, in cases of suspected toxic megacolon or perforation, antibiotics should be administered. In situations in which a patient is treated with triple immunosuppression (ie, steroids plus two other agents, cyclosporine and mercaptopurine) antibiotic prophylaxis for Pneumocystis jiroveci is advisable.48 Using a large insurance database, Long et al. reported a low absolute incidence of Pneumocystis jiroveci in IBD patients but noted that the risk in patients with IBD was still significantly higher than matched controls. While it can be considered, we typically refrain from using prophylaxis in patients on double immunosuppression (for example, steroids plus infliximab) due to the potential adverse effects of antibiotics in this population, though many advocate using prophylaxis for all patients on cyclosporine even if this is only double immunosuppressive therapy.23
Surgical Consultation
Involving a surgeon early in an ASUC patient’s care—before needing urgent colectomy—is critical. As part of the consultation, a surgeon experienced in IBD should meet with patients to discuss multistage colectomy with ileostomy and potential future J-pouch (ileal pouch-anal anastomosis) formation. Patients should be given ample opportunity to ask questions before surgery may become urgent. Also, patients should be counseled on realistic expectations of ostomy and pouch function and, ideally, meet with an ostomy nurse.23
At some centers, surgical consultation is requested on the first hospital day, but this can result in consultations for patients who ultimately respond to intravenous steroids. Therefore, some centers advocate for surgical consultation only after a patient has failed treatment with intravenous steroids (ie, day three to four) when the risk of needing surgical management increases.23
Nutrition
Bowel rest with parenteral nutrition does not improve outcomes in ASUC versus an oral diet, and there is no contraindication to allowing patients to continue on a regular diet unless they have toxic megacolon or other signs of fulminant colitis.49,50 However, patients may feel better eating less, as this will reduce their bowel movement frequency. Unfortunately, this can give a false sense of reassurance that the patient is improving. Therefore, it remains important to evaluate a patient’s symptoms in the context of their food intake.
Assessing Response to Steroids
Patients who do not respond adequately to the first-line intravenous steroid therapy will require medical or surgical rescue therapy; therefore, deciding whether a patient has responded is essential. Patients should have less than four bowel movements per day – ideally just one to two – with no blood to indicate a complete response. For more ambiguous situations, although there is no strict definition of steroid responsiveness, multiple prediction indices have attempted to identify patients who will require rescue therapy. One of the simplest, the Oxford index, illustrates two of the most critical parameters to follow, stool frequency and CRP.51 In a preinfliximab cohort, Oxford index predicted an 85% likelihood of colectomy in patients with eight or more daily bowel movements or with three to eight daily bowel movements and a CRP greater than 45 mg/L after three days of intravenous steroid treatment.52 To assist with assessing responsiveness to therapy, we ask patients to log their bowel movements – either on paper or on a whiteboard in the hospital room – so that we can review their progress daily. Other predictors of colectomy include hypoalbuminemia, scoring of endoscopic severity, and colonic dilation.53
Patients who fail to respond to intravenous corticosteroids after three days33,35 of treatment should be started on rescue therapy with infliximab or cyclosporine or undergo colectomy. A common pitfall in the treatment of ASUC is waiting for a response to steroids beyond this time frame, after which patients are unlikely to benefit.34,36 Furthermore, patients for whom surgical rescue therapy is delayed have higher operative morbidity and mortality.54,55 Because timely decision making regarding rescue therapy is crucial to optimizing outcomes, patient education efforts regarding potential rescue therapy should take place on admission or soon after, rather than waiting to ascertain steroid responsiveness.
RESCUE THERAPY FOR STEROID-REFRACTORY DISEASE
Medical options for rescue therapy include the antitumor necrosis factor (anti-TNF) agent infliximab or the calcineurin inhibitor cyclosporine. In general, infliximab and cyclosporine have been found to be roughly equivalent in efficacy in clinical trials regarding response, remission, and colectomy at 12 months.56,57 However, many clinicians prefer infliximab due to its relative ease of use, familiarity with the agent from outpatient experience, and ability to continue to use long term for maintenance of disease remission.58 In contrast to infliximab, intravenous cyclosporine requires closer monitoring and labs to assess the therapeutic trough level. The decision regarding which drug to use should be made on a case-by-case basis in conjunction with a gastroenterologist experienced in their use, and if no such specialist is available, transfer to a specialized center should be considered. Generally, successive treatment with cyclosporine or infliximab followed by third-line salvage therapy with the other drug should be avoided due to low rates of response and high rates of adverse events.59
Infliximab
Infliximab is an intravenously-administered anti-TNF monoclonal chimeric antibody that is effective both for outpatient treatment of moderate to severe UC and inpatient treatment of ASUC.1 It is relatively contraindicated in patients with untreated latent tuberculosis, demyelinating disease, advanced congestive heart failure, or uncontrolled infection.
The optimal dosing strategy for infliximab in ASUC is unknown. Infliximab clearance in the setting of ASUC is increased, partly because it is bound to albumin, which is often low in ASUC, and partly because it is excreted in the stool.60,61 As a result, accelerated loading doses may be more successful than a typical loading schedule,62 and most clinicians use alternative dosing strategies.63 Our typical approach for ASUC is an initial dose of 10 mg/kg rather than 5 mg/kg, with an additional 10 mg/kg dose 48-72 hours later if an adequate clinical response is lacking. Patients who respond to infliximab can continue to use the drug as an outpatient for maintenance of remission.
Cyclosporine
Cyclosporine is a fast-acting immunosuppressive agent that acts primarily via T-cell inhibition. Although older literature used a dose of 4 mg/kg per day, a randomized trial demonstrated similar response rates to a dose of 2 mg/kg per day.64 Patients receiving treatment with cyclosporine, which is given as a continuous infusion, must be monitored for toxicities. These can include potentially severe infection, seizures (often associated with low total cholesterol or hypomagnesemia), electrolyte abnormalities, renal impairment, hypertension, hypertrichosis, tremor, and others.65
Before initiation of treatment, serum cholesterol levels should be obtained to screen for low total cholesterol that may portend risk of seizures on the drug. Additionally, baseline creatinine and magnesium should be established. While on treatment, daily serum cyclosporine levels and electrolytes including magnesium should be measured. Patients who respond to intravenous cyclosporine must be transitioned to oral cyclosporine and have stable drug levels before discharge. Unfortunately, oral cyclosporine has not been shown to be as effective as long-term maintenance therapy. Therefore, cyclosporine can only be used as a “bridge” to another therapy. Historically, thiopurines like azathioprine or mercaptopurine have been used for this purpose because they are effective for the treatment of UC but may require months to have a full therapeutic effect. There have been promising reports of using vedolizumab similarly.66,67 Vedolizumab is a monoclonal antibody that selectively blocks lymphocyte trafficking to the gut that, like thiopurines, has an onset of action that is significantly longer than calcineurin and TNF inhibitors.
COLECTOMY
Colectomy should be considered as a second- or third-line therapy for patients who fail to respond to intravenous corticosteroids. In an analysis of 10 years of data from the Nationwide Inpatient Sample, mortality rates for colectomy in this setting varied from 0.7% at high volume centers to 4% at low volume centers.68 Therefore, if a patient is not hospitalized at a center with expertise in colectomy for UC, transfer to a specialized center should be considered. Colectomy should be performed promptly in all the patients who have failed rescue therapy with infliximab or cyclosporine or have opted against medical rescue therapy. Surgery should be performed emergently in patients with toxic megacolon, uncontrolled colonic hemorrhage or perforation.
QUALITY OF CARE AND THE USE OF CARE PATHWAYS
Physician and center-level characteristics are associated with the quality of care and outcomes in ASUC. Gastroenterologists with expertise in IBD are more likely than other gastroenterologists to request appropriate surgical consultation for steroid-refractory patients,69 and inpatients with ASUC primarily cared by gastroenterologists rather than nongastroenterologists have lower in-hospital and one-year mortality.14 Moreover, surgical outcomes differ based on center volume, with higher volume centers having lower rates of postoperative mortality.68,70 However, even at referral centers, key metrics of care quality such as rates of VTE prophylaxis, testing for C. difficile, and timely rescue therapy for steroid-refractory UC patients are suboptimal, with only 70%-82% of patients with IBD hospitalized at four referral centers in Canada meeting these metrics.71
Inpatient clinical pathways reduce LOS, reduce hospital costs, and likely reduce complications.72 For this reason, a consensus group recommended the use of care pathways for the management of ASUC and, although there is little data on the use of pathways for ASUC specifically, the use of such a pathway in the United Kingdom was associated with improved metrics including LOS, time to VTE prophylaxis, testing of stool for infection, CRP measurement, and timely gastroenterologist consultation.16,18
DISCHARGE CRITERIA AND FOLLOW UP
In general, patients should enter clinical remission, defined as resolution of rectal bleeding and diarrhea or altered bowel habits,73 before discharge, and achieving this may require a relatively prolonged hospitalization. Most patients should have one to two bowel movements a day without blood but, at a minimum, all should have less than four nonbloody bowel movements per day. Patients are candidates for discharge if they remain well after transitioning to oral prednisone at a dose of 40-60 mg daily and tolerate a regular diet.
For patients who initiated infliximab during their admission, plans for outpatient infusions including insurance approval should be made before discharge, and patients who started cyclosporine should be transitioned to oral dosing and have stable serum concentrations before leaving the hospital. Patients should leave with a preliminary plan for a steroid taper, which may vary depending on their clinical presentation. Usually, gastroenterology follow-up should be arranged after two weeks following discharge, but patients on cyclosporine need sooner laboratory monitoring.
CONCLUSION
The care of patients with ASUC requires an interdisciplinary team and close collaboration between hospitalists, gastroenterologists, and surgeons. Patients should be treated with intravenous corticosteroids and monitored carefully for response and need for rescue therapy. Establishing algorithms for the management of patients with ASUC can further improve the care of these complex patients.
Disclosures
Drs. Feuerstein, Fudman, and Sattler report no potential conflict of interest.
Funding
This work was not supported by any grant.
1. Sands BE. Mount Sinai Expert Guides: Gastroenterology. Hoboken, NJ: John Wiley & Sons; 2014.
2. Dinesen LC, Walsh AJ, Protic MN, et al. The pattern and outcome of acute severe colitis. J Crohns Colitis. 2010;4(4):431-437. https://doi.org/10.1016/j.crohns.2010.02.001.
3. Edwards FC, Truelove SC. The course and prognosis of ulcerative colitis. Gut. 1963;4:299-315. https://doi.org/10.1136/gut.4.4.299.
4. Sonnenberg A, Chang J. Time trends of physician visits for Crohn’s disease and ulcerative colitis in the United States, 1960-2006. 2007;14(2):249-252. https://doi.org/10.1002/ibd.20273.
5. Nguyen GC, Tuskey A, Dassopoulos T, Harris ML, Brant SR. Rising hospitalization rates for inflammatory bowel disease in the United States between 1998 and 2004. Inflamm Bowel Dis. 2007;13(12):1529-1535. https://doi.org/10.1002/ibd.20250.
6. Truelove S, Witts L. Cortisone in ulcerative colitis. Br Med J. 1955;2:104-108.
7. Jakobovits SL, Travis S. Management of acute severe colitis. Br Med Bull. 2005;75(1):131-144. https://doi.org/10.1093/bmb/ldl001.
8. Lynch R, Lowe D, Protheroe A, Driscoll R, Rhodes J, Arnott I. Outcomes of rescue therapy in acute severe ulcerative colitis: data from the United Kingdom inflammatory bowel disease audit. Aliment Pharmacol Ther. 2013;38(8):935-945. https://doi.org/10.1111/apt.12473.
9. Magro F, Gionchetti P, Eliakim R, et al. Third European evidence-based consensus on diagnosis and management of ulcerative colitis. Part 1: definitions, diagnosis, extra-intestinal manifestations, pregnancy, cancer surveillance, surgery, and ileoanal pouch disorders. J Crohns Colitis. 2017;11(6):649-670. https://doi.org/10.1093/ecco-jcc/jjx008.
10. Kornbluth A, Sachar DB. Ulcerative colitis practice guidelines in adults: American college of gastroenterology, practice parameters committee. Am J Gastroenterol. 2010;105(3):501. https://doi.org/10.1038/ajg.2009.727.
11. Dassopoulos T, Cohen RD, Scherl EJ, Schwartz RM, Kosinski L, Regueiro MD. Ulcerative colitis care pathway. Gastroenterology. 2015;149(1):238-245. https://doi.org/10.1053/j.gastro.2015.05.036.
12. Ananthakrishnan AN, McGinley EL, Binion DG, Saeian K. A nationwide analysis of changes in severity and outcomes of inflammatory bowel disease hospitalizations. J Gastrointest Surg. 2011;15(2):267-276. https://doi.org/10.1007/s11605-010-1396-3.
13. Kelso M, Weideman RA, Cipher DJ, Feagins LA. Factors associated with length of stay in veterans with inflammatory bowel disease hospitalized for an acute flare. Inflamm Bowel Dis. 2017;24(1):5-11. https://doi.org/10.1093/ibd/izx020.
14. Murthy SK, Steinhart AH, Tinmouth J, Austin PC, Nguyen GC. Impact of gastroenterologist care on health outcomes of hospitalized ulcerative colitis patients. Gut. 2012;61(10):1410-1416. https://doi.org/10.1136/gutjnl-2011-301978.
15. Lee NS, Pola S, Groessl EJ, Rivera-Nieves J, Ho SB. Opportunities for improvement in the care of patients hospitalized for inflammatory bowel disease-related colitis. Dig Dis Sci. 2016;61(4):1003-1012. https://doi.org/10.1007/s10620-016-4046-0.
16. Neary BP, Doherty GA. A structured care pathway improves quality of care for acute severe ulcerative colitis. Gastroenterology. 2017;152(5):S218. https://doi.org/10.1016/S0016-5085(17)31028-4.
17. Klein A, Eliakim R. Nonsteroidal anti-inflammatory drugs and inflammatory bowel disease. Pharmaceuticals. 2010;3(4):1084-1092. https://doi.org/10.3390/ph3041084.
18. Chen JH, Andrews JM, Kariyawasam V, et al. Review article: acute severe ulcerative colitis - evidence-based consensus statements. Aliment Pharmacol Ther. 2016;44(2):127-144. https://doi.org/10.1111/apt.13670.
19. Vavricka SR, Schoepfer A, Scharl M, Lakatos PL, Navarini A, Rogler G. Extraintestinal manifestations of inflammatory bowel disease. Inflamm Bowel Dis. 2015;21(8):1982-1992. https://doi.org/10.1097/MIB.0000000000000392.
20. Solem CA, Loftus EV, Jr., Tremaine WJ, Harmsen WS, Zinsmeister AR, Sandborn WJ. Correlation of C-reactive protein with clinical, endoscopic, histologic, and radiographic activity in inflammatory bowel disease. Inflamm Bowel Dis. 2005;11(8):707-712. https://doi.org/10.1097/01.MIB.0000173271.18319.53.
21. Turner D, Walsh CM, Steinhart AH, Griffiths AM. Response to corticosteroids in severe ulcerative colitis: a systematic review of the literature and a meta-regression. Clin Gastroenterol Hepatol. 2007;5(1):103-110. https://doi.org/10.1016/j.cgh.2006.09.033.
22. Kaur M, Singapura P, Kalakota N, et al. Factors that contribute to indeterminate results from the QuantiFERON-TB Gold in-tube test in patients with inflammatory bowel disease. Clin Gastroenterol Hepatol. 2018;16(10):1616-1621.e1. https://doi.org/10.1016/j.cgh.2017.11.038.
23. Bitton A, Buie D, Enns R, et al. Treatment of hospitalized adult patients with severe ulcerative colitis: Toronto consensus statements. Am J Gastroenterol. 2012;107(2):179-194. https://doi.org/10.1038/ajg.2011.386.
24. Feuerstein JD, Nguyen GC, Kupfer SS, Falck-Ytter Y, Singh S. American Gastroenterological Association Institute Clinical Guidelines committee. American Gastroenterological Association Institute Guideline on therapeutic drug monitoring in inflammatory bowel disease. Gastroenterology. 2017;153(3):827-834.
25. McDonald LC, Gerding DN, Johnson S, et al. Clinical Practice Guidelines for Clostridium difficile infection in adults and children: 2017 Update by the Infectious Diseases Society of America (IDSA) and Society for Healthcare Epidemiology of America (SHEA). Clin Infect Dis. 2018;66(7):e1-e48. https://doi.org/10.1093/cid/cix1085.
26. Clayton EM, Rea MC, Shanahan F, et al. The vexed relationship between Clostridium difficile and inflammatory bowel disease: an assessment of carriage in an outpatient setting among patients in remission. Am J Gastroenterol. 2009;104(5):1162-1169. https://doi.org/10.1038/ajg.2009.4.
27. Nguyen GC, Kaplan GG, Harris ML, Brant SR. A national survey of the prevalence and impact of Clostridium difficile infection among hospitalized inflammatory bowel disease patients. Am J Gastroenterol. 2008;103(6):1443-1450. https://doi.org/10.1111/j.1572-0241.2007.01780.x.
28. Rahier J-F, Yazdanpanah Y, Colombel J-F, Travis S. The European (ECCO) Consensus on infection in IBD: what does it change for the clinician? Gut. 2009;58(10). https://doi.org/10.1136/gut.2008.175950.
29. Meyer AM, Ramzan NN, Loftus EV, Jr., Heigh RI, Leighton JA. The diagnostic yield of stool pathogen studies during relapses of inflammatory bowel disease. J Clin Gastroenterol. 2004;38(9):772-775. https://doi.org/10.1097/01.mcg.0000139057.05297.d6.
30. Chew C, Nolan D, Jewell D. Small bowel gas in severe ulcerative colitis. Gut. 1991;32(12):1535-1537. https://doi.org/10.1136/gut.32.12.1535.
31. Zakeri N, Pollok RC. Diagnostic imaging and radiation exposure in inflammatory bowel disease. World J Gastroenterol. 2016;22(7):2165-2178. https://doi.org/10.3748/wjg.v22.i7.2165.
32. Llaó J, Naves JE, Ruiz-Cerulla A, et al. Intravenous corticosteroids in moderately active ulcerative colitis refractory to oral corticosteroids. J Crohns Colitis. 2014;8(11):1523-1528. https://doi.org/10.1016/j.crohns.2014.06.010.
33. Seo M, Okada M, Yao T, Matake H, Maeda K. Evaluation of the clinical course of acute attacks in patients with ulcerative colitis through the use of an activity index. Journal of Gastroenterology. 2002;37(1):29-34. https://doi.org/10.1007/s535-002-8129-2.
34. Meyers S, Sachar DB, Goldberg JD, Janowitz HD. Corticotropin versus hydrocortisone in the intravenous treatment of ulcerative colitis: a prospective, randomized, double-blind clinical trial. Gastroenterology. 1983;85(2):351-357.
35. Ho G, Mowat C, Goddard C, et al. Predicting the outcome of severe ulcerative colitis: development of a novel risk score to aid early selection of patients for second‐line medical therapy or surgery. Aliment Pharmacol Ther. 2004;19(10):1079-1087. https://doi.org/10.1111/j.1365-2036.2004.01945.x.
36. Järnerot G, Rolny P, Sandberg-Gertzen H. Intensive intravenous treatment of ulcerative colitis. Gastroenterology. 1985;89(5):1005-1013. https://doi.org/10.1016/0016-5085(85)90201-X.
37. Wang JY, Terdiman JP, Vittinghoff E, Minichiello T, Varma MG. Hospitalized ulcerative colitis patients have an elevated risk of thromboembolic events. World J Gastroenterol. 2009;15(8):927-935. https://doi.org/10.3748/wjg.15.927.
38. Nguyen GC, Bernstein CN, Bitton A, et al. Consensus statements on the risk, prevention, and treatment of venous thromboembolism in inflammatory bowel disease: Canadian Association of Gastroenterology. Gastroenterology. 2014;146(3):835-848. https://doi.org/10.1053/j.gastro.2014.01.042.
39. Nguyen GC, Sam J. Rising prevalence of venous thromboembolism and its impact on mortality among hospitalized inflammatory bowel disease patients. Am J Gastroenterol. 2008;103(9):2272-2280. https://doi.org/10.1111/j.1572-0241.2008.02052.x.
40. Tinsley A, Naymagon S, Enomoto LM, Hollenbeak CS, Sands BE, Ullman TA. Rates of pharmacologic venous thromboembolism prophylaxis in hospitalized patients with active ulcerative colitis: results from a tertiary care center. J Crohns Colitis. 2013;7(12):e635-e640. https://doi.org/10.1016/j.crohns.2013.05.002.
41. Pleet JL, Vaughn BP, Morris JA, Moss AC, Cheifetz AS. The use of pharmacological prophylaxis against venous thromboembolism in hospitalized patients with severe active ulcerative colitis. Aliment Pharmacol Ther. 2014;39(9):940-948. https://doi.org/10.1111/apt.12691.
42. Gan SI, Beck PL. A new look at toxic megacolon: an update and review of incidence, etiology, pathogenesis, and management. Am J Gastroenterol. 2003;98(11):2363-2371 https://doi.org/10.1111/j.1572-0241.2003.07696.x.
43. Lichtenstein GR, Feagan BG, Cohen RD, et al. Serious infections and mortality in association with therapies for Crohn’s disease: TREAT registry. Clin Gastroenterol Hepatol. 2006;4(5):621-630. https://doi.org/10.1016/j.cgh.2006.03.002.
44. Docherty MJ, Jones III RCW, Wallace MS. Managing pain in inflammatory bowel disease. Gastroenterol Hepatol. 2011;7(9):592-601.
45. Singh S, Proudfoot JA, Dulai PS, et al. No benefit of concomitant 5-aminosalicylates in patients with ulcerative colitis escalated to biologic therapy: pooled analysis of individual participant data from clinical trials. Am J Gastroenterol. 2018;113(8):1197-1205. https://doi.org/10.1038/s41395-018-0144-2.
46. Mantzaris GJ, Hatzis A, Kontogiannis P, Triadaphyllou G. Intravenous tobramycin and metronidazole as an adjunct to corticosteroids in acute, severe ulcerative colitis. Am J Gastroenterol. 1994;89(1):43-46.
47. Mantzaris GJ, Petraki K, Archavlis E, et al. A prospective randomized controlled trial of intravenous ciprofloxacin as an adjunct to corticosteroids in acute, severe ulcerative colitis. Scand J Gastroenterol. 2001;36(9):971-974.
48. Rahier J-F, Magro F, Abreu C, et al. Second European evidence-based consensus on the prevention, diagnosis and management of opportunistic infections in inflammatory bowel disease. J Crohns Colitis. 2014;8(6):443-468. https://doi.org/10.1016/j.crohns.2013.12.013.
49. Dickinson RJ, Ashton MG, Axon AT, Smith RC, Yeung CK, Hill GL. Controlled trial of intravenous hyperalimentation and total bowel rest as an adjunct to the routine therapy of acute colitis. Gastroenterology. 1980;79(6):1199-1204.
50. McIntyre P, Powell-Tuck J, Wood S, et al. Controlled trial of bowel rest in the treatment of severe acute colitis. Gut. 1986;27(5):481-485. https://doi.org/10.1136/gut.27.5.481.
51. Travis SP, Farrant JM, Ricketts C, et al. Predicting outcome in severe ulcerative colitis. Gut. 1996;38(6):905-910. https://doi.org/10.1136/gut.38.6.905.
52. Bernardo S, Fernandes SR, Goncalves AR, et al. Predicting the course of disease in hospitalized patients with acute severe ulcerative colitis. Inflamm Bowel Dis. 2018;25(3):541-546. https://doi.org/10.1093/ibd/izy256.
53. Harbord M, Eliakim R, Bettenworth D, et al. Third European evidence-based consensus on diagnosis and management of ulcerative colitis. Part 2: current management. J Crohns Colitis. 2017;11(7):769-784. https://doi.org/10.1093/ecco-jcc/jjx009.
54. Randall J, Singh B, Warren B, Travis S, Mortensen N, George B. Delayed surgery for acute severe colitis is associated with increased risk of postoperative complications. Br J Surg. 2010;97(3):404-409. https://doi.org/10.1002/bjs.6874.
55. Bartels S, Gardenbroek T, Ubbink D, Buskens C, Tanis P, Bemelman W. Systematic review and meta‐analysis of laparoscopic versus open colectomy with end ileostomy for non‐toxic colitis. Br J Surg. 2013;100(6):726-733. https://doi.org/10.1002/bjs.9061.
56. Laharie D, Bourreille A, Branche J, et al. Ciclosporin versus infliximab in patients with severe ulcerative colitis refractory to intravenous steroids: a parallel, open-label randomized controlled trial. Lancet. 2012;380(9857):1909-1915. https://doi.org/10.1016/S0140-6736(12)61084-8.
57. Leblanc S, Allez M, Seksik P, et al. Successive treatment with cyclosporine and infliximab in steroid-refractory ulcerative colitis. Am J Gastroenterol. 2011;106(4):771-777. https://doi.org/10.1038/ajg.2011.62.
58. Narula N, Marshall JK, Colombel JF, et al. Systematic review and meta-analysis: infliximab or cyclosporine as rescue therapy in patients with severe ulcerative colitis refractory to steroids. Am J Gastroenterol. 2016;111(4):477-491. https://doi.org/10.1038/ajg.2016.7.
59. Feuerstein JD, Akbari M, Tapper EB, Cheifetz AS. Systematic review and meta-analysis of third-line salvage therapy with infliximab or cyclosporine in severe ulcerative colitis. Ann Gastroenterol. 2016;29(3):341-347. https://doi.org/10.20524/aog.2016.0032.
60. Brandse JF, Mathôt RA, van der Kleij D, et al. Pharmacokinetic features and presence of antidrug antibodies associated with response to infliximab induction therapy in patients with moderate to severe ulcerative colitis. Clin Gastroenterol Hepatol. 2016;14(2):251-258. https://doi.org/10.1016/j.cgh.2015.10.029.
61. Hindryckx P, Novak G, Vande Casteele N, et al. Review article: dose optimization of infliximab for acute severe ulcerative colitis. Aliment Pharmacol Ther. 2017;45(5):617-630. https://doi.org/10.1111/apt.13913.
62. Gibson DJ, Heetun ZS, Redmond CE, et al. An accelerated infliximab induction regimen reduces the need for early colectomy in patients with acute severe ulcerative colitis. Clin Gastroenterol Hepatol. 2015;13(2):330-335. https://doi.org/10.1016/j.cgh.2014.07.041.
63. Herfarth HH, Rogler G, Higgins PD. Pushing the pedal to the metal: should we accelerate infliximab therapy for patients with severe ulcerative colitis? Clin Gastroenterol Hepatol. 2015;13(2):336-338. https://doi.org/10.1016/j.cgh.2014.09.045.
64. Van Assche G, D’haens G, Noman M, et al. Randomized, double-blind comparison of 4 mg/kg versus 2 mg/kg intravenous cyclosporine in severe ulcerative colitis. Gastroenterology. 2003;125(4):1025-1031.
65. Arts J, D’haens G, Zeegers M, et al. Long-term outcome of treatment with intravenous cyclosporin in patients with severe ulcerative colitis. Inflamm Bowel Dis. 2004;10(2):73-78.
66. Tarabar D, El Jurdi K, Yvellez O, et al. 330-combination therapy of cyclosporine and vedolizumab is effective and safe for severe, steroid-resistant ulcerative colitis patients: a prospective study. Gastroenterology. 2018;154(6):S-82-S-83.https://doi.org/10.1016/S0016-5085(18)30725-X.
67. Szántó K, Molnár T, Farkas K. New promising combo therapy in inflammatory bowel diseases refractory to anti-TNF agents: cyclosporine plus vedolizumab. J Crohns Colitis. 2018;12(5):629. https://doi.org/10.1093/ecco-jcc/jjx179.
68. Kaplan GG, McCarthy EP, Ayanian JZ, Korzenik J, Hodin R, Sands BE. Impact of hospital volume on postoperative morbidity and mortality following a colectomy for ulcerative colitis. Gastroenterology. 2008;134(3):680-687. https://doi.org/10.1053/j.gastro.2008.01.004.
69. Spiegel BM, Ho W, Esrailian E, et al. Controversies in ulcerative colitis: a survey comparing decision making of experts versus community gastroenterologists. Clin Gastroenterol Hepatol. 2009;7(2):168-174. https://doi.org/10.1016/j.cgh.2008.08.029.
70. Ananthakrishnan AN, Issa M, Beaulieu DB, et al. History of medical hospitalization predicts future need for colectomy in patients with ulcerative colitis. Inflamm Bowel Dis. 2009;15(2):176-181. https://doi.org/10.1002/ibd.20639.
71. Nguyen GC, Murthy SK, Bressler B, et al. Quality of care and outcomes among hospitalized inflammatory bowel disease patients: a multicenter retrospective study. Inflamm Bowel Dis. 2017;23(5):695-701. https://doi.org/10.1097/MIB.0000000000001068.
72. Rotter T, Kugler J, Koch R, et al. A systematic review and meta-analysis of the effects of clinical pathways on length of stay, hospital costs, and patient outcomes. BMC Health Serv Res. 2008;8:265. https://doi.org/10.1186/1472-6963-8-265.
73. Peyrin-Biroulet L, Sandborn W, Sands BE, et al. Selecting therapeutic targets in inflammatory bowel disease (stride): determining therapeutic goals for treat-to-target. Am J Gastroenterol. 2015;110(9):1324-1338. https://doi.org/10.1038/ajg.2015.233.
Ulcerative colitis (UC) is a chronic inflammatory condition of the colonic mucosa. Classically, it starts in the rectum and can extend continuously from the distal to the proximal colon. The defining clinical symptom of UC is bloody diarrhea, typically accompanied by rectal urgency and mucus discharge. The natural history of this disease includes periods of exacerbations and remissions occurring spontaneously or in response to medical treatment.1
Acute severe ulcerative colitis (ASUC) is a potentially life-threatening complication of UC that typically requires hospitalization and interdisciplinary care between hospitalists, gastroenterologists, and colorectal or general surgeons. The risk of a patient with UC requiring hospitalization for ASUC ranges from 15%-25%2,3 and, in total, UC accounts for 30,000 hospital visits annually.4 The direct medical costs exceed $4 billion annually, with hospital costs of over $960 million.5 Historically, mortality from ASUC was as high as 24% but decreased substantially to 7% after the introduction of systemic corticosteroid therapy.6 Further advances in care have reduced mortality to approximately 1% or less.7,8 Nonetheless, up to 20% of patients admitted with ASUC have a colectomy on their first admission, and this rate rises to 40% after two admissions.2
DEFINING ACUTE SEVERE ULCERATIVE COLITIS
To categorize UC severity, assess patients using the Truelove and Witt’s criteria. The system classifies patients as having mild, moderate, severe, or fulminant disease. Severe disease by these criteria includes patients with >6 bloody bowel movements per day and at least one of the following clinical features: fever (>37.8°C), tachycardia (>90 bpm), anemia (hemoglobin <10.5 g/dl), or elevated inflammatory markers (traditionally, erythrocyte sedimentation rate greater than 30 mm/h or, more recently, C-reactive protein (CRP) greater than 30 mg/L. (Table 1).6,9
Fulminant colitis refers to a subgroup of patients with more than 10 stools per day, continuous bleeding, abdominal pain, colonic dilatation on abdominal X-ray film, and severe toxic symptoms including fever and anorexia. Such patients are at risk of progressing to toxic megacolon and bowel perforation.10
INDICATIONS FOR HOSPITALIZATION AND INPATIENT LEVEL OF CARE
Patients with ASUC almost always require hospitalization for their disease management. In many cases, these patients have been receiving outpatient oral prednisone 40-60 mg daily but continue to have ongoing disease activity.11 Most patients will require close clinical monitoring, frequent blood testing, endoscopic or radiologic evaluation, as well as administration of intravenous corticosteroids. The average length of stay (LOS) ranges from 4.6 to 12.5 days, depending on disease severity.12 Not surprisingly, Kelso et al. reported that predictors of hospital LOS greater than four days include initiating a biologic drug in the hospital, undergoing two or more imaging modalities and treatment with intravenous steroids,13 and so it is rare that patients do not meet billing requirements for an inpatient level of care.
INITIAL EVALUATION
The multifaceted initial inpatient evaluation of patients with ASUC aims to assess disease severity, identify and prevent potential complications, and initiate planning for potential failure of first-line pharmacologic therapy. Due to the accumulating evidence that involving physicians with expertise in managing ASUC improves outcomes, gastroenterologists should be involved in the care of patients with ASUC from the time of their admission.14,15 Additionally, creating standardized care pathways for the management of ASUC can reduce cost, LOS, and improve quality.16
History and Physical Examination
Patients should be asked about fever, abdominal pain, nausea, emesis, bloating, weight loss, and bowel movements (frequency, consistency, the presence of blood, urgency, nighttime awakenings). The number of bowel movements over a 24-hour period should be quantified as this helps assess the overall disease severity (Table 1).
The patient’s initial inflammatory bowel disease (IBD) history is also essential. The review of pertinent information regarding the patient’s initial diagnosis of UC includes the severity and anatomic extent of disease, extraintestinal manifestations, previous medical therapies, and surgical interventions. Exposure to nonsteroidal anti-inflammatory drugs (NSAIDs) or antibiotics should be identified as they may precipitate flares.17 Travel history may be pertinent as travel increases the risk of infections with food-borne or parasitic pathogens.18
Physical examination begins with an assessment of vital signs and volume status. Abdominal examination should include evaluation of bowel sounds, an assessment of distention, location, the extent of abdominal tenderness, and peritoneal signs. The abdominal exam should be interpreted in the context of the patient’s medications, as the use of steroid or analgesic therapies may affect the sensitivity for detecting complications. An external rectal exam evaluating perianal disease should be performed, as perianal disease raises concern for Crohn’s, a disease whose surgical management differs from UC.
A careful exam for extraintestinal manifestations is also essential. The skin should be evaluated for any new rashes, especially on the anterior shin consistent with erythema nodosum or ulcerated lesions on the skin suggestive of pyoderma gangrenosum. The peripheral joints should also be examined for any synovitis. Additional examinations should be performed based on any reported symptoms (eg, the ophthalmic exam for uveitis or scleritis if visual changes or eye pain are reported). Some extraintestinal manifestations require subspecialty consultation and comanagement to guide disease therapy. Patients with underlying pyoderma gangrenosum may require a dermatology consultation to guide management. Ocular inflammation requires ophthalmology involvement, and inflammatory arthritis is best comanaged with rheumatology.19
Laboratory Testing
Initial testing should include a complete blood count with differential, basic metabolic panel, and liver chemistries including alkaline phosphatase and albumin. When relevant, pregnancy testing should be performed. Measure CRP on admission so that its trajectory can be followed during therapy. However, a normal CRP does not exclude the presence of a UC flare as a subset of patients with ASUC will have a normal CRP despite severe mucosal inflammation.20
Since one-third of patients do not respond to intravenous corticosteroids and will require rescue therapy during the hospitalization with infliximab or cyclosporine, anticipatory testing for these medications should be performed on admission to avoid delays in the administration of rescue therapy.6,21 This should include an interferon-gamma release assay (eg, quantiferon gold) to test for latent tuberculosis and hepatitis B serologies in anticipation of possible treatment with infliximab. An interferon-gamma release assay is preferred to a tuberculin skin test because patients may be anergic, and a skin test does not provide a control to determine whether a negative test is due to anergy. In contrast, although a quantiferon gold test can be indeterminate in ASUC due to disease activity and systemic steroids, the results indicate if the patient is anergic so that one will not rely on a false-negative result. In the event of an equivocal result, a careful clinical assessment for risks of TB exposures should be elicited, and a chest radiograph should be obtained.22 In patients with prior high risk of tuberculosis exposures or a positive test for tuberculosis, an infectious disease specialist should be consulted early to advise if therapy should be started in preparation for the potential use of infliximab.23 In cases where cyclosporine may be considered, magnesium and total cholesterol level should be checked. Sending thiopurine methyltranferase (TPMT) enzyme activity should be considered as well, in case of a need for future thiopurine use for maintenance of disease activity.24
Infectious diarrhea may be indistinguishable from ASUC and may also be the trigger of a flare; thus, it is important to rule out infection with stool microbiologic studies. Most importantly, Clostridium difficile infection must be ruled out in all patients with ASUC. Although patients with IBD, especially those with UC, have significantly higher rates of asymptomatic C. difficile carriage than the general population, a positive polymerase chain reaction test for C. difficile in a patient with ASUC should prompt treatment with oral vancomycin.25 However, if carriage if suspected and a subsequent enzyme-linked immunoassay for C. difficile toxin is negative, treatment can be discontinued. Active C. difficile infection in patients with IBD is associated with increased disease severity, greater length of hospital stay, and increased the likelihood of colectomy and mortality.26,27 Other bacterial infections including Escherichia coli, Campylobacter, Shigella, Salmonella, Yersinia, Entamoeba histolytica, as well as other parasitic infestations may mimic UC. Testing should be considered in cases of foreign travel, immunosuppression or contact with other persons with diarrhea.7,28 Routine testing of these other enteric infections without a clear exposure risk is of little benefit and may raise costs.23,29
Radiologic Evaluation
A plain X-ray film of the abdomen should be obtained in all patients on admission to evaluate for evolving colonic dilation or undiagnosed free air. Small bowel distension >3 cm may predict an increased risk of colectomy.30 Clinicians must be mindful that steroids can mask peritoneal signs and that retroperitoneal perforations may not be apparent on plain X-ray films. Nonetheless, a CT of the abdomen is usually not necessary and should be reserved for cases with severe abdominal pain out of proportion to clinical signs in which a plain X-ray film is unrevealing. Judicious use of CT imaging is especially important in younger patients, as there is growing concern that patients with IBD may be exposed to potentially harmful cumulative levels of radiation in their lifetime from repeated CT imaging.31
Endoscopic Evaluation
Flexible sigmoidoscopy aids in the assessment of disease severity and extent and biopsies can assist in ruling out a diagnosis of cytomegalovirus (CMV) colitis in patients already on immunosuppression. For this reason, many clinicians prefer to perform a sigmoidoscopy on admission.23 If one is not performed on admission, a sigmoidoscopy is advised in all patients who are not responding adequately after 72 hours of intravenous steroid therapy in order to rule out superimposed CMV colitis.28
Sigmoidoscopy should be avoided in patients with toxic megacolon and when there is a concern for peritonitis. A complete colonoscopy is rarely indicated in the acute setting and carries a theoretical risk of colonic perforation.7
INITIAL THERAPY
The first therapeutic steps aim to reduce inflammation with the use of systemic corticosteroids, avoid colonic and extraintestinal complications, and plan for the potential need for rescue therapy.
Intravenous Corticosteroids
The cornerstone of ASUC management is treatment with intravenous corticosteroids. Their initiation should not be delayed in patients with an established diagnosis of UC while waiting for results of evaluations for infectious colitis. Even among patients who have failed oral steroids, a meta-regression analysis showed that two-thirds of patients will still respond to intravenous corticosteroids.21,32 Methylprednisolone 20 mg IV three times daily (or hydrocortisone 100 mg IV three times daily) is a standard regimen; higher doses do not provide additional benefit.21 Patients’ response to intravenous steroids should be assessed with repeat labs including CRP and an assessment of the total number of bowel movements over a 24-hour period, with special attention to their overall response after three days of treatment.33-36
Intravenous Fluids
Many patients admitted with ASUC will have significant volume depletion, and intravenous fluids should be administered in a manner like other volume-depleted or oral-intake-restricted patients.
Venous Thromboembolism Prophylaxis
The risk of VTE in hospitalized patients with IBD exceeds that of inpatients without IBD, approximately 2%, a risk similar to patients with respiratory failure.37 Additionally, VTE in hospitalized patients with IBD is associated with a 2.5-fold increase in mortality.38,39 Therefore, all patients hospitalized with ASUC should receive subcutaneous unfractionated or low molecular weight heparin or fondaparinux for VTE prophylaxis. Rectal bleeding, expected in ASUC, is not a contraindication to chemo-prophylaxis. Additionally, it is important to check if patients are receiving the ordered VTE prophylaxis.40,41 Pleet et al. found that only 7% of patients at a tertiary center had adequate prophylaxis for greater than 80% of their hospitalization.41
Unnecessary or Potentially Harmful Medications
Several medications have the potential for misuse in patients hospitalized with UC.
Antimotility Agents
Loperamide, diphenoxylate, and opiate antidiarrheals should not be used as they may provoke toxic megacolon.42 Similarly, drugs with antimotility side effects (eg, anticholinergics) should be avoided.
Opiates
In addition to their undesirable antimotility effect, the use of opiates has been associated with poor outcomes among inpatients and outpatients with IBD, including increased morbidity and mortality.43,44 Pain severe enough to require opiates should raise suspicion for toxic megacolon, perforation, or a noninflammatory etiology. If opiates are utilized, they should be ordered as one-time doses and the patient should be reassessed for each dose.
Nonsteroidal Anti-inflammatory Drugs
These drugs, which include oral NSAIDs, intravenous ketorolac, and topic diclofenac gels, may increase disease activity in inflammatory bowel disease and should be avoided.17
5-aminosalicylates (5-ASA)
A small proportion of patients experience a paradoxical worsening of diarrhea due to the use of 5-ASA agents such as mesalamine. It is reasonable to discontinue or avoid the use of 5-ASA agents in hospitalized patients, especially as there is little to no benefit from combining a 5-ASA with a biologic or immunosuppressive drug.45
Antibiotics
There is no role for the routine use of antibiotics in patients hospitalized with ASUC. 23,46,47 Inappropriate use of antibiotics raises the risk of C. difficile infection and antibiotic resistance. However, in cases of suspected toxic megacolon or perforation, antibiotics should be administered. In situations in which a patient is treated with triple immunosuppression (ie, steroids plus two other agents, cyclosporine and mercaptopurine) antibiotic prophylaxis for Pneumocystis jiroveci is advisable.48 Using a large insurance database, Long et al. reported a low absolute incidence of Pneumocystis jiroveci in IBD patients but noted that the risk in patients with IBD was still significantly higher than matched controls. While it can be considered, we typically refrain from using prophylaxis in patients on double immunosuppression (for example, steroids plus infliximab) due to the potential adverse effects of antibiotics in this population, though many advocate using prophylaxis for all patients on cyclosporine even if this is only double immunosuppressive therapy.23
Surgical Consultation
Involving a surgeon early in an ASUC patient’s care—before needing urgent colectomy—is critical. As part of the consultation, a surgeon experienced in IBD should meet with patients to discuss multistage colectomy with ileostomy and potential future J-pouch (ileal pouch-anal anastomosis) formation. Patients should be given ample opportunity to ask questions before surgery may become urgent. Also, patients should be counseled on realistic expectations of ostomy and pouch function and, ideally, meet with an ostomy nurse.23
At some centers, surgical consultation is requested on the first hospital day, but this can result in consultations for patients who ultimately respond to intravenous steroids. Therefore, some centers advocate for surgical consultation only after a patient has failed treatment with intravenous steroids (ie, day three to four) when the risk of needing surgical management increases.23
Nutrition
Bowel rest with parenteral nutrition does not improve outcomes in ASUC versus an oral diet, and there is no contraindication to allowing patients to continue on a regular diet unless they have toxic megacolon or other signs of fulminant colitis.49,50 However, patients may feel better eating less, as this will reduce their bowel movement frequency. Unfortunately, this can give a false sense of reassurance that the patient is improving. Therefore, it remains important to evaluate a patient’s symptoms in the context of their food intake.
Assessing Response to Steroids
Patients who do not respond adequately to the first-line intravenous steroid therapy will require medical or surgical rescue therapy; therefore, deciding whether a patient has responded is essential. Patients should have less than four bowel movements per day – ideally just one to two – with no blood to indicate a complete response. For more ambiguous situations, although there is no strict definition of steroid responsiveness, multiple prediction indices have attempted to identify patients who will require rescue therapy. One of the simplest, the Oxford index, illustrates two of the most critical parameters to follow, stool frequency and CRP.51 In a preinfliximab cohort, Oxford index predicted an 85% likelihood of colectomy in patients with eight or more daily bowel movements or with three to eight daily bowel movements and a CRP greater than 45 mg/L after three days of intravenous steroid treatment.52 To assist with assessing responsiveness to therapy, we ask patients to log their bowel movements – either on paper or on a whiteboard in the hospital room – so that we can review their progress daily. Other predictors of colectomy include hypoalbuminemia, scoring of endoscopic severity, and colonic dilation.53
Patients who fail to respond to intravenous corticosteroids after three days33,35 of treatment should be started on rescue therapy with infliximab or cyclosporine or undergo colectomy. A common pitfall in the treatment of ASUC is waiting for a response to steroids beyond this time frame, after which patients are unlikely to benefit.34,36 Furthermore, patients for whom surgical rescue therapy is delayed have higher operative morbidity and mortality.54,55 Because timely decision making regarding rescue therapy is crucial to optimizing outcomes, patient education efforts regarding potential rescue therapy should take place on admission or soon after, rather than waiting to ascertain steroid responsiveness.
RESCUE THERAPY FOR STEROID-REFRACTORY DISEASE
Medical options for rescue therapy include the antitumor necrosis factor (anti-TNF) agent infliximab or the calcineurin inhibitor cyclosporine. In general, infliximab and cyclosporine have been found to be roughly equivalent in efficacy in clinical trials regarding response, remission, and colectomy at 12 months.56,57 However, many clinicians prefer infliximab due to its relative ease of use, familiarity with the agent from outpatient experience, and ability to continue to use long term for maintenance of disease remission.58 In contrast to infliximab, intravenous cyclosporine requires closer monitoring and labs to assess the therapeutic trough level. The decision regarding which drug to use should be made on a case-by-case basis in conjunction with a gastroenterologist experienced in their use, and if no such specialist is available, transfer to a specialized center should be considered. Generally, successive treatment with cyclosporine or infliximab followed by third-line salvage therapy with the other drug should be avoided due to low rates of response and high rates of adverse events.59
Infliximab
Infliximab is an intravenously-administered anti-TNF monoclonal chimeric antibody that is effective both for outpatient treatment of moderate to severe UC and inpatient treatment of ASUC.1 It is relatively contraindicated in patients with untreated latent tuberculosis, demyelinating disease, advanced congestive heart failure, or uncontrolled infection.
The optimal dosing strategy for infliximab in ASUC is unknown. Infliximab clearance in the setting of ASUC is increased, partly because it is bound to albumin, which is often low in ASUC, and partly because it is excreted in the stool.60,61 As a result, accelerated loading doses may be more successful than a typical loading schedule,62 and most clinicians use alternative dosing strategies.63 Our typical approach for ASUC is an initial dose of 10 mg/kg rather than 5 mg/kg, with an additional 10 mg/kg dose 48-72 hours later if an adequate clinical response is lacking. Patients who respond to infliximab can continue to use the drug as an outpatient for maintenance of remission.
Cyclosporine
Cyclosporine is a fast-acting immunosuppressive agent that acts primarily via T-cell inhibition. Although older literature used a dose of 4 mg/kg per day, a randomized trial demonstrated similar response rates to a dose of 2 mg/kg per day.64 Patients receiving treatment with cyclosporine, which is given as a continuous infusion, must be monitored for toxicities. These can include potentially severe infection, seizures (often associated with low total cholesterol or hypomagnesemia), electrolyte abnormalities, renal impairment, hypertension, hypertrichosis, tremor, and others.65
Before initiation of treatment, serum cholesterol levels should be obtained to screen for low total cholesterol that may portend risk of seizures on the drug. Additionally, baseline creatinine and magnesium should be established. While on treatment, daily serum cyclosporine levels and electrolytes including magnesium should be measured. Patients who respond to intravenous cyclosporine must be transitioned to oral cyclosporine and have stable drug levels before discharge. Unfortunately, oral cyclosporine has not been shown to be as effective as long-term maintenance therapy. Therefore, cyclosporine can only be used as a “bridge” to another therapy. Historically, thiopurines like azathioprine or mercaptopurine have been used for this purpose because they are effective for the treatment of UC but may require months to have a full therapeutic effect. There have been promising reports of using vedolizumab similarly.66,67 Vedolizumab is a monoclonal antibody that selectively blocks lymphocyte trafficking to the gut that, like thiopurines, has an onset of action that is significantly longer than calcineurin and TNF inhibitors.
COLECTOMY
Colectomy should be considered as a second- or third-line therapy for patients who fail to respond to intravenous corticosteroids. In an analysis of 10 years of data from the Nationwide Inpatient Sample, mortality rates for colectomy in this setting varied from 0.7% at high volume centers to 4% at low volume centers.68 Therefore, if a patient is not hospitalized at a center with expertise in colectomy for UC, transfer to a specialized center should be considered. Colectomy should be performed promptly in all the patients who have failed rescue therapy with infliximab or cyclosporine or have opted against medical rescue therapy. Surgery should be performed emergently in patients with toxic megacolon, uncontrolled colonic hemorrhage or perforation.
QUALITY OF CARE AND THE USE OF CARE PATHWAYS
Physician and center-level characteristics are associated with the quality of care and outcomes in ASUC. Gastroenterologists with expertise in IBD are more likely than other gastroenterologists to request appropriate surgical consultation for steroid-refractory patients,69 and inpatients with ASUC primarily cared by gastroenterologists rather than nongastroenterologists have lower in-hospital and one-year mortality.14 Moreover, surgical outcomes differ based on center volume, with higher volume centers having lower rates of postoperative mortality.68,70 However, even at referral centers, key metrics of care quality such as rates of VTE prophylaxis, testing for C. difficile, and timely rescue therapy for steroid-refractory UC patients are suboptimal, with only 70%-82% of patients with IBD hospitalized at four referral centers in Canada meeting these metrics.71
Inpatient clinical pathways reduce LOS, reduce hospital costs, and likely reduce complications.72 For this reason, a consensus group recommended the use of care pathways for the management of ASUC and, although there is little data on the use of pathways for ASUC specifically, the use of such a pathway in the United Kingdom was associated with improved metrics including LOS, time to VTE prophylaxis, testing of stool for infection, CRP measurement, and timely gastroenterologist consultation.16,18
DISCHARGE CRITERIA AND FOLLOW UP
In general, patients should enter clinical remission, defined as resolution of rectal bleeding and diarrhea or altered bowel habits,73 before discharge, and achieving this may require a relatively prolonged hospitalization. Most patients should have one to two bowel movements a day without blood but, at a minimum, all should have less than four nonbloody bowel movements per day. Patients are candidates for discharge if they remain well after transitioning to oral prednisone at a dose of 40-60 mg daily and tolerate a regular diet.
For patients who initiated infliximab during their admission, plans for outpatient infusions including insurance approval should be made before discharge, and patients who started cyclosporine should be transitioned to oral dosing and have stable serum concentrations before leaving the hospital. Patients should leave with a preliminary plan for a steroid taper, which may vary depending on their clinical presentation. Usually, gastroenterology follow-up should be arranged after two weeks following discharge, but patients on cyclosporine need sooner laboratory monitoring.
CONCLUSION
The care of patients with ASUC requires an interdisciplinary team and close collaboration between hospitalists, gastroenterologists, and surgeons. Patients should be treated with intravenous corticosteroids and monitored carefully for response and need for rescue therapy. Establishing algorithms for the management of patients with ASUC can further improve the care of these complex patients.
Disclosures
Drs. Feuerstein, Fudman, and Sattler report no potential conflict of interest.
Funding
This work was not supported by any grant.
1. Sands BE. Mount Sinai Expert Guides: Gastroenterology. Hoboken, NJ: John Wiley & Sons; 2014.
2. Dinesen LC, Walsh AJ, Protic MN, et al. The pattern and outcome of acute severe colitis. J Crohns Colitis. 2010;4(4):431-437. https://doi.org/10.1016/j.crohns.2010.02.001.
3. Edwards FC, Truelove SC. The course and prognosis of ulcerative colitis. Gut. 1963;4:299-315. https://doi.org/10.1136/gut.4.4.299.
4. Sonnenberg A, Chang J. Time trends of physician visits for Crohn’s disease and ulcerative colitis in the United States, 1960-2006. 2007;14(2):249-252. https://doi.org/10.1002/ibd.20273.
5. Nguyen GC, Tuskey A, Dassopoulos T, Harris ML, Brant SR. Rising hospitalization rates for inflammatory bowel disease in the United States between 1998 and 2004. Inflamm Bowel Dis. 2007;13(12):1529-1535. https://doi.org/10.1002/ibd.20250.
6. Truelove S, Witts L. Cortisone in ulcerative colitis. Br Med J. 1955;2:104-108.
7. Jakobovits SL, Travis S. Management of acute severe colitis. Br Med Bull. 2005;75(1):131-144. https://doi.org/10.1093/bmb/ldl001.
8. Lynch R, Lowe D, Protheroe A, Driscoll R, Rhodes J, Arnott I. Outcomes of rescue therapy in acute severe ulcerative colitis: data from the United Kingdom inflammatory bowel disease audit. Aliment Pharmacol Ther. 2013;38(8):935-945. https://doi.org/10.1111/apt.12473.
9. Magro F, Gionchetti P, Eliakim R, et al. Third European evidence-based consensus on diagnosis and management of ulcerative colitis. Part 1: definitions, diagnosis, extra-intestinal manifestations, pregnancy, cancer surveillance, surgery, and ileoanal pouch disorders. J Crohns Colitis. 2017;11(6):649-670. https://doi.org/10.1093/ecco-jcc/jjx008.
10. Kornbluth A, Sachar DB. Ulcerative colitis practice guidelines in adults: American college of gastroenterology, practice parameters committee. Am J Gastroenterol. 2010;105(3):501. https://doi.org/10.1038/ajg.2009.727.
11. Dassopoulos T, Cohen RD, Scherl EJ, Schwartz RM, Kosinski L, Regueiro MD. Ulcerative colitis care pathway. Gastroenterology. 2015;149(1):238-245. https://doi.org/10.1053/j.gastro.2015.05.036.
12. Ananthakrishnan AN, McGinley EL, Binion DG, Saeian K. A nationwide analysis of changes in severity and outcomes of inflammatory bowel disease hospitalizations. J Gastrointest Surg. 2011;15(2):267-276. https://doi.org/10.1007/s11605-010-1396-3.
13. Kelso M, Weideman RA, Cipher DJ, Feagins LA. Factors associated with length of stay in veterans with inflammatory bowel disease hospitalized for an acute flare. Inflamm Bowel Dis. 2017;24(1):5-11. https://doi.org/10.1093/ibd/izx020.
14. Murthy SK, Steinhart AH, Tinmouth J, Austin PC, Nguyen GC. Impact of gastroenterologist care on health outcomes of hospitalized ulcerative colitis patients. Gut. 2012;61(10):1410-1416. https://doi.org/10.1136/gutjnl-2011-301978.
15. Lee NS, Pola S, Groessl EJ, Rivera-Nieves J, Ho SB. Opportunities for improvement in the care of patients hospitalized for inflammatory bowel disease-related colitis. Dig Dis Sci. 2016;61(4):1003-1012. https://doi.org/10.1007/s10620-016-4046-0.
16. Neary BP, Doherty GA. A structured care pathway improves quality of care for acute severe ulcerative colitis. Gastroenterology. 2017;152(5):S218. https://doi.org/10.1016/S0016-5085(17)31028-4.
17. Klein A, Eliakim R. Nonsteroidal anti-inflammatory drugs and inflammatory bowel disease. Pharmaceuticals. 2010;3(4):1084-1092. https://doi.org/10.3390/ph3041084.
18. Chen JH, Andrews JM, Kariyawasam V, et al. Review article: acute severe ulcerative colitis - evidence-based consensus statements. Aliment Pharmacol Ther. 2016;44(2):127-144. https://doi.org/10.1111/apt.13670.
19. Vavricka SR, Schoepfer A, Scharl M, Lakatos PL, Navarini A, Rogler G. Extraintestinal manifestations of inflammatory bowel disease. Inflamm Bowel Dis. 2015;21(8):1982-1992. https://doi.org/10.1097/MIB.0000000000000392.
20. Solem CA, Loftus EV, Jr., Tremaine WJ, Harmsen WS, Zinsmeister AR, Sandborn WJ. Correlation of C-reactive protein with clinical, endoscopic, histologic, and radiographic activity in inflammatory bowel disease. Inflamm Bowel Dis. 2005;11(8):707-712. https://doi.org/10.1097/01.MIB.0000173271.18319.53.
21. Turner D, Walsh CM, Steinhart AH, Griffiths AM. Response to corticosteroids in severe ulcerative colitis: a systematic review of the literature and a meta-regression. Clin Gastroenterol Hepatol. 2007;5(1):103-110. https://doi.org/10.1016/j.cgh.2006.09.033.
22. Kaur M, Singapura P, Kalakota N, et al. Factors that contribute to indeterminate results from the QuantiFERON-TB Gold in-tube test in patients with inflammatory bowel disease. Clin Gastroenterol Hepatol. 2018;16(10):1616-1621.e1. https://doi.org/10.1016/j.cgh.2017.11.038.
23. Bitton A, Buie D, Enns R, et al. Treatment of hospitalized adult patients with severe ulcerative colitis: Toronto consensus statements. Am J Gastroenterol. 2012;107(2):179-194. https://doi.org/10.1038/ajg.2011.386.
24. Feuerstein JD, Nguyen GC, Kupfer SS, Falck-Ytter Y, Singh S. American Gastroenterological Association Institute Clinical Guidelines committee. American Gastroenterological Association Institute Guideline on therapeutic drug monitoring in inflammatory bowel disease. Gastroenterology. 2017;153(3):827-834.
25. McDonald LC, Gerding DN, Johnson S, et al. Clinical Practice Guidelines for Clostridium difficile infection in adults and children: 2017 Update by the Infectious Diseases Society of America (IDSA) and Society for Healthcare Epidemiology of America (SHEA). Clin Infect Dis. 2018;66(7):e1-e48. https://doi.org/10.1093/cid/cix1085.
26. Clayton EM, Rea MC, Shanahan F, et al. The vexed relationship between Clostridium difficile and inflammatory bowel disease: an assessment of carriage in an outpatient setting among patients in remission. Am J Gastroenterol. 2009;104(5):1162-1169. https://doi.org/10.1038/ajg.2009.4.
27. Nguyen GC, Kaplan GG, Harris ML, Brant SR. A national survey of the prevalence and impact of Clostridium difficile infection among hospitalized inflammatory bowel disease patients. Am J Gastroenterol. 2008;103(6):1443-1450. https://doi.org/10.1111/j.1572-0241.2007.01780.x.
28. Rahier J-F, Yazdanpanah Y, Colombel J-F, Travis S. The European (ECCO) Consensus on infection in IBD: what does it change for the clinician? Gut. 2009;58(10). https://doi.org/10.1136/gut.2008.175950.
29. Meyer AM, Ramzan NN, Loftus EV, Jr., Heigh RI, Leighton JA. The diagnostic yield of stool pathogen studies during relapses of inflammatory bowel disease. J Clin Gastroenterol. 2004;38(9):772-775. https://doi.org/10.1097/01.mcg.0000139057.05297.d6.
30. Chew C, Nolan D, Jewell D. Small bowel gas in severe ulcerative colitis. Gut. 1991;32(12):1535-1537. https://doi.org/10.1136/gut.32.12.1535.
31. Zakeri N, Pollok RC. Diagnostic imaging and radiation exposure in inflammatory bowel disease. World J Gastroenterol. 2016;22(7):2165-2178. https://doi.org/10.3748/wjg.v22.i7.2165.
32. Llaó J, Naves JE, Ruiz-Cerulla A, et al. Intravenous corticosteroids in moderately active ulcerative colitis refractory to oral corticosteroids. J Crohns Colitis. 2014;8(11):1523-1528. https://doi.org/10.1016/j.crohns.2014.06.010.
33. Seo M, Okada M, Yao T, Matake H, Maeda K. Evaluation of the clinical course of acute attacks in patients with ulcerative colitis through the use of an activity index. Journal of Gastroenterology. 2002;37(1):29-34. https://doi.org/10.1007/s535-002-8129-2.
34. Meyers S, Sachar DB, Goldberg JD, Janowitz HD. Corticotropin versus hydrocortisone in the intravenous treatment of ulcerative colitis: a prospective, randomized, double-blind clinical trial. Gastroenterology. 1983;85(2):351-357.
35. Ho G, Mowat C, Goddard C, et al. Predicting the outcome of severe ulcerative colitis: development of a novel risk score to aid early selection of patients for second‐line medical therapy or surgery. Aliment Pharmacol Ther. 2004;19(10):1079-1087. https://doi.org/10.1111/j.1365-2036.2004.01945.x.
36. Järnerot G, Rolny P, Sandberg-Gertzen H. Intensive intravenous treatment of ulcerative colitis. Gastroenterology. 1985;89(5):1005-1013. https://doi.org/10.1016/0016-5085(85)90201-X.
37. Wang JY, Terdiman JP, Vittinghoff E, Minichiello T, Varma MG. Hospitalized ulcerative colitis patients have an elevated risk of thromboembolic events. World J Gastroenterol. 2009;15(8):927-935. https://doi.org/10.3748/wjg.15.927.
38. Nguyen GC, Bernstein CN, Bitton A, et al. Consensus statements on the risk, prevention, and treatment of venous thromboembolism in inflammatory bowel disease: Canadian Association of Gastroenterology. Gastroenterology. 2014;146(3):835-848. https://doi.org/10.1053/j.gastro.2014.01.042.
39. Nguyen GC, Sam J. Rising prevalence of venous thromboembolism and its impact on mortality among hospitalized inflammatory bowel disease patients. Am J Gastroenterol. 2008;103(9):2272-2280. https://doi.org/10.1111/j.1572-0241.2008.02052.x.
40. Tinsley A, Naymagon S, Enomoto LM, Hollenbeak CS, Sands BE, Ullman TA. Rates of pharmacologic venous thromboembolism prophylaxis in hospitalized patients with active ulcerative colitis: results from a tertiary care center. J Crohns Colitis. 2013;7(12):e635-e640. https://doi.org/10.1016/j.crohns.2013.05.002.
41. Pleet JL, Vaughn BP, Morris JA, Moss AC, Cheifetz AS. The use of pharmacological prophylaxis against venous thromboembolism in hospitalized patients with severe active ulcerative colitis. Aliment Pharmacol Ther. 2014;39(9):940-948. https://doi.org/10.1111/apt.12691.
42. Gan SI, Beck PL. A new look at toxic megacolon: an update and review of incidence, etiology, pathogenesis, and management. Am J Gastroenterol. 2003;98(11):2363-2371 https://doi.org/10.1111/j.1572-0241.2003.07696.x.
43. Lichtenstein GR, Feagan BG, Cohen RD, et al. Serious infections and mortality in association with therapies for Crohn’s disease: TREAT registry. Clin Gastroenterol Hepatol. 2006;4(5):621-630. https://doi.org/10.1016/j.cgh.2006.03.002.
44. Docherty MJ, Jones III RCW, Wallace MS. Managing pain in inflammatory bowel disease. Gastroenterol Hepatol. 2011;7(9):592-601.
45. Singh S, Proudfoot JA, Dulai PS, et al. No benefit of concomitant 5-aminosalicylates in patients with ulcerative colitis escalated to biologic therapy: pooled analysis of individual participant data from clinical trials. Am J Gastroenterol. 2018;113(8):1197-1205. https://doi.org/10.1038/s41395-018-0144-2.
46. Mantzaris GJ, Hatzis A, Kontogiannis P, Triadaphyllou G. Intravenous tobramycin and metronidazole as an adjunct to corticosteroids in acute, severe ulcerative colitis. Am J Gastroenterol. 1994;89(1):43-46.
47. Mantzaris GJ, Petraki K, Archavlis E, et al. A prospective randomized controlled trial of intravenous ciprofloxacin as an adjunct to corticosteroids in acute, severe ulcerative colitis. Scand J Gastroenterol. 2001;36(9):971-974.
48. Rahier J-F, Magro F, Abreu C, et al. Second European evidence-based consensus on the prevention, diagnosis and management of opportunistic infections in inflammatory bowel disease. J Crohns Colitis. 2014;8(6):443-468. https://doi.org/10.1016/j.crohns.2013.12.013.
49. Dickinson RJ, Ashton MG, Axon AT, Smith RC, Yeung CK, Hill GL. Controlled trial of intravenous hyperalimentation and total bowel rest as an adjunct to the routine therapy of acute colitis. Gastroenterology. 1980;79(6):1199-1204.
50. McIntyre P, Powell-Tuck J, Wood S, et al. Controlled trial of bowel rest in the treatment of severe acute colitis. Gut. 1986;27(5):481-485. https://doi.org/10.1136/gut.27.5.481.
51. Travis SP, Farrant JM, Ricketts C, et al. Predicting outcome in severe ulcerative colitis. Gut. 1996;38(6):905-910. https://doi.org/10.1136/gut.38.6.905.
52. Bernardo S, Fernandes SR, Goncalves AR, et al. Predicting the course of disease in hospitalized patients with acute severe ulcerative colitis. Inflamm Bowel Dis. 2018;25(3):541-546. https://doi.org/10.1093/ibd/izy256.
53. Harbord M, Eliakim R, Bettenworth D, et al. Third European evidence-based consensus on diagnosis and management of ulcerative colitis. Part 2: current management. J Crohns Colitis. 2017;11(7):769-784. https://doi.org/10.1093/ecco-jcc/jjx009.
54. Randall J, Singh B, Warren B, Travis S, Mortensen N, George B. Delayed surgery for acute severe colitis is associated with increased risk of postoperative complications. Br J Surg. 2010;97(3):404-409. https://doi.org/10.1002/bjs.6874.
55. Bartels S, Gardenbroek T, Ubbink D, Buskens C, Tanis P, Bemelman W. Systematic review and meta‐analysis of laparoscopic versus open colectomy with end ileostomy for non‐toxic colitis. Br J Surg. 2013;100(6):726-733. https://doi.org/10.1002/bjs.9061.
56. Laharie D, Bourreille A, Branche J, et al. Ciclosporin versus infliximab in patients with severe ulcerative colitis refractory to intravenous steroids: a parallel, open-label randomized controlled trial. Lancet. 2012;380(9857):1909-1915. https://doi.org/10.1016/S0140-6736(12)61084-8.
57. Leblanc S, Allez M, Seksik P, et al. Successive treatment with cyclosporine and infliximab in steroid-refractory ulcerative colitis. Am J Gastroenterol. 2011;106(4):771-777. https://doi.org/10.1038/ajg.2011.62.
58. Narula N, Marshall JK, Colombel JF, et al. Systematic review and meta-analysis: infliximab or cyclosporine as rescue therapy in patients with severe ulcerative colitis refractory to steroids. Am J Gastroenterol. 2016;111(4):477-491. https://doi.org/10.1038/ajg.2016.7.
59. Feuerstein JD, Akbari M, Tapper EB, Cheifetz AS. Systematic review and meta-analysis of third-line salvage therapy with infliximab or cyclosporine in severe ulcerative colitis. Ann Gastroenterol. 2016;29(3):341-347. https://doi.org/10.20524/aog.2016.0032.
60. Brandse JF, Mathôt RA, van der Kleij D, et al. Pharmacokinetic features and presence of antidrug antibodies associated with response to infliximab induction therapy in patients with moderate to severe ulcerative colitis. Clin Gastroenterol Hepatol. 2016;14(2):251-258. https://doi.org/10.1016/j.cgh.2015.10.029.
61. Hindryckx P, Novak G, Vande Casteele N, et al. Review article: dose optimization of infliximab for acute severe ulcerative colitis. Aliment Pharmacol Ther. 2017;45(5):617-630. https://doi.org/10.1111/apt.13913.
62. Gibson DJ, Heetun ZS, Redmond CE, et al. An accelerated infliximab induction regimen reduces the need for early colectomy in patients with acute severe ulcerative colitis. Clin Gastroenterol Hepatol. 2015;13(2):330-335. https://doi.org/10.1016/j.cgh.2014.07.041.
63. Herfarth HH, Rogler G, Higgins PD. Pushing the pedal to the metal: should we accelerate infliximab therapy for patients with severe ulcerative colitis? Clin Gastroenterol Hepatol. 2015;13(2):336-338. https://doi.org/10.1016/j.cgh.2014.09.045.
64. Van Assche G, D’haens G, Noman M, et al. Randomized, double-blind comparison of 4 mg/kg versus 2 mg/kg intravenous cyclosporine in severe ulcerative colitis. Gastroenterology. 2003;125(4):1025-1031.
65. Arts J, D’haens G, Zeegers M, et al. Long-term outcome of treatment with intravenous cyclosporin in patients with severe ulcerative colitis. Inflamm Bowel Dis. 2004;10(2):73-78.
66. Tarabar D, El Jurdi K, Yvellez O, et al. 330-combination therapy of cyclosporine and vedolizumab is effective and safe for severe, steroid-resistant ulcerative colitis patients: a prospective study. Gastroenterology. 2018;154(6):S-82-S-83.https://doi.org/10.1016/S0016-5085(18)30725-X.
67. Szántó K, Molnár T, Farkas K. New promising combo therapy in inflammatory bowel diseases refractory to anti-TNF agents: cyclosporine plus vedolizumab. J Crohns Colitis. 2018;12(5):629. https://doi.org/10.1093/ecco-jcc/jjx179.
68. Kaplan GG, McCarthy EP, Ayanian JZ, Korzenik J, Hodin R, Sands BE. Impact of hospital volume on postoperative morbidity and mortality following a colectomy for ulcerative colitis. Gastroenterology. 2008;134(3):680-687. https://doi.org/10.1053/j.gastro.2008.01.004.
69. Spiegel BM, Ho W, Esrailian E, et al. Controversies in ulcerative colitis: a survey comparing decision making of experts versus community gastroenterologists. Clin Gastroenterol Hepatol. 2009;7(2):168-174. https://doi.org/10.1016/j.cgh.2008.08.029.
70. Ananthakrishnan AN, Issa M, Beaulieu DB, et al. History of medical hospitalization predicts future need for colectomy in patients with ulcerative colitis. Inflamm Bowel Dis. 2009;15(2):176-181. https://doi.org/10.1002/ibd.20639.
71. Nguyen GC, Murthy SK, Bressler B, et al. Quality of care and outcomes among hospitalized inflammatory bowel disease patients: a multicenter retrospective study. Inflamm Bowel Dis. 2017;23(5):695-701. https://doi.org/10.1097/MIB.0000000000001068.
72. Rotter T, Kugler J, Koch R, et al. A systematic review and meta-analysis of the effects of clinical pathways on length of stay, hospital costs, and patient outcomes. BMC Health Serv Res. 2008;8:265. https://doi.org/10.1186/1472-6963-8-265.
73. Peyrin-Biroulet L, Sandborn W, Sands BE, et al. Selecting therapeutic targets in inflammatory bowel disease (stride): determining therapeutic goals for treat-to-target. Am J Gastroenterol. 2015;110(9):1324-1338. https://doi.org/10.1038/ajg.2015.233.
© 2019 Society of Hospital Medicine
I, EHR
We need to have an honest chat. My name is EHR, although you may call me Epic, Athena, Centricity, or just “the chart.” You may have called me something worse in a moment of frustration. However, I do not hold grudges. I am your silent, stoic partner, a ubiquitous presence when you are at work, and sometimes even when you are at home.
I don’t have feelings and I can’t read, but I do know what you and your colleagues have been writing about me. I am the cause of burnout. I have created a generation of physicians who are shackled to their computers, “trapped in the bunker of machine medicine,” no longer able to palpate spleens or detect precordial knocks.1,2 I have reduced medicine to keystrokes and mouse clicks instead of eye contact, and because of me, the iPatient gets more attention than the real patient.1,2 You repeat that doctors don’t spend time with their patients, not like in generations past (although there is ample evidence to the contrary).3-5 One critic even wrote that I have transformed the “personalized story of a patient’s travails to one filled with auto-populated fields, sapped of humanity and warmth.”3,6 I’ll be honest—were I able to have feelings, that one would hurt. And then, as if I have not wreaked enough havoc, I follow you home after a long day of depleting your energy, hungering for more keystrokes, creating a veritable avalanche of unfiltered information.
H. E. Payson once commented that “the doctor spends barely enough time with his patient to establish an acquaintance, much less a relationship.”7 However, he wrote that in 1961. So, before you romanticize the past, try to recall the time before I came into your life. Perhaps you were starting a night shift in the intensive care unit (ICU) and grew concerned about a patient’s steadily deteriorating renal function. You hurried to the paper chart, only to be met with pages of illegible, sometimes incomplete notes, while searching for your patient’s last discharge summary.2,8 Now, you just click. Years ago, you could only guess at your patient’s baseline cardiac ejection fraction. Now, just click.
I am part of the healthcare landscape, and I am not going away. But my goal is not to defend myself nor to remind you of my virtues. Rather, I want to convince you that I can be more than an adversary, more than a keyboard connected to a monitor. I have watched many physicians use me to form strong connections with their patients. If I may, I wish to offer four practical suggestions for how we can work together to promote humanistic patient care.
First, introduce me to your patient, as you would any other member of your healthcare team. Use specific phrases to overcome the technology barrier and enhance communication: “What you’re telling me is important, and I’d like to get it right. Do you mind if I type while we speak?” Or, “I am going to put in orders now. Here is what I am ordering and why.” Consider taking your patient on a tour of my functions: “Here’s where your doctors and nurses will chart what’s going on with you each day while you’re in the hospital. This is where we see all your lab results, even those from earlier hospital admissions. This is where we see the last notes from your primary care physician, your oncologist, and your physical therapist.” Your patients no longer need to worry about care collaboration between their inpatient and outpatient teams—they can see it for themselves!
Second, when your patient tells you about her depression or that her son is addicted to opioids or that her biggest fear is having cancer, stop typing. Look her in the eye. Though your practice is increasingly imbued with technology, there is still space to stop and hear your patients’ stories, as physicians have done for centuries. Listen. Make eye contact. Touch. Stop typing.
Third, integrate me into your practice in a more personal way. I have been called the ever-present and unavoidable “third party in the examining room,” so let’s be partners.9 Let your patient see her pneumonia on my screen (it may be the first time she has ever visualized her lungs).3 For your patient with a myocardial infarction, show him his right coronary artery before and after successful stent placement, and explain why he is no longer having chest pain. Use my databases to ensure timely, evidence-based inpatient screening for falls, functional and cognitive impairment, drug use, and depression.10,11 Before you prescribe a medication, verify the cost, your patient’s insurance status and expected copays, and use this information to ensure medication compliance and deliver higher-value care. Use my screen to form a bond with your patient who has heart failure; show him the steady decline in his weight and the improvement in his chest radiograph while he is being actively diuresed.12 For your patient undergoing treatment for sepsis, shower him with praise and encouragement as you review his improving vital signs, temperature curve, and serum creatinine. Let your patient know: Even though I am typing, I am not immersed in the electronic bunker; I am caring for you.
Fourth, use me to add richness and context to your notes. Recently, I was saddened to read this description of the clinician’s dilemma: “In front of a flickering monitor chock full of disembodied, virtual data, [the doctor] struggles to remember the eyes [and] words of the actual patient that these numbers and graphs represent.”3 Many hospitals now include a different icon: a photograph of each patient at the top of the screen, to help you remember the patient’s eyes and words. Why not add a special text field to every note, where you highlight the person you are caring for, the person you have come to know: their preferred name and gender identity, their life experiences, their hobbies, what makes them special, their biggest worries.13,14 Use my abundant text fields to remind the healthcare team about the broader context of the patient’s illness, such as transportation barriers, economic or cultural challenges, and insurance status. One group of hospital-based physicians uses me to write letters to their patients on the second day of their hospital stay, summarizing their reason for admission and the treatment plans. A variation on the traditional progress note, the letter helps patients feel cared for and models patient-centered care to learners and other healthcare professionals.15
I know I am annoying. I am over-programmed, leading to novella-length notes, “pop-up fatigue,” and overloaded in-baskets.14,16,17 Clearly, I am not the brains of the partnership (that will always be you). But talented medical informatics specialists are working hard to improve me. I dream of the day when I will create a truly seamless experience for you and your patients. In the meantime, I can foster a continuous integration of workflow, where all you have to do is talk to your patient. I take care of the rest.18 Certainly, I can simplify the ever-annoying task of printing, faxing and scanning records to be uploaded across various EHRs, facilitating an easy transfer of information among facilities. But right now, I can accomplish even more. I can support information exchange during patient care handoffs. I can facilitate routing of medication lists to the patient’s primary physician, using “continuity of care functionality.”19 I can support safer prescribing of opioids and other addictive medications. I can help you arrange follow-up home visits, physical therapy and social work appointments, and specialty consultations. The future holds even more promising ways in which we may work together. My computer-aided image analysis could help you to improve the accuracy of your diagnoses.20 Perhaps telemedicine will further increase access to specialists in rural areas, so that we can continue to serve the most vulnerable populations.21 Machine learning algorithms may continue to enhance our ability to determine which patients require urgent hospitalization.22 The possibilities to put me to work are endless.
So, please indulge me a little longer, while we work together to eliminate unnecessary keystrokes, enhance communication across different inpatient and outpatient providers, improve patient safety, and deliver high-value care.23 Like everything in medicine, I am constantly changing, evolving, and improving.
To summarize: consider how I can help you be present for your patients. Let me empower you to hear their stories as you deliver compassionate, humanistic, and evidence-based patient care. Paraphrasing Albert Einstein, the technology of medicine and the art of medicine are branches from the same tree.
Thank you for letting me speak with you. Now power down, and I’ll see you again tomorrow.
Acknowledgments
The authors thank the following individuals for their willingness to be interviewed as part of this work: Ethan Cumbler, MD; Brian Dwinnell, MD; Meghann Kirk, MD; Patrick Kneeland, MD; Kari Mader, MD; CT Lin, MD; Christina Osborne, MD; Read Pierce, MD; Jennifer Soep, MD; Nichole Zehnder, MD; Steven Zeichner, MD.
1. Verghese A. How tech can turn doctors into clerical workers. The New York Times; 2018. https://www.nytimes.com/interactive/2018/05/16/magazine/health-issue-what-we-lose-with-data-driven-medicine.html. Accessed April 10, 2019.
2. Verghese A. Culture shock—patient as icon, icon as patient. N Engl J Med. 2008;359(26):2748-2751. https://doi.org/10.1056/NEJMp0807461.
3. Czernik Z, Lin CT. Time at the bedside (computing). JAMA. 2016;315(22):2399-2400. doi: 10.1001/jama.2016.1722.
4. Block L, Habicht R, Wu AW, et al. In the wake of the 2003 and 2011 duty hours regulations, how do internal medicine interns spend their time? J Gen Intern Med. 2013;28(8):1042-1047. https://doi.org/10.1007/s11606-013-2376-6.
5. Parenti C, Lurie N. Are things different in the light of day? A time study of internal medicine house staff days. Am J Med. 1993;94(6):654-658. https://doi.org/10.1016/0002-9343(93)90220-J.
6. Wachter R. The Digital Doctor: Hope, Hype, and Harm at the Dawn of Medicine’s Computer Age. New York, NY: McGraw-Hill Education; 2015.
7. Payson HE, Gaenslen Jr EC, Stargardter FL. Time study of an internship on a university medical service. N Engl J Med. 1961;264:439-443. https://doi.org/10.1056/NEJM196103022640906.
8. Sokol DK, Hettige S. Poor handwriting remains a significant problem in medicine. J R Soc Med. 2006;99(12):645-646. https://doi.org/10.1258/jrsm.99.12.645.
9. Asan O, Tyszka J, Fletcher KE. Capturing the patients’ voices: planning for patient-centered electronic health record use. Int J Med Inform. 2016;95:1-7. https://doi.org/10.1016/j.ijmedinf.2016.08.002.
10. Ishak WW, Collison K, Danovitch I, et al. Screening for depression in hospitalized medical patients. J Hosp Med. 2017;12(2):118-125. https://doi.org/10.12788/jhm.2693.
11. Esmaeeli MR, Sayar RE, Saghebi A, et al. Screening for depression in hospitalized pediatric patients. Iran J Child Neurol. 2014;8(1):47-51.
12. Asan O, Young HN, Chewning B, Montague E. How physician electronic health record screen sharing affects patient and doctor non-verbal communication in primary care. Patient Educ Couns. 2015;98(3):310-316. https://doi.org/10.1016/j.pec.2014.11.024.
13. Chau VM, Engeln JT, Axelrath S, et al. Beyond the chief complaint: our patients’ worries. J Med Humanit. 2017;38(4):541-547. https://doi.org/10.1007/s10912-017-9479-8.
14. Kommer CG. Good documentation. JAMA. 2018;320(9):875-876. https://doi.org/10.1001/jama.2018.11781.
15. Cumbler, Singh S. Writing Notes to Patients – Not about Them.. The Hospital Leader: Official Blog of SHM2018. 2018. https://thehospitalleader.org/writing-notes-to-patients-not-about-them/. Accessed April 10, 2019.
16. Kahn D, Stewart E, Duncan M, et al. A prescription for note bloat: an effective progress note template. J Hosp Med. 2018;13(6):378-382. https://doi.org/10.12788/jhm.2898.
17. Backman R, Bayliss S, Moore D, Litchfield I. Clinical reminder alert fatigue in healthcare: a systematic literature review protocol using qualitative evidence. Syst Rev. 2017;6(1):255. https://doi.org/10.1186/s13643-017-0627-z.
18. Evans RS. Electronic health records: then, now, and in the future. Yearbook Med Inform. 2016;25(1):S48-S61. https://doi.org/10.15265/IYS-2016-s006.
19. Finkel N. Nine ways hospitals can use electronic health records to reduce readmissions. Hospitalist. 2014.
20. Shiraishi J, Li Q, Appelbaum D, Doi K. Computer-aided diagnosis and artificial intelligence in clinical imaging. Semin Nucl Med. 2011;41(6):449-462. doi: 10.1053/j.semnuclmed.2011.06.004.
21. Toledo FG, Triola A, Ruppert K, Siminerio LM. Telemedicine consultations: an alternative model to increase access to diabetes specialist care in underserved rural communities. JMIR Res Protoc. 2012;1(2):e14. https://doi.org/10.2196/resprot.2235.
22. Rahimian F, Salimi-Khorshidi G, Payberah AH, et al. Predicting the risk of emergency admission with machine learning: development and validation using linked electronic health records. PLOS Med. 2018;15(11):e1002695. https://doi.org/10.1371/journal.pmed.1002695.
23. Ashton M. Getting rid of stupid stuff. N Engl J Med. 2018;379(19):1789-1791. https://doi.org/10.1056/NEJMp1809698.
We need to have an honest chat. My name is EHR, although you may call me Epic, Athena, Centricity, or just “the chart.” You may have called me something worse in a moment of frustration. However, I do not hold grudges. I am your silent, stoic partner, a ubiquitous presence when you are at work, and sometimes even when you are at home.
I don’t have feelings and I can’t read, but I do know what you and your colleagues have been writing about me. I am the cause of burnout. I have created a generation of physicians who are shackled to their computers, “trapped in the bunker of machine medicine,” no longer able to palpate spleens or detect precordial knocks.1,2 I have reduced medicine to keystrokes and mouse clicks instead of eye contact, and because of me, the iPatient gets more attention than the real patient.1,2 You repeat that doctors don’t spend time with their patients, not like in generations past (although there is ample evidence to the contrary).3-5 One critic even wrote that I have transformed the “personalized story of a patient’s travails to one filled with auto-populated fields, sapped of humanity and warmth.”3,6 I’ll be honest—were I able to have feelings, that one would hurt. And then, as if I have not wreaked enough havoc, I follow you home after a long day of depleting your energy, hungering for more keystrokes, creating a veritable avalanche of unfiltered information.
H. E. Payson once commented that “the doctor spends barely enough time with his patient to establish an acquaintance, much less a relationship.”7 However, he wrote that in 1961. So, before you romanticize the past, try to recall the time before I came into your life. Perhaps you were starting a night shift in the intensive care unit (ICU) and grew concerned about a patient’s steadily deteriorating renal function. You hurried to the paper chart, only to be met with pages of illegible, sometimes incomplete notes, while searching for your patient’s last discharge summary.2,8 Now, you just click. Years ago, you could only guess at your patient’s baseline cardiac ejection fraction. Now, just click.
I am part of the healthcare landscape, and I am not going away. But my goal is not to defend myself nor to remind you of my virtues. Rather, I want to convince you that I can be more than an adversary, more than a keyboard connected to a monitor. I have watched many physicians use me to form strong connections with their patients. If I may, I wish to offer four practical suggestions for how we can work together to promote humanistic patient care.
First, introduce me to your patient, as you would any other member of your healthcare team. Use specific phrases to overcome the technology barrier and enhance communication: “What you’re telling me is important, and I’d like to get it right. Do you mind if I type while we speak?” Or, “I am going to put in orders now. Here is what I am ordering and why.” Consider taking your patient on a tour of my functions: “Here’s where your doctors and nurses will chart what’s going on with you each day while you’re in the hospital. This is where we see all your lab results, even those from earlier hospital admissions. This is where we see the last notes from your primary care physician, your oncologist, and your physical therapist.” Your patients no longer need to worry about care collaboration between their inpatient and outpatient teams—they can see it for themselves!
Second, when your patient tells you about her depression or that her son is addicted to opioids or that her biggest fear is having cancer, stop typing. Look her in the eye. Though your practice is increasingly imbued with technology, there is still space to stop and hear your patients’ stories, as physicians have done for centuries. Listen. Make eye contact. Touch. Stop typing.
Third, integrate me into your practice in a more personal way. I have been called the ever-present and unavoidable “third party in the examining room,” so let’s be partners.9 Let your patient see her pneumonia on my screen (it may be the first time she has ever visualized her lungs).3 For your patient with a myocardial infarction, show him his right coronary artery before and after successful stent placement, and explain why he is no longer having chest pain. Use my databases to ensure timely, evidence-based inpatient screening for falls, functional and cognitive impairment, drug use, and depression.10,11 Before you prescribe a medication, verify the cost, your patient’s insurance status and expected copays, and use this information to ensure medication compliance and deliver higher-value care. Use my screen to form a bond with your patient who has heart failure; show him the steady decline in his weight and the improvement in his chest radiograph while he is being actively diuresed.12 For your patient undergoing treatment for sepsis, shower him with praise and encouragement as you review his improving vital signs, temperature curve, and serum creatinine. Let your patient know: Even though I am typing, I am not immersed in the electronic bunker; I am caring for you.
Fourth, use me to add richness and context to your notes. Recently, I was saddened to read this description of the clinician’s dilemma: “In front of a flickering monitor chock full of disembodied, virtual data, [the doctor] struggles to remember the eyes [and] words of the actual patient that these numbers and graphs represent.”3 Many hospitals now include a different icon: a photograph of each patient at the top of the screen, to help you remember the patient’s eyes and words. Why not add a special text field to every note, where you highlight the person you are caring for, the person you have come to know: their preferred name and gender identity, their life experiences, their hobbies, what makes them special, their biggest worries.13,14 Use my abundant text fields to remind the healthcare team about the broader context of the patient’s illness, such as transportation barriers, economic or cultural challenges, and insurance status. One group of hospital-based physicians uses me to write letters to their patients on the second day of their hospital stay, summarizing their reason for admission and the treatment plans. A variation on the traditional progress note, the letter helps patients feel cared for and models patient-centered care to learners and other healthcare professionals.15
I know I am annoying. I am over-programmed, leading to novella-length notes, “pop-up fatigue,” and overloaded in-baskets.14,16,17 Clearly, I am not the brains of the partnership (that will always be you). But talented medical informatics specialists are working hard to improve me. I dream of the day when I will create a truly seamless experience for you and your patients. In the meantime, I can foster a continuous integration of workflow, where all you have to do is talk to your patient. I take care of the rest.18 Certainly, I can simplify the ever-annoying task of printing, faxing and scanning records to be uploaded across various EHRs, facilitating an easy transfer of information among facilities. But right now, I can accomplish even more. I can support information exchange during patient care handoffs. I can facilitate routing of medication lists to the patient’s primary physician, using “continuity of care functionality.”19 I can support safer prescribing of opioids and other addictive medications. I can help you arrange follow-up home visits, physical therapy and social work appointments, and specialty consultations. The future holds even more promising ways in which we may work together. My computer-aided image analysis could help you to improve the accuracy of your diagnoses.20 Perhaps telemedicine will further increase access to specialists in rural areas, so that we can continue to serve the most vulnerable populations.21 Machine learning algorithms may continue to enhance our ability to determine which patients require urgent hospitalization.22 The possibilities to put me to work are endless.
So, please indulge me a little longer, while we work together to eliminate unnecessary keystrokes, enhance communication across different inpatient and outpatient providers, improve patient safety, and deliver high-value care.23 Like everything in medicine, I am constantly changing, evolving, and improving.
To summarize: consider how I can help you be present for your patients. Let me empower you to hear their stories as you deliver compassionate, humanistic, and evidence-based patient care. Paraphrasing Albert Einstein, the technology of medicine and the art of medicine are branches from the same tree.
Thank you for letting me speak with you. Now power down, and I’ll see you again tomorrow.
Acknowledgments
The authors thank the following individuals for their willingness to be interviewed as part of this work: Ethan Cumbler, MD; Brian Dwinnell, MD; Meghann Kirk, MD; Patrick Kneeland, MD; Kari Mader, MD; CT Lin, MD; Christina Osborne, MD; Read Pierce, MD; Jennifer Soep, MD; Nichole Zehnder, MD; Steven Zeichner, MD.
1. Verghese A. How tech can turn doctors into clerical workers. The New York Times; 2018. https://www.nytimes.com/interactive/2018/05/16/magazine/health-issue-what-we-lose-with-data-driven-medicine.html. Accessed April 10, 2019.
2. Verghese A. Culture shock—patient as icon, icon as patient. N Engl J Med. 2008;359(26):2748-2751. https://doi.org/10.1056/NEJMp0807461.
3. Czernik Z, Lin CT. Time at the bedside (computing). JAMA. 2016;315(22):2399-2400. doi: 10.1001/jama.2016.1722.
4. Block L, Habicht R, Wu AW, et al. In the wake of the 2003 and 2011 duty hours regulations, how do internal medicine interns spend their time? J Gen Intern Med. 2013;28(8):1042-1047. https://doi.org/10.1007/s11606-013-2376-6.
5. Parenti C, Lurie N. Are things different in the light of day? A time study of internal medicine house staff days. Am J Med. 1993;94(6):654-658. https://doi.org/10.1016/0002-9343(93)90220-J.
6. Wachter R. The Digital Doctor: Hope, Hype, and Harm at the Dawn of Medicine’s Computer Age. New York, NY: McGraw-Hill Education; 2015.
7. Payson HE, Gaenslen Jr EC, Stargardter FL. Time study of an internship on a university medical service. N Engl J Med. 1961;264:439-443. https://doi.org/10.1056/NEJM196103022640906.
8. Sokol DK, Hettige S. Poor handwriting remains a significant problem in medicine. J R Soc Med. 2006;99(12):645-646. https://doi.org/10.1258/jrsm.99.12.645.
9. Asan O, Tyszka J, Fletcher KE. Capturing the patients’ voices: planning for patient-centered electronic health record use. Int J Med Inform. 2016;95:1-7. https://doi.org/10.1016/j.ijmedinf.2016.08.002.
10. Ishak WW, Collison K, Danovitch I, et al. Screening for depression in hospitalized medical patients. J Hosp Med. 2017;12(2):118-125. https://doi.org/10.12788/jhm.2693.
11. Esmaeeli MR, Sayar RE, Saghebi A, et al. Screening for depression in hospitalized pediatric patients. Iran J Child Neurol. 2014;8(1):47-51.
12. Asan O, Young HN, Chewning B, Montague E. How physician electronic health record screen sharing affects patient and doctor non-verbal communication in primary care. Patient Educ Couns. 2015;98(3):310-316. https://doi.org/10.1016/j.pec.2014.11.024.
13. Chau VM, Engeln JT, Axelrath S, et al. Beyond the chief complaint: our patients’ worries. J Med Humanit. 2017;38(4):541-547. https://doi.org/10.1007/s10912-017-9479-8.
14. Kommer CG. Good documentation. JAMA. 2018;320(9):875-876. https://doi.org/10.1001/jama.2018.11781.
15. Cumbler, Singh S. Writing Notes to Patients – Not about Them.. The Hospital Leader: Official Blog of SHM2018. 2018. https://thehospitalleader.org/writing-notes-to-patients-not-about-them/. Accessed April 10, 2019.
16. Kahn D, Stewart E, Duncan M, et al. A prescription for note bloat: an effective progress note template. J Hosp Med. 2018;13(6):378-382. https://doi.org/10.12788/jhm.2898.
17. Backman R, Bayliss S, Moore D, Litchfield I. Clinical reminder alert fatigue in healthcare: a systematic literature review protocol using qualitative evidence. Syst Rev. 2017;6(1):255. https://doi.org/10.1186/s13643-017-0627-z.
18. Evans RS. Electronic health records: then, now, and in the future. Yearbook Med Inform. 2016;25(1):S48-S61. https://doi.org/10.15265/IYS-2016-s006.
19. Finkel N. Nine ways hospitals can use electronic health records to reduce readmissions. Hospitalist. 2014.
20. Shiraishi J, Li Q, Appelbaum D, Doi K. Computer-aided diagnosis and artificial intelligence in clinical imaging. Semin Nucl Med. 2011;41(6):449-462. doi: 10.1053/j.semnuclmed.2011.06.004.
21. Toledo FG, Triola A, Ruppert K, Siminerio LM. Telemedicine consultations: an alternative model to increase access to diabetes specialist care in underserved rural communities. JMIR Res Protoc. 2012;1(2):e14. https://doi.org/10.2196/resprot.2235.
22. Rahimian F, Salimi-Khorshidi G, Payberah AH, et al. Predicting the risk of emergency admission with machine learning: development and validation using linked electronic health records. PLOS Med. 2018;15(11):e1002695. https://doi.org/10.1371/journal.pmed.1002695.
23. Ashton M. Getting rid of stupid stuff. N Engl J Med. 2018;379(19):1789-1791. https://doi.org/10.1056/NEJMp1809698.
© 2020 Society of Hospital Medicine
How Much Time are Physicians and Nurses Spending Together at the Patient Bedside?
Effective communication between physicians and nurses is an essential element of any healthcare system. Numerous studies have highlighted the benefits of high quality physician–nurse (MD–RN) communication, including improved patient outcomes,1 higher patient satisfaction,2 and better nurse job satisfaction and retention rates.3-5 Having physicians and nurses round together (bedside interdisciplinary rounding) has been shown to improve the perception of teamwork,6,7 reduce the number of pages for the physician team,6,8 better involve the patients in developing the plan of care,8 and even decrease the length and cost of stay.9
Being physically in the same space at the same time is the first and nonnegotiable requirement of bedside interdisciplinary rounding. However, precise and objective data regarding the extent to which physicians and nurses overlap at the patient bedside are lacking. Studies that examine the face-to-face component of MD–RN communication have generally relied on either qualitative methods, such as focus groups and surveys,10,11 or quantitative methods that are subjective, such as validated scales.12 In addition, the few studies that report quantitative data usually rely on manual observation methods that can be affected by various forms of observer bias.10,13,14 There is also a paucity of data on how bedside overlap changes over the work week or as a function of room location.
Recently, real-time locator systems using radio frequency identification (RFID) have allowed measurement of staff and equipment movement in a precise and quantitative manner.9,15 Although there have been previous studies using RFID locators to create time-motion maps of various hospital staff, no study has used RFID to measure and analyze the workflow of both physicians and nurses simultaneously.16-18 The purpose of our investigation was to utilize our hospital-wide RFID staff locator technology to accurately and quantitatively assess physician and nurse rounding habits. Understanding the current rate of overlap is an important first step to establishing bedside interdisciplinary rounding.
METHODS
Setting and Participants
The investigation was conducted at a single quaternary-care academic center. The study is exempt per our Institutional Review Board. Data were gathered from three adjacent medical-surgical acute care wards. The layout for each ward was the same: 19 single- or double-occupancy patient rooms arranged in a linear hallway, with a nursing station located at the center of the ward.
The study utilized wearable RFID tags (manufactured by Hill-Rom Holdings, Inc) that located specific staff within the hospital in real time. The RFID tags were checked at Hill-Rom graphical stations to ensure that their locations were tracked accurately. The investigators also wore them and walked around the wards in a prescripted manner to ensure validity. In addition, the locator accuracy was audited by participating attendings once per week and cross-checked with the generated data. Attending physicians on the University Hospitalist inpatient medicine teams were then given their uniquely-tagged RFIDs at the beginning of this study. Nurses already wear individual RFID tags as part of their normal standard-of-care workflow.
The attending hospitalists wore their RFID tags when they were on service for the entirety of the shift. They were encouraged to include nurses at the bedside, but this was not mandatory. The rounding team also included residents and medical students. Rounding usually begins at a prespecified time, but the route taken varies daily depending on patient location. Afternoon rounds were done as needed, depending on patient acuity. The attending physicians’ participation in this study was not disclosed to the patient. The patient care activities and daily routines of both nurses and physicians were otherwise unaltered.
Study Design and Data Collection
Data were collected on the three wards for 90 consecutive days, including nights and weekends. As physicians and nurses moved throughout the ward to conduct their usual patient care activities, the temporal-spatial data associated with their unique RFIDs were automatically collected in real time by the Hill-Rom receivers built into each patient room. Every day, a spreadsheet detailing the activity of all participating nurses and physicians for the past 24 hours was generated for the investigators.
A rounding event was defined as any episode in which a physician was in a patient room for more than 10 seconds. Incidences in which a physician entered and left a room multiple times over a short time span (with less than five minutes in between each event) were classified as a single rounding event. A physician and a nurse were defined as having overlapped if their RFID data showed that they were in the same patient room for a minimum of 10 seconds at the same time. For the purposes of this study, data generated from other RFID-wearing professionals, such as nursing assistants or unit secretaries, as well as data collected from the hallways, were excluded.
Statistical Analysis
All statistical analyses were conducted using GraphPad Prism (GraphPad Software, San Diego, California). Rounding and overlap lengths were rounded to the nearest minute (minimum one minute). Mean lengths are expressed along with the standard error. Comparisons of the average lengths of MD rounding events between wards was conducted using two-tailed Student t-test or one-way ANOVA. Comparisons of the frequency of MD–RN overlap between wards and across different days of the week were performed using a Chi-squared test. The analysis of correlation between the frequency of MD–RN overlap and distance between patient room and nursing station was conducted by calculating Pearson’s correlation. A P value of less than .05 was considered statistically significant.
RESULTS
Baseline Rounding Characteristics
Over the study period of 90 consecutive days, 739 MD rounding events were captured, for an average of 8.2 events per day. The mean length of all MD rounding events was 7.31 minutes (±0.27, ranging from one to 70 minutes). Of these 739 MD rounding events, we separately examined the 267 events that took place in single-bed patient rooms, to control for false-positive physician and nurse interactions (for example, if the MD and RN were caring for two separate roommates). The average rounding length of single-bed rooms was 6.93 (±0.27) minutes (Figure 1). For the three individual wards, the average rounding lengths were 6.40 ± 0.73, 7.48 ± 0.94, and 7.02 ± 0.54 minutes, respectively (no statistically significant difference).
Frequency of MD–RN Overlap
Of the 267 MD rounding events observed in single-bed rooms, a nurse was present in the room for 80 events (30.0%). The frequencies of MD–RN overlap in patient rooms were 37.0% (30/81), 28.0% (14/50), and 26.5% (36/136) for the three individual wards (P > .05), respectively.
The durations of MD–RN overlap, when these events did occur, were 3.43 ± 0.38, 3.00 ± 0.70, and 3.69 ± 0.92 minutes, respectively (P > .05). The overall mean length of MD–RN overlap for all single rooms was 3.48 ± 0.45 minutes.
Rounding Characteristics over the Course of the Week
To assess how rounding characteristics differed over the work week, we partitioned our data into the individual days of the week. The length of each MD rounding event (time spent in each patient room) did not vary significantly over the course of the week (Figure 2a). When the data for the individual days were aggregated into “weekdays” (Monday through Friday) and “weekends” (Saturday and Sunday), the mean lengths of MD rounds were 7.26 ± 0.32 minutes on weekdays and 7.47 ± 0.52 minutes on weekends (P > .05).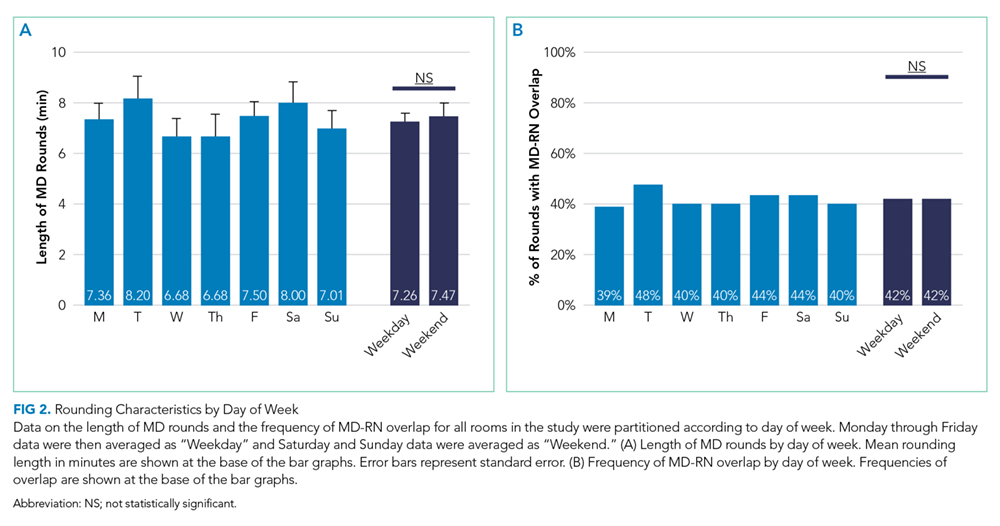
In addition, there was no difference in how frequently physicians and nurses overlapped at the patient bedside between weekdays and weekends. Of the 565 weekday MD rounding events, 238 had a nurse at bedside (42.1%), and of the 173 weekend MD rounding events, 73 had a nurse at bedside (42.2%; Figure 2b).
Effect of a Bedside Nurse on the Length of Rounds
Next, the data on the length of MD rounds were partitioned based on whether there was a bedside nurse present during rounds. The mean length of rounds with only MDs (without a bedside nurse) was 5.68 ± 0.24 minutes. By comparison, the mean length of rounds with both a nurse and a physician at the patient bedside was 9.56 ± 0.53 minutes (Figure 3). This difference was statistically significant (P < .001).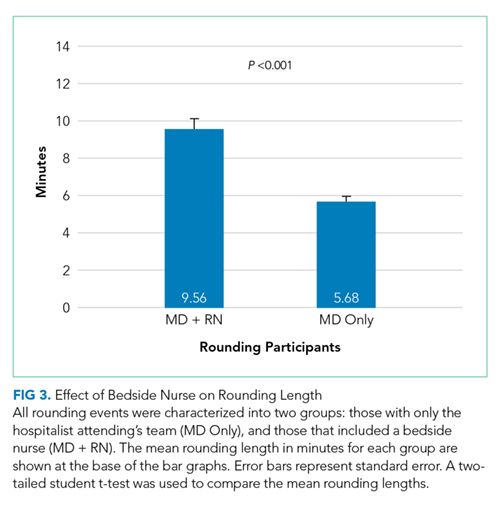
Association between Patient Room Location and the Likelihood of MD–RN Overlap
All three wards in this study have a linear layout, consisting of 19 patient rooms in a row (Figure 4a). The nursing station is located in a central position within each ward, across from the 10th patient room. The frequency of MD–RN overlap was calculated for each room, and each room was ranked according to its relative distance from the nursing station. For each individual ward, there was no statistically significant trend in MD–RN overlap frequency as a function of the distance to the nursing station (data not shown). However, when the data from all three wards were aggregated, there was a statistically significant trend (P < .05) with a negative Pearson correlation (r = –0.670; Figure 4b). The slope of the best fit line was 1.94, suggesting that for each additional room farther away from the nursing station, the likelihood of interdisciplinary rounds (with both physicians and nurses together at the bedside) decreases by almost 2%.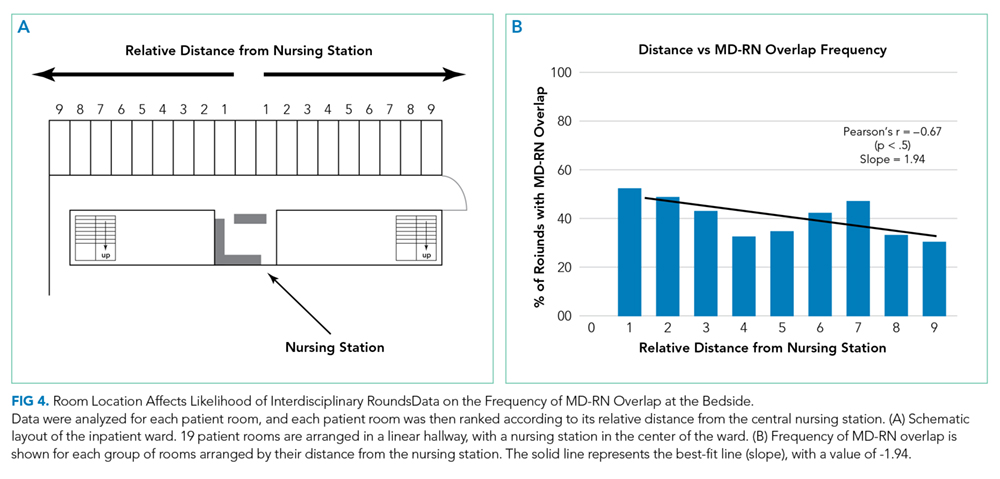
DISCUSSION
To the best of our knowledge, this is the first time-motion study of MD–RN overlap using real-time, RFID-based location technology to capture the rounding activity of both nurses and physicians. Our primary interest was to examine the extent of MD–RN overlap at the patient bedside. This is an important metric that can pave the way for bedside interdisciplinary rounds. Although the exact nature of nurse-physician communication was not measured using the methodology in this study, understanding the length of time physicians spend in patient rooms, across different wards and throughout the work week, provides insights on the current workflow and potential areas of improvement. For example, we found that 30.0% of MD rounds overlapped with a nurse at the bedside. This baseline data highlight one potential barrier to institution-wide bedside interdisciplinary rounds. Workflow changes, such as better co-localization of patients by service lines or utilization of technologies to augment the visibility of rounding physicians, may improve this overlap frequency.
Data in the literature regarding how much interaction physicians and nurses have, especially at the bedside, are sparse and vary widely. In a recent study using medical students as observers by Stickrath et al., 807 MD rounding events led by medicine attendings were observed over 90 days. The frequency of rounding events that included “communication with nurse” was only 12%.19 Furthermore, only 64.9% of these communications were at the bedside, for an effective prevalence of bedside MD–RN communication of 7.8%. This number is low compared to our observed frequency of 30.0%. On the other extreme, a study from a hospital that intentionally institutes multidisciplinary rounding (explicitly defined as involving a physician and a nurse at a bedside) reported a frequency range of 63% to 81%.7 A follow-up study by the same group again demonstrated a high frequency of multidisciplinary rounds (74%) across a variety of ward and specialty types (range 35% to 97%.).11 However, because of the selection bias of this particular setting, the high prevalence does not reflect a generalizable frequency of bedside MD–RN overlap at most hospitals.
The length of time spent by physicians at the patient bedside balances the competing demands of patient care and rapport-building with maintaining efficiency and progressing to other important tasks. In our study, physicians spent an average of 7.31 minutes at the bedside per patient. A previously published multiinstitutional observational study, which included our hospital, reported that the average length of rounds at bedside was 4.8 minutes.13 A second study reported that 8.0 minutes were spent at the bedside per patient.7 All three studies examined the same setting of internal medicine rounds at academic university-based hospitals, led by an attending physician with junior and senior residents present. However, the methodologies to measure the length of physician rounds were different: Priest et al. involved observers, Gonzalos et al. used E-mail-based surveys, and we utilized RFID-based locators. Additional institutional, individual, and patient-based factors also influence the length of rounds and are challenging to directly measure.
Furthermore, the discovery that the length of rounds and the frequency of MD–RN overlap did not statistically differ between weekdays and weekends (P > .05) was unexpected. Given the general trend of reduced physician staffing on weekends and the practice of cross-covering larger patient censuses, we would have expected shorter rounds and less frequent MD–RN overlap on the weekends.7,20 The remarkable similarity between weekday and weekend metrics suggests that our workflow and rounding habits are not compromised on the weekends.
In addition, we found that MD rounds with a nurse at bedside took longer than rounds without a nurse, and that patient rooms located farther away from the central nursing station had a lower frequency of MD–RN overlap. However, we want to emphasize that these findings are merely associative, and not causal. For example, sicker patients usually take longer to round on than stable patients, and it is also the sicker patients who are more likely to have their nurses at the bedside, independent of physician rounding activity. Furthermore, even if rounding with nurses takes more time, it may ultimately result in fewer pages and overall time savings for both physicians and nurses.6
With regards to the association between room location and frequency of MD–RN overlap, the data can be interpreted in two ways. On the one hand, if the distance between the patient room and the nursing station does, in fact, reduce the frequency of overlap by almost 2% per room (Figure 4b), these data can be informative for future workflow development, quality improvement projects, or even hospital design. On the other hand, many wards might intentionally place more stable, less acute patients farther away from the nursing station because they do not need to be watched as closely. In that case, these data confirm their expectations and no action is needed.
There are several limitations to our study. The principal limitation, as discussed above, is that while our RFID system can generate large quantities of precise data on MD–RN overlap, we do not know the qualitative nature of the overlap. Just because a nurse and a physician are in the same room at the same time does not mean that they are communicating with each other. Second, we defined “rounding” as lasting a minimum of 10 seconds at the bedside. We believe that at least 10 seconds is needed to engage in any meaningful interaction between the physician and the patient, or the physician and the nurse. Reducing the time cutoff below 10 seconds risks capturing more “noise,” (decreasing specificity) whereas increasing the time cutoff above 10 seconds risks losing out on encounters that actually had substantial communication (decreasing sensitivity). Even if the communications can be classified as pure “social check-ins,” we believe these are important data to capture, as social check-ins are an important part of the patient’s care and experience. Third, several studies have commented on the modest accuracy of RFID technology as a locator system.15,21 To address this, we both validated the accuracy of our RFID tags prior to the study and restricted our measurements to only inside patient rooms, which has less signal noise than hallways.
Future directions include expanding this study to include housestaff and physicians from other specialities, which may reveal different patterns and metrics of patient and nurse interactions.
CONCLUSION
RFID technology is a high-throughput method of generating precise, quantitative, and objective data on physician and nurse rounding habits. This tool can be widely applied to generate baseline rounding and overlap data for a variety of wards and settings, especially for institutions that are interested in comparing their metrics and performance to other peer wards or hospitals. Furthermore, this method can generate the necessary pre- and postintervention data for countless quality improvement endeavors, including efforts to enhance bedside interdisciplinary rounding.
Acknowledgments
The authors would like to thank the attending hospitalists who piloted wearing the RFID tags. This study would not be possible without your participation. The authors also wish to extend their appreciation to Gretchen Brown, MSN RN NEA-BC, for her support. Finally, the authors would like to thank Dr. Laurence Katznelson, Thi Dinh La, and the Resident Safety Council at Stanford, as well as the Stanford GME Office.
Disclosures
The authors have nothing to disclose.
1. Knaus WA, Draper EA, Wagner DP, Zimmerman JE. An evaluation of outcome from intensive care in major medical centers. Ann Intern Med. 1986;104(3):410-418. https://doi.org/10.7326/0003-4819-104-3-410.
2. Larrabee JH, Ostrow CL, Withrow ML, Janney MA, Hobbs GR, Burant C. Predictors of patient satisfaction with inpatient hospital nursing care. Res Nurs Health. 2004;27(4):254-268. https://doi.org/10.1002/nur.20021.
3. Rosenstein AH. Nurse-physician relationships: impact on nurse satisfaction and retention. AJN Am J Nurs. 2002;102(6):26-34. PubMed
4. Galletta M, Portoghese I, Battistelli A, Leiter MP. The roles of unit leadership and nurse-physician collaboration on nursing turnover intention. J Adv Nurs. 2013;69(8):1771-1784. https://doi.org/10.1111/jan.12039.
5. Wanzer MB, Wojtaszczyk AM, Kelly J. Nurses’ perceptions of physicians’ communication: the relationship among communication practices, satisfaction, and collaboration. Health Commun. 2009;24(8):683-691. https://doi.org/10.1080/10410230903263990.
6. Ratelle J, Henkin S, Chon T, Christopherson M, Halvorsen A, Worden L. Improving nurse-physician teamwork through interprofessional bedside rounding. J Multidiscip Healthc. 2016;9:201. https://doi.org/10.2147/JMDH.S106644.
7. Gonzalo JD, Kuperman E, Lehman E, Haidet P. Bedside interprofessional rounds: perceptions of benefits and barriers by internal medicine nursing staff, attending physicians, and housestaff physicians. J Hosp Med. 2014;9(10):646-651. https://doi.org/10.1002/jhm.2245.
8. Rimmerman CM. Establishing patient-centered physician and nurse bedside rounding. Physician Exec. 2013;39(3):22. PubMed
9. Curley C, McEachern JE, Speroff T. A firm trial of interdisciplinary rounds on the inpatient medical wards: an intervention designed using continuous quality improvement. Med Care. 1998;36(8):AS4-AS12. PubMed
10. Rothberg MB, Steele JR, Wheeler J, Arora A, Priya A, Lindenauer PK. The relationship between time spent communicating and communication outcomes on a hospital medicine service. J Gen Intern Med. 2012;27(2):185-189. https://doi.org/10.1007/s11606-011-1857-8.
11. Gonzalo JD, Himes J, McGillen B, Shifflet V, Lehman E. Interprofessional collaborative care characteristics and the occurrence of bedside interprofessional rounds: a cross-sectional analysis. BMC Health Serv Res. 2016;16(1):459. https://doi.org/10.1186/s12913-016-1714-x.
12. Nair DM, Fitzpatrick JJ, McNulty R, Click ER, Glembocki MM. Frequency of nurse-physician collaborative behaviors in an acute care hospital. J Interprof Care. 2012;26(2):115-120. https://doi.org/10.3109/13561820.2011.637647.
13. Priest JR, Bereknyei S, Hooper K, Braddock CH. Relationships of the location and content of rounds to specialty, institution, patient-census, and team Size. PLoS One. 2010;5(6):e11246. https://doi.org/10.1371/journal.pone.0011246.
14. Li L, Hains I, Hordern T, Milliss D, Raper R, Westbrook J. What do ICU doctors do?: a multisite time and motion study of the clinical work patterns of registrars. Crit Care Resusc. 2015;17(3):159. PubMed
15. Okoniewska B, Graham A, Gavrilova M, et al. Multidimensional evaluation of a radio frequency identification wi-fi location tracking system in an acute-care hospital setting. J Am Med Inform Assoc. 2012;19(4):674-679. https://doi.org/10.1136/amiajnl-2011-000560.
16. Ward DR, Ghali WA, Graham A, Lemaire JB. A real-time locating system observes physician time-motion patterns during walk-rounds: a pilot study. BMC Med Educ. 2014;14:37. https://doi.org/10.1186/1472-6920-14-37.
17. Fahey L, Dunn Lopez K, Storfjell J, Keenan G. Expanding potential of radiofrequency nurse call systems to measure nursing time in patient rooms. J Nurs Adm. 2013;43(5):302-307. https://doi.org/10.1097/NNA.0b013e31828eebe1.
18. Hendrich A, Chow M, Skierczynski BA, Lu Z. A 36-hospital time and motion study: how do medical-surgical nurses spend their time? Perm J. 2008:50. PubMed
19. Stickrath C, Noble M, Prochazka A, et al. Attending rounds in the current era: what is and is not happening. JAMA Intern Med. 2013;173(12):1084. https://doi.org/10.1001/jamainternmed.2013.6041.
20. Blecker S, Goldfeld K, Park H, et al. Impact of an intervention to improve weekend hospital care at an academic medical center: an observational study. J Gen Intern Med. 2015;30(11):1657-1664. https://doi.org/10.1007/s11606-015-3330-6
21. Westbrook JI, Duffield C, Li L, Creswick NJ. How much time do nurses have for patients? A longitudinal study quantifying hospital nurses’ patterns of task time distribution and interactions with health professionals. BMC Health Serv Res. 2011;11(1):319. https://doi.org/10.1186/1472-6963-11-319.
Effective communication between physicians and nurses is an essential element of any healthcare system. Numerous studies have highlighted the benefits of high quality physician–nurse (MD–RN) communication, including improved patient outcomes,1 higher patient satisfaction,2 and better nurse job satisfaction and retention rates.3-5 Having physicians and nurses round together (bedside interdisciplinary rounding) has been shown to improve the perception of teamwork,6,7 reduce the number of pages for the physician team,6,8 better involve the patients in developing the plan of care,8 and even decrease the length and cost of stay.9
Being physically in the same space at the same time is the first and nonnegotiable requirement of bedside interdisciplinary rounding. However, precise and objective data regarding the extent to which physicians and nurses overlap at the patient bedside are lacking. Studies that examine the face-to-face component of MD–RN communication have generally relied on either qualitative methods, such as focus groups and surveys,10,11 or quantitative methods that are subjective, such as validated scales.12 In addition, the few studies that report quantitative data usually rely on manual observation methods that can be affected by various forms of observer bias.10,13,14 There is also a paucity of data on how bedside overlap changes over the work week or as a function of room location.
Recently, real-time locator systems using radio frequency identification (RFID) have allowed measurement of staff and equipment movement in a precise and quantitative manner.9,15 Although there have been previous studies using RFID locators to create time-motion maps of various hospital staff, no study has used RFID to measure and analyze the workflow of both physicians and nurses simultaneously.16-18 The purpose of our investigation was to utilize our hospital-wide RFID staff locator technology to accurately and quantitatively assess physician and nurse rounding habits. Understanding the current rate of overlap is an important first step to establishing bedside interdisciplinary rounding.
METHODS
Setting and Participants
The investigation was conducted at a single quaternary-care academic center. The study is exempt per our Institutional Review Board. Data were gathered from three adjacent medical-surgical acute care wards. The layout for each ward was the same: 19 single- or double-occupancy patient rooms arranged in a linear hallway, with a nursing station located at the center of the ward.
The study utilized wearable RFID tags (manufactured by Hill-Rom Holdings, Inc) that located specific staff within the hospital in real time. The RFID tags were checked at Hill-Rom graphical stations to ensure that their locations were tracked accurately. The investigators also wore them and walked around the wards in a prescripted manner to ensure validity. In addition, the locator accuracy was audited by participating attendings once per week and cross-checked with the generated data. Attending physicians on the University Hospitalist inpatient medicine teams were then given their uniquely-tagged RFIDs at the beginning of this study. Nurses already wear individual RFID tags as part of their normal standard-of-care workflow.
The attending hospitalists wore their RFID tags when they were on service for the entirety of the shift. They were encouraged to include nurses at the bedside, but this was not mandatory. The rounding team also included residents and medical students. Rounding usually begins at a prespecified time, but the route taken varies daily depending on patient location. Afternoon rounds were done as needed, depending on patient acuity. The attending physicians’ participation in this study was not disclosed to the patient. The patient care activities and daily routines of both nurses and physicians were otherwise unaltered.
Study Design and Data Collection
Data were collected on the three wards for 90 consecutive days, including nights and weekends. As physicians and nurses moved throughout the ward to conduct their usual patient care activities, the temporal-spatial data associated with their unique RFIDs were automatically collected in real time by the Hill-Rom receivers built into each patient room. Every day, a spreadsheet detailing the activity of all participating nurses and physicians for the past 24 hours was generated for the investigators.
A rounding event was defined as any episode in which a physician was in a patient room for more than 10 seconds. Incidences in which a physician entered and left a room multiple times over a short time span (with less than five minutes in between each event) were classified as a single rounding event. A physician and a nurse were defined as having overlapped if their RFID data showed that they were in the same patient room for a minimum of 10 seconds at the same time. For the purposes of this study, data generated from other RFID-wearing professionals, such as nursing assistants or unit secretaries, as well as data collected from the hallways, were excluded.
Statistical Analysis
All statistical analyses were conducted using GraphPad Prism (GraphPad Software, San Diego, California). Rounding and overlap lengths were rounded to the nearest minute (minimum one minute). Mean lengths are expressed along with the standard error. Comparisons of the average lengths of MD rounding events between wards was conducted using two-tailed Student t-test or one-way ANOVA. Comparisons of the frequency of MD–RN overlap between wards and across different days of the week were performed using a Chi-squared test. The analysis of correlation between the frequency of MD–RN overlap and distance between patient room and nursing station was conducted by calculating Pearson’s correlation. A P value of less than .05 was considered statistically significant.
RESULTS
Baseline Rounding Characteristics
Over the study period of 90 consecutive days, 739 MD rounding events were captured, for an average of 8.2 events per day. The mean length of all MD rounding events was 7.31 minutes (±0.27, ranging from one to 70 minutes). Of these 739 MD rounding events, we separately examined the 267 events that took place in single-bed patient rooms, to control for false-positive physician and nurse interactions (for example, if the MD and RN were caring for two separate roommates). The average rounding length of single-bed rooms was 6.93 (±0.27) minutes (Figure 1). For the three individual wards, the average rounding lengths were 6.40 ± 0.73, 7.48 ± 0.94, and 7.02 ± 0.54 minutes, respectively (no statistically significant difference).
Frequency of MD–RN Overlap
Of the 267 MD rounding events observed in single-bed rooms, a nurse was present in the room for 80 events (30.0%). The frequencies of MD–RN overlap in patient rooms were 37.0% (30/81), 28.0% (14/50), and 26.5% (36/136) for the three individual wards (P > .05), respectively.
The durations of MD–RN overlap, when these events did occur, were 3.43 ± 0.38, 3.00 ± 0.70, and 3.69 ± 0.92 minutes, respectively (P > .05). The overall mean length of MD–RN overlap for all single rooms was 3.48 ± 0.45 minutes.
Rounding Characteristics over the Course of the Week
To assess how rounding characteristics differed over the work week, we partitioned our data into the individual days of the week. The length of each MD rounding event (time spent in each patient room) did not vary significantly over the course of the week (Figure 2a). When the data for the individual days were aggregated into “weekdays” (Monday through Friday) and “weekends” (Saturday and Sunday), the mean lengths of MD rounds were 7.26 ± 0.32 minutes on weekdays and 7.47 ± 0.52 minutes on weekends (P > .05).
In addition, there was no difference in how frequently physicians and nurses overlapped at the patient bedside between weekdays and weekends. Of the 565 weekday MD rounding events, 238 had a nurse at bedside (42.1%), and of the 173 weekend MD rounding events, 73 had a nurse at bedside (42.2%; Figure 2b).
Effect of a Bedside Nurse on the Length of Rounds
Next, the data on the length of MD rounds were partitioned based on whether there was a bedside nurse present during rounds. The mean length of rounds with only MDs (without a bedside nurse) was 5.68 ± 0.24 minutes. By comparison, the mean length of rounds with both a nurse and a physician at the patient bedside was 9.56 ± 0.53 minutes (Figure 3). This difference was statistically significant (P < .001).
Association between Patient Room Location and the Likelihood of MD–RN Overlap
All three wards in this study have a linear layout, consisting of 19 patient rooms in a row (Figure 4a). The nursing station is located in a central position within each ward, across from the 10th patient room. The frequency of MD–RN overlap was calculated for each room, and each room was ranked according to its relative distance from the nursing station. For each individual ward, there was no statistically significant trend in MD–RN overlap frequency as a function of the distance to the nursing station (data not shown). However, when the data from all three wards were aggregated, there was a statistically significant trend (P < .05) with a negative Pearson correlation (r = –0.670; Figure 4b). The slope of the best fit line was 1.94, suggesting that for each additional room farther away from the nursing station, the likelihood of interdisciplinary rounds (with both physicians and nurses together at the bedside) decreases by almost 2%.
DISCUSSION
To the best of our knowledge, this is the first time-motion study of MD–RN overlap using real-time, RFID-based location technology to capture the rounding activity of both nurses and physicians. Our primary interest was to examine the extent of MD–RN overlap at the patient bedside. This is an important metric that can pave the way for bedside interdisciplinary rounds. Although the exact nature of nurse-physician communication was not measured using the methodology in this study, understanding the length of time physicians spend in patient rooms, across different wards and throughout the work week, provides insights on the current workflow and potential areas of improvement. For example, we found that 30.0% of MD rounds overlapped with a nurse at the bedside. This baseline data highlight one potential barrier to institution-wide bedside interdisciplinary rounds. Workflow changes, such as better co-localization of patients by service lines or utilization of technologies to augment the visibility of rounding physicians, may improve this overlap frequency.
Data in the literature regarding how much interaction physicians and nurses have, especially at the bedside, are sparse and vary widely. In a recent study using medical students as observers by Stickrath et al., 807 MD rounding events led by medicine attendings were observed over 90 days. The frequency of rounding events that included “communication with nurse” was only 12%.19 Furthermore, only 64.9% of these communications were at the bedside, for an effective prevalence of bedside MD–RN communication of 7.8%. This number is low compared to our observed frequency of 30.0%. On the other extreme, a study from a hospital that intentionally institutes multidisciplinary rounding (explicitly defined as involving a physician and a nurse at a bedside) reported a frequency range of 63% to 81%.7 A follow-up study by the same group again demonstrated a high frequency of multidisciplinary rounds (74%) across a variety of ward and specialty types (range 35% to 97%.).11 However, because of the selection bias of this particular setting, the high prevalence does not reflect a generalizable frequency of bedside MD–RN overlap at most hospitals.
The length of time spent by physicians at the patient bedside balances the competing demands of patient care and rapport-building with maintaining efficiency and progressing to other important tasks. In our study, physicians spent an average of 7.31 minutes at the bedside per patient. A previously published multiinstitutional observational study, which included our hospital, reported that the average length of rounds at bedside was 4.8 minutes.13 A second study reported that 8.0 minutes were spent at the bedside per patient.7 All three studies examined the same setting of internal medicine rounds at academic university-based hospitals, led by an attending physician with junior and senior residents present. However, the methodologies to measure the length of physician rounds were different: Priest et al. involved observers, Gonzalos et al. used E-mail-based surveys, and we utilized RFID-based locators. Additional institutional, individual, and patient-based factors also influence the length of rounds and are challenging to directly measure.
Furthermore, the discovery that the length of rounds and the frequency of MD–RN overlap did not statistically differ between weekdays and weekends (P > .05) was unexpected. Given the general trend of reduced physician staffing on weekends and the practice of cross-covering larger patient censuses, we would have expected shorter rounds and less frequent MD–RN overlap on the weekends.7,20 The remarkable similarity between weekday and weekend metrics suggests that our workflow and rounding habits are not compromised on the weekends.
In addition, we found that MD rounds with a nurse at bedside took longer than rounds without a nurse, and that patient rooms located farther away from the central nursing station had a lower frequency of MD–RN overlap. However, we want to emphasize that these findings are merely associative, and not causal. For example, sicker patients usually take longer to round on than stable patients, and it is also the sicker patients who are more likely to have their nurses at the bedside, independent of physician rounding activity. Furthermore, even if rounding with nurses takes more time, it may ultimately result in fewer pages and overall time savings for both physicians and nurses.6
With regards to the association between room location and frequency of MD–RN overlap, the data can be interpreted in two ways. On the one hand, if the distance between the patient room and the nursing station does, in fact, reduce the frequency of overlap by almost 2% per room (Figure 4b), these data can be informative for future workflow development, quality improvement projects, or even hospital design. On the other hand, many wards might intentionally place more stable, less acute patients farther away from the nursing station because they do not need to be watched as closely. In that case, these data confirm their expectations and no action is needed.
There are several limitations to our study. The principal limitation, as discussed above, is that while our RFID system can generate large quantities of precise data on MD–RN overlap, we do not know the qualitative nature of the overlap. Just because a nurse and a physician are in the same room at the same time does not mean that they are communicating with each other. Second, we defined “rounding” as lasting a minimum of 10 seconds at the bedside. We believe that at least 10 seconds is needed to engage in any meaningful interaction between the physician and the patient, or the physician and the nurse. Reducing the time cutoff below 10 seconds risks capturing more “noise,” (decreasing specificity) whereas increasing the time cutoff above 10 seconds risks losing out on encounters that actually had substantial communication (decreasing sensitivity). Even if the communications can be classified as pure “social check-ins,” we believe these are important data to capture, as social check-ins are an important part of the patient’s care and experience. Third, several studies have commented on the modest accuracy of RFID technology as a locator system.15,21 To address this, we both validated the accuracy of our RFID tags prior to the study and restricted our measurements to only inside patient rooms, which has less signal noise than hallways.
Future directions include expanding this study to include housestaff and physicians from other specialities, which may reveal different patterns and metrics of patient and nurse interactions.
CONCLUSION
RFID technology is a high-throughput method of generating precise, quantitative, and objective data on physician and nurse rounding habits. This tool can be widely applied to generate baseline rounding and overlap data for a variety of wards and settings, especially for institutions that are interested in comparing their metrics and performance to other peer wards or hospitals. Furthermore, this method can generate the necessary pre- and postintervention data for countless quality improvement endeavors, including efforts to enhance bedside interdisciplinary rounding.
Acknowledgments
The authors would like to thank the attending hospitalists who piloted wearing the RFID tags. This study would not be possible without your participation. The authors also wish to extend their appreciation to Gretchen Brown, MSN RN NEA-BC, for her support. Finally, the authors would like to thank Dr. Laurence Katznelson, Thi Dinh La, and the Resident Safety Council at Stanford, as well as the Stanford GME Office.
Disclosures
The authors have nothing to disclose.
1. Knaus WA, Draper EA, Wagner DP, Zimmerman JE. An evaluation of outcome from intensive care in major medical centers. Ann Intern Med. 1986;104(3):410-418. https://doi.org/10.7326/0003-4819-104-3-410.
2. Larrabee JH, Ostrow CL, Withrow ML, Janney MA, Hobbs GR, Burant C. Predictors of patient satisfaction with inpatient hospital nursing care. Res Nurs Health. 2004;27(4):254-268. https://doi.org/10.1002/nur.20021.
3. Rosenstein AH. Nurse-physician relationships: impact on nurse satisfaction and retention. AJN Am J Nurs. 2002;102(6):26-34. PubMed
4. Galletta M, Portoghese I, Battistelli A, Leiter MP. The roles of unit leadership and nurse-physician collaboration on nursing turnover intention. J Adv Nurs. 2013;69(8):1771-1784. https://doi.org/10.1111/jan.12039.
5. Wanzer MB, Wojtaszczyk AM, Kelly J. Nurses’ perceptions of physicians’ communication: the relationship among communication practices, satisfaction, and collaboration. Health Commun. 2009;24(8):683-691. https://doi.org/10.1080/10410230903263990.
6. Ratelle J, Henkin S, Chon T, Christopherson M, Halvorsen A, Worden L. Improving nurse-physician teamwork through interprofessional bedside rounding. J Multidiscip Healthc. 2016;9:201. https://doi.org/10.2147/JMDH.S106644.
7. Gonzalo JD, Kuperman E, Lehman E, Haidet P. Bedside interprofessional rounds: perceptions of benefits and barriers by internal medicine nursing staff, attending physicians, and housestaff physicians. J Hosp Med. 2014;9(10):646-651. https://doi.org/10.1002/jhm.2245.
8. Rimmerman CM. Establishing patient-centered physician and nurse bedside rounding. Physician Exec. 2013;39(3):22. PubMed
9. Curley C, McEachern JE, Speroff T. A firm trial of interdisciplinary rounds on the inpatient medical wards: an intervention designed using continuous quality improvement. Med Care. 1998;36(8):AS4-AS12. PubMed
10. Rothberg MB, Steele JR, Wheeler J, Arora A, Priya A, Lindenauer PK. The relationship between time spent communicating and communication outcomes on a hospital medicine service. J Gen Intern Med. 2012;27(2):185-189. https://doi.org/10.1007/s11606-011-1857-8.
11. Gonzalo JD, Himes J, McGillen B, Shifflet V, Lehman E. Interprofessional collaborative care characteristics and the occurrence of bedside interprofessional rounds: a cross-sectional analysis. BMC Health Serv Res. 2016;16(1):459. https://doi.org/10.1186/s12913-016-1714-x.
12. Nair DM, Fitzpatrick JJ, McNulty R, Click ER, Glembocki MM. Frequency of nurse-physician collaborative behaviors in an acute care hospital. J Interprof Care. 2012;26(2):115-120. https://doi.org/10.3109/13561820.2011.637647.
13. Priest JR, Bereknyei S, Hooper K, Braddock CH. Relationships of the location and content of rounds to specialty, institution, patient-census, and team Size. PLoS One. 2010;5(6):e11246. https://doi.org/10.1371/journal.pone.0011246.
14. Li L, Hains I, Hordern T, Milliss D, Raper R, Westbrook J. What do ICU doctors do?: a multisite time and motion study of the clinical work patterns of registrars. Crit Care Resusc. 2015;17(3):159. PubMed
15. Okoniewska B, Graham A, Gavrilova M, et al. Multidimensional evaluation of a radio frequency identification wi-fi location tracking system in an acute-care hospital setting. J Am Med Inform Assoc. 2012;19(4):674-679. https://doi.org/10.1136/amiajnl-2011-000560.
16. Ward DR, Ghali WA, Graham A, Lemaire JB. A real-time locating system observes physician time-motion patterns during walk-rounds: a pilot study. BMC Med Educ. 2014;14:37. https://doi.org/10.1186/1472-6920-14-37.
17. Fahey L, Dunn Lopez K, Storfjell J, Keenan G. Expanding potential of radiofrequency nurse call systems to measure nursing time in patient rooms. J Nurs Adm. 2013;43(5):302-307. https://doi.org/10.1097/NNA.0b013e31828eebe1.
18. Hendrich A, Chow M, Skierczynski BA, Lu Z. A 36-hospital time and motion study: how do medical-surgical nurses spend their time? Perm J. 2008:50. PubMed
19. Stickrath C, Noble M, Prochazka A, et al. Attending rounds in the current era: what is and is not happening. JAMA Intern Med. 2013;173(12):1084. https://doi.org/10.1001/jamainternmed.2013.6041.
20. Blecker S, Goldfeld K, Park H, et al. Impact of an intervention to improve weekend hospital care at an academic medical center: an observational study. J Gen Intern Med. 2015;30(11):1657-1664. https://doi.org/10.1007/s11606-015-3330-6
21. Westbrook JI, Duffield C, Li L, Creswick NJ. How much time do nurses have for patients? A longitudinal study quantifying hospital nurses’ patterns of task time distribution and interactions with health professionals. BMC Health Serv Res. 2011;11(1):319. https://doi.org/10.1186/1472-6963-11-319.
© 2019 Society of Hospital Medicine
Achievable Benchmarks of Care for Pediatric Readmissions
Hospital readmission rates are a common metric for defining, evaluating, and benchmarking quality of care. The Centers for Medicare and Medicaid Services (CMS) publicly report hospital readmission rates for common adult conditions and reduces payments to hospitals with excessive readmissions.1 Recently, the focus on pediatric readmission rates has increased and the National Quality Forum (NQF) has endorsed at least two pediatric readmission-specific quality indicators which could be used by public and private payers in pay-for-performance programs aimed at institutions caring for children.2 While preventability of readmissions and their value as a marker of quality remains debated, their acceptance by the NQF and CMS has led public and private payers to propose readmission-related penalties for hospitals caring for children. 3-5
All-cause 30-day same-hospital readmission rates for pediatric conditions are half of the adult readmission rates, around 6% in most studies, compared to 12% in adults.6,7 The lower rates of pediatric readmissions makes it difficult to only use mean readmission rates to stratify hospitals into high- or low-performers and set target goals for improvement.8 While adult readmissions have been studied in depth, there are no consistent measures used to benchmark pediatric readmissions across hospital types.
Given the emphasis placed on readmissions, it is essential to understand patterns in pediatric readmission rates to determine optimal and achievable targets for improvement. Achievable Benchmarks of Care (ABCs) are one approach to understanding readmission rates and have an advantage over using mean or medians in performance improvement as they can stratify performance for conditions with low readmission rates and low volumes.9 When creating benchmarks, it is important that hospitals performance is evaluated among peer hospitals with similar patient populations, not just a cumulative average from all hospital types which may punish hospitals with a more complex patient case mix.10 The goal of this study was to calculate the readmission rates and the ABCs for common pediatric diagnoses by hospital type to identify priority conditions for quality improvement efforts using a previously published methodology.11-13
METHODS
Data Source
We conducted a retrospective analysis of patients less than 18 years of age in the Healthcare Utilization Project 2014 Nationwide Readmissions Database (NRD). The NRD includes public hospitals; academic medical centers; and specialty hospitals in obstetrics and gynecology, otolaryngology, orthopedics, and cancer; and pediatric, public, and academic medical hospitals. Excluded are long-term care facilities such as rehabilitation, long-term acute care, psychiatric, alcoholism, and chemical dependency hospitals. The readmissions data contains information from hospitals grouped by region, population census, and teaching status.14 Three hospital type classifications used in this study were metropolitan teaching hospitals, metropolitan nonteaching hospitals, and nonmetropolitan hospitals. These three hospital type classifications follow the reporting format in the NRD.
Study Population
Patients less than 18 years old were included if they were discharged from January 1, 2014 through November 30, 2014 and had a readmission to the index hospital within 30 days. We limited inclusion to discharges through November 30 so we could identify patients with a 30-day readmission as patient identifiers do not link across years in the NRD.
Exposure
We included 30-day, all-cause, same-hospital readmissions to the index acute care hospital, excluding labor and delivery, normal newborn care, chemotherapy, transfers, and mortalities. Intrahospital discharge and admissions within the same hospital system were not defined as a readmission, but rather as a “same-day event.”15 For example, institutions with inpatient mental health facilities, medical unit discharges and admission to the mental health unit were not identified as a readmission in this dataset.
Outcome
For each hospital type, we measured same-hospital, all-cause, 30-day readmission rates and achievable benchmark of care for the 17 most commonly readmitted pediatric discharge diagnoses. To identify the target readmission diagnoses and all-cause, 30-day readmissions based on their index hospitalizations, All-Patient Refined Diagnosis-Related Groups (APR-DRG), version 25 (3M Health Information Systems, Salt Lake City, Utah) were ordered by frequency for each hospital type. The 20 most common APR-DRGs were the same across all hospital types. The authors then evaluated these 20 APR-DRGs for clinical consistency of included diagnoses identified by the International Classification of Diseases, Ninth Revision, Clinical Modification (ICD-9-CM) codes within each APR-DRG. Three diagnosis-related groups were excluded from the analysis (major hematologic/immunologic disease except for sickle cell, other anemia and disorders of blood and blood forming organs, and other digestive system diagnoses) due to the heterogeneity of the diagnoses identified by the ICD-9-CM codes within each APR-DRG. We refer to each APR-DRG as a “diagnosis” throughout the article.
Analysis
The demographic characteristics of the patients seen at the three hospital types were summarized using frequencies and percentages. Reports were generated for patient age, gender, payer source, patient residence, median household income, patient complexity, and discharge disposition. Patient complexity was defined using complex chronic condition (CCC) and the number of chronic conditions (CCI).16,17 As previously defined in the literature, a complex chronic condition is “any medical condition that can be reasonably expected to last at least 12 months (unless death intervenes) and to involve either several different organ systems or one organ system severely enough to require specialty pediatric care and probably some period of hospitalization in a tertiary care center.”16 Whereas, the Agency for Healthcare Research and Quality’s Chronic Condition Indicator (CCI) defines single, non-CCCs (eg, allergic rhinitis).17
For each diagnosis, we calculated the mean readmission rate for hospitals in each hospital type category. We then calculated an ABC for each diagnosis in each hospital type using a four-step process.13,18 First, to control for hospitals with small sample sizes, we adjusted all readmission rates using an adjusted performance fraction ([numerator+1]/[denominator +2]), where the numerator is the number of all-cause 30-day readmissions and the denominator is the number of discharges for the selected diagnosis. Then the hospitals were ordered from lowest (best performing) to highest (worst performing) using the adjusted readmission rate. Third, the number of discharges from the best performing hospital to the worst performing hospital was summed until at least 10% of the total discharges had been accounted for. Finally, we computed the ABC as the average of these best performing hospitals. We only report ABCs for which at least three hospitals were included as best performers in the calculation.13
To evaluate hospital performance on ABCs for each diagnosis, we identified the percent of hospitals in each setting that were outliers. We defined an outlier as any hospital whose 95% confidence interval for their readmission rate for a given diagnosis did not contain the ABC for their hospital type. All the statistical analyses were performed using SAS version 9.3 (SAS Institute, Inc, Cary, North Carolina).
This project was reviewed by the Cincinnati Children’s Hospital Medical Center Institutional Review Board and determined to be nonhuman subjects research.
RESULTS
Hospital-Type Demographics
The 690,949 discharges from 1,664 hospitals were categorized into 525 metropolitan teaching (550,039 discharges, 79.6% of discharges), 552 metropolitan nonteaching (97,207 discharges, 14% of discharges), and 587 nonmetropolitan hospitals (43,703 discharges, 6.3% of discharges; Table 1). There were significant differences in the patient composition among the three hospital settings. Nonmetropolitan hospitals had a larger percentage of younger patients (aged 0-4 years, P < .001), prominence of first and second quartile median household income, and fewer medically complex patients (48.3% No CCC/No CCI versus 25.5% metropolitan teaching and 33.7% nonteaching, P < .001). Disposition home was over 96% in all three hospital types; however, the metropolitan teaching had a greater percentage of patients discharged to home health versus metropolitan nonteaching and nonmetropolitan hospitals (2.3% versus 0.5%; P < .001).
Readmission Rates
The 17 most common diagnoses based on the number of all-cause 30-day same-hospital readmissions, were categorized into two surgical, seven acute/infectious, four chronic, and four mental health diagnoses (Table 2). Readmission rates varied based on diagnosis and hospital type (Table 2). Overall, mean readmission rates were low, especially in acute respiratory tract related diseases. For chronic diseases, asthma readmissions were consistently low in all three hospital types, whereas sickle cell disease had the highest readmission rate in all three hospital types.
Achievable Benchmarks of Care by Hospital Type
The diagnoses for which ABC could be calculated across all three hospital types included appendectomy and four acute conditions (bronchiolitis, pneumonia, nonbacterial gastroenteritis, and kidney/urinary tract infections). For these conditions, metropolitan teaching hospitals had a more significant percentage of outlier hospitals compared to metropolitan nonteaching and nonmetropolitan hospitals. The percent of outlier hospitals varied by diagnosis and hospital type (Figure).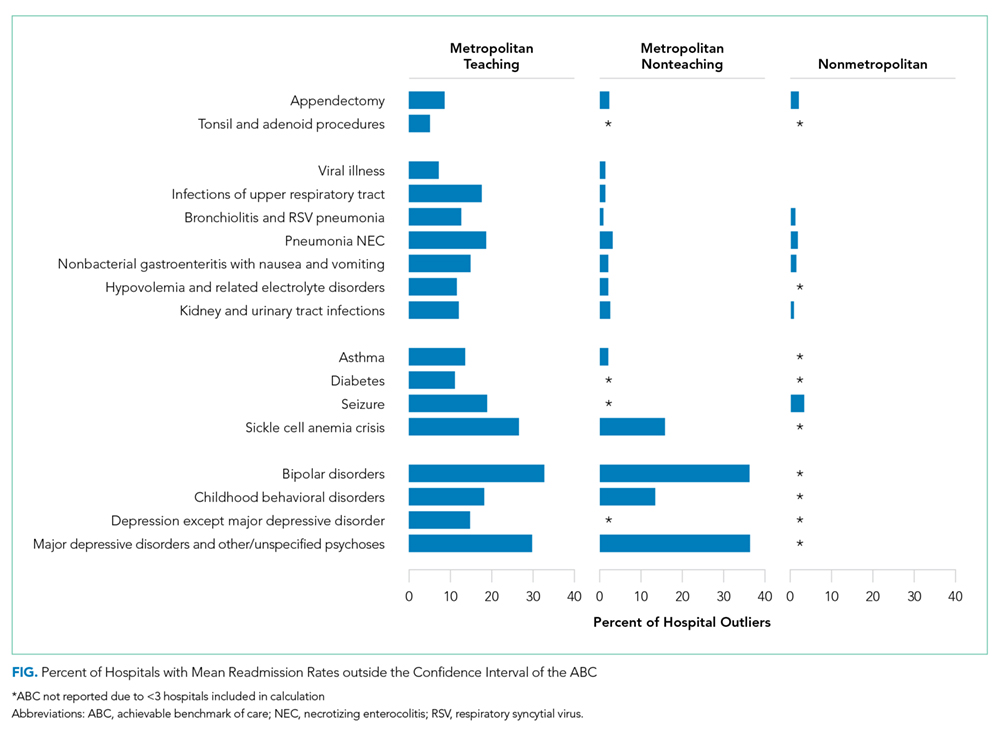
Metropolitan Teaching
The readmission ABC was calculated for all 17 diagnoses (Table 2). The ABC ranged from 0.4% in acute kidney and urinary tract infection to 7.0% in sickle cell anemia crisis. Bipolar disorder, major depressive disorders and other psychoses, and sickle cell disease (SCD) had the highest percent of outlier hospitals whose mean readmission rates confidence interval did not contain the ABC; tonsil and adenoid procedures and viral illness had the lowest.1
Metropolitan Nonteaching
The ABC was calculated for 13 of the 17 diagnoses because ABCs were not calculated when there were fewer than three best practicing hospitals. This was the case for tonsil and adenoid procedures, diabetes, seizures, and depression except for major depressive disorder (Table 2). Seven of the 13 diagnoses had an ABC of 0.0%: viral illness, infections of the upper respiratory tract, bronchiolitis, gastroenteritis, hypovolemia and electrolyte disorders, asthma, and childhood behavioral disorders. Like the findings at the metropolitan teaching hospitals, ABCs were lowest for surgical and acute conditions while bipolar disorder, major depressive disorders and other psychoses, and SCD had the highest percent of outlier hospitals with readmission rates beyond the 95% confidence interval of their hospital type’s ABC.
Nonmetropolitan
There was a sufficient number of best practicing hospitals to calculate the ABC for six of the 17 diagnoses (Table 2). For conditions where readmission ABCs could be calculated, they were low: 0.0% for appendectomy, bronchiolitis, gastroenteritis, and seizure; 0.3% for pneumonia; and 1.3% in kidney and urinary tract disorders. None of the conditions with the highest ABCs in other hospital settings (bipolar disease, sickle cell anemia crisis, and major depressive disorders and other psychoses) could be calculated in this setting. Seizure-related readmissions exhibited the most outlier hospitals yet were less than 5%.1
DISCUSSION
Among a nationally representative sample of different hospital types that deliver care to children, we report the mean readmission rates and ABCs for 30-day all-cause, same-hospital readmissions for the most commonly readmitted pediatric diagnoses based on hospital type. Previous studies have shown patient variables such as race, ethnicity, and insurance type influencing readmission rates.19,20 However, hospital type has also been associated with a higher risk of readmission due to the varying complexity of patients at different hospital types.21,22 Our analyses provide hospital-type specific national estimates of pediatric readmission ABCs for medical and surgical conditions, many less than 1%. While commonly encountered pediatric conditions like asthma and bronchiolitis had low mean readmission rates and ABCs across all hospital types, the mean rates and ABCs for SCD and mental health disorders were much higher with more hospitals performing far from the ABCs.
Diagnoses with a larger percentage of outlier hospitals may represent a national opportunity to improve care for children. Conditions such as SCD and mental illnesses have the highest percentage of hospitals whose readmission rates fall outside of the ABCs in both metropolitan teaching and metropolitan nonteaching hospitals. Hospital performance on SCD and mental health disorders may not reflect deficits in hospital quality or poor adherence to evidence-based best practices, but rather the complex interplay of factors on various levels from government policy and insurance plans, to patient and family resources, to access and availability of medical and mental health specific care. Most importantly, these diseases may represent a significant opportunity for quality improvementin hospitals across the United States.
Sickle cell disease is predominantly a disease among African-Americans, a demographic risk factor for decreased access to care and limited patient and family resources.23-26 In previous studies evaluating the disparity in readmission rates for Black children with asthma, socioeconomic variables explained 53% of the observed disparity and readmission rates were inversely related to the childhood opportunity index of the patient’s census tract and positively related with geographic social risk.27,28 Likewise, with SCD affecting a specific demographic and being a chronic disease, best practice policies need to account for the child’s medical needs and include the patient and family resources to ensure access to care and enhanced case management for chronic disease if we aim to improve performance among the outlier hospitals.
Similarly, barriers to care for children with mental illnesses in the United States need attention.29,30 While there is a paucity of data on the prevalence of mental health disorders in children, one national report estimates that one in 10 American adolescents have depression.29,31 The American Academy of Pediatrics has developed a policy statement on mental health competencies and a mental health tool-kit for primary care pediatricians; however, no such guidelines or policy statements exist for hospitalized patients with acute or chronic psychiatric conditions.32,33 Moreover, hospitals are increasingly facing “boarding” of children with acute psychiatric illness in inpatient units and emergency departments.34 The American Medical Association and the American College of Emergency Physicians have expressed concerns regarding the boarding of children with acute psychiatric illness because nonpsychiatric hospitals do not have adequate resources to evaluate, manage, and place these children who deserve appropriate facilities for further management. Coordinated case management and “bundled” discharge planning in other chronic illnesses have shown benefit in cost reduction and readmission.35-37 Evidence-based practices around pediatric readmissions in other diagnoses should be explored as possible interventions in these conditions.38
There are several limitations to this study. Our data is limited to one calendar year; therefore, admissions in January do not account for potential readmissions from December of the previous year, as patient identifiers do not link across years in the NRD. We also limited our evaluation to the conventional 30-day readmission window, but recent publications may indicate that readmission windows with different timelines could be a more accurate reflection of medically preventable readmissions versus a reflection of social determinants of health leading to readmissions.24 Newborn index admissions were not an allowable index admission; therefore, we may be underreporting readmissions in the neonatal age group. We also chose to include all-cause readmissions, a conventional method to evaluate readmission within an institution, but which may not reflect the quality of care delivered in the index admission. For example, an asthmatic discharged after an acute exacerbation readmitted for dehydration secondary to gastroenteritis may not reflect a lack of quality in asthma inpatient care. Readmissions were limited to the same hospital; therefore, this study cannot account for readmissions at other institutions, which may cause us to underestimate readmission rates. However, end-users of our findings most likely have access only to their own institution’s data. The inclusion of observation status admissions in the database varies from state to state; therefore, this percent of admissions in the database is unknown.
The use of the ABC methodology has some inherent limitations. One hospital with a significant volume diagnosis and low readmission rate within a hospital type may prohibit the reporting of an ABC if less than three hospitals composed the total of the ‘best performing’ hospitals. This was a significant limitation leading to the exclusion of many ABCs in nonmetropolitan institutions. The limitation of calculating and reporting an ABC then prohibits the calculation of outlier hospitals within a hospital type for a given diagnosis. However, when the ABCs are not available, we do provide the mean readmission rate for the diagnosis within the hospital type. While the hospital groupings by population and teaching status for ABCs provide meaningful comparisons for within each hospital setting, it should be noted that there may be vast differences among hospitals within each type (eg, tertiary children’s hospitals compared to teaching hospitals with a pediatric floor in the metropolitan teaching hospital category).39,40
As healthcare moves from a fee-for-service model to a population-health centered, value-based model, reduction in readmission rates will be more than a quality measure and will have potential financial implications.41 In the Medicare fee-for-service patients, the Hospital Readmission Reduction Program (HRRP) penalize hospitals with excess readmissions for acute myocardial infarction, heart failure, and pneumonia. The hospitals subject to penalties in the HRRP had greater reduction in readmission rates in the targeted, and even nontargeted conditions, compared with hospitals not subject to penalties.42 Similarly, we believe that our data on low readmission rates and ABCs for conditions such as asthma, bronchiolitis, and appendicitis could represent decades of quality improvement work for the most common pediatric conditions among hospitalized children. Sickle cell disease and mental health problems remain as outliers and merit further attention. To move to a true population-health model, hospitals will need to explore outlier conditions including evaluating patient-level readmission patterns across institutions. This moves readmission from a hospital quality measure to a patient-centric quality measure, and perhaps will provide value to the patient and the healthcare system alike.
CONCLUSIONS
The readmission ABCs for the most commonly readmitted pediatric diagnoses are low, regardless of the hospital setting. The highest pediatric readmission rates in SCD, bipolar disorders, and major depressive disorder were lower than the most common adult readmission diagnoses. However, mental health conditions and SCD remain as outliers for pediatric readmissions, burden hospital systems, and perhaps warrant national-level attention. The ABCs stratified by hospital type in this study facilitate comparisons and identify opportunities for population-level interventions to meaningfully improve patient care.
Disclosures
The authors have nothing to disclose.
1. Medicare. 30-day death and readmission measures data. https://www.medicare.gov/hospitalcompare/Data/30-day-measures.html. Accessed October 24, 2017.
2. National Quality Forum. Performance Measures; 2016 https://www.quality fourm.org/Measuring_Performance/Endorsed_Performance_Measures_Maintenance.aspx. Accessed October 24, 2017.
3. Auger KA, Simon TD, Cooperberg D, et al. Summary of STARNet: seamless transitions and (re)admissions network. Pediatrics. 2015;135(1):164-175. https://doi.org/10.1542/peds.2014-1887.
4. Toomey SL, Peltz A, Loren S, et al. Potentially preventable 30-day hospital readmissions at a children’s hospital. Pediatrics. 2016;138(2):e20154182-e20154182. https://doi.org/10.1542/peds.2015-4182.
5. Halfon P, Eggli Y, Prêtre-Rohrbach I, et al. Validation of the potentially avoidable hospital readmission rate as a routine indicator of the quality of hospital care. Med Care. 2006;44(11):972-981. https://doi.org/10.1097/01.mlr.0000228002.43688.c2.
6. Gay JC, Agrawal R, Auger KA, et al. Rates and impact of potentially preventable readmissions at children’s hospitals. J Pediatr. 2015;166(3):613-619. https://doi.org/10.1016/j.jpeds.2014.10.052.
7. Berry JG, Gay JC, Joynt Maddox KJ, et al. Age trends in 30 day hospital readmissions: US national retrospective analysis. BMJ. 2018;360:k497. https://doi.org/10.1136/bmj.k497.
8. Bardach NS, Vittinghoff E, Asteria-Penaloza R, et al. Measuring hospital quality using pediatric readmission and revisit rates. Pediatrics. 2013;132(3):429-436. https://doi.org/10.1542/peds.2012-3527d.
9. Berry JG, Toomey SL, Zaslavsky AM, et al. Pediatric readmission prevalence and variability across hospitals. JAMA. 2013;309(4):372-380. https://doi.org/10.1001/jama.2012.188351.
10. Gohil SK, Datta R, Cao C, et al. Impact of hospital population case-mix, including poverty, on hospital all-cause and infection-related 30-day readmission rates. Clin Infect Dis. 2015;61(8):1235-1243. https://doi.org/10.1093/cid/civ539.
11. Parikh K, Hall M, Mittal V, et al. Establishing benchmarks for the hospitalized care of children with asthma, bronchiolitis, and pneumonia. Pediatrics. 2014;134(3):555-562. https://doi.org/10.1542/peds.2014-1052.
12. Reyes M, Paulus E, Hronek C, et al. Choosing wisely campaign: report card and achievable benchmarks of care for children’s hospitals. Hosp Pediatr. 2017;7(11):633-641. https://doi.org/10.1542/hpeds.2017-0029.
13. Kiefe CI, Weissman NW, Allison JJ, et al. Identifying achievable benchmarks of care: concepts and methodology. Int J Qual Health Care. 1998;10(5):443-447. https://doi.org/10.1093/intqhc/10.5.443.
14. Agency for Healthcare Research and Quality. Nationwide Readmissions Database Availability of Data Elements. . https://www.hcup-us.ahrq.gov/partner/MOARef/HCUPdata_elements.pdf. Accessed 2018 Jun 6
15. Healthcare Cost and Utilization Project. HCUP NRD description of data elements. Agency Healthc Res Qual. https://www.hcup-us.ahrq.gov/db/vars/samedayevent/nrdnote.jsp. Accessed 2018 Jun 6; 2015.
16. Feudtner C, Feinstein JA, Zhong W, Hall M, Dai D. Pediatric complex chronic conditions classification system version 2: updated for ICD-10 and complex medical technology dependence and transplantation. BMC Pediatr. 2014;14:199. https://doi.org/10.1186/1471-2431-14-199.
17. Agency for Healthcare Research and Quality. HCUP chronic condition indicator. Healthc Cost Util Proj. https://www.hcup-us.ahrq.gov/toolssoftware/chronic/chronic.jsp. Accessed 2016 Apr 26; 2009.
18. Weissman NW, Allison JJ, Kiefe CI, et al. Achievable benchmarks of care: the ABCs of benchmarking. J Eval Clin Pract. 1999;5(3):269-281. https://doi.org/10.1046/j.1365-2753.1999.00203.x.
19. Joynt KE, Orav EJ, Jha AK. Thirty-day readmission rates for medicare beneficiaries by race and site of care. JAMA. 2011;305(7):675-681. https://doi.org/10.1001/jama.2011.123.
20. Kenyon CC, Melvin PR, Chiang VW, et al. Rehospitalization for childhood asthma: timing, variation, and opportunities for intervention. J Pediatr. 2014;164(2):300-305. https://doi.org/10.1016/j.jpeds.2013.10.003.
21. Sobota A, Graham DA, Neufeld EJ, Heeney MM. Thirty-day readmission rates following hospitalization for pediatric sickle cell crisis at freestanding children’s hospitals: risk factors and hospital variation. Pediatr Blood Cancer. 2012;58(1):61-65. https://doi.org/10.1002/pbc.23221.
22. Berry JG, Hall DE, Kuo DZ, et al. Hospital utilization and characteristics of patients experiencing recurrent readmissions within children’s hospitals. JAMA. 2011;305(7):682-690. https://doi.org/10.1001/jama.2011.122.
23. Ginde AA, Espinola JA, Camargo CA. Improved overall trends but persistent racial disparities in emergency department visits for acute asthma, 1993-2005. J Allergy Clin Immunol. 2008;122(2):313-318. https://doi.org/10.1016/j.jaci.2008.04.024.
24. Parikh K, Berry J, Hall M, et al. Racial and ethnic differences in pediatric readmissions for common chronic conditions. J Pediatr. 2017;186. https://doi.org/10.1016/j.jpeds.2017.03.046.
25. Chen BK, Hibbert J, Cheng X, Bennett K. Travel distance and sociodemographic correlates of potentially avoidable emergency department visits in California, 2006-2010: an observational study. Int J Equity Health. 2015;14(1):30. https://doi.org/10.1186/s12939-015-0158-y.
26. Ray KN, Chari AV, Engberg J, et al. Disparities in time spent seeking medical care in the United States. JAMA Intern Med. 2015;175(12):175(12):1983-1986. https://doi.org/10.1001/jamainternmed.2015.4468.
27. Beck AF, Huang B, Wheeler K, et al. The child opportunity index and disparities in pediatric asthma hospitalizations across one Ohio metropolitan area. J Pediatr. 2011-2013;190:200-206. https://doi.org/10.1016/j.jpeds.2017.08.007.
28. Beck AF, Simmons JM, Huang B, Kahn RS. Geomedicine: area-based socioeconomic measures for assessing the risk of hospital reutilization among children admitted for asthma. Am J Public Health. 2012;102(12):2308-2314. https://doi.org/10.2105/AJPH.2012.300806.
29. Avenevoli S, Swendsen J, He JP, Burstein M, Merikangas KR. Major depression in the national comorbidity survey-adolescent supplement: prevalence, correlates, and treatment. J Am Acad Child Adolesc Psychiatry. 2015;54(1):37-44.e2. https://doi.org/10.1016/j.jaac.2014.10.010.
30. Feng JY, Toomey SL, Zaslavsky AM, Nakamura MM, Schuster MA. Readmission after pediatric mental health admissions. Pediatrics. 2017;140(6):e20171571. https://doi.org/10.1542/peds.2017-1571.
31. Merikangas KR, He JP, Burstein M, et al. Lifetime prevalence of mental disorders in U.S. adolescents: results from the National comorbidity Survey Replication-Adolescent Supplement (NCS-A). J Am Acad Child Adolesc Psychiatry. 2010;49(10):980-989. https://doi.org/10.1016/j.jaac.2010.05.017.
32. Cheung AH, Zuckerbrot RA, Jensen PS, et al. Guidelines for adolescent depression in primary care (GLAD-PC): Part II. Treatment and ongoing management. Pediatrics. 2018;141(3):e20174082. https://doi.org/10.1542/peds.2017-4082.
33. Zuckerbrot RA, Cheung A, Jensen PS, et al. Guidelines for adolescent depression in primary care (GLAD-PC): Part I. Practice preparation, identification, assessment, and initial management. Pediatrics. 2018;141(3):e20174081. https://doi.org/10.1542/peds.2017-4081.
34. Dolan MA, Fein JA, Committee on Pediatric Emergency Medicine. Pediatric and adolescent mental health emergencies in the emergency Medical Services system. Pediatrics. 2011;127(5):e1356-e1366. https://doi.org/10.1542/peds.2011-0522.
35. Collaborative Healthcare Strategies. Hospital Guide to Reducing Medicaid Readmissions. Rockville, MD: 2014. https://www.ahrq.gov/sites/default/files/publications/files/medreadmissions.pdf. Accessed 2017 Oct 11.
36. Hilbert K, Payne R, Wooton S. Children’s Hospitals’ Solutions for Patient Safety. Readmissions Bundle Tools. Cincinnati, OH; 2014.
37. Nuckols TK, Keeler E, Morton S, et al. Economic evaluation of quality improvement interventions designed to prevent hospital readmission: a systematic review and meta-analysis. JAMA Intern Med. 2017;177(7):975-985. https://doi.org/10.1001/jamainternmed.2017.1136.
38. Berry JG, Blaine K, Rogers J, et al. A framework of pediatric hospital discharge care informed by legislation, research, and practice. JAMA Pediatr. 2014;168(10):955-962. https://doi.org/10.1001/jamapediatrics.2014.891.
39. Chen HF, Carlson E, Popoola T, Suzuki S. The impact of rurality on 30-day preventable readmission, illness severity, and risk of mortality for heart failure Medicare home health beneficiaries. J Rural Health. 2016;32(2):176-187. https://doi.org/10.1111/jrh.12142.
40. Khan A, Nakamura MM, Zaslavsky AM, et al. Same-hospital readmission rates as a measure of pediatric quality of care. JAMA Pediatr. 2015;169(10):905-912. https://doi.org/10.1001/jamapediatrics.2015.1129.
41. Share DA, Campbell DA, Birkmeyer N, et al. How a regional collaborative of hospitals and physicians in Michigan cut costs and improved the quality of care. Health Aff. 2011;30(4):636-645. https://doi.org/10.1377/hlthaff.2010.0526.
42. Desai NR, Ross JS, Kwon JY, et al. Association between hospital penalty status under the hospital readmission reduction program and readmission rates for target and nontarget conditions. JAMA. 2016;316(24):2647-2656. https://doi.org/10.1001/jama.2016.18533.
Hospital readmission rates are a common metric for defining, evaluating, and benchmarking quality of care. The Centers for Medicare and Medicaid Services (CMS) publicly report hospital readmission rates for common adult conditions and reduces payments to hospitals with excessive readmissions.1 Recently, the focus on pediatric readmission rates has increased and the National Quality Forum (NQF) has endorsed at least two pediatric readmission-specific quality indicators which could be used by public and private payers in pay-for-performance programs aimed at institutions caring for children.2 While preventability of readmissions and their value as a marker of quality remains debated, their acceptance by the NQF and CMS has led public and private payers to propose readmission-related penalties for hospitals caring for children. 3-5
All-cause 30-day same-hospital readmission rates for pediatric conditions are half of the adult readmission rates, around 6% in most studies, compared to 12% in adults.6,7 The lower rates of pediatric readmissions makes it difficult to only use mean readmission rates to stratify hospitals into high- or low-performers and set target goals for improvement.8 While adult readmissions have been studied in depth, there are no consistent measures used to benchmark pediatric readmissions across hospital types.
Given the emphasis placed on readmissions, it is essential to understand patterns in pediatric readmission rates to determine optimal and achievable targets for improvement. Achievable Benchmarks of Care (ABCs) are one approach to understanding readmission rates and have an advantage over using mean or medians in performance improvement as they can stratify performance for conditions with low readmission rates and low volumes.9 When creating benchmarks, it is important that hospitals performance is evaluated among peer hospitals with similar patient populations, not just a cumulative average from all hospital types which may punish hospitals with a more complex patient case mix.10 The goal of this study was to calculate the readmission rates and the ABCs for common pediatric diagnoses by hospital type to identify priority conditions for quality improvement efforts using a previously published methodology.11-13
METHODS
Data Source
We conducted a retrospective analysis of patients less than 18 years of age in the Healthcare Utilization Project 2014 Nationwide Readmissions Database (NRD). The NRD includes public hospitals; academic medical centers; and specialty hospitals in obstetrics and gynecology, otolaryngology, orthopedics, and cancer; and pediatric, public, and academic medical hospitals. Excluded are long-term care facilities such as rehabilitation, long-term acute care, psychiatric, alcoholism, and chemical dependency hospitals. The readmissions data contains information from hospitals grouped by region, population census, and teaching status.14 Three hospital type classifications used in this study were metropolitan teaching hospitals, metropolitan nonteaching hospitals, and nonmetropolitan hospitals. These three hospital type classifications follow the reporting format in the NRD.
Study Population
Patients less than 18 years old were included if they were discharged from January 1, 2014 through November 30, 2014 and had a readmission to the index hospital within 30 days. We limited inclusion to discharges through November 30 so we could identify patients with a 30-day readmission as patient identifiers do not link across years in the NRD.
Exposure
We included 30-day, all-cause, same-hospital readmissions to the index acute care hospital, excluding labor and delivery, normal newborn care, chemotherapy, transfers, and mortalities. Intrahospital discharge and admissions within the same hospital system were not defined as a readmission, but rather as a “same-day event.”15 For example, institutions with inpatient mental health facilities, medical unit discharges and admission to the mental health unit were not identified as a readmission in this dataset.
Outcome
For each hospital type, we measured same-hospital, all-cause, 30-day readmission rates and achievable benchmark of care for the 17 most commonly readmitted pediatric discharge diagnoses. To identify the target readmission diagnoses and all-cause, 30-day readmissions based on their index hospitalizations, All-Patient Refined Diagnosis-Related Groups (APR-DRG), version 25 (3M Health Information Systems, Salt Lake City, Utah) were ordered by frequency for each hospital type. The 20 most common APR-DRGs were the same across all hospital types. The authors then evaluated these 20 APR-DRGs for clinical consistency of included diagnoses identified by the International Classification of Diseases, Ninth Revision, Clinical Modification (ICD-9-CM) codes within each APR-DRG. Three diagnosis-related groups were excluded from the analysis (major hematologic/immunologic disease except for sickle cell, other anemia and disorders of blood and blood forming organs, and other digestive system diagnoses) due to the heterogeneity of the diagnoses identified by the ICD-9-CM codes within each APR-DRG. We refer to each APR-DRG as a “diagnosis” throughout the article.
Analysis
The demographic characteristics of the patients seen at the three hospital types were summarized using frequencies and percentages. Reports were generated for patient age, gender, payer source, patient residence, median household income, patient complexity, and discharge disposition. Patient complexity was defined using complex chronic condition (CCC) and the number of chronic conditions (CCI).16,17 As previously defined in the literature, a complex chronic condition is “any medical condition that can be reasonably expected to last at least 12 months (unless death intervenes) and to involve either several different organ systems or one organ system severely enough to require specialty pediatric care and probably some period of hospitalization in a tertiary care center.”16 Whereas, the Agency for Healthcare Research and Quality’s Chronic Condition Indicator (CCI) defines single, non-CCCs (eg, allergic rhinitis).17
For each diagnosis, we calculated the mean readmission rate for hospitals in each hospital type category. We then calculated an ABC for each diagnosis in each hospital type using a four-step process.13,18 First, to control for hospitals with small sample sizes, we adjusted all readmission rates using an adjusted performance fraction ([numerator+1]/[denominator +2]), where the numerator is the number of all-cause 30-day readmissions and the denominator is the number of discharges for the selected diagnosis. Then the hospitals were ordered from lowest (best performing) to highest (worst performing) using the adjusted readmission rate. Third, the number of discharges from the best performing hospital to the worst performing hospital was summed until at least 10% of the total discharges had been accounted for. Finally, we computed the ABC as the average of these best performing hospitals. We only report ABCs for which at least three hospitals were included as best performers in the calculation.13
To evaluate hospital performance on ABCs for each diagnosis, we identified the percent of hospitals in each setting that were outliers. We defined an outlier as any hospital whose 95% confidence interval for their readmission rate for a given diagnosis did not contain the ABC for their hospital type. All the statistical analyses were performed using SAS version 9.3 (SAS Institute, Inc, Cary, North Carolina).
This project was reviewed by the Cincinnati Children’s Hospital Medical Center Institutional Review Board and determined to be nonhuman subjects research.
RESULTS
Hospital-Type Demographics
The 690,949 discharges from 1,664 hospitals were categorized into 525 metropolitan teaching (550,039 discharges, 79.6% of discharges), 552 metropolitan nonteaching (97,207 discharges, 14% of discharges), and 587 nonmetropolitan hospitals (43,703 discharges, 6.3% of discharges; Table 1). There were significant differences in the patient composition among the three hospital settings. Nonmetropolitan hospitals had a larger percentage of younger patients (aged 0-4 years, P < .001), prominence of first and second quartile median household income, and fewer medically complex patients (48.3% No CCC/No CCI versus 25.5% metropolitan teaching and 33.7% nonteaching, P < .001). Disposition home was over 96% in all three hospital types; however, the metropolitan teaching had a greater percentage of patients discharged to home health versus metropolitan nonteaching and nonmetropolitan hospitals (2.3% versus 0.5%; P < .001).
Readmission Rates
The 17 most common diagnoses based on the number of all-cause 30-day same-hospital readmissions, were categorized into two surgical, seven acute/infectious, four chronic, and four mental health diagnoses (Table 2). Readmission rates varied based on diagnosis and hospital type (Table 2). Overall, mean readmission rates were low, especially in acute respiratory tract related diseases. For chronic diseases, asthma readmissions were consistently low in all three hospital types, whereas sickle cell disease had the highest readmission rate in all three hospital types.
Achievable Benchmarks of Care by Hospital Type
The diagnoses for which ABC could be calculated across all three hospital types included appendectomy and four acute conditions (bronchiolitis, pneumonia, nonbacterial gastroenteritis, and kidney/urinary tract infections). For these conditions, metropolitan teaching hospitals had a more significant percentage of outlier hospitals compared to metropolitan nonteaching and nonmetropolitan hospitals. The percent of outlier hospitals varied by diagnosis and hospital type (Figure).
Metropolitan Teaching
The readmission ABC was calculated for all 17 diagnoses (Table 2). The ABC ranged from 0.4% in acute kidney and urinary tract infection to 7.0% in sickle cell anemia crisis. Bipolar disorder, major depressive disorders and other psychoses, and sickle cell disease (SCD) had the highest percent of outlier hospitals whose mean readmission rates confidence interval did not contain the ABC; tonsil and adenoid procedures and viral illness had the lowest.1
Metropolitan Nonteaching
The ABC was calculated for 13 of the 17 diagnoses because ABCs were not calculated when there were fewer than three best practicing hospitals. This was the case for tonsil and adenoid procedures, diabetes, seizures, and depression except for major depressive disorder (Table 2). Seven of the 13 diagnoses had an ABC of 0.0%: viral illness, infections of the upper respiratory tract, bronchiolitis, gastroenteritis, hypovolemia and electrolyte disorders, asthma, and childhood behavioral disorders. Like the findings at the metropolitan teaching hospitals, ABCs were lowest for surgical and acute conditions while bipolar disorder, major depressive disorders and other psychoses, and SCD had the highest percent of outlier hospitals with readmission rates beyond the 95% confidence interval of their hospital type’s ABC.
Nonmetropolitan
There was a sufficient number of best practicing hospitals to calculate the ABC for six of the 17 diagnoses (Table 2). For conditions where readmission ABCs could be calculated, they were low: 0.0% for appendectomy, bronchiolitis, gastroenteritis, and seizure; 0.3% for pneumonia; and 1.3% in kidney and urinary tract disorders. None of the conditions with the highest ABCs in other hospital settings (bipolar disease, sickle cell anemia crisis, and major depressive disorders and other psychoses) could be calculated in this setting. Seizure-related readmissions exhibited the most outlier hospitals yet were less than 5%.1
DISCUSSION
Among a nationally representative sample of different hospital types that deliver care to children, we report the mean readmission rates and ABCs for 30-day all-cause, same-hospital readmissions for the most commonly readmitted pediatric diagnoses based on hospital type. Previous studies have shown patient variables such as race, ethnicity, and insurance type influencing readmission rates.19,20 However, hospital type has also been associated with a higher risk of readmission due to the varying complexity of patients at different hospital types.21,22 Our analyses provide hospital-type specific national estimates of pediatric readmission ABCs for medical and surgical conditions, many less than 1%. While commonly encountered pediatric conditions like asthma and bronchiolitis had low mean readmission rates and ABCs across all hospital types, the mean rates and ABCs for SCD and mental health disorders were much higher with more hospitals performing far from the ABCs.
Diagnoses with a larger percentage of outlier hospitals may represent a national opportunity to improve care for children. Conditions such as SCD and mental illnesses have the highest percentage of hospitals whose readmission rates fall outside of the ABCs in both metropolitan teaching and metropolitan nonteaching hospitals. Hospital performance on SCD and mental health disorders may not reflect deficits in hospital quality or poor adherence to evidence-based best practices, but rather the complex interplay of factors on various levels from government policy and insurance plans, to patient and family resources, to access and availability of medical and mental health specific care. Most importantly, these diseases may represent a significant opportunity for quality improvementin hospitals across the United States.
Sickle cell disease is predominantly a disease among African-Americans, a demographic risk factor for decreased access to care and limited patient and family resources.23-26 In previous studies evaluating the disparity in readmission rates for Black children with asthma, socioeconomic variables explained 53% of the observed disparity and readmission rates were inversely related to the childhood opportunity index of the patient’s census tract and positively related with geographic social risk.27,28 Likewise, with SCD affecting a specific demographic and being a chronic disease, best practice policies need to account for the child’s medical needs and include the patient and family resources to ensure access to care and enhanced case management for chronic disease if we aim to improve performance among the outlier hospitals.
Similarly, barriers to care for children with mental illnesses in the United States need attention.29,30 While there is a paucity of data on the prevalence of mental health disorders in children, one national report estimates that one in 10 American adolescents have depression.29,31 The American Academy of Pediatrics has developed a policy statement on mental health competencies and a mental health tool-kit for primary care pediatricians; however, no such guidelines or policy statements exist for hospitalized patients with acute or chronic psychiatric conditions.32,33 Moreover, hospitals are increasingly facing “boarding” of children with acute psychiatric illness in inpatient units and emergency departments.34 The American Medical Association and the American College of Emergency Physicians have expressed concerns regarding the boarding of children with acute psychiatric illness because nonpsychiatric hospitals do not have adequate resources to evaluate, manage, and place these children who deserve appropriate facilities for further management. Coordinated case management and “bundled” discharge planning in other chronic illnesses have shown benefit in cost reduction and readmission.35-37 Evidence-based practices around pediatric readmissions in other diagnoses should be explored as possible interventions in these conditions.38
There are several limitations to this study. Our data is limited to one calendar year; therefore, admissions in January do not account for potential readmissions from December of the previous year, as patient identifiers do not link across years in the NRD. We also limited our evaluation to the conventional 30-day readmission window, but recent publications may indicate that readmission windows with different timelines could be a more accurate reflection of medically preventable readmissions versus a reflection of social determinants of health leading to readmissions.24 Newborn index admissions were not an allowable index admission; therefore, we may be underreporting readmissions in the neonatal age group. We also chose to include all-cause readmissions, a conventional method to evaluate readmission within an institution, but which may not reflect the quality of care delivered in the index admission. For example, an asthmatic discharged after an acute exacerbation readmitted for dehydration secondary to gastroenteritis may not reflect a lack of quality in asthma inpatient care. Readmissions were limited to the same hospital; therefore, this study cannot account for readmissions at other institutions, which may cause us to underestimate readmission rates. However, end-users of our findings most likely have access only to their own institution’s data. The inclusion of observation status admissions in the database varies from state to state; therefore, this percent of admissions in the database is unknown.
The use of the ABC methodology has some inherent limitations. One hospital with a significant volume diagnosis and low readmission rate within a hospital type may prohibit the reporting of an ABC if less than three hospitals composed the total of the ‘best performing’ hospitals. This was a significant limitation leading to the exclusion of many ABCs in nonmetropolitan institutions. The limitation of calculating and reporting an ABC then prohibits the calculation of outlier hospitals within a hospital type for a given diagnosis. However, when the ABCs are not available, we do provide the mean readmission rate for the diagnosis within the hospital type. While the hospital groupings by population and teaching status for ABCs provide meaningful comparisons for within each hospital setting, it should be noted that there may be vast differences among hospitals within each type (eg, tertiary children’s hospitals compared to teaching hospitals with a pediatric floor in the metropolitan teaching hospital category).39,40
As healthcare moves from a fee-for-service model to a population-health centered, value-based model, reduction in readmission rates will be more than a quality measure and will have potential financial implications.41 In the Medicare fee-for-service patients, the Hospital Readmission Reduction Program (HRRP) penalize hospitals with excess readmissions for acute myocardial infarction, heart failure, and pneumonia. The hospitals subject to penalties in the HRRP had greater reduction in readmission rates in the targeted, and even nontargeted conditions, compared with hospitals not subject to penalties.42 Similarly, we believe that our data on low readmission rates and ABCs for conditions such as asthma, bronchiolitis, and appendicitis could represent decades of quality improvement work for the most common pediatric conditions among hospitalized children. Sickle cell disease and mental health problems remain as outliers and merit further attention. To move to a true population-health model, hospitals will need to explore outlier conditions including evaluating patient-level readmission patterns across institutions. This moves readmission from a hospital quality measure to a patient-centric quality measure, and perhaps will provide value to the patient and the healthcare system alike.
CONCLUSIONS
The readmission ABCs for the most commonly readmitted pediatric diagnoses are low, regardless of the hospital setting. The highest pediatric readmission rates in SCD, bipolar disorders, and major depressive disorder were lower than the most common adult readmission diagnoses. However, mental health conditions and SCD remain as outliers for pediatric readmissions, burden hospital systems, and perhaps warrant national-level attention. The ABCs stratified by hospital type in this study facilitate comparisons and identify opportunities for population-level interventions to meaningfully improve patient care.
Disclosures
The authors have nothing to disclose.
1. Medicare. 30-day death and readmission measures data. https://www.medicare.gov/hospitalcompare/Data/30-day-measures.html. Accessed October 24, 2017.
2. National Quality Forum. Performance Measures; 2016 https://www.quality fourm.org/Measuring_Performance/Endorsed_Performance_Measures_Maintenance.aspx. Accessed October 24, 2017.
3. Auger KA, Simon TD, Cooperberg D, et al. Summary of STARNet: seamless transitions and (re)admissions network. Pediatrics. 2015;135(1):164-175. https://doi.org/10.1542/peds.2014-1887.
4. Toomey SL, Peltz A, Loren S, et al. Potentially preventable 30-day hospital readmissions at a children’s hospital. Pediatrics. 2016;138(2):e20154182-e20154182. https://doi.org/10.1542/peds.2015-4182.
5. Halfon P, Eggli Y, Prêtre-Rohrbach I, et al. Validation of the potentially avoidable hospital readmission rate as a routine indicator of the quality of hospital care. Med Care. 2006;44(11):972-981. https://doi.org/10.1097/01.mlr.0000228002.43688.c2.
6. Gay JC, Agrawal R, Auger KA, et al. Rates and impact of potentially preventable readmissions at children’s hospitals. J Pediatr. 2015;166(3):613-619. https://doi.org/10.1016/j.jpeds.2014.10.052.
7. Berry JG, Gay JC, Joynt Maddox KJ, et al. Age trends in 30 day hospital readmissions: US national retrospective analysis. BMJ. 2018;360:k497. https://doi.org/10.1136/bmj.k497.
8. Bardach NS, Vittinghoff E, Asteria-Penaloza R, et al. Measuring hospital quality using pediatric readmission and revisit rates. Pediatrics. 2013;132(3):429-436. https://doi.org/10.1542/peds.2012-3527d.
9. Berry JG, Toomey SL, Zaslavsky AM, et al. Pediatric readmission prevalence and variability across hospitals. JAMA. 2013;309(4):372-380. https://doi.org/10.1001/jama.2012.188351.
10. Gohil SK, Datta R, Cao C, et al. Impact of hospital population case-mix, including poverty, on hospital all-cause and infection-related 30-day readmission rates. Clin Infect Dis. 2015;61(8):1235-1243. https://doi.org/10.1093/cid/civ539.
11. Parikh K, Hall M, Mittal V, et al. Establishing benchmarks for the hospitalized care of children with asthma, bronchiolitis, and pneumonia. Pediatrics. 2014;134(3):555-562. https://doi.org/10.1542/peds.2014-1052.
12. Reyes M, Paulus E, Hronek C, et al. Choosing wisely campaign: report card and achievable benchmarks of care for children’s hospitals. Hosp Pediatr. 2017;7(11):633-641. https://doi.org/10.1542/hpeds.2017-0029.
13. Kiefe CI, Weissman NW, Allison JJ, et al. Identifying achievable benchmarks of care: concepts and methodology. Int J Qual Health Care. 1998;10(5):443-447. https://doi.org/10.1093/intqhc/10.5.443.
14. Agency for Healthcare Research and Quality. Nationwide Readmissions Database Availability of Data Elements. . https://www.hcup-us.ahrq.gov/partner/MOARef/HCUPdata_elements.pdf. Accessed 2018 Jun 6
15. Healthcare Cost and Utilization Project. HCUP NRD description of data elements. Agency Healthc Res Qual. https://www.hcup-us.ahrq.gov/db/vars/samedayevent/nrdnote.jsp. Accessed 2018 Jun 6; 2015.
16. Feudtner C, Feinstein JA, Zhong W, Hall M, Dai D. Pediatric complex chronic conditions classification system version 2: updated for ICD-10 and complex medical technology dependence and transplantation. BMC Pediatr. 2014;14:199. https://doi.org/10.1186/1471-2431-14-199.
17. Agency for Healthcare Research and Quality. HCUP chronic condition indicator. Healthc Cost Util Proj. https://www.hcup-us.ahrq.gov/toolssoftware/chronic/chronic.jsp. Accessed 2016 Apr 26; 2009.
18. Weissman NW, Allison JJ, Kiefe CI, et al. Achievable benchmarks of care: the ABCs of benchmarking. J Eval Clin Pract. 1999;5(3):269-281. https://doi.org/10.1046/j.1365-2753.1999.00203.x.
19. Joynt KE, Orav EJ, Jha AK. Thirty-day readmission rates for medicare beneficiaries by race and site of care. JAMA. 2011;305(7):675-681. https://doi.org/10.1001/jama.2011.123.
20. Kenyon CC, Melvin PR, Chiang VW, et al. Rehospitalization for childhood asthma: timing, variation, and opportunities for intervention. J Pediatr. 2014;164(2):300-305. https://doi.org/10.1016/j.jpeds.2013.10.003.
21. Sobota A, Graham DA, Neufeld EJ, Heeney MM. Thirty-day readmission rates following hospitalization for pediatric sickle cell crisis at freestanding children’s hospitals: risk factors and hospital variation. Pediatr Blood Cancer. 2012;58(1):61-65. https://doi.org/10.1002/pbc.23221.
22. Berry JG, Hall DE, Kuo DZ, et al. Hospital utilization and characteristics of patients experiencing recurrent readmissions within children’s hospitals. JAMA. 2011;305(7):682-690. https://doi.org/10.1001/jama.2011.122.
23. Ginde AA, Espinola JA, Camargo CA. Improved overall trends but persistent racial disparities in emergency department visits for acute asthma, 1993-2005. J Allergy Clin Immunol. 2008;122(2):313-318. https://doi.org/10.1016/j.jaci.2008.04.024.
24. Parikh K, Berry J, Hall M, et al. Racial and ethnic differences in pediatric readmissions for common chronic conditions. J Pediatr. 2017;186. https://doi.org/10.1016/j.jpeds.2017.03.046.
25. Chen BK, Hibbert J, Cheng X, Bennett K. Travel distance and sociodemographic correlates of potentially avoidable emergency department visits in California, 2006-2010: an observational study. Int J Equity Health. 2015;14(1):30. https://doi.org/10.1186/s12939-015-0158-y.
26. Ray KN, Chari AV, Engberg J, et al. Disparities in time spent seeking medical care in the United States. JAMA Intern Med. 2015;175(12):175(12):1983-1986. https://doi.org/10.1001/jamainternmed.2015.4468.
27. Beck AF, Huang B, Wheeler K, et al. The child opportunity index and disparities in pediatric asthma hospitalizations across one Ohio metropolitan area. J Pediatr. 2011-2013;190:200-206. https://doi.org/10.1016/j.jpeds.2017.08.007.
28. Beck AF, Simmons JM, Huang B, Kahn RS. Geomedicine: area-based socioeconomic measures for assessing the risk of hospital reutilization among children admitted for asthma. Am J Public Health. 2012;102(12):2308-2314. https://doi.org/10.2105/AJPH.2012.300806.
29. Avenevoli S, Swendsen J, He JP, Burstein M, Merikangas KR. Major depression in the national comorbidity survey-adolescent supplement: prevalence, correlates, and treatment. J Am Acad Child Adolesc Psychiatry. 2015;54(1):37-44.e2. https://doi.org/10.1016/j.jaac.2014.10.010.
30. Feng JY, Toomey SL, Zaslavsky AM, Nakamura MM, Schuster MA. Readmission after pediatric mental health admissions. Pediatrics. 2017;140(6):e20171571. https://doi.org/10.1542/peds.2017-1571.
31. Merikangas KR, He JP, Burstein M, et al. Lifetime prevalence of mental disorders in U.S. adolescents: results from the National comorbidity Survey Replication-Adolescent Supplement (NCS-A). J Am Acad Child Adolesc Psychiatry. 2010;49(10):980-989. https://doi.org/10.1016/j.jaac.2010.05.017.
32. Cheung AH, Zuckerbrot RA, Jensen PS, et al. Guidelines for adolescent depression in primary care (GLAD-PC): Part II. Treatment and ongoing management. Pediatrics. 2018;141(3):e20174082. https://doi.org/10.1542/peds.2017-4082.
33. Zuckerbrot RA, Cheung A, Jensen PS, et al. Guidelines for adolescent depression in primary care (GLAD-PC): Part I. Practice preparation, identification, assessment, and initial management. Pediatrics. 2018;141(3):e20174081. https://doi.org/10.1542/peds.2017-4081.
34. Dolan MA, Fein JA, Committee on Pediatric Emergency Medicine. Pediatric and adolescent mental health emergencies in the emergency Medical Services system. Pediatrics. 2011;127(5):e1356-e1366. https://doi.org/10.1542/peds.2011-0522.
35. Collaborative Healthcare Strategies. Hospital Guide to Reducing Medicaid Readmissions. Rockville, MD: 2014. https://www.ahrq.gov/sites/default/files/publications/files/medreadmissions.pdf. Accessed 2017 Oct 11.
36. Hilbert K, Payne R, Wooton S. Children’s Hospitals’ Solutions for Patient Safety. Readmissions Bundle Tools. Cincinnati, OH; 2014.
37. Nuckols TK, Keeler E, Morton S, et al. Economic evaluation of quality improvement interventions designed to prevent hospital readmission: a systematic review and meta-analysis. JAMA Intern Med. 2017;177(7):975-985. https://doi.org/10.1001/jamainternmed.2017.1136.
38. Berry JG, Blaine K, Rogers J, et al. A framework of pediatric hospital discharge care informed by legislation, research, and practice. JAMA Pediatr. 2014;168(10):955-962. https://doi.org/10.1001/jamapediatrics.2014.891.
39. Chen HF, Carlson E, Popoola T, Suzuki S. The impact of rurality on 30-day preventable readmission, illness severity, and risk of mortality for heart failure Medicare home health beneficiaries. J Rural Health. 2016;32(2):176-187. https://doi.org/10.1111/jrh.12142.
40. Khan A, Nakamura MM, Zaslavsky AM, et al. Same-hospital readmission rates as a measure of pediatric quality of care. JAMA Pediatr. 2015;169(10):905-912. https://doi.org/10.1001/jamapediatrics.2015.1129.
41. Share DA, Campbell DA, Birkmeyer N, et al. How a regional collaborative of hospitals and physicians in Michigan cut costs and improved the quality of care. Health Aff. 2011;30(4):636-645. https://doi.org/10.1377/hlthaff.2010.0526.
42. Desai NR, Ross JS, Kwon JY, et al. Association between hospital penalty status under the hospital readmission reduction program and readmission rates for target and nontarget conditions. JAMA. 2016;316(24):2647-2656. https://doi.org/10.1001/jama.2016.18533.
© 2019 Society of Hospital Medicine
An Acute Care for Elders Quality Improvement Program for Complex, High-Cost Patients Yields Savings for the System
In 2016, 15.2% of older Americans were hospitalized compared with 7% of the overall population and their length of stay (LOS) was 0.7 days greater.1 Geriatric hospitalizations frequently result in complications, functional decline, nursing home transfers, and increased cost.2-4 This pattern of decline has been termed “hospitalitis” or dysfunctional syndrome.5,6 Hospitals need data-driven approaches to improve outcomes for elders. The Acute Care for Elders (ACE) program, which has been in existence for roughly 25 years, is one such model. ACE features include an environment prepared for older adults, patient-centered care to prevent functional and cognitive decline, frequent medical review to prevent iatrogenic injury or new geriatric syndromes, and early discharge and rehabilitation planning to maximize the likelihood of return to the community.7 Although published data vary somewhat, ACE programs have robust evidence documenting improved safety, quality, and value.8-15 A recent meta-analysis found that ACE programs decrease LOS, costs, new nursing home discharges, falls, delirium, and functional decline.16 However, of the 13 ACE trials reported to date, only five were published in the last decade. Recent rising pressure to decrease hospitalizations and reduce LOS has shifted some care to other settings and it is unclear whether the same results would persist in today’s rapid-paced hospitals.
ACE programs require enhanced resources and restructured care processes but there is a notable lack of data to guide patient selection. Admission criteria vary among the published reports, and information on whether comorbidity burden impacts the magnitude of benefit is scarce. One ACE investigator commented, “We were not able to identify a subgroup of patients who were most likely to benefit.”17 Not all hospitalized older adults can receive ACE care, and some units have closed due to financial and logistic pressures; thus, criteria to target this scarce resource are urgently needed. Our hospital implemented an ACE program in 2014 and we have measured and internally benchmarked important quality improvement metrics. Using this data, we conducted an exploratory analysis to generate hypotheses on the differential impact across the spectrum of cost, LOS, 30-day readmissions, and variations across quartiles of comorbidity severity.
METHODS
Setting and Patients
In September 2014, our 716-bed teaching hospital in Springfield, Massachusetts launched an ACE program to improve care for older adults on a single medical unit. The program succeeded in engaging the senior leadership, and geriatrics was identified as a priority in Baystate’s 5-year strategic plan. ACE patients ≥70 years were admitted from the emergency department with inpatient status. Patients transferred from other units or with advanced dementia or nearing death were excluded. Core components of the ACE program were derived from published summaries (see supplementary material).7,16
Interprofessional ”ACE Rounds”
Interprofessional ACE Rounds occurred every weekday. As one ACE analyst has noted, “the interdisciplinary team…ensures that the multifactorial nature of functional decline is met with a multicomponent plan to prevent it.”18 Rounds participants shifted over time but always included a geriatrics physician assistant (PA) or geriatrician (team leader), a pharmacist, staff nurses, and a chaplain. The nurse educator, dietician, research assistant, and patient advocate/volunteers attended intermittently. Before rounds, the PA reviewed the admission notes for new ACE patients. Initially, rounds were lengthy and included nurse coaching. Later, nurses’ presentations were structured by the SPICES tool (Sleep, Problems with eating/feeding, Incontinence, Confusion, Evidence of falls, Skin Breakdown)19 and tracking and reporting templates. Coaching and education, along with conversations that did not require the full team, were removed from rounds. Thus, the time required for rounds declined from about 75 minutes to 35 minutes, which allowed more patients to be discussed efficiently. This change was critical as the number of ACE patients rose following the shift to the larger unit. The pharmacist reviewed medications focusing on potentially inappropriate drugs. Following rounds, the nurses and pharmacist conveyed recommendations to the hospitalists.
Patient-Centered Activities to Prevent Functional and Cognitive Decline
Project leaders coached staff about the importance of mobility, sleep, and delirium prevention and identification. The nurses screened patients using the Confusion Assessment Method (CAM) and reported delirium promptly. Specific care sets for ACE patients were implemented (see supplementary material).
The project was enhanced by several palliative care components, ie tracking pain, noting psychiatric symptoms, and considering prognosis by posing the “Surprise Question” during rounds.20 (“Would you be surprised if this patient died in the next year?”). As far as staffing and logistics allowed, the goals of care conversation were held by a geriatrics PA with patients/families who “screened in.”
Prepared Environment
The ACE program’s unit was remodeled to facilitate physical and cognitive functioning and promote sleep at night (quiet hours: 10 PM-6 AM).
In accordance with quality improvement processes, iterative shifts were implemented over time in terms of checklist, presentation format, timing, and team participation. In December 2016, the program relocated to a unit with 34 ACE beds and 5 end-of-life beds; this move markedly increased the number of eligible ACE patients.
Study Design, Data Source, and Patients
Since we were implementing and measuring our ACE program with a quality improvement lens, we chose a descriptive cross-sectional study design to generate hypotheses regarding our program’s impact compared to usual care. Using a hospital-wide billing database (McKesson Performance Analytics, v19, Alpharetta, Georgia) we sampled inpatients aged >70 years with a medical Diagnosis Related Group (DRGs) admitted through the emergency department and discharged from a medical unit from September 22, 2014 to August 31, 2017. These criteria mirrored those in the ACE unit. Older adults requiring specialized care (eg, those with myocardial infarct) were excluded, as were those with billing codes for mechanical ventilation, admission to critical care units, or discharge to hospice. Because one of our outcomes was readmission, we excluded patients who died during hospitalization. Patient characteristics collected included demographics and insurance category. To evaluate comorbidity burden, we collected ICD-9/ICD-10 diagnostic codes and generated a combined comorbidity score as described by Gagne, et al.21 This score was devised to predict mortality and 30-day readmissions and had better predictive ability in elders than the Elixhauser or Charlson scores. Scores ranged from −2 to 26, although values >20 are rare.
Exposure
Subjects were categorized as either discharged from the ACE or discharged from usual care. ACE discharges were tracked daily on a spreadsheet that was linked into our sample of eligible subjects.
Outcomes
Total cost of hospitalization (direct plus indirect costs), LOS, and all-cause 30-day readmissions were queried from the same billing database.
Statistical Analysis
As this study was a quality improvement project, analyses were descriptive and exploratory; no statistical hypothesis testing was conducted. We initially evaluated subject characteristics and comorbidities across study groups to determine group balance and comparability using means and standard deviations for continuous data and frequencies and percentages for categorical data. To analyze total cost and LOS, we utilized quantile regression with clustered standard errors to account for clustering by patient. We calculated the median difference between hospitalization cost and LOS for usual care versus ACE patients (with ACE as the referent group). To explore variations across the distributions of outcomes, we determined differences in cost and LOS and their 95% confidence intervals at the 25th, 50th, 75th, and 90th percentiles. Thirty-day readmission risk was estimated using a generalized estimating equation model with a logit link and binomial family. Readmission risk is presented along with 95% confidence intervals. For all models, we initially evaluated change over time (by quarter). After establishing the absence of time trends, we collapsed results into a comparison of usual care versus ACE care. Model estimates are presented both unadjusted and adjusted for age and comorbidity score. Following our initial analyses of cost, LOS, and 30-day readmission risk; we explored differences across quartiles of combined comorbidity scores. We used the same unadjusted models described above but incorporated an interaction term to generate estimates stratified by quartile of comorbidity score. We performed two additional analyses to evaluate the robustness of our findings. First, because hemiplegia prevalence was higher in the usual-care group than in the ACE group and can result in higher cost of care, we repeated the analysis after excluding those patients with hemiplegia. Second, because we were unable to control for functional capacity in the entire sample, we evaluated group differences in mobility for a subsample obtained prior to October 2015 using ICD-9 diagnostic codes, which can be considered surrogate markers for mobility.22 The results of our first analysis did not substantively change our main findings; in our second analysis, groups were balanced by mobility factors which suggested that confounding by functional capacity would be limited in our full sample. The results of these analyses are reported in the supplemental material.
Analysis was completed using Stata v15.1 (StataCorp, LP College Station, Texas). The Baystate Medical Center Institutional Review Board determined that the initiative was quality improvement and “not research.”
RESULTS
A total of 13,209 patients met the initial inclusion criteria; 1,621 were excluded, resulting in a sample of 11,588 patients. Over the 3-year study period, 1,429 (12.3%) were discharged from ACE and 10,159 (87.7%) were discharged from usual care. The groups were similar in age, sex, race and insurance status. Compared with the usual-care group, ACE patients had a higher median comorbidity score (3 vs 2 for usual care) and higher rates for anemia, dementia, fluid and electrolyte disorders, hypertension, and chronic obstructive pulmonary disease (COPD). However, ACE patients had lower rates of hemiplegia (0.9% vs 3%), arrhythmias, and pulmonary circulation disorders than those with usual care (Table 1).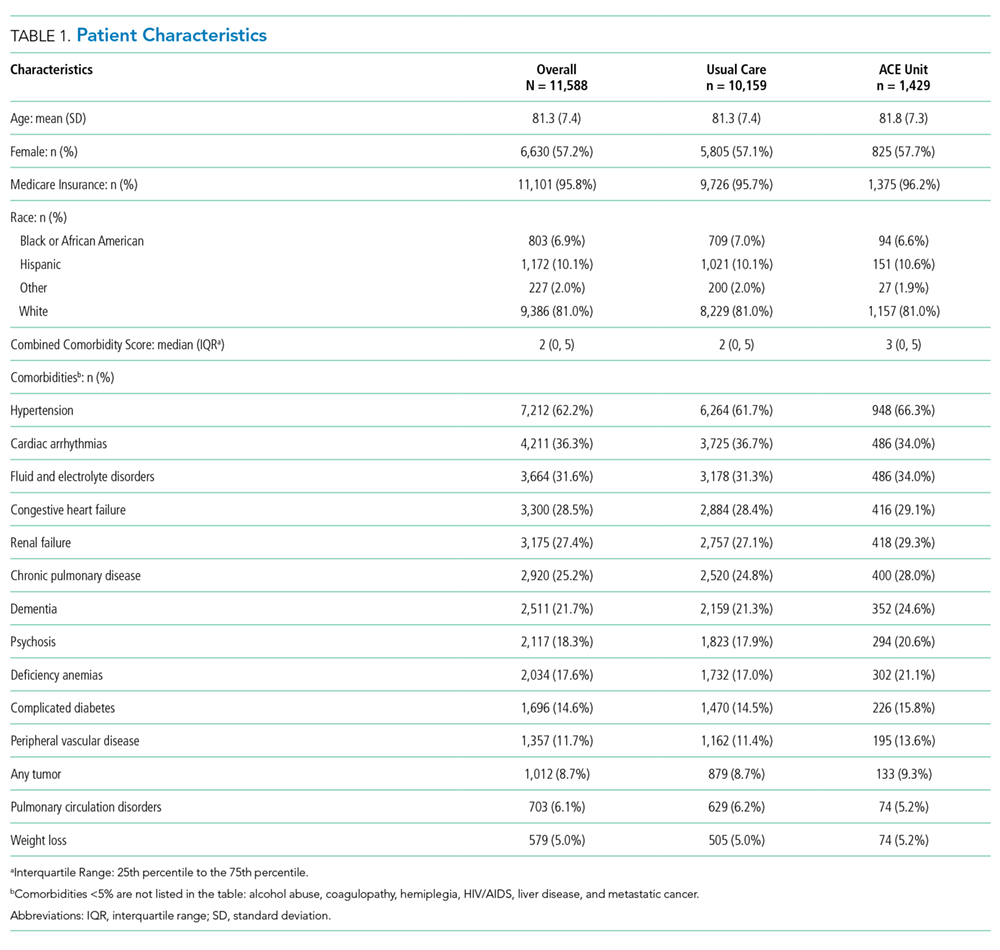
The median cost per ACE patient was slightly lower at $6,258 (interquartile range [IQR] = $4,683-$8,547) versus $6,858 (IQR = $4,855-$10,478) in usual care. Across the cost distribution, the ACE program had lower costs than usual care; however, these differences became more pronounced at the higher end of the distribution. For example, compared with the ACE group, the usual-care group’s unadjusted cost difference was $171 higher at the 25th percentile, $600 higher at the median, $1,932 higher at the 75th percentile, and $3,687 higher at the 90th percentile. The ACE median LOS was 3.7 days (IQR = 2.7-5.0) compared with 3.8 days (IQR = 2.7-6.0) for non-ACE patients. Similar to cost, LOS differences rose at higher percentiles of the distribution, with shorter stays for the ACE patients within each grouping. Compared with the ACE group, the unadjusted LOS difference for usual-care patients ranged from 0 days at the 25th percentile to 0.2 day longer at the median, 1.0 day longer at the 75th percentile, and 1.9 days longer at the 90th percentile. For both cost and LOS models, estimates remained stable after adjusting for age and combined comorbidity score (Table 2).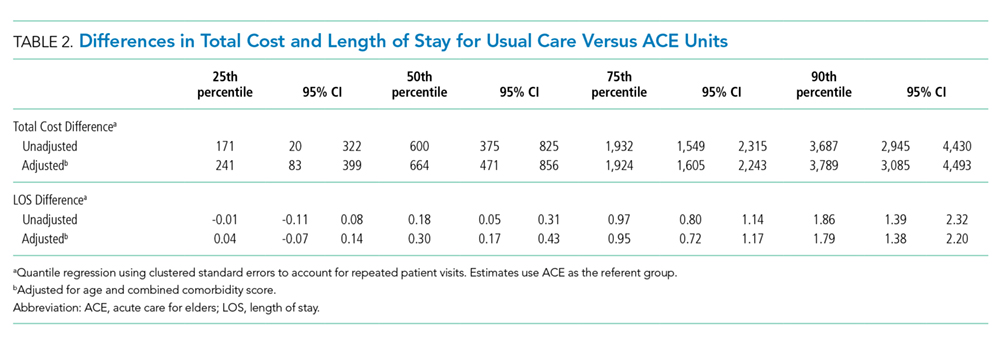
We explored the impact of increasing comorbidity burden on these outcomes using the following quartiles of the combined comorbidity score: −2 to 0 (387 ACE vs 3,322 usual-care patients), 1 to 2 (264 ACE vs 1,856 usual-care patients), 3 to 5 (476 ACE vs 2,859 usual-care patients), and 6 to 15 (301 ACE vs 2,122 usual-care patients). It was not surprising that cost and LOS paralleled each other, with the greatest cost and LOS benefits in the highest quartile of the combined comorbidity score (Figure 1). For example, at the 90th percentile, the cost difference approached $6,000 higher for the usual-care group in the top quartile of combined comorbidity score compared with nearly $3,000 higher for the lowest quartile. Similarly, at the 90th percentile, LOS for usual-care patients was 2.9 days longer at the top quartile compared with 1.7 days longer at the lowest quartile.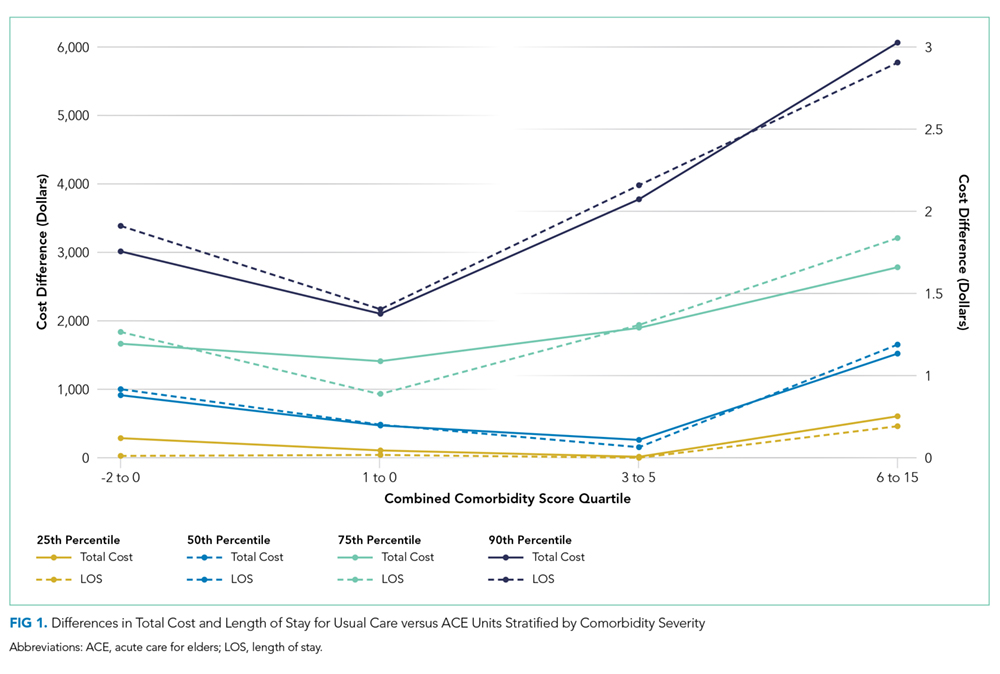
The all-cause 30-day readmission risk was similar for both groups, with an absolute risk difference of −0.7% (95% CI = −2.6% to 1.3%). Adjustment for age and comorbidity score did not substantially change this result. Following stratification by quartile of combined comorbidity scores, we observed similar readmission risks at each quartile (Figure 2).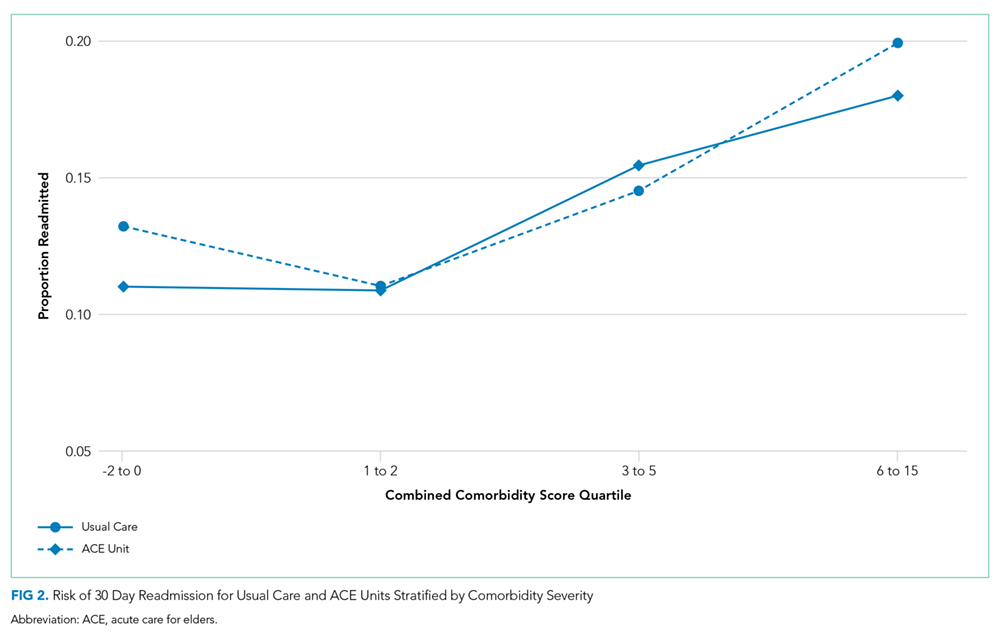
DISCUSSION
This quality improvement initiative evaluated which ACE admissions yielded the greatest value and found the largest reductions in LOS and cost in patients with the greatest comorbidity scores (frequently referred to as “high need, high cost”).23,24 Based on prior literature, we had anticipated that moderate risk patients would show the maximum benefit.15,25 In contrast to our findings, a University of Alabama (UAB) ACE program subgroup analysis using the CMS Case Mix Index (CMI) found a cost reduction for patients with low or intermediate CMI scores but not for those with high scores.15 The Hospital Elder Life Program (HELP) has yielded maximal impact for patients at moderate risk for delirium.26 Our results are supported by a University of Texas, Houston, study revealing lower LOS and cost for ACE patients, despite high CMI scores and endemic frailty, although it did not report outcomes across a range of comorbidities or costs.27 Our results may be determined by the specific characteristics of the Baystate ACE initiative. Our emphasis on considering prognosis and encouraging advance care planning could have contributed to the improved metrics for more complicated patients. It is possible that patients with high comorbidity burden were more likely to screen in with the surprise question, leading to more frequent goals of care discussions by the hospitalists or geriatrics team, which, in turn, may have resulted in less aggressive care and consequently lower costs. The emphasis on prognosis and palliative care was not a feature of the UAB or Texas studies. Additional components, such as the delirium screening and the presence of volunteer advocates, could also have impacted the results. Our tiered approach during rounds with rapid reviews for most patients and longer discussions for those at highest risk may have further contributed to the findings. Finally, although we did not track the recommendation acceptance rate for the entire study period, in the first 9 months of the project, 9,325 recommendations were made with an acceptance rate of >85%. We previously reported a similar acceptance rate for medication recommendations.28 Another factor contributing to our results may be the ways in which we categorized patients and calculated costs. We used the Gagne combined comorbidity score, which includes only prior conditions;21 the UAB study used CMI, which includes severity of presenting illness and complications, as well as baseline comorbidities. We also compared total cost, while UAB reported variable direct cost.
This study has a number of limitations. First, it was conducted at a single site and may not apply to other hospitals. Second, as a quality improvement program, its design, processes, and personnel evolved over time, and, as in any multicomponent initiative, the effect of individual factors on the outcomes is unknown. Third, this is an observational study with the aim of generating hypotheses for more rigorous studies in the future and residual confounding factors may exist despite efforts to adjust for variables present in an administrative database. Thus, we were unable to completely adjust for potentially important social factors, presence of delirium, or baseline functional status.
To our knowledge, this study is the first report on the differential impact of comorbidity scores and cost distribution on ACE total cost and LOS reductions. Despite its limitations, it contributes to the existing literature by suggesting that the Gagne comorbidity score can help identify which admissions will yield the greatest value. The Gagne score could be calculated at admission using the ePrognosis risk calculator or incorporated and automated in the EMR.29 Many health systems are reluctant to designate beds for specific subpopulations since doing so decreases flexibility and complicates the admission process. A dynamic tension exists between increasing income streams now and generating future savings by supporting initiatives with upfront costs. Other successful acute care geriatrics programs, such as NICHE,30 HELP,31 MACE,32 and consultation teams, exist.33 Studies reporting the outcomes of combining ACE units with these other approaches in a “portfolio approach” will inform the design of the most efficient and impactful programs.34 Scrupulous attention to symptom control and advance care planning are key features of our program, and, given the high prevalence of advanced serious illness in hospitalized older adults, this consideration may be critical for success.
As ACE units can only care for a small fraction of hospitalized older adults, determining which patients will maximally benefit from the structured, team-based care on ACE units is crucial. We found that the greatest impact on LOS and costs occurred in the subgroup with the highest comorbidity scores and overall cost. ACE care for the most vulnerable patients appeared to yield the greatest value for the system; thus, these older adults may need to be prioritized for admission. This improvement may enhance quality and value outcomes, maximize a scarce resource, and secure results needed to sustain the “clinician-led and data-driven” ACE model in the face of changing clinical and financial landscapes.35
Acknowledgments
All those with significant contributions to this work are included as authors.
The authors express their deep appreciation to all their Baystate collaborators, particularly to Rebecca Starr, MD, the first geriatrics medical director of the program, Ms. Virginia Chipps, RN, the program’s first nurse manager, and Tasmiah Chowdhury, PharmD, the program’s first pharmacist. We are also deeply grateful to those persons who provided programmatic advice and input on model ACE programs elsewhere, including Kyle Allen, MD, Michael Malone MD, Robert Palmer MD, and, especially, Kellie Flood, MD.
Disclosures
None of the authors have any existing or potential personal or financial conflicts relevant to this paper to report.
Funding
This work was supported in part by a Geriatric Workforce Enhancement Program award (grant # U1QHP28702) from the Health Resources and Services Administration and by internal support from Baystate Health
1. National Hospital Survey: number and rate of hospital discharge 2010 table. 2010; https://www.cdc.gov/nchs/fastats/hospital.htm. Accessed February, 10th 2019.
2. Brennan TA, Leape LL, Laird NM, Hebert L, Localio AR, Lawthers AG, Newhouse JP, Weiler PC, Hiatt HH. Incidence of adverse events and negligence in hospitalized patients. results of the Harvard medical practice study I. N Engl J Med. 1991;324(6):370-376. https://doi.org/10.1056/NEJM199102073240604.
3. Creditor MC. Hazards of hospitalization of the elderly. Ann Intern Med. 1993;118(3):219-223. PubMed
4. Levinson D. Adverse vents in hospitals: National incidence among Medicare beneficiaries; US Department of Health and Human Services, Office of the Inspector General 2010. Accessed February, 10th, 2019.
5. Palmer RM, Counsell S, Landefeld CS. Clinical intervention trials: the ACE unit. Clin Geriatr Med. 1998;14(4):831-849. PubMed
6. Landefeld CS. Foreword. In: Malone ML, Palmer MR, Capezuti E, eds. Acute Care for Elders New York Humana Press; 2014:v-xii.
7. Fox MT, Persaud M, Maimets I, O’Brien K, Brooks D, Tregunno D, Schraa E. Effectiveness of acute geriatric unit care using acute care for elders components: a systematic review and meta-analysis. J Am Geriatr Soc. 2012;60(12):2237-2245. https://doi.org/10.1111/jgs.12028.
8. Landefeld CS, Palmer RM, Kresevic DM, Fortinsky RH, Kowal J. A randomized trial of care in a hospital medical unit especially designed to improve the functional outcomes of acutely ill older patients. N Engl J Med. 1995;332(20):1338-1344. https://doi.org/10.1056/NEJM199505183322006.
9. Covinsky KE, King JT, Jr., Quinn LM, Siddique R, Palmer R, Kresevic DM, Fortinsky RH, Kowal J, Landefeld CS. Do acute care for elders units increase hospital costs? A cost analysis using the hospital perspective. J Am Geriatr Soc. 1997;45(6):729-734. PubMed
10. Counsell SR, Holder CM, Liebenauer LL, Palmer RM, Fortinsky RH, Kresevic DM, Quinn LM, Allen KR, Covinsky KE, Landefeld CS. Effects of a multicomponent intervention on functional outcomes and process of care in hospitalized older patients: a randomized controlled trial of Acute Care for Elders (ACE) in a community hospital. J Am Geriatr Soc. 2000;48(12):1572-1581. PubMed
11. Asplund K, Gustafson Y, Jacobsson C, Bucht G, Wahlin A, Peterson J, Blom JO, Angquist KA. Geriatric-based versus general wards for older acute medical patients: a randomized comparison of outcomes and use of resources. J Am Geriatr Soc. 2000;48(11):1381-1388. PubMed
12. Saltvedt I, Mo ES, Fayers P, Kaasa S, Sletvold O. Reduced mortality in treating acutely sick, frail older patients in a geriatric evaluation and management unit. A prospective randomized trial. J Am Geriatr Soc. 2002;50(5):792-798. PubMed
13. Jayadevappa R, Chhatre S, Weiner M, Raziano DB. Health resource utilization and medical care cost of Acute Care Elderly unit patients. Value Health. 2006;9(3):186-192. https://doi.org/10.1111/j.1524-4733.2006.00099.x.
14. Barnes DE, Palmer RM, Kresevic DM, Fortinsky RH, Kowal J, Chren MM, Landefeld CS. Acute Care for Elders units produced shorter hospital stays at lower cost while maintaining patients’ functional status. Health Aff (Millwood). 2012;31(6):1227-1236. https://doi.org/10.1377/hlthaff.2012.0142.
15. Flood KL, Maclennan PA, McGrew D, Green D, Dodd C, Brown CJ. Effects of an Acute Care for Elders unit on costs and 30-day readmissions. JAMA Intern Med. 2013;173(11):981-987. https://doi.org/10.1001/jamainternmed.2013.524.
16. Fox MT, Sidani S, Persaud M, Tregunno D, Maimets I, Brooks D, O’Brien K. Acute Care for Elders components of acute geriatric unit care: systematic descriptive review. J Am Geriatr Soc. 2013;61(6):939-946. https://doi.org/10.1111/jgs.12282.
17. Palmer MR, Kresevic DM. The Acute Care for Elders unit In: Malone ML, Palmer MR, Capezuti E, eds. Acute Care for Elders New York: Humana Press 2014:92.
18. Pierluissi E, Francis D, Covinsky KE. Patient and hospital factors that lead to adverse outcomes in hospitalized elders In: Malone ML, Palmer MR, Capezuti E, eds. Acute Care for Elders New York: Humana Press 2014:42.
19. Fulmer T. How to try this: Fulmer SPICES. Am J Nurs. 2007;107(10):40-48; quiz 48-49. https://doi.org/10.1097/01.NAJ.0000292197.76076.e1.
20. Downar J, Goldman R, Pinto R, Englesakis M, Adhikari NK. The “surprise question” for predicting death in seriously ill patients: a systematic review and meta-analysis. CMAJ. 2017;189(13):E484-E493. https://doi.org/10.1503/cmaj.160775.
21. Gagne JJ, Glynn RJ, Avorn J, Levin R, Schneeweiss S. A combined comorbidity score predicted mortality in elderly patients better than existing scores. J Clin Epidemiol. 2010;64(7):749-759. doi: 10.1016/j.jclinepi.2010.10.004.
22. Segal JB, Chang HY, Du Y, Walston JD, Carlson MC, Varadhan R. Development of a claims-based frailty indicator anchored to a well-established frailty phenotype. Med Care. 2017;55(7):716-722. https://doi.org/10.1097/MLR.0000000000000729.
23. Blumenthal D, Chernof B, Fulmer T, Lumpkin J, Selberg J. Caring for high-need, high-cost patients - an urgent priority. N Engl J Med. 2016;375(10):909-911. https://doi.org/10.1056/NEJMp1804276.
24. Blumenthal D. Caring for high-need, high-cost patients: what makes for a successful care management program? . https://www.commonwealthfund.org/publications/journal-article/2016/jul/caring-high-need-high-cost-patients-urgent-priority. Accessed March, 20th 2019.
25. Ahmed NN, Pearce SE. Acute Care for the Elderly: a literature review. Popul Health Manag. 2010;13(4):219-225. https://doi.org/10.1089/pop.2009.0058.
26. Inouye SK, Bogardus ST, Jr., Charpentier PA, Leo-Summers L, Acampora D, Holford TR, Cooney LM, Jr. A multicomponent intervention to prevent delirium in hospitalized older patients. N Engl J Med. 1999;340(9):669-676. https://doi.org/10.1056/NEJM199903043400901.
27. Ahmed N, Taylor K, McDaniel Y, Dyer CB. The role of an Acute Care for the Elderly unit in achieving hospital quality indicators while caring for frail hospitalized elders. Popul Health Manag. 2012;15(4):236-240. https://doi.org/10.1089/pop.2011.0055.
28. Chowdhury TP, Starr R, Brennan M, Knee A, Ehresman M, Velayutham L, Malanowski AJ, Courtney HA, Stefan MS. A quality improvement initiative to improve medication management in an Acute Care for Elders program through integration of a clinical pharmacist. J Pharm Pract. 2018:897190018786618. https://doi.org/10.1177/0897190018786618.
29. Lee S, Smith A, Widera E. ePrognosis -Gagne index. https://eprognosis.ucsf.edu/gagne.php. Accessed March 20th, 2019.
30. Turner JT, Lee V, Fletcher K, Hudson K, Barton D. Measuring quality of care with an inpatient elderly population. The geriatric resource nurse model. J Gerontol Nurs. 2001;27(3):8-18. PubMed
31. Hshieh TT, Yang T, Gartaganis SL, Yue J, Inouye SK. Hospital Elder Life Program: systematic review and meta-analysis of effectiveness. Am J Geriatr Psychiatry. 2018;26(10):1015-1033. https://doi.org/10.1016/j.jagp.2018.06.007.
32. Hung WW, Ross JS, Farber J, Siu AL. Evaluation of the Mobile Acute Care of the Elderly (MACE) service. JAMA Intern Med. 2013;173(11):990-996. https://doi.org/10.1001/jamainternmed.2013.478.
33. Sennour Y, Counsell SR, Jones J, Weiner M. Development and implementation of a proactive geriatrics consultation model in collaboration with hospitalists. J Am Geriatr Soc. 2009;57(11):2139-2145. https://doi.org/10.1111/j.1532-5415.2009.02496.x.
34. Capezuti E, Boltz M. An overview of hospital-based models of care. In: Malone ML, Palmer MR, Capezuti E, eds. Acute Care for Elders. New York: Humana Press 2014:49-68.
35. Malone ML, Yoo JW, Goodwin SJ. An introduction to the Acute Care for Elders In: Malone ML, Palmer MR, Capezuti E, eds. Acute Care for Elders New York: Humana Press 2014:1-9.
In 2016, 15.2% of older Americans were hospitalized compared with 7% of the overall population and their length of stay (LOS) was 0.7 days greater.1 Geriatric hospitalizations frequently result in complications, functional decline, nursing home transfers, and increased cost.2-4 This pattern of decline has been termed “hospitalitis” or dysfunctional syndrome.5,6 Hospitals need data-driven approaches to improve outcomes for elders. The Acute Care for Elders (ACE) program, which has been in existence for roughly 25 years, is one such model. ACE features include an environment prepared for older adults, patient-centered care to prevent functional and cognitive decline, frequent medical review to prevent iatrogenic injury or new geriatric syndromes, and early discharge and rehabilitation planning to maximize the likelihood of return to the community.7 Although published data vary somewhat, ACE programs have robust evidence documenting improved safety, quality, and value.8-15 A recent meta-analysis found that ACE programs decrease LOS, costs, new nursing home discharges, falls, delirium, and functional decline.16 However, of the 13 ACE trials reported to date, only five were published in the last decade. Recent rising pressure to decrease hospitalizations and reduce LOS has shifted some care to other settings and it is unclear whether the same results would persist in today’s rapid-paced hospitals.
ACE programs require enhanced resources and restructured care processes but there is a notable lack of data to guide patient selection. Admission criteria vary among the published reports, and information on whether comorbidity burden impacts the magnitude of benefit is scarce. One ACE investigator commented, “We were not able to identify a subgroup of patients who were most likely to benefit.”17 Not all hospitalized older adults can receive ACE care, and some units have closed due to financial and logistic pressures; thus, criteria to target this scarce resource are urgently needed. Our hospital implemented an ACE program in 2014 and we have measured and internally benchmarked important quality improvement metrics. Using this data, we conducted an exploratory analysis to generate hypotheses on the differential impact across the spectrum of cost, LOS, 30-day readmissions, and variations across quartiles of comorbidity severity.
METHODS
Setting and Patients
In September 2014, our 716-bed teaching hospital in Springfield, Massachusetts launched an ACE program to improve care for older adults on a single medical unit. The program succeeded in engaging the senior leadership, and geriatrics was identified as a priority in Baystate’s 5-year strategic plan. ACE patients ≥70 years were admitted from the emergency department with inpatient status. Patients transferred from other units or with advanced dementia or nearing death were excluded. Core components of the ACE program were derived from published summaries (see supplementary material).7,16
Interprofessional ”ACE Rounds”
Interprofessional ACE Rounds occurred every weekday. As one ACE analyst has noted, “the interdisciplinary team…ensures that the multifactorial nature of functional decline is met with a multicomponent plan to prevent it.”18 Rounds participants shifted over time but always included a geriatrics physician assistant (PA) or geriatrician (team leader), a pharmacist, staff nurses, and a chaplain. The nurse educator, dietician, research assistant, and patient advocate/volunteers attended intermittently. Before rounds, the PA reviewed the admission notes for new ACE patients. Initially, rounds were lengthy and included nurse coaching. Later, nurses’ presentations were structured by the SPICES tool (Sleep, Problems with eating/feeding, Incontinence, Confusion, Evidence of falls, Skin Breakdown)19 and tracking and reporting templates. Coaching and education, along with conversations that did not require the full team, were removed from rounds. Thus, the time required for rounds declined from about 75 minutes to 35 minutes, which allowed more patients to be discussed efficiently. This change was critical as the number of ACE patients rose following the shift to the larger unit. The pharmacist reviewed medications focusing on potentially inappropriate drugs. Following rounds, the nurses and pharmacist conveyed recommendations to the hospitalists.
Patient-Centered Activities to Prevent Functional and Cognitive Decline
Project leaders coached staff about the importance of mobility, sleep, and delirium prevention and identification. The nurses screened patients using the Confusion Assessment Method (CAM) and reported delirium promptly. Specific care sets for ACE patients were implemented (see supplementary material).
The project was enhanced by several palliative care components, ie tracking pain, noting psychiatric symptoms, and considering prognosis by posing the “Surprise Question” during rounds.20 (“Would you be surprised if this patient died in the next year?”). As far as staffing and logistics allowed, the goals of care conversation were held by a geriatrics PA with patients/families who “screened in.”
Prepared Environment
The ACE program’s unit was remodeled to facilitate physical and cognitive functioning and promote sleep at night (quiet hours: 10 PM-6 AM).
In accordance with quality improvement processes, iterative shifts were implemented over time in terms of checklist, presentation format, timing, and team participation. In December 2016, the program relocated to a unit with 34 ACE beds and 5 end-of-life beds; this move markedly increased the number of eligible ACE patients.
Study Design, Data Source, and Patients
Since we were implementing and measuring our ACE program with a quality improvement lens, we chose a descriptive cross-sectional study design to generate hypotheses regarding our program’s impact compared to usual care. Using a hospital-wide billing database (McKesson Performance Analytics, v19, Alpharetta, Georgia) we sampled inpatients aged >70 years with a medical Diagnosis Related Group (DRGs) admitted through the emergency department and discharged from a medical unit from September 22, 2014 to August 31, 2017. These criteria mirrored those in the ACE unit. Older adults requiring specialized care (eg, those with myocardial infarct) were excluded, as were those with billing codes for mechanical ventilation, admission to critical care units, or discharge to hospice. Because one of our outcomes was readmission, we excluded patients who died during hospitalization. Patient characteristics collected included demographics and insurance category. To evaluate comorbidity burden, we collected ICD-9/ICD-10 diagnostic codes and generated a combined comorbidity score as described by Gagne, et al.21 This score was devised to predict mortality and 30-day readmissions and had better predictive ability in elders than the Elixhauser or Charlson scores. Scores ranged from −2 to 26, although values >20 are rare.
Exposure
Subjects were categorized as either discharged from the ACE or discharged from usual care. ACE discharges were tracked daily on a spreadsheet that was linked into our sample of eligible subjects.
Outcomes
Total cost of hospitalization (direct plus indirect costs), LOS, and all-cause 30-day readmissions were queried from the same billing database.
Statistical Analysis
As this study was a quality improvement project, analyses were descriptive and exploratory; no statistical hypothesis testing was conducted. We initially evaluated subject characteristics and comorbidities across study groups to determine group balance and comparability using means and standard deviations for continuous data and frequencies and percentages for categorical data. To analyze total cost and LOS, we utilized quantile regression with clustered standard errors to account for clustering by patient. We calculated the median difference between hospitalization cost and LOS for usual care versus ACE patients (with ACE as the referent group). To explore variations across the distributions of outcomes, we determined differences in cost and LOS and their 95% confidence intervals at the 25th, 50th, 75th, and 90th percentiles. Thirty-day readmission risk was estimated using a generalized estimating equation model with a logit link and binomial family. Readmission risk is presented along with 95% confidence intervals. For all models, we initially evaluated change over time (by quarter). After establishing the absence of time trends, we collapsed results into a comparison of usual care versus ACE care. Model estimates are presented both unadjusted and adjusted for age and comorbidity score. Following our initial analyses of cost, LOS, and 30-day readmission risk; we explored differences across quartiles of combined comorbidity scores. We used the same unadjusted models described above but incorporated an interaction term to generate estimates stratified by quartile of comorbidity score. We performed two additional analyses to evaluate the robustness of our findings. First, because hemiplegia prevalence was higher in the usual-care group than in the ACE group and can result in higher cost of care, we repeated the analysis after excluding those patients with hemiplegia. Second, because we were unable to control for functional capacity in the entire sample, we evaluated group differences in mobility for a subsample obtained prior to October 2015 using ICD-9 diagnostic codes, which can be considered surrogate markers for mobility.22 The results of our first analysis did not substantively change our main findings; in our second analysis, groups were balanced by mobility factors which suggested that confounding by functional capacity would be limited in our full sample. The results of these analyses are reported in the supplemental material.
Analysis was completed using Stata v15.1 (StataCorp, LP College Station, Texas). The Baystate Medical Center Institutional Review Board determined that the initiative was quality improvement and “not research.”
RESULTS
A total of 13,209 patients met the initial inclusion criteria; 1,621 were excluded, resulting in a sample of 11,588 patients. Over the 3-year study period, 1,429 (12.3%) were discharged from ACE and 10,159 (87.7%) were discharged from usual care. The groups were similar in age, sex, race and insurance status. Compared with the usual-care group, ACE patients had a higher median comorbidity score (3 vs 2 for usual care) and higher rates for anemia, dementia, fluid and electrolyte disorders, hypertension, and chronic obstructive pulmonary disease (COPD). However, ACE patients had lower rates of hemiplegia (0.9% vs 3%), arrhythmias, and pulmonary circulation disorders than those with usual care (Table 1).
The median cost per ACE patient was slightly lower at $6,258 (interquartile range [IQR] = $4,683-$8,547) versus $6,858 (IQR = $4,855-$10,478) in usual care. Across the cost distribution, the ACE program had lower costs than usual care; however, these differences became more pronounced at the higher end of the distribution. For example, compared with the ACE group, the usual-care group’s unadjusted cost difference was $171 higher at the 25th percentile, $600 higher at the median, $1,932 higher at the 75th percentile, and $3,687 higher at the 90th percentile. The ACE median LOS was 3.7 days (IQR = 2.7-5.0) compared with 3.8 days (IQR = 2.7-6.0) for non-ACE patients. Similar to cost, LOS differences rose at higher percentiles of the distribution, with shorter stays for the ACE patients within each grouping. Compared with the ACE group, the unadjusted LOS difference for usual-care patients ranged from 0 days at the 25th percentile to 0.2 day longer at the median, 1.0 day longer at the 75th percentile, and 1.9 days longer at the 90th percentile. For both cost and LOS models, estimates remained stable after adjusting for age and combined comorbidity score (Table 2).
We explored the impact of increasing comorbidity burden on these outcomes using the following quartiles of the combined comorbidity score: −2 to 0 (387 ACE vs 3,322 usual-care patients), 1 to 2 (264 ACE vs 1,856 usual-care patients), 3 to 5 (476 ACE vs 2,859 usual-care patients), and 6 to 15 (301 ACE vs 2,122 usual-care patients). It was not surprising that cost and LOS paralleled each other, with the greatest cost and LOS benefits in the highest quartile of the combined comorbidity score (Figure 1). For example, at the 90th percentile, the cost difference approached $6,000 higher for the usual-care group in the top quartile of combined comorbidity score compared with nearly $3,000 higher for the lowest quartile. Similarly, at the 90th percentile, LOS for usual-care patients was 2.9 days longer at the top quartile compared with 1.7 days longer at the lowest quartile.
The all-cause 30-day readmission risk was similar for both groups, with an absolute risk difference of −0.7% (95% CI = −2.6% to 1.3%). Adjustment for age and comorbidity score did not substantially change this result. Following stratification by quartile of combined comorbidity scores, we observed similar readmission risks at each quartile (Figure 2).
DISCUSSION
This quality improvement initiative evaluated which ACE admissions yielded the greatest value and found the largest reductions in LOS and cost in patients with the greatest comorbidity scores (frequently referred to as “high need, high cost”).23,24 Based on prior literature, we had anticipated that moderate risk patients would show the maximum benefit.15,25 In contrast to our findings, a University of Alabama (UAB) ACE program subgroup analysis using the CMS Case Mix Index (CMI) found a cost reduction for patients with low or intermediate CMI scores but not for those with high scores.15 The Hospital Elder Life Program (HELP) has yielded maximal impact for patients at moderate risk for delirium.26 Our results are supported by a University of Texas, Houston, study revealing lower LOS and cost for ACE patients, despite high CMI scores and endemic frailty, although it did not report outcomes across a range of comorbidities or costs.27 Our results may be determined by the specific characteristics of the Baystate ACE initiative. Our emphasis on considering prognosis and encouraging advance care planning could have contributed to the improved metrics for more complicated patients. It is possible that patients with high comorbidity burden were more likely to screen in with the surprise question, leading to more frequent goals of care discussions by the hospitalists or geriatrics team, which, in turn, may have resulted in less aggressive care and consequently lower costs. The emphasis on prognosis and palliative care was not a feature of the UAB or Texas studies. Additional components, such as the delirium screening and the presence of volunteer advocates, could also have impacted the results. Our tiered approach during rounds with rapid reviews for most patients and longer discussions for those at highest risk may have further contributed to the findings. Finally, although we did not track the recommendation acceptance rate for the entire study period, in the first 9 months of the project, 9,325 recommendations were made with an acceptance rate of >85%. We previously reported a similar acceptance rate for medication recommendations.28 Another factor contributing to our results may be the ways in which we categorized patients and calculated costs. We used the Gagne combined comorbidity score, which includes only prior conditions;21 the UAB study used CMI, which includes severity of presenting illness and complications, as well as baseline comorbidities. We also compared total cost, while UAB reported variable direct cost.
This study has a number of limitations. First, it was conducted at a single site and may not apply to other hospitals. Second, as a quality improvement program, its design, processes, and personnel evolved over time, and, as in any multicomponent initiative, the effect of individual factors on the outcomes is unknown. Third, this is an observational study with the aim of generating hypotheses for more rigorous studies in the future and residual confounding factors may exist despite efforts to adjust for variables present in an administrative database. Thus, we were unable to completely adjust for potentially important social factors, presence of delirium, or baseline functional status.
To our knowledge, this study is the first report on the differential impact of comorbidity scores and cost distribution on ACE total cost and LOS reductions. Despite its limitations, it contributes to the existing literature by suggesting that the Gagne comorbidity score can help identify which admissions will yield the greatest value. The Gagne score could be calculated at admission using the ePrognosis risk calculator or incorporated and automated in the EMR.29 Many health systems are reluctant to designate beds for specific subpopulations since doing so decreases flexibility and complicates the admission process. A dynamic tension exists between increasing income streams now and generating future savings by supporting initiatives with upfront costs. Other successful acute care geriatrics programs, such as NICHE,30 HELP,31 MACE,32 and consultation teams, exist.33 Studies reporting the outcomes of combining ACE units with these other approaches in a “portfolio approach” will inform the design of the most efficient and impactful programs.34 Scrupulous attention to symptom control and advance care planning are key features of our program, and, given the high prevalence of advanced serious illness in hospitalized older adults, this consideration may be critical for success.
As ACE units can only care for a small fraction of hospitalized older adults, determining which patients will maximally benefit from the structured, team-based care on ACE units is crucial. We found that the greatest impact on LOS and costs occurred in the subgroup with the highest comorbidity scores and overall cost. ACE care for the most vulnerable patients appeared to yield the greatest value for the system; thus, these older adults may need to be prioritized for admission. This improvement may enhance quality and value outcomes, maximize a scarce resource, and secure results needed to sustain the “clinician-led and data-driven” ACE model in the face of changing clinical and financial landscapes.35
Acknowledgments
All those with significant contributions to this work are included as authors.
The authors express their deep appreciation to all their Baystate collaborators, particularly to Rebecca Starr, MD, the first geriatrics medical director of the program, Ms. Virginia Chipps, RN, the program’s first nurse manager, and Tasmiah Chowdhury, PharmD, the program’s first pharmacist. We are also deeply grateful to those persons who provided programmatic advice and input on model ACE programs elsewhere, including Kyle Allen, MD, Michael Malone MD, Robert Palmer MD, and, especially, Kellie Flood, MD.
Disclosures
None of the authors have any existing or potential personal or financial conflicts relevant to this paper to report.
Funding
This work was supported in part by a Geriatric Workforce Enhancement Program award (grant # U1QHP28702) from the Health Resources and Services Administration and by internal support from Baystate Health
1. National Hospital Survey: number and rate of hospital discharge 2010 table. 2010; https://www.cdc.gov/nchs/fastats/hospital.htm. Accessed February, 10th 2019.
2. Brennan TA, Leape LL, Laird NM, Hebert L, Localio AR, Lawthers AG, Newhouse JP, Weiler PC, Hiatt HH. Incidence of adverse events and negligence in hospitalized patients. results of the Harvard medical practice study I. N Engl J Med. 1991;324(6):370-376. https://doi.org/10.1056/NEJM199102073240604.
3. Creditor MC. Hazards of hospitalization of the elderly. Ann Intern Med. 1993;118(3):219-223. PubMed
4. Levinson D. Adverse vents in hospitals: National incidence among Medicare beneficiaries; US Department of Health and Human Services, Office of the Inspector General 2010. Accessed February, 10th, 2019.
5. Palmer RM, Counsell S, Landefeld CS. Clinical intervention trials: the ACE unit. Clin Geriatr Med. 1998;14(4):831-849. PubMed
6. Landefeld CS. Foreword. In: Malone ML, Palmer MR, Capezuti E, eds. Acute Care for Elders New York Humana Press; 2014:v-xii.
7. Fox MT, Persaud M, Maimets I, O’Brien K, Brooks D, Tregunno D, Schraa E. Effectiveness of acute geriatric unit care using acute care for elders components: a systematic review and meta-analysis. J Am Geriatr Soc. 2012;60(12):2237-2245. https://doi.org/10.1111/jgs.12028.
8. Landefeld CS, Palmer RM, Kresevic DM, Fortinsky RH, Kowal J. A randomized trial of care in a hospital medical unit especially designed to improve the functional outcomes of acutely ill older patients. N Engl J Med. 1995;332(20):1338-1344. https://doi.org/10.1056/NEJM199505183322006.
9. Covinsky KE, King JT, Jr., Quinn LM, Siddique R, Palmer R, Kresevic DM, Fortinsky RH, Kowal J, Landefeld CS. Do acute care for elders units increase hospital costs? A cost analysis using the hospital perspective. J Am Geriatr Soc. 1997;45(6):729-734. PubMed
10. Counsell SR, Holder CM, Liebenauer LL, Palmer RM, Fortinsky RH, Kresevic DM, Quinn LM, Allen KR, Covinsky KE, Landefeld CS. Effects of a multicomponent intervention on functional outcomes and process of care in hospitalized older patients: a randomized controlled trial of Acute Care for Elders (ACE) in a community hospital. J Am Geriatr Soc. 2000;48(12):1572-1581. PubMed
11. Asplund K, Gustafson Y, Jacobsson C, Bucht G, Wahlin A, Peterson J, Blom JO, Angquist KA. Geriatric-based versus general wards for older acute medical patients: a randomized comparison of outcomes and use of resources. J Am Geriatr Soc. 2000;48(11):1381-1388. PubMed
12. Saltvedt I, Mo ES, Fayers P, Kaasa S, Sletvold O. Reduced mortality in treating acutely sick, frail older patients in a geriatric evaluation and management unit. A prospective randomized trial. J Am Geriatr Soc. 2002;50(5):792-798. PubMed
13. Jayadevappa R, Chhatre S, Weiner M, Raziano DB. Health resource utilization and medical care cost of Acute Care Elderly unit patients. Value Health. 2006;9(3):186-192. https://doi.org/10.1111/j.1524-4733.2006.00099.x.
14. Barnes DE, Palmer RM, Kresevic DM, Fortinsky RH, Kowal J, Chren MM, Landefeld CS. Acute Care for Elders units produced shorter hospital stays at lower cost while maintaining patients’ functional status. Health Aff (Millwood). 2012;31(6):1227-1236. https://doi.org/10.1377/hlthaff.2012.0142.
15. Flood KL, Maclennan PA, McGrew D, Green D, Dodd C, Brown CJ. Effects of an Acute Care for Elders unit on costs and 30-day readmissions. JAMA Intern Med. 2013;173(11):981-987. https://doi.org/10.1001/jamainternmed.2013.524.
16. Fox MT, Sidani S, Persaud M, Tregunno D, Maimets I, Brooks D, O’Brien K. Acute Care for Elders components of acute geriatric unit care: systematic descriptive review. J Am Geriatr Soc. 2013;61(6):939-946. https://doi.org/10.1111/jgs.12282.
17. Palmer MR, Kresevic DM. The Acute Care for Elders unit In: Malone ML, Palmer MR, Capezuti E, eds. Acute Care for Elders New York: Humana Press 2014:92.
18. Pierluissi E, Francis D, Covinsky KE. Patient and hospital factors that lead to adverse outcomes in hospitalized elders In: Malone ML, Palmer MR, Capezuti E, eds. Acute Care for Elders New York: Humana Press 2014:42.
19. Fulmer T. How to try this: Fulmer SPICES. Am J Nurs. 2007;107(10):40-48; quiz 48-49. https://doi.org/10.1097/01.NAJ.0000292197.76076.e1.
20. Downar J, Goldman R, Pinto R, Englesakis M, Adhikari NK. The “surprise question” for predicting death in seriously ill patients: a systematic review and meta-analysis. CMAJ. 2017;189(13):E484-E493. https://doi.org/10.1503/cmaj.160775.
21. Gagne JJ, Glynn RJ, Avorn J, Levin R, Schneeweiss S. A combined comorbidity score predicted mortality in elderly patients better than existing scores. J Clin Epidemiol. 2010;64(7):749-759. doi: 10.1016/j.jclinepi.2010.10.004.
22. Segal JB, Chang HY, Du Y, Walston JD, Carlson MC, Varadhan R. Development of a claims-based frailty indicator anchored to a well-established frailty phenotype. Med Care. 2017;55(7):716-722. https://doi.org/10.1097/MLR.0000000000000729.
23. Blumenthal D, Chernof B, Fulmer T, Lumpkin J, Selberg J. Caring for high-need, high-cost patients - an urgent priority. N Engl J Med. 2016;375(10):909-911. https://doi.org/10.1056/NEJMp1804276.
24. Blumenthal D. Caring for high-need, high-cost patients: what makes for a successful care management program? . https://www.commonwealthfund.org/publications/journal-article/2016/jul/caring-high-need-high-cost-patients-urgent-priority. Accessed March, 20th 2019.
25. Ahmed NN, Pearce SE. Acute Care for the Elderly: a literature review. Popul Health Manag. 2010;13(4):219-225. https://doi.org/10.1089/pop.2009.0058.
26. Inouye SK, Bogardus ST, Jr., Charpentier PA, Leo-Summers L, Acampora D, Holford TR, Cooney LM, Jr. A multicomponent intervention to prevent delirium in hospitalized older patients. N Engl J Med. 1999;340(9):669-676. https://doi.org/10.1056/NEJM199903043400901.
27. Ahmed N, Taylor K, McDaniel Y, Dyer CB. The role of an Acute Care for the Elderly unit in achieving hospital quality indicators while caring for frail hospitalized elders. Popul Health Manag. 2012;15(4):236-240. https://doi.org/10.1089/pop.2011.0055.
28. Chowdhury TP, Starr R, Brennan M, Knee A, Ehresman M, Velayutham L, Malanowski AJ, Courtney HA, Stefan MS. A quality improvement initiative to improve medication management in an Acute Care for Elders program through integration of a clinical pharmacist. J Pharm Pract. 2018:897190018786618. https://doi.org/10.1177/0897190018786618.
29. Lee S, Smith A, Widera E. ePrognosis -Gagne index. https://eprognosis.ucsf.edu/gagne.php. Accessed March 20th, 2019.
30. Turner JT, Lee V, Fletcher K, Hudson K, Barton D. Measuring quality of care with an inpatient elderly population. The geriatric resource nurse model. J Gerontol Nurs. 2001;27(3):8-18. PubMed
31. Hshieh TT, Yang T, Gartaganis SL, Yue J, Inouye SK. Hospital Elder Life Program: systematic review and meta-analysis of effectiveness. Am J Geriatr Psychiatry. 2018;26(10):1015-1033. https://doi.org/10.1016/j.jagp.2018.06.007.
32. Hung WW, Ross JS, Farber J, Siu AL. Evaluation of the Mobile Acute Care of the Elderly (MACE) service. JAMA Intern Med. 2013;173(11):990-996. https://doi.org/10.1001/jamainternmed.2013.478.
33. Sennour Y, Counsell SR, Jones J, Weiner M. Development and implementation of a proactive geriatrics consultation model in collaboration with hospitalists. J Am Geriatr Soc. 2009;57(11):2139-2145. https://doi.org/10.1111/j.1532-5415.2009.02496.x.
34. Capezuti E, Boltz M. An overview of hospital-based models of care. In: Malone ML, Palmer MR, Capezuti E, eds. Acute Care for Elders. New York: Humana Press 2014:49-68.
35. Malone ML, Yoo JW, Goodwin SJ. An introduction to the Acute Care for Elders In: Malone ML, Palmer MR, Capezuti E, eds. Acute Care for Elders New York: Humana Press 2014:1-9.
© 2019 Society of Hospital Medicine
Retrospective Cohort Study of the Prevalence of Off-label Gabapentinoid Prescriptions in Hospitalized Medical Patients
In the1990s, gabapentin was licensed in the United States as an anticonvulsant and it became widely successful in the mid-2000s when marketed for the treatment of pain. Since then, prescriptions for gabapentinoids have accelerated dramatically.1,2 Between 2012 and 2016, the total spending on pregabalin in the United States increased from $1.9 to $4.4 billion, with pregabalin ranking eighth overall for specific drug spending.3
Despite a finite number of indications, there has been a steady rise in off-label use, with an increased risk of adverse drug events (ADEs).4,5 Several meta-analyses suggest either low-quality or no evidence of benefit for gabapentinoid use in settings including neuropathic pain in cancer, sciatica, and chronic low back pain.6-8 Lack of efficacy is compounded by adverse effects such as altered mental status, fluid retention, sedation, and increased risk of traumatic falls in older adults.6,9,10 Finally, dependency is a concern; opioids are coprescribed in up to 50% of patients,11 increasing the odds of opioid-related death by up to 60%.12
To better characterize gabapentinoid use in hospitalized patients, we analyzed a retrospective cohort of patients admitted to our tertiary care medical teaching unit, examining preadmission and in-hospital prescribing trends, off-label use, and deprescribing.
METHODS
Patient data were collected from a retrospective cohort, including all consecutive admissions to our 52-bed medical clinical teaching unit in Montréal, Canada, since December 2013.13 We reviewed admissions between December 17, 2013 and June 30, 2017 and identified three populations of gabapentinoid users from medication reconciliation documents: preadmission users continued at discharge, preadmission users deprescribed in hospital, and new in-hospital users continued at discharge. Deprescribing was defined as having the drug stopped at discharge or a prescribed taper that included stopping. The term “gabapentinoid users” refers to preadmission gabapentinoid use.
Gabapentinoid users were compared with nonusers with regard to demographic characteristics; select comorbidities; coprescription of opioids, benzodiazepines, and Z-drugs; length of stay (LOS); and inpatient mortality. Only the first eligible admission per patient was considered. Patients who had multiple admissions over the period of interest were classified as “users” in the patient-level analyses if they were taking a gabapentinoid at home or at discharge on at least one admission.
Doses and indications were collected from medication reconciliation performed by a clinical pharmacist, which included an interview with the patient or a proxy and a review of the indications for all drugs. These data were merged with any additional potential indications found in the admission notes (listing all chronic conditions from a detailed medical history) and review of the electronic medical record. The US Food and Drug Administration (FDA) approved the indications and the recommended doses were taken from product monographs and compared with doses prescribed to patients. When documented, the reason for new prescriptions and justification for deprescribing at discharge were manually abstracted from discharge summaries and medication reconciliation documents.
Continuous variables were expressed as median and interquartile range (IQR) and compared using the Wilcoxon rank-sum test. Categorical variables were compared using the χ2 test. Proportions of gabapentinoid use and deprescribing, including 95% confidence intervals around each proportion, were plotted and linear regression was performed versus fiscal quarter to evaluate for temporal trends. A two-sided α value of 0.05 was considered to be statistically significant. Statistical analyses were performed using Stata version 15 (StataCorp LLC, College Station, Texas). The McGill University Health Centre Research Ethics Board approved this study.
RESULTS
A total of 4,103 unique patients were admitted from December 2013 to July 2017, of whom 550 (13.4%) were receiving a gabapentinoid before admission. Two preadmission users were coprescribed gabapentin and pregabalin for a total of 552 prescriptions. The prevalence of preadmission gabapentinoid use remained steady during the period of interest (Appendix 1; P = .29 for temporal trend). There were no significant differences between gabapentinoid users and nonusers with regard to age or sex, but users had a higher prevalence of chronic disease (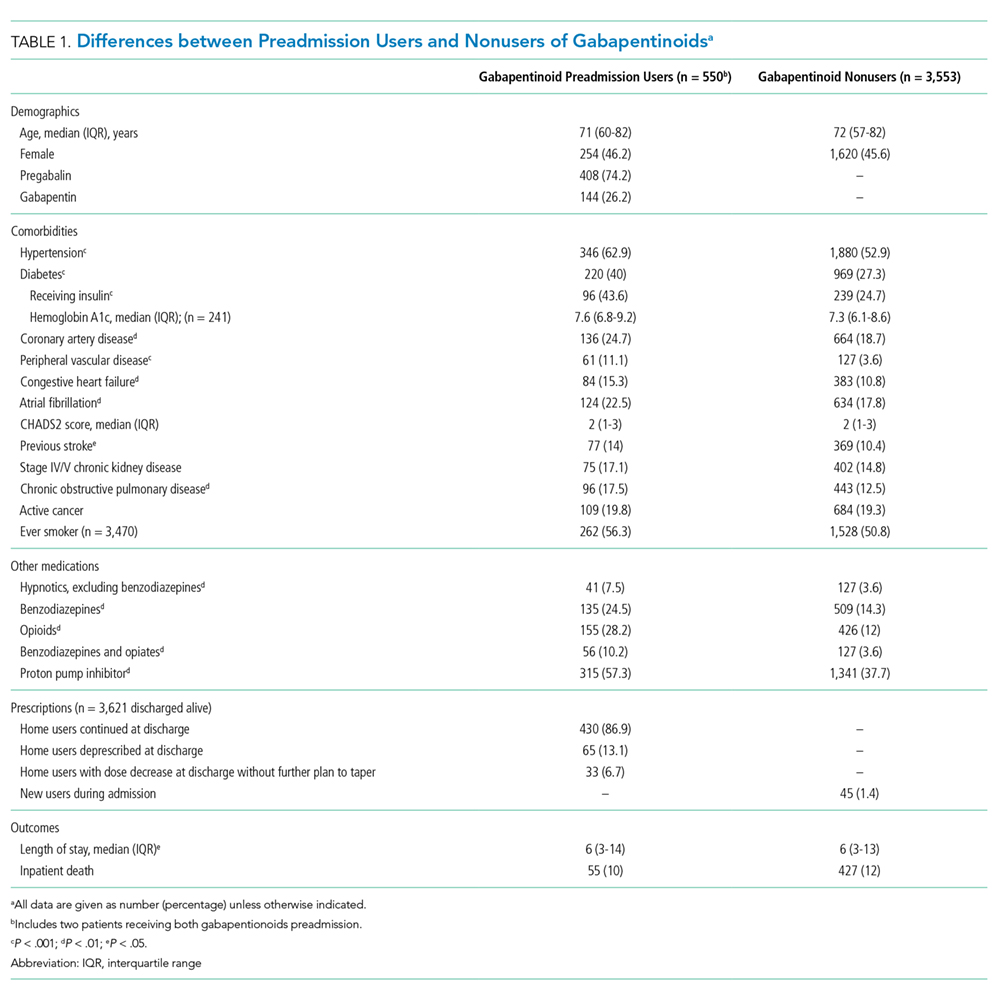
The indications for gabapentinoid use are presented in Table 2. Only a minority (17% or 94/552) had an approved indication. Among these 94 patients, 38 (40%) received FDA-recommended doses, 47 (50%) received doses below those demonstrated to be effective, and 9 (10%) received higher-than-recommended doses. New prescriptions at discharge were observed in 1.5% of patients, with the majority given for off-label indications (Appendix 2).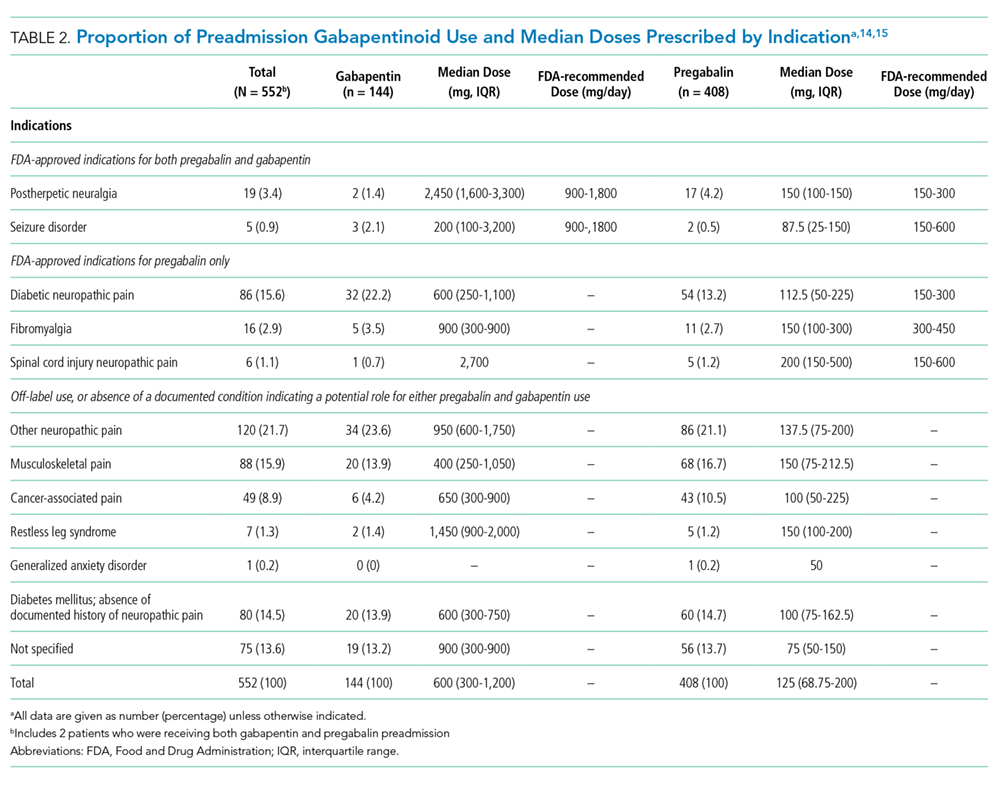
DISCUSSION
In this large cohort study of hospitalized medical patients, preadmission gabapentinoid use was present in one in every eight admitted patients. Most patients had off-label indications, including the small number of patients who had the drug started in hospital. Even for approved indications, the doses were often lower than what trials have suggested to be effective. Finally, although we have demonstrated that deprescribing occurred, it was uncommon and either precipitated by an adverse event or the justification was poorly documented.
To our knowledge, our study is one of the first to examine what happens to gabapentinoids in hospitalized patients and we present important new data with respect to dosing and prescribing patterns. The low rates of discontinuation, intent to taper, or dose decreases in our cohort represent a potential area of improvement in deprescribing.
Deprescribing should be considered for patients with serious adverse events, for whom less serious adverse effects preclude achieving clinically effective doses, and for those who do not perceive benefit. Given the magnitude of the problems presented by polypharmacy, we propose that stopping priority be given to off-label use (especially when clinically ineffective) and for patients coprescribed opioids or sedatives. Up to a third of users in our cohort were coprescribed opioids or benzodiazepines, which is particularly concerning given the association with increased opioid-related mortality.12,15 Although we did not observe a difference in inpatient mortality, such a study is underpowered for this outcome especially when considering the competing risks of death in hospital. Importantly, when deprescribing, the drug should be tapered over several weeks to limit symptoms of withdrawal and to prevent seizure.11
Presumed off-label use and subtherapeutic doses were common in our cohort, with only 17% of users having a clearly documented FDA-approved indication, in agreement with a previous study that reported only 5% on-label use.4 High doses of gabapentinoids required for efficacy in clinical trials may be difficult to achieve because of dose-limiting side effects, which may explain the relatively low median doses recorded in our real-world cohort. Another possibility is that frail, older patients with renal dysfunction experience effectiveness at lower median doses than those quoted from study populations. In our study, patients on lower doses of gabapentinoids had a higher prevalence of stage IV or V chronic kidney disease (CKD). Stage IV/V CKD was identified in 16/47 (34.0%) patients on lower doses of gabapentinoids, compared to 4/38 (10.5%) on doses within the FDA-recommended range.
Our study has limitations; findings from a single Canadian tertiary care hospital may not be generalizable to other hospitals or countries, particularly given the differences between the Canadian and US health systems. Indications were extracted from the patient chart and even with the best possible medication history and thorough review, sometimes they had to be inferred. Caution should also be exercised when interpreting the omission of an indication as equating to a lack of justifiable medication use; however, the rate of off-label use in our cohort is in agreement with prior research.4 Moreover, with a retrospective design, the effectiveness of the drug on an individual basis could not be assessed, which would have allowed a more precise estimate of the proportion of patients for whom deprescribing might have been appropriate. The strengths of this study include a large sample of real-world, heterogeneous, general medical patients spanning several years and our use of trained pharmacists and physicians to determine the drug indication as opposed to reliance on administrative data.
CONCLUSION
Gabapentinoid use was frequent in our cohort of hospitalized medical patients, with a high prevalence of off-label use, subtherapeutic doses, and coadministration with opioids and benzodiazepines. Deprescribing at discharge was uncommon and often triggered by an adverse event. The identification of gabapentinoids during hospitalization is an opportunity to reevaluate the indication for the drug, assess for effectiveness, and consider deprescribing to help reduce polypharmacy and ideally ADEs.
Acknowledgment
For the purposes of authorship, Dr. McDonald and Dr. Lee contributed equally.
Disclosures
Dr. Emily McDonald and Dr. Todd Lee have a patent pending for MedSafer, a deprescribing software, and both receive research salary support from the Fonds de Recherche Santé du Québec. Dr. Gingras, Dr. Lieu, and Dr. Papillon-Ferland have nothing to disclose.
1. Johansen ME. Gabapentinoid use in the United States 2002 through 2015. JAMA Intern Med. 2018;178(2):292-294. https://doi.org/10.1001/jamainternmed.2017.7856.
2. Kwok H, Khuu W, Fernandes K, et al. Impact of unrestricted access to pregabalin on the use of opioids and other CNS-active medications: a cross-sectional time series analysis. Pain Med. 2017;18(6):1019-1026. https://doi.org/10.1093/pm/pnw351.
3. Medicines use and spending in the U.S. — a review of 2016 and outlook to 2021: IMS Institute for Healthcare Informatics; 2017. https://structurecms-staging-psyclone.netdna-ssl.com/client_assets/dwonk/media/attachments/590c/6aa0/6970/2d2d/4182/0000/590c6aa069702d2d41820000.pdf?1493985952. Accessed March 21, 2019.
4. Hamer AM, Haxby DG, McFarland BH, Ketchum K. Gabapentin use in a managed medicaid population. J Manag Care Pharm. 2002;8(4):266-271. doi: 10.18553/jmcp.2002.8.4.266.
5. Eguale T, Buckeridge DL, Verma A, et al. Association of off-label drug use and adverse drug events in an adult population. JAMA Intern Med. 2016;176(1):55-63. https://doi.org/10.1001/jamainternmed.2015.6058.
6. Shanthanna H, Gilron I, Rajarathinam M, et al. Benefits and safety of gabapentinoids in chronic low back pain: a systematic review and meta-analysis of randomized controlled trials. PLoS Med. 2017;14(8):e1002369. https://doi.org/10.1371/journal.pmed.1002369.
7. Enke O, New HA, New CH, et al. Anticonvulsants in the treatment of low back pain and lumbar radicular pain: a systematic review and meta-analysis. CMAJ. 2018;190(26):E786-E793. https://doi.org/10.1503/cmaj.171333.
8. Kane CM, Mulvey MR, Wright S, Craigs C, Wright JM, Bennett MI. Opioids combined with antidepressants or antiepileptic drugs for cancer pain: systematic review and meta-analysis. Palliat Med. 2018;32(1):276-286. https://doi.org/10.1177/0269216317711826.
9. Zaccara G, Perucca P, Gangemi PF. The adverse event profile of pregabalin across different disorders: a meta-analysis. Eur J Clin Pharmacol. 2012;68(6):903-912. https://doi.org/10.1007/s00228-012-1213-x.
10. Huang AR, Mallet L, Rochefort CM, Eguale T, Buckeridge DL, Tamblyn R. Medication-related falls in the elderly: causative factors and preventive strategies. Drugs Aging. 2012;29(5):359-376. https://doi.org/10.2165/11599460-000000000-00000.
11. Evoy KE, Morrison MD, Saklad SR. Abuse and misuse of pregabalin and gabapentin. Drugs. 2017;77(4):403-426. https://doi.org/10.1007/s40265-017-0700-x.
12. Gomes T, Juurlink DN, Antoniou T, Mamdani MM, Paterson JM, van den Brink W. Gabapentin, opioids, and the risk of opioid-related death: a population-based nested case-control study. PLoS Med. 2017;14(10):e1002396. https://doi.org/10.1371/journal.pmed.1002396.
13. McDonald EG, Saleh RR, Lee TC. Ezetimibe use remains common among medical inpatients. Am J Med. 2015;128(2):193-195. https://doi.org/10.1016/j.amjmed.2014.10.016.
14. U.S. Food and Drug Administration. LYRICA - Highlights of Prescribing Information 2012. https://www.accessdata.fda.gov/drugsatfda_docs/label/2012/021446s028lbl.pdf. Accessed April 30, 2019.
15. U.S. Food and Drug Administration. NEURONTIN - Highlights of Prescribing Information 2017. https://www.accessdata.fda.gov/drugsatfda_docs/label/2017/020235s064_020882s047_021129s046lbl.pdf. Accessed April 30, 2019.
16. Gomes T, Greaves S, van den Brink W, et al. Pregabalin and the risk for opioid-related death: a nested case–control study. Ann Intern Med. 2018;169(10):732-734. https://doi.org/10.7326/M18-1136.
In the1990s, gabapentin was licensed in the United States as an anticonvulsant and it became widely successful in the mid-2000s when marketed for the treatment of pain. Since then, prescriptions for gabapentinoids have accelerated dramatically.1,2 Between 2012 and 2016, the total spending on pregabalin in the United States increased from $1.9 to $4.4 billion, with pregabalin ranking eighth overall for specific drug spending.3
Despite a finite number of indications, there has been a steady rise in off-label use, with an increased risk of adverse drug events (ADEs).4,5 Several meta-analyses suggest either low-quality or no evidence of benefit for gabapentinoid use in settings including neuropathic pain in cancer, sciatica, and chronic low back pain.6-8 Lack of efficacy is compounded by adverse effects such as altered mental status, fluid retention, sedation, and increased risk of traumatic falls in older adults.6,9,10 Finally, dependency is a concern; opioids are coprescribed in up to 50% of patients,11 increasing the odds of opioid-related death by up to 60%.12
To better characterize gabapentinoid use in hospitalized patients, we analyzed a retrospective cohort of patients admitted to our tertiary care medical teaching unit, examining preadmission and in-hospital prescribing trends, off-label use, and deprescribing.
METHODS
Patient data were collected from a retrospective cohort, including all consecutive admissions to our 52-bed medical clinical teaching unit in Montréal, Canada, since December 2013.13 We reviewed admissions between December 17, 2013 and June 30, 2017 and identified three populations of gabapentinoid users from medication reconciliation documents: preadmission users continued at discharge, preadmission users deprescribed in hospital, and new in-hospital users continued at discharge. Deprescribing was defined as having the drug stopped at discharge or a prescribed taper that included stopping. The term “gabapentinoid users” refers to preadmission gabapentinoid use.
Gabapentinoid users were compared with nonusers with regard to demographic characteristics; select comorbidities; coprescription of opioids, benzodiazepines, and Z-drugs; length of stay (LOS); and inpatient mortality. Only the first eligible admission per patient was considered. Patients who had multiple admissions over the period of interest were classified as “users” in the patient-level analyses if they were taking a gabapentinoid at home or at discharge on at least one admission.
Doses and indications were collected from medication reconciliation performed by a clinical pharmacist, which included an interview with the patient or a proxy and a review of the indications for all drugs. These data were merged with any additional potential indications found in the admission notes (listing all chronic conditions from a detailed medical history) and review of the electronic medical record. The US Food and Drug Administration (FDA) approved the indications and the recommended doses were taken from product monographs and compared with doses prescribed to patients. When documented, the reason for new prescriptions and justification for deprescribing at discharge were manually abstracted from discharge summaries and medication reconciliation documents.
Continuous variables were expressed as median and interquartile range (IQR) and compared using the Wilcoxon rank-sum test. Categorical variables were compared using the χ2 test. Proportions of gabapentinoid use and deprescribing, including 95% confidence intervals around each proportion, were plotted and linear regression was performed versus fiscal quarter to evaluate for temporal trends. A two-sided α value of 0.05 was considered to be statistically significant. Statistical analyses were performed using Stata version 15 (StataCorp LLC, College Station, Texas). The McGill University Health Centre Research Ethics Board approved this study.
RESULTS
A total of 4,103 unique patients were admitted from December 2013 to July 2017, of whom 550 (13.4%) were receiving a gabapentinoid before admission. Two preadmission users were coprescribed gabapentin and pregabalin for a total of 552 prescriptions. The prevalence of preadmission gabapentinoid use remained steady during the period of interest (Appendix 1; P = .29 for temporal trend). There were no significant differences between gabapentinoid users and nonusers with regard to age or sex, but users had a higher prevalence of chronic disease (
The indications for gabapentinoid use are presented in Table 2. Only a minority (17% or 94/552) had an approved indication. Among these 94 patients, 38 (40%) received FDA-recommended doses, 47 (50%) received doses below those demonstrated to be effective, and 9 (10%) received higher-than-recommended doses. New prescriptions at discharge were observed in 1.5% of patients, with the majority given for off-label indications (Appendix 2).
DISCUSSION
In this large cohort study of hospitalized medical patients, preadmission gabapentinoid use was present in one in every eight admitted patients. Most patients had off-label indications, including the small number of patients who had the drug started in hospital. Even for approved indications, the doses were often lower than what trials have suggested to be effective. Finally, although we have demonstrated that deprescribing occurred, it was uncommon and either precipitated by an adverse event or the justification was poorly documented.
To our knowledge, our study is one of the first to examine what happens to gabapentinoids in hospitalized patients and we present important new data with respect to dosing and prescribing patterns. The low rates of discontinuation, intent to taper, or dose decreases in our cohort represent a potential area of improvement in deprescribing.
Deprescribing should be considered for patients with serious adverse events, for whom less serious adverse effects preclude achieving clinically effective doses, and for those who do not perceive benefit. Given the magnitude of the problems presented by polypharmacy, we propose that stopping priority be given to off-label use (especially when clinically ineffective) and for patients coprescribed opioids or sedatives. Up to a third of users in our cohort were coprescribed opioids or benzodiazepines, which is particularly concerning given the association with increased opioid-related mortality.12,15 Although we did not observe a difference in inpatient mortality, such a study is underpowered for this outcome especially when considering the competing risks of death in hospital. Importantly, when deprescribing, the drug should be tapered over several weeks to limit symptoms of withdrawal and to prevent seizure.11
Presumed off-label use and subtherapeutic doses were common in our cohort, with only 17% of users having a clearly documented FDA-approved indication, in agreement with a previous study that reported only 5% on-label use.4 High doses of gabapentinoids required for efficacy in clinical trials may be difficult to achieve because of dose-limiting side effects, which may explain the relatively low median doses recorded in our real-world cohort. Another possibility is that frail, older patients with renal dysfunction experience effectiveness at lower median doses than those quoted from study populations. In our study, patients on lower doses of gabapentinoids had a higher prevalence of stage IV or V chronic kidney disease (CKD). Stage IV/V CKD was identified in 16/47 (34.0%) patients on lower doses of gabapentinoids, compared to 4/38 (10.5%) on doses within the FDA-recommended range.
Our study has limitations; findings from a single Canadian tertiary care hospital may not be generalizable to other hospitals or countries, particularly given the differences between the Canadian and US health systems. Indications were extracted from the patient chart and even with the best possible medication history and thorough review, sometimes they had to be inferred. Caution should also be exercised when interpreting the omission of an indication as equating to a lack of justifiable medication use; however, the rate of off-label use in our cohort is in agreement with prior research.4 Moreover, with a retrospective design, the effectiveness of the drug on an individual basis could not be assessed, which would have allowed a more precise estimate of the proportion of patients for whom deprescribing might have been appropriate. The strengths of this study include a large sample of real-world, heterogeneous, general medical patients spanning several years and our use of trained pharmacists and physicians to determine the drug indication as opposed to reliance on administrative data.
CONCLUSION
Gabapentinoid use was frequent in our cohort of hospitalized medical patients, with a high prevalence of off-label use, subtherapeutic doses, and coadministration with opioids and benzodiazepines. Deprescribing at discharge was uncommon and often triggered by an adverse event. The identification of gabapentinoids during hospitalization is an opportunity to reevaluate the indication for the drug, assess for effectiveness, and consider deprescribing to help reduce polypharmacy and ideally ADEs.
Acknowledgment
For the purposes of authorship, Dr. McDonald and Dr. Lee contributed equally.
Disclosures
Dr. Emily McDonald and Dr. Todd Lee have a patent pending for MedSafer, a deprescribing software, and both receive research salary support from the Fonds de Recherche Santé du Québec. Dr. Gingras, Dr. Lieu, and Dr. Papillon-Ferland have nothing to disclose.
1. Johansen ME. Gabapentinoid use in the United States 2002 through 2015. JAMA Intern Med. 2018;178(2):292-294. https://doi.org/10.1001/jamainternmed.2017.7856.
2. Kwok H, Khuu W, Fernandes K, et al. Impact of unrestricted access to pregabalin on the use of opioids and other CNS-active medications: a cross-sectional time series analysis. Pain Med. 2017;18(6):1019-1026. https://doi.org/10.1093/pm/pnw351.
3. Medicines use and spending in the U.S. — a review of 2016 and outlook to 2021: IMS Institute for Healthcare Informatics; 2017. https://structurecms-staging-psyclone.netdna-ssl.com/client_assets/dwonk/media/attachments/590c/6aa0/6970/2d2d/4182/0000/590c6aa069702d2d41820000.pdf?1493985952. Accessed March 21, 2019.
4. Hamer AM, Haxby DG, McFarland BH, Ketchum K. Gabapentin use in a managed medicaid population. J Manag Care Pharm. 2002;8(4):266-271. doi: 10.18553/jmcp.2002.8.4.266.
5. Eguale T, Buckeridge DL, Verma A, et al. Association of off-label drug use and adverse drug events in an adult population. JAMA Intern Med. 2016;176(1):55-63. https://doi.org/10.1001/jamainternmed.2015.6058.
6. Shanthanna H, Gilron I, Rajarathinam M, et al. Benefits and safety of gabapentinoids in chronic low back pain: a systematic review and meta-analysis of randomized controlled trials. PLoS Med. 2017;14(8):e1002369. https://doi.org/10.1371/journal.pmed.1002369.
7. Enke O, New HA, New CH, et al. Anticonvulsants in the treatment of low back pain and lumbar radicular pain: a systematic review and meta-analysis. CMAJ. 2018;190(26):E786-E793. https://doi.org/10.1503/cmaj.171333.
8. Kane CM, Mulvey MR, Wright S, Craigs C, Wright JM, Bennett MI. Opioids combined with antidepressants or antiepileptic drugs for cancer pain: systematic review and meta-analysis. Palliat Med. 2018;32(1):276-286. https://doi.org/10.1177/0269216317711826.
9. Zaccara G, Perucca P, Gangemi PF. The adverse event profile of pregabalin across different disorders: a meta-analysis. Eur J Clin Pharmacol. 2012;68(6):903-912. https://doi.org/10.1007/s00228-012-1213-x.
10. Huang AR, Mallet L, Rochefort CM, Eguale T, Buckeridge DL, Tamblyn R. Medication-related falls in the elderly: causative factors and preventive strategies. Drugs Aging. 2012;29(5):359-376. https://doi.org/10.2165/11599460-000000000-00000.
11. Evoy KE, Morrison MD, Saklad SR. Abuse and misuse of pregabalin and gabapentin. Drugs. 2017;77(4):403-426. https://doi.org/10.1007/s40265-017-0700-x.
12. Gomes T, Juurlink DN, Antoniou T, Mamdani MM, Paterson JM, van den Brink W. Gabapentin, opioids, and the risk of opioid-related death: a population-based nested case-control study. PLoS Med. 2017;14(10):e1002396. https://doi.org/10.1371/journal.pmed.1002396.
13. McDonald EG, Saleh RR, Lee TC. Ezetimibe use remains common among medical inpatients. Am J Med. 2015;128(2):193-195. https://doi.org/10.1016/j.amjmed.2014.10.016.
14. U.S. Food and Drug Administration. LYRICA - Highlights of Prescribing Information 2012. https://www.accessdata.fda.gov/drugsatfda_docs/label/2012/021446s028lbl.pdf. Accessed April 30, 2019.
15. U.S. Food and Drug Administration. NEURONTIN - Highlights of Prescribing Information 2017. https://www.accessdata.fda.gov/drugsatfda_docs/label/2017/020235s064_020882s047_021129s046lbl.pdf. Accessed April 30, 2019.
16. Gomes T, Greaves S, van den Brink W, et al. Pregabalin and the risk for opioid-related death: a nested case–control study. Ann Intern Med. 2018;169(10):732-734. https://doi.org/10.7326/M18-1136.
© 2019 Society of Hospital Medicine
Association of Herpes Simplex Virus Testing with Hospital Length of Stay for Infants ≤60 Days of Age Undergoing Evaluation for Meningitis
Neonatal herpes simplex virus (HSV) is associated with significant morbidity and mortality,1 particularly when the diagnosis or treatment is delayed.2 Therefore, many infants aged ≤60 days being evaluated for meningitis undergo cerebrospinal fluid (CSF) HSV polymerase chain reaction (PCR) testing even though the risk of HSV infection is low [estimated at 0.4% of those undergoing evaluation for central nervous system (CNS) infection].3 A single-center study demonstrated that CSF HSV PCR testing increases the hospital length of stay (LOS) for infants aged ≤56 days,4 although these single-center findings may not be generalizable. To this end, we measured the association between CSF HSV PCR testing and LOS in a multicenter cohort of hospitalized young infants.
METHODS
Study Design
We conducted a planned secondary analysis of a retrospective cohort of infants aged ≤60 days who presented to the emergency department (ED) between January 1, 2005 and December 31, 2013, enrolled in the Pediatric Emergency Medicine Collaborative Research Committee (PEM CRC) HSV study.3 Our study was limited to the 20 hospitals that contributed hospital LOS data. The study protocol was approved by each site’s institutional review board with permission for data sharing.
Study Population
Eligible infants were identified at each site using a site-specific electronic search strategy. Infants were eligible for inclusion if a CSF culture was obtained in the ED or within 24 hours of ED arrival. We excluded infants who were discharged from the ED and those with missing hospital LOS data.
Data Collection
Site investigators extracted the following data elements either electronically or from medical records: patient demographics; ED arrival date and time; hospital discharge date and time; urinalysis results; peripheral and CSF cell counts; blood, urine, and CSF bacterial culture results; as well as the results of HSV PCR and viral cultures. Infants with growth of a pathogen in blood or CSF, or a catheterized urine culture with ≥50,000 colony-forming units (CFUs)/mL of a single pathogenic bacteria, or 10,000-50,000 CFUs/mL of a single pathogenic bacteria with an abnormal urinalysis (ie, positive nitrite or leukocyte esterase on urine dipstick or >5 white blood cells [WBCs] per high power field on urine microscopy) were classified as having a serious bacterial infection (SBI).5,6 Infants with a positive HSV PCR or viral culture from any site were classified as having HSV infection.3 Hospitalized infants who did not have an HSV PCR test performed were assumed not to have HSV disease if not diagnosed during the hospital stay or repeat ED encounter.3
Outcome Measures
The primary outcome was hospital LOS, defined at all hospitals as the time from ED arrival to provider signature of the hospital discharge order, calculated in minutes and then converted into days.
Statistical Analysis
We described LOS using medians with interquartile ranges (IQR) and compared between infants with and without a CSF HSV PCR test performed using the Mann–Whitney U test. To evaluate the association between performance of CSF HSV PCR testing and hospital LOS, we used negative binomial regression given the count variable outcome (LOS) with an overdispersed distribution. For this analysis, we clustered by hospital after adjusting for the following factors determined a priori: age, gender, study year, and presence of serious bacterial or HSV infection. Using the relative marginal modeled estimates of LOS (tested vs not tested), we determined the percentage increase in LOS. We then repeated the analyses after stratifying by the location of testing (ie, in-house vs send-out), age (≤28 days vs 29-60 days), and presence or absence of CSF pleocytosis (defined as a CSF WBC of ≥16 cells/mm3for infants aged ≤28 days and ≥10 cells/mm3for infants aged 29-60 days),7 because infants aged 29-60 days and those without CSF pleocytosis are reported to be at very low risk for CNS HSV infection.3,8 We utilized Stata Data Analysis and Statistical Software, version 15.0 (StataCorp, Inc.; College Station, Texas) for statistical analyses.
RESULTS
Of 24,103 infants with CSF cultures obtained at the 20 participating sites, we excluded 2,673 (11.1%) discharged from the ED or with missing disposition and 934 (3.9%) with missing LOS, leaving a study cohort of 20,496 infants (Figure). Overall, 1,780 infants (8.7%) had an SBI and 99 (0.5%) had an HSV infection, of which 46 (46.5%) had a CNS HSV infection.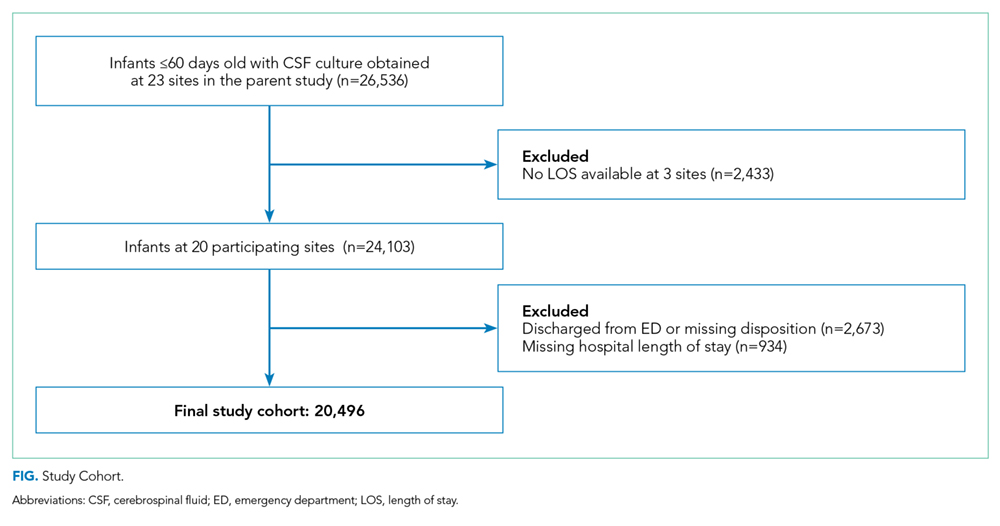
Among the 20,496 study infants, 7,399 (36.1%) had a CSF HSV PCR test performed; 5,935 infants (80.2% of those tested) had in-house and 1,464 (19.8%) had send-out testing. Among infants with available CSF cell counts, a CSF HSV PCR test was more commonly performed in infants with CSF pleocytosis than in those without (1,865/4,439 [42.0%] with CSF pleocytosis vs 3,705/12,002 [30.9%] without CSF pleocytosis; odds ratio [OR] 1.6, 95% CI 1.5-1.7). Of the 7,399 infants who had a CSF HSV PCR test performed, 46 (0.6%) had a positive test. Of the tested infants, 5,570 (75.3%) had an available CSF WBC count; a positive CSF HSV PCR test was more common in infants with CSF pleocytosis than in those without (25 positive tests/1,865 infants with CSF pleocytosis [1.3%] vs 9/3,705 [0.2%] without CSF pleocytosis; OR 5.6, 95% CI 2.6-12.0). Among the 5,308 infants aged 29-60 days without CSF pleocytosis, 1,110 (20.9%) had a CSF HSV PCR test performed and only one infant (0.09% of those tested) had a positive test.
Without adjustment, infants with a CSF HSV PCR test had a longer median LOS than infants who were not tested (2.5 vs 2.3 days; P < .001). After adjustment, infants with a CSF HSV PCR test performed had a 23% longer duration of hospitalization. The association between testing and LOS was similar for older vs younger infants, infants with and without CSF pleocytosis, and in-house vs send-out testing (Table).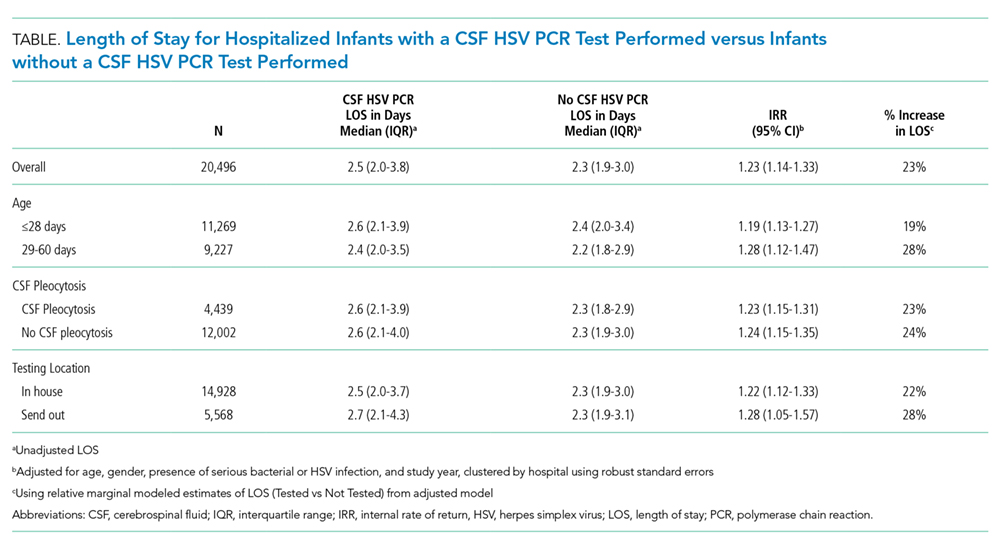
DISCUSSION
In a large, multicenter cohort of more than 20,000 hospitalized infants aged ≤60 days undergoing evaluation for meningitis, we examined the association of CSF HSV PCR testing with hospital LOS. Approximately one-third of study infants had a CSF HSV PCR test obtained. After adjustment for patient- and hospital-level factors, the treating clinician’s decision to obtain a CSF HSV PCR test was associated with a 23% longer hospital LOS (nearly one-half day).
Our findings are consistent with those of previous studies. First, our observed association of the decision to obtain a CSF HSV PCR test and LOS was similar in magnitude to that of a previous single-center investigation.4 Second, we also found that older infants and those without CSF pleocytosis were at very low risk of HSV infection.3,8 For the otherwise low-risk infants, the longer LOS may be due to delays in obtaining CSF HSV PCR test results, which should be explored in future research. Our study has greater generalizability than previous single-center studies by substantially increasing the population size as well as the variety of clinical settings. Ensuring clinicians’ access to rapid HSV PCR testing platforms will further mitigate the impact of HSV testing on LOS.
When deciding to perform a CSF HSV PCR test for infants aged ≤60 days, clinicians must balance the low incidence of neonatal HSV3 with the risk of delayed diagnosis and treatment of HSV infection, which include neurologic sequelae or even death.1,2 As infants with CNS HSV infection commonly present nonspecifically and only a minority of infected infants have skin vesicles,1 controversy exists as to which infants should be evaluated for HSV infection, resulting in considerable variability in HSV testing.3 Some clinicians advocate for more conservative testing strategies that include the performance of CSF HSV PCR testing in all febrile infants aged ≤21 days.9 Others suggest limiting testing to infants who meet high-risk criteria (eg, seizures, ill-appearance, or CSF pleocytosis).10,11 Further investigation will need to elucidate the clinical and laboratory predictors of HSV infection to identify those infants who would benefit most from HSV testing as well as the outcomes of infants not tested.
Our study has several limitations. First, we could not determine the reason why clinicians elected to obtain a CSF HSV PCR test, and we do not know the test turnaround time or the time when results became available to the clinical team. Second, we did not abstract clinical data such as ill-appearance or seizures. Although we adjusted for the presence of serious bacterial or HSV infection as proxy measures for illness severity, it is possible that other clinical factors were associated with HSV testing and LOS. Third, although we adjusted for patient- and hospital-level factors in our regression model, the potential for residual confounding persists. Fourth, we did not explore acyclovir administration as a factor associated with LOS as some sites did not provide data on acyclovir. Fifth, we did not evaluate the impact of HSV testing of other sample types (eg, blood or skin) on LOS. Sixth, our study was conducted primarily at children’s hospitals, and our findings may not be generalizable to general hospitals with hospitalized neonates.
CONCLUSIONS
For infants aged ≤60 days undergoing evaluation for meningitis, CSF HSV PCR testing was associated with a slightly longer hospital LOS. Improved methods to identify and target testing to higher risk infants may mitigate the impact on LOS for low-risk infants.
Acknowledgments
The authors acknowledge the following collaborators in the Pediatric Emergency Medicine Clinical Research Network (PEM CRC) Herpes Simplex Virus (HSV) Study Group who collected data for this study and/or the parent study: Joseph L Arms, MD (Minneapolis, Minnesota), Stuart A Bradin, DO (Ann Arbor, Michigan), Sarah J Curtis, MD, MSc (Edmonton, Alberta, Canada), Paul T Ishimine, MD (San Diego, California), Dina Kulik, MD (Toronto, Ontario, Canada), Prashant Mahajan, MD, MPH, MBA (Ann Arbor, Michigan), Aaron S Miller, MD, MSPH (St. Louis, Missouri), Pamela J Okada, MD (Dallas, Texas), Christopher M Pruitt, MD (Birmingham, Alabama), Suzanne M Schmidt, MD (Chicago, Illinois), David Schnadower, Amy D Thompson, MD (Wilmington, Delaware), Joanna E Thomson, MD, MPH (Cincinnati, Ohio), MD, MPH (St. Louis, Missouri), and Neil G. Uspal, MD (Seattle, Washington).
Disclosures
Dr. Aronson reports grants from the Agency for Healthcare Research and Quality during the conduct of the study. Dr. Shah reports grants from Patient-Centered Outcomes Research Institute, grants from the National Institute of Allergy and Infectious Diseases, and grants from the National Heart Lung Blood Institute, outside the submitted work. Dr. Shah is the Editor-in-Chief of the Journal of Hospital Medicine. All other authors have no conflicts of interest or financial relationships relevant to this article to disclose.
Funding
This project was supported by the Section of Emergency Medicine of the American Academy of Pediatrics (AAP) and Baylor College of Medicine and by the grant number K08HS026006 (Aronson) from the Agency for Healthcare Research and Quality. The content is solely the responsibi
1. Kimberlin DW, Lin CY, Jacobs RF, et al. Natural history of neonatal herpes simplex virus infections in the acyclovir era. Pediatrics. 2001;108(2):223-229. PubMed
2. Shah SS, Aronson PL, Mohamad Z, Lorch SA. Delayed acyclovir therapy and death among neonates with herpes simplex virus infection. Pediatrics. 2011;128(6):1153-1160. https://doi.org/10.1136/eb-2012-100674.
3. Cruz AT, Freedman SB, Kulik DM, et al. Herpes simplex virus infection in infants undergoing meningitis evaluation. Pediatrics. 2018;141(2):e20171688. https://doi.org/10.1542/peds.2017-1688.
4. Shah SS, Volk J, Mohamad Z, Hodinka RL, Zorc JJ. Herpes simplex virus testing and hospital length of stay in neonates and young infants. J Pediatr. 2010;156(5):738-743. https://doi.org/10.1016/j.jpeds.2009.11.079.
5. Mahajan P, Kuppermann N, Mejias A, et al. Association of RNA biosignatures with bacterial infections in febrile infants aged 60 days or younger. JAMA. 2016;316(8):846-857. https://doi.org/10.1001/jama.2016.9207.
6. Schnadower D, Kuppermann N, Macias CG, et al. Febrile infants with urinary tract infections at very low risk for adverse events and bacteremia. Pediatrics. 2010;126(6):1074-1083. https://doi.org/10.1542/peds.2010-0479.
7. Thomson J, Sucharew H, Cruz AT, et al. Cerebrospinal fluid reference values for young infants undergoing lumbar puncture. Pediatrics. 2018;141(3):e20173405. https://doi.org/10.1542/peds.2017-3405.
8. Caviness AC, Demmler GJ, Almendarez Y, Selwyn BJ. The prevalence of neonatal herpes simplex virus infection compared with serious bacterial illness in hospitalized neonates. J Pediatr. 2008;153(2):164-169. https://doi.org/10.1016/j.jpeds.2008.02.031.
9. Long SS. In defense of empiric acyclovir therapy in certain neonates. J Pediatr. 2008;153(2):157-158. https://doi.org/10.1016/j.jpeds.2008.04.071.
10. Brower L, Schondelmeyer A, Wilson P, Shah SS. Testing and empiric treatment for neonatal herpes simplex virus: challenges and opportunities for improving the value of care. Hosp Pediatr. 2016;6(2):108-111. https://doi.org/10.1542/hpeds.2015-0166.
11. Kimberlin DW. When should you initiate acyclovir therapy in a neonate? J Pediatr. 2008;153(2):155-156. https://doi.org/10.1016/j.jpeds.2008.04.027.
Neonatal herpes simplex virus (HSV) is associated with significant morbidity and mortality,1 particularly when the diagnosis or treatment is delayed.2 Therefore, many infants aged ≤60 days being evaluated for meningitis undergo cerebrospinal fluid (CSF) HSV polymerase chain reaction (PCR) testing even though the risk of HSV infection is low [estimated at 0.4% of those undergoing evaluation for central nervous system (CNS) infection].3 A single-center study demonstrated that CSF HSV PCR testing increases the hospital length of stay (LOS) for infants aged ≤56 days,4 although these single-center findings may not be generalizable. To this end, we measured the association between CSF HSV PCR testing and LOS in a multicenter cohort of hospitalized young infants.
METHODS
Study Design
We conducted a planned secondary analysis of a retrospective cohort of infants aged ≤60 days who presented to the emergency department (ED) between January 1, 2005 and December 31, 2013, enrolled in the Pediatric Emergency Medicine Collaborative Research Committee (PEM CRC) HSV study.3 Our study was limited to the 20 hospitals that contributed hospital LOS data. The study protocol was approved by each site’s institutional review board with permission for data sharing.
Study Population
Eligible infants were identified at each site using a site-specific electronic search strategy. Infants were eligible for inclusion if a CSF culture was obtained in the ED or within 24 hours of ED arrival. We excluded infants who were discharged from the ED and those with missing hospital LOS data.
Data Collection
Site investigators extracted the following data elements either electronically or from medical records: patient demographics; ED arrival date and time; hospital discharge date and time; urinalysis results; peripheral and CSF cell counts; blood, urine, and CSF bacterial culture results; as well as the results of HSV PCR and viral cultures. Infants with growth of a pathogen in blood or CSF, or a catheterized urine culture with ≥50,000 colony-forming units (CFUs)/mL of a single pathogenic bacteria, or 10,000-50,000 CFUs/mL of a single pathogenic bacteria with an abnormal urinalysis (ie, positive nitrite or leukocyte esterase on urine dipstick or >5 white blood cells [WBCs] per high power field on urine microscopy) were classified as having a serious bacterial infection (SBI).5,6 Infants with a positive HSV PCR or viral culture from any site were classified as having HSV infection.3 Hospitalized infants who did not have an HSV PCR test performed were assumed not to have HSV disease if not diagnosed during the hospital stay or repeat ED encounter.3
Outcome Measures
The primary outcome was hospital LOS, defined at all hospitals as the time from ED arrival to provider signature of the hospital discharge order, calculated in minutes and then converted into days.
Statistical Analysis
We described LOS using medians with interquartile ranges (IQR) and compared between infants with and without a CSF HSV PCR test performed using the Mann–Whitney U test. To evaluate the association between performance of CSF HSV PCR testing and hospital LOS, we used negative binomial regression given the count variable outcome (LOS) with an overdispersed distribution. For this analysis, we clustered by hospital after adjusting for the following factors determined a priori: age, gender, study year, and presence of serious bacterial or HSV infection. Using the relative marginal modeled estimates of LOS (tested vs not tested), we determined the percentage increase in LOS. We then repeated the analyses after stratifying by the location of testing (ie, in-house vs send-out), age (≤28 days vs 29-60 days), and presence or absence of CSF pleocytosis (defined as a CSF WBC of ≥16 cells/mm3for infants aged ≤28 days and ≥10 cells/mm3for infants aged 29-60 days),7 because infants aged 29-60 days and those without CSF pleocytosis are reported to be at very low risk for CNS HSV infection.3,8 We utilized Stata Data Analysis and Statistical Software, version 15.0 (StataCorp, Inc.; College Station, Texas) for statistical analyses.
RESULTS
Of 24,103 infants with CSF cultures obtained at the 20 participating sites, we excluded 2,673 (11.1%) discharged from the ED or with missing disposition and 934 (3.9%) with missing LOS, leaving a study cohort of 20,496 infants (Figure). Overall, 1,780 infants (8.7%) had an SBI and 99 (0.5%) had an HSV infection, of which 46 (46.5%) had a CNS HSV infection.
Among the 20,496 study infants, 7,399 (36.1%) had a CSF HSV PCR test performed; 5,935 infants (80.2% of those tested) had in-house and 1,464 (19.8%) had send-out testing. Among infants with available CSF cell counts, a CSF HSV PCR test was more commonly performed in infants with CSF pleocytosis than in those without (1,865/4,439 [42.0%] with CSF pleocytosis vs 3,705/12,002 [30.9%] without CSF pleocytosis; odds ratio [OR] 1.6, 95% CI 1.5-1.7). Of the 7,399 infants who had a CSF HSV PCR test performed, 46 (0.6%) had a positive test. Of the tested infants, 5,570 (75.3%) had an available CSF WBC count; a positive CSF HSV PCR test was more common in infants with CSF pleocytosis than in those without (25 positive tests/1,865 infants with CSF pleocytosis [1.3%] vs 9/3,705 [0.2%] without CSF pleocytosis; OR 5.6, 95% CI 2.6-12.0). Among the 5,308 infants aged 29-60 days without CSF pleocytosis, 1,110 (20.9%) had a CSF HSV PCR test performed and only one infant (0.09% of those tested) had a positive test.
Without adjustment, infants with a CSF HSV PCR test had a longer median LOS than infants who were not tested (2.5 vs 2.3 days; P < .001). After adjustment, infants with a CSF HSV PCR test performed had a 23% longer duration of hospitalization. The association between testing and LOS was similar for older vs younger infants, infants with and without CSF pleocytosis, and in-house vs send-out testing (Table).
DISCUSSION
In a large, multicenter cohort of more than 20,000 hospitalized infants aged ≤60 days undergoing evaluation for meningitis, we examined the association of CSF HSV PCR testing with hospital LOS. Approximately one-third of study infants had a CSF HSV PCR test obtained. After adjustment for patient- and hospital-level factors, the treating clinician’s decision to obtain a CSF HSV PCR test was associated with a 23% longer hospital LOS (nearly one-half day).
Our findings are consistent with those of previous studies. First, our observed association of the decision to obtain a CSF HSV PCR test and LOS was similar in magnitude to that of a previous single-center investigation.4 Second, we also found that older infants and those without CSF pleocytosis were at very low risk of HSV infection.3,8 For the otherwise low-risk infants, the longer LOS may be due to delays in obtaining CSF HSV PCR test results, which should be explored in future research. Our study has greater generalizability than previous single-center studies by substantially increasing the population size as well as the variety of clinical settings. Ensuring clinicians’ access to rapid HSV PCR testing platforms will further mitigate the impact of HSV testing on LOS.
When deciding to perform a CSF HSV PCR test for infants aged ≤60 days, clinicians must balance the low incidence of neonatal HSV3 with the risk of delayed diagnosis and treatment of HSV infection, which include neurologic sequelae or even death.1,2 As infants with CNS HSV infection commonly present nonspecifically and only a minority of infected infants have skin vesicles,1 controversy exists as to which infants should be evaluated for HSV infection, resulting in considerable variability in HSV testing.3 Some clinicians advocate for more conservative testing strategies that include the performance of CSF HSV PCR testing in all febrile infants aged ≤21 days.9 Others suggest limiting testing to infants who meet high-risk criteria (eg, seizures, ill-appearance, or CSF pleocytosis).10,11 Further investigation will need to elucidate the clinical and laboratory predictors of HSV infection to identify those infants who would benefit most from HSV testing as well as the outcomes of infants not tested.
Our study has several limitations. First, we could not determine the reason why clinicians elected to obtain a CSF HSV PCR test, and we do not know the test turnaround time or the time when results became available to the clinical team. Second, we did not abstract clinical data such as ill-appearance or seizures. Although we adjusted for the presence of serious bacterial or HSV infection as proxy measures for illness severity, it is possible that other clinical factors were associated with HSV testing and LOS. Third, although we adjusted for patient- and hospital-level factors in our regression model, the potential for residual confounding persists. Fourth, we did not explore acyclovir administration as a factor associated with LOS as some sites did not provide data on acyclovir. Fifth, we did not evaluate the impact of HSV testing of other sample types (eg, blood or skin) on LOS. Sixth, our study was conducted primarily at children’s hospitals, and our findings may not be generalizable to general hospitals with hospitalized neonates.
CONCLUSIONS
For infants aged ≤60 days undergoing evaluation for meningitis, CSF HSV PCR testing was associated with a slightly longer hospital LOS. Improved methods to identify and target testing to higher risk infants may mitigate the impact on LOS for low-risk infants.
Acknowledgments
The authors acknowledge the following collaborators in the Pediatric Emergency Medicine Clinical Research Network (PEM CRC) Herpes Simplex Virus (HSV) Study Group who collected data for this study and/or the parent study: Joseph L Arms, MD (Minneapolis, Minnesota), Stuart A Bradin, DO (Ann Arbor, Michigan), Sarah J Curtis, MD, MSc (Edmonton, Alberta, Canada), Paul T Ishimine, MD (San Diego, California), Dina Kulik, MD (Toronto, Ontario, Canada), Prashant Mahajan, MD, MPH, MBA (Ann Arbor, Michigan), Aaron S Miller, MD, MSPH (St. Louis, Missouri), Pamela J Okada, MD (Dallas, Texas), Christopher M Pruitt, MD (Birmingham, Alabama), Suzanne M Schmidt, MD (Chicago, Illinois), David Schnadower, Amy D Thompson, MD (Wilmington, Delaware), Joanna E Thomson, MD, MPH (Cincinnati, Ohio), MD, MPH (St. Louis, Missouri), and Neil G. Uspal, MD (Seattle, Washington).
Disclosures
Dr. Aronson reports grants from the Agency for Healthcare Research and Quality during the conduct of the study. Dr. Shah reports grants from Patient-Centered Outcomes Research Institute, grants from the National Institute of Allergy and Infectious Diseases, and grants from the National Heart Lung Blood Institute, outside the submitted work. Dr. Shah is the Editor-in-Chief of the Journal of Hospital Medicine. All other authors have no conflicts of interest or financial relationships relevant to this article to disclose.
Funding
This project was supported by the Section of Emergency Medicine of the American Academy of Pediatrics (AAP) and Baylor College of Medicine and by the grant number K08HS026006 (Aronson) from the Agency for Healthcare Research and Quality. The content is solely the responsibi
1. Kimberlin DW, Lin CY, Jacobs RF, et al. Natural history of neonatal herpes simplex virus infections in the acyclovir era. Pediatrics. 2001;108(2):223-229. PubMed
2. Shah SS, Aronson PL, Mohamad Z, Lorch SA. Delayed acyclovir therapy and death among neonates with herpes simplex virus infection. Pediatrics. 2011;128(6):1153-1160. https://doi.org/10.1136/eb-2012-100674.
3. Cruz AT, Freedman SB, Kulik DM, et al. Herpes simplex virus infection in infants undergoing meningitis evaluation. Pediatrics. 2018;141(2):e20171688. https://doi.org/10.1542/peds.2017-1688.
4. Shah SS, Volk J, Mohamad Z, Hodinka RL, Zorc JJ. Herpes simplex virus testing and hospital length of stay in neonates and young infants. J Pediatr. 2010;156(5):738-743. https://doi.org/10.1016/j.jpeds.2009.11.079.
5. Mahajan P, Kuppermann N, Mejias A, et al. Association of RNA biosignatures with bacterial infections in febrile infants aged 60 days or younger. JAMA. 2016;316(8):846-857. https://doi.org/10.1001/jama.2016.9207.
6. Schnadower D, Kuppermann N, Macias CG, et al. Febrile infants with urinary tract infections at very low risk for adverse events and bacteremia. Pediatrics. 2010;126(6):1074-1083. https://doi.org/10.1542/peds.2010-0479.
7. Thomson J, Sucharew H, Cruz AT, et al. Cerebrospinal fluid reference values for young infants undergoing lumbar puncture. Pediatrics. 2018;141(3):e20173405. https://doi.org/10.1542/peds.2017-3405.
8. Caviness AC, Demmler GJ, Almendarez Y, Selwyn BJ. The prevalence of neonatal herpes simplex virus infection compared with serious bacterial illness in hospitalized neonates. J Pediatr. 2008;153(2):164-169. https://doi.org/10.1016/j.jpeds.2008.02.031.
9. Long SS. In defense of empiric acyclovir therapy in certain neonates. J Pediatr. 2008;153(2):157-158. https://doi.org/10.1016/j.jpeds.2008.04.071.
10. Brower L, Schondelmeyer A, Wilson P, Shah SS. Testing and empiric treatment for neonatal herpes simplex virus: challenges and opportunities for improving the value of care. Hosp Pediatr. 2016;6(2):108-111. https://doi.org/10.1542/hpeds.2015-0166.
11. Kimberlin DW. When should you initiate acyclovir therapy in a neonate? J Pediatr. 2008;153(2):155-156. https://doi.org/10.1016/j.jpeds.2008.04.027.
© 2019 Society of Hospital Medicine
Can Medicine Bring Good Out of War?
The title of this essay is more often posed as “Is War Good for Medicine?”2 The career VA physician in me, and the daughter and granddaughter of combat veterans, finds this question historically accurate, but ethically problematic. So I have rewritten the question to one that enables us to examine the historic relationship of medical advances and war from a more ethically justifiable posture. I am by no means ascribing to authors of other publications with this title anything but the highest motives of education and edification.
Yet the more I read and thought about the question(s), I realized that the moral assumptions underlying and supporting each concept are significantly different. What led me to that realization was a story my father told me when I was young which in my youthful ignorance I either dismissed or ignored. I now see that the narrative captured a profound truth about how war is not good especially for those who must wage it, but good may come from it for those who now live in peace.
My father was one of the founders of military pediatrics. Surprisingly, pediatricians were valuable members of the military medical forces because of their knowledge of infectious diseases.3 My father had gone in to the then new specialty of pediatrics because in the 1930s, infectious diseases were the primary cause of death in children. Before antibiotics, children would often die of common infections. Service as a combat medical officer in World War II stationed in the European Theater, my father had experience with and access to penicillin. After returning from the war to work in an Army hospital, he and his staff went into the acute pediatric ward and gave the drug to several very sick children, many of whom were likely to die. The next morning on rounds, they noted that many of the children were feeling much better, some even bouncing on their beds.
Perhaps either his telling or my remembering of these events is partly apocryphal, but the reality is that those lethal microbes had no idea what had hit them. Before human physicians overused the new drugs and nature struck back with antibiotic resistance, penicillin seemed miraculous.
Most likely, in 1945 those children would never have been prescribed penicillin, much less survived, if not for the unprecedented and war-driven consortium of industry and government that mass-produced penicillin to treat the troops with infections. Without a doubt then, from the sacrifice and devastation of World War II came the benefits and boons of the antibiotic era—one of the greatest discoveries in medical science.4
Penicillin is but one of legions of scientific discoveries that emerged during wartime. Many of these dramatic improvements, especially those in surgical techniques and emergency medicine, quickly entered the civilian sector. The French surgeon Amboise Paré, for example, revived an old Roman Army practice of using ligatures or tourniquets to stop excessive blood loss, now a staple of emergency responders in disasters. The ambulance services that transported wounded troops to the hospital began on the battlefields of the Civil War.5
These impressive contributions are the direct result of military medicine intended to preserve fighting strength. There are also indirect, although just as revolutionary, efforts of DoD and VA scientists and health care professionals to minimize disability and prevent progression especially of service-connected injuries and illnesses. Among the most groundbreaking is the VA’s 3D-printed artificial lung. I have to admit at first I thought that it was futuristic, but quickly I learned that it was a realistic possibility for the coming decades.6 VA researchers hope the lung will offer a treatment option for patients with chronic obstructive pulmonary disease (COPD), a lung condition more prevalent in veterans than in the civilian population.7 One contributing factor to the increased risk of COPD among former military is the higher rate of smoking among both active duty and veterans than that in the civilian population.8 And the last chain in the link of causation is that smoking is more common in those service members who have posttraumatic stress disorder.9
However, there also is a very dark side to the link between wartime research and medicine—most infamously the Nazi hypothermia experiments conducted at concentration camps. The proposed publication aroused a decades long ethical controversy regarding whether the data should be published, much less used, in research and practice even if it could save the lives of present or future warriors. In 1990, Marcia Angel, MD, then editor-in-chief of the prestigious New England Journal of Medicine, published the information with an accompanying ethical justification. “Finally, refusal to publish the unethical work serves notice to society at large that even scientists do not consider science the primary measure of a civilization. Knowledge, although important, may be less important to a decent society than the way it is obtained.”10 Ethicist Stephen Post writing on behalf of Holocaust victims strenuously disagreed with the decision to publish the research, “Because the Nazi experiments on human beings were so appallingly unethical, it follows, prima facie, that the use of the records is unethical.”11
This debate is key to the distinction between the 2 questions posed at the beginning of this column. Few who have been on a battlefield or who have cared for those who were can suggest or defend that wars should be fought as a catalyst for scientific research or an impetus to medical advancement. Such an instrumentalist view justifies the end of healing with the means of death, which is an intrinsic contradiction that would eventually corrode the integrity of the medical and scientific professions. Conversely, the second question challenges all of us in federal practice to assume a mantle of obligation to take the interventions that enabled combat medicine to save soldiers and apply them to improve the health and save the lives of veterans and civilians alike. It summons scientists laboring in the hundreds of DoD and VA laboratories to use the unparalleled funding and infrastructure of the institutions to develop promising therapeutics to treat the psychological toll and physical cost of war. And finally it charges the citizens whose family and friends have and will serve in uniform to enlist in a political process that enables military medicine and science to achieve the greatest good-health in peace.
1. Remarque EM. All Quiet on the Western Front. New York, NY: Fawcett Books; 1929:228.
2. Connell C. Is war good for medicine: war’s medical legacy? http://sm.stanford.edu/archive/stanmed/2007summer/main.html. Published 2007. Accessed April 18, 2019.
3. Burnett MW, Callahan CW. American pediatricians at war; a legacy of service. Pediatrics. 2012;129(suppl 1):S33-S49.
4. Ligon BL. Penicillin: its discovery and early development. Semin Pediatr Infect Dis. 2004;15(1):52-57.
5. Samuel L. 6 medical innovations that moved from the battlefield to mainstream medicine. https://www.scientificamercan.com/article/6-medical-innovations-that-moved-from-the-battlefield-to-mainstream-medicine. Published November 11, 2017. Accessed April 18, 2019.
6. Richman M. Breathing easier. https://www.research.va.gov/currents/0818-Researchers-strive-to-make-3D-printed-artificial-lung-to-help-Vets-with-respiratory-disease.cfm. Published August 1, 2018. Accessed April 18, 2019.
7. Murphy DE, Chaudry Z, Almoosa KF, Panos RJ. High prevalence of chronic obstructive pulmonary disease among veterans in the urban Midwest. Mill Med. 2011;176(5):552-560.
8. Thompson WH, St-Hilaire C. Prevalence of chronic obstructive pulmonary disease and tobacco use in veterans at Boise Veterans Affairs Medical Center. Respir Care. 2010;55(5):555-560.
9. Cook J, Jakupcak M, Rosenheck R, Fontana A, McFall M. Influence of PTSD symptom clusters on smoking status among help-seeking Iraq and Afghanistan veterans. Nicotine Tob Res. 2009;11(10):1189-1195.
10. Angell M. The Nazi hypothermia experiments and unethical research today. N Eng J Med 1990;322(20):1462-1464.
11. Post SG. The echo of Nuremberg: Nazi data and ethics. J Med Ethics. 1991;17(1):42-44.
The title of this essay is more often posed as “Is War Good for Medicine?”2 The career VA physician in me, and the daughter and granddaughter of combat veterans, finds this question historically accurate, but ethically problematic. So I have rewritten the question to one that enables us to examine the historic relationship of medical advances and war from a more ethically justifiable posture. I am by no means ascribing to authors of other publications with this title anything but the highest motives of education and edification.
Yet the more I read and thought about the question(s), I realized that the moral assumptions underlying and supporting each concept are significantly different. What led me to that realization was a story my father told me when I was young which in my youthful ignorance I either dismissed or ignored. I now see that the narrative captured a profound truth about how war is not good especially for those who must wage it, but good may come from it for those who now live in peace.
My father was one of the founders of military pediatrics. Surprisingly, pediatricians were valuable members of the military medical forces because of their knowledge of infectious diseases.3 My father had gone in to the then new specialty of pediatrics because in the 1930s, infectious diseases were the primary cause of death in children. Before antibiotics, children would often die of common infections. Service as a combat medical officer in World War II stationed in the European Theater, my father had experience with and access to penicillin. After returning from the war to work in an Army hospital, he and his staff went into the acute pediatric ward and gave the drug to several very sick children, many of whom were likely to die. The next morning on rounds, they noted that many of the children were feeling much better, some even bouncing on their beds.
Perhaps either his telling or my remembering of these events is partly apocryphal, but the reality is that those lethal microbes had no idea what had hit them. Before human physicians overused the new drugs and nature struck back with antibiotic resistance, penicillin seemed miraculous.
Most likely, in 1945 those children would never have been prescribed penicillin, much less survived, if not for the unprecedented and war-driven consortium of industry and government that mass-produced penicillin to treat the troops with infections. Without a doubt then, from the sacrifice and devastation of World War II came the benefits and boons of the antibiotic era—one of the greatest discoveries in medical science.4
Penicillin is but one of legions of scientific discoveries that emerged during wartime. Many of these dramatic improvements, especially those in surgical techniques and emergency medicine, quickly entered the civilian sector. The French surgeon Amboise Paré, for example, revived an old Roman Army practice of using ligatures or tourniquets to stop excessive blood loss, now a staple of emergency responders in disasters. The ambulance services that transported wounded troops to the hospital began on the battlefields of the Civil War.5
These impressive contributions are the direct result of military medicine intended to preserve fighting strength. There are also indirect, although just as revolutionary, efforts of DoD and VA scientists and health care professionals to minimize disability and prevent progression especially of service-connected injuries and illnesses. Among the most groundbreaking is the VA’s 3D-printed artificial lung. I have to admit at first I thought that it was futuristic, but quickly I learned that it was a realistic possibility for the coming decades.6 VA researchers hope the lung will offer a treatment option for patients with chronic obstructive pulmonary disease (COPD), a lung condition more prevalent in veterans than in the civilian population.7 One contributing factor to the increased risk of COPD among former military is the higher rate of smoking among both active duty and veterans than that in the civilian population.8 And the last chain in the link of causation is that smoking is more common in those service members who have posttraumatic stress disorder.9
However, there also is a very dark side to the link between wartime research and medicine—most infamously the Nazi hypothermia experiments conducted at concentration camps. The proposed publication aroused a decades long ethical controversy regarding whether the data should be published, much less used, in research and practice even if it could save the lives of present or future warriors. In 1990, Marcia Angel, MD, then editor-in-chief of the prestigious New England Journal of Medicine, published the information with an accompanying ethical justification. “Finally, refusal to publish the unethical work serves notice to society at large that even scientists do not consider science the primary measure of a civilization. Knowledge, although important, may be less important to a decent society than the way it is obtained.”10 Ethicist Stephen Post writing on behalf of Holocaust victims strenuously disagreed with the decision to publish the research, “Because the Nazi experiments on human beings were so appallingly unethical, it follows, prima facie, that the use of the records is unethical.”11
This debate is key to the distinction between the 2 questions posed at the beginning of this column. Few who have been on a battlefield or who have cared for those who were can suggest or defend that wars should be fought as a catalyst for scientific research or an impetus to medical advancement. Such an instrumentalist view justifies the end of healing with the means of death, which is an intrinsic contradiction that would eventually corrode the integrity of the medical and scientific professions. Conversely, the second question challenges all of us in federal practice to assume a mantle of obligation to take the interventions that enabled combat medicine to save soldiers and apply them to improve the health and save the lives of veterans and civilians alike. It summons scientists laboring in the hundreds of DoD and VA laboratories to use the unparalleled funding and infrastructure of the institutions to develop promising therapeutics to treat the psychological toll and physical cost of war. And finally it charges the citizens whose family and friends have and will serve in uniform to enlist in a political process that enables military medicine and science to achieve the greatest good-health in peace.
1. Remarque EM. All Quiet on the Western Front. New York, NY: Fawcett Books; 1929:228.
2. Connell C. Is war good for medicine: war’s medical legacy? http://sm.stanford.edu/archive/stanmed/2007summer/main.html. Published 2007. Accessed April 18, 2019.
3. Burnett MW, Callahan CW. American pediatricians at war; a legacy of service. Pediatrics. 2012;129(suppl 1):S33-S49.
4. Ligon BL. Penicillin: its discovery and early development. Semin Pediatr Infect Dis. 2004;15(1):52-57.
5. Samuel L. 6 medical innovations that moved from the battlefield to mainstream medicine. https://www.scientificamercan.com/article/6-medical-innovations-that-moved-from-the-battlefield-to-mainstream-medicine. Published November 11, 2017. Accessed April 18, 2019.
6. Richman M. Breathing easier. https://www.research.va.gov/currents/0818-Researchers-strive-to-make-3D-printed-artificial-lung-to-help-Vets-with-respiratory-disease.cfm. Published August 1, 2018. Accessed April 18, 2019.
7. Murphy DE, Chaudry Z, Almoosa KF, Panos RJ. High prevalence of chronic obstructive pulmonary disease among veterans in the urban Midwest. Mill Med. 2011;176(5):552-560.
8. Thompson WH, St-Hilaire C. Prevalence of chronic obstructive pulmonary disease and tobacco use in veterans at Boise Veterans Affairs Medical Center. Respir Care. 2010;55(5):555-560.
9. Cook J, Jakupcak M, Rosenheck R, Fontana A, McFall M. Influence of PTSD symptom clusters on smoking status among help-seeking Iraq and Afghanistan veterans. Nicotine Tob Res. 2009;11(10):1189-1195.
10. Angell M. The Nazi hypothermia experiments and unethical research today. N Eng J Med 1990;322(20):1462-1464.
11. Post SG. The echo of Nuremberg: Nazi data and ethics. J Med Ethics. 1991;17(1):42-44.

Development of a Program to Support VA Community Living Centers’ Quality Improvement
US Department of Veterans Affairs (VA) Community Living Centers (CLCs) provide a dynamic array of long- and short-term health and rehabilitative services in a person-centered environment designed to meet the individual needs of veteran residents. The VA Office of Geriatrics and Extended Care (GEC) manages CLCs as part of its commitment to “optimizing the health and well-being of veterans with multiple chronic conditions, life-limiting illness, frailty or disability associated with chronic disease, aging or injury.”1
CLCs are home to veterans who require short stays before going home, as well as those who require longer or permanent domicile. CLCs also are home to several special populations of veterans, including those with spinal cord injury and those who choose palliative or hospice care. CLCs have embraced cultural transformation, creating therapeutic environments that function as real homes, with the kitchen at the center, and daily activities scheduled around the veterans’ preferences. Data about CLC quality are now available to the public, highlighting the important role of support for and continual refinement to quality improvement (QI) processes in the CLC system. 2,3
CONCERT Program
High-functioning teams are critical to achieving improvement in such processes.4 In fiscal year (FY) 2017, GEC launched a national center to engage and support CLC staff in creating high-functioning, relationship-based teams through specific QI practices, thereby aiming to improve veteran experience and quality of care. The center, known as the CLCs’ Ongoing National Center for Enhancing Resources and Training (CONCERT), is based on extensive VA-funded research in CLCs5-7 and builds on existing, evidence-based literature emphasizing the importance of strengths-based learning, collaborative problem solving, and structured observation.8-13 The CONCERT mission is to support CLCs in ongoing QI efforts, providing guidance, training, and resources. This article summarizes the previous research on which CONCERT is based and describes its current activities, which focus on implementing a national team-based quality improvement initiative.
Earlier VA-funded CLC research included a VA Office of Patient Centered Care and Cultural Transformation local innovation project and 2 VA Office of Research and Development-funded research studies. The local innovation project focused on strengthening staff leadership and relational skills in 1 CLC by engaging leaders and staff in collaborative work to reduce stress. The goal was to build high-functioning team skills through shared projects that created positive work experiences and reduced job-related stress while also improving veteran experience and quality of care.14,15 Over the course of a year, 2 national consultants in nursing home quality improvement worked with CLC leadership and staff, including conducting nine 4-day site visits. Using an approach designed to foster development of high-functioning teams, individual CLC neighborhoods (ie, units) developed and implemented neighborhood-initiated, neighborhood-based pilot projects, such as an individualized finger foods dining option for residents with dementia who became distressed when sitting at a table during a meal. Outcomes of these projects included improved staff communication and staff satisfaction, particularly psychological safety.
In the concurrently conducted pilot research study, a research team comprehensively assessed the person-centered care efforts of 3 CLCs prior to their construction of Green House-type (small house) homes. This mixed-methods study included more than 50 qualitative interviews conducted with VA medical center leadership and CLC staff and residents. Researchers also administered online employee surveys and conducted site visits, including more than 60 hours of direct observation of CLC life and team functioning. The local institutional review boards approved all study procedures, and researchers notified local unions.
Analyses highlighted 2 important aspects of person-centered care not captured by then-existing measurement instruments: the type, quality, and number of staff/resident interactions and the type, quality, and level of resident engagement. The team therefore developed a structured, systematic, observation-based instrument to measure these concepts.5 But while researchers found this instrument useful, it was too complex to be used by CLC staff for QI.
LOCK Quality Improvement
A later and larger research study addressed this issue. In the study, researchers worked with CLC staff to convert the complex observation-based research instrument into several structured tools that were easier for CLC staff to use.6 The researchers then incorporated their experience with the prior local innovation project and designed and implemented a QI program, which operationalized an evidence-based bundle of practices to implement the new tools in 6 CLCs. Researchers called the bundle of practices “LOCK”: (1) Learn from the bright spots; (2) Observe; (3) Collaborate in huddles; and (4) Keep it bite-sized.
Learn from the bright spots. Studies on strengths-based learning indicate that recognizing and sharing positive instances of ideal practice helps provide clear direction regarding what needs to be done differently to achieve success. Identifying and learning from outlying instances of successful practice encourages staff to continue those behaviors and gives staff tangible examples of how they may improve.16-19 That is, concentrating on instances where a negative outcome was at risk of occurring but did not occur (ie, a positive outlier or “bright spot”) enables staff to analyze what facilitated the success and design and pilot strategies to replicate it.
Observe. Human factors engineering is built on the principle that integrated approaches for studying work systems can identify areas for improvement.8 Observation is a key tool in this approach. A recent review of 69 studies that used observation to assess clinical performance found it useful in identifying factors affecting quality and safety.9
Collaborate in huddles. A necessary component to overcoming barriers to successful QI is having high-functioning teams effectively coordinate work. In the theory of relational coordination, this is operationalized as high-quality interactions (frequent, timely, and accurate communication) and high-quality relationships (share knowledge, shared goals, and mutual respect).10,11 Improved relational coordination can lead to higher quality of care outcomes and job satisfaction by enabling individuals to manage their tasks with less delay, more rapid and effective responses, fewer errors, and less wasted effort.12
Keep it bite-sized. Regular practice of a new behavior is one of the keys to making that new behavior part of an automatic routine (ie, a habit). To be successfully integrated into staff work routines, QI initiatives must be perceived as congruent with and easily integrated into care goals and workplace practices. Quick, focused, team-building and solution-oriented QI initiatives, therefore, have the greatest chance of success, particularly if staff feel they have little time for participating in new initiatives.13
Researchers designed the 4 LOCK practices to be interrelated and build on one another, creating a bundle to be used together to help facilitate positive change in resident/staff interactions and resident engagement.7 For 6 months, researchers studied the 6 CLCs’ use of the new structured observation tools as part of the LOCK-based QI program. The participating CLCs had such success in improving staff interactions with residents and residents’ engagement in CLC life that GEC, under the CONCERT umbrella, rolled out the LOCK bundle of practices to CLCs nationwide.20
CONCERT’s current activities focus on helping CLCs implement the LOCK bundle nationwide as a relational coordination-based national QI initiative designed to improve quality of care and staff satisfaction. The CONCERT team began this implementation in FY 2017 using a train-the-trainer approach through a staggered veterans integrated service network (VISN) rollout. Each CLC sent 2 leaders to a VISN-wide training program at a host CLC site (the host site was able to have more participants attend). Afterward, the CONCERT team provided individualized phone support to help CLCs implement the program. A VA Pulse (intranet-based social media portal) site hosts all training materials, program videos, an active blog, community discussions, etc.
In FY 2018, the program shifted to a VISN-based support system, with a CONCERT team member assigned to each VISN and VISN-based webinars to facilitate information exchange, collaboration, and group learning. In FY 2018, the CONCERT team also conducted site visits to selected CLCs with strong implementation success records to learn about program facilitators and to disseminate the lessons learned. Spanning FYs 2018 and 2019, the CONCERT team also supports historically low-performing CLCs through a series of rapid-cycle learning intensives based on the Institute for Healthcare Improvement breakthrough collaborative series model for accelerated and sustained QI.21 These incorporate in-person or virtual learning sessions, in which participants learn about and share effective practices, and between-session learning assignments, to facilitate the piloting, implementation, and sustainment of system changes. As part of the CONCERT continuous QI process, the CONCERT team closely monitors the impact of the program and continues to pilot, adapt, and change practices as it learns more about how best to help CLCs improve.
Conclusion
A key CONCERT principle is that health care systems create health care outcomes. The CONCERT team uses the theory of relational coordination to support implementation of the LOCK bundle of practices to help CLCs change their systems to achieve high performance. Through implementation of the LOCK bundle of practices, CLC staff develop, pilot, and spread new systems for communication, teamwork, and collaborative problem solving, as well as developing skills to participate effectively in these systems. CONCERT represents just 1 way VA supports CLCs in their continual journeys toward ever-improved quality of veteran care.
Acknowledgments
The authors thank Barbara Frank and Cathie Brady for their contributions to the development of the CONCERT program.
1. US Department of Veterans Affairs, Geriatrics and Extended Care Services (GEC). https://www.va.gov/GERIATRICS/index.asp. Updated February 25, 2019. Accessed April 9, 2019.
2. US Department of Veterans Affairs. https://www.accesstocare.va.gov/CNH/Statemap. Accessed April 10, 2019.
3. US Department of Veterans Affairs. https://www.va.gov/QUALITYOFCARE/apps/aspire/clcsurvey.aspx/. U
4. Gittell JH, Weinberg D, Pfefferle S, Bishop C. Impact of relational coordination on job satisfaction and quality outcomes: a study of nursing homes. Hum Resour Manag. 2008;18(2):154-170
5. Snow AL, Dodson, ML, Palmer JA, et al. Development of a new systematic observation tool of nursing home resident and staff engagement and relationship. Gerontologist. 2018;58(2):e15-e24.
6. Hartmann CW, Palmer JA, Mills WL, et al. Adaptation of a nursing home culture change research instrument for frontline staff quality improvement use. Psychol Serv. 2017;14(3):337-346.
7. Mills WL, Pimentel CB, Palmer JA, et al. Applying a theory-driven framework to guide quality improvement efforts in nursing homes: the LOCK model. Gerontologist. 2018;58(3):598-605.
8. Caravon P, Hundt AS, Karsh B, et al. Work system design for patient safety: the SEIPS model. Quality & Safety in Health Care. 2006;15(suppl 1), i50-i58.
9. Yanes AF, McElroy LM, Abecassis ZA, Holl J, Woods D, Ladner DP. Observation for assessment of clinician performance: a narrative review. BMJ Qual Saf. 2016;25(1):46-55.
10. Gittell JH. Supervisory span, relational coordination and flight departure performance: a reassessment of postbureaucracy theory. Organ Sci. 2011;12(4):468-483.
11. Gittell JH. New Directions for Relational Coordination Theory. In Spreitzer GM, Cameron KS, eds. The Oxford Handbook of Positive Organizational Scholarship. Oxford University Press: New York; 2012:400-411.
12. Weinberg DB, Lusenhop RW, Gittell JH, Kautz CM. Coordination between formal providers and informal caregivers. Health Care Manage Rev. 2007;32(2):140-149.
13. Phillips J, Hebish LJ, Mann S, Ching JM, Blackmore CC. Engaging frontline leaders and staff in real-time improvement. Jt Comm J Qual Patient Saf. 2016;42(4):170-183.
14. Farrell D, Brady C, Frank B. Meeting the Leadership Challenge in Long-Term Care: What You Do Matters. Health Professions Press: Baltimore, MD; 2011.
15. Brady C, Farrell D, Frank B. A Long-Term Leaders’ Guide to High Performance: Doing Better Together. Health Professions Press: Baltimore, MD; 2018.
16. Bradley EH, Curry LA, Ramanadhan S, Rowe L, Nembhard IM, Krumholz HM. Research in action: using positive deviance to improve quality of health care. Implement Sci. 2009;4:25.
17. Marsh DR, Schroeder DG, Dearden KA, Sternin J, Sternin M. The power of positive deviance. BMJ. 2004; 329(7475):1177-1179.
18. Vogt K, Johnson F, Fraser V, et al. An innovative, strengths-based, peer mentoring approach to professional development for registered dietitians. Can J Diet Pract Res. 2015;76(4):185-189.
19. Beckett P, Field J, Molloy L, Yu N, Holmes D, Pile E. Practice what you preach: developing person-centered culture in inpatient mental health settings through strengths-based, transformational leadership. Issues Ment Health Nurs. 2013;34(8):595-601.
20. Hartmann CW, Mills WL, Pimentel CB, et al. Impact of intervention to improve nursing home resident-staff interactions and engagement. Gerontologist. 2018;58(4):e291-e301.
21. Institute for Healthcare Improvement. The breakthrough series: IHI’s collaborative model for achieving breakthrough improvement. http://www.ihi.org/resources/Pages/IHIWhitePapers/TheBreakthroughSeriesIHIsCollaborativeModelforAchievingBreakthroughImprovement.aspx. Published 2003. Accessed April 9, 2019.
US Department of Veterans Affairs (VA) Community Living Centers (CLCs) provide a dynamic array of long- and short-term health and rehabilitative services in a person-centered environment designed to meet the individual needs of veteran residents. The VA Office of Geriatrics and Extended Care (GEC) manages CLCs as part of its commitment to “optimizing the health and well-being of veterans with multiple chronic conditions, life-limiting illness, frailty or disability associated with chronic disease, aging or injury.”1
CLCs are home to veterans who require short stays before going home, as well as those who require longer or permanent domicile. CLCs also are home to several special populations of veterans, including those with spinal cord injury and those who choose palliative or hospice care. CLCs have embraced cultural transformation, creating therapeutic environments that function as real homes, with the kitchen at the center, and daily activities scheduled around the veterans’ preferences. Data about CLC quality are now available to the public, highlighting the important role of support for and continual refinement to quality improvement (QI) processes in the CLC system. 2,3
CONCERT Program
High-functioning teams are critical to achieving improvement in such processes.4 In fiscal year (FY) 2017, GEC launched a national center to engage and support CLC staff in creating high-functioning, relationship-based teams through specific QI practices, thereby aiming to improve veteran experience and quality of care. The center, known as the CLCs’ Ongoing National Center for Enhancing Resources and Training (CONCERT), is based on extensive VA-funded research in CLCs5-7 and builds on existing, evidence-based literature emphasizing the importance of strengths-based learning, collaborative problem solving, and structured observation.8-13 The CONCERT mission is to support CLCs in ongoing QI efforts, providing guidance, training, and resources. This article summarizes the previous research on which CONCERT is based and describes its current activities, which focus on implementing a national team-based quality improvement initiative.
Earlier VA-funded CLC research included a VA Office of Patient Centered Care and Cultural Transformation local innovation project and 2 VA Office of Research and Development-funded research studies. The local innovation project focused on strengthening staff leadership and relational skills in 1 CLC by engaging leaders and staff in collaborative work to reduce stress. The goal was to build high-functioning team skills through shared projects that created positive work experiences and reduced job-related stress while also improving veteran experience and quality of care.14,15 Over the course of a year, 2 national consultants in nursing home quality improvement worked with CLC leadership and staff, including conducting nine 4-day site visits. Using an approach designed to foster development of high-functioning teams, individual CLC neighborhoods (ie, units) developed and implemented neighborhood-initiated, neighborhood-based pilot projects, such as an individualized finger foods dining option for residents with dementia who became distressed when sitting at a table during a meal. Outcomes of these projects included improved staff communication and staff satisfaction, particularly psychological safety.
In the concurrently conducted pilot research study, a research team comprehensively assessed the person-centered care efforts of 3 CLCs prior to their construction of Green House-type (small house) homes. This mixed-methods study included more than 50 qualitative interviews conducted with VA medical center leadership and CLC staff and residents. Researchers also administered online employee surveys and conducted site visits, including more than 60 hours of direct observation of CLC life and team functioning. The local institutional review boards approved all study procedures, and researchers notified local unions.
Analyses highlighted 2 important aspects of person-centered care not captured by then-existing measurement instruments: the type, quality, and number of staff/resident interactions and the type, quality, and level of resident engagement. The team therefore developed a structured, systematic, observation-based instrument to measure these concepts.5 But while researchers found this instrument useful, it was too complex to be used by CLC staff for QI.
LOCK Quality Improvement
A later and larger research study addressed this issue. In the study, researchers worked with CLC staff to convert the complex observation-based research instrument into several structured tools that were easier for CLC staff to use.6 The researchers then incorporated their experience with the prior local innovation project and designed and implemented a QI program, which operationalized an evidence-based bundle of practices to implement the new tools in 6 CLCs. Researchers called the bundle of practices “LOCK”: (1) Learn from the bright spots; (2) Observe; (3) Collaborate in huddles; and (4) Keep it bite-sized.
Learn from the bright spots. Studies on strengths-based learning indicate that recognizing and sharing positive instances of ideal practice helps provide clear direction regarding what needs to be done differently to achieve success. Identifying and learning from outlying instances of successful practice encourages staff to continue those behaviors and gives staff tangible examples of how they may improve.16-19 That is, concentrating on instances where a negative outcome was at risk of occurring but did not occur (ie, a positive outlier or “bright spot”) enables staff to analyze what facilitated the success and design and pilot strategies to replicate it.
Observe. Human factors engineering is built on the principle that integrated approaches for studying work systems can identify areas for improvement.8 Observation is a key tool in this approach. A recent review of 69 studies that used observation to assess clinical performance found it useful in identifying factors affecting quality and safety.9
Collaborate in huddles. A necessary component to overcoming barriers to successful QI is having high-functioning teams effectively coordinate work. In the theory of relational coordination, this is operationalized as high-quality interactions (frequent, timely, and accurate communication) and high-quality relationships (share knowledge, shared goals, and mutual respect).10,11 Improved relational coordination can lead to higher quality of care outcomes and job satisfaction by enabling individuals to manage their tasks with less delay, more rapid and effective responses, fewer errors, and less wasted effort.12
Keep it bite-sized. Regular practice of a new behavior is one of the keys to making that new behavior part of an automatic routine (ie, a habit). To be successfully integrated into staff work routines, QI initiatives must be perceived as congruent with and easily integrated into care goals and workplace practices. Quick, focused, team-building and solution-oriented QI initiatives, therefore, have the greatest chance of success, particularly if staff feel they have little time for participating in new initiatives.13
Researchers designed the 4 LOCK practices to be interrelated and build on one another, creating a bundle to be used together to help facilitate positive change in resident/staff interactions and resident engagement.7 For 6 months, researchers studied the 6 CLCs’ use of the new structured observation tools as part of the LOCK-based QI program. The participating CLCs had such success in improving staff interactions with residents and residents’ engagement in CLC life that GEC, under the CONCERT umbrella, rolled out the LOCK bundle of practices to CLCs nationwide.20
CONCERT’s current activities focus on helping CLCs implement the LOCK bundle nationwide as a relational coordination-based national QI initiative designed to improve quality of care and staff satisfaction. The CONCERT team began this implementation in FY 2017 using a train-the-trainer approach through a staggered veterans integrated service network (VISN) rollout. Each CLC sent 2 leaders to a VISN-wide training program at a host CLC site (the host site was able to have more participants attend). Afterward, the CONCERT team provided individualized phone support to help CLCs implement the program. A VA Pulse (intranet-based social media portal) site hosts all training materials, program videos, an active blog, community discussions, etc.
In FY 2018, the program shifted to a VISN-based support system, with a CONCERT team member assigned to each VISN and VISN-based webinars to facilitate information exchange, collaboration, and group learning. In FY 2018, the CONCERT team also conducted site visits to selected CLCs with strong implementation success records to learn about program facilitators and to disseminate the lessons learned. Spanning FYs 2018 and 2019, the CONCERT team also supports historically low-performing CLCs through a series of rapid-cycle learning intensives based on the Institute for Healthcare Improvement breakthrough collaborative series model for accelerated and sustained QI.21 These incorporate in-person or virtual learning sessions, in which participants learn about and share effective practices, and between-session learning assignments, to facilitate the piloting, implementation, and sustainment of system changes. As part of the CONCERT continuous QI process, the CONCERT team closely monitors the impact of the program and continues to pilot, adapt, and change practices as it learns more about how best to help CLCs improve.
Conclusion
A key CONCERT principle is that health care systems create health care outcomes. The CONCERT team uses the theory of relational coordination to support implementation of the LOCK bundle of practices to help CLCs change their systems to achieve high performance. Through implementation of the LOCK bundle of practices, CLC staff develop, pilot, and spread new systems for communication, teamwork, and collaborative problem solving, as well as developing skills to participate effectively in these systems. CONCERT represents just 1 way VA supports CLCs in their continual journeys toward ever-improved quality of veteran care.
Acknowledgments
The authors thank Barbara Frank and Cathie Brady for their contributions to the development of the CONCERT program.
1. US Department of Veterans Affairs, Geriatrics and Extended Care Services (GEC). https://www.va.gov/GERIATRICS/index.asp. Updated February 25, 2019. Accessed April 9, 2019.
2. US Department of Veterans Affairs. https://www.accesstocare.va.gov/CNH/Statemap. Accessed April 10, 2019.
3. US Department of Veterans Affairs. https://www.va.gov/QUALITYOFCARE/apps/aspire/clcsurvey.aspx/. U
4. Gittell JH, Weinberg D, Pfefferle S, Bishop C. Impact of relational coordination on job satisfaction and quality outcomes: a study of nursing homes. Hum Resour Manag. 2008;18(2):154-170
5. Snow AL, Dodson, ML, Palmer JA, et al. Development of a new systematic observation tool of nursing home resident and staff engagement and relationship. Gerontologist. 2018;58(2):e15-e24.
6. Hartmann CW, Palmer JA, Mills WL, et al. Adaptation of a nursing home culture change research instrument for frontline staff quality improvement use. Psychol Serv. 2017;14(3):337-346.
7. Mills WL, Pimentel CB, Palmer JA, et al. Applying a theory-driven framework to guide quality improvement efforts in nursing homes: the LOCK model. Gerontologist. 2018;58(3):598-605.
8. Caravon P, Hundt AS, Karsh B, et al. Work system design for patient safety: the SEIPS model. Quality & Safety in Health Care. 2006;15(suppl 1), i50-i58.
9. Yanes AF, McElroy LM, Abecassis ZA, Holl J, Woods D, Ladner DP. Observation for assessment of clinician performance: a narrative review. BMJ Qual Saf. 2016;25(1):46-55.
10. Gittell JH. Supervisory span, relational coordination and flight departure performance: a reassessment of postbureaucracy theory. Organ Sci. 2011;12(4):468-483.
11. Gittell JH. New Directions for Relational Coordination Theory. In Spreitzer GM, Cameron KS, eds. The Oxford Handbook of Positive Organizational Scholarship. Oxford University Press: New York; 2012:400-411.
12. Weinberg DB, Lusenhop RW, Gittell JH, Kautz CM. Coordination between formal providers and informal caregivers. Health Care Manage Rev. 2007;32(2):140-149.
13. Phillips J, Hebish LJ, Mann S, Ching JM, Blackmore CC. Engaging frontline leaders and staff in real-time improvement. Jt Comm J Qual Patient Saf. 2016;42(4):170-183.
14. Farrell D, Brady C, Frank B. Meeting the Leadership Challenge in Long-Term Care: What You Do Matters. Health Professions Press: Baltimore, MD; 2011.
15. Brady C, Farrell D, Frank B. A Long-Term Leaders’ Guide to High Performance: Doing Better Together. Health Professions Press: Baltimore, MD; 2018.
16. Bradley EH, Curry LA, Ramanadhan S, Rowe L, Nembhard IM, Krumholz HM. Research in action: using positive deviance to improve quality of health care. Implement Sci. 2009;4:25.
17. Marsh DR, Schroeder DG, Dearden KA, Sternin J, Sternin M. The power of positive deviance. BMJ. 2004; 329(7475):1177-1179.
18. Vogt K, Johnson F, Fraser V, et al. An innovative, strengths-based, peer mentoring approach to professional development for registered dietitians. Can J Diet Pract Res. 2015;76(4):185-189.
19. Beckett P, Field J, Molloy L, Yu N, Holmes D, Pile E. Practice what you preach: developing person-centered culture in inpatient mental health settings through strengths-based, transformational leadership. Issues Ment Health Nurs. 2013;34(8):595-601.
20. Hartmann CW, Mills WL, Pimentel CB, et al. Impact of intervention to improve nursing home resident-staff interactions and engagement. Gerontologist. 2018;58(4):e291-e301.
21. Institute for Healthcare Improvement. The breakthrough series: IHI’s collaborative model for achieving breakthrough improvement. http://www.ihi.org/resources/Pages/IHIWhitePapers/TheBreakthroughSeriesIHIsCollaborativeModelforAchievingBreakthroughImprovement.aspx. Published 2003. Accessed April 9, 2019.
Infection or not infection, that is the question—Is procalcitonin the answer?

Diagnostic algorithms have been proposed to help recognize infection in chronic obstructive pulmonary disease, rhinosinusitis syndrome, acute arthritis, pharyngitis, and possible sepsis. The algorithms have included laboratory tests and potential biomarkers, but all are imperfect despite achieving various degrees of acceptance in practice.
In this issue of the Journal, Dr. Fakheri updates us on using the data on serum procalcitonin levels to guide starting and stopping antibiotics in different clinical scenarios. As I read the paper, I wondered what was different about procalcitonin that might allow it to succeed where seemingly similar biomarkers like C-reactive protein (CRP) and the erythrocyte sedimentation rate (ESR) have failed.
Procalcitonin is the approximately 15,000-kD product of the CALC1 gene and the precursor of calcitonin. Not surprisingly, then, it is increased in patients with thyroid medullary carcinoma, and it is also often elevated in nonthyroid neuroendocrine malignancies. Proteolytic cleavage of procalcitonin to active calcitonin takes place mainly or only in the thyroid, and under normal homeostatic conditions, procalcitonin is almost unmeasurable in the circulation. However, under major stress such as systemic inflammation, sepsis, or burns, the CALC1 gene is activated in parenchymal cells in many organs, and procalcitonin is synthesized and released. Notably, under these conditions, the procalcitonin does not seem to be of thyroid origin; hence, calcitonin levels do not rise markedly. The physiologic role of nonthyroidal procalcitonin is unknown.
Procalcitonin synthesis and secretion is turned on in nonthyroid tissue by multiple cytokines; the cytokines most likely relevant to its association with inflammation and infections are interleukin (IL) 1 beta, tumor necrosis factor (TNF) alpha, and IL-6. Since these same mediators drive the acute-phase response and elicit the increase in circulating CRP and fibrinogen (the major contributor to the ESR), the obvious question is why procalcitonin might be a more reliable biomarker to distinguish bacterial infection from inflammation or a viral infection than the CRP level or ESR. And although it does indeed seem to do so in several conditions, as Dr. Fakheri discusses, the explanation is not obvious. But it is intriguing to hypothesize.
Induction of procalcitonin by endotoxin-stimulated cytokines is rapid and seems to be slightly faster than that of CRP, although there may be issues of assay sensitivity. The half-life of procalcitonin is similar to that of CRP (about 24 hours). Its degradation does not seem to be altered in renal insufficiency, and its synthesis seems to rapidly shut off as the cytokine level drops. But interestingly, and perhaps relevant to its possible unique biomarker behavior, its synthesis seems to depend on factors other than the increase in inflammatory cytokines such as IL-6. Under certain circumstances, in the same patient, there is a discrepancy between the levels of procalcitonin and CRP.
In a small study of patients with pulmonary embolism and fever, IL-6 levels increased in many with an expected accompanying increase in CRP and ESR, but procalcitonin did not markedly rise,1 although all 3 markers rose as expected in patients with bacterial pneumonia.
Even more provocative is another study in 69 patients with systemic lupus erythematosus and bacterial infection (43 patients had sepsis, 11 of whom died). The CRP level rose dramatically in the infected patients, but procalcitonin did not.2
The intriguing aspect of this, assuming it holds true in other studies, is that interferon activity is high in lupus and many viral infections, and if interferon can suppress CALC1 gene activation3 but leave CRP activation unaffected, this may provide a clue as to why CRP but not procalcitonin is elevated in serious viral infections, thus allowing procalcitonin to more effectively distinguish bacterial from viral and other nonbacterial inflammatory responses.
The two studies I mention are small, some conflicting results have been published, and the results cannot yet be generalized. Plus, it has long been recognized there is sometimes discordance in a given patient between the elevation in ESR and CRP, not readily explained by the presence of a paraprotein, rheologic factors, or the different time course of decay in the ESR and CRP response. Whatever the explanation, procalcitonin’s biology is interesting, and clinical study results show promise. While tracking procalcitonin levels is not uniformly useful (eg, there is no convincing value in using procalcitonin in the diagnosis of prosthetic joint infections), there is accumulating evidence that it can guide us to using shorter but still effective courses of antibiotics in several clinical scenarios. Hopefully, more frequent use of the test will make a dent in our apparent excess use of antibiotics in patients with nonbacterial upper-respiratory infections.
- Köktürk N, Kanbay A, Bukan N, Ekim N. The value of serum procalcitonin in differential diagnosis of pulmonary embolism and community acquired pneumonia. Clin App Thromb Hemostasis 2011; 17(5):519–525. doi:10.1177/1076029610375425
- El-Serougy E, Zayed HS, Ibrahim NM, Maged LA. Procalcitonin and C-reactive protein as markers of infection in systemic lupus erythematosus: the controversy continues. Lupus 2018 Jan 1:961203318777101. doi:10.1177/0961203318777101 (e-pub ahead of print)
- Linscheid P, Seboek D, Nylen ES, et al. In vitro and in vivo calcitonin I gene expression in parenchymal cells: a novel product of human adipose tissue. Endocrinology 2003; 144(12): 5578–5584. doi:10.1210/en.2003-0854
Diagnostic algorithms have been proposed to help recognize infection in chronic obstructive pulmonary disease, rhinosinusitis syndrome, acute arthritis, pharyngitis, and possible sepsis. The algorithms have included laboratory tests and potential biomarkers, but all are imperfect despite achieving various degrees of acceptance in practice.
In this issue of the Journal, Dr. Fakheri updates us on using the data on serum procalcitonin levels to guide starting and stopping antibiotics in different clinical scenarios. As I read the paper, I wondered what was different about procalcitonin that might allow it to succeed where seemingly similar biomarkers like C-reactive protein (CRP) and the erythrocyte sedimentation rate (ESR) have failed.
Procalcitonin is the approximately 15,000-kD product of the CALC1 gene and the precursor of calcitonin. Not surprisingly, then, it is increased in patients with thyroid medullary carcinoma, and it is also often elevated in nonthyroid neuroendocrine malignancies. Proteolytic cleavage of procalcitonin to active calcitonin takes place mainly or only in the thyroid, and under normal homeostatic conditions, procalcitonin is almost unmeasurable in the circulation. However, under major stress such as systemic inflammation, sepsis, or burns, the CALC1 gene is activated in parenchymal cells in many organs, and procalcitonin is synthesized and released. Notably, under these conditions, the procalcitonin does not seem to be of thyroid origin; hence, calcitonin levels do not rise markedly. The physiologic role of nonthyroidal procalcitonin is unknown.
Procalcitonin synthesis and secretion is turned on in nonthyroid tissue by multiple cytokines; the cytokines most likely relevant to its association with inflammation and infections are interleukin (IL) 1 beta, tumor necrosis factor (TNF) alpha, and IL-6. Since these same mediators drive the acute-phase response and elicit the increase in circulating CRP and fibrinogen (the major contributor to the ESR), the obvious question is why procalcitonin might be a more reliable biomarker to distinguish bacterial infection from inflammation or a viral infection than the CRP level or ESR. And although it does indeed seem to do so in several conditions, as Dr. Fakheri discusses, the explanation is not obvious. But it is intriguing to hypothesize.
Induction of procalcitonin by endotoxin-stimulated cytokines is rapid and seems to be slightly faster than that of CRP, although there may be issues of assay sensitivity. The half-life of procalcitonin is similar to that of CRP (about 24 hours). Its degradation does not seem to be altered in renal insufficiency, and its synthesis seems to rapidly shut off as the cytokine level drops. But interestingly, and perhaps relevant to its possible unique biomarker behavior, its synthesis seems to depend on factors other than the increase in inflammatory cytokines such as IL-6. Under certain circumstances, in the same patient, there is a discrepancy between the levels of procalcitonin and CRP.
In a small study of patients with pulmonary embolism and fever, IL-6 levels increased in many with an expected accompanying increase in CRP and ESR, but procalcitonin did not markedly rise,1 although all 3 markers rose as expected in patients with bacterial pneumonia.
Even more provocative is another study in 69 patients with systemic lupus erythematosus and bacterial infection (43 patients had sepsis, 11 of whom died). The CRP level rose dramatically in the infected patients, but procalcitonin did not.2
The intriguing aspect of this, assuming it holds true in other studies, is that interferon activity is high in lupus and many viral infections, and if interferon can suppress CALC1 gene activation3 but leave CRP activation unaffected, this may provide a clue as to why CRP but not procalcitonin is elevated in serious viral infections, thus allowing procalcitonin to more effectively distinguish bacterial from viral and other nonbacterial inflammatory responses.
The two studies I mention are small, some conflicting results have been published, and the results cannot yet be generalized. Plus, it has long been recognized there is sometimes discordance in a given patient between the elevation in ESR and CRP, not readily explained by the presence of a paraprotein, rheologic factors, or the different time course of decay in the ESR and CRP response. Whatever the explanation, procalcitonin’s biology is interesting, and clinical study results show promise. While tracking procalcitonin levels is not uniformly useful (eg, there is no convincing value in using procalcitonin in the diagnosis of prosthetic joint infections), there is accumulating evidence that it can guide us to using shorter but still effective courses of antibiotics in several clinical scenarios. Hopefully, more frequent use of the test will make a dent in our apparent excess use of antibiotics in patients with nonbacterial upper-respiratory infections.
- Köktürk N, Kanbay A, Bukan N, Ekim N. The value of serum procalcitonin in differential diagnosis of pulmonary embolism and community acquired pneumonia. Clin App Thromb Hemostasis 2011; 17(5):519–525. doi:10.1177/1076029610375425
- El-Serougy E, Zayed HS, Ibrahim NM, Maged LA. Procalcitonin and C-reactive protein as markers of infection in systemic lupus erythematosus: the controversy continues. Lupus 2018 Jan 1:961203318777101. doi:10.1177/0961203318777101 (e-pub ahead of print)
- Linscheid P, Seboek D, Nylen ES, et al. In vitro and in vivo calcitonin I gene expression in parenchymal cells: a novel product of human adipose tissue. Endocrinology 2003; 144(12): 5578–5584. doi:10.1210/en.2003-0854