User login
Anti-Xa assays: What is their role today in antithrombotic therapy?
Should clinicians abandon the activated partial thromboplastin time (aPTT) for monitoring heparin therapy in favor of tests that measure the activity of the patient’s plasma against activated factor X (anti-Xa assays)?
Although other anticoagulants are now available for preventing and treating arterial and venous thromboembolism, unfractionated heparin—which requires laboratory monitoring of therapy—is still widely used. And this monitoring can be challenging. Despite its wide use, the aPTT lacks standardization, and the role of alternative monitoring assays such as the anti-Xa assay is not well defined.
This article reviews the advantages, limitations, and clinical applicability of anti-Xa assays for monitoring therapy with unfractionated heparin and other anticoagulants.
UNFRACTIONATED HEPARIN AND WARFARIN ARE STILL WIDELY USED
Until the mid-1990s, unfractionated heparin and oral vitamin K antagonists (eg, warfarin) were the only anticoagulants widely available for clinical use. These agents have complex pharmacokinetic and pharmacodynamic properties, resulting in highly variable dosing requirements (both between patients and in individual patients) and narrow therapeutic windows, making frequent laboratory monitoring and dose adjustments mandatory.
Over the past 3 decades, other anticoagulants have been approved, including low-molecular-weight heparins, fondaparinux, parenteral direct thrombin inhibitors, and direct oral anticoagulants. While these agents have expanded the options for preventing and treating thromboembolism, unfractionated heparin and warfarin are still the most appropriate choices for many patients, eg, those with stage 4 chronic kidney disease and end-stage renal disease on dialysis, and those with mechanical heart valves.
In addition, unfractionated heparin remains the anticoagulant of choice during procedures such as hemodialysis, percutaneous transluminal angioplasty, and cardiopulmonary bypass, as well as in hospitalized and critically ill patients, who often have acute kidney injury or require frequent interruptions of therapy for invasive procedures. In these scenarios, unfractionated heparin is typically preferred because of its short plasma half-life, complete reversibility by protamine, safety regardless of renal function, and low cost compared with parenteral direct thrombin inhibitors.
As long as unfractionated heparin and warfarin remain important therapies, the need for their laboratory monitoring continues. For warfarin monitoring, the prothrombin time and international normalized ratio are validated and widely reproducible methods. But monitoring unfractionated heparin therapy remains a challenge.
UNFRACTIONATED HEPARIN’S EFFECT IS UNPREDICTABLE
Unfractionated heparin, a negatively charged mucopolysaccharide, inhibits coagulation by binding to antithrombin through the high-affinity pentasaccharide sequence.1–6 Such binding induces a conformational change in the antithrombin molecule, converting it to a rapid inhibitor of several coagulation proteins, especially factors IIa and Xa.2–4
Unfractionated heparin inhibits factors IIa and Xa in a 1:1 ratio, but low-molecular-weight heparins inhibit factor Xa more than factor IIa, with IIa-Xa inhibition ratios ranging from 1:2 to 1:4, owing to their smaller molecular size.7
One of the most important reasons for the unpredictable and highly variable individual responses to unfractionated heparin is that, infused into the blood, the large and negatively charged unfractionated heparin molecules bind nonspecifically to positively charged plasma proteins.7 In patients who are critically ill, have acute infections or inflammatory states, or have undergone major surgery, unfractionated heparin binds to acute-phase proteins that are elevated, particularly factor VIII. This results in fewer free heparin molecules and a variable anticoagulant effect.8
In contrast, low-molecular-weight heparins have longer half-lives and bind less to plasma proteins, resulting in more predictable plasma levels following subcutaneous injection.9
MONITORING UNFRACTIONATED HEPARIN IMPROVES OUTCOMES
In 1960, Barritt and Jordan10 conducted a small but landmark trial that established the clinical importance of unfractionated heparin for treating venous thromboembolism. None of the patients who received unfractionated heparin for acute pulmonary embolism developed a recurrence during the subsequent 2 weeks, while 50% of those who did not receive it had recurrent pulmonary embolism, fatal in half of the cases.
The importance of achieving a specific aPTT therapeutic target was not demonstrated until a 1972 study by Basu et al,11 in which 162 patients with venous thromboembolism were treated with heparin with a target aPTT of 1.5 to 2.5 times the control value. Patients who suffered recurrent events had subtherapeutic aPTT values on 71% of treatment days, while the rest of the patients, with no recurrences, had subtherapeutic aPTT values only 28% of treatment days. The different outcomes could not be explained by the average daily dose of unfractionated heparin, which was similar in the patients regardless of recurrence.
Subsequent studies showed that the best outcomes occur when unfractionated heparin is given in doses high enough to rapidly achieve a therapeutic prolongation of the aPTT,12–14 and that the total daily dose is also important in preventing recurrences.15,16 Failure to achieve a target aPTT within 24 hours of starting unfractionated heparin is associated with increased risk of recurrent venous thromboembolism.13,17
Raschke et al17 found that patients prospectively randomized to weight-based doses of intravenous unfractionated heparin (bolus plus infusion) achieved significantly higher rates of therapeutic aPTT within 6 hours and 24 hours after starting the infusion, and had significantly lower rates of recurrent venous thromboembolism than those randomized to a fixed unfractionated heparin protocol, without an increase in major bleeding.
Smith et al,18 in a study of 400 consecutive patients with acute pulmonary embolism treated with unfractionated heparin, found that patients who achieved a therapeutic aPTT within 24 hours had lower in-hospital and 30-day mortality rates than those who did not achieve the first therapeutic aPTT until more than 24 hours after starting unfractionated heparin infusion.
Such data lend support to the widely accepted practice and current guideline recommendation8 of using laboratory assays to adjust the dose of unfractionated heparin to achieve and maintain a therapeutic target. The use of dosing nomograms significantly reduces the time to achieve a therapeutic aPTT while minimizing subtherapeutic and supratherapeutic unfractionated heparin levels.19,20
THE aPTT REFLECTS THROMBIN INHIBITION
The aPTT has a log-linear relationship with plasma concentrations of unfractionated heparin,21 but it was not developed specifically for monitoring unfractionated heparin therapy. Originally described in 1953 as a screening tool for hemophilia,22–24 the aPTT is prolonged in the setting of factor deficiencies (typically with levels < 45%, except for factors VII and XIII), as well as lupus anticoagulants and therapy with parenteral direct thrombin inhibitors.8,25,26
Because thrombin (factor IIa) is 10 times more sensitive than factor Xa to inhibition by the heparin-antithrombin complex,4,7 thrombin inhibition appears to be the most likely mechanism by which unfractionated heparin prolongs the aPTT. In contrast, aPTT is minimally or not at all prolonged by low-molecular-weight heparins, which are predominantly factor Xa inhibitors.7
HEPARIN ASSAYS MEASURE UNFRACTIONATED HEPARIN ACTIVITY
While the aPTT is a surrogate marker of unfractionated heparin activity in plasma, unfractionated heparin activity can be measured more precisely by so-called heparin assays, which are typically not direct measures of the plasma concentration of heparins, but rather functional assays that provide indirect estimates. They include protamine sulfate titration assays and anti-Xa assays.
Protamine sulfate titration assays measure the amount of protamine sulfate required to neutralize heparin: the more protamine required, the greater the estimated concentration of unfractionated heparin in plasma.8,27–29 Protamine titration assays are technically demanding, so they are rarely used clinically.
Anti-Xa assays provide a measure of the functional level of heparins in plasma.29–33 Chromogenic anti-Xa assays are available on automated analyzers with standardized kits29,33,34 and may be faster to perform than the aPTT.35
Experiments in rabbits show that unfractionated heparin inhibits thrombus formation and extension at concentrations of 0.2 to 0.4 U/mL as measured by the protamine titration assay,27 which correlated with an anti-Xa activity of 0.35 to 0.67 U/mL in a randomized controlled trial.32
Assays that directly measure the plasma concentration of heparin exist but are not clinically relevant because they also measure heparin molecules lacking the pentasaccharide sequence, which have no anticoagulant activity.36
ANTI-Xa ASSAY VS THE aPTT
Anti-Xa assays are more expensive than the aPTT and are not available in all hospitals. For these reasons, the aPTT remains the most commonly used laboratory assay for monitoring unfractionated heparin therapy.
However, the aPTT correlates poorly with the activity level of unfractionated heparin in plasma. In one study, an anti-Xa level of 0.3 U/mL corresponded to aPTT results ranging from 47 to 108 seconds.31 Furthermore, in studies that used a heparin therapeutic target based on an aPTT ratio 1.5 to 2.5 times the control aPTT value, the lower end of that target range was often associated with subtherapeutic plasma unfractionated heparin activity measured by anti-Xa and protamine titration assays.28,31
Because of these limitations, individual laboratories should determine their own aPTT therapeutic target ranges for unfractionated heparin based on the response curves obtained with the reagent and coagulometer used. The optimal therapeutic aPTT range for treating acute venous thromboembolism should be defined as the aPTT range (in seconds) that correlates with a plasma activity level of unfractionated heparin of 0.3 to 0.7 U/mL based on a chromogenic anti-Xa assay, or 0.2 to 0.4 U/mL based on a protamine titration assay.32,34–36
Nevertheless, the anticoagulant effect of unfractionated heparin as measured by the aPTT can be unpredictable and can vary widely among individuals and in the same patient.7 This wide variability can be explained by a number of technical and biologic variables. Different commercial aPTT reagents, different lots of the same reagent, and different reagent and instrument combinations have different sensitivities to unfractionated heparin, which can lead to variable aPTT results.37 Moreover, high plasma levels of acute-phase proteins, low plasma antithrombin levels, consumptive coagulopathies, liver failure, and lupus anticoagulants may also affect the aPTT.7,25,32,36–41 These variables account for the poor correlation—ranging from 25% to 66%—reported between aPTT and anti-Xa assays.32,42–48
Such discrepancies may have serious clinical implications: if a patient’s aPTT is low (subtherapeutic) or high (supratherapeutic) but the anti-Xa assay result is within the therapeutic range (0.3–0.7 units/mL), changing the dose of unfractionated heparin (guided by an aPTT nomogram) may increase the risk of bleeding or of recurrent thromboembolism.
CLINICAL APPLICABILITY OF THE ANTI-Xa ASSAY
Neither anti-Xa nor protamine titration assays are standardized across reference laboratories, but chromogenic anti-Xa assays have better interlaboratory correlation than the aPTT49,50 and can be calibrated specifically for unfractionated or low-molecular-weight heparins.29,33
Although reagent costs are higher for chromogenic anti-Xa assays than for the aPTT, some technical variables (described below) may partially offset the cost difference.29,33,41 In addition, unlike the aPTT, anti-Xa assays do not need local calibration; the therapeutic range for unfractionated heparin is the same (0.3–0.7 U/mL) regardless of instrument or reagent.33,41
Most important, studies have found that patients monitored by anti-Xa assay achieve significantly higher rates of therapeutic anticoagulation within 24 and 48 hours after starting unfractionated heparin infusion than those monitored by the aPTT. Fewer dose adjustments and repeat tests are required, which may also result in lower cost.32,51–55
While these studies found chromogenic anti-Xa assays better for achieving laboratory end points, data regarding relevant clinical outcomes are more limited. In a retrospective, observational cohort study,51 the rate of venous thromboembolism or bleeding-related death was 2% in patients receiving unfractionated heparin therapy monitored by anti-Xa assay and 6% in patients monitored by aPTT (P = .62). Rates of major hemorrhage were also not significantly different.
In a randomized controlled trial32 in 131 patients with acute venous thromboembolism and heparin resistance, rates of recurrent venous thromboembolism were 4.6% and 6.1% in the groups randomized to anti-Xa and aPTT monitoring, respectively, whereas overall bleeding rates were 1.5% and 6.1%, respectively. Again, the differences were not statistically significant.

Heparin resistance. Some patients require unusually high doses of unfractionated heparin to achieve a therapeutic aPTT: typically, more than 35,000 U over 24 hours,7,8,32 or total daily doses that exceed their estimated weight-based requirements. Heparin resistance has been observed in various clinical settings.7,8,32,37–40,59–61 Patients with heparin resistance monitored by anti-Xa had similar rates of recurrent venous thromboembolism while receiving significantly lower doses of unfractionated heparin than those monitored by the aPTT.32
Lupus anticoagulant. Patients with the specific antiphospholipid antibody known as lupus anticoagulant frequently have a prolonged baseline aPTT,25 making it an unreliable marker of anticoagulant effect for intravenous unfractionated heparin therapy.
Critically ill infants and children. Arachchillage et al35 found that infants (< 1 year old) treated with intravenous unfractionated heparin in an intensive care department had only a 32.4% correlation between aPTT and anti-Xa levels, which was lower than that found in children ages 1 to 15 (66%) and adults (52%). In two-thirds of cases of discordant aPTT and anti-Xa levels, the aPTT was elevated (supratherapeutic) while the anti-Xa assay was within the therapeutic range (0.3–0.7 U/mL). Despite the lack of data on clinical outcomes (eg, rates of thrombosis and bleeding) with the use of an anti-Xa assay, it has been considered the method of choice for unfractionated heparin monitoring in critically ill children, and especially in those under age 1.41,44,62–64
While anti-Xa assays may also be better for unfractionated heparin monitoring in critically ill adults, the lack of clinical outcome data from large-scale randomized trials has precluded evidence-based recommendations favoring them over the aPTT.8,34
LIMITATIONS OF ANTI-Xa ASSAYS
Anti-Xa assays are hampered by some technical limitations:
Samples must be processed within 1 hour to avoid heparin neutralization.34
Samples must be clear. Hemolyzed or opaque samples (eg, due to bilirubin levels > 6.6 mg/dL or triglyceride levels > 360 mg/dL) cannot be processed, as they can cause falsely low levels.
Exposure to other anticoagulants can interfere with the results. The anti-Xa assay may be unreliable for unfractionated heparin monitoring in patients who are transitioned from low-molecular-weight heparins, fondaparinux, or an oral factor Xa inhibitor (apixaban, betrixaban, edoxaban, rivaroxaban) to intravenous unfractionated heparin, eg, due to hospitalization or acute kidney injury.65,66 Different reports have found that anti-Xa assays may be elevated for as long as 63 to 96 hours after the last dose of oral Xa inhibitors,67–69 potentially resulting in underdosing of unfractionated heparin. In such settings, unfractionated heparin therapy should be monitored by the aPTT.
ANTI-Xa ASSAYS AND LOW-MOLECULAR-WEIGHT HEPARINS
Most patients receiving low-molecular-weight heparins do not need laboratory monitoring.8 Alhenc-Gelas et al70 randomized patients to receive dalteparin in doses either based on weight or guided by anti-Xa assay results, and found that dose adjustments were rare and lacked clinical benefit.

The suggested therapeutic anti-Xa levels for low-molecular-weight heparins are:
- 0.5–1.2 U/mL for twice-daily enoxaparin
- 1.0–2.0 U/mL for once-daily enoxaparin or dalteparin.
Levels should be measured at peak plasma level (ie, 3–4 hours after subcutaneous injection, except during pregnancy, when it is 4–6 hours), and only after at least 3 doses of low-molecular-weight heparin.8,71 Unlike the anti-Xa therapeutic range recommended for unfractionated heparin therapy, these ranges are not based on prospective data, and if the assay result is outside the suggested therapeutic target range, current guidelines offer no advice on safely adjusting the dose.8,71
Measuring anti-Xa activity is particularly important for pregnant women with a mechanical prosthetic heart valve who are treated with low-molecular-weight heparins. In this setting, valve thrombosis and cardioembolic events have been reported in patients with peak low-molecular-weight heparin anti-Xa assay levels below or even at the lower end of the therapeutic range, and increased bleeding risk has been reported with elevated anti-Xa levels.71–74 Measuring trough low-molecular-weight heparin anti-Xa levels has been suggested to guide dose adjustments during pregnancy.75
Clearance of low-molecular-weight heparins as measured by the anti-Xa assay is highly correlated with creatinine clearance.76,77 A strong linear correlation has been demonstrated between creatine clearance and anti-Xa levels of enoxaparin after multiple therapeutic doses, and low-molecular-weight heparins accumulate in the plasma, especially in patients with creatine clearance less than 30 mL/min.78 The risk of major bleeding is significantly increased in patients with severe renal insufficiency (creatinine clearance < 30 mL/min) not on dialysis who are treated with either prophylactic or therapeutic doses of low-molecular-weight heparin.79–81 In a meta-analysis, the risk of bleeding with therapeutic-intensity doses of enoxaparin was 4 times higher than with prophylactic-intensity doses.79 Although bleeding risk appears to be reduced when the enoxaparin dose is reduced by 50%,8 the efficacy and safety of this strategy has not been determined by prospective trials.
ANTI-Xa ASSAYS IN PATIENTS RECEIVING DIRECT ORAL ANTICOAGULANTS
Direct oral factor Xa inhibitors cannot be measured accurately by heparin anti-Xa assays. Nevertheless, such assays may be useful to assess whether clinically relevant plasma levels are present in cases of major bleeding, suspected anticoagulant failure, or patient noncompliance.82
Intense research has focused on developing drug-specific chromogenic anti-Xa assays using calibrators and standards for apixaban, edoxaban, and rivaroxaban,82,83 and good linear correlation has been shown with some assays.82,84 In patients treated with oral factor Xa inhibitors who need to undergo an urgent invasive procedure associated with high bleeding risk, use of a specific reversal agent may be considered with drug concentrations more than 30 ng/mL measured by a drug-specific anti-Xa assay. A similar suggestion has been made for drug concentrations more than 50 ng/mL in the setting of major bleeding.85 Unfortunately, such assays are not widely available at this time.82,86
While drug-specific anti-Xa assays could become clinically important to guide reversal strategies, their relevance for drug monitoring remains uncertain. This is because no therapeutic target ranges have been established for any of the direct oral anticoagulants, which were approved on the basis of favorable clinical trial outcomes that neither measured nor were correlated with specific drug levels in plasma. Therefore, a specific anti-Xa level cannot yet be used as a marker of clinical efficacy for any specific oral direct Xa inhibitor.
- Abildgaard U. Highly purified antithrombin 3 with heparin cofactor activity prepared by disc electrophoresis. Scand J Clin Lab Invest 1968; 21(1):89–91. pmid:5637480
- Rosenberg RD, Lam L. Correlation between structure and function of heparin. Proc Natl Acad Sci USA 1979; 76(3):1218–1222. pmid:286307
- Lindahl U, Bäckström G, Höök M, Thunberg L, Fransson LA, Linker A. Structure of the antithrombin-binding site of heparin. Proc Natl Acad Sci USA 1979; 76(7):3198–3202. pmid:226960
- Rosenberg RD, Rosenberg JS. Natural anticoagulant mechanisms. J Clin Invest 1984; 74(1):1–6. doi:10.1172/JCI111389
- Casu B, Oreste P, Torri G, et al. The structure of heparin oligosaccharide fragments with high anti-(factor Xa) activity containing the minimal antithrombin III-binding sequence. Chemical and 13C nuclear-magnetic-resonance studies. Biochem J 1981; 197(3):599–609. pmid:7325974
- Choay J, Lormeau JC, Petitou M, Sinaÿ P, Fareed J. Structural studies on a biologically active hexasaccharide obtained from heparin. Ann NY Acad Sci 1981; 370: 644–649. pmid:6943974
- Hirsh J, Warkentin TE, Shaughnessy SG, et al. Heparin and low-molecular-weight heparin: mechanisms of action, pharmacokinetics, dosing, monitoring, efficacy, and safety. Chest 2001; 119(suppl 1):64S–94S. pmid:11157643
- Garcia DA, Baglin TP, Weitz JI, Samama MM. Parenteral anticoagulants: antithrombotic therapy and prevention of thrombosis, 9th ed: American College of Chest Physicians Evidence-Based Clinical Practice Guidelines. Chest 2012; 141(suppl 2):e24S–e43S. doi:10.1378/chest.11-2291
- Hirsh J, Levine M. Low-molecular weight heparin. Blood 1992; 79(1):1–17. pmid:1309422
- Barritt DW, Jordan SC. Anticoagulant drugs in the treatment of pulmonary embolism. A controlled trial. Lancet 1960; 1(7138):1309–1312. pmid:13797091
- Basu D, Gallus A, Hirsh J, Cade J. A prospective study of the value of monitoring heparin treatment with the activated partial thromboplastin time. N Engl J Med 1972; 287(7):324–327. doi:10.1056/NEJM197208172870703
- Hull RD, Raskob GE, Hirsh J, et al. Continuous intravenous heparin compared with intermittent subcutaneous heparin in the initial treatment of proximal-vein thrombosis. N Engl J Med 1986; 315(18):1109–1114. doi:10.1056/NEJM198610303151801
- Hull RD, Raskob GE, Brant RF, Pineo GF, Valentine KA. Relation between the time to achieve the lower limit of the APTT therapeutic range and recurrent venous thromboembolism during heparin treatment for deep vein thrombosis. Arch Intern Med 1997; 157(22):2562–2568. pmid:9531224
- Hull RD, Raskob GE, Brant RF, Pineo GF, Valentine KA. The importance of initial heparin treatment on long-term clinical outcomes of antithrombotic therapy. The emerging theme of delayed recurrence. Arch Intern Med 1997; 157(20):2317–2321. pmid:9361572
- Anand S, Ginsberg JS, Kearon C, Gent M, Hirsh J. The relation between the activated partial thromboplastin time response and recurrence in patients with venous thrombosis treated with continuous intravenous heparin. Arch Intern Med 1996; 156(15):1677–1681. pmid:8694666
- Anand SS, Bates S, Ginsberg JS, et al. Recurrent venous thrombosis and heparin therapy: an evaluation of the importance of early activated partial thromboplastin times. Arch Intern Med 1999; 159(17):2029–2032. pmid:10510988
- Raschke RA, Reilly BM, Guidry JR, Fontana JR, Srinivas S. The weight-based heparin dosing nomogram compared with a “standard care” nomogram. A randomized controlled trial. Ann Intern Med 1993; 119(9):874–881. pmid:8214998
- Smith SB, Geske JB, Maguire JM, Zane NA, Carter RE, Morgenthaler TI. Early anticoagulation is associated with reduced mortality for acute pulmonary embolism. Chest 2010; 137(6):1382–1390. doi:10.1378/chest.09-0959
- Cruickshank MK, Levine MN, Hirsh J, Roberts R, Siguenza M. A standard heparin nomogram for the management of heparin therapy. Arch Intern Med 1991; 151(2):333–337. pmid:1789820
- Raschke RA, Gollihare B, Peirce J. The effectiveness of implementing the weight-based heparin nomogram as a practice guideline. Arch Intern Med 1996; 156(15):1645–1649. pmid:8694662
- Simko RJ, Tsung FF, Stanek EJ. Activated clotting time versus activated partial thromboplastin time for therapeutic monitoring of heparin. Ann Pharmacother 1995; 29(10):1015–1021. doi:10.1177/106002809502901012
- Langdell RD, Wagner RH, Brinkhous KM. Effect of antihemophilic factor on one-stage clotting tests; a presumptive test for hemophilia and a simple one-stage antihemophilic factor assy procedure. J Lab Clin Med 1953; 41(4):637–647.
- White GC 2nd. The partial thromboplastin time: defining an era in coagulation. J Thromb Haemost 2003; 1(11):2267–2270. pmid:14629454
- Proctor RR, Rapaport SI. The partial thromboplastin time with kaolin. A simple screening test for first stage plasma clotting factor deficiencies. Am J Clin Pathol 1961; 36:212–219. pmid:13738153
- Brandt JT, Triplett DA, Rock WA, Bovill EG, Arkin CF. Effect of lupus anticoagulants on the activated partial thromboplastin time. Results of the College of American Pathologists survey program. Arch Pathol Lab Med 1991; 115(2):109–114. pmid:1899555
- Tripodi A, Mannucci PM. Activated partial thromboplastin time (APTT). New indications for an old test? J Thromb Haemost 2006; 4(4):750–751. doi:10.1111/j.1538-7836.2006.01857.x
- Chiu HM, Hirsh J, Yung WL, Regoeczi E, Gent M. Relationship between the anticoagulant and antithrombotic effects of heparin in experimental venous thrombosis. Blood 1977; 49(2):171–184. pmid:831872
- Brill-Edwards P, Ginsberg JS, Johnston M, Hirsh J. Establishing a therapeutic range for heparin therapy. Ann Intern Med 1993; 119(2):104–109. pmid:8512158
- Vandiver JW, Vondracek TG. Antifactor Xa levels versus activated partial thromboplastin time for monitoring unfractionated heparin. Pharmacotherapy 2012; 32(6):546–558. doi:10.1002/j.1875-9114.2011.01049.x
- Newall F. Anti-factor Xa (anti-Xa). In: Monagle P, ed. Haemostasis: Methods and Protocols. New York, NY: Springer-Verlag; 2013.
- Bates SM, Weitz JI, Johnston M, Hirsh J, Ginsberg JS. Use of a fixed activated partial thromboplastin time ratio to establish a therapeutic range for unfractionated heparin. Arch Intern Med 2001; 161(3):385–391. pmid:11176764
- Levine MN, Hirsh J, Gent M, et al. A randomized trial comparing activated thromboplastin time with heparin assay in patients with acute venous thromboembolism requiring large doses of heparin. Arch Intern Med 1994; 154(1):49–56. pmid:8267489
- Wool GD, Lu CM; Education Committee of the Academy of Clinical Laboratory Physicians and Scientists. Pathology consultation on anticoagulation monitoring: factor X-related assays. Am J Clin Pathol 2013; 140(5):623–634. doi:10.1309/AJCPR3JTOK7NKDBJ
- Lehman CM, Frank EL. Laboratory monitoring of heparin therapy: partial thromboplastin time or anti-Xa assay? Lab Med 2009; 40(1):47–51. doi:10.1309/LM9NJGW2ZIOLPHY6
- Arachchillage DR, Kamani F, Deplano S, Banya W, Laffan M. Should we abandon the aPTT for monitoring unfractionated heparin? Thromb Res 2017; 157:157–161. doi:10.1016/j.thromres.2017.07.006
- Olson JD, Arkin CA, Brandt JT, et al. College of American Pathologists Conference XXXI on Laboratory Monitoring of Anticoagulant Therapy: laboratory monitoring of unfractionated heparin therapy. Arch Pathol Lab Med 1998; 122(9):782–798. pmid:9740136
- Eikelboom JW, Hirsh J. Monitoring unfractionated heparin with the aPTT: time for a fresh look. Thromb Haemost 2006; 96(5):547–552. pmid:17080209
- Young E, Prins M, Levine MN, Hirsh J. Heparin binding to plasma proteins, an important mechanism of heparin resistance. Thromb Haemost 1992; 67(6):639–643. pmid:1509402
- Edson JR, Krivit W, White JG. Kaolin partial thromboplastin time: high levels of procoagulants producing short clotting times or masking deficiencies of other procoagulants or low concentrations of anticoagulants. J Lab Clin Med 1967; 70(3):463–470. pmid:6072020
- Whitfield LR, Lele AS, Levy G. Effect of pregnancy on the relationship between concentration and anticoagulant action of heparin. Clin Pharmacol Ther 1983; 34(1):23–28. pmid:6861435
- Marci CD, Prager D. A review of the clinical indications for the plasma heparin assay. Am J Clin Pathol 1993; 99(5):546–550.
- Takemoto CM, Streiff MB, Shermock KM, et al. Activated partial thromboplastin time and anti-Xa measurements in heparin monitoring: biochemical basis of discordance. Am J Clin Pathol 2013; 139(4):450–456. doi:10.1309/AJCPS6OW6DYNOGNH
- Adatya S, Uriel N, Yarmohammadi H, et al. Anti-factor Xa and activated partial thromboplastin time measurements for heparin monitoring in mechanical circulatory support. JACC Heart Fail 2015; 3(4):314–322. doi:10.1016/j.jchf.2014.11.009
- Kuhle S, Eulmesekian P, Kavanagh B, et al. Lack of correlation between heparin dose and standard clinical monitoring tests in treatment with unfractionated heparin in critically ill children. Haematologica 2007; 92(4):554–557. pmid:17488668
- Price EA, Jin J, Nguyen HM, Krishnan G, Bowen R, Zehnder JL. Discordant aPTT and anti-Xa values and outcomes in hospitalized patients treated with intravenous unfractionated heparin. Ann Pharmacother 2013; 47(2):151–158. doi:10.1345/aph.1R635
- Baker BA, Adelman MD, Smith PA, Osborn JC. Inability of the activated partial thromboplastin time to predict heparin levels. Arch Intern Med 1997; 157(21):2475–2479. pmid:9385299
- Koerber JM, Smythe MA, Begle RL, Mattson JC, Kershaw BP, Westley SJ. Correlation of activated clotting time and activated partial thromboplastin time to plasma heparin concentration. Pharmacotherapy 1999; 19(8):922–931. pmid:10453963
- Smythe MA, Mattson JC, Koerber JM. The heparin anti-Xa therapeutic range: are we there yet? Chest 2002; 121(1):303–304. pmid:11796474
- Cuker A, Ptashkin B, Konkle A, et al. Interlaboratory agreement in the monitoring of unfractionated heparin using the anti-factor Xa-correlated activated partial thromboplastin time. J Thromb Haemost 2009; 7(1):80–86. doi:10.1111/j.1538-7836.2008.03224.x
- Taylor CT, Petros WP, Ortel TL. Two instruments to determine activated partial thromboplastin time: implications for heparin monitoring. Pharmacotherapy 1999; 19(4):383–387. pmid:10212007
- Guervil DJ, Rosenberg AF, Winterstein AG, Harris NS, Johns TE, Zumberg MS. Activated partial thromboplastin time versus antifactor Xa heparin assay in monitoring unfractionated heparin by continuous intravenous infusion. Ann Pharmacother 2011; 45(7–8):861–868. doi:10.1345/aph.1Q161
- Fruge KS, Lee YR. Comparison of unfractionated heparin protocols using antifactor Xa monitoring or activated partial thrombin time monitoring. Am J Health Syst Pharm 2015; 72(17 suppl 2):S90–S97. doi:10.2146/sp150016
- Rosborough TK. Monitoring unfractionated heparin therapy with antifactor Xa activity results in fewer monitoring tests and dosage changes than monitoring with activated partial thromboplastin time. Pharmacotherapy 1999; 19(6):760–766. pmid:10391423
- Rosborough TK, Shepherd MF. Achieving target antifactor Xa activity with a heparin protocol based on sex, age, height, and weight. Pharmacotherapy 2004; 24(6):713–719. doi:10.1592/phco.24.8.713.36067
- Smith ML, Wheeler KE. Weight-based heparin protocol using antifactor Xa monitoring. Am J Health Syst Pharm 2010; 67(5):371–374. doi:10.2146/ajhp090123
- Bartholomew JR, Kottke-Marchant K. Monitoring anticoagulation therapy in patients with the lupus anticoagulant. J Clin Rheumatol 1998; 4(6):307–312. pmid:19078327
- Wool GD, Lu CM; Education Committee of the Academy of Clinical Laboratory Physicians and Scientists. Pathology consultation on anticoagulation monitoring: factor X-related assays. Am J Clin Pathol 2013; 140(5):623–634. doi:10.1309/AJCPR3JTOK7NKDBJ
- Mehta TP, Smythe MA, Mattson JC. Strategies for managing heparin therapy in patients with antiphospholipid antibody syndrome. Pharmacotherapy 2011; 31(12):1221–1231. doi:10.1592/phco.31.12.1221
- Levine SP, Sorenson RR, Harris MA, Knieriem LK. The effect of platelet factor 4 (PF4) on assays of plasma heparin. Br J Haematol 1984; 57(4):585–596. pmid:6743573
- Fisher AR, Bailey CR, Shannon CN, Wielogorski AK. Heparin resistance after aprotinin. Lancet 1992; 340(8829):1230–1231. pmid:1279335
- Becker RC, Corrao JM, Bovill EG, et al. Intravenous nitroglycerin-induced heparin resistance: a qualitative antithrombin III abnormality. Am Heart J 1990; 119(6):1254–1261. pmid:2112878
- Monagle P, Chan AK, Goldenberg NA, et al. Antithrombotic therapy in neonates and children: Antithrombotic Therapy and Prevention of Thrombosis, 9th ed: American College of Chest Physicians Evidence-Based Clinical Practice Guidelines. Chest 2012; 141(suppl 2):e737S–e801S. doi:10.1378/chest.11-2308
- Long E, Pitfield AF, Kissoon N. Anticoagulation therapy: indications, monitoring, and complications. Pediatr Emerg Care 2011; 27(1):55–61. doi:10.1097/PEC.0b013e31820461b1
- Andrew M, Schmidt B. Use of heparin in newborn infants. Semin Thromb Hemost 1988; 14(1):28–32. doi:10.1055/s-2007-1002752
- Teien AN, Lie M, Abildgaard U. Assay of heparin in plasma using a chromogenic substrate for activated factor X. Thromb Res 1976; 8(3):413–416. pmid:1265712
- Vera-Aguillera J, Yousef H, Beltran-Melgarejo D, et al. Clinical scenarios for discordant anti-Xa. Adv Hematol 2016; 2016:4054806. doi:10.1155/2016/4054806
- Macedo KA, Tatarian P, Eugenio KR. Influence of direct oral anticoagulants on anti-factor Xa measurements utilized for monitoring heparin. Ann Pharmacother 2018; 52(2):154–159. doi:10.1177/1060028017729481
- Wendte J, Voss G, Van Overschelde B. Influence of apixaban on antifactor Xa levels in a patient with acute kidney injury. Am J Health Syst Pharm 2016; 73(8):563–567. doi:10.2146/ajhp150360
- Faust AC, Kanyer D, Wittkowsky AK. Managing transitions from oral factor Xa inhibitors to unfractionated heparin infusions. Am J Health Syst Pharm 2016; 73(24):2037–2041. doi:10.2146/ajhp150596
- Alhenc-Gelas M, Jestin-Le Guernic C, Vitoux JF, Kher A, Aiach M, Fiessinger JN. Adjusted versus fixed doses of the low-molecular-weight heparin fragmin in the treatment of deep vein thrombosis. Fragmin-Study Group. Thromb Haemost 1994; 71(6):698–702. pmid:7974334
- Bates SM, Greer IA, Middeldorp S, Veenstra DL, Prabulos AM, Vandvik PO. VTE, thrombophilia, antithrombotic therapy, and pregnancy: Antithrombotic Therapy and Prevention of Thrombosis, 9th ed: American College of Chest Physicians Evidence-Based Clinical Practice Guidelines. Chest 2012; 141(suppl 2):e691S–e736S. doi:10.1378/chest.11-2300
- Bara L, Leizorovicz A, Picolet H, Samama M. Correlation between anti-Xa and occurrence of thrombosis and haemorrhage in post-surgical patients treated with either Logiparin (LMWH) or unfractionated heparin. Post-surgery Logiparin Study Group. Thromb Res 1992; 65(4–5):641–650. pmid:1319619
- Prandoni P, Lensing AW, Büller HR, et al. Comparison of subcutaneous low-molecular-weight heparin with intravenous standard heparin in proximal deep-vein thrombosis. Lancet 1992; 339(8791):441–445. pmid:1346817
- Walenga JM, Hoppensteadt D, Fareed J. Laboratory monitoring of the clinical effects of low molecular weight heparins. Thromb Res Suppl 1991;14:49–62. pmid:1658970
- Elkayam U. Anticoagulation therapy for pregnant women with mechanical prosthetic heart valves: how to improve safety? J Am Coll Cardiol 2017; 69(22):2692–2695. doi:10.1016/j.jacc.2017.04.034
- Brophy DF, Wazny LD, Gehr TW, Comstock TJ, Venitz J. The pharmacokinetics of subcutaneous enoxaparin in end-stage renal disease. Pharmacotherapy 2001; 21(2):169–174. pmid:11213853
- Becker RC, Spencer FA, Gibson M, et al; TIMI 11A Investigators. Influence of patient characteristics and renal function on factor Xa inhibition pharmacokinetics and pharmacodynamics after enoxaparin administration in non-ST-segment elevation acute coronary syndromes. Am Heart J 2002; 143(5):753–759. pmid:12040334
- Chow SL, Zammit K, West K, Dannenhoffer M, Lopez-Candales A. Correlation of antifactor Xa concentrations with renal function in patients on enoxaparin. J Clin Pharmacol 2003; 43(6):586–590. pmid:12817521
- Lim W, Dentali F, Eikelboom JW, Crowther MA. Meta-analysis: low-molecular-weight heparin and bleeding in patients with severe renal insufficiency. Ann Intern Med 2006; 144(9):673–684. pmid:16670137
- Spinler SA, Inverso SM, Cohen M, Goodman SG, Stringer KA, Antman EM; ESSENCE and TIMI 11B Investigators. Safety and efficacy of unfractionated heparin versus enoxaparin in patients who are obese and patients with severe renal impairment: analysis from the ESSENCE and TIMI 11B studies. Am Heart J 2003; 146(1):33–41. doi:10.1016/S0002-8703(03)00121-2
- Cestac P, Bagheri H, Lapeyre-Mestre M, et al. Utilisation and safety of low molecular weight heparins: prospective observational study in medical inpatients. Drug Saf 2003; 26(3):197–207. doi:10.2165/00002018-200326030-00005
- Douxfils J, Ageno W, Samama CM, et al. Laboratory testing in patients treated with direct oral anticoagulants: a practical guide for clinicians. J Thromb Haemost 2018; 16(2):209–219. doi:10.1111/jth.13912
- Samuelson BT, Cuker A, Siegal DM, Crowther M, Garcia DA. Laboratory assessment of the anticoagulant activity of direct oral anticoagulants: a systematic review. Chest 2017; 151(1):127–138. doi:10.1016/j.chest.2016.08.1462
- Gosselin RC, Francart SJ, Hawes EM, Moll S, Dager WE, Adcock DM. Heparin-calibrated chromogenic anti-Xa activity measurements in patients receiving rivaroxaban: can this test be used to quantify drug level? Ann Pharmacother 2015; 49(7):777–783. doi:10.1177/1060028015578451
- Levy JH, Ageno W, Chan NC, Crowther M, Verhamme P, Weitz JI; Subcommittee on Control of Anticoagulation. When and how to use antidotes for the reversal of direct oral anticoagulants: guidance from the SSC of the ISTH. J Thromb Haemost 2016; 14(3):623–627. doi:10.1111/jth.13227
- Cuker A, Siegal D. Monitoring and reversal of direct oral anticoagulants. Hematology Am Soc Hematol Educ Program 2015; 2015:117–124. doi:10.1182/asheducation-2015.1.117
Should clinicians abandon the activated partial thromboplastin time (aPTT) for monitoring heparin therapy in favor of tests that measure the activity of the patient’s plasma against activated factor X (anti-Xa assays)?
Although other anticoagulants are now available for preventing and treating arterial and venous thromboembolism, unfractionated heparin—which requires laboratory monitoring of therapy—is still widely used. And this monitoring can be challenging. Despite its wide use, the aPTT lacks standardization, and the role of alternative monitoring assays such as the anti-Xa assay is not well defined.
This article reviews the advantages, limitations, and clinical applicability of anti-Xa assays for monitoring therapy with unfractionated heparin and other anticoagulants.
UNFRACTIONATED HEPARIN AND WARFARIN ARE STILL WIDELY USED
Until the mid-1990s, unfractionated heparin and oral vitamin K antagonists (eg, warfarin) were the only anticoagulants widely available for clinical use. These agents have complex pharmacokinetic and pharmacodynamic properties, resulting in highly variable dosing requirements (both between patients and in individual patients) and narrow therapeutic windows, making frequent laboratory monitoring and dose adjustments mandatory.
Over the past 3 decades, other anticoagulants have been approved, including low-molecular-weight heparins, fondaparinux, parenteral direct thrombin inhibitors, and direct oral anticoagulants. While these agents have expanded the options for preventing and treating thromboembolism, unfractionated heparin and warfarin are still the most appropriate choices for many patients, eg, those with stage 4 chronic kidney disease and end-stage renal disease on dialysis, and those with mechanical heart valves.
In addition, unfractionated heparin remains the anticoagulant of choice during procedures such as hemodialysis, percutaneous transluminal angioplasty, and cardiopulmonary bypass, as well as in hospitalized and critically ill patients, who often have acute kidney injury or require frequent interruptions of therapy for invasive procedures. In these scenarios, unfractionated heparin is typically preferred because of its short plasma half-life, complete reversibility by protamine, safety regardless of renal function, and low cost compared with parenteral direct thrombin inhibitors.
As long as unfractionated heparin and warfarin remain important therapies, the need for their laboratory monitoring continues. For warfarin monitoring, the prothrombin time and international normalized ratio are validated and widely reproducible methods. But monitoring unfractionated heparin therapy remains a challenge.
UNFRACTIONATED HEPARIN’S EFFECT IS UNPREDICTABLE
Unfractionated heparin, a negatively charged mucopolysaccharide, inhibits coagulation by binding to antithrombin through the high-affinity pentasaccharide sequence.1–6 Such binding induces a conformational change in the antithrombin molecule, converting it to a rapid inhibitor of several coagulation proteins, especially factors IIa and Xa.2–4
Unfractionated heparin inhibits factors IIa and Xa in a 1:1 ratio, but low-molecular-weight heparins inhibit factor Xa more than factor IIa, with IIa-Xa inhibition ratios ranging from 1:2 to 1:4, owing to their smaller molecular size.7
One of the most important reasons for the unpredictable and highly variable individual responses to unfractionated heparin is that, infused into the blood, the large and negatively charged unfractionated heparin molecules bind nonspecifically to positively charged plasma proteins.7 In patients who are critically ill, have acute infections or inflammatory states, or have undergone major surgery, unfractionated heparin binds to acute-phase proteins that are elevated, particularly factor VIII. This results in fewer free heparin molecules and a variable anticoagulant effect.8
In contrast, low-molecular-weight heparins have longer half-lives and bind less to plasma proteins, resulting in more predictable plasma levels following subcutaneous injection.9
MONITORING UNFRACTIONATED HEPARIN IMPROVES OUTCOMES
In 1960, Barritt and Jordan10 conducted a small but landmark trial that established the clinical importance of unfractionated heparin for treating venous thromboembolism. None of the patients who received unfractionated heparin for acute pulmonary embolism developed a recurrence during the subsequent 2 weeks, while 50% of those who did not receive it had recurrent pulmonary embolism, fatal in half of the cases.
The importance of achieving a specific aPTT therapeutic target was not demonstrated until a 1972 study by Basu et al,11 in which 162 patients with venous thromboembolism were treated with heparin with a target aPTT of 1.5 to 2.5 times the control value. Patients who suffered recurrent events had subtherapeutic aPTT values on 71% of treatment days, while the rest of the patients, with no recurrences, had subtherapeutic aPTT values only 28% of treatment days. The different outcomes could not be explained by the average daily dose of unfractionated heparin, which was similar in the patients regardless of recurrence.
Subsequent studies showed that the best outcomes occur when unfractionated heparin is given in doses high enough to rapidly achieve a therapeutic prolongation of the aPTT,12–14 and that the total daily dose is also important in preventing recurrences.15,16 Failure to achieve a target aPTT within 24 hours of starting unfractionated heparin is associated with increased risk of recurrent venous thromboembolism.13,17
Raschke et al17 found that patients prospectively randomized to weight-based doses of intravenous unfractionated heparin (bolus plus infusion) achieved significantly higher rates of therapeutic aPTT within 6 hours and 24 hours after starting the infusion, and had significantly lower rates of recurrent venous thromboembolism than those randomized to a fixed unfractionated heparin protocol, without an increase in major bleeding.
Smith et al,18 in a study of 400 consecutive patients with acute pulmonary embolism treated with unfractionated heparin, found that patients who achieved a therapeutic aPTT within 24 hours had lower in-hospital and 30-day mortality rates than those who did not achieve the first therapeutic aPTT until more than 24 hours after starting unfractionated heparin infusion.
Such data lend support to the widely accepted practice and current guideline recommendation8 of using laboratory assays to adjust the dose of unfractionated heparin to achieve and maintain a therapeutic target. The use of dosing nomograms significantly reduces the time to achieve a therapeutic aPTT while minimizing subtherapeutic and supratherapeutic unfractionated heparin levels.19,20
THE aPTT REFLECTS THROMBIN INHIBITION
The aPTT has a log-linear relationship with plasma concentrations of unfractionated heparin,21 but it was not developed specifically for monitoring unfractionated heparin therapy. Originally described in 1953 as a screening tool for hemophilia,22–24 the aPTT is prolonged in the setting of factor deficiencies (typically with levels < 45%, except for factors VII and XIII), as well as lupus anticoagulants and therapy with parenteral direct thrombin inhibitors.8,25,26
Because thrombin (factor IIa) is 10 times more sensitive than factor Xa to inhibition by the heparin-antithrombin complex,4,7 thrombin inhibition appears to be the most likely mechanism by which unfractionated heparin prolongs the aPTT. In contrast, aPTT is minimally or not at all prolonged by low-molecular-weight heparins, which are predominantly factor Xa inhibitors.7
HEPARIN ASSAYS MEASURE UNFRACTIONATED HEPARIN ACTIVITY
While the aPTT is a surrogate marker of unfractionated heparin activity in plasma, unfractionated heparin activity can be measured more precisely by so-called heparin assays, which are typically not direct measures of the plasma concentration of heparins, but rather functional assays that provide indirect estimates. They include protamine sulfate titration assays and anti-Xa assays.
Protamine sulfate titration assays measure the amount of protamine sulfate required to neutralize heparin: the more protamine required, the greater the estimated concentration of unfractionated heparin in plasma.8,27–29 Protamine titration assays are technically demanding, so they are rarely used clinically.
Anti-Xa assays provide a measure of the functional level of heparins in plasma.29–33 Chromogenic anti-Xa assays are available on automated analyzers with standardized kits29,33,34 and may be faster to perform than the aPTT.35
Experiments in rabbits show that unfractionated heparin inhibits thrombus formation and extension at concentrations of 0.2 to 0.4 U/mL as measured by the protamine titration assay,27 which correlated with an anti-Xa activity of 0.35 to 0.67 U/mL in a randomized controlled trial.32
Assays that directly measure the plasma concentration of heparin exist but are not clinically relevant because they also measure heparin molecules lacking the pentasaccharide sequence, which have no anticoagulant activity.36
ANTI-Xa ASSAY VS THE aPTT
Anti-Xa assays are more expensive than the aPTT and are not available in all hospitals. For these reasons, the aPTT remains the most commonly used laboratory assay for monitoring unfractionated heparin therapy.
However, the aPTT correlates poorly with the activity level of unfractionated heparin in plasma. In one study, an anti-Xa level of 0.3 U/mL corresponded to aPTT results ranging from 47 to 108 seconds.31 Furthermore, in studies that used a heparin therapeutic target based on an aPTT ratio 1.5 to 2.5 times the control aPTT value, the lower end of that target range was often associated with subtherapeutic plasma unfractionated heparin activity measured by anti-Xa and protamine titration assays.28,31
Because of these limitations, individual laboratories should determine their own aPTT therapeutic target ranges for unfractionated heparin based on the response curves obtained with the reagent and coagulometer used. The optimal therapeutic aPTT range for treating acute venous thromboembolism should be defined as the aPTT range (in seconds) that correlates with a plasma activity level of unfractionated heparin of 0.3 to 0.7 U/mL based on a chromogenic anti-Xa assay, or 0.2 to 0.4 U/mL based on a protamine titration assay.32,34–36
Nevertheless, the anticoagulant effect of unfractionated heparin as measured by the aPTT can be unpredictable and can vary widely among individuals and in the same patient.7 This wide variability can be explained by a number of technical and biologic variables. Different commercial aPTT reagents, different lots of the same reagent, and different reagent and instrument combinations have different sensitivities to unfractionated heparin, which can lead to variable aPTT results.37 Moreover, high plasma levels of acute-phase proteins, low plasma antithrombin levels, consumptive coagulopathies, liver failure, and lupus anticoagulants may also affect the aPTT.7,25,32,36–41 These variables account for the poor correlation—ranging from 25% to 66%—reported between aPTT and anti-Xa assays.32,42–48
Such discrepancies may have serious clinical implications: if a patient’s aPTT is low (subtherapeutic) or high (supratherapeutic) but the anti-Xa assay result is within the therapeutic range (0.3–0.7 units/mL), changing the dose of unfractionated heparin (guided by an aPTT nomogram) may increase the risk of bleeding or of recurrent thromboembolism.
CLINICAL APPLICABILITY OF THE ANTI-Xa ASSAY
Neither anti-Xa nor protamine titration assays are standardized across reference laboratories, but chromogenic anti-Xa assays have better interlaboratory correlation than the aPTT49,50 and can be calibrated specifically for unfractionated or low-molecular-weight heparins.29,33
Although reagent costs are higher for chromogenic anti-Xa assays than for the aPTT, some technical variables (described below) may partially offset the cost difference.29,33,41 In addition, unlike the aPTT, anti-Xa assays do not need local calibration; the therapeutic range for unfractionated heparin is the same (0.3–0.7 U/mL) regardless of instrument or reagent.33,41
Most important, studies have found that patients monitored by anti-Xa assay achieve significantly higher rates of therapeutic anticoagulation within 24 and 48 hours after starting unfractionated heparin infusion than those monitored by the aPTT. Fewer dose adjustments and repeat tests are required, which may also result in lower cost.32,51–55
While these studies found chromogenic anti-Xa assays better for achieving laboratory end points, data regarding relevant clinical outcomes are more limited. In a retrospective, observational cohort study,51 the rate of venous thromboembolism or bleeding-related death was 2% in patients receiving unfractionated heparin therapy monitored by anti-Xa assay and 6% in patients monitored by aPTT (P = .62). Rates of major hemorrhage were also not significantly different.
In a randomized controlled trial32 in 131 patients with acute venous thromboembolism and heparin resistance, rates of recurrent venous thromboembolism were 4.6% and 6.1% in the groups randomized to anti-Xa and aPTT monitoring, respectively, whereas overall bleeding rates were 1.5% and 6.1%, respectively. Again, the differences were not statistically significant.
Heparin resistance. Some patients require unusually high doses of unfractionated heparin to achieve a therapeutic aPTT: typically, more than 35,000 U over 24 hours,7,8,32 or total daily doses that exceed their estimated weight-based requirements. Heparin resistance has been observed in various clinical settings.7,8,32,37–40,59–61 Patients with heparin resistance monitored by anti-Xa had similar rates of recurrent venous thromboembolism while receiving significantly lower doses of unfractionated heparin than those monitored by the aPTT.32
Lupus anticoagulant. Patients with the specific antiphospholipid antibody known as lupus anticoagulant frequently have a prolonged baseline aPTT,25 making it an unreliable marker of anticoagulant effect for intravenous unfractionated heparin therapy.
Critically ill infants and children. Arachchillage et al35 found that infants (< 1 year old) treated with intravenous unfractionated heparin in an intensive care department had only a 32.4% correlation between aPTT and anti-Xa levels, which was lower than that found in children ages 1 to 15 (66%) and adults (52%). In two-thirds of cases of discordant aPTT and anti-Xa levels, the aPTT was elevated (supratherapeutic) while the anti-Xa assay was within the therapeutic range (0.3–0.7 U/mL). Despite the lack of data on clinical outcomes (eg, rates of thrombosis and bleeding) with the use of an anti-Xa assay, it has been considered the method of choice for unfractionated heparin monitoring in critically ill children, and especially in those under age 1.41,44,62–64
While anti-Xa assays may also be better for unfractionated heparin monitoring in critically ill adults, the lack of clinical outcome data from large-scale randomized trials has precluded evidence-based recommendations favoring them over the aPTT.8,34
LIMITATIONS OF ANTI-Xa ASSAYS
Anti-Xa assays are hampered by some technical limitations:
Samples must be processed within 1 hour to avoid heparin neutralization.34
Samples must be clear. Hemolyzed or opaque samples (eg, due to bilirubin levels > 6.6 mg/dL or triglyceride levels > 360 mg/dL) cannot be processed, as they can cause falsely low levels.
Exposure to other anticoagulants can interfere with the results. The anti-Xa assay may be unreliable for unfractionated heparin monitoring in patients who are transitioned from low-molecular-weight heparins, fondaparinux, or an oral factor Xa inhibitor (apixaban, betrixaban, edoxaban, rivaroxaban) to intravenous unfractionated heparin, eg, due to hospitalization or acute kidney injury.65,66 Different reports have found that anti-Xa assays may be elevated for as long as 63 to 96 hours after the last dose of oral Xa inhibitors,67–69 potentially resulting in underdosing of unfractionated heparin. In such settings, unfractionated heparin therapy should be monitored by the aPTT.
ANTI-Xa ASSAYS AND LOW-MOLECULAR-WEIGHT HEPARINS
Most patients receiving low-molecular-weight heparins do not need laboratory monitoring.8 Alhenc-Gelas et al70 randomized patients to receive dalteparin in doses either based on weight or guided by anti-Xa assay results, and found that dose adjustments were rare and lacked clinical benefit.
The suggested therapeutic anti-Xa levels for low-molecular-weight heparins are:
- 0.5–1.2 U/mL for twice-daily enoxaparin
- 1.0–2.0 U/mL for once-daily enoxaparin or dalteparin.
Levels should be measured at peak plasma level (ie, 3–4 hours after subcutaneous injection, except during pregnancy, when it is 4–6 hours), and only after at least 3 doses of low-molecular-weight heparin.8,71 Unlike the anti-Xa therapeutic range recommended for unfractionated heparin therapy, these ranges are not based on prospective data, and if the assay result is outside the suggested therapeutic target range, current guidelines offer no advice on safely adjusting the dose.8,71
Measuring anti-Xa activity is particularly important for pregnant women with a mechanical prosthetic heart valve who are treated with low-molecular-weight heparins. In this setting, valve thrombosis and cardioembolic events have been reported in patients with peak low-molecular-weight heparin anti-Xa assay levels below or even at the lower end of the therapeutic range, and increased bleeding risk has been reported with elevated anti-Xa levels.71–74 Measuring trough low-molecular-weight heparin anti-Xa levels has been suggested to guide dose adjustments during pregnancy.75
Clearance of low-molecular-weight heparins as measured by the anti-Xa assay is highly correlated with creatinine clearance.76,77 A strong linear correlation has been demonstrated between creatine clearance and anti-Xa levels of enoxaparin after multiple therapeutic doses, and low-molecular-weight heparins accumulate in the plasma, especially in patients with creatine clearance less than 30 mL/min.78 The risk of major bleeding is significantly increased in patients with severe renal insufficiency (creatinine clearance < 30 mL/min) not on dialysis who are treated with either prophylactic or therapeutic doses of low-molecular-weight heparin.79–81 In a meta-analysis, the risk of bleeding with therapeutic-intensity doses of enoxaparin was 4 times higher than with prophylactic-intensity doses.79 Although bleeding risk appears to be reduced when the enoxaparin dose is reduced by 50%,8 the efficacy and safety of this strategy has not been determined by prospective trials.
ANTI-Xa ASSAYS IN PATIENTS RECEIVING DIRECT ORAL ANTICOAGULANTS
Direct oral factor Xa inhibitors cannot be measured accurately by heparin anti-Xa assays. Nevertheless, such assays may be useful to assess whether clinically relevant plasma levels are present in cases of major bleeding, suspected anticoagulant failure, or patient noncompliance.82
Intense research has focused on developing drug-specific chromogenic anti-Xa assays using calibrators and standards for apixaban, edoxaban, and rivaroxaban,82,83 and good linear correlation has been shown with some assays.82,84 In patients treated with oral factor Xa inhibitors who need to undergo an urgent invasive procedure associated with high bleeding risk, use of a specific reversal agent may be considered with drug concentrations more than 30 ng/mL measured by a drug-specific anti-Xa assay. A similar suggestion has been made for drug concentrations more than 50 ng/mL in the setting of major bleeding.85 Unfortunately, such assays are not widely available at this time.82,86
While drug-specific anti-Xa assays could become clinically important to guide reversal strategies, their relevance for drug monitoring remains uncertain. This is because no therapeutic target ranges have been established for any of the direct oral anticoagulants, which were approved on the basis of favorable clinical trial outcomes that neither measured nor were correlated with specific drug levels in plasma. Therefore, a specific anti-Xa level cannot yet be used as a marker of clinical efficacy for any specific oral direct Xa inhibitor.
- Abildgaard U. Highly purified antithrombin 3 with heparin cofactor activity prepared by disc electrophoresis. Scand J Clin Lab Invest 1968; 21(1):89–91. pmid:5637480
- Rosenberg RD, Lam L. Correlation between structure and function of heparin. Proc Natl Acad Sci USA 1979; 76(3):1218–1222. pmid:286307
- Lindahl U, Bäckström G, Höök M, Thunberg L, Fransson LA, Linker A. Structure of the antithrombin-binding site of heparin. Proc Natl Acad Sci USA 1979; 76(7):3198–3202. pmid:226960
- Rosenberg RD, Rosenberg JS. Natural anticoagulant mechanisms. J Clin Invest 1984; 74(1):1–6. doi:10.1172/JCI111389
- Casu B, Oreste P, Torri G, et al. The structure of heparin oligosaccharide fragments with high anti-(factor Xa) activity containing the minimal antithrombin III-binding sequence. Chemical and 13C nuclear-magnetic-resonance studies. Biochem J 1981; 197(3):599–609. pmid:7325974
- Choay J, Lormeau JC, Petitou M, Sinaÿ P, Fareed J. Structural studies on a biologically active hexasaccharide obtained from heparin. Ann NY Acad Sci 1981; 370: 644–649. pmid:6943974
- Hirsh J, Warkentin TE, Shaughnessy SG, et al. Heparin and low-molecular-weight heparin: mechanisms of action, pharmacokinetics, dosing, monitoring, efficacy, and safety. Chest 2001; 119(suppl 1):64S–94S. pmid:11157643
- Garcia DA, Baglin TP, Weitz JI, Samama MM. Parenteral anticoagulants: antithrombotic therapy and prevention of thrombosis, 9th ed: American College of Chest Physicians Evidence-Based Clinical Practice Guidelines. Chest 2012; 141(suppl 2):e24S–e43S. doi:10.1378/chest.11-2291
- Hirsh J, Levine M. Low-molecular weight heparin. Blood 1992; 79(1):1–17. pmid:1309422
- Barritt DW, Jordan SC. Anticoagulant drugs in the treatment of pulmonary embolism. A controlled trial. Lancet 1960; 1(7138):1309–1312. pmid:13797091
- Basu D, Gallus A, Hirsh J, Cade J. A prospective study of the value of monitoring heparin treatment with the activated partial thromboplastin time. N Engl J Med 1972; 287(7):324–327. doi:10.1056/NEJM197208172870703
- Hull RD, Raskob GE, Hirsh J, et al. Continuous intravenous heparin compared with intermittent subcutaneous heparin in the initial treatment of proximal-vein thrombosis. N Engl J Med 1986; 315(18):1109–1114. doi:10.1056/NEJM198610303151801
- Hull RD, Raskob GE, Brant RF, Pineo GF, Valentine KA. Relation between the time to achieve the lower limit of the APTT therapeutic range and recurrent venous thromboembolism during heparin treatment for deep vein thrombosis. Arch Intern Med 1997; 157(22):2562–2568. pmid:9531224
- Hull RD, Raskob GE, Brant RF, Pineo GF, Valentine KA. The importance of initial heparin treatment on long-term clinical outcomes of antithrombotic therapy. The emerging theme of delayed recurrence. Arch Intern Med 1997; 157(20):2317–2321. pmid:9361572
- Anand S, Ginsberg JS, Kearon C, Gent M, Hirsh J. The relation between the activated partial thromboplastin time response and recurrence in patients with venous thrombosis treated with continuous intravenous heparin. Arch Intern Med 1996; 156(15):1677–1681. pmid:8694666
- Anand SS, Bates S, Ginsberg JS, et al. Recurrent venous thrombosis and heparin therapy: an evaluation of the importance of early activated partial thromboplastin times. Arch Intern Med 1999; 159(17):2029–2032. pmid:10510988
- Raschke RA, Reilly BM, Guidry JR, Fontana JR, Srinivas S. The weight-based heparin dosing nomogram compared with a “standard care” nomogram. A randomized controlled trial. Ann Intern Med 1993; 119(9):874–881. pmid:8214998
- Smith SB, Geske JB, Maguire JM, Zane NA, Carter RE, Morgenthaler TI. Early anticoagulation is associated with reduced mortality for acute pulmonary embolism. Chest 2010; 137(6):1382–1390. doi:10.1378/chest.09-0959
- Cruickshank MK, Levine MN, Hirsh J, Roberts R, Siguenza M. A standard heparin nomogram for the management of heparin therapy. Arch Intern Med 1991; 151(2):333–337. pmid:1789820
- Raschke RA, Gollihare B, Peirce J. The effectiveness of implementing the weight-based heparin nomogram as a practice guideline. Arch Intern Med 1996; 156(15):1645–1649. pmid:8694662
- Simko RJ, Tsung FF, Stanek EJ. Activated clotting time versus activated partial thromboplastin time for therapeutic monitoring of heparin. Ann Pharmacother 1995; 29(10):1015–1021. doi:10.1177/106002809502901012
- Langdell RD, Wagner RH, Brinkhous KM. Effect of antihemophilic factor on one-stage clotting tests; a presumptive test for hemophilia and a simple one-stage antihemophilic factor assy procedure. J Lab Clin Med 1953; 41(4):637–647.
- White GC 2nd. The partial thromboplastin time: defining an era in coagulation. J Thromb Haemost 2003; 1(11):2267–2270. pmid:14629454
- Proctor RR, Rapaport SI. The partial thromboplastin time with kaolin. A simple screening test for first stage plasma clotting factor deficiencies. Am J Clin Pathol 1961; 36:212–219. pmid:13738153
- Brandt JT, Triplett DA, Rock WA, Bovill EG, Arkin CF. Effect of lupus anticoagulants on the activated partial thromboplastin time. Results of the College of American Pathologists survey program. Arch Pathol Lab Med 1991; 115(2):109–114. pmid:1899555
- Tripodi A, Mannucci PM. Activated partial thromboplastin time (APTT). New indications for an old test? J Thromb Haemost 2006; 4(4):750–751. doi:10.1111/j.1538-7836.2006.01857.x
- Chiu HM, Hirsh J, Yung WL, Regoeczi E, Gent M. Relationship between the anticoagulant and antithrombotic effects of heparin in experimental venous thrombosis. Blood 1977; 49(2):171–184. pmid:831872
- Brill-Edwards P, Ginsberg JS, Johnston M, Hirsh J. Establishing a therapeutic range for heparin therapy. Ann Intern Med 1993; 119(2):104–109. pmid:8512158
- Vandiver JW, Vondracek TG. Antifactor Xa levels versus activated partial thromboplastin time for monitoring unfractionated heparin. Pharmacotherapy 2012; 32(6):546–558. doi:10.1002/j.1875-9114.2011.01049.x
- Newall F. Anti-factor Xa (anti-Xa). In: Monagle P, ed. Haemostasis: Methods and Protocols. New York, NY: Springer-Verlag; 2013.
- Bates SM, Weitz JI, Johnston M, Hirsh J, Ginsberg JS. Use of a fixed activated partial thromboplastin time ratio to establish a therapeutic range for unfractionated heparin. Arch Intern Med 2001; 161(3):385–391. pmid:11176764
- Levine MN, Hirsh J, Gent M, et al. A randomized trial comparing activated thromboplastin time with heparin assay in patients with acute venous thromboembolism requiring large doses of heparin. Arch Intern Med 1994; 154(1):49–56. pmid:8267489
- Wool GD, Lu CM; Education Committee of the Academy of Clinical Laboratory Physicians and Scientists. Pathology consultation on anticoagulation monitoring: factor X-related assays. Am J Clin Pathol 2013; 140(5):623–634. doi:10.1309/AJCPR3JTOK7NKDBJ
- Lehman CM, Frank EL. Laboratory monitoring of heparin therapy: partial thromboplastin time or anti-Xa assay? Lab Med 2009; 40(1):47–51. doi:10.1309/LM9NJGW2ZIOLPHY6
- Arachchillage DR, Kamani F, Deplano S, Banya W, Laffan M. Should we abandon the aPTT for monitoring unfractionated heparin? Thromb Res 2017; 157:157–161. doi:10.1016/j.thromres.2017.07.006
- Olson JD, Arkin CA, Brandt JT, et al. College of American Pathologists Conference XXXI on Laboratory Monitoring of Anticoagulant Therapy: laboratory monitoring of unfractionated heparin therapy. Arch Pathol Lab Med 1998; 122(9):782–798. pmid:9740136
- Eikelboom JW, Hirsh J. Monitoring unfractionated heparin with the aPTT: time for a fresh look. Thromb Haemost 2006; 96(5):547–552. pmid:17080209
- Young E, Prins M, Levine MN, Hirsh J. Heparin binding to plasma proteins, an important mechanism of heparin resistance. Thromb Haemost 1992; 67(6):639–643. pmid:1509402
- Edson JR, Krivit W, White JG. Kaolin partial thromboplastin time: high levels of procoagulants producing short clotting times or masking deficiencies of other procoagulants or low concentrations of anticoagulants. J Lab Clin Med 1967; 70(3):463–470. pmid:6072020
- Whitfield LR, Lele AS, Levy G. Effect of pregnancy on the relationship between concentration and anticoagulant action of heparin. Clin Pharmacol Ther 1983; 34(1):23–28. pmid:6861435
- Marci CD, Prager D. A review of the clinical indications for the plasma heparin assay. Am J Clin Pathol 1993; 99(5):546–550.
- Takemoto CM, Streiff MB, Shermock KM, et al. Activated partial thromboplastin time and anti-Xa measurements in heparin monitoring: biochemical basis of discordance. Am J Clin Pathol 2013; 139(4):450–456. doi:10.1309/AJCPS6OW6DYNOGNH
- Adatya S, Uriel N, Yarmohammadi H, et al. Anti-factor Xa and activated partial thromboplastin time measurements for heparin monitoring in mechanical circulatory support. JACC Heart Fail 2015; 3(4):314–322. doi:10.1016/j.jchf.2014.11.009
- Kuhle S, Eulmesekian P, Kavanagh B, et al. Lack of correlation between heparin dose and standard clinical monitoring tests in treatment with unfractionated heparin in critically ill children. Haematologica 2007; 92(4):554–557. pmid:17488668
- Price EA, Jin J, Nguyen HM, Krishnan G, Bowen R, Zehnder JL. Discordant aPTT and anti-Xa values and outcomes in hospitalized patients treated with intravenous unfractionated heparin. Ann Pharmacother 2013; 47(2):151–158. doi:10.1345/aph.1R635
- Baker BA, Adelman MD, Smith PA, Osborn JC. Inability of the activated partial thromboplastin time to predict heparin levels. Arch Intern Med 1997; 157(21):2475–2479. pmid:9385299
- Koerber JM, Smythe MA, Begle RL, Mattson JC, Kershaw BP, Westley SJ. Correlation of activated clotting time and activated partial thromboplastin time to plasma heparin concentration. Pharmacotherapy 1999; 19(8):922–931. pmid:10453963
- Smythe MA, Mattson JC, Koerber JM. The heparin anti-Xa therapeutic range: are we there yet? Chest 2002; 121(1):303–304. pmid:11796474
- Cuker A, Ptashkin B, Konkle A, et al. Interlaboratory agreement in the monitoring of unfractionated heparin using the anti-factor Xa-correlated activated partial thromboplastin time. J Thromb Haemost 2009; 7(1):80–86. doi:10.1111/j.1538-7836.2008.03224.x
- Taylor CT, Petros WP, Ortel TL. Two instruments to determine activated partial thromboplastin time: implications for heparin monitoring. Pharmacotherapy 1999; 19(4):383–387. pmid:10212007
- Guervil DJ, Rosenberg AF, Winterstein AG, Harris NS, Johns TE, Zumberg MS. Activated partial thromboplastin time versus antifactor Xa heparin assay in monitoring unfractionated heparin by continuous intravenous infusion. Ann Pharmacother 2011; 45(7–8):861–868. doi:10.1345/aph.1Q161
- Fruge KS, Lee YR. Comparison of unfractionated heparin protocols using antifactor Xa monitoring or activated partial thrombin time monitoring. Am J Health Syst Pharm 2015; 72(17 suppl 2):S90–S97. doi:10.2146/sp150016
- Rosborough TK. Monitoring unfractionated heparin therapy with antifactor Xa activity results in fewer monitoring tests and dosage changes than monitoring with activated partial thromboplastin time. Pharmacotherapy 1999; 19(6):760–766. pmid:10391423
- Rosborough TK, Shepherd MF. Achieving target antifactor Xa activity with a heparin protocol based on sex, age, height, and weight. Pharmacotherapy 2004; 24(6):713–719. doi:10.1592/phco.24.8.713.36067
- Smith ML, Wheeler KE. Weight-based heparin protocol using antifactor Xa monitoring. Am J Health Syst Pharm 2010; 67(5):371–374. doi:10.2146/ajhp090123
- Bartholomew JR, Kottke-Marchant K. Monitoring anticoagulation therapy in patients with the lupus anticoagulant. J Clin Rheumatol 1998; 4(6):307–312. pmid:19078327
- Wool GD, Lu CM; Education Committee of the Academy of Clinical Laboratory Physicians and Scientists. Pathology consultation on anticoagulation monitoring: factor X-related assays. Am J Clin Pathol 2013; 140(5):623–634. doi:10.1309/AJCPR3JTOK7NKDBJ
- Mehta TP, Smythe MA, Mattson JC. Strategies for managing heparin therapy in patients with antiphospholipid antibody syndrome. Pharmacotherapy 2011; 31(12):1221–1231. doi:10.1592/phco.31.12.1221
- Levine SP, Sorenson RR, Harris MA, Knieriem LK. The effect of platelet factor 4 (PF4) on assays of plasma heparin. Br J Haematol 1984; 57(4):585–596. pmid:6743573
- Fisher AR, Bailey CR, Shannon CN, Wielogorski AK. Heparin resistance after aprotinin. Lancet 1992; 340(8829):1230–1231. pmid:1279335
- Becker RC, Corrao JM, Bovill EG, et al. Intravenous nitroglycerin-induced heparin resistance: a qualitative antithrombin III abnormality. Am Heart J 1990; 119(6):1254–1261. pmid:2112878
- Monagle P, Chan AK, Goldenberg NA, et al. Antithrombotic therapy in neonates and children: Antithrombotic Therapy and Prevention of Thrombosis, 9th ed: American College of Chest Physicians Evidence-Based Clinical Practice Guidelines. Chest 2012; 141(suppl 2):e737S–e801S. doi:10.1378/chest.11-2308
- Long E, Pitfield AF, Kissoon N. Anticoagulation therapy: indications, monitoring, and complications. Pediatr Emerg Care 2011; 27(1):55–61. doi:10.1097/PEC.0b013e31820461b1
- Andrew M, Schmidt B. Use of heparin in newborn infants. Semin Thromb Hemost 1988; 14(1):28–32. doi:10.1055/s-2007-1002752
- Teien AN, Lie M, Abildgaard U. Assay of heparin in plasma using a chromogenic substrate for activated factor X. Thromb Res 1976; 8(3):413–416. pmid:1265712
- Vera-Aguillera J, Yousef H, Beltran-Melgarejo D, et al. Clinical scenarios for discordant anti-Xa. Adv Hematol 2016; 2016:4054806. doi:10.1155/2016/4054806
- Macedo KA, Tatarian P, Eugenio KR. Influence of direct oral anticoagulants on anti-factor Xa measurements utilized for monitoring heparin. Ann Pharmacother 2018; 52(2):154–159. doi:10.1177/1060028017729481
- Wendte J, Voss G, Van Overschelde B. Influence of apixaban on antifactor Xa levels in a patient with acute kidney injury. Am J Health Syst Pharm 2016; 73(8):563–567. doi:10.2146/ajhp150360
- Faust AC, Kanyer D, Wittkowsky AK. Managing transitions from oral factor Xa inhibitors to unfractionated heparin infusions. Am J Health Syst Pharm 2016; 73(24):2037–2041. doi:10.2146/ajhp150596
- Alhenc-Gelas M, Jestin-Le Guernic C, Vitoux JF, Kher A, Aiach M, Fiessinger JN. Adjusted versus fixed doses of the low-molecular-weight heparin fragmin in the treatment of deep vein thrombosis. Fragmin-Study Group. Thromb Haemost 1994; 71(6):698–702. pmid:7974334
- Bates SM, Greer IA, Middeldorp S, Veenstra DL, Prabulos AM, Vandvik PO. VTE, thrombophilia, antithrombotic therapy, and pregnancy: Antithrombotic Therapy and Prevention of Thrombosis, 9th ed: American College of Chest Physicians Evidence-Based Clinical Practice Guidelines. Chest 2012; 141(suppl 2):e691S–e736S. doi:10.1378/chest.11-2300
- Bara L, Leizorovicz A, Picolet H, Samama M. Correlation between anti-Xa and occurrence of thrombosis and haemorrhage in post-surgical patients treated with either Logiparin (LMWH) or unfractionated heparin. Post-surgery Logiparin Study Group. Thromb Res 1992; 65(4–5):641–650. pmid:1319619
- Prandoni P, Lensing AW, Büller HR, et al. Comparison of subcutaneous low-molecular-weight heparin with intravenous standard heparin in proximal deep-vein thrombosis. Lancet 1992; 339(8791):441–445. pmid:1346817
- Walenga JM, Hoppensteadt D, Fareed J. Laboratory monitoring of the clinical effects of low molecular weight heparins. Thromb Res Suppl 1991;14:49–62. pmid:1658970
- Elkayam U. Anticoagulation therapy for pregnant women with mechanical prosthetic heart valves: how to improve safety? J Am Coll Cardiol 2017; 69(22):2692–2695. doi:10.1016/j.jacc.2017.04.034
- Brophy DF, Wazny LD, Gehr TW, Comstock TJ, Venitz J. The pharmacokinetics of subcutaneous enoxaparin in end-stage renal disease. Pharmacotherapy 2001; 21(2):169–174. pmid:11213853
- Becker RC, Spencer FA, Gibson M, et al; TIMI 11A Investigators. Influence of patient characteristics and renal function on factor Xa inhibition pharmacokinetics and pharmacodynamics after enoxaparin administration in non-ST-segment elevation acute coronary syndromes. Am Heart J 2002; 143(5):753–759. pmid:12040334
- Chow SL, Zammit K, West K, Dannenhoffer M, Lopez-Candales A. Correlation of antifactor Xa concentrations with renal function in patients on enoxaparin. J Clin Pharmacol 2003; 43(6):586–590. pmid:12817521
- Lim W, Dentali F, Eikelboom JW, Crowther MA. Meta-analysis: low-molecular-weight heparin and bleeding in patients with severe renal insufficiency. Ann Intern Med 2006; 144(9):673–684. pmid:16670137
- Spinler SA, Inverso SM, Cohen M, Goodman SG, Stringer KA, Antman EM; ESSENCE and TIMI 11B Investigators. Safety and efficacy of unfractionated heparin versus enoxaparin in patients who are obese and patients with severe renal impairment: analysis from the ESSENCE and TIMI 11B studies. Am Heart J 2003; 146(1):33–41. doi:10.1016/S0002-8703(03)00121-2
- Cestac P, Bagheri H, Lapeyre-Mestre M, et al. Utilisation and safety of low molecular weight heparins: prospective observational study in medical inpatients. Drug Saf 2003; 26(3):197–207. doi:10.2165/00002018-200326030-00005
- Douxfils J, Ageno W, Samama CM, et al. Laboratory testing in patients treated with direct oral anticoagulants: a practical guide for clinicians. J Thromb Haemost 2018; 16(2):209–219. doi:10.1111/jth.13912
- Samuelson BT, Cuker A, Siegal DM, Crowther M, Garcia DA. Laboratory assessment of the anticoagulant activity of direct oral anticoagulants: a systematic review. Chest 2017; 151(1):127–138. doi:10.1016/j.chest.2016.08.1462
- Gosselin RC, Francart SJ, Hawes EM, Moll S, Dager WE, Adcock DM. Heparin-calibrated chromogenic anti-Xa activity measurements in patients receiving rivaroxaban: can this test be used to quantify drug level? Ann Pharmacother 2015; 49(7):777–783. doi:10.1177/1060028015578451
- Levy JH, Ageno W, Chan NC, Crowther M, Verhamme P, Weitz JI; Subcommittee on Control of Anticoagulation. When and how to use antidotes for the reversal of direct oral anticoagulants: guidance from the SSC of the ISTH. J Thromb Haemost 2016; 14(3):623–627. doi:10.1111/jth.13227
- Cuker A, Siegal D. Monitoring and reversal of direct oral anticoagulants. Hematology Am Soc Hematol Educ Program 2015; 2015:117–124. doi:10.1182/asheducation-2015.1.117
KEY POINTS
- Intravenous unfractionated heparin treatment is typically monitored by the activated partial thromboplastin time (aPTT), with a therapeutic target defined as the range that corresponds to an anti-Xa level of 0.3 to 0.7 U/mL.
- Monitoring unfractionated heparin is important to achieve a therapeutic target within the first 24 hours and to maintain therapeutic levels thereafter.
- The heparin anti-Xa assay is unreliable for unfractionated heparin monitoring when switching from oral factor Xa inhibitor therapy to intravenous unfractionated heparin. In such cases, the aPTT is preferred.
- Most patients receiving low-molecular-weight heparin do not need monitoring, but monitoring should be considered for pregnant women with prosthetic heart valves, using an anti-Xa assay specific for low-molecular-weight heparin.

Is chest radiography routinely needed after thoracentesis?
No. After thoracentesis, chest radiography or another lung imaging study should be done only if pneumothorax is suspected, if thoracentesis requires more than 1 attempt, if the patient is on mechanical ventilation or has pre-existing lung disease, or if a large volume (> 1,500 mL) of fluid is removed. Radiography is also usually not necessary after diagnostic thoracentesis in a patient breathing spontaneously. In most cases, pneumothorax found incidentally after thoracentesis does not require decompression and can be managed supportively.
WHAT ARE THE RISKS OF THORACENTESIS?
Thoracentesis is a minimally invasive procedure usually performed at the bedside that involves insertion of a needle into the pleural cavity for drainage of fluid.1 Diagnostic thoracentesis should be done in most cases of a new pleural effusion unless the effusion is small and with a clear diagnosis, or in cases of typical heart failure.
Therapeutic thoracentesis, often called large-volume thoracentesis, aims to improve symptoms such as dyspnea attributed to the pleural effusion by removing at least 1 L of pleural fluid. The presence of active respiratory symptoms and suspicion of infected pleural effusion should lead to thoracentesis as soon as possible.
Complications of thoracentesis may be benign, such as pain and anxiety associated with the procedure and external bleeding at the site of needle insertion. Pneumothorax is the most common serious procedural complication and the principal reason to order postprocedural chest radiography.1 Less common complications include hemothorax, re-expansion pulmonary edema, infection, subdiaphragmatic organ puncture, and procedure-related death. Bleeding complications and hemothorax are rare even in patients with underlying coagulopathy.2
Point-of-care pleural ultrasonography is now considered the standard of care to guide optimal needle location for the procedure and to exclude other conditions that can mimic pleural effusion on chest radiography, such as lung consolidation and atelectasis.3 High proficiency in the use of preprocedural point-of-care ultrasonography reduces the rate of procedural complications, though it does not eliminate the risk entirely.3,4
Factors associated with higher rates of complications include lack of operator proficiency, poor understanding of the anatomy, poor patient positioning, poor patient cooperation with the procedure, lack of availability of bedside ultrasonography, and drainage of more than 1,500 mL of fluid. Addressing these factors has been shown to decrease the risk of pneumothorax and infection.1–5
HOW OFTEN DOES PNEUMOTHORAX OCCUR AFTER THORACENTESIS?
Several early studies have examined the incidence of pneumothorax after thoracentesis. Lack of ultrasonography use likely explains a higher incidence of complications in early studies: rates of pneumothorax after thoracentesis without ultrasonographic guidance ranged from 5.2% to 26%.6,7
Gervais et al8 analyzed thoracentesis with ultrasonographic guidance in 434 patients, 92 of whom were intubated, and reported that pneumothorax occurred in 10 patients, of whom 6 were intubated. Two of the intubated patients required chest tubes. Other studies have confirmed the low incidence of pneumothorax in patients undergoing thoracentesis, with rates such as 0.61%,1 5%,9 and 4%.10
The major predictor of postprocedural pneumothorax was the presence of symptoms such as chest pain and dyspnea. No intervention was necessary for most cases of pneumothorax in asymptomatic patients. The more widespread use of procedural ultrasonography may explain some discrepancies between the early5,6 and more recent studies.1,8–10
Several studies have demonstrated that postprocedural radiography is unnecessary unless a complication is suspected based on the patient’s symptoms or the need to demonstrate lung re-expansion.1,4,9,10 Clinical suspicion and the patient’s symptoms are the major predictors of procedure-related pneumothorax requiring treatment with a chest tube. Otherwise, incidentally discovered pneumothorax can usually be observed and managed supportively.
WHAT MECHANISMS UNDERLIE POSTPROCEDURAL PNEUMOTHORAX?
Major causes of pneumothorax in patients undergoing thoracentesis are direct puncture during needle or catheter insertion, the introduction of air through the needle or catheter into the pleural cavity, and the inability of the ipsilateral lung to fully expand after drainage of a large volume of fluid, known as pneumothorax ex vacuo.5
Pneumothorax ex vacuo may be seen in patients with medical conditions such as endobronchial obstruction, pleural scarring from long-standing pleural effusion, and lung malignancy, all of which can impair the lung’s ability to expand after removal of a large volume of pleural fluid. It is believed that transient parenchymal pleural fistulae form if the lung cannot expand, causing air leakage into the pleural cavity.5,8,9 Pleural manometry to monitor changes in pleural pressure and elastance can decrease the rates of pneumothorax ex vacuo in patients with the above risk factors.5
WHEN IS RADIOGRAPHY INDICATED AFTER THORACENTESIS?
Current literature suggests that imaging to evaluate for postprocedural complications should be done if there is suspicion of a complication, if thoracentesis required multiple attempts, if the procedure caused aspiration of air, if the patient has advanced lung disease, if the patient is scheduled to undergo thoracic radiation, if the patient is on mechanical ventilation, and after therapeutic thoracentesis if a large volume of fluid is removed.1–10 Routine chest radiography after thoracentesis is not supported in the literature in the absence of these risk factors.
Some practitioners order chest imaging after therapeutic thoracentesis to assess for residual pleural fluid and for visualization of other abnormalities previously hidden by pleural effusion, rather than simply to exclude postprocedural pneumothorax. Alternatively, postprocedural bedside pleural ultrasonography with recording of images can be done to assess for complications and residual pleural fluid volume without exposing the patient to radiation.11
Needle decompression and chest tube insertion should be considered in patients with tension pneumothorax, large pneumothorax (distance from the chest wall to the visceral pleural line of at least 2 cm), mechanical ventilation, progressing pneumothorax, and symptoms.
KEY POINTS
- Pneumothorax is a rare complication of thoracentesis when performed by a skilled operator using ultrasonographic guidance.
- Mechanisms behind the occurrence of pneumothorax are direct lung puncture, introduction of air into the pleural cavity, and pneumothorax ex vacuo.
- In asymptomatic patients, pneumothorax after thoracentesis rarely requires intervention beyond supportive care and close observation.
- Factors such as multiple thoracentesis attempts, symptoms, clinical suspicion, air aspiration during thoracentesis, presence of previous lung disease, and removal of a large volume of fluid may require postprocedural lung imaging (eg, bedside ultrasonography, radiography).
- Ault MJ, Rosen BT, Scher J, Feinglass J, Barsuk JH. Thoracentesis outcomes: a 12-year experience. Thorax 2015; 70(2):127–132. doi:10.1136/thoraxjnl-2014-206114
- Hibbert RM, Atwell TD, Lekah A, et al. Safety of ultrasound-guided thoracentesis in patients with abnormal preprocedural coagulation parameters. Chest 2013; 144(2):456–463. doi:10.1378/chest.12-2374
- Barnes TW, Morgenthaler TI, Olson EJ, Hesley GK, Decker PA, Ryu JH. Sonographically guided thoracentesis and rate of pneumothorax. J Clin Ultrasound 2005; 33(9):442–446. doi:10.1002/jcu.20163
- Gordon CE, Feller-Kopman D, Balk EM, Smetana GW. Pneumothorax following thoracentesis: a systematic review and meta-analysis. Arch Intern Med 2010; 170(4):332–339. doi:10.1001/archinternmed.2009.548
- Heidecker J, Huggins JT, Sahn SA, Doelken P. Pathophysiology of pneumothorax following ultrasound-guided thoracentesis. Chest 2006; 130(4):1173–1184. doi:10.1016/S0012-3692(15)51155-0
- Brandstetter RD, Karetzky M, Rastogi R, Lolis JD. Pneumothorax after thoracentesis in chronic obstructive pulmonary disease. Heart Lung 1994; 23(1):67–70. pmid:8150647
- Doyle JJ, Hnatiuk OW, Torrington KG, Slade AR, Howard RS. Necessity of routine chest roentgenography after thoracentesis. Ann Intern Med 1996; 124(9):816–820. pmid:8610950
- Gervais DA, Petersein A, Lee MJ, Hahn PF, Saini S, Mueller PR. US-guided thoracentesis: requirement for postprocedure chest radiography in patients who receive mechanical ventilation versus patients who breathe spontaneously. Radiology 1997; 204(2):503–506. doi:10.1148/radiology.204.2.9240544
- Capizzi SA, Prakash UB. Chest roentgenography after outpatient thoracentesis. Mayo Clin Proc 1998; 73(10):948–950. doi:10.4065/73.10.948
- Alemán C, Alegre J, Armadans L, et al. The value of chest roentgenography in the diagnosis of pneumothorax after thoracentesis. Am J Med 1999; 107(4):340–343. pmid:10527035
- Lichtenstein D. Lung ultrasound in the critically ill. Curr Opin Crit Care 2014; 20(3):315–322. doi:10.1097/MCC.0000000000000096
No. After thoracentesis, chest radiography or another lung imaging study should be done only if pneumothorax is suspected, if thoracentesis requires more than 1 attempt, if the patient is on mechanical ventilation or has pre-existing lung disease, or if a large volume (> 1,500 mL) of fluid is removed. Radiography is also usually not necessary after diagnostic thoracentesis in a patient breathing spontaneously. In most cases, pneumothorax found incidentally after thoracentesis does not require decompression and can be managed supportively.
WHAT ARE THE RISKS OF THORACENTESIS?
Thoracentesis is a minimally invasive procedure usually performed at the bedside that involves insertion of a needle into the pleural cavity for drainage of fluid.1 Diagnostic thoracentesis should be done in most cases of a new pleural effusion unless the effusion is small and with a clear diagnosis, or in cases of typical heart failure.
Therapeutic thoracentesis, often called large-volume thoracentesis, aims to improve symptoms such as dyspnea attributed to the pleural effusion by removing at least 1 L of pleural fluid. The presence of active respiratory symptoms and suspicion of infected pleural effusion should lead to thoracentesis as soon as possible.
Complications of thoracentesis may be benign, such as pain and anxiety associated with the procedure and external bleeding at the site of needle insertion. Pneumothorax is the most common serious procedural complication and the principal reason to order postprocedural chest radiography.1 Less common complications include hemothorax, re-expansion pulmonary edema, infection, subdiaphragmatic organ puncture, and procedure-related death. Bleeding complications and hemothorax are rare even in patients with underlying coagulopathy.2
Point-of-care pleural ultrasonography is now considered the standard of care to guide optimal needle location for the procedure and to exclude other conditions that can mimic pleural effusion on chest radiography, such as lung consolidation and atelectasis.3 High proficiency in the use of preprocedural point-of-care ultrasonography reduces the rate of procedural complications, though it does not eliminate the risk entirely.3,4
Factors associated with higher rates of complications include lack of operator proficiency, poor understanding of the anatomy, poor patient positioning, poor patient cooperation with the procedure, lack of availability of bedside ultrasonography, and drainage of more than 1,500 mL of fluid. Addressing these factors has been shown to decrease the risk of pneumothorax and infection.1–5
HOW OFTEN DOES PNEUMOTHORAX OCCUR AFTER THORACENTESIS?
Several early studies have examined the incidence of pneumothorax after thoracentesis. Lack of ultrasonography use likely explains a higher incidence of complications in early studies: rates of pneumothorax after thoracentesis without ultrasonographic guidance ranged from 5.2% to 26%.6,7
Gervais et al8 analyzed thoracentesis with ultrasonographic guidance in 434 patients, 92 of whom were intubated, and reported that pneumothorax occurred in 10 patients, of whom 6 were intubated. Two of the intubated patients required chest tubes. Other studies have confirmed the low incidence of pneumothorax in patients undergoing thoracentesis, with rates such as 0.61%,1 5%,9 and 4%.10
The major predictor of postprocedural pneumothorax was the presence of symptoms such as chest pain and dyspnea. No intervention was necessary for most cases of pneumothorax in asymptomatic patients. The more widespread use of procedural ultrasonography may explain some discrepancies between the early5,6 and more recent studies.1,8–10
Several studies have demonstrated that postprocedural radiography is unnecessary unless a complication is suspected based on the patient’s symptoms or the need to demonstrate lung re-expansion.1,4,9,10 Clinical suspicion and the patient’s symptoms are the major predictors of procedure-related pneumothorax requiring treatment with a chest tube. Otherwise, incidentally discovered pneumothorax can usually be observed and managed supportively.
WHAT MECHANISMS UNDERLIE POSTPROCEDURAL PNEUMOTHORAX?
Major causes of pneumothorax in patients undergoing thoracentesis are direct puncture during needle or catheter insertion, the introduction of air through the needle or catheter into the pleural cavity, and the inability of the ipsilateral lung to fully expand after drainage of a large volume of fluid, known as pneumothorax ex vacuo.5
Pneumothorax ex vacuo may be seen in patients with medical conditions such as endobronchial obstruction, pleural scarring from long-standing pleural effusion, and lung malignancy, all of which can impair the lung’s ability to expand after removal of a large volume of pleural fluid. It is believed that transient parenchymal pleural fistulae form if the lung cannot expand, causing air leakage into the pleural cavity.5,8,9 Pleural manometry to monitor changes in pleural pressure and elastance can decrease the rates of pneumothorax ex vacuo in patients with the above risk factors.5
WHEN IS RADIOGRAPHY INDICATED AFTER THORACENTESIS?
Current literature suggests that imaging to evaluate for postprocedural complications should be done if there is suspicion of a complication, if thoracentesis required multiple attempts, if the procedure caused aspiration of air, if the patient has advanced lung disease, if the patient is scheduled to undergo thoracic radiation, if the patient is on mechanical ventilation, and after therapeutic thoracentesis if a large volume of fluid is removed.1–10 Routine chest radiography after thoracentesis is not supported in the literature in the absence of these risk factors.
Some practitioners order chest imaging after therapeutic thoracentesis to assess for residual pleural fluid and for visualization of other abnormalities previously hidden by pleural effusion, rather than simply to exclude postprocedural pneumothorax. Alternatively, postprocedural bedside pleural ultrasonography with recording of images can be done to assess for complications and residual pleural fluid volume without exposing the patient to radiation.11
Needle decompression and chest tube insertion should be considered in patients with tension pneumothorax, large pneumothorax (distance from the chest wall to the visceral pleural line of at least 2 cm), mechanical ventilation, progressing pneumothorax, and symptoms.
KEY POINTS
- Pneumothorax is a rare complication of thoracentesis when performed by a skilled operator using ultrasonographic guidance.
- Mechanisms behind the occurrence of pneumothorax are direct lung puncture, introduction of air into the pleural cavity, and pneumothorax ex vacuo.
- In asymptomatic patients, pneumothorax after thoracentesis rarely requires intervention beyond supportive care and close observation.
- Factors such as multiple thoracentesis attempts, symptoms, clinical suspicion, air aspiration during thoracentesis, presence of previous lung disease, and removal of a large volume of fluid may require postprocedural lung imaging (eg, bedside ultrasonography, radiography).
- Ault MJ, Rosen BT, Scher J, Feinglass J, Barsuk JH. Thoracentesis outcomes: a 12-year experience. Thorax 2015; 70(2):127–132. doi:10.1136/thoraxjnl-2014-206114
- Hibbert RM, Atwell TD, Lekah A, et al. Safety of ultrasound-guided thoracentesis in patients with abnormal preprocedural coagulation parameters. Chest 2013; 144(2):456–463. doi:10.1378/chest.12-2374
- Barnes TW, Morgenthaler TI, Olson EJ, Hesley GK, Decker PA, Ryu JH. Sonographically guided thoracentesis and rate of pneumothorax. J Clin Ultrasound 2005; 33(9):442–446. doi:10.1002/jcu.20163
- Gordon CE, Feller-Kopman D, Balk EM, Smetana GW. Pneumothorax following thoracentesis: a systematic review and meta-analysis. Arch Intern Med 2010; 170(4):332–339. doi:10.1001/archinternmed.2009.548
- Heidecker J, Huggins JT, Sahn SA, Doelken P. Pathophysiology of pneumothorax following ultrasound-guided thoracentesis. Chest 2006; 130(4):1173–1184. doi:10.1016/S0012-3692(15)51155-0
- Brandstetter RD, Karetzky M, Rastogi R, Lolis JD. Pneumothorax after thoracentesis in chronic obstructive pulmonary disease. Heart Lung 1994; 23(1):67–70. pmid:8150647
- Doyle JJ, Hnatiuk OW, Torrington KG, Slade AR, Howard RS. Necessity of routine chest roentgenography after thoracentesis. Ann Intern Med 1996; 124(9):816–820. pmid:8610950
- Gervais DA, Petersein A, Lee MJ, Hahn PF, Saini S, Mueller PR. US-guided thoracentesis: requirement for postprocedure chest radiography in patients who receive mechanical ventilation versus patients who breathe spontaneously. Radiology 1997; 204(2):503–506. doi:10.1148/radiology.204.2.9240544
- Capizzi SA, Prakash UB. Chest roentgenography after outpatient thoracentesis. Mayo Clin Proc 1998; 73(10):948–950. doi:10.4065/73.10.948
- Alemán C, Alegre J, Armadans L, et al. The value of chest roentgenography in the diagnosis of pneumothorax after thoracentesis. Am J Med 1999; 107(4):340–343. pmid:10527035
- Lichtenstein D. Lung ultrasound in the critically ill. Curr Opin Crit Care 2014; 20(3):315–322. doi:10.1097/MCC.0000000000000096
A 69-year-old woman with double vision and lower-extremity weakness
A 69-year-old woman was admitted to the hospital with double vision, weakness in the lower extremities, sensory loss, pain, and falls. Her symptoms started with sudden onset of horizontal diplopia 6 weeks before, followed by gradually worsening lower-extremity weakness, as well as ataxia and patchy and bilateral radicular burning leg pain more pronounced on the right. Her medical history included narcolepsy, obstructive sleep apnea, hypertension, hyperlipidemia, and bilateral knee replacements for osteoarthritis.
Neurologic examination showed inability to abduct the right eye, bilateral hip flexion weakness, decreased pinprick response, decreased proprioception, and diminished muscle stretch reflexes in the lower extremities. Magnetic resonance imaging (MRI) of the brain without contrast and magnetic resonance angiography of the brain and carotid arteries showed no evidence of acute stroke. No abnormalities were noted on electrocardiography and echocardiography.
A diagnosis of idiopathic peripheral neuropathy was made, and outpatient physical therapy was recommended. Over the subsequent 2 weeks, her condition declined to the point where she needed a walker. She continued to have worsening leg weakness with falls, prompting hospital readmission.
INITIAL EVALUATION
In addition to her diplopia and weakness, she said she had lost 15 pounds since the onset of symptoms and had experienced symptoms suggesting urinary retention.
Physical examination
Her temperature was 37°C (98.6°F), heart rate 79 beats per minute, blood pressure 117/86 mm Hg, respiratory rate 14 breaths per minute, and oxygen saturation 98% on room air. Examination of the head, neck, heart, lung, abdomen, lymph nodes, and extremities yielded nothing remarkable except for chronic venous changes in the lower extremities.
The neurologic examination showed incomplete lateral gaze bilaterally (cranial nerve VI dysfunction). Strength in the upper extremities was normal. In the legs, the Medical Research Council scale score for proximal muscle strength was 2 to 3 out of 5, and for distal muscles 3 to 4 out of 5, with the right side worse than the left and flexors and extensors affected equally. Muscle stretch reflexes were absent in both lower extremities and the left upper extremity, but intact in the right upper extremity. No abnormal corticospinal tract reflexes were elicited.
Sensory testing revealed diminished pin-prick perception in a length-dependent fashion in the lower extremities, reduced 50% compared with the hands. Gait could not be assessed due to weakness.
Initial laboratory testing
Results of initial laboratory tests—complete blood cell count, complete metabolic panel, erythrocyte sedimentation rate, C-reactive protein, thyroid-stimulating hormone, and hemoglobin A1c—were unremarkable.
FURTHER EVALUATION AND DIFFERENTIAL DIAGNOSIS
1. Which of the following is the most likely diagnosis at this point?
- Cerebral infarction
- Guillain-Barré syndrome
- Progressive polyneuropathy
- Transverse myelitis
- Polyradiculopathy
In the absence of definitive diagnostic tests, all of the above options were considered in the differential diagnosis for this patient.
Cerebral infarction
Although acute-onset diplopia can be explained by brainstem stroke involving cranial nerve nuclei or their projections, the onset of diplopia with progressive bilateral lower-extremity weakness makes stroke unlikely. Flaccid paralysis, areflexia of the lower extremities, and sensory involvement can also be caused by acute anterior spinal artery occlusion leading to spinal cord infarction; however, the deficits are usually maximal at onset.
Guillain-Barré syndrome
The combination of acute-subacute progressive ascending weakness, sensory involvement, and diminished or absent reflexes is typical of Guillain-Barré syndrome. Cranial nerve involvement can overlap with the more typical features of the syndrome. However, most patients reach the nadir of their disease by 4 weeks after initial symptom onset, even without treatment.1 This patient’s condition continued to worsen over 8 weeks. In addition, the asymmetric lower-extremity weakness and sparing of the arms are atypical for Guillain-Barré syndrome.
Given the progression of symptoms, chronic inflammatory demyelinating polyneuropathy is also a consideration, typically presenting as a relapsing or progressive neuropathy in proximal and distal muscles and worsening over at least an 8-week period.2
The initial workup for Guillain-Barré syndrome or chronic inflammatory demyelinating polyneuropathy includes lumbar puncture to assess for albuminocytologic dissociation (elevated protein with normal white blood cell count) in cerebrospinal fluid (CSF), and electromyography (EMG) to assess for neurophysiologic evidence of peripheral nerve demyelination. In Miller-Fisher syndrome, a rare variant of Guillain-Barré syndrome characterized by ataxia, ophthalmoparesis, and areflexia, serum ganglioside antibodies to GQ1b are found in over 90% of patients.3,4 Although MRI of the spine is not necessary to diagnose Guillain-Barré syndrome, it is often done to exclude other causes of lower-extremity weakness such as spinal cord or cauda equina compression that would require urgent neurosurgical consultation. MRI can support the diagnosis of Guillain-Barré syndrome when it reveals enhancement of the spinal nerve roots or cauda equina.
Other polyneuropathies
Polyneuropathy is caused by a variety of diseases that affect the function of peripheral motor, sensory, or autonomic nerves. The differential diagnosis is broad and involves inflammatory diseases (including autoimmune and paraneoplastic causes), hereditary disorders, infection, toxicity, and ischemic and nutritional deficiencies.5 Polyneuropathy can present in a distal-predominant, generalized, or asymmetric pattern involving individual nerve trunks termed “mononeuropathy multiplex,” as in our patient’s presentation. The initial workup includes EMG and a battery of serologic tests. In cases of severe and progressive polyneuropathy, nerve biopsy can assess for the presence of vasculitis, amyloidosis, and paraprotein deposition.
Transverse myelitis
Transverse myelitis is an inflammatory myelopathy that usually presents with acute or subacute weakness of the upper extremities or lower extremities, or both, corresponding to the level of the lesion, hyperreflexia, bladder and bowel dysfunction, spinal level of sensory loss, and autonomic involvement.6 The differential diagnosis of acute myelopathy includes:
- Infection (eg, herpes simplex virus, West Nile virus, Lyme disease, Mycoplasma pneumoniae, human immunodeficiency virus)
- Systemic inflammatory disease (systemic lupus erythematosus, sarcoidosis, Sjögren syndrome, scleroderma, paraneoplastic syndrome)
- Central nervous system demyelinating disease (acute disseminated encephalomyelitis, multiple sclerosis, neuromyelitis optica)
- Vascular malformation (dural arteriovenous fistula)
- Compression due to tumor, bleeding, disc herniation, infection, or abscess.
The workup involves laboratory tests to exclude systemic inflammatory and infectious causes, as well as MRI of the spine with and without contrast to identify a causative lesion. Lumbar puncture and CSF analysis may show pleocytosis, elevated protein concentration, and increased intrathecal immunoglobulin G (IgG) index.7
Although our patient’s presentation with subacute lower-extremity weakness, sensory changes, and bladder dysfunction were consistent with transverse myelitis, her cranial nerve abnormalities would be atypical for it.
Polyradiculopathy
Polyradiculopathy has many possible causes. In the United States, the most common causes are lumbar spondylosis, lumbar canal stenosis, and diabetic polyradiculoneuropathy.
When multiple spinal segments are affected, leptomeningeal disease involving the arachnoid and pia mater should be considered. Causes include malignant invasion, inflammatory cell accumulation, and protein deposition, leading to patchy but widespread dysfunction of spinal nerve roots and cranial nerves. Specific causes are myriad and include carcinomatous meningitis,8 syphilis, tuberculosis, sarcoidosis, and paraproteinemias. CSF and MRI changes are often nonspecific, leading to the need for meningeal biopsy for diagnosis.
CASE CONTINUED
During her hospitalization, our patient developed acute right upper and lower facial weakness consistent with peripheral facial mononeuropathy. Bilateral lower-extremity weakness progressed to disabling paraparesis.

She underwent lumbar puncture and CSF analysis (Table 1). The most notable findings were significant pleocytosis (72% lymphocytic predominance), protein elevation, and elevated IgG index (indicative of elevated intrathecal immunoglobulin synthesis in the central nervous system). Viral, bacterial, and fungal studies were negative. Guillain-Barré syndrome, other polyneuropathies, and spinal cord infarction would not be expected with these CSF features.
Surface EMG demonstrated normal sensory responses, and needle EMG showed chronic and active motor axon loss in the L3 and S1 root distributions, suggesting polyradiculopathy without polyneuropathy. These findings would not be expected in typical acute transverse myelitis but could be seen with spinal cord infarction.
 in axial T1 sequence (top) and sagittal T1 sequence (bottom).")
MRI of the entire spine with and without contrast showed cauda equina nerve root thickening and enhancement, especially involving the L5 and S1 roots (Figure 1). The spinal cord appeared normal. These findings further supported polyradiculopathy and a leptomeningeal process.
Further evaluation included chest radiography, erythrocyte sedimentation rate, C-reactive protein, hemoglobin A1c, human immunodeficiency virus testing, antinuclear antibody, antineutrophil cytoplasmic antibody, extractable nuclear antibody, GQ1b antibody, serum and CSF paraneoplastic panels, levels of vitamin B1, B12, and B6, copper, and ceruloplasmin, and a screen for heavy metals. All results were within normal ranges.
ESTABLISHING THE DIAGNOSIS
Serum monoclonal protein analysis with immunofixation revealed IgM kappa monoclonal gammopathy with an IgM level of 1,570 (reference range 53–334 mg/dL) and M-spike 0.75 (0.00 mg/dL), serum free kappa light chains 61.1 (3.30–19.40 mg/L), lambda 9.3 (5.7–26.3 mg/L), and kappa-lambda ratio 6.57 (0.26–1.65).
2. Which is the best next step in this patient’s neurologic evaluation?
- Test CSF angiotensin-converting enzyme level
- CSF cytology
- Meningeal biopsy
- Peripheral nerve biopsy
Given the high suspicion for malignancy, CSF cytology was performed and showed increased numbers of mononuclear chronic inflammatory cells, including a mixture of lymphocytes and monocytes, favoring a reactive lymphoid pleocytosis. Flow cytometry indicated the presence of a monoclonal, CD5- and CD10- negative, B-cell lymphoproliferative disorder. The immunophenotypic findings were not specific for a single diagnosis. The differential diagnosis included marginal zone lymphoma and lymphoplasmacytic lymphoma.
3. Given the presence of serum IgM monoclonal gammopathy in this patient, which is the most likely diagnosis?
- Neurosarcoidosis
- Multiple myeloma
- Waldenström macroglobulinemia
- Carcinomatous meningitis
Study of bone marrow biopsy demonstrated limited bone marrow involvement (1%) by a lymphoproliferative disorder with plasmacytoid features, and DNA testing detected an MYD88 L265P mutation, reported to be present in 90% of patients with Waldenström macroglobulinemia.9 This finding confirmed the diagnosis of Waldenström macroglobulinemia with central nervous system involvement. Our patient began therapy with rituximab and methotrexate, which resulted in some improvement in strength, gait, and vision.
WALDENSTRÖM MACROGLOBULINEMIA AND BING-NEEL SYNDROME
Waldenström macroglobulinemia is a lymphoplasmacytic lymphoma associated with a monoclonal IgM protein.10 It is considered a paraproteinemic disorder, similar to multiple myeloma. The presenting symptoms and complications are related to direct tumor infiltration, hyperviscosity syndrome, and deposition of IgM in various tissues.11,12
Waldenström macroglobulinemia is usually indolent, and treatment is reserved for patients with symptoms.13,14 It includes rituximab, usually in combination with chemotherapy or other targeted agents.15,16
Paraneoplastic antibody-mediated polyneuropathy may occur in these patients. However, the pattern is usually symmetrical clinically, with demyelination on EMG, and is not associated with cranial nerve or meningeal involvement. Management with plasmapheresis, corticosteroids, and intravenous immunoglobulin has not been shown to be effective.17
Involvement of the central nervous system as a complication of Waldenström macroglobulinemia has been described as Bing-Neel syndrome. It can present as diffuse malignant cell infiltration of the leptomeningeal space, white matter, or spinal cord, or in a tumoral form presenting as intraparenchymal masses or nodular lesions. The distinction between the tumoral and diffuse forms is based primarily on imaging findings.18
In a report of 44 patients with Bing-Neel syndrome, 36% presented with the disorder as the initial manifestation of Waldenström macroglobulinemia.18 The primary presenting symptoms were imbalance and gait difficulty (48%) and cranial nerve involvement (36%), which presented as predominantly facial or oculomotor nerve palsy. Cauda equina syndrome with motor involvement (seen in our patient) occurred in 14% of patients. Other presenting symptoms included cognitive impairment, sensory deficits, headache, dysarthria, aphasia, and seizures.
LEARNING POINTS
The differential diagnosis for patients presenting with multifocal neurologic symptoms can be broad, and a systematic approach to the diagnosis is necessary. Localizing the lesion is important in determining the diagnosis for patients presenting with neurologic symptoms. The process of localization begins with taking the history, is further refined during the examination, and is confirmed with diagnostic studies. Atypical presentations of relatively common neurologic diseases such as Guillain-Barré syndrome, transverse myelitis, and peripheral polyneuropathy do occur, but uncommon diagnoses need to be considered when support for the initial diagnosis is lacking.
- Fokke C, van den Berg B, Drenthen J, Walgaard C, van Doorn PA, Jacobs BC. Diagnosis of Guillain-Barre syndrome and validation of Brighton criteria. Brain 2014; 137(Pt 1):33–43. doi:10.1093/brain/awt285
- Mathey EK, Park SB, Hughes RA, et al. Chronic inflammatory demyelinating polyradiculoneuropathy: from pathology to phenotype. J Neurol Neurosurg Psychiatry 2015; 86(9):973–985. doi:10.1136/jnnp-2014-309697
- Chiba A, Kusunoki S, Obata H, Machinami R, Kanazawa I. Serum anti-GQ1b IgG antibody is associated with ophthalmoplegia in Miller Fisher syndrome and Guillain-Barré syndrome: clinical and immunohistochemical studies. Neurology 1993; 43(10):1911–1917. pmid:8413947
- Teener J. Miller Fisher’s syndrome. Semin Neurol 2012; 32(5):512–516. doi:10.1055/s-0033-1334470
- Watson JC, Dyck PJ. Peripheral neuropathy: a practical approach to diagnosis and symptom management. Mayo Clin Proc 2015; 90(7):940–951. doi:10.1016/j.mayocp.2015.05.004
- Greenberg BM. Treatment of acute transverse myelitis and its early complications. Continuum (Minneap Minn) 2011; 17(4):733–743. doi:10.1212/01.CON.0000403792.36161.f5
- West TW. Transverse myelitis—a review of the presentation, diagnosis, and initial management. Discov Med 2013; 16(88):167–177. pmid:24099672
- Le Rhun E, Taillibert S, Chamberlain MC. Carcinomatous meningitis: leptomeningeal metastases in solid tumors. Surg Neurol Int 2013; 4(suppl 4):S265–S288. doi:10.4103/2152-7806.111304
- Treon SP, Xu L, Yang G, et al. MYD88 L265P somatic mutation in Waldenström’s macroglobulinemia. N Engl J Med 2012; 367(9):826–833. doi:10.1056/NEJMoa1200710
- Owen RG, Treon SP, Al-Katib A, et al. Clinicopathological definition of Waldenstrom’s macroglobulinemia: consensus panel recommendations from the Second International Workshop on Waldenstrom’s Macroglobulinemia. Semin Oncol 2003; 30(2):110–115. doi:10.1053/sonc.2003.50082
- Björkholm M, Johansson E, Papamichael D, et al. Patterns of clinical presentation, treatment, and outcome in patients with Waldenstrom’s macroglobulinemia: a two-institution study. Semin Oncol 2003; 30(2):226–230. doi:10.1053/sonc.2003.50054
- Rison RA, Beydoun SR. Paraproteinemic neuropathy: a practical review. BMC Neurol 2016; 16:13. doi:10.1186/s12883-016-0532-4
- Kyle RA, Benson J, Larson D, et al. IgM monoclonal gammopathy of undetermined significance and smoldering Waldenström’s macroglobulinemia. Clin Lymphoma Myeloma 2009; 9(1):17–18. doi:10.3816/CLM.2009.n.002
- Kyle RA, Benson JT, Larson DR, et al. Progression in smoldering Waldenstrom macroglobulinemia: long-term results. Blood 2012; 119(19):4462–4466. doi:10.1182/blood-2011-10-384768
- Leblond V, Kastritis E, Advani R, et al. Treatment recommendations from the Eighth International Workshop on Waldenström’s macroglobulinemia. Blood 2016; 128(10):1321–1328. doi:10.1182/blood-2016-04-711234
- Kapoor P, Ansell SM, Fonseca R, et al. Diagnosis and management of Waldenström macroglobulinemia: Mayo stratification of macroglobulinemia and risk-adapted therapy (mSMART) guidelines 2016. JAMA Oncol 2017; 3(9):1257–1265. doi:10.1001/jamaoncol.2016.5763
- D’Sa S, Kersten MJ, Castillo JJ, et al. Investigation and management of IgM and Waldenström-associated peripheral neuropathies: recommendations from the IWWM-8 consensus panel. Br J Haematol 2017; 176(5):728–742. doi:10.1111/bjh.14492
- Simon L, Fitsiori A, Lemal R, et al. Bing-Neel syndrome, a rare complication of Waldenström macroglobulinemia: analysis of 44 cases and review of the literature. A study on behalf of the French Innovative Leukemia Organization (FILO). Haematologica 2015; 100(12):1587–1594. doi:10.3324/haematol.2015.133744
A 69-year-old woman was admitted to the hospital with double vision, weakness in the lower extremities, sensory loss, pain, and falls. Her symptoms started with sudden onset of horizontal diplopia 6 weeks before, followed by gradually worsening lower-extremity weakness, as well as ataxia and patchy and bilateral radicular burning leg pain more pronounced on the right. Her medical history included narcolepsy, obstructive sleep apnea, hypertension, hyperlipidemia, and bilateral knee replacements for osteoarthritis.
Neurologic examination showed inability to abduct the right eye, bilateral hip flexion weakness, decreased pinprick response, decreased proprioception, and diminished muscle stretch reflexes in the lower extremities. Magnetic resonance imaging (MRI) of the brain without contrast and magnetic resonance angiography of the brain and carotid arteries showed no evidence of acute stroke. No abnormalities were noted on electrocardiography and echocardiography.
A diagnosis of idiopathic peripheral neuropathy was made, and outpatient physical therapy was recommended. Over the subsequent 2 weeks, her condition declined to the point where she needed a walker. She continued to have worsening leg weakness with falls, prompting hospital readmission.
INITIAL EVALUATION
In addition to her diplopia and weakness, she said she had lost 15 pounds since the onset of symptoms and had experienced symptoms suggesting urinary retention.
Physical examination
Her temperature was 37°C (98.6°F), heart rate 79 beats per minute, blood pressure 117/86 mm Hg, respiratory rate 14 breaths per minute, and oxygen saturation 98% on room air. Examination of the head, neck, heart, lung, abdomen, lymph nodes, and extremities yielded nothing remarkable except for chronic venous changes in the lower extremities.
The neurologic examination showed incomplete lateral gaze bilaterally (cranial nerve VI dysfunction). Strength in the upper extremities was normal. In the legs, the Medical Research Council scale score for proximal muscle strength was 2 to 3 out of 5, and for distal muscles 3 to 4 out of 5, with the right side worse than the left and flexors and extensors affected equally. Muscle stretch reflexes were absent in both lower extremities and the left upper extremity, but intact in the right upper extremity. No abnormal corticospinal tract reflexes were elicited.
Sensory testing revealed diminished pin-prick perception in a length-dependent fashion in the lower extremities, reduced 50% compared with the hands. Gait could not be assessed due to weakness.
Initial laboratory testing
Results of initial laboratory tests—complete blood cell count, complete metabolic panel, erythrocyte sedimentation rate, C-reactive protein, thyroid-stimulating hormone, and hemoglobin A1c—were unremarkable.
FURTHER EVALUATION AND DIFFERENTIAL DIAGNOSIS
1. Which of the following is the most likely diagnosis at this point?
- Cerebral infarction
- Guillain-Barré syndrome
- Progressive polyneuropathy
- Transverse myelitis
- Polyradiculopathy
In the absence of definitive diagnostic tests, all of the above options were considered in the differential diagnosis for this patient.
Cerebral infarction
Although acute-onset diplopia can be explained by brainstem stroke involving cranial nerve nuclei or their projections, the onset of diplopia with progressive bilateral lower-extremity weakness makes stroke unlikely. Flaccid paralysis, areflexia of the lower extremities, and sensory involvement can also be caused by acute anterior spinal artery occlusion leading to spinal cord infarction; however, the deficits are usually maximal at onset.
Guillain-Barré syndrome
The combination of acute-subacute progressive ascending weakness, sensory involvement, and diminished or absent reflexes is typical of Guillain-Barré syndrome. Cranial nerve involvement can overlap with the more typical features of the syndrome. However, most patients reach the nadir of their disease by 4 weeks after initial symptom onset, even without treatment.1 This patient’s condition continued to worsen over 8 weeks. In addition, the asymmetric lower-extremity weakness and sparing of the arms are atypical for Guillain-Barré syndrome.
Given the progression of symptoms, chronic inflammatory demyelinating polyneuropathy is also a consideration, typically presenting as a relapsing or progressive neuropathy in proximal and distal muscles and worsening over at least an 8-week period.2
The initial workup for Guillain-Barré syndrome or chronic inflammatory demyelinating polyneuropathy includes lumbar puncture to assess for albuminocytologic dissociation (elevated protein with normal white blood cell count) in cerebrospinal fluid (CSF), and electromyography (EMG) to assess for neurophysiologic evidence of peripheral nerve demyelination. In Miller-Fisher syndrome, a rare variant of Guillain-Barré syndrome characterized by ataxia, ophthalmoparesis, and areflexia, serum ganglioside antibodies to GQ1b are found in over 90% of patients.3,4 Although MRI of the spine is not necessary to diagnose Guillain-Barré syndrome, it is often done to exclude other causes of lower-extremity weakness such as spinal cord or cauda equina compression that would require urgent neurosurgical consultation. MRI can support the diagnosis of Guillain-Barré syndrome when it reveals enhancement of the spinal nerve roots or cauda equina.
Other polyneuropathies
Polyneuropathy is caused by a variety of diseases that affect the function of peripheral motor, sensory, or autonomic nerves. The differential diagnosis is broad and involves inflammatory diseases (including autoimmune and paraneoplastic causes), hereditary disorders, infection, toxicity, and ischemic and nutritional deficiencies.5 Polyneuropathy can present in a distal-predominant, generalized, or asymmetric pattern involving individual nerve trunks termed “mononeuropathy multiplex,” as in our patient’s presentation. The initial workup includes EMG and a battery of serologic tests. In cases of severe and progressive polyneuropathy, nerve biopsy can assess for the presence of vasculitis, amyloidosis, and paraprotein deposition.
Transverse myelitis
Transverse myelitis is an inflammatory myelopathy that usually presents with acute or subacute weakness of the upper extremities or lower extremities, or both, corresponding to the level of the lesion, hyperreflexia, bladder and bowel dysfunction, spinal level of sensory loss, and autonomic involvement.6 The differential diagnosis of acute myelopathy includes:
- Infection (eg, herpes simplex virus, West Nile virus, Lyme disease, Mycoplasma pneumoniae, human immunodeficiency virus)
- Systemic inflammatory disease (systemic lupus erythematosus, sarcoidosis, Sjögren syndrome, scleroderma, paraneoplastic syndrome)
- Central nervous system demyelinating disease (acute disseminated encephalomyelitis, multiple sclerosis, neuromyelitis optica)
- Vascular malformation (dural arteriovenous fistula)
- Compression due to tumor, bleeding, disc herniation, infection, or abscess.
The workup involves laboratory tests to exclude systemic inflammatory and infectious causes, as well as MRI of the spine with and without contrast to identify a causative lesion. Lumbar puncture and CSF analysis may show pleocytosis, elevated protein concentration, and increased intrathecal immunoglobulin G (IgG) index.7
Although our patient’s presentation with subacute lower-extremity weakness, sensory changes, and bladder dysfunction were consistent with transverse myelitis, her cranial nerve abnormalities would be atypical for it.
Polyradiculopathy
Polyradiculopathy has many possible causes. In the United States, the most common causes are lumbar spondylosis, lumbar canal stenosis, and diabetic polyradiculoneuropathy.
When multiple spinal segments are affected, leptomeningeal disease involving the arachnoid and pia mater should be considered. Causes include malignant invasion, inflammatory cell accumulation, and protein deposition, leading to patchy but widespread dysfunction of spinal nerve roots and cranial nerves. Specific causes are myriad and include carcinomatous meningitis,8 syphilis, tuberculosis, sarcoidosis, and paraproteinemias. CSF and MRI changes are often nonspecific, leading to the need for meningeal biopsy for diagnosis.
CASE CONTINUED
During her hospitalization, our patient developed acute right upper and lower facial weakness consistent with peripheral facial mononeuropathy. Bilateral lower-extremity weakness progressed to disabling paraparesis.
She underwent lumbar puncture and CSF analysis (Table 1). The most notable findings were significant pleocytosis (72% lymphocytic predominance), protein elevation, and elevated IgG index (indicative of elevated intrathecal immunoglobulin synthesis in the central nervous system). Viral, bacterial, and fungal studies were negative. Guillain-Barré syndrome, other polyneuropathies, and spinal cord infarction would not be expected with these CSF features.
Surface EMG demonstrated normal sensory responses, and needle EMG showed chronic and active motor axon loss in the L3 and S1 root distributions, suggesting polyradiculopathy without polyneuropathy. These findings would not be expected in typical acute transverse myelitis but could be seen with spinal cord infarction.
MRI of the entire spine with and without contrast showed cauda equina nerve root thickening and enhancement, especially involving the L5 and S1 roots (Figure 1). The spinal cord appeared normal. These findings further supported polyradiculopathy and a leptomeningeal process.
Further evaluation included chest radiography, erythrocyte sedimentation rate, C-reactive protein, hemoglobin A1c, human immunodeficiency virus testing, antinuclear antibody, antineutrophil cytoplasmic antibody, extractable nuclear antibody, GQ1b antibody, serum and CSF paraneoplastic panels, levels of vitamin B1, B12, and B6, copper, and ceruloplasmin, and a screen for heavy metals. All results were within normal ranges.
ESTABLISHING THE DIAGNOSIS
Serum monoclonal protein analysis with immunofixation revealed IgM kappa monoclonal gammopathy with an IgM level of 1,570 (reference range 53–334 mg/dL) and M-spike 0.75 (0.00 mg/dL), serum free kappa light chains 61.1 (3.30–19.40 mg/L), lambda 9.3 (5.7–26.3 mg/L), and kappa-lambda ratio 6.57 (0.26–1.65).
2. Which is the best next step in this patient’s neurologic evaluation?
- Test CSF angiotensin-converting enzyme level
- CSF cytology
- Meningeal biopsy
- Peripheral nerve biopsy
Given the high suspicion for malignancy, CSF cytology was performed and showed increased numbers of mononuclear chronic inflammatory cells, including a mixture of lymphocytes and monocytes, favoring a reactive lymphoid pleocytosis. Flow cytometry indicated the presence of a monoclonal, CD5- and CD10- negative, B-cell lymphoproliferative disorder. The immunophenotypic findings were not specific for a single diagnosis. The differential diagnosis included marginal zone lymphoma and lymphoplasmacytic lymphoma.
3. Given the presence of serum IgM monoclonal gammopathy in this patient, which is the most likely diagnosis?
- Neurosarcoidosis
- Multiple myeloma
- Waldenström macroglobulinemia
- Carcinomatous meningitis
Study of bone marrow biopsy demonstrated limited bone marrow involvement (1%) by a lymphoproliferative disorder with plasmacytoid features, and DNA testing detected an MYD88 L265P mutation, reported to be present in 90% of patients with Waldenström macroglobulinemia.9 This finding confirmed the diagnosis of Waldenström macroglobulinemia with central nervous system involvement. Our patient began therapy with rituximab and methotrexate, which resulted in some improvement in strength, gait, and vision.
WALDENSTRÖM MACROGLOBULINEMIA AND BING-NEEL SYNDROME
Waldenström macroglobulinemia is a lymphoplasmacytic lymphoma associated with a monoclonal IgM protein.10 It is considered a paraproteinemic disorder, similar to multiple myeloma. The presenting symptoms and complications are related to direct tumor infiltration, hyperviscosity syndrome, and deposition of IgM in various tissues.11,12
Waldenström macroglobulinemia is usually indolent, and treatment is reserved for patients with symptoms.13,14 It includes rituximab, usually in combination with chemotherapy or other targeted agents.15,16
Paraneoplastic antibody-mediated polyneuropathy may occur in these patients. However, the pattern is usually symmetrical clinically, with demyelination on EMG, and is not associated with cranial nerve or meningeal involvement. Management with plasmapheresis, corticosteroids, and intravenous immunoglobulin has not been shown to be effective.17
Involvement of the central nervous system as a complication of Waldenström macroglobulinemia has been described as Bing-Neel syndrome. It can present as diffuse malignant cell infiltration of the leptomeningeal space, white matter, or spinal cord, or in a tumoral form presenting as intraparenchymal masses or nodular lesions. The distinction between the tumoral and diffuse forms is based primarily on imaging findings.18
In a report of 44 patients with Bing-Neel syndrome, 36% presented with the disorder as the initial manifestation of Waldenström macroglobulinemia.18 The primary presenting symptoms were imbalance and gait difficulty (48%) and cranial nerve involvement (36%), which presented as predominantly facial or oculomotor nerve palsy. Cauda equina syndrome with motor involvement (seen in our patient) occurred in 14% of patients. Other presenting symptoms included cognitive impairment, sensory deficits, headache, dysarthria, aphasia, and seizures.
LEARNING POINTS
The differential diagnosis for patients presenting with multifocal neurologic symptoms can be broad, and a systematic approach to the diagnosis is necessary. Localizing the lesion is important in determining the diagnosis for patients presenting with neurologic symptoms. The process of localization begins with taking the history, is further refined during the examination, and is confirmed with diagnostic studies. Atypical presentations of relatively common neurologic diseases such as Guillain-Barré syndrome, transverse myelitis, and peripheral polyneuropathy do occur, but uncommon diagnoses need to be considered when support for the initial diagnosis is lacking.
- Fokke C, van den Berg B, Drenthen J, Walgaard C, van Doorn PA, Jacobs BC. Diagnosis of Guillain-Barre syndrome and validation of Brighton criteria. Brain 2014; 137(Pt 1):33–43. doi:10.1093/brain/awt285
- Mathey EK, Park SB, Hughes RA, et al. Chronic inflammatory demyelinating polyradiculoneuropathy: from pathology to phenotype. J Neurol Neurosurg Psychiatry 2015; 86(9):973–985. doi:10.1136/jnnp-2014-309697
- Chiba A, Kusunoki S, Obata H, Machinami R, Kanazawa I. Serum anti-GQ1b IgG antibody is associated with ophthalmoplegia in Miller Fisher syndrome and Guillain-Barré syndrome: clinical and immunohistochemical studies. Neurology 1993; 43(10):1911–1917. pmid:8413947
- Teener J. Miller Fisher’s syndrome. Semin Neurol 2012; 32(5):512–516. doi:10.1055/s-0033-1334470
- Watson JC, Dyck PJ. Peripheral neuropathy: a practical approach to diagnosis and symptom management. Mayo Clin Proc 2015; 90(7):940–951. doi:10.1016/j.mayocp.2015.05.004
- Greenberg BM. Treatment of acute transverse myelitis and its early complications. Continuum (Minneap Minn) 2011; 17(4):733–743. doi:10.1212/01.CON.0000403792.36161.f5
- West TW. Transverse myelitis—a review of the presentation, diagnosis, and initial management. Discov Med 2013; 16(88):167–177. pmid:24099672
- Le Rhun E, Taillibert S, Chamberlain MC. Carcinomatous meningitis: leptomeningeal metastases in solid tumors. Surg Neurol Int 2013; 4(suppl 4):S265–S288. doi:10.4103/2152-7806.111304
- Treon SP, Xu L, Yang G, et al. MYD88 L265P somatic mutation in Waldenström’s macroglobulinemia. N Engl J Med 2012; 367(9):826–833. doi:10.1056/NEJMoa1200710
- Owen RG, Treon SP, Al-Katib A, et al. Clinicopathological definition of Waldenstrom’s macroglobulinemia: consensus panel recommendations from the Second International Workshop on Waldenstrom’s Macroglobulinemia. Semin Oncol 2003; 30(2):110–115. doi:10.1053/sonc.2003.50082
- Björkholm M, Johansson E, Papamichael D, et al. Patterns of clinical presentation, treatment, and outcome in patients with Waldenstrom’s macroglobulinemia: a two-institution study. Semin Oncol 2003; 30(2):226–230. doi:10.1053/sonc.2003.50054
- Rison RA, Beydoun SR. Paraproteinemic neuropathy: a practical review. BMC Neurol 2016; 16:13. doi:10.1186/s12883-016-0532-4
- Kyle RA, Benson J, Larson D, et al. IgM monoclonal gammopathy of undetermined significance and smoldering Waldenström’s macroglobulinemia. Clin Lymphoma Myeloma 2009; 9(1):17–18. doi:10.3816/CLM.2009.n.002
- Kyle RA, Benson JT, Larson DR, et al. Progression in smoldering Waldenstrom macroglobulinemia: long-term results. Blood 2012; 119(19):4462–4466. doi:10.1182/blood-2011-10-384768
- Leblond V, Kastritis E, Advani R, et al. Treatment recommendations from the Eighth International Workshop on Waldenström’s macroglobulinemia. Blood 2016; 128(10):1321–1328. doi:10.1182/blood-2016-04-711234
- Kapoor P, Ansell SM, Fonseca R, et al. Diagnosis and management of Waldenström macroglobulinemia: Mayo stratification of macroglobulinemia and risk-adapted therapy (mSMART) guidelines 2016. JAMA Oncol 2017; 3(9):1257–1265. doi:10.1001/jamaoncol.2016.5763
- D’Sa S, Kersten MJ, Castillo JJ, et al. Investigation and management of IgM and Waldenström-associated peripheral neuropathies: recommendations from the IWWM-8 consensus panel. Br J Haematol 2017; 176(5):728–742. doi:10.1111/bjh.14492
- Simon L, Fitsiori A, Lemal R, et al. Bing-Neel syndrome, a rare complication of Waldenström macroglobulinemia: analysis of 44 cases and review of the literature. A study on behalf of the French Innovative Leukemia Organization (FILO). Haematologica 2015; 100(12):1587–1594. doi:10.3324/haematol.2015.133744
Leadership and Professional Development: TIME’S UP for Hospital Medicine
“If it is true that the full humanity of women is not our culture, then we can and must make it our culture.”
—Chimamanda Ngozi Adichie
A young boy is on the way home from soccer when a driver hits his car head-on. His father dies immediately, but the boy survives. The boy is transported to the hospital and immediately rushed into the OR. The surgeon takes one look at him and says, “I can’t operate on this patient. He’s my son!” The riddle asks: If the father is dead, who is the surgeon?
Struggling to realize that the surgeon is a mom highlights the depth of gender bias in medicine. Gender bias leads to inequities which are magnified when compounded with differences in race, ethnicity, sexual orientation, gender identity and/or socioeconomic status. The recent National Academies report described the toll of gender inequities, including sexual harassment, and their impact on women in medicine.1 But like this riddle, the focus was directed towards those at the top of the hierarchy: physicians. It is undeniable that women physicians suffer the effects of inequities, but why exclude other women in healthcare? For example, over 90% of nurses are female, yet male nurses make higher salaries with lower degrees.2 If we only focus on physicians, we risk ignoring a problem faced by the entirety of our workforce.
Healthcare is a team sport. The practice of hospital medicine is a prime example of how each team member brings critical value. One would never be able to run an effective code without excellent nursing or successfully intubate a patient without a skilled respiratory therapist. Yet, when it comes to conversations about gender bias and sexual harassment, we rarely work together. The work of equity in healthcare must therefore become more like a lattice than a ladder, with many of us advocating for or with one another.
As hospital medicine has grown, hospitalists have become genuine agents of change. Therefore, this change too, must begin with hospitalists. As leaders in healthcare, we must advocate for equity for all, from the lab technician to the CEO. We must engage and respond when direct care workers (often minorities), face gender or racial bias. In short, if we see something, we must say something.
To create a culture of inclusivity and intersectionality in healthcare, we suggest the following:
- Unite healthcare workers across fields. View your fellow healthcare worker as a team member, not as a subordinate or ancillary staff. Ask them what their experiences regarding inequity have been. See things from their perspective.
- Be a champion for those affected by harassment and inequity. Offer direct support to anyone affected by harassment or inequity. Accompany them to human resources or use your influence to advocate for gender-based salary audits.
- Raise awareness and knowledge. Know the resources in your institution and share them with others. Encourage teams to discuss the impact of microaggressions and implicit bias together as opposed to in role-specific groups. Use communication to lend allyship and support. If you see microaggressions based on gender or race, inquire by asking “I’m curious...why would you say that?” or share the impact a statement has on you by noting “The comment doesn’t just affect one person, it affects all of us.”
People create culture. Meaningful cultural change must be inclusive and intersectional. Historically, movements focused on equity have failed to be inclusive, leading to certain groups feeling marginalized. The time has come to affect change in healthcare across all differences. Whether in the role of physician, nurse, advanced practice provider, or paramedical staff, it’s time to stand together and say: “time is up.”
Disclosures
Dr Kass and Dr. Acholonu are founding members of TIME’S UP Healthcare
1. National Academies of Sciences, Engineering, and Medicine. Sexual harassment of women: climate, culture, and consequences in academic sciences, engineering, and medicine. Washington, DC: National Academies Press, August 2018. (https://www.nap.edu/catalog/24994/sexual-harassment-of-women-climate-culture-and-consequences-in-academic). Accessed March 1, 2019.
2. 2018 Nurse.com. Nursing Salary Research Report. http://mediakit.nurse.com/wp-content/uploads/2018/06/2018-Nurse.com-Salary-Research-Report.pdf. Accessed March 1, 2019.
“If it is true that the full humanity of women is not our culture, then we can and must make it our culture.”
—Chimamanda Ngozi Adichie
A young boy is on the way home from soccer when a driver hits his car head-on. His father dies immediately, but the boy survives. The boy is transported to the hospital and immediately rushed into the OR. The surgeon takes one look at him and says, “I can’t operate on this patient. He’s my son!” The riddle asks: If the father is dead, who is the surgeon?
Struggling to realize that the surgeon is a mom highlights the depth of gender bias in medicine. Gender bias leads to inequities which are magnified when compounded with differences in race, ethnicity, sexual orientation, gender identity and/or socioeconomic status. The recent National Academies report described the toll of gender inequities, including sexual harassment, and their impact on women in medicine.1 But like this riddle, the focus was directed towards those at the top of the hierarchy: physicians. It is undeniable that women physicians suffer the effects of inequities, but why exclude other women in healthcare? For example, over 90% of nurses are female, yet male nurses make higher salaries with lower degrees.2 If we only focus on physicians, we risk ignoring a problem faced by the entirety of our workforce.
Healthcare is a team sport. The practice of hospital medicine is a prime example of how each team member brings critical value. One would never be able to run an effective code without excellent nursing or successfully intubate a patient without a skilled respiratory therapist. Yet, when it comes to conversations about gender bias and sexual harassment, we rarely work together. The work of equity in healthcare must therefore become more like a lattice than a ladder, with many of us advocating for or with one another.
As hospital medicine has grown, hospitalists have become genuine agents of change. Therefore, this change too, must begin with hospitalists. As leaders in healthcare, we must advocate for equity for all, from the lab technician to the CEO. We must engage and respond when direct care workers (often minorities), face gender or racial bias. In short, if we see something, we must say something.
To create a culture of inclusivity and intersectionality in healthcare, we suggest the following:
- Unite healthcare workers across fields. View your fellow healthcare worker as a team member, not as a subordinate or ancillary staff. Ask them what their experiences regarding inequity have been. See things from their perspective.
- Be a champion for those affected by harassment and inequity. Offer direct support to anyone affected by harassment or inequity. Accompany them to human resources or use your influence to advocate for gender-based salary audits.
- Raise awareness and knowledge. Know the resources in your institution and share them with others. Encourage teams to discuss the impact of microaggressions and implicit bias together as opposed to in role-specific groups. Use communication to lend allyship and support. If you see microaggressions based on gender or race, inquire by asking “I’m curious...why would you say that?” or share the impact a statement has on you by noting “The comment doesn’t just affect one person, it affects all of us.”
People create culture. Meaningful cultural change must be inclusive and intersectional. Historically, movements focused on equity have failed to be inclusive, leading to certain groups feeling marginalized. The time has come to affect change in healthcare across all differences. Whether in the role of physician, nurse, advanced practice provider, or paramedical staff, it’s time to stand together and say: “time is up.”
Disclosures
Dr Kass and Dr. Acholonu are founding members of TIME’S UP Healthcare
1. National Academies of Sciences, Engineering, and Medicine. Sexual harassment of women: climate, culture, and consequences in academic sciences, engineering, and medicine. Washington, DC: National Academies Press, August 2018. (https://www.nap.edu/catalog/24994/sexual-harassment-of-women-climate-culture-and-consequences-in-academic). Accessed March 1, 2019.
2. 2018 Nurse.com. Nursing Salary Research Report. http://mediakit.nurse.com/wp-content/uploads/2018/06/2018-Nurse.com-Salary-Research-Report.pdf. Accessed March 1, 2019.
© 2019 Society of Hospital Medicine
In Response to “In Reference to: ‘Preventing Hypoglycemia Following Treatment of Hyperkalemia in Hospitalized Patients’”
We appreciate the comments and interest of Al-Sharefi and colleagues who highlight the use of glucose-only infusion in the management of hyperkalemia.1 The incidence of hypoglycemia following hyperkalemia treatment with insulin/dextrose is high and measures to reduce this should be pursued.2 However, evidence of the efficacy of glucose-only infusions on lowering potassium in heterogeneous inpatient populations is lacking. The small study by Chothia et al demonstrated potassium lowering efficacy in ten clinically stable patients without diabetes receiving chronic hemodialysis.3 In contrast, multiple observational studies consistently show a clinically significant effect of insulin/dextrose on potassium lowering across different populations.4
Importantly, inpatient hyperglycemia is associated with increased morbidity and mortality and occurs in those with preexisting diabetes and also those without, due to stress hyperglycemia from acute illness, medication or nutrition support.5 Determining intact insulin sensitivity during acute illness is not straightforward and deciding on the appropriateness of glucose-only hyperkalemia treatment compared with insulin/dextrose would be challenging. With the rising prevalence of diabetes in the inpatient setting (>30% in our study), the number of eligible individuals for glucose-only treatment would be small and does not justify the use of two separate hyperkalemia treatment protocols.
Given the potential life-threatening consequences of hyperkalemia, rapid potassium lowering is a priority. For glucose-only infusions to be applied, there n
Disclosures
The authors have nothing to disclose.
1. Al Sharefi A, Quinton R, Roberts G. In Reference to: “Preventing Hypoglycemia Following Treatment of Hyperkalemia in Hospitalized Patients “. J Hosp Med. 2019;14(6):387. doi: 10.12788/jhm.3209.
2. Boughton CK, Dixon D, Goble E, Burridge A, Cox A, Noble-Bell G, et al. Preventing hypoglycemia following treatment of hyperkalemia in hospitalized patients. J Hosp Med. 2019;14(5):284-287. doi: 10.12788/jhm.3145. PubMed
3. Chothia MY, Halperin ML, Rensburg MA, Hassan MS, Davids MR. Bolus administration of intravenous glucose in the treatment of hyperkalemia: a randomized controlled trial. Nephron Physiol. 2014;126(1):1-8. doi: 10.1159/000358836. PubMed
4. Harel Z, Kamel KS. Optimal dose and method of administration of intravenous insulin in the management of emergency hyperkalemia: a systematic review. PLoS One. 2016;11(5):e0154963. doi: 10.1371/journal.pone.0154963. e PubMed
5. Umpierrez GE, Isaacs SD, Bazargan N, You X, Thaler LM, Kitabchi AE. Hyperglycemia: an independent marker of in-hospital mortality in patients with undiagnosed diabetes. J Clin Endocrinol Metab. 2002;87(3):978-982. doi: 10.1210/jcem.87.3.8341. PubMed
We appreciate the comments and interest of Al-Sharefi and colleagues who highlight the use of glucose-only infusion in the management of hyperkalemia.1 The incidence of hypoglycemia following hyperkalemia treatment with insulin/dextrose is high and measures to reduce this should be pursued.2 However, evidence of the efficacy of glucose-only infusions on lowering potassium in heterogeneous inpatient populations is lacking. The small study by Chothia et al demonstrated potassium lowering efficacy in ten clinically stable patients without diabetes receiving chronic hemodialysis.3 In contrast, multiple observational studies consistently show a clinically significant effect of insulin/dextrose on potassium lowering across different populations.4
Importantly, inpatient hyperglycemia is associated with increased morbidity and mortality and occurs in those with preexisting diabetes and also those without, due to stress hyperglycemia from acute illness, medication or nutrition support.5 Determining intact insulin sensitivity during acute illness is not straightforward and deciding on the appropriateness of glucose-only hyperkalemia treatment compared with insulin/dextrose would be challenging. With the rising prevalence of diabetes in the inpatient setting (>30% in our study), the number of eligible individuals for glucose-only treatment would be small and does not justify the use of two separate hyperkalemia treatment protocols.
Given the potential life-threatening consequences of hyperkalemia, rapid potassium lowering is a priority. For glucose-only infusions to be applied, there n
Disclosures
The authors have nothing to disclose.
1. Al Sharefi A, Quinton R, Roberts G. In Reference to: “Preventing Hypoglycemia Following Treatment of Hyperkalemia in Hospitalized Patients “. J Hosp Med. 2019;14(6):387. doi: 10.12788/jhm.3209.
2. Boughton CK, Dixon D, Goble E, Burridge A, Cox A, Noble-Bell G, et al. Preventing hypoglycemia following treatment of hyperkalemia in hospitalized patients. J Hosp Med. 2019;14(5):284-287. doi: 10.12788/jhm.3145. PubMed
3. Chothia MY, Halperin ML, Rensburg MA, Hassan MS, Davids MR. Bolus administration of intravenous glucose in the treatment of hyperkalemia: a randomized controlled trial. Nephron Physiol. 2014;126(1):1-8. doi: 10.1159/000358836. PubMed
4. Harel Z, Kamel KS. Optimal dose and method of administration of intravenous insulin in the management of emergency hyperkalemia: a systematic review. PLoS One. 2016;11(5):e0154963. doi: 10.1371/journal.pone.0154963. e PubMed
5. Umpierrez GE, Isaacs SD, Bazargan N, You X, Thaler LM, Kitabchi AE. Hyperglycemia: an independent marker of in-hospital mortality in patients with undiagnosed diabetes. J Clin Endocrinol Metab. 2002;87(3):978-982. doi: 10.1210/jcem.87.3.8341. PubMed
© 2019 Society of Hospital Medicine
In Reference to: “Preventing Hypoglycemia Following Treatment of Hyperkalemia in Hospitalized Patients”
Boughton et al.1 reported a high incidence of hypoglycemia resulting from glucose-with-insulin (GwI) infusion used to treat acute hyperkalemia. This has been reported by other investigators—particularly in subjects without preexisting diabetes2 and resonates with the experiences of clinicians practicing in Internal Medicine or Diabetes.
The authors suggested that patients at risk of hypoglycemia be identified and offered a regimen containing less insulin. However, for subjects without preexisting diagnosis and not at high risk of diabetes, we question the physiological logic and the safety basis for administering insulin.
Infusion of glucose only (GO) to subjects with intact pancreatic function and insulin sensitivity stimulates endogenous insulin secretion in a dose-dependent manner, resulting in a reduction in extracellular fluid potassium with no risk of hypoglycemia.3,4
It is unclear why GwI historically entered mainstream practice rather than GO, but the rationale may have been based on the potential risks of paradoxical hyperglycemia-mediated hyperkalemia (HMK) being induced by GO. In practice, HMK was only observed in subjects with diabetes.5
As there is an ongoing need to reduce the impact of iatrogenic hypoglycemia, revisiting of the prematurely abandoned GO regimen in hyperkalemia management is warranted. Such approach may offer a safe and physiological alternative to GwI in nondiabetic patients with hyperkalemia.
We advocate that GO be prospectively evaluated against GwI for the treatment of hyperkalemia in subjects without diabetes, against the endpoints being noninferiority in respect of efficacy and maintenance of euglycemia in respect of safety.
Disclosures
Nothing to declare.
1. Boughton CK, Dixon D, Goble E, et al. Preventing hypoglycemia following treatment of hyperkalemia in hospitalized patients. J Hosp Med. 2019;14:E1-E4. doi: 10.12788/jhm.3145. PubMed
2. Apel J, Reutrakul S, Baldwin D. Hypoglycemia in the treatment of hyperkalemia with insulin in patients with end-stage renal disease. Clin Kidney J. 2014;7(3):248-250. doi: 10.1093/ckj/sfu026. PubMed
3. Chothia MY, Halperin ML, Rensburg MA, Hassan MS, Davids MR. Bolus administration of intravenous glucose in the treatment of hyperkalemia: a randomized controlled trial. Nephron Physiol. 2014;126(1):1-8. doi: 10.1159/000358836. PubMed
4. Groen J, Willebrands AF, Kamminga CE, Van Schothorst HK, Godfried EG. Effects of glucose administration on the potassium and inorganic phosphate content of the blood serum and the electrocardiogram in normal individuals and in non-diabetic patients. Acta Med Scand. 1952;141(5):352-366. doi: 10.1111/j.0954-6820.1952.tb14227.x. PubMed
5. Nicolis GL, Kahn T, Sanchez A, Gabrilove JL. Glucose-induced hyperkalemia in diabetic subjects. Arch Intern Med. 1981;141(1):49-53. doi:10.1001/archinte.1981.00340010045012. PubMed
Boughton et al.1 reported a high incidence of hypoglycemia resulting from glucose-with-insulin (GwI) infusion used to treat acute hyperkalemia. This has been reported by other investigators—particularly in subjects without preexisting diabetes2 and resonates with the experiences of clinicians practicing in Internal Medicine or Diabetes.
The authors suggested that patients at risk of hypoglycemia be identified and offered a regimen containing less insulin. However, for subjects without preexisting diagnosis and not at high risk of diabetes, we question the physiological logic and the safety basis for administering insulin.
Infusion of glucose only (GO) to subjects with intact pancreatic function and insulin sensitivity stimulates endogenous insulin secretion in a dose-dependent manner, resulting in a reduction in extracellular fluid potassium with no risk of hypoglycemia.3,4
It is unclear why GwI historically entered mainstream practice rather than GO, but the rationale may have been based on the potential risks of paradoxical hyperglycemia-mediated hyperkalemia (HMK) being induced by GO. In practice, HMK was only observed in subjects with diabetes.5
As there is an ongoing need to reduce the impact of iatrogenic hypoglycemia, revisiting of the prematurely abandoned GO regimen in hyperkalemia management is warranted. Such approach may offer a safe and physiological alternative to GwI in nondiabetic patients with hyperkalemia.
We advocate that GO be prospectively evaluated against GwI for the treatment of hyperkalemia in subjects without diabetes, against the endpoints being noninferiority in respect of efficacy and maintenance of euglycemia in respect of safety.
Disclosures
Nothing to declare.
1. Boughton CK, Dixon D, Goble E, et al. Preventing hypoglycemia following treatment of hyperkalemia in hospitalized patients. J Hosp Med. 2019;14:E1-E4. doi: 10.12788/jhm.3145. PubMed
2. Apel J, Reutrakul S, Baldwin D. Hypoglycemia in the treatment of hyperkalemia with insulin in patients with end-stage renal disease. Clin Kidney J. 2014;7(3):248-250. doi: 10.1093/ckj/sfu026. PubMed
3. Chothia MY, Halperin ML, Rensburg MA, Hassan MS, Davids MR. Bolus administration of intravenous glucose in the treatment of hyperkalemia: a randomized controlled trial. Nephron Physiol. 2014;126(1):1-8. doi: 10.1159/000358836. PubMed
4. Groen J, Willebrands AF, Kamminga CE, Van Schothorst HK, Godfried EG. Effects of glucose administration on the potassium and inorganic phosphate content of the blood serum and the electrocardiogram in normal individuals and in non-diabetic patients. Acta Med Scand. 1952;141(5):352-366. doi: 10.1111/j.0954-6820.1952.tb14227.x. PubMed
5. Nicolis GL, Kahn T, Sanchez A, Gabrilove JL. Glucose-induced hyperkalemia in diabetic subjects. Arch Intern Med. 1981;141(1):49-53. doi:10.1001/archinte.1981.00340010045012. PubMed
© 2019 Society of Hospital Medicine
Transitions of Care with Incidental Pulmonary Nodules
With advancement in imaging techniques, incidental pulmonary nodules (IPNs) are routinely found on imaging studies. Depending on the size, an IPN has diagnostic uncertainty. Is it a benign finding? Will it progress to cancer? These questions have the potential to create anxiety for our patients. Between 2012 and 2014, 19,739 patients were discharged from hospitals in the United States with a diagnosis of a solitary pulmonary nodule.1 Roughly 7,500 were discharged after an inpatient stay; the remainder from the emergency room. Aggregate costs for these visits totaled $49 million. The exact number of nodules receiving follow-up is unknown.
The Fleischner guidelines, updated in 2017, outline management for IPNs.2 Depending on nodule size and patient risk factors, repeat imaging is either not indicated or one to two follow-up scans could be recommended. In this issue of the Journal of Hospital Medicine®, two reports assess provider awareness of the Fleischner guidelines and examine the proportion of patients receiving follow-up.
Umscheid et al. surveyed hospitalists to understand their approach IPN management. Of 174 respondents, 42% were unfamiliar with the Fleischner guidelines.3 The authors proposed methods for improving provider awareness, including better communication between hospitalists and primary care providers, better documentation, and in the case of their institution, the development of an IPN consult team. The IPN consult team is composed of a nurse practitioner and pulmonologist. They inform primary care providers of patient findings and need for follow-up. If no follow-up is made, the team will see the patients in an IPN ambulatory clinic to ensure follow-up imaging is obtained.
Kwan et al. found that fewer than 50% of patients with high-risk new pulmonary nodules received follow-up.4 Although a single-site study, the study is consistent with prior work on tests pending at discharge, which essentially show that there are poor follow-up rates.5,6 Follow-up was more likely when the IPN was mentioned in the discharge summary. This conclusion builds on previous work showing that IPNs are more likely to be included in a discharge summary if the nodule is noted in the report heading, the radiologist recommends further imaging, and the patient is discharged from a medicine service as opposed to a surgical service.7 IPN follow-up is less likely if results are mentioned in the findings section alone.5
IPN follow-up is a piece of a larger issue of how best to ensure appropriate follow-up of any tests pending after discharge. A systematic review of discharge interventions found improvement in follow-up when discharge summaries are combined with e-mail alerts.6 A study of the effects of integrated electronic health records (EHR) web modules with discharge specific instructions showed an increase in follow-up from 18% to 27%.8 Studies also consider provider-to-patient communication. One intervention uses the patient portal to remind patients to pick up their medications,9 finding a decrease in nonadherence from 65.5% to 22.2%. Engaging patients by way of patient portals and reminders are an effective way to hold both the physician and the patient accountable for follow-up. Mobile technologies studied in the emergency department show patient preferences toward texting to receive medication and appointment reminders.10 Given wide-spread adoption of mobile technologies,11 notification systems could leverage applications or texting modalities to keep patients informed of discharge appointments and follow-up imaging studies. Similar interventions could be designed for IPNs using the Fleischner guidelines, generating alerts when patients have not received follow-up imaging.
The number of IPNs identified in the hospital will likely remain in the tens of thousands. From the hospitalist perspective, the findings presented in this month’s Journal of Hospital Medicine suggest that patients be educated about their findings and recommended follow-up, that follow-up be arranged before discharge, and that findings are clearly documented for patients and primary care providers to review. More study into how to implement these enhancements is needed to guide how we focus educational, systems, and technological interventions. Further study is also needed to help understand the complexities of communication channels between hospitalists and primary care physicians. As hospitalist workflow is more integrated with the EHR and mobile technology, future interventions can facilitate follow-up, keeping all providers and, most importantly, the patient aware of the next steps in care.
Acknowledgments
Author support is provided by the South Texas Veterans Health Care System. The views expressed are those of the authors and do not reflect the position or policy of the Department of Veterans Affairs.
Disclosures
The authors report no financial conflicts of interest.
1. HCUPNet: A tool for identifying, tracking and analyzing national hospital statistics (2018). Retrieved from https://hcupnet.ahrq.gov/#setup on 10/25/2019
2. MacMahon H, Naidich DP, Goo JM, et al. Guidelines for management of incidental pulmonary nodules detected on CT Images: from the Fleischner Society 2017. Radiology. 2017;284(1):228-243. doi: 10.1148/radiol.2017161659. PubMed
3. Umscheid CA, Wilen J, Garin M, et al. National Survey of Hospitalists’ experiences with incidental pulmonary nodules. J Hosp Med. 2019;14(6):353-356. doi: 10.12788/jhm.3115. PubMed
4. Kwan JL, Yermak D, Markell L, Paul NS, Shojania KG, Cram P. Follow-up of incidental high-risk pulmonary nodules on computed tomography pulmonary angiography at care transitions. J Hosp Med. 2019;14(6):349-352. doi: 10.12788/jhm.3128. PubMed
5. Blagev DP, Lloyd JF, Conner K, et al. Follow-up of incidental pulmonary nodules and the radiology report. J Am Coll Radiol. 2014;11(4):378-383. doi: 10.1016/j.jacr.2013.08.003. PubMed
7. Darragh PJ, Bodley T, Orchanian-cheff A, Shojania KG, Kwan JL, Cram P. A systematic review of interventions to follow-up test results pending at discharge. J Gen Intern Med. 2018;33(5):750-758. doi: 10.1007/s11606-017-4290-9. PubMed
8. Bates R, Plooster C, Croghan I, Schroeder D, Mccoy C. Incidental pulmonary nodules reported on CT abdominal imaging: frequency and factors affecting inclusion in the hospital discharge summary. J Hosp Med. 2017;12(6):454-457. doi: 10.12788/jhm.2757. PubMed
9. Lacson R, Desai S, Landman A, Proctor R, Sumption S, Khorasani R. Impact of a health information technology intervention on the follow-up management of pulmonary nodules. J Digit Imaging. 2018;31(1):19-25. doi: 10.1007/s10278-017-9989-y. PubMed
10. Kerner DE, Knezevich EL. Use of communication tool within electronic medical record to improve primary nonadherence. J Am Pharm Assoc (2003). 2017;57(3S):S270-S273.e2. doi: 10.1016/j.japh.2017.03.009. PubMed
11. Ray M, Dayan PS, Pahalyants V, Chernick LS. Mobile health technology to communicate discharge and follow-up information to adolescents from the emergency department. Pediatr Emerg Care. 2016;32(12):900-905. doi: 10.1097/PEC.0000000000000970. PubMed
12. Gallagher R, Roach K, Sadler L, et al. Mobile technology use across age groups in patients eligible for cardiac rehabilitation: survey study. JMIR mHealth uhealth. 2017;5(10):e161. doi: 10.2196/mhealth.8352. PubMed
With advancement in imaging techniques, incidental pulmonary nodules (IPNs) are routinely found on imaging studies. Depending on the size, an IPN has diagnostic uncertainty. Is it a benign finding? Will it progress to cancer? These questions have the potential to create anxiety for our patients. Between 2012 and 2014, 19,739 patients were discharged from hospitals in the United States with a diagnosis of a solitary pulmonary nodule.1 Roughly 7,500 were discharged after an inpatient stay; the remainder from the emergency room. Aggregate costs for these visits totaled $49 million. The exact number of nodules receiving follow-up is unknown.
The Fleischner guidelines, updated in 2017, outline management for IPNs.2 Depending on nodule size and patient risk factors, repeat imaging is either not indicated or one to two follow-up scans could be recommended. In this issue of the Journal of Hospital Medicine®, two reports assess provider awareness of the Fleischner guidelines and examine the proportion of patients receiving follow-up.
Umscheid et al. surveyed hospitalists to understand their approach IPN management. Of 174 respondents, 42% were unfamiliar with the Fleischner guidelines.3 The authors proposed methods for improving provider awareness, including better communication between hospitalists and primary care providers, better documentation, and in the case of their institution, the development of an IPN consult team. The IPN consult team is composed of a nurse practitioner and pulmonologist. They inform primary care providers of patient findings and need for follow-up. If no follow-up is made, the team will see the patients in an IPN ambulatory clinic to ensure follow-up imaging is obtained.
Kwan et al. found that fewer than 50% of patients with high-risk new pulmonary nodules received follow-up.4 Although a single-site study, the study is consistent with prior work on tests pending at discharge, which essentially show that there are poor follow-up rates.5,6 Follow-up was more likely when the IPN was mentioned in the discharge summary. This conclusion builds on previous work showing that IPNs are more likely to be included in a discharge summary if the nodule is noted in the report heading, the radiologist recommends further imaging, and the patient is discharged from a medicine service as opposed to a surgical service.7 IPN follow-up is less likely if results are mentioned in the findings section alone.5
IPN follow-up is a piece of a larger issue of how best to ensure appropriate follow-up of any tests pending after discharge. A systematic review of discharge interventions found improvement in follow-up when discharge summaries are combined with e-mail alerts.6 A study of the effects of integrated electronic health records (EHR) web modules with discharge specific instructions showed an increase in follow-up from 18% to 27%.8 Studies also consider provider-to-patient communication. One intervention uses the patient portal to remind patients to pick up their medications,9 finding a decrease in nonadherence from 65.5% to 22.2%. Engaging patients by way of patient portals and reminders are an effective way to hold both the physician and the patient accountable for follow-up. Mobile technologies studied in the emergency department show patient preferences toward texting to receive medication and appointment reminders.10 Given wide-spread adoption of mobile technologies,11 notification systems could leverage applications or texting modalities to keep patients informed of discharge appointments and follow-up imaging studies. Similar interventions could be designed for IPNs using the Fleischner guidelines, generating alerts when patients have not received follow-up imaging.
The number of IPNs identified in the hospital will likely remain in the tens of thousands. From the hospitalist perspective, the findings presented in this month’s Journal of Hospital Medicine suggest that patients be educated about their findings and recommended follow-up, that follow-up be arranged before discharge, and that findings are clearly documented for patients and primary care providers to review. More study into how to implement these enhancements is needed to guide how we focus educational, systems, and technological interventions. Further study is also needed to help understand the complexities of communication channels between hospitalists and primary care physicians. As hospitalist workflow is more integrated with the EHR and mobile technology, future interventions can facilitate follow-up, keeping all providers and, most importantly, the patient aware of the next steps in care.
Acknowledgments
Author support is provided by the South Texas Veterans Health Care System. The views expressed are those of the authors and do not reflect the position or policy of the Department of Veterans Affairs.
Disclosures
The authors report no financial conflicts of interest.
1. HCUPNet: A tool for identifying, tracking and analyzing national hospital statistics (2018). Retrieved from https://hcupnet.ahrq.gov/#setup on 10/25/2019
2. MacMahon H, Naidich DP, Goo JM, et al. Guidelines for management of incidental pulmonary nodules detected on CT Images: from the Fleischner Society 2017. Radiology. 2017;284(1):228-243. doi: 10.1148/radiol.2017161659. PubMed
3. Umscheid CA, Wilen J, Garin M, et al. National Survey of Hospitalists’ experiences with incidental pulmonary nodules. J Hosp Med. 2019;14(6):353-356. doi: 10.12788/jhm.3115. PubMed
4. Kwan JL, Yermak D, Markell L, Paul NS, Shojania KG, Cram P. Follow-up of incidental high-risk pulmonary nodules on computed tomography pulmonary angiography at care transitions. J Hosp Med. 2019;14(6):349-352. doi: 10.12788/jhm.3128. PubMed
5. Blagev DP, Lloyd JF, Conner K, et al. Follow-up of incidental pulmonary nodules and the radiology report. J Am Coll Radiol. 2014;11(4):378-383. doi: 10.1016/j.jacr.2013.08.003. PubMed
7. Darragh PJ, Bodley T, Orchanian-cheff A, Shojania KG, Kwan JL, Cram P. A systematic review of interventions to follow-up test results pending at discharge. J Gen Intern Med. 2018;33(5):750-758. doi: 10.1007/s11606-017-4290-9. PubMed
8. Bates R, Plooster C, Croghan I, Schroeder D, Mccoy C. Incidental pulmonary nodules reported on CT abdominal imaging: frequency and factors affecting inclusion in the hospital discharge summary. J Hosp Med. 2017;12(6):454-457. doi: 10.12788/jhm.2757. PubMed
9. Lacson R, Desai S, Landman A, Proctor R, Sumption S, Khorasani R. Impact of a health information technology intervention on the follow-up management of pulmonary nodules. J Digit Imaging. 2018;31(1):19-25. doi: 10.1007/s10278-017-9989-y. PubMed
10. Kerner DE, Knezevich EL. Use of communication tool within electronic medical record to improve primary nonadherence. J Am Pharm Assoc (2003). 2017;57(3S):S270-S273.e2. doi: 10.1016/j.japh.2017.03.009. PubMed
11. Ray M, Dayan PS, Pahalyants V, Chernick LS. Mobile health technology to communicate discharge and follow-up information to adolescents from the emergency department. Pediatr Emerg Care. 2016;32(12):900-905. doi: 10.1097/PEC.0000000000000970. PubMed
12. Gallagher R, Roach K, Sadler L, et al. Mobile technology use across age groups in patients eligible for cardiac rehabilitation: survey study. JMIR mHealth uhealth. 2017;5(10):e161. doi: 10.2196/mhealth.8352. PubMed
© 2019 Society of Hospital Medicine
Life After Liver Transplantation
Liver transplantation (LT) is “one of the most resource-intense procedures despite significant improvements in procedures and protocols,” say researchers from Seoul National University Hospital in South Korea. But little is known about the “practical aspects of life after liver transplantation,” such as unplanned visits to the emergency department (ED) or readmission for complications. So the researchers conducted a study to find out what health care resources are used after discharge.
Of 430 patients, half visited the ED at least once, and 57% were readmitted at least once. The rate of ED visits rose from 15% at 30 days after discharge to 44% at 1 year. Readmission rates more than tripled, from 16% at 30 days to 49% at 1 year.
Contrary to other research, living donor liver transplantation was not a risk factor of readmission. Emergency LT was a risk factor for ED visits and readmission within 30 days of discharge. And although LT using the left liver lobe and pre-existing hepatitis C are known risk factors for long-term graft failure, at the researchers’ hospital hepatitis B is the most common indication for living donor LT. Most of their patients undergo LT using the right liver lobe.
Some of the identified risk factors were unexpected, the researchers say. One was donor age of < 60 years. Warm ischemic time of 15 minutes or longer was another. The researchers note that prolonged warm ischemic time increases hepatic ischemia and reperfusion injury and is related to postoperative complications, which can be a cause of frequent readmission.
Length of stay (LOS) > 2 weeks also was a risk factor for readmission. In their institution, the average LOS for patients with a warm ischemic time of < 15 minutes was 15.6 days, shorter than the overall average LOS. Shorter LOS, the researchers add, may reflect fewer immediate postoperative complications.
Although they identified no specific complication as a risk factor for readmission, the researchers found specific conditions that accounted for a relatively high proportion of readmissions and repeated readmission, including abnormal liver function test (32% of readmissions) and fever (17% of readmissions and 39% of repeated readmissions). The researchers suggest those are conditions to monitor and manage.
Notably, patients who did not require readmission or ED visits in the first 20 months almost never required unplanned health care resources thereafter.
Comparison of Parent Report with Administrative Data to Identify Pediatric Reutilization Following Hospital Discharge
Prior healthcare utilization predicts future utilization;1 thus, providers should know when a child has had a recent healthcare visit. Healthcare providers typically obtain this information from parents and caregivers, who may not always provide accurate information.2-4
The Hospital to Home Outcomes study (H2O) was a randomized controlled trial conducted to assess the effects of a one-time home nurse visit following discharge on unplanned healthcare reutilization.5 We assessed reutilization through two sources: parent report via a postdischarge telephone call and administrative data. In this analysis, we sought to understand differences in reutilization rates by source by comparing parent report with administrative data.
METHODS
The H2O trial included children (<18 years) hospitalized on the hospital medicine (HM) or neuroscience (Neurology/Neurosurgery) services at Cincinnati Children’s Hospital Medical Center (CCHMC) from February 2015 to April 2016; they had an English-speaking parent and were discharged to home without skilled nursing care.6 For this analysis, we restricted the sample to children randomized to the control arm (discharge without a home visit), which reflects typical clinical care.
We used administrative data to capture 14-day reutilization (unplanned hospital readmissions, emergency department [ED] visits, or urgent care visits). CCHMC is the only pediatric admitting facility in the region and includes two pediatric EDs and five urgent care centers. We supplemented hospital data with a dataset (The Health Collaborative7) that included utilization at other regional facilities. Parent report was assessed via a research coordinator phone call 14-23 days after discharge. Parents were asked: “I’m going to [ask] about your child’s health since [discharge date]. Has s/he been hospitalized overnight? Has s/he been taken to the Emergency Room/Emergency Department (didn’t stay overnight)? Has s/he been taken to an urgent care?” We report 14-day reutilization rates by source (parent and/or administrative) and visit type.
We considered administrative data the gold standard for documentation of reutilization events for two reasons. First, all healthcare encounters generate billing and are therefore documented with verifiable coding. Second, we had access to data from our center and other regional healthcare facilities. Any parent-reported utilization to a facility not documented in either dataset was considered an unverifiable event (eg, outside our catchment region). Agreement between administrative and parent report of 14-day reutilization was summarized as positive agreement (reutilization documented in both administrative and parent report), negative agreement (no reutilization reported in either administrative or parent report), and overall agreement (combination of positive and negative agreement). We classified discrepancies as reutilization events in administrative data without parent report of reutilization or vice versa. We performed medical record review of discrepancies in our institutional data.
We summarized agreement by using the Cohen’s kappa statistic by reuse type (hospital readmission, ED, and urgent care visit) and overall (any reutilization event). Strength of agreement based on the kappa statistics was classified as poor (<0.20), fair (0.21-0.40), moderate (0.41-0.60), good (0.61-0.80), and very good (0.81-1.00).8 We used McNemar’s test to evaluate marginal homogeneity.
RESULTS
Of 749 children randomized to the standard of care arm, 723 parents completed the 14-day follow-up call and were included in this analysis. The median child age was two years (interquartile range: 0.4, 6.9), the median length of stay (LOS) was two days (1, 3), and the majority were white (62%). Payer mix varied, with 44% privately insured and 54% publicly insured. Most patients (83%) were admitted to the HM service, and the most common diagnoses groups for index admission were respiratory (35%), neurologic (14%), and gastrointestinal (9%) diseases.
Administrative data showed 63 children with any reutilization event; parents reported 63 with any reutilization event; 48 children had events reported by both sources. The overall agreement was high, ranging from 95.9% to 98.5% (Table 1) depending on visit type. The positive agreement (ie, parent and administrative data indicated reutilization) ranged from 47.6% to 76.2%. Negative agreement (ie, parent and administrative data agreed no reutilization) was very high, 97.7% to 99.2%. Parents reported three ED visits and four urgent care visits that were unverifiable due to lack of access to administrative data (sites of care reported were not included in our datasets).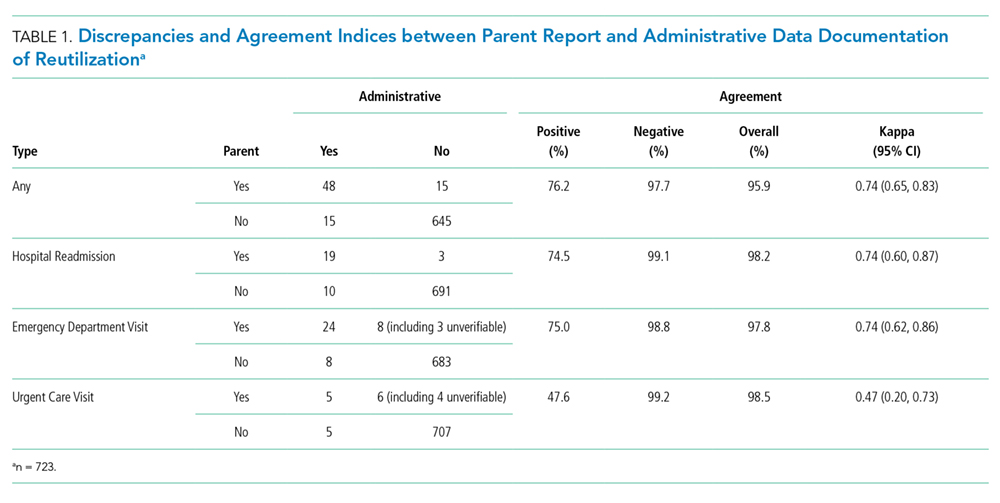
The kappa statistics indicated good agreement between parent report and administrative data for hospital readmission, ED visit, and composite any type of reutilization but moderate agreement for urgent care visit (Table 1).
Discrepancies were noted between parent report and administrative data (Table 2). In 15 children, a parent reported no reutilization when the administrative data included one; in 15 children, a parent reported a reutilization (including seven unverifiable events) when the administrative data revealed none. However, a few discrepancies were due to the incorrect site of care report (Table 2). Chart review of discrepancies involving CCHMC locations verified the accuracy of administrative data except in one case. In this case, a child’s ED revisit appeared to be a separate encounter but actually led to a hospital readmission.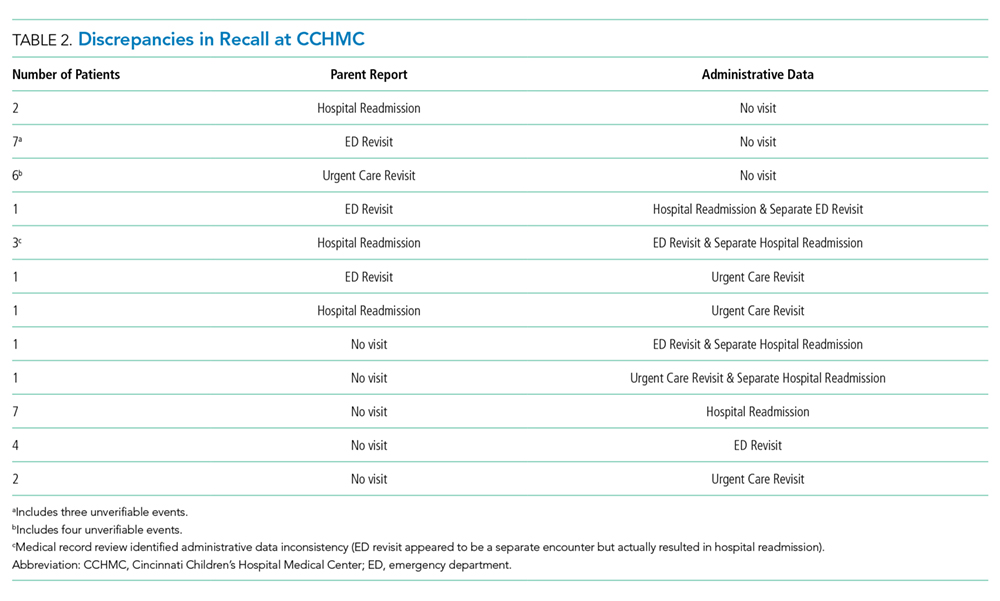
The 14-day reutilization rates by type (any, hospital readmission, ED visit, and urgent care visit) and data source (administrative data only, parent report only, and administrative or parent report) are depicted in the Appendix. Reutilization rates were similar when computed using administrative only or parent report only. However, reutilization rates increased slightly if a composite measure of any administrative data or parent report was utilized. No significant difference was found between administrative data and parent report in the marginal reuse proportions, with McNemar’s test P values all >.05 for hospital readmission, ED visit, and urgent care visit evaluated separately.
DISCUSSION
By comparing parent report of reutilization after hospital discharge through postdischarge phone calls with administrative data, we demonstrated high overall agreement between sources (95.9%); this finding is similar to prior research investigating the relationship between an established medical home and reutilization.9 However, this agreement is largely due to both sources reporting no reutilization. When revisits did occur, the agreement was notably lower, especially with regard to urgent care visits.
Discrepancies between sources have several possible explanations. First, parents may be confused by the framing of reutilization questions, perhaps lacking clarity around which visit we were referencing. Second, parents may experience limitations in health literacy10,11 with a lack of familiarity with healthcare language, such as the ability to delineate location types (for example, a parent may identify an urgent care visit as an ED visit, given their close proximity at our facility). Finally, our prior work identified that the “fog” of hospitalization,12 which is often a stressful and disruptive time for families, may linger after admission and could lead to difficulty in recalling detailed events.
Our findings have implications for effective care in a complex healthcare system where parent report may be the most practical method to obtain historical information, both within clinical care and in the context of research or quality measures, such as postdischarge utilization. Given that one of the greatest risk factors for readmission is prior utilization,1 the knowledge that a patient experienced a reutilization after a prior discharge might prompt the inpatient provider to better prepare families for subsequent transition to home.
To apply our findings practically, it is important to realize that a parent report may be sufficient when reporting that no revisit occurred, if there is also no record of a visit in accessible administrative data (such as an electronic health record). However, further questions or investigation should be considered when parents report a visit did occur or when administrative data indicate a visit occurred that the parent does not recall. Providers and researchers alike should remember to use health literacy universal precautions with all families, employing plain language without medical jargon.13 As linked electronic health record use becomes more prevalent, administrative data may be accessible in real-time, allowing for verification of family interview information. Administrative data beyond a single hospital system should be considered to effectively capture reutilization for research or quality efforts.
Our study has several limitations. Similar to most studies using reutilization outcomes, our data may miss a few unverifiable reuse events. By supplementing with additional regional data,7 we likely captured most events. Second, we did not include patients with limited English proficiency, although it is unclear how this might have biased our results. Third, while relatively few families did not complete the calls, it is possible that more discrepancies would have been noted in nonresponders. Fourth, research coordinators administering the calls followed a script to determine reutilization information; in clinical practice, a practitioner might not ask questions as clearly, which could negatively impact recall or might add clarifying follow-up questions to enhance recall. Finally, the analysis occurred in the setting of a randomized controlled trial that included children with relatively noncomplex health conditions with short LOS;6 thus, the results may not apply to other populations.
In conclusion, parent report and administrative data of reutilization following hospital discharge were usually in agreement when no reutilization occurred; however, discrepancies were noted more often when reutilizations occurred and may have care implications.
Collaborators
On behalf of the H2O Trial study group including: Joanne Bachus, BSN, RN; Andrew F. Beck, MD, MPH; Monica L. Borell, BSN, RN; Lenisa V. Chang, MA, PhD; Patricia Crawford, RN; Jennifer M. Gold, MSN, RN; Judy A. Heilman BSN, RN; Jane C. Khoury, PhD; Pierce Kuhnell, MS; Karen Lawley, BSN, RN; Allison Loechtenfeldt, BS; Colleen Mangeot, MS; Lynn O’Donnell, BSN, RN; Rita H. Pickler, PhD, RN; Hadley S. Sauers-Ford, MPH; Anita N. Shah, DO, MPH; Susan N. Sherman, DPA; Lauren G. Solan, MD, MEd; Karen P. Sullivan, BSN, RN; Susan Wade-Murphy, MSN, RN
Disclosures
Hospital to Home Outcomes team reports grants from the Patient Centered Outcomes Research Institute during the conduct of the study. Dr. White reports personal fees from the Institute for Health Care Improvement, outside the submitted work.
Funding
This work was supported by the Patient Centered Outcomes Research Institute (IHS-1306-0081 to Dr. S. Shah). All statements in this report, including findings and conclusions, are solely those of the authors and do not necessarily represent the views of the Patient-Centered Outcomes Research Institute, its Board of Governors, or the Methodology Committee. Dr Auger’s research is funded by the Agency for Healthcare Research and Quality (1K08HS024735).
1. Berry JG, Hall DE, Kuo DZ, et al. Hospital utilization and characteristics of patients experiencing recurrent readmissions within children’s hospitals. JAMA. 2011;305(7):682-690. doi: 10.1001/jama.2011.122. PubMed
2. Schwarz JN, Monti A, Savelli-Castillo I, Nelson LP. Accuracy of familial reporting of a child’s medical history in a dental clinic setting. Pediatr Dent. 2004;26(5):433-439. PubMed
3. Williams ER, Meza YE, Salazar S, Dominici P, Fasano CJ. Immunization histories given by adult caregivers accompanying children 3-36 months to the emergency department: are their histories valid for the Haemophilus influenzae B and pneumococcal vaccines? Pediatr Emerg Care. 2007;23(5):285-288. doi: 10.1097/01.pec.0000248699.42175.62. PubMed
4. Stupiansky NW, Zimet GD, Cummings T, Fortenberry JD, Shew M. Accuracy of self-reported human papillomavirus vaccine receipt among adolescent girls and their mothers. J Adolesc Health. 2012;50(1):103-105. doi: 10.1016/j.jadohealth.2011.04.010. PubMed
5. Tubbs-Cooley HL, Pickler RH, Simmons JM, et al. Testing a post-discharge nurse-led transitional home visit in acute care pediatrics: the Hospital-To-Home Outcomes (H2O) study protocol. J Adv Nurs. 2016;72(4):915-925. doi: 10.1111/jan.12882. PubMed
6. Auger KA, Simmons JM, Tubbs-Cooley HL, et al. Postdischarge nurse home visits and reuse: the hospital to home outcomes (H2O) trial. Pediatrics. 2018;142(1):e20173919. doi: 10.1542/peds.2017-3919. PubMed
7. The Health Collaborative. The Health Collaborative Healthbridge Analytics. http://healthcollab.org/hbanalytics/. Accessed August 11, 2017.
8. Altman DG. Practical statistics for medical research. Boca Raton, Florida: CRC Press; 1990.
9. Coller RJ, Klitzner TS, Saenz AA, Lerner CF, Nelson BB, Chung PJ. The medical home and hospital readmissions. Pediatrics. 2015;136(6):e1550-e1560. doi: 10.1542/peds.2015-1618. PubMed
10. Office of Disease Prevention and Health Promotion. US Department of Health and Human Services. Healthy People 2010: Understanding and Improving Health. 2nd ed. Washington, DC: US Government Printing Office; 2000.
11. Yin HS, Johnson M, Mendelsohn AL, Abrams MA, Sanders LM, Dreyer BP. The health literacy of parents in the United States: a nationally representative study. Pediatrics. 2009;124(3):S289-S298. doi: 10.1542/peds.2009-1162E. PubMed
12. Solan LG, Beck AF, Brunswick SA, et al. The family perspective on hospital to home transitions: a qualitative study. Pediatrics. 2015;136(6):e1539-e1549. PubMed
13. DeWalt DA CL, Hawk VH, Broucksou KA, Hink A, Rudd R, Brach C. Health Literacy Universal Precautions Toolkit. (Prepared by North Carolina Network Consortium, The Cecil G. Sheps Center for Health Services Research, The University of North Carolina at Chapel Hill, under Contract No. HHSA290200710014.). Rockville, MD: Agency for Healthcare Research and Quality; 2010.
Prior healthcare utilization predicts future utilization;1 thus, providers should know when a child has had a recent healthcare visit. Healthcare providers typically obtain this information from parents and caregivers, who may not always provide accurate information.2-4
The Hospital to Home Outcomes study (H2O) was a randomized controlled trial conducted to assess the effects of a one-time home nurse visit following discharge on unplanned healthcare reutilization.5 We assessed reutilization through two sources: parent report via a postdischarge telephone call and administrative data. In this analysis, we sought to understand differences in reutilization rates by source by comparing parent report with administrative data.
METHODS
The H2O trial included children (<18 years) hospitalized on the hospital medicine (HM) or neuroscience (Neurology/Neurosurgery) services at Cincinnati Children’s Hospital Medical Center (CCHMC) from February 2015 to April 2016; they had an English-speaking parent and were discharged to home without skilled nursing care.6 For this analysis, we restricted the sample to children randomized to the control arm (discharge without a home visit), which reflects typical clinical care.
We used administrative data to capture 14-day reutilization (unplanned hospital readmissions, emergency department [ED] visits, or urgent care visits). CCHMC is the only pediatric admitting facility in the region and includes two pediatric EDs and five urgent care centers. We supplemented hospital data with a dataset (The Health Collaborative7) that included utilization at other regional facilities. Parent report was assessed via a research coordinator phone call 14-23 days after discharge. Parents were asked: “I’m going to [ask] about your child’s health since [discharge date]. Has s/he been hospitalized overnight? Has s/he been taken to the Emergency Room/Emergency Department (didn’t stay overnight)? Has s/he been taken to an urgent care?” We report 14-day reutilization rates by source (parent and/or administrative) and visit type.
We considered administrative data the gold standard for documentation of reutilization events for two reasons. First, all healthcare encounters generate billing and are therefore documented with verifiable coding. Second, we had access to data from our center and other regional healthcare facilities. Any parent-reported utilization to a facility not documented in either dataset was considered an unverifiable event (eg, outside our catchment region). Agreement between administrative and parent report of 14-day reutilization was summarized as positive agreement (reutilization documented in both administrative and parent report), negative agreement (no reutilization reported in either administrative or parent report), and overall agreement (combination of positive and negative agreement). We classified discrepancies as reutilization events in administrative data without parent report of reutilization or vice versa. We performed medical record review of discrepancies in our institutional data.
We summarized agreement by using the Cohen’s kappa statistic by reuse type (hospital readmission, ED, and urgent care visit) and overall (any reutilization event). Strength of agreement based on the kappa statistics was classified as poor (<0.20), fair (0.21-0.40), moderate (0.41-0.60), good (0.61-0.80), and very good (0.81-1.00).8 We used McNemar’s test to evaluate marginal homogeneity.
RESULTS
Of 749 children randomized to the standard of care arm, 723 parents completed the 14-day follow-up call and were included in this analysis. The median child age was two years (interquartile range: 0.4, 6.9), the median length of stay (LOS) was two days (1, 3), and the majority were white (62%). Payer mix varied, with 44% privately insured and 54% publicly insured. Most patients (83%) were admitted to the HM service, and the most common diagnoses groups for index admission were respiratory (35%), neurologic (14%), and gastrointestinal (9%) diseases.
Administrative data showed 63 children with any reutilization event; parents reported 63 with any reutilization event; 48 children had events reported by both sources. The overall agreement was high, ranging from 95.9% to 98.5% (Table 1) depending on visit type. The positive agreement (ie, parent and administrative data indicated reutilization) ranged from 47.6% to 76.2%. Negative agreement (ie, parent and administrative data agreed no reutilization) was very high, 97.7% to 99.2%. Parents reported three ED visits and four urgent care visits that were unverifiable due to lack of access to administrative data (sites of care reported were not included in our datasets).
The kappa statistics indicated good agreement between parent report and administrative data for hospital readmission, ED visit, and composite any type of reutilization but moderate agreement for urgent care visit (Table 1).
Discrepancies were noted between parent report and administrative data (Table 2). In 15 children, a parent reported no reutilization when the administrative data included one; in 15 children, a parent reported a reutilization (including seven unverifiable events) when the administrative data revealed none. However, a few discrepancies were due to the incorrect site of care report (Table 2). Chart review of discrepancies involving CCHMC locations verified the accuracy of administrative data except in one case. In this case, a child’s ED revisit appeared to be a separate encounter but actually led to a hospital readmission.
The 14-day reutilization rates by type (any, hospital readmission, ED visit, and urgent care visit) and data source (administrative data only, parent report only, and administrative or parent report) are depicted in the Appendix. Reutilization rates were similar when computed using administrative only or parent report only. However, reutilization rates increased slightly if a composite measure of any administrative data or parent report was utilized. No significant difference was found between administrative data and parent report in the marginal reuse proportions, with McNemar’s test P values all >.05 for hospital readmission, ED visit, and urgent care visit evaluated separately.
DISCUSSION
By comparing parent report of reutilization after hospital discharge through postdischarge phone calls with administrative data, we demonstrated high overall agreement between sources (95.9%); this finding is similar to prior research investigating the relationship between an established medical home and reutilization.9 However, this agreement is largely due to both sources reporting no reutilization. When revisits did occur, the agreement was notably lower, especially with regard to urgent care visits.
Discrepancies between sources have several possible explanations. First, parents may be confused by the framing of reutilization questions, perhaps lacking clarity around which visit we were referencing. Second, parents may experience limitations in health literacy10,11 with a lack of familiarity with healthcare language, such as the ability to delineate location types (for example, a parent may identify an urgent care visit as an ED visit, given their close proximity at our facility). Finally, our prior work identified that the “fog” of hospitalization,12 which is often a stressful and disruptive time for families, may linger after admission and could lead to difficulty in recalling detailed events.
Our findings have implications for effective care in a complex healthcare system where parent report may be the most practical method to obtain historical information, both within clinical care and in the context of research or quality measures, such as postdischarge utilization. Given that one of the greatest risk factors for readmission is prior utilization,1 the knowledge that a patient experienced a reutilization after a prior discharge might prompt the inpatient provider to better prepare families for subsequent transition to home.
To apply our findings practically, it is important to realize that a parent report may be sufficient when reporting that no revisit occurred, if there is also no record of a visit in accessible administrative data (such as an electronic health record). However, further questions or investigation should be considered when parents report a visit did occur or when administrative data indicate a visit occurred that the parent does not recall. Providers and researchers alike should remember to use health literacy universal precautions with all families, employing plain language without medical jargon.13 As linked electronic health record use becomes more prevalent, administrative data may be accessible in real-time, allowing for verification of family interview information. Administrative data beyond a single hospital system should be considered to effectively capture reutilization for research or quality efforts.
Our study has several limitations. Similar to most studies using reutilization outcomes, our data may miss a few unverifiable reuse events. By supplementing with additional regional data,7 we likely captured most events. Second, we did not include patients with limited English proficiency, although it is unclear how this might have biased our results. Third, while relatively few families did not complete the calls, it is possible that more discrepancies would have been noted in nonresponders. Fourth, research coordinators administering the calls followed a script to determine reutilization information; in clinical practice, a practitioner might not ask questions as clearly, which could negatively impact recall or might add clarifying follow-up questions to enhance recall. Finally, the analysis occurred in the setting of a randomized controlled trial that included children with relatively noncomplex health conditions with short LOS;6 thus, the results may not apply to other populations.
In conclusion, parent report and administrative data of reutilization following hospital discharge were usually in agreement when no reutilization occurred; however, discrepancies were noted more often when reutilizations occurred and may have care implications.
Collaborators
On behalf of the H2O Trial study group including: Joanne Bachus, BSN, RN; Andrew F. Beck, MD, MPH; Monica L. Borell, BSN, RN; Lenisa V. Chang, MA, PhD; Patricia Crawford, RN; Jennifer M. Gold, MSN, RN; Judy A. Heilman BSN, RN; Jane C. Khoury, PhD; Pierce Kuhnell, MS; Karen Lawley, BSN, RN; Allison Loechtenfeldt, BS; Colleen Mangeot, MS; Lynn O’Donnell, BSN, RN; Rita H. Pickler, PhD, RN; Hadley S. Sauers-Ford, MPH; Anita N. Shah, DO, MPH; Susan N. Sherman, DPA; Lauren G. Solan, MD, MEd; Karen P. Sullivan, BSN, RN; Susan Wade-Murphy, MSN, RN
Disclosures
Hospital to Home Outcomes team reports grants from the Patient Centered Outcomes Research Institute during the conduct of the study. Dr. White reports personal fees from the Institute for Health Care Improvement, outside the submitted work.
Funding
This work was supported by the Patient Centered Outcomes Research Institute (IHS-1306-0081 to Dr. S. Shah). All statements in this report, including findings and conclusions, are solely those of the authors and do not necessarily represent the views of the Patient-Centered Outcomes Research Institute, its Board of Governors, or the Methodology Committee. Dr Auger’s research is funded by the Agency for Healthcare Research and Quality (1K08HS024735).
1. Berry JG, Hall DE, Kuo DZ, et al. Hospital utilization and characteristics of patients experiencing recurrent readmissions within children’s hospitals. JAMA. 2011;305(7):682-690. doi: 10.1001/jama.2011.122. PubMed
2. Schwarz JN, Monti A, Savelli-Castillo I, Nelson LP. Accuracy of familial reporting of a child’s medical history in a dental clinic setting. Pediatr Dent. 2004;26(5):433-439. PubMed
3. Williams ER, Meza YE, Salazar S, Dominici P, Fasano CJ. Immunization histories given by adult caregivers accompanying children 3-36 months to the emergency department: are their histories valid for the Haemophilus influenzae B and pneumococcal vaccines? Pediatr Emerg Care. 2007;23(5):285-288. doi: 10.1097/01.pec.0000248699.42175.62. PubMed
4. Stupiansky NW, Zimet GD, Cummings T, Fortenberry JD, Shew M. Accuracy of self-reported human papillomavirus vaccine receipt among adolescent girls and their mothers. J Adolesc Health. 2012;50(1):103-105. doi: 10.1016/j.jadohealth.2011.04.010. PubMed
5. Tubbs-Cooley HL, Pickler RH, Simmons JM, et al. Testing a post-discharge nurse-led transitional home visit in acute care pediatrics: the Hospital-To-Home Outcomes (H2O) study protocol. J Adv Nurs. 2016;72(4):915-925. doi: 10.1111/jan.12882. PubMed
6. Auger KA, Simmons JM, Tubbs-Cooley HL, et al. Postdischarge nurse home visits and reuse: the hospital to home outcomes (H2O) trial. Pediatrics. 2018;142(1):e20173919. doi: 10.1542/peds.2017-3919. PubMed
7. The Health Collaborative. The Health Collaborative Healthbridge Analytics. http://healthcollab.org/hbanalytics/. Accessed August 11, 2017.
8. Altman DG. Practical statistics for medical research. Boca Raton, Florida: CRC Press; 1990.
9. Coller RJ, Klitzner TS, Saenz AA, Lerner CF, Nelson BB, Chung PJ. The medical home and hospital readmissions. Pediatrics. 2015;136(6):e1550-e1560. doi: 10.1542/peds.2015-1618. PubMed
10. Office of Disease Prevention and Health Promotion. US Department of Health and Human Services. Healthy People 2010: Understanding and Improving Health. 2nd ed. Washington, DC: US Government Printing Office; 2000.
11. Yin HS, Johnson M, Mendelsohn AL, Abrams MA, Sanders LM, Dreyer BP. The health literacy of parents in the United States: a nationally representative study. Pediatrics. 2009;124(3):S289-S298. doi: 10.1542/peds.2009-1162E. PubMed
12. Solan LG, Beck AF, Brunswick SA, et al. The family perspective on hospital to home transitions: a qualitative study. Pediatrics. 2015;136(6):e1539-e1549. PubMed
13. DeWalt DA CL, Hawk VH, Broucksou KA, Hink A, Rudd R, Brach C. Health Literacy Universal Precautions Toolkit. (Prepared by North Carolina Network Consortium, The Cecil G. Sheps Center for Health Services Research, The University of North Carolina at Chapel Hill, under Contract No. HHSA290200710014.). Rockville, MD: Agency for Healthcare Research and Quality; 2010.
© 2019 Society of Hospital Medicine
Preventing Delirium Takes a Village: Systematic Review and Meta-Analysis of Delirium Preventive Models of Care
Delirium presents as an acute change in mentation characterized by reduced attention, clouding of awareness, and typically an altered level of arousal. It can be caused by a host of medical conditions, medications, or other psychoactive substances and is therefore encountered primarily in acute and postacute medical settings.1 More than a quarter of all hospitalized patients develop delirium,2 with rates up to 80% in the critically ill.3 Similarly, delirium occurs in more than one-third of patients who transition to postacute care.4 These high prevalence rates are alarming, especially because delirium is a risk factor for mortality, prolonged hospitalization, institutionalization, and overall higher cost of care.5 However, more than a quarter of delirium is preventable.6 Evidence-based guidelines for delirium uniformly call for multicomponent prevention strategies,7 and these are best delivered through collaborative models of care. In short, delirium impacts healthcare systems; therefore, interventions aimed at preventing delirium and its consequences ought to be systems-based.
Since the Institute of Medicine issued its 1999 report highlighting the critical role of medical errors in healthcare, healthcare systems have increasingly become team-based.8 “Medical care is inherently interdependent,”9 and this implies that delirium prevention rests not only on individuals but also on broader systems of care. Although nonpharmacological interventions are efficacious at preventing delirium,10 previous reviews have focused on specific interventions or multiple interventions rather than the systems of care needed to deliver them. Indeed, teams and the quality of their teamwork impact outcomes.11
Herein, we provide a systematic review and meta-analysis of integrated models of care designed to prevent delirium. What distinguishes this review from previous reviews of nonpharmacological interventions to prevent delirium is our focus on discrete models of care that involve collaboration among clinicians. Our goal is to identify the most promising models that deserve further development, investigation, and dissemination. Viewing delirium prevention through a collaborative care lens is consistent with efforts to achieve value-based care and may encourage drawing from the expanding literature outlining the benefits of mental healthcare integration.12,13 Specifically, a systems perspective highlights the potential for system-wide benefits such as reducing readmissions14,15 and cost savings.16
METHODS
This systematic review and meta-analysis follows PRISMA guidelines. A search of OVID, MEDLINE, CINAHL, Cochrane Database of Systematic Reviews, EMBASE, and PsycINFO was completed by a medical librarian for clinical studies in which models of care were implemented to prevent delirium using PICO (P patient, problem or population; I, intervention; C, comparison, control or comparator; O, outcome) inquiries. Search terms included delirium, acute confusional state, altered mental status, prevention, and control (“delirium”/exp OR “acute confusion”/exp OR “altered mental status”/exp) AND “prevention and control”/exp AND [English]/lim AND [embase]/lim).
One researcher (AK) screened articles by title for relevance. Relevant articles were then divided among four authors (AK, MO, NF, and OB), and the abstracts were screened for eligibility. The authors reviewed the full texts of any potentially eligible studies. Each full text was assigned to two authors for full review. Discrepancies were adjudicated by conference among all authors. In addition, references within all full-text publications were scanned for potential additional articles.
The inclusion criteria for review of full-text articles required English-language description of a model of care with multiple interventions, delirium reported as an outcome, and presence of a comparator group.
“Model of care” was defined by the Cochrane Effective Practice and Organization of Care Review Group as follows: (1) revision of professional roles, including shifting of professional roles or expansion of roles to new tasks; (2) creation of clinical multidisciplinary teams or addition of new members to the team who collaborate inpatient care; (3) delivery of multiple interventions across multiple domains (ie, studies involving a single intervention such as physical therapy or targeting a single domain such as sleep were excluded); and (4) formal integration of services whereby teams work together in collaboration with existing services to enhance care.17 For this review, we required that studies include a comparator group so that effectiveness of the intervention could be assessed. Quality improvement studies that lacked a comparator group were excluded.
Delirium incidence was the primary outcome and was evaluated by meta-analysis. Heterogeneity was assessed using I2 and visual inspection of forest plots. I2 values of 25%, 50%, and 75% represent low, moderate, and high heterogeneity, respectively. The studies were pooled according to study type as follows: randomized controlled trials, pre–post design, and other nonrandomized prospective studies. Random effects models were used to calculate estimates using the Comprehensive Meta-Analysis software (Version 3, Biostat, Englewood, New Jersey), which also generated forest plots.
Risk of bias was assessed using criteria established by the Cochrane Collaborative Review Criteria, which lists six categories of potential bias: random sequence generation, allocation concealment, blinding of participants and personnel, blinding of outcome assessment, incomplete outcome data, and selective reporting.17 Each study was assessed by two authors (either MO and AK or MO-P. and OB) for bias and a numerical value was assigned to each of the six categories as follows: 1 = low risk, 2 = unknown/moderate risk, and 3 = high risk. Where scorers disagreed, all authors jointly conferred, and a consensus score was given. The values for each of these six categories were added to create a composite risk-of-bias score for each study, with 6 being the lowest possible score and 18 the highest. Overall risk was classified as follows: <9 = low risk, 9-12 = moderate risk, and >12 = high risk.
RESULTS
Study Selection Process
An initial literature search identified 352 articles. After reviewing the titles, 308 articles were excluded for irrelevance, and 44 abstracts were screened for eligibility. We excluded 27 articles upon abstract review, and the full texts of 17 were obtained for detailed review. In addition, we identified another 10 potentially eligible articles through review of references and obtained full texts of these as well. Of the 27 full-text articles reviewed, 15 were included in this systematic review, 10 of which were suitable for meta-analysis. The Figure shows the PRISMA flow chart.
Study Characteristics
The 15 studies that met the inclusion criteria are summarized in the Table.18-32 Delirium prevention was among the primary outcomes of 13 studies; delirium outcomes were reported in the other two studies as well, which were primarily designed to assess feasibility.26,27 Six studies were conducted in the United States, three in Sweden, two in Spain, two in the United Kingdom, and one each conducted in Korea and Canada. Healthcare settings among the included studies involved the intensive care unit (six studies), medical floors (four studies), surgical floors (three studies), a long-term care unit (one study), and
Outcomes Reported
All but one of the studies reported delirium incidence. The most commonly used delirium screening instrument was the Confusion Assessment Method (CAM) or its modified version, the CAM-ICU (11 studies).33,34 Other methods used to assess mentation included the Richmond Agitation Sedation Scale,35 the Organic Brain Syndrome scale,36 the revised Delirium Rating Scale,37 the Diagnostic and Statistical Manual of Mental Disorders, Fourth Edition,38 and the Confusion Rating Scale.39 (Details regarding delirium screening tools can be found in the systematic review by De and Wand.40) Researchers performed delirium assessment in nine studies, whereas assessments were performed by clinical staff in the remaining studies. Other outcomes reported included length of stay (LOS), mortality, number of days ventilated, and functional decline. None of the included studies reported cost effectiveness.
Risk of Bias Assessment
Risk of bias assessment identified only two studies—both randomized controlled trials—as low risk (Table). The remaining studies had moderate (four studies) or high risk (nine studies).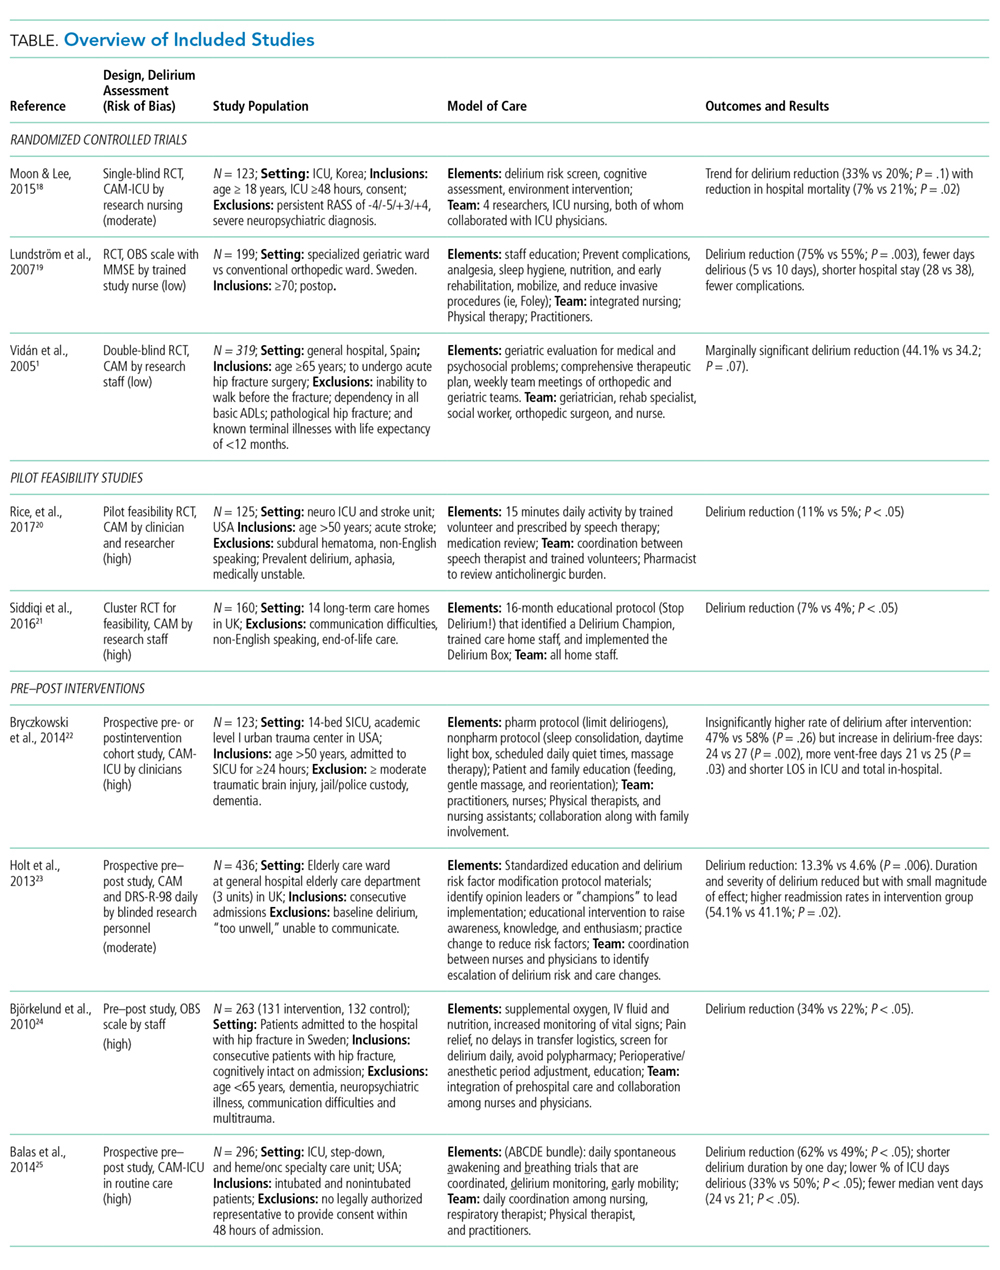
Results from Individual Studies
Of the 15 studies, nine reported a statistically significant reduction in delirium incidence, and another two reported a statistically insignificant reduction. In addition, seven of the eight studies that assessed delirium duration found reduced duration in the intervention cohort, and two of the three studies that reported delirium severity found a reduction in the intervention group.
Results of Meta-Analysis
Random effects models were created to meta-analyze groups of studies based on design as follows: randomized controlled trials (three studies18,19,25), pre–post intervention studies (four of six studies included28-31), and other nonrandomized studies (three of four studies included21-23). Meta-analysis was not completed for the two feasibility studies26,27 because delirium outcome data were limited due to the feasibility study design. The study of Dale et al.32 was excluded from the meta-analysis because the rates of CAM-ICU completion differed substantially between control and intervention groups (0.35 vs 1.49 per 24 hours, respectively), leading to imbalanced between-group sensitivity in delirium detection and Needham et al.20 was also excluded because it reported only days of delirium, not delirium incidence. The study by Lundström et al.24 was also excluded from the meta-analysis because delirium incidence was measured on days 1, 3, and 5, whereas the other studies reported delirium daily.
Meta-analysis of the three randomized controlled trials revealed a pooled odds ratio of 0.56 (95% CI: 0.37-0.85; P = .006) for delirium incidence among intervention group subjects relative to those in comparator groups. The heterogeneity across studies was low (I2 = 29%). Pooling data from four pre–post studies found that the odds ratio for delirium incidence was 0.63 (95% CI: 0.37-1.07; P = .09). The heterogeneity across these studies was moderate (I2 = 65%). Results from the three eligible, nonrandomized prospective studies were also pooled. The odds ratio for developing delirium among study subjects was 0.79 (95% CI: 0.46-1.37; P = .40), and the heterogeneity among these studies was high (I2 = 85%).
DISCUSSION
We provide a systematic review and meta-analysis of delirium preventive models of care. Meta-analysis of the three randomized controlled trials found that these models of care led to a statistically significant reduction in delirium incidence; study subjects had an 11.5% reduction in absolute delirium incidence. The pooled odds ratios for both of the other sets of nonrandomized studies favored the intervention group but were not significant, each because of one included study. The pre–post meta-analysis failed to reach significance as one of the included studies found a trend toward higher delirium incidence; however, interestingly, in that same study, the overall delirium-free days were significantly reduced overall (24 vs 27, P = .002). Similarly, meta-analysis of the three additional nonrandomized prospective studies failed to reach significance because the largest included study found higher rates of delirium among intervention group subjects. Despite considerable risk of bias in several of these studies, their findings were broadly consistent; all but one study (Gagnon 201221) reported a trend or a significant reduction in delirium incidence, duration, severity, or number of delirium episodes. Moreover, the value of such models of care extended beyond preventing delirium; for instance, other positive outcomes included reduced LOS and fewer medical complications.
Models of care ranged widely with respect to specific interventions, though several common elements highlighted their relevance for delirium care and as potential delirium prevention strategies in future studies. For example, two of the randomized controlled trials18,19 employed early mobilization, enhanced nutrition, sleep hygiene, early reduction of invasive procedures (eg, urinary catheterization), and pain control in their multicomponent models. Five additional studies also incorporated early mobilization,20,22,23,31,32 and three sought to improve sleep quality.22,28,30 Among other important strategies were delirium screening,18,20,22,30,31 monitoring medication,18,20,22,26,28,30,32 orientation,18,21,23,28 addressing vision and hearing impairment,18,22,23,32 hydration,18,22,23 avoiding hypoxia,18,20,30 and staff, patient, and caretaker education.19,21,23,27-30 Unique strategies were implemented in certain studies. For instance, one study used massage therapy,28 preventing delays in transfer logistics in another,30 and a third addressed psychosocial problems.25 Overall, the selection of strategies depended on the patient setting; thus, no one care bundle should be expected to emerge as a universal model for delirium prevention. Rather, these results should be interpreted within their specific care contexts and judged on the quality of evidence (eg, effect size and statistically significant findings, low risk of bias, sound experimental design). The one study that failed to find any positive effect on delirium, that of Gagnon et al.,21 was conducted on an inpatient palliative care service in Canada, and its negative finding may reflect the unique delirium risk factors in patients who are nearing end of life.
This current review differs from previous delirium prevention reviews in operationally defining a “model of care.” We identified a great deal of variation in specific models and team composition. For example, some interventions were carried out by nurses18-20,31 and physicians,20,21,25,32 whereas others involved physical therapists,20,22,28 medical residents,23 geriatricians,22,23,25 pharmacists,26 researchers,18 and trained volunteers.22 In all cases, the staff roles were expanded to include new tasks, and the clinical team worked collaboratively to administer interventions across multiple domains. Team-related considerations are critical because modern medical care is inherently interdependent.9 These broad differences in team composition across studies demonstrate the number of potential options for team structure and function. They also highlight the number of “moving parts” to be considered when designing and implementing delirium care bundles.
Most of the delirium prevention studies implementing models of care are characterized by a substantial risk of bias. We evaluated risk of bias along six categories of potential sources, including random assignment to groups, ability to foresee future group allocation, blinding of participants and personnel to group assignment, blinding of outcome assessment, completeness of outcome data, selective reporting, and other potential sources of bias.17 Two of the three studies that used randomization had a low risk of bias, and four additional studies had a moderate risk of bias. Allocation concealment was accomplished only in randomized controlled trials, whereas blinding of both subjects and study personnel was not implemented in any of the studies. Although some studies relied on data analysis by research personnel blinded to group membership or the nature of the intervention, others failed to do so or failed to describe data analysis in sufficient detail. Studies also failed to report the percentage of unscorable or otherwise omitted delirium assessments necessary to calculate attrition rates or to understand the comprehensiveness of outcome assessment in a systematic manner. Other potential sources of bias included systematic differences between the intervention and control groups (such as differences in gender composition, age, or delirium risk) at study outset.
A primary limitation of this review is the heterogeneity of settings, interventions, and models of care across included studies. We excluded several studies from this review for being delivered by a single individual or service line (eg, introduction of a geriatric consult service, physical therapy, or volunteers), for providing a single intervention (eg, early ambulation alone), or for multiple interventions targeting a single domain (eg, sleep). We did so because the future of value-based care lies in collaboration of providers and services, and in a way the complexity across and within these studies ultimately reflects the complexity of medical settings as well as the multifactorial nature of delirium. The broader message is a call for increasing the integration of delirium-related care services. As discussed earlier, the high risk of bias across these studies is a limitation of our findings; high-quality evidence on the value of delirium prevention models of care remains limited. Thus, although our review suggests that there are multicomponent models of care that hold promise in mitigating delirium and its outcomes, additional randomized studies are required to confirm the efficacy of such models of care and to test which services, interventions, and clinical domains deserve priority.
CONCLUSION
To our knowledge, this is the first systematic review and meta-analysis of delirium preventive models of care. Models of care, as defined here, necessarily included a multidisciplinary team in which traditional staff roles had been revised to implement a multicomponent, multidomain intervention. Other recent reviews are available for multicomponent pharmacological and nonpharmacological interventions to prevent and manage delirium,41-49 but just as important as which interventions are being delivered is the team that delivers them. Care delivery in a complex medical system is more than handing a patient a medication or facilitating ambulation; it requires a choreographed dance of teamwork and integration across services. This review identifies promising models of care that deserve further recognition, refinement, and ultimately widespread implementation.
Acknowledgments
The authors comprise a writing group created through the Delirium Boot Camp, an annual meeting originally sponsored by the Center of Excellence for Delirium in Aging: Research, Training, and Educational Enhancement (CEDARTREE, Boston, Massachusetts); it is currently supported by the Network for Investigation of Delirium: Unifying Scientists (NIDUS, Boston, Massachusetts). The authors would like to thank medical librarian Rita Mitchell (Aurora Health Care, Milwaukee, Wisconsin) for the literature search, senior scientific writer and editor Joe Grundle (Aurora Research Institute, Milwaukee, Wisconsin) for editorial assistance, and graphics specialist Brian Miller (Aurora Research Institute, Milwaukee, Wisconsin) for help with the figures.
Disclosures
The authors report no relevant conflicts of interest.
Funding
No funding was dedicated to the conduct of this review.
1. American Psychiatric Association; 2013. Diagnostic and Statistical Manual of Mental Disorders. American Psychiatric Publishing, Inc.
2. Schubert M, Schürch R, Boettger S, et al. A hospital-wide evaluation of delirium prevalence and outcomes in acute care patients - A cohort study. BMC Health Serv Res. 2018;18(1):550. https://doi.org/10.1186/s12913-018-3345-x.
3. Ely EW, Shintani A, Truman B, et al. Delirium as a predictor of mortality in mechanically ventilated patients in the Intensive Care Unit. JAMA. 2004;291(14):1753-1762. https://doi.org/10.1001/jama.291.14.1753.
4. Gual N, Morandi A, Pérez LM, et al. Risk factors and outcomes of delirium in older patients admitted to postacute care with and without dementia. Dement Geriatr Cogn Disord. 2018;45(1-2):121-129. https://doi.org/10.1159/000485794.
5. Marcantonio ER. Delirium in hospitalized older adults. N Engl J Med. 2017;377(15):1456-1466. https://doi.org/10.1056/NEJMcp1605501.
6. Inouye SK, Westendorp RGJ, Saczynski JS. Delirium in elderly people. Lancet. 2014;383(9920):911-922. https://doi.org/10.1016/S0140-6736(13)60688-1.
7. Bush SH, Marchington KL, Agar M, et al. Quality of clinical practice guidelines in delirium: A systematic appraisal. BMJ Open. 2017;7(3):e013809. https://doi.org/10.1136/bmjopen-2016-013809.
8. Institute of Medicine. 2000. To Err Is Human: Building a Safer Health System. Washington, DC: The National Academies Press. https://doi.org/10.17226/9728.
9. Rosen MA, DiazGranados D, Dietz AS, et al. Teamwork in healthcare: key discoveries enabling safer, high-quality care. Am Psychol. 2018;73(4):433-450. https://doi.org/10.1037/amp0000298.
10. Abraha I, Trotta F, Rimland JM, et al. Efficacy of non-pharmacological interventions to prevent and treat delirium in older patients: A systematic overview. The SENATOR project ONTOP series. PLOS ONE. 2015;10(6):e0123090. https://doi.org/10.1371/journal.pone.0123090.
11. Thomas EJ. Improving teamwork in healthcare: current approaches and the path forward. BMJ Qual Saf. 2011;20(8):647-650. https://doi.org/10.1136/bmjqs-2011-000117.
12. Sledge W, Bozzo J, White-McCullum B, Lee H. The cost-benefit from the perspective of the hospital of a proactive psychiatric consultation service on inpatient general medicine services. Health Econ Outcome -Res. 2016;2:2-6.
13. Unützer J, Katon WJ, Fan MY, et al. Long-term cost effects of collaborative care for late-life depression. Am J Manag Care. 2008;14(2):95-100. PubMed
14. Lee E, Kim J. Cost-benefit analysis of a delirium prevention strategy in the intensive care unit. Nurs Crit Care. 2014;21:367-373. https://doi.org/10.1111/nicc.12124.
15. Rubin FH, Bellon J, Bilderback A, Urda K, Inouye SK. Effect of the hospital elder life program on risk of 30-day readmission. J Am Geriatr Soc. 2018;66(1):145-149. https://doi.org/10.1111/jgs.15132.
16. Zaubler TS, Murphy K, Rizzuto L, et al. Quality improvement and cost savings with multicomponent delirium interventions: replication of the hospital elder life program in a community hospital. Psychosomatics. 2013;54(3):219-226. https://doi.org/10.1016/j.psym.2013.01.010.
17. Cochrane effective practice and organisation of Care Group (EPOC). Data collection Checklistist. Chochrane Effective Practice and Organisation of Care Group (EPOC) Methods Papers. . https://methods.cochrane.org/sites/methods.cochrane.org.bias/files/public/uploads/EPOC Data Collection Checklist.pdf. Accessed May 27, 2014.
18. Moon KJ, Lee SM. The effects of a tailored intensive care unit delirium prevention protocol: A randomized controlled trial. Int J Nurs Stud. 2015;52(9):1423-1432. https://doi.org/10.1016/j.ijnurstu.2015.04.021.
19. Lundström M, Olofsson B, Stenvall M, et al. Postoperative delirium in old patients with femoral neck fracture: a randomized intervention study. Aging Clin Exp Res-. 2007;19(3):178-186. https://doi.org/10.1007/BF03324687.
20. Needham DM, Korupolu R, Zanni JM, et al. Early physical medicine and rehabilitation for patients With acute respiratory failure: a quality improvement project. Arch Phys Med Rehabil. 2010;91(4):536-542. https://doi.org/10.1016/j.apmr.2010.01.002.
21. Gagnon P, Allard P, Gagnon B, Mérette C, Tardif F. Delirium prevention in terminal cancer: assessment of a multicomponent intervention. Psychooncology. 2012;21(2):187-194. https://doi.org/10.1002/pon.1881.
22. Inouye SK, Bogardus ST, Charpentier PA, et al. A multicomponent intervention to prevent delirium in hospitalized older patients. N Engl J Med. 1999;340(9):669-676. https://doi.org/10.1056/NEJM199903043400901.
23. Vidán MT, Sánchez E, Alonso M, et al. An intervention integrated into daily clinical practice reduces the incidence of delirium during hospitalization in elderly patients. J Am Geriatr Soc. 2009;57(11):2029-2036. https://doi.org/10.1111/j.1532-5415.2009.02485.x.
24. Lundström M, Edlund A, Karlsson S, et al. A multifactorial intervention program reduces the duration of delirium, length of hospitalization, and mortality in delirious patients. J Am Geriatr Soc. 2005;53(4):622-628. https://doi.org/10.1111/j.1532-5415.2005.53210.x.
25. Vidán M, Serra JA, Moreno C, Riquelme G, Ortiz J. Efficacy of a comprehensive geriatric intervention in older patients hospitalized for hip fracture: A randomized, controlled trial. J Am Geriatr Soc. 2005;53(9):1476-1482. https://doi.org/10.1111/j.1532-5415.2005.53466.x.
26. Rice KL, Bennett MJ, Berger L, et al. A pilot randomized controlled trial of the feasibility of a multicomponent delirium prevention intervention versus usual care in acute stroke. J Cardiovasc Nurs. 2017;32(1):E1-E10. https://doi.org/10.1097/JCN.0000000000000356.
27. Siddiqi N, Cheater F, Collinson M, et al. The PiTSTOP study: a feasibility cluster randomized trial of delirium prevention in care homes for older people. Age Ageing. 2016;45(5):652-661. https://doi.org/10.1093/ageing/afw091.
28. Bryczkowski SB, Lopreiato MC, Yonclas PP, Sacca JJ, Mosenthal AC. Delirium prevention program in the surgical intensive care unit (SICU) improved the outcomes of older adults. J Surg Res. 2014;186:519. https://doi.org/10.1016/j.jss.2013.11.352
29. Holt R, Young J, Heseltine D. Effectiveness of a multi-component intervention to reduce delirium incidence in elderly care wards. Age Ageing. 2013;42(6):721-727. https://doi.org/10.1093/ageing/aft120.
30. Björkelund KB, Hommel A, Thorngren KG, et al. Reducing delirium in elderly patients with hip fracture: A multi-factorial intervention study. Acta Anaesthesiol-Scand. 2010;54(6):678-688. https://doi.org/10.1111/j.1399-6576.2010.02232.x.
31. Balas MC, Vasilevskis EE, Olsen KM, et al. Effectiveness and safety of the awakening and breathing coordination, delirium monitoring/management, and early exercise/mobility (ABCDE) bundle. Crit Care Med. 2014;42(5):1024-1036. https://doi.org/10.1097/CCM.0000000000000129.
32. Dale CR, Kannas DA, Fan VS, et al. Improved analgesia, sedation, and delirium protocol associated with decreased duration of delirium and mechanical ventilation. Ann Am Thorac Soc. 2014;11(3):367-374. https://doi.org/10.1513/AnnalsATS.201306-210OC.
33. Inouye SK, van Dyck CH, Alessi CA, et al. Clarifying confusion: the confusion assessment method. A new method for detection of delirium. Ann Intern Med. 1990;113(12):941-948. https://doi.org/10.7326/0003-4819-113-12-941.
34. Ely EW, Margolin R, Francis J, et al. Evaluation of delirium in critically ill patients: validation of the Confusion Assessment Method for the Intensive Care Unit (CAM-ICU). Crit Care Med. 2001;29(7):1370-1379. https://doi.org/10.1097/00003246-200107000-00012.
35. Sessler CN, Gosnell MS, Grap MJ, et al. The Richmond Agitation-Sedation Scale: validity and reliability in adult intensive care unit patients. Am J Respir Crit Care Med. 2002;166(10):1338-1344. https://doi.org/10.1164/rccm.2107138.
36. Jensen E, Dehlin O, Gustafson L. A comparison between three psychogeriatric rating scales. Int J Geriatr Psychiatry. 1993;8(3):215-229. https://doi.org/10.1002/gps.930080305.
37. Trzepacz PT, Mittal D, Torres R, et al. Validation of the Delirium Rating Scale-revised-98: comparison with the delirium rating scale and the cognitive test for delirium. J Neuropsychiatr Clin Neurosci. 2001;13(2):229-242. https://doi.org/10.1176/jnp.13.2.229.
38. American Psychiatric Association. (1994). Diagnostic and statistical manual of mental disorders (4th ed.). Arlington, VA, US: American Psychiatric Publishing, Inc.
39. Williams MA. Delirium/acute confusional states: evaluation devices in nursing. Int Psychogeriatr. 1991;3(2):301-308. PubMed
40. De J, Wand APF. Delirium screening: A systematic review of delirium screening tools in hospitalized patients. Gerontologist-. 2015;55(6):1079-1099. https://doi.org/10.1093/geront/gnv100.
41. Martinez F, Tobar C, Hill N. Preventing delirium: should non-pharmacological,
multicomponent interventions be used? A systematic review and meta-analysis of the literature. Age Ageing. 2015;44(2):196-204. https://doi.org/10.1093/ageing/afu173.
42. Reston JT, Schoelles KM. In-facility delirium prevention programs as a patient safety strategy: a systematic review. Ann Intern Med. 2013;158(5):375-380. https://doi.org/10.7326/0003-4819-158-5-201303051-00003.
43. Rivosecchi RM, Smithburger PL, Svec S, Campbell S, Kane-Gill SL. Nonpharmacological interventions to prevent delirium: an evidence-based systematic review. Crit Care Nurse. 2015;35(1):39-50; quiz 51. https://doi.org/10.4037/ccn2015423.
44. Trogrlić Z, van der Jagt M, Bakker J, et al. A systematic review of implementation strategies for assessment, prevention, and management of ICU delirium and their effect on clinical outcomes. Crit Care. 2015;19:157. https://doi.org/10.1186/s13054-015-0886-9.
45. Wang Y, Tang J, Zhou F, Yang L, Wu J. Comprehensive geriatric care reduces acute perioperative delirium in elderly patients with hip fractures: A meta-analysis. Medicine (Baltimore). 2017;96(26):e7361. https://doi.org/10.1097/MD.0000000000007361.
46. Shields L, Henderson V, Caslake R. Comprehensive geriatric assessment for prevention of delirium After hip fracture: A systematic review of randomized controlled trials. J Am Geriatr Soc. 2017;65(7):1559-1565. https://doi.org/10.1111/jgs.14846.
47. Oberai T, Lizarondo L, Ruurd J. Effectiveness of multi-component interventions on incidence of delirium in hospitalized older patients with hip fracture: a systematic review protocol. JBI Database Syst Rev Implement Rep. 2017;15(2):259-268. https://doi.org/10.11124/JBISRIR-2016-002943.
48. Collinsworth AW, Priest EL, Campbell CR, Vasilevskis EE, Masica AL. A review of multifaceted care approaches for the prevention and mitigation of delirium in intensive care units. J Intensive Care Med. 2016;31(2):127-141. https://doi.org/10.1177/0885066614553925.
49. Hshieh TT, Yue J, Oh E, et al. Effectiveness of multicomponent nonpharmacological
delirium interventions: a meta-analysis. JAMA Intern Med. 2015;175(4):512-520. https://doi.org/10.1001/jamainternmed.2014.7779.
Delirium presents as an acute change in mentation characterized by reduced attention, clouding of awareness, and typically an altered level of arousal. It can be caused by a host of medical conditions, medications, or other psychoactive substances and is therefore encountered primarily in acute and postacute medical settings.1 More than a quarter of all hospitalized patients develop delirium,2 with rates up to 80% in the critically ill.3 Similarly, delirium occurs in more than one-third of patients who transition to postacute care.4 These high prevalence rates are alarming, especially because delirium is a risk factor for mortality, prolonged hospitalization, institutionalization, and overall higher cost of care.5 However, more than a quarter of delirium is preventable.6 Evidence-based guidelines for delirium uniformly call for multicomponent prevention strategies,7 and these are best delivered through collaborative models of care. In short, delirium impacts healthcare systems; therefore, interventions aimed at preventing delirium and its consequences ought to be systems-based.
Since the Institute of Medicine issued its 1999 report highlighting the critical role of medical errors in healthcare, healthcare systems have increasingly become team-based.8 “Medical care is inherently interdependent,”9 and this implies that delirium prevention rests not only on individuals but also on broader systems of care. Although nonpharmacological interventions are efficacious at preventing delirium,10 previous reviews have focused on specific interventions or multiple interventions rather than the systems of care needed to deliver them. Indeed, teams and the quality of their teamwork impact outcomes.11
Herein, we provide a systematic review and meta-analysis of integrated models of care designed to prevent delirium. What distinguishes this review from previous reviews of nonpharmacological interventions to prevent delirium is our focus on discrete models of care that involve collaboration among clinicians. Our goal is to identify the most promising models that deserve further development, investigation, and dissemination. Viewing delirium prevention through a collaborative care lens is consistent with efforts to achieve value-based care and may encourage drawing from the expanding literature outlining the benefits of mental healthcare integration.12,13 Specifically, a systems perspective highlights the potential for system-wide benefits such as reducing readmissions14,15 and cost savings.16
METHODS
This systematic review and meta-analysis follows PRISMA guidelines. A search of OVID, MEDLINE, CINAHL, Cochrane Database of Systematic Reviews, EMBASE, and PsycINFO was completed by a medical librarian for clinical studies in which models of care were implemented to prevent delirium using PICO (P patient, problem or population; I, intervention; C, comparison, control or comparator; O, outcome) inquiries. Search terms included delirium, acute confusional state, altered mental status, prevention, and control (“delirium”/exp OR “acute confusion”/exp OR “altered mental status”/exp) AND “prevention and control”/exp AND [English]/lim AND [embase]/lim).
One researcher (AK) screened articles by title for relevance. Relevant articles were then divided among four authors (AK, MO, NF, and OB), and the abstracts were screened for eligibility. The authors reviewed the full texts of any potentially eligible studies. Each full text was assigned to two authors for full review. Discrepancies were adjudicated by conference among all authors. In addition, references within all full-text publications were scanned for potential additional articles.
The inclusion criteria for review of full-text articles required English-language description of a model of care with multiple interventions, delirium reported as an outcome, and presence of a comparator group.
“Model of care” was defined by the Cochrane Effective Practice and Organization of Care Review Group as follows: (1) revision of professional roles, including shifting of professional roles or expansion of roles to new tasks; (2) creation of clinical multidisciplinary teams or addition of new members to the team who collaborate inpatient care; (3) delivery of multiple interventions across multiple domains (ie, studies involving a single intervention such as physical therapy or targeting a single domain such as sleep were excluded); and (4) formal integration of services whereby teams work together in collaboration with existing services to enhance care.17 For this review, we required that studies include a comparator group so that effectiveness of the intervention could be assessed. Quality improvement studies that lacked a comparator group were excluded.
Delirium incidence was the primary outcome and was evaluated by meta-analysis. Heterogeneity was assessed using I2 and visual inspection of forest plots. I2 values of 25%, 50%, and 75% represent low, moderate, and high heterogeneity, respectively. The studies were pooled according to study type as follows: randomized controlled trials, pre–post design, and other nonrandomized prospective studies. Random effects models were used to calculate estimates using the Comprehensive Meta-Analysis software (Version 3, Biostat, Englewood, New Jersey), which also generated forest plots.
Risk of bias was assessed using criteria established by the Cochrane Collaborative Review Criteria, which lists six categories of potential bias: random sequence generation, allocation concealment, blinding of participants and personnel, blinding of outcome assessment, incomplete outcome data, and selective reporting.17 Each study was assessed by two authors (either MO and AK or MO-P. and OB) for bias and a numerical value was assigned to each of the six categories as follows: 1 = low risk, 2 = unknown/moderate risk, and 3 = high risk. Where scorers disagreed, all authors jointly conferred, and a consensus score was given. The values for each of these six categories were added to create a composite risk-of-bias score for each study, with 6 being the lowest possible score and 18 the highest. Overall risk was classified as follows: <9 = low risk, 9-12 = moderate risk, and >12 = high risk.
RESULTS
Study Selection Process
An initial literature search identified 352 articles. After reviewing the titles, 308 articles were excluded for irrelevance, and 44 abstracts were screened for eligibility. We excluded 27 articles upon abstract review, and the full texts of 17 were obtained for detailed review. In addition, we identified another 10 potentially eligible articles through review of references and obtained full texts of these as well. Of the 27 full-text articles reviewed, 15 were included in this systematic review, 10 of which were suitable for meta-analysis. The Figure shows the PRISMA flow chart.
Study Characteristics
The 15 studies that met the inclusion criteria are summarized in the Table.18-32 Delirium prevention was among the primary outcomes of 13 studies; delirium outcomes were reported in the other two studies as well, which were primarily designed to assess feasibility.26,27 Six studies were conducted in the United States, three in Sweden, two in Spain, two in the United Kingdom, and one each conducted in Korea and Canada. Healthcare settings among the included studies involved the intensive care unit (six studies), medical floors (four studies), surgical floors (three studies), a long-term care unit (one study), and
Outcomes Reported
All but one of the studies reported delirium incidence. The most commonly used delirium screening instrument was the Confusion Assessment Method (CAM) or its modified version, the CAM-ICU (11 studies).33,34 Other methods used to assess mentation included the Richmond Agitation Sedation Scale,35 the Organic Brain Syndrome scale,36 the revised Delirium Rating Scale,37 the Diagnostic and Statistical Manual of Mental Disorders, Fourth Edition,38 and the Confusion Rating Scale.39 (Details regarding delirium screening tools can be found in the systematic review by De and Wand.40) Researchers performed delirium assessment in nine studies, whereas assessments were performed by clinical staff in the remaining studies. Other outcomes reported included length of stay (LOS), mortality, number of days ventilated, and functional decline. None of the included studies reported cost effectiveness.
Risk of Bias Assessment
Risk of bias assessment identified only two studies—both randomized controlled trials—as low risk (Table). The remaining studies had moderate (four studies) or high risk (nine studies).
Results from Individual Studies
Of the 15 studies, nine reported a statistically significant reduction in delirium incidence, and another two reported a statistically insignificant reduction. In addition, seven of the eight studies that assessed delirium duration found reduced duration in the intervention cohort, and two of the three studies that reported delirium severity found a reduction in the intervention group.
Results of Meta-Analysis
Random effects models were created to meta-analyze groups of studies based on design as follows: randomized controlled trials (three studies18,19,25), pre–post intervention studies (four of six studies included28-31), and other nonrandomized studies (three of four studies included21-23). Meta-analysis was not completed for the two feasibility studies26,27 because delirium outcome data were limited due to the feasibility study design. The study of Dale et al.32 was excluded from the meta-analysis because the rates of CAM-ICU completion differed substantially between control and intervention groups (0.35 vs 1.49 per 24 hours, respectively), leading to imbalanced between-group sensitivity in delirium detection and Needham et al.20 was also excluded because it reported only days of delirium, not delirium incidence. The study by Lundström et al.24 was also excluded from the meta-analysis because delirium incidence was measured on days 1, 3, and 5, whereas the other studies reported delirium daily.
Meta-analysis of the three randomized controlled trials revealed a pooled odds ratio of 0.56 (95% CI: 0.37-0.85; P = .006) for delirium incidence among intervention group subjects relative to those in comparator groups. The heterogeneity across studies was low (I2 = 29%). Pooling data from four pre–post studies found that the odds ratio for delirium incidence was 0.63 (95% CI: 0.37-1.07; P = .09). The heterogeneity across these studies was moderate (I2 = 65%). Results from the three eligible, nonrandomized prospective studies were also pooled. The odds ratio for developing delirium among study subjects was 0.79 (95% CI: 0.46-1.37; P = .40), and the heterogeneity among these studies was high (I2 = 85%).
DISCUSSION
We provide a systematic review and meta-analysis of delirium preventive models of care. Meta-analysis of the three randomized controlled trials found that these models of care led to a statistically significant reduction in delirium incidence; study subjects had an 11.5% reduction in absolute delirium incidence. The pooled odds ratios for both of the other sets of nonrandomized studies favored the intervention group but were not significant, each because of one included study. The pre–post meta-analysis failed to reach significance as one of the included studies found a trend toward higher delirium incidence; however, interestingly, in that same study, the overall delirium-free days were significantly reduced overall (24 vs 27, P = .002). Similarly, meta-analysis of the three additional nonrandomized prospective studies failed to reach significance because the largest included study found higher rates of delirium among intervention group subjects. Despite considerable risk of bias in several of these studies, their findings were broadly consistent; all but one study (Gagnon 201221) reported a trend or a significant reduction in delirium incidence, duration, severity, or number of delirium episodes. Moreover, the value of such models of care extended beyond preventing delirium; for instance, other positive outcomes included reduced LOS and fewer medical complications.
Models of care ranged widely with respect to specific interventions, though several common elements highlighted their relevance for delirium care and as potential delirium prevention strategies in future studies. For example, two of the randomized controlled trials18,19 employed early mobilization, enhanced nutrition, sleep hygiene, early reduction of invasive procedures (eg, urinary catheterization), and pain control in their multicomponent models. Five additional studies also incorporated early mobilization,20,22,23,31,32 and three sought to improve sleep quality.22,28,30 Among other important strategies were delirium screening,18,20,22,30,31 monitoring medication,18,20,22,26,28,30,32 orientation,18,21,23,28 addressing vision and hearing impairment,18,22,23,32 hydration,18,22,23 avoiding hypoxia,18,20,30 and staff, patient, and caretaker education.19,21,23,27-30 Unique strategies were implemented in certain studies. For instance, one study used massage therapy,28 preventing delays in transfer logistics in another,30 and a third addressed psychosocial problems.25 Overall, the selection of strategies depended on the patient setting; thus, no one care bundle should be expected to emerge as a universal model for delirium prevention. Rather, these results should be interpreted within their specific care contexts and judged on the quality of evidence (eg, effect size and statistically significant findings, low risk of bias, sound experimental design). The one study that failed to find any positive effect on delirium, that of Gagnon et al.,21 was conducted on an inpatient palliative care service in Canada, and its negative finding may reflect the unique delirium risk factors in patients who are nearing end of life.
This current review differs from previous delirium prevention reviews in operationally defining a “model of care.” We identified a great deal of variation in specific models and team composition. For example, some interventions were carried out by nurses18-20,31 and physicians,20,21,25,32 whereas others involved physical therapists,20,22,28 medical residents,23 geriatricians,22,23,25 pharmacists,26 researchers,18 and trained volunteers.22 In all cases, the staff roles were expanded to include new tasks, and the clinical team worked collaboratively to administer interventions across multiple domains. Team-related considerations are critical because modern medical care is inherently interdependent.9 These broad differences in team composition across studies demonstrate the number of potential options for team structure and function. They also highlight the number of “moving parts” to be considered when designing and implementing delirium care bundles.
Most of the delirium prevention studies implementing models of care are characterized by a substantial risk of bias. We evaluated risk of bias along six categories of potential sources, including random assignment to groups, ability to foresee future group allocation, blinding of participants and personnel to group assignment, blinding of outcome assessment, completeness of outcome data, selective reporting, and other potential sources of bias.17 Two of the three studies that used randomization had a low risk of bias, and four additional studies had a moderate risk of bias. Allocation concealment was accomplished only in randomized controlled trials, whereas blinding of both subjects and study personnel was not implemented in any of the studies. Although some studies relied on data analysis by research personnel blinded to group membership or the nature of the intervention, others failed to do so or failed to describe data analysis in sufficient detail. Studies also failed to report the percentage of unscorable or otherwise omitted delirium assessments necessary to calculate attrition rates or to understand the comprehensiveness of outcome assessment in a systematic manner. Other potential sources of bias included systematic differences between the intervention and control groups (such as differences in gender composition, age, or delirium risk) at study outset.
A primary limitation of this review is the heterogeneity of settings, interventions, and models of care across included studies. We excluded several studies from this review for being delivered by a single individual or service line (eg, introduction of a geriatric consult service, physical therapy, or volunteers), for providing a single intervention (eg, early ambulation alone), or for multiple interventions targeting a single domain (eg, sleep). We did so because the future of value-based care lies in collaboration of providers and services, and in a way the complexity across and within these studies ultimately reflects the complexity of medical settings as well as the multifactorial nature of delirium. The broader message is a call for increasing the integration of delirium-related care services. As discussed earlier, the high risk of bias across these studies is a limitation of our findings; high-quality evidence on the value of delirium prevention models of care remains limited. Thus, although our review suggests that there are multicomponent models of care that hold promise in mitigating delirium and its outcomes, additional randomized studies are required to confirm the efficacy of such models of care and to test which services, interventions, and clinical domains deserve priority.
CONCLUSION
To our knowledge, this is the first systematic review and meta-analysis of delirium preventive models of care. Models of care, as defined here, necessarily included a multidisciplinary team in which traditional staff roles had been revised to implement a multicomponent, multidomain intervention. Other recent reviews are available for multicomponent pharmacological and nonpharmacological interventions to prevent and manage delirium,41-49 but just as important as which interventions are being delivered is the team that delivers them. Care delivery in a complex medical system is more than handing a patient a medication or facilitating ambulation; it requires a choreographed dance of teamwork and integration across services. This review identifies promising models of care that deserve further recognition, refinement, and ultimately widespread implementation.
Acknowledgments
The authors comprise a writing group created through the Delirium Boot Camp, an annual meeting originally sponsored by the Center of Excellence for Delirium in Aging: Research, Training, and Educational Enhancement (CEDARTREE, Boston, Massachusetts); it is currently supported by the Network for Investigation of Delirium: Unifying Scientists (NIDUS, Boston, Massachusetts). The authors would like to thank medical librarian Rita Mitchell (Aurora Health Care, Milwaukee, Wisconsin) for the literature search, senior scientific writer and editor Joe Grundle (Aurora Research Institute, Milwaukee, Wisconsin) for editorial assistance, and graphics specialist Brian Miller (Aurora Research Institute, Milwaukee, Wisconsin) for help with the figures.
Disclosures
The authors report no relevant conflicts of interest.
Funding
No funding was dedicated to the conduct of this review.
1. American Psychiatric Association; 2013. Diagnostic and Statistical Manual of Mental Disorders. American Psychiatric Publishing, Inc.
2. Schubert M, Schürch R, Boettger S, et al. A hospital-wide evaluation of delirium prevalence and outcomes in acute care patients - A cohort study. BMC Health Serv Res. 2018;18(1):550. https://doi.org/10.1186/s12913-018-3345-x.
3. Ely EW, Shintani A, Truman B, et al. Delirium as a predictor of mortality in mechanically ventilated patients in the Intensive Care Unit. JAMA. 2004;291(14):1753-1762. https://doi.org/10.1001/jama.291.14.1753.
4. Gual N, Morandi A, Pérez LM, et al. Risk factors and outcomes of delirium in older patients admitted to postacute care with and without dementia. Dement Geriatr Cogn Disord. 2018;45(1-2):121-129. https://doi.org/10.1159/000485794.
5. Marcantonio ER. Delirium in hospitalized older adults. N Engl J Med. 2017;377(15):1456-1466. https://doi.org/10.1056/NEJMcp1605501.
6. Inouye SK, Westendorp RGJ, Saczynski JS. Delirium in elderly people. Lancet. 2014;383(9920):911-922. https://doi.org/10.1016/S0140-6736(13)60688-1.
7. Bush SH, Marchington KL, Agar M, et al. Quality of clinical practice guidelines in delirium: A systematic appraisal. BMJ Open. 2017;7(3):e013809. https://doi.org/10.1136/bmjopen-2016-013809.
8. Institute of Medicine. 2000. To Err Is Human: Building a Safer Health System. Washington, DC: The National Academies Press. https://doi.org/10.17226/9728.
9. Rosen MA, DiazGranados D, Dietz AS, et al. Teamwork in healthcare: key discoveries enabling safer, high-quality care. Am Psychol. 2018;73(4):433-450. https://doi.org/10.1037/amp0000298.
10. Abraha I, Trotta F, Rimland JM, et al. Efficacy of non-pharmacological interventions to prevent and treat delirium in older patients: A systematic overview. The SENATOR project ONTOP series. PLOS ONE. 2015;10(6):e0123090. https://doi.org/10.1371/journal.pone.0123090.
11. Thomas EJ. Improving teamwork in healthcare: current approaches and the path forward. BMJ Qual Saf. 2011;20(8):647-650. https://doi.org/10.1136/bmjqs-2011-000117.
12. Sledge W, Bozzo J, White-McCullum B, Lee H. The cost-benefit from the perspective of the hospital of a proactive psychiatric consultation service on inpatient general medicine services. Health Econ Outcome -Res. 2016;2:2-6.
13. Unützer J, Katon WJ, Fan MY, et al. Long-term cost effects of collaborative care for late-life depression. Am J Manag Care. 2008;14(2):95-100. PubMed
14. Lee E, Kim J. Cost-benefit analysis of a delirium prevention strategy in the intensive care unit. Nurs Crit Care. 2014;21:367-373. https://doi.org/10.1111/nicc.12124.
15. Rubin FH, Bellon J, Bilderback A, Urda K, Inouye SK. Effect of the hospital elder life program on risk of 30-day readmission. J Am Geriatr Soc. 2018;66(1):145-149. https://doi.org/10.1111/jgs.15132.
16. Zaubler TS, Murphy K, Rizzuto L, et al. Quality improvement and cost savings with multicomponent delirium interventions: replication of the hospital elder life program in a community hospital. Psychosomatics. 2013;54(3):219-226. https://doi.org/10.1016/j.psym.2013.01.010.
17. Cochrane effective practice and organisation of Care Group (EPOC). Data collection Checklistist. Chochrane Effective Practice and Organisation of Care Group (EPOC) Methods Papers. . https://methods.cochrane.org/sites/methods.cochrane.org.bias/files/public/uploads/EPOC Data Collection Checklist.pdf. Accessed May 27, 2014.
18. Moon KJ, Lee SM. The effects of a tailored intensive care unit delirium prevention protocol: A randomized controlled trial. Int J Nurs Stud. 2015;52(9):1423-1432. https://doi.org/10.1016/j.ijnurstu.2015.04.021.
19. Lundström M, Olofsson B, Stenvall M, et al. Postoperative delirium in old patients with femoral neck fracture: a randomized intervention study. Aging Clin Exp Res-. 2007;19(3):178-186. https://doi.org/10.1007/BF03324687.
20. Needham DM, Korupolu R, Zanni JM, et al. Early physical medicine and rehabilitation for patients With acute respiratory failure: a quality improvement project. Arch Phys Med Rehabil. 2010;91(4):536-542. https://doi.org/10.1016/j.apmr.2010.01.002.
21. Gagnon P, Allard P, Gagnon B, Mérette C, Tardif F. Delirium prevention in terminal cancer: assessment of a multicomponent intervention. Psychooncology. 2012;21(2):187-194. https://doi.org/10.1002/pon.1881.
22. Inouye SK, Bogardus ST, Charpentier PA, et al. A multicomponent intervention to prevent delirium in hospitalized older patients. N Engl J Med. 1999;340(9):669-676. https://doi.org/10.1056/NEJM199903043400901.
23. Vidán MT, Sánchez E, Alonso M, et al. An intervention integrated into daily clinical practice reduces the incidence of delirium during hospitalization in elderly patients. J Am Geriatr Soc. 2009;57(11):2029-2036. https://doi.org/10.1111/j.1532-5415.2009.02485.x.
24. Lundström M, Edlund A, Karlsson S, et al. A multifactorial intervention program reduces the duration of delirium, length of hospitalization, and mortality in delirious patients. J Am Geriatr Soc. 2005;53(4):622-628. https://doi.org/10.1111/j.1532-5415.2005.53210.x.
25. Vidán M, Serra JA, Moreno C, Riquelme G, Ortiz J. Efficacy of a comprehensive geriatric intervention in older patients hospitalized for hip fracture: A randomized, controlled trial. J Am Geriatr Soc. 2005;53(9):1476-1482. https://doi.org/10.1111/j.1532-5415.2005.53466.x.
26. Rice KL, Bennett MJ, Berger L, et al. A pilot randomized controlled trial of the feasibility of a multicomponent delirium prevention intervention versus usual care in acute stroke. J Cardiovasc Nurs. 2017;32(1):E1-E10. https://doi.org/10.1097/JCN.0000000000000356.
27. Siddiqi N, Cheater F, Collinson M, et al. The PiTSTOP study: a feasibility cluster randomized trial of delirium prevention in care homes for older people. Age Ageing. 2016;45(5):652-661. https://doi.org/10.1093/ageing/afw091.
28. Bryczkowski SB, Lopreiato MC, Yonclas PP, Sacca JJ, Mosenthal AC. Delirium prevention program in the surgical intensive care unit (SICU) improved the outcomes of older adults. J Surg Res. 2014;186:519. https://doi.org/10.1016/j.jss.2013.11.352
29. Holt R, Young J, Heseltine D. Effectiveness of a multi-component intervention to reduce delirium incidence in elderly care wards. Age Ageing. 2013;42(6):721-727. https://doi.org/10.1093/ageing/aft120.
30. Björkelund KB, Hommel A, Thorngren KG, et al. Reducing delirium in elderly patients with hip fracture: A multi-factorial intervention study. Acta Anaesthesiol-Scand. 2010;54(6):678-688. https://doi.org/10.1111/j.1399-6576.2010.02232.x.
31. Balas MC, Vasilevskis EE, Olsen KM, et al. Effectiveness and safety of the awakening and breathing coordination, delirium monitoring/management, and early exercise/mobility (ABCDE) bundle. Crit Care Med. 2014;42(5):1024-1036. https://doi.org/10.1097/CCM.0000000000000129.
32. Dale CR, Kannas DA, Fan VS, et al. Improved analgesia, sedation, and delirium protocol associated with decreased duration of delirium and mechanical ventilation. Ann Am Thorac Soc. 2014;11(3):367-374. https://doi.org/10.1513/AnnalsATS.201306-210OC.
33. Inouye SK, van Dyck CH, Alessi CA, et al. Clarifying confusion: the confusion assessment method. A new method for detection of delirium. Ann Intern Med. 1990;113(12):941-948. https://doi.org/10.7326/0003-4819-113-12-941.
34. Ely EW, Margolin R, Francis J, et al. Evaluation of delirium in critically ill patients: validation of the Confusion Assessment Method for the Intensive Care Unit (CAM-ICU). Crit Care Med. 2001;29(7):1370-1379. https://doi.org/10.1097/00003246-200107000-00012.
35. Sessler CN, Gosnell MS, Grap MJ, et al. The Richmond Agitation-Sedation Scale: validity and reliability in adult intensive care unit patients. Am J Respir Crit Care Med. 2002;166(10):1338-1344. https://doi.org/10.1164/rccm.2107138.
36. Jensen E, Dehlin O, Gustafson L. A comparison between three psychogeriatric rating scales. Int J Geriatr Psychiatry. 1993;8(3):215-229. https://doi.org/10.1002/gps.930080305.
37. Trzepacz PT, Mittal D, Torres R, et al. Validation of the Delirium Rating Scale-revised-98: comparison with the delirium rating scale and the cognitive test for delirium. J Neuropsychiatr Clin Neurosci. 2001;13(2):229-242. https://doi.org/10.1176/jnp.13.2.229.
38. American Psychiatric Association. (1994). Diagnostic and statistical manual of mental disorders (4th ed.). Arlington, VA, US: American Psychiatric Publishing, Inc.
39. Williams MA. Delirium/acute confusional states: evaluation devices in nursing. Int Psychogeriatr. 1991;3(2):301-308. PubMed
40. De J, Wand APF. Delirium screening: A systematic review of delirium screening tools in hospitalized patients. Gerontologist-. 2015;55(6):1079-1099. https://doi.org/10.1093/geront/gnv100.
41. Martinez F, Tobar C, Hill N. Preventing delirium: should non-pharmacological,
multicomponent interventions be used? A systematic review and meta-analysis of the literature. Age Ageing. 2015;44(2):196-204. https://doi.org/10.1093/ageing/afu173.
42. Reston JT, Schoelles KM. In-facility delirium prevention programs as a patient safety strategy: a systematic review. Ann Intern Med. 2013;158(5):375-380. https://doi.org/10.7326/0003-4819-158-5-201303051-00003.
43. Rivosecchi RM, Smithburger PL, Svec S, Campbell S, Kane-Gill SL. Nonpharmacological interventions to prevent delirium: an evidence-based systematic review. Crit Care Nurse. 2015;35(1):39-50; quiz 51. https://doi.org/10.4037/ccn2015423.
44. Trogrlić Z, van der Jagt M, Bakker J, et al. A systematic review of implementation strategies for assessment, prevention, and management of ICU delirium and their effect on clinical outcomes. Crit Care. 2015;19:157. https://doi.org/10.1186/s13054-015-0886-9.
45. Wang Y, Tang J, Zhou F, Yang L, Wu J. Comprehensive geriatric care reduces acute perioperative delirium in elderly patients with hip fractures: A meta-analysis. Medicine (Baltimore). 2017;96(26):e7361. https://doi.org/10.1097/MD.0000000000007361.
46. Shields L, Henderson V, Caslake R. Comprehensive geriatric assessment for prevention of delirium After hip fracture: A systematic review of randomized controlled trials. J Am Geriatr Soc. 2017;65(7):1559-1565. https://doi.org/10.1111/jgs.14846.
47. Oberai T, Lizarondo L, Ruurd J. Effectiveness of multi-component interventions on incidence of delirium in hospitalized older patients with hip fracture: a systematic review protocol. JBI Database Syst Rev Implement Rep. 2017;15(2):259-268. https://doi.org/10.11124/JBISRIR-2016-002943.
48. Collinsworth AW, Priest EL, Campbell CR, Vasilevskis EE, Masica AL. A review of multifaceted care approaches for the prevention and mitigation of delirium in intensive care units. J Intensive Care Med. 2016;31(2):127-141. https://doi.org/10.1177/0885066614553925.
49. Hshieh TT, Yue J, Oh E, et al. Effectiveness of multicomponent nonpharmacological
delirium interventions: a meta-analysis. JAMA Intern Med. 2015;175(4):512-520. https://doi.org/10.1001/jamainternmed.2014.7779.
© 2019 Society of Hospital Medicine