User login
Ultrasound Guidance for Lumbar Puncture: A Consideration, Not an Obligation
Recognizing the increasingly important role of point-of-care ultrasound (POCUS) in advancing clinical care, the Society of Hospital Medicine (SHM) has published a valuable series of position statements to guide hospitalists and administrators on the safe and effective use of POCUS.1 In this issue of the Journal of Hospital Medicine, Soni et al. present a series of consensus-based recommendations on ultrasound guidance for lumbar puncture (LP).2 Among these are the recommendations that ultrasound “should be used” to map the lumbar spine and to select an appropriate puncture site to reduce insertion attempts, reduce needle redirections, and increase overall procedural success.
At first glance, the recommendations appear definitive. However, not immediately obvious is the authors’ clarification that “This position statement does not mandate that hospitalists use ultrasound guidance for LP, nor does it establish ultrasound guidance as the standard of care for LP.” Even with the authors’ caveat, this nuance may not be readily apparent to the readers who review only the executive summary of the guidelines or who omit the context provided in the background of the position statement.
The directive language of this position statement may be a result of an unmerited amplification. The SHM POCUS Task Force employed the Research and Development Appropriateness Method to quantify the degree of consensus and the strength of the recommendation assigned,3 reaching “very good” consensus for each of the recommendations espoused in its position statement. Procedurally, this implies that ≥80% of the 27 voting members rated each published recommendation statement as “appropriate”. Using wording assigned a priori by the committee to each level of consensus, appropriateness became magnified to the declaration “should be used”. In this manner, the strength of the recommendations in this position statement is not necessarily based on the experts’ convictions related to ultrasound-guided LP, nor the strength of the supporting evidence.
In the case of ultrasound-guided LP, we might choose different descriptors than “appropriate” or “should be used”. The evidence base for ultrasound guidance for LP, though growing, may be insufficient as a foundation to a position statement and is certainly insufficient to create a new standard of care for hospitalists. Although the SHM POCUS Task Force completed a thoughtful literature review, no systematic approach (eg, GRADE methodology4) was used to rate the quality of evidence. Furthermore, the literature reviewed was drawn predominantly from anesthesia and emergency medicine sources—not readily generalizable to the hospitalist. Notably, these studies examined all neuraxial procedures (most commonly epidural and spinal anesthesia), which employ different techniques and tools than LP and are performed by clinicians with vastly different procedural training backgrounds than most hospitalists. Altogether, this creates the potential for a gap between true evidence quality and the strength of recommendation.
At a high level, although the technique for ultrasound mapping of the lumbar spine may be similar, the use of ultrasound has been less well studied specifically for LP. When considering LP alone, the available literature is inadequate to recommend uniform ultrasound guidance. A 2018 meta-analysis by Gottlieb et al. included 12 studies focusing only on LP, totaling N = 957 patients.5 This showed some favorability of ultrasound guidance, with a success rate of 90% using ultrasound, 81.4% with a landmark-based approach, and an odds ratio of 2.22 favoring ultrasound guidance (95% CI: 1.03-4.77). Unfortunately, when focusing only on adult patients, the advantage of POCUS diminished, with 91.4% success in the ultrasound group, 87.7% success in the landmark group, and a nonsignificant odds ratio of 2.10 (95% CI: 0.66-7.44).
Unequivocally, POCUS has established itself as a transformative technology for the guidance of invasive bedside procedures, bringing increased procedural success, improved safety, and decreased complication rates.6 For some procedures, particularly central venous catheterization, ultrasound guidance is a clear standard of care.7,8 For LP, the greatest benefit has been observed in patients with anticipated procedural challenges, most commonly obese patients in whom landmarks are not easily palpable.9 Moreover, the harms ultrasound seeks to prevent are substantially different. The primary risk of deferring ultrasound guidance for LP is most often a failed procedure, whereas for other common ultrasound-guided procedures, the harms may include significant vascular injury, pneumothorax, or bowel perforation. Differences in the relative harms make risk-benefit assessments harder to quantify and studies harder to carry out.
Sonographic guidance for LP has a role in clinical practice and should always be considered. However, at present, there exist no guidelines in any other specialty regarding the routine use of ultrasound-guided LP, including anesthesia, emergency medicine, neurology, or interventional radiology.10-15 As a result, a conservative interpretation of the POCUS Task Force’s findings would be to consider the use of ultrasound guidance for LP in patients where landmark identification is particularly challenging, but not to consider it a standard requirement for accreditation, training, or practice as of yet. Saying “more studies are required” can be a cop-out in some cases, but in this situation, the old adage does seem to apply.
We have great respect for the work of the SHM POCUS Task Force in advancing the use of POCUS in hospital medicine. Though ultrasound is not currently mandated as a care standard for the performance of LP, we all can agree that POCUS does confer advantages for this procedure, particularly in a well-selected patient population. To continue to provide care of the highest quality, hospitalists must be encouraged to elevate their practice with POCUS and be supported with the equipment, training, credentialing, and quality assurance structures necessary to integrate bedside ultrasound safely and effectively into their diagnostic and procedural practice.
Disclosures
No conflicts of interest to disclose.
Funding
None.
1. Soni NJ, Schnobrich D, Matthews BK, et al. Point-of-care ultrasound for hospitalists: a position statement of the society of hospital medicine [published online ahead of print June 10, 2019]. J Hosp Med. 2019;14(10):591-601. https://doi.org/10.12788/jhm.3079.
2. Soni NJ, Franco-Sadud R, Dobaidze K, et al. Recommendations on the use of ultrasound guidance for adult lumbar puncture: a position statement of the society of hospital medicine. J Hosp Med. 2018;13(2):126-135. https://doi.org/10.12788/jhm.2940.
3. Fitch, K, Bernstein SJ, Aguilar MD et al. The RAND/UCLA appropriateness method user’s manual. Santa Monica, CA: RAND Corporation, 2001.
4. Guyatt GH, Oxman AD, Vist GE, et al. GRADE: An emerging consensus on rating quality of evidence and strength of recommendations. BMJ. 2008;334(7650):924-926. PubMed
5. Gottlieb M, Holladay D, Peksa GD. Ultrasound-assisted lumbar punctures: a systematic review and meta-analysis. Acad Emerg Med. 2019;26(1):85-96. https://doi.org/10.1111/acem.13558.
6. Moore CL, Copel JA. Point of care ultrasonography. N Engl J Med. 2011;364(8):749-757. https://doi.org/10.1056/NEJMra0909487.
7. Shojania K, Duncan B, McDonald K, Wachter RM. Making health care safer: a critical analysis of patient safety practices. Rockville, MD: Agency for Healthcare Research and Quality, 2001. Evidence Report/Technology Assessment No. 43; AHRQ publication 01-E058. PubMed
8. Brass P, Hellmich M, Kolodziej L, Schick G, Smith AF. Ultrasound guidance versus anatomical landmarks for internal jugular vein catherization. Cochrane Database Syst Rev. 2015;Art. No.: 1:CD006962. https://doi.org/10.1002/14651858.CD006962.pub2.
9. Peterson MA, Pisupati D, Heyming TW, Abele JA, Lewis RJ. Ultrasound for routine lumbar puncture. Acad Emerg Med. 2014;21(2):130-136. https://doi.org/10.1111/acem.12305.
10. American College of Emergency Physicians. Ultrasound guidelines: emergency, point-of-care, and clinical ultrasound guidelines in medicine. Ann Emerg Med. 2017;69(5):e27-e54. https://doi.org/10.1016/j.annemergmed.2016.08.457.
11. Neal JM, Brull R, Horn JL, et al. The Second American Society of Regional Anesthesia and Pain Medicine Evidence-Based Medicine Assessment of Ultrasound-Guided Regional Anesthesia: executive summary. Reg Anesth Pain Med. 2016;41(2):181-194. doi: 10.1097/AAP.0000000000000331.
12. Practice guidelines for obstetric anesthesia: an updated report by the American Society of Anesthesiologists Task Force on Obstetric Anesthesia and the Society for Obstetric Anesthesia and Perinatology. Anesthesiology. 2016;124(2):270-300. doi: 10.1097/ALN.0000000000000935.
13. Engelborghs S, Sebastiaan E, Struyfs H, et al. Consensus guidelines for lumbar puncture in patients with neurological diseases. Alzheimers Dement. 2017;8:111-126. doi: 10.1016/j.dadm.2017.04.007.
14. American College of Radiology. ACR-SPR-SRU Practice Parameter for the Performing and Interpreting Diagnostic Ultrasound Examinations. 2017; Available at https://www.acr.org/-/media/ACR/Files/Practice-Parameters/us-perf-interpret.pdf. Accessed April 15, 2019.
15. American College of Radiology. ACR-AIUM-SPR-SRU Practice Parameter for the Performance of an Ultrasound Examination of the Neonatal and Infant Spine. 2016/ Available at https://www.acr.org/-/media/ACR/Files/Practice-Parameters/US-NeonatalSpine.pdf. Accessed April 15, 2019.
Recognizing the increasingly important role of point-of-care ultrasound (POCUS) in advancing clinical care, the Society of Hospital Medicine (SHM) has published a valuable series of position statements to guide hospitalists and administrators on the safe and effective use of POCUS.1 In this issue of the Journal of Hospital Medicine, Soni et al. present a series of consensus-based recommendations on ultrasound guidance for lumbar puncture (LP).2 Among these are the recommendations that ultrasound “should be used” to map the lumbar spine and to select an appropriate puncture site to reduce insertion attempts, reduce needle redirections, and increase overall procedural success.
At first glance, the recommendations appear definitive. However, not immediately obvious is the authors’ clarification that “This position statement does not mandate that hospitalists use ultrasound guidance for LP, nor does it establish ultrasound guidance as the standard of care for LP.” Even with the authors’ caveat, this nuance may not be readily apparent to the readers who review only the executive summary of the guidelines or who omit the context provided in the background of the position statement.
The directive language of this position statement may be a result of an unmerited amplification. The SHM POCUS Task Force employed the Research and Development Appropriateness Method to quantify the degree of consensus and the strength of the recommendation assigned,3 reaching “very good” consensus for each of the recommendations espoused in its position statement. Procedurally, this implies that ≥80% of the 27 voting members rated each published recommendation statement as “appropriate”. Using wording assigned a priori by the committee to each level of consensus, appropriateness became magnified to the declaration “should be used”. In this manner, the strength of the recommendations in this position statement is not necessarily based on the experts’ convictions related to ultrasound-guided LP, nor the strength of the supporting evidence.
In the case of ultrasound-guided LP, we might choose different descriptors than “appropriate” or “should be used”. The evidence base for ultrasound guidance for LP, though growing, may be insufficient as a foundation to a position statement and is certainly insufficient to create a new standard of care for hospitalists. Although the SHM POCUS Task Force completed a thoughtful literature review, no systematic approach (eg, GRADE methodology4) was used to rate the quality of evidence. Furthermore, the literature reviewed was drawn predominantly from anesthesia and emergency medicine sources—not readily generalizable to the hospitalist. Notably, these studies examined all neuraxial procedures (most commonly epidural and spinal anesthesia), which employ different techniques and tools than LP and are performed by clinicians with vastly different procedural training backgrounds than most hospitalists. Altogether, this creates the potential for a gap between true evidence quality and the strength of recommendation.
At a high level, although the technique for ultrasound mapping of the lumbar spine may be similar, the use of ultrasound has been less well studied specifically for LP. When considering LP alone, the available literature is inadequate to recommend uniform ultrasound guidance. A 2018 meta-analysis by Gottlieb et al. included 12 studies focusing only on LP, totaling N = 957 patients.5 This showed some favorability of ultrasound guidance, with a success rate of 90% using ultrasound, 81.4% with a landmark-based approach, and an odds ratio of 2.22 favoring ultrasound guidance (95% CI: 1.03-4.77). Unfortunately, when focusing only on adult patients, the advantage of POCUS diminished, with 91.4% success in the ultrasound group, 87.7% success in the landmark group, and a nonsignificant odds ratio of 2.10 (95% CI: 0.66-7.44).
Unequivocally, POCUS has established itself as a transformative technology for the guidance of invasive bedside procedures, bringing increased procedural success, improved safety, and decreased complication rates.6 For some procedures, particularly central venous catheterization, ultrasound guidance is a clear standard of care.7,8 For LP, the greatest benefit has been observed in patients with anticipated procedural challenges, most commonly obese patients in whom landmarks are not easily palpable.9 Moreover, the harms ultrasound seeks to prevent are substantially different. The primary risk of deferring ultrasound guidance for LP is most often a failed procedure, whereas for other common ultrasound-guided procedures, the harms may include significant vascular injury, pneumothorax, or bowel perforation. Differences in the relative harms make risk-benefit assessments harder to quantify and studies harder to carry out.
Sonographic guidance for LP has a role in clinical practice and should always be considered. However, at present, there exist no guidelines in any other specialty regarding the routine use of ultrasound-guided LP, including anesthesia, emergency medicine, neurology, or interventional radiology.10-15 As a result, a conservative interpretation of the POCUS Task Force’s findings would be to consider the use of ultrasound guidance for LP in patients where landmark identification is particularly challenging, but not to consider it a standard requirement for accreditation, training, or practice as of yet. Saying “more studies are required” can be a cop-out in some cases, but in this situation, the old adage does seem to apply.
We have great respect for the work of the SHM POCUS Task Force in advancing the use of POCUS in hospital medicine. Though ultrasound is not currently mandated as a care standard for the performance of LP, we all can agree that POCUS does confer advantages for this procedure, particularly in a well-selected patient population. To continue to provide care of the highest quality, hospitalists must be encouraged to elevate their practice with POCUS and be supported with the equipment, training, credentialing, and quality assurance structures necessary to integrate bedside ultrasound safely and effectively into their diagnostic and procedural practice.
Disclosures
No conflicts of interest to disclose.
Funding
None.
1. Soni NJ, Schnobrich D, Matthews BK, et al. Point-of-care ultrasound for hospitalists: a position statement of the society of hospital medicine [published online ahead of print June 10, 2019]. J Hosp Med. 2019;14(10):591-601. https://doi.org/10.12788/jhm.3079.
2. Soni NJ, Franco-Sadud R, Dobaidze K, et al. Recommendations on the use of ultrasound guidance for adult lumbar puncture: a position statement of the society of hospital medicine. J Hosp Med. 2018;13(2):126-135. https://doi.org/10.12788/jhm.2940.
3. Fitch, K, Bernstein SJ, Aguilar MD et al. The RAND/UCLA appropriateness method user’s manual. Santa Monica, CA: RAND Corporation, 2001.
4. Guyatt GH, Oxman AD, Vist GE, et al. GRADE: An emerging consensus on rating quality of evidence and strength of recommendations. BMJ. 2008;334(7650):924-926. PubMed
5. Gottlieb M, Holladay D, Peksa GD. Ultrasound-assisted lumbar punctures: a systematic review and meta-analysis. Acad Emerg Med. 2019;26(1):85-96. https://doi.org/10.1111/acem.13558.
6. Moore CL, Copel JA. Point of care ultrasonography. N Engl J Med. 2011;364(8):749-757. https://doi.org/10.1056/NEJMra0909487.
7. Shojania K, Duncan B, McDonald K, Wachter RM. Making health care safer: a critical analysis of patient safety practices. Rockville, MD: Agency for Healthcare Research and Quality, 2001. Evidence Report/Technology Assessment No. 43; AHRQ publication 01-E058. PubMed
8. Brass P, Hellmich M, Kolodziej L, Schick G, Smith AF. Ultrasound guidance versus anatomical landmarks for internal jugular vein catherization. Cochrane Database Syst Rev. 2015;Art. No.: 1:CD006962. https://doi.org/10.1002/14651858.CD006962.pub2.
9. Peterson MA, Pisupati D, Heyming TW, Abele JA, Lewis RJ. Ultrasound for routine lumbar puncture. Acad Emerg Med. 2014;21(2):130-136. https://doi.org/10.1111/acem.12305.
10. American College of Emergency Physicians. Ultrasound guidelines: emergency, point-of-care, and clinical ultrasound guidelines in medicine. Ann Emerg Med. 2017;69(5):e27-e54. https://doi.org/10.1016/j.annemergmed.2016.08.457.
11. Neal JM, Brull R, Horn JL, et al. The Second American Society of Regional Anesthesia and Pain Medicine Evidence-Based Medicine Assessment of Ultrasound-Guided Regional Anesthesia: executive summary. Reg Anesth Pain Med. 2016;41(2):181-194. doi: 10.1097/AAP.0000000000000331.
12. Practice guidelines for obstetric anesthesia: an updated report by the American Society of Anesthesiologists Task Force on Obstetric Anesthesia and the Society for Obstetric Anesthesia and Perinatology. Anesthesiology. 2016;124(2):270-300. doi: 10.1097/ALN.0000000000000935.
13. Engelborghs S, Sebastiaan E, Struyfs H, et al. Consensus guidelines for lumbar puncture in patients with neurological diseases. Alzheimers Dement. 2017;8:111-126. doi: 10.1016/j.dadm.2017.04.007.
14. American College of Radiology. ACR-SPR-SRU Practice Parameter for the Performing and Interpreting Diagnostic Ultrasound Examinations. 2017; Available at https://www.acr.org/-/media/ACR/Files/Practice-Parameters/us-perf-interpret.pdf. Accessed April 15, 2019.
15. American College of Radiology. ACR-AIUM-SPR-SRU Practice Parameter for the Performance of an Ultrasound Examination of the Neonatal and Infant Spine. 2016/ Available at https://www.acr.org/-/media/ACR/Files/Practice-Parameters/US-NeonatalSpine.pdf. Accessed April 15, 2019.
© 2019 Society of Hospital Medicine
Improving Respiratory Rate Accuracy in the Hospital: A Quality Improvement Initiative
Respiratory rate (RR) is an essential vital sign that is routinely measured for hospitalized adults. It is a strong predictor of adverse events.1,2 Therefore, RR is a key component of several widely used risk prediction scores, including the systemic inflammatory response syndrome (SIRS).3
Despite its clinical utility, RR is inaccurately measured.4-7 One reason for the inaccurate measurement of RR is that RR measurement, in contrast to that of other vital signs, is not automated. The gold-standard technique for measuring RR is the visual assessment of a resting patient. Thus, RR measurement is perceived as time-consuming. Clinical staff instead frequently approximate RR through brief observation.8-11
Given its clinical importance and widespread inaccuracy, we conducted a quality improvement (QI) initiative to improve RR accuracy.
METHODS
Design and Setting
We conducted an interdisciplinary QI initiative by using the plan–do–study–act (PDSA) methodology from July 2017 to February 2018. The initiative was set in a single adult 28-bed medical inpatient unit of a large, urban, safety-net hospital consisting of general internal medicine and hematology/oncology patients. Routine vital sign measurements on this unit occur at four- or six-hour intervals per physician orders and are performed by patient-care assistants (PCAs) who are nonregistered nursing support staff. PCAs use a vital signs cart equipped with automated tools to measure vital signs except for RR, which is manually assessed. PCAs are trained on vital sign measurements during a two-day onboarding orientation and four to six weeks of on-the-job training by experienced PCAs. PCAs are directly supervised by nursing operations managers. Formal continuing education programs for PCAs or performance audits of their clinical duties did not exist prior to our QI initiative.
Intervention
Intervention development addressing several important barriers and workflow inefficiencies was based on the direct observation of PCA workflow and information gathering by engaging stakeholders, including PCAs, nursing operations management, nursing leadership, and hospital administration (PDSA cycles 1-7 in Table). Our modified PCA vital sign workflow incorporated RR measurement during the approximate 30 seconds needed to complete automated blood pressure measurement as previously described.12 Nursing administration purchased three stopwatches (each $5 US) to attach to vital signs carts. One investigator (NK) participated in two monthly one-hour meetings, and three investigators (NK, KB, and SD) participated in 19 daily 15-minute huddles to conduct stakeholder engagement and educate and retrain PCAs on proper technique (total of 6.75 hours).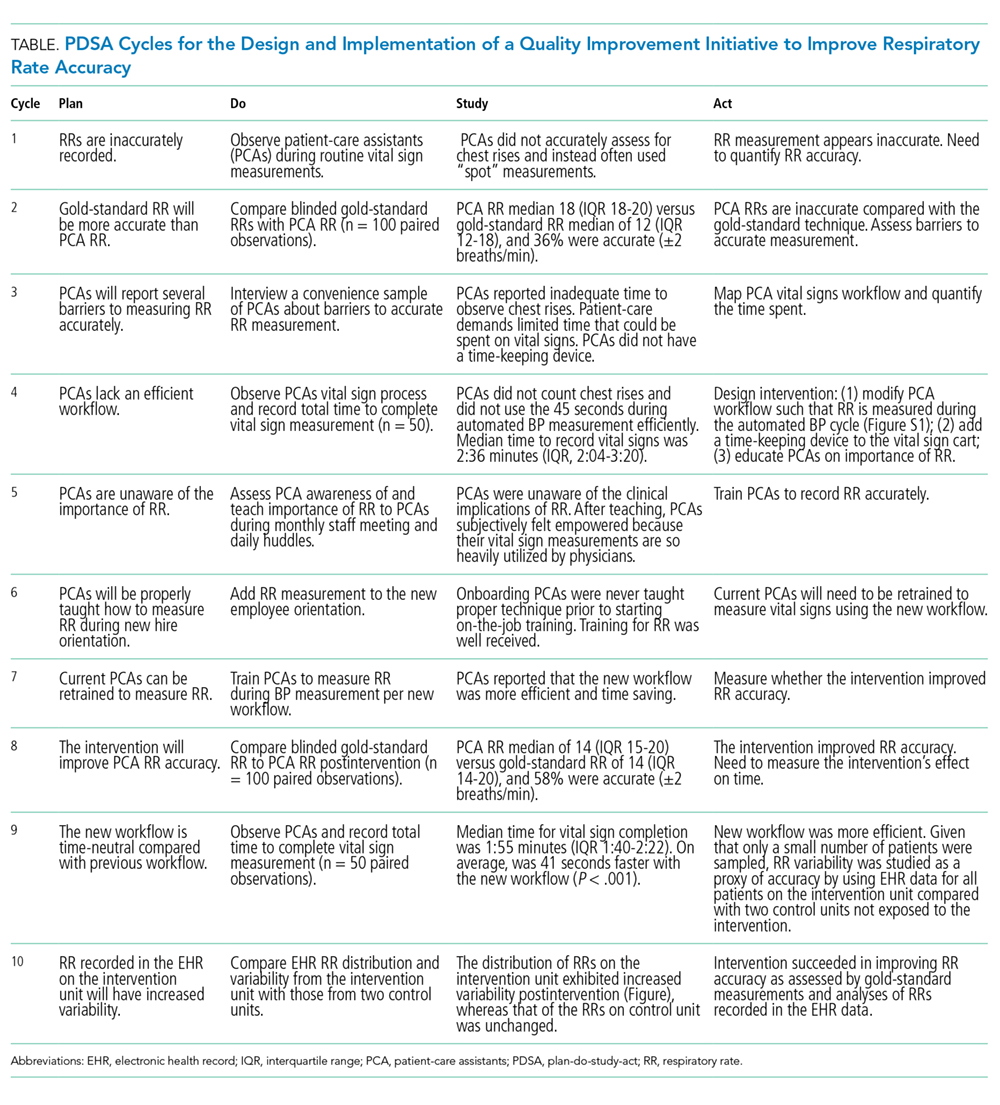
Evaluation
The primary aim of this QI initiative was to improve RR accuracy, which was evaluated using two distinct but complementary analyses: the prospective comparison of PCA-recorded RRs with gold-standard recorded RRs and the retrospective comparison of RRs recorded in electronic health records (EHR) on the intervention unit versus two control units. The secondary aims were to examine time to complete vital sign measurement and to assess whether the intervention was associated with a reduction in the incidence of SIRS specifically due to tachypnea.
Respiratory Rate Accuracy
PCA-recorded RRs were considered accurate if the RR was within ±2 breaths of a gold-standard RR measurement performed by a trained study member (NK or KB). We conducted gold-standard RR measurements for 100 observations pre- and postintervention within 30 minutes of PCA measurement to avoid Hawthorne bias.
We assessed the variability of recorded RRs in the EHR for all patients in the intervention unit as a proxy for accuracy. We hypothesized on the basis of prior research that improving the accuracy of RR measurement would increase the variability and normality of distribution in RRs.13 This is an approach that we have employed previously.7 The EHR cohort included consecutive hospitalizations by patients who were admitted to either the intervention unit or to one of two nonintervention general medicine inpatient units that served as concurrent controls. We grouped hospitalizations into a preintervention phase from March 1, 2017-July 22, 2017, a planning phase from July 23, 2017-December 3, 2017, and a postintervention phase from December 21, 2017-February 28, 2018. Hospitalizations during the two-week teaching phase from December 3, 2017-December 21, 2017 were excluded. We excluded vital signs obtained in the emergency department or in a location different from the patient’s admission unit. We qualitatively assessed RR distribution using histograms as we have done previously.7
We examined the distributions of RRs recorded in the EHR before and after intervention by individual PCAs on the intervention floor to assess for fidelity and adherence in the PCA uptake of the intervention.
Time
We compared the time to complete vital sign measurement among convenience samples of 50 unique observations pre- and postintervention using the Wilcoxon rank sum test.
SIRS Incidence
Since we hypothesized that improved RR accuracy would reduce falsely elevated RRs but have no impact on the other three SIRS criteria, we assessed changes in tachypnea-specific SIRS incidence, which was defined a priori as the presence of exactly two concurrent SIRS criteria, one of which was an elevated RR.3 We examined changes using a difference-in-differences approach with three different units of analysis (per vital sign measurement, hospital-day, and hospitalization; see footnote for Appendix Table 1 for methodological details. All analyses were conducted using STATA 12.0 (StataCorp, College Station, Texas).
RESULTS
Respiratory Rate Accuracy
Prior to the intervention, the median PCA RR was 18 (IQR 18-20) versus 12 (IQR 12-18) for the gold-standard RR (Appendix Figure 1), with only 36% of PCA measurements considered accurate. After the intervention, the median PCA-recorded RR was 14 (IQR 15-20) versus 14 (IQR 14-20) for the gold-standard RR and a RR accuracy of 58% (P < .001).
For our analyses on RR distribution using EHR data, we included 143,447 unique RRs (Appendix Table 2). After the intervention, the normality of the distribution of RRs on the intervention unit had increased, whereas those of RRs on the control units remained qualitatively similar pre- and postintervention (Appendix Figure 2).
Notable differences existed among the 11 individual PCAs (Figure) despite observing increased variability in PCA-recorded RRs postintervention. Some PCAs (numbers 2, 7, and 10) shifted their narrow RR interquartile range lower by several breaths/minute, whereas most other PCAs had a reduced median RR and widened interquartile range.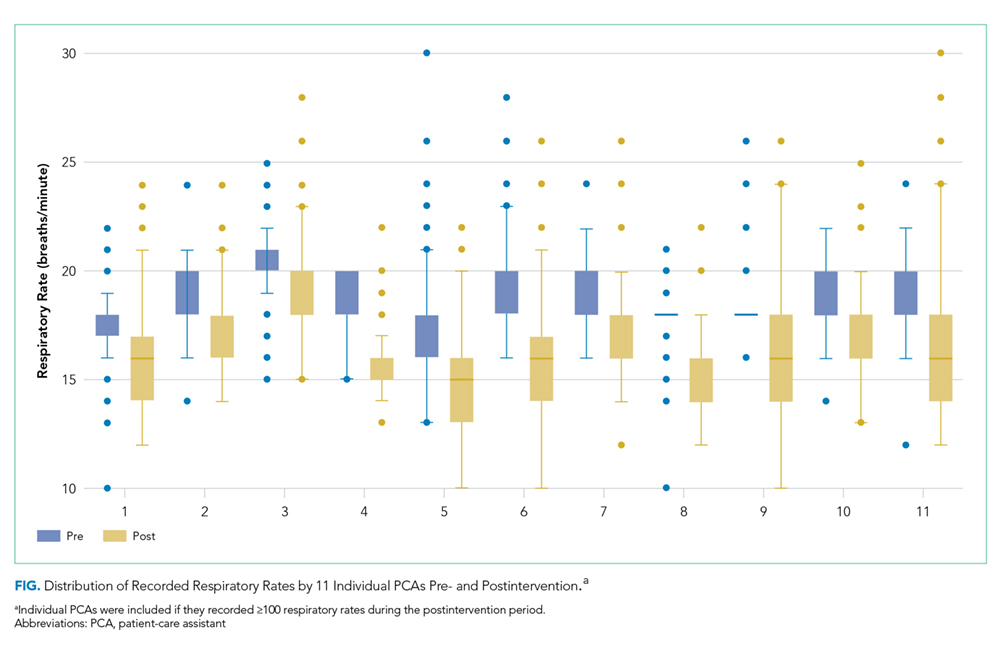
Time
Before the intervention, the median time to complete vital sign measurements was 2:36 (IQR 2:04-3:20). After the intervention, the time to complete vital signs decreased to 1:55 (IQR, 1:40-2:22; P < .001), which was 41 less seconds on average per vital sign set.
SIRS Incidence
The intervention was associated with a 3.3% reduction (95% CI, –6.4% to –0.005%) in tachypnea-specific SIRS incidence per hospital-day and a 7.8% reduction (95% CI, –13.5% to –2.2%) per hospitalization (Appendix Table 1). We also observed a modest reduction in overall SIRS incidence after the intervention (2.9% less per vital sign check, 4.6% less per hospital-day, and 3.2% less per hospitalization), although these reductions were not statistically significant.
DISCUSSION
Our QI initiative improved the absolute RR accuracy by 22%, saved PCAs 41 seconds on average per vital sign measurement, and decreased the absolute proportion of hospitalizations with tachypnea-specific SIRS by 7.8%. Our intervention is a novel, interdisciplinary, low-cost, low-effort, low-tech approach that addressed known challenges to accurate RR measurement,8,9,11 as well as the key barriers identified in our initial PDSA cycles. Our approach includes adding a time-keeping device to vital sign carts and standardizing a PCA vital sign workflow with increased efficiency. Lastly, this intervention is potentially scalable because stakeholder engagement, education, and retraining of the entire PCA staff for the unit required only 6.75 hours.
While our primary goal was to improve RR accuracy, our QI initiative also improved vital sign efficiency. By extrapolating our findings to an eight-hour PCA shift caring for eight patients who require vital sign checks every four hours, we estimated that our intervention would save approximately 16:24 minutes per PCA shift. This newfound time could be repurposed for other patient-care tasks or could be spent ensuring the accuracy of other vital signs given that accurate monitoring may be neglected because of time constraints.11 Additionally, the improvement in RR accuracy reduced falsely elevated RRs and thus lowered SIRS incidence specifically due to tachypnea. Given that EHR-based sepsis alerts are often based on SIRS criteria, improved RR accuracy may also improve alarm fatigue by reducing the rate of false-positive alerts.14
This initiative is not without limitations. Generalizability to other hospitals and even other units within the same hospital is uncertain. However, because this initiative was conducted within a safety-net hospital, we anticipate at least similar, if not increased, success in better-resourced hospitals. Second, the long-term durability of our intervention is unclear, although EHR RR variability remained steady for two months after our intervention (data not shown).
To ensure long-term sustainability and further improve RR accuracy, future PDSA cycles could include electing a PCA “vital signs champion” to reiterate the importance of RRs in clinical decision-making and ensure adherence to the modified workflow. Nursing champions act as persuasive change agents that disseminate and implement healthcare change,15 which may also be true of PCA champions. Additionally, future PDSA cycles can obviate the need for labor-intensive manual audits by leveraging EHR-based auditing to target education and retraining interventions to PCAs with minimal RR variability to optimize workflow adherence.
In conclusion, through a multipronged QI initiative we improved RR accuracy, increased the efficiency of vital sign measurement, and decreased SIRS incidence specifically due to tachypnea by reducing the number of falsely elevated RRs. This novel, low-cost, low-effort, low-tech approach can readily be implemented and disseminated in hospital inpatient settings.
Acknowledgments
The authors would like to acknowledge the meaningful contributions of Mr. Sudarshaan Pathak, RN, Ms. Shirly Koduvathu, RN, and Ms. Judy Herrington MSN, RN in this multidisciplinary initiative. We thank Mr. Christopher McKintosh, RN for his support in data acquisition. Lastly, the authors would like to acknowledge all of the patient-care assistants involved in this QI initiative.
Disclosures
Dr. Makam reports grants from NIA/NIH, during the conduct of the study. All other authors have nothing to disclose.
Funding
This work is supported in part by the Agency for Healthcare Research and Quality-funded UT Southwestern Center for Patient-Centered Outcomes Research (R24HS022418). OKN is funded by the National Heart, Lung, and Blood Institute (K23HL133441), and ANM is funded by the National Institute on Aging (K23AG052603).
1. Fieselmann JF, Hendryx MS, Helms CM, Wakefield DS. Respiratory rate predicts cardiopulmonary arrest for internal medicine inpatients. J Gen Intern Med. 1993;8(7):354-360. https://doi.org/10.1007/BF02600071.
2. Hodgetts TJ, Kenward G, Vlachonikolis IG, Payne S, Castle N. The identification of risk factors for cardiac arrest and formulation of activation criteria to alert a medical emergency team. Resuscitation. 2002;54(2):125-131. https://doi.org/10.1016/S0300-9572(02)00100-4.
3. Bone RC, Sibbald WJ, Sprung CL. The ACCP-SCCM consensus conference on sepsis and organ failure. Chest. 1992;101(6):1481-1483.
4. Lovett PB, Buchwald JM, Sturmann K, Bijur P. The vexatious vital: neither clinical measurements by nurses nor an electronic monitor provides accurate measurements of respiratory rate in triage. Ann Emerg Med. 2005;45(1):68-76. https://doi.org/10.1016/j.annemergmed.2004.06.016.
5. Chen J, Hillman K, Bellomo R, et al. The impact of introducing medical emergency team system on the documentations of vital signs. Resuscitation. 2009;80(1):35-43. https://doi.org/10.1016/j.resuscitation.2008.10.009.
6. Leuvan CH, Mitchell I. Missed opportunities? An observational study of vital sign measurements. Crit Care Resusc. 2008;10(2):111-115.
7. Badawy J, Nguyen OK, Clark C, Halm EA, Makam AN. Is everyone really breathing 20 times a minute? Assessing epidemiology and variation in recorded respiratory rate in hospitalised adults. BMJ Qual Saf. 2017;26(10):832-836. https://doi.org/10.1136/bmjqs-2017-006671.
8. Chua WL, Mackey S, Ng EK, Liaw SY. Front line nurses’ experiences with deteriorating ward patients: a qualitative study. Int Nurs Rev. 2013;60(4):501-509. https://doi.org/10.1111/inr.12061.
9. De Meester K, Van Bogaert P, Clarke SP, Bossaert L. In-hospital mortality after serious adverse events on medical and surgical nursing units: a mixed methods study. J Clin Nurs. 2013;22(15-16):2308-2317. https://doi.org/10.1111/j.1365-2702.2012.04154.x.
10. Cheng AC, Black JF, Buising KL. Respiratory rate: the neglected vital sign. Med J Aust. 2008;189(9):531. https://doi.org/10.5694/j.1326-5377.2008.tb02163.x.
11. Mok W, Wang W, Cooper S, Ang EN, Liaw SY. Attitudes towards vital signs monitoring in the detection of clinical deterioration: scale development and survey of ward nurses. Int J Qual Health Care. 2015;27(3):207-213. https://doi.org/10.1093/intqhc/mzv019.
12. Keshvani N, Berger K, Nguyen OK, Makam AN. Roadmap for improving the accuracy of respiratory rate measurements. BMJ Qual Saf. 2018;27(8):e5. https://doi.org/10.1136/bmjqs-2017-007516.
13. Semler MW, Stover DG, Copland AP, et al. Flash mob research: a single-day, multicenter, resident-directed study of respiratory rate. Chest. 2013;143(6):1740-1744. https://doi.org/10.1378/chest.12-1837.
14. Makam AN, Nguyen OK, Auerbach AD. Diagnostic accuracy and effectiveness of automated electronic sepsis alert systems: a systematic review. J Hosp Med. 2015;10(6):396-402. https://doi.org/10.1002/jhm.2347.
15. Ploeg J, Skelly J, Rowan M, et al. The role of nursing best practice champions in diffusing practice guidelines: a mixed methods study. Worldviews Evid Based Nurs. 2010;7(4):238-251. https://doi.org/10.1111/j.1741-6787.2010.00202.x.
Respiratory rate (RR) is an essential vital sign that is routinely measured for hospitalized adults. It is a strong predictor of adverse events.1,2 Therefore, RR is a key component of several widely used risk prediction scores, including the systemic inflammatory response syndrome (SIRS).3
Despite its clinical utility, RR is inaccurately measured.4-7 One reason for the inaccurate measurement of RR is that RR measurement, in contrast to that of other vital signs, is not automated. The gold-standard technique for measuring RR is the visual assessment of a resting patient. Thus, RR measurement is perceived as time-consuming. Clinical staff instead frequently approximate RR through brief observation.8-11
Given its clinical importance and widespread inaccuracy, we conducted a quality improvement (QI) initiative to improve RR accuracy.
METHODS
Design and Setting
We conducted an interdisciplinary QI initiative by using the plan–do–study–act (PDSA) methodology from July 2017 to February 2018. The initiative was set in a single adult 28-bed medical inpatient unit of a large, urban, safety-net hospital consisting of general internal medicine and hematology/oncology patients. Routine vital sign measurements on this unit occur at four- or six-hour intervals per physician orders and are performed by patient-care assistants (PCAs) who are nonregistered nursing support staff. PCAs use a vital signs cart equipped with automated tools to measure vital signs except for RR, which is manually assessed. PCAs are trained on vital sign measurements during a two-day onboarding orientation and four to six weeks of on-the-job training by experienced PCAs. PCAs are directly supervised by nursing operations managers. Formal continuing education programs for PCAs or performance audits of their clinical duties did not exist prior to our QI initiative.
Intervention
Intervention development addressing several important barriers and workflow inefficiencies was based on the direct observation of PCA workflow and information gathering by engaging stakeholders, including PCAs, nursing operations management, nursing leadership, and hospital administration (PDSA cycles 1-7 in Table). Our modified PCA vital sign workflow incorporated RR measurement during the approximate 30 seconds needed to complete automated blood pressure measurement as previously described.12 Nursing administration purchased three stopwatches (each $5 US) to attach to vital signs carts. One investigator (NK) participated in two monthly one-hour meetings, and three investigators (NK, KB, and SD) participated in 19 daily 15-minute huddles to conduct stakeholder engagement and educate and retrain PCAs on proper technique (total of 6.75 hours).
Evaluation
The primary aim of this QI initiative was to improve RR accuracy, which was evaluated using two distinct but complementary analyses: the prospective comparison of PCA-recorded RRs with gold-standard recorded RRs and the retrospective comparison of RRs recorded in electronic health records (EHR) on the intervention unit versus two control units. The secondary aims were to examine time to complete vital sign measurement and to assess whether the intervention was associated with a reduction in the incidence of SIRS specifically due to tachypnea.
Respiratory Rate Accuracy
PCA-recorded RRs were considered accurate if the RR was within ±2 breaths of a gold-standard RR measurement performed by a trained study member (NK or KB). We conducted gold-standard RR measurements for 100 observations pre- and postintervention within 30 minutes of PCA measurement to avoid Hawthorne bias.
We assessed the variability of recorded RRs in the EHR for all patients in the intervention unit as a proxy for accuracy. We hypothesized on the basis of prior research that improving the accuracy of RR measurement would increase the variability and normality of distribution in RRs.13 This is an approach that we have employed previously.7 The EHR cohort included consecutive hospitalizations by patients who were admitted to either the intervention unit or to one of two nonintervention general medicine inpatient units that served as concurrent controls. We grouped hospitalizations into a preintervention phase from March 1, 2017-July 22, 2017, a planning phase from July 23, 2017-December 3, 2017, and a postintervention phase from December 21, 2017-February 28, 2018. Hospitalizations during the two-week teaching phase from December 3, 2017-December 21, 2017 were excluded. We excluded vital signs obtained in the emergency department or in a location different from the patient’s admission unit. We qualitatively assessed RR distribution using histograms as we have done previously.7
We examined the distributions of RRs recorded in the EHR before and after intervention by individual PCAs on the intervention floor to assess for fidelity and adherence in the PCA uptake of the intervention.
Time
We compared the time to complete vital sign measurement among convenience samples of 50 unique observations pre- and postintervention using the Wilcoxon rank sum test.
SIRS Incidence
Since we hypothesized that improved RR accuracy would reduce falsely elevated RRs but have no impact on the other three SIRS criteria, we assessed changes in tachypnea-specific SIRS incidence, which was defined a priori as the presence of exactly two concurrent SIRS criteria, one of which was an elevated RR.3 We examined changes using a difference-in-differences approach with three different units of analysis (per vital sign measurement, hospital-day, and hospitalization; see footnote for Appendix Table 1 for methodological details. All analyses were conducted using STATA 12.0 (StataCorp, College Station, Texas).
RESULTS
Respiratory Rate Accuracy
Prior to the intervention, the median PCA RR was 18 (IQR 18-20) versus 12 (IQR 12-18) for the gold-standard RR (Appendix Figure 1), with only 36% of PCA measurements considered accurate. After the intervention, the median PCA-recorded RR was 14 (IQR 15-20) versus 14 (IQR 14-20) for the gold-standard RR and a RR accuracy of 58% (P < .001).
For our analyses on RR distribution using EHR data, we included 143,447 unique RRs (Appendix Table 2). After the intervention, the normality of the distribution of RRs on the intervention unit had increased, whereas those of RRs on the control units remained qualitatively similar pre- and postintervention (Appendix Figure 2).
Notable differences existed among the 11 individual PCAs (Figure) despite observing increased variability in PCA-recorded RRs postintervention. Some PCAs (numbers 2, 7, and 10) shifted their narrow RR interquartile range lower by several breaths/minute, whereas most other PCAs had a reduced median RR and widened interquartile range.
Time
Before the intervention, the median time to complete vital sign measurements was 2:36 (IQR 2:04-3:20). After the intervention, the time to complete vital signs decreased to 1:55 (IQR, 1:40-2:22; P < .001), which was 41 less seconds on average per vital sign set.
SIRS Incidence
The intervention was associated with a 3.3% reduction (95% CI, –6.4% to –0.005%) in tachypnea-specific SIRS incidence per hospital-day and a 7.8% reduction (95% CI, –13.5% to –2.2%) per hospitalization (Appendix Table 1). We also observed a modest reduction in overall SIRS incidence after the intervention (2.9% less per vital sign check, 4.6% less per hospital-day, and 3.2% less per hospitalization), although these reductions were not statistically significant.
DISCUSSION
Our QI initiative improved the absolute RR accuracy by 22%, saved PCAs 41 seconds on average per vital sign measurement, and decreased the absolute proportion of hospitalizations with tachypnea-specific SIRS by 7.8%. Our intervention is a novel, interdisciplinary, low-cost, low-effort, low-tech approach that addressed known challenges to accurate RR measurement,8,9,11 as well as the key barriers identified in our initial PDSA cycles. Our approach includes adding a time-keeping device to vital sign carts and standardizing a PCA vital sign workflow with increased efficiency. Lastly, this intervention is potentially scalable because stakeholder engagement, education, and retraining of the entire PCA staff for the unit required only 6.75 hours.
While our primary goal was to improve RR accuracy, our QI initiative also improved vital sign efficiency. By extrapolating our findings to an eight-hour PCA shift caring for eight patients who require vital sign checks every four hours, we estimated that our intervention would save approximately 16:24 minutes per PCA shift. This newfound time could be repurposed for other patient-care tasks or could be spent ensuring the accuracy of other vital signs given that accurate monitoring may be neglected because of time constraints.11 Additionally, the improvement in RR accuracy reduced falsely elevated RRs and thus lowered SIRS incidence specifically due to tachypnea. Given that EHR-based sepsis alerts are often based on SIRS criteria, improved RR accuracy may also improve alarm fatigue by reducing the rate of false-positive alerts.14
This initiative is not without limitations. Generalizability to other hospitals and even other units within the same hospital is uncertain. However, because this initiative was conducted within a safety-net hospital, we anticipate at least similar, if not increased, success in better-resourced hospitals. Second, the long-term durability of our intervention is unclear, although EHR RR variability remained steady for two months after our intervention (data not shown).
To ensure long-term sustainability and further improve RR accuracy, future PDSA cycles could include electing a PCA “vital signs champion” to reiterate the importance of RRs in clinical decision-making and ensure adherence to the modified workflow. Nursing champions act as persuasive change agents that disseminate and implement healthcare change,15 which may also be true of PCA champions. Additionally, future PDSA cycles can obviate the need for labor-intensive manual audits by leveraging EHR-based auditing to target education and retraining interventions to PCAs with minimal RR variability to optimize workflow adherence.
In conclusion, through a multipronged QI initiative we improved RR accuracy, increased the efficiency of vital sign measurement, and decreased SIRS incidence specifically due to tachypnea by reducing the number of falsely elevated RRs. This novel, low-cost, low-effort, low-tech approach can readily be implemented and disseminated in hospital inpatient settings.
Acknowledgments
The authors would like to acknowledge the meaningful contributions of Mr. Sudarshaan Pathak, RN, Ms. Shirly Koduvathu, RN, and Ms. Judy Herrington MSN, RN in this multidisciplinary initiative. We thank Mr. Christopher McKintosh, RN for his support in data acquisition. Lastly, the authors would like to acknowledge all of the patient-care assistants involved in this QI initiative.
Disclosures
Dr. Makam reports grants from NIA/NIH, during the conduct of the study. All other authors have nothing to disclose.
Funding
This work is supported in part by the Agency for Healthcare Research and Quality-funded UT Southwestern Center for Patient-Centered Outcomes Research (R24HS022418). OKN is funded by the National Heart, Lung, and Blood Institute (K23HL133441), and ANM is funded by the National Institute on Aging (K23AG052603).
1. Fieselmann JF, Hendryx MS, Helms CM, Wakefield DS. Respiratory rate predicts cardiopulmonary arrest for internal medicine inpatients. J Gen Intern Med. 1993;8(7):354-360. https://doi.org/10.1007/BF02600071.
2. Hodgetts TJ, Kenward G, Vlachonikolis IG, Payne S, Castle N. The identification of risk factors for cardiac arrest and formulation of activation criteria to alert a medical emergency team. Resuscitation. 2002;54(2):125-131. https://doi.org/10.1016/S0300-9572(02)00100-4.
3. Bone RC, Sibbald WJ, Sprung CL. The ACCP-SCCM consensus conference on sepsis and organ failure. Chest. 1992;101(6):1481-1483.
4. Lovett PB, Buchwald JM, Sturmann K, Bijur P. The vexatious vital: neither clinical measurements by nurses nor an electronic monitor provides accurate measurements of respiratory rate in triage. Ann Emerg Med. 2005;45(1):68-76. https://doi.org/10.1016/j.annemergmed.2004.06.016.
5. Chen J, Hillman K, Bellomo R, et al. The impact of introducing medical emergency team system on the documentations of vital signs. Resuscitation. 2009;80(1):35-43. https://doi.org/10.1016/j.resuscitation.2008.10.009.
6. Leuvan CH, Mitchell I. Missed opportunities? An observational study of vital sign measurements. Crit Care Resusc. 2008;10(2):111-115.
7. Badawy J, Nguyen OK, Clark C, Halm EA, Makam AN. Is everyone really breathing 20 times a minute? Assessing epidemiology and variation in recorded respiratory rate in hospitalised adults. BMJ Qual Saf. 2017;26(10):832-836. https://doi.org/10.1136/bmjqs-2017-006671.
8. Chua WL, Mackey S, Ng EK, Liaw SY. Front line nurses’ experiences with deteriorating ward patients: a qualitative study. Int Nurs Rev. 2013;60(4):501-509. https://doi.org/10.1111/inr.12061.
9. De Meester K, Van Bogaert P, Clarke SP, Bossaert L. In-hospital mortality after serious adverse events on medical and surgical nursing units: a mixed methods study. J Clin Nurs. 2013;22(15-16):2308-2317. https://doi.org/10.1111/j.1365-2702.2012.04154.x.
10. Cheng AC, Black JF, Buising KL. Respiratory rate: the neglected vital sign. Med J Aust. 2008;189(9):531. https://doi.org/10.5694/j.1326-5377.2008.tb02163.x.
11. Mok W, Wang W, Cooper S, Ang EN, Liaw SY. Attitudes towards vital signs monitoring in the detection of clinical deterioration: scale development and survey of ward nurses. Int J Qual Health Care. 2015;27(3):207-213. https://doi.org/10.1093/intqhc/mzv019.
12. Keshvani N, Berger K, Nguyen OK, Makam AN. Roadmap for improving the accuracy of respiratory rate measurements. BMJ Qual Saf. 2018;27(8):e5. https://doi.org/10.1136/bmjqs-2017-007516.
13. Semler MW, Stover DG, Copland AP, et al. Flash mob research: a single-day, multicenter, resident-directed study of respiratory rate. Chest. 2013;143(6):1740-1744. https://doi.org/10.1378/chest.12-1837.
14. Makam AN, Nguyen OK, Auerbach AD. Diagnostic accuracy and effectiveness of automated electronic sepsis alert systems: a systematic review. J Hosp Med. 2015;10(6):396-402. https://doi.org/10.1002/jhm.2347.
15. Ploeg J, Skelly J, Rowan M, et al. The role of nursing best practice champions in diffusing practice guidelines: a mixed methods study. Worldviews Evid Based Nurs. 2010;7(4):238-251. https://doi.org/10.1111/j.1741-6787.2010.00202.x.
© 2019 Society of Hospital Medicine
Adverse Events Experienced by Patients Hospitalized without Definite Medical Acuity: A Retrospective Cohort Study
Evidence exists that physicians consider what may be called “social” or “nonmedical” factors (lack of social support or barriers to access) in hospital admission decision-making and that patients are hospitalized even in the absence of a level of medical acuity warranting admission.1-3 Although hospitalization is associated with the risk of adverse events (AEs),4 whether this risk is related to the medical acuity of admission remains unclear. Our study sought to quantify the AEs experienced by patients hospitalized without definite medical acuity compared with those experienced by patients hospitalized with a definite medically appropriate indication for admission.
METHODS
Setting and Database Used for Analysis
This study was conducted at an urban, safety-net, public teaching hospital. At our site, calls for medical admissions are always answered by a hospital medicine attending physician (“triage physician”) who works collaboratively with the referring physician to facilitate appropriate disposition. Many of these discussions occur via telephone, but the triage physician may also assess the patient directly if needed. This study involved 24 triage physicians who directly assessed the patient in 65% of the cases.
At the time of each admission call, the triage physician logs the following information into a central triage database: date and time of call, patient location, reason for admission, assessment of appropriateness for medical floor, contributing factors to admission decision-making, and patient disposition.
Admission Appropriateness Group Designation
To be considered for inclusion in this study, calls must have originated from the emergency department and resulted in admission to the general medicine floor on either a resident teaching or hospitalist service from February 1, 2018 to June 1, 2018. This time frame was selected to avoid the start of a new academic cycle in late June that may confound AE rates.
The designation of appropriateness was determined by the triage physician’s logged response to triage database questions at the time of the admission call. Of the 748 admissions meeting inclusion criteria, 513 (68.6%) were considered definitely appropriate on the basis of the triage physician’s response to the question “Based ONLY on the medical reason for hospitalization, in your opinion, how appropriate is this admission to the medicine floor service?” Furthermore, 169 (22.6%) were considered without definite medical acuity on the basis of the triage physician’s indication that “severity of medical problems alone may not require inpatient hospitalization” (Appendix Figure 1).
Study Design
Following a retrospective cohort study design, we systematically sampled 150 admissions from those “admitted without definite medical acuity” to create the exposure group and 150 from the “definitely medically appropriate” admissions to create the nonexposure group. Our sampling method involved selecting every third record until reaching the target sample size. This method and group sizes were determined prior to beginning data collection. Given the expected incidence of 33% AEs in the unexposed group (consistent with previous reports of AEs using the trigger tool5), we anticipated that a total sample size of 300 would be appropriate to capture a relative risk of at least 1.5 with 80% power and 95% confidence level.
Chart review was performed to capture patient demographics, admission characteristics, and hospitalization outcomes. We captured emergency severity index (ESI)6, a validated, reliable triage assessment score assigned by our emergency department, as a measurement of acute illness and calculated the Charlson comorbidity index (CCI)7 as a measurement of chronic comorbidity.
Identification of Adverse Events
We measured AEs by using the Institute for Healthcare Improvement Global Trigger Tool,8,9 which is estimated to identify up to 10 times more AEs than other methods, such as voluntary reporting.5 This protocol includes 28 triggers in the Cares and Medication Modules that serve as indicators that an AE may have occurred. The presence of a trigger is not necessarily an AE but a clue for further analysis. Two investigators (AS and CS) independently systematically searched for the presence of triggers within each patient chart. Trigger identification prompted in-depth analysis to confirm the occurrence of an AE and to characterize its severity by using the National Coordinating Council for Medication Error Reporting and Prevention categorization.10 An AE was coded when independent reviewers identified evidence of a preventable or nonpreventable “noxious and unintended event occurring in association with medical care.”9 By definition, any AEs identified were patient harms. Findings were reviewed weekly to ensure agreement, and discrepancies were adjudicated by a third investigator (MB).
All study data were collected by using REDCap electronic data capture tools hosted at the University of Washington.11 The University of Washington Institutional Review Board granted approval for this study.
Study Outcome and Statistical Analysis
The primary outcome was AEs per group with results calculated in three ways: AEs per 1,000 patient-days, AEs per 100 admissions, and percent of admissions with an AE. The risk ratio (RR) for the percent of admissions with an AE and the incidence rate ratio (IRR) for AEs per 1,000 patient-days were calculated for the comparison of significance.
Other data were analyzed by using Pearson’s chi square for categorical data, Student t test for normally distributed quantitative data, and Wilcoxon rank-sum (Mann–Whitney) for the length of stay (due to skew). Analyses were conducted using STATA (version 15.1, College Station, TX).
This work follows standards for reporting observational students as outlined in the STROBE statement.12
RESULTS
Patient Demographics
Both groups were predominantly white/non-Hispanic, male, and English-speaking (Table 1). More patients without definite medical acuity were covered by public insurance (78.9% vs 69.8%, P = .010) and discharged to homelessness (34.8% vs 22.6%, P = .041).
Measures of Illness
Patients considered definitely medically appropriate had lower ESI scores, indicative of more acute presentation, than those without definite medical acuity (2.73 [95% CI 2.64-2.81] vs 2.87 [95% CI 2.78-2.95], P = .026). There was no difference in CCI scores (Table 1).
Reason for Admission and Outcomes
Admissions considered definitely medically appropriate more frequently had an identified diagnosis/syndrome (66% vs 53%) or objective measurement (8.7% vs 2.7%) listed as the reason for admission, whereas patients admitted without definite medical acuity more freuqently had undifferentiated symptoms (34.7% vs 24%) or other/disposition (6% vs 1.3%) listed. The most common factors that triage physicians cited as contributing to the decision to admit patients without definite medical acuity included homelessness (34%), lack of outpatient social support (32%), and substance use disorder (25%). More details are available in Appendix Tables 1 and 2.
Admissions without definite medical acuity were longer than those with definite medical acuity (6.6 vs 6.0 days, P = .038), but there was no difference in emergency department readmissions within 48 hours or hospital readmissions within 30 days (Table 1).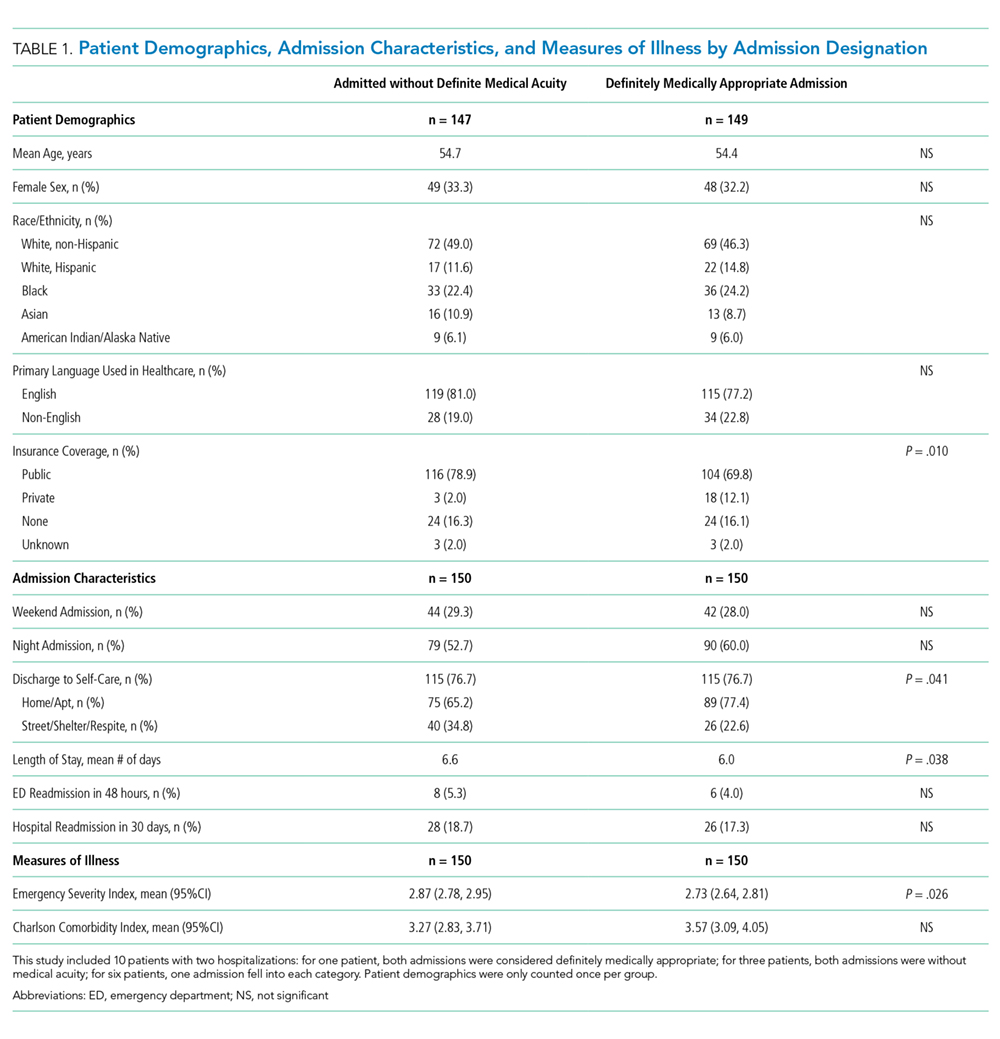
Adverse Events
We identified 76 AEs in 41 admissions without definite medical acuity (range 0-10 AEs per admission) and 63 AEs in 44 definitely medically appropriate admissions (range 0-4 AEs per admission). The percentage of admissions with AE (27.3% vs 29.3%; RR 0.93, 95% CI 0.65-1.34, P = .70) and the rate of AE/1,000 patient-days (76.8 vs 70.4; IRR 1.09, 95% CI 0.77-1.55, P = .61) did not show statistically significant differences. The distribution of AE severity was similar between the two groups (Table 2). Most identified AEs caused temporary harm to the patient and were rated at severity levels E or F. Severe AEs, including at least one level I (patient death), occurred in both groups. The complete listing of positive triggers leading to adverse event identification by group and severity is available in Appendix Table 3.
DISCUSSION
By using a robust, standardized method, we found that patients admitted without definite medical acuity experienced the same number of inpatient AEs as patients admitted for definitely medically appropriate reasons. While the groups were relatively similar overall in terms of demographics and chronic comorbidity, we found evidence of social vulnerability in the group admitted without definite medical acuity in the form of increased rates of homelessness, triage physician concern regarding the lack of outpatient social support, and disposition-related reasons for admission. That both groups suffered harm―including patient death―while admitted to the hospital is striking, in particular for those patients who were admitted because of the lack of suitable outpatient options.
The potential limitations to the generalizability of this work include the single-site, safety-net setting and the use of individual physician determination of admission appropriateness. The proportion of admissions without definite medical acuity reported here is similar to that reported by previously published admission decision-making studies,2,3 and the rate of AEs observed is similar to rates measured in other studies using the trigger tool methodology.5,13 These similarities suggest some commonality across settings. Our study treats triage physician assessment as the marker of difference in defining the two groups and is an inherently subjective assessment that is reflective of real-world, holistic decision-making. Notably, the triage physician assessment was corroborated by corresponding differences in the ESI score, an acute triage assessment completed by a clinician outside of our team.
This study adds foundational knowledge to the risk/benefit discussion surrounding the decision to admit. Physician admission decisions are likely influenced by concern for the safety of vulnerable patients. Our results suggest that considering the risk of hospitalization itself in this decision-making remains important.
1. Mushlin AI, Appel FA. Extramedical factors in the decision to hospitalize medical patients. Am J Public Health. 1976;66(2):170-172. https://doi.org/10.2105/AJPH.66.2.170.
2. Lewis Hunter AE, Spatz ES, Bernstein SL, Rosenthal MS. Factors influencing hospital admission of noncritically ill patients presenting to the emergency department: a cross-sectional study. J Gen Intern Med. 2016;31(1):37-44. https://doi.org/10.1007/s11606-015-3438-8.
3. Pope I, Burn H, Ismail SA, Harris T, McCoy D. A qualitative study exploring the factors influencing admission to hospital from the emergency department. BMJ Open. 2017;7(8):e011543. https://doi.org/10.1136/bmjopen-2016-011543.
4. Levinson DR. Adverse Events in Hospitals: National Incidence among Medicare Beneficiaries. 2010. https://oig.hhs.gov/oei/reports/oei-06-09-00090.pdf. Accessed May 20, 2019.
5. Classen DC, Resar R, Griffin F, et al. ‘Global trigger tool’ shows that adverse events in hospitals may be ten times greater than previously measured. Health Aff (Millwood). 2011;30(4):581-589. https://doi.org/10.1377/hlthaff.2011.0190.
6. Wuerz RC, Milne LW, Eitel DR, Travers D, Gilboy N. Reliability and validity of a new five-level triage instrument. Acad Emerg Med. 2000;7(3):236-242.https://doi.org/10.1111/j.1553-2712.2000.tb01066.x.
7. Charlson ME, Pompei P, Ales KL, MacKenzie CR. A new method of classifying prognostic comorbidity in longitudinal studies: development and validation. J Chron Dis. 1987;40:373-383. https://doi.org/10.1016/0021-9681(87)90171-8.
8. Resar RK, Rozich JD, Classen D. Methodology and rationale for the measurement of harm with trigger tools. Qual Saf Health Care. 2003;12(2):ii39-ii45. https://doi.org/10.1136/qhc.12.suppl_2.ii39.
9. Griffen FA, Resar RK. IHI Global Trigger Tool for Measuring Adverse Events (Second Edition). Cambridge, Massachusetts: Institute for Healthcare Improvement; 2009.
10. National Coordinating Council for Medication Error Reporting and Prevention (NCC MERP) Index for Categorizing Errors. https://www.nccmerp.org/types-medication-errors Accessed May 20, 2019.
11. Harris PA, Taylor R, Thielke R, Payne J, Gonzalez N, Conde JG. Research electronic data capture (REDCap)--a metadata-driven methodology and workflow process for providing translational research informatics support. J Biomed Inform. 2009;42(2):377-381. https://doi.org/10.1016/j.jbi.2008.08.010.
12. von Elm E, Altman DG, Egger M, Pocock SJ, Gøtzsche PC, Vandenbroucke JP. The Strengthening the Reporting of Observational Studies in Epidemiology (STROBE) statement: guidelines for reporting observational studies. Ann Intern Med. 2007;147(8):573-577.
13. Kennerly DA, Kudyakov R, da Graca B, et al. Characterization of adverse events detected in a large health care delivery system using an enhanced global trigger tool over a five-year interval. Health Serv Res. 2014;49(5):1407-1425. https://doi.org/10.1111/1475-6773.12163.
Evidence exists that physicians consider what may be called “social” or “nonmedical” factors (lack of social support or barriers to access) in hospital admission decision-making and that patients are hospitalized even in the absence of a level of medical acuity warranting admission.1-3 Although hospitalization is associated with the risk of adverse events (AEs),4 whether this risk is related to the medical acuity of admission remains unclear. Our study sought to quantify the AEs experienced by patients hospitalized without definite medical acuity compared with those experienced by patients hospitalized with a definite medically appropriate indication for admission.
METHODS
Setting and Database Used for Analysis
This study was conducted at an urban, safety-net, public teaching hospital. At our site, calls for medical admissions are always answered by a hospital medicine attending physician (“triage physician”) who works collaboratively with the referring physician to facilitate appropriate disposition. Many of these discussions occur via telephone, but the triage physician may also assess the patient directly if needed. This study involved 24 triage physicians who directly assessed the patient in 65% of the cases.
At the time of each admission call, the triage physician logs the following information into a central triage database: date and time of call, patient location, reason for admission, assessment of appropriateness for medical floor, contributing factors to admission decision-making, and patient disposition.
Admission Appropriateness Group Designation
To be considered for inclusion in this study, calls must have originated from the emergency department and resulted in admission to the general medicine floor on either a resident teaching or hospitalist service from February 1, 2018 to June 1, 2018. This time frame was selected to avoid the start of a new academic cycle in late June that may confound AE rates.
The designation of appropriateness was determined by the triage physician’s logged response to triage database questions at the time of the admission call. Of the 748 admissions meeting inclusion criteria, 513 (68.6%) were considered definitely appropriate on the basis of the triage physician’s response to the question “Based ONLY on the medical reason for hospitalization, in your opinion, how appropriate is this admission to the medicine floor service?” Furthermore, 169 (22.6%) were considered without definite medical acuity on the basis of the triage physician’s indication that “severity of medical problems alone may not require inpatient hospitalization” (Appendix Figure 1).
Study Design
Following a retrospective cohort study design, we systematically sampled 150 admissions from those “admitted without definite medical acuity” to create the exposure group and 150 from the “definitely medically appropriate” admissions to create the nonexposure group. Our sampling method involved selecting every third record until reaching the target sample size. This method and group sizes were determined prior to beginning data collection. Given the expected incidence of 33% AEs in the unexposed group (consistent with previous reports of AEs using the trigger tool5), we anticipated that a total sample size of 300 would be appropriate to capture a relative risk of at least 1.5 with 80% power and 95% confidence level.
Chart review was performed to capture patient demographics, admission characteristics, and hospitalization outcomes. We captured emergency severity index (ESI)6, a validated, reliable triage assessment score assigned by our emergency department, as a measurement of acute illness and calculated the Charlson comorbidity index (CCI)7 as a measurement of chronic comorbidity.
Identification of Adverse Events
We measured AEs by using the Institute for Healthcare Improvement Global Trigger Tool,8,9 which is estimated to identify up to 10 times more AEs than other methods, such as voluntary reporting.5 This protocol includes 28 triggers in the Cares and Medication Modules that serve as indicators that an AE may have occurred. The presence of a trigger is not necessarily an AE but a clue for further analysis. Two investigators (AS and CS) independently systematically searched for the presence of triggers within each patient chart. Trigger identification prompted in-depth analysis to confirm the occurrence of an AE and to characterize its severity by using the National Coordinating Council for Medication Error Reporting and Prevention categorization.10 An AE was coded when independent reviewers identified evidence of a preventable or nonpreventable “noxious and unintended event occurring in association with medical care.”9 By definition, any AEs identified were patient harms. Findings were reviewed weekly to ensure agreement, and discrepancies were adjudicated by a third investigator (MB).
All study data were collected by using REDCap electronic data capture tools hosted at the University of Washington.11 The University of Washington Institutional Review Board granted approval for this study.
Study Outcome and Statistical Analysis
The primary outcome was AEs per group with results calculated in three ways: AEs per 1,000 patient-days, AEs per 100 admissions, and percent of admissions with an AE. The risk ratio (RR) for the percent of admissions with an AE and the incidence rate ratio (IRR) for AEs per 1,000 patient-days were calculated for the comparison of significance.
Other data were analyzed by using Pearson’s chi square for categorical data, Student t test for normally distributed quantitative data, and Wilcoxon rank-sum (Mann–Whitney) for the length of stay (due to skew). Analyses were conducted using STATA (version 15.1, College Station, TX).
This work follows standards for reporting observational students as outlined in the STROBE statement.12
RESULTS
Patient Demographics
Both groups were predominantly white/non-Hispanic, male, and English-speaking (Table 1). More patients without definite medical acuity were covered by public insurance (78.9% vs 69.8%, P = .010) and discharged to homelessness (34.8% vs 22.6%, P = .041).
Measures of Illness
Patients considered definitely medically appropriate had lower ESI scores, indicative of more acute presentation, than those without definite medical acuity (2.73 [95% CI 2.64-2.81] vs 2.87 [95% CI 2.78-2.95], P = .026). There was no difference in CCI scores (Table 1).
Reason for Admission and Outcomes
Admissions considered definitely medically appropriate more frequently had an identified diagnosis/syndrome (66% vs 53%) or objective measurement (8.7% vs 2.7%) listed as the reason for admission, whereas patients admitted without definite medical acuity more freuqently had undifferentiated symptoms (34.7% vs 24%) or other/disposition (6% vs 1.3%) listed. The most common factors that triage physicians cited as contributing to the decision to admit patients without definite medical acuity included homelessness (34%), lack of outpatient social support (32%), and substance use disorder (25%). More details are available in Appendix Tables 1 and 2.
Admissions without definite medical acuity were longer than those with definite medical acuity (6.6 vs 6.0 days, P = .038), but there was no difference in emergency department readmissions within 48 hours or hospital readmissions within 30 days (Table 1).
Adverse Events
We identified 76 AEs in 41 admissions without definite medical acuity (range 0-10 AEs per admission) and 63 AEs in 44 definitely medically appropriate admissions (range 0-4 AEs per admission). The percentage of admissions with AE (27.3% vs 29.3%; RR 0.93, 95% CI 0.65-1.34, P = .70) and the rate of AE/1,000 patient-days (76.8 vs 70.4; IRR 1.09, 95% CI 0.77-1.55, P = .61) did not show statistically significant differences. The distribution of AE severity was similar between the two groups (Table 2). Most identified AEs caused temporary harm to the patient and were rated at severity levels E or F. Severe AEs, including at least one level I (patient death), occurred in both groups. The complete listing of positive triggers leading to adverse event identification by group and severity is available in Appendix Table 3.
DISCUSSION
By using a robust, standardized method, we found that patients admitted without definite medical acuity experienced the same number of inpatient AEs as patients admitted for definitely medically appropriate reasons. While the groups were relatively similar overall in terms of demographics and chronic comorbidity, we found evidence of social vulnerability in the group admitted without definite medical acuity in the form of increased rates of homelessness, triage physician concern regarding the lack of outpatient social support, and disposition-related reasons for admission. That both groups suffered harm―including patient death―while admitted to the hospital is striking, in particular for those patients who were admitted because of the lack of suitable outpatient options.
The potential limitations to the generalizability of this work include the single-site, safety-net setting and the use of individual physician determination of admission appropriateness. The proportion of admissions without definite medical acuity reported here is similar to that reported by previously published admission decision-making studies,2,3 and the rate of AEs observed is similar to rates measured in other studies using the trigger tool methodology.5,13 These similarities suggest some commonality across settings. Our study treats triage physician assessment as the marker of difference in defining the two groups and is an inherently subjective assessment that is reflective of real-world, holistic decision-making. Notably, the triage physician assessment was corroborated by corresponding differences in the ESI score, an acute triage assessment completed by a clinician outside of our team.
This study adds foundational knowledge to the risk/benefit discussion surrounding the decision to admit. Physician admission decisions are likely influenced by concern for the safety of vulnerable patients. Our results suggest that considering the risk of hospitalization itself in this decision-making remains important.
1. Mushlin AI, Appel FA. Extramedical factors in the decision to hospitalize medical patients. Am J Public Health. 1976;66(2):170-172. https://doi.org/10.2105/AJPH.66.2.170.
2. Lewis Hunter AE, Spatz ES, Bernstein SL, Rosenthal MS. Factors influencing hospital admission of noncritically ill patients presenting to the emergency department: a cross-sectional study. J Gen Intern Med. 2016;31(1):37-44. https://doi.org/10.1007/s11606-015-3438-8.
3. Pope I, Burn H, Ismail SA, Harris T, McCoy D. A qualitative study exploring the factors influencing admission to hospital from the emergency department. BMJ Open. 2017;7(8):e011543. https://doi.org/10.1136/bmjopen-2016-011543.
4. Levinson DR. Adverse Events in Hospitals: National Incidence among Medicare Beneficiaries. 2010. https://oig.hhs.gov/oei/reports/oei-06-09-00090.pdf. Accessed May 20, 2019.
5. Classen DC, Resar R, Griffin F, et al. ‘Global trigger tool’ shows that adverse events in hospitals may be ten times greater than previously measured. Health Aff (Millwood). 2011;30(4):581-589. https://doi.org/10.1377/hlthaff.2011.0190.
6. Wuerz RC, Milne LW, Eitel DR, Travers D, Gilboy N. Reliability and validity of a new five-level triage instrument. Acad Emerg Med. 2000;7(3):236-242.https://doi.org/10.1111/j.1553-2712.2000.tb01066.x.
7. Charlson ME, Pompei P, Ales KL, MacKenzie CR. A new method of classifying prognostic comorbidity in longitudinal studies: development and validation. J Chron Dis. 1987;40:373-383. https://doi.org/10.1016/0021-9681(87)90171-8.
8. Resar RK, Rozich JD, Classen D. Methodology and rationale for the measurement of harm with trigger tools. Qual Saf Health Care. 2003;12(2):ii39-ii45. https://doi.org/10.1136/qhc.12.suppl_2.ii39.
9. Griffen FA, Resar RK. IHI Global Trigger Tool for Measuring Adverse Events (Second Edition). Cambridge, Massachusetts: Institute for Healthcare Improvement; 2009.
10. National Coordinating Council for Medication Error Reporting and Prevention (NCC MERP) Index for Categorizing Errors. https://www.nccmerp.org/types-medication-errors Accessed May 20, 2019.
11. Harris PA, Taylor R, Thielke R, Payne J, Gonzalez N, Conde JG. Research electronic data capture (REDCap)--a metadata-driven methodology and workflow process for providing translational research informatics support. J Biomed Inform. 2009;42(2):377-381. https://doi.org/10.1016/j.jbi.2008.08.010.
12. von Elm E, Altman DG, Egger M, Pocock SJ, Gøtzsche PC, Vandenbroucke JP. The Strengthening the Reporting of Observational Studies in Epidemiology (STROBE) statement: guidelines for reporting observational studies. Ann Intern Med. 2007;147(8):573-577.
13. Kennerly DA, Kudyakov R, da Graca B, et al. Characterization of adverse events detected in a large health care delivery system using an enhanced global trigger tool over a five-year interval. Health Serv Res. 2014;49(5):1407-1425. https://doi.org/10.1111/1475-6773.12163.
© 2020 Society of Hospital Medicine
Breathing New Life into Vital Sign Measurement
As you review the electronic health record before rounds in the morning, you notice a red exclamation mark in the chart of a patient who was admitted two days ago for an acute chronic obstructive pulmonary disease (COPD) exacerbation. The patient’s respiratory rate (RR) this morning is recorded at 24 breaths per minute (bpm). His RR last evening was 16 bpm and he remains on two liters per minute of supplemental oxygen. No one has notified you that he is getting worse, but you stop by the room to confirm that he is clinically stable.
During rounds, the resident states “The respiratory rate is recorded as 24 bpm, which is high, but I never trust the respiratory rate.” You silently agree and confirm your mistrust of the recorded RR.
Elevated RR has been associated with numerous poor outcomes, including mortality after myocardial infarction1 and death and readmission after acute COPD exacerbation.2 Furthermore, RR is used in models to predict mortality and intensive care unit admission,3 as well as in models to identify and predict mortality from sepsis.4 Recorded RRs are frequency inaccurate,5 and medical staff lack confidence in recorded RR values.6 Based on this evidence, you feel justified in your mistrust of recorded RR values. You might even believe that until a high-tech RR monitoring system is invented and implemented at your hospital, human error will forever prevent you from knowing your patients’ true RRs.
However, there is hope. In this issue of the Journal of Hospital Medicine, Keshvani et al.7 describe a successful quality improvement project where they employed plan–do–study–act methodology in a single inpatient unit to improve the accuracy of recorded RR. Before their project, only 36% of RR measurements were accurate, and there was considerable heterogeneity in the RR measurement technique. To address this problem, an interdisciplinary team of patient care assistants (PCAs), nurses, physicians, and hospital administration developed a plan to identify barriers, improve workflow, and educate stakeholders in RR recording.
The authors created a low-cost, “low-tech” intervention that consisted of training and educating PCAs on the correct technique and the importance of RR measurement, modifying workflow to incorporate RR measurement into a 30-second period of automated blood pressure measurement, and adding stopwatches to the vital sign carts. The RR measurements obtained by PCAs were compared with the RR measurements obtained by trained team members to assess for accuracy. PCA-obtained RR measurements were also compared with two control units, both before and after the intervention. Secondary outcomes included time to complete vital sign measurements and the incidence of systemic inflammatory response syndrome (SIRS)
The intervention improved the accuracy of PCA-obtained RRs from 36% to 58% and decreased the median RR from 18 to 14 breaths per minute. The implementation also resulted in a more normal distribution of RR in the intervention unit compared with the control unit. Interestingly, this intervention did not increase the time spent in obtaining vital signs—in fact, the time to complete vital signs decreased from a median of 2:26 to 1:55 minutes. In addition, tachypnea-specific SIRS incidence was reduced by 7.8% per hospitalization. An important implication of this finding is that reducing the false-positive rate of SIRS could possibly decrease unnecessary testing, medical interventions, and alert fatigue.
This project shows that meaningful interventions need not be expensive or overly technologic to have very real clinical effects. It would be very easy for a system to advocate for funding to purchase advanced monitors that purport to remove human error from the situation rather than trying first to improve human performance. Certainly, there is a role for advanced technologies—but improvement need not wait for, or be completely predicated on, these new technologies. The first barrier often expressed when evaluating a potential improvement initiative is that “we don’t have time for that”. This project demonstrates that innovations to improve care can also benefit the care team and improve workflow. Certainly, this project is not definitive and should be replicated elsewhere, but it is an important first step.
In an era where technology is expanding rapidly and the pace of innovation is breathtaking, we have an obligation to ensure that we are getting the basics right. Further, we must not take core tasks—such as vital signs, physical examination, and medication reconciliation—for granted, nor should we accept that they are as they will be. We discuss and debate the merits of advanced imaging, artificial intelligence, and machine learning—which are certainly exciting advances—but we must occasionally pause, breathe, and examine our practice to make sure that we do not overlook things that are truly vital to our patients’ care.
Disclosures
The authors have nothing to disclose.
1. Barthel P, Wensel R, Bauer A, et al. Respiratory rate predicts outcome after acute myocardial infarction: a prospective cohort study. Eur Heart J. 2013;34(22):1644-1650. https://doi.org/10.1093/eurheartj/ehs420.
2. Flattet Y, Garin N, Serratrice J, Arnaud P, Stirnemann J, Carballo S. Determining prognosis in acute exacerbation of COPD. Int J Chron Obstruct Pulmon Dis. 2017;12:467-475. https://doi.org/10.2147/COPD.S122382.
3. Subbe CP, Kruger M, Rutherford P, Gemmel L. Validation of a modified early warning score in medical admissions. QJM. 2001;94(10):521-526. https://doi.org/10.1093/qjmed/94.10.521.
4. Seymour CW, Liu VX, Iwashyna TJ, et al. Assessment of clinical criteria for sepsis: for the third international consensus definitions for sepsis and septic shock (sepsis-3). JAMA. 2016;315(8):762-774. https://doi.org/10.1001/jama.2016.0288.
5. Badawy J, Nguyen OK, Clark C, Halm EA, Makam AN. Is everyone really breathing 20 times a minute? Assessing epidemiology and variation in recorded respiratory rate in hospitalised adults. BMJ Qual Saf. 2017;26(10):832-836. https://doi.org/10.1136/bmjqs-2017-006671.
6. Philip K, Richardson R, Cohen M. Staff perceptions of respiratory rate measurement in a general hospital. Br J Nurs. 2013;22(10):570-574. https://doi.org/10.12968/bjon.2013.22.10.570.
7. Keshvani N, Berger K, Gupta A, DePaola S, Nguyen O, Makam A. Improving respiratory rate accuracy in the hospital: a quality improvement initiative [published online ahead of print June 10, 2019]. J Hosp Med. 2019;14(11):673-677. https://doi.org/10.12788/jhm.3232.
As you review the electronic health record before rounds in the morning, you notice a red exclamation mark in the chart of a patient who was admitted two days ago for an acute chronic obstructive pulmonary disease (COPD) exacerbation. The patient’s respiratory rate (RR) this morning is recorded at 24 breaths per minute (bpm). His RR last evening was 16 bpm and he remains on two liters per minute of supplemental oxygen. No one has notified you that he is getting worse, but you stop by the room to confirm that he is clinically stable.
During rounds, the resident states “The respiratory rate is recorded as 24 bpm, which is high, but I never trust the respiratory rate.” You silently agree and confirm your mistrust of the recorded RR.
Elevated RR has been associated with numerous poor outcomes, including mortality after myocardial infarction1 and death and readmission after acute COPD exacerbation.2 Furthermore, RR is used in models to predict mortality and intensive care unit admission,3 as well as in models to identify and predict mortality from sepsis.4 Recorded RRs are frequency inaccurate,5 and medical staff lack confidence in recorded RR values.6 Based on this evidence, you feel justified in your mistrust of recorded RR values. You might even believe that until a high-tech RR monitoring system is invented and implemented at your hospital, human error will forever prevent you from knowing your patients’ true RRs.
However, there is hope. In this issue of the Journal of Hospital Medicine, Keshvani et al.7 describe a successful quality improvement project where they employed plan–do–study–act methodology in a single inpatient unit to improve the accuracy of recorded RR. Before their project, only 36% of RR measurements were accurate, and there was considerable heterogeneity in the RR measurement technique. To address this problem, an interdisciplinary team of patient care assistants (PCAs), nurses, physicians, and hospital administration developed a plan to identify barriers, improve workflow, and educate stakeholders in RR recording.
The authors created a low-cost, “low-tech” intervention that consisted of training and educating PCAs on the correct technique and the importance of RR measurement, modifying workflow to incorporate RR measurement into a 30-second period of automated blood pressure measurement, and adding stopwatches to the vital sign carts. The RR measurements obtained by PCAs were compared with the RR measurements obtained by trained team members to assess for accuracy. PCA-obtained RR measurements were also compared with two control units, both before and after the intervention. Secondary outcomes included time to complete vital sign measurements and the incidence of systemic inflammatory response syndrome (SIRS)
The intervention improved the accuracy of PCA-obtained RRs from 36% to 58% and decreased the median RR from 18 to 14 breaths per minute. The implementation also resulted in a more normal distribution of RR in the intervention unit compared with the control unit. Interestingly, this intervention did not increase the time spent in obtaining vital signs—in fact, the time to complete vital signs decreased from a median of 2:26 to 1:55 minutes. In addition, tachypnea-specific SIRS incidence was reduced by 7.8% per hospitalization. An important implication of this finding is that reducing the false-positive rate of SIRS could possibly decrease unnecessary testing, medical interventions, and alert fatigue.
This project shows that meaningful interventions need not be expensive or overly technologic to have very real clinical effects. It would be very easy for a system to advocate for funding to purchase advanced monitors that purport to remove human error from the situation rather than trying first to improve human performance. Certainly, there is a role for advanced technologies—but improvement need not wait for, or be completely predicated on, these new technologies. The first barrier often expressed when evaluating a potential improvement initiative is that “we don’t have time for that”. This project demonstrates that innovations to improve care can also benefit the care team and improve workflow. Certainly, this project is not definitive and should be replicated elsewhere, but it is an important first step.
In an era where technology is expanding rapidly and the pace of innovation is breathtaking, we have an obligation to ensure that we are getting the basics right. Further, we must not take core tasks—such as vital signs, physical examination, and medication reconciliation—for granted, nor should we accept that they are as they will be. We discuss and debate the merits of advanced imaging, artificial intelligence, and machine learning—which are certainly exciting advances—but we must occasionally pause, breathe, and examine our practice to make sure that we do not overlook things that are truly vital to our patients’ care.
Disclosures
The authors have nothing to disclose.
1. Barthel P, Wensel R, Bauer A, et al. Respiratory rate predicts outcome after acute myocardial infarction: a prospective cohort study. Eur Heart J. 2013;34(22):1644-1650. https://doi.org/10.1093/eurheartj/ehs420.
2. Flattet Y, Garin N, Serratrice J, Arnaud P, Stirnemann J, Carballo S. Determining prognosis in acute exacerbation of COPD. Int J Chron Obstruct Pulmon Dis. 2017;12:467-475. https://doi.org/10.2147/COPD.S122382.
3. Subbe CP, Kruger M, Rutherford P, Gemmel L. Validation of a modified early warning score in medical admissions. QJM. 2001;94(10):521-526. https://doi.org/10.1093/qjmed/94.10.521.
4. Seymour CW, Liu VX, Iwashyna TJ, et al. Assessment of clinical criteria for sepsis: for the third international consensus definitions for sepsis and septic shock (sepsis-3). JAMA. 2016;315(8):762-774. https://doi.org/10.1001/jama.2016.0288.
5. Badawy J, Nguyen OK, Clark C, Halm EA, Makam AN. Is everyone really breathing 20 times a minute? Assessing epidemiology and variation in recorded respiratory rate in hospitalised adults. BMJ Qual Saf. 2017;26(10):832-836. https://doi.org/10.1136/bmjqs-2017-006671.
6. Philip K, Richardson R, Cohen M. Staff perceptions of respiratory rate measurement in a general hospital. Br J Nurs. 2013;22(10):570-574. https://doi.org/10.12968/bjon.2013.22.10.570.
7. Keshvani N, Berger K, Gupta A, DePaola S, Nguyen O, Makam A. Improving respiratory rate accuracy in the hospital: a quality improvement initiative [published online ahead of print June 10, 2019]. J Hosp Med. 2019;14(11):673-677. https://doi.org/10.12788/jhm.3232.
© 2019 Society of Hospital Medicine
Beyond Mortality: Improving Outcomes for Children Who Deteriorate in Inpatient Settings
The past 20 years has seen an explosion of approaches to improve the recognition of children who deteriorate in the hospital. Early Warning Scores, Rapid Response Teams, Situational Awareness, and Parent-Triggered Activation systems are a few of the safety initiatives implemented worldwide. Many have an inherent face validity; for example, it would appear to be intuitive that highlighting the changes in physiology via a Pediatric Early Warning Score (PEWS) would enable staff to recognize a change in disease process and intervene accordingly. However, although mortality trends have been shown to diminish over time,1 the evidence base supporting their impact has often been quite heterogeneous.2,3 In particular, a recent international randomized control trial of a PEWS approach was found not to improve overall mortality.4
A major challenge with the evaluation of these patient safety systems is the reliance on mortality as an outcome measure. This is relatively rare, even in large tertiary institutions with complex patients and finding other proxy measures of quality of care are important. Hussain et al. have created a relatively easy to measure metric, an emergency transfer (ET). The benefit of the ET is its simplicity and transferability, which is described as follows:
“Emergency Transfer (ET) is defined as any patient transferred to the ICU where the patient received intubation, inotropes, or three or more fluid boluses in the first hour after arrival or before transfer.”5
All these components are easily extractable from written or electronic records and are representative of meaningful deterioration. Pressure on bed states, challenges with staff skill mix, and increasing parental expectation may all impact on decisions to transfer patients. The ET metric is relatively immune to these biases as its tight time definition separates it from the previous Bonafide et al.6 measure (similar interventions but within a 12-hour window) as being centered on an abrupt critical change, rather than a potential drift toward deterioration. This makes the measure useful not only to an individual institution to measure the impact of an intervention but also internationally, as a comparison between institutions will not be influenced by health system differences.
The ET metric is important as Hussain et al. have demonstrated that it is associated with a worse outcome for the child both as a concrete outcome (increased mortality when it does occur) and as an experience (a longer stay in hospital). “You can’t improve what you can’t measure” is an old improvement maxim, and only by broadening our use of alternative metrics of care will we be able to understand which interventions will make a difference to patients. Certainly, evidence suggests that cultures, hierarchies, and leadership may well be as important as other more concrete or tangible tools,7 but these have seldom been evaluated as part of studies on improving the response to deterioration. The pediatric early warning system utilization and mortality avoidance (PUMA) study, a research program funded by the National Institute for Health Research (United Kingdom), is exploring these tools and will likely report later in 2019.8
Two immediate practical implications of this work emerge, which should be of relevance to clinical leaders in children’s hospitals. The first is that it is highly likely that there will be some events you cannot anticipate. A bronchiolitic infant is always likely to suddenly plug off, and invasive group A streptococcus is a mastery of mimicry and deceit. The authors noted that even with a mature, long-standing Rapid Response System process, ETs were still associated with adverse outcomes. Therefore, it may well be that the ET metric measured over time delineates a locally defined acceptable level of unplanned intensive care admission. If your hospital is significantly above this, they must seriously look at how they can improve their performance. It should be noted here that there were only 45 ETs identified in 4.5 years in Cincinnati and 50% of these were from specialist units within the hospital. It is possible that perhaps the ETs will in the future become as rare as mortality is today, and as hospitals improve, new frames of reference will be needed.
These new references are likely to come from high-performing child health institutions such as those in Philadelphia and Cincinnati, and this leads to a second important principle that hospitals should acknowledge. One of the reasons for patient safety success is the relentless pursuit of excellence. The very act of consistently, and transparently, auditing and analyzing performance is vital to change outcomes. We should digest, evaluate, adopt, and improve the research that groups such as these are undertaking as, although sometimes imperfect, they should also inspire us to ensure that children in our own institutions are as safe as they possibly can be.
Disclosure
Dr. Roland reports that he is currently the cochief investigator of a National Institute for Health Research (NIHR) grant investigating pediatric early warning systems (the PUMA study)
1. United Nations. Levels and Trends in Child Mortality Report 2018. https://www.un.org/en/development/desa/population/publications/mortality/child-mortality-report-2018.asp. Accessed April 26, 2019.
2. McGaughey J, O’Halloran P, Porter S, Trinder J, Blackwood B. Early warning systems and rapid response to the deteriorating patient in hospital: a realist evaluation. J Adv Nurs. 2017;73(12):3119-3132. https://doi.org/10.1111/jan.13367.
3. Chapman SM, Maconochie IK Early warning scores in paediatrics: an overview. Arch Dis Child. 2019;104:395-399. https://doi.org/10.1136/archdischild-2018-314807.
4. Parshuram CS, Dryden-Palmer K, Farrell C, et al. Effect of a pediatric early warning system on all-cause mortality in hospitalized pediatric patients: the EPOCH randomized clinical trial. JAMA. 2018;319(10):1002-1012. https://doi.org/10.1001/jama.2018.0948.
5. Hussain F. Emergency transfers: an important predictor of adverse outcomes in hospitalized children [Published online ahead of print June 7, 2019]. J Hosp Med. 2019;14(8):482-485. https://doi.org/10.12788/jhm.3219.
6. Bonafide CP, Roberts KE, Priestley MA, et al. Development of a pragmatic measure for evaluating and optimizing rapid response systems. Pediatrics. 2012;129(4):e874-e881. https://doi.org/10.1542/peds.2011-2784.
7. Gawronski O, Parshuram C, Cecchetti C, et al. Qualitative study exploring factors influencing escalation of care of deteriorating children in a children’s hospital. BMJ Paediatrics Open. 2018;2(1):e000241. https://doi.org/10.1136/bmjpo-2017-000241.
8. Thomas-Jones E, Lloyd A, Roland D, et al. A prospective, mixed-methods, before and after study to identify the evidence base for the core components of an effective Paediatric Early Warning System and the development of an implementation package containing those core recommendations for use in the UK: Paediatric early warning system - utilisation and mortality avoidance- the PUMA study protocol. BMC Pediatr. 2018;18(1):244. https://doi.org/10.1186/s12887-018-1210-z.
The past 20 years has seen an explosion of approaches to improve the recognition of children who deteriorate in the hospital. Early Warning Scores, Rapid Response Teams, Situational Awareness, and Parent-Triggered Activation systems are a few of the safety initiatives implemented worldwide. Many have an inherent face validity; for example, it would appear to be intuitive that highlighting the changes in physiology via a Pediatric Early Warning Score (PEWS) would enable staff to recognize a change in disease process and intervene accordingly. However, although mortality trends have been shown to diminish over time,1 the evidence base supporting their impact has often been quite heterogeneous.2,3 In particular, a recent international randomized control trial of a PEWS approach was found not to improve overall mortality.4
A major challenge with the evaluation of these patient safety systems is the reliance on mortality as an outcome measure. This is relatively rare, even in large tertiary institutions with complex patients and finding other proxy measures of quality of care are important. Hussain et al. have created a relatively easy to measure metric, an emergency transfer (ET). The benefit of the ET is its simplicity and transferability, which is described as follows:
“Emergency Transfer (ET) is defined as any patient transferred to the ICU where the patient received intubation, inotropes, or three or more fluid boluses in the first hour after arrival or before transfer.”5
All these components are easily extractable from written or electronic records and are representative of meaningful deterioration. Pressure on bed states, challenges with staff skill mix, and increasing parental expectation may all impact on decisions to transfer patients. The ET metric is relatively immune to these biases as its tight time definition separates it from the previous Bonafide et al.6 measure (similar interventions but within a 12-hour window) as being centered on an abrupt critical change, rather than a potential drift toward deterioration. This makes the measure useful not only to an individual institution to measure the impact of an intervention but also internationally, as a comparison between institutions will not be influenced by health system differences.
The ET metric is important as Hussain et al. have demonstrated that it is associated with a worse outcome for the child both as a concrete outcome (increased mortality when it does occur) and as an experience (a longer stay in hospital). “You can’t improve what you can’t measure” is an old improvement maxim, and only by broadening our use of alternative metrics of care will we be able to understand which interventions will make a difference to patients. Certainly, evidence suggests that cultures, hierarchies, and leadership may well be as important as other more concrete or tangible tools,7 but these have seldom been evaluated as part of studies on improving the response to deterioration. The pediatric early warning system utilization and mortality avoidance (PUMA) study, a research program funded by the National Institute for Health Research (United Kingdom), is exploring these tools and will likely report later in 2019.8
Two immediate practical implications of this work emerge, which should be of relevance to clinical leaders in children’s hospitals. The first is that it is highly likely that there will be some events you cannot anticipate. A bronchiolitic infant is always likely to suddenly plug off, and invasive group A streptococcus is a mastery of mimicry and deceit. The authors noted that even with a mature, long-standing Rapid Response System process, ETs were still associated with adverse outcomes. Therefore, it may well be that the ET metric measured over time delineates a locally defined acceptable level of unplanned intensive care admission. If your hospital is significantly above this, they must seriously look at how they can improve their performance. It should be noted here that there were only 45 ETs identified in 4.5 years in Cincinnati and 50% of these were from specialist units within the hospital. It is possible that perhaps the ETs will in the future become as rare as mortality is today, and as hospitals improve, new frames of reference will be needed.
These new references are likely to come from high-performing child health institutions such as those in Philadelphia and Cincinnati, and this leads to a second important principle that hospitals should acknowledge. One of the reasons for patient safety success is the relentless pursuit of excellence. The very act of consistently, and transparently, auditing and analyzing performance is vital to change outcomes. We should digest, evaluate, adopt, and improve the research that groups such as these are undertaking as, although sometimes imperfect, they should also inspire us to ensure that children in our own institutions are as safe as they possibly can be.
Disclosure
Dr. Roland reports that he is currently the cochief investigator of a National Institute for Health Research (NIHR) grant investigating pediatric early warning systems (the PUMA study)
1. United Nations. Levels and Trends in Child Mortality Report 2018. https://www.un.org/en/development/desa/population/publications/mortality/child-mortality-report-2018.asp. Accessed April 26, 2019.
2. McGaughey J, O’Halloran P, Porter S, Trinder J, Blackwood B. Early warning systems and rapid response to the deteriorating patient in hospital: a realist evaluation. J Adv Nurs. 2017;73(12):3119-3132. https://doi.org/10.1111/jan.13367.
3. Chapman SM, Maconochie IK Early warning scores in paediatrics: an overview. Arch Dis Child. 2019;104:395-399. https://doi.org/10.1136/archdischild-2018-314807.
4. Parshuram CS, Dryden-Palmer K, Farrell C, et al. Effect of a pediatric early warning system on all-cause mortality in hospitalized pediatric patients: the EPOCH randomized clinical trial. JAMA. 2018;319(10):1002-1012. https://doi.org/10.1001/jama.2018.0948.
5. Hussain F. Emergency transfers: an important predictor of adverse outcomes in hospitalized children [Published online ahead of print June 7, 2019]. J Hosp Med. 2019;14(8):482-485. https://doi.org/10.12788/jhm.3219.
6. Bonafide CP, Roberts KE, Priestley MA, et al. Development of a pragmatic measure for evaluating and optimizing rapid response systems. Pediatrics. 2012;129(4):e874-e881. https://doi.org/10.1542/peds.2011-2784.
7. Gawronski O, Parshuram C, Cecchetti C, et al. Qualitative study exploring factors influencing escalation of care of deteriorating children in a children’s hospital. BMJ Paediatrics Open. 2018;2(1):e000241. https://doi.org/10.1136/bmjpo-2017-000241.
8. Thomas-Jones E, Lloyd A, Roland D, et al. A prospective, mixed-methods, before and after study to identify the evidence base for the core components of an effective Paediatric Early Warning System and the development of an implementation package containing those core recommendations for use in the UK: Paediatric early warning system - utilisation and mortality avoidance- the PUMA study protocol. BMC Pediatr. 2018;18(1):244. https://doi.org/10.1186/s12887-018-1210-z.
© 2019 Society of Hospital Medicine
Progress (?) Toward Reducing Pediatric Readmissions
Readmission rates have been used by payers to administer financial incentives or penalties to hospitals as a measure of quality. The Centers for Medicare and Medicaid Services (CMS) reduces payments to hospitals with excess readmissions for adult Medicare patients.1 Although the Medicare readmission penalties do not apply to children, several state Medicaid agencies have adopted policies to reduce reimbursement for hospitals with higher than expected readmission rates. These Medicaid programs often use potentially preventable readmission (PPR) rates calculated with proprietary software.2 As a result of these incentives and with a goal of improving care, many children’s hospitals have focused on reducing readmissions through participation in local, regional, and national collaboratives.3
Rates of unplanned readmissions in children are lower than in older adults, with all-cause 30-day pediatric readmission rates around 13%.4-7 Even so, as many as 30% of pediatric readmissions may be potentially preventable, with the most common transition failure involving a hospital factor, such as failure to recognize worsening clinical status prior to discharge.8 While readmission metrics are often judged across peer institutions, little is known about national trends over time. Therefore, we sought to examine readmission rates at children’s hospitals over a six-year timeframe to determine if progress has been made toward reducing readmissions.
METHODS
We utilized data from the Children’s Hospital Association Inpatient Essentials Database and included index hospitalizations from January 1, 2010 through June 30, 2016. This database contains demographic information, diagnosis and procedure codes, and All-Patient Refined Diagnosis-Related Groups (APR-DRGs; 3M Health Information Systems) to describe the principal reason for each hospitalization.9 We included 66 hospitals from 31 states plus the District of Columbia with complete data during the study period.
Seven-day all-cause (AC) readmission and PPR rates were calculated using the output from 3M potentially preventable readmission software (version 32). The PPR software utilizes a proprietary algorithm to designate potentially preventable readmissions based on diagnosis codes and the severity of illness (as measured by the APR-DRG severity of illness classification). We chose seven-day readmissions, as opposed to a longer window, as readmissions soon after discharge are more likely to be preventable8 and thus theoretically more amenable to prevention efforts. Quarterly rates were generated for each hospital and in aggregate across the population. We chose quarterly rates a priori to assess changes in rates without focusing on minor monthly fluctuations due to seasonal differences. We performed generalized linear mixed regression models with cluster adjustments at the hospital level to assess changes in readmission rates over time adjusted for case mix index, as admissions to children’s hospitals have increased in complexity over time.10,11 We operationalized the case mix index as an average of pediatric admissions’ relative weights at each hospital for the quarter.12 We assessed AC and PPR models separately. The average case mix index was a covariate in both regression models.
Finally, to determine if readmission reduction may be specific to particular conditions, we generated readmission rates for a select number of APR-DRGs. We focused on conditions with a very high percentage of AC readmissions classified as PPR (appendectomy, connective tissue disorders, ventricular shunt procedures, bronchiolitis, asthma, and sickle cell crisis) as well as those with a very low percentage of AC readmissions classified as PPR (gastrointestinal infections, hematologic disease, and bone marrow transplant [BMT]).5
RESULTS
We included 4.52 million admissions to the 66 included hospitals. Most hospitals (62%) were freestanding acute-care children’s hospitals. The hospitals were geographically diverse. Two-thirds had magnet status (Appendix Table 1). Appendix Table 2 displays patient/admission characteristics over time. Approximately 49% of children were non-Hispanic white, 19% were non-Hispanic black, and 19% were Hispanic. Half of the children were insured by Medicaid. These characteristics were stable over time, except case mix index, which increased during the study period (P = .04).
Across Diagnosis All-Cause and Potentially Preventable Readmission Rates
Over the study period, there were 227,378 AC seven-day readmissions (5.1% readmission rate), and 91,467 readmissions (40% of AC readmissions) were considered PPRs. Readmission rates did not vary over the study period (Figure, Panel A). The median AC seven-day readmission rate across all quarters was 5.1%, ranging from 4.3% to 5.3% (Figure, Panels A and B). The median seven-day PPR rate across all quarters was 2.5% and ranged from 2.1% to 2.5% (Figure, Panels A and C). When adjusted for case mix index, the AC rate increased slightly (on average 0.006% increase per quarter, P = .01) and PPR rates were unchanged over time (PPR model P = .14; Figure, Panel D).
Condition-Specific Readmission Rates
Of the condition-specific readmission rates, only the AC rate for BMT changed significantly, with a decrease of 0.1% per quarter, P = .048. None of the conditions had significant trends in increasing or decreasing readmission in PPR rates. Some conditions, including sickle cell and cerebrospinal fluid ventricular shunt procedures, had fluctuating readmission rates throughout the study period (Appendix Figure, Panels A-G).
DISCUSSION
Despite substantial national efforts to reduce pediatric readmissions,3 seven-day readmission rates at children’s hospitals have not decreased over six years. When individual conditions are examined, there are minor fluctuations of readmission rates over time but no clear trend of decreased readmission events.
Our results are contrary to findings in the Medicare population, where 30-day readmission rates have decreased over time.13,14 In these analyses, we focused on seven-day readmission, as earlier pediatric readmissions are more likely to be preventable. Importantly, the majority of our included hospitals (88%) participate in the Solutions for Patient Safety collaborative, which focuses on reducing seven-day readmissions. Thus, we are confident that a concerted effort to decrease readmission has been ongoing. Further, our findings are contrary to recent analyses indicating an increase in pediatric readmission rates using the pediatric all-condition readmission rate in the National Readmission Database.15 Our analyses are distinctly different in that they allow a focus on hospital-level performance in children’s hospitals. Although in our analyses the all-cause adjusted readmission rate did increase significantly over time (0.006% a quarter or 0.024% per year), this small increase is unlikely to be clinically relevant.
There are several potential reasons for the lack of change in pediatric readmission rates despite concerted efforts to decrease readmissions. First, pediatric readmissions across all conditions are relatively infrequent compared with adult readmission rates. Extrapolating from the largest pediatric study on readmission preventability,8 it is estimated that only two in 100 pediatric hospitalizations results in a PPR.16 Given the lack of robust pediatric readmission prediction tools, the ability to prospectively identify children at high risk for readmission and target interventions is challenging. Second, as we have previously described, children are readmitted after hospitalization for a wide variety of conditions.5 Medicare readmission penalties are leveraged on specific conditions; yet, Medicaid policies include all conditions. In pediatrics, successful interventions to reduce readmissions have focused on hospitalizations for specific conditions.17 In the only two large pediatric readmission reduction trials across multiple conditions, postdischarge homecare nursing contact did not reduce reutilization.18,19 It is challenging to decrease readmissions in heterogenous populations without a robust set of evidence-based interventions. Third, there are multiple ways to measure pediatric readmissions, and different institutions may focus on different methods. Given the proprietary nature and the reliance on retrospective administrative data, PPR rates cannot be assessed during admission and thus are not feasible as a real-time quality improvement outcome. Fourth, in contrast to other hospital quality metrics such as central line-associated bloodstream infections or catheter-associated urinary tract infection, the locus of control for readmission is not entirely within the purview of the hospital.
It is unclear what readmission rate in children is appropriate—or safe—and whether that level has already been met. National readmission prevention efforts may have collateral benefits such as improved communication, medication errors or adherence, and other important aspects of care during transitions. In this scenario, lower readmission rates may not reflect improved quality. Future research should focus on determining if and how readmission reduction efforts are helping to ease the transition to home. Alternatively, research should determine if there are better interventions to assist with transition challenges which should receive resources divested from failing readmission reduction efforts.
Using administrative data, we are limited in delineating truly preventable readmissions from nonpreventable readmissions. Nevertheless, we chose to focus on the PPR and AC metrics, as these are the most policy-relevant metrics. Additionally, we examined aggregate rates of readmission across a cohort of hospitals and did not assess for within-hospital changes in readmission rates. Thus, it is possible (and likely) that some hospitals saw improvements and others saw increases in readmission rates during the study period. We are unable to examine readmission rates at hospitals based on investment in readmission reduction efforts or individual state Medicaid reimbursement policies. Finally, we are unable to assess readmissions to other institutions; however, it is unlikely that readmissions to other hospitals have decreased significantly when readmissions to the discharging hospital have not changed.
Pediatric readmissions at children’s hospitals have not decreased in the past six years, despite widespread readmission reduction efforts. Readmission rates for individual conditions have fluctuated but have not decreased.
Disclosures
Dr. Auger reports grants from AHRQ, during the conduct of the study. Drs. Harris, Gay, Teufel, McLead, Neuman, Peltz, Morse, Del Beccaro, Simon, Argawal, and Fieldston have nothing to disclose. Dr. Shah is the Editor-in-Chief of the Journal of Hospital Medicine.
Funding
Dr. Auger’s research is funded by a K08 award from the Agency for Healthcare Research and Quality (1K08HS024735-01A).
1. Centers for Medicare & Medicaid Services. Readmissions Reduction Program (HRRP). https://www.cms.gov/Medicare/Medicare-Fee-for-Service-Payment/AcuteInpatientPPS/Readmissions-Reduction-Program.html. Accessed January 19, 2018.
2. 3M Health Information Systems. Potentially Preventable Readmissions Classification System: Methodology Overview. http://multimedia.3m.com/mws/media/1042610O/resources-and-references-his-2015.pdf. Accessed April 5, 2019.
3. Children’s Hospitals’ Solutions for Patient Safety. SPS prevention bundles: readmission. http://www.solutionsforpatientsafety.org/wp-content/uploads/SPS-Prevention-Bundles.pdf. Accessed January 11, 2017.
4. Berry JG, Toomey SL, Zaslavsky AM, et al. Pediatric readmission prevalence and variability across hospitals. JAMA. 2013;309(4):372-380. https://doi.org/10.1001/jama.2012.188351.
5. Gay JC, Agrawal R, Auger KA, et al. Rates and impact of potentially preventable readmissions at children’s hospitals. J Pediatr. 2015;166(3):613-619. https://doi.org/10.1016/j.jpeds.2014.10.052.
6. Auger KA, Teufel RJ, Harris JM, et al. Children’s hospital characteristics and readmission metrics. Pediatrics. 2017;139(2):e20161720. https://doi.org/10.1542/peds.2016-1720.
7. Joynt KE, Orav EJ, Jha AK. Thirty-day readmission rates for medicare beneficiaries by race and site of care. JAMA. 2011;305(7):675-681. https://doi.org/10.1001/jama.2011.123.
8. Toomey SL, Peltz A, Loren S, et al. Potentially preventable 30-day hospital readmissions at a children’s hospital. Pediatrics. 2016;138(2):e20154182. doi: 10.1542/peds.2015-4182.
9. Children’s Hospital Association. Pediatric analytic solutions. https://www.childrenshospitals.org/Programs-and-Services/Data-Analytics-and-Research/Pediatric-Analytic-Solutions. Accessed June 2, 2018.
10. Simon TD, Berry J, Feudtner C, et al. Children with complex chronic conditions in inpatient hospital settings in the United States. Pediatrics. 2010;126(4):647-655. https://doi.org/10.1542/peds.2009-3266.
11. Berry JG, Hall M, Hall DE, et al. Inpatient growth and resource use in 28 children’s hospitals: a longitudinal, multi-institutional study. JAMA Pediatr. 2013;167(2):170-177.https://doi.org/10.1001/jamapediatrics.2013.432.
12. Richardson T, Rodean J, Harris M, et al. Development of hospitalization resource intensity scores for kids (H-RISK) and comparison across pediatric populations. J Hosp Med. 2018;13(9):602-608. https://doi.org/10.12788/jhm.2948.
13. Zuckerman RB, Sheingold SH, Orav EJ, Ruhter J, Epstein AM. Readmissions, observation, and the hospital readmissions reduction program. N Engl J Med. 2016;374(16):1543-1551. https://doi.org/10.1056/NEJMsa1513024.
14. Desai NR, Ross JS, Kwon JY, et al. Association between hospital penalty status under the hospital readmission reduction program and readmission rates for target and nontarget conditions. JAMA. 2016;316(24):2647-2656. https://doi.org/10.1001/jama.2016.18533.
15. Bucholz EM, Toomey SL, Schuster MA. Trends in pediatric hospitalizations and readmissions: 2010-2016. Pediatrics. 2019;143(2):e20181958. https://doi.org/10.1542/peds.2018-1958.
16. Brittan M, Shah SS, Auger KA. Preventing pediatric readmissions: how does the hospital fit in? Pediatrics. 2016;138(2):e20161643. https://doi.org/10.1542/peds.2016-1643.
17. Auger KA, Kenyon CC, Feudtner C, Davis MM. Pediatric hospital discharge interventions to reduce subsequent utilization: a systematic review. J Hosp Med. 2014;9(4):251-260. https://doi.org/10.1002/jhm.2134.
18. Auger KA, Simmons JM, Tubbs-Cooley H, et al. Hospital to home outcomes (H2O) randomized trial of a post-discharge nurse home visit. Pediatrics. In press.
19. Auger KA, Shah SS, Tubbs-Cooley HL, et al. Effects of a 1-time nurse-led telephone call after pediatric discharge: the H2O II randomized clinical trial. JAMA Pediatr. 2018;172(9):e181482. https://doi.org/10.1001/jamapediatrics.2018.1482.
Readmission rates have been used by payers to administer financial incentives or penalties to hospitals as a measure of quality. The Centers for Medicare and Medicaid Services (CMS) reduces payments to hospitals with excess readmissions for adult Medicare patients.1 Although the Medicare readmission penalties do not apply to children, several state Medicaid agencies have adopted policies to reduce reimbursement for hospitals with higher than expected readmission rates. These Medicaid programs often use potentially preventable readmission (PPR) rates calculated with proprietary software.2 As a result of these incentives and with a goal of improving care, many children’s hospitals have focused on reducing readmissions through participation in local, regional, and national collaboratives.3
Rates of unplanned readmissions in children are lower than in older adults, with all-cause 30-day pediatric readmission rates around 13%.4-7 Even so, as many as 30% of pediatric readmissions may be potentially preventable, with the most common transition failure involving a hospital factor, such as failure to recognize worsening clinical status prior to discharge.8 While readmission metrics are often judged across peer institutions, little is known about national trends over time. Therefore, we sought to examine readmission rates at children’s hospitals over a six-year timeframe to determine if progress has been made toward reducing readmissions.
METHODS
We utilized data from the Children’s Hospital Association Inpatient Essentials Database and included index hospitalizations from January 1, 2010 through June 30, 2016. This database contains demographic information, diagnosis and procedure codes, and All-Patient Refined Diagnosis-Related Groups (APR-DRGs; 3M Health Information Systems) to describe the principal reason for each hospitalization.9 We included 66 hospitals from 31 states plus the District of Columbia with complete data during the study period.
Seven-day all-cause (AC) readmission and PPR rates were calculated using the output from 3M potentially preventable readmission software (version 32). The PPR software utilizes a proprietary algorithm to designate potentially preventable readmissions based on diagnosis codes and the severity of illness (as measured by the APR-DRG severity of illness classification). We chose seven-day readmissions, as opposed to a longer window, as readmissions soon after discharge are more likely to be preventable8 and thus theoretically more amenable to prevention efforts. Quarterly rates were generated for each hospital and in aggregate across the population. We chose quarterly rates a priori to assess changes in rates without focusing on minor monthly fluctuations due to seasonal differences. We performed generalized linear mixed regression models with cluster adjustments at the hospital level to assess changes in readmission rates over time adjusted for case mix index, as admissions to children’s hospitals have increased in complexity over time.10,11 We operationalized the case mix index as an average of pediatric admissions’ relative weights at each hospital for the quarter.12 We assessed AC and PPR models separately. The average case mix index was a covariate in both regression models.
Finally, to determine if readmission reduction may be specific to particular conditions, we generated readmission rates for a select number of APR-DRGs. We focused on conditions with a very high percentage of AC readmissions classified as PPR (appendectomy, connective tissue disorders, ventricular shunt procedures, bronchiolitis, asthma, and sickle cell crisis) as well as those with a very low percentage of AC readmissions classified as PPR (gastrointestinal infections, hematologic disease, and bone marrow transplant [BMT]).5
RESULTS
We included 4.52 million admissions to the 66 included hospitals. Most hospitals (62%) were freestanding acute-care children’s hospitals. The hospitals were geographically diverse. Two-thirds had magnet status (Appendix Table 1). Appendix Table 2 displays patient/admission characteristics over time. Approximately 49% of children were non-Hispanic white, 19% were non-Hispanic black, and 19% were Hispanic. Half of the children were insured by Medicaid. These characteristics were stable over time, except case mix index, which increased during the study period (P = .04).
Across Diagnosis All-Cause and Potentially Preventable Readmission Rates
Over the study period, there were 227,378 AC seven-day readmissions (5.1% readmission rate), and 91,467 readmissions (40% of AC readmissions) were considered PPRs. Readmission rates did not vary over the study period (Figure, Panel A). The median AC seven-day readmission rate across all quarters was 5.1%, ranging from 4.3% to 5.3% (Figure, Panels A and B). The median seven-day PPR rate across all quarters was 2.5% and ranged from 2.1% to 2.5% (Figure, Panels A and C). When adjusted for case mix index, the AC rate increased slightly (on average 0.006% increase per quarter, P = .01) and PPR rates were unchanged over time (PPR model P = .14; Figure, Panel D).
Condition-Specific Readmission Rates
Of the condition-specific readmission rates, only the AC rate for BMT changed significantly, with a decrease of 0.1% per quarter, P = .048. None of the conditions had significant trends in increasing or decreasing readmission in PPR rates. Some conditions, including sickle cell and cerebrospinal fluid ventricular shunt procedures, had fluctuating readmission rates throughout the study period (Appendix Figure, Panels A-G).
DISCUSSION
Despite substantial national efforts to reduce pediatric readmissions,3 seven-day readmission rates at children’s hospitals have not decreased over six years. When individual conditions are examined, there are minor fluctuations of readmission rates over time but no clear trend of decreased readmission events.
Our results are contrary to findings in the Medicare population, where 30-day readmission rates have decreased over time.13,14 In these analyses, we focused on seven-day readmission, as earlier pediatric readmissions are more likely to be preventable. Importantly, the majority of our included hospitals (88%) participate in the Solutions for Patient Safety collaborative, which focuses on reducing seven-day readmissions. Thus, we are confident that a concerted effort to decrease readmission has been ongoing. Further, our findings are contrary to recent analyses indicating an increase in pediatric readmission rates using the pediatric all-condition readmission rate in the National Readmission Database.15 Our analyses are distinctly different in that they allow a focus on hospital-level performance in children’s hospitals. Although in our analyses the all-cause adjusted readmission rate did increase significantly over time (0.006% a quarter or 0.024% per year), this small increase is unlikely to be clinically relevant.
There are several potential reasons for the lack of change in pediatric readmission rates despite concerted efforts to decrease readmissions. First, pediatric readmissions across all conditions are relatively infrequent compared with adult readmission rates. Extrapolating from the largest pediatric study on readmission preventability,8 it is estimated that only two in 100 pediatric hospitalizations results in a PPR.16 Given the lack of robust pediatric readmission prediction tools, the ability to prospectively identify children at high risk for readmission and target interventions is challenging. Second, as we have previously described, children are readmitted after hospitalization for a wide variety of conditions.5 Medicare readmission penalties are leveraged on specific conditions; yet, Medicaid policies include all conditions. In pediatrics, successful interventions to reduce readmissions have focused on hospitalizations for specific conditions.17 In the only two large pediatric readmission reduction trials across multiple conditions, postdischarge homecare nursing contact did not reduce reutilization.18,19 It is challenging to decrease readmissions in heterogenous populations without a robust set of evidence-based interventions. Third, there are multiple ways to measure pediatric readmissions, and different institutions may focus on different methods. Given the proprietary nature and the reliance on retrospective administrative data, PPR rates cannot be assessed during admission and thus are not feasible as a real-time quality improvement outcome. Fourth, in contrast to other hospital quality metrics such as central line-associated bloodstream infections or catheter-associated urinary tract infection, the locus of control for readmission is not entirely within the purview of the hospital.
It is unclear what readmission rate in children is appropriate—or safe—and whether that level has already been met. National readmission prevention efforts may have collateral benefits such as improved communication, medication errors or adherence, and other important aspects of care during transitions. In this scenario, lower readmission rates may not reflect improved quality. Future research should focus on determining if and how readmission reduction efforts are helping to ease the transition to home. Alternatively, research should determine if there are better interventions to assist with transition challenges which should receive resources divested from failing readmission reduction efforts.
Using administrative data, we are limited in delineating truly preventable readmissions from nonpreventable readmissions. Nevertheless, we chose to focus on the PPR and AC metrics, as these are the most policy-relevant metrics. Additionally, we examined aggregate rates of readmission across a cohort of hospitals and did not assess for within-hospital changes in readmission rates. Thus, it is possible (and likely) that some hospitals saw improvements and others saw increases in readmission rates during the study period. We are unable to examine readmission rates at hospitals based on investment in readmission reduction efforts or individual state Medicaid reimbursement policies. Finally, we are unable to assess readmissions to other institutions; however, it is unlikely that readmissions to other hospitals have decreased significantly when readmissions to the discharging hospital have not changed.
Pediatric readmissions at children’s hospitals have not decreased in the past six years, despite widespread readmission reduction efforts. Readmission rates for individual conditions have fluctuated but have not decreased.
Disclosures
Dr. Auger reports grants from AHRQ, during the conduct of the study. Drs. Harris, Gay, Teufel, McLead, Neuman, Peltz, Morse, Del Beccaro, Simon, Argawal, and Fieldston have nothing to disclose. Dr. Shah is the Editor-in-Chief of the Journal of Hospital Medicine.
Funding
Dr. Auger’s research is funded by a K08 award from the Agency for Healthcare Research and Quality (1K08HS024735-01A).
1. Centers for Medicare & Medicaid Services. Readmissions Reduction Program (HRRP). https://www.cms.gov/Medicare/Medicare-Fee-for-Service-Payment/AcuteInpatientPPS/Readmissions-Reduction-Program.html. Accessed January 19, 2018.
2. 3M Health Information Systems. Potentially Preventable Readmissions Classification System: Methodology Overview. http://multimedia.3m.com/mws/media/1042610O/resources-and-references-his-2015.pdf. Accessed April 5, 2019.
3. Children’s Hospitals’ Solutions for Patient Safety. SPS prevention bundles: readmission. http://www.solutionsforpatientsafety.org/wp-content/uploads/SPS-Prevention-Bundles.pdf. Accessed January 11, 2017.
4. Berry JG, Toomey SL, Zaslavsky AM, et al. Pediatric readmission prevalence and variability across hospitals. JAMA. 2013;309(4):372-380. https://doi.org/10.1001/jama.2012.188351.
5. Gay JC, Agrawal R, Auger KA, et al. Rates and impact of potentially preventable readmissions at children’s hospitals. J Pediatr. 2015;166(3):613-619. https://doi.org/10.1016/j.jpeds.2014.10.052.
6. Auger KA, Teufel RJ, Harris JM, et al. Children’s hospital characteristics and readmission metrics. Pediatrics. 2017;139(2):e20161720. https://doi.org/10.1542/peds.2016-1720.
7. Joynt KE, Orav EJ, Jha AK. Thirty-day readmission rates for medicare beneficiaries by race and site of care. JAMA. 2011;305(7):675-681. https://doi.org/10.1001/jama.2011.123.
8. Toomey SL, Peltz A, Loren S, et al. Potentially preventable 30-day hospital readmissions at a children’s hospital. Pediatrics. 2016;138(2):e20154182. doi: 10.1542/peds.2015-4182.
9. Children’s Hospital Association. Pediatric analytic solutions. https://www.childrenshospitals.org/Programs-and-Services/Data-Analytics-and-Research/Pediatric-Analytic-Solutions. Accessed June 2, 2018.
10. Simon TD, Berry J, Feudtner C, et al. Children with complex chronic conditions in inpatient hospital settings in the United States. Pediatrics. 2010;126(4):647-655. https://doi.org/10.1542/peds.2009-3266.
11. Berry JG, Hall M, Hall DE, et al. Inpatient growth and resource use in 28 children’s hospitals: a longitudinal, multi-institutional study. JAMA Pediatr. 2013;167(2):170-177.https://doi.org/10.1001/jamapediatrics.2013.432.
12. Richardson T, Rodean J, Harris M, et al. Development of hospitalization resource intensity scores for kids (H-RISK) and comparison across pediatric populations. J Hosp Med. 2018;13(9):602-608. https://doi.org/10.12788/jhm.2948.
13. Zuckerman RB, Sheingold SH, Orav EJ, Ruhter J, Epstein AM. Readmissions, observation, and the hospital readmissions reduction program. N Engl J Med. 2016;374(16):1543-1551. https://doi.org/10.1056/NEJMsa1513024.
14. Desai NR, Ross JS, Kwon JY, et al. Association between hospital penalty status under the hospital readmission reduction program and readmission rates for target and nontarget conditions. JAMA. 2016;316(24):2647-2656. https://doi.org/10.1001/jama.2016.18533.
15. Bucholz EM, Toomey SL, Schuster MA. Trends in pediatric hospitalizations and readmissions: 2010-2016. Pediatrics. 2019;143(2):e20181958. https://doi.org/10.1542/peds.2018-1958.
16. Brittan M, Shah SS, Auger KA. Preventing pediatric readmissions: how does the hospital fit in? Pediatrics. 2016;138(2):e20161643. https://doi.org/10.1542/peds.2016-1643.
17. Auger KA, Kenyon CC, Feudtner C, Davis MM. Pediatric hospital discharge interventions to reduce subsequent utilization: a systematic review. J Hosp Med. 2014;9(4):251-260. https://doi.org/10.1002/jhm.2134.
18. Auger KA, Simmons JM, Tubbs-Cooley H, et al. Hospital to home outcomes (H2O) randomized trial of a post-discharge nurse home visit. Pediatrics. In press.
19. Auger KA, Shah SS, Tubbs-Cooley HL, et al. Effects of a 1-time nurse-led telephone call after pediatric discharge: the H2O II randomized clinical trial. JAMA Pediatr. 2018;172(9):e181482. https://doi.org/10.1001/jamapediatrics.2018.1482.
© 2019 Society of Hospital Medicine
Emergency Transfers: An Important Predictor of Adverse Outcomes in Hospitalized Children
Unrecognized in-hospital deterioration can result in tragic consequences for pediatric patients. The majority of deterioration events have antecedents such as increasingly abnormal vital signs and new concerns from nurses.1 Recent meta-analyses have shown that rapid response systems (RRSs), which include trigger mechanisms such as a pediatric early warning score (PEWS), are associated with a reduced rate of arrests and in-hospital mortality.2,3 Cardiopulmonary arrest rates are useful metrics to judge the effectiveness of the system to identify and respond to deteriorating adult patients; however, there are important challenges to their use as an outcome measure in pediatrics. Arrests, which have been relatively uncommon in pediatric patients, are now even less frequent since the adoption of a RRS in the majority of children’s hospitals.4,5 Several innovations in these systems will be context-dependent and hence best first evaluated in a single center, where arrests outside of the intensive care unit (ICU) may occur rarely. Identification of valid, more frequent proximal measures to arrests may better identify the risk factors for deterioration. This could potentially inform quality improvement efforts to mitigate clinical deterioration.
Bonafide et al. at the Children’s Hospital of Philadelphia developed and validated the critical deterioration event (CDE) metric, demonstrating that children who were transferred to the ICU and who received noninvasive ventilation, intubation, or vasopressor initiation within 12 hours of transfer had a >13-fold increased risk of in-hospital mortality.6 At Cincinnati Children’s Hospital Medical Center, an additional proximal outcome measure was developed for unrecognized clinical deterioration, now termed emergency transfers (ETs).7-9 An ET is defined as any patient transferred to the ICU where the patient received intubation, inotropes, or three or more fluid boluses in the first hour after arrival or before transfer.9 Improvement science work that aimed at increasing clinician situation awareness was associated with a reduction in ETs,8 but the association of ETs with mortality or other healthcare utilization outcomes is unknown. The objective of this study was to determine the predictive validity of an ET on in-hospital mortality, ICU length of stay (LOS), and overall hospital LOS.
METHODS
We conducted a case–control study at Cincinnati Children’s Hospital, a free-standing tertiary care children’s hospital. Our center has had an ICU-based RRS in place since 2005. In 2009, we eliminated the ICU consult such that each floor-to-ICU transfer is evaluated by the RRS. Nurses calculate a Monaghan PEWS every four hours on the majority of nursing units.
Patients of all ages cared for outside of the ICU at any point in their hospitalization from January 1, 2013, to July 31, 2017, were eligible for inclusion. There were no other exclusion criteria. The ICU included both the pediatric ICU and the cardiac ICU.
Cases
We identified all ET cases from an existing situation awareness database in which each RRS call is entered by the hospital nursing supervisor, whose role includes responding to each RRS activation. If the patient transfer meets the ET criteria, the nurse indicates this in the database. Each ET entry is later confirmed for assurance purposes by the nurse leader of the RRS committee (RG). For the purposes of this study, all records were again reviewed and validated using manual chart review in the electronic health record (Epic Systems, Verona, Wisconsin).
Controls
We identified nonemergent ICU transfers to serve as controls and matched those to ET in cases to limit the impact of confounders that may increase the likelihood of both an ET and a negative outcome such as ICU mortality. We identified up to three controls for each case from our database and matched in terms of age group (within five years of age), hospital unit before transfer, and time of year (within three months of ET). These variables were chosen to adjust for the impact of age, diversity of disease (as hospital units are generally organized by organ system of illness), and seasonality on outcomes.
Outcome Measures
Posttransfer LOS in the ICU, posttransfer hospital LOS, and in-hospital mortality were the primary outcome measures. Patient demographics, specific diagnoses, and number of medical conditions were a priori defined as covariates of interest. Data for each case and control were entered into a secure, web-based Research Electronic Data Capture (REDCap) database.
Analysis
Descriptive data were summarized using counts and percentages for categorical variables and medians and ranges for continuous variables due to nonnormal distributions. Chi-square test was used to compare in-hospital mortality between the ETs and the controls. The Wilcoxon rank-sum test was used to compare LOS between ETs and controls. All data analyses were performed using SAS version 9.4 (SAS Institute Inc., Cary, North Carolina).
RESULTS
A total of 45 ETs were identified, and 110 controls were matched. Patient demographics were similar among all cases and controls (P > .05). Patients with ETs had a median age of seven years (interquartile range: 3-18 years), and 51% of them were males. The majority of patients among our examined cases were white (68%) and non-Hispanic (93%). There was no statistical difference in insurance between the ETs and the controls. When evaluating the hospital unit before the transfer, ETs occurred most commonly in the Cardiology (22%), Hematology/Oncology (22%), and Neuroscience (16%) units.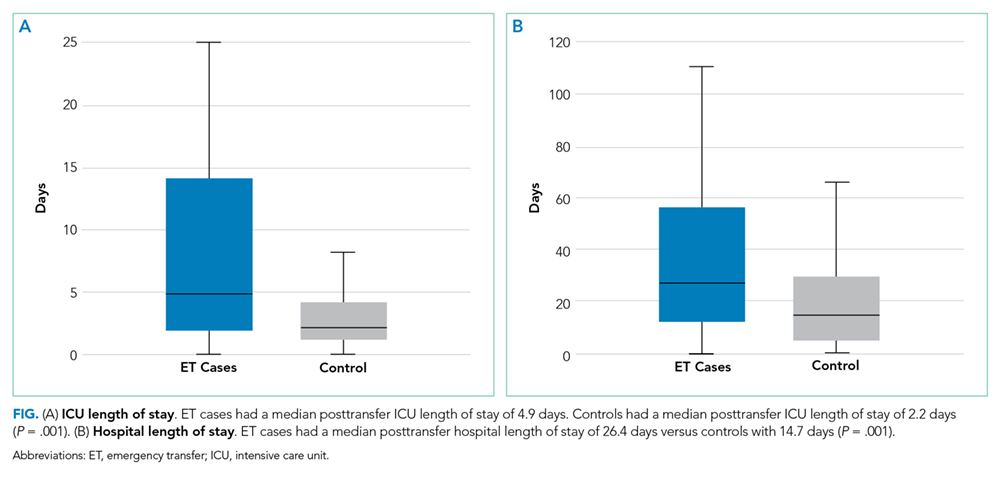
ETs stayed longer in the ICU than non-ETs [median of 4.9 days vs 2.2 days, P = .001; Figure (A)]. Similarly, ET cases had a significantly longer posttransfer hospital LOS [median of 35 days vs 21 days, P = .001; Figure (B)]. ETs had a 22% in-hospital mortality rate, compared with 9% in-hospital mortality in the matched controls (P = .02; Table).
DISCUSSION
Children who experienced an ET had a significantly longer ICU LOS, a longer posttransfer LOS, and a higher in-hospital mortality than the matched controls who were also transferred to the ICU. Researchers and improvement science teams at multiple hospitals have demonstrated that interventions targeting improved situation awareness can reduce ETs; we have demonstrated that reducing ETs may reduce subsequent adverse outcomes.8,10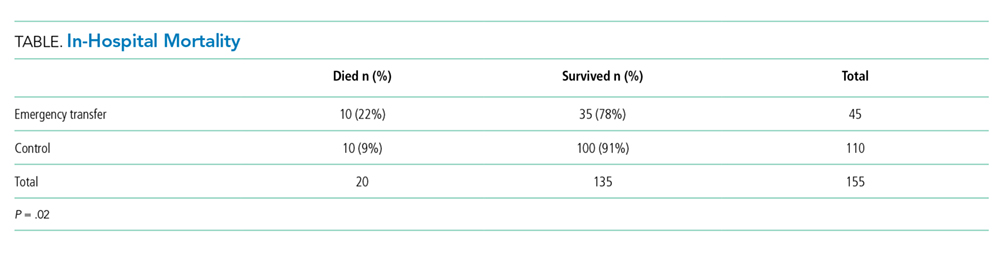
These findings provide additional support for the use of the ET metric in children’s hospitals as a proximal measure for significant clinical deterioration. We found mortality rates that were overall high for a children’s hospital (22% in ET cases and 9% among controls) compared with a national average mortality rate of 2.3% in pediatric ICUs.11 This is likely due to the study sample containing a significant proportion of children with medical complexity.
Aoki et al. recently demonstrated that ETs, compared with non-ETs, were associated with longer LOS and higher mortality in a bivariate analysis.12 In our study, we found similar results with the important addition that these findings were robust when ETs were compared with matched controls who were likely at a higher risk of poor outcomes than ICU transfers in general. In addition, we demonstrated that ETs were associated with adverse outcomes in a United States children’s hospital with a mature, long-standing RRS process. As ETs are considerably more common than cardiac and respiratory arrests, use of the ET metric in children’s hospitals may enable more rapid learning and systems improvement implementations. We also found that most of the children with ETs present from units that care for children with substantial medical complexity, including Cardiology, Hematology/Oncology, and Neurosciences. Future work should continue to examine the relationship between medical complexity and ET risk.
The ET metric is complementary to the CDE measure developed by Bonafide et al. Both metrics capture potential events of unrecognized clinical deterioration, and both offer researchers the opportunity to better understand and improve their RRSs. Both ETs and CDEs are more common than arrests, and CDEs are more common than ETs. ETs, which by definition occur in the first hour of ICU care, are likely a more specific measure of unrecognized clinical deterioration. CDEs will capture therapies that may have been started up to 12 hours after transfer and thus are possibly more sensitive to identify unrecognized clinical deterioration. However, CDEs also may encompass some patients who arrived at the ICU after prompt recognition and then had a subacute deterioration in the ICU.
The maturity of the RRS and the bandwidth of teams to collect data may inform which metric(s) are best for individual centers. As ETs are less common and likely more specific to unrecognized clinical deterioration, they might be the first tracked as a center improves its RRS through QI methods. Alternatively, CDEs may be a useful metric for centers where unrecognized clinical deterioration is less common or in research studies where this more common outcome would lead to more power to detect the effect of interventions to improve care.
Our study had several limitations. Data collection was confined to one tertiary care children’s hospital with a high burden of complex cardiac and oncology care. The results may not generalize well to children hospitalized in smaller or community hospitals or in hospitals without a mature RRS. There is also the possibility of misclassification of covariates and outcomes, but any misclassification would likely be nondifferential and bias toward the null. Matching was not possible based on exact diagnosis, and the unit is a good but imperfect proxy for diagnosis grouping. At our center, overflow of patients into the Cardiology and Hematology/Oncology units is uncommon, mitigating this partially, although residual confounding may remain. The finding that ETs are associated with adverse outcomes does not necessarily mean that these events were preventable; however, it is important and encouraging that the rate of ETs has been reduced at two centers using improvement science interventions.8,10
CONCLUSION
Patients who experienced an ET had a significantly higher likelihood of in-hospital mortality, spent more time in the ICU, and had a longer hospital LOS posttransfer than matched controls. The use of the ET metric in children’s hospitals would allow for further analysis of such patients in hopes of identifying clinical characteristics that serve as predictors of deterioration. This may facilitate better risk stratification in the clinical system as well as enable more rapid learning and systems improvements targeted toward preventing unrecognized clinical deterioration.
Disclosures
Dr. Hussain, Dr. Sosa, Dr. Ambroggio, and Mrs. Gallagher have nothing to disclose. Patrick Brady reports grants from the Agency for Healthcare Research and Quality, outside the submitted work. The authors certify that this submission is not under review by any other publication. The author team has no conflicts of interest to disclose.
Funding
Ms. Hussain was supported by the Society of Hospital Medicine’s Student Hospitalist Scholar Grant Program in 2017. Dr. Brady receives career development support from AHRQ K08-HS023827. The project described was supported by the National Center for Advancing Translational Sciences of the National Institutes of Health, under Award Number 5UL1TR001425-04. The content is solely the responsibility of the authors and does not necessarily represent the official views of the SHM, AHRQ, or NIH.
1. Schein RM, Hazday N, Pena M, Ruben BH, Sprung CL. Clinical antecedents to in-hospital cardiopulmonary arrest. Chest. 1990;98(6):1388-1392. https://doi.org/10.1378/chest.98.6.1388.
2. Maharaj R, Raffaele I, Wendon J. Rapid response systems: a systematic review and meta-analysis. Crit Care. 2015;19:254. https://doi.org/10.1186/s13054-015-0973-y.
3. Bonafide CP, Roland D, Brady PW. Rapid response systems 20 years later: new approaches, old challenges. JAMA Pediatrics. 2016;170(8):729-730. https://doi.org/10.1001/jamapediatrics.2016.0398.
4. Hayes LW, Dobyns EL, DiGiovine B, et al. A multicenter collaborative approach to reducing pediatric codes outside the ICU. Pediatrics. 2012;129(3):e785-e791. https://doi.org/10.1542/peds.2011-0227.
5. Raymond TT, Bonafide CP, Praestgaard A, et al. Pediatric medical emergency team events and outcomes: a report of 3647 events from the American Heart Association’s get with the guidelines-resuscitation registry. Hosp Pediatr. 2016;6(2):57-64. https://doi.org/10.1542/hpeds.2015-0132.
6. Bonafide CP, Roberts KE, Priestley MA, et al. Development of a pragmatic measure for evaluating and optimizing rapid response systems. Pediatrics. 2012;129(4):e874-e881. https://doi.org/10.1542/peds.2011-2784.
7. Brady PW, Goldenhar LM. A qualitative study examining the influences on situation awareness and the identification, mitigation and escalation of recognised patient risk. BMJ Qual Saf. 2014;23(2):153-161. https://doi.org/10.1136/bmjqs-2012-001747.
8. Brady PW, Muething S, Kotagal U, et al. Improving situation awareness to reduce unrecognized clinical deterioration and serious safety events. Pediatrics. 2013;131(1):e298-e308. https://doi.org/10.1542/peds.2012-1364.
9. Brady PW, Wheeler DS, Muething SE, Kotagal UR. Situation awareness: a new model for predicting and preventing patient deterioration. Hosp Pediatr. 2014;4(3):143-146. https://doi.org/10.1542/hpeds.2013-0119.
10. McClain Smith M, Chumpia M, Wargo L, Nicol J, Bugnitz M. Watcher initiative associated with decrease in failure to rescue events in pediatric population. Hosp Pediatr. 2017;7(12):710-715. https://doi.org/10.1542/hpeds.2017-0042.
11. McCrory MC, Spaeder MC, Gower EW, et al. Time of admission to the PICU and mortality. Pediatr Crit Care Med. 2017;18(10):915-923. https://doi.org/10.1097/PCC.0000000000001268.
12. Aoki Y, Inata Y, Hatachi T, Shimizu Y, Takeuchi M. Outcomes of ‘unrecognised situation awareness failures events’ in intensive care unit transfer of children in a Japanese children’s hospital. J Paediatr Child Health. 2018;55(2):213-215. https://doi.org/10.1111/jpc.14185.
Unrecognized in-hospital deterioration can result in tragic consequences for pediatric patients. The majority of deterioration events have antecedents such as increasingly abnormal vital signs and new concerns from nurses.1 Recent meta-analyses have shown that rapid response systems (RRSs), which include trigger mechanisms such as a pediatric early warning score (PEWS), are associated with a reduced rate of arrests and in-hospital mortality.2,3 Cardiopulmonary arrest rates are useful metrics to judge the effectiveness of the system to identify and respond to deteriorating adult patients; however, there are important challenges to their use as an outcome measure in pediatrics. Arrests, which have been relatively uncommon in pediatric patients, are now even less frequent since the adoption of a RRS in the majority of children’s hospitals.4,5 Several innovations in these systems will be context-dependent and hence best first evaluated in a single center, where arrests outside of the intensive care unit (ICU) may occur rarely. Identification of valid, more frequent proximal measures to arrests may better identify the risk factors for deterioration. This could potentially inform quality improvement efforts to mitigate clinical deterioration.
Bonafide et al. at the Children’s Hospital of Philadelphia developed and validated the critical deterioration event (CDE) metric, demonstrating that children who were transferred to the ICU and who received noninvasive ventilation, intubation, or vasopressor initiation within 12 hours of transfer had a >13-fold increased risk of in-hospital mortality.6 At Cincinnati Children’s Hospital Medical Center, an additional proximal outcome measure was developed for unrecognized clinical deterioration, now termed emergency transfers (ETs).7-9 An ET is defined as any patient transferred to the ICU where the patient received intubation, inotropes, or three or more fluid boluses in the first hour after arrival or before transfer.9 Improvement science work that aimed at increasing clinician situation awareness was associated with a reduction in ETs,8 but the association of ETs with mortality or other healthcare utilization outcomes is unknown. The objective of this study was to determine the predictive validity of an ET on in-hospital mortality, ICU length of stay (LOS), and overall hospital LOS.
METHODS
We conducted a case–control study at Cincinnati Children’s Hospital, a free-standing tertiary care children’s hospital. Our center has had an ICU-based RRS in place since 2005. In 2009, we eliminated the ICU consult such that each floor-to-ICU transfer is evaluated by the RRS. Nurses calculate a Monaghan PEWS every four hours on the majority of nursing units.
Patients of all ages cared for outside of the ICU at any point in their hospitalization from January 1, 2013, to July 31, 2017, were eligible for inclusion. There were no other exclusion criteria. The ICU included both the pediatric ICU and the cardiac ICU.
Cases
We identified all ET cases from an existing situation awareness database in which each RRS call is entered by the hospital nursing supervisor, whose role includes responding to each RRS activation. If the patient transfer meets the ET criteria, the nurse indicates this in the database. Each ET entry is later confirmed for assurance purposes by the nurse leader of the RRS committee (RG). For the purposes of this study, all records were again reviewed and validated using manual chart review in the electronic health record (Epic Systems, Verona, Wisconsin).
Controls
We identified nonemergent ICU transfers to serve as controls and matched those to ET in cases to limit the impact of confounders that may increase the likelihood of both an ET and a negative outcome such as ICU mortality. We identified up to three controls for each case from our database and matched in terms of age group (within five years of age), hospital unit before transfer, and time of year (within three months of ET). These variables were chosen to adjust for the impact of age, diversity of disease (as hospital units are generally organized by organ system of illness), and seasonality on outcomes.
Outcome Measures
Posttransfer LOS in the ICU, posttransfer hospital LOS, and in-hospital mortality were the primary outcome measures. Patient demographics, specific diagnoses, and number of medical conditions were a priori defined as covariates of interest. Data for each case and control were entered into a secure, web-based Research Electronic Data Capture (REDCap) database.
Analysis
Descriptive data were summarized using counts and percentages for categorical variables and medians and ranges for continuous variables due to nonnormal distributions. Chi-square test was used to compare in-hospital mortality between the ETs and the controls. The Wilcoxon rank-sum test was used to compare LOS between ETs and controls. All data analyses were performed using SAS version 9.4 (SAS Institute Inc., Cary, North Carolina).
RESULTS
A total of 45 ETs were identified, and 110 controls were matched. Patient demographics were similar among all cases and controls (P > .05). Patients with ETs had a median age of seven years (interquartile range: 3-18 years), and 51% of them were males. The majority of patients among our examined cases were white (68%) and non-Hispanic (93%). There was no statistical difference in insurance between the ETs and the controls. When evaluating the hospital unit before the transfer, ETs occurred most commonly in the Cardiology (22%), Hematology/Oncology (22%), and Neuroscience (16%) units.
ETs stayed longer in the ICU than non-ETs [median of 4.9 days vs 2.2 days, P = .001; Figure (A)]. Similarly, ET cases had a significantly longer posttransfer hospital LOS [median of 35 days vs 21 days, P = .001; Figure (B)]. ETs had a 22% in-hospital mortality rate, compared with 9% in-hospital mortality in the matched controls (P = .02; Table).
DISCUSSION
Children who experienced an ET had a significantly longer ICU LOS, a longer posttransfer LOS, and a higher in-hospital mortality than the matched controls who were also transferred to the ICU. Researchers and improvement science teams at multiple hospitals have demonstrated that interventions targeting improved situation awareness can reduce ETs; we have demonstrated that reducing ETs may reduce subsequent adverse outcomes.8,10
These findings provide additional support for the use of the ET metric in children’s hospitals as a proximal measure for significant clinical deterioration. We found mortality rates that were overall high for a children’s hospital (22% in ET cases and 9% among controls) compared with a national average mortality rate of 2.3% in pediatric ICUs.11 This is likely due to the study sample containing a significant proportion of children with medical complexity.
Aoki et al. recently demonstrated that ETs, compared with non-ETs, were associated with longer LOS and higher mortality in a bivariate analysis.12 In our study, we found similar results with the important addition that these findings were robust when ETs were compared with matched controls who were likely at a higher risk of poor outcomes than ICU transfers in general. In addition, we demonstrated that ETs were associated with adverse outcomes in a United States children’s hospital with a mature, long-standing RRS process. As ETs are considerably more common than cardiac and respiratory arrests, use of the ET metric in children’s hospitals may enable more rapid learning and systems improvement implementations. We also found that most of the children with ETs present from units that care for children with substantial medical complexity, including Cardiology, Hematology/Oncology, and Neurosciences. Future work should continue to examine the relationship between medical complexity and ET risk.
The ET metric is complementary to the CDE measure developed by Bonafide et al. Both metrics capture potential events of unrecognized clinical deterioration, and both offer researchers the opportunity to better understand and improve their RRSs. Both ETs and CDEs are more common than arrests, and CDEs are more common than ETs. ETs, which by definition occur in the first hour of ICU care, are likely a more specific measure of unrecognized clinical deterioration. CDEs will capture therapies that may have been started up to 12 hours after transfer and thus are possibly more sensitive to identify unrecognized clinical deterioration. However, CDEs also may encompass some patients who arrived at the ICU after prompt recognition and then had a subacute deterioration in the ICU.
The maturity of the RRS and the bandwidth of teams to collect data may inform which metric(s) are best for individual centers. As ETs are less common and likely more specific to unrecognized clinical deterioration, they might be the first tracked as a center improves its RRS through QI methods. Alternatively, CDEs may be a useful metric for centers where unrecognized clinical deterioration is less common or in research studies where this more common outcome would lead to more power to detect the effect of interventions to improve care.
Our study had several limitations. Data collection was confined to one tertiary care children’s hospital with a high burden of complex cardiac and oncology care. The results may not generalize well to children hospitalized in smaller or community hospitals or in hospitals without a mature RRS. There is also the possibility of misclassification of covariates and outcomes, but any misclassification would likely be nondifferential and bias toward the null. Matching was not possible based on exact diagnosis, and the unit is a good but imperfect proxy for diagnosis grouping. At our center, overflow of patients into the Cardiology and Hematology/Oncology units is uncommon, mitigating this partially, although residual confounding may remain. The finding that ETs are associated with adverse outcomes does not necessarily mean that these events were preventable; however, it is important and encouraging that the rate of ETs has been reduced at two centers using improvement science interventions.8,10
CONCLUSION
Patients who experienced an ET had a significantly higher likelihood of in-hospital mortality, spent more time in the ICU, and had a longer hospital LOS posttransfer than matched controls. The use of the ET metric in children’s hospitals would allow for further analysis of such patients in hopes of identifying clinical characteristics that serve as predictors of deterioration. This may facilitate better risk stratification in the clinical system as well as enable more rapid learning and systems improvements targeted toward preventing unrecognized clinical deterioration.
Disclosures
Dr. Hussain, Dr. Sosa, Dr. Ambroggio, and Mrs. Gallagher have nothing to disclose. Patrick Brady reports grants from the Agency for Healthcare Research and Quality, outside the submitted work. The authors certify that this submission is not under review by any other publication. The author team has no conflicts of interest to disclose.
Funding
Ms. Hussain was supported by the Society of Hospital Medicine’s Student Hospitalist Scholar Grant Program in 2017. Dr. Brady receives career development support from AHRQ K08-HS023827. The project described was supported by the National Center for Advancing Translational Sciences of the National Institutes of Health, under Award Number 5UL1TR001425-04. The content is solely the responsibility of the authors and does not necessarily represent the official views of the SHM, AHRQ, or NIH.
1. Schein RM, Hazday N, Pena M, Ruben BH, Sprung CL. Clinical antecedents to in-hospital cardiopulmonary arrest. Chest. 1990;98(6):1388-1392. https://doi.org/10.1378/chest.98.6.1388.
2. Maharaj R, Raffaele I, Wendon J. Rapid response systems: a systematic review and meta-analysis. Crit Care. 2015;19:254. https://doi.org/10.1186/s13054-015-0973-y.
3. Bonafide CP, Roland D, Brady PW. Rapid response systems 20 years later: new approaches, old challenges. JAMA Pediatrics. 2016;170(8):729-730. https://doi.org/10.1001/jamapediatrics.2016.0398.
4. Hayes LW, Dobyns EL, DiGiovine B, et al. A multicenter collaborative approach to reducing pediatric codes outside the ICU. Pediatrics. 2012;129(3):e785-e791. https://doi.org/10.1542/peds.2011-0227.
5. Raymond TT, Bonafide CP, Praestgaard A, et al. Pediatric medical emergency team events and outcomes: a report of 3647 events from the American Heart Association’s get with the guidelines-resuscitation registry. Hosp Pediatr. 2016;6(2):57-64. https://doi.org/10.1542/hpeds.2015-0132.
6. Bonafide CP, Roberts KE, Priestley MA, et al. Development of a pragmatic measure for evaluating and optimizing rapid response systems. Pediatrics. 2012;129(4):e874-e881. https://doi.org/10.1542/peds.2011-2784.
7. Brady PW, Goldenhar LM. A qualitative study examining the influences on situation awareness and the identification, mitigation and escalation of recognised patient risk. BMJ Qual Saf. 2014;23(2):153-161. https://doi.org/10.1136/bmjqs-2012-001747.
8. Brady PW, Muething S, Kotagal U, et al. Improving situation awareness to reduce unrecognized clinical deterioration and serious safety events. Pediatrics. 2013;131(1):e298-e308. https://doi.org/10.1542/peds.2012-1364.
9. Brady PW, Wheeler DS, Muething SE, Kotagal UR. Situation awareness: a new model for predicting and preventing patient deterioration. Hosp Pediatr. 2014;4(3):143-146. https://doi.org/10.1542/hpeds.2013-0119.
10. McClain Smith M, Chumpia M, Wargo L, Nicol J, Bugnitz M. Watcher initiative associated with decrease in failure to rescue events in pediatric population. Hosp Pediatr. 2017;7(12):710-715. https://doi.org/10.1542/hpeds.2017-0042.
11. McCrory MC, Spaeder MC, Gower EW, et al. Time of admission to the PICU and mortality. Pediatr Crit Care Med. 2017;18(10):915-923. https://doi.org/10.1097/PCC.0000000000001268.
12. Aoki Y, Inata Y, Hatachi T, Shimizu Y, Takeuchi M. Outcomes of ‘unrecognised situation awareness failures events’ in intensive care unit transfer of children in a Japanese children’s hospital. J Paediatr Child Health. 2018;55(2):213-215. https://doi.org/10.1111/jpc.14185.
© 2019 Society of Hospital Medicine
Potentially Inappropriate Use of Intravenous Opioids in Hospitalized Patients
Recently released guidelines on safe opioid prescribing draw attention to the fact that physicians have the ability to curb the opioid epidemic through better adherence to prescribing guidelines and limiting opioid use when not clinically indicated.1,2 A consensus statement from the Society of Hospital Medicine includes 16 recommendations for improving the safety of opioid use in hospitalized patients, one of which is to use the oral route of administration whenever possible, reserving intravenous (IV) administration for patients who cannot take food or medications by mouth, patients suspected of gastrointestinal (GI) malabsorption, or when immediate pain control and/or rapid dose titration is necessary.2 This recommendation was based on an increased risk of side effects, adverse events, and medication errors with IV compared with oral formulations.3-5 Furthermore, the reinforcement from opioids is inversely related to the rate of onset of action, and therefore opioids administered by an IV route may be more likely to lead to addiction.6-8
Choosing oral over IV opioids has several additional advantages. The cost of the IV formulation is more than oral; at our institution, the cost of IV morphine is 2.5-4.6 times greater than oral. Additional costs associated with IV administration include nursing time and equipment. Overall, transitioning patients from IV to oral medications could considerably lower costs of care.9 Ongoing need for an IV line may also lead to avoidable complications, including patient discomfort, infection, and thrombophlebitis. In addition, the recent national shortage of IV opioids has necessitated better stewardship of IV opioids.
Despite this recommendation, our observations suggest that patients often continue receiving IV opioids longer than clinically indicated. The goal of this study was to identify the incidence of potentially inappropriate IV opioid use in hospitalized patients.
METHODS
The present study was an observational study seeking to quantify the burden of potentially inappropriate IV opioid use and characteristics predicting potentially inappropriate use in the inpatient setting at a large academic medical center in Boston, Massachusetts, using retrospective review of medical records.
Definition of Potentially Inappropriate Use and Study Sample
We identified all hospitalizations during the month of February 2017 with any order for IV opioids using pharmacy charge data and performed chart reviews in this sample until we reached our prespecified study sample of 200 hospitalizations meeting inclusion/exclusion criteria further defined below.
We defined potentially inappropriate use of IV opioids as use of IV opioids for greater than 24 hours in a patient who could receive oral medications (evidenced by receipt of other orally administered medications during the same 24-hour period) and was not mechanically ventilated. This definition is consistent with recommendations in the recently released consensus statement from the Society of Hospital Medicine.2 We selected a time frame of 24 hours because IV pain medications may be indicated for initial immediate pain control and rapid dose titration; however, 24 hours should be sufficient time to determine opioid needs and transition to an oral regimen in patients without contraindications. After an initial IV dose, additional IV doses within 24 hours were considered appropriate, whereas IV doses thereafter were considered potentially inappropriate unless the patient had nil per os status, including medications. All IV opioids administered within 24 hours of a surgery or procedure were considered appropriate. Because it may be appropriate to continue IV opioids beyond 24 hours in patients with an active cancer diagnosis, in patients who have chosen comfort measures only, or in patients with GI dysfunction (including conditions such as small bowel obstruction, colitis, pancreatitis), we excluded these populations from the study sample. Patients admitted to the hospital for less than 24 hours were also excluded from the study, because they would not be at risk for the outcome of potentially inappropriate use. Doses of IV opioids administered for respiratory distress were considered to be appropriate. Given difficulty in identifying the appropriate time to transition from patient-controlled analgesia (PCA) to IV or per os (PO) opioids, days spent receiving opioids by PCA or continuous IV drip were excluded from the analysis.
We used Fisher’s exact test or the Chi-square test (in the setting of a multicategory variable) to calculate bivariable P values. We used multivariable logistic regression to identify independent predictors of receipt of at least one dose of potentially inappropriate IV opioids, using the hospitalization as the unit of analysis.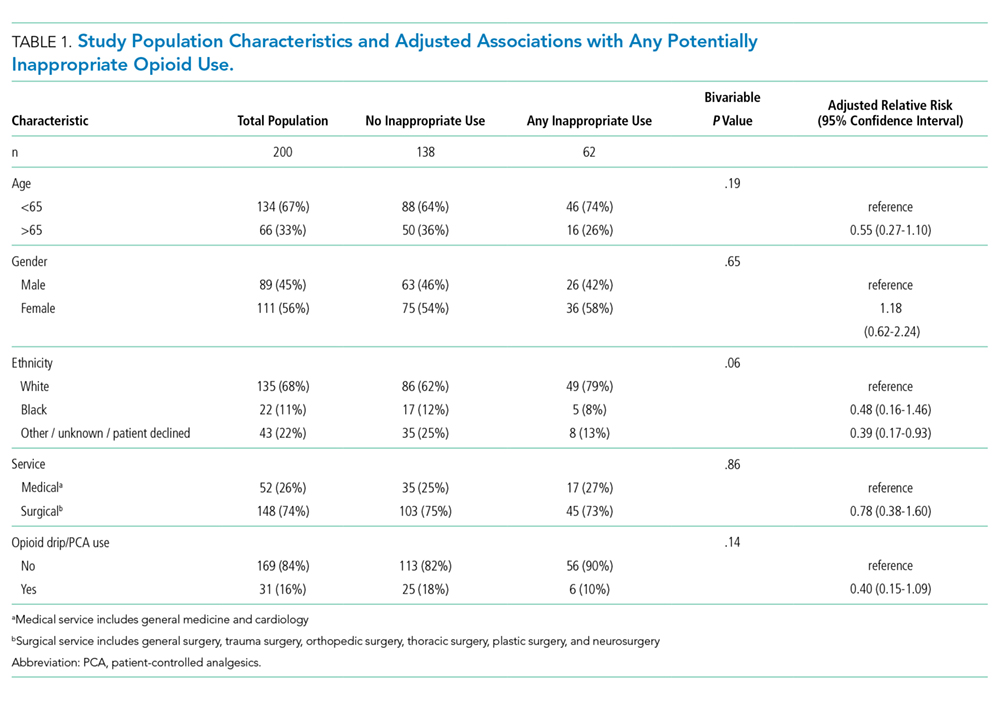
RESULTS
Of 630 hospitalizations with at least one order for IV opioids over a one-month period, we reviewed 502 charts, from which we excluded 76 hospitalizations with an active cancer diagnosis, 30 with comfort-focused care, 115 with GI dysfunction, and 108 with a hospitalization less than 24 hours in duration, resulting in 200 hospitalizations included in this analysis (some patients met multiple exclusion criteria). Table 1 outlines characteristics of the study population, stratified by appropriateness of IV opioid use. The study population was predominately white and had an average age of 56.3 years. The majority of patients were on a surgical service. Hydromorphone was the most commonly administered opioid. There were significant differences in the percentage of doses considered inappropriate between different types of opioids (P < .001), with morphine having the highest proportion of doses considered potentially inappropriate (Table 2).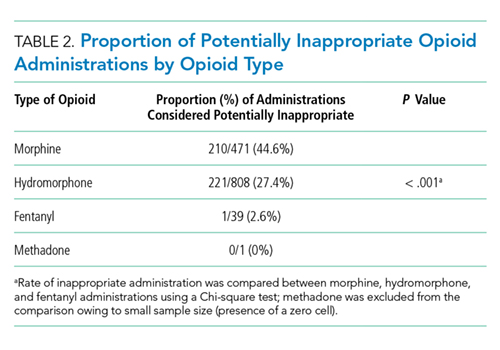
Thirty-one percent of the cohort was administered at least one potentially inappropriate dose of IV opioids. A total of 432 of 1,319 (33%) IV doses were considered potentially inappropriate.
Predictors of Potentially Inappropriate Use
No significant associations were observed between potentially inappropriate IV opioid administration and age, sex, or admitting service (Table 1). Patients with an ethnicity described as other, unknown, or declined were less likely to have potentially inappropriate use.
DISCUSSION AND CONCLUSIONS
In this cohort of medical and surgical inpatients, we found that almost one-third received at least one potentially inappropriate IV opioid administration during their hospitalization, and one-third of all IV opioid administrations were potentially inappropriate based on current recommendations defining the appropriate use of IV versus oral opioids. Although this is a single-center analysis, to our knowledge, this is the first study to ascertain the rate of potentially inappropriate IV opioid administration in hospitalized patients. Our findings suggest that quality improvement initiatives are necessary to promote more guideline-concordant care in this realm.
Several factors may contribute to overuse. Requests from patients for immediate pain relief may at times drive prescription of the IV formulation. In addition, patients may expect the IV formulation because of precedents from prior interactions with the healthcare system. Both of these situations may be opportunities for patient education about the equivalent bioavailability of oral and IV formulations in patients with a functioning GI tract, as well as the relatively small difference in rate of onset between the two routes of administration (generally 15-20 minutes). When a patient’s pain is well controlled with IV medications, physicians may also fail to recognize the need to transition to PO medications, further prolonging unnecessary use. Finally, in patients with multiple, complex, or deteriorating medical conditions, transitioning to oral opioids may be deprioritized for the sake of addressing more urgent medical concerns.
This study highlights the potential for transitioning more patients to oral opioids, which should be feasible in the inpatient setting, where pain needs can often be anticipated in advance and oral medications can be administered earlier to overcome the short delay in the onset of action between the oral and IV routes. Oral medications also have the advantage of a longer duration of effect, which may provide overall improved pain control. At our institution, a recent shortage of IV opioids (which occurred after the data collection period for this study) and subsequent efforts to limit IV opioid use (via computerized prompts and active pharmacist consultation) resulted in an immediate 50% reduction in the daily number of IV opioid administrations, further supporting our conclusion that there is an opportunity to decrease inappropriate use of IV opioids.
There were no specific patient factors that contributed to potentially inappropriate use. Although the ethnicity category of other/unknown/declined was significantly less likely to receive opioids potentially inappropriately, given the heterogeneity of this group, it is difficult to draw conclusions on the clinical significance of this finding. Morphine was significantly more likely than other opioids to be administered inappropriately.
There are several limitations of this study. Because this was a retrospective review, our criteria for appropriate use may have resulted in some misclassification; as a result, we can comment only on potentially inappropriate use rather than on definitively inappropriate use. We attempted to use a conservative definition of appropriateness by automatically assuming all doses in the first 24 hours of administration to be appropriate, which could have resulted in underestimating potentially inappropriate use. Nonetheless, there may be instances in which a patient had suspected malabsorption that was not captured or a fluctuating ability to receive oral medications within a given 24-hour period (due to nausea, for example), resulting in outcome misclassification. In addition, we did not correlate findings with patient-reported pain scores. Because there is no clearly defined pain threshold at which IV opioids are indicated, we did not believe that would be useful in clarifying appropriate versus inappropriate use. That said, we believe that, most of the time, pain medications should be able to be titrated appropriately within 24 hours to avoid the need for immediate pain relief with IV opioids thereafter. Although there may be instances of patients who have breakthrough pain severe enough to require IV opioids despite adequate titration of oral medications, we believe this is likely to represent a small number of our population that received potentially inappropriate use. It is worth noting that even if we overestimated by 50%, such that the true rate of potentially inappropriate IV administrations is 15%, we believe this would still be a ripe target for quality improvement initiatives, given that tens of millions of hospitalized patients receive opioids each year in the United States.10 Finally, we were unable to quantify the number of providers involved in decision making for these patients, and the single-center nature and short time frame of the study limit generalizability; our analysis should be replicated at other hospitals.
In conclusion, in this sample of 200 medical and surgical hospitalizations receiving IV opioids at a large academic medical center, we identified potentially inappropriate IV administration in 31%, suggesting potential to improve value through improving prescribing practices.
Disclosures
None of the authors have conflicts to disclose.
Funding
Dr. Herzig is funded by grant number K23AG042459 from the National Institute on Aging and R01HS026215 from the Agency for Healthcare Research and Quality. The manuscript contents are solely the responsibility of the authors and do not necessarily represent the views of the funding organizations.
1. Dowell D, Haegerich TM, Chou R. CDC guideline for prescribing opioids for chronic pain-United States, 2016. JAMA. 2016;315(15):1624-1645. https://doi.org/10.1001/jama.2016.1464.
2. Herzig SJ, Mosher HJ, Calcaterra SL, Jena AB, Nuckols TK. Improving the safety of opioid use for acute noncancer pain in hospitalized adults: a consensus statement from the Society of Hospital Medicine. J Hosp Med. 2018;13(4):263-271. https://doi.org/10.12788/jhm.2980.
3. Daoust R, Paquet J, Lavigne G, Piette E, Chauny JM. Impact of age, sex and route of administration on adverse events after opioid treatment in the emergency department: a retrospective study. Pain Res Manag. 2015;20(1):23-28. https://doi.org/10.1155/2015/316275.
4. Overdyk F, Dahan A, Roozekrans M, van der Schrier R, Aarts L, Niesters M. Opioid-induced respiratory depression in the acute care setting: a compendium of case reports. Pain Manag. 2014;4(4):317-325. https://doi.org/10.2217/pmt.14.19.
5. Wang Y, Sands LP, Vaurio L, Mullen EA, Leung JM. The effects of postoperative pain and its management on postoperative cognitive dysfunction. Am J Geriatr Psychiatry. 2007;15(1):50-59. https://doi.org/10.1097/01.JGP.0000229792.31009.da.
6. Al-Qadheeb NS, O’Connor HH, White AC, et al. Antipsychotic prescribing patterns, and the factors and outcomes associated with their use, among patients requiring prolonged mechanical ventilation in the long-term acute care hospital setting. Ann Pharmacother. 2013;47(2):181-188. https://doi.org/10.1345/aph.1R521.
7. Compton WM, Volkow ND. Abuse of prescription drugs and the risk of addiction. Drug Alcohol Depend. 2006;83(1):S4-S7. https://doi.org/10.1016/j.drugalcdep.2005.10.020.
8. O’Brien CP. Drug addiction and drug abuse. In: Hardman JG, ed. Goodman and Gilman’s Pharmacological Basis of Therapeutics. New York: McGraw-Hill; 2001:621-642.
9. Lau BD, Pinto BL, Thiemann DR, Lehmann CU. Budget impact analysis of conversion from intravenous to oral medication when clinically eligible for oral intake. Clin Ther. 2011;33(11):1792-1796. https://doi.org/10.1016/j.clinthera.2011.09.030.
10. Herzig SJ, Rothberg MB, Cheung M, Ngo LH, Marcantonio ER. Opioid utilization and opioid-related adverse events in nonsurgical patients in US hospitals. J Hosp Med. 2014;9(2):73-81. https://doi.org/10.1002/jhm.2102.
Recently released guidelines on safe opioid prescribing draw attention to the fact that physicians have the ability to curb the opioid epidemic through better adherence to prescribing guidelines and limiting opioid use when not clinically indicated.1,2 A consensus statement from the Society of Hospital Medicine includes 16 recommendations for improving the safety of opioid use in hospitalized patients, one of which is to use the oral route of administration whenever possible, reserving intravenous (IV) administration for patients who cannot take food or medications by mouth, patients suspected of gastrointestinal (GI) malabsorption, or when immediate pain control and/or rapid dose titration is necessary.2 This recommendation was based on an increased risk of side effects, adverse events, and medication errors with IV compared with oral formulations.3-5 Furthermore, the reinforcement from opioids is inversely related to the rate of onset of action, and therefore opioids administered by an IV route may be more likely to lead to addiction.6-8
Choosing oral over IV opioids has several additional advantages. The cost of the IV formulation is more than oral; at our institution, the cost of IV morphine is 2.5-4.6 times greater than oral. Additional costs associated with IV administration include nursing time and equipment. Overall, transitioning patients from IV to oral medications could considerably lower costs of care.9 Ongoing need for an IV line may also lead to avoidable complications, including patient discomfort, infection, and thrombophlebitis. In addition, the recent national shortage of IV opioids has necessitated better stewardship of IV opioids.
Despite this recommendation, our observations suggest that patients often continue receiving IV opioids longer than clinically indicated. The goal of this study was to identify the incidence of potentially inappropriate IV opioid use in hospitalized patients.
METHODS
The present study was an observational study seeking to quantify the burden of potentially inappropriate IV opioid use and characteristics predicting potentially inappropriate use in the inpatient setting at a large academic medical center in Boston, Massachusetts, using retrospective review of medical records.
Definition of Potentially Inappropriate Use and Study Sample
We identified all hospitalizations during the month of February 2017 with any order for IV opioids using pharmacy charge data and performed chart reviews in this sample until we reached our prespecified study sample of 200 hospitalizations meeting inclusion/exclusion criteria further defined below.
We defined potentially inappropriate use of IV opioids as use of IV opioids for greater than 24 hours in a patient who could receive oral medications (evidenced by receipt of other orally administered medications during the same 24-hour period) and was not mechanically ventilated. This definition is consistent with recommendations in the recently released consensus statement from the Society of Hospital Medicine.2 We selected a time frame of 24 hours because IV pain medications may be indicated for initial immediate pain control and rapid dose titration; however, 24 hours should be sufficient time to determine opioid needs and transition to an oral regimen in patients without contraindications. After an initial IV dose, additional IV doses within 24 hours were considered appropriate, whereas IV doses thereafter were considered potentially inappropriate unless the patient had nil per os status, including medications. All IV opioids administered within 24 hours of a surgery or procedure were considered appropriate. Because it may be appropriate to continue IV opioids beyond 24 hours in patients with an active cancer diagnosis, in patients who have chosen comfort measures only, or in patients with GI dysfunction (including conditions such as small bowel obstruction, colitis, pancreatitis), we excluded these populations from the study sample. Patients admitted to the hospital for less than 24 hours were also excluded from the study, because they would not be at risk for the outcome of potentially inappropriate use. Doses of IV opioids administered for respiratory distress were considered to be appropriate. Given difficulty in identifying the appropriate time to transition from patient-controlled analgesia (PCA) to IV or per os (PO) opioids, days spent receiving opioids by PCA or continuous IV drip were excluded from the analysis.
We used Fisher’s exact test or the Chi-square test (in the setting of a multicategory variable) to calculate bivariable P values. We used multivariable logistic regression to identify independent predictors of receipt of at least one dose of potentially inappropriate IV opioids, using the hospitalization as the unit of analysis.
RESULTS
Of 630 hospitalizations with at least one order for IV opioids over a one-month period, we reviewed 502 charts, from which we excluded 76 hospitalizations with an active cancer diagnosis, 30 with comfort-focused care, 115 with GI dysfunction, and 108 with a hospitalization less than 24 hours in duration, resulting in 200 hospitalizations included in this analysis (some patients met multiple exclusion criteria). Table 1 outlines characteristics of the study population, stratified by appropriateness of IV opioid use. The study population was predominately white and had an average age of 56.3 years. The majority of patients were on a surgical service. Hydromorphone was the most commonly administered opioid. There were significant differences in the percentage of doses considered inappropriate between different types of opioids (P < .001), with morphine having the highest proportion of doses considered potentially inappropriate (Table 2).
Thirty-one percent of the cohort was administered at least one potentially inappropriate dose of IV opioids. A total of 432 of 1,319 (33%) IV doses were considered potentially inappropriate.
Predictors of Potentially Inappropriate Use
No significant associations were observed between potentially inappropriate IV opioid administration and age, sex, or admitting service (Table 1). Patients with an ethnicity described as other, unknown, or declined were less likely to have potentially inappropriate use.
DISCUSSION AND CONCLUSIONS
In this cohort of medical and surgical inpatients, we found that almost one-third received at least one potentially inappropriate IV opioid administration during their hospitalization, and one-third of all IV opioid administrations were potentially inappropriate based on current recommendations defining the appropriate use of IV versus oral opioids. Although this is a single-center analysis, to our knowledge, this is the first study to ascertain the rate of potentially inappropriate IV opioid administration in hospitalized patients. Our findings suggest that quality improvement initiatives are necessary to promote more guideline-concordant care in this realm.
Several factors may contribute to overuse. Requests from patients for immediate pain relief may at times drive prescription of the IV formulation. In addition, patients may expect the IV formulation because of precedents from prior interactions with the healthcare system. Both of these situations may be opportunities for patient education about the equivalent bioavailability of oral and IV formulations in patients with a functioning GI tract, as well as the relatively small difference in rate of onset between the two routes of administration (generally 15-20 minutes). When a patient’s pain is well controlled with IV medications, physicians may also fail to recognize the need to transition to PO medications, further prolonging unnecessary use. Finally, in patients with multiple, complex, or deteriorating medical conditions, transitioning to oral opioids may be deprioritized for the sake of addressing more urgent medical concerns.
This study highlights the potential for transitioning more patients to oral opioids, which should be feasible in the inpatient setting, where pain needs can often be anticipated in advance and oral medications can be administered earlier to overcome the short delay in the onset of action between the oral and IV routes. Oral medications also have the advantage of a longer duration of effect, which may provide overall improved pain control. At our institution, a recent shortage of IV opioids (which occurred after the data collection period for this study) and subsequent efforts to limit IV opioid use (via computerized prompts and active pharmacist consultation) resulted in an immediate 50% reduction in the daily number of IV opioid administrations, further supporting our conclusion that there is an opportunity to decrease inappropriate use of IV opioids.
There were no specific patient factors that contributed to potentially inappropriate use. Although the ethnicity category of other/unknown/declined was significantly less likely to receive opioids potentially inappropriately, given the heterogeneity of this group, it is difficult to draw conclusions on the clinical significance of this finding. Morphine was significantly more likely than other opioids to be administered inappropriately.
There are several limitations of this study. Because this was a retrospective review, our criteria for appropriate use may have resulted in some misclassification; as a result, we can comment only on potentially inappropriate use rather than on definitively inappropriate use. We attempted to use a conservative definition of appropriateness by automatically assuming all doses in the first 24 hours of administration to be appropriate, which could have resulted in underestimating potentially inappropriate use. Nonetheless, there may be instances in which a patient had suspected malabsorption that was not captured or a fluctuating ability to receive oral medications within a given 24-hour period (due to nausea, for example), resulting in outcome misclassification. In addition, we did not correlate findings with patient-reported pain scores. Because there is no clearly defined pain threshold at which IV opioids are indicated, we did not believe that would be useful in clarifying appropriate versus inappropriate use. That said, we believe that, most of the time, pain medications should be able to be titrated appropriately within 24 hours to avoid the need for immediate pain relief with IV opioids thereafter. Although there may be instances of patients who have breakthrough pain severe enough to require IV opioids despite adequate titration of oral medications, we believe this is likely to represent a small number of our population that received potentially inappropriate use. It is worth noting that even if we overestimated by 50%, such that the true rate of potentially inappropriate IV administrations is 15%, we believe this would still be a ripe target for quality improvement initiatives, given that tens of millions of hospitalized patients receive opioids each year in the United States.10 Finally, we were unable to quantify the number of providers involved in decision making for these patients, and the single-center nature and short time frame of the study limit generalizability; our analysis should be replicated at other hospitals.
In conclusion, in this sample of 200 medical and surgical hospitalizations receiving IV opioids at a large academic medical center, we identified potentially inappropriate IV administration in 31%, suggesting potential to improve value through improving prescribing practices.
Disclosures
None of the authors have conflicts to disclose.
Funding
Dr. Herzig is funded by grant number K23AG042459 from the National Institute on Aging and R01HS026215 from the Agency for Healthcare Research and Quality. The manuscript contents are solely the responsibility of the authors and do not necessarily represent the views of the funding organizations.
1. Dowell D, Haegerich TM, Chou R. CDC guideline for prescribing opioids for chronic pain-United States, 2016. JAMA. 2016;315(15):1624-1645. https://doi.org/10.1001/jama.2016.1464.
2. Herzig SJ, Mosher HJ, Calcaterra SL, Jena AB, Nuckols TK. Improving the safety of opioid use for acute noncancer pain in hospitalized adults: a consensus statement from the Society of Hospital Medicine. J Hosp Med. 2018;13(4):263-271. https://doi.org/10.12788/jhm.2980.
3. Daoust R, Paquet J, Lavigne G, Piette E, Chauny JM. Impact of age, sex and route of administration on adverse events after opioid treatment in the emergency department: a retrospective study. Pain Res Manag. 2015;20(1):23-28. https://doi.org/10.1155/2015/316275.
4. Overdyk F, Dahan A, Roozekrans M, van der Schrier R, Aarts L, Niesters M. Opioid-induced respiratory depression in the acute care setting: a compendium of case reports. Pain Manag. 2014;4(4):317-325. https://doi.org/10.2217/pmt.14.19.
5. Wang Y, Sands LP, Vaurio L, Mullen EA, Leung JM. The effects of postoperative pain and its management on postoperative cognitive dysfunction. Am J Geriatr Psychiatry. 2007;15(1):50-59. https://doi.org/10.1097/01.JGP.0000229792.31009.da.
6. Al-Qadheeb NS, O’Connor HH, White AC, et al. Antipsychotic prescribing patterns, and the factors and outcomes associated with their use, among patients requiring prolonged mechanical ventilation in the long-term acute care hospital setting. Ann Pharmacother. 2013;47(2):181-188. https://doi.org/10.1345/aph.1R521.
7. Compton WM, Volkow ND. Abuse of prescription drugs and the risk of addiction. Drug Alcohol Depend. 2006;83(1):S4-S7. https://doi.org/10.1016/j.drugalcdep.2005.10.020.
8. O’Brien CP. Drug addiction and drug abuse. In: Hardman JG, ed. Goodman and Gilman’s Pharmacological Basis of Therapeutics. New York: McGraw-Hill; 2001:621-642.
9. Lau BD, Pinto BL, Thiemann DR, Lehmann CU. Budget impact analysis of conversion from intravenous to oral medication when clinically eligible for oral intake. Clin Ther. 2011;33(11):1792-1796. https://doi.org/10.1016/j.clinthera.2011.09.030.
10. Herzig SJ, Rothberg MB, Cheung M, Ngo LH, Marcantonio ER. Opioid utilization and opioid-related adverse events in nonsurgical patients in US hospitals. J Hosp Med. 2014;9(2):73-81. https://doi.org/10.1002/jhm.2102.
© 2019 Society of Hospital Medicine
Interprofessional Academic Patient Aligned Care Team Panel Management Model
This article is part of a series that illustrates strategies intended to redesign primary care education at the Veterans Health Administration (VHA), using interprofessional workplace learning. All have been implemented in the VA Centers of Excellence in Primary Care Education (CoEPCE). These models embody visionary transformation of clinical and educational environments that have potential for replication and dissemination throughout VA and other primary care clinical educational environments. For an introduction to the series see Klink K. Transforming primary care clinical learning environments to optimize education, outcomes, and satisfaction. Fed Pract. 2018;35(9):8-10.
Background
In 2011, 5 US Department of Veterans Affairs (VA) medical centers were selected by the VA Office of Academic Affiliations (OAA) to establish Centers of Excellence in Primary Care Education (CoEPCE). Part of the New Models of Care initiative, the 5 CoEPCEs use VA primary care settings to develop and test innovative approaches to prepare physician residents, medical students, advanced practice registered nurses, undergraduate nursing students, and other health professions’ trainees, such as social workers, pharmacists, psychologists, and physician assistants, for improved primary care practice. The CoEPCEs are interprofessional Academic PACTs (iAPACTs) with ≥ 2 professions of trainees engaged in learning on the PACT team.

The VA Puget Sound Seattle CoEPCE curriculum is embedded in a well-established academic VA primary care training site.1 Trainees include doctor of nursing practice (DNP) students in adult, family, and psychiatric mental health nurse practitioner (NP) programs; NP residents; internal medicine physician residents; postgraduate pharmacy residents; and other health professions’ trainees. A Seattle CoEPCE priority is to provide DNP students, DNP residents, and physician residents with a longitudinal experience in team-based care as well as interprofessional education and collaborative practice (IPECP). Learners spend the majority of CoEPCE time in supervised, direct patient care, including primary care, women’s health, deployment health, homeless care, and home care. Formal IPECP activities comprise about 20% of time, supported by 3 educational strategies: (1) Panel management (PM)/quality improvement (QI); (2) Team building/ communications; and (3) Clinical content seminars to expand trainee clinical knowledge and skills and curriculum developed with the CoEPCE enterprise core domains in mind (Table).
Panel Management
Clinicians are increasingly being required to proactively optimize the health of an assigned population of patients in addition to assessing and managing the health of individual patients presenting for care. To address the objectives of increased accountability for population health outcomes and improved face-to-face care, Seattle CoEPCE developed curriculum for trainees to learn PM, a set of tools and processes that can be applied in the primary care setting.
PM clinical providers use data to proactively provide care to their patients between traditional clinic visits. The process is proactive in that gaps are identified whether or not an in-person visit occurs and involves an outreach mechanism to increase continuity of care, such as follow-up communications with the patients.2 PM also has been associated with improvements in chronic disease care.3-5
The Seattle CoEPCE developed an interprofessional team approach to PM that teaches trainees about the tools and resources used to close the gaps in care, including the use of clinical team members as health care systems subject matter experts. CoEPCE trainees are taught to analyze the care they provide to their panel of veterans (eg, identifying patients who have not refilled chronic medications or those who use the emergency department [ED] for nonacute conditions) and take action to improve care. PM yields rich discussions on systems resources and processes and is easily applied to a range of health conditions as well as delivery system issues. PM gives learners the tools they can use to close these gaps, such as the expertise of their peers, clinical team, and specialists.6
Planning and Implementation
In addition to completing a literature review to determine the state of PM practice and models, CoEPCE faculty polled recent graduates inquiring about strategies they did not learn prior to graduation. Based on their responses, CoEPCE faculty identified 2 skill deficits: management of chronic diseases and proficiency with data and statistics about performance improvement in panel patient care over time. Addressing these unmet needs became the impetus for developing curriculum for conducting PM. Planning and launching the CoEPCE approach to PM took about 3 months and involved CoEPCE faculty, a data manager, and administrative support. The learning objectives of Seattle’s PM initiative are to:
- Promote preventive health and chronic disease care by use performance data;
- Develop individual- and populationfocused action plans;
- Work collaboratively, strategically, and effectively with an interprofessional care team; and
- Learn how to effectively use system resources.
Curriculum
The PM curriculum is a longitudinal, experiential approach to learning how to manage chronic diseases between visits by using patient data. It is designed for trainees in a continuity clinic to review the care of their patients on a regular basis. Seattle CoEPCE medicine residents are assigned patient panels, which increase from 70 patients in the first year to about 140 patients by the end of the third year. DNP postgraduate trainees are assigned an initial panel of 50 patients that increases incrementally over the year-long residency.
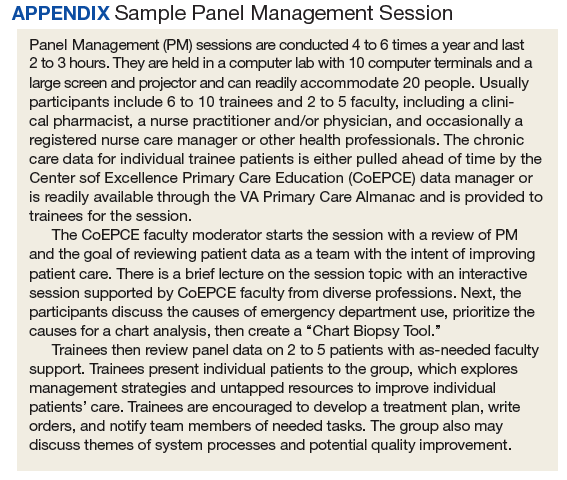
CoEPCE faculty determined the focus of PM sessions to be diabetes mellitus (DM), hypertension, obesity, chronic opioid therapy, and low-acuity ED use. Because PM sessions are designed to allow participants to identify systems issues that may affect multiple patients, some of these topics have expanded into QI projects. PM sessions run 2 to 3 hours per session and are held 4 to 6 times a year. Each session is repeated twice to accommodate diverse trainee schedules. PM participants must have their patient visit time blocked for each session (Appendix).
Faculty Roles and Development
PM faculty involved in any individual session may include a combination of a CoEPCE clinical pharmacy specialist, a registered nurse (RN) care manager, a social worker, a NP, a physician, a clinical psychologist, and a medicine outpatient chief resident (PGY4, termed clinician-teacher fellow at Seattle VA medical center). The chief resident is a medicine residency graduate and takes on teaching responsibilities depending on the topic of the session. The CoEPCE clinical pharmacist role varies depending on the session topic: They may facilitate the session or provide recommendations for medication management for individual cases. The RN care manager often knows the patients and brings a unique perspective that complements that of the primary care providers and ideally participates in every session. The patients of multiple RN care managers may be presented at each session, and it was not feasible to include all RN care managers in every session. After case discussions, trainees often communicated with the RN care managers about the case, using instant messaging, and CoEPCE provides other avenues for patient care discussion through huddles involving the provider, RN care manager, clinical pharmacist, and other clinical professions.
Resources
The primary resource required to support PM is an information technology (IT) system that provides relevant health outcome and health care utilization data on patients assigned to trainees. PM sessions include teaching trainees how to access patient data. Since discussion about the care of panel patients during the learning sessions often results in real-time adjustments in the care plan, modest administrative support required post-PM sessions, such as clerical scheduling of the requested clinic or telephone follow-up with the physician, nurse, or pharmacist.
Monitoring and Assessment
Panel performance is evaluated at each educational session. To assess the CoEPCE PM curriculum, participants provide feedback in 8 questions over 3 domains: trainee perception of curriculum content, confidence in performing PM involving completion of a PM workshop, and likelihood of using PM techniques in the future. CoEPCE faculty use the feedback to improve their instruction of panel management skill and develop new sessions that target additional population groups. Evaluation of the curriculum also includes monitoring of panel patients’ chronic disease measures.
Several partnerships have contributed to the success and integrations of PM into facility activities. First, having the primary care clinic director as a member of the Co- EPCE faculty has encouraged faculty and staff to operationalize and implement PM broadly by distributing data monthly to all clinic staff. Second, high facility staff interest outside the CoEPCE and primary care clinic has facilitated establishing communications outside the CoEPCE regarding clinic data.
Challenges and Solutions
Trainees at earlier academic levels often desire more instruction in clinical knowledge, such as treatment options for DM or goals of therapy in hypertension. In contrast, advanced trainees are able to review patient data, brainstorm, and optimize solutions. Seattle CoEPCE balances these different learning needs via a flexible approach to the 3-hour sessions. For example, advanced trainees progress from structured short lectures to informal sessions, which train them to perform PM on their own. In addition, the flexible design integrates trainees with diverse schedules, particularly among DNP students and residents, pharmacy residents, and physician residents. Some of this work falls on the RN care management team and administrative support staff.
Competing Priorities
The demand for direct patient care points to the importance of indirect patient care activities like PM to demonstrate improved results. Managing chronic conditions and matching appropriate services and resources should improve clinical outcomes and efficiency longterm. In the interim, it is important to note that PM demonstrates the continuous aspect of clinical care, particularly for trainees who have strict guidelines defining clinical care for the experiences to count toward eligibility for licensure. Additionally, PM results in trainees who are making decisions with VA patients and are more efficiently providing and supporting patient care. Therefore, it is critical to secure important resources, such as provider time for conducting PM.
Data Access
No single data system in VA covers the broad range of topics covered in the PM sessions, and not all trainees have their own assigned panels. For example, health professions students are not assigned a panel of patients. While they do not have access to panel data such as those generated by Primary Care Almanac in VSSC (a data source in the VA Support Service Center database),the Seattle CoEPCE data manager pulls a set of patient data from the students’ paired faculty preceptors’ panels for review. Thus they learn PM principles and strategies for improving patient care via PM as part of the unique VA longitudinal clinic experience and the opportunity to learn from a multidisciplinary team that is not available at other clinical sites. Postgraduate NP residents in CoEPCE training have their own panels of patients and thus the ability to directly access their panel performance data.
Success Factors
A key success factor includes CoEPCE faculty’s ability to develop and operationalize a panel management model that simultaneously aligns with the educational goals of an interprofessional education training program and supports VA adoption of the medical home or patient aligned care teams (PACT). The CoEPCE contributes staff expertise in accessing and reporting patient data, accessing appropriate teaching space, managing panels of patients with chronic diseases, and facilitating a team-based approach to care. Additionally, the CoEPCE brand is helpful for getting buy-in from the clinical and academic stakeholders necessary for moving PM forward.
Colocating CoEPCE trainees and faculty in the primary care clinic promotes team identity around the RN care managers and facilitated communications with non-CoEPCE clinical teams that have trainees from other professions. RN care managers serve as the locus of highquality PM since they share patient panels with the trainees and already track admissions, ED visits, and numerous chronic health care metrics. RN care managers offer a level of insight into chronic disease that other providers may not possess, such as the specific details on medication adherence and the impact of adverse effects (AEs) for that particular patient. RN care managers are able to teach about their team role and responsibilities, strengthening the model.
PM is an opportunity to expand CoEPCE interprofessional education capacity by creating colocation of different trainee and faculty professions during the PM sessions; the sharing of data with trainees; and sharing and reflecting on data, strengthening communications between professions and within the PACT. The Seattle CoEPCE now has systems in place that allow the RN care manager to send notes to a physician and DNP resident, and the resident is expected to respond. In addition, the PM approach provides experience with analyzing data to improve care in an interprofessional team setting, which is a requirement of the Accreditation Council for Graduate Medical Education.
Interprofessional Collaboration
PM sessions are intentionally designed to improve communication among team members and foster a team approach to care. PM sessions provide an opportunity for trainees and clinician faculty to be together and learn about each profession’s perspectives. For example, early in the process physician and DNP trainees learn about the importance of clinical pharmacists to the team who prescribe and make medication adjustments within their scope of practice as well as the importance of making appropriate pharmacy referrals. Additionally, the RN care manager and clinical pharmacy specialists who serve as faculty in the CoEPCE provide pertinent information on individual patients, increasing integration with the PACT. Finally, there is anecdotal evidence that faculty also are learning more about interprofessional education and expanding their own skills.
Clinical Performance
CoEPCE trainees, non-CoEPCE physician residents, and CoEPCE faculty participants regularly receive patient data with which they can proactively develop or amend a treatment plan between visits. PM has resulted in improved data sharing with providers. Instead of once a year, providers and clinic staff now receive patient data monthly on chronic conditions from the clinic director. Trainees on ambulatory rotations are expected to review their panel data at least a half day per week. CoEPCE staff evaluate trainee likelihood to use PM and ability to identify patients who benefit from team-based care.
At the population level of chronic disease management, preliminary evidence demonstrates that primary care clinic patient panels are increasingly within target for DM and blood pressure measures, as assessed by periodic clinical reports to providers. Some of the PM topics have resulted in systems-level improvements, such as reducing unnecessary ED use for nonacute conditions and better opioid prescription monitoring. Moreover, PM supports everyone working at the top of his/her professional capability. For example, the RN care manager has the impetus to initiate DM education with a particular patient.
Since CoEPCE began teaching PM, the Seattle primary care clinic has committed to the regular access and review of data. This has encouraged the alignment of standards of care for chronic disease management so that all care providers are working toward the same benchmark goals.
Patient Outcomes
At the individual level, PM provide a mechanism to systemically review trainee panel patients with out-of-target clinical measures, and develop new care approaches involving interprofessional strategies and problem solving. PM also helps identify patients who have missed follow-up, reducing the risk that patients with chronic care needs will be lost to clinical engagement if they are not reminded or do not pursue appointments. The PM-trained PACT reaches out to patients who might not otherwise get care before the next clinic visit and provides new care plans. Second, patients have the benefit of a team that manages their health needs. For example, including the clinical pharmacists in the PM sessions ensures timely identification of medication interactions and the potential AEs. Additionally, PM contributes to the care coordination model by involving individuals on the primary care team who know the patient. These members review the patient’s data between visits and initiate team-based changes to the care plan to improve care. More team members connect with a patient, resulting in more intense care and quicker follow-up to determine the effectiveness of a treatment plan.
PM topics have spun off QI projects resulting in new clinic processes and programs, including processes for managing wounds in primary care and to assure timely post-ED visit follow-ups. Areas for expansion include a follow-up QI project to reduce nonacute ED visits by patients on the homeless PACT panel and interventions for better management of care for women veterans with mental health needs. PM also has extended to non-Co- EPCE teams and to other clinic activities, such as strengthening huddles of team members specifically related to panel data and addressing selected patient cases between visits. Pharmacy residents and faculty are more involved in reviewing the panel before patients are seen to review medication lists and identify duplications.
The Future
Under stage 2 of the program, the Seattle CoEPCE intends to lead in the creation of a PM toolkit as well as a data access guide that will allow VA facilities with limited data management expertise to access chronic disease metrics. Second, the CoEPCE will continue its dissemination efforts locally to other residents in the internal medicine residency program in all of its continuity clinics. Additionally, there is high interest by DNP training programs to expand and export longitudinal training experience PM curriculum to non-VA based students.
1. Kaminetzky CP, Beste LA, Poppe AP, et al. Implementation of a novel panel management curriculum. BMC Med Educ. 2017;17(1):264-269.
2. Neuwirth EB, Schmittdiel JA, Tallman K, Bellows J. Understanding panel management: a comparative study of an emerging approach to population care. Perm J. 2007;11(3):12-20.
3. Loo TS, Davis RB, Lipsitz LA, et al. Electronic medical record reminders and panel management to improve primary care of elderly patients. Arch Intern Med. 2011;171(17):1552-1558.
4. Kanter M, Martinez O, Lindsay G, Andrews K, Denver C. Proactive office encounter: a systematic approach to preventive and chronic care at every patient encounter. Perm J. 2010;14(3):38-43.
5. Kravetz JD, Walsh RF. Team-based hypertension management to improve blood pressure control. J Prim Care Community Health. 2016;7(4):272-275.
6. Kaminetzky CP, Nelson KM. In the office and in-between: the role of panel management in primary care. J Gen Intern Med. 2015;30(7):876-877.
This article is part of a series that illustrates strategies intended to redesign primary care education at the Veterans Health Administration (VHA), using interprofessional workplace learning. All have been implemented in the VA Centers of Excellence in Primary Care Education (CoEPCE). These models embody visionary transformation of clinical and educational environments that have potential for replication and dissemination throughout VA and other primary care clinical educational environments. For an introduction to the series see Klink K. Transforming primary care clinical learning environments to optimize education, outcomes, and satisfaction. Fed Pract. 2018;35(9):8-10.
Background
In 2011, 5 US Department of Veterans Affairs (VA) medical centers were selected by the VA Office of Academic Affiliations (OAA) to establish Centers of Excellence in Primary Care Education (CoEPCE). Part of the New Models of Care initiative, the 5 CoEPCEs use VA primary care settings to develop and test innovative approaches to prepare physician residents, medical students, advanced practice registered nurses, undergraduate nursing students, and other health professions’ trainees, such as social workers, pharmacists, psychologists, and physician assistants, for improved primary care practice. The CoEPCEs are interprofessional Academic PACTs (iAPACTs) with ≥ 2 professions of trainees engaged in learning on the PACT team.
The VA Puget Sound Seattle CoEPCE curriculum is embedded in a well-established academic VA primary care training site.1 Trainees include doctor of nursing practice (DNP) students in adult, family, and psychiatric mental health nurse practitioner (NP) programs; NP residents; internal medicine physician residents; postgraduate pharmacy residents; and other health professions’ trainees. A Seattle CoEPCE priority is to provide DNP students, DNP residents, and physician residents with a longitudinal experience in team-based care as well as interprofessional education and collaborative practice (IPECP). Learners spend the majority of CoEPCE time in supervised, direct patient care, including primary care, women’s health, deployment health, homeless care, and home care. Formal IPECP activities comprise about 20% of time, supported by 3 educational strategies: (1) Panel management (PM)/quality improvement (QI); (2) Team building/ communications; and (3) Clinical content seminars to expand trainee clinical knowledge and skills and curriculum developed with the CoEPCE enterprise core domains in mind (Table).
Panel Management
Clinicians are increasingly being required to proactively optimize the health of an assigned population of patients in addition to assessing and managing the health of individual patients presenting for care. To address the objectives of increased accountability for population health outcomes and improved face-to-face care, Seattle CoEPCE developed curriculum for trainees to learn PM, a set of tools and processes that can be applied in the primary care setting.
PM clinical providers use data to proactively provide care to their patients between traditional clinic visits. The process is proactive in that gaps are identified whether or not an in-person visit occurs and involves an outreach mechanism to increase continuity of care, such as follow-up communications with the patients.2 PM also has been associated with improvements in chronic disease care.3-5
The Seattle CoEPCE developed an interprofessional team approach to PM that teaches trainees about the tools and resources used to close the gaps in care, including the use of clinical team members as health care systems subject matter experts. CoEPCE trainees are taught to analyze the care they provide to their panel of veterans (eg, identifying patients who have not refilled chronic medications or those who use the emergency department [ED] for nonacute conditions) and take action to improve care. PM yields rich discussions on systems resources and processes and is easily applied to a range of health conditions as well as delivery system issues. PM gives learners the tools they can use to close these gaps, such as the expertise of their peers, clinical team, and specialists.6
Planning and Implementation
In addition to completing a literature review to determine the state of PM practice and models, CoEPCE faculty polled recent graduates inquiring about strategies they did not learn prior to graduation. Based on their responses, CoEPCE faculty identified 2 skill deficits: management of chronic diseases and proficiency with data and statistics about performance improvement in panel patient care over time. Addressing these unmet needs became the impetus for developing curriculum for conducting PM. Planning and launching the CoEPCE approach to PM took about 3 months and involved CoEPCE faculty, a data manager, and administrative support. The learning objectives of Seattle’s PM initiative are to:
- Promote preventive health and chronic disease care by use performance data;
- Develop individual- and populationfocused action plans;
- Work collaboratively, strategically, and effectively with an interprofessional care team; and
- Learn how to effectively use system resources.
Curriculum
The PM curriculum is a longitudinal, experiential approach to learning how to manage chronic diseases between visits by using patient data. It is designed for trainees in a continuity clinic to review the care of their patients on a regular basis. Seattle CoEPCE medicine residents are assigned patient panels, which increase from 70 patients in the first year to about 140 patients by the end of the third year. DNP postgraduate trainees are assigned an initial panel of 50 patients that increases incrementally over the year-long residency.
CoEPCE faculty determined the focus of PM sessions to be diabetes mellitus (DM), hypertension, obesity, chronic opioid therapy, and low-acuity ED use. Because PM sessions are designed to allow participants to identify systems issues that may affect multiple patients, some of these topics have expanded into QI projects. PM sessions run 2 to 3 hours per session and are held 4 to 6 times a year. Each session is repeated twice to accommodate diverse trainee schedules. PM participants must have their patient visit time blocked for each session (Appendix).
Faculty Roles and Development
PM faculty involved in any individual session may include a combination of a CoEPCE clinical pharmacy specialist, a registered nurse (RN) care manager, a social worker, a NP, a physician, a clinical psychologist, and a medicine outpatient chief resident (PGY4, termed clinician-teacher fellow at Seattle VA medical center). The chief resident is a medicine residency graduate and takes on teaching responsibilities depending on the topic of the session. The CoEPCE clinical pharmacist role varies depending on the session topic: They may facilitate the session or provide recommendations for medication management for individual cases. The RN care manager often knows the patients and brings a unique perspective that complements that of the primary care providers and ideally participates in every session. The patients of multiple RN care managers may be presented at each session, and it was not feasible to include all RN care managers in every session. After case discussions, trainees often communicated with the RN care managers about the case, using instant messaging, and CoEPCE provides other avenues for patient care discussion through huddles involving the provider, RN care manager, clinical pharmacist, and other clinical professions.
Resources
The primary resource required to support PM is an information technology (IT) system that provides relevant health outcome and health care utilization data on patients assigned to trainees. PM sessions include teaching trainees how to access patient data. Since discussion about the care of panel patients during the learning sessions often results in real-time adjustments in the care plan, modest administrative support required post-PM sessions, such as clerical scheduling of the requested clinic or telephone follow-up with the physician, nurse, or pharmacist.
Monitoring and Assessment
Panel performance is evaluated at each educational session. To assess the CoEPCE PM curriculum, participants provide feedback in 8 questions over 3 domains: trainee perception of curriculum content, confidence in performing PM involving completion of a PM workshop, and likelihood of using PM techniques in the future. CoEPCE faculty use the feedback to improve their instruction of panel management skill and develop new sessions that target additional population groups. Evaluation of the curriculum also includes monitoring of panel patients’ chronic disease measures.
Several partnerships have contributed to the success and integrations of PM into facility activities. First, having the primary care clinic director as a member of the Co- EPCE faculty has encouraged faculty and staff to operationalize and implement PM broadly by distributing data monthly to all clinic staff. Second, high facility staff interest outside the CoEPCE and primary care clinic has facilitated establishing communications outside the CoEPCE regarding clinic data.
Challenges and Solutions
Trainees at earlier academic levels often desire more instruction in clinical knowledge, such as treatment options for DM or goals of therapy in hypertension. In contrast, advanced trainees are able to review patient data, brainstorm, and optimize solutions. Seattle CoEPCE balances these different learning needs via a flexible approach to the 3-hour sessions. For example, advanced trainees progress from structured short lectures to informal sessions, which train them to perform PM on their own. In addition, the flexible design integrates trainees with diverse schedules, particularly among DNP students and residents, pharmacy residents, and physician residents. Some of this work falls on the RN care management team and administrative support staff.
Competing Priorities
The demand for direct patient care points to the importance of indirect patient care activities like PM to demonstrate improved results. Managing chronic conditions and matching appropriate services and resources should improve clinical outcomes and efficiency longterm. In the interim, it is important to note that PM demonstrates the continuous aspect of clinical care, particularly for trainees who have strict guidelines defining clinical care for the experiences to count toward eligibility for licensure. Additionally, PM results in trainees who are making decisions with VA patients and are more efficiently providing and supporting patient care. Therefore, it is critical to secure important resources, such as provider time for conducting PM.
Data Access
No single data system in VA covers the broad range of topics covered in the PM sessions, and not all trainees have their own assigned panels. For example, health professions students are not assigned a panel of patients. While they do not have access to panel data such as those generated by Primary Care Almanac in VSSC (a data source in the VA Support Service Center database),the Seattle CoEPCE data manager pulls a set of patient data from the students’ paired faculty preceptors’ panels for review. Thus they learn PM principles and strategies for improving patient care via PM as part of the unique VA longitudinal clinic experience and the opportunity to learn from a multidisciplinary team that is not available at other clinical sites. Postgraduate NP residents in CoEPCE training have their own panels of patients and thus the ability to directly access their panel performance data.
Success Factors
A key success factor includes CoEPCE faculty’s ability to develop and operationalize a panel management model that simultaneously aligns with the educational goals of an interprofessional education training program and supports VA adoption of the medical home or patient aligned care teams (PACT). The CoEPCE contributes staff expertise in accessing and reporting patient data, accessing appropriate teaching space, managing panels of patients with chronic diseases, and facilitating a team-based approach to care. Additionally, the CoEPCE brand is helpful for getting buy-in from the clinical and academic stakeholders necessary for moving PM forward.
Colocating CoEPCE trainees and faculty in the primary care clinic promotes team identity around the RN care managers and facilitated communications with non-CoEPCE clinical teams that have trainees from other professions. RN care managers serve as the locus of highquality PM since they share patient panels with the trainees and already track admissions, ED visits, and numerous chronic health care metrics. RN care managers offer a level of insight into chronic disease that other providers may not possess, such as the specific details on medication adherence and the impact of adverse effects (AEs) for that particular patient. RN care managers are able to teach about their team role and responsibilities, strengthening the model.
PM is an opportunity to expand CoEPCE interprofessional education capacity by creating colocation of different trainee and faculty professions during the PM sessions; the sharing of data with trainees; and sharing and reflecting on data, strengthening communications between professions and within the PACT. The Seattle CoEPCE now has systems in place that allow the RN care manager to send notes to a physician and DNP resident, and the resident is expected to respond. In addition, the PM approach provides experience with analyzing data to improve care in an interprofessional team setting, which is a requirement of the Accreditation Council for Graduate Medical Education.
Interprofessional Collaboration
PM sessions are intentionally designed to improve communication among team members and foster a team approach to care. PM sessions provide an opportunity for trainees and clinician faculty to be together and learn about each profession’s perspectives. For example, early in the process physician and DNP trainees learn about the importance of clinical pharmacists to the team who prescribe and make medication adjustments within their scope of practice as well as the importance of making appropriate pharmacy referrals. Additionally, the RN care manager and clinical pharmacy specialists who serve as faculty in the CoEPCE provide pertinent information on individual patients, increasing integration with the PACT. Finally, there is anecdotal evidence that faculty also are learning more about interprofessional education and expanding their own skills.
Clinical Performance
CoEPCE trainees, non-CoEPCE physician residents, and CoEPCE faculty participants regularly receive patient data with which they can proactively develop or amend a treatment plan between visits. PM has resulted in improved data sharing with providers. Instead of once a year, providers and clinic staff now receive patient data monthly on chronic conditions from the clinic director. Trainees on ambulatory rotations are expected to review their panel data at least a half day per week. CoEPCE staff evaluate trainee likelihood to use PM and ability to identify patients who benefit from team-based care.
At the population level of chronic disease management, preliminary evidence demonstrates that primary care clinic patient panels are increasingly within target for DM and blood pressure measures, as assessed by periodic clinical reports to providers. Some of the PM topics have resulted in systems-level improvements, such as reducing unnecessary ED use for nonacute conditions and better opioid prescription monitoring. Moreover, PM supports everyone working at the top of his/her professional capability. For example, the RN care manager has the impetus to initiate DM education with a particular patient.
Since CoEPCE began teaching PM, the Seattle primary care clinic has committed to the regular access and review of data. This has encouraged the alignment of standards of care for chronic disease management so that all care providers are working toward the same benchmark goals.
Patient Outcomes
At the individual level, PM provide a mechanism to systemically review trainee panel patients with out-of-target clinical measures, and develop new care approaches involving interprofessional strategies and problem solving. PM also helps identify patients who have missed follow-up, reducing the risk that patients with chronic care needs will be lost to clinical engagement if they are not reminded or do not pursue appointments. The PM-trained PACT reaches out to patients who might not otherwise get care before the next clinic visit and provides new care plans. Second, patients have the benefit of a team that manages their health needs. For example, including the clinical pharmacists in the PM sessions ensures timely identification of medication interactions and the potential AEs. Additionally, PM contributes to the care coordination model by involving individuals on the primary care team who know the patient. These members review the patient’s data between visits and initiate team-based changes to the care plan to improve care. More team members connect with a patient, resulting in more intense care and quicker follow-up to determine the effectiveness of a treatment plan.
PM topics have spun off QI projects resulting in new clinic processes and programs, including processes for managing wounds in primary care and to assure timely post-ED visit follow-ups. Areas for expansion include a follow-up QI project to reduce nonacute ED visits by patients on the homeless PACT panel and interventions for better management of care for women veterans with mental health needs. PM also has extended to non-Co- EPCE teams and to other clinic activities, such as strengthening huddles of team members specifically related to panel data and addressing selected patient cases between visits. Pharmacy residents and faculty are more involved in reviewing the panel before patients are seen to review medication lists and identify duplications.
The Future
Under stage 2 of the program, the Seattle CoEPCE intends to lead in the creation of a PM toolkit as well as a data access guide that will allow VA facilities with limited data management expertise to access chronic disease metrics. Second, the CoEPCE will continue its dissemination efforts locally to other residents in the internal medicine residency program in all of its continuity clinics. Additionally, there is high interest by DNP training programs to expand and export longitudinal training experience PM curriculum to non-VA based students.
1. Kaminetzky CP, Beste LA, Poppe AP, et al. Implementation of a novel panel management curriculum. BMC Med Educ. 2017;17(1):264-269.
2. Neuwirth EB, Schmittdiel JA, Tallman K, Bellows J. Understanding panel management: a comparative study of an emerging approach to population care. Perm J. 2007;11(3):12-20.
3. Loo TS, Davis RB, Lipsitz LA, et al. Electronic medical record reminders and panel management to improve primary care of elderly patients. Arch Intern Med. 2011;171(17):1552-1558.
4. Kanter M, Martinez O, Lindsay G, Andrews K, Denver C. Proactive office encounter: a systematic approach to preventive and chronic care at every patient encounter. Perm J. 2010;14(3):38-43.
5. Kravetz JD, Walsh RF. Team-based hypertension management to improve blood pressure control. J Prim Care Community Health. 2016;7(4):272-275.
6. Kaminetzky CP, Nelson KM. In the office and in-between: the role of panel management in primary care. J Gen Intern Med. 2015;30(7):876-877.
Structured Approach to Venous Access Associated with Zero Risk of Pneumothorax During Cardiac Device Implant Procedures
Iatrogenic pneumothorax, an acute serious complication, is reported to occur in 0.1% to 2% of permanent trans-venous cardiac device implant procedures. 1,2 A National Cardiovascular Data Registry analysis of data between January 2006 and December 2008 found that pneumothorax incidence after a new defibrillator implant was 0.5%. 1 Among 4355 Danish patients undergoing a new device implant, 0.9% experienced pneumothorax requiring drainage and 0.7% had pneumothorax treated conservatively. 2 Studies have shown a higher risk of complications when procedures were performed at low-volume centers compared with the highest volume quartile (odds ratio, 1.26; 95% confidence interval, 1.05-1.52) or when procedures were performed by low-volume operators. 1
Methods. At 2 community hospitals, a project to reduce pneumothorax risk related to new device implants was implemented. This project consisted of obtaining a pre-procedure venogram (right anterior oblique [RAO] view, 12–18 degrees, 42 cm magnification), creating a subcutaneous pocket first and then obtaining axillary venous access with a 4Fr micro-puncture needle, and obtaining a post-procedure chest radiograph. During venous access, the needle was never advanced beyond the inner border of the first rib. This new process was fully implemented by January 2015. A chart review of all patients who underwent a new device implant between January 2015 and July 2017 at the 2 community medical centers was performed.
Results. Seventy patients received new implants during the review period (31 female, 39 male). The median age was 78 years (range, 34–94 years), median body mass index was 29.05 (range, 17.3–67.9), median procedural time was 70 minutes (range, 26–146 minutes), and median fluoroscopic time was 6.4 minutes (range, 0.5–35.7 minutes). A total of 131 independent venous accesses were obtained to implant 42 pacemakers and 28 defibrillators (10 single, 54 dual, and 6 biventricular devices). Of these accesses, 127 were axillary and the remainder were cephalic. There was no incidence of pneumothorax reported during these venous accesses.
Discussion. A structured approach to venous access during device implants was associated with zero incidence of pneumothorax in a low-volume center where implants were performed by a low-volume trained operator. The venogram eliminates “blind attempts,” and the RAO view reduces the likelihood of going too posterior. Using caudal fluoroscopy and targeting the axillary vein, other groups have reported a 0% to 0.2% risk for acute pneumothorax in larger patient groups. 3,4 Creating a subcutaneous pocket first allows the needle to be aligned more longitudinally along the course of the vein. The 4Fr needle increases the ratio of vein-to-needle surface area, reducing risk for pneumothorax.
Standardization of venous access can potentially reduce iatrogenic pneumothorax risk to a never event, similar to the approach used to prevent central line–associated blood stream infections. 5
Benjamin Carmel
Lake Erie College of Osteopathic Medicine
Bradenton, FL
Indiresha R. Iyer, MD
Case Western Reserve University
Cleveland, OH
Corresponding author: Indiresha R. Iyer, MD, Indiresha.iyer@ uhhospitals.org.
Financial disclosures: None.
1. Freeman JV, Wang Y, Curtis JP, et al. The relation between hospital procedure volume and complications of cardioverter-defibrillator implantation from the implantable cardioverter-defibrillator registry. J Am Coll Cardiol . 2010; 56:1133-1139.
2. Kirkfeldt RE, Johansen JB, Nohr, EA, et al. Complications after cardiac implantable electronic device implantations: an analysis of a complete, nationwide cohort in Denmark, Eur Heart J . 2014;35:1186–1194.
3. Yang F, Kulbak GA. New trick to a routine procedure: taking the fear out of the axillary vein stick using the 35° caudal view. Europace . 2015;17:1157-1160.
4. Hettiarachchi EMS, Arsene C, Fares S, et al. Fluoroscopy-guided axillary vein puncture, a reliable method to prevent acute complications associated with pacemaker, defibrillator, and cardiac resynchronization therapy leads insertion. J Cardiovasc Dis Diagn. 2014;2:136.
5. Chu H, Cosgrove S, Sexton B, et al. An intervention to decrease catheter-related bloodstream infections in the ICU. N Engl
Iatrogenic pneumothorax, an acute serious complication, is reported to occur in 0.1% to 2% of permanent trans-venous cardiac device implant procedures. 1,2 A National Cardiovascular Data Registry analysis of data between January 2006 and December 2008 found that pneumothorax incidence after a new defibrillator implant was 0.5%. 1 Among 4355 Danish patients undergoing a new device implant, 0.9% experienced pneumothorax requiring drainage and 0.7% had pneumothorax treated conservatively. 2 Studies have shown a higher risk of complications when procedures were performed at low-volume centers compared with the highest volume quartile (odds ratio, 1.26; 95% confidence interval, 1.05-1.52) or when procedures were performed by low-volume operators. 1
Methods. At 2 community hospitals, a project to reduce pneumothorax risk related to new device implants was implemented. This project consisted of obtaining a pre-procedure venogram (right anterior oblique [RAO] view, 12–18 degrees, 42 cm magnification), creating a subcutaneous pocket first and then obtaining axillary venous access with a 4Fr micro-puncture needle, and obtaining a post-procedure chest radiograph. During venous access, the needle was never advanced beyond the inner border of the first rib. This new process was fully implemented by January 2015. A chart review of all patients who underwent a new device implant between January 2015 and July 2017 at the 2 community medical centers was performed.
Results. Seventy patients received new implants during the review period (31 female, 39 male). The median age was 78 years (range, 34–94 years), median body mass index was 29.05 (range, 17.3–67.9), median procedural time was 70 minutes (range, 26–146 minutes), and median fluoroscopic time was 6.4 minutes (range, 0.5–35.7 minutes). A total of 131 independent venous accesses were obtained to implant 42 pacemakers and 28 defibrillators (10 single, 54 dual, and 6 biventricular devices). Of these accesses, 127 were axillary and the remainder were cephalic. There was no incidence of pneumothorax reported during these venous accesses.
Discussion. A structured approach to venous access during device implants was associated with zero incidence of pneumothorax in a low-volume center where implants were performed by a low-volume trained operator. The venogram eliminates “blind attempts,” and the RAO view reduces the likelihood of going too posterior. Using caudal fluoroscopy and targeting the axillary vein, other groups have reported a 0% to 0.2% risk for acute pneumothorax in larger patient groups. 3,4 Creating a subcutaneous pocket first allows the needle to be aligned more longitudinally along the course of the vein. The 4Fr needle increases the ratio of vein-to-needle surface area, reducing risk for pneumothorax.
Standardization of venous access can potentially reduce iatrogenic pneumothorax risk to a never event, similar to the approach used to prevent central line–associated blood stream infections. 5
Benjamin Carmel
Lake Erie College of Osteopathic Medicine
Bradenton, FL
Indiresha R. Iyer, MD
Case Western Reserve University
Cleveland, OH
Corresponding author: Indiresha R. Iyer, MD, Indiresha.iyer@ uhhospitals.org.
Financial disclosures: None.
1. Freeman JV, Wang Y, Curtis JP, et al. The relation between hospital procedure volume and complications of cardioverter-defibrillator implantation from the implantable cardioverter-defibrillator registry. J Am Coll Cardiol . 2010; 56:1133-1139.
2. Kirkfeldt RE, Johansen JB, Nohr, EA, et al. Complications after cardiac implantable electronic device implantations: an analysis of a complete, nationwide cohort in Denmark, Eur Heart J . 2014;35:1186–1194.
3. Yang F, Kulbak GA. New trick to a routine procedure: taking the fear out of the axillary vein stick using the 35° caudal view. Europace . 2015;17:1157-1160.
4. Hettiarachchi EMS, Arsene C, Fares S, et al. Fluoroscopy-guided axillary vein puncture, a reliable method to prevent acute complications associated with pacemaker, defibrillator, and cardiac resynchronization therapy leads insertion. J Cardiovasc Dis Diagn. 2014;2:136.
5. Chu H, Cosgrove S, Sexton B, et al. An intervention to decrease catheter-related bloodstream infections in the ICU. N Engl