Acute kidney injury (AKI) is a common complication that affects as many as 20% of hospitalized patients, depending on the definition employed.1-3 AKI is associated with significant morbidity and mortality; hospitalized patients with AKI require more investigations and medications,4 develop more postoperative complications,5 and spend more time in the intensive care unit than do patients without AKI.6 Inhospital mortality for patients with AKI has recently been estimated between 20-25%,3,7 and critically ill patients with AKI requiring dialysis experience mortality rates in excess of 50%.8,9 AKI and its accompanying complications may continue to rise, as the incidence of AKI and AKI requiring dialysis is increasing at a rate of approximately 10% per year.10-12
Owing to poor outcomes and rising incidence, AKI has emerged as a major public health concern with high human and financial costs; however, the costs related to AKI have been excluded from recent United States Renal Data System estimates.13 Most studies that have explored the costs related to hospitalizations complicated by AKI have been single-center or local studies in specialized patient populations.4,5,14-18 Very few studies have used data after the year 2000, when the incidence of AKI began to increase, likely related to a combination of patient age, comorbidity burden, sepsis, heart failure, and nephrotoxic medications.10,11 Moreover, it is unclear which patient and hospital characteristics contribute most to the cost of an AKI hospitalization, and how the costs of AKI compare to those for other acute medical conditions. Such information is important for hospitals, policymakers, and researchers to target prevention and management strategies for high-risk and high-cost patient groups.
The main objectives of this study were to determine the costs of AKI-related hospitalization, and patient and hospital factors associated with these costs. We hypothesized that costs related to AKI would add several thousand dollars to each hospitalization and would eclipse the cost of many higher profile acute medical conditions.
METHODS
Study Population
We extracted data from the National Inpatient Sample (NIS), a nationally representative administrative database of hospitalizations in the United States (U.S.) created by the Agency for Healthcare Research and Quality as part of the Healthcare Cost and Utilization Project.19 The NIS is the largest all-payer inpatient-care database, and contains a 20% stratified sample of yearly discharge data from short-term, non-Federal, nonrehabilitation hospitals. Data are stratified according to geographic region, location (urban/rural), teaching status, ownership, and hospital bed number. Each hospitalization is treated as an individual entry in the database (ie, individual patients who are hospitalized multiple times may be present in the NIS multiple times). The NIS includes demographic variables, diagnoses, procedures, LOS, and hospital charges. Sample weights are provided to allow for the generation of national estimates, along with information necessary to calculate the variance of estimates.
Table 1
We utilized the 2012 NIS subset, the most recent year available at the time of data analysis. The 2012 NIS subset contained administrative data from over 7 million hospitalizations, representing more than 4000 hospitals, 44 states, and 95% of the US population. We excluded patients under 18 years of age and patients with end-stage renal disease (ESRD). We identified patients with ESRD using diagnosis codes and procedure codes from the International Classification of Diseases, Ninth Revision, Clinical Modification (ICD-9-CM, Supplemental Table 1). We also excluded hospitalizations with an ICD-9 diagnosis or procedure code for dialysis but without a diagnosis code for AKI, assuming that these patients were treated with dialysis for ESRD. We and others have used this approach,11,20,21 which has been shown to produce high sensitivity and specificity, as well as high positive and negative predictive values (all equal to or greater than 90%) for differentiating dialysis-requiring AKI (AKI-D) from chronic dialysis.21
Primary and Secondary Exposures
Episodes of AKI were identified using the ICD-9 diagnosis code 584.x. This administrative code for AKI has low sensitivity, but high specificity of approximately 99%: our cohort includes few false positives, and identifies a more severe spectrum of AKI compared to serum creatinine criteria.21,22 For example, the median (25th, 75th percentile) change in serum creatinine from baseline is estimated at 1.2 (0.7 to 2.1) mg/dL compared with 0.2 (0.1 to 0.2) mg/dL for patients without an administrative code for AKI.21 We defined AKI-D as the presence of an AKI diagnosis code and a diagnosis or procedure code for dialysis. This algorithm for AKI-D has been shown to yield high sensitivity and specificity.21 Secondary exposures included several acute medical conditions (myocardial infarction, stroke, venous thromboembolic disease, gastrointestinal bleed, acute pancreatitis, sepsis, and pneumonia) whose incremental costs and LOS could be compared to AKI (Supplemental Table 1).
Covariates
We assessed patient comorbidities from the 25 diagnoses listed in the NIS for each record (Supplemental Table 1).Hospital-level variables included geographic region, bed number, and teaching status using predetermined NIS definitions.19
Outcomes
The primary outcome was the inpatient cost of each hospital record in 2012 dollars. We estimated costs from the total charge for each hospitalization by applying hospital-specific charge-to-cost ratios. The NIS obtained cost information from the hospital accounting reports collected by the Centers for Medicare and Medicaid Services.19The secondary outcome was hospital LOS.
Statistical Analysis
We summarized baseline characteristics of the study participants using descriptive statistics. Normally distributed continuous variables were expressed as mean (standard deviation [SD]), and nonparametric continuous variables were expressed as median (25th, 75th percentile). Categorical variables were expressed as proportions. We calculated the mean increase in cost and LOS of each hospital record, comparing hospital records with AKI and AKI-D to hospital records without AKI. We took the same approach when examining incremental costs and LOS associated with other acute medical conditions. Due to the skewness of cost and LOS data, we used a generalized linear model with a gamma distribution and a log link fitted to the primary or secondary exposure to obtain the unadjusted mean increase in cost and LOS.23,24 We incorporated demographics, hospital differences, comorbidities (including AKI when it was compared to the other acute medical conditions), and procedures into the generalized linear model to calculate the adjusted mean increase in cost and LOS. This method also provides the adjusted percentage change in hospital costs and LOS from the estimated beta-coefficients in the multivariable model. We calculated the proportion of variation in the outcomes explained by the generalized linear models using pseudo R-squared measured by the Kullback-Leibler divergence.25 As a companion analysis, we repeated estimates for AKI-D when dialysis was initiated within 7 days of hospital admission because subsequent events during the hospital stay would more likely be attributable to the AKI episode. All analyses presented account for the NIS survey design (weighting and stratification) and subpopulation measurements to generate national estimates. We created the cohort using the Statistical Analysis System software, version 9.4 (SAS Institute, Cary, North Carolina) and conducted the analyses using StataMP, version 14.0 (Stata Corporation, College Station, Texas).
RESULTS
Patient Characteristics
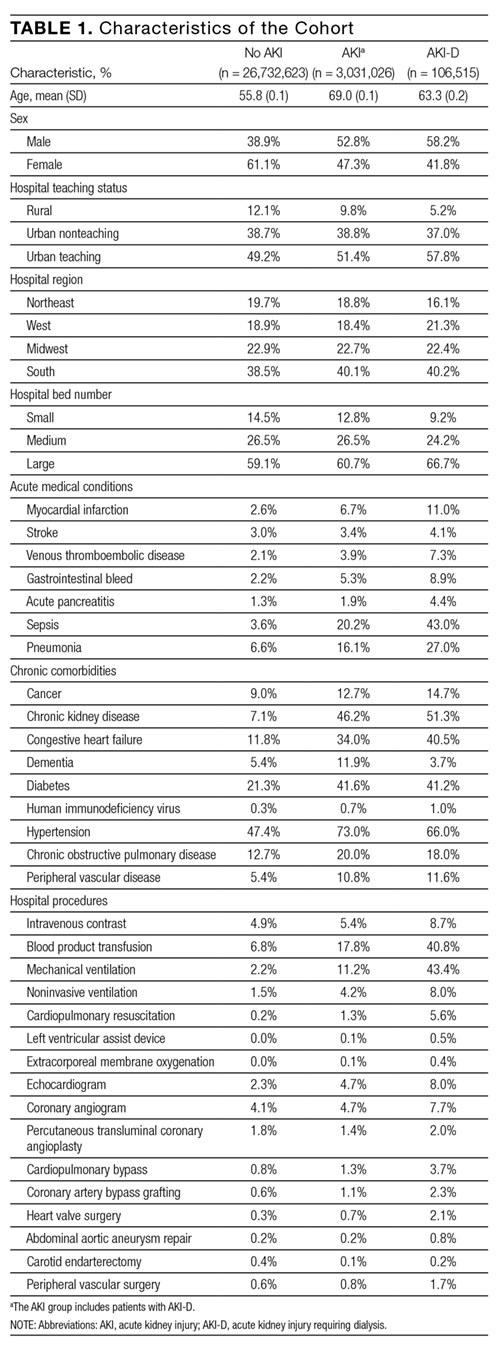
Between January 1 and December 31, 2012, there were 36,484,846 hospitalization records available in the NIS; 948,875 adult records (2.6%) were classified as having ESRD and 29,763,649 (81.6%) were included in the final cohort. Within the final cohort, 3,031,026 (10.2%) hospitalizations were complicated by AKI, of which 106,515 (3.5%) required dialysis (corresponding to 0.36% of the analytic cohort) (Figure 1).
Figure 1
Compared to patients without AKI, patients with AKI were older (69.0 years vs. 55.8 years) and a larger proportion were male (52.8% vs. 38.9%). All measured comorbidities were more prevalent in patients with AKI. Patients with AKI also underwent more hospital procedures than patients without AKI (Table 1).
Hospitalization Costs
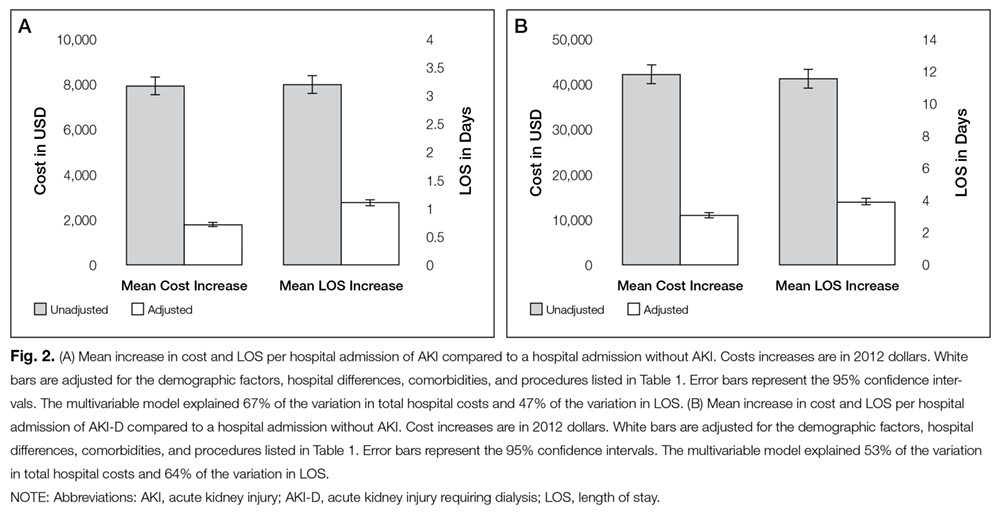
Figures 2A and 2B show unadjusted and multivariable-adjusted mean increases in cost of a hospitalization with AKI and AKI-D compared to a hospitalization without AKI. Extrapolating to the 2012 population estimates in Table 1 for AKI and AKI-D, increases in cost related to AKI ranged from $24.0 billion (unadjusted) to $5.4 billion (adjusted) and for AKI-D ranged from $4.5 billion (unadjusted) to $1.2 billion (adjusted).
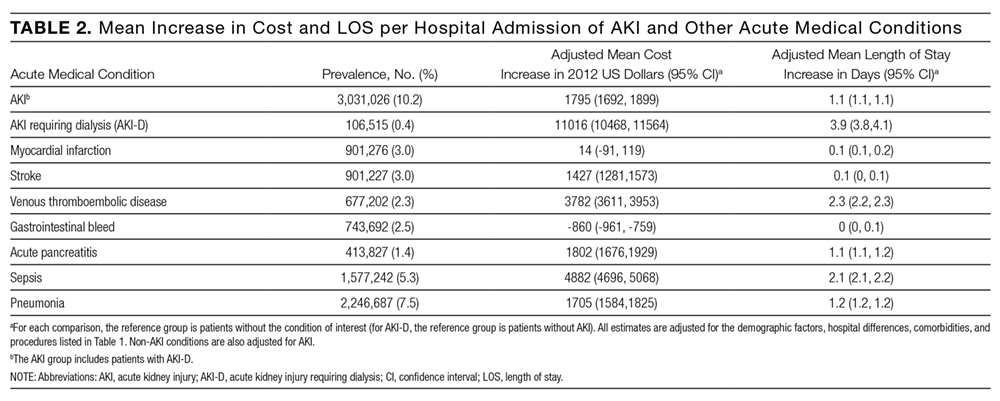
Mean increases in the cost of a hospitalization for AKI exceeded costs associated with other acute medical conditions such as myocardial infarction and gastrointestinal bleeding. Costs associated with AKI were similar to hospitalizations for stroke, acute pancreatitis, and pneumonia. Costs of AKI-D exceeded those related to sepsis and venous thromboembolic disease (Table 2). AKI was the most common of the acute medical conditions examined (3,031,026 patients, 10.2%).
Major drivers of cost included urban and teaching hospitals, hospitals in the Southern US (relative to other regions), hospitals with a larger number of beds, most acute medical conditions, cancer, and hospital procedures. Older age was associated with higher costs with non-AKI hospitalizations but lower costs with AKI hospitalizations (0.67% vs. -0.44%, per year of age). Determinants of hospital costs are shown in Supplemental Table 2. Generally, hospital procedures accounted for the largest relative increases in cost.
Length of Stay
Figures 2A and 2B show unadjusted and multivariable-adjusted mean increases in LOS for a hospitalization with AKI and AKI-D compared to a hospitalization without AKI. Extrapolating to the 2012 population estimates in Table 1 for AKI and AKI-D, increases in LOS related to AKI ranged from 9.8 million days (unadjusted) to 3.3 million days (adjusted) and for AKI-D ranged from 1.2 million days (unadjusted) to 0.4 million days (adjusted).
Figure 2A and 2B
When compared to other acute medical conditions, the mean increase in LOS of an AKI hospitalization resembled the order for mean increases in cost (Table 2). Major drivers of LOS also resembled drivers of costs, with the exception of some common cardiovascular procedures (percutaneous transluminal coronary angioplasty, abdominal aortic aneurysm repair, and carotid endarterectomy) that were associated only with prolonged LOS in the AKI and AKI-D groups (Supplemental Table 3).
Table 2
Companion Analysis
In an analysis of 78,220 patients who developed AKI-D within 7 days of hospital admission (73% of AKI-D cases), increases in cost ranged from $32,133 (unadjusted) to $8594 (adjusted) and increases in LOS ranged from 8.4 days (unadjusted) to 2.9 days (adjusted) compared to patients without AKI.
DISCUSSION
We found that hospitalizations complicated by AKI were more costly—between $1800 and $7900—than hospitalizations that did not involve AKI, which indicates that AKI could be responsible for billions of dollars of annual healthcare spending. Relative to several other acute medical conditions, AKI was more common and expensive; when AKI was severe enough to require dialysis, costs of AKI exceeded all other acute medical conditions by a large margin.
Several single-center and regional studies have highlighted the association of AKI with hospital costs and LOS. In a single-center study conducted in the late 1990s, Chertow et al14 described mean cost increases between $4900 (adjusted) and $8900 (unadjusted) and LOS increases of 3.5 days (adjusted) using serum creatinine criteria to define AKI.14 These higher adjusted estimates may result because their multivariable models did not adjust for several major determinants of cost, including several procedures and hospital-level variables. A study at the same academic center in 2010, which adjusted for some procedures, found AKI was associated with a 2.8-day increase in LOS and a $7082 increase in costs;2 however, this study also could not adjust for hospital-level variables because of the single-center design. Fischer et al15 were able to adjust for hospital teaching status in their study that included 23 local hospitals. Similar to our results, teaching hospitals were associated with an approximately17% increase in cost compared to nonacademic hospitals. However, this study excluded patients who required critical care or mechanical ventilation, which limits the generalizability of their cost estimates. Another limitation of these 3 studies is that they were all conducted in Massachusetts. Beyond the US, the economic burden of AKI has been studied in England where the annual cost of AKI-related inpatient care has been estimated at $1.4 billion.16 In addition to incomplete procedure and hospital-level adjustment, this study is limited by its ascertainment of AKI and costs, which was extrapolated from 1 hospital region to the rest of England.
Our study adds to the existing evidence in a number of ways. It uses nationally representative data to determine a lower and an upper limit of increases in cost and LOS attributable to AKI. The adjusted value is likely overly conservative; it minimizes the influence of events that are attributable to AKI and does not account for complications that may be caused by, or otherwise related to, AKI. The unadjusted value is likely an overestimate, attributing events during an AKI hospitalization to the AKI episode, even if they precede AKI. In clinical practice, most patients fall between these 2 extremes. Therefore, we suggest using the adjusted and unadjusted estimates to provide a range of the cost and LOS increases that are attributable to AKI. This interpretation is also supported by the companion analysis that minimizes the effect of pre-AKI events, where the unadjusted cost and LOS estimates for AKI-D occurring early during a hospitalization fell between the unadjusted and adjusted estimates for the main AKI-D analysis. Therefore, our data suggest that each hospitalization complicated by AKI is associated with a cost increase between $1800 and $7900 and an LOS increase between 1.1 days and 3.2 days. Not surprisingly, the burden of AKI-D was more pronounced with a cost increase between $11,000 and $42,100 and an LOS increase between 3.9 days and 11.5 days.
Unlike previous studies, these analyses are fully adjusted for procedures and multiple hospital-level variables (such as teaching status, region, and bed number). These adjustments are important because procedures account for much of the incremental cost and LOS associated with AKI, and each hospital-level variable may increase the cost and LOS of an AKI hospitalization by 10% to 25% (Supplemental Tables 2 and 3). Even though the relative increases in cost and LOS associated with different comorbidities and procedures were largely similar between patients with and without AKI, the absolute increases were usually larger in patients with AKI rather than without AKI because of their higher baseline estimates. We also observed that each year of age was associated with increased costs in patients without AKI, but decreased costs in patients with AKI. We suspect this difference is due to the lesser (and ultimately less costly) injury required to induce AKI in elderly patients who have less physiologic reserve.26 Moreover, we placed the burden of AKI in relation to other acute medical conditions, where its total estimated annual costs of $5.4 billion were exceeded only by the $7.7 billion attributed to sepsis.
Our results emphasize that AKI is an important contributor to hospital costs and LOS. Despite these consequences, there have been very few innovations in the prevention and management of AKI over the last decade.27,28 The primary treatment for severe AKI remains dialysis, and recent clinical trials suggest that we may have reached a dose plateau in the value of dialytic therapy.8,29 Several opportunities, such as advances in basic science and clinical care, may improve the care of patients with AKI. Translational research challenges in AKI have been reviewed, with treatment strategies that include hemodynamic, inflammatory, and regenerative mechanisms.28, 30 In a recent report from the National Confidential Enquiry into Patient Outcome and Death in the United Kingdom, 30% of AKI episodes that occurred inhospital were preventable, and only 50% of patients with AKI were deemed to have received good care.31 Our results suggest that even small progress in these areas could yield significant cost savings. One starting point suggested by our findings is a better understanding of the reasons underlying the association between hospital-level variables and differences in cost and LOS. Notably, there have been few efforts to improve AKI care processes on the same scale as sepsis,32 myocardial infarction,33,34 stroke,35 and venous thromboembolic disease.36
Strengths of this study include cost and LOS estimates of AKI from different hospitals across the US, including academic and community institutions. As a result, our study is significantly larger and more representative of the US population than previously published studies. Moreover, we utilized data from 2012, which accounts for the increasing incidence of AKI and recent advances in critical care medicine. We were also able to adjust for comorbid conditions, procedures, severity of illness, and hospital-level variables, which provide a conservative lower limit of the burden of AKI on hospitalized patients.
Our study has limitations. First, we used administrative codes to identify patients with AKI. The low sensitivity of these codes suggests that many patients with milder forms of AKI were probably not coded as such. Accordingly, our findings should be generally applicable to patients with moderate to severe AKI rather than to those with mild AKI.21,22 Second, the NIS lacks granularity on the details and sequence of events during a hospitalization. As a result, we could not determine the timing of an AKI episode during a hospitalization or whether a diagnosis or procedure was the cause or consequence of an AKI episode (ie, day 1 as the reason for admission vs. day 20 as a complication of surgery). Both the timing and cause of an AKI episode may influence cost and LOS, which should be considered when applying our results to patient care. We did not attempt to estimate the costs associated with comorbidities such as congestive heart failure and chronic obstructive pulmonary disease because we could not determine the acuity of disease in the NIS. Third, despite our efforts, residual confounding is likely, especially since administrative data limit our ability to capture the severity of comorbid conditions and the underlying illness. Fourth, the NIS does not contain individual patient identifiers, so multiple hospitalizations from the same patient may be represented.
Even our most conservative estimates still attribute $5.4 billion and 3.3 million hospital-days to AKI in 2012. These findings highlight the need for hospitals, policymakers, and researchers to recognize the economic burden of AKI. Future work should focus on understanding hospital-level differences in AKI care and the effect on patient morbidity and mortality. National and hospital-wide quality improvement programs are also needed. Such initiatives have commenced in the United Kingdom,37 and similar efforts are needed in North America to develop and coordinate cost-effective strategies to care for patients with AKI.
Disclosures
Samuel A. Silver, MD, MSc, is supported by a Kidney Research Scientist Core Education and National Training Program Post-Doctoral Fellowship (co-funded by the Kidney Foundation of Canada, Canadian Society of Nephrology, and Canadian Institutes of Health Research). Glenn M. Chertow, MD, MPH, is supported by a K24 mid-career mentoring award from NIDDK (K24 DK085446). These funders had no role in the design and conduct of the study; collection, management, analysis, and interpretation of the data; preparation, or approval of the manuscript; or decision to submit the manuscript for publication. The authors report no financial conflicts of interest.
1. Waikar SS, Liu KD, Chertow GM. Diagnosis, epidemiology and outcomes of acute kidney injury. Clin J Am Soc Nephrol. 2008;3:844-861. PubMed
2. Zeng X, McMahon GM, Brunelli SM, Bates DW, Waikar SS. Incidence, outcomes, and comparisons across definitions of AKI in hospitalized individuals. Clin J Am Soc Nephrol. 2014;9:12-20. PubMed
3. Susantitaphong P, Cruz DN, Cerda J, et al. Acute Kidney Injury Advisory Group of the American Society of Nephrology. World incidence of AKI: a meta-analysis. Clin J Am Soc Nephrol. 2013;8:1482-1493. PubMed
4. Dasta JF, Kane-Gill SL, Durtschi AJ, Pathak DS, Kellum JA. Costs and outcomes of acute kidney injury (AKI) following cardiac surgery. Nephrol Dial Transplant. 2008;23:1970-1974. PubMed
5. Hobson C, Ozrazgat-Baslanti T, Kuxhausen A, et al. Cost and mortality associated with postoperative acute kidney injury. Ann Surg. 2015;261:1207-1214. PubMed
6. Vieira JM Jr, Castro I, Curvello-Neto A, et al. Effect of acute kidney injury on weaning from mechanical ventilation in critically ill patients. Crit Care Med. 2007;35:184-191. PubMed
7. Selby NM, Kolhe NV, McIntyre CW, et al. Defining the cause of death in hospitalised patients with acute kidney injury. PLoS One. 2012;7:e48580. PubMed
8. Palevsky PM, Zhang JH, O’Connor TZ, et al. Intensity of renal support in critically ill patients with acute kidney injury. N Engl J Med. 2008;359(1):7-20. PubMed
9. Uchino S, Bellomo R, Morimatsu H, et al. Continuous renal replacement therapy: a worldwide practice survey. The beginning and ending supportive therapy for the kidney (B.E.S.T. kidney) investigators. Intensive Care Med. 2007;33:1563-1570. PubMed
10. Siew ED, Davenport A. The growth of acute kidney injury: a rising tide or just closer attention to detail? Kidney Int. 2015;87:46-61. PubMed
11. Hsu RK, McCulloch CE, Dudley RA, Lo LJ, Hsu CY. Temporal changes in incidence of dialysis-requiring AKI. J Am Soc Nephrol. 2013;24:37-42. PubMed
12. Xue JL, Daniels F, Star RA, et al. Incidence and mortality of acute renal failure in Medicare beneficiaries, 1992 to 2001. J Am Soc Nephrol. 2006;17:1135-1142. PubMed
13. Saran R, Li Y, Robinson B, et al. US Renal Data System 2015 annual data report: epidemiology of kidney disease in the United States. Am J Kidney Dis. 2016;67(3 suppl 1):S1-S434. PubMed
14. Chertow GM, Burdick E, Honour M, Bonventre JV, Bates DW. Acute kidney injury, mortality, length of stay, and costs in hospitalized patients. J Am Soc Nephrol. 2005;16:3365-3370. PubMed
15. Fischer MJ, Brimhall BB, Lezotte DC, Glazner JE, Parikh CR. Uncomplicated acute renal failure and hospital resource utilization: a retrospective multicenter analysis. Am J Kidney Dis. 2005;46:1049-1057. PubMed
16. Kerr M, Bedford M, Matthews B, O’Donoghue D. The economic impact of acute kidney injury in England. Nephrol Dial Transplant. 2014;29:1362-1368. PubMed
17. De Smedt DM, Elseviers MM, Lins RL, Annemans L. Economic evaluation of different treatment modalities in acute kidney injury. Nephrol Dial Transplant. 2012;27:4095-5101. PubMed
18. Srisawat N, Lawsin L, Uchino S, Bellomo R, Kellum JA; BEST Kidney Investigators. Cost of acute renal replacement therapy in the intensive care unit: results from The Beginning and Ending Supportive Therapy for the Kidney (BEST Kidney) study. Crit Care. 2010;14:R46. PubMed
19. Agency for Healthcare Research and Quality. Healthcare Cost and Utilization Project (HCUP). Overview of the National (Nationwide) Inpatient Sample (NIS). Available at: http://www.hcup-us.ahrq.gov/nisoverview.jsp. Accessed January 10, 2016.
20. Lenihan CR, Montez-Rath ME, Mora Mangano CT, Chertow GM, Winkelmayer WC. Trends in acute kidney injury, associated use of dialysis, and mortality after cardiac surgery, 1999 to 2008. Ann Thorac Surg. 2013;95:20-28. PubMed
21. Waikar SS, Wald R, Chertow GM, et al. Validity of international classification of diseases, ninth revision, clinical modification codes for acute renal failure. J Am Soc Nephrol. 2006;17:1688-1694. PubMed
22. Grams ME, Waikar SS, MacMahon B, Whelton S, Ballew SH, Coresh J. Performance and limitations of administrative data in the identification of AKI. Clin J Am Soc Nephrol. 2014;9:682-689. PubMed
23. Blough DK, Madden CW, Hornbrook MC. Modeling risk using generalized linear models. J Health Econ. 1999;18:153-171. PubMed
24. Malehi AS, Pourmotahari F, Angali KA. Statistical models for the analysis of skewed healthcare cost data: a simulation study. Health Econ Rev. 2015;5:11. PubMed
25. Cameron AC, Windmeijer FA. An R-squared measure of goodness of fit for some common nonlinear regression models. J Econometrics. 1997(77):329-342.
26. Coca SG. Acute kidney injury in elderly persons. Am J Kidney Dis. 2010;56:122-131. PubMed
27. Bonventre JV, Basile D, Liu KD, et al; Kidney Research National Dialogue (KRND). AKI: a path forward. Clin J Am Soc Nephrol. 2013;8:1606-1608. PubMed
28. Okusa MD, Rosner MH, Kellum JA, Ronco C; Acute Dialysis Quality Initiative XIII Workgroup. Therapeutic targets of human AKI: harmonizing human and animal AKI. J Am Soc Nephrol. 2016;27:44-48. PubMed
29. Pannu N, Klarenbach S, Wiebe N, Manns B, Tonelli M; Alberta Kidney Disease Network. Renal replacement therapy in patients with acute renal failure: a systematic review. JAMA. 2008;299:793-805. PubMed
30. Silver SA, Cardinal H, Colwell K, Burger D, Dickhout JG. Acute kidney injury: preclinical innovations, challenges, and opportunities for translation. Can J Kidney Health Dis. 2015;2:30. PubMed
31. Stewart J, Findlay G, Smith N, Kelly K, Mason M. Adding insult to injury: a review of the care of patients who died in hospital with a primary diagnosis of acute kidney injury (acute renal failure). A report by the National Confidential Enquiry into Patient Outcome and Death 2009. Available at: http://www.ncepod.org.uk/2009aki.html. Accessed April 4, 2016.
32. Society of Critical Care Medicine. Surviving Sepsis Campaign. Available at: http://www.survivingsepsis.org /Pages/default.aspx. Accessed April 3, 2016.
33. Mehta RH, Montoye CK, Gallogly M, et al; GAP Steering Committee of the American College of Cardiology. Improving quality of care for acute myocardial infarction: The Guidelines Applied in Practice (GAP) Initiative. JAMA. 2002;287:1269-1276. PubMed
34. Lewis WR, Peterson ED, Cannon CP, et al. An organized approach to improvement in guideline adherence for acute myocardial infarction: results with the Get With The Guidelines quality improvement program. Arch Intern Med. 2008;168:1813-1819. PubMed
35. Schwamm LH, Fonarow GC, Reeves MJ, et al. Get With the Guidelines–stroke is associated with sustained improvement in care for patients hospitalized with acute stroke or transient ischemic attack. Circulation. 2009;119:107-115. PubMed
36. Maynard G. Preventing Hospital-associated Venous Thromboembolism: A Guide for Effective Quality Improvement. 2nd ed. Rockville, MD: Agency for Healthcare Research and Quality; October 2015. AHRQ Publication No. 16-0001-EF.
Acute kidney injury (AKI) is a common complication that affects as many as 20% of hospitalized patients, depending on the definition employed.1-3 AKI is associated with significant morbidity and mortality; hospitalized patients with AKI require more investigations and medications,4 develop more postoperative complications,5 and spend more time in the intensive care unit than do patients without AKI.6 Inhospital mortality for patients with AKI has recently been estimated between 20-25%,3,7 and critically ill patients with AKI requiring dialysis experience mortality rates in excess of 50%.8,9 AKI and its accompanying complications may continue to rise, as the incidence of AKI and AKI requiring dialysis is increasing at a rate of approximately 10% per year.10-12
Owing to poor outcomes and rising incidence, AKI has emerged as a major public health concern with high human and financial costs; however, the costs related to AKI have been excluded from recent United States Renal Data System estimates.13 Most studies that have explored the costs related to hospitalizations complicated by AKI have been single-center or local studies in specialized patient populations.4,5,14-18 Very few studies have used data after the year 2000, when the incidence of AKI began to increase, likely related to a combination of patient age, comorbidity burden, sepsis, heart failure, and nephrotoxic medications.10,11 Moreover, it is unclear which patient and hospital characteristics contribute most to the cost of an AKI hospitalization, and how the costs of AKI compare to those for other acute medical conditions. Such information is important for hospitals, policymakers, and researchers to target prevention and management strategies for high-risk and high-cost patient groups.
The main objectives of this study were to determine the costs of AKI-related hospitalization, and patient and hospital factors associated with these costs. We hypothesized that costs related to AKI would add several thousand dollars to each hospitalization and would eclipse the cost of many higher profile acute medical conditions.
METHODS
Study Population
We extracted data from the National Inpatient Sample (NIS), a nationally representative administrative database of hospitalizations in the United States (U.S.) created by the Agency for Healthcare Research and Quality as part of the Healthcare Cost and Utilization Project.19 The NIS is the largest all-payer inpatient-care database, and contains a 20% stratified sample of yearly discharge data from short-term, non-Federal, nonrehabilitation hospitals. Data are stratified according to geographic region, location (urban/rural), teaching status, ownership, and hospital bed number. Each hospitalization is treated as an individual entry in the database (ie, individual patients who are hospitalized multiple times may be present in the NIS multiple times). The NIS includes demographic variables, diagnoses, procedures, LOS, and hospital charges. Sample weights are provided to allow for the generation of national estimates, along with information necessary to calculate the variance of estimates.
Table 1
We utilized the 2012 NIS subset, the most recent year available at the time of data analysis. The 2012 NIS subset contained administrative data from over 7 million hospitalizations, representing more than 4000 hospitals, 44 states, and 95% of the US population. We excluded patients under 18 years of age and patients with end-stage renal disease (ESRD). We identified patients with ESRD using diagnosis codes and procedure codes from the International Classification of Diseases, Ninth Revision, Clinical Modification (ICD-9-CM, Supplemental Table 1). We also excluded hospitalizations with an ICD-9 diagnosis or procedure code for dialysis but without a diagnosis code for AKI, assuming that these patients were treated with dialysis for ESRD. We and others have used this approach,11,20,21 which has been shown to produce high sensitivity and specificity, as well as high positive and negative predictive values (all equal to or greater than 90%) for differentiating dialysis-requiring AKI (AKI-D) from chronic dialysis.21
Primary and Secondary Exposures
Episodes of AKI were identified using the ICD-9 diagnosis code 584.x. This administrative code for AKI has low sensitivity, but high specificity of approximately 99%: our cohort includes few false positives, and identifies a more severe spectrum of AKI compared to serum creatinine criteria.21,22 For example, the median (25th, 75th percentile) change in serum creatinine from baseline is estimated at 1.2 (0.7 to 2.1) mg/dL compared with 0.2 (0.1 to 0.2) mg/dL for patients without an administrative code for AKI.21 We defined AKI-D as the presence of an AKI diagnosis code and a diagnosis or procedure code for dialysis. This algorithm for AKI-D has been shown to yield high sensitivity and specificity.21 Secondary exposures included several acute medical conditions (myocardial infarction, stroke, venous thromboembolic disease, gastrointestinal bleed, acute pancreatitis, sepsis, and pneumonia) whose incremental costs and LOS could be compared to AKI (Supplemental Table 1).
Covariates
We assessed patient comorbidities from the 25 diagnoses listed in the NIS for each record (Supplemental Table 1).Hospital-level variables included geographic region, bed number, and teaching status using predetermined NIS definitions.19
Outcomes
The primary outcome was the inpatient cost of each hospital record in 2012 dollars. We estimated costs from the total charge for each hospitalization by applying hospital-specific charge-to-cost ratios. The NIS obtained cost information from the hospital accounting reports collected by the Centers for Medicare and Medicaid Services.19The secondary outcome was hospital LOS.
Statistical Analysis
We summarized baseline characteristics of the study participants using descriptive statistics. Normally distributed continuous variables were expressed as mean (standard deviation [SD]), and nonparametric continuous variables were expressed as median (25th, 75th percentile). Categorical variables were expressed as proportions. We calculated the mean increase in cost and LOS of each hospital record, comparing hospital records with AKI and AKI-D to hospital records without AKI. We took the same approach when examining incremental costs and LOS associated with other acute medical conditions. Due to the skewness of cost and LOS data, we used a generalized linear model with a gamma distribution and a log link fitted to the primary or secondary exposure to obtain the unadjusted mean increase in cost and LOS.23,24 We incorporated demographics, hospital differences, comorbidities (including AKI when it was compared to the other acute medical conditions), and procedures into the generalized linear model to calculate the adjusted mean increase in cost and LOS. This method also provides the adjusted percentage change in hospital costs and LOS from the estimated beta-coefficients in the multivariable model. We calculated the proportion of variation in the outcomes explained by the generalized linear models using pseudo R-squared measured by the Kullback-Leibler divergence.25 As a companion analysis, we repeated estimates for AKI-D when dialysis was initiated within 7 days of hospital admission because subsequent events during the hospital stay would more likely be attributable to the AKI episode. All analyses presented account for the NIS survey design (weighting and stratification) and subpopulation measurements to generate national estimates. We created the cohort using the Statistical Analysis System software, version 9.4 (SAS Institute, Cary, North Carolina) and conducted the analyses using StataMP, version 14.0 (Stata Corporation, College Station, Texas).
RESULTS
Patient Characteristics
Between January 1 and December 31, 2012, there were 36,484,846 hospitalization records available in the NIS; 948,875 adult records (2.6%) were classified as having ESRD and 29,763,649 (81.6%) were included in the final cohort. Within the final cohort, 3,031,026 (10.2%) hospitalizations were complicated by AKI, of which 106,515 (3.5%) required dialysis (corresponding to 0.36% of the analytic cohort) (Figure 1).
Figure 1
Compared to patients without AKI, patients with AKI were older (69.0 years vs. 55.8 years) and a larger proportion were male (52.8% vs. 38.9%). All measured comorbidities were more prevalent in patients with AKI. Patients with AKI also underwent more hospital procedures than patients without AKI (Table 1).
Hospitalization Costs
Figures 2A and 2B show unadjusted and multivariable-adjusted mean increases in cost of a hospitalization with AKI and AKI-D compared to a hospitalization without AKI. Extrapolating to the 2012 population estimates in Table 1 for AKI and AKI-D, increases in cost related to AKI ranged from $24.0 billion (unadjusted) to $5.4 billion (adjusted) and for AKI-D ranged from $4.5 billion (unadjusted) to $1.2 billion (adjusted).
Mean increases in the cost of a hospitalization for AKI exceeded costs associated with other acute medical conditions such as myocardial infarction and gastrointestinal bleeding. Costs associated with AKI were similar to hospitalizations for stroke, acute pancreatitis, and pneumonia. Costs of AKI-D exceeded those related to sepsis and venous thromboembolic disease (Table 2). AKI was the most common of the acute medical conditions examined (3,031,026 patients, 10.2%).
Major drivers of cost included urban and teaching hospitals, hospitals in the Southern US (relative to other regions), hospitals with a larger number of beds, most acute medical conditions, cancer, and hospital procedures. Older age was associated with higher costs with non-AKI hospitalizations but lower costs with AKI hospitalizations (0.67% vs. -0.44%, per year of age). Determinants of hospital costs are shown in Supplemental Table 2. Generally, hospital procedures accounted for the largest relative increases in cost.
Length of Stay
Figures 2A and 2B show unadjusted and multivariable-adjusted mean increases in LOS for a hospitalization with AKI and AKI-D compared to a hospitalization without AKI. Extrapolating to the 2012 population estimates in Table 1 for AKI and AKI-D, increases in LOS related to AKI ranged from 9.8 million days (unadjusted) to 3.3 million days (adjusted) and for AKI-D ranged from 1.2 million days (unadjusted) to 0.4 million days (adjusted).
Figure 2A and 2B
When compared to other acute medical conditions, the mean increase in LOS of an AKI hospitalization resembled the order for mean increases in cost (Table 2). Major drivers of LOS also resembled drivers of costs, with the exception of some common cardiovascular procedures (percutaneous transluminal coronary angioplasty, abdominal aortic aneurysm repair, and carotid endarterectomy) that were associated only with prolonged LOS in the AKI and AKI-D groups (Supplemental Table 3).
Table 2
Companion Analysis
In an analysis of 78,220 patients who developed AKI-D within 7 days of hospital admission (73% of AKI-D cases), increases in cost ranged from $32,133 (unadjusted) to $8594 (adjusted) and increases in LOS ranged from 8.4 days (unadjusted) to 2.9 days (adjusted) compared to patients without AKI.
DISCUSSION
We found that hospitalizations complicated by AKI were more costly—between $1800 and $7900—than hospitalizations that did not involve AKI, which indicates that AKI could be responsible for billions of dollars of annual healthcare spending. Relative to several other acute medical conditions, AKI was more common and expensive; when AKI was severe enough to require dialysis, costs of AKI exceeded all other acute medical conditions by a large margin.
Several single-center and regional studies have highlighted the association of AKI with hospital costs and LOS. In a single-center study conducted in the late 1990s, Chertow et al14 described mean cost increases between $4900 (adjusted) and $8900 (unadjusted) and LOS increases of 3.5 days (adjusted) using serum creatinine criteria to define AKI.14 These higher adjusted estimates may result because their multivariable models did not adjust for several major determinants of cost, including several procedures and hospital-level variables. A study at the same academic center in 2010, which adjusted for some procedures, found AKI was associated with a 2.8-day increase in LOS and a $7082 increase in costs;2 however, this study also could not adjust for hospital-level variables because of the single-center design. Fischer et al15 were able to adjust for hospital teaching status in their study that included 23 local hospitals. Similar to our results, teaching hospitals were associated with an approximately17% increase in cost compared to nonacademic hospitals. However, this study excluded patients who required critical care or mechanical ventilation, which limits the generalizability of their cost estimates. Another limitation of these 3 studies is that they were all conducted in Massachusetts. Beyond the US, the economic burden of AKI has been studied in England where the annual cost of AKI-related inpatient care has been estimated at $1.4 billion.16 In addition to incomplete procedure and hospital-level adjustment, this study is limited by its ascertainment of AKI and costs, which was extrapolated from 1 hospital region to the rest of England.
Our study adds to the existing evidence in a number of ways. It uses nationally representative data to determine a lower and an upper limit of increases in cost and LOS attributable to AKI. The adjusted value is likely overly conservative; it minimizes the influence of events that are attributable to AKI and does not account for complications that may be caused by, or otherwise related to, AKI. The unadjusted value is likely an overestimate, attributing events during an AKI hospitalization to the AKI episode, even if they precede AKI. In clinical practice, most patients fall between these 2 extremes. Therefore, we suggest using the adjusted and unadjusted estimates to provide a range of the cost and LOS increases that are attributable to AKI. This interpretation is also supported by the companion analysis that minimizes the effect of pre-AKI events, where the unadjusted cost and LOS estimates for AKI-D occurring early during a hospitalization fell between the unadjusted and adjusted estimates for the main AKI-D analysis. Therefore, our data suggest that each hospitalization complicated by AKI is associated with a cost increase between $1800 and $7900 and an LOS increase between 1.1 days and 3.2 days. Not surprisingly, the burden of AKI-D was more pronounced with a cost increase between $11,000 and $42,100 and an LOS increase between 3.9 days and 11.5 days.
Unlike previous studies, these analyses are fully adjusted for procedures and multiple hospital-level variables (such as teaching status, region, and bed number). These adjustments are important because procedures account for much of the incremental cost and LOS associated with AKI, and each hospital-level variable may increase the cost and LOS of an AKI hospitalization by 10% to 25% (Supplemental Tables 2 and 3). Even though the relative increases in cost and LOS associated with different comorbidities and procedures were largely similar between patients with and without AKI, the absolute increases were usually larger in patients with AKI rather than without AKI because of their higher baseline estimates. We also observed that each year of age was associated with increased costs in patients without AKI, but decreased costs in patients with AKI. We suspect this difference is due to the lesser (and ultimately less costly) injury required to induce AKI in elderly patients who have less physiologic reserve.26 Moreover, we placed the burden of AKI in relation to other acute medical conditions, where its total estimated annual costs of $5.4 billion were exceeded only by the $7.7 billion attributed to sepsis.
Our results emphasize that AKI is an important contributor to hospital costs and LOS. Despite these consequences, there have been very few innovations in the prevention and management of AKI over the last decade.27,28 The primary treatment for severe AKI remains dialysis, and recent clinical trials suggest that we may have reached a dose plateau in the value of dialytic therapy.8,29 Several opportunities, such as advances in basic science and clinical care, may improve the care of patients with AKI. Translational research challenges in AKI have been reviewed, with treatment strategies that include hemodynamic, inflammatory, and regenerative mechanisms.28, 30 In a recent report from the National Confidential Enquiry into Patient Outcome and Death in the United Kingdom, 30% of AKI episodes that occurred inhospital were preventable, and only 50% of patients with AKI were deemed to have received good care.31 Our results suggest that even small progress in these areas could yield significant cost savings. One starting point suggested by our findings is a better understanding of the reasons underlying the association between hospital-level variables and differences in cost and LOS. Notably, there have been few efforts to improve AKI care processes on the same scale as sepsis,32 myocardial infarction,33,34 stroke,35 and venous thromboembolic disease.36
Strengths of this study include cost and LOS estimates of AKI from different hospitals across the US, including academic and community institutions. As a result, our study is significantly larger and more representative of the US population than previously published studies. Moreover, we utilized data from 2012, which accounts for the increasing incidence of AKI and recent advances in critical care medicine. We were also able to adjust for comorbid conditions, procedures, severity of illness, and hospital-level variables, which provide a conservative lower limit of the burden of AKI on hospitalized patients.
Our study has limitations. First, we used administrative codes to identify patients with AKI. The low sensitivity of these codes suggests that many patients with milder forms of AKI were probably not coded as such. Accordingly, our findings should be generally applicable to patients with moderate to severe AKI rather than to those with mild AKI.21,22 Second, the NIS lacks granularity on the details and sequence of events during a hospitalization. As a result, we could not determine the timing of an AKI episode during a hospitalization or whether a diagnosis or procedure was the cause or consequence of an AKI episode (ie, day 1 as the reason for admission vs. day 20 as a complication of surgery). Both the timing and cause of an AKI episode may influence cost and LOS, which should be considered when applying our results to patient care. We did not attempt to estimate the costs associated with comorbidities such as congestive heart failure and chronic obstructive pulmonary disease because we could not determine the acuity of disease in the NIS. Third, despite our efforts, residual confounding is likely, especially since administrative data limit our ability to capture the severity of comorbid conditions and the underlying illness. Fourth, the NIS does not contain individual patient identifiers, so multiple hospitalizations from the same patient may be represented.
Even our most conservative estimates still attribute $5.4 billion and 3.3 million hospital-days to AKI in 2012. These findings highlight the need for hospitals, policymakers, and researchers to recognize the economic burden of AKI. Future work should focus on understanding hospital-level differences in AKI care and the effect on patient morbidity and mortality. National and hospital-wide quality improvement programs are also needed. Such initiatives have commenced in the United Kingdom,37 and similar efforts are needed in North America to develop and coordinate cost-effective strategies to care for patients with AKI.
Disclosures
Samuel A. Silver, MD, MSc, is supported by a Kidney Research Scientist Core Education and National Training Program Post-Doctoral Fellowship (co-funded by the Kidney Foundation of Canada, Canadian Society of Nephrology, and Canadian Institutes of Health Research). Glenn M. Chertow, MD, MPH, is supported by a K24 mid-career mentoring award from NIDDK (K24 DK085446). These funders had no role in the design and conduct of the study; collection, management, analysis, and interpretation of the data; preparation, or approval of the manuscript; or decision to submit the manuscript for publication. The authors report no financial conflicts of interest.
References
1. Waikar SS, Liu KD, Chertow GM. Diagnosis, epidemiology and outcomes of acute kidney injury. Clin J Am Soc Nephrol. 2008;3:844-861. PubMed
2. Zeng X, McMahon GM, Brunelli SM, Bates DW, Waikar SS. Incidence, outcomes, and comparisons across definitions of AKI in hospitalized individuals. Clin J Am Soc Nephrol. 2014;9:12-20. PubMed
3. Susantitaphong P, Cruz DN, Cerda J, et al. Acute Kidney Injury Advisory Group of the American Society of Nephrology. World incidence of AKI: a meta-analysis. Clin J Am Soc Nephrol. 2013;8:1482-1493. PubMed
4. Dasta JF, Kane-Gill SL, Durtschi AJ, Pathak DS, Kellum JA. Costs and outcomes of acute kidney injury (AKI) following cardiac surgery. Nephrol Dial Transplant. 2008;23:1970-1974. PubMed
5. Hobson C, Ozrazgat-Baslanti T, Kuxhausen A, et al. Cost and mortality associated with postoperative acute kidney injury. Ann Surg. 2015;261:1207-1214. PubMed
6. Vieira JM Jr, Castro I, Curvello-Neto A, et al. Effect of acute kidney injury on weaning from mechanical ventilation in critically ill patients. Crit Care Med. 2007;35:184-191. PubMed
7. Selby NM, Kolhe NV, McIntyre CW, et al. Defining the cause of death in hospitalised patients with acute kidney injury. PLoS One. 2012;7:e48580. PubMed
8. Palevsky PM, Zhang JH, O’Connor TZ, et al. Intensity of renal support in critically ill patients with acute kidney injury. N Engl J Med. 2008;359(1):7-20. PubMed
9. Uchino S, Bellomo R, Morimatsu H, et al. Continuous renal replacement therapy: a worldwide practice survey. The beginning and ending supportive therapy for the kidney (B.E.S.T. kidney) investigators. Intensive Care Med. 2007;33:1563-1570. PubMed
10. Siew ED, Davenport A. The growth of acute kidney injury: a rising tide or just closer attention to detail? Kidney Int. 2015;87:46-61. PubMed
11. Hsu RK, McCulloch CE, Dudley RA, Lo LJ, Hsu CY. Temporal changes in incidence of dialysis-requiring AKI. J Am Soc Nephrol. 2013;24:37-42. PubMed
12. Xue JL, Daniels F, Star RA, et al. Incidence and mortality of acute renal failure in Medicare beneficiaries, 1992 to 2001. J Am Soc Nephrol. 2006;17:1135-1142. PubMed
13. Saran R, Li Y, Robinson B, et al. US Renal Data System 2015 annual data report: epidemiology of kidney disease in the United States. Am J Kidney Dis. 2016;67(3 suppl 1):S1-S434. PubMed
14. Chertow GM, Burdick E, Honour M, Bonventre JV, Bates DW. Acute kidney injury, mortality, length of stay, and costs in hospitalized patients. J Am Soc Nephrol. 2005;16:3365-3370. PubMed
15. Fischer MJ, Brimhall BB, Lezotte DC, Glazner JE, Parikh CR. Uncomplicated acute renal failure and hospital resource utilization: a retrospective multicenter analysis. Am J Kidney Dis. 2005;46:1049-1057. PubMed
16. Kerr M, Bedford M, Matthews B, O’Donoghue D. The economic impact of acute kidney injury in England. Nephrol Dial Transplant. 2014;29:1362-1368. PubMed
17. De Smedt DM, Elseviers MM, Lins RL, Annemans L. Economic evaluation of different treatment modalities in acute kidney injury. Nephrol Dial Transplant. 2012;27:4095-5101. PubMed
18. Srisawat N, Lawsin L, Uchino S, Bellomo R, Kellum JA; BEST Kidney Investigators. Cost of acute renal replacement therapy in the intensive care unit: results from The Beginning and Ending Supportive Therapy for the Kidney (BEST Kidney) study. Crit Care. 2010;14:R46. PubMed
19. Agency for Healthcare Research and Quality. Healthcare Cost and Utilization Project (HCUP). Overview of the National (Nationwide) Inpatient Sample (NIS). Available at: http://www.hcup-us.ahrq.gov/nisoverview.jsp. Accessed January 10, 2016.
20. Lenihan CR, Montez-Rath ME, Mora Mangano CT, Chertow GM, Winkelmayer WC. Trends in acute kidney injury, associated use of dialysis, and mortality after cardiac surgery, 1999 to 2008. Ann Thorac Surg. 2013;95:20-28. PubMed
21. Waikar SS, Wald R, Chertow GM, et al. Validity of international classification of diseases, ninth revision, clinical modification codes for acute renal failure. J Am Soc Nephrol. 2006;17:1688-1694. PubMed
22. Grams ME, Waikar SS, MacMahon B, Whelton S, Ballew SH, Coresh J. Performance and limitations of administrative data in the identification of AKI. Clin J Am Soc Nephrol. 2014;9:682-689. PubMed
23. Blough DK, Madden CW, Hornbrook MC. Modeling risk using generalized linear models. J Health Econ. 1999;18:153-171. PubMed
24. Malehi AS, Pourmotahari F, Angali KA. Statistical models for the analysis of skewed healthcare cost data: a simulation study. Health Econ Rev. 2015;5:11. PubMed
25. Cameron AC, Windmeijer FA. An R-squared measure of goodness of fit for some common nonlinear regression models. J Econometrics. 1997(77):329-342.
26. Coca SG. Acute kidney injury in elderly persons. Am J Kidney Dis. 2010;56:122-131. PubMed
27. Bonventre JV, Basile D, Liu KD, et al; Kidney Research National Dialogue (KRND). AKI: a path forward. Clin J Am Soc Nephrol. 2013;8:1606-1608. PubMed
28. Okusa MD, Rosner MH, Kellum JA, Ronco C; Acute Dialysis Quality Initiative XIII Workgroup. Therapeutic targets of human AKI: harmonizing human and animal AKI. J Am Soc Nephrol. 2016;27:44-48. PubMed
29. Pannu N, Klarenbach S, Wiebe N, Manns B, Tonelli M; Alberta Kidney Disease Network. Renal replacement therapy in patients with acute renal failure: a systematic review. JAMA. 2008;299:793-805. PubMed
30. Silver SA, Cardinal H, Colwell K, Burger D, Dickhout JG. Acute kidney injury: preclinical innovations, challenges, and opportunities for translation. Can J Kidney Health Dis. 2015;2:30. PubMed
31. Stewart J, Findlay G, Smith N, Kelly K, Mason M. Adding insult to injury: a review of the care of patients who died in hospital with a primary diagnosis of acute kidney injury (acute renal failure). A report by the National Confidential Enquiry into Patient Outcome and Death 2009. Available at: http://www.ncepod.org.uk/2009aki.html. Accessed April 4, 2016.
32. Society of Critical Care Medicine. Surviving Sepsis Campaign. Available at: http://www.survivingsepsis.org /Pages/default.aspx. Accessed April 3, 2016.
33. Mehta RH, Montoye CK, Gallogly M, et al; GAP Steering Committee of the American College of Cardiology. Improving quality of care for acute myocardial infarction: The Guidelines Applied in Practice (GAP) Initiative. JAMA. 2002;287:1269-1276. PubMed
34. Lewis WR, Peterson ED, Cannon CP, et al. An organized approach to improvement in guideline adherence for acute myocardial infarction: results with the Get With The Guidelines quality improvement program. Arch Intern Med. 2008;168:1813-1819. PubMed
35. Schwamm LH, Fonarow GC, Reeves MJ, et al. Get With the Guidelines–stroke is associated with sustained improvement in care for patients hospitalized with acute stroke or transient ischemic attack. Circulation. 2009;119:107-115. PubMed
36. Maynard G. Preventing Hospital-associated Venous Thromboembolism: A Guide for Effective Quality Improvement. 2nd ed. Rockville, MD: Agency for Healthcare Research and Quality; October 2015. AHRQ Publication No. 16-0001-EF.
*Address for correspondence and reprint requests: Samuel A. Silver, Stanford University School of Medicine, Division of Nephrology, 1070 Arastradero Road, Palo Alto, CA, 94304; Telephone: 650-504-0030; Fax: 650-721-1443; E-mail: [email protected]
Content Gating
Gated (full article locked unless allowed per User)
Frequent and prolonged fasting can lead to patient dissatisfaction and distress.1 It may also cause malnutrition and negatively affect outcomes in high-risk populations such as the elderly.2 Evidence suggests that patients are commonly kept fasting longer than necessary.3,4 However, the extent to which nil per os (NPO) orders are necessary or adhere to evidence-based duration is unknown.
Our study showed half of patients admitted to the general medicine services experienced a period of fasting, and 1 in 4 NPO orders may be avoidable.5 In this study, we aimed to provide action-oriented recommendations by 1) assessing why some interventions did not occur after NPO orders were placed and 2) analyzing NPO orders by indication and comparing them with the best available evidence.
METHOD
This retrospective study was conducted at an academic medical center in the United States. The study protocol was approved by the Mayo Clinic Institutional Review Board.
Detailed data handling and NPO order review processes have been described elsewhere.5 Briefly, we identified 1200 NPO orders of 120 or more minutes’ duration that were written for patients on the general medicine services at our institution in 2013. After blinded duplicate review, we excluded 70 orders written in the intensive care unit or on other services, 24 with unknown indications, 101 primarily indicated for clinical reasons, and 81 that had multiple indications. Consequently, 924 orders indicated for a single intervention (eg, imaging study, procedure, or operation) were included in the main analysis.
We assessed if the indicated intervention was performed. If performed, we recorded the time when the intervention was started. If not performed, we assessed reasons why it was not performed. We also performed exploratory analyses to investigate factors associated with performing the indicated intervention. The variables were 1) NPO starting at midnight, 2) NPO starting within 12 hours of admission, and 3) indication (eg, imaging study, procedure, or operation). We also conducted sensitivity analyses limited to 1 NPO order per patient (N = 673) to assess independence of the orders.
We then further categorized indications for the orders in detail and identified those with a sample size >10. This resulted in 779 orders that were included in the analysis by indication. We reviewed the literature by indication to determine suggested minimally required fasting durations to compare fasting duration in our patients to current evidence-based recommendations.
For descriptive statistics, we used median with interquartile range (IQR) for continuous variables and percentage for discrete variables; chi-square tests were used for comparison of discrete variables. All P values were two-tailed and P < 0.05 was considered significant.
RESULTS
Median length of 924 orders was 12.7 hours (IQR, 10.1-15.7 hours); 190 (20.1%), 577 (62.4%), and 157 (21.0%) orders were indicated for imaging studies, procedures, and operations, respectively. NPO started at midnight in 662 (71.6%) and within 12 hours of admission in 210 (22.7%) orders.
The indicated interventions were not performed in 183 (19.8%) orders, mostly as a result of a change in plan (75/183, 41.0%) or scheduling barriers (43/183, 23.5%). Plan changes occurred when, for example, input from a consulting service was obtained or the supervising physician decided not to pursue the intervention. Scheduling barriers included slots being unavailable and conflicts with other tasks/tests. Notably, only in 1 of 183 (0.5%) orders, the intervention was cancelled because the patient ate (Table 1).
Table 1
NPO orders starting at midnight were associated with higher likelihood of indicated interventions being performed (546/662, 82.5% vs. 195/262, 74.4%; P = 0.006), as were NPO orders starting more than 12 hours after admission (601/714, 84.2% vs. 140/210, 66.7%; P < 0.001). Imaging studies were more likely to be performed than procedures or operations (170/190, 89.5% vs. 452/577, 78.3% vs. 119/157, 75.8%; P = 0.001). These results were unchanged when the analyses were limited to 1 order per patient.
When analyzed by indication, the median durations of NPO orders ranged from 8.3 hours in kidney ultrasound to 13.9 hours in upper endoscopy. These were slightly shortened, most by 1 to 2 hours, when the duration was calculated from start of the order to initiation of the intervention. The literature review identified, for most indications, that the minimally required length of NPO were 2 to 4 hours, generally 6 to 8 hours shorter than the median NPO length in this study sample. Furthermore, for indications such as computed tomography with intravenous contrast and abdominal ultrasound, the literature suggested NPO may be unnecessary (Table 2).6-9,16-30
Table 2
DISCUSSION
We analyzed a comprehensive set of NPO orders written for interventions in medical inpatients at an academic medical center. NPO started at midnight in 71.6% of the analyzed orders. In 1 in 5 NPO orders, the indicated intervention was not performed largely due to a change in plan or scheduling barriers. In most NPO orders in which the indicated interventions were performed, patients were kept fasting either unnecessarily or much longer than needed. This study is the first of its kind in evaluating NPO-ordering practices across multiple indications and comparing them with the best available evidence.
These results suggest current NPO practice in the hospital is suboptimal, and limited literature measures the magnitude of this issue.6,7 An important aspect of our study findings is that, in a substantial number of NPO orders, the indicated interventions were not performed for seemingly avoidable reasons. These issues may be attributable to clinicians’ preemptive decisions or lack of knowledge, or inefficiency in the healthcare system. Minimizing anticipatory NPO may carry drawbacks such as delays in interventions, and limited evidence links excessive NPO with clinical outcomes (eg, length of stay, readmission, or death). However, from the patients’ perspective, it is important to be kept fasting only for clinical benefit. Hence, this calls for substantial improvement of NPO practices.
Furthermore, results indicated that the duration of most NPO orders was longer than the minimal duration currently suggested in the literature. Whereas strong evidence suggests that no longer than 2 hours of fasting is generally required for preoperative purposes,8 limited studies have evaluated the required length of NPO orders in imaging studies and procedures,9-11 which comprised most of the orders in the study cohort. For example, in upper endoscopy, 2 small studies suggested fasting for 1 or 2 hours may provide as good visualization as with the conventional 6 to 8 hours of fasting.9,10 In coronary angiography, a retrospective study demonstrated fasting may be unnecessary.11 Due to lack of robust evidence, guidelines for these interventions either do not specify the required length of fasting or have not changed the conventional recommendations for fasting, leading to large variations in fasting policies by institution.6,12 Therefore, more studies are needed to define required length of fasting for those indications and to measure the exact magnitude of excessive fasting in the hospital.
One of the limitations of this study is generalizability because NPO practice may considerably vary by institution as suggested in the literature.4,6,12 Conversely, studies have suggested that excessive fasting exists in other institutions.3,4,13 Thus, this study adds further evidence of the prevalence of suboptimal NPO practice to the literature and provides a benchmark that other institutions can refer to when evaluating their own NPO practice. Another limitation is the assumption that the evidence for minimally required NPO duration can be applied to our patient samples. Specifically, the American Society of Anesthesiologists guideline states that preoperative or preprocedural fasting may need to be longer than 2 hours for 1) patients with comorbidities that can affect gastric emptying or fluid volume such as obesity, diabetes, emergency care, and enteral tube feeding, and 2) patients in whom airway management might be difficult.8 We did not consider these possibilities, and as these conditions are prevalent in medical inpatients, we may be overstating the excessiveness of fasting orders. On the other hand, especially in patients with diabetes, prolonged fasting may cause harm by inducing hypoglycemia.14 Further, no study rigorously evaluated safety of shortening the fasting period for these subsets of patients. Therefore, it is necessary to establish optimal duration of NPO and to improve NPO ordering practice even in these patient subsets.
While more research is needed to define optimal duration of NPO for various interventions and specific subsets of patients and to establish linkage of excessive NPO with clinical outcomes, our data provide insights into immediate actions that can be taken by clinicians to improve NPO practices using our data as a benchmark. First, institutions can establish more robust practice guidelines or institutional protocols for NPO orders. Successful interventions have been reported,15 and breaking the habit of ordering NPO after midnight is certainly possible. We recommend each institution does so by indication, potentially through interdepartmental work groups involving appropriate departments such as radiology, surgery, and medicine. Second, institutional guidelines or protocols can be incorporated in the ordering system to enable appropriate NPO ordering. For example, at our institution, we are modifying the order screens for ultrasound-guided paracentesis and thoracentesis to indicate that NPO is not necessary for these procedures unless sedation is anticipated. We conclude that, at any institution, efforts in improving the NPO practice are urgently warranted to minimize unnecessary fasting.
Disclosures
This publication was supported by Grant Number UL1 TR000135 from the National Center for Advancing Translational Sciences (NCATS). Its contents are solely the responsibility of the authors and do not necessarily represent the official views of the National Institutes of Health. The authors report no financial conflicts of interest.
References
1. Carey SK, Conchin S, Bloomfield-Stone S. A qualitative study into the impact of fasting within a large tertiary hospital in Australia - the patients’ perspective. J Clin Nurs. 2015;24:1946-1954. PubMed
2. Kyriakos G, Calleja-Fernández A, Ávila-Turcios D, Cano-Rodríguez I, Ballesteros Pomar MD, Vidal-Casariego A. Prolonged fasting with fluid therapy is related to poorer outcomes in medical patients. Nutr Hosp. 2013;28:1710-1716. PubMed
3. Rycroft-Malone J, Seers K, Crichton N, et al. A pragmatic cluster randomised trial evaluating three implementation interventions. Implement Sci. 2012;7:80. PubMed
4. Breuer JP, Bosse G, Seifert S, et al. Pre-operative fasting: a nationwide survey of German anaesthesia departments. Acta Anaesthesiol Scand. 2010;54:313-320. PubMed
5. Sorita A, Thongprayoon C, Ahmed A, et al. Frequency and appropriateness of fasting orders in the hospital. Mayo Clin Proc. 2015;90:1225-1232. PubMed
6. Lee BY, Ok JJ, Abdelaziz Elsayed AA, Kim Y, Han DH. Preparative fasting for contrast-enhanced CT: reconsideration. Radiology. 2012;263:444-450. PubMed
7. Manchikanti L, Malla Y, Wargo BW, Fellows B. Preoperative fasting before interventional techniques: is it necessary or evidence-based? Pain Physician. 2011;14:459-467. PubMed
8. American Society of Anesthesiologists Committee. Practice guidelines for preoperative fasting and the use of pharmacologic agents to reduce the risk of pulmonary aspiration: application to healthy patients undergoing elective procedures: an updated report by the American Society of Anesthesiologists Committee on Standards and Practice Parameters. Anesthesiology. 2011;114:495-511. PubMed
9. Koeppe AT, Lubini M, Bonadeo NM, Moraes I Jr, Fornari F. Comfort, safety and quality of upper gastrointestinal endoscopy after 2 hours fasting: a randomized controlled trial. BMC Gastroenterol. 2013;13:158. PubMed
10. De Silva AP, Amarasiri L, Liyanage MN, Kottachchi D, Dassanayake AS, de Silva HJ. One-hour fast for water and six-hour fast for solids prior to endoscopy provides good endoscopic vision and results in minimum patient discomfort. J Gastroenterol Hepatol. 2009;24:1095-1097. PubMed
11. Hamid T, Aleem Q, Lau Y, et al. Pre-procedural fasting for coronary interventions: is it time to change practice? Heart. 2014;100:658-661. PubMed
12. Ahmed SU, Tonidandel W, Trella J, Martin NM, Chang Y. Peri-procedural protocols for interventional pain management techniques: a survey of US pain centers. Pain Physician. 2005;8:181-185. PubMed
13. Franklin GA, McClave SA, Hurt RT, et al. Physician-delivered malnutrition: why do patients receive nothing by mouth or a clear liquid diet in a university hospital setting? JPEN J Parenter Enteral Nutr. 2011;35:337-342. PubMed
14. Aldasouqi S, Sheikh A, Klosterman P, et al. Hypoglycemia in patients with diabetes who are fasting for laboratory blood tests: the Cape Girardeau Hypoglycemia En Route Prevention Program. Postgrad Med. 2013;125:136-143. PubMed
15. Aguilar-Nascimento JE, Salomão AB, Caporossi C, Diniz BN. Clinical benefits after the implementation of a multimodal perioperative protocol in elderly patients. Arq Gastroenterol. 2010;47:178-183. PubMed
16. Hilberath JN, Oakes DA, Shernan SK, Bulwer BE, D’Ambra MN, Eltzschig HK. Safety of transesophageal echocardiography. J Am Soc Echocardiogr. 2010;23: 1115-1127. PubMed
17. Hahn RT, Abraham T, Adams MS, et al. Guidelines for performing a comprehensive transesophageal echocardiographic examination: recommendations from the American Society of Echocardiography and the Society of Cardiovascular Anesthesiologists. J Am Soc Echocardiogr. 2013;26:921-964. PubMed
18. Sinan T, Leven H, Sheikh M. Is fasting a necessary preparation for abdominal ultrasound? BMC Med Imaging. 2003;3:1. PubMed
19. Garcia DA, Froes TR. Importance of fasting in preparing dogs for abdominal ultrasound examination of specific organs. J Small Anim Pract. 2014;55:630-634. PubMed
20. Kidney ultrasound. The Johns Hopkins University, The Johns Hopkins Hospital, and Johns Hopkins Health System. Health Library, Johns Hopkins Medicine. Available at: http://www.hopkinsmedicine.org/healthlibrary/test_procedures/urology/kidney_ultrasound_92,P07709/. Accessed August 17, 2015.
21. Surasi DS, Bhambhvani P, Baldwin JA, Almodovar SE, O’Malley JP. 18F-FDG PET and PET/CT patient preparation: a review of the literature. J Nucl Med Technol. 2014;42:5-13. PubMed
22. Kang SH, Hyun JJ. Preparation and patient evaluation for safe gastrointestinal endoscopy. Clin Endosc. 2013;46:212-218. PubMed
23. Smith I, Kranke P, Murat I, et al. Perioperative fasting in adults and children: guidelines from the European Society of Anaesthesiology. Eur J Anaesthesiol. 2011;28:556-569. PubMed
24. ASGE Standards of Practice Committee, Saltzman JR, Cash BD, Pasha SF, et al. Bowel preparation before colonoscopy. Gastrointest Endosc. 2015;81:781-794. PubMed
25. Hassan C, Bretthauer M, Kaminski MF, et al; European Society of Gastrointestinal Endoscopy. Bowel preparation for colonoscopy: European Society of Gastrointestinal Endoscopy (ESGE) guideline. Endoscopy. 2013;45:142-150. PubMed
26. Du Rand IA, Blaikley J, Booton R, et al; British Thoracic Society Bronchoscopy Guideline Group. British Thoracic Society guideline for diagnostic flexible bronchoscopy in adults: accredited by NICE. Thorax. 2013;68(suppl 1):i1-i44. PubMed
27. Thoracentesis. The Johns Hopkins University, The Johns Hopkins Hospital, and Johns Hopkins Health System. Health Library, Johns Hopkins Medicine. Available at: http://www.hopkinsmedicine.org/healthlibrary/test_procedures/pulmonary/thoracentesis_92,P07761/. Accessed August 18, 2015.
28. Runyon BA. Diagnostic and therapeutic abdominal paracentesis. UpToDate. Available at: http://www.uptodate.com/contents/diagnostic-and-therapeutic-abdominal-paracentesis. Published February 18, 2014. Accessed August 18, 2015.
29. Granata A, Fiorini F, Andrulli S, et al. Doppler ultrasound and renal artery stenosis: An overview. J Ultrasound. 2009;12:133-143. PubMed
30. Gerhard-Herman M, Gardin JM, Jaff M, et al. Guidelines for noninvasive vascular laboratory testing: a report from the American Society of Echocardiography and the Society for Vascular Medicine and Biology. Vasc Med. 2006;11:183-200. PubMed
Frequent and prolonged fasting can lead to patient dissatisfaction and distress.1 It may also cause malnutrition and negatively affect outcomes in high-risk populations such as the elderly.2 Evidence suggests that patients are commonly kept fasting longer than necessary.3,4 However, the extent to which nil per os (NPO) orders are necessary or adhere to evidence-based duration is unknown.
Our study showed half of patients admitted to the general medicine services experienced a period of fasting, and 1 in 4 NPO orders may be avoidable.5 In this study, we aimed to provide action-oriented recommendations by 1) assessing why some interventions did not occur after NPO orders were placed and 2) analyzing NPO orders by indication and comparing them with the best available evidence.
METHOD
This retrospective study was conducted at an academic medical center in the United States. The study protocol was approved by the Mayo Clinic Institutional Review Board.
Detailed data handling and NPO order review processes have been described elsewhere.5 Briefly, we identified 1200 NPO orders of 120 or more minutes’ duration that were written for patients on the general medicine services at our institution in 2013. After blinded duplicate review, we excluded 70 orders written in the intensive care unit or on other services, 24 with unknown indications, 101 primarily indicated for clinical reasons, and 81 that had multiple indications. Consequently, 924 orders indicated for a single intervention (eg, imaging study, procedure, or operation) were included in the main analysis.
We assessed if the indicated intervention was performed. If performed, we recorded the time when the intervention was started. If not performed, we assessed reasons why it was not performed. We also performed exploratory analyses to investigate factors associated with performing the indicated intervention. The variables were 1) NPO starting at midnight, 2) NPO starting within 12 hours of admission, and 3) indication (eg, imaging study, procedure, or operation). We also conducted sensitivity analyses limited to 1 NPO order per patient (N = 673) to assess independence of the orders.
We then further categorized indications for the orders in detail and identified those with a sample size >10. This resulted in 779 orders that were included in the analysis by indication. We reviewed the literature by indication to determine suggested minimally required fasting durations to compare fasting duration in our patients to current evidence-based recommendations.
For descriptive statistics, we used median with interquartile range (IQR) for continuous variables and percentage for discrete variables; chi-square tests were used for comparison of discrete variables. All P values were two-tailed and P < 0.05 was considered significant.
RESULTS
Median length of 924 orders was 12.7 hours (IQR, 10.1-15.7 hours); 190 (20.1%), 577 (62.4%), and 157 (21.0%) orders were indicated for imaging studies, procedures, and operations, respectively. NPO started at midnight in 662 (71.6%) and within 12 hours of admission in 210 (22.7%) orders.
The indicated interventions were not performed in 183 (19.8%) orders, mostly as a result of a change in plan (75/183, 41.0%) or scheduling barriers (43/183, 23.5%). Plan changes occurred when, for example, input from a consulting service was obtained or the supervising physician decided not to pursue the intervention. Scheduling barriers included slots being unavailable and conflicts with other tasks/tests. Notably, only in 1 of 183 (0.5%) orders, the intervention was cancelled because the patient ate (Table 1).
Table 1
NPO orders starting at midnight were associated with higher likelihood of indicated interventions being performed (546/662, 82.5% vs. 195/262, 74.4%; P = 0.006), as were NPO orders starting more than 12 hours after admission (601/714, 84.2% vs. 140/210, 66.7%; P < 0.001). Imaging studies were more likely to be performed than procedures or operations (170/190, 89.5% vs. 452/577, 78.3% vs. 119/157, 75.8%; P = 0.001). These results were unchanged when the analyses were limited to 1 order per patient.
When analyzed by indication, the median durations of NPO orders ranged from 8.3 hours in kidney ultrasound to 13.9 hours in upper endoscopy. These were slightly shortened, most by 1 to 2 hours, when the duration was calculated from start of the order to initiation of the intervention. The literature review identified, for most indications, that the minimally required length of NPO were 2 to 4 hours, generally 6 to 8 hours shorter than the median NPO length in this study sample. Furthermore, for indications such as computed tomography with intravenous contrast and abdominal ultrasound, the literature suggested NPO may be unnecessary (Table 2).6-9,16-30
Table 2
DISCUSSION
We analyzed a comprehensive set of NPO orders written for interventions in medical inpatients at an academic medical center. NPO started at midnight in 71.6% of the analyzed orders. In 1 in 5 NPO orders, the indicated intervention was not performed largely due to a change in plan or scheduling barriers. In most NPO orders in which the indicated interventions were performed, patients were kept fasting either unnecessarily or much longer than needed. This study is the first of its kind in evaluating NPO-ordering practices across multiple indications and comparing them with the best available evidence.
These results suggest current NPO practice in the hospital is suboptimal, and limited literature measures the magnitude of this issue.6,7 An important aspect of our study findings is that, in a substantial number of NPO orders, the indicated interventions were not performed for seemingly avoidable reasons. These issues may be attributable to clinicians’ preemptive decisions or lack of knowledge, or inefficiency in the healthcare system. Minimizing anticipatory NPO may carry drawbacks such as delays in interventions, and limited evidence links excessive NPO with clinical outcomes (eg, length of stay, readmission, or death). However, from the patients’ perspective, it is important to be kept fasting only for clinical benefit. Hence, this calls for substantial improvement of NPO practices.
Furthermore, results indicated that the duration of most NPO orders was longer than the minimal duration currently suggested in the literature. Whereas strong evidence suggests that no longer than 2 hours of fasting is generally required for preoperative purposes,8 limited studies have evaluated the required length of NPO orders in imaging studies and procedures,9-11 which comprised most of the orders in the study cohort. For example, in upper endoscopy, 2 small studies suggested fasting for 1 or 2 hours may provide as good visualization as with the conventional 6 to 8 hours of fasting.9,10 In coronary angiography, a retrospective study demonstrated fasting may be unnecessary.11 Due to lack of robust evidence, guidelines for these interventions either do not specify the required length of fasting or have not changed the conventional recommendations for fasting, leading to large variations in fasting policies by institution.6,12 Therefore, more studies are needed to define required length of fasting for those indications and to measure the exact magnitude of excessive fasting in the hospital.
One of the limitations of this study is generalizability because NPO practice may considerably vary by institution as suggested in the literature.4,6,12 Conversely, studies have suggested that excessive fasting exists in other institutions.3,4,13 Thus, this study adds further evidence of the prevalence of suboptimal NPO practice to the literature and provides a benchmark that other institutions can refer to when evaluating their own NPO practice. Another limitation is the assumption that the evidence for minimally required NPO duration can be applied to our patient samples. Specifically, the American Society of Anesthesiologists guideline states that preoperative or preprocedural fasting may need to be longer than 2 hours for 1) patients with comorbidities that can affect gastric emptying or fluid volume such as obesity, diabetes, emergency care, and enteral tube feeding, and 2) patients in whom airway management might be difficult.8 We did not consider these possibilities, and as these conditions are prevalent in medical inpatients, we may be overstating the excessiveness of fasting orders. On the other hand, especially in patients with diabetes, prolonged fasting may cause harm by inducing hypoglycemia.14 Further, no study rigorously evaluated safety of shortening the fasting period for these subsets of patients. Therefore, it is necessary to establish optimal duration of NPO and to improve NPO ordering practice even in these patient subsets.
While more research is needed to define optimal duration of NPO for various interventions and specific subsets of patients and to establish linkage of excessive NPO with clinical outcomes, our data provide insights into immediate actions that can be taken by clinicians to improve NPO practices using our data as a benchmark. First, institutions can establish more robust practice guidelines or institutional protocols for NPO orders. Successful interventions have been reported,15 and breaking the habit of ordering NPO after midnight is certainly possible. We recommend each institution does so by indication, potentially through interdepartmental work groups involving appropriate departments such as radiology, surgery, and medicine. Second, institutional guidelines or protocols can be incorporated in the ordering system to enable appropriate NPO ordering. For example, at our institution, we are modifying the order screens for ultrasound-guided paracentesis and thoracentesis to indicate that NPO is not necessary for these procedures unless sedation is anticipated. We conclude that, at any institution, efforts in improving the NPO practice are urgently warranted to minimize unnecessary fasting.
Disclosures
This publication was supported by Grant Number UL1 TR000135 from the National Center for Advancing Translational Sciences (NCATS). Its contents are solely the responsibility of the authors and do not necessarily represent the official views of the National Institutes of Health. The authors report no financial conflicts of interest.
References
1. Carey SK, Conchin S, Bloomfield-Stone S. A qualitative study into the impact of fasting within a large tertiary hospital in Australia - the patients’ perspective. J Clin Nurs. 2015;24:1946-1954. PubMed
2. Kyriakos G, Calleja-Fernández A, Ávila-Turcios D, Cano-Rodríguez I, Ballesteros Pomar MD, Vidal-Casariego A. Prolonged fasting with fluid therapy is related to poorer outcomes in medical patients. Nutr Hosp. 2013;28:1710-1716. PubMed
3. Rycroft-Malone J, Seers K, Crichton N, et al. A pragmatic cluster randomised trial evaluating three implementation interventions. Implement Sci. 2012;7:80. PubMed
4. Breuer JP, Bosse G, Seifert S, et al. Pre-operative fasting: a nationwide survey of German anaesthesia departments. Acta Anaesthesiol Scand. 2010;54:313-320. PubMed
5. Sorita A, Thongprayoon C, Ahmed A, et al. Frequency and appropriateness of fasting orders in the hospital. Mayo Clin Proc. 2015;90:1225-1232. PubMed
6. Lee BY, Ok JJ, Abdelaziz Elsayed AA, Kim Y, Han DH. Preparative fasting for contrast-enhanced CT: reconsideration. Radiology. 2012;263:444-450. PubMed
7. Manchikanti L, Malla Y, Wargo BW, Fellows B. Preoperative fasting before interventional techniques: is it necessary or evidence-based? Pain Physician. 2011;14:459-467. PubMed
8. American Society of Anesthesiologists Committee. Practice guidelines for preoperative fasting and the use of pharmacologic agents to reduce the risk of pulmonary aspiration: application to healthy patients undergoing elective procedures: an updated report by the American Society of Anesthesiologists Committee on Standards and Practice Parameters. Anesthesiology. 2011;114:495-511. PubMed
9. Koeppe AT, Lubini M, Bonadeo NM, Moraes I Jr, Fornari F. Comfort, safety and quality of upper gastrointestinal endoscopy after 2 hours fasting: a randomized controlled trial. BMC Gastroenterol. 2013;13:158. PubMed
10. De Silva AP, Amarasiri L, Liyanage MN, Kottachchi D, Dassanayake AS, de Silva HJ. One-hour fast for water and six-hour fast for solids prior to endoscopy provides good endoscopic vision and results in minimum patient discomfort. J Gastroenterol Hepatol. 2009;24:1095-1097. PubMed
11. Hamid T, Aleem Q, Lau Y, et al. Pre-procedural fasting for coronary interventions: is it time to change practice? Heart. 2014;100:658-661. PubMed
12. Ahmed SU, Tonidandel W, Trella J, Martin NM, Chang Y. Peri-procedural protocols for interventional pain management techniques: a survey of US pain centers. Pain Physician. 2005;8:181-185. PubMed
13. Franklin GA, McClave SA, Hurt RT, et al. Physician-delivered malnutrition: why do patients receive nothing by mouth or a clear liquid diet in a university hospital setting? JPEN J Parenter Enteral Nutr. 2011;35:337-342. PubMed
14. Aldasouqi S, Sheikh A, Klosterman P, et al. Hypoglycemia in patients with diabetes who are fasting for laboratory blood tests: the Cape Girardeau Hypoglycemia En Route Prevention Program. Postgrad Med. 2013;125:136-143. PubMed
15. Aguilar-Nascimento JE, Salomão AB, Caporossi C, Diniz BN. Clinical benefits after the implementation of a multimodal perioperative protocol in elderly patients. Arq Gastroenterol. 2010;47:178-183. PubMed
16. Hilberath JN, Oakes DA, Shernan SK, Bulwer BE, D’Ambra MN, Eltzschig HK. Safety of transesophageal echocardiography. J Am Soc Echocardiogr. 2010;23: 1115-1127. PubMed
17. Hahn RT, Abraham T, Adams MS, et al. Guidelines for performing a comprehensive transesophageal echocardiographic examination: recommendations from the American Society of Echocardiography and the Society of Cardiovascular Anesthesiologists. J Am Soc Echocardiogr. 2013;26:921-964. PubMed
18. Sinan T, Leven H, Sheikh M. Is fasting a necessary preparation for abdominal ultrasound? BMC Med Imaging. 2003;3:1. PubMed
19. Garcia DA, Froes TR. Importance of fasting in preparing dogs for abdominal ultrasound examination of specific organs. J Small Anim Pract. 2014;55:630-634. PubMed
20. Kidney ultrasound. The Johns Hopkins University, The Johns Hopkins Hospital, and Johns Hopkins Health System. Health Library, Johns Hopkins Medicine. Available at: http://www.hopkinsmedicine.org/healthlibrary/test_procedures/urology/kidney_ultrasound_92,P07709/. Accessed August 17, 2015.
21. Surasi DS, Bhambhvani P, Baldwin JA, Almodovar SE, O’Malley JP. 18F-FDG PET and PET/CT patient preparation: a review of the literature. J Nucl Med Technol. 2014;42:5-13. PubMed
22. Kang SH, Hyun JJ. Preparation and patient evaluation for safe gastrointestinal endoscopy. Clin Endosc. 2013;46:212-218. PubMed
23. Smith I, Kranke P, Murat I, et al. Perioperative fasting in adults and children: guidelines from the European Society of Anaesthesiology. Eur J Anaesthesiol. 2011;28:556-569. PubMed
24. ASGE Standards of Practice Committee, Saltzman JR, Cash BD, Pasha SF, et al. Bowel preparation before colonoscopy. Gastrointest Endosc. 2015;81:781-794. PubMed
25. Hassan C, Bretthauer M, Kaminski MF, et al; European Society of Gastrointestinal Endoscopy. Bowel preparation for colonoscopy: European Society of Gastrointestinal Endoscopy (ESGE) guideline. Endoscopy. 2013;45:142-150. PubMed
26. Du Rand IA, Blaikley J, Booton R, et al; British Thoracic Society Bronchoscopy Guideline Group. British Thoracic Society guideline for diagnostic flexible bronchoscopy in adults: accredited by NICE. Thorax. 2013;68(suppl 1):i1-i44. PubMed
27. Thoracentesis. The Johns Hopkins University, The Johns Hopkins Hospital, and Johns Hopkins Health System. Health Library, Johns Hopkins Medicine. Available at: http://www.hopkinsmedicine.org/healthlibrary/test_procedures/pulmonary/thoracentesis_92,P07761/. Accessed August 18, 2015.
28. Runyon BA. Diagnostic and therapeutic abdominal paracentesis. UpToDate. Available at: http://www.uptodate.com/contents/diagnostic-and-therapeutic-abdominal-paracentesis. Published February 18, 2014. Accessed August 18, 2015.
29. Granata A, Fiorini F, Andrulli S, et al. Doppler ultrasound and renal artery stenosis: An overview. J Ultrasound. 2009;12:133-143. PubMed
30. Gerhard-Herman M, Gardin JM, Jaff M, et al. Guidelines for noninvasive vascular laboratory testing: a report from the American Society of Echocardiography and the Society for Vascular Medicine and Biology. Vasc Med. 2006;11:183-200. PubMed
Address for Correspondence and Reprint Requests: Deanne T. Kashiwagi, MD, Mayo Clinic, Division of Hospital Internal Medicine, 200 First Street SW, Rochester, MN 55905; Telephone: 507-255-8715; Fax: 507-255-9189; Email: [email protected]
Content Gating
Open Access (article Unlocked/Open Access)
Alternative CME
Consolidated Pubs: Do Not Show Source Publication Logo
Cardiac telemetry is overused in hospitals and continues to be a source of healthcare waste.1-4 Its overuse is considered a leading issue in quality initiatives, as highlighted by its presence in the top 5 recommendations by the Society of Hospital Medicine to the Choosing Wisely Campaign.5 There have been multiple published studies on efforts to curb telemetry overuse, including educational campaigns, hard-wiring guidelines into the electronic health record (EHR), and discontinuation protocols.6-9
Less studied, however, are the causes of telemetry overuse. While lack of knowledge of guidelines may contribute to inappropriate initial ordering of telemetry,1,4 physicians may forget to discontinue it when the original indication is no longer present, ie, a form of “clinical inertia.” The authors aimed to study how often inpatient clinicians were aware (or unaware) of the telemetry status of their patients.
METHODS
The authors conducted a cross-sectional observational study at 2 academic medical centers within the same healthcare system (University of California, Los Angeles [UCLA] Health System) over a 10-week period, from December 12, 2014 to February 18, 2015. The survey included senior resident physicians (in years 2 or 3 of training), attending physicians on teaching services (“teaching attendings”), and attending physicians on nonteaching services (“direct-care attendings”) caring for hospitalized patients on general internal medicine (nonintensive care) units. First-year residents (“interns”) were not surveyed because their presence at interdisciplinary rounds, where surveying took place, was not mandatory. At both hospitals, telemetry is initiated by placing a “Continuous Cardiac Monitoring” order in the EHR, and is terminated by selecting “Discontinue” on that same order. Telemetry status of patients was determined through a daily review of the EHR at UCLA Ronald Reagan Hospital, where presence of telemetry was defined as an active order for telemetry as of 7 AM. At UCLA Santa Monica Hospital, telemetry status was determined by daily review of the morning telemetry technician logs, which reflected telemetry status as of 7 AM.
Once-weekly, prior to afternoon interdisciplinary rounds, members of the study team would give physicians a print-out of their patient list and ask them to mark whether or not their patients were on telemetry as of that morning. They were allowed to reference their own printed patient list, but were not allowed to reference the EHR. Since interdisciplinary rounds occurred in the afternoon, it was assumed that all clinicians had seen and examined their patients. The authors did not mandate that physicians respond to the survey, and we did not collect information on individual physician characteristics other than training status.
The primary outcome of interest was correct assessment of telemetry status. The authors first presented descriptive statistics for patient, provider, and telemetry status, and used χ2 tests and McNemar’s test to compare the type of physician (resident, teaching attending, or direct-care attending) with the binary outcome (correct or incorrect assessment). STATA/SE, 13.1 (StataCorp), was used for all statistical analysis, and P values < 0.05 were considered statistically significant. The study was submitted to the UCLA Office of Human Research Protection Program and exempted from Institutional Review Board review.
RESULTS
A total of 1,379 physician-assessments on 962 patients were obtained during the study period. During this time, 53.1% (511/962) of patients were on telemetry. Overall, physicians were incorrect in 26.5% (365/1379) of their assessments of telemetry status (Table). Of the 745 assessments of a patient on telemetry, clinicians erroneously reported that they were not 27.9% of the time (n = 208). Of the 634 assessments of a patient not on telemetry, clinicians erroneously reported that patients were on it 24.8% of the time (n = 157).
Assessments by direct-care attendings were more accurate than those done by teaching attendings (80.9% vs. 72.4%, P < 0.05) and resident physicians (80.9% vs. 71.8%, P < 0.05). There was no statistically significant difference in accuracy of resident physician assessments when compared to teaching attending assessments (71.8% vs. 72.4%, P = 0.81).
DISCUSSION
In this study, clinicians often inaccurately recalled the telemetry status of their hospitalized patients. These findings have implications for both patient safety as well as telemetry overuse, as ignorance of telemetry status may limit its discontinuation.
The authors also found that assessments done by direct-care attendings were more accurate than those done by teaching attendings. This discrepancy is likely related to different roles in patient care: teaching attendings provide supervisory roles, while direct-care attendings routinely review orders and perform detailed exams on their patients. Similarly, resident physician assessments were found to be less accurate than direct-care attending assessments, which may reflect less clinical experience as well as their supervisory role.
In light of these findings, interventions to reduce telemetry overuse should include efforts to increase real-time telemetry awareness as well as reduce inappropriate use, and should target all levels of training. Using research on urinary catheter removal10 as a model, strategies to increase telemetry awareness could include daily verbal or written reminders of telemetry status, requests to assess daily need, high visibility signs in charts or in patient rooms, or electronic reminders that telemetry is in place. Furthermore, efforts to promote and operationalize medical mindfulness, in which providers are trained to be aware of indications, timely removal, and the presence of monitoring devices could be incorporated into broader telemetry stewardship and high-value care efforts.11
There are limitations to this study. The authors did not collect information on the number of unique individual physicians represented by the study, and, thus, clinicians may have been surveyed multiple times throughout the study, potentially influencing their attention to the telemetry status of their patients. In addition, this study was conducted within a single healthcare system, limiting its generalizability.
In conclusion, the authors found that physicians were often incorrect when assessing the telemetry status of their patients. Interventions to help raise awareness of a patient’s telemetry status may help reduce telemetry overuse.
Disclosure: Nothing to report.
References
1. Henriques-Forsythe MN, Ivonye CC, Jamched U, Kamuguisha LKK, Olejeme KA, Onwuanyi AE. Is telemetry overused? Is it as helpful as thought? Cleve Clin J Med. 2009;76:368-372. PubMed
2. Kanwar M, Fares R, Minnick S, Rosman HS, Saravolatz L. Inpatient cardiac telemetry monitoring: are we overdoing it. JCOM. 2008;15(1):16-20.
3. Chong-Yik R, Bennett A, Milani R, Morin D. Telemetry overuse and its economic implications. J Am Coll Cardiol.2016;67(13_S):1993.
4. Najafi N, Auerbach A. Use and outcomes of telemetry monitoring on a medicine service. Arch Intern Med. 2012;172:1349-1350. PubMed
5. Bulger J, Nickel W, Messler J, et al. Choosing wisely in adult hospital medicine: five opportunities for improved healthcare value. J Hosp Med. 2013;8:486-492. PubMed
6. Leighton H, Kianfar H, Serynek S, Kerwin T. Effect of an electronic ordering system on adherence to the American College of Cardiology/American Heart Association guidelines for cardiac monitoring. Crit Pathw Cardiol. 2013;12:6-8. PubMed
7. Lee JC, Lamb P, Rand E, Ryan C, Rubal BJ. Optimizing telemetry utilization in an academic medical center. JCOM. 2008;15(9).
8. Boggan JC, Navar-Boggan AM, Patel V, Schulteis RD, Simel DL. Reductions in telemetry order duration do not reduce telemetry utilization. J Hosp Med. 2014;9:795-796. PubMed
9. Dressler R, Dryer MM, Coletti C, Mahoney D, Doorey AJ. Altering overuse of cardiac telemetry in non-intensive care unit settings by hardwiring the use of American Heart Association guidelines. JAMA Intern Med. 2014;174:1852-1854. PubMed
10. Meddings J, Krein SL, Fakih MG, Olmsted RN, Saint S. Reducing unnecessary urinary catheter use and other strategies to prevent catheter-associated urinary tract infections: brief update review. In: Making Health Care Safer II: An Updated Critical Analysis of the Evidence for Patient Safety Practices. (Evidence Reports/Technology Assessments, No. 211.) Chapter 9. Rockville (MD): Agency for Healthcare Research and Quality (US); 2013. Available from: http://www.ncbi.nlm.nih.gov/books/NBK133354/. May 15, 2016. PubMed
11. Kiyoshi-Teo H, Krein SL, Saint S. Applying mindful evidence-based practice at the bedside: using catheter-associated urinary tract infection as a model. Infect Control Hosp Epidemiol. 2013;34:1099-1001. PubMed
Cardiac telemetry is overused in hospitals and continues to be a source of healthcare waste.1-4 Its overuse is considered a leading issue in quality initiatives, as highlighted by its presence in the top 5 recommendations by the Society of Hospital Medicine to the Choosing Wisely Campaign.5 There have been multiple published studies on efforts to curb telemetry overuse, including educational campaigns, hard-wiring guidelines into the electronic health record (EHR), and discontinuation protocols.6-9
Less studied, however, are the causes of telemetry overuse. While lack of knowledge of guidelines may contribute to inappropriate initial ordering of telemetry,1,4 physicians may forget to discontinue it when the original indication is no longer present, ie, a form of “clinical inertia.” The authors aimed to study how often inpatient clinicians were aware (or unaware) of the telemetry status of their patients.
METHODS
The authors conducted a cross-sectional observational study at 2 academic medical centers within the same healthcare system (University of California, Los Angeles [UCLA] Health System) over a 10-week period, from December 12, 2014 to February 18, 2015. The survey included senior resident physicians (in years 2 or 3 of training), attending physicians on teaching services (“teaching attendings”), and attending physicians on nonteaching services (“direct-care attendings”) caring for hospitalized patients on general internal medicine (nonintensive care) units. First-year residents (“interns”) were not surveyed because their presence at interdisciplinary rounds, where surveying took place, was not mandatory. At both hospitals, telemetry is initiated by placing a “Continuous Cardiac Monitoring” order in the EHR, and is terminated by selecting “Discontinue” on that same order. Telemetry status of patients was determined through a daily review of the EHR at UCLA Ronald Reagan Hospital, where presence of telemetry was defined as an active order for telemetry as of 7 AM. At UCLA Santa Monica Hospital, telemetry status was determined by daily review of the morning telemetry technician logs, which reflected telemetry status as of 7 AM.
Once-weekly, prior to afternoon interdisciplinary rounds, members of the study team would give physicians a print-out of their patient list and ask them to mark whether or not their patients were on telemetry as of that morning. They were allowed to reference their own printed patient list, but were not allowed to reference the EHR. Since interdisciplinary rounds occurred in the afternoon, it was assumed that all clinicians had seen and examined their patients. The authors did not mandate that physicians respond to the survey, and we did not collect information on individual physician characteristics other than training status.
The primary outcome of interest was correct assessment of telemetry status. The authors first presented descriptive statistics for patient, provider, and telemetry status, and used χ2 tests and McNemar’s test to compare the type of physician (resident, teaching attending, or direct-care attending) with the binary outcome (correct or incorrect assessment). STATA/SE, 13.1 (StataCorp), was used for all statistical analysis, and P values < 0.05 were considered statistically significant. The study was submitted to the UCLA Office of Human Research Protection Program and exempted from Institutional Review Board review.
RESULTS
A total of 1,379 physician-assessments on 962 patients were obtained during the study period. During this time, 53.1% (511/962) of patients were on telemetry. Overall, physicians were incorrect in 26.5% (365/1379) of their assessments of telemetry status (Table). Of the 745 assessments of a patient on telemetry, clinicians erroneously reported that they were not 27.9% of the time (n = 208). Of the 634 assessments of a patient not on telemetry, clinicians erroneously reported that patients were on it 24.8% of the time (n = 157).
Assessments by direct-care attendings were more accurate than those done by teaching attendings (80.9% vs. 72.4%, P < 0.05) and resident physicians (80.9% vs. 71.8%, P < 0.05). There was no statistically significant difference in accuracy of resident physician assessments when compared to teaching attending assessments (71.8% vs. 72.4%, P = 0.81).
DISCUSSION
In this study, clinicians often inaccurately recalled the telemetry status of their hospitalized patients. These findings have implications for both patient safety as well as telemetry overuse, as ignorance of telemetry status may limit its discontinuation.
The authors also found that assessments done by direct-care attendings were more accurate than those done by teaching attendings. This discrepancy is likely related to different roles in patient care: teaching attendings provide supervisory roles, while direct-care attendings routinely review orders and perform detailed exams on their patients. Similarly, resident physician assessments were found to be less accurate than direct-care attending assessments, which may reflect less clinical experience as well as their supervisory role.
In light of these findings, interventions to reduce telemetry overuse should include efforts to increase real-time telemetry awareness as well as reduce inappropriate use, and should target all levels of training. Using research on urinary catheter removal10 as a model, strategies to increase telemetry awareness could include daily verbal or written reminders of telemetry status, requests to assess daily need, high visibility signs in charts or in patient rooms, or electronic reminders that telemetry is in place. Furthermore, efforts to promote and operationalize medical mindfulness, in which providers are trained to be aware of indications, timely removal, and the presence of monitoring devices could be incorporated into broader telemetry stewardship and high-value care efforts.11
There are limitations to this study. The authors did not collect information on the number of unique individual physicians represented by the study, and, thus, clinicians may have been surveyed multiple times throughout the study, potentially influencing their attention to the telemetry status of their patients. In addition, this study was conducted within a single healthcare system, limiting its generalizability.
In conclusion, the authors found that physicians were often incorrect when assessing the telemetry status of their patients. Interventions to help raise awareness of a patient’s telemetry status may help reduce telemetry overuse.
Disclosure: Nothing to report.
References
1. Henriques-Forsythe MN, Ivonye CC, Jamched U, Kamuguisha LKK, Olejeme KA, Onwuanyi AE. Is telemetry overused? Is it as helpful as thought? Cleve Clin J Med. 2009;76:368-372. PubMed
2. Kanwar M, Fares R, Minnick S, Rosman HS, Saravolatz L. Inpatient cardiac telemetry monitoring: are we overdoing it. JCOM. 2008;15(1):16-20.
3. Chong-Yik R, Bennett A, Milani R, Morin D. Telemetry overuse and its economic implications. J Am Coll Cardiol.2016;67(13_S):1993.
4. Najafi N, Auerbach A. Use and outcomes of telemetry monitoring on a medicine service. Arch Intern Med. 2012;172:1349-1350. PubMed
5. Bulger J, Nickel W, Messler J, et al. Choosing wisely in adult hospital medicine: five opportunities for improved healthcare value. J Hosp Med. 2013;8:486-492. PubMed
6. Leighton H, Kianfar H, Serynek S, Kerwin T. Effect of an electronic ordering system on adherence to the American College of Cardiology/American Heart Association guidelines for cardiac monitoring. Crit Pathw Cardiol. 2013;12:6-8. PubMed
7. Lee JC, Lamb P, Rand E, Ryan C, Rubal BJ. Optimizing telemetry utilization in an academic medical center. JCOM. 2008;15(9).
8. Boggan JC, Navar-Boggan AM, Patel V, Schulteis RD, Simel DL. Reductions in telemetry order duration do not reduce telemetry utilization. J Hosp Med. 2014;9:795-796. PubMed
9. Dressler R, Dryer MM, Coletti C, Mahoney D, Doorey AJ. Altering overuse of cardiac telemetry in non-intensive care unit settings by hardwiring the use of American Heart Association guidelines. JAMA Intern Med. 2014;174:1852-1854. PubMed
10. Meddings J, Krein SL, Fakih MG, Olmsted RN, Saint S. Reducing unnecessary urinary catheter use and other strategies to prevent catheter-associated urinary tract infections: brief update review. In: Making Health Care Safer II: An Updated Critical Analysis of the Evidence for Patient Safety Practices. (Evidence Reports/Technology Assessments, No. 211.) Chapter 9. Rockville (MD): Agency for Healthcare Research and Quality (US); 2013. Available from: http://www.ncbi.nlm.nih.gov/books/NBK133354/. May 15, 2016. PubMed
11. Kiyoshi-Teo H, Krein SL, Saint S. Applying mindful evidence-based practice at the bedside: using catheter-associated urinary tract infection as a model. Infect Control Hosp Epidemiol. 2013;34:1099-1001. PubMed
Address for correspondence and reprint requests: Sajan Patel, University of California, San Francisco, Division of Hospital Medicine, 533 Parnassus Avenue, Box 0131, San Francisco, CA 94143-0131; Telephone: 415-502-5137; Fax: 415-476-4818; Email: [email protected]
Content Gating
Gated (full article locked unless allowed per User)
Patient complexity is associated with greater hospital readmission rates,1,2 poorer quality of care,3 and lower patient satisfaction.4 Improving outcomes for complex patients is a global priority,5 and local initiatives such as Ontario’s Health Links are being developed, yet evidence to inform care is lacking.6-8
The prevalence of patients living with multiple comorbidities is increasing as advances in medicine enable people to live and manage chronic diseases.9-11 However, these medical gains have resulted in an increased burden on both patients and healthcare systems. Socioeconomic status and co-occurring psychosocial challenges further complicate health and healthcare in marginalized populations.12,13
Human immunodeficiency virus/acquired immunodeficiency syndrome (HIV/AIDS) is one example of a disease that medicine has transformed. Individuals living with HIV today, on antiretroviral medications, may be able to manage their chronic illness for decades.14,15 However, in addition to social determinants of health that influence ongoing adherence and engagement in care, these medications do not completely eradicate the impact of HIV and, as a result, HIV-positive individuals are at a greater risk of developing additional comorbidities.15 People living with HIV may, therefore, represent an important patient population in which healthcare interventions and system improvements for complex patients should be explored.
Improving health systems and better supporting complex patients requires a broader understanding of the patient experience and the challenges encountered, especially during high-risk periods such as hospital discharge. Qualitative research approaches are designed to help us understand social phenomena in their “natural” settings,16 and thus suited to achieve this goal, providing critical insight to inform healthcare systems and policies.17,18 This study sought to answer the question, “What are the obstacles and challenges faced by complex patients during hospital discharge and post-discharge transition?” We approached patient complexity holistically, using a unified Complexity Framework6 that connects 5 health dimensions—social capital, mental health, demographics, health and social experiences, and physical health—identified as important to understanding complex patients and their interaction with healthcare. A longitudinal case study approach was used, with multiple sources of data, to understand the clinical context and discharge plans in relation to the lived experience of patients over time, exploring potential misalignment and areas for improvement.
METHODS
This community-based research study was conducted at Casey House, a 13-bed subacute care hospital in Toronto, Canada that provides in-patient and community programs to a complex patient group. All patients are HIV-positive. Inpatient hospital care is provided by an interdisciplinary team, including physicians, social workers, nurses, and healthcare aides. A harm reduction approach is taken to substance use. Twelve beds are for general admission. Patients may be transferred from acute-care hospitals or referred by community-based providers. One bed is reserved for scheduled 2-week respite stays.
The primary research team for this community-based project consisted of clinicians and community and academic researchers. The study was conducted in collaboration with housing, healthcare, and HIV service providers and was advised by 2 individuals with lived experience of discharge from Casey House. Community members with lived experience attended team meetings, provided feedback on all stages of the project (ie, interview guides, recruitment, analysis and dissemination), and helped facilitate community engagement sessions with other patients at the start and the end of the project.
Standard practice for discharge planning involves clinicians determining a tentative discharge date and identifying strategies to support the patient. Planning is informed by knowledge gathered by the interdisciplinary team throughout the admission, including social determinants of health (ie, housing, social support, food security). Patients are encouraged to invite an individual from their social support network to attend a discharge meeting, where the care team reviews goals for admission, course of treatment, referrals, and important follow-up dates.
We used a multi-case study approach to explore the discharge process and post-discharge period. A case was defined as the discharge and transition of a patient from hospital to community. Data were collected through serial interviews with patients (n = 4), medical chart abstraction, and review of discharge summaries. Serial interviews, although not frequently used in clinical research, have been proposed as a strong approach for exploring complex processes and to build trust between researcher and participant,19 both of which were relevant in this study. Patient interviews were conducted by the Master’s trained research coordinator (SM) using tailored semi-structured interview guides for 4 time points: before the discharge meeting (I1); after the discharge meeting but before discharge (I2); within a week of discharge (I3); and approximately 30 days after discharge (I4). Interviews were audio recorded and transcribed verbatim.
Cases were eligible if the patient had a general admission and a planned discharge to the community, and was able to communicate in English and direct his/her own care. Patient-initiated discharges and discharges to another healthcare facility were excluded. Casey House clinical staff approached consecutive potentially eligible patients for their willingness to speak with the researcher coordinator. The research coordinator met with patients to assess eligibility and obtain informed consent to participate. All participants provided informed written consent. The study was approved by the University of Toronto HIV Research Ethics Board.
Interview data, managed with MAXQDA software (VERBI GmbH, Berlin, Germany), were analyzed using a framework analysis approach.20,21 At least 3 authors read each transcript in its entirety. Priority questions/topics identified a priori by stakeholders as important to inform change in care and practices were used as the first draft of the coding framework. The framework was modified through team discussion in the analysis phase to integrate emerging themes. Participant demographic and clinical data were extracted using a structured data collection form.
Preliminary data analysis was completed for the separate data sources including inter- and intra-case comparisons: exploring how experiences and perceptions changed over time and themes that emerged across cases at the same time point. Data sources were combined to strengthen the understanding of the cases and identify relationships and discrepancies across sources.22 Audit trails, reflexive journaling, group coding and analysis meetings and member-checking, were used to enhance analytical rigor.
RESULTS
The results focus on the patient experience of the “discharge plan” and are presented in terms of 3 pre-identified categories: 1) social support; 2) discharge process and transition experience; and 3) post-discharge follow-up and referrals; and 1 emergent theme, patient priorities.
Table 1
Participants experienced complex medical and psychosocial challenges (Table 1, participant characteristics). All participants were living with HIV plus a mean of 5 additional comorbidities, the most common being hepatitis C (n= 3), chronic obstructive pulmonary disease (n = 2), herpes (n = 2) and opportunistic infections (n = 2). Eight of 9 participants had a history of an Axis 1 diagnosis, most commonly mood disorder (n = 4). Substance use was identified in all participants. An overview of each case is presented in Table 2.
Table 2 Three patients declined to be considered for the study. Informed consent was obtained for 10 cases. One participant withdrew after interview 1. Data are presented here for 9 cases, including 32 interviews, between October 2013 and June 2014. Interviews 1 (I1) and 2 (I2) were combined for 3 participants. Two participants were lost to follow-up for interview 4.
Social Support
For the purposes of this paper, we define “social support” as the emotional or instrumental assistance an individual perceives and experiences from people in his/her self-identified network (ie, family, friends). Participants’ discharge-related experience of social support did not align, in most cases, with the information from their medical charts or their expectations. At admission, 8 of 9 participants identified at least 1 person in their social support network, yet only 1 participant had someone attend the discharge meeting. One participant said she had expected “my daughter, my mother, my brother, somebody. At least somebody. But they never show up.” (P5, I2).
The complexity of her relationship with her family and her unmet needs for support continued after discharge:
I try and be as independent as possible. I don’t have to call them for nothing. Because, even the other day, I called my mom and I asked her, I said, “Mom, I’m going to give you $400 [to pay back a personal loan] and I’m going to give you an extra $100, you could buy me some food.” And she goes “Okay.” But, I didn’t give it to her yet. I don’t know, she seems money hungry right now, so I’m like no, I’ll wait. (P5, I4)
In the hospital, participants frequently spoke about discharge and transition planning that was inclusive of their social support networks. However, a sense of isolation and loneliness was common post-discharge. Often, friends and family members did not provide the support that participants anticipated, but instead were sources of anxiety and stress. One participant conveyed his experience with a friend he listed as a social support:
I gave him some money to get me some groceries, to make sure I had some food in the house when I got home. He didn’t do that. All of a sudden he was called away to [another city]. He told me his father had a heart attack. He told [others] his father had a slip. I still have yet to receive my money. (P7, I4)
Discharge Process and Transition Experience
While some participants were excited about the thought of freedom of being home, others were anxious about the burdens of returning to life outside of the hospital.
I kind of feel like, yeah, I want to go home, but then I think to myself what am I going to do when I get home. Am I just going to go back to what I’ve been doing? Am I going to really change? Am I going to forget to take my pill one day because I’m home and stuff like that. (P4, I1)
The discharge process was often perceived by participants to be rushed. Some participants found the discharge meetings helpful, while others did not feel the process empowered them to engage in a meaningful conversation with hospital staff.
There was no one there with me to even help me with my brain, to think. But it’s afterwards I’m like why didn’t I say that, like that’s what I meant to say. The brain just doesn’t function that way. (P8, I2).
This participant struggled with the transition. One week after discharge when she was asked how her health was she replied:
Terrible. I’ve got no energy. I haven’t eaten for 3 days. I haven’t drank for 3 days. I’ve got diarrhea galore […] Just no appetite whatsoever. I can’t even make it up the stairs without losing my breath. If I make it up the stairs, I have to sit for 15 or 20 minutes… (P8, I3)
The weight of maintaining activities of daily living was prominent in all post-discharge interviews, in many cases accentuated by declining health. The transition to home was more challenging than participants expected; the experience was strongly influenced by the stability of their health, their environment, and the complexity of their lives.
Follow-up and Referrals
Discharge summaries included a mean of 7 referrals. All participants were referred to a case coordinator, nurse, and family physician. Other referrals included pharmacist (n= 8); personal support worker (n = 6); housing (n = 5); and food-support programs (n = 5).
Several factors led to challenges accessing and receiving services. Participants identified: difficulty with requisite paperwork; mobility and financial constraints; personal and logistical challenges with home-care providers; and competing priorities, such as caring for family. These experiences were frequently accompanied by frustration and anxiety.
Because, if I’m in [city where girlfriend lives], I will not get the support that I get when I’m home. Like my nurse comes. [She] was supposed to come and see me twice and I missed that. I missed like 4 [appointments]. You understand? Certain things I’ve been missing. (P6, I4)
When one participant was asked if she had followed up with the food support program she had been referred to, she responded:
Oh, baby, no. I’ve been so confused. I’ve had ODSP [referring to Ontario Disability Support Program, a government disability program] on my case. I’ve got all the files all mixed up. My worker’s a real bitch. She hates me, big time. I was supposed to go bring in papers today, but I couldn’t get out of bed. I don’t know how much trouble I’m going to be in with ODSP now. (P8, I3)
Despite comprehensive discharge plans and referrals, all participants experienced delays and difficulties in accessing and receiving services. In most cases, there was no single contributing factor to these challenges; the unique experiences were a result of the complex interplay of multiple factors for each individual.
Patient Priorities
In the hospital, participants primarily identified goals of improving physical health and medication adherence. However, these goals often shifted to meeting basic living necessities and supporting others upon discharge. Barriers to adequate food and mobility were prominent themes.
One participant spoke about the challenges of supporting her son while struggling with her own health after discharge:
Well, I’ve been dying, I can’t even walk, and yet I’m the one that still has to go to WalMart, to grab milk and bread for my kid. It’s not like I need any of that stuff, because I don’t even eat. (P8, I3)
Participants were admitted on a mean of 6 medications and discharged with a mean of 14 (Table 1). In the hospital, medications are dispensed directly to patients; however, maintaining optimal adherence at home was complex. When 1 participant was asked about her medications after being home for a week, she said:
My meds, you know I have the cream that I’m supposed to put … and I can’t find it. I lost it yesterday. I used it yesterday morning and all day yesterday I’m looking, like, did it fall behind there? But, obviously, I can’t look over there [because of mobility challenges] … I don’t think I can get it covered [by insurance to replace it]. (P5, I3)
Participants found it difficult to follow a specific dosing schedule, ensure food intake corresponded to medication guidelines, and navigate the impact of substance use. Substance use for some was associated with nonadherence. A participant, explaining his quickly declining health, spoke about the impact of using crack cocaine:
Yeah, when I use I don’t think about medicating, taking my pills or anything like that. That’s not even on your mind. It doesn’t come across your mind. […] I guess, that’s part of the addictive personality. It wants to grab hold of you and say “no, focus on me, focus on me.” (P7, I4)
Others used marijuana as an appetite stimulant and a critical piece of their medication adherence routine.
DISCUSSION
This study followed complex patients through hospital discharge and transition back into the community. In the hospital, participants focused on medical goals, but following discharge basic living needs became the priority. Despite a comprehensive plan to provide support upon discharge, participants found executing and following up with referrals, services, and medication adherence was often overwhelming and not achieved in the month post-hospitalization.
Our study provides depth and context to support and understand the findings of reviews evaluating interventions to improve transitions in care.23,24 A systematic review of interventions to decrease 30-day readmission rates concluded that comprehensive support interventions (with many components) contributed to the greatest reduction in risk of readmission.16 Components that showed the greatest impact were those that were designed to improve patients’ capacity for self-care (including their ability to access and follow through with post-discharge care plans) and those that involved more individuals in the delivery of care.23
Our results also support and expand on other qualitative findings of complex patients. Kangovi et al.25 interviewed patients with low socioeconomic status at a single time point post-discharge to identify common experiences. They summarized their findings in 6 themes: powerlessness during hospitalization; incongruence of patient and clinical team goals; competing issues influencing prominence of health behaviors; socioeconomic constraints on patients’ ability to perform recommended behaviors; sense of abandonment after discharge; and loss of self-efficacy resulting from the “failure” to follow the discharge plan. Our findings tell a very similar story but provide the additional context and understanding of the lived experience over time. We found that the transition experience was most challenging when the home environment was unstable, resulting in a shift in priorities from those set during hospitalization.
While increased support may improve outcomes, there is a need to improve awareness, integration, and support for building capacity within complex patients.26 Capacity is defined here as the sum of resources and abilities that a patient can draw on, and includes physical and mental as well as social, financial, personal, and environmental capabilities and resources.27 This includes understanding the potential negative impact of developing a clinical plan which, in order to operationalize, requires resources in excess of the patient’s capacity at that time.27 Minimally disruptive medicine, a promising theoretical approach for improving the care of complex clients, embodies the awareness of capacity in achieving patient-centered care while “imposing the smallest possible treatment burden on patients’ lives.”28
This study, although not without its limitations, provides an in-depth exploration of the experiences of a small number of patients living with HIV, recruited from a single facility in Toronto, Canada after relatively long hospital stays. There are specific context issues related to HIV, such as stigma and severe consequences for suboptimal medication adherence. Furthermore, this study took place where many urban health resources exist; complex patients in rural settings or in environments less tailored to the needs associated with complex medical, psychiatric, and social conditions may experience greater barriers in the transition process. Although this study captured data from medical charts and documents relevant to the cases, further exploration of the clinician decision-making process in creating the discharge plans and additional sources of data on health outcomes post-discharge would be beneficial.
Despite its limitations, this study provides detail and depth to understand some of the most complex patients who suffer from significant challenges in the health system and who are amongst the highest-cost healthcare users. The case study approach, with serial interviews, is an important strength of this study, enabling meaningful insight into hospital discharge processes and challenges experienced by complex patients that can inform individual-level care practice and the development of new programs and interventions.
This study builds on recent research with complex patients in calling for a new approach to clinical care.6,29,30 In order to support complex patients through discharge, clinical goals and referrals must be made in light of a patient’s capacity in the community. Structural changes may be made to improve coordination and access to services, decreasing the burden and improving the healthcare experience. Albreht et al.31 highlight a number of promising programs across Europe (such as the Clinic for Multimorbidity and Polypharmacy in Denmark) designed to improve the health and healthcare for individuals living with multiple chronic conditions. Small-scale changes are also important such as increasing conversations about the capacity and limitations of individuals listed as social supports, and making appropriate and realistic referrals based on an understanding of a patient’s capacity and motivation for follow-up. Shippee et al.32 identify a list of approaches in line with minimally disruptive medicine that can be integrated into existing systems as part of a developing “toolkit” (eg, elicitation of transcendent patient goals, and integration of patient-reported outcome tracking of challenges and burdens associated with health and daily living). The findings of this study suggest that the elements of the toolkit may provide a foundation for future interventions and research to improve hospital care and discharge outcomes for complex patients.
Disclosures
This project was funded by a Canadian Institutes of Health Research (CIHR) HIV/AIDS Community-based Research Catalyst Grant (#126669). Dr. Brennan’s research is supported by an Ontario HIV Treatment Network (OHTN) Applied HIV Research Chair. Dr. Chan Carusone reports grants from Canadian Institutes of Health Research during the conduct of the study.
References
1. Allaudeen N, Vidyarthi A, Masselli J, Auerback A. Redefining readmission risk factors for general medicine patients. J Hosp Med. 2011;6:54-60. PubMed
2. Hu J, Gonsahn MD, Nerenz DR. Socioeconomic status and readmissions: evidence from an urban teaching hospital. Health Aff (Millwood). 2014;33:778-785. PubMed
3. Panagioti M, Stokes J, Esmail A, et al. Multimorbidity and patient safety incidents in primary care: a systematic review and meta-analysis. PLoS One. 2015;10:e0135947. PubMed
4. Paddison CA, Saunders CL, Abel GA, Payne RA, Campbell JL, Roland M. Why do patients with multimorbidity in England report worse experiences in primary care? Evidence from the General Practice Patient Survey. BMJ Open. 2015;5:e006172. PubMed
5. Barnett K, Mercer SW, Norbury M, Watt G, Wyke S, Guthrie B. Epidemiology of multimorbidity and implications for health care, research, and medical education: a cross-sectional study. Lancet. 2012;380:37-43. PubMed
6. Schaink AK, Kuluski K, Lyons RF, et al. A scoping review and thematic classification of patient complexity: offering a unifying framework. J Comorbidity. 2012;2:1-9.
7. Roland M, Paddison C. Better management of patients with multimorbidity. BMJ. 2013;346:f2510. PubMed
8. Smith SM, Soubhi H, Fortin M, Hudon C, O’Dowd T. Managing patients with multimorbidity: a systematic review of interventions in primary care and community settings. BMJ. 2012;345:e5205. PubMed
9. Afshar S, Roderick PJ, Kowal P, Dimitrov BD, Hill AG. Multimorbidity and the inequalities of global ageing: a cross-sectional study of 28 countries using the World Health Surveys. BMC Public Health. 2015;15:776. PubMed
10. Pefoyo AJK, Bronskill SE, Gruneir A, et al. The increasing burden and complexity of multimorbidity. BMC Public Health. 2015;15:415. PubMed
11. Ward BW, Schiller JS. Prevalence of multiple chronic conditions among US adults: estimates from the National Health Interview Survey, 2010. Prev Chronic Dis. 2013;10:E65. PubMed
12. World Health Organization. Commission on Social Determinants of Health Final Report: Closing the Gap in a Generation: Health Equity through Action on Social Determinants of Health. Geneva, Switzerland: World Health Organization, 2008.
13. Barnett K, Mercer SW, Norbury M, Watt G, Wyke S, Guthrie B.. Epidemiology of multimorbidity and implications for health care, research and medical education: a cross-sectional study. Lancet. 2012;380:37-43. PubMed
14. Samji H, Cescon A, Hogg RS, et al. Closing the gap: increases in life expectancy among treated HIV-positive individuals in the United States and Canada. PLoS One. 2013;8:e81355. PubMed
15. Deeks SG, Lewin SR, Havlir DV. The end of AIDS: HIV infection as a chronic disease. Lancet. 2013;382:1525-1533. PubMed
16. Mays N, Pope C. Qualitative research: rigour and qualitative research. BMJ. 1995;311:109-112. PubMed
17. Gilson L, Hanson K, Sheikh K, Agyepong IA, Ssengooba F, Bennett S. Building the field of health policy and systems research: social science matters. PLoS Med. 2011;8:e1001079. PubMed
18. Stoto MA, Nelson CD, Klaiman T. Getting from what to why: using qualitative research to conduct public health systems research. AcademyHealth; August 2013. http://www.academyhealth.org/files/publications/qmforph.pdf. Accessed May 24, 2016.
19. Murray SA, Kendall M, Carduff E, et al. Use of serial qualitative interviews to understand patients’ evolving experiences and needs. BMJ. 2009;339:b3702. PubMed
20. Pope C, Ziebland S, Mays N. Qualitative research in health care. Analysing qualitative data. BMJ. 2000;320:114-116. PubMed
21. Dixon-Woods M. Using framework-based synthesis for conducting reviews of qualitative studies. BMC Med. 2011;9:39. PubMed
22. Yin RK. Case Study Research: Design and Methods. 5th ed. Thousand Oaks, CA: Sage Publications, Inc.; 2014.
23. Leppin AL, Gionfriddo MR, Kessler M, et al. Preventing 30-day hospital readmissions: a systematic review and meta-analysis of randomized trials. JAMA Intern Med. 2014;174:1095-1107. PubMed
24. Kansagara D, Chiovaro JC, Kagen D, et al. So many options, where do we start? An overview of the care transitions literature. J Hosp Med. 2016;11:221-230. PubMed
25. Kangovi S, Barg FK, Carter T, et al. Challenges faced by patients with low socioeconomic status during the post-hospital transition. J Gen Intern Med. 2013;29:283-289. PubMed
26. Gill A, Kuluski K, Jaakimainen L, Naganathan G, Upshur R, Wodchis WP. “Where do we go from here?” Health system frustrations expressed by patients with multimorbidity, their caregivers and family physicians. Healthc Policy. 2014;9:73-89. PubMed
27. Shippee ND, Shah ND, May CR, Mair FS, Montori VM. Cumulative complexity: a functional, patient-centered model of patient complexity can improve research and practice. J Clin Epidemiol. 2012;65:1041-1051. PubMed
28. Leppin AL, Montori VM, Gionfriddo MR. Minimally disruptive medicine: a pragmatically comprehensive model for delivering care to patients with multiple chronic conditions. Healthcare (Basel). 2015;3:50-63. PubMed
29. Salisbury C. Multimorbidity: redesigning health care for people who use it. Lancet. 2012;380:7-9. PubMed
30. Upshur R, Tracy S. Chronicity and complexity: is what’s good for the diseases always good for the patients? Can Fam Physician. 2008;54:1655-1658. PubMed
31. Albreht A, Dyakova M, Schellevis FG, Van den Broucke S. Many diseases, one model of care? J Comorbidity. 2016;6:12-20.
32. Shippee ND, Allen SV, Leppin AL, May CR, Montori VM. Attaining minimally disruptive medicine: context, challenges and a roadmap for implementation. J R Coll Physicians Edinb. 2015;45:118-122. PubMed
Patient complexity is associated with greater hospital readmission rates,1,2 poorer quality of care,3 and lower patient satisfaction.4 Improving outcomes for complex patients is a global priority,5 and local initiatives such as Ontario’s Health Links are being developed, yet evidence to inform care is lacking.6-8
The prevalence of patients living with multiple comorbidities is increasing as advances in medicine enable people to live and manage chronic diseases.9-11 However, these medical gains have resulted in an increased burden on both patients and healthcare systems. Socioeconomic status and co-occurring psychosocial challenges further complicate health and healthcare in marginalized populations.12,13
Human immunodeficiency virus/acquired immunodeficiency syndrome (HIV/AIDS) is one example of a disease that medicine has transformed. Individuals living with HIV today, on antiretroviral medications, may be able to manage their chronic illness for decades.14,15 However, in addition to social determinants of health that influence ongoing adherence and engagement in care, these medications do not completely eradicate the impact of HIV and, as a result, HIV-positive individuals are at a greater risk of developing additional comorbidities.15 People living with HIV may, therefore, represent an important patient population in which healthcare interventions and system improvements for complex patients should be explored.
Improving health systems and better supporting complex patients requires a broader understanding of the patient experience and the challenges encountered, especially during high-risk periods such as hospital discharge. Qualitative research approaches are designed to help us understand social phenomena in their “natural” settings,16 and thus suited to achieve this goal, providing critical insight to inform healthcare systems and policies.17,18 This study sought to answer the question, “What are the obstacles and challenges faced by complex patients during hospital discharge and post-discharge transition?” We approached patient complexity holistically, using a unified Complexity Framework6 that connects 5 health dimensions—social capital, mental health, demographics, health and social experiences, and physical health—identified as important to understanding complex patients and their interaction with healthcare. A longitudinal case study approach was used, with multiple sources of data, to understand the clinical context and discharge plans in relation to the lived experience of patients over time, exploring potential misalignment and areas for improvement.
METHODS
This community-based research study was conducted at Casey House, a 13-bed subacute care hospital in Toronto, Canada that provides in-patient and community programs to a complex patient group. All patients are HIV-positive. Inpatient hospital care is provided by an interdisciplinary team, including physicians, social workers, nurses, and healthcare aides. A harm reduction approach is taken to substance use. Twelve beds are for general admission. Patients may be transferred from acute-care hospitals or referred by community-based providers. One bed is reserved for scheduled 2-week respite stays.
The primary research team for this community-based project consisted of clinicians and community and academic researchers. The study was conducted in collaboration with housing, healthcare, and HIV service providers and was advised by 2 individuals with lived experience of discharge from Casey House. Community members with lived experience attended team meetings, provided feedback on all stages of the project (ie, interview guides, recruitment, analysis and dissemination), and helped facilitate community engagement sessions with other patients at the start and the end of the project.
Standard practice for discharge planning involves clinicians determining a tentative discharge date and identifying strategies to support the patient. Planning is informed by knowledge gathered by the interdisciplinary team throughout the admission, including social determinants of health (ie, housing, social support, food security). Patients are encouraged to invite an individual from their social support network to attend a discharge meeting, where the care team reviews goals for admission, course of treatment, referrals, and important follow-up dates.
We used a multi-case study approach to explore the discharge process and post-discharge period. A case was defined as the discharge and transition of a patient from hospital to community. Data were collected through serial interviews with patients (n = 4), medical chart abstraction, and review of discharge summaries. Serial interviews, although not frequently used in clinical research, have been proposed as a strong approach for exploring complex processes and to build trust between researcher and participant,19 both of which were relevant in this study. Patient interviews were conducted by the Master’s trained research coordinator (SM) using tailored semi-structured interview guides for 4 time points: before the discharge meeting (I1); after the discharge meeting but before discharge (I2); within a week of discharge (I3); and approximately 30 days after discharge (I4). Interviews were audio recorded and transcribed verbatim.
Cases were eligible if the patient had a general admission and a planned discharge to the community, and was able to communicate in English and direct his/her own care. Patient-initiated discharges and discharges to another healthcare facility were excluded. Casey House clinical staff approached consecutive potentially eligible patients for their willingness to speak with the researcher coordinator. The research coordinator met with patients to assess eligibility and obtain informed consent to participate. All participants provided informed written consent. The study was approved by the University of Toronto HIV Research Ethics Board.
Interview data, managed with MAXQDA software (VERBI GmbH, Berlin, Germany), were analyzed using a framework analysis approach.20,21 At least 3 authors read each transcript in its entirety. Priority questions/topics identified a priori by stakeholders as important to inform change in care and practices were used as the first draft of the coding framework. The framework was modified through team discussion in the analysis phase to integrate emerging themes. Participant demographic and clinical data were extracted using a structured data collection form.
Preliminary data analysis was completed for the separate data sources including inter- and intra-case comparisons: exploring how experiences and perceptions changed over time and themes that emerged across cases at the same time point. Data sources were combined to strengthen the understanding of the cases and identify relationships and discrepancies across sources.22 Audit trails, reflexive journaling, group coding and analysis meetings and member-checking, were used to enhance analytical rigor.
RESULTS
The results focus on the patient experience of the “discharge plan” and are presented in terms of 3 pre-identified categories: 1) social support; 2) discharge process and transition experience; and 3) post-discharge follow-up and referrals; and 1 emergent theme, patient priorities.
Table 1
Participants experienced complex medical and psychosocial challenges (Table 1, participant characteristics). All participants were living with HIV plus a mean of 5 additional comorbidities, the most common being hepatitis C (n= 3), chronic obstructive pulmonary disease (n = 2), herpes (n = 2) and opportunistic infections (n = 2). Eight of 9 participants had a history of an Axis 1 diagnosis, most commonly mood disorder (n = 4). Substance use was identified in all participants. An overview of each case is presented in Table 2.
Table 2 Three patients declined to be considered for the study. Informed consent was obtained for 10 cases. One participant withdrew after interview 1. Data are presented here for 9 cases, including 32 interviews, between October 2013 and June 2014. Interviews 1 (I1) and 2 (I2) were combined for 3 participants. Two participants were lost to follow-up for interview 4.
Social Support
For the purposes of this paper, we define “social support” as the emotional or instrumental assistance an individual perceives and experiences from people in his/her self-identified network (ie, family, friends). Participants’ discharge-related experience of social support did not align, in most cases, with the information from their medical charts or their expectations. At admission, 8 of 9 participants identified at least 1 person in their social support network, yet only 1 participant had someone attend the discharge meeting. One participant said she had expected “my daughter, my mother, my brother, somebody. At least somebody. But they never show up.” (P5, I2).
The complexity of her relationship with her family and her unmet needs for support continued after discharge:
I try and be as independent as possible. I don’t have to call them for nothing. Because, even the other day, I called my mom and I asked her, I said, “Mom, I’m going to give you $400 [to pay back a personal loan] and I’m going to give you an extra $100, you could buy me some food.” And she goes “Okay.” But, I didn’t give it to her yet. I don’t know, she seems money hungry right now, so I’m like no, I’ll wait. (P5, I4)
In the hospital, participants frequently spoke about discharge and transition planning that was inclusive of their social support networks. However, a sense of isolation and loneliness was common post-discharge. Often, friends and family members did not provide the support that participants anticipated, but instead were sources of anxiety and stress. One participant conveyed his experience with a friend he listed as a social support:
I gave him some money to get me some groceries, to make sure I had some food in the house when I got home. He didn’t do that. All of a sudden he was called away to [another city]. He told me his father had a heart attack. He told [others] his father had a slip. I still have yet to receive my money. (P7, I4)
Discharge Process and Transition Experience
While some participants were excited about the thought of freedom of being home, others were anxious about the burdens of returning to life outside of the hospital.
I kind of feel like, yeah, I want to go home, but then I think to myself what am I going to do when I get home. Am I just going to go back to what I’ve been doing? Am I going to really change? Am I going to forget to take my pill one day because I’m home and stuff like that. (P4, I1)
The discharge process was often perceived by participants to be rushed. Some participants found the discharge meetings helpful, while others did not feel the process empowered them to engage in a meaningful conversation with hospital staff.
There was no one there with me to even help me with my brain, to think. But it’s afterwards I’m like why didn’t I say that, like that’s what I meant to say. The brain just doesn’t function that way. (P8, I2).
This participant struggled with the transition. One week after discharge when she was asked how her health was she replied:
Terrible. I’ve got no energy. I haven’t eaten for 3 days. I haven’t drank for 3 days. I’ve got diarrhea galore […] Just no appetite whatsoever. I can’t even make it up the stairs without losing my breath. If I make it up the stairs, I have to sit for 15 or 20 minutes… (P8, I3)
The weight of maintaining activities of daily living was prominent in all post-discharge interviews, in many cases accentuated by declining health. The transition to home was more challenging than participants expected; the experience was strongly influenced by the stability of their health, their environment, and the complexity of their lives.
Follow-up and Referrals
Discharge summaries included a mean of 7 referrals. All participants were referred to a case coordinator, nurse, and family physician. Other referrals included pharmacist (n= 8); personal support worker (n = 6); housing (n = 5); and food-support programs (n = 5).
Several factors led to challenges accessing and receiving services. Participants identified: difficulty with requisite paperwork; mobility and financial constraints; personal and logistical challenges with home-care providers; and competing priorities, such as caring for family. These experiences were frequently accompanied by frustration and anxiety.
Because, if I’m in [city where girlfriend lives], I will not get the support that I get when I’m home. Like my nurse comes. [She] was supposed to come and see me twice and I missed that. I missed like 4 [appointments]. You understand? Certain things I’ve been missing. (P6, I4)
When one participant was asked if she had followed up with the food support program she had been referred to, she responded:
Oh, baby, no. I’ve been so confused. I’ve had ODSP [referring to Ontario Disability Support Program, a government disability program] on my case. I’ve got all the files all mixed up. My worker’s a real bitch. She hates me, big time. I was supposed to go bring in papers today, but I couldn’t get out of bed. I don’t know how much trouble I’m going to be in with ODSP now. (P8, I3)
Despite comprehensive discharge plans and referrals, all participants experienced delays and difficulties in accessing and receiving services. In most cases, there was no single contributing factor to these challenges; the unique experiences were a result of the complex interplay of multiple factors for each individual.
Patient Priorities
In the hospital, participants primarily identified goals of improving physical health and medication adherence. However, these goals often shifted to meeting basic living necessities and supporting others upon discharge. Barriers to adequate food and mobility were prominent themes.
One participant spoke about the challenges of supporting her son while struggling with her own health after discharge:
Well, I’ve been dying, I can’t even walk, and yet I’m the one that still has to go to WalMart, to grab milk and bread for my kid. It’s not like I need any of that stuff, because I don’t even eat. (P8, I3)
Participants were admitted on a mean of 6 medications and discharged with a mean of 14 (Table 1). In the hospital, medications are dispensed directly to patients; however, maintaining optimal adherence at home was complex. When 1 participant was asked about her medications after being home for a week, she said:
My meds, you know I have the cream that I’m supposed to put … and I can’t find it. I lost it yesterday. I used it yesterday morning and all day yesterday I’m looking, like, did it fall behind there? But, obviously, I can’t look over there [because of mobility challenges] … I don’t think I can get it covered [by insurance to replace it]. (P5, I3)
Participants found it difficult to follow a specific dosing schedule, ensure food intake corresponded to medication guidelines, and navigate the impact of substance use. Substance use for some was associated with nonadherence. A participant, explaining his quickly declining health, spoke about the impact of using crack cocaine:
Yeah, when I use I don’t think about medicating, taking my pills or anything like that. That’s not even on your mind. It doesn’t come across your mind. […] I guess, that’s part of the addictive personality. It wants to grab hold of you and say “no, focus on me, focus on me.” (P7, I4)
Others used marijuana as an appetite stimulant and a critical piece of their medication adherence routine.
DISCUSSION
This study followed complex patients through hospital discharge and transition back into the community. In the hospital, participants focused on medical goals, but following discharge basic living needs became the priority. Despite a comprehensive plan to provide support upon discharge, participants found executing and following up with referrals, services, and medication adherence was often overwhelming and not achieved in the month post-hospitalization.
Our study provides depth and context to support and understand the findings of reviews evaluating interventions to improve transitions in care.23,24 A systematic review of interventions to decrease 30-day readmission rates concluded that comprehensive support interventions (with many components) contributed to the greatest reduction in risk of readmission.16 Components that showed the greatest impact were those that were designed to improve patients’ capacity for self-care (including their ability to access and follow through with post-discharge care plans) and those that involved more individuals in the delivery of care.23
Our results also support and expand on other qualitative findings of complex patients. Kangovi et al.25 interviewed patients with low socioeconomic status at a single time point post-discharge to identify common experiences. They summarized their findings in 6 themes: powerlessness during hospitalization; incongruence of patient and clinical team goals; competing issues influencing prominence of health behaviors; socioeconomic constraints on patients’ ability to perform recommended behaviors; sense of abandonment after discharge; and loss of self-efficacy resulting from the “failure” to follow the discharge plan. Our findings tell a very similar story but provide the additional context and understanding of the lived experience over time. We found that the transition experience was most challenging when the home environment was unstable, resulting in a shift in priorities from those set during hospitalization.
While increased support may improve outcomes, there is a need to improve awareness, integration, and support for building capacity within complex patients.26 Capacity is defined here as the sum of resources and abilities that a patient can draw on, and includes physical and mental as well as social, financial, personal, and environmental capabilities and resources.27 This includes understanding the potential negative impact of developing a clinical plan which, in order to operationalize, requires resources in excess of the patient’s capacity at that time.27 Minimally disruptive medicine, a promising theoretical approach for improving the care of complex clients, embodies the awareness of capacity in achieving patient-centered care while “imposing the smallest possible treatment burden on patients’ lives.”28
This study, although not without its limitations, provides an in-depth exploration of the experiences of a small number of patients living with HIV, recruited from a single facility in Toronto, Canada after relatively long hospital stays. There are specific context issues related to HIV, such as stigma and severe consequences for suboptimal medication adherence. Furthermore, this study took place where many urban health resources exist; complex patients in rural settings or in environments less tailored to the needs associated with complex medical, psychiatric, and social conditions may experience greater barriers in the transition process. Although this study captured data from medical charts and documents relevant to the cases, further exploration of the clinician decision-making process in creating the discharge plans and additional sources of data on health outcomes post-discharge would be beneficial.
Despite its limitations, this study provides detail and depth to understand some of the most complex patients who suffer from significant challenges in the health system and who are amongst the highest-cost healthcare users. The case study approach, with serial interviews, is an important strength of this study, enabling meaningful insight into hospital discharge processes and challenges experienced by complex patients that can inform individual-level care practice and the development of new programs and interventions.
This study builds on recent research with complex patients in calling for a new approach to clinical care.6,29,30 In order to support complex patients through discharge, clinical goals and referrals must be made in light of a patient’s capacity in the community. Structural changes may be made to improve coordination and access to services, decreasing the burden and improving the healthcare experience. Albreht et al.31 highlight a number of promising programs across Europe (such as the Clinic for Multimorbidity and Polypharmacy in Denmark) designed to improve the health and healthcare for individuals living with multiple chronic conditions. Small-scale changes are also important such as increasing conversations about the capacity and limitations of individuals listed as social supports, and making appropriate and realistic referrals based on an understanding of a patient’s capacity and motivation for follow-up. Shippee et al.32 identify a list of approaches in line with minimally disruptive medicine that can be integrated into existing systems as part of a developing “toolkit” (eg, elicitation of transcendent patient goals, and integration of patient-reported outcome tracking of challenges and burdens associated with health and daily living). The findings of this study suggest that the elements of the toolkit may provide a foundation for future interventions and research to improve hospital care and discharge outcomes for complex patients.
Disclosures
This project was funded by a Canadian Institutes of Health Research (CIHR) HIV/AIDS Community-based Research Catalyst Grant (#126669). Dr. Brennan’s research is supported by an Ontario HIV Treatment Network (OHTN) Applied HIV Research Chair. Dr. Chan Carusone reports grants from Canadian Institutes of Health Research during the conduct of the study.
References
1. Allaudeen N, Vidyarthi A, Masselli J, Auerback A. Redefining readmission risk factors for general medicine patients. J Hosp Med. 2011;6:54-60. PubMed
2. Hu J, Gonsahn MD, Nerenz DR. Socioeconomic status and readmissions: evidence from an urban teaching hospital. Health Aff (Millwood). 2014;33:778-785. PubMed
3. Panagioti M, Stokes J, Esmail A, et al. Multimorbidity and patient safety incidents in primary care: a systematic review and meta-analysis. PLoS One. 2015;10:e0135947. PubMed
4. Paddison CA, Saunders CL, Abel GA, Payne RA, Campbell JL, Roland M. Why do patients with multimorbidity in England report worse experiences in primary care? Evidence from the General Practice Patient Survey. BMJ Open. 2015;5:e006172. PubMed
5. Barnett K, Mercer SW, Norbury M, Watt G, Wyke S, Guthrie B. Epidemiology of multimorbidity and implications for health care, research, and medical education: a cross-sectional study. Lancet. 2012;380:37-43. PubMed
6. Schaink AK, Kuluski K, Lyons RF, et al. A scoping review and thematic classification of patient complexity: offering a unifying framework. J Comorbidity. 2012;2:1-9.
7. Roland M, Paddison C. Better management of patients with multimorbidity. BMJ. 2013;346:f2510. PubMed
8. Smith SM, Soubhi H, Fortin M, Hudon C, O’Dowd T. Managing patients with multimorbidity: a systematic review of interventions in primary care and community settings. BMJ. 2012;345:e5205. PubMed
9. Afshar S, Roderick PJ, Kowal P, Dimitrov BD, Hill AG. Multimorbidity and the inequalities of global ageing: a cross-sectional study of 28 countries using the World Health Surveys. BMC Public Health. 2015;15:776. PubMed
10. Pefoyo AJK, Bronskill SE, Gruneir A, et al. The increasing burden and complexity of multimorbidity. BMC Public Health. 2015;15:415. PubMed
11. Ward BW, Schiller JS. Prevalence of multiple chronic conditions among US adults: estimates from the National Health Interview Survey, 2010. Prev Chronic Dis. 2013;10:E65. PubMed
12. World Health Organization. Commission on Social Determinants of Health Final Report: Closing the Gap in a Generation: Health Equity through Action on Social Determinants of Health. Geneva, Switzerland: World Health Organization, 2008.
13. Barnett K, Mercer SW, Norbury M, Watt G, Wyke S, Guthrie B.. Epidemiology of multimorbidity and implications for health care, research and medical education: a cross-sectional study. Lancet. 2012;380:37-43. PubMed
14. Samji H, Cescon A, Hogg RS, et al. Closing the gap: increases in life expectancy among treated HIV-positive individuals in the United States and Canada. PLoS One. 2013;8:e81355. PubMed
15. Deeks SG, Lewin SR, Havlir DV. The end of AIDS: HIV infection as a chronic disease. Lancet. 2013;382:1525-1533. PubMed
16. Mays N, Pope C. Qualitative research: rigour and qualitative research. BMJ. 1995;311:109-112. PubMed
17. Gilson L, Hanson K, Sheikh K, Agyepong IA, Ssengooba F, Bennett S. Building the field of health policy and systems research: social science matters. PLoS Med. 2011;8:e1001079. PubMed
18. Stoto MA, Nelson CD, Klaiman T. Getting from what to why: using qualitative research to conduct public health systems research. AcademyHealth; August 2013. http://www.academyhealth.org/files/publications/qmforph.pdf. Accessed May 24, 2016.
19. Murray SA, Kendall M, Carduff E, et al. Use of serial qualitative interviews to understand patients’ evolving experiences and needs. BMJ. 2009;339:b3702. PubMed
20. Pope C, Ziebland S, Mays N. Qualitative research in health care. Analysing qualitative data. BMJ. 2000;320:114-116. PubMed
21. Dixon-Woods M. Using framework-based synthesis for conducting reviews of qualitative studies. BMC Med. 2011;9:39. PubMed
22. Yin RK. Case Study Research: Design and Methods. 5th ed. Thousand Oaks, CA: Sage Publications, Inc.; 2014.
23. Leppin AL, Gionfriddo MR, Kessler M, et al. Preventing 30-day hospital readmissions: a systematic review and meta-analysis of randomized trials. JAMA Intern Med. 2014;174:1095-1107. PubMed
24. Kansagara D, Chiovaro JC, Kagen D, et al. So many options, where do we start? An overview of the care transitions literature. J Hosp Med. 2016;11:221-230. PubMed
25. Kangovi S, Barg FK, Carter T, et al. Challenges faced by patients with low socioeconomic status during the post-hospital transition. J Gen Intern Med. 2013;29:283-289. PubMed
26. Gill A, Kuluski K, Jaakimainen L, Naganathan G, Upshur R, Wodchis WP. “Where do we go from here?” Health system frustrations expressed by patients with multimorbidity, their caregivers and family physicians. Healthc Policy. 2014;9:73-89. PubMed
27. Shippee ND, Shah ND, May CR, Mair FS, Montori VM. Cumulative complexity: a functional, patient-centered model of patient complexity can improve research and practice. J Clin Epidemiol. 2012;65:1041-1051. PubMed
28. Leppin AL, Montori VM, Gionfriddo MR. Minimally disruptive medicine: a pragmatically comprehensive model for delivering care to patients with multiple chronic conditions. Healthcare (Basel). 2015;3:50-63. PubMed
29. Salisbury C. Multimorbidity: redesigning health care for people who use it. Lancet. 2012;380:7-9. PubMed
30. Upshur R, Tracy S. Chronicity and complexity: is what’s good for the diseases always good for the patients? Can Fam Physician. 2008;54:1655-1658. PubMed
31. Albreht A, Dyakova M, Schellevis FG, Van den Broucke S. Many diseases, one model of care? J Comorbidity. 2016;6:12-20.
32. Shippee ND, Allen SV, Leppin AL, May CR, Montori VM. Attaining minimally disruptive medicine: context, challenges and a roadmap for implementation. J R Coll Physicians Edinb. 2015;45:118-122. PubMed
The landscape of post–acute care (PAC), which is predominantly provided by inpatient rehabilitation facilities (IRFs), skilled nursing facilities (SNFs), and home healthcare (HHC) providers, is rapidly changing. As hospitalizations shorten, PAC utilization is rising, resulting in rapidly increasing costs.1-5 However, patient outcomes in PAC are characterized by high rates of readmission and low rates of return to the community.6,7 Emerging evidence suggests these outcomes could be substantially improved through use of better in-hospital and transitional care processes.8-10
Legislators took notice of the spiraling costs, potential quality concerns, and undesirable patient outcomes in PAC. Provisions in the Patient Protection and Affordable Care Act of 2010 (ACA), the Protecting Access to Medicare Act of 2014 (PAMA), and the Improving Medicare Post–Acute Care Transformation (IMPACT) Act of 2014 affect patient selection, payment, and quality measurement in PAC. As older adults are increasingly being cared for by hospitalists,11 hospitalists must be aware of the implications of these reforms.
IMPLICATIONS FOR HOSPITALISTS
Choosing Patients Wisely for PAC
Because PAC-related decision making is not standardized, referral rates vary significantly.12 The variability in PAC use accounts for 79% of all regional variation in Medicare spending in the United States.13,14 Compared with other physicians, hospitalists are more likely to use PAC15 but typically receive little exposure to PAC during training.16
The IMPACT Act proposes 2 major changes to patient selection: a uniform assessment tool for patients being discharged to PAC and “site-neutral” payments for PAC. Starting in 2018, the Continuity Assessment Record and Evaluation (CARE) tool must be completed before a hospital discharge in order to better match PAC resources to patient needs. The current 26-page CARE tool includes questions about demographics and home support, medical complexity, physical function, cognitive status, and “transition items,” including discharge plans and advance directives. In pilot testing, significant amounts of missing data and average completion times of up to 60 minutes raised concerns about feasibility.17 CARE tool assessments accurately predicted what form of PAC patients actually received, but further testing is planned to validate whether the type of PAC selected was optimal for patient outcomes.. A plan for using CARE tool assessments to determine site-neutral payments is due to Congress by 2020. In the site-neutral payment system, the PAC provider will be reimbursed according to patient needs (identified by the CARE tool), regardless of PAC setting—a radical change from the current system, in which IRF, SNF, and HHC episodes show major differences in median costs (Table 1).18
Hospitalists may be concerned that use of the CARE tool will supplant clinical judgment about patients’ PAC needs. The burden of completing the CARE tool could inadvertently reduce the amount of attention hospitalists give to other aspects of a safe discharge rather than lead to the improvement desired.19-21 Hospitalists will benefit from developing interdisciplinary, iterative workflows to complete the tool, improving accuracy and reducing the burden.
A potential unintended consequence of the site-neutral payment system may be increased difficulty discharging elderly patients who have limited rehabilitation potential but are lacking sufficient social support to return home. In the current system, these patients are commonly discharged to SNFs as a bridge to long-term nursing home care. Hospitalists will need to become increasingly familiar with novel alternatives to nursing home–based care, such as home-based primary care, medical foster homes, and Medicare/Medicaid’s Program of All-Inclusive Care of the Elderly (PACE).22-25
Choosing PAC Providers Wisely
Medicare’s Nursing Home Compare tool (https://www.medicare.gov/nursinghomecompare/search.html) provides a “5-star” system for rating SNFs on several quality metrics; these metrics, however, are not correlated with readmission or mortality rates.26,27 Improving quality measurement in PAC and tying payment to quality and outcomes are major emphases of the IMPACT Act and PAMA, respectively. PAC providers must publicly report an expanded list of quality measures and outcomes by 2018. In 2017, SNFs will begin reporting rates of “potentially preventable” readmissions, and starting in 2019 they will face penalties for having high risk-adjusted rates.
These reforms coincide with an increased emphasis on hospitals and PAC providers sharing responsibility for costs and outcomes. One model of the Bundled Payments for Care Improvement (BPCI) initiative includes a single payment for an acute hospitalization and PAC up to 90 days after hospital discharge for select conditions. The Medicare Spending Per Beneficiary (MSPB) measure compares hospitals on their spending for Medicare beneficiaries from 3 days before hospital admission to 30 days after hospital discharge, and penalizes outliers with high costs.28 PAC spending is the main driver of costs in both BPCI and MSPB.29 One way that hospitals have responded to the BPCI is by drastically reducing their referrals to SNFs and increasing their referrals to HHC providers; unfortunately, this response has resulted in increases in post-discharge emergency department visits.29,30 Taking a novel step in November 2015, the Centers for Medicare & Medicaid Services (CMS) ruled that hospitals in more than 67 metropolitan service areas will be involuntarily enrolled in the BPCI initiative, using elective lower extremity joint replacement as the sample condition.31 This ruling signaled that these reforms are not meant solely for “high-performing” hospital and PAC systems able to volunteer for novel models of payment.
These changes have direct implications for hospitalists. Bundled payments incentivize hospitalists to reduce hospital length of stay and choose PAC alternatives with lower costs. SNFs may start accepting fewer “high-risk” patients in order to avoid readmission penalties. Hospitals will need to identify and partner with high-performing PAC providers in their community to maximize outcomes for their patients. On their websites, the Society of Post-Acute and Long-Term Care Medicine (AMDA) lists its state chapters,32 and the National Association for Home Care & Hospice lists national HHC agencies.33 Reviewing early lessons learned in the evaluation of PAC providers as potential hospital partners in Pioneer accountable care organizations may be helpful,34 though the PAC cost savings in these organizations largely resulted from redirecting patients from SNFs to HHC providers.35,36 In many markets, the relationships between hospitals and PAC providers may become more formalized, leading to vertical integration.37 Hospitalists may increasingly be asked to work with, or even in, SNFs.38 For hospitalists who begin working in PAC, the AMDA is developing an educational curriculum to maximize efficacy in a new practice setting.39 In other markets, hospitals may turn to for-profit entities that provide “integrated post-acute care services,”40 taking over PAC decision making from inpatient teams and sharing any resulting profits from bundled payments.
OPPORTUNITIES FOR HOSPITALISTS
Improve Hospital and Transitional Care to Ensure Successful Early Outcomes in PAC
Payment reform ensures hospitalists will increasingly have a stake in these matters, as joint responsibility for costs and outcomes increases for patients discharged to PAC. Hospitalists play a major role in these outcomes by deciding when and where to discharge patients and ensuring that optimal transition-of-care processes are used.8-10,41-45 Although no single intervention has been prospectively found to improve hospital-to-PAC transitional care outcomes, areas in need of improvement are known. Table 2 lists these within 9 of the Ideal Transition of Care Framework domains.43,46
Advocate Patient-Centered PAC Placement That Maximizes Long-Term Outcomes
Payment reforms could reinforce the cynical view that the optimal PAC setting is the least costly one that avoids hospital readmission. This view does not incorporate evidence that, in some cases, placement in a more costly PAC setting results in better long-term outcomes (eg, community discharge rates).47,48 It is also incongruent with a holistic view of the patient’s needs, particularly for patients who may otherwise be suitable for home-based PAC but have limited social support.49 Finally, it does not acknowledge the reality that patients who are inadequately rehabilitated often transition to long-term nursing home care,50 which could result in significant cost-shifting from Medicare to Medicaid, the predominant payer for long-term care.51 Given the extraordinary cost of long-term nursing home care, attending only to short-term costs and outcomes could increase national healthcare expenditures.
With most PAC-related decisions being made in the hospital, hospitalists find themselves at the center of a care team that must advocate the PAC that is best for the patient over the long term. This endeavor requires that hospitalists and others work for improvements in at least 3 aspects of in-hospital care. First, systems for accurately and reliably identifying patient factors that could substantially affect ability to rehabilitate (eg delirium) must be developed or enhanced.52-54 Second, more formal evaluation of the ability of patients and their caregivers to succeed at home is needed.55-60 Patients and caregivers may not understand their home needs without first “testing” the experience prior to discharge.61 Third, hospitalists must understand PAC in order to provide safe transitions.16 It is logistically challenging to expose practicing hospitalists to PAC, and it is unclear which exposures are most effective in improving decision making.62 An alternative approach that provides hospitalists with feedback about the short- and long-term outcomes of patients they have discharged to PAC may iteratively improve decision making. However, despite the high rate of discharges to PAC, there are anecdotal reports that few hospitalists receive feedback on patient outcomes.
As these reforms are tested and implemented, advocacy at regional and national levels is needed. The American Geriatrics Society (AGS), the AMDA, and the American Academy of Home Care Medicine all have well-developed advocacy platforms hospitalists can access.63-65
Share Expertise to Improve Quality in a Constrained Environment
There are opportunities for synergy between robust quality improvement (QI) efforts in PAC (often as part of Quality Assurance and Performance Improvement programs) and similarly robust hospital QI efforts led by hospitalists.66-70 These efforts have largely occurred in parallel, but now some important bridging QI interventions (eg, collaborative root cause analyses for patients readmitted after PAC) are starting at some sites, and these may drive improvement across the care spectrum.45 The Society of Hospital Medicine, the AGS, and the AMDA have written White Papers on care transitions that may serve as starting points for discussion.41,71,72
CONCLUSION
PAC is rapidly changing in response to reform legislation that is intended to address poor outcomes and high costs. Hospitalists will increasingly feel the effects of these reforms in their day-to-day practices. To continue to deliver high-value care, hospitalists should review their in-hospital and transitional care practices and start building relationships with high-quality PAC providers in their community.
Disclosures: Dr. Burke was supported by a VA Health Services Research and Development Service career development award and by National Institute on Aging grant R03AG050885. The funders had no role in the design, conduct, interpretation, or presentation of the data. The other authors have nothing to report. The views represented here are those of the authors and do not necessarily represent the views of the Department of Veterans Affairs.
References
1. Kosecoff J, Kahn KL, Rogers WH, et al. Prospective payment system and impairment at discharge. The ‘quicker-and-sicker’ story revisited. JAMA. 1990;264(15):1980-1983. PubMed
2. Burke RE, Juarez-Colunga E, Levy C, Prochazka AV, Coleman EA, Ginde AA. Patient and hospitalization characteristics associated with increased postacute care facility discharges from US hospitals. Med Care. 2015;53(6):492-500. PubMed
3. Jones CD, Ginde AA, Burke RE, Wald HL, Masoudi FA, Boxer RS. Increasing home healthcare referrals upon discharge from U.S. hospitals: 2001-2012. J Am Geriatr Soc. 2015;63(6):1265-1266. PubMed
4. Burke RE, Juarez-Colunga E, Levy C, Prochazka AV, Coleman EA, Ginde AA. Rise of post-acute care facilities as a discharge destination of US hospitalizations. JAMA Intern Med. 2015;175(2):295-296. PubMed
5. Chandra A, Dalton MA, Holmes J. Large increases in spending on postacute care in Medicare point to the potential for cost savings in these settings. Health Aff (Millwood). 2013;32(5):864-872. PubMed
6. Mor V, Intrator O, Feng Z, Grabowski DC. The revolving door of rehospitalization from skilled nursing facilities. Health Aff (Millwood). 2010;29(1):57-64. PubMed
7. Kramer A, Fish R, Min S. Community Discharge and Rehospitalization Outcome Measures (Fiscal Year 2011): Final Report. Denver, CO: Providigm. http://67.59.137.244/documents/Apr13_CommunityDischarge_CONTRACTOR.pdf. Published April 15, 2013. Accessed March 24, 2016.
8. Burke RE, Whitfield EA, Hittle D, et al. Hospital readmission from post-acute care facilities: risk factors, timing, and outcomes. J Am Med Dir Assoc. 2016;17(3):249-255. PubMed
9. Levinson DR. Adverse Events in Skilled Nursing Facilities: National Incidence Among Medicare Beneficiaries. Washington, DC: Office of the Inspector General, US Dept of Health and Human Services. Report OEI-06-11-00370. http://oig.hhs.gov/oei/reports/oei-06-11-00370.pdf. Published February 2014. Accessed March 5, 2014.
10. Ouslander JG, Naharci I, Engstrom G, et al. Lessons learned from root cause analyses of transfers of skilled nursing facility (SNF) patients to acute hospitals: transfers rated as preventable versus nonpreventable by SNF staff. J Am Med Dir Assoc. 2016;17(7):596-601. PubMed
11. Kuo YF, Sharma G, Freeman JL, Goodwin JS. Growth in the care of older patients by hospitalists in the United States. N Engl J Med. 2009;360(11):1102-1112. PubMed
12. Kane RL. Finding the right level of posthospital care: “We didn’t realize there was any other option for him.” JAMA. 2011;305(3):284-293. PubMed
13. Newhouse JP, Garber AM. Geographic variation in health care spending in the United States: insights from an Institute of Medicine report. JAMA. 2013;310(12):1227-1228. PubMed
14. Kane RL, Lin WC, Blewett LA. Geographic variation in the use of post-acute care. Health Serv Res. 2002;37(3):667-682. PubMed
15. Kuo YF, Goodwin JS. Association of hospitalist care with medical utilization after discharge: evidence of cost shift from a cohort study. Ann Intern Med. 2011;155(3):152-159. PubMed
16. Ward KT, Eslami MS, Garcia MB, McCreath HE. Do internal medicine residents know enough about skilled nursing facilities to orchestrate a good care transition? J Am Med Dir Assoc. 2014;15(11):841-843. PubMed
17. Centers for Medicare & Medicaid Services. CARE Item Set and B-CARE. https://www.cms.gov/Medicare/Quality-Initiatives-Patient-Assessment-Instruments/Post-Acute-Care-Quality-Initiatives/CARE-Item-Set-and-B-CARE.html. Published January 13, 2015. Accessed November 2, 2015.
18. Medicare Payment Advisory Commission. Report to the Congress: Medicare Payment Policy. Washington, DC: Medicare Payment Advisory Commission. http://medpac.gov/docs/default-source/reports/mar2015_entirereport_revised.pdf. Published March 13, 2015. Accessed December 8, 2015.
19. Block L, Morgan-Gouveia M, Levine RB, Cayea D. We could have done a better job: a qualitative study of medical student reflections on safe hospital discharge. J Am Geriatr Soc. 2014;62(6):1147-1154. PubMed
20. Greysen SR, Schiliro D, Horwitz LI, Curry L, Bradley EH. “Out of sight, out of mind”: housestaff perceptions of quality-limiting factors in discharge care at teaching hospitals. J Hosp Med. 2012;7(5):376-381. PubMed
21. Halasyamani L, Kripalani S, Coleman E, et al. Transition of care for hospitalized elderly patients—development of a discharge checklist for hospitalists. J Hosp Med. 2006;1(6):354-360. PubMed
22. Hughes SL, Weaver FM, Giobbie-Hurder A, et al.; Department of Veterans Affairs Cooperative Study Group on Home-Based Primary Care. Effectiveness of team-managed home-based primary care: a randomized multicenter trial. JAMA. 2000;284(22):2877-2885. PubMed
23. Kinosian B, Taler G, Boling P, Gilden D; Independence at Home Learning Collaborative Writing Group. Projected savings and workforce transformation from converting Independence at Home to a Medicare benefit. J Am Geriatr Soc. 2016;64(8):1531-1536. PubMed
24. Segelman M, Szydlowski J, Kinosian B, et al. Hospitalizations in the Program of All-Inclusive Care for the Elderly. J Am Geriatr Soc. 2014;62(2):320-324. PubMed
25. Manheim CE, Haverhals LM, Jones J, Levy CR. Allowing family to be family: end-of-life care in Veterans Affairs medical foster homes. J Soc Work End Life Palliat Care. 2016;12(1-2):104-125. PubMed
26. Neuman MD, Wirtalla C, Werner RM. Association between skilled nursing facility quality indicators and hospital readmissions. JAMA. 2014;312(15):1542-1551. PubMed
27. Unroe KT, Greiner MA, Colón-Emeric C, Peterson ED, Curtis LH. Associations between published quality ratings of skilled nursing facilities and outcomes of Medicare beneficiaries with heart failure. J Am Med Dir Assoc. 2012;13(2): 188.e1-e6. PubMed
28. Schumacher DN, Dobkin ED. Medicare spending per beneficiary. Health Aff (Millwood). 2014;33(10):1878. PubMed
29. Das A, Norton EC, Miller DC, Chen LM. Association of postdischarge spending and performance on new episode-based spending measure. JAMA Intern Med. 2016;176(1):117-119. PubMed
30. Jubelt LE, Goldfeld KS, Chung WY, Blecker SB, Horwitz LI. Changes in discharge location and readmission rates under Medicare bundled payment. JAMA Intern Med. 2016;176(1):115-117. PubMed
31. Federal Register: Medicare Program; Comprehensive Care for Joint Replacement Payment Model for Acute Care Hospitals Furnishing Lower Extremity Joint Replacement Services. https://www.gpo.gov/fdsys/pkg/FR-2015-11-24/pdf/2015-29438.pdf. Accessed June 20, 2016.
32. Society for Post-Acute and Long-Term Care Medicine. State chapters; AMDA state chapter network. http://www.paltc.org/state-chapters. Accessed June 6, 2016.
33. National Association for Home Care & Hospice. National agency location service. https://agencylocator.nahc.org. Accessed June 6, 2016.
34. Lage DE, Rusinak D, Carr D, Grabowski DC, Ackerly DC. Creating a network of high-quality skilled nursing facilities: preliminary data on the postacute care quality improvement experiences of an accountable care organization. J Am Geriatr Soc. 2015;63(4):804-808. PubMed
35. Nyweide DJ, Lee W, Cuerdon TT, et al. Association of Pioneer accountable care organizations vs traditional Medicare fee for service with spending, utilization, and patient experience. JAMA. 2015;313(21):2152-2161. PubMed
36. McWilliams JM, Chernew ME, Landon BE, Schwartz AL. Performance differences in year 1 of Pioneer accountable care organizations. N Engl J Med. 2015;372(20):1927-1936. PubMed
37. Afendulis CC, Kessler DP. Vertical integration and optimal reimbursement policy. Int J Health Care Finance Econ. 2011;11(3):165-179. PubMed
38. IPC Healthcare. Post-acute care services. http://www.ipchealthcare.com/advantage/post-acute-care. Accessed January 11, 2016.
39. Society for Post-Acute and Long-Term Care Medicine. Competencies curriculum for post-acute and long-term care medicine. http://www.paltc.org/competencies-curriculum-post-acute-and-long-term-care-medicine. Accessed May 26, 2016.
40. NaviHealth. Leading the way in a rapidly changing PAC marketplace. http://www.navihealth.us/home/solutions/services. Accessed January 11, 2016.
41. Arbaje AI, Kansagara DL, Salanitro AH, et al. Regardless of age: incorporating principles from geriatric medicine to improve care transitions for patients with complex needs. J Gen Intern Med. 2014;29(6):932-939. PubMed
42. Schoenborn NL, Arbaje AI, Eubank KJ, Maynor K, Carrese JA. Clinician roles and responsibilities during care transitions of older adults. J Am Geriatr Soc. 2013;61(2):231-236. PubMed
43. Burke RE, Kripalani S, Vasilevskis EE, Schnipper JL. Moving beyond readmission penalties: creating an ideal process to improve transitional care. J Hosp Med. 2013;8(2):102-109. PubMed
44. Kripalani S, Jackson AT, Schnipper JL, Coleman EA. Promoting effective transitions of care at hospital discharge: a review of key issues for hospitalists. J Hosp Med. 2007;2(5):314-323. PubMed
45. Ouslander JG, Naharci I, Engstrom G, et al. Root cause analyses of transfers of skilled nursing facility patients to acute hospitals: lessons learned for reducing unnecessary hospitalizations. J Am Med Dir Assoc. 2016;17(3):256-262. PubMed
46. Burke RE, Guo R, Prochazka AV, Misky GJ. Identifying keys to success in reducing readmissions using the ideal transitions in care framework. BMC Health Serv Res. 2014;14:423. PubMed
47. Kane RL, Chen Q, Finch M, Blewett L, Burns R, Moskowitz M. Functional outcomes of posthospital care for stroke and hip fracture patients under Medicare. J Am Geriatr Soc. 1998;46(12):1525-1533. PubMed
48. Kane RL, Chen Q, Finch M, Blewett L, Burns R, Moskowitz M. The optimal outcomes of post-hospital care under Medicare. Health Serv Res. 2000;35(3):615-661. PubMed
49. Greysen SR, Harrison JD, Kripalani S, et al. Understanding patient-centred readmission factors: a multi-site, mixed-methods study [published online January 14, 2016]. BMJ Qual Saf. doi:10.1136/bmjqs-2015-004570. PubMed
50. Goodwin JS, Howrey B, Zhang DD, Kuo YF. Risk of continued institutionalization after hospitalization in older adults. J Gerontol A Biol Sci Med Sci. 2011;66(12):1321-1327. PubMed
51. Reaves EL, Musumeci M. Medicaid and Long-Term Services and Supports: A Primer. Washington, DC: Kaiser Commission on Medicaid and the Uninsured. Report 8617-02. Henry J. Kaiser Family Foundation website. http://files.kff.org/attachment/report-medicaid-and-long-term-services-and-supports-a-primer. Published December 15, 2015. Accessed May 18, 2016.
52. Bell SP, Vasilevskis EE, Saraf AA, et al. Geriatric syndromes in hospitalized older adults discharged to skilled nursing facilities. J Am Geriatr Soc. 2016;64(4): 715-722. PubMed
53. Cawthon C, Mion LC, Willens DE, Roumie CL, Kripalani S. Implementing routine health literacy assessment in hospital and primary care patients. Jt Comm J Qual Patient Saf. 2014;40(2):68-76. PubMed
54. Greysen SR, Stijacic Cenzer I, Auerbach AD, Covinsky KE. Functional impairment and hospital readmission in Medicare seniors. JAMA Intern Med. 2015;175(4):559-565. PubMed
55. Coleman EA, Roman SP. Family caregivers’ experiences during transitions out of hospital. J Healthc Qual. 2015;37(1):12-21. PubMed
56. Coleman EA, Min SJ. Patients’ and family caregivers’ goals for care during transitions out of the hospital. Home Health Care Serv Q. 2015;34(3-4):173-184. PubMed
57. Coleman EA, Smith JD, Frank JC, Min SJ, Parry C, Kramer AM. Preparing patients and caregivers to participate in care delivered across settings: the Care Transitions Intervention. J Am Geriatr Soc. 2004;52(11):1817-1825. PubMed
58. Coleman EA, Ground KL, Maul A. The Family Caregiver Activation in Transitions (FCAT) tool: a new measure of family caregiver self-efficacy. Jt Comm J Qual Patient Saf. 2015;41(11):502-507. PubMed
59. Cain CH, Neuwirth E, Bellows J, Zuber C, Green J. Patient experiences of transitioning from hospital to home: an ethnographic quality improvement project. PubMed J Hosp Med. 2012;7(5):382-387.
60. Burke RE, Jones J, Ho PM, Bekelman DB. Caregivers’ perceived roles in caring for patients with heart failure: what do clinicians need to know? J Card Fail. 2014;20(10):731-738. PubMed
61. Coleman EA. Extending simulation learning experiences to patients with chronic health conditions. JAMA. 2014;311(3):243-244. PubMed
62. Meade LB, Hall SL, Kleppel RW, Hinchey KT. TRACER: an ‘eye-opener’ to the patient experience across the transition of care in an internal medicine resident program. J Community Hosp Intern Med Perspect. 2015;5(2):26230. PubMed
63. American Geriatrics Society. Public policy & advocacy. http://www.americangeriatrics.org/advocacy_public_policy. Accessed May 26, 2016.
64. Society for Post-Acute and Long-Term Care Medicine. Public policy. http://www.paltc.org/public-policy. Accessed May 26, 2016.
65. American Academy of Home Care Medicine. Public policy. http://www.aahcm.org/?page=Public_Policy. Accessed May 26, 2016.
66. Hansen LO, Greenwald JL, Budnitz T, et al. Project BOOST: effectiveness of a multihospital effort to reduce rehospitalization. J Hosp Med. 2013;8(8):421-427. PubMed
67. Unroe KT, Nazir A, Holtz LR, et al. The Optimizing Patient Transfers, Impacting Medical Quality, and Improving Symptoms: Transforming Institutional Care approach: preliminary data from the implementation of a Centers for Medicare and Medicaid Services nursing facility demonstration project. J Am Geriatr Soc. 2015;63(1):165-169. PubMed
68. Meehan TP Sr, Qazi DJ, Van Hoof TJ, et al. Process evaluation of a quality improvement project to decrease hospital readmissions from skilled nursing facilities. J Am Med Dir Assoc. 2015;16(8):648-653. PubMed
69. Gillespie SM, Olsan T, Liebel D, et al. Pioneering a nursing home quality improvement learning collaborative: a case study of method and lessons learned. J Am Med Dir Assoc. 2016;17(2):136-141. PubMed
70. Auerbach AD, Kripalani S, Vasilevskis EE, et al. Preventability and causes of readmissions in a national cohort of general medicine patients. JAMA Intern Med. 2016;176(4):484-493. PubMed
71. Snow V, Beck D, Budnitz T, et al. Transitions of Care consensus policy statement: American College of Physicians, Society of General Internal Medicine, Society of Hospital Medicine, American Geriatrics Society, American College of Emergency Physicians, and Society for Academic Emergency Medicine. J Hosp Med. 2009;4(6):364-370. PubMed
72. Lett JE 2nd. AMDA national engagement in care transitions. J Am Med Dir Assoc. 2011;12(5):387. PubMed
73. Haley SM, Coster WJ, Andres PL, et al. Activity outcome measurement for postacute care. Med Care. 2004;42(1 suppl):I49-I61. PubMed
74. Jette DU, Stilphen M, Ranganathan VK, Passek SD, Frost FS, Jette AM. AM-PAC “6-Clicks” functional assessment scores predict acute care hospital discharge destination. Phys Ther. 2014;94(9):1252-1261. PubMed
75. Bowles KH, Ratcliffe SJ, Holmes JH, Liberatore M, Nydick R, Naylor MD. Post-acute referral decisions made by multidisciplinary experts compared to hospital clinicians and the patients’ 12-week outcomes. Med Care. 2008;46(2):158-166. PubMed
76. Kane RL, Bershadsky B, Bershadsky J. Who recommends long-term care matters. Gerontologist. 2006;46(4):474-482. PubMed
77. Wald HL, Glasheen JJ, Guerrasio J, Youngwerth JM, Cumbler EU. Evaluation of a hospitalist-run acute care for the elderly service. J Hosp Med. 2011;6(6):313-321. PubMed
78. Jones CD, Vu MB, O’Donnell CM, et al. A failure to communicate: a qualitative exploration of care coordination between hospitalists and primary care providers around patient hospitalizations. J Gen Intern Med. 2015;30(4):417-424. PubMed
79. Falvey JR, Burke RE, Malone D, Ridgeway KJ, McManus BM, Stevens-Lapsley JE. Role of physical therapists in reducing hospital readmissions: optimizing outcomes for older adults during care transitions from hospital to community. Phys Ther. 2016;96(8):1125-1134. PubMed
80. Levy CR, Fish R, Kramer A. Do-not-resuscitate and do-not-hospitalize directives of persons admitted to skilled nursing facilities under the Medicare benefit. J Am Geriatr Soc. 2005;53(12):2060-2068. PubMed
81. Boockvar KS, Fridman B, Marturano C. Ineffective communication of mental status information during care transfer of older adults. J Gen Intern Med. 2005;20(12):1146-1150. PubMed
82. Kiely DK, Bergmann MA, Murphy KM, Jones RN, Orav EJ, Marcantonio ER. Delirium among newly admitted postacute facility patients: prevalence, symptoms, and severity. J Gerontol A Biol Sci Med Sci. 2003;58(5):M441-M445. PubMed
83. Kind AJ, Thorpe CT, Sattin JA, Walz SE, Smith MA. Provider characteristics, clinical-work processes and their relationship to discharge summary quality for sub-acute care patients. J Gen Intern Med. 2012;27(1):78-84. PubMed
84. King BJ, Gilmore-Bykovskyi AL, Roiland RA, Polnaszek BE, Bowers BJ, Kind AJ. The consequences of poor communication during transitions from hospital to skilled nursing facility: a qualitative study. J Am Geriatr Soc. 2013;61(7):1095-1102. PubMed
85. Horwitz LI, Jenq GY, Brewster UC, et al. Comprehensive quality of discharge summaries at an academic medical center. J Hosp Med. 2013;8(8):436-443. PubMed
86. Tjia J, Bonner A, Briesacher BA, McGee S, Terrill E, Miller K. Medication discrepancies upon hospital to skilled nursing facility transitions. J Gen Intern Med. 2009;24(5):630-635. PubMed
87. Vogelsmeier A. Identifying medication order discrepancies during medication reconciliation: perceptions of nursing home leaders and staff. J Nurs Manag. 2014;22(3):362-372. PubMed
88. Boockvar K, Fishman E, Kyriacou CK, Monias A, Gavi S, Cortes T. Adverse events due to discontinuations in drug use and dose changes in patients transferred between acute and long-term care facilities. Arch Intern Med. 2004;164(5):545-550. PubMed
89. Sinvani LD, Beizer J, Akerman M, et al. Medication reconciliation in continuum of care transitions: a moving target. J Am Med Dir Assoc. 2013;14(9):668-672. PubMed
90. Scott IA, Hilmer SN, Reeve E, et al. Reducing inappropriate polypharmacy: the process of deprescribing. JAMA Intern Med. 2015;175(5):827-834. PubMed
91. Marcantonio ER, Bergmann MA, Kiely DK, Orav EJ, Jones RN. Randomized trial of a delirium abatement program for postacute skilled nursing facilities. J Am Geriatr Soc. 2010;58(6):1019-1026. PubMed
92. Callahan CM, Tu W, Unroe KT, LaMantia MA, Stump TE, Clark DO. Transitions in care in a nationally representative sample of older Americans with dementia. PubMed J Am Geriatr Soc. 2015;63(8):1495-1502.
93. Givens JL, Mitchell SL, Kuo S, Gozalo P, Mor V, Teno J. Skilled nursing facility admissions of nursing home residents with advanced dementia. J Am Geriatr Soc. 2013;61(10):1645-1650. PubMed
94. Gozalo P, Teno JM, Mitchell SL, et al. End-of-life transitions among nursing home residents with cognitive issues. N Engl J Med. 2011;365(13):1212-1221. PubMed
95. Ottenbacher KJ, Karmarkar A, Graham JE, et al. Thirty-day hospital readmission following discharge from postacute rehabilitation in fee-for-service Medicare patients. JAMA. 2014;311(6):604-614. PubMed
96. Konetzka RT, Grabowski DC, Perraillon MC, Werner RM. Nursing home 5-star rating system exacerbates disparities in quality, by payer source. Health Aff (Millwood). 2015;34(5):819-827. PubMed
97. Williams A, Straker JK, Applebaum R. The nursing home five star rating: how does it compare to resident and family views of care? Gerontologist. 2016;56(2):234-242. PubMed
98. Caplan GA, Meller A, Squires B, Chan S, Willett W. Advance care planning and hospital in the nursing home. Age Ageing. 2006;35(6):581-585. PubMed
99. Gade G, Venohr I, Conner D, et al. Impact of an inpatient palliative care team: a randomized control trial. J Palliat Med. 2008;11(2):180-190. PubMed
100. Gill TM, Gahbauer EA, Han L, Allore HG. The role of intervening hospital admissions on trajectories of disability in the last year of life: prospective cohort study of older people. BMJ. 2015;350:h2361. PubMed
101. Levy C, Morris M, Kramer A. Improving end-of-life outcomes in nursing homes by targeting residents at high-risk of mortality for palliative care: program description and evaluation. J Palliat Med. 2008;11(2):217-225. PubMed
102. Miller SC, Lima JC, Looze J, Mitchell SL. Dying in U.S. nursing homes with advanced dementia: how does health care use differ for residents with, versus without, end-of-life Medicare skilled nursing facility care? J Palliat Med. 2012;15(1): 43-50. PubMed
103. Halm EA, Magaziner J, Hannan EL, et al. Frequency and impact of active clinical issues and new impairments on hospital discharge in patients with hip fracture. Arch Intern Med. 2003;163(1):108-113. PubMed
104. Thomas KS, Mor V, Tyler DA, Hyer K. The relationships among licensed nurse turnover, retention, and rehospitalization of nursing home residents. Gerontologist. 2013;53(2):211-221. PubMed
The landscape of post–acute care (PAC), which is predominantly provided by inpatient rehabilitation facilities (IRFs), skilled nursing facilities (SNFs), and home healthcare (HHC) providers, is rapidly changing. As hospitalizations shorten, PAC utilization is rising, resulting in rapidly increasing costs.1-5 However, patient outcomes in PAC are characterized by high rates of readmission and low rates of return to the community.6,7 Emerging evidence suggests these outcomes could be substantially improved through use of better in-hospital and transitional care processes.8-10
Legislators took notice of the spiraling costs, potential quality concerns, and undesirable patient outcomes in PAC. Provisions in the Patient Protection and Affordable Care Act of 2010 (ACA), the Protecting Access to Medicare Act of 2014 (PAMA), and the Improving Medicare Post–Acute Care Transformation (IMPACT) Act of 2014 affect patient selection, payment, and quality measurement in PAC. As older adults are increasingly being cared for by hospitalists,11 hospitalists must be aware of the implications of these reforms.
IMPLICATIONS FOR HOSPITALISTS
Choosing Patients Wisely for PAC
Because PAC-related decision making is not standardized, referral rates vary significantly.12 The variability in PAC use accounts for 79% of all regional variation in Medicare spending in the United States.13,14 Compared with other physicians, hospitalists are more likely to use PAC15 but typically receive little exposure to PAC during training.16
The IMPACT Act proposes 2 major changes to patient selection: a uniform assessment tool for patients being discharged to PAC and “site-neutral” payments for PAC. Starting in 2018, the Continuity Assessment Record and Evaluation (CARE) tool must be completed before a hospital discharge in order to better match PAC resources to patient needs. The current 26-page CARE tool includes questions about demographics and home support, medical complexity, physical function, cognitive status, and “transition items,” including discharge plans and advance directives. In pilot testing, significant amounts of missing data and average completion times of up to 60 minutes raised concerns about feasibility.17 CARE tool assessments accurately predicted what form of PAC patients actually received, but further testing is planned to validate whether the type of PAC selected was optimal for patient outcomes.. A plan for using CARE tool assessments to determine site-neutral payments is due to Congress by 2020. In the site-neutral payment system, the PAC provider will be reimbursed according to patient needs (identified by the CARE tool), regardless of PAC setting—a radical change from the current system, in which IRF, SNF, and HHC episodes show major differences in median costs (Table 1).18
Hospitalists may be concerned that use of the CARE tool will supplant clinical judgment about patients’ PAC needs. The burden of completing the CARE tool could inadvertently reduce the amount of attention hospitalists give to other aspects of a safe discharge rather than lead to the improvement desired.19-21 Hospitalists will benefit from developing interdisciplinary, iterative workflows to complete the tool, improving accuracy and reducing the burden.
A potential unintended consequence of the site-neutral payment system may be increased difficulty discharging elderly patients who have limited rehabilitation potential but are lacking sufficient social support to return home. In the current system, these patients are commonly discharged to SNFs as a bridge to long-term nursing home care. Hospitalists will need to become increasingly familiar with novel alternatives to nursing home–based care, such as home-based primary care, medical foster homes, and Medicare/Medicaid’s Program of All-Inclusive Care of the Elderly (PACE).22-25
Choosing PAC Providers Wisely
Medicare’s Nursing Home Compare tool (https://www.medicare.gov/nursinghomecompare/search.html) provides a “5-star” system for rating SNFs on several quality metrics; these metrics, however, are not correlated with readmission or mortality rates.26,27 Improving quality measurement in PAC and tying payment to quality and outcomes are major emphases of the IMPACT Act and PAMA, respectively. PAC providers must publicly report an expanded list of quality measures and outcomes by 2018. In 2017, SNFs will begin reporting rates of “potentially preventable” readmissions, and starting in 2019 they will face penalties for having high risk-adjusted rates.
These reforms coincide with an increased emphasis on hospitals and PAC providers sharing responsibility for costs and outcomes. One model of the Bundled Payments for Care Improvement (BPCI) initiative includes a single payment for an acute hospitalization and PAC up to 90 days after hospital discharge for select conditions. The Medicare Spending Per Beneficiary (MSPB) measure compares hospitals on their spending for Medicare beneficiaries from 3 days before hospital admission to 30 days after hospital discharge, and penalizes outliers with high costs.28 PAC spending is the main driver of costs in both BPCI and MSPB.29 One way that hospitals have responded to the BPCI is by drastically reducing their referrals to SNFs and increasing their referrals to HHC providers; unfortunately, this response has resulted in increases in post-discharge emergency department visits.29,30 Taking a novel step in November 2015, the Centers for Medicare & Medicaid Services (CMS) ruled that hospitals in more than 67 metropolitan service areas will be involuntarily enrolled in the BPCI initiative, using elective lower extremity joint replacement as the sample condition.31 This ruling signaled that these reforms are not meant solely for “high-performing” hospital and PAC systems able to volunteer for novel models of payment.
These changes have direct implications for hospitalists. Bundled payments incentivize hospitalists to reduce hospital length of stay and choose PAC alternatives with lower costs. SNFs may start accepting fewer “high-risk” patients in order to avoid readmission penalties. Hospitals will need to identify and partner with high-performing PAC providers in their community to maximize outcomes for their patients. On their websites, the Society of Post-Acute and Long-Term Care Medicine (AMDA) lists its state chapters,32 and the National Association for Home Care & Hospice lists national HHC agencies.33 Reviewing early lessons learned in the evaluation of PAC providers as potential hospital partners in Pioneer accountable care organizations may be helpful,34 though the PAC cost savings in these organizations largely resulted from redirecting patients from SNFs to HHC providers.35,36 In many markets, the relationships between hospitals and PAC providers may become more formalized, leading to vertical integration.37 Hospitalists may increasingly be asked to work with, or even in, SNFs.38 For hospitalists who begin working in PAC, the AMDA is developing an educational curriculum to maximize efficacy in a new practice setting.39 In other markets, hospitals may turn to for-profit entities that provide “integrated post-acute care services,”40 taking over PAC decision making from inpatient teams and sharing any resulting profits from bundled payments.
OPPORTUNITIES FOR HOSPITALISTS
Improve Hospital and Transitional Care to Ensure Successful Early Outcomes in PAC
Payment reform ensures hospitalists will increasingly have a stake in these matters, as joint responsibility for costs and outcomes increases for patients discharged to PAC. Hospitalists play a major role in these outcomes by deciding when and where to discharge patients and ensuring that optimal transition-of-care processes are used.8-10,41-45 Although no single intervention has been prospectively found to improve hospital-to-PAC transitional care outcomes, areas in need of improvement are known. Table 2 lists these within 9 of the Ideal Transition of Care Framework domains.43,46
Advocate Patient-Centered PAC Placement That Maximizes Long-Term Outcomes
Payment reforms could reinforce the cynical view that the optimal PAC setting is the least costly one that avoids hospital readmission. This view does not incorporate evidence that, in some cases, placement in a more costly PAC setting results in better long-term outcomes (eg, community discharge rates).47,48 It is also incongruent with a holistic view of the patient’s needs, particularly for patients who may otherwise be suitable for home-based PAC but have limited social support.49 Finally, it does not acknowledge the reality that patients who are inadequately rehabilitated often transition to long-term nursing home care,50 which could result in significant cost-shifting from Medicare to Medicaid, the predominant payer for long-term care.51 Given the extraordinary cost of long-term nursing home care, attending only to short-term costs and outcomes could increase national healthcare expenditures.
With most PAC-related decisions being made in the hospital, hospitalists find themselves at the center of a care team that must advocate the PAC that is best for the patient over the long term. This endeavor requires that hospitalists and others work for improvements in at least 3 aspects of in-hospital care. First, systems for accurately and reliably identifying patient factors that could substantially affect ability to rehabilitate (eg delirium) must be developed or enhanced.52-54 Second, more formal evaluation of the ability of patients and their caregivers to succeed at home is needed.55-60 Patients and caregivers may not understand their home needs without first “testing” the experience prior to discharge.61 Third, hospitalists must understand PAC in order to provide safe transitions.16 It is logistically challenging to expose practicing hospitalists to PAC, and it is unclear which exposures are most effective in improving decision making.62 An alternative approach that provides hospitalists with feedback about the short- and long-term outcomes of patients they have discharged to PAC may iteratively improve decision making. However, despite the high rate of discharges to PAC, there are anecdotal reports that few hospitalists receive feedback on patient outcomes.
As these reforms are tested and implemented, advocacy at regional and national levels is needed. The American Geriatrics Society (AGS), the AMDA, and the American Academy of Home Care Medicine all have well-developed advocacy platforms hospitalists can access.63-65
Share Expertise to Improve Quality in a Constrained Environment
There are opportunities for synergy between robust quality improvement (QI) efforts in PAC (often as part of Quality Assurance and Performance Improvement programs) and similarly robust hospital QI efforts led by hospitalists.66-70 These efforts have largely occurred in parallel, but now some important bridging QI interventions (eg, collaborative root cause analyses for patients readmitted after PAC) are starting at some sites, and these may drive improvement across the care spectrum.45 The Society of Hospital Medicine, the AGS, and the AMDA have written White Papers on care transitions that may serve as starting points for discussion.41,71,72
CONCLUSION
PAC is rapidly changing in response to reform legislation that is intended to address poor outcomes and high costs. Hospitalists will increasingly feel the effects of these reforms in their day-to-day practices. To continue to deliver high-value care, hospitalists should review their in-hospital and transitional care practices and start building relationships with high-quality PAC providers in their community.
Disclosures: Dr. Burke was supported by a VA Health Services Research and Development Service career development award and by National Institute on Aging grant R03AG050885. The funders had no role in the design, conduct, interpretation, or presentation of the data. The other authors have nothing to report. The views represented here are those of the authors and do not necessarily represent the views of the Department of Veterans Affairs.
References
1. Kosecoff J, Kahn KL, Rogers WH, et al. Prospective payment system and impairment at discharge. The ‘quicker-and-sicker’ story revisited. JAMA. 1990;264(15):1980-1983. PubMed
2. Burke RE, Juarez-Colunga E, Levy C, Prochazka AV, Coleman EA, Ginde AA. Patient and hospitalization characteristics associated with increased postacute care facility discharges from US hospitals. Med Care. 2015;53(6):492-500. PubMed
3. Jones CD, Ginde AA, Burke RE, Wald HL, Masoudi FA, Boxer RS. Increasing home healthcare referrals upon discharge from U.S. hospitals: 2001-2012. J Am Geriatr Soc. 2015;63(6):1265-1266. PubMed
4. Burke RE, Juarez-Colunga E, Levy C, Prochazka AV, Coleman EA, Ginde AA. Rise of post-acute care facilities as a discharge destination of US hospitalizations. JAMA Intern Med. 2015;175(2):295-296. PubMed
5. Chandra A, Dalton MA, Holmes J. Large increases in spending on postacute care in Medicare point to the potential for cost savings in these settings. Health Aff (Millwood). 2013;32(5):864-872. PubMed
6. Mor V, Intrator O, Feng Z, Grabowski DC. The revolving door of rehospitalization from skilled nursing facilities. Health Aff (Millwood). 2010;29(1):57-64. PubMed
7. Kramer A, Fish R, Min S. Community Discharge and Rehospitalization Outcome Measures (Fiscal Year 2011): Final Report. Denver, CO: Providigm. http://67.59.137.244/documents/Apr13_CommunityDischarge_CONTRACTOR.pdf. Published April 15, 2013. Accessed March 24, 2016.
8. Burke RE, Whitfield EA, Hittle D, et al. Hospital readmission from post-acute care facilities: risk factors, timing, and outcomes. J Am Med Dir Assoc. 2016;17(3):249-255. PubMed
9. Levinson DR. Adverse Events in Skilled Nursing Facilities: National Incidence Among Medicare Beneficiaries. Washington, DC: Office of the Inspector General, US Dept of Health and Human Services. Report OEI-06-11-00370. http://oig.hhs.gov/oei/reports/oei-06-11-00370.pdf. Published February 2014. Accessed March 5, 2014.
10. Ouslander JG, Naharci I, Engstrom G, et al. Lessons learned from root cause analyses of transfers of skilled nursing facility (SNF) patients to acute hospitals: transfers rated as preventable versus nonpreventable by SNF staff. J Am Med Dir Assoc. 2016;17(7):596-601. PubMed
11. Kuo YF, Sharma G, Freeman JL, Goodwin JS. Growth in the care of older patients by hospitalists in the United States. N Engl J Med. 2009;360(11):1102-1112. PubMed
12. Kane RL. Finding the right level of posthospital care: “We didn’t realize there was any other option for him.” JAMA. 2011;305(3):284-293. PubMed
13. Newhouse JP, Garber AM. Geographic variation in health care spending in the United States: insights from an Institute of Medicine report. JAMA. 2013;310(12):1227-1228. PubMed
14. Kane RL, Lin WC, Blewett LA. Geographic variation in the use of post-acute care. Health Serv Res. 2002;37(3):667-682. PubMed
15. Kuo YF, Goodwin JS. Association of hospitalist care with medical utilization after discharge: evidence of cost shift from a cohort study. Ann Intern Med. 2011;155(3):152-159. PubMed
16. Ward KT, Eslami MS, Garcia MB, McCreath HE. Do internal medicine residents know enough about skilled nursing facilities to orchestrate a good care transition? J Am Med Dir Assoc. 2014;15(11):841-843. PubMed
17. Centers for Medicare & Medicaid Services. CARE Item Set and B-CARE. https://www.cms.gov/Medicare/Quality-Initiatives-Patient-Assessment-Instruments/Post-Acute-Care-Quality-Initiatives/CARE-Item-Set-and-B-CARE.html. Published January 13, 2015. Accessed November 2, 2015.
18. Medicare Payment Advisory Commission. Report to the Congress: Medicare Payment Policy. Washington, DC: Medicare Payment Advisory Commission. http://medpac.gov/docs/default-source/reports/mar2015_entirereport_revised.pdf. Published March 13, 2015. Accessed December 8, 2015.
19. Block L, Morgan-Gouveia M, Levine RB, Cayea D. We could have done a better job: a qualitative study of medical student reflections on safe hospital discharge. J Am Geriatr Soc. 2014;62(6):1147-1154. PubMed
20. Greysen SR, Schiliro D, Horwitz LI, Curry L, Bradley EH. “Out of sight, out of mind”: housestaff perceptions of quality-limiting factors in discharge care at teaching hospitals. J Hosp Med. 2012;7(5):376-381. PubMed
21. Halasyamani L, Kripalani S, Coleman E, et al. Transition of care for hospitalized elderly patients—development of a discharge checklist for hospitalists. J Hosp Med. 2006;1(6):354-360. PubMed
22. Hughes SL, Weaver FM, Giobbie-Hurder A, et al.; Department of Veterans Affairs Cooperative Study Group on Home-Based Primary Care. Effectiveness of team-managed home-based primary care: a randomized multicenter trial. JAMA. 2000;284(22):2877-2885. PubMed
23. Kinosian B, Taler G, Boling P, Gilden D; Independence at Home Learning Collaborative Writing Group. Projected savings and workforce transformation from converting Independence at Home to a Medicare benefit. J Am Geriatr Soc. 2016;64(8):1531-1536. PubMed
24. Segelman M, Szydlowski J, Kinosian B, et al. Hospitalizations in the Program of All-Inclusive Care for the Elderly. J Am Geriatr Soc. 2014;62(2):320-324. PubMed
25. Manheim CE, Haverhals LM, Jones J, Levy CR. Allowing family to be family: end-of-life care in Veterans Affairs medical foster homes. J Soc Work End Life Palliat Care. 2016;12(1-2):104-125. PubMed
26. Neuman MD, Wirtalla C, Werner RM. Association between skilled nursing facility quality indicators and hospital readmissions. JAMA. 2014;312(15):1542-1551. PubMed
27. Unroe KT, Greiner MA, Colón-Emeric C, Peterson ED, Curtis LH. Associations between published quality ratings of skilled nursing facilities and outcomes of Medicare beneficiaries with heart failure. J Am Med Dir Assoc. 2012;13(2): 188.e1-e6. PubMed
28. Schumacher DN, Dobkin ED. Medicare spending per beneficiary. Health Aff (Millwood). 2014;33(10):1878. PubMed
29. Das A, Norton EC, Miller DC, Chen LM. Association of postdischarge spending and performance on new episode-based spending measure. JAMA Intern Med. 2016;176(1):117-119. PubMed
30. Jubelt LE, Goldfeld KS, Chung WY, Blecker SB, Horwitz LI. Changes in discharge location and readmission rates under Medicare bundled payment. JAMA Intern Med. 2016;176(1):115-117. PubMed
31. Federal Register: Medicare Program; Comprehensive Care for Joint Replacement Payment Model for Acute Care Hospitals Furnishing Lower Extremity Joint Replacement Services. https://www.gpo.gov/fdsys/pkg/FR-2015-11-24/pdf/2015-29438.pdf. Accessed June 20, 2016.
32. Society for Post-Acute and Long-Term Care Medicine. State chapters; AMDA state chapter network. http://www.paltc.org/state-chapters. Accessed June 6, 2016.
33. National Association for Home Care & Hospice. National agency location service. https://agencylocator.nahc.org. Accessed June 6, 2016.
34. Lage DE, Rusinak D, Carr D, Grabowski DC, Ackerly DC. Creating a network of high-quality skilled nursing facilities: preliminary data on the postacute care quality improvement experiences of an accountable care organization. J Am Geriatr Soc. 2015;63(4):804-808. PubMed
35. Nyweide DJ, Lee W, Cuerdon TT, et al. Association of Pioneer accountable care organizations vs traditional Medicare fee for service with spending, utilization, and patient experience. JAMA. 2015;313(21):2152-2161. PubMed
36. McWilliams JM, Chernew ME, Landon BE, Schwartz AL. Performance differences in year 1 of Pioneer accountable care organizations. N Engl J Med. 2015;372(20):1927-1936. PubMed
37. Afendulis CC, Kessler DP. Vertical integration and optimal reimbursement policy. Int J Health Care Finance Econ. 2011;11(3):165-179. PubMed
38. IPC Healthcare. Post-acute care services. http://www.ipchealthcare.com/advantage/post-acute-care. Accessed January 11, 2016.
39. Society for Post-Acute and Long-Term Care Medicine. Competencies curriculum for post-acute and long-term care medicine. http://www.paltc.org/competencies-curriculum-post-acute-and-long-term-care-medicine. Accessed May 26, 2016.
40. NaviHealth. Leading the way in a rapidly changing PAC marketplace. http://www.navihealth.us/home/solutions/services. Accessed January 11, 2016.
41. Arbaje AI, Kansagara DL, Salanitro AH, et al. Regardless of age: incorporating principles from geriatric medicine to improve care transitions for patients with complex needs. J Gen Intern Med. 2014;29(6):932-939. PubMed
42. Schoenborn NL, Arbaje AI, Eubank KJ, Maynor K, Carrese JA. Clinician roles and responsibilities during care transitions of older adults. J Am Geriatr Soc. 2013;61(2):231-236. PubMed
43. Burke RE, Kripalani S, Vasilevskis EE, Schnipper JL. Moving beyond readmission penalties: creating an ideal process to improve transitional care. J Hosp Med. 2013;8(2):102-109. PubMed
44. Kripalani S, Jackson AT, Schnipper JL, Coleman EA. Promoting effective transitions of care at hospital discharge: a review of key issues for hospitalists. J Hosp Med. 2007;2(5):314-323. PubMed
45. Ouslander JG, Naharci I, Engstrom G, et al. Root cause analyses of transfers of skilled nursing facility patients to acute hospitals: lessons learned for reducing unnecessary hospitalizations. J Am Med Dir Assoc. 2016;17(3):256-262. PubMed
46. Burke RE, Guo R, Prochazka AV, Misky GJ. Identifying keys to success in reducing readmissions using the ideal transitions in care framework. BMC Health Serv Res. 2014;14:423. PubMed
47. Kane RL, Chen Q, Finch M, Blewett L, Burns R, Moskowitz M. Functional outcomes of posthospital care for stroke and hip fracture patients under Medicare. J Am Geriatr Soc. 1998;46(12):1525-1533. PubMed
48. Kane RL, Chen Q, Finch M, Blewett L, Burns R, Moskowitz M. The optimal outcomes of post-hospital care under Medicare. Health Serv Res. 2000;35(3):615-661. PubMed
49. Greysen SR, Harrison JD, Kripalani S, et al. Understanding patient-centred readmission factors: a multi-site, mixed-methods study [published online January 14, 2016]. BMJ Qual Saf. doi:10.1136/bmjqs-2015-004570. PubMed
50. Goodwin JS, Howrey B, Zhang DD, Kuo YF. Risk of continued institutionalization after hospitalization in older adults. J Gerontol A Biol Sci Med Sci. 2011;66(12):1321-1327. PubMed
51. Reaves EL, Musumeci M. Medicaid and Long-Term Services and Supports: A Primer. Washington, DC: Kaiser Commission on Medicaid and the Uninsured. Report 8617-02. Henry J. Kaiser Family Foundation website. http://files.kff.org/attachment/report-medicaid-and-long-term-services-and-supports-a-primer. Published December 15, 2015. Accessed May 18, 2016.
52. Bell SP, Vasilevskis EE, Saraf AA, et al. Geriatric syndromes in hospitalized older adults discharged to skilled nursing facilities. J Am Geriatr Soc. 2016;64(4): 715-722. PubMed
53. Cawthon C, Mion LC, Willens DE, Roumie CL, Kripalani S. Implementing routine health literacy assessment in hospital and primary care patients. Jt Comm J Qual Patient Saf. 2014;40(2):68-76. PubMed
54. Greysen SR, Stijacic Cenzer I, Auerbach AD, Covinsky KE. Functional impairment and hospital readmission in Medicare seniors. JAMA Intern Med. 2015;175(4):559-565. PubMed
55. Coleman EA, Roman SP. Family caregivers’ experiences during transitions out of hospital. J Healthc Qual. 2015;37(1):12-21. PubMed
56. Coleman EA, Min SJ. Patients’ and family caregivers’ goals for care during transitions out of the hospital. Home Health Care Serv Q. 2015;34(3-4):173-184. PubMed
57. Coleman EA, Smith JD, Frank JC, Min SJ, Parry C, Kramer AM. Preparing patients and caregivers to participate in care delivered across settings: the Care Transitions Intervention. J Am Geriatr Soc. 2004;52(11):1817-1825. PubMed
58. Coleman EA, Ground KL, Maul A. The Family Caregiver Activation in Transitions (FCAT) tool: a new measure of family caregiver self-efficacy. Jt Comm J Qual Patient Saf. 2015;41(11):502-507. PubMed
59. Cain CH, Neuwirth E, Bellows J, Zuber C, Green J. Patient experiences of transitioning from hospital to home: an ethnographic quality improvement project. PubMed J Hosp Med. 2012;7(5):382-387.
60. Burke RE, Jones J, Ho PM, Bekelman DB. Caregivers’ perceived roles in caring for patients with heart failure: what do clinicians need to know? J Card Fail. 2014;20(10):731-738. PubMed
61. Coleman EA. Extending simulation learning experiences to patients with chronic health conditions. JAMA. 2014;311(3):243-244. PubMed
62. Meade LB, Hall SL, Kleppel RW, Hinchey KT. TRACER: an ‘eye-opener’ to the patient experience across the transition of care in an internal medicine resident program. J Community Hosp Intern Med Perspect. 2015;5(2):26230. PubMed
63. American Geriatrics Society. Public policy & advocacy. http://www.americangeriatrics.org/advocacy_public_policy. Accessed May 26, 2016.
64. Society for Post-Acute and Long-Term Care Medicine. Public policy. http://www.paltc.org/public-policy. Accessed May 26, 2016.
65. American Academy of Home Care Medicine. Public policy. http://www.aahcm.org/?page=Public_Policy. Accessed May 26, 2016.
66. Hansen LO, Greenwald JL, Budnitz T, et al. Project BOOST: effectiveness of a multihospital effort to reduce rehospitalization. J Hosp Med. 2013;8(8):421-427. PubMed
67. Unroe KT, Nazir A, Holtz LR, et al. The Optimizing Patient Transfers, Impacting Medical Quality, and Improving Symptoms: Transforming Institutional Care approach: preliminary data from the implementation of a Centers for Medicare and Medicaid Services nursing facility demonstration project. J Am Geriatr Soc. 2015;63(1):165-169. PubMed
68. Meehan TP Sr, Qazi DJ, Van Hoof TJ, et al. Process evaluation of a quality improvement project to decrease hospital readmissions from skilled nursing facilities. J Am Med Dir Assoc. 2015;16(8):648-653. PubMed
69. Gillespie SM, Olsan T, Liebel D, et al. Pioneering a nursing home quality improvement learning collaborative: a case study of method and lessons learned. J Am Med Dir Assoc. 2016;17(2):136-141. PubMed
70. Auerbach AD, Kripalani S, Vasilevskis EE, et al. Preventability and causes of readmissions in a national cohort of general medicine patients. JAMA Intern Med. 2016;176(4):484-493. PubMed
71. Snow V, Beck D, Budnitz T, et al. Transitions of Care consensus policy statement: American College of Physicians, Society of General Internal Medicine, Society of Hospital Medicine, American Geriatrics Society, American College of Emergency Physicians, and Society for Academic Emergency Medicine. J Hosp Med. 2009;4(6):364-370. PubMed
72. Lett JE 2nd. AMDA national engagement in care transitions. J Am Med Dir Assoc. 2011;12(5):387. PubMed
73. Haley SM, Coster WJ, Andres PL, et al. Activity outcome measurement for postacute care. Med Care. 2004;42(1 suppl):I49-I61. PubMed
74. Jette DU, Stilphen M, Ranganathan VK, Passek SD, Frost FS, Jette AM. AM-PAC “6-Clicks” functional assessment scores predict acute care hospital discharge destination. Phys Ther. 2014;94(9):1252-1261. PubMed
75. Bowles KH, Ratcliffe SJ, Holmes JH, Liberatore M, Nydick R, Naylor MD. Post-acute referral decisions made by multidisciplinary experts compared to hospital clinicians and the patients’ 12-week outcomes. Med Care. 2008;46(2):158-166. PubMed
76. Kane RL, Bershadsky B, Bershadsky J. Who recommends long-term care matters. Gerontologist. 2006;46(4):474-482. PubMed
77. Wald HL, Glasheen JJ, Guerrasio J, Youngwerth JM, Cumbler EU. Evaluation of a hospitalist-run acute care for the elderly service. J Hosp Med. 2011;6(6):313-321. PubMed
78. Jones CD, Vu MB, O’Donnell CM, et al. A failure to communicate: a qualitative exploration of care coordination between hospitalists and primary care providers around patient hospitalizations. J Gen Intern Med. 2015;30(4):417-424. PubMed
79. Falvey JR, Burke RE, Malone D, Ridgeway KJ, McManus BM, Stevens-Lapsley JE. Role of physical therapists in reducing hospital readmissions: optimizing outcomes for older adults during care transitions from hospital to community. Phys Ther. 2016;96(8):1125-1134. PubMed
80. Levy CR, Fish R, Kramer A. Do-not-resuscitate and do-not-hospitalize directives of persons admitted to skilled nursing facilities under the Medicare benefit. J Am Geriatr Soc. 2005;53(12):2060-2068. PubMed
81. Boockvar KS, Fridman B, Marturano C. Ineffective communication of mental status information during care transfer of older adults. J Gen Intern Med. 2005;20(12):1146-1150. PubMed
82. Kiely DK, Bergmann MA, Murphy KM, Jones RN, Orav EJ, Marcantonio ER. Delirium among newly admitted postacute facility patients: prevalence, symptoms, and severity. J Gerontol A Biol Sci Med Sci. 2003;58(5):M441-M445. PubMed
83. Kind AJ, Thorpe CT, Sattin JA, Walz SE, Smith MA. Provider characteristics, clinical-work processes and their relationship to discharge summary quality for sub-acute care patients. J Gen Intern Med. 2012;27(1):78-84. PubMed
84. King BJ, Gilmore-Bykovskyi AL, Roiland RA, Polnaszek BE, Bowers BJ, Kind AJ. The consequences of poor communication during transitions from hospital to skilled nursing facility: a qualitative study. J Am Geriatr Soc. 2013;61(7):1095-1102. PubMed
85. Horwitz LI, Jenq GY, Brewster UC, et al. Comprehensive quality of discharge summaries at an academic medical center. J Hosp Med. 2013;8(8):436-443. PubMed
86. Tjia J, Bonner A, Briesacher BA, McGee S, Terrill E, Miller K. Medication discrepancies upon hospital to skilled nursing facility transitions. J Gen Intern Med. 2009;24(5):630-635. PubMed
87. Vogelsmeier A. Identifying medication order discrepancies during medication reconciliation: perceptions of nursing home leaders and staff. J Nurs Manag. 2014;22(3):362-372. PubMed
88. Boockvar K, Fishman E, Kyriacou CK, Monias A, Gavi S, Cortes T. Adverse events due to discontinuations in drug use and dose changes in patients transferred between acute and long-term care facilities. Arch Intern Med. 2004;164(5):545-550. PubMed
89. Sinvani LD, Beizer J, Akerman M, et al. Medication reconciliation in continuum of care transitions: a moving target. J Am Med Dir Assoc. 2013;14(9):668-672. PubMed
90. Scott IA, Hilmer SN, Reeve E, et al. Reducing inappropriate polypharmacy: the process of deprescribing. JAMA Intern Med. 2015;175(5):827-834. PubMed
91. Marcantonio ER, Bergmann MA, Kiely DK, Orav EJ, Jones RN. Randomized trial of a delirium abatement program for postacute skilled nursing facilities. J Am Geriatr Soc. 2010;58(6):1019-1026. PubMed
92. Callahan CM, Tu W, Unroe KT, LaMantia MA, Stump TE, Clark DO. Transitions in care in a nationally representative sample of older Americans with dementia. PubMed J Am Geriatr Soc. 2015;63(8):1495-1502.
93. Givens JL, Mitchell SL, Kuo S, Gozalo P, Mor V, Teno J. Skilled nursing facility admissions of nursing home residents with advanced dementia. J Am Geriatr Soc. 2013;61(10):1645-1650. PubMed
94. Gozalo P, Teno JM, Mitchell SL, et al. End-of-life transitions among nursing home residents with cognitive issues. N Engl J Med. 2011;365(13):1212-1221. PubMed
95. Ottenbacher KJ, Karmarkar A, Graham JE, et al. Thirty-day hospital readmission following discharge from postacute rehabilitation in fee-for-service Medicare patients. JAMA. 2014;311(6):604-614. PubMed
96. Konetzka RT, Grabowski DC, Perraillon MC, Werner RM. Nursing home 5-star rating system exacerbates disparities in quality, by payer source. Health Aff (Millwood). 2015;34(5):819-827. PubMed
97. Williams A, Straker JK, Applebaum R. The nursing home five star rating: how does it compare to resident and family views of care? Gerontologist. 2016;56(2):234-242. PubMed
98. Caplan GA, Meller A, Squires B, Chan S, Willett W. Advance care planning and hospital in the nursing home. Age Ageing. 2006;35(6):581-585. PubMed
99. Gade G, Venohr I, Conner D, et al. Impact of an inpatient palliative care team: a randomized control trial. J Palliat Med. 2008;11(2):180-190. PubMed
100. Gill TM, Gahbauer EA, Han L, Allore HG. The role of intervening hospital admissions on trajectories of disability in the last year of life: prospective cohort study of older people. BMJ. 2015;350:h2361. PubMed
101. Levy C, Morris M, Kramer A. Improving end-of-life outcomes in nursing homes by targeting residents at high-risk of mortality for palliative care: program description and evaluation. J Palliat Med. 2008;11(2):217-225. PubMed
102. Miller SC, Lima JC, Looze J, Mitchell SL. Dying in U.S. nursing homes with advanced dementia: how does health care use differ for residents with, versus without, end-of-life Medicare skilled nursing facility care? J Palliat Med. 2012;15(1): 43-50. PubMed
103. Halm EA, Magaziner J, Hannan EL, et al. Frequency and impact of active clinical issues and new impairments on hospital discharge in patients with hip fracture. Arch Intern Med. 2003;163(1):108-113. PubMed
104. Thomas KS, Mor V, Tyler DA, Hyer K. The relationships among licensed nurse turnover, retention, and rehospitalization of nursing home residents. Gerontologist. 2013;53(2):211-221. PubMed
Address for correspondence and reprint requests: Robert E. Burke, MD, MS, Research and Hospital Medicine Sections, Denver VA Medical Center, 1055 Clermont St, Denver, CO 80220; Telephone: 303-399-8020 extension 2396; Fax: 303-393-5199; E-mail: [email protected]
Content Gating
Open Access (article Unlocked/Open Access)
Alternative CME
Consolidated Pubs: Do Not Show Source Publication Logo
Patients leave the hospital against medical advice (AMA) for a variety of reasons. The AMA rate is approximately 1% nationally but substantially higher at safety-net hospitals and has rapidly increased over the past decade.1-5 The principle that patients have the right to make choices about their healthcare, up to and including whether to leave the hospital against the advice of medical staff, is well-established law and a foundation of medical ethics.6 In practice, however, AMA discharges are often emotionally charged for both patients and providers, and, in the high-stress setting of AMA discharge, providers may be confused about their roles.7-9
The demographics of patients who leave AMA have been well described. Compared with conventionally discharged patients, AMA patients are younger, more likely to be male, and more likely a marginalized ethnic or racial minority.10-14 Patients with mental illnesses and addiction issues are overrepresented in AMA discharges, and complicated capacity assessments and limited resources may strain providers.7,8,15,16 Studies have repeatedly shown higher rates of readmission and mortality for AMA patients than for conventionally discharged patients.17-21 Whether AMA discharge is a marker for other prognostic factors that bode poorly for patients or contributes to negative outcomes, data suggest this group of patients is vulnerable, having mortality rates up to 40% higher 1 year after discharge, relative to conventionally discharged patients.12
Several models of standardized best practice approaches for AMA have been proposed by bioethicists.6,22,23 Although details of these approaches vary, all involve assessing the patient’s decision-making capacity, clarifying the risks of AMA discharge, addressing factors that might be prompting the discharge, formulating an alternative outpatient treatment plan or “next best” option, and documenting extensively. A recent study found patients often gave advance warning of an AMA discharge, but physicians rarely prepared by arranging follow-up care.8 The investigators hypothesized that providers might not have known what they were permitted to arrange for AMA patients, or might have thought that providing “second best” options went against their principles. The investigators noted that nurses might have become aware of AMA risk sooner than physicians did but could not act on this awareness by preparing medications and arranging follow-up.
Translating models of best practice care for AMA patients into clinical practice requires buy-in from bedside providers, not just bioethicists. Given the study findings that providers have misconceptions about their roles in the AMA discharge,7 it is prudent to investigate providers’ current practices, beliefs, and concerns about AMA discharges before introducing a new approach.
The present authors conducted a mixed-methods cross-sectional study of the state of AMA discharges at Highland Hospital (Oakland, California), a 236-bed county hospital and trauma center serving a primarily underserved urban patient population. The aim of this study was to assess current provider practices for AMA discharges and provider perceptions and knowledge about AMA discharges, ultimately to help direct future educational interventions with medical providers or hospital policy changes needed to improve the quality of AMA discharges.
METHODS
Phase 1 of this study involved identifying AMA patients through a review of data from Highland Hospital’s electronic medical records for 2014. These data included discharge status (eg, AMA vs other discharge types). The hospital’s floor clerk distinguishes between absent without official leave (AWOL; the patient leaves without notifying a provider) and AMA discharge. Discharges designated AWOL were excluded from the analyses.
In phase 2, a structured chart review (Appendix A) was performed for all patients identified during phase 1 as being discharged AMA in 2014. In these reviews, further assessment was made of patient and visit characteristics in hospitalizations that ended in AMA discharge, and of providers’ documentation of AMA discharges—that is, whether several factors were documented (capacity; predischarge indication that patient might leave AMA; reason for AMA; and indications that discharge medications, transportation, and follow-up were arranged). These visit factors were reviewed because the literature has identified them as being important markers for AMA discharge safety.6,8 Two research assistants, under the guidance of Dr. Stearns, reviewed the charts. To ensure agreement across chart reviews with respect to subjective questions (eg, whether capacity was adequately documented), the group reviewed the first 10 consecutive charts together; there was full agreement on how to classify the data of interest. Throughout the study, whenever a research assistant asked how to classify particular patient data, Dr. Stearns reviewed the data, and the research team made a decision together. Additional data, for AMA patients and for all patients admitted to Highland Hospital, were obtained from the hospital’s data warehouse, which pools data from within the health system.
Phase 3 involved surveying healthcare providers who were involved in patient care on the internal medicine and trauma surgery services at the hospital. These providers were selected because chart review revealed that the vast majority of patients who left AMA in 2014 were on one of these services. Surveys (Appendix B) asked participant providers to identify their role at the hospital, to provide a self-assessment of competence in various aspects of AMA discharge, to voice opinions about provider responsibilities in arranging follow-up for AMA patients, and to make suggestions about the AMA process. The authors designed these surveys, which included questions about aspects of care that have been highlighted in the AMA discharge literature as being important for AMA discharge safety.6,8,22,23 Surveys were distributed to providers at internal medicine and trauma surgery department meetings and nursing conferences. Data (without identifying information) were analyzed, and survey responses kept anonymous.
The Alameda Health System Institutional Review Board approved this project. Providers were given the option of writing their name and contact information at the top of the survey in order to be entered into a drawing to receive a prize for completion.
We performed statistical analyses of the patient charts and physician survey data using Stata (version 14.0, Stata Corp., College Station, Texas). We analyzed both patient- and encounter-level data. In demographic analyses, this approach prevented duplicate counting of patients who left AMA multiple times. Patient-level analyses compared the demographic characteristics of AMA patients and patients discharged conventionally from the hospital in 2014. In addition, patients with either 1 or multiple AMA discharges were compared to identify characteristics that might be linked to highest risk of recurrent AMA discharge in the hope that early identification of these patients might facilitate providers’ early awareness and preparation for follow-up care or hospitalization alternatives. We used ANOVAs for continuous variables and tests of proportions for categorical variables. On the encounter level, analyses examined data about each admission (eg, AMA forms signed, follow-up arrangements made, capacity documented, etc.) for all AMA discharges. We employed chi square tests to identify variations in healthcare provider survey responses. A P value < 0.05 was used as the significance cut-off point.
Staged logistic regression analyses, adjusted for demographic characteristics, were performed to assess the association between risk of leaving AMA (yes or no) and demographic characteristics and the association between risk of leaving AMA more than once (yes or no) and health-related characteristics.
RESULTS
Demographic, Clinical, and Utilization Characteristics
Of the 12,036 Highland Hospital admissions in 2014, 319 (2.7%) ended with an AMA discharge. Of the 8207 individual patients discharged, 268 left AMA once, and 29 left AMA multiple times. Further review of the Admissions, Discharges, and Transfers Report generated from the electronic medical record revealed that 15 AWOL discharges were misclassified as AMA discharges.
Compared with patients discharged conventionally, AMA patients were significantly younger; more likely to be male, to self-identify as Black/African American, and to be English-speaking; and less likely to self-identify as Asian/Pacific Islander or Hispanic/Latino or to be Chinese- or Spanish-speaking (Table 1). They were also more likely than all patients admitted to Highland to be homeless (15.7% vs 8.7%; P < 0.01). Multivariate regression analysis revealed persistent age and sex disparities, but racial disparities were mitigated in adjusted analyses (Appendix C). Language disparities persisted only for Spanish speakers, who had a significantly lower rate of AMA discharge, even in adjusted analyses.
Table 1
The majority of AMA patients were on the internal medicine service (63.5%) or the trauma surgery service (24.8%). Regarding admission diagnosis, 17.2% of AMA patients were admitted for infections, 5.0% for drug or alcohol intoxication or withdrawal, 38.9% for acute noninfectious illnesses, 16.7% for decompensation of chronic disease, 18.4% for injuries or trauma, and 3.8% for pregnancy complications or labor. Compared with patients who left AMA once, patients who left AMA multiple times had higher rates of heavy alcohol use (53.9% vs 30.9%; P = 0.01) and illicit drug use (88.5% vs 53.7%; P < 0.001) (Table 2). In multivariate analyses, the increased odds of leaving AMA more than once persisted for current heavy illicit drug users compared with patients who had never engaged in illicit drug use.
Table 2
Discharge Characteristics and Documentation
Providers documented a patient’s plan to leave AMA before actual discharge 17.3% of the time. The documented plan to leave had to indicate that the patient was actually considering leaving. For example, “Patient is eager to go home” was not enough to qualify as a plan, but “Patient is thinking of leaving” qualified. For 84.3% of AMA discharges, the hospital’s AMA form was signed and was included in the medical record. Documentation showed that medications were prescribed for AMA patients 21.4% of the time, follow-up was arranged 25.7% of the time, and follow-up was pending arrangement 14.8% of the time. The majority of AMA patients (71.4%) left during daytime hours. In 29.6% of AMA discharges, providers documented AMA patients had decision-making capacity.
Readmission After AMA Discharge
Of the 268 AMA patients, 67.7% were not readmitted within the 6 months after AMA, 24.5% had 1 or 2 readmissions, and the rest had 3 or more readmissions (1 patient had 15). In addition, 35.8% returned to the emergency department within 30 days, and 16.4% were readmitted within 30 days. In 2014, the hospital’s overall 30-day readmission rate was 10.8%. Of the patients readmitted within 6 months after AMA, 23.5% left AMA again at the next visit, 9.4% left AWOL, and 67.1% were discharged conventionally.
Drivers of Premature Discharge
Qualitative analysis of the 35.5% of patient charts documenting a reason for leaving the hospital revealed 3 broad, interrelated themes (Figure 1). The first theme, dissatisfaction with hospital care, included chart notations such as “His wife couldn’t sleep in the hospital room” and “Not satisfied with all-liquid diet.” The second theme, urgent personal issues, included comments such as “He has a very important court date for his children” and “He needed to take care of immigration forms.” The third theme, mental health and substance abuse issues, included notations such as “He wants to go smoke” and “Severe anxiety and prison flashbacks.”
Figure 1
Provider Self-Assessment and Beliefs
The survey was completed by 178 healthcare providers: 49.4% registered nurses, 19.1% trainee physicians, 20.8% attending physicians, and 10.7% other providers, including chaplains, social workers, and clerks. Regarding self-assessment of competency in AMA discharges, 94% of providers agreed they were comfortable assessing capacity, and 94% agreed they were comfortable talking with patients about the risks of leaving AMA (Figure 2). Nurses were more likely than trainee physicians to agree they knew what to do for patients who lacked capacity (74% vs 49%; P = 0.02). Most providers (70%) agreed they usually knew why their patients were leaving AMA; in this self-assessment, there were no significant differences between types of providers.
Figure 2
Regarding follow-up, attending physicians and trainee physicians demonstrated more agreement than nurses that AMA patients should receive medications and follow-up (94% and 84% vs 64%; P < 0.05). Nurses were more likely than attending physicians to say patients should lose their rights to hospital follow-up because of leaving AMA (38% vs 6%; P < 0.01). A minority of providers (37%) agreed transportation should be arranged. Addiction was the most common driver of AMA discharge (35%), followed by familial obligations (19%), dissatisfaction with hospital care (16%), and financial concerns (15%).
DISCUSSION
The demographic characteristics of AMA patients in this study are similar to those identified in other studies, showing overrepresentation of young male patients.12,14 Homeless patients were also overrepresented in the AMA discharge population at Highland Hospital—a finding that has not been consistently reported in prior studies, and that warrants further examination. In adjusted analyses, Spanish speakers had a lower rate of AMA discharge, and there were no racial variations. This is consistent with another study’s finding: that racial disparities in AMA discharge rates were largely attributable to confounders.24 Language differences may result from failure of staff to fully explain the option of AMA discharge to non-English speakers, or from fear of immigration consequences after AMA discharge. Further investigation of patient experiences is needed to identify factors that contribute to demographic variations in AMA discharge rates.25,26
Of the patients who left AMA multiple times, nearly all were actively using illicit drugs. In a recent study conducted at a safety-net hospital in Vancouver, Canada, 43% of patients with illicit drug use and at least 1 hospitalization left AMA at least once during the 6-year study period.11 Many factors might explain this correlation—addiction itself, poor pain control for patients with addiction issues, fears about incarceration, and poor treatment of drug users by healthcare staff.15 Although the medical literature highlights deficits in pain control for patients addicted to opiates, proposed solutions are sparse and focus on perioperative pain control and physician prescribing practices.27,28 At safety-net hospitals in which addiction is a factor in many hospitalizations, there is opportunity for new research in inpatient pain control for patients with substance dependence. In addition, harm reduction strategies—such as methadone maintenance for hospitalized patients with opiate dependence and abscess clinics as hospitalization alternatives for injection-associated infection treatment—may be key in improving safety for patients.11,15,29
Comparing the provider survey and chart review results highlights discordance between provider beliefs and clinical practice. Healthcare providers at Highland Hospital considered themselves competent in assessing capacity and talking with patients about the risks of AMA discharge. In practice, however, capacity was documented in less than a third of AMA discharges. Although the majority of providers thought medications and follow-up should be arranged for patients, arrangements were seldom made. This may be partially attributable to limited resources for making these arrangements. Average time to “third next available” primary care appointment within the county health system that includes Highland was 44.6 days for established patients during the period of study; for new primary care patients, the average wait for an appointment was 2 to 3 months. Highland has a same-day clinic, but inpatient providers are discouraged from using it as a postdischarge clinic for patients who would be better served in primary care. Medications and transportation are easily arranged during daytime hours but are not immediately available at night. In addition, some of this discrepancy may be attributable to the limited documentation rather than to provider failure to achieve their own benchmarks of quality care for AMA patients.
Documentation in AMA discharges is key for multiple reasons. Most AMA patients in this study signed an AMA form, and it could be that the rate of documenting decision-making capacity was low because providers thought a signed AMA form was adequate documentation of capacity and informed consent. In numerous court cases, however, these forms were found to be insufficient evidence of informed consent (lacking other supportive documentation) and possibly to go against the public good.30 In addition, high rates of repeat emergency department visits and readmissions for AMA patients, demonstrated here and in other studies, highlight the importance of careful documentation in informing subsequent providers about hospital returnees’ ongoing issues.17-19
This study also demonstrated differences between nurses and physicians in their beliefs about arranging follow-up for AMA patients. Nurses were less likely than physicians to think follow-up arrangements should be made for AMA patients and more likely to say these patients should lose the right to follow-up because of the AMA discharge. For conventional discharges, nurses provide patients with significantly more discharge education than interns or hospitalists do.31 This discrepancy highlights an urgent need for the education and involvement of nurses as stakeholders in the challenging AMA discharge process. Although the percentage of physicians who thought they were not obligated to provide medications and arrange follow-up for AMA patients was lower than the percentage of nurses, these beliefs contradict best practice guidelines for AMA discharges,22,23 and this finding calls attention to the need for interventions to improve adherence to professional and ethical guidelines in this aspect of clinical practice.
Providers showed a lack of familiarity with practice guidelines regarding certain aspects of the AMA discharge process. For example, most providers thought they should not have to arrange transportation for AMA patients, even though both the California Hospital Association Guidelines and the Highland Hospital internalpolicy on AMA discharges recommend arranging appropriate transportation.32 This finding suggests a need for educational interventions to ensure providers are informed about state and hospital policies, and a need to include both physicians and nurses in policymaking so theory can be tied to practice.
This study was limited to a single center with healthcare provider and patient populations that might not be generalizable to other settings. In the retrospective chart review, the authors were limited to information documented in the medical record, which might not accurately reflect the AMA discharge process. As they surveyed a limited number of social workers, case managers, and others who play an important role in the AMA discharge process, their data may lack varying viewpoints.
Overall, these data suggest providers at this county hospital generally agreed in principle with the best practice guidelines proposed by bioethicists for AMA discharges. In practice, however, providers were not reliably following these guidelines. Future interventions—including provider education on best practice guidelines for AMA discharge, provider involvement in policymaking, supportive templates for guiding documentation of AMA discharges, and improving access to follow-up care—will be key in improving the safety and health outcomes of AMA patients.
Acknowledgments
The authors thank Kelly Aguilar, Kethia Chheng, Irene Yen, and the Research Advancement and Coordination Initiative at Alameda Health System for important contributions to this project.
Disclosures
Highland Hospital Department of Medicine internal grant 2015.23 helped fund this research. A portion of the data was presented as a poster at the University of California San Francisco Health Disparities Symposium; October 2015; San Francisco, CA. Two posters from the data were presented at Hospital Medicine 2016, March 2016; San Diego, CA.
1. Southern WN, Nahvi S, Arnsten JH. Increased risk of mortality and readmission among patients discharged against medical advice. Am J Med. 2012;125(6):594-602. PubMed
2. Stranges E, Wier L, Merrill C, Steiner C. Hospitalizations in which Patients Leave the Hospital against Medical Advice (AMA), 2007. HCUP Statistical Brief #78. August 2009. Agency for Healthcare Research and Quality, Rockville, MD. http://www.hcup-us.ahrq.gov/reports/statbriefs/sb78.pdf. Accessed November 30, 2016. PubMed
3. Devitt PJ, Devitt AC, Dewan M. Does identifying a discharge as “against medical advice” confer legal protection? J Fam Pract. 2000;49(3):224-227. PubMed
4. O’Hara D, Hart W, McDonald I. Leaving hospital against medical advice. J Qual Clin Pract. 1996;16(3):157-164. PubMed
5. Ibrahim SA, Kwoh CK, Krishnan E. Factors associated with patients who leave acute-care hospitals against medical advice. Am J Public Health. 2007;97(12):2204-2208. PubMed
6. Clark MA, Abbott JT, Adyanthaya T. Ethics seminars: a best-practice approach to navigating the against-medical-advice discharge. Acad Emerg Med. 2014;21(9):1050-1057. PubMed
7. Windish DM, Ratanawongsa N. Providers’ perceptions of relationships and professional roles when caring for patients who leave the hospital against medical advice. J Gen Intern Med. 2008;23(10):1698-1707. PubMed
8. Edwards J, Markert R, Bricker D. Discharge against medical advice: how often do we intervene? J Hosp Med. 2013;8(10):574-577. PubMed
9. Alfandre DJ. “I’m going home”: discharges against medical advice. Mayo Clin Proc. 2009;84(3):255-260. PubMed
10. Katzenellenbogen JM, Sanfilippo FM, Hobbs MS, et al. Voting with their feet—predictors of discharge against medical advice in Aboriginal and non-Aboriginal ischaemic heart disease inpatients in Western Australia: an analytic study using data linkage. BMC Health Serv Res. 2013;13:330. PubMed
11. Ti L, Milloy MJ, Buxton J, et al. Factors associated with leaving hospital against medical advice among people who use illicit drugs in Vancouver, Canada. PLoS One. 2015;10(10):e0141594. PubMed
12. Yong TY, Fok JS, Hakendorf P, Ben-Tovim D, Thompson CH, Li JY. Characteristics and outcomes of discharges against medical advice among hospitalised patients. Intern Med J. 2013;43(7):798-802. PubMed
13. Tabatabaei SM, Sargazi Moakhar Z, Behmanesh Pour F, Shaare Mollashahi S, Zaboli M. Hospitalized pregnant women who leave against medical advice: attributes and reasons. Matern Child Health J. 2016;20(1):128-138. PubMed
14. Aliyu ZY. Discharge against medical advice: sociodemographic, clinical and financial perspectives. Int J Clin Pract. 2002;56(5):325-327. PubMed
15. Ti L, Ti L. Leaving the hospital against medical advice among people who use illicit drugs: a systematic review. Am J Public Health. 2015;105(12):e53-e59. PubMed
16. Targum SD, Capodanno AE, Hoffman HA, Foudraine C. An intervention to reduce the rate of hospital discharges against medical advice. Am J Psychiatry. 1982;139(5):657-659. PubMed
17. Choi M, Kim H, Qian H, Palepu A. Readmission rates of patients discharged against medical advice: a matched cohort study. PLoS One. 2011;6(9):e24459. PubMed
18. Glasgow JM, Vaughn-Sarrazin M, Kaboli PJ. Leaving against medical advice (AMA): risk of 30-day mortality and hospital readmission. J Gen Intern Med. 2010;25(9):926-929. PubMed
19. Garland A, Ramsey CD, Fransoo R, et al. Rates of readmission and death associated with leaving hospital against medical advice: a population-based study. CMAJ. 2013;185(14):1207-1214. PubMed
20. Hwang SW, Li J, Gupta R, Chien V, Martin RE. What happens to patients who leave hospital against medical advice? CMAJ. 2003;168(4):417-420. PubMed
21. Onukwugha E, Mullins CD, Loh FE, Saunders E, Shaya FT, Weir MR. Readmissions after unauthorized discharges in the cardiovascular setting. Med Care. 2011;49(2):215-224. PubMed
22. Alfandre D. Reconsidering against medical advice discharges: embracing patient-centeredness to promote high quality care and a renewed research agenda. J Gen Intern Med. 2013;28(12):1657-1662. PubMed
23. Berger JT. Discharge against medical advice: ethical considerations and professional obligations. J Hosp Med. 2008;3(5):403-408. PubMed
24. Franks P, Meldrum S, Fiscella K. Discharges against medical advice: are race/ethnicity predictors? J Gen Intern Med. 2006;21(9):955-960. PubMed
25. Hicks LS, Ayanian JZ, Orav EJ, et al. Is hospital service associated with racial and ethnic disparities in experiences with hospital care? Am J Med. 2005;118(5):529-535. PubMed
26. Hicks LS, Tovar DA, Orav EJ, Johnson PA. Experiences with hospital care: perspectives of black and Hispanic patients. J Gen Intern Med. 2008;23(8):1234-1240. PubMed
27. McCreaddie M, Lyons I, Watt D, et al. Routines and rituals: a grounded theory of the pain management of drug users in acute care settings. J Clin Nurs. 2010;19(19-20):2730-2740. PubMed
28. Carroll IR, Angst MS, Clark JD. Management of perioperative pain in patients chronically consuming opioids. Reg Anesth Pain Med. 2004;29(6):576-591. PubMed
29. Chan AC, Palepu A, Guh DP, et al. HIV-positive injection drug users who leave the hospital against medical advice: the mitigating role of methadone and social support. J Acquir Immune Defic Syndr. 2004;35(1):56-59. PubMed
30. Levy F, Mareiniss DP, Iacovelli C. The importance of a proper against-medical-advice (AMA) discharge: how signing out AMA may create significant liability protection for providers. J Emerg Med. 2012;43(3):516-520. PubMed
31. Ashbrook L, Mourad M, Sehgal N. Communicating discharge instructions to patients: a survey of nurse, intern, and hospitalist practices. J Hosp Med. 2013;8(1):36-41. PubMed
32. Joint Commission on Accreditation of Healthcare Organizations. Title 22, California Code of Regulations, §70707.3.
Patients leave the hospital against medical advice (AMA) for a variety of reasons. The AMA rate is approximately 1% nationally but substantially higher at safety-net hospitals and has rapidly increased over the past decade.1-5 The principle that patients have the right to make choices about their healthcare, up to and including whether to leave the hospital against the advice of medical staff, is well-established law and a foundation of medical ethics.6 In practice, however, AMA discharges are often emotionally charged for both patients and providers, and, in the high-stress setting of AMA discharge, providers may be confused about their roles.7-9
The demographics of patients who leave AMA have been well described. Compared with conventionally discharged patients, AMA patients are younger, more likely to be male, and more likely a marginalized ethnic or racial minority.10-14 Patients with mental illnesses and addiction issues are overrepresented in AMA discharges, and complicated capacity assessments and limited resources may strain providers.7,8,15,16 Studies have repeatedly shown higher rates of readmission and mortality for AMA patients than for conventionally discharged patients.17-21 Whether AMA discharge is a marker for other prognostic factors that bode poorly for patients or contributes to negative outcomes, data suggest this group of patients is vulnerable, having mortality rates up to 40% higher 1 year after discharge, relative to conventionally discharged patients.12
Several models of standardized best practice approaches for AMA have been proposed by bioethicists.6,22,23 Although details of these approaches vary, all involve assessing the patient’s decision-making capacity, clarifying the risks of AMA discharge, addressing factors that might be prompting the discharge, formulating an alternative outpatient treatment plan or “next best” option, and documenting extensively. A recent study found patients often gave advance warning of an AMA discharge, but physicians rarely prepared by arranging follow-up care.8 The investigators hypothesized that providers might not have known what they were permitted to arrange for AMA patients, or might have thought that providing “second best” options went against their principles. The investigators noted that nurses might have become aware of AMA risk sooner than physicians did but could not act on this awareness by preparing medications and arranging follow-up.
Translating models of best practice care for AMA patients into clinical practice requires buy-in from bedside providers, not just bioethicists. Given the study findings that providers have misconceptions about their roles in the AMA discharge,7 it is prudent to investigate providers’ current practices, beliefs, and concerns about AMA discharges before introducing a new approach.
The present authors conducted a mixed-methods cross-sectional study of the state of AMA discharges at Highland Hospital (Oakland, California), a 236-bed county hospital and trauma center serving a primarily underserved urban patient population. The aim of this study was to assess current provider practices for AMA discharges and provider perceptions and knowledge about AMA discharges, ultimately to help direct future educational interventions with medical providers or hospital policy changes needed to improve the quality of AMA discharges.
METHODS
Phase 1 of this study involved identifying AMA patients through a review of data from Highland Hospital’s electronic medical records for 2014. These data included discharge status (eg, AMA vs other discharge types). The hospital’s floor clerk distinguishes between absent without official leave (AWOL; the patient leaves without notifying a provider) and AMA discharge. Discharges designated AWOL were excluded from the analyses.
In phase 2, a structured chart review (Appendix A) was performed for all patients identified during phase 1 as being discharged AMA in 2014. In these reviews, further assessment was made of patient and visit characteristics in hospitalizations that ended in AMA discharge, and of providers’ documentation of AMA discharges—that is, whether several factors were documented (capacity; predischarge indication that patient might leave AMA; reason for AMA; and indications that discharge medications, transportation, and follow-up were arranged). These visit factors were reviewed because the literature has identified them as being important markers for AMA discharge safety.6,8 Two research assistants, under the guidance of Dr. Stearns, reviewed the charts. To ensure agreement across chart reviews with respect to subjective questions (eg, whether capacity was adequately documented), the group reviewed the first 10 consecutive charts together; there was full agreement on how to classify the data of interest. Throughout the study, whenever a research assistant asked how to classify particular patient data, Dr. Stearns reviewed the data, and the research team made a decision together. Additional data, for AMA patients and for all patients admitted to Highland Hospital, were obtained from the hospital’s data warehouse, which pools data from within the health system.
Phase 3 involved surveying healthcare providers who were involved in patient care on the internal medicine and trauma surgery services at the hospital. These providers were selected because chart review revealed that the vast majority of patients who left AMA in 2014 were on one of these services. Surveys (Appendix B) asked participant providers to identify their role at the hospital, to provide a self-assessment of competence in various aspects of AMA discharge, to voice opinions about provider responsibilities in arranging follow-up for AMA patients, and to make suggestions about the AMA process. The authors designed these surveys, which included questions about aspects of care that have been highlighted in the AMA discharge literature as being important for AMA discharge safety.6,8,22,23 Surveys were distributed to providers at internal medicine and trauma surgery department meetings and nursing conferences. Data (without identifying information) were analyzed, and survey responses kept anonymous.
The Alameda Health System Institutional Review Board approved this project. Providers were given the option of writing their name and contact information at the top of the survey in order to be entered into a drawing to receive a prize for completion.
We performed statistical analyses of the patient charts and physician survey data using Stata (version 14.0, Stata Corp., College Station, Texas). We analyzed both patient- and encounter-level data. In demographic analyses, this approach prevented duplicate counting of patients who left AMA multiple times. Patient-level analyses compared the demographic characteristics of AMA patients and patients discharged conventionally from the hospital in 2014. In addition, patients with either 1 or multiple AMA discharges were compared to identify characteristics that might be linked to highest risk of recurrent AMA discharge in the hope that early identification of these patients might facilitate providers’ early awareness and preparation for follow-up care or hospitalization alternatives. We used ANOVAs for continuous variables and tests of proportions for categorical variables. On the encounter level, analyses examined data about each admission (eg, AMA forms signed, follow-up arrangements made, capacity documented, etc.) for all AMA discharges. We employed chi square tests to identify variations in healthcare provider survey responses. A P value < 0.05 was used as the significance cut-off point.
Staged logistic regression analyses, adjusted for demographic characteristics, were performed to assess the association between risk of leaving AMA (yes or no) and demographic characteristics and the association between risk of leaving AMA more than once (yes or no) and health-related characteristics.
RESULTS
Demographic, Clinical, and Utilization Characteristics
Of the 12,036 Highland Hospital admissions in 2014, 319 (2.7%) ended with an AMA discharge. Of the 8207 individual patients discharged, 268 left AMA once, and 29 left AMA multiple times. Further review of the Admissions, Discharges, and Transfers Report generated from the electronic medical record revealed that 15 AWOL discharges were misclassified as AMA discharges.
Compared with patients discharged conventionally, AMA patients were significantly younger; more likely to be male, to self-identify as Black/African American, and to be English-speaking; and less likely to self-identify as Asian/Pacific Islander or Hispanic/Latino or to be Chinese- or Spanish-speaking (Table 1). They were also more likely than all patients admitted to Highland to be homeless (15.7% vs 8.7%; P < 0.01). Multivariate regression analysis revealed persistent age and sex disparities, but racial disparities were mitigated in adjusted analyses (Appendix C). Language disparities persisted only for Spanish speakers, who had a significantly lower rate of AMA discharge, even in adjusted analyses.
Table 1
The majority of AMA patients were on the internal medicine service (63.5%) or the trauma surgery service (24.8%). Regarding admission diagnosis, 17.2% of AMA patients were admitted for infections, 5.0% for drug or alcohol intoxication or withdrawal, 38.9% for acute noninfectious illnesses, 16.7% for decompensation of chronic disease, 18.4% for injuries or trauma, and 3.8% for pregnancy complications or labor. Compared with patients who left AMA once, patients who left AMA multiple times had higher rates of heavy alcohol use (53.9% vs 30.9%; P = 0.01) and illicit drug use (88.5% vs 53.7%; P < 0.001) (Table 2). In multivariate analyses, the increased odds of leaving AMA more than once persisted for current heavy illicit drug users compared with patients who had never engaged in illicit drug use.
Table 2
Discharge Characteristics and Documentation
Providers documented a patient’s plan to leave AMA before actual discharge 17.3% of the time. The documented plan to leave had to indicate that the patient was actually considering leaving. For example, “Patient is eager to go home” was not enough to qualify as a plan, but “Patient is thinking of leaving” qualified. For 84.3% of AMA discharges, the hospital’s AMA form was signed and was included in the medical record. Documentation showed that medications were prescribed for AMA patients 21.4% of the time, follow-up was arranged 25.7% of the time, and follow-up was pending arrangement 14.8% of the time. The majority of AMA patients (71.4%) left during daytime hours. In 29.6% of AMA discharges, providers documented AMA patients had decision-making capacity.
Readmission After AMA Discharge
Of the 268 AMA patients, 67.7% were not readmitted within the 6 months after AMA, 24.5% had 1 or 2 readmissions, and the rest had 3 or more readmissions (1 patient had 15). In addition, 35.8% returned to the emergency department within 30 days, and 16.4% were readmitted within 30 days. In 2014, the hospital’s overall 30-day readmission rate was 10.8%. Of the patients readmitted within 6 months after AMA, 23.5% left AMA again at the next visit, 9.4% left AWOL, and 67.1% were discharged conventionally.
Drivers of Premature Discharge
Qualitative analysis of the 35.5% of patient charts documenting a reason for leaving the hospital revealed 3 broad, interrelated themes (Figure 1). The first theme, dissatisfaction with hospital care, included chart notations such as “His wife couldn’t sleep in the hospital room” and “Not satisfied with all-liquid diet.” The second theme, urgent personal issues, included comments such as “He has a very important court date for his children” and “He needed to take care of immigration forms.” The third theme, mental health and substance abuse issues, included notations such as “He wants to go smoke” and “Severe anxiety and prison flashbacks.”
Figure 1
Provider Self-Assessment and Beliefs
The survey was completed by 178 healthcare providers: 49.4% registered nurses, 19.1% trainee physicians, 20.8% attending physicians, and 10.7% other providers, including chaplains, social workers, and clerks. Regarding self-assessment of competency in AMA discharges, 94% of providers agreed they were comfortable assessing capacity, and 94% agreed they were comfortable talking with patients about the risks of leaving AMA (Figure 2). Nurses were more likely than trainee physicians to agree they knew what to do for patients who lacked capacity (74% vs 49%; P = 0.02). Most providers (70%) agreed they usually knew why their patients were leaving AMA; in this self-assessment, there were no significant differences between types of providers.
Figure 2
Regarding follow-up, attending physicians and trainee physicians demonstrated more agreement than nurses that AMA patients should receive medications and follow-up (94% and 84% vs 64%; P < 0.05). Nurses were more likely than attending physicians to say patients should lose their rights to hospital follow-up because of leaving AMA (38% vs 6%; P < 0.01). A minority of providers (37%) agreed transportation should be arranged. Addiction was the most common driver of AMA discharge (35%), followed by familial obligations (19%), dissatisfaction with hospital care (16%), and financial concerns (15%).
DISCUSSION
The demographic characteristics of AMA patients in this study are similar to those identified in other studies, showing overrepresentation of young male patients.12,14 Homeless patients were also overrepresented in the AMA discharge population at Highland Hospital—a finding that has not been consistently reported in prior studies, and that warrants further examination. In adjusted analyses, Spanish speakers had a lower rate of AMA discharge, and there were no racial variations. This is consistent with another study’s finding: that racial disparities in AMA discharge rates were largely attributable to confounders.24 Language differences may result from failure of staff to fully explain the option of AMA discharge to non-English speakers, or from fear of immigration consequences after AMA discharge. Further investigation of patient experiences is needed to identify factors that contribute to demographic variations in AMA discharge rates.25,26
Of the patients who left AMA multiple times, nearly all were actively using illicit drugs. In a recent study conducted at a safety-net hospital in Vancouver, Canada, 43% of patients with illicit drug use and at least 1 hospitalization left AMA at least once during the 6-year study period.11 Many factors might explain this correlation—addiction itself, poor pain control for patients with addiction issues, fears about incarceration, and poor treatment of drug users by healthcare staff.15 Although the medical literature highlights deficits in pain control for patients addicted to opiates, proposed solutions are sparse and focus on perioperative pain control and physician prescribing practices.27,28 At safety-net hospitals in which addiction is a factor in many hospitalizations, there is opportunity for new research in inpatient pain control for patients with substance dependence. In addition, harm reduction strategies—such as methadone maintenance for hospitalized patients with opiate dependence and abscess clinics as hospitalization alternatives for injection-associated infection treatment—may be key in improving safety for patients.11,15,29
Comparing the provider survey and chart review results highlights discordance between provider beliefs and clinical practice. Healthcare providers at Highland Hospital considered themselves competent in assessing capacity and talking with patients about the risks of AMA discharge. In practice, however, capacity was documented in less than a third of AMA discharges. Although the majority of providers thought medications and follow-up should be arranged for patients, arrangements were seldom made. This may be partially attributable to limited resources for making these arrangements. Average time to “third next available” primary care appointment within the county health system that includes Highland was 44.6 days for established patients during the period of study; for new primary care patients, the average wait for an appointment was 2 to 3 months. Highland has a same-day clinic, but inpatient providers are discouraged from using it as a postdischarge clinic for patients who would be better served in primary care. Medications and transportation are easily arranged during daytime hours but are not immediately available at night. In addition, some of this discrepancy may be attributable to the limited documentation rather than to provider failure to achieve their own benchmarks of quality care for AMA patients.
Documentation in AMA discharges is key for multiple reasons. Most AMA patients in this study signed an AMA form, and it could be that the rate of documenting decision-making capacity was low because providers thought a signed AMA form was adequate documentation of capacity and informed consent. In numerous court cases, however, these forms were found to be insufficient evidence of informed consent (lacking other supportive documentation) and possibly to go against the public good.30 In addition, high rates of repeat emergency department visits and readmissions for AMA patients, demonstrated here and in other studies, highlight the importance of careful documentation in informing subsequent providers about hospital returnees’ ongoing issues.17-19
This study also demonstrated differences between nurses and physicians in their beliefs about arranging follow-up for AMA patients. Nurses were less likely than physicians to think follow-up arrangements should be made for AMA patients and more likely to say these patients should lose the right to follow-up because of the AMA discharge. For conventional discharges, nurses provide patients with significantly more discharge education than interns or hospitalists do.31 This discrepancy highlights an urgent need for the education and involvement of nurses as stakeholders in the challenging AMA discharge process. Although the percentage of physicians who thought they were not obligated to provide medications and arrange follow-up for AMA patients was lower than the percentage of nurses, these beliefs contradict best practice guidelines for AMA discharges,22,23 and this finding calls attention to the need for interventions to improve adherence to professional and ethical guidelines in this aspect of clinical practice.
Providers showed a lack of familiarity with practice guidelines regarding certain aspects of the AMA discharge process. For example, most providers thought they should not have to arrange transportation for AMA patients, even though both the California Hospital Association Guidelines and the Highland Hospital internalpolicy on AMA discharges recommend arranging appropriate transportation.32 This finding suggests a need for educational interventions to ensure providers are informed about state and hospital policies, and a need to include both physicians and nurses in policymaking so theory can be tied to practice.
This study was limited to a single center with healthcare provider and patient populations that might not be generalizable to other settings. In the retrospective chart review, the authors were limited to information documented in the medical record, which might not accurately reflect the AMA discharge process. As they surveyed a limited number of social workers, case managers, and others who play an important role in the AMA discharge process, their data may lack varying viewpoints.
Overall, these data suggest providers at this county hospital generally agreed in principle with the best practice guidelines proposed by bioethicists for AMA discharges. In practice, however, providers were not reliably following these guidelines. Future interventions—including provider education on best practice guidelines for AMA discharge, provider involvement in policymaking, supportive templates for guiding documentation of AMA discharges, and improving access to follow-up care—will be key in improving the safety and health outcomes of AMA patients.
Acknowledgments
The authors thank Kelly Aguilar, Kethia Chheng, Irene Yen, and the Research Advancement and Coordination Initiative at Alameda Health System for important contributions to this project.
Disclosures
Highland Hospital Department of Medicine internal grant 2015.23 helped fund this research. A portion of the data was presented as a poster at the University of California San Francisco Health Disparities Symposium; October 2015; San Francisco, CA. Two posters from the data were presented at Hospital Medicine 2016, March 2016; San Diego, CA.
References
1. Southern WN, Nahvi S, Arnsten JH. Increased risk of mortality and readmission among patients discharged against medical advice. Am J Med. 2012;125(6):594-602. PubMed
2. Stranges E, Wier L, Merrill C, Steiner C. Hospitalizations in which Patients Leave the Hospital against Medical Advice (AMA), 2007. HCUP Statistical Brief #78. August 2009. Agency for Healthcare Research and Quality, Rockville, MD. http://www.hcup-us.ahrq.gov/reports/statbriefs/sb78.pdf. Accessed November 30, 2016. PubMed
3. Devitt PJ, Devitt AC, Dewan M. Does identifying a discharge as “against medical advice” confer legal protection? J Fam Pract. 2000;49(3):224-227. PubMed
4. O’Hara D, Hart W, McDonald I. Leaving hospital against medical advice. J Qual Clin Pract. 1996;16(3):157-164. PubMed
5. Ibrahim SA, Kwoh CK, Krishnan E. Factors associated with patients who leave acute-care hospitals against medical advice. Am J Public Health. 2007;97(12):2204-2208. PubMed
6. Clark MA, Abbott JT, Adyanthaya T. Ethics seminars: a best-practice approach to navigating the against-medical-advice discharge. Acad Emerg Med. 2014;21(9):1050-1057. PubMed
7. Windish DM, Ratanawongsa N. Providers’ perceptions of relationships and professional roles when caring for patients who leave the hospital against medical advice. J Gen Intern Med. 2008;23(10):1698-1707. PubMed
8. Edwards J, Markert R, Bricker D. Discharge against medical advice: how often do we intervene? J Hosp Med. 2013;8(10):574-577. PubMed
9. Alfandre DJ. “I’m going home”: discharges against medical advice. Mayo Clin Proc. 2009;84(3):255-260. PubMed
10. Katzenellenbogen JM, Sanfilippo FM, Hobbs MS, et al. Voting with their feet—predictors of discharge against medical advice in Aboriginal and non-Aboriginal ischaemic heart disease inpatients in Western Australia: an analytic study using data linkage. BMC Health Serv Res. 2013;13:330. PubMed
11. Ti L, Milloy MJ, Buxton J, et al. Factors associated with leaving hospital against medical advice among people who use illicit drugs in Vancouver, Canada. PLoS One. 2015;10(10):e0141594. PubMed
12. Yong TY, Fok JS, Hakendorf P, Ben-Tovim D, Thompson CH, Li JY. Characteristics and outcomes of discharges against medical advice among hospitalised patients. Intern Med J. 2013;43(7):798-802. PubMed
13. Tabatabaei SM, Sargazi Moakhar Z, Behmanesh Pour F, Shaare Mollashahi S, Zaboli M. Hospitalized pregnant women who leave against medical advice: attributes and reasons. Matern Child Health J. 2016;20(1):128-138. PubMed
14. Aliyu ZY. Discharge against medical advice: sociodemographic, clinical and financial perspectives. Int J Clin Pract. 2002;56(5):325-327. PubMed
15. Ti L, Ti L. Leaving the hospital against medical advice among people who use illicit drugs: a systematic review. Am J Public Health. 2015;105(12):e53-e59. PubMed
16. Targum SD, Capodanno AE, Hoffman HA, Foudraine C. An intervention to reduce the rate of hospital discharges against medical advice. Am J Psychiatry. 1982;139(5):657-659. PubMed
17. Choi M, Kim H, Qian H, Palepu A. Readmission rates of patients discharged against medical advice: a matched cohort study. PLoS One. 2011;6(9):e24459. PubMed
18. Glasgow JM, Vaughn-Sarrazin M, Kaboli PJ. Leaving against medical advice (AMA): risk of 30-day mortality and hospital readmission. J Gen Intern Med. 2010;25(9):926-929. PubMed
19. Garland A, Ramsey CD, Fransoo R, et al. Rates of readmission and death associated with leaving hospital against medical advice: a population-based study. CMAJ. 2013;185(14):1207-1214. PubMed
20. Hwang SW, Li J, Gupta R, Chien V, Martin RE. What happens to patients who leave hospital against medical advice? CMAJ. 2003;168(4):417-420. PubMed
21. Onukwugha E, Mullins CD, Loh FE, Saunders E, Shaya FT, Weir MR. Readmissions after unauthorized discharges in the cardiovascular setting. Med Care. 2011;49(2):215-224. PubMed
22. Alfandre D. Reconsidering against medical advice discharges: embracing patient-centeredness to promote high quality care and a renewed research agenda. J Gen Intern Med. 2013;28(12):1657-1662. PubMed
23. Berger JT. Discharge against medical advice: ethical considerations and professional obligations. J Hosp Med. 2008;3(5):403-408. PubMed
24. Franks P, Meldrum S, Fiscella K. Discharges against medical advice: are race/ethnicity predictors? J Gen Intern Med. 2006;21(9):955-960. PubMed
25. Hicks LS, Ayanian JZ, Orav EJ, et al. Is hospital service associated with racial and ethnic disparities in experiences with hospital care? Am J Med. 2005;118(5):529-535. PubMed
26. Hicks LS, Tovar DA, Orav EJ, Johnson PA. Experiences with hospital care: perspectives of black and Hispanic patients. J Gen Intern Med. 2008;23(8):1234-1240. PubMed
27. McCreaddie M, Lyons I, Watt D, et al. Routines and rituals: a grounded theory of the pain management of drug users in acute care settings. J Clin Nurs. 2010;19(19-20):2730-2740. PubMed
28. Carroll IR, Angst MS, Clark JD. Management of perioperative pain in patients chronically consuming opioids. Reg Anesth Pain Med. 2004;29(6):576-591. PubMed
29. Chan AC, Palepu A, Guh DP, et al. HIV-positive injection drug users who leave the hospital against medical advice: the mitigating role of methadone and social support. J Acquir Immune Defic Syndr. 2004;35(1):56-59. PubMed
30. Levy F, Mareiniss DP, Iacovelli C. The importance of a proper against-medical-advice (AMA) discharge: how signing out AMA may create significant liability protection for providers. J Emerg Med. 2012;43(3):516-520. PubMed
31. Ashbrook L, Mourad M, Sehgal N. Communicating discharge instructions to patients: a survey of nurse, intern, and hospitalist practices. J Hosp Med. 2013;8(1):36-41. PubMed
32. Joint Commission on Accreditation of Healthcare Organizations. Title 22, California Code of Regulations, §70707.3.
Address for correspondence and reprint requests: Cordelia R. Stearns, MD, Department of Medicine, Highland Hospital, 1411 E 31st St, A2, Oakland, CA 94602; Telephone: 510-437-4763; Fax: 510-437-5134; E-mail: [email protected]
Content Gating
Gated (full article locked unless allowed per User)
Central line-associated bloodstream infections (CLABSIs) are common and serious occurrences across healthcare systems, with an attributable mortality of 12% to 25%.1,2 Given this burden,3–5 CLABSI is a focus for both high-profile public reporting and quality improvement interventions. An integral component of such interventions is audit and feedback via quality metrics. These measures are intended to allow decision makers to assess their own performance and appropriately allocate resources. Quality metrics present a substantial cost to health systems, with an estimated $15.4 billion dollars spent annually simply for reporting.6 Despite this toll, “audit and feedback” interventions have proven to be variably successful.7–9 The mechanisms that limit the effectiveness of these interventions remain poorly understood.
One plausible explanation for limited efficacy of quality metrics is inadequate clinician numeracy—that is, “the ability to understand the quantitative aspects of clinical medicine, original research, quality improvement, and financial matters.”10 Indeed, clinicians are not consistently able to interpret probabilities and or clinical test characteristics. For example, Wegwarth et al. identified shortcomings in physician application of lead-time bias toward cancer screening.11 Additionally, studies have demonstrated systematic misinterpretations of probabilistic information in clinical settings, along with misconceptions regarding the impact of prevalence on post-test probabilities.12,13 Effective interpretation of rates may be a key—if unstated—requirement of many CLABSI quality improvement efforts.14–19 Our broader hypothesis is that clinicians who can more accurately interpret quality data, even if only from their own institution, are more likely to act on it appropriately and persistently than those who feel they must depend on a preprocessed interpretation of that same data by some other expert.
Therefore, we designed a survey to assess the numeracy of clinicians on CLABSI data presented in a prototypical feedback report. We studied 3 domains of comprehension: (1) basic numeracy: numerical tasks related to simple data; (2) risk-adjustment numeracy: numerical tasks related to risk-adjusted data; and (3) risk-adjustment interpretation: inferential tasks concerning risk-adjusted data. We hypothesized that clinician performance would vary substantially across domains, with the poorest performance in risk- adjusted data.
METHODS
We conducted a cross-sectional survey of clinician numeracy regarding CLABSI feedback data. Respondents were also asked to provide demographic information and opinions regarding the reliability of quality metric data. Survey recruitment occurred on Twitter, a novel approach that leveraged social media to facilitate rapid recruitment of participants. The study instrument was administered using a web survey with randomized question order to preclude any possibility of order effects between questions. The study was deemed Institutional Review Board exempt by the University of Michigan: protocol HUM00106696.
Data Presentation Method
To determine the optimal mode of presenting data, we reviewed the literature on quality metric numeracy and presentation methods. Additionally, we evaluated quality metric presentation methods used by the Centers for Disease Control and Prevention (CDC), Centers for Medicare & Medicaid Services (CMS), and a tertiary academic medical center. After assessing the available literature and options, we adapted a CLABSI data presentation array from a study that had qualitatively validated the format using physician feedback (Appendix).20 We used hypothetical CLABSI data for our survey.
Survey Development
We developed a survey that included an 11-item test regarding CLABSI numeracy and data interpretation. Additional questions related to quality metric reliability and demographic information were included. No preexisting assessment tools existed for our areas of interest. Therefore, we developed a novel instrument using a broad, exploratory approach as others have employed.21
First, we defined 3 conceptual categories related to CLABSI data. Within this conceptual framework, an iterative process of development and revision was used to assemble a question bank from which the survey would be constructed. A series of think-aloud sessions were held to evaluate each prompt for precision, clarity, and accuracy in assessing the conceptual categories. Correct and incorrect answers were defined based on literature review in conjunction with input from methodological and content experts (TJI and VC) (see Appendix for answer explanations).
Within the conceptual categories related to CLABSI risk-adjustment, a key measure is the standardized infection ratio (SIR). This value is defined as the ratio of observed number of CLABSI over the expected number of CLABSIs.22 This is the primary measure to stratify hospital performance, and it was used in our assessment of risk-adjustment comprehension. In total, 54 question prompts were developed and subsequently narrowed to 11 study questions for the initial survey.
The instrument was then pretested in a cohort of 8 hospitalists and intensivists to ensure appropriate comprehension, retrieval, and judgment processes.23 Questions were revised based on feedback from this cognitive testing to constitute the final instrument. During the survey, the data table was reshown on each page directly above each question and so was always on the same screen for the respondents.
Survey Sample
We innovated by using Twitter as an online platform for recruiting participants; we used Survey Monkey to host the electronic instrument. Two authors (TJI, VC) systematically sent out solicitation tweets to their followers. These tweets clearly indicated that the recruitment was for the purpose of a research study, and participants would receive no financial reward/incentive (Appendix). A link to the survey was provided in each tweet, and the period of recruitment was 30 days. To ensure respondents were clinicians, they needed to first answer a screening question recognizing that central lines were placed in the subclavian site but not the aorta, iliac, or radial sites.
To prevent systematic or anchoring biases, the order of questions was electronically randomized for each respondent. The primary outcome was the percentage correct of attempted questions.
Statistical Analysis
Descriptive statistics were calculated for all demographic variables. The primary outcome was evaluated as a dichotomous variable for each question (correct vs. incorrect response), and as a continuous variable when assessing mean percent correct on the overall survey. Demographic and conceptual associations were assessed via t-tests, chi-square, or Fisher exact tests. Point biserial correlations were calculated to assess for associations between response to a single question and overall performance on the survey.
To evaluate the association between various respondent characteristics and responses, logistic regression analyses were performed. An ANOVA was performed to assess the association between self-reported reliability of quality metric data and the overall performance on attempted items. Analyses were conducted using STATA MP 14.0 (College Station, TX); P <0.05 was considered statistically significant.
RESULTS
A total of 97 respondents attempted at least 1 question on the survey, and 72 respondents attempted all 11 questions, yielding 939 unique responses for analysis. Seventy respondents (87%) identified as doctors or nurses, and 44 (55%) reported having 6 to 20 years of experience; the survey cohort also came from 6 nations (Table 1). All respondents answered the CLABSI knowledge filter question correctly.
Table 1
Primary Outcome
The mean percent correct of attempted questions was 61% (standard deviation 21%, interquartile range 50%-75%) (Figure 1). Of those who answered all 11 CLABSI questions, the mean percent correct was 63% (95% CI, 59%-67%). Some questions were answered correctly more often than others—ranging from 17% to 95% (Table 2). Doctors answered 68% of questions correctly (95% CI, 63%-73%), while nurses and other respondents answered 57% of questions correctly (95% CI, 52%-62%) (P = 0.003). Other demographic variables—including self-reported involvement in a quality improvement committee and being from the United States versus elsewhere—were not associated with survey performance. The point biserial correlations for each individual question with overall performance were all more than 0.2 (range 0.24–0.62) and all statistically significant at P < 0.05.
Figure 1
Concept-Specific Performance
Average percent correct declined across categories as numeracy requirements increased (P < 0.05 for all pairwise comparisons). In the area of basic numeracy, respondents’ mean percent correct was 82% (95% CI, 77%-87%) of attempted. This category had 4 questions, with a performance range of 77% to 90%. For example, on the question, “Which hospital has the lowest CLABSI rate?”, 80% of respondents answered correctly. For risk-adjustment numeracy, the mean percent correct was 70% (95% CI, 64%-76%); 2 items assessed this category. For “Which is better: a higher or lower SIR?”, 95% of the cohort answered correctly. However, on “If hospital B had its number of projected infection halved, what is its SIR?”, only 46% of those who attempted the question answered correctly.
Questions featuring risk-adjustment interpretation had an average percent correct of 43% (95% CI, 37%-49%). Five questions made up this category, with a percent correct range of 17% to 75%. For example, on the question, “Which hospital’s patients are the most predisposed to developing CLABSI?”, only 32% of respondents answered this correctly. In contrast, for the question “Which hospital is most effective at preventing CLABSI?”, 51% answered correctly. Figure 2 illustrates the cohort’s performance on each conceptual category while Table 2 displays question-by-question results.
Figure 2
Table 2
Opinions Regarding CLABSI Data Reliability
Respondents were also asked about their opinion regarding the reliability of CLABSI quality metric data. Forty-three percent of respondents stated that such data were reliable at best 50% of the time. Notably, 10% of respondents indicated that CLABSI quality metric data were rarely or never reliable. There was no association between perceived reliability of quality metric data and survey performance (P = 0.87).
DISCUSSION
This Twitter-based study found wide variation in clinician interpretation of CLABSI quality data, with low overall performance. In particular, comprehension and interpretation of risk-adjusted data were substantially worse than unadjusted data. Although doctors performed somewhat better than nurses and other respondents, those involved in quality improvement initiatives performed no better than respondents who were not. Collectively, these findings suggest clinicians may not reliably comprehend quality metric data, potentially affecting their ability to utilize audit and feedback data. These results may have important implications for policy efforts that seek to leverage quality metric data to improve patient safety.
An integral component of many contemporary quality improvement initiatives is audit and feedback through metrics.6 Unfortunately, formal audit and feedback, along with other similar methods that benchmark data, have not consistently improved outcomes.24–27 A recent meta-analysis noted that audit and feedback interventions are not becoming more efficacious over time; the study further asserted that “new trials have provided little new knowledge regarding key effect modifiers.”9 Our findings suggest that numeracy and comprehension of quality metrics may be important candidate effect modifiers not previously considered. Simply put: we hypothesize that without intrinsic comprehension of data, impetus or insight to change practice might be diminished. In other words, clinicians may be more apt to act on insights they themselves derive from the data than when they are simply told what the data “mean.”
The present study further demonstrates that clinicians do not understand risk-adjusted data as well as raw data. Risk-adjustment has long been recognized as necessary to compare outcomes among hospitals.28,29 However, risk-adjustment is complex and, by its nature, difficult to understand. Although efforts have focused on improving the statistical reliability of quality metrics, this may represent but one half of the equation. Numeracy and interpretation of the data by decision makers are potentially equally important to effecting change. Because clinicians seem to have difficulty understanding risk-adjusted data, this deficit may be of growing importance as our risk-adjustment techniques become more sophisticated.
We note that clinicians expressed concerns regarding the reliability of quality metric feedback. These findings corroborate recent research that has reported reservations from hospital leaders concerning quality data.30,31 However, as shown in the context of patients and healthcare decisions, the aversion associated with quality metrics may be related to incomplete understanding of the data.32 Whether perceptions of unreliability drive lack of understanding or, conversely, whether lack of understanding fuels perceived unreliability is an important question that requires further study.
This study has several strengths. First, we used rigorous survey development techniques to evaluate the understudied issue of quality metric numeracy. Second, our sample size was sufficient to show statistically significant differences in numeracy and comprehension of CLABSI quality metric data. Third, we leveraged social media to rapidly acquire this sample. Finally, our results provided new insights that may have important implications in the area of quality metrics.
There were also limitations to our study. First, the Twitter-derived sample precludes the calculation of a response rate and may not be representative of individuals engaged in CLABSI prevention. However, respondents were solicited from the Twitter-followers of 2 health services researchers (TJI, VC) who are actively engaged in scholarly activities pertaining to critically ill patients and hospital-acquired complications. Thus, our sample likely represents a highly motivated subset that engages in these topics on a regular basis—potentially making them more numerate than average clinicians. Second, we did not ask whether the respondents had previously seen CLABSI data specifically, so we cannot stratify by exposure to such data. Third, this study assessed only CLABSI quality metric data; generalizations regarding numeracy with other metrics should be made with caution. However, as many such data are presented in similar formats, we suspect our findings are applicable to similar audit-and-feedback initiatives.
The findings of this study serve as a stimulus for further inquiry. Research of this nature needs to be carried out in samples drawn from specific, policy-relevant populations (eg, infection control practitioners, bedside nurses, intensive care unit directors). Such studies should include longitudinal assessments of numeracy that attempt to mechanistically examine its impact on CLABSI prevention efforts and outcomes. The latter is an important issue as the link between numeracy and behavioral response, while plausible, cannot be assumed, particularly given the complexity of issues related to behavioral modification.33 Additionally, whether alternate presentations of quality data affect numeracy, interpretation, and performance is worthy of further testing; indeed, this has been shown to be the case in other forms of communication.34–37 Until data from larger samples are available, it may be prudent for quality improvement leaders to assess the comprehension of local clinicians regarding feedback and whether lack of adequate comprehension is a barrier to deploying quality improvement interventions.
Quality measurement is a cornerstone of patient safety as it seeks to assess and improve the care delivered at the bedside. Rigorous metric development is important; however, ensuring that decision makers understand complex quality metrics may be equally fundamental. Given the cost of examining quality, elucidating the mechanisms of numeracy and interpretation as decision makers engage with quality metric data is necessary, along with whether improved comprehension leads to behavior change. Such inquiry may provide an evidence-base to shape alterations in quality metric deployment that will ensure maximal efficacy in driving practice change.
Disclosures
This work was supported by VA HSR&D IIR-13-079 (TJI). Dr. Chopra is supported by a career development award from the Agency of Healthcare Research and Quality (1-K08-HS022835-01). The views expressed here are the authors’ own and do not necessarily represent the view of the US Government or the Department of Veterans’ Affairs. The authors report no conflicts of interest.
1. Scott RD II. The direct medical costs of healthcare-associated infections in us hospitals and the benefits of prevention. Centers for Disease Control and Prevention. Available at: http://www.cdc.gov/HAI/pdfs/hai/Scott_CostPaper.pdf. Published March 2009. Accessed November 8, 2016.
2. O’Grady NP, Alexander M, Burns LA, et al. Guidelines for the prevention of intravascular catheter-related infections. Am J Infect Control. 2011;39(4 suppl 1)::S1-S34. PubMed
3. Blot K, Bergs J, Vogelaers D, Blot S, Vandijck D. Prevention of central line-associated bloodstream infections through quality improvement interventions: a systematic review and meta-analysis. Clin Infect Dis. 2014;59(1):96-105. PubMed
4. Mermel LA. Prevention of intravascular catheter-related infections. Ann Intern Med. 2000;132(5):391-402. PubMed
5. Siempos II, Kopterides P, Tsangaris I, Dimopoulou I, Armaganidis AE. Impact of catheter-related bloodstream infections on the mortality of critically ill patients: a meta-analysis. Crit Care Med. 2009;37(7):2283-2289. PubMed
6. Casalino LP, Gans D, Weber R, et al. US physician practices spend more than $15.4 billion annually to report quality measures. Health Aff (Millwood). 2016;35(3):401-406. PubMed
7. Hysong SJ. Meta-analysis: audit and feedback features impact effectiveness on care quality. Med Care. 2009;47(3):356-363. PubMed
8. Ilgen DR, Fisher CD, Taylor MS. Consequences of individual feedback on behavior in organizations. J Appl Psychol. 1979;64:349-371.
9. Ivers NM, Grimshaw JM, Jamtvedt G, et al. Growing literature, stagnant science? Systematic review, meta-regression and cumulative analysis of audit and feedback interventions in health care. J Gen Intern Med. 2014;29(11):1534-1541. PubMed
10. Rao G. Physician numeracy: essential skills for practicing evidence-based medicine. Fam Med. 2008;40(5):354-358. PubMed
11. Wegwarth O, Schwartz LM, Woloshin S, Gaissmaier W, Gigerenzer G. Do physicians understand cancer screening statistics? A national survey of primary care physicians in the United States. Ann Intern Med. 2012;156(5):340-349. PubMed
12. Bramwell R, West H, Salmon P. Health professionals’ and service users’ interpretation of screening test results: experimental study. BMJ. 2006;333(7562):284. PubMed
13. Agoritsas T, Courvoisier DS, Combescure C, Deom M, Perneger TV. Does prevalence matter to physicians in estimating post-test probability of disease? A randomized trial. J Gen Intern Med. 2011;26(4):373-378. PubMed
14. Warren DK, Zack JE, Mayfield JL, et al. The effect of an education program on the incidence of central venous catheter-associated bloodstream infection in a medical ICU. Chest. 2004;126(5):1612-1618. PubMed
15. Rinke ML, Bundy DG, Chen AR, et al. Central line maintenance bundles and CLABSIs in ambulatory oncology patients. Pediatrics. 2013;132(5):e1403-e1412. PubMed
16. Pronovost P, Needham D, Berenholtz S, et al. An intervention to decrease catheter-related bloodstream infections in the ICU. N Engl J Med. 2006;355(26): 2725-2732. PubMed
17. Rinke ML, Chen AR, Bundy DG, et al. Implementation of a central line maintenance care bundle in hospitalized pediatric oncology patients. Pediatrics. 2012;130(4):e996-e1004. PubMed
18. Sacks GD, Diggs BS, Hadjizacharia P, Green D, Salim A, Malinoski DJ. Reducing the rate of catheter-associated bloodstream infections in a surgical intensive care unit using the Institute for Healthcare Improvement Central Line Bundle. Am J Surg. 2014;207(6):817-823. PubMed
19. Berenholtz SM, Pronovost PJ, Lipsett PA, et al. Eliminating catheter-related bloodstream infections in the intensive care unit. Crit Care Med. 2004;32(10):2014-2020. PubMed
20. Rajwan YG, Barclay PW, Lee T, Sun IF, Passaretti C, Lehmann H. Visualizing central line-associated blood stream infection (CLABSI) outcome data for decision making by health care consumers and practitioners—an evaluation study. Online J Public Health Inform. 2013;5(2):218. PubMed
21. Fagerlin A, Zikmund-Fisher BJ, Ubel PA, Jankovic A, Derry HA, Smith DM. Measuring numeracy without a math test: development of the Subjective Numeracy Scale. Med Decis Making 2007;27(5):672-680. PubMed
22. HAI progress report FAQ. 2016. Available at: http://www.cdc.gov/hai/surveillance/progress-report/faq.html. Last updated March 2, 2016. Accessed November 8, 2016.
23. Collins D. Pretesting survey instruments: an overview of cognitive methods. Qual Life Res. 2003;12(3):229-238. PubMed
24. Ivers N, Jamtvedt G, Flottorp S, et al. Audit and feedback: effects on professional practice and healthcare outcomes. Cochrane Database Syst Rev. 2012;(6):CD000259. PubMed
25. Chatterjee P, Joynt KE. Do cardiology quality measures actually improve patient outcomes? J Am Heart Assoc. 2014;3(1):e000404. PubMed
26. Joynt KE, Blumenthal DM, Orav EJ, Resnic FS, Jha AK. Association of public reporting for percutaneous coronary intervention with utilization and outcomes among Medicare beneficiaries with acute myocardial infarction. JAMA. 2012;308(14):1460-1468. PubMed
27. Ryan AM, Nallamothu BK, Dimick JB. Medicare’s public reporting initiative on hospital quality had modest or no impact on mortality from three key conditions. Health Aff (Millwood). 2012;31(3):585-592. PubMed
28. Thomas JW. Risk adjustment for measuring health care outcomes, 3rd edition. Int J Qual Health Care. 2004;16(2):181-182.
29. Iezzoni LI. Risk Adjustment for Measuring Health Care Outcomes. Ann Arbor, Michigan: Health Administration Press; 1994.
30. Goff SL, Lagu T, Pekow PS, et al. A qualitative analysis of hospital leaders’ opinions about publicly reported measures of health care quality. Jt Comm J Qual Patient Saf. 2015;41(4):169-176. PubMed
31. Lindenauer PK, Lagu T, Ross JS, et al. Attitudes of hospital leaders toward publicly reported measures of health care quality. JAMA Intern Med. 2014;174(12): 1904-1911. PubMed
32. Peters E, Hibbard J, Slovic P, Dieckmann N. Numeracy skill and the communication, comprehension, and use of risk-benefit information. Health Aff (Millwood). 2007;26(3):741-748. PubMed
33. Montano DE, Kasprzyk D. Theory of reasoned action, theory of planned behavior, and the integrated behavioral model. In: Glanz K, Rimer BK, Viswanath K, eds. Health Behavior and Health Education: Theory, Research and Practice. 5th ed. San Francisco, CA: Jossey-Bass; 2015:95–124.
34. Hamstra DA, Johnson SB, Daignault S, et al. The impact of numeracy on verbatim knowledge of the longitudinal risk for prostate cancer recurrence following radiation therapy. Med Decis Making. 2015;35(1):27-36. PubMed
35. Hawley ST, Zikmund-Fisher B, Ubel P, Jancovic A, Lucas T, Fagerlin A. The impact of the format of graphical presentation on health-related knowledge and treatment choices. Patient Educ Couns. 2008;73(3):448-455. PubMed
36. Zikmund-Fisher BJ, Witteman HO, Dickson M, et al. Blocks, ovals, or people? Icon type affects risk perceptions and recall of pictographs. Med Decis Making. 2014;34(4):443-453. PubMed
37. Korfage IJ, Fuhrel-Forbis A, Ubel PA, et al. Informed choice about breast cancer prevention: randomized controlled trial of an online decision aid intervention. Breast Cancer Res. 2013;15(5):R74. PubMed
Central line-associated bloodstream infections (CLABSIs) are common and serious occurrences across healthcare systems, with an attributable mortality of 12% to 25%.1,2 Given this burden,3–5 CLABSI is a focus for both high-profile public reporting and quality improvement interventions. An integral component of such interventions is audit and feedback via quality metrics. These measures are intended to allow decision makers to assess their own performance and appropriately allocate resources. Quality metrics present a substantial cost to health systems, with an estimated $15.4 billion dollars spent annually simply for reporting.6 Despite this toll, “audit and feedback” interventions have proven to be variably successful.7–9 The mechanisms that limit the effectiveness of these interventions remain poorly understood.
One plausible explanation for limited efficacy of quality metrics is inadequate clinician numeracy—that is, “the ability to understand the quantitative aspects of clinical medicine, original research, quality improvement, and financial matters.”10 Indeed, clinicians are not consistently able to interpret probabilities and or clinical test characteristics. For example, Wegwarth et al. identified shortcomings in physician application of lead-time bias toward cancer screening.11 Additionally, studies have demonstrated systematic misinterpretations of probabilistic information in clinical settings, along with misconceptions regarding the impact of prevalence on post-test probabilities.12,13 Effective interpretation of rates may be a key—if unstated—requirement of many CLABSI quality improvement efforts.14–19 Our broader hypothesis is that clinicians who can more accurately interpret quality data, even if only from their own institution, are more likely to act on it appropriately and persistently than those who feel they must depend on a preprocessed interpretation of that same data by some other expert.
Therefore, we designed a survey to assess the numeracy of clinicians on CLABSI data presented in a prototypical feedback report. We studied 3 domains of comprehension: (1) basic numeracy: numerical tasks related to simple data; (2) risk-adjustment numeracy: numerical tasks related to risk-adjusted data; and (3) risk-adjustment interpretation: inferential tasks concerning risk-adjusted data. We hypothesized that clinician performance would vary substantially across domains, with the poorest performance in risk- adjusted data.
METHODS
We conducted a cross-sectional survey of clinician numeracy regarding CLABSI feedback data. Respondents were also asked to provide demographic information and opinions regarding the reliability of quality metric data. Survey recruitment occurred on Twitter, a novel approach that leveraged social media to facilitate rapid recruitment of participants. The study instrument was administered using a web survey with randomized question order to preclude any possibility of order effects between questions. The study was deemed Institutional Review Board exempt by the University of Michigan: protocol HUM00106696.
Data Presentation Method
To determine the optimal mode of presenting data, we reviewed the literature on quality metric numeracy and presentation methods. Additionally, we evaluated quality metric presentation methods used by the Centers for Disease Control and Prevention (CDC), Centers for Medicare & Medicaid Services (CMS), and a tertiary academic medical center. After assessing the available literature and options, we adapted a CLABSI data presentation array from a study that had qualitatively validated the format using physician feedback (Appendix).20 We used hypothetical CLABSI data for our survey.
Survey Development
We developed a survey that included an 11-item test regarding CLABSI numeracy and data interpretation. Additional questions related to quality metric reliability and demographic information were included. No preexisting assessment tools existed for our areas of interest. Therefore, we developed a novel instrument using a broad, exploratory approach as others have employed.21
First, we defined 3 conceptual categories related to CLABSI data. Within this conceptual framework, an iterative process of development and revision was used to assemble a question bank from which the survey would be constructed. A series of think-aloud sessions were held to evaluate each prompt for precision, clarity, and accuracy in assessing the conceptual categories. Correct and incorrect answers were defined based on literature review in conjunction with input from methodological and content experts (TJI and VC) (see Appendix for answer explanations).
Within the conceptual categories related to CLABSI risk-adjustment, a key measure is the standardized infection ratio (SIR). This value is defined as the ratio of observed number of CLABSI over the expected number of CLABSIs.22 This is the primary measure to stratify hospital performance, and it was used in our assessment of risk-adjustment comprehension. In total, 54 question prompts were developed and subsequently narrowed to 11 study questions for the initial survey.
The instrument was then pretested in a cohort of 8 hospitalists and intensivists to ensure appropriate comprehension, retrieval, and judgment processes.23 Questions were revised based on feedback from this cognitive testing to constitute the final instrument. During the survey, the data table was reshown on each page directly above each question and so was always on the same screen for the respondents.
Survey Sample
We innovated by using Twitter as an online platform for recruiting participants; we used Survey Monkey to host the electronic instrument. Two authors (TJI, VC) systematically sent out solicitation tweets to their followers. These tweets clearly indicated that the recruitment was for the purpose of a research study, and participants would receive no financial reward/incentive (Appendix). A link to the survey was provided in each tweet, and the period of recruitment was 30 days. To ensure respondents were clinicians, they needed to first answer a screening question recognizing that central lines were placed in the subclavian site but not the aorta, iliac, or radial sites.
To prevent systematic or anchoring biases, the order of questions was electronically randomized for each respondent. The primary outcome was the percentage correct of attempted questions.
Statistical Analysis
Descriptive statistics were calculated for all demographic variables. The primary outcome was evaluated as a dichotomous variable for each question (correct vs. incorrect response), and as a continuous variable when assessing mean percent correct on the overall survey. Demographic and conceptual associations were assessed via t-tests, chi-square, or Fisher exact tests. Point biserial correlations were calculated to assess for associations between response to a single question and overall performance on the survey.
To evaluate the association between various respondent characteristics and responses, logistic regression analyses were performed. An ANOVA was performed to assess the association between self-reported reliability of quality metric data and the overall performance on attempted items. Analyses were conducted using STATA MP 14.0 (College Station, TX); P <0.05 was considered statistically significant.
RESULTS
A total of 97 respondents attempted at least 1 question on the survey, and 72 respondents attempted all 11 questions, yielding 939 unique responses for analysis. Seventy respondents (87%) identified as doctors or nurses, and 44 (55%) reported having 6 to 20 years of experience; the survey cohort also came from 6 nations (Table 1). All respondents answered the CLABSI knowledge filter question correctly.
Table 1
Primary Outcome
The mean percent correct of attempted questions was 61% (standard deviation 21%, interquartile range 50%-75%) (Figure 1). Of those who answered all 11 CLABSI questions, the mean percent correct was 63% (95% CI, 59%-67%). Some questions were answered correctly more often than others—ranging from 17% to 95% (Table 2). Doctors answered 68% of questions correctly (95% CI, 63%-73%), while nurses and other respondents answered 57% of questions correctly (95% CI, 52%-62%) (P = 0.003). Other demographic variables—including self-reported involvement in a quality improvement committee and being from the United States versus elsewhere—were not associated with survey performance. The point biserial correlations for each individual question with overall performance were all more than 0.2 (range 0.24–0.62) and all statistically significant at P < 0.05.
Figure 1
Concept-Specific Performance
Average percent correct declined across categories as numeracy requirements increased (P < 0.05 for all pairwise comparisons). In the area of basic numeracy, respondents’ mean percent correct was 82% (95% CI, 77%-87%) of attempted. This category had 4 questions, with a performance range of 77% to 90%. For example, on the question, “Which hospital has the lowest CLABSI rate?”, 80% of respondents answered correctly. For risk-adjustment numeracy, the mean percent correct was 70% (95% CI, 64%-76%); 2 items assessed this category. For “Which is better: a higher or lower SIR?”, 95% of the cohort answered correctly. However, on “If hospital B had its number of projected infection halved, what is its SIR?”, only 46% of those who attempted the question answered correctly.
Questions featuring risk-adjustment interpretation had an average percent correct of 43% (95% CI, 37%-49%). Five questions made up this category, with a percent correct range of 17% to 75%. For example, on the question, “Which hospital’s patients are the most predisposed to developing CLABSI?”, only 32% of respondents answered this correctly. In contrast, for the question “Which hospital is most effective at preventing CLABSI?”, 51% answered correctly. Figure 2 illustrates the cohort’s performance on each conceptual category while Table 2 displays question-by-question results.
Figure 2
Table 2
Opinions Regarding CLABSI Data Reliability
Respondents were also asked about their opinion regarding the reliability of CLABSI quality metric data. Forty-three percent of respondents stated that such data were reliable at best 50% of the time. Notably, 10% of respondents indicated that CLABSI quality metric data were rarely or never reliable. There was no association between perceived reliability of quality metric data and survey performance (P = 0.87).
DISCUSSION
This Twitter-based study found wide variation in clinician interpretation of CLABSI quality data, with low overall performance. In particular, comprehension and interpretation of risk-adjusted data were substantially worse than unadjusted data. Although doctors performed somewhat better than nurses and other respondents, those involved in quality improvement initiatives performed no better than respondents who were not. Collectively, these findings suggest clinicians may not reliably comprehend quality metric data, potentially affecting their ability to utilize audit and feedback data. These results may have important implications for policy efforts that seek to leverage quality metric data to improve patient safety.
An integral component of many contemporary quality improvement initiatives is audit and feedback through metrics.6 Unfortunately, formal audit and feedback, along with other similar methods that benchmark data, have not consistently improved outcomes.24–27 A recent meta-analysis noted that audit and feedback interventions are not becoming more efficacious over time; the study further asserted that “new trials have provided little new knowledge regarding key effect modifiers.”9 Our findings suggest that numeracy and comprehension of quality metrics may be important candidate effect modifiers not previously considered. Simply put: we hypothesize that without intrinsic comprehension of data, impetus or insight to change practice might be diminished. In other words, clinicians may be more apt to act on insights they themselves derive from the data than when they are simply told what the data “mean.”
The present study further demonstrates that clinicians do not understand risk-adjusted data as well as raw data. Risk-adjustment has long been recognized as necessary to compare outcomes among hospitals.28,29 However, risk-adjustment is complex and, by its nature, difficult to understand. Although efforts have focused on improving the statistical reliability of quality metrics, this may represent but one half of the equation. Numeracy and interpretation of the data by decision makers are potentially equally important to effecting change. Because clinicians seem to have difficulty understanding risk-adjusted data, this deficit may be of growing importance as our risk-adjustment techniques become more sophisticated.
We note that clinicians expressed concerns regarding the reliability of quality metric feedback. These findings corroborate recent research that has reported reservations from hospital leaders concerning quality data.30,31 However, as shown in the context of patients and healthcare decisions, the aversion associated with quality metrics may be related to incomplete understanding of the data.32 Whether perceptions of unreliability drive lack of understanding or, conversely, whether lack of understanding fuels perceived unreliability is an important question that requires further study.
This study has several strengths. First, we used rigorous survey development techniques to evaluate the understudied issue of quality metric numeracy. Second, our sample size was sufficient to show statistically significant differences in numeracy and comprehension of CLABSI quality metric data. Third, we leveraged social media to rapidly acquire this sample. Finally, our results provided new insights that may have important implications in the area of quality metrics.
There were also limitations to our study. First, the Twitter-derived sample precludes the calculation of a response rate and may not be representative of individuals engaged in CLABSI prevention. However, respondents were solicited from the Twitter-followers of 2 health services researchers (TJI, VC) who are actively engaged in scholarly activities pertaining to critically ill patients and hospital-acquired complications. Thus, our sample likely represents a highly motivated subset that engages in these topics on a regular basis—potentially making them more numerate than average clinicians. Second, we did not ask whether the respondents had previously seen CLABSI data specifically, so we cannot stratify by exposure to such data. Third, this study assessed only CLABSI quality metric data; generalizations regarding numeracy with other metrics should be made with caution. However, as many such data are presented in similar formats, we suspect our findings are applicable to similar audit-and-feedback initiatives.
The findings of this study serve as a stimulus for further inquiry. Research of this nature needs to be carried out in samples drawn from specific, policy-relevant populations (eg, infection control practitioners, bedside nurses, intensive care unit directors). Such studies should include longitudinal assessments of numeracy that attempt to mechanistically examine its impact on CLABSI prevention efforts and outcomes. The latter is an important issue as the link between numeracy and behavioral response, while plausible, cannot be assumed, particularly given the complexity of issues related to behavioral modification.33 Additionally, whether alternate presentations of quality data affect numeracy, interpretation, and performance is worthy of further testing; indeed, this has been shown to be the case in other forms of communication.34–37 Until data from larger samples are available, it may be prudent for quality improvement leaders to assess the comprehension of local clinicians regarding feedback and whether lack of adequate comprehension is a barrier to deploying quality improvement interventions.
Quality measurement is a cornerstone of patient safety as it seeks to assess and improve the care delivered at the bedside. Rigorous metric development is important; however, ensuring that decision makers understand complex quality metrics may be equally fundamental. Given the cost of examining quality, elucidating the mechanisms of numeracy and interpretation as decision makers engage with quality metric data is necessary, along with whether improved comprehension leads to behavior change. Such inquiry may provide an evidence-base to shape alterations in quality metric deployment that will ensure maximal efficacy in driving practice change.
Disclosures
This work was supported by VA HSR&D IIR-13-079 (TJI). Dr. Chopra is supported by a career development award from the Agency of Healthcare Research and Quality (1-K08-HS022835-01). The views expressed here are the authors’ own and do not necessarily represent the view of the US Government or the Department of Veterans’ Affairs. The authors report no conflicts of interest.
References
1. Scott RD II. The direct medical costs of healthcare-associated infections in us hospitals and the benefits of prevention. Centers for Disease Control and Prevention. Available at: http://www.cdc.gov/HAI/pdfs/hai/Scott_CostPaper.pdf. Published March 2009. Accessed November 8, 2016.
2. O’Grady NP, Alexander M, Burns LA, et al. Guidelines for the prevention of intravascular catheter-related infections. Am J Infect Control. 2011;39(4 suppl 1)::S1-S34. PubMed
3. Blot K, Bergs J, Vogelaers D, Blot S, Vandijck D. Prevention of central line-associated bloodstream infections through quality improvement interventions: a systematic review and meta-analysis. Clin Infect Dis. 2014;59(1):96-105. PubMed
4. Mermel LA. Prevention of intravascular catheter-related infections. Ann Intern Med. 2000;132(5):391-402. PubMed
5. Siempos II, Kopterides P, Tsangaris I, Dimopoulou I, Armaganidis AE. Impact of catheter-related bloodstream infections on the mortality of critically ill patients: a meta-analysis. Crit Care Med. 2009;37(7):2283-2289. PubMed
6. Casalino LP, Gans D, Weber R, et al. US physician practices spend more than $15.4 billion annually to report quality measures. Health Aff (Millwood). 2016;35(3):401-406. PubMed
7. Hysong SJ. Meta-analysis: audit and feedback features impact effectiveness on care quality. Med Care. 2009;47(3):356-363. PubMed
8. Ilgen DR, Fisher CD, Taylor MS. Consequences of individual feedback on behavior in organizations. J Appl Psychol. 1979;64:349-371.
9. Ivers NM, Grimshaw JM, Jamtvedt G, et al. Growing literature, stagnant science? Systematic review, meta-regression and cumulative analysis of audit and feedback interventions in health care. J Gen Intern Med. 2014;29(11):1534-1541. PubMed
10. Rao G. Physician numeracy: essential skills for practicing evidence-based medicine. Fam Med. 2008;40(5):354-358. PubMed
11. Wegwarth O, Schwartz LM, Woloshin S, Gaissmaier W, Gigerenzer G. Do physicians understand cancer screening statistics? A national survey of primary care physicians in the United States. Ann Intern Med. 2012;156(5):340-349. PubMed
12. Bramwell R, West H, Salmon P. Health professionals’ and service users’ interpretation of screening test results: experimental study. BMJ. 2006;333(7562):284. PubMed
13. Agoritsas T, Courvoisier DS, Combescure C, Deom M, Perneger TV. Does prevalence matter to physicians in estimating post-test probability of disease? A randomized trial. J Gen Intern Med. 2011;26(4):373-378. PubMed
14. Warren DK, Zack JE, Mayfield JL, et al. The effect of an education program on the incidence of central venous catheter-associated bloodstream infection in a medical ICU. Chest. 2004;126(5):1612-1618. PubMed
15. Rinke ML, Bundy DG, Chen AR, et al. Central line maintenance bundles and CLABSIs in ambulatory oncology patients. Pediatrics. 2013;132(5):e1403-e1412. PubMed
16. Pronovost P, Needham D, Berenholtz S, et al. An intervention to decrease catheter-related bloodstream infections in the ICU. N Engl J Med. 2006;355(26): 2725-2732. PubMed
17. Rinke ML, Chen AR, Bundy DG, et al. Implementation of a central line maintenance care bundle in hospitalized pediatric oncology patients. Pediatrics. 2012;130(4):e996-e1004. PubMed
18. Sacks GD, Diggs BS, Hadjizacharia P, Green D, Salim A, Malinoski DJ. Reducing the rate of catheter-associated bloodstream infections in a surgical intensive care unit using the Institute for Healthcare Improvement Central Line Bundle. Am J Surg. 2014;207(6):817-823. PubMed
19. Berenholtz SM, Pronovost PJ, Lipsett PA, et al. Eliminating catheter-related bloodstream infections in the intensive care unit. Crit Care Med. 2004;32(10):2014-2020. PubMed
20. Rajwan YG, Barclay PW, Lee T, Sun IF, Passaretti C, Lehmann H. Visualizing central line-associated blood stream infection (CLABSI) outcome data for decision making by health care consumers and practitioners—an evaluation study. Online J Public Health Inform. 2013;5(2):218. PubMed
21. Fagerlin A, Zikmund-Fisher BJ, Ubel PA, Jankovic A, Derry HA, Smith DM. Measuring numeracy without a math test: development of the Subjective Numeracy Scale. Med Decis Making 2007;27(5):672-680. PubMed
22. HAI progress report FAQ. 2016. Available at: http://www.cdc.gov/hai/surveillance/progress-report/faq.html. Last updated March 2, 2016. Accessed November 8, 2016.
23. Collins D. Pretesting survey instruments: an overview of cognitive methods. Qual Life Res. 2003;12(3):229-238. PubMed
24. Ivers N, Jamtvedt G, Flottorp S, et al. Audit and feedback: effects on professional practice and healthcare outcomes. Cochrane Database Syst Rev. 2012;(6):CD000259. PubMed
25. Chatterjee P, Joynt KE. Do cardiology quality measures actually improve patient outcomes? J Am Heart Assoc. 2014;3(1):e000404. PubMed
26. Joynt KE, Blumenthal DM, Orav EJ, Resnic FS, Jha AK. Association of public reporting for percutaneous coronary intervention with utilization and outcomes among Medicare beneficiaries with acute myocardial infarction. JAMA. 2012;308(14):1460-1468. PubMed
27. Ryan AM, Nallamothu BK, Dimick JB. Medicare’s public reporting initiative on hospital quality had modest or no impact on mortality from three key conditions. Health Aff (Millwood). 2012;31(3):585-592. PubMed
28. Thomas JW. Risk adjustment for measuring health care outcomes, 3rd edition. Int J Qual Health Care. 2004;16(2):181-182.
29. Iezzoni LI. Risk Adjustment for Measuring Health Care Outcomes. Ann Arbor, Michigan: Health Administration Press; 1994.
30. Goff SL, Lagu T, Pekow PS, et al. A qualitative analysis of hospital leaders’ opinions about publicly reported measures of health care quality. Jt Comm J Qual Patient Saf. 2015;41(4):169-176. PubMed
31. Lindenauer PK, Lagu T, Ross JS, et al. Attitudes of hospital leaders toward publicly reported measures of health care quality. JAMA Intern Med. 2014;174(12): 1904-1911. PubMed
32. Peters E, Hibbard J, Slovic P, Dieckmann N. Numeracy skill and the communication, comprehension, and use of risk-benefit information. Health Aff (Millwood). 2007;26(3):741-748. PubMed
33. Montano DE, Kasprzyk D. Theory of reasoned action, theory of planned behavior, and the integrated behavioral model. In: Glanz K, Rimer BK, Viswanath K, eds. Health Behavior and Health Education: Theory, Research and Practice. 5th ed. San Francisco, CA: Jossey-Bass; 2015:95–124.
34. Hamstra DA, Johnson SB, Daignault S, et al. The impact of numeracy on verbatim knowledge of the longitudinal risk for prostate cancer recurrence following radiation therapy. Med Decis Making. 2015;35(1):27-36. PubMed
35. Hawley ST, Zikmund-Fisher B, Ubel P, Jancovic A, Lucas T, Fagerlin A. The impact of the format of graphical presentation on health-related knowledge and treatment choices. Patient Educ Couns. 2008;73(3):448-455. PubMed
36. Zikmund-Fisher BJ, Witteman HO, Dickson M, et al. Blocks, ovals, or people? Icon type affects risk perceptions and recall of pictographs. Med Decis Making. 2014;34(4):443-453. PubMed
37. Korfage IJ, Fuhrel-Forbis A, Ubel PA, et al. Informed choice about breast cancer prevention: randomized controlled trial of an online decision aid intervention. Breast Cancer Res. 2013;15(5):R74. PubMed
Address for correspondence and reprint requests: Sushant Govindan, MD, Taubman Center, Floor 3 Room 3920, 1500 East Medical Center Drive, SPC 5360, Ann Arbor, MI 48109; Telephone: 734-763-9077; Fax: 734-764-4556; E-mail: [email protected]
Content Gating
Open Access (article Unlocked/Open Access)
Alternative CME
Consolidated Pubs: Do Not Show Source Publication Logo
The transfer of inpatients between hospitals for specialized services is common, affecting nearly 10% of all Medicare admissions1 and 4.5% of all critical care hospitalizations.2 At tertiary referral centers, 49% of medical intensive care unit (ICU) admissions are transferred from another hospital.3
Transfer patients have longer length of stay (LOS) than patients admitted directly from the emergency department or clinic. Among patients initially admitted to an ICU, transfer patients spend 1 day to 2.2 more days in the ICU and an additional 2 days to 4 more days total at the receiving hospital.4,5 Furthermore, transfer patients have higher mortality than nontransferred patients by 4% to 8%.3-5 Even after adjustment for case mix and comorbid disease, interhospital transfer is an independent predictor of both ICU death and LOS.6,7 As a result, interhospital transfer has been associated with a $9600 increase (on average) in hospital costs.4
Despite evidence detailing patient handovers as a key time when poor communication can lead to delays in care and significant patient risk, 8-10 most studies have focused on hospital discharge or change of shift, and scant effort has been dedicated to improving the interhospital handover. The process of interhospital transfer is often prolonged and discontinuous,11 commonly including delays of more than 24 hours between initiation and completion. This frequently precludes direct physician-to-physician contact at the time of transfer, and physicians rely on the discharge/transfer summary.12 Yet discharge summaries are frequently absent or incomplete,13 and often lack information for high-risk treatments such as systemic anticoagulation.14 The traditional reliance on discharge summaries for handover communication requires interpretation of unstandardized documentation and increases the risk for miscommunication, delays, and error.
To improve communication, we developed a 1-page handover tool for all inbound adult interhospital transfers to our academic medical center. We sought to determine whether implementation of this standardized handover tool improved the timeliness of initial care, LOS, and mortality among interhospital transfer patients.
METHODS
Study Design, Setting, Population
We conducted a retrospective cohort study of patients transferred into Vanderbilt University Hospital (VUH), an adult 626-bed quaternary care academic medical center in Nashville, Tennessee. The Vanderbilt University Institutional Review Board approved this study.
Population
We selected for inclusion all patients age 18 or older who were transferred into VUH between July 1, 2009 and December 31, 2010. We excluded patients whose transfer was routed outside the main VUH Patient Flow Center as well as patients who did not arrive alive at VUH. We also excluded patients transferred to the emergency department and patients admitted to obstetrics, burn, or trauma services, because these admitting services did not initially use the handover tool. Patients were followed for the duration of their hospitalization at VUH.
Intervention
The 1-page handover tool was developed with multidisciplinary physician input from house staff; medical directors from intensive care, neurology, and surgery; and the chief of staff. The tool was structured on the SBARmodel (Situation, Background, Assessment, and Recommendation).15 Fields on the handover tool were limited to those deemed critical for immediate patient care and designed for 1 tool to be used for both ICU and non-ICU transfers. Fields included primary diagnosis; allergies; use and last dose of anticoagulants, vasopressors, sedative/paralytics, and antibiotics; isolation needs; indwelling devices; recent operations/procedures; code status; emergency contact information; problem list; active medication list; vital signs; pertinent exam; imaging; lab findings; and overall reason for transfer.
The handover tool was completed by the physician at the transferring hospital, faxed to VUH, and immediately scanned into the electronic record, allowing the receiving physicians to review information before patient arrival. Use of the tool was piloted first with 2 referring hospitals in April 2010 and universally recommended but not compulsory for all adult patients routed through the main VUH Patient Flow Center beginning July 1, 2010. Immediately before full implementation, the chief of staff sent letters to leadership of the 40 highest volume referral hospitals, highlighting the institutional goal of improving hand-off communication, framing completion of the tool as a step in the transfer acceptance process, and providing contact information for questions, feedback, or concerns. To ensure the tool was a standard part of the transfer process, the VUH Patient Flow Center maintained the responsibility of faxing the form to the outside facility and monitoring its receipt. The tool was processed in the same manner as other faxed patient records and treated as a part of the formal medical record to meet all standards for the Health Insurance Portability and Accountability Act (HIPAA) and medicolegal compliance. The medical center also has a separate cardiac transfer center where the handover tool was not implemented owing to its specialized workflow.
Data Source
The VUH Patient Flow Center maintains a database of all patients for whom transfer to VUH is requested, including information on the requesting hospital and the duration of transfer process. Outcome data and patient characteristics were extracted from the Enterprise Data Warehouse. Data related to comorbid illness were extracted from the Perioperative Data Warehouse, an IRB-approved data registry.
Measures
We evaluated 3 outcomes. First, we defined 2 measures of the timeliness of initial care, the time from arrival at VUH until entry of an admission order, and the time from arrival until entry of the first antibiotic order. Only antibiotics ordered within the first 36 hours of admission were included. Second, we evaluated the total LOS after transfer to VUH and the ICU LOS for patients transferred into an ICU setting. Finally, we examined in-hospital mortality at VUH. These metrics were chosen for their broad applicability across patient groups and feasibility of data capture. Length of stay and mortality also represent final common pathways for avoidance of complications. Specific patient safety indicators and complications were not abstracted due to their low frequency and burden of data collection. Due to system changes in our cost accounting systems, we were not able to obtain cost data pre- and postimplementation that provided meaningful comparisons.
Patient covariates included age, gender, payer, and Elixhauser comorbidity index as modified by van Walraven,16 calculated based on the admission of interest and the previous 365 days. We also examined admission characteristics including location (ICU vs. non-ICU), admitting service (medicine, surgery, neurology, or gynecology), and shift of arrival (day, 7:00 am to 6:00 pm; or night, 6:00 pm to 7:00 pm). Finally, we examined duration of the transfer process (ie, time between transfer request and arrival at VUH) and the volume of the transferring hospital (high was defined as 3 or more transfers to VUH per year).
Statistical analysis
Patient characteristics before and after implementation of the handover tool were compared using Pearson’s chi-square test and Fisher exact test for categorical variables and using Student t test and the Wilcoxon rank sum test for continuous variables. The outcome variables of time to admission order entry, time to antibiotic order entry, LOS, ICU LOS, and in-hospital mortality were compared between the before- and after-intervention time periods, using the Wilcoxon rank sum test for continuous outcomes and Pearson’s chi-square test for in-hospital mortality.
To account for temporal trends, the effect of the handover tool on time-to-admission order entry, hospital LOS, and mortality was measured using an interrupted time-series design with segmented linear regression analysis.17 The study period was divided into 2-week intervals, with 26 time periods in the pre-intervention period and 13 time periods in the postintervention period. Expected rates for the postintervention time periods were projected from the pre-intervention data using a linear regression model. To assess the observed effect of the intervention, rates from the postintervention periods were compared with these projected rates, assuming continuation of the trend. Restricted cubic spline models were also fit for time-to-admission order and hospital LOS; however, the F-statistics for these models were not significant, suggesting the linear regression provided a more appropriate model.
To further account for potential confounding of outcomes by comorbid disease and other patient factors, multivariate linear regression models assessed change in timeliness and LOS with implementation of the intervention. A multivariate logistic regression model was used to assess change in mortality with intervention implementation. All models adjusted for age, gender, payer, comorbid illness, admitting team, shift of arrival (day vs. night), transfer duration, volume of transferring hospital, and ICU status. Outcomes were further adjusted for calendar month to account for temporal trends in house staff efficiency. Because the cardiac transfer center did not adopt the use of the transfer tool, we evaluated adjusted in-hospital mortality for these patients as a concurrent control group.
All statistical testing was 2-sided at a significance level of 0.05. All analyses were conducted using STATA 12.1 statistical software (StataCorp LP, College Station, Texas).
RESULTS
Of 10,325 patients for whom transfer to VUH was requested during the study period, 1715 met inclusion criteria, including 798 patients (46.5%) initially admitted to an ICU setting. Specific patient exclusions are detailed in the Supplemental Figure; the majority of exclusions were due to patients being transferred directly to the emergency department setting. Table 1 summarizes patient characteristics before and after implementation of the handover tool. The median age was 57 years, with 48.6% male patients. Accepting services included medicine (56%), surgery (34%), neurology (9%), and gynecology (1%). The median duration of transfer was 8 hours, and the majority (93%) of patients came from higher volume transferring hospitals. Most (65%) of patients were admitted during night shift. The median modified Elixhauser comorbidity index was 11 (range of possible scores, -19 to 89). A slightly higher proportion of patients admitted postimplementation of the handover tool came from higher volume transferring hospitals; otherwise, there were no significant differences between the pre- and postintervention groups.
Table 1
Vanderbilt University Hospital received transfers from more than 350 unique facilities in more than 25 U.S. states during the overall study period. During the postintervention period, adherence to the handover process was excellent, with more than 85% of patients having a completed handover tool available in their medical record at the time of transfer. The remaining 15% had either incomplete forms or no form.
Timeliness of Initial Care
There was no change in either the median time-to-admission order entry after implementation (47 vs. 45 minutes, unadjusted P = 0.36) or time to antibiotic order entry (199 vs. 202 minutes; unadjusted P = 0.81; Table 2).
In the time-series analysis, the pre-intervention period did not have a significant temporal trend in median time-to-admission order entry (ß-coefficient = -0.27; 95% confidence interval [CI] -0.85 to 0.31; R2 = 0.04; P = 0.34; Figure 1A). The postintervention period showed a trend toward a reduction in median time-to-admission order entry (ß-coefficient = -1.39; 95% CI -2.92 to 0.15; R2 = 0.27; P = 0.07). There was no significant difference between the actual time-to-admission order entry in the postintervention period when compared to the projected rates from the pre-intervention period (P = 0.18).
After multivariate adjustment, the postintervention time period was not associated with any significant change in the median time-to-admission order entry (P = 0.94, R2 = 0.09) nor time-to-antibiotic order entry (P = 0.91; R2 = 0.08; Table 2).
Table 2
Length of Stay
Hospital LOS demonstrated a nonstatistically significant decline after implementation of the handover tool from 6.47 days to 5.81 days (unadjusted P = 0.18; Table 2). There was no significant change in ICU LOS postintervention (4.34 days to 4.55 days; P = 0.38).
In time series analysis, hospital LOS did not have a significant temporal trend in either the pre-intervention period (ß-coefficient = 0.00094; 95% CI, -0.07 to 0.07; R2 = 0.00; P = 0.98) or the postintervention period (ß-coefficient = 0.09; 95% CI, -0.07 to 0.25; R2 = 0.13; P = 0.23; Figure 1B). Similarly, there was no significant difference between the actual and projected hospital LOS after implementation of the handover tool (P = 0.31).
After multivariate adjustment, the postintervention time period was associated with a trend toward reduction in overall LOS (P = 0.06; R2 = 0.07) but no significant change in ICU LOS (P = 0.99; R2 = 0.09).
Figure 1A-1C
Mortality
In-hospital mortality declined significantly from 12.0% in the pre-intervention period to 8.9% in the postintervention period (P = 0.04; Table 2). In time-series analysis, mortality did not have a significant trend in the pre-intervention period (ß-coefficient = 0.00017, 95% CI, -0.0020 to 0.0024; P = 0.878) and had a trend toward reduction in the postintervention period (ß-coefficient = -0.0032; 95% CI, -0.0091 to 0.0027; P = 0.255; Figure 1C) but did not reach statistical significance due to relatively small numbers of deaths in each individual time period.
After multivariate adjustment, the postintervention period was associated with overall lower odds of mortality among transfer patients when compared with the pre-intervention period (adjusted OR 0.68; 95% CI, 0.47 – 0.99; R2 = 0.21; P = 0.04; Figure 2). Among the concurrent control group of patients routed through the cardiac transfer center, there was no significant change in mortality between the pre- and postintervention periods (adjusted OR 1.31; 95% CI, 0.88 – 1.93; R2 = 0.28; P = 0.18).
Figure 2
DISCUSSION
We developed a simple 1-page handover tool for interhospital transfer patients and aimed to improve timeliness, efficiency, and outcomes of care at the receiving hospital. Implementation of the handover tool was feasible and well accepted by transferring physicians despite a geographically large and diverse transfer network. Although implementation did not substantially improve measures of the timeliness of initial care among transfer patients, we noted a nonsignificant trend toward reduced LOS postintervention.
We observed a substantial and statistically significant reduction in mortality among transfer patients after implementation of the handover tool that persisted after controlling for time trends, comorbid illness, and several other patient factors. This effect was not seen in a concurrent control group of cardiac transfer patients for whom the handover tool was not implemented. Standardizing communication regarding high-risk clinical care processes may be responsible for the observed mortality reduction, similar to improvements seen in other small pilot studies.18 We acknowledge that the magnitude of the improvement in mortality is more than might be expected from the handover tool alone and could be due to chance.
In this initial evaluation, it was not feasible to determine whether information provided in the handover tool helped avert specific complications that could affect mortality, such as complications related to the use of ventilators, high-risk medications, or indwelling devices. Assessment of additional patient safety indices such as code events, unplanned ICU transfers, and medication errors could also help clarify the effect of the handover tool on patient-safety outcomes, and future work should include these metrics as well. Alternately, the improvement in mortality may result from other unmeasured processes that occurred concurrently and verification of this finding should be completed in other settings.
CONCLUSION
More work is needed to determine suitable process and outcome measures for interhospital transfers. Most literature has focused on cost and LOS at the exclusion of more proximal measures of initial care.3-7 The Institute of Medicine has identified timeliness as 1 of the 6 aims for care delivery redesign,19 yet standardized timeliness outcomes do not exist across broad inpatient populations. We chose to monitor the time-to-admission order entry and time-to-antibiotic order entry as 2 indicators of timeliness that would be applicable to a variety of patients. The lack of change in these selected measures should prompt examination for other measures of efficiency, including those that affect nontransferred patients. It is possible that nontransferred patients cared for by the same physician also benefit from fewer delays or disruptions and experience increased efficiency of care if transfer patient communication is improved. Further work is necessary to understand whether other measures of timely initial patient care may be more suitable.
The use of a time-series design to account for temporal trends adds substantial rigor to this study, since the majority of these patients were cared for by house staff whose experience and efficiency vary throughout the academic year. Furthermore, subsequent multivariate analysis demonstrated consistent findings after adjustment for comorbid illness and several other hospital and patient-level confounders.
This study has several limitations. The primary limitation is its nonrandomized design. Patient characteristics were stable across multiple variables before and after implementation, but it is possible that another confounding factor was responsible for observed improvements. Likewise, we collected data for only 6 rather than 12 months during the postintervention time period, which limited our sample size and statistical power. This was chosen because a significant restructuring of resident duty hours occurred in spring 2011 that had the potential to affect all measures studied.20,21 Finally, we did not collect data on accuracy of the information provided in the handover tool or end-user utilization and were unable to account for effects of these.
Since implementation in 2010, this process for interhospital transfers at VUH remains the same, although the volume of incoming transfers has significantly increased. Electronic handover tools with similar structure and content have since been adopted for patients being transferred to the emergency department or directly admitted from clinic. As VUH moves in the coming years from a locally developed electronic medical record to a national vendor, there will be an opportunity to transform this tool into an electronic template that will easily share data between institutions and further enhance communication.
Interhospital transfer patients represent a high-risk population whose unique handover needs have not been adequately measured or addressed. Our investigation demonstrated that a standardized handover aid can be implemented across a broad transfer network and may contribute to reductions in LOS and mortality. Further study is warranted to confirm these findings and assess the effect on other clinical outcomes.
Disclosures
This material is based upon work supported by the Office of Academic Affiliations, Department of Veterans Affairs, VA National Quality Scholars Program, and was made possible by the use of the facilities at VA Tennessee Valley Healthcare System, Nashville, Tennessee. The views expressed in this article are those of the authors and do not necessarily reflect the position or policy of the Department of Veterans Affairs or the US government. Additionally, this publication was supported in part by CTSA award No. UL1TR000445 from the National Center for Advancing Translational Sciences. Its contents are solely the responsibility of the authors and do not necessarily represent official views of the National Center for Advancing Translational Sciences or the National Institutes of Health.
1. Coleman EA, Min SJ, Chomiak A, Kramer AM. Posthospital care transitions: patterns, complications, and risk identification. Health Serv Res. 2004;39:1449-1465. PubMed
2. Iwashyna TJ, Christie JD, Moody J, Kahn JM, Asch DA. The structure of critical care transfer networks. Med Care. 2009;47:787-793. PubMed
3. Durairaj L, Will JG, Torner JC, Doebbeling BN. Prognostic factors for mortality following interhospital transfers to the medical intensive care unit of a tertiary referral center. Crit Care Med. 2003;31:1981-1986. PubMed
4. Golestanian E, Scruggs JE, Gangnon RE, Mak RP, Wood KE. Effect of interhospital transfer on resource utilization and outcomes at a tertiary care referral center. Crit Care Med. 2007;35:1470-1476. PubMed
5. Flabouris A, Hart GK, George C. Outcomes of patients admitted to tertiary intensive care units after interhospital transfer: comparison with patients admitted from emergency departments. Crit Care Resusc. 2008;10:97-105. PubMed
6. Combes A, Luyt CE, Trouillet JL, Chastre J, Gibert C. Adverse effect on a referral intensive care unit’s performance of accepting patients transferred from another intensive care unit. Crit Care Med. 2005;33:705-710. PubMed
7. Rosenberg AL, Hofer TP, Strachan C, Watts CM, Hayward RA. Accepting critically ill transfer patients: adverse effect on a referral center’s outcome and benchmark measures. A Intern Med. 2003;138:882-890. PubMed
8. Horwitz LI, Moin T, Krumholz HM, Wang L, Bradley EH. Consequences of inadequate sign-out for patient care. Arch Intern Med. 2008;168:1755-1760. PubMed
9. Starmer AJ, Sectish TC, Simon DW, et al. Rates of medical errors and preventable adverse events among hospitalized children following implementation of a resident handoff bundle. JAMA. 2013;310:2262-2270. PubMed
10. Arora VM, Manjarrez E, Dressler DD, Basaviah P, Halasyamani L, Kripalani S. Hospitalist handoffs: a systematic review and task force recommendations. J Hosp Med. 2009;4:433-440. PubMed
11. Bosk EA, Veinot T, Iwashyna TJ. Which patients and where: a qualitative study of patient transfers from community hospitals. Med Care. 2011;49:592-598. PubMed
12. Herrigel DJ, Carroll M, Fanning C, Steinberg MB, Parikh A, Usher M. Interhospital transfer handoff practices among US tertiary care centers: a descriptive survey. J Hosp Med. 2016;11:413-417. PubMed
13. Kripalani S, LeFevre F, Phillips CO, Williams MV, Basaviah P, Baker DW. Deficits in communication and information transfer between hospital-based and primary care physicians. JAMA. 2007;297:831-841. PubMed
14. Gandara E, Moniz TT, Ungar J, et al. Deficits in discharge documentation in patients transferred to rehabilitation facilities on anticoagulation: results of a systemwide evaluation. Jt Comm J Qual Patient Saf. 2008;34:460-463. PubMed
15. Haig KM, Sutton S, Whittington J. SBAR: a shared mental model for improving communication between clinicians. Jt Comm J Qual Patient Saf. 2006;32:167-175. PubMed
16. van Walraven C, Austin PC, Jennings A, Quan H, Forster AJ. A modification of the Elixhauser comorbidity measures into a point system for hospital death using administrative data. Med Care. 2009;47:626-633. PubMed
17. Wagner AK, Soumerai SB, Zhang F, Ross-Degnan D. Segmented regression analysis of interrupted time series studies in medication use research. J Clin Pharm Ther. 2002;27:299-309. PubMed
18. Malpass HC, Enfield KB, Keim-Malpass J, Verghese GM. The interhospital medical intensive care unit transfer instrument facilitates early implementation of critical therapies and is associated with fewer emergent procedures upon arrival. J Intensive Care Med. 2015;30:351-357. PubMed
19. National Academy of Sciences. Institute of Medicine. Crossing the Quality Chasm: A New Health System for the 21st Century. March 2005:1–360. Washington, DC. PubMed
20. Theobald CN, Stover DG, Choma NN, et al. The effect of reducing maximum shift lengths to 16 hours on internal medicine interns’ educational opportunities. Acad Med. 2013;88:512-518. PubMed
21. Choma NN, Vasilevskis EE, Sponsler KC, Hathaway J, Kripalani S. Effect of the ACGME 16-hour rule on efficiency and quality of care: duty hours 2.0. JAMA Intern Med. 2013;173:819-821. PubMed
The transfer of inpatients between hospitals for specialized services is common, affecting nearly 10% of all Medicare admissions1 and 4.5% of all critical care hospitalizations.2 At tertiary referral centers, 49% of medical intensive care unit (ICU) admissions are transferred from another hospital.3
Transfer patients have longer length of stay (LOS) than patients admitted directly from the emergency department or clinic. Among patients initially admitted to an ICU, transfer patients spend 1 day to 2.2 more days in the ICU and an additional 2 days to 4 more days total at the receiving hospital.4,5 Furthermore, transfer patients have higher mortality than nontransferred patients by 4% to 8%.3-5 Even after adjustment for case mix and comorbid disease, interhospital transfer is an independent predictor of both ICU death and LOS.6,7 As a result, interhospital transfer has been associated with a $9600 increase (on average) in hospital costs.4
Despite evidence detailing patient handovers as a key time when poor communication can lead to delays in care and significant patient risk, 8-10 most studies have focused on hospital discharge or change of shift, and scant effort has been dedicated to improving the interhospital handover. The process of interhospital transfer is often prolonged and discontinuous,11 commonly including delays of more than 24 hours between initiation and completion. This frequently precludes direct physician-to-physician contact at the time of transfer, and physicians rely on the discharge/transfer summary.12 Yet discharge summaries are frequently absent or incomplete,13 and often lack information for high-risk treatments such as systemic anticoagulation.14 The traditional reliance on discharge summaries for handover communication requires interpretation of unstandardized documentation and increases the risk for miscommunication, delays, and error.
To improve communication, we developed a 1-page handover tool for all inbound adult interhospital transfers to our academic medical center. We sought to determine whether implementation of this standardized handover tool improved the timeliness of initial care, LOS, and mortality among interhospital transfer patients.
METHODS
Study Design, Setting, Population
We conducted a retrospective cohort study of patients transferred into Vanderbilt University Hospital (VUH), an adult 626-bed quaternary care academic medical center in Nashville, Tennessee. The Vanderbilt University Institutional Review Board approved this study.
Population
We selected for inclusion all patients age 18 or older who were transferred into VUH between July 1, 2009 and December 31, 2010. We excluded patients whose transfer was routed outside the main VUH Patient Flow Center as well as patients who did not arrive alive at VUH. We also excluded patients transferred to the emergency department and patients admitted to obstetrics, burn, or trauma services, because these admitting services did not initially use the handover tool. Patients were followed for the duration of their hospitalization at VUH.
Intervention
The 1-page handover tool was developed with multidisciplinary physician input from house staff; medical directors from intensive care, neurology, and surgery; and the chief of staff. The tool was structured on the SBARmodel (Situation, Background, Assessment, and Recommendation).15 Fields on the handover tool were limited to those deemed critical for immediate patient care and designed for 1 tool to be used for both ICU and non-ICU transfers. Fields included primary diagnosis; allergies; use and last dose of anticoagulants, vasopressors, sedative/paralytics, and antibiotics; isolation needs; indwelling devices; recent operations/procedures; code status; emergency contact information; problem list; active medication list; vital signs; pertinent exam; imaging; lab findings; and overall reason for transfer.
The handover tool was completed by the physician at the transferring hospital, faxed to VUH, and immediately scanned into the electronic record, allowing the receiving physicians to review information before patient arrival. Use of the tool was piloted first with 2 referring hospitals in April 2010 and universally recommended but not compulsory for all adult patients routed through the main VUH Patient Flow Center beginning July 1, 2010. Immediately before full implementation, the chief of staff sent letters to leadership of the 40 highest volume referral hospitals, highlighting the institutional goal of improving hand-off communication, framing completion of the tool as a step in the transfer acceptance process, and providing contact information for questions, feedback, or concerns. To ensure the tool was a standard part of the transfer process, the VUH Patient Flow Center maintained the responsibility of faxing the form to the outside facility and monitoring its receipt. The tool was processed in the same manner as other faxed patient records and treated as a part of the formal medical record to meet all standards for the Health Insurance Portability and Accountability Act (HIPAA) and medicolegal compliance. The medical center also has a separate cardiac transfer center where the handover tool was not implemented owing to its specialized workflow.
Data Source
The VUH Patient Flow Center maintains a database of all patients for whom transfer to VUH is requested, including information on the requesting hospital and the duration of transfer process. Outcome data and patient characteristics were extracted from the Enterprise Data Warehouse. Data related to comorbid illness were extracted from the Perioperative Data Warehouse, an IRB-approved data registry.
Measures
We evaluated 3 outcomes. First, we defined 2 measures of the timeliness of initial care, the time from arrival at VUH until entry of an admission order, and the time from arrival until entry of the first antibiotic order. Only antibiotics ordered within the first 36 hours of admission were included. Second, we evaluated the total LOS after transfer to VUH and the ICU LOS for patients transferred into an ICU setting. Finally, we examined in-hospital mortality at VUH. These metrics were chosen for their broad applicability across patient groups and feasibility of data capture. Length of stay and mortality also represent final common pathways for avoidance of complications. Specific patient safety indicators and complications were not abstracted due to their low frequency and burden of data collection. Due to system changes in our cost accounting systems, we were not able to obtain cost data pre- and postimplementation that provided meaningful comparisons.
Patient covariates included age, gender, payer, and Elixhauser comorbidity index as modified by van Walraven,16 calculated based on the admission of interest and the previous 365 days. We also examined admission characteristics including location (ICU vs. non-ICU), admitting service (medicine, surgery, neurology, or gynecology), and shift of arrival (day, 7:00 am to 6:00 pm; or night, 6:00 pm to 7:00 pm). Finally, we examined duration of the transfer process (ie, time between transfer request and arrival at VUH) and the volume of the transferring hospital (high was defined as 3 or more transfers to VUH per year).
Statistical analysis
Patient characteristics before and after implementation of the handover tool were compared using Pearson’s chi-square test and Fisher exact test for categorical variables and using Student t test and the Wilcoxon rank sum test for continuous variables. The outcome variables of time to admission order entry, time to antibiotic order entry, LOS, ICU LOS, and in-hospital mortality were compared between the before- and after-intervention time periods, using the Wilcoxon rank sum test for continuous outcomes and Pearson’s chi-square test for in-hospital mortality.
To account for temporal trends, the effect of the handover tool on time-to-admission order entry, hospital LOS, and mortality was measured using an interrupted time-series design with segmented linear regression analysis.17 The study period was divided into 2-week intervals, with 26 time periods in the pre-intervention period and 13 time periods in the postintervention period. Expected rates for the postintervention time periods were projected from the pre-intervention data using a linear regression model. To assess the observed effect of the intervention, rates from the postintervention periods were compared with these projected rates, assuming continuation of the trend. Restricted cubic spline models were also fit for time-to-admission order and hospital LOS; however, the F-statistics for these models were not significant, suggesting the linear regression provided a more appropriate model.
To further account for potential confounding of outcomes by comorbid disease and other patient factors, multivariate linear regression models assessed change in timeliness and LOS with implementation of the intervention. A multivariate logistic regression model was used to assess change in mortality with intervention implementation. All models adjusted for age, gender, payer, comorbid illness, admitting team, shift of arrival (day vs. night), transfer duration, volume of transferring hospital, and ICU status. Outcomes were further adjusted for calendar month to account for temporal trends in house staff efficiency. Because the cardiac transfer center did not adopt the use of the transfer tool, we evaluated adjusted in-hospital mortality for these patients as a concurrent control group.
All statistical testing was 2-sided at a significance level of 0.05. All analyses were conducted using STATA 12.1 statistical software (StataCorp LP, College Station, Texas).
RESULTS
Of 10,325 patients for whom transfer to VUH was requested during the study period, 1715 met inclusion criteria, including 798 patients (46.5%) initially admitted to an ICU setting. Specific patient exclusions are detailed in the Supplemental Figure; the majority of exclusions were due to patients being transferred directly to the emergency department setting. Table 1 summarizes patient characteristics before and after implementation of the handover tool. The median age was 57 years, with 48.6% male patients. Accepting services included medicine (56%), surgery (34%), neurology (9%), and gynecology (1%). The median duration of transfer was 8 hours, and the majority (93%) of patients came from higher volume transferring hospitals. Most (65%) of patients were admitted during night shift. The median modified Elixhauser comorbidity index was 11 (range of possible scores, -19 to 89). A slightly higher proportion of patients admitted postimplementation of the handover tool came from higher volume transferring hospitals; otherwise, there were no significant differences between the pre- and postintervention groups.
Table 1
Vanderbilt University Hospital received transfers from more than 350 unique facilities in more than 25 U.S. states during the overall study period. During the postintervention period, adherence to the handover process was excellent, with more than 85% of patients having a completed handover tool available in their medical record at the time of transfer. The remaining 15% had either incomplete forms or no form.
Timeliness of Initial Care
There was no change in either the median time-to-admission order entry after implementation (47 vs. 45 minutes, unadjusted P = 0.36) or time to antibiotic order entry (199 vs. 202 minutes; unadjusted P = 0.81; Table 2).
In the time-series analysis, the pre-intervention period did not have a significant temporal trend in median time-to-admission order entry (ß-coefficient = -0.27; 95% confidence interval [CI] -0.85 to 0.31; R2 = 0.04; P = 0.34; Figure 1A). The postintervention period showed a trend toward a reduction in median time-to-admission order entry (ß-coefficient = -1.39; 95% CI -2.92 to 0.15; R2 = 0.27; P = 0.07). There was no significant difference between the actual time-to-admission order entry in the postintervention period when compared to the projected rates from the pre-intervention period (P = 0.18).
After multivariate adjustment, the postintervention time period was not associated with any significant change in the median time-to-admission order entry (P = 0.94, R2 = 0.09) nor time-to-antibiotic order entry (P = 0.91; R2 = 0.08; Table 2).
Table 2
Length of Stay
Hospital LOS demonstrated a nonstatistically significant decline after implementation of the handover tool from 6.47 days to 5.81 days (unadjusted P = 0.18; Table 2). There was no significant change in ICU LOS postintervention (4.34 days to 4.55 days; P = 0.38).
In time series analysis, hospital LOS did not have a significant temporal trend in either the pre-intervention period (ß-coefficient = 0.00094; 95% CI, -0.07 to 0.07; R2 = 0.00; P = 0.98) or the postintervention period (ß-coefficient = 0.09; 95% CI, -0.07 to 0.25; R2 = 0.13; P = 0.23; Figure 1B). Similarly, there was no significant difference between the actual and projected hospital LOS after implementation of the handover tool (P = 0.31).
After multivariate adjustment, the postintervention time period was associated with a trend toward reduction in overall LOS (P = 0.06; R2 = 0.07) but no significant change in ICU LOS (P = 0.99; R2 = 0.09).
Figure 1A-1C
Mortality
In-hospital mortality declined significantly from 12.0% in the pre-intervention period to 8.9% in the postintervention period (P = 0.04; Table 2). In time-series analysis, mortality did not have a significant trend in the pre-intervention period (ß-coefficient = 0.00017, 95% CI, -0.0020 to 0.0024; P = 0.878) and had a trend toward reduction in the postintervention period (ß-coefficient = -0.0032; 95% CI, -0.0091 to 0.0027; P = 0.255; Figure 1C) but did not reach statistical significance due to relatively small numbers of deaths in each individual time period.
After multivariate adjustment, the postintervention period was associated with overall lower odds of mortality among transfer patients when compared with the pre-intervention period (adjusted OR 0.68; 95% CI, 0.47 – 0.99; R2 = 0.21; P = 0.04; Figure 2). Among the concurrent control group of patients routed through the cardiac transfer center, there was no significant change in mortality between the pre- and postintervention periods (adjusted OR 1.31; 95% CI, 0.88 – 1.93; R2 = 0.28; P = 0.18).
Figure 2
DISCUSSION
We developed a simple 1-page handover tool for interhospital transfer patients and aimed to improve timeliness, efficiency, and outcomes of care at the receiving hospital. Implementation of the handover tool was feasible and well accepted by transferring physicians despite a geographically large and diverse transfer network. Although implementation did not substantially improve measures of the timeliness of initial care among transfer patients, we noted a nonsignificant trend toward reduced LOS postintervention.
We observed a substantial and statistically significant reduction in mortality among transfer patients after implementation of the handover tool that persisted after controlling for time trends, comorbid illness, and several other patient factors. This effect was not seen in a concurrent control group of cardiac transfer patients for whom the handover tool was not implemented. Standardizing communication regarding high-risk clinical care processes may be responsible for the observed mortality reduction, similar to improvements seen in other small pilot studies.18 We acknowledge that the magnitude of the improvement in mortality is more than might be expected from the handover tool alone and could be due to chance.
In this initial evaluation, it was not feasible to determine whether information provided in the handover tool helped avert specific complications that could affect mortality, such as complications related to the use of ventilators, high-risk medications, or indwelling devices. Assessment of additional patient safety indices such as code events, unplanned ICU transfers, and medication errors could also help clarify the effect of the handover tool on patient-safety outcomes, and future work should include these metrics as well. Alternately, the improvement in mortality may result from other unmeasured processes that occurred concurrently and verification of this finding should be completed in other settings.
CONCLUSION
More work is needed to determine suitable process and outcome measures for interhospital transfers. Most literature has focused on cost and LOS at the exclusion of more proximal measures of initial care.3-7 The Institute of Medicine has identified timeliness as 1 of the 6 aims for care delivery redesign,19 yet standardized timeliness outcomes do not exist across broad inpatient populations. We chose to monitor the time-to-admission order entry and time-to-antibiotic order entry as 2 indicators of timeliness that would be applicable to a variety of patients. The lack of change in these selected measures should prompt examination for other measures of efficiency, including those that affect nontransferred patients. It is possible that nontransferred patients cared for by the same physician also benefit from fewer delays or disruptions and experience increased efficiency of care if transfer patient communication is improved. Further work is necessary to understand whether other measures of timely initial patient care may be more suitable.
The use of a time-series design to account for temporal trends adds substantial rigor to this study, since the majority of these patients were cared for by house staff whose experience and efficiency vary throughout the academic year. Furthermore, subsequent multivariate analysis demonstrated consistent findings after adjustment for comorbid illness and several other hospital and patient-level confounders.
This study has several limitations. The primary limitation is its nonrandomized design. Patient characteristics were stable across multiple variables before and after implementation, but it is possible that another confounding factor was responsible for observed improvements. Likewise, we collected data for only 6 rather than 12 months during the postintervention time period, which limited our sample size and statistical power. This was chosen because a significant restructuring of resident duty hours occurred in spring 2011 that had the potential to affect all measures studied.20,21 Finally, we did not collect data on accuracy of the information provided in the handover tool or end-user utilization and were unable to account for effects of these.
Since implementation in 2010, this process for interhospital transfers at VUH remains the same, although the volume of incoming transfers has significantly increased. Electronic handover tools with similar structure and content have since been adopted for patients being transferred to the emergency department or directly admitted from clinic. As VUH moves in the coming years from a locally developed electronic medical record to a national vendor, there will be an opportunity to transform this tool into an electronic template that will easily share data between institutions and further enhance communication.
Interhospital transfer patients represent a high-risk population whose unique handover needs have not been adequately measured or addressed. Our investigation demonstrated that a standardized handover aid can be implemented across a broad transfer network and may contribute to reductions in LOS and mortality. Further study is warranted to confirm these findings and assess the effect on other clinical outcomes.
Disclosures
This material is based upon work supported by the Office of Academic Affiliations, Department of Veterans Affairs, VA National Quality Scholars Program, and was made possible by the use of the facilities at VA Tennessee Valley Healthcare System, Nashville, Tennessee. The views expressed in this article are those of the authors and do not necessarily reflect the position or policy of the Department of Veterans Affairs or the US government. Additionally, this publication was supported in part by CTSA award No. UL1TR000445 from the National Center for Advancing Translational Sciences. Its contents are solely the responsibility of the authors and do not necessarily represent official views of the National Center for Advancing Translational Sciences or the National Institutes of Health.
References
1. Coleman EA, Min SJ, Chomiak A, Kramer AM. Posthospital care transitions: patterns, complications, and risk identification. Health Serv Res. 2004;39:1449-1465. PubMed
2. Iwashyna TJ, Christie JD, Moody J, Kahn JM, Asch DA. The structure of critical care transfer networks. Med Care. 2009;47:787-793. PubMed
3. Durairaj L, Will JG, Torner JC, Doebbeling BN. Prognostic factors for mortality following interhospital transfers to the medical intensive care unit of a tertiary referral center. Crit Care Med. 2003;31:1981-1986. PubMed
4. Golestanian E, Scruggs JE, Gangnon RE, Mak RP, Wood KE. Effect of interhospital transfer on resource utilization and outcomes at a tertiary care referral center. Crit Care Med. 2007;35:1470-1476. PubMed
5. Flabouris A, Hart GK, George C. Outcomes of patients admitted to tertiary intensive care units after interhospital transfer: comparison with patients admitted from emergency departments. Crit Care Resusc. 2008;10:97-105. PubMed
6. Combes A, Luyt CE, Trouillet JL, Chastre J, Gibert C. Adverse effect on a referral intensive care unit’s performance of accepting patients transferred from another intensive care unit. Crit Care Med. 2005;33:705-710. PubMed
7. Rosenberg AL, Hofer TP, Strachan C, Watts CM, Hayward RA. Accepting critically ill transfer patients: adverse effect on a referral center’s outcome and benchmark measures. A Intern Med. 2003;138:882-890. PubMed
8. Horwitz LI, Moin T, Krumholz HM, Wang L, Bradley EH. Consequences of inadequate sign-out for patient care. Arch Intern Med. 2008;168:1755-1760. PubMed
9. Starmer AJ, Sectish TC, Simon DW, et al. Rates of medical errors and preventable adverse events among hospitalized children following implementation of a resident handoff bundle. JAMA. 2013;310:2262-2270. PubMed
10. Arora VM, Manjarrez E, Dressler DD, Basaviah P, Halasyamani L, Kripalani S. Hospitalist handoffs: a systematic review and task force recommendations. J Hosp Med. 2009;4:433-440. PubMed
11. Bosk EA, Veinot T, Iwashyna TJ. Which patients and where: a qualitative study of patient transfers from community hospitals. Med Care. 2011;49:592-598. PubMed
12. Herrigel DJ, Carroll M, Fanning C, Steinberg MB, Parikh A, Usher M. Interhospital transfer handoff practices among US tertiary care centers: a descriptive survey. J Hosp Med. 2016;11:413-417. PubMed
13. Kripalani S, LeFevre F, Phillips CO, Williams MV, Basaviah P, Baker DW. Deficits in communication and information transfer between hospital-based and primary care physicians. JAMA. 2007;297:831-841. PubMed
14. Gandara E, Moniz TT, Ungar J, et al. Deficits in discharge documentation in patients transferred to rehabilitation facilities on anticoagulation: results of a systemwide evaluation. Jt Comm J Qual Patient Saf. 2008;34:460-463. PubMed
15. Haig KM, Sutton S, Whittington J. SBAR: a shared mental model for improving communication between clinicians. Jt Comm J Qual Patient Saf. 2006;32:167-175. PubMed
16. van Walraven C, Austin PC, Jennings A, Quan H, Forster AJ. A modification of the Elixhauser comorbidity measures into a point system for hospital death using administrative data. Med Care. 2009;47:626-633. PubMed
17. Wagner AK, Soumerai SB, Zhang F, Ross-Degnan D. Segmented regression analysis of interrupted time series studies in medication use research. J Clin Pharm Ther. 2002;27:299-309. PubMed
18. Malpass HC, Enfield KB, Keim-Malpass J, Verghese GM. The interhospital medical intensive care unit transfer instrument facilitates early implementation of critical therapies and is associated with fewer emergent procedures upon arrival. J Intensive Care Med. 2015;30:351-357. PubMed
19. National Academy of Sciences. Institute of Medicine. Crossing the Quality Chasm: A New Health System for the 21st Century. March 2005:1–360. Washington, DC. PubMed
20. Theobald CN, Stover DG, Choma NN, et al. The effect of reducing maximum shift lengths to 16 hours on internal medicine interns’ educational opportunities. Acad Med. 2013;88:512-518. PubMed
21. Choma NN, Vasilevskis EE, Sponsler KC, Hathaway J, Kripalani S. Effect of the ACGME 16-hour rule on efficiency and quality of care: duty hours 2.0. JAMA Intern Med. 2013;173:819-821. PubMed
Address for correspondence and reprint requests: Cecelia N. Theobald, Division of General Internal Medicine and Public Health, 1214 21st Ave. S, Medical Center East–NT, 7th floor Suite IV, Nashville, TN 37232; Telephone: 615-936-3216; Fax: 615-936-3156; E-mail: [email protected]
Content Gating
Open Access (article Unlocked/Open Access)
Alternative CME
Consolidated Pubs: Do Not Show Source Publication Logo
Although much has been written about pediatric discharge and readmissions1-5 over the past several years, surprisingly little is known about which care practices are most effective at preventing postdischarge utilization.5 Major collaborations across the U.S. are currently focused on improving pediatric discharge processes,6-8 although the impact that these efforts will have on readmissions remains to be seen.
Research on handoffs between hospitals and primary care has mixed associations with postdischarge utilization. Although some studies observe positive relationships between specific activities and reduced postdischarge utilization,1 others suggest no relationship9-12 or, paradoxically, more utilization.13,14 Brittan et al15 found that outpatient visits were associated with more readmissions when occurring less than 4 days after discharge, but fewer readmissions when occurring 4 days to 29 days after discharge. Most studies, however, investigate single or limited sets of care activities, such as having an outpatient visit,15 timeliness of that visit,16 or receipt of a discharge summary.11 Inclusion of a more comprehensive set of hospital- to primary-care communication practices may better unravel this complex relationship between discharge care and postdischarge outcomes for children.
The purpose of this study was to characterize a set of traditional discharge handoff practices between hospital and primary care providers (PCPs) and to explore their relationships to readmissions. We hypothesized that handoff practices would be associated with fewer unplanned readmissions.
METHODS
Study Design, Setting, Participants
This project was part of a prospective cohort study with 2 aims: to investigate relationships between medical home experience and postdischarge utilization,17 and to identify relationships between common discharge communication practices and postdischarge utilization. This manuscript is focused on the second aim. Randomly selected pediatric patients and their caregivers were enrolled from any medical or surgical service during an acute hospitalization lasting more than 24 hours from October 1, 2012 to January 1, 2014, at a 100-bed tertiary children’s hospital. Patients who transferred to another facility, died, were older than 18 years or in neonatal care (ie, newborn nursery or neonatal intensive care unit) were excluded since their discharge experiences would be significantly distinct from the population of interest. Patients were enrolled once in the study.
Outcome
The study’s primary outcome was 30-day unplanned readmissions, defined as a hospitalization occurring within 30 days of the index (ie, study enrollment) hospitalization, identified through caregiver report or administrative sources.17 Although the study site is a single hospital system, readmissions could have occurred to any hospital reported by caregivers, (ie,readmissions could have occurred within or outside our health system). Readmissions for chemotherapy, radiation, dialysis, rehabilitation, or labor and delivery were excluded. If caregivers reported an admission as planned or chart review of the index discharge summary noted that a rehospitalization was scheduled in the subsequent 30 days, the readmission was labeled “planned” and excluded.
Discharge Handoff Communication
Transitional care is a set of actions designed to ensure continuity and coordination of healthcare during transfer from 1 location or level of care to another.18,19 The study team, comprised of a division chief of general pediatrics, a division chief of hospital medicine, 2 departmental vice-chairs, and the medical director for quality at the study site, identified 11 common handoff activities and reporting sources. These consensus-based activities were expected by the study team to improve continuity and coordination during hospital-to-home transfer, and included:
verifying PCP identity during the hospitalization (caregiver report);
notifying the PCP of admission, discharge, and providing updates during the hospitalization (PCP report);
PCP follow-up appointment set prior to discharge (caregiver report);
documenting planned PCP and subspecialty follow-up in the discharge summary (chart review);
completing the discharge summary within 48 hours (chart review);
providing a verbal or written handoff to the PCP prior to follow-up (PCP report); and
having a PCP follow-up visit within 30 days of discharge (caregiver report).
We also asked PCPs whether they thought the follow-up interval was appropriate and whether phone follow-up with the patient would have been as appropriate as a face-to-face visit.
Covariates
Patient demographics that might confound the relationship between handoff practices and readmissions based on pediatric research20,21 were included. Medical complexity was accounted for by length-of-index stay, the number of hospitalizations and emergency department (ED) visits in past 12 months, complex chronic conditions,22,23 and seeing 3 or more subspecialists.24,25 Variables from related work included PCP scope (general pediatrics or subspecialist) and presence of a usual source for well and sick care.17
The Care Transitions Measure-3 (CTM-3), originally developed to assess the patient-centeredness of hospital transition,26,27 can discriminate adult patients at risk for readmission.26 We adapted the original CTM-3 to be answered by caregiver respondents after pilot testing with 5 caregivers not enrolled in the study: 1) “The hospital staff took my preferences and those of my family into account in deciding what my child’s health care needs would be when I left the hospital;” 2) “When I left the hospital, I had a good understanding of the things I was responsible for in managing my child’s health;” and 3) “When I left the hospital, I clearly understood the purpose for giving each of my child’s medications.” We analyzed the adapted CTM-3 on a transformed 0-100 scale as designed,26 initially hypothesizing that the CTM-3 would mediate the relationship between handoff practices and readmissions.
We assessed caregiver confidence to avoid a readmission, based on a strong independent association with readmissions described in Coller et al.17 Using questions developed for this study, caregivers were asked to rate “How confident are you that [child’s name] will stay out of the hospital for the next 30 days?” with instructions to refer to unplanned hospital visits only. Responses were reported on a 4-point Likert scale (1 = very confident, 4 = not very confident). Responses were dichotomized into very confident (ie, “1”) or not very confident (ie, “2-4”).
Enrollment and Data Collection
Computer-generated random numbers were assigned to patients admitted the previous day, and families were enrolled sequentially until the daily enrollment target was reached. Data were obtained from 3 sources: medical record, caregiver report, and PCP report. Trained research assistants systematically extracted chart review data documenting the transitions practices above, while a hospital information technology analyst extracted claims and demographic data to complement what was reported by parents and PCPs. After study conclusion, these medical record data were merged with caregiver and PCP-reported data.
Trained bilingual research assistants collected caregiver- and PCP-reported data using structured questionnaires in English or Spanish, according to preference. Timing of data collection differed by data source; caregiver-reported data were collected immediately after discharge and at 30 days postdischarge; PCP-reported data were collected at 30 days postdischarge.
Caregiver-reported data were collected through 2 separate phone calls following index discharge: immediately after discharge (caregiver confidence and CTM-3 measures) and at 30 days (readmission measures). Caregiver confidence questions were asked after (rather than immediately before) discharge to avoid biasing clinical care and revisit risk, consistent with previous work.28
PCP-reported data were collected using structured questionnaires with the PCP who was identified by the family during study enrollment. PCP-reported data were collected by telephone or fax 30 days after discharge, with up to 5 telephone attempts and 3 fax attempts. At the beginning of the questionnaire, PCPs were asked if they agreed with the designation, although they were asked to complete the questionnaire regardless.
Analyses
Descriptive statistics compared differences in handoff practices and 30-day unplanned readmissions. Exploratory factor analysis assessed whether certain handoff practices were sufficiently correlated to allow grouping of items and construction of scales. Relationships between handoff practices and readmissions were examined using bivariate, followed by multivariate, logistic regression adjusting for the covariates described. Collinearity was tested before constructing final models. Because no relationship was observed between CTM-3 and readmissions, additional mediation analyses were not pursued. All analyses were completed using STATA (SE version 14.0, StataCorp LP, College Station, Texas). This study was approved by the Institutional Review Boards at UCLA (study site) and University of Wisconsin (lead author site).
RESULTS
This study enrolled 701 of 816 eligible participants (85.9%) between October 2012 and January 2014. More than 99% of administrative data and 97% of caregiver questionnaires were complete. Of 685 patients with a reported PCP, we obtained responses from 577 PCPs (84.2%). Patient characteristics and outcomes were not significantly different for patients with and without a responding PCP; however, patients of nonresponding PCPs were more often publicly insured (64.5% vs. 48.2% for responding PCPs, P = 0.004) or seen by a subspecialist as opposed to a generalist (28.1% vs. 13.8% for responding PCPs, P = 0.001).
The overall population characteristics are summarized in Table 1: 27.4% of the cohort was younger 2 years, 49.2% were Hispanic, and the majority (51.1%) had public insurance. The average length of the index hospitalization for the overall population was 4.8 days (standard deviation = 9.6), and 53.5% had at least 1 complex chronic condition. Eighty-four percent of the cohort reported using a generalist (vs. subspecialist) for primary care.
Table 1
Discharge Handoff Communication
Practices varied widely (Figure 1a). Verbal handoffs between hospital-based and PCPs were least common (10.7%), whereas discharge summary completion within 48 hours was most common (84.9%). Of variables measuring direct communication with PCPs, only notification of admission occurred at least half the time (50.8%).
Exploratory factor analysis identified 5 well-correlated items (Cronbach α = 0.77), which were combined and labeled the Hospital and Primary Care Provider Communication scale (Figure 1b). Items included PCP notification of admission, discharge, and receipt of updates during hospitalization, as well as receipt of verbal and written handoffs prior to follow-up. While these 5 items were analyzed only in this scale, other practices were analyzed as independent variables. In this assessment, 42.1% of patients had a scale score of 0 (no items performed), while 5% had all 5 items completed
Figure 1A-1B
Readmissions
The 30-day unplanned readmission rate to any hospital was 12.4%. Demographic characteristics were similar in patients with and without an unplanned readmission (Table 1); however, patients with a readmission were more often younger (P = 0.03) and used a subspecialist for primary care (P = 0.03). Fewer than 60% of those with an unplanned readmission had a usual source of sick and well care compared with 77.5% of those without a readmission (P < 0.001). The length of index stay was nearly 4 days longer for those with an unplanned readmission (9.3 days vs. 4.4 days, P < 0.001).These patients also had more hospitalizations or ED visits in the past year (P = 0.002 and P = 0.04, respectively) and saw more subspecialists (P < 0.001).
Table 2
Frequencies of communication practices between those with and without an unplanned readmission are illustrated in Table 2. Nearly three-quarters of caregivers whose children were readmitted reported having follow-up appointments scheduled before discharge, compared to 48.9% without a readmission (P < 0.001). In 71% of discharges followed by a readmission, caregivers were not very confident about avoiding readmission, vs. 44.8% of discharges with no readmission (P < 0.001).
Readmissions were largely unrelated to handoff practices in multivariate analyses (Table 3). Having a follow-up visit scheduled prior to discharge was the only activity with a statistically significant association; however, it was actually associated with more than double the odds of readmission (adjusted odds ratio 2.20, 95% confidence interval 1.08-4.46).
Table 3
DISCUSSION
The complex nature of hospital discharge care has led to general optimism that improved handoff processes might reduce readmissions for pediatric patients. Although the current literature linking transition practices to readmissions in pediatrics has mixed results,1,4,5 most studies are fragmented—investigating a single or small number of transitional care activities, such asoutpatient follow-up visits, postdischarge caregiver phone calls, or PCP receipt of discharge summaries. Despite finding limited relationships with readmissions, a strength of our study was its inclusion of a more comprehensive set of traditional communication practices that the study team anticipates many primary care and hospital medicine providers would expect to be carried out for most, if not all, patients during the hospital-to-home transition.
Although our study was developed earlier, the variables in our analyses align with each domain of the conceptual model for readmission risk proposed by the Seamless Transitions and Re(admissions) Network (STARNet).6 This model identifies 7 elements believed to directly impact readmission risk in children: hospital and ED utilization, underlying diseases, ability to care for diseases, access to outpatient care, discharge processes, and discharge readiness. For example, our study included ED and hospital visits in the past year, complex chronic conditions, number of subspecialists, caregiver confidence, having a usual source of care, insurance status, and the 11 consensus-based handoff practices identified by our study team. Therefore, although the included handoff practices we included were a limited set, our models provide a relatively comprehensive analysis of readmission risk, confirming caregiver confidence, usual source of care, and hospitalizations to be associated with unplanned readmissions.
With the exception of having scheduled follow-up appointments before discharge – which was associated with more rather than fewer readmissions—the included care practices were not associated with readmissions. We suspect that these findings likely represent selection bias, with hospital providers taking additional steps in communicating with outpatient providers when they are most concerned about a patient’s vulnerability at discharge, eg,due to severity of illness, sociodemographics, health literacy, access to care, or other factors. Such selection bias could have 2 potential effects: (1) creating associations between the performance of certain handoff practices and higher readmission risk (eg,hospital providers are more likely to set follow-up appointments with the sickest patients who are also most likely to be readmitted, or (2) negating weakly effective communication practices that have small effect sizes. The currently mixed literature suggests that if associations between these handoff practices and postdischarge outcomes exist, they are often opposite to our expectation and likely driven by selection bias. If there are real effects that are hidden by this selection bias, they may be weak or inconsistent.
Recent qualitative research highlights the needs and preferences of caregivers of children with chronic or complex conditions to promote their sense of self-efficacy at discharge.29 Such needs include support from within and beyond the health system, comprehensive discharge education, and written instructions, ultimately leading to confidence and comfort in executing the home-management plan. Consistent with our work,17 a strong independent relationship between caregiver confidence and postdischarge outcomes remained even after accounting for these conventional handoff activities.
Transitions research in pediatrics has started only recently to move beyond traditional handoff communication between hospital and outpatient providers. Over the last several years, more ambitious conceptualizations of hospital discharge care have evolved2 and include constructs such as family-centeredness,4,28,29 discharge readiness,30 and social determinants of health.31 Interventions targeting these constructs are largely missing from the literature and are greatly needed. If transitions are to have an effect on downstream utilization, their focus likely needs to evolve to address such areas.
Finally, our study underscores the need to identify relevant outcomes of improved transitional care. Although the preventability of postdischarge utilization continues to be debated, most would agree that this should not detract from the importance of high-quality transitional care. The STARNet collaborative provides some examples of outcomes potentially impacted through improved transitional care,6 although the authors note that reliability, validity, and feasibility of the measures are not well understood. High-quality transitional care presumably would lead to improvements in patient and family experience and perhaps safer care. Although caregiver experience measured by an adapted CTM-3 was neither a mediator nor a predictor of postdischarge utilization for children in our study, use of more rigorously developed tools for pediatric patients32 may provide a better assessment of caregiver experience. Finally, given the well-described risks of poor communication between hospital and outpatient providers,33-35 safety events may be a better outcome of high-quality transitional care than readmissions. Investment in transitional care initiatives would be well justified if the positive patient, provider, and health system impacts can be better demonstrated through improved outcomes.
Future readmissions research should aim to accomplish several goals. Because observational studies will continue to be challenged by the selection biases described above, more rigorously designed and controlled experimental pediatric studies are needed. Family, social, and primary care characteristics should continue to be incorporated into pediatric readmission analyses given their increasingly recognized critical role. These variables, some of which could be modifiable, might represent potential targets for innovative readmission reduction interventions. Recently published conceptual models6,29,36 provide a useful starting framework.
Limitations
Because of the observational study design, we cannot draw conclusions about causal relationships between handoff practices and the measured outcomes. The tertiary care single-center nature of the study limits generalizability. Response biases are possible given that we often could not verify accuracy of PCP and caregiver responses. As noted above, we suspect that handoff practices were driven by important selection bias, not all of which could be controlled by the measured patient and clinical characteristics. The handoff practices included in this study were a limited set primarily focused on communication between hospital providers and PCPs. Therefore, the study does not rule out the possibility that other aspects of transitional care may reduce readmissions. Subsequent work investigating innovative interventions may find reductions in readmissions and other important outcomes. Additionally, not all practices have standardized definitions, eg,what 1 PCP considers a verbal handoff may be different from that of another provider. Although we assessed whether communication occurred, we were not able to assess the content or quality of communication, which may have important implications for its effectiveness.37,38
CONCLUSION
Improvements in handoffs between hospital and PCPs may have an important impact on postdischarge outcomes, but it is not clear that unplanned 30-day readmissions is among them. Efforts to reduce postdischarge utilization, if possible, likely need to focus on broader constructs such as caregiver self-efficacy, discharge readiness, and social determinants of health.
Disclosures
This study was supported by a grant from the Lucile Packard Foundation for Children’s Health, Palo Alto, California, as well as grant R40MC25677 Maternal and Child Health Research Program, Maternal and Child Health Bureau (Title V, Social Security Act), Health Resources and Services Administration, Department of Health and Human Services. The authors report no financial conflicts of interest.
References
1. Auger KA, Kenyon CC, Feudtner C, Davis MM. Pediatric hospital discharge interventions to reduce subsequent utilization: a systematic review. J Hosp Med. 2014;9:251-260. PubMed
2. Berry JG, Blaine K, Rogers J, et al. A framework of pediatric hospital discharge care informed by legislation, research, and practice. JAMA Pediatr. 2014;168:955-962; quiz 965-956. PubMed
3. Snow V, Beck D, Budnitz T, et al, American College of Physicians, Society of General Internal Medicine, Society of Hospital Medicine, American Geriatrics Society, American College of Emergency Physicians, Society of Academic Emergency Medicine. Transitions of Care Consensus Policy Statement. American College of Physicians, Society of General Internal Medicine, Society of Hospital Medicine, American Geriatrics Society, American College of Emergency Physicians, Society of Academic Emergency Medicine. J Gen Intern Med. 2009;24:971-976. PubMed
4. Desai AD, Popalisky J, Simon TD, Mangione-Smith RM. The effectiveness of family-centered transition processes from hospital settings to home: a review of the literature. Hosp Pediatr. 2015;5:219-231. PubMed
5. Berry JG, Gay JC. Preventing readmissions in children: how do we do that? Hosp Pediatr. 2015;5:602-604. PubMed
6. Auger KA, Simon TD, Cooperberg D, et al. Summary of STARNet: Seamless Transitions and (Re)admissions Network. Pediatrics. 2015;135:164-175. PubMed
7. Value in inpatient pediatrics network projects. American Academy of Pediatrics. Available at: https://www.aap.org/en-us/professional-resources/quality-improvement/Quality-Improvement-Innovation-Networks/Value-in-Inpatient-Pediatrics-Network/Pages/Value-in-Inpatient-Pediatrics-Network.aspx. Accessed May 18, 2015.
8. Ohio Children’s Hospitals. Solutions for patient safety. Available at: http://www.solutionsforpatientsafety.org/about-us/our-goals/. Accessed May 18, 2015.
9. Bell CM, Schnipper JL, Auerbach AD, et al. Association of communication between hospital-based physicians and primary care providers with patient outcomes. J Gen Intern Med. 2009;24:381-386. PubMed
10. Oduyebo I, Lehmann CU, Pollack CE, et al. Association of self-reported hospital discharge handoffs with 30-day readmissions. JAMA Intern Med. 2013;173:624-629. PubMed
11. van Walraven C, Seth R, Austin PC, Laupacis A. Effect of discharge summary availability during post-discharge visits on hospital readmission. J Gen Intern Med. 2002;17:186-192. PubMed
12. Kashiwagi DT, Burton MC, Kirkland LL, Cha S, Varkey P. Do timely outpatient follow-up visits decrease hospital readmission rates? Am J Med Qual. 2012;27:11-15. PubMed
13. Coller RJ, Klitzner TS, Lerner CF, Chung PJ. Predictors of 30-day readmission and association with primary care follow-up plans. J Pediatr. 2013;163:1027-1033. PubMed
14. Feudtner C, Pati S, Goodman DM, et al. State-level child health system performance and the likelihood of readmission to children’s hospitals. J Pediatr. 2010;157:98-102. PubMed
15. Brittan MS, Sills MR, Fox D, et al. Outpatient follow-up visits and readmission in medically complex children enrolled in Medicaid. J Pediatr. 2015;166:998-1005. PubMed
16. Misky GJ, Wald HL, Coleman EA. Post-hospitalization transitions: Examining the effects of timing of primary care provider follow-up. J Hosp Med. 2010;5:392-397. PubMed
17. Coller RJ, Klitzner TS, Saenz AA, Lerner CF, Nelson BB, Chung PJ. The medical home and hospital readmissions. Pediatrics. 2015;136:e1550-e1560. PubMed
18. Coleman EA, Berenson RA. Lost in transition: challenges and opportunities for improving the quality of transitional care. Ann Intern Med. 2004;141:533-536. PubMed
19. Coleman EA, Boult C; American Geriatrics Society Health Care Systems Committee. Improving the quality of transitional care for persons with complex care needs. J Am Geriatr Soc. 2003;51:556-557. PubMed
20. Berry JG, Hall DE, Kuo DZ, et al. Hospital utilization and characteristics of patients experiencing recurrent readmissions within children’s hospitals. JAMA. 2011;305:682-690. PubMed
21. Feudtner C, Levin JE, Srivastava R, et al. How well can hospital readmission be predicted in a cohort of hospitalized children? A retrospective, multicenter study. Pediatrics. 2009;123:286-293. PubMed
22. Feudtner C, Christakis DA, Connell FA. Pediatric deaths attributable to complex chronic conditions: a population-based study of Washington State, 1980-1997. Pediatrics. 2000;106:205-209. PubMed
23. Feudtner C, Feinstein JA, Zhong W, Hall M, Dai D. Pediatric complex chronic conditions classification system version 2: updated for ICD-10 and complex medical technology dependence and transplantation. BMC Pediatr. 2014;14:199. PubMed
24. Berry JG, Agrawal R, Kuo DZ, et al. Characteristics of hospitalizations for patients who use a structured clinical care program for children with medical complexity. J Pediatr. 2011;159:284-290. PubMed
25. Kuo DZ, Cohen E, Agrawal R, Berry JG, Casey PH. A national profile of caregiver challenges among more medically complex children with special health care needs. Arch Pediatr Adolesc Med. 2011;165:1020-1026. PubMed
26. Parry C, Mahoney E, Chalmers SA, Coleman EA. Assessing the quality of transitional care: further applications of the care transitions measure. Med Care. 2008;46:317-322. PubMed
27. Coleman EA, Mahoney E, Parry C. Assessing the quality of preparation for posthospital care from the patient’s perspective: the care transitions measure. Med Care. 2005;43:246-255. PubMed
28. Berry JG, Ziniel SI, Freeman L, et al. Hospital readmission and parent perceptions of their child’s hospital discharge. Int J Qual Health Care. 2013;25:573-581. PubMed
29. Desai AD, Durkin LK, Jacob-Files EA, Mangione-Smith R. Caregiver perceptions of hospital to home transitions according to medical complexity: a qualitative study. Acad Pediatr. 2016;16:136-144. PubMed
30. Weiss ME, Bobay KL, Bahr SJ, Costa L, Hughes RG, Holland DE. A model for hospital discharge preparation: from case management to care transition. J Nurs Adm. 2015;45:606-614. PubMed
31. Sills MR, Hall M, Colvin JD, et al. Association of social determinants with children’s hospitals’ preventable readmissions performance. JAMA Pediatr. 2016;170:350-358. PubMed
32. Toomey SL, Zaslavsky AM, Elliott MN, et al. The development of a pediatric inpatient experience of care measure: child HCAHPS. Pediatrics. 2015;136:360-369. PubMed
33. Kripalani S, LeFevre F, Phillips CO, Williams MV, Basaviah P, Baker DW. Deficits in communication and information transfer between hospital-based and primary care physicians: implications for patient safety and continuity of care. JAMA. 2007;297:831-841. PubMed
34. Harlan G, Srivastava R, Harrison L, McBride G, Maloney C. Pediatric hospitalists and primary care providers: a communication needs assessment. J Hosp Med. 2009;4:187-193. PubMed
35. Forster AJ, Clark HD, Menard A, et al. Adverse events among medical patients after discharge from hospital. CMAJ. 2004;170:345-349. PubMed
36. Nakamura MM, Toomey SL, Zaslavsky AM, et al. Measuring pediatric hospital readmission rates to drive quality improvement. Acad Pediatr. 2014;14:S39-S46. PubMed
37. Smith K. Effective communication with primary care providers. Pediatr Clin North Am. 2014;61671-679. PubMed
38. Leyenaar JK, Bergert L, Mallory LA, et al. Pediatric primary care providers’ perspectives regarding hospital discharge communication: a mixed methods analysis. Acad Pediatr. 2015;15:61-68. PubMed
Although much has been written about pediatric discharge and readmissions1-5 over the past several years, surprisingly little is known about which care practices are most effective at preventing postdischarge utilization.5 Major collaborations across the U.S. are currently focused on improving pediatric discharge processes,6-8 although the impact that these efforts will have on readmissions remains to be seen.
Research on handoffs between hospitals and primary care has mixed associations with postdischarge utilization. Although some studies observe positive relationships between specific activities and reduced postdischarge utilization,1 others suggest no relationship9-12 or, paradoxically, more utilization.13,14 Brittan et al15 found that outpatient visits were associated with more readmissions when occurring less than 4 days after discharge, but fewer readmissions when occurring 4 days to 29 days after discharge. Most studies, however, investigate single or limited sets of care activities, such as having an outpatient visit,15 timeliness of that visit,16 or receipt of a discharge summary.11 Inclusion of a more comprehensive set of hospital- to primary-care communication practices may better unravel this complex relationship between discharge care and postdischarge outcomes for children.
The purpose of this study was to characterize a set of traditional discharge handoff practices between hospital and primary care providers (PCPs) and to explore their relationships to readmissions. We hypothesized that handoff practices would be associated with fewer unplanned readmissions.
METHODS
Study Design, Setting, Participants
This project was part of a prospective cohort study with 2 aims: to investigate relationships between medical home experience and postdischarge utilization,17 and to identify relationships between common discharge communication practices and postdischarge utilization. This manuscript is focused on the second aim. Randomly selected pediatric patients and their caregivers were enrolled from any medical or surgical service during an acute hospitalization lasting more than 24 hours from October 1, 2012 to January 1, 2014, at a 100-bed tertiary children’s hospital. Patients who transferred to another facility, died, were older than 18 years or in neonatal care (ie, newborn nursery or neonatal intensive care unit) were excluded since their discharge experiences would be significantly distinct from the population of interest. Patients were enrolled once in the study.
Outcome
The study’s primary outcome was 30-day unplanned readmissions, defined as a hospitalization occurring within 30 days of the index (ie, study enrollment) hospitalization, identified through caregiver report or administrative sources.17 Although the study site is a single hospital system, readmissions could have occurred to any hospital reported by caregivers, (ie,readmissions could have occurred within or outside our health system). Readmissions for chemotherapy, radiation, dialysis, rehabilitation, or labor and delivery were excluded. If caregivers reported an admission as planned or chart review of the index discharge summary noted that a rehospitalization was scheduled in the subsequent 30 days, the readmission was labeled “planned” and excluded.
Discharge Handoff Communication
Transitional care is a set of actions designed to ensure continuity and coordination of healthcare during transfer from 1 location or level of care to another.18,19 The study team, comprised of a division chief of general pediatrics, a division chief of hospital medicine, 2 departmental vice-chairs, and the medical director for quality at the study site, identified 11 common handoff activities and reporting sources. These consensus-based activities were expected by the study team to improve continuity and coordination during hospital-to-home transfer, and included:
verifying PCP identity during the hospitalization (caregiver report);
notifying the PCP of admission, discharge, and providing updates during the hospitalization (PCP report);
PCP follow-up appointment set prior to discharge (caregiver report);
documenting planned PCP and subspecialty follow-up in the discharge summary (chart review);
completing the discharge summary within 48 hours (chart review);
providing a verbal or written handoff to the PCP prior to follow-up (PCP report); and
having a PCP follow-up visit within 30 days of discharge (caregiver report).
We also asked PCPs whether they thought the follow-up interval was appropriate and whether phone follow-up with the patient would have been as appropriate as a face-to-face visit.
Covariates
Patient demographics that might confound the relationship between handoff practices and readmissions based on pediatric research20,21 were included. Medical complexity was accounted for by length-of-index stay, the number of hospitalizations and emergency department (ED) visits in past 12 months, complex chronic conditions,22,23 and seeing 3 or more subspecialists.24,25 Variables from related work included PCP scope (general pediatrics or subspecialist) and presence of a usual source for well and sick care.17
The Care Transitions Measure-3 (CTM-3), originally developed to assess the patient-centeredness of hospital transition,26,27 can discriminate adult patients at risk for readmission.26 We adapted the original CTM-3 to be answered by caregiver respondents after pilot testing with 5 caregivers not enrolled in the study: 1) “The hospital staff took my preferences and those of my family into account in deciding what my child’s health care needs would be when I left the hospital;” 2) “When I left the hospital, I had a good understanding of the things I was responsible for in managing my child’s health;” and 3) “When I left the hospital, I clearly understood the purpose for giving each of my child’s medications.” We analyzed the adapted CTM-3 on a transformed 0-100 scale as designed,26 initially hypothesizing that the CTM-3 would mediate the relationship between handoff practices and readmissions.
We assessed caregiver confidence to avoid a readmission, based on a strong independent association with readmissions described in Coller et al.17 Using questions developed for this study, caregivers were asked to rate “How confident are you that [child’s name] will stay out of the hospital for the next 30 days?” with instructions to refer to unplanned hospital visits only. Responses were reported on a 4-point Likert scale (1 = very confident, 4 = not very confident). Responses were dichotomized into very confident (ie, “1”) or not very confident (ie, “2-4”).
Enrollment and Data Collection
Computer-generated random numbers were assigned to patients admitted the previous day, and families were enrolled sequentially until the daily enrollment target was reached. Data were obtained from 3 sources: medical record, caregiver report, and PCP report. Trained research assistants systematically extracted chart review data documenting the transitions practices above, while a hospital information technology analyst extracted claims and demographic data to complement what was reported by parents and PCPs. After study conclusion, these medical record data were merged with caregiver and PCP-reported data.
Trained bilingual research assistants collected caregiver- and PCP-reported data using structured questionnaires in English or Spanish, according to preference. Timing of data collection differed by data source; caregiver-reported data were collected immediately after discharge and at 30 days postdischarge; PCP-reported data were collected at 30 days postdischarge.
Caregiver-reported data were collected through 2 separate phone calls following index discharge: immediately after discharge (caregiver confidence and CTM-3 measures) and at 30 days (readmission measures). Caregiver confidence questions were asked after (rather than immediately before) discharge to avoid biasing clinical care and revisit risk, consistent with previous work.28
PCP-reported data were collected using structured questionnaires with the PCP who was identified by the family during study enrollment. PCP-reported data were collected by telephone or fax 30 days after discharge, with up to 5 telephone attempts and 3 fax attempts. At the beginning of the questionnaire, PCPs were asked if they agreed with the designation, although they were asked to complete the questionnaire regardless.
Analyses
Descriptive statistics compared differences in handoff practices and 30-day unplanned readmissions. Exploratory factor analysis assessed whether certain handoff practices were sufficiently correlated to allow grouping of items and construction of scales. Relationships between handoff practices and readmissions were examined using bivariate, followed by multivariate, logistic regression adjusting for the covariates described. Collinearity was tested before constructing final models. Because no relationship was observed between CTM-3 and readmissions, additional mediation analyses were not pursued. All analyses were completed using STATA (SE version 14.0, StataCorp LP, College Station, Texas). This study was approved by the Institutional Review Boards at UCLA (study site) and University of Wisconsin (lead author site).
RESULTS
This study enrolled 701 of 816 eligible participants (85.9%) between October 2012 and January 2014. More than 99% of administrative data and 97% of caregiver questionnaires were complete. Of 685 patients with a reported PCP, we obtained responses from 577 PCPs (84.2%). Patient characteristics and outcomes were not significantly different for patients with and without a responding PCP; however, patients of nonresponding PCPs were more often publicly insured (64.5% vs. 48.2% for responding PCPs, P = 0.004) or seen by a subspecialist as opposed to a generalist (28.1% vs. 13.8% for responding PCPs, P = 0.001).
The overall population characteristics are summarized in Table 1: 27.4% of the cohort was younger 2 years, 49.2% were Hispanic, and the majority (51.1%) had public insurance. The average length of the index hospitalization for the overall population was 4.8 days (standard deviation = 9.6), and 53.5% had at least 1 complex chronic condition. Eighty-four percent of the cohort reported using a generalist (vs. subspecialist) for primary care.
Table 1
Discharge Handoff Communication
Practices varied widely (Figure 1a). Verbal handoffs between hospital-based and PCPs were least common (10.7%), whereas discharge summary completion within 48 hours was most common (84.9%). Of variables measuring direct communication with PCPs, only notification of admission occurred at least half the time (50.8%).
Exploratory factor analysis identified 5 well-correlated items (Cronbach α = 0.77), which were combined and labeled the Hospital and Primary Care Provider Communication scale (Figure 1b). Items included PCP notification of admission, discharge, and receipt of updates during hospitalization, as well as receipt of verbal and written handoffs prior to follow-up. While these 5 items were analyzed only in this scale, other practices were analyzed as independent variables. In this assessment, 42.1% of patients had a scale score of 0 (no items performed), while 5% had all 5 items completed
Figure 1A-1B
Readmissions
The 30-day unplanned readmission rate to any hospital was 12.4%. Demographic characteristics were similar in patients with and without an unplanned readmission (Table 1); however, patients with a readmission were more often younger (P = 0.03) and used a subspecialist for primary care (P = 0.03). Fewer than 60% of those with an unplanned readmission had a usual source of sick and well care compared with 77.5% of those without a readmission (P < 0.001). The length of index stay was nearly 4 days longer for those with an unplanned readmission (9.3 days vs. 4.4 days, P < 0.001).These patients also had more hospitalizations or ED visits in the past year (P = 0.002 and P = 0.04, respectively) and saw more subspecialists (P < 0.001).
Table 2
Frequencies of communication practices between those with and without an unplanned readmission are illustrated in Table 2. Nearly three-quarters of caregivers whose children were readmitted reported having follow-up appointments scheduled before discharge, compared to 48.9% without a readmission (P < 0.001). In 71% of discharges followed by a readmission, caregivers were not very confident about avoiding readmission, vs. 44.8% of discharges with no readmission (P < 0.001).
Readmissions were largely unrelated to handoff practices in multivariate analyses (Table 3). Having a follow-up visit scheduled prior to discharge was the only activity with a statistically significant association; however, it was actually associated with more than double the odds of readmission (adjusted odds ratio 2.20, 95% confidence interval 1.08-4.46).
Table 3
DISCUSSION
The complex nature of hospital discharge care has led to general optimism that improved handoff processes might reduce readmissions for pediatric patients. Although the current literature linking transition practices to readmissions in pediatrics has mixed results,1,4,5 most studies are fragmented—investigating a single or small number of transitional care activities, such asoutpatient follow-up visits, postdischarge caregiver phone calls, or PCP receipt of discharge summaries. Despite finding limited relationships with readmissions, a strength of our study was its inclusion of a more comprehensive set of traditional communication practices that the study team anticipates many primary care and hospital medicine providers would expect to be carried out for most, if not all, patients during the hospital-to-home transition.
Although our study was developed earlier, the variables in our analyses align with each domain of the conceptual model for readmission risk proposed by the Seamless Transitions and Re(admissions) Network (STARNet).6 This model identifies 7 elements believed to directly impact readmission risk in children: hospital and ED utilization, underlying diseases, ability to care for diseases, access to outpatient care, discharge processes, and discharge readiness. For example, our study included ED and hospital visits in the past year, complex chronic conditions, number of subspecialists, caregiver confidence, having a usual source of care, insurance status, and the 11 consensus-based handoff practices identified by our study team. Therefore, although the included handoff practices we included were a limited set, our models provide a relatively comprehensive analysis of readmission risk, confirming caregiver confidence, usual source of care, and hospitalizations to be associated with unplanned readmissions.
With the exception of having scheduled follow-up appointments before discharge – which was associated with more rather than fewer readmissions—the included care practices were not associated with readmissions. We suspect that these findings likely represent selection bias, with hospital providers taking additional steps in communicating with outpatient providers when they are most concerned about a patient’s vulnerability at discharge, eg,due to severity of illness, sociodemographics, health literacy, access to care, or other factors. Such selection bias could have 2 potential effects: (1) creating associations between the performance of certain handoff practices and higher readmission risk (eg,hospital providers are more likely to set follow-up appointments with the sickest patients who are also most likely to be readmitted, or (2) negating weakly effective communication practices that have small effect sizes. The currently mixed literature suggests that if associations between these handoff practices and postdischarge outcomes exist, they are often opposite to our expectation and likely driven by selection bias. If there are real effects that are hidden by this selection bias, they may be weak or inconsistent.
Recent qualitative research highlights the needs and preferences of caregivers of children with chronic or complex conditions to promote their sense of self-efficacy at discharge.29 Such needs include support from within and beyond the health system, comprehensive discharge education, and written instructions, ultimately leading to confidence and comfort in executing the home-management plan. Consistent with our work,17 a strong independent relationship between caregiver confidence and postdischarge outcomes remained even after accounting for these conventional handoff activities.
Transitions research in pediatrics has started only recently to move beyond traditional handoff communication between hospital and outpatient providers. Over the last several years, more ambitious conceptualizations of hospital discharge care have evolved2 and include constructs such as family-centeredness,4,28,29 discharge readiness,30 and social determinants of health.31 Interventions targeting these constructs are largely missing from the literature and are greatly needed. If transitions are to have an effect on downstream utilization, their focus likely needs to evolve to address such areas.
Finally, our study underscores the need to identify relevant outcomes of improved transitional care. Although the preventability of postdischarge utilization continues to be debated, most would agree that this should not detract from the importance of high-quality transitional care. The STARNet collaborative provides some examples of outcomes potentially impacted through improved transitional care,6 although the authors note that reliability, validity, and feasibility of the measures are not well understood. High-quality transitional care presumably would lead to improvements in patient and family experience and perhaps safer care. Although caregiver experience measured by an adapted CTM-3 was neither a mediator nor a predictor of postdischarge utilization for children in our study, use of more rigorously developed tools for pediatric patients32 may provide a better assessment of caregiver experience. Finally, given the well-described risks of poor communication between hospital and outpatient providers,33-35 safety events may be a better outcome of high-quality transitional care than readmissions. Investment in transitional care initiatives would be well justified if the positive patient, provider, and health system impacts can be better demonstrated through improved outcomes.
Future readmissions research should aim to accomplish several goals. Because observational studies will continue to be challenged by the selection biases described above, more rigorously designed and controlled experimental pediatric studies are needed. Family, social, and primary care characteristics should continue to be incorporated into pediatric readmission analyses given their increasingly recognized critical role. These variables, some of which could be modifiable, might represent potential targets for innovative readmission reduction interventions. Recently published conceptual models6,29,36 provide a useful starting framework.
Limitations
Because of the observational study design, we cannot draw conclusions about causal relationships between handoff practices and the measured outcomes. The tertiary care single-center nature of the study limits generalizability. Response biases are possible given that we often could not verify accuracy of PCP and caregiver responses. As noted above, we suspect that handoff practices were driven by important selection bias, not all of which could be controlled by the measured patient and clinical characteristics. The handoff practices included in this study were a limited set primarily focused on communication between hospital providers and PCPs. Therefore, the study does not rule out the possibility that other aspects of transitional care may reduce readmissions. Subsequent work investigating innovative interventions may find reductions in readmissions and other important outcomes. Additionally, not all practices have standardized definitions, eg,what 1 PCP considers a verbal handoff may be different from that of another provider. Although we assessed whether communication occurred, we were not able to assess the content or quality of communication, which may have important implications for its effectiveness.37,38
CONCLUSION
Improvements in handoffs between hospital and PCPs may have an important impact on postdischarge outcomes, but it is not clear that unplanned 30-day readmissions is among them. Efforts to reduce postdischarge utilization, if possible, likely need to focus on broader constructs such as caregiver self-efficacy, discharge readiness, and social determinants of health.
Disclosures
This study was supported by a grant from the Lucile Packard Foundation for Children’s Health, Palo Alto, California, as well as grant R40MC25677 Maternal and Child Health Research Program, Maternal and Child Health Bureau (Title V, Social Security Act), Health Resources and Services Administration, Department of Health and Human Services. The authors report no financial conflicts of interest.
References
1. Auger KA, Kenyon CC, Feudtner C, Davis MM. Pediatric hospital discharge interventions to reduce subsequent utilization: a systematic review. J Hosp Med. 2014;9:251-260. PubMed
2. Berry JG, Blaine K, Rogers J, et al. A framework of pediatric hospital discharge care informed by legislation, research, and practice. JAMA Pediatr. 2014;168:955-962; quiz 965-956. PubMed
3. Snow V, Beck D, Budnitz T, et al, American College of Physicians, Society of General Internal Medicine, Society of Hospital Medicine, American Geriatrics Society, American College of Emergency Physicians, Society of Academic Emergency Medicine. Transitions of Care Consensus Policy Statement. American College of Physicians, Society of General Internal Medicine, Society of Hospital Medicine, American Geriatrics Society, American College of Emergency Physicians, Society of Academic Emergency Medicine. J Gen Intern Med. 2009;24:971-976. PubMed
4. Desai AD, Popalisky J, Simon TD, Mangione-Smith RM. The effectiveness of family-centered transition processes from hospital settings to home: a review of the literature. Hosp Pediatr. 2015;5:219-231. PubMed
5. Berry JG, Gay JC. Preventing readmissions in children: how do we do that? Hosp Pediatr. 2015;5:602-604. PubMed
6. Auger KA, Simon TD, Cooperberg D, et al. Summary of STARNet: Seamless Transitions and (Re)admissions Network. Pediatrics. 2015;135:164-175. PubMed
7. Value in inpatient pediatrics network projects. American Academy of Pediatrics. Available at: https://www.aap.org/en-us/professional-resources/quality-improvement/Quality-Improvement-Innovation-Networks/Value-in-Inpatient-Pediatrics-Network/Pages/Value-in-Inpatient-Pediatrics-Network.aspx. Accessed May 18, 2015.
8. Ohio Children’s Hospitals. Solutions for patient safety. Available at: http://www.solutionsforpatientsafety.org/about-us/our-goals/. Accessed May 18, 2015.
9. Bell CM, Schnipper JL, Auerbach AD, et al. Association of communication between hospital-based physicians and primary care providers with patient outcomes. J Gen Intern Med. 2009;24:381-386. PubMed
10. Oduyebo I, Lehmann CU, Pollack CE, et al. Association of self-reported hospital discharge handoffs with 30-day readmissions. JAMA Intern Med. 2013;173:624-629. PubMed
11. van Walraven C, Seth R, Austin PC, Laupacis A. Effect of discharge summary availability during post-discharge visits on hospital readmission. J Gen Intern Med. 2002;17:186-192. PubMed
12. Kashiwagi DT, Burton MC, Kirkland LL, Cha S, Varkey P. Do timely outpatient follow-up visits decrease hospital readmission rates? Am J Med Qual. 2012;27:11-15. PubMed
13. Coller RJ, Klitzner TS, Lerner CF, Chung PJ. Predictors of 30-day readmission and association with primary care follow-up plans. J Pediatr. 2013;163:1027-1033. PubMed
14. Feudtner C, Pati S, Goodman DM, et al. State-level child health system performance and the likelihood of readmission to children’s hospitals. J Pediatr. 2010;157:98-102. PubMed
15. Brittan MS, Sills MR, Fox D, et al. Outpatient follow-up visits and readmission in medically complex children enrolled in Medicaid. J Pediatr. 2015;166:998-1005. PubMed
16. Misky GJ, Wald HL, Coleman EA. Post-hospitalization transitions: Examining the effects of timing of primary care provider follow-up. J Hosp Med. 2010;5:392-397. PubMed
17. Coller RJ, Klitzner TS, Saenz AA, Lerner CF, Nelson BB, Chung PJ. The medical home and hospital readmissions. Pediatrics. 2015;136:e1550-e1560. PubMed
18. Coleman EA, Berenson RA. Lost in transition: challenges and opportunities for improving the quality of transitional care. Ann Intern Med. 2004;141:533-536. PubMed
19. Coleman EA, Boult C; American Geriatrics Society Health Care Systems Committee. Improving the quality of transitional care for persons with complex care needs. J Am Geriatr Soc. 2003;51:556-557. PubMed
20. Berry JG, Hall DE, Kuo DZ, et al. Hospital utilization and characteristics of patients experiencing recurrent readmissions within children’s hospitals. JAMA. 2011;305:682-690. PubMed
21. Feudtner C, Levin JE, Srivastava R, et al. How well can hospital readmission be predicted in a cohort of hospitalized children? A retrospective, multicenter study. Pediatrics. 2009;123:286-293. PubMed
22. Feudtner C, Christakis DA, Connell FA. Pediatric deaths attributable to complex chronic conditions: a population-based study of Washington State, 1980-1997. Pediatrics. 2000;106:205-209. PubMed
23. Feudtner C, Feinstein JA, Zhong W, Hall M, Dai D. Pediatric complex chronic conditions classification system version 2: updated for ICD-10 and complex medical technology dependence and transplantation. BMC Pediatr. 2014;14:199. PubMed
24. Berry JG, Agrawal R, Kuo DZ, et al. Characteristics of hospitalizations for patients who use a structured clinical care program for children with medical complexity. J Pediatr. 2011;159:284-290. PubMed
25. Kuo DZ, Cohen E, Agrawal R, Berry JG, Casey PH. A national profile of caregiver challenges among more medically complex children with special health care needs. Arch Pediatr Adolesc Med. 2011;165:1020-1026. PubMed
26. Parry C, Mahoney E, Chalmers SA, Coleman EA. Assessing the quality of transitional care: further applications of the care transitions measure. Med Care. 2008;46:317-322. PubMed
27. Coleman EA, Mahoney E, Parry C. Assessing the quality of preparation for posthospital care from the patient’s perspective: the care transitions measure. Med Care. 2005;43:246-255. PubMed
28. Berry JG, Ziniel SI, Freeman L, et al. Hospital readmission and parent perceptions of their child’s hospital discharge. Int J Qual Health Care. 2013;25:573-581. PubMed
29. Desai AD, Durkin LK, Jacob-Files EA, Mangione-Smith R. Caregiver perceptions of hospital to home transitions according to medical complexity: a qualitative study. Acad Pediatr. 2016;16:136-144. PubMed
30. Weiss ME, Bobay KL, Bahr SJ, Costa L, Hughes RG, Holland DE. A model for hospital discharge preparation: from case management to care transition. J Nurs Adm. 2015;45:606-614. PubMed
31. Sills MR, Hall M, Colvin JD, et al. Association of social determinants with children’s hospitals’ preventable readmissions performance. JAMA Pediatr. 2016;170:350-358. PubMed
32. Toomey SL, Zaslavsky AM, Elliott MN, et al. The development of a pediatric inpatient experience of care measure: child HCAHPS. Pediatrics. 2015;136:360-369. PubMed
33. Kripalani S, LeFevre F, Phillips CO, Williams MV, Basaviah P, Baker DW. Deficits in communication and information transfer between hospital-based and primary care physicians: implications for patient safety and continuity of care. JAMA. 2007;297:831-841. PubMed
34. Harlan G, Srivastava R, Harrison L, McBride G, Maloney C. Pediatric hospitalists and primary care providers: a communication needs assessment. J Hosp Med. 2009;4:187-193. PubMed
35. Forster AJ, Clark HD, Menard A, et al. Adverse events among medical patients after discharge from hospital. CMAJ. 2004;170:345-349. PubMed
36. Nakamura MM, Toomey SL, Zaslavsky AM, et al. Measuring pediatric hospital readmission rates to drive quality improvement. Acad Pediatr. 2014;14:S39-S46. PubMed
37. Smith K. Effective communication with primary care providers. Pediatr Clin North Am. 2014;61671-679. PubMed
38. Leyenaar JK, Bergert L, Mallory LA, et al. Pediatric primary care providers’ perspectives regarding hospital discharge communication: a mixed methods analysis. Acad Pediatr. 2015;15:61-68. PubMed
Address for correspondence and reprint requests: Ryan J. Coller, Department of Pediatrics, University of Wisconsin, Madison, 600 Highland Ave, Madison, WI 53792; Telephone: 608-265-5545; Fax: 608-265-8074; E-mail: [email protected]
Content Gating
Open Access (article Unlocked/Open Access)
Alternative CME
Consolidated Pubs: Do Not Show Source Publication Logo
The “Things We Do for No Reason” (TWDFNR) series reviews practices which have become common parts of hospital care but which may provide little value to our patients. Practices reviewed in the TWDFNR series do not represent “black and white” conclusions or clinical practice standards, but are meant as a starting place for research and active discussions among hospitalists and patients. We invite you to be part of that discussion. https://www.choosingwisely.org/
Hospitals and health systems worldwide have adopted policies for routine replacement of peripheral intravenous catheters (PIVCs) at prespecified time intervals (range, 48-96 hours). This practice accounts for a large number of PIVC reinsertions and places a significant cost burden on the healthcare infrastructure. The authors of this article examine the evidence that has been used to support this practice.
CASE PRESENTATION
A 67-year-old man with metastatic lung cancer presents to a hospital for pain control and “failure to thrive.” In the emergency department, a left antecubital peripheral intravenous catheter (PIVC) is placed. On admission, a prerenal acute kidney injury is noted. During the patient’s entire hospitalization, normal saline with parenteral hydromorphone is administered. On hospital day 4, the pain is still not adequately controlled, and the intravenous opioid is continued. On morning rounds, an intern notes that the PIVC is functioning well, and there are no signs of irritation. However, the nursing staff reminds the team that the PIVC should be changed because it has been in place for 4 days and is “due for replacement.” The patient does not want to receive another skin puncture for routine venous access. Does the PIVC need to be replaced, per routine?
WHY YOU MIGHT THINK ROUTINE PIVC REPLACEMENT IS HELPFUL
PIVC placement is easily the most common procedure performed in the United States. An estimated 200 million PIVCs are placed each year.1 Given the number of inpatient hospital stays per year in the United States alone—more than 37 million1,2—data regarding the care, maintenance, and complications of PIVCs are essential to the healthcare infrastructure.
The recommendation to routinely replace PIVCs dates to 1981, when the Centers for Disease Control and Prevention3 (CDC) issued a guideline that calls for replacing PIVCs every 24 to 48 hours. Most of the data and studies that established that recommendation originated in the 1970s, when catheters varied in length and material, and precise definitions of complications, such as phlebitis—localized vein inflammation characterized by pain, erythema, tenderness, swelling, and a palpable cord4,5—were not standardized across trials. Research at the time suggested higher rates of complications from IVCs dwelling longer than 48 to 72 hours. The latest (2011) CDC guidelines6,7 softened the recommendation but still concluded, “There is no need to replace peripheral catheters more frequently than every 72-96 hours.”
The 2011 recommendation6,7 is based on findings of a 1983 prospective observational study,8 a 1991 randomized controlled trial (RCT),9 and a 1998 prospective observational study.2 The 1983 and 1991 studies found higher rates of PIVC complications after day 2 of cannulation.8,9 The 1998 study found no increase in the rate of complications after day 3 of catheterization, and its authors, recommending a reevaluation of the need to routinely replace PIVCs, wrote, “[The] hazard for catheter-related complications, phlebitis, catheter-related infections, and mechanical complications did not increase during prolonged catheterization.”2
Results of RCTs conducted by Barker et al.10 (2004) and Nishanth et al.11 (2009) supported the claim that routine replacement of PIVCs leads to lower rates of thrombophlebitis. Nishanth et al. also included site pain and cannula dislodgement in their definition of phlebitis. Neither study compared blood stream infection rates, but both found higher rates of phlebitis between day 2.5 and day 3. However, Cochrane reviewersWebster et al.12 questioned the findings of these 2 trials, given their missing data and possibly biased results and conclusions. In the Barker study, patient numbers (screened, eligible, dropout) were unclear; each patient group was unbalanced; protocol deviations were not reported (possibly a result of incomplete data reporting or inappropriate randomization); and varied definitions of phlebitis were allowed, which may have resulted in more events being included. In the Nishanth study, the 100% phlebitis rate for the clinically indicated replacement group seemed extreme, which suggested confounding by an unknown bias or chance. Last, both samples were small: 47 patients (Barker) and 42 patients (Nishanth). Given all these concerns, the 2 trials were excluded from the Cochrane meta-analysis on the subject.12
In the 1980s and early 1990s, routine removal and exchange of PIVCs were supported by limited evidence. Current well-designed trial data cast doubt on the need for such a practice.
WHY YOU SHOULD NOT ROUTINELY REPLACE PIVCs
According to the CDC,6,7 the issue of routine PIVC replacement remains unresolved: “No recommendation is made regarding replacement of peripheral catheters in adults only when clinically indicated.”
Whereas earlier data showed a higher risk of complications with longer dwelling IVs, the majority of contemporary data has failed to support this conclusion. The recent (2015) Cochrane meta-analysis comparing routine with clinically indicated IVC replacement found “no evidence to support changing catheters every 72-96 hours.”12 Of the 7 studies that fulfilled the criteria for qualitative analysis, only 5 were included (the studies by Barker et al.10 and Nishanth et al.11 were excluded). The included studies assessed the endpoints of catheter-related blood stream infection (CRBSI), phlebitis, phlebitis per device-days, mortality, cost, and infiltration. Statistically significant differences were found only for cost (favoring clinically indicated replacement) and infiltration (occurring less with routine replacement).
The largest and most robust RCT in the meta-analysis12 was conducted by Rickard et al.13 (2012). Their nonblinded, intention-to-treat study of 3283 patients used concealed allocation to randomly assign patients to either clinically indicated or routine PIVC replacement in order to evaluate a primary endpoint, phlebitis. Secondary endpoints were CRBSI, venous port infection, IVC tip colonization, infusion failure, number of IVCs needed per patient, IV therapy duration, cost, and mortality. Need for PIVC replacement was methodically monitored (Table) with extensive nursing education and interrater validation. The study found no difference in the groups’ phlebitis rates; the rate was 7% for both routine and clinically indicated replacement (13.08% and 13.11%, respectively, adjusted for phlebitis per 1000 IVC days). In addition, there was no difference in the secondary outcome measures, except cost and number of catheters used, both of which favored clinically indicated replacement. The most serious complication, CRBSI, occurred at essentially the same rate in the 2 replacement arms: 0.11% (routine) and 0% (clinically indicated). Per-patient cost for the entire course of treatment was A$69.24 in the routine group and A$61.66 in the clinically indicated group; the difference was A$7.58 (P < 0.0001). Mean number of catheters used was 1.9 in the routine group and 1.7 in the clinically indicated group; the difference was 0.21 catheter per patient for the treatment course (P < 0.0001). Overall, the study found no important difference in significant outcomes between the 2 study arms.
Table
The other 4 studies in the meta-analysis12 duplicated these results, with none finding a higher rate of major adverse events.14-17 All 4 showed virtually equivalent rates of phlebitis, the primary outcome; 3 also examined the secondary outcome measure of blood stream infection, and results were similar, with identical rates of complications. Only 1 trial identified any bloodstream infections (1 per group).15 The meta-analysis did find that routine catheter replacement resulted in less catheter infiltration.
Most of the data on PIVC exchange involves phlebitis and other local complications. A prospective study by Stuart et al.18 and commentary by Collignon et al.19 underscore the need for further research targeting blood stream infections (sepsis and severe sepsis in particular) as a primary outcome. Blood stream infections, especially those related to PIVC use, are rare entities overall, with most recent data yielding an estimated rate of 0.5 per 1000 catheter-days.20 Given this epidemiologic finding, researchers trying to acquire meaningful data on PIVC-related blood stream infections and subsequent complications would need to have tens of thousands of patients in routine and clinically indicated replacement arms to sufficiently power their studies.20 As they are infeasible, such trials cannot be found in the scientific literature.
Stuart et al.18 tried addressing the question. Prospectively examining more than 5 million occupied-bed days and the incidence of bloodstream infections by type of intravascular device over a 5-year period, they found that 137 (23.5%) of 583 healthcare-associated Staphylococcus aureus bacteremia (SAB) cases were attributed to PIVC use. PIVC insertions were performed equally (39.6%) in emergency departments and medical wards. About 45% of PIVCs remained in place 4 days or longer. Stuart et al. noted the “significant issue of PIVC-associated SAB” and favored routine removal of PIVCs within 96 hours (4 days). However, 55% of patients in their PIVC-related SAB group had the device in place less than 4 days. In addition, overall incidence of SAB was low: 0.3 per 10,000 occupied-bed days. Further, their study did not adjust device-specific SAB incidence for frequency of device use. For example, the rate of healthcare-acquired SAB was 19.7% for central venous catheters and 23.5% for PIVCs, despite PIVCs being used significantly more often than central lines. Device-specific adjustments would show a vastly different absolute risk of SAB in relation to individual devices. Nevertheless, the overall benefit of and need for routine PIVC replacement must be questioned. The percentage of PIVC-associated SAB in their study and the need for more research in this area should be noted. Given current information, their study and others in the literature underscore the need for selective use, appropriate maintenance, and timely removal of PIVCs.
Pure clinical outcomes are important, but procedural costs are as well. Clinically indicated replacement helps patients avoid an unpleasant procedure and saves money.21 If one third of the 37 million annual inpatient admissions require a PIVC for more than 3 days, then a strategy of “replacement when clinically indicated” could prevent almost 2.5 million unnecessary PIVC insertions each year. Equipment cost savings combined with savings of nearly 1 million staff hours could yield an estimated $400 million in savings over a 5-year period.22 Given current data suggesting no harm from clinically indicated PIVC replacement and clear evidence that routine replacement increases needle sticks and costs, it seems time to end the practice of routine PIVC replacement.
RECOMMENDATIONS
Compared with clinically indicated catheter replacement, routine replacement in the absence of a clinical indication (eg, infiltration, phlebitis, infection) provides no added benefit. Studies have consistently found that rates of phlebitis and SAB are not affected by scheduled replacement, though the largest RCT may not have been powered to show a difference in SAB. The present authors’ recommendations for PIVC care are:
Scrutinize each patient’s need for PIVCs and remove each PIVC as soon as possible.
Do not make routine replacement of otherwise well-functioning, well-appearing clinically necessary PIVCs the standard of care.
Regularly examine PIVC sites for signs and symptoms of infection.
Remove a PIVC immediately on recognition of any clinical sign of a complication (eg, infiltration, phlebitis, localized infection, blood stream infection) and replace the PIVC only if there is a clinical need.
If replacing PIVCs on a clinical basis, establish protocols for frequency of evaluation for complications; these protocols might mirror those from prior studies (Table).10,22
Replace as soon as possible any PIVC inserted during an urgent or emergent situation in which proper insertion technique could not be guaranteed.
Conduct real-world observational studies to ensure that the switch to clinically driven replacement is safe and develop standardized definitions of complications.
Given the literature findings and the preceding recommendations, the authors conclude that the patient in the case example does not need routine PIVC replacement. His PIVC may remain in place as long as evaluation for local complications is routinely and methodically performed and the device is removed as soon as it is deemed unnecessary (transition to oral opioid therapy).
CONCLUSION
The long-standing practice of routinely replacing PIVCs every 72 to 96 hours during a hospital stay does not affect any meaningful clinical outcome. Specifically, data do not show that routine replacement prevents phlebitis or blood stream infections. Furthermore, routine PIVC replacement increases patient discomfort, uses resources unnecessarily, and raises hospital costs. Most of the PIVC research has involved phlebitis and other local complications; more research on PIVC use and bloodstream infections is needed. Given the findings in the current literature, routine PIVC replacement should be considered a Thing We Do For No Reason.
Disclosure
Nothing to report.
Do you think this is a low-value practice? Is this truly a “Thing We Do for No Reason”? Share what you do in your practice and join in the conversation online by retweeting it on Twitter (#TWDFNR) and liking it on Facebook. We invite you to propose ideas for other “Things We Do for No Reason” topics by emailing [email protected].
References
1. Mermel LA, Allon M, Bouza E, et al. Clinical practice guidelines for the diagnosis and management of intravascular catheter-related infection: 2009 update by the Infectious Diseases Society of America. Clin Infect Dis. 2009;49(1):1-45. PubMed
3. Centers for Disease Control Working Group. Guidelines for prevention of intravenous therapy-related infections. Infect Control. 1981;3:62-79.
4. Hershey CO, Tomford JW, McLaren CE, Porter DK, Cohen DI. The natural history of intravenous catheter-associated phlebitis. Arch Intern Med. 1984;144(7):1373-1375. PubMed
5. Widmer AF. IV-related infections. In: Wenzel RP, ed. Prevention and Control of Nosocomial Infections. 3rd ed. Baltimore, MD: Williams & Wilkins; 1997:556-579.
6. O’Grady NP, Alexander M, Burns LA, et al; Healthcare Infection Control Practices Advisory Committee (HICPAC). Guidelines for the Prevention of Intravascular Catheter-Related Infections, 2011. Centers for Disease Control and Prevention website. http://www.cdc.gov/hicpac/pdf/guidelines/bsi-guidelines-2011.pdf. Published April 1, 2011. Accessed November 5, 2016. PubMed
7. O’Grady NP, Alexander M, Burns LA, et al; Healthcare Infection Control Practices Advisory Committee (HICPAC). Guidelines for the prevention of intravascular catheter-related infections. Clin Infect Dis. 2011;52(9):e162-e193. PubMed
8. Rhode Island Nosocomial Infection Consortium; Tager IB, Ginsberg MB, Ellis SE, et al. An epidemiologic study of the risks associated with peripheral intravenous catheters. Am J Epidemiol. 1983;118(6):839-851. PubMed
9. Maki DG, Ringer M. Risk factors for infusion-related phlebitis with small peripheral venous catheters. A randomized controlled trial. Ann Intern Med. 1991;114(10):845-854. PubMed
10. Barker P, Anderson AD, MacFie J. Randomised clinical trial of elective re-siting of intravenous cannulae. Ann R Coll Surg Engl. 2004;86(4):281-283. PubMed
11. Nishanth S, Sivaram G, Kalayarasan R, Kate V, Ananthakrishnan N. Does elective re-siting of intravenous cannulae decrease peripheral thrombophlebitis? A randomized controlled study. Int Med J India. 2009;22(2):60-62. PubMed
12. Webster J, Osborne S, Rickard CM, New K. Clinically-indicated replacement versus routine replacement of peripheral venous catheters. Cochrane Database Syst Rev. 2015;(8):CD007798. PubMed
13. Rickard CM, Webster J, Wallis MC, et al. Routine versus clinically indicated replacement of peripheral intravenous catheters: a randomised controlled equivalence trial. Lancet. 2012;380(9847):1066-1074. PubMed
14. Webster J, Lloyd S, Hopkins T, Osborne S, Yaxley M. Developing a Research base for Intravenous Peripheral cannula re-sites (DRIP trial). A randomised controlled trial of hospital in-patients. Int J Nurs Stud. 2007;44(5):664-671. PubMed
15. Webster J, Clarke S, Paterson D, et al. Routine care of peripheral intravenous catheters versus clinically indicated replacement: randomised controlled trial. BMJ. 2008;337:a339. PubMed
16. Van Donk P, Rickard CM, McGrail MR, Doolan G. Routine replacement versus clinical monitoring of peripheral intravenous catheters in a regional hospital in the home program: a randomized controlled trial. Infect Control Hosp Epidemiol. 2009;30(9):915-917. PubMed
17. Rickard CM, McCann D, Munnings J, McGrail MR. Routine resite of peripheral intravenous devices every 3 days did not reduce complications compared with clinically indicated resite: a randomised controlled trial. BMC Med. 2010;8:53. PubMed
18. Stuart RL, Cameron DR, Scott C, et al. Peripheral intravenous catheter-associated Staphylococcus aureus bacteraemia: more than 5 years of prospective data from two tertiary health services. Med J Aust. 2013;198(10):551-553. PubMed
19. Collignon PJ, Kimber FJ, Beckingham WD, Roberts JL. Prevention of peripheral intravenous catheter-related bloodstream infections: the need for routine replacement [letter]. Med J Aust. 2013;199(11):750-751. PubMed
20. Maki DG, Kluger DM, Crnich CJ. The risk of bloodstream infection in adults with different intravascular devices: a systematic review of 200 published prospective studies. Mayo Clin Proc. 2006:81(9):1159-1171. PubMed
21. Tuffaha HW, Rickard CM, Webster J, et al. Cost-effectiveness analysis of clinically indicated versus routine replacement of peripheral intravenous catheters. Appl Health Econ Health Policy. 2014;12(1):51-58. PubMed
22. Rickard CM, Webster J, Playford EG. Prevention of peripheral intravenous catheter-related bloodstream infections: the need for a new focus. Med J Aust. 2013;198(10):519-520. PubMed
The “Things We Do for No Reason” (TWDFNR) series reviews practices which have become common parts of hospital care but which may provide little value to our patients. Practices reviewed in the TWDFNR series do not represent “black and white” conclusions or clinical practice standards, but are meant as a starting place for research and active discussions among hospitalists and patients. We invite you to be part of that discussion. https://www.choosingwisely.org/
Hospitals and health systems worldwide have adopted policies for routine replacement of peripheral intravenous catheters (PIVCs) at prespecified time intervals (range, 48-96 hours). This practice accounts for a large number of PIVC reinsertions and places a significant cost burden on the healthcare infrastructure. The authors of this article examine the evidence that has been used to support this practice.
CASE PRESENTATION
A 67-year-old man with metastatic lung cancer presents to a hospital for pain control and “failure to thrive.” In the emergency department, a left antecubital peripheral intravenous catheter (PIVC) is placed. On admission, a prerenal acute kidney injury is noted. During the patient’s entire hospitalization, normal saline with parenteral hydromorphone is administered. On hospital day 4, the pain is still not adequately controlled, and the intravenous opioid is continued. On morning rounds, an intern notes that the PIVC is functioning well, and there are no signs of irritation. However, the nursing staff reminds the team that the PIVC should be changed because it has been in place for 4 days and is “due for replacement.” The patient does not want to receive another skin puncture for routine venous access. Does the PIVC need to be replaced, per routine?
WHY YOU MIGHT THINK ROUTINE PIVC REPLACEMENT IS HELPFUL
PIVC placement is easily the most common procedure performed in the United States. An estimated 200 million PIVCs are placed each year.1 Given the number of inpatient hospital stays per year in the United States alone—more than 37 million1,2—data regarding the care, maintenance, and complications of PIVCs are essential to the healthcare infrastructure.
The recommendation to routinely replace PIVCs dates to 1981, when the Centers for Disease Control and Prevention3 (CDC) issued a guideline that calls for replacing PIVCs every 24 to 48 hours. Most of the data and studies that established that recommendation originated in the 1970s, when catheters varied in length and material, and precise definitions of complications, such as phlebitis—localized vein inflammation characterized by pain, erythema, tenderness, swelling, and a palpable cord4,5—were not standardized across trials. Research at the time suggested higher rates of complications from IVCs dwelling longer than 48 to 72 hours. The latest (2011) CDC guidelines6,7 softened the recommendation but still concluded, “There is no need to replace peripheral catheters more frequently than every 72-96 hours.”
The 2011 recommendation6,7 is based on findings of a 1983 prospective observational study,8 a 1991 randomized controlled trial (RCT),9 and a 1998 prospective observational study.2 The 1983 and 1991 studies found higher rates of PIVC complications after day 2 of cannulation.8,9 The 1998 study found no increase in the rate of complications after day 3 of catheterization, and its authors, recommending a reevaluation of the need to routinely replace PIVCs, wrote, “[The] hazard for catheter-related complications, phlebitis, catheter-related infections, and mechanical complications did not increase during prolonged catheterization.”2
Results of RCTs conducted by Barker et al.10 (2004) and Nishanth et al.11 (2009) supported the claim that routine replacement of PIVCs leads to lower rates of thrombophlebitis. Nishanth et al. also included site pain and cannula dislodgement in their definition of phlebitis. Neither study compared blood stream infection rates, but both found higher rates of phlebitis between day 2.5 and day 3. However, Cochrane reviewersWebster et al.12 questioned the findings of these 2 trials, given their missing data and possibly biased results and conclusions. In the Barker study, patient numbers (screened, eligible, dropout) were unclear; each patient group was unbalanced; protocol deviations were not reported (possibly a result of incomplete data reporting or inappropriate randomization); and varied definitions of phlebitis were allowed, which may have resulted in more events being included. In the Nishanth study, the 100% phlebitis rate for the clinically indicated replacement group seemed extreme, which suggested confounding by an unknown bias or chance. Last, both samples were small: 47 patients (Barker) and 42 patients (Nishanth). Given all these concerns, the 2 trials were excluded from the Cochrane meta-analysis on the subject.12
In the 1980s and early 1990s, routine removal and exchange of PIVCs were supported by limited evidence. Current well-designed trial data cast doubt on the need for such a practice.
WHY YOU SHOULD NOT ROUTINELY REPLACE PIVCs
According to the CDC,6,7 the issue of routine PIVC replacement remains unresolved: “No recommendation is made regarding replacement of peripheral catheters in adults only when clinically indicated.”
Whereas earlier data showed a higher risk of complications with longer dwelling IVs, the majority of contemporary data has failed to support this conclusion. The recent (2015) Cochrane meta-analysis comparing routine with clinically indicated IVC replacement found “no evidence to support changing catheters every 72-96 hours.”12 Of the 7 studies that fulfilled the criteria for qualitative analysis, only 5 were included (the studies by Barker et al.10 and Nishanth et al.11 were excluded). The included studies assessed the endpoints of catheter-related blood stream infection (CRBSI), phlebitis, phlebitis per device-days, mortality, cost, and infiltration. Statistically significant differences were found only for cost (favoring clinically indicated replacement) and infiltration (occurring less with routine replacement).
The largest and most robust RCT in the meta-analysis12 was conducted by Rickard et al.13 (2012). Their nonblinded, intention-to-treat study of 3283 patients used concealed allocation to randomly assign patients to either clinically indicated or routine PIVC replacement in order to evaluate a primary endpoint, phlebitis. Secondary endpoints were CRBSI, venous port infection, IVC tip colonization, infusion failure, number of IVCs needed per patient, IV therapy duration, cost, and mortality. Need for PIVC replacement was methodically monitored (Table) with extensive nursing education and interrater validation. The study found no difference in the groups’ phlebitis rates; the rate was 7% for both routine and clinically indicated replacement (13.08% and 13.11%, respectively, adjusted for phlebitis per 1000 IVC days). In addition, there was no difference in the secondary outcome measures, except cost and number of catheters used, both of which favored clinically indicated replacement. The most serious complication, CRBSI, occurred at essentially the same rate in the 2 replacement arms: 0.11% (routine) and 0% (clinically indicated). Per-patient cost for the entire course of treatment was A$69.24 in the routine group and A$61.66 in the clinically indicated group; the difference was A$7.58 (P < 0.0001). Mean number of catheters used was 1.9 in the routine group and 1.7 in the clinically indicated group; the difference was 0.21 catheter per patient for the treatment course (P < 0.0001). Overall, the study found no important difference in significant outcomes between the 2 study arms.
Table
The other 4 studies in the meta-analysis12 duplicated these results, with none finding a higher rate of major adverse events.14-17 All 4 showed virtually equivalent rates of phlebitis, the primary outcome; 3 also examined the secondary outcome measure of blood stream infection, and results were similar, with identical rates of complications. Only 1 trial identified any bloodstream infections (1 per group).15 The meta-analysis did find that routine catheter replacement resulted in less catheter infiltration.
Most of the data on PIVC exchange involves phlebitis and other local complications. A prospective study by Stuart et al.18 and commentary by Collignon et al.19 underscore the need for further research targeting blood stream infections (sepsis and severe sepsis in particular) as a primary outcome. Blood stream infections, especially those related to PIVC use, are rare entities overall, with most recent data yielding an estimated rate of 0.5 per 1000 catheter-days.20 Given this epidemiologic finding, researchers trying to acquire meaningful data on PIVC-related blood stream infections and subsequent complications would need to have tens of thousands of patients in routine and clinically indicated replacement arms to sufficiently power their studies.20 As they are infeasible, such trials cannot be found in the scientific literature.
Stuart et al.18 tried addressing the question. Prospectively examining more than 5 million occupied-bed days and the incidence of bloodstream infections by type of intravascular device over a 5-year period, they found that 137 (23.5%) of 583 healthcare-associated Staphylococcus aureus bacteremia (SAB) cases were attributed to PIVC use. PIVC insertions were performed equally (39.6%) in emergency departments and medical wards. About 45% of PIVCs remained in place 4 days or longer. Stuart et al. noted the “significant issue of PIVC-associated SAB” and favored routine removal of PIVCs within 96 hours (4 days). However, 55% of patients in their PIVC-related SAB group had the device in place less than 4 days. In addition, overall incidence of SAB was low: 0.3 per 10,000 occupied-bed days. Further, their study did not adjust device-specific SAB incidence for frequency of device use. For example, the rate of healthcare-acquired SAB was 19.7% for central venous catheters and 23.5% for PIVCs, despite PIVCs being used significantly more often than central lines. Device-specific adjustments would show a vastly different absolute risk of SAB in relation to individual devices. Nevertheless, the overall benefit of and need for routine PIVC replacement must be questioned. The percentage of PIVC-associated SAB in their study and the need for more research in this area should be noted. Given current information, their study and others in the literature underscore the need for selective use, appropriate maintenance, and timely removal of PIVCs.
Pure clinical outcomes are important, but procedural costs are as well. Clinically indicated replacement helps patients avoid an unpleasant procedure and saves money.21 If one third of the 37 million annual inpatient admissions require a PIVC for more than 3 days, then a strategy of “replacement when clinically indicated” could prevent almost 2.5 million unnecessary PIVC insertions each year. Equipment cost savings combined with savings of nearly 1 million staff hours could yield an estimated $400 million in savings over a 5-year period.22 Given current data suggesting no harm from clinically indicated PIVC replacement and clear evidence that routine replacement increases needle sticks and costs, it seems time to end the practice of routine PIVC replacement.
RECOMMENDATIONS
Compared with clinically indicated catheter replacement, routine replacement in the absence of a clinical indication (eg, infiltration, phlebitis, infection) provides no added benefit. Studies have consistently found that rates of phlebitis and SAB are not affected by scheduled replacement, though the largest RCT may not have been powered to show a difference in SAB. The present authors’ recommendations for PIVC care are:
Scrutinize each patient’s need for PIVCs and remove each PIVC as soon as possible.
Do not make routine replacement of otherwise well-functioning, well-appearing clinically necessary PIVCs the standard of care.
Regularly examine PIVC sites for signs and symptoms of infection.
Remove a PIVC immediately on recognition of any clinical sign of a complication (eg, infiltration, phlebitis, localized infection, blood stream infection) and replace the PIVC only if there is a clinical need.
If replacing PIVCs on a clinical basis, establish protocols for frequency of evaluation for complications; these protocols might mirror those from prior studies (Table).10,22
Replace as soon as possible any PIVC inserted during an urgent or emergent situation in which proper insertion technique could not be guaranteed.
Conduct real-world observational studies to ensure that the switch to clinically driven replacement is safe and develop standardized definitions of complications.
Given the literature findings and the preceding recommendations, the authors conclude that the patient in the case example does not need routine PIVC replacement. His PIVC may remain in place as long as evaluation for local complications is routinely and methodically performed and the device is removed as soon as it is deemed unnecessary (transition to oral opioid therapy).
CONCLUSION
The long-standing practice of routinely replacing PIVCs every 72 to 96 hours during a hospital stay does not affect any meaningful clinical outcome. Specifically, data do not show that routine replacement prevents phlebitis or blood stream infections. Furthermore, routine PIVC replacement increases patient discomfort, uses resources unnecessarily, and raises hospital costs. Most of the PIVC research has involved phlebitis and other local complications; more research on PIVC use and bloodstream infections is needed. Given the findings in the current literature, routine PIVC replacement should be considered a Thing We Do For No Reason.
Disclosure
Nothing to report.
Do you think this is a low-value practice? Is this truly a “Thing We Do for No Reason”? Share what you do in your practice and join in the conversation online by retweeting it on Twitter (#TWDFNR) and liking it on Facebook. We invite you to propose ideas for other “Things We Do for No Reason” topics by emailing [email protected].
References
1. Mermel LA, Allon M, Bouza E, et al. Clinical practice guidelines for the diagnosis and management of intravascular catheter-related infection: 2009 update by the Infectious Diseases Society of America. Clin Infect Dis. 2009;49(1):1-45. PubMed
3. Centers for Disease Control Working Group. Guidelines for prevention of intravenous therapy-related infections. Infect Control. 1981;3:62-79.
4. Hershey CO, Tomford JW, McLaren CE, Porter DK, Cohen DI. The natural history of intravenous catheter-associated phlebitis. Arch Intern Med. 1984;144(7):1373-1375. PubMed
5. Widmer AF. IV-related infections. In: Wenzel RP, ed. Prevention and Control of Nosocomial Infections. 3rd ed. Baltimore, MD: Williams & Wilkins; 1997:556-579.
6. O’Grady NP, Alexander M, Burns LA, et al; Healthcare Infection Control Practices Advisory Committee (HICPAC). Guidelines for the Prevention of Intravascular Catheter-Related Infections, 2011. Centers for Disease Control and Prevention website. http://www.cdc.gov/hicpac/pdf/guidelines/bsi-guidelines-2011.pdf. Published April 1, 2011. Accessed November 5, 2016. PubMed
7. O’Grady NP, Alexander M, Burns LA, et al; Healthcare Infection Control Practices Advisory Committee (HICPAC). Guidelines for the prevention of intravascular catheter-related infections. Clin Infect Dis. 2011;52(9):e162-e193. PubMed
8. Rhode Island Nosocomial Infection Consortium; Tager IB, Ginsberg MB, Ellis SE, et al. An epidemiologic study of the risks associated with peripheral intravenous catheters. Am J Epidemiol. 1983;118(6):839-851. PubMed
9. Maki DG, Ringer M. Risk factors for infusion-related phlebitis with small peripheral venous catheters. A randomized controlled trial. Ann Intern Med. 1991;114(10):845-854. PubMed
10. Barker P, Anderson AD, MacFie J. Randomised clinical trial of elective re-siting of intravenous cannulae. Ann R Coll Surg Engl. 2004;86(4):281-283. PubMed
11. Nishanth S, Sivaram G, Kalayarasan R, Kate V, Ananthakrishnan N. Does elective re-siting of intravenous cannulae decrease peripheral thrombophlebitis? A randomized controlled study. Int Med J India. 2009;22(2):60-62. PubMed
12. Webster J, Osborne S, Rickard CM, New K. Clinically-indicated replacement versus routine replacement of peripheral venous catheters. Cochrane Database Syst Rev. 2015;(8):CD007798. PubMed
13. Rickard CM, Webster J, Wallis MC, et al. Routine versus clinically indicated replacement of peripheral intravenous catheters: a randomised controlled equivalence trial. Lancet. 2012;380(9847):1066-1074. PubMed
14. Webster J, Lloyd S, Hopkins T, Osborne S, Yaxley M. Developing a Research base for Intravenous Peripheral cannula re-sites (DRIP trial). A randomised controlled trial of hospital in-patients. Int J Nurs Stud. 2007;44(5):664-671. PubMed
15. Webster J, Clarke S, Paterson D, et al. Routine care of peripheral intravenous catheters versus clinically indicated replacement: randomised controlled trial. BMJ. 2008;337:a339. PubMed
16. Van Donk P, Rickard CM, McGrail MR, Doolan G. Routine replacement versus clinical monitoring of peripheral intravenous catheters in a regional hospital in the home program: a randomized controlled trial. Infect Control Hosp Epidemiol. 2009;30(9):915-917. PubMed
17. Rickard CM, McCann D, Munnings J, McGrail MR. Routine resite of peripheral intravenous devices every 3 days did not reduce complications compared with clinically indicated resite: a randomised controlled trial. BMC Med. 2010;8:53. PubMed
18. Stuart RL, Cameron DR, Scott C, et al. Peripheral intravenous catheter-associated Staphylococcus aureus bacteraemia: more than 5 years of prospective data from two tertiary health services. Med J Aust. 2013;198(10):551-553. PubMed
19. Collignon PJ, Kimber FJ, Beckingham WD, Roberts JL. Prevention of peripheral intravenous catheter-related bloodstream infections: the need for routine replacement [letter]. Med J Aust. 2013;199(11):750-751. PubMed
20. Maki DG, Kluger DM, Crnich CJ. The risk of bloodstream infection in adults with different intravascular devices: a systematic review of 200 published prospective studies. Mayo Clin Proc. 2006:81(9):1159-1171. PubMed
21. Tuffaha HW, Rickard CM, Webster J, et al. Cost-effectiveness analysis of clinically indicated versus routine replacement of peripheral intravenous catheters. Appl Health Econ Health Policy. 2014;12(1):51-58. PubMed
22. Rickard CM, Webster J, Playford EG. Prevention of peripheral intravenous catheter-related bloodstream infections: the need for a new focus. Med J Aust. 2013;198(10):519-520. PubMed
Address for correspondence and reprint requests: Sanjay A. Patel, MD, Division of Hospital Medicine, Department of Medicine, John H. Stroger, Jr. Hospital of Cook County, Room 570A, Administration Building, 1901 W Harrison St, Chicago, IL 60612; Telephone: 312-864-4522; Fax: 312-864-9958; E-mail: [email protected]
Content Gating
Open Access (article Unlocked/Open Access)
Alternative CME
Consolidated Pubs: Do Not Show Source Publication Logo