User login
Bedside manners: How to deal with delirium
During my training in Leiden, Netherlands, I was infused with the lessons of Herman Boerhaave (1668–1738), the professor who is considered the pioneer of bedside teaching.1 This practice had begun in Padua and was then brought to Leiden, where Boerhaave transformed it into an art form. At the Caecilia hospital, the municipal clerics provided Boerhaave with 2 wards for teaching; 1 with 6 beds for men and the other with 6 beds for women. Medical historian Henry Sigerist2 has commented that half the physicians of Europe were trained on these 12 beds.
Boerhaave made daily rounds with his students, examining the patients, reviewing their histories, and inspecting their urine. He considered postmortem examinations essential and made his students attend the autopsies of patients who died: “In spite of the most detailed description of all disease phenomena one does not know anything of the cause until one has opened the body.”2
What was once the basis of clinical medicine is now fading, with both clinical rounds and autopsies being replaced by imaging techniques of body parts and automated analysis of Vacutainer samples. These novelties provide us with far more diagnostic accuracy than Boerhaave had, and randomized controlled trials provide us with an evidence base. But bedside observation and case reports are still relevant,3 and autopsies still reveal important, clinically missed diagnoses.4
In this issue of the Journal, Imm et al5 describe a case of presumed postoperative delirium in a 64-year-old hospitalized patient. They remind us that crucial signs and symptoms can guide how to use our modern diagnostic tools.
DELIRIUM IS OFTEN OVERLOOKED
Delirium is often overlooked by physicians. But why? The characteristic disturbances in attention and cognition are easy to interpret, while the various observation scales have high sensitivity and should signal the need for further interrogation. Perhaps the reason we often overlook the signs and symptoms is that we assume that delirium is just normal sickness behavior.
Another reason we may fail to recognize the syndrome is more fundamental and closely related to how we practice medicine. These days, we place such trust in high-tech diagnostics that we feel the modern procedures supersede the classic examination of patients. But mental disturbances can only be detected by history-taking and clinical observation.
Moreover, the actual mental state is less important than the subtle changes in it. A continuously disturbed mind does not pose a problem, but a casual remark by a family member or informal caregiver that “his mood has changed” should seize our attention.6
Here, the fragmented and disconnected practice of modern medicine takes its toll. Shorter working hours have helped to preserve our own mental performance, but at the cost of being less able to follow the patient’s mental status over time and to recognize a change of behavior. Applying repeated, standardized assessments of these vital signs may help solve the problem, but repeated observations are easily neglected, as are body temperature, blood pressure, and others.
DELIRIUM IS SERIOUS
Imm et al also remind us that delirium is serious. The case-fatality rate in delirium equals that in acute cardiovascular events or metastatic cancer, even though its impact is often not thought to be as severe. Far too often the mental symptoms are dismissed and judged to be something to be handled in the outpatient clinic after the acute problems are addressed.
In part, this may be because no professional society or advocacy group is promoting the recognition, diagnosis, and treatment of delirium or pushing for incentives to do so. We have cardiologists and oncologists but not deliriologists. But in a way, it may be a good thing that no specialist group “owns” delirium, as the syndrome is elicited by various underlying disease mechanisms, and every physician should be vigilant to recognize it.
DELIRIUM REQUIRES PROMPT MANAGEMENT
If delirium is a life-threatening condition, it necessitates a prompt and coordinated series of diagnostic actions, judgments, and decisions.7 Although most delirious patients are not admitted to an intensive care unit, they should be considered critically ill and must be provided a corresponding level of care. Here, the old clinical aphorism holds: action should be taken before the sun sets or rises. Attention should be on worsening of the underlying disease, unexpected comorbid conditions, and side effects of our interventions.
As the case reported by Imm et al shows, the causative factors may be recognized only after in-depth examination.4 The pathogenesis of delirium is poorly understood, and there is no specific therapy for it. There is not even conclusive evidence that the standard use of antipsychotics is beneficial, whereas their side effects cannot be overestimated.7 Our interventions are aimed at eliminating the underlying pathologies that have triggered the delirious state, as well as on preventing complications of the mental disturbance.
Many of us have had the experience of watching one of our children develop fever and confusion. When our older patients become delirious, it should raise the same level of alarm and activity as when it happens in a child.
- Koehler U, Hildebrandt O, Koehler J, Nell C. The pioneer of bedside teaching—Herman Boerhaave (1668–1738). Dtsch Med Wochenschr 2014; 139:2655–2659.
- Sigerist HE. A History of Medicine. New York: Oxford University Press 1951;1. [According to Walker HK. Chapter 1. The origins of the history and physical examination. In: Walker HK, Hall WD, Hurst JW, editors. Clinical Methods: The History, Physical, and Laboratory Examinations. 3rd ed. Boston: Buterworths, 1990.] www.ncbi.nlm.nih.gov/books/NBK458. Accessed August 7, 2017.
- Vandenbroucke JP. In defense of case reports and case series. Ann Intern Med 2001; 134:330–334.
- Shojania KG, Burton EC, McDonald KM, Goldman M. Changes in rates of autopsy-detected diagnostic errors over time: a systematic review. JAMA 2003; 289:2849–2856.
- Imm M, Torres LF, Kottapally M. Postoperative delirium in a 64-year-old woman. Cleve Clinic J Med 2017; 84:690–698.
- Steis MR, Evans L, Hirschman KB, et al. Screening for delirium using family caregivers: convergent validity of the family confusion assessment method and interviewer-rated confusion assessment method. J Am Geriatr Soc 2012; 60:2121–2126.
- Inouye SK, Westendorp RGJ, Saczynski JS. Delirium in elderly people Lancet 2014; 383:911–922.
During my training in Leiden, Netherlands, I was infused with the lessons of Herman Boerhaave (1668–1738), the professor who is considered the pioneer of bedside teaching.1 This practice had begun in Padua and was then brought to Leiden, where Boerhaave transformed it into an art form. At the Caecilia hospital, the municipal clerics provided Boerhaave with 2 wards for teaching; 1 with 6 beds for men and the other with 6 beds for women. Medical historian Henry Sigerist2 has commented that half the physicians of Europe were trained on these 12 beds.
Boerhaave made daily rounds with his students, examining the patients, reviewing their histories, and inspecting their urine. He considered postmortem examinations essential and made his students attend the autopsies of patients who died: “In spite of the most detailed description of all disease phenomena one does not know anything of the cause until one has opened the body.”2
What was once the basis of clinical medicine is now fading, with both clinical rounds and autopsies being replaced by imaging techniques of body parts and automated analysis of Vacutainer samples. These novelties provide us with far more diagnostic accuracy than Boerhaave had, and randomized controlled trials provide us with an evidence base. But bedside observation and case reports are still relevant,3 and autopsies still reveal important, clinically missed diagnoses.4
In this issue of the Journal, Imm et al5 describe a case of presumed postoperative delirium in a 64-year-old hospitalized patient. They remind us that crucial signs and symptoms can guide how to use our modern diagnostic tools.
DELIRIUM IS OFTEN OVERLOOKED
Delirium is often overlooked by physicians. But why? The characteristic disturbances in attention and cognition are easy to interpret, while the various observation scales have high sensitivity and should signal the need for further interrogation. Perhaps the reason we often overlook the signs and symptoms is that we assume that delirium is just normal sickness behavior.
Another reason we may fail to recognize the syndrome is more fundamental and closely related to how we practice medicine. These days, we place such trust in high-tech diagnostics that we feel the modern procedures supersede the classic examination of patients. But mental disturbances can only be detected by history-taking and clinical observation.
Moreover, the actual mental state is less important than the subtle changes in it. A continuously disturbed mind does not pose a problem, but a casual remark by a family member or informal caregiver that “his mood has changed” should seize our attention.6
Here, the fragmented and disconnected practice of modern medicine takes its toll. Shorter working hours have helped to preserve our own mental performance, but at the cost of being less able to follow the patient’s mental status over time and to recognize a change of behavior. Applying repeated, standardized assessments of these vital signs may help solve the problem, but repeated observations are easily neglected, as are body temperature, blood pressure, and others.
DELIRIUM IS SERIOUS
Imm et al also remind us that delirium is serious. The case-fatality rate in delirium equals that in acute cardiovascular events or metastatic cancer, even though its impact is often not thought to be as severe. Far too often the mental symptoms are dismissed and judged to be something to be handled in the outpatient clinic after the acute problems are addressed.
In part, this may be because no professional society or advocacy group is promoting the recognition, diagnosis, and treatment of delirium or pushing for incentives to do so. We have cardiologists and oncologists but not deliriologists. But in a way, it may be a good thing that no specialist group “owns” delirium, as the syndrome is elicited by various underlying disease mechanisms, and every physician should be vigilant to recognize it.
DELIRIUM REQUIRES PROMPT MANAGEMENT
If delirium is a life-threatening condition, it necessitates a prompt and coordinated series of diagnostic actions, judgments, and decisions.7 Although most delirious patients are not admitted to an intensive care unit, they should be considered critically ill and must be provided a corresponding level of care. Here, the old clinical aphorism holds: action should be taken before the sun sets or rises. Attention should be on worsening of the underlying disease, unexpected comorbid conditions, and side effects of our interventions.
As the case reported by Imm et al shows, the causative factors may be recognized only after in-depth examination.4 The pathogenesis of delirium is poorly understood, and there is no specific therapy for it. There is not even conclusive evidence that the standard use of antipsychotics is beneficial, whereas their side effects cannot be overestimated.7 Our interventions are aimed at eliminating the underlying pathologies that have triggered the delirious state, as well as on preventing complications of the mental disturbance.
Many of us have had the experience of watching one of our children develop fever and confusion. When our older patients become delirious, it should raise the same level of alarm and activity as when it happens in a child.
- Koehler U, Hildebrandt O, Koehler J, Nell C. The pioneer of bedside teaching—Herman Boerhaave (1668–1738). Dtsch Med Wochenschr 2014; 139:2655–2659.
- Sigerist HE. A History of Medicine. New York: Oxford University Press 1951;1. [According to Walker HK. Chapter 1. The origins of the history and physical examination. In: Walker HK, Hall WD, Hurst JW, editors. Clinical Methods: The History, Physical, and Laboratory Examinations. 3rd ed. Boston: Buterworths, 1990.] www.ncbi.nlm.nih.gov/books/NBK458. Accessed August 7, 2017.
- Vandenbroucke JP. In defense of case reports and case series. Ann Intern Med 2001; 134:330–334.
- Shojania KG, Burton EC, McDonald KM, Goldman M. Changes in rates of autopsy-detected diagnostic errors over time: a systematic review. JAMA 2003; 289:2849–2856.
- Imm M, Torres LF, Kottapally M. Postoperative delirium in a 64-year-old woman. Cleve Clinic J Med 2017; 84:690–698.
- Steis MR, Evans L, Hirschman KB, et al. Screening for delirium using family caregivers: convergent validity of the family confusion assessment method and interviewer-rated confusion assessment method. J Am Geriatr Soc 2012; 60:2121–2126.
- Inouye SK, Westendorp RGJ, Saczynski JS. Delirium in elderly people Lancet 2014; 383:911–922.

Watson, the game is a foot…or a palm
What common message do a 64-year-old woman with postoperative cognitive changes and an 83-year-old man with red palms have for us as physicians? As I read their clinical scenarios and the editorial by Westendorp, I was struck by the value and significance of informed clinical observation, an activity that I fear is going the way of the music CD and handwritten letters.
As I read the descriptions of these patients I was reminded of the internal satisfaction that I feel when I pick up a clinical or historical finding that directs me to a specific diagnosis and therapeutic recommendation. Sherlock Holmes I am not. Those satisfying pickups are infrequent, and I have no idea how many clues I have missed. I do know that most come from taking the time to perform a methodical physical examination, directed and informed by the patient’s recounted history. Some, like red palms or anisocoria, may be readily apparent and diagnostically useful—if the observer recognizes their potential significance. The 2 patients described in this issue of the Journal highlight the value of both observation and the knowledge and experience to place what we observe into a clinical context. Watson (the computer) can provide data regarding the potential significance of a physical finding, but only if someone first detects its existence.
Once it is recognized (or pointed out), we can all pull out our smartphones and Google “palmar erythema and disease,” and on our screen up pops liver disease, pregnancy, and assorted other conditions, including malignancies. But how many of us in our clinic, as opposed to the artificial scenario of reading it in the Journal or attending a clinicopathologic conference, will spontaneously recognize palmar erythema as a potentially relevant clinical finding?
For many physicians, the sense of professional satisfaction in making these observations is diminished. The professional joy gleaned from these moments has been diluted. We are in jeopardy of losing the passion for the professional work that we do as well as the intellectual and emotional satisfaction that accompanies a nuanced professional job well done, while focusing instead on our contracted jobs, frequently evaluated by our ability to meet commercial needs. The absence of emotional and intellectual satisfaction that should come from these collected moments of patient interaction and reflection undoubtedly contributes to the rising rate of physician burnout.
There are so many pressures on us in the office. Did I record that my new patient with known rheumatoid arthritis (who has had a recent MI and pneumonia and who has tried several biologic therapies without success and is in need of a creative change in her medication) has a cousin with hypothyroidism so I could include family history in my electronic medical record note and thus bill at a “desired” level of complexity? Did I use the appropriate catchphrase stating that over 50% of my time was spent in education of the patient (after collecting and reading for 30 minutes the stack of prior records, preparing to do battle with her insurance company to get the next therapy approved for coverage)?
There is little wonder that an observation of red palms gets missed or, if it is noted, that the Google search is never actually done. And when we do recognize the finding and its clinical significance, we often don’t take a moment to reflect and bask in the glow of a job well done, the satisfaction of successfully applying both our knowledge and experience to help resolve a clinical problem.
As Westendorp points out, bedside observation is still relevant. And I will add that there still should be joy in the intellectual pursuit of the job well done as well as the patient well managed. It takes more than a smartphone to know when and how to look at the palms and the eyes before typing in a Google search or consulting the digital (not the doctor) Watson. Those are skills to be proud of.

Another complication of cirrhosis
A 53-year-old Native American woman with a history of liver cirrhosis secondary to alcohol abuse presents to the emergency department after 2 days of diffuse abdominal pain and weakness. The pain was sudden in onset and has progressed relentlessly over the last day, reaching 9 on a scale of 10 in severity. Family members say that her oral intake has been decreased for the last 2 days, but she has had no fever, vomiting, change in bowel habit, blood in stool, or black stool. She has never undergone surgery, and has had one uncomplicated pregnancy.
Physical examination
Vital signs:
- Blood pressure 82/57 mm Hg
- Heart rate 96 beats per minute
- Temperature 37.3°C (99.1°F)
- Respiratory rate 16 per minute
- Oxygen saturation 92% while receiving oxygen at 2 L/minute.
The patient is somnolent and has scleral icterus. Her cardiopulmonary examination is normal. Her abdomen is tense, distended, and diffusely tender. She has bilateral +2 pitting edema in her lower extremities. She is oriented to person only and is noted to have asterixis. Her baseline Model for End-stage Liver Disease score is 18 points on a scale of 6 (less ill) to 40 (gravely ill).
Laboratory studies:
- Hemoglobin 9.8 g/dL (reference range 11.5–15.5)
- Platelet count 100 × 109/L (150–400)
- White blood cell count 9.9 × 10⁹/L (3.7–11.0)
- Serum creatinine 1.06 mg/dL (0.58–0.96)
- Bilirubin 6.3 mg/dL (0.2–1.3)
- International normalized ratio of the prothrombin time 2.15 (0.8–1.2)
- Blood urea nitrogen 13 mg/dL (7–21)
- Serum albumin 2.7 g/dL (3.9–4.9).
Intravenous fluid resuscitation is initiated but the patient remains hypotensive, and on repeat laboratory testing 4 hours later her hemoglobin level has dropped to 7.3 mg/dL.
DIFFERENTIAL DIAGNOSIS
1. Which of the following are likely causes of this patient’s presentation?
- Splenic arterial aneurysm rupture
- Spontaneous bacterial peritonitis
- Variceal hemorrhage
- Portal vein thrombosis
- Abdominal aortic aneurysm rupture
Ruptured splenic artery aneurysm
Splenic artery aneurysms are the third most common intra-abdominal aneurysm, after those of the abdominal aorta and iliac artery.1 They are often asymptomatic and are being detected more frequently because of increased use of computed tomography (CT).2 Symptomatic splenic artery aneurysms may present with abdominal pain and have the potential to rupture, which can be life-threatening.3,4
This patient may have a ruptured splenic artery aneurysm, given her hemodynamic shock.
Spontaneous bacterial peritonitis
Ten percent to 20% of hospitalized patients with cirrhosis and ascites develop spontaneous bacterial peritonitis. Patients may present with ascites and abdominal pain, tenderness to palpation, fever, encephalopathy, or worsening liver and renal function.
Diagnostic paracentesis is paramount to delineate the cause of ascites; one should calculate the serum-ascites albumin gradient and obtain a cell count and culture of the ascitic fluid. The diagnosis of spontaneous bacterial peritonitis can be made if the ascitic fluid polymorphonuclear cell count is 0.25 × 10⁹/L or higher, even if the ascitic fluid culture is negative.5,6 Simultaneous blood cultures should also be collected, as 50% of cases are associated with bacteremia.
The in-hospital mortality rate of an episode of spontaneous bacterial peritonitis has been reduced to 10% to 20% thanks to prompt diagnosis and empiric treatment with third-generation cephalosporins.7
Five percent of cases of infected ascites fluid are due to secondary bacterial peritonitis from a perforated viscus or a loculated abscess, which cannot be differentiated clinically from spontaneous bacterial peritonitis but can be diagnosed with CT.8
This patient may be presenting with septic shock secondary to either of these causes.
Variceal hemorrhage
Half of patients with cirrhosis have gastroesophageal varices due to portal hypertension. Endoscopic surveillance is warranted, as the risk of hemorrhage is 12% to 15% per year, and the mortality rate approaches 15% to 20% with each episode. Prompt resuscitation, diagnosis, and control of bleeding is paramount.
Esophagogastroduodenoscopy is used for both diagnosis and intervention. Short-term prophylactic use of antibiotics improves survival by preventing infections in the event bleeding recurs.9–11
Our patient may be presenting with hemodynamic shock from bleeding esophageal varices.
Portal vein thrombosis
Portal vein thrombosis is a common complication of cirrhosis, occurring in 5% to 28% of patients. The risk increases with the severity of liver disease and in association with hepatocellular carcinoma.12 Forty-three percent of cases are discovered incidentally in asymptomatic patients during ultrasonography, 39% present with upper gastrointestinal bleeding, and 18% present with abdominal pain.13,14
Portal vein thrombosis is the complete or partial obstruction of blood flow due to a thrombus in the lumen of the portal vein. Contrast ultrasonography and CT can be used to establish the diagnosis.15
Anticoagulation is recommended in cases of complete thrombosis in candidates for living-donor liver transplant and for those at risk of mesenteric ischemia because of the thrombus extending into the mesenteric veins. In symptomatic patients, the decision to initiate anticoagulation should be made on a case-by-case basis after appropriate screening and management of varices.16–18
Our patient’s thrombocytopenia reflects the severity of portal hypertension and increases her risk of portal vein thrombosis, but this is unlikely to be the sole cause of the hemodynamic compromise in this patient.
Ruptured abdominal aortic aneurysm
Rupture of an abdominal aortic aneurysm is a medical emergency, with a mortality rate approaching 90%. Risk factors for abdominal aortic aneurysms are smoking, male sex, age over 65, history of cardiovascular disease, hypertension, and a family history of abdominal aortic aneurysm, especially if a first-degree relative is affected.19 Endovascular repair is associated with lower rates of death and complications compared with open repair.20
The patient does not have any of those risk factors, making this diagnosis less likely.
CASE CONTINUED: RUPTURED SPLENIC ARTERY ANEURYSM

Emergency CT of the abdomen and pelvis with contrast enhancement shows a large left intraperitoneal hematoma with active extravasation from a ruptured splenic artery aneurysm (Figure 1). The patient receives packed red blood cells and fresh-frozen plasma before being transferred to our hospital.
2. Which of the following is false regarding splenic artery aneurysms?
- They are the most common type of splanchnic arterial aneurysm
- True aneurysms are more common than pseudoaneurysms
- Asymptomatic aneurysms are discovered incidentally during assessment for other radiographic indications
- Splenic artery aneurysm in portal hypertension is the result of athero-sclerotic changes to the vascular intima
Splenic artery aneurysm in portal hypertension is not the result of atherosclerotic change to the vascular intima.
Splenic artery aneurysms are the most common type of splanchnic artery aneurysm.1 True aneurysms involve all 3 layers of the arterial wall, ie, intima, media, and adventitia. Cirrhosis and portal hypertension are associated with true aneurysm formation. The proposed mechanism of aneurysm formation is increased splenic blood flow in response to portal congestion with resultant hemodynamic stress that disrupts arterial wall structure, leading to aneurysmal dilation.21
In earlier reports, the incidence of true splenic artery aneurysm in portal hypertension varied from 2.9% to 50%, the latter representing autopsy findings of small aneurysms that were found in the splenic hilum of patients with cirrhosis.22–25 The incidence of clinically significant aneurysms in cirrhosis is unknown but incidental asymptomatic aneurysm is being detected more frequently on imaging studies pursued for screening purposes.26
The risk of rupture is low, only 2% to 10% in older studies and likely even lower now due to increased incidental detection in asymptomatic patients.27 However, emergent management of rupture at a tertiary care facility is paramount, as the mortality rate of ruptured splenic artery aneurysm is 29% to 36%.1,26,28
Splenic artery pseudoaneurysm is rarer and has a different pathophysiologic process than true aneurysm. It usually arises in the setting of trauma, pancreatitis, or postsurgery.29,30 Pseudoaneurysm is more likely to rupture, owing to compromise in the vascular wall integrity.4,21,28 As a result, treatment is indicated for every pseudoaneurysm regardless of size.
RISK FACTORS FOR SPLENIC ARTERY ANEURYSM
3. Which of the following is true regarding our patient’s risk of splenic artery aneurysm?
- Liver cirrhosis and portal hypertension are her greatest risk factors for it
- Female sex and prior pregnancy are her greatest risk factors for it
- Being Native American makes it more likely that the patient has splenic artery aneurysm secondary to collagen vascular disease
- Her risk of rupture would diminish after receiving a liver transplant
Liver cirrhosis and portal hypertension are her greatest risk factors for splenic artery aneurysm.
Risk factors for true aneurysm include hypertension, atherosclerosis, portal hypertension with or without liver cirrhosis, liver transplant, third trimester of pregnancy, and multiparity.1,4,26,28,31 Splenic artery aneurysm is usually diagnosed in the sixth decade. It may be 4 times as common in women, given a hormonal influence.32 Cirrhosis is also associated with massive splenic artery aneurysm (≥ 5 cm). Although rare, massive splenic artery aneurysm is more frequent in men (the male-to-female ratio is 1.78:1) and has a heightened risk of rupture.28 The incidence of rupture increases to around 3% to 4% after liver transplant.33 Rare causes of true aneurysm include fibrodysplasia, collagen vascular disease (eg, Loeys-Dietz and type IV Ehler-Danlos syndromes), vasculitis (eg, polyarteritis nodosa due to amphetamine abuse), and mycotic aneurysms.24,25,28,29
This patient’s age, sex, and history of cirrhosis puts her at increased risk of splenic artery aneurysm. The risk of rupture is highest in the peripartum period and in patients with cirrhosis who become pregnant. Although being Native American portends an increased risk for collagen vascular disease, the latter is unlikely to be a contributing factor.
TREATMENT OF SPLENIC ARTERY ANEURYSM
4. Which of the following is false regarding treatment of splenic artery aneurysms?
- Aneurysms larger than 2 cm and those that are expanding require repair
- Treatment should be offered if the patient has symptoms attributable to the aneurysm
- Asymptomatic aneurysms in pregnant women can be followed with watchful waiting
- Minimally invasive therapies such as percutaneous embolization may be a good option in poor operative candidates
Asymptomatic aneurysms in pregnant women should not be followed with watchful waiting—they should be repaired, as rupture carries a maternal mortality rate of 75% and a fetal mortality rate of 95%.34
Complications of splenic artery aneurysm depend on the type of aneurysm and its predisposing factors. Indications for treatment of true aneurysms include:
- Symptoms attributable to the aneurysm (hence, the second answer choice above is true)
- Diameter 2 cm or greater or enlarging diameter (hence, the first answer choice is true)
- Women of childbearing age in anticipation of pregnancy
- Need for surgical intervention such as portocaval shunt and liver transplant.
Conservative management is associated with a late mortality risk of 4.9%.2 Interventional options include percutaneous embolization or stenting; or laparotomy with splenic artery ligation or excision with or without splenectomy.1,28,35–37
Endovascular and open surgical repair have both been used to treat splenic artery aneurysms. The method used depends on the patient’s surgical history and aneurysm anatomy such as splenic artery tortuosity hindering passage of a catheter. Open surgery is associated with longer intraoperative time and length of hospital stay and higher rates of 30-day mortality and perioperative morbidity.38–41 With endovascular repair, the complication of persistent or recurrent flow occurs in 3% to 5% of cases by 30 days; hence, postprocedural surveillance is recommended.42–44 Endovascular repair has a higher reintervention rate but may still be more cost-effective than open surgical repair.
Because patients with cirrhosis have a higher risk of surgical complications,45 elective endovascular treatment may be an option for patients with aneurysms at high risk of rupturing. Endovascular treatment of visceral aneurysms is associated with complications such as postembolization syndrome (fever, abdominal pain, pleural effusion, and pancreatitis), access site hematoma, splenic infarction, and persistent abdominal pain.42
Patients with cirrhosis as the cause of splenic artery aneurysm tend to need longer hospitalization after endovascular treatment, but there is insufficient evidence to suggest that they are at higher risk of other complications.37
CASE CONTINUED: SPLENIC ARTERY EMBOLIZATION

The patient undergoes emergency splenic artery embolization, performed by an interventional radiology team (Figure 2 and Figure 3). Over the next few days, her mental status improves and her abdominal pain resolves. Her hemoglobin level remains stable after the procedure.

The surgical and interventional radiology teams discuss the risk of repeat intervention with the patient and her family, who prefer a nonoperative approach. She is managed supportively in the intensive care unit and is finally discharged home in stable condition and is scheduled for outpatient follow-up.
SUSPECT THIS FATAL CONDITION
The low prevalence of ruptured splenic artery aneurysm may lead physicians to attribute septic shock to spontaneous bacterial peritonitis or hemorrhagic shock from gastroesophageal varices in patients with cirrhosis, but a high index of suspicion and early recognition of this rare disease can lead to timely diagnosis and treatment of this highly fatal complication.
KEY POINTS
- Splenic artery aneurysm is a common complication of cirrhosis, often diagnosed incidentally.
- Elective embolization should be considered for asymptomatic splenic artery aneurysms larger than 2 cm in diameter, clinically symptomatic aneurysms, women of childbearing age, and patients who are candidates for liver transplant.
- Although splenic artery aneurysm rupture is rare, it has a high mortality rate and warrants a high index of suspicion to institute prompt specialized intervention.
- We recommend that physicians consider splenic artery aneurysm rupture in their differential diagnoses in patients with liver cirrhosis presenting with abdominal pain, altered mental status, and hemodynamic shock.
- Bakhos CT, McIntosh BC, Nukta FA, et al. Staged arterial embolization and surgical resection of a giant splenic artery aneurysm. Ann Vasc Surg 2007; 21:208–210.
- Hogendoorn W, Lavida A, Hunink MG, et al. Open repair, endovascular repair, and conservative management of true splenic artery aneurysms. J Vasc Surg 2014; 60:1667–1676.e1.
- Algudkar A. Unruptured splenic artery aneurysm presenting as epigastric pain. JRSM Short Rep 2010; 1:24.
- Abbas MA, Stone WM, Fowl RJ, et al. Splenic artery aneurysms: two decades experience at Mayo Clinic. Ann Vasc Surg 2002; 16:442–449.
- Hoefs JC, Canawati HN, Sapico FL, Hopkins RR, Weiner J, Montgomerie JZ. Spontaneous bacterial peritonitis. Hepatology 1982; 2:399–407.
- Runyon BA, Hoefs JC. Culture-negative neutrocytic ascites: a variant of spontaneous bacterial peritonitis. Hepatology 1984; 4:1209–1211.
- Garcia-Tsao G. Spontaneous bacterial peritonitis: a historical perspective. J Hepatol 2004; 41:522–527.
- Soriano G, Castellote J, Alvarez C, et al. Secondary bacterial peritonitis in cirrhosis: a retrospective study of clinical and analytical characteristics, diagnosis and management. J Hepatol 2010; 52:39–44.
- D’Amico G, De Franchis R; Cooperative Study Group. Upper digestive bleeding in cirrhosis. Post-therapeutic outcome and prognostic indicators. Hepatology 2003; 38:599–612.
- Garcia-Tsao G, Sanyal AJ, Grace ND, Carey WD; Practice Guidelines Committee of American Association for Study of Liver Diseases; Practice Parameters Committee of American College of Gastroenterology. Prevention and management of gastroesophageal varices and variceal hemorrhage in cirrhosis. Am J Gastroenterol 2007; 102:2086–2102.
- Garcia-Tsao G, Sanyal AJ, Grace ND, Carey W; Practice Guidelines Committee of the American Association for the Study of Liver Diseases; Practice Parameters Committee of the American College of Gastroenterology. Prevention and management of gastroesophageal varices and variceal hemorrhage in cirrhosis. Hepatology 2007; 46:922–938.
- Tsochatzis EA, Senzolo M, Germani G, Gatt A, Burroughs AK. Systematic review: portal vein thrombosis in cirrhosis. Aliment Pharmacol Ther 2010; 31:366–374.
- Kobori L, van der Kolk MJ, de Jong KP, et al. Splenic artery aneurysms in liver transplant patients. Liver Transplant Group. J Hepatol 1997; 27:890–893.
- Manzano-Robleda Mdel C, Barranco-Fragoso B, Uribe M, Mendez-Sanchez N. Portal vein thrombosis: what is new? Ann Hepatol 2015; 14:20–27.
- Sarin SK, Philips CA, Kamath PS, et al. Toward a comprehensive new classification of portal vein thrombosis in patients with cirrhosis. Gastroenterology 2016; 151:574–577.e3.
- DeLeve LD, Valla DC, Garcia-Tsao G; American Association for the Study of Liver Diseases. Vascular disorders of the liver. Hepatology 2009; 49:1729–1764.
- Manzanet G, Sanjuan F, Orbis P, et al. Liver transplantation in patients with portal vein thrombosis. Liver Transpl 2001; 7:125–131.
- John BV, Konjeti R, Aggarwal A, et al. Impact of untreated portal vein thrombosis on pre and post liver transplant outcomes in cirrhosis. Ann Hepatol 2013; 12:952–958.
- Hirsch AT, Haskal ZJ, Hertzer NR, et al; American Association for Vascular Surgery/Society for Vascular Surgery; Society for Cardiovascular Angiography and Interventions; Society for Vascular Medicine and Biology; Society of Interventional Radiology; ACC/AHA Task Force on Practice Guidelines. ACC/AHA Guidelines for the Management of Patients with Peripheral Arterial Disease (lower extremity, renal, mesenteric, and abdominal aortic): a collaborative report from the American Associations for Vascular Surgery/Society for Vascular Surgery, Society for Cardiovascular Angiography and Interventions, Society for Vascular Medicine and Biology, Society of Interventional Radiology, and the ACC/AHA Task Force on Practice Guidelines (writing committee to develop guidelines for the management of patients with peripheral arterial disease)—summary of recommendations. J Vasc Interv Radiol 2006; 17:1383–1397.
- Schermerhorn ML, O’Malley AJ, Jhaveri A, Cotterill P, Pomposelli F, Landon BE. Endovascular vs open repair of abdominal aortic aneurysms in the Medicare population. N Engl J Med 2008; 358:464–474.
- Ohta M, Hashizume M, Ueno K, Tanoue K, Sugimachi K, Hasuo K. Hemodynamic study of splenic artery aneurysm in portal hypertension. Hepatogastroenterology 1994; 41:181–184.
- Sunagozaka H, Tsuji H, Mizukoshi E, et al. The development and clinical features of splenic aneurysm associated with liver cirrhosis. Liver Int 2006; 26:291–297.
- Manenti F, Williams R. Injection studies of the splenic vasculature in portal hypertension. Gut 1966; 7:175–180.
- Stanley JC, Fry WJ. Pathogenesis and clinical significance of splenic artery aneurysms. Surgery 1974; 76:898–909.
- Lee PC, Rhee RY, Gordon RY, Fung JJ, Webster MW. Management of splenic artery aneurysms: the significance of portal and essential hypertension. J Am Coll Surg 1999; 189:483–490.
- Al-Habbal Y, Christophi C, Muralidharan V. Aneurysms of the splenic artery—a review. Surgeon 2010; 8:223–231.
- Mattar SG, Lumsden AB. The management of splenic artery aneurysms: experience with 23 cases. Am J Surg 1995; 169:580–584.
- Akbulut S, Otan E. Management of giant splenic artery aneurysm: comprehensive literature review. Medicine (Baltimore) 2015; 94:e1016.
- Agrawal GA, Johnson PT, Fishman EK. Splenic artery aneurysms and pseudoaneurysms: clinical distinctions and CT appearances. AJR Am J Roentgenol 2007; 188:992–999.
- Tessier DJ, Stone WM, Fowl RJ, et al. Clinical features and management of splenic artery pseudoaneurysm: case series and cumulative review of literature. J Vasc Surg 2003; 38:969–974.
- Dave SP, Reis ED, Hossain A, Taub PJ, Kerstein MD, Hollier LH. Splenic artery aneurysm in the 1990s. Ann Vasc Surg 2000; 14:223–229.
- Parrish J, Maxwell C, Beecroft JR. Splenic artery aneurysm in pregnancy. J Obstet Gynaecol Can 2015; 37:816–818.
- Moon DB, Lee SG, Hwang S, et al. Characteristics and management of splenic artery aneurysms in adult living donor liver transplant recipients. Liver Transpl 2009; 15:1535–1541.
- Sadat U, Dar O, Walsh S, Varty K. Splenic artery aneurysms in pregnancy—a systematic review. Int J Surg 2008; 6:261–265.
- Geoghegan T, McAuley G, Snow A, Torreggiani WC. Emergency embolization of multiple splenic artery pseudoaneurysms associated with portal hypertension complicating cystic fibrosis. Australas Radiol 2007; 51(suppl):B337–B339.
- Jiang R, Ding X, Jian W, Jiang J, Hu S, Zhang Z. Combined endovascular embolization and open surgery for splenic artery aneurysm with arteriovenous fistula. Ann Vasc Surg 2016; 30:311.e1–311.e4.
- Naganuma M, Matsui H, Koizumi J, Fushimi K, Yasunaga H. Short-term outcomes following elective transcatheter arterial embolization for splenic artery aneurysms: data from a nationwide administrative database. Acta Radiol Open 2015; 4:2047981615574354.
- Batagini NC, El-Arousy H, Clair DG, Kirksey L. Open versus endovascular treatment of visceral artery aneurysms and pseudoaneurysms. Ann Vasc Surg 2016; 35:1–8.
- Marone EM, Mascia D, Kahlberg A, Brioschi C, Tshomba Y, Chiesa R. Is open repair still the gold standard in visceral artery aneurysm management? Ann Vasc Surg 2011; 25:936–946.
- Sticco A, Aggarwal A, Shapiro M, Pratt A, Rissuci D, D'Ayala M. A comparison of open and endovascular treatment strategies for the management of splenic artery aneurysms. Vascular 2016; 24:487–491.
- Hogendoorn W, Lavida A, Hunink MG, et al. Cost-effectiveness of endovascular repair, open repair, and conservative management of splenic artery aneurysms. J Vasc Surg 2015; 61:1432–1440.
- Fankhauser GT, Stone WM, Naidu SG, et al; Mayo Vascular Research Center Consortium. The minimally invasive management of visceral artery aneurysms and pseudoaneurysms. J Vasc Surg 2011; 53:966–970.
- Lagana D, Carrafiello G, Mangini M, et al. Multimodal approach to endovascular treatment of visceral artery aneurysms and pseudoaneurysms. Eur J Radiol 2006; 59:104–111.
- Guillon R, Garcier JM, Abergel A, et al. Management of splenic artery aneurysms and false aneurysms with endovascular treatment in 12 patients. Cardiovasc Intervent Radiol 2003; 26:256–260.
- Northup PG, Wanamaker RC, Lee VD, Adams RB, Berg CL. Model for end-stage liver disease (MELD) predicts nontransplant surgical mortality in patients with cirrhosis. Ann Surg 2005; 242:244–251.
A 53-year-old Native American woman with a history of liver cirrhosis secondary to alcohol abuse presents to the emergency department after 2 days of diffuse abdominal pain and weakness. The pain was sudden in onset and has progressed relentlessly over the last day, reaching 9 on a scale of 10 in severity. Family members say that her oral intake has been decreased for the last 2 days, but she has had no fever, vomiting, change in bowel habit, blood in stool, or black stool. She has never undergone surgery, and has had one uncomplicated pregnancy.
Physical examination
Vital signs:
- Blood pressure 82/57 mm Hg
- Heart rate 96 beats per minute
- Temperature 37.3°C (99.1°F)
- Respiratory rate 16 per minute
- Oxygen saturation 92% while receiving oxygen at 2 L/minute.
The patient is somnolent and has scleral icterus. Her cardiopulmonary examination is normal. Her abdomen is tense, distended, and diffusely tender. She has bilateral +2 pitting edema in her lower extremities. She is oriented to person only and is noted to have asterixis. Her baseline Model for End-stage Liver Disease score is 18 points on a scale of 6 (less ill) to 40 (gravely ill).
Laboratory studies:
- Hemoglobin 9.8 g/dL (reference range 11.5–15.5)
- Platelet count 100 × 109/L (150–400)
- White blood cell count 9.9 × 10⁹/L (3.7–11.0)
- Serum creatinine 1.06 mg/dL (0.58–0.96)
- Bilirubin 6.3 mg/dL (0.2–1.3)
- International normalized ratio of the prothrombin time 2.15 (0.8–1.2)
- Blood urea nitrogen 13 mg/dL (7–21)
- Serum albumin 2.7 g/dL (3.9–4.9).
Intravenous fluid resuscitation is initiated but the patient remains hypotensive, and on repeat laboratory testing 4 hours later her hemoglobin level has dropped to 7.3 mg/dL.
DIFFERENTIAL DIAGNOSIS
1. Which of the following are likely causes of this patient’s presentation?
- Splenic arterial aneurysm rupture
- Spontaneous bacterial peritonitis
- Variceal hemorrhage
- Portal vein thrombosis
- Abdominal aortic aneurysm rupture
Ruptured splenic artery aneurysm
Splenic artery aneurysms are the third most common intra-abdominal aneurysm, after those of the abdominal aorta and iliac artery.1 They are often asymptomatic and are being detected more frequently because of increased use of computed tomography (CT).2 Symptomatic splenic artery aneurysms may present with abdominal pain and have the potential to rupture, which can be life-threatening.3,4
This patient may have a ruptured splenic artery aneurysm, given her hemodynamic shock.
Spontaneous bacterial peritonitis
Ten percent to 20% of hospitalized patients with cirrhosis and ascites develop spontaneous bacterial peritonitis. Patients may present with ascites and abdominal pain, tenderness to palpation, fever, encephalopathy, or worsening liver and renal function.
Diagnostic paracentesis is paramount to delineate the cause of ascites; one should calculate the serum-ascites albumin gradient and obtain a cell count and culture of the ascitic fluid. The diagnosis of spontaneous bacterial peritonitis can be made if the ascitic fluid polymorphonuclear cell count is 0.25 × 10⁹/L or higher, even if the ascitic fluid culture is negative.5,6 Simultaneous blood cultures should also be collected, as 50% of cases are associated with bacteremia.
The in-hospital mortality rate of an episode of spontaneous bacterial peritonitis has been reduced to 10% to 20% thanks to prompt diagnosis and empiric treatment with third-generation cephalosporins.7
Five percent of cases of infected ascites fluid are due to secondary bacterial peritonitis from a perforated viscus or a loculated abscess, which cannot be differentiated clinically from spontaneous bacterial peritonitis but can be diagnosed with CT.8
This patient may be presenting with septic shock secondary to either of these causes.
Variceal hemorrhage
Half of patients with cirrhosis have gastroesophageal varices due to portal hypertension. Endoscopic surveillance is warranted, as the risk of hemorrhage is 12% to 15% per year, and the mortality rate approaches 15% to 20% with each episode. Prompt resuscitation, diagnosis, and control of bleeding is paramount.
Esophagogastroduodenoscopy is used for both diagnosis and intervention. Short-term prophylactic use of antibiotics improves survival by preventing infections in the event bleeding recurs.9–11
Our patient may be presenting with hemodynamic shock from bleeding esophageal varices.
Portal vein thrombosis
Portal vein thrombosis is a common complication of cirrhosis, occurring in 5% to 28% of patients. The risk increases with the severity of liver disease and in association with hepatocellular carcinoma.12 Forty-three percent of cases are discovered incidentally in asymptomatic patients during ultrasonography, 39% present with upper gastrointestinal bleeding, and 18% present with abdominal pain.13,14
Portal vein thrombosis is the complete or partial obstruction of blood flow due to a thrombus in the lumen of the portal vein. Contrast ultrasonography and CT can be used to establish the diagnosis.15
Anticoagulation is recommended in cases of complete thrombosis in candidates for living-donor liver transplant and for those at risk of mesenteric ischemia because of the thrombus extending into the mesenteric veins. In symptomatic patients, the decision to initiate anticoagulation should be made on a case-by-case basis after appropriate screening and management of varices.16–18
Our patient’s thrombocytopenia reflects the severity of portal hypertension and increases her risk of portal vein thrombosis, but this is unlikely to be the sole cause of the hemodynamic compromise in this patient.
Ruptured abdominal aortic aneurysm
Rupture of an abdominal aortic aneurysm is a medical emergency, with a mortality rate approaching 90%. Risk factors for abdominal aortic aneurysms are smoking, male sex, age over 65, history of cardiovascular disease, hypertension, and a family history of abdominal aortic aneurysm, especially if a first-degree relative is affected.19 Endovascular repair is associated with lower rates of death and complications compared with open repair.20
The patient does not have any of those risk factors, making this diagnosis less likely.
CASE CONTINUED: RUPTURED SPLENIC ARTERY ANEURYSM
Emergency CT of the abdomen and pelvis with contrast enhancement shows a large left intraperitoneal hematoma with active extravasation from a ruptured splenic artery aneurysm (Figure 1). The patient receives packed red blood cells and fresh-frozen plasma before being transferred to our hospital.
2. Which of the following is false regarding splenic artery aneurysms?
- They are the most common type of splanchnic arterial aneurysm
- True aneurysms are more common than pseudoaneurysms
- Asymptomatic aneurysms are discovered incidentally during assessment for other radiographic indications
- Splenic artery aneurysm in portal hypertension is the result of athero-sclerotic changes to the vascular intima
Splenic artery aneurysm in portal hypertension is not the result of atherosclerotic change to the vascular intima.
Splenic artery aneurysms are the most common type of splanchnic artery aneurysm.1 True aneurysms involve all 3 layers of the arterial wall, ie, intima, media, and adventitia. Cirrhosis and portal hypertension are associated with true aneurysm formation. The proposed mechanism of aneurysm formation is increased splenic blood flow in response to portal congestion with resultant hemodynamic stress that disrupts arterial wall structure, leading to aneurysmal dilation.21
In earlier reports, the incidence of true splenic artery aneurysm in portal hypertension varied from 2.9% to 50%, the latter representing autopsy findings of small aneurysms that were found in the splenic hilum of patients with cirrhosis.22–25 The incidence of clinically significant aneurysms in cirrhosis is unknown but incidental asymptomatic aneurysm is being detected more frequently on imaging studies pursued for screening purposes.26
The risk of rupture is low, only 2% to 10% in older studies and likely even lower now due to increased incidental detection in asymptomatic patients.27 However, emergent management of rupture at a tertiary care facility is paramount, as the mortality rate of ruptured splenic artery aneurysm is 29% to 36%.1,26,28
Splenic artery pseudoaneurysm is rarer and has a different pathophysiologic process than true aneurysm. It usually arises in the setting of trauma, pancreatitis, or postsurgery.29,30 Pseudoaneurysm is more likely to rupture, owing to compromise in the vascular wall integrity.4,21,28 As a result, treatment is indicated for every pseudoaneurysm regardless of size.
RISK FACTORS FOR SPLENIC ARTERY ANEURYSM
3. Which of the following is true regarding our patient’s risk of splenic artery aneurysm?
- Liver cirrhosis and portal hypertension are her greatest risk factors for it
- Female sex and prior pregnancy are her greatest risk factors for it
- Being Native American makes it more likely that the patient has splenic artery aneurysm secondary to collagen vascular disease
- Her risk of rupture would diminish after receiving a liver transplant
Liver cirrhosis and portal hypertension are her greatest risk factors for splenic artery aneurysm.
Risk factors for true aneurysm include hypertension, atherosclerosis, portal hypertension with or without liver cirrhosis, liver transplant, third trimester of pregnancy, and multiparity.1,4,26,28,31 Splenic artery aneurysm is usually diagnosed in the sixth decade. It may be 4 times as common in women, given a hormonal influence.32 Cirrhosis is also associated with massive splenic artery aneurysm (≥ 5 cm). Although rare, massive splenic artery aneurysm is more frequent in men (the male-to-female ratio is 1.78:1) and has a heightened risk of rupture.28 The incidence of rupture increases to around 3% to 4% after liver transplant.33 Rare causes of true aneurysm include fibrodysplasia, collagen vascular disease (eg, Loeys-Dietz and type IV Ehler-Danlos syndromes), vasculitis (eg, polyarteritis nodosa due to amphetamine abuse), and mycotic aneurysms.24,25,28,29
This patient’s age, sex, and history of cirrhosis puts her at increased risk of splenic artery aneurysm. The risk of rupture is highest in the peripartum period and in patients with cirrhosis who become pregnant. Although being Native American portends an increased risk for collagen vascular disease, the latter is unlikely to be a contributing factor.
TREATMENT OF SPLENIC ARTERY ANEURYSM
4. Which of the following is false regarding treatment of splenic artery aneurysms?
- Aneurysms larger than 2 cm and those that are expanding require repair
- Treatment should be offered if the patient has symptoms attributable to the aneurysm
- Asymptomatic aneurysms in pregnant women can be followed with watchful waiting
- Minimally invasive therapies such as percutaneous embolization may be a good option in poor operative candidates
Asymptomatic aneurysms in pregnant women should not be followed with watchful waiting—they should be repaired, as rupture carries a maternal mortality rate of 75% and a fetal mortality rate of 95%.34
Complications of splenic artery aneurysm depend on the type of aneurysm and its predisposing factors. Indications for treatment of true aneurysms include:
- Symptoms attributable to the aneurysm (hence, the second answer choice above is true)
- Diameter 2 cm or greater or enlarging diameter (hence, the first answer choice is true)
- Women of childbearing age in anticipation of pregnancy
- Need for surgical intervention such as portocaval shunt and liver transplant.
Conservative management is associated with a late mortality risk of 4.9%.2 Interventional options include percutaneous embolization or stenting; or laparotomy with splenic artery ligation or excision with or without splenectomy.1,28,35–37
Endovascular and open surgical repair have both been used to treat splenic artery aneurysms. The method used depends on the patient’s surgical history and aneurysm anatomy such as splenic artery tortuosity hindering passage of a catheter. Open surgery is associated with longer intraoperative time and length of hospital stay and higher rates of 30-day mortality and perioperative morbidity.38–41 With endovascular repair, the complication of persistent or recurrent flow occurs in 3% to 5% of cases by 30 days; hence, postprocedural surveillance is recommended.42–44 Endovascular repair has a higher reintervention rate but may still be more cost-effective than open surgical repair.
Because patients with cirrhosis have a higher risk of surgical complications,45 elective endovascular treatment may be an option for patients with aneurysms at high risk of rupturing. Endovascular treatment of visceral aneurysms is associated with complications such as postembolization syndrome (fever, abdominal pain, pleural effusion, and pancreatitis), access site hematoma, splenic infarction, and persistent abdominal pain.42
Patients with cirrhosis as the cause of splenic artery aneurysm tend to need longer hospitalization after endovascular treatment, but there is insufficient evidence to suggest that they are at higher risk of other complications.37
CASE CONTINUED: SPLENIC ARTERY EMBOLIZATION
The patient undergoes emergency splenic artery embolization, performed by an interventional radiology team (Figure 2 and Figure 3). Over the next few days, her mental status improves and her abdominal pain resolves. Her hemoglobin level remains stable after the procedure.
The surgical and interventional radiology teams discuss the risk of repeat intervention with the patient and her family, who prefer a nonoperative approach. She is managed supportively in the intensive care unit and is finally discharged home in stable condition and is scheduled for outpatient follow-up.
SUSPECT THIS FATAL CONDITION
The low prevalence of ruptured splenic artery aneurysm may lead physicians to attribute septic shock to spontaneous bacterial peritonitis or hemorrhagic shock from gastroesophageal varices in patients with cirrhosis, but a high index of suspicion and early recognition of this rare disease can lead to timely diagnosis and treatment of this highly fatal complication.
KEY POINTS
- Splenic artery aneurysm is a common complication of cirrhosis, often diagnosed incidentally.
- Elective embolization should be considered for asymptomatic splenic artery aneurysms larger than 2 cm in diameter, clinically symptomatic aneurysms, women of childbearing age, and patients who are candidates for liver transplant.
- Although splenic artery aneurysm rupture is rare, it has a high mortality rate and warrants a high index of suspicion to institute prompt specialized intervention.
- We recommend that physicians consider splenic artery aneurysm rupture in their differential diagnoses in patients with liver cirrhosis presenting with abdominal pain, altered mental status, and hemodynamic shock.
- Bakhos CT, McIntosh BC, Nukta FA, et al. Staged arterial embolization and surgical resection of a giant splenic artery aneurysm. Ann Vasc Surg 2007; 21:208–210.
- Hogendoorn W, Lavida A, Hunink MG, et al. Open repair, endovascular repair, and conservative management of true splenic artery aneurysms. J Vasc Surg 2014; 60:1667–1676.e1.
- Algudkar A. Unruptured splenic artery aneurysm presenting as epigastric pain. JRSM Short Rep 2010; 1:24.
- Abbas MA, Stone WM, Fowl RJ, et al. Splenic artery aneurysms: two decades experience at Mayo Clinic. Ann Vasc Surg 2002; 16:442–449.
- Hoefs JC, Canawati HN, Sapico FL, Hopkins RR, Weiner J, Montgomerie JZ. Spontaneous bacterial peritonitis. Hepatology 1982; 2:399–407.
- Runyon BA, Hoefs JC. Culture-negative neutrocytic ascites: a variant of spontaneous bacterial peritonitis. Hepatology 1984; 4:1209–1211.
- Garcia-Tsao G. Spontaneous bacterial peritonitis: a historical perspective. J Hepatol 2004; 41:522–527.
- Soriano G, Castellote J, Alvarez C, et al. Secondary bacterial peritonitis in cirrhosis: a retrospective study of clinical and analytical characteristics, diagnosis and management. J Hepatol 2010; 52:39–44.
- D’Amico G, De Franchis R; Cooperative Study Group. Upper digestive bleeding in cirrhosis. Post-therapeutic outcome and prognostic indicators. Hepatology 2003; 38:599–612.
- Garcia-Tsao G, Sanyal AJ, Grace ND, Carey WD; Practice Guidelines Committee of American Association for Study of Liver Diseases; Practice Parameters Committee of American College of Gastroenterology. Prevention and management of gastroesophageal varices and variceal hemorrhage in cirrhosis. Am J Gastroenterol 2007; 102:2086–2102.
- Garcia-Tsao G, Sanyal AJ, Grace ND, Carey W; Practice Guidelines Committee of the American Association for the Study of Liver Diseases; Practice Parameters Committee of the American College of Gastroenterology. Prevention and management of gastroesophageal varices and variceal hemorrhage in cirrhosis. Hepatology 2007; 46:922–938.
- Tsochatzis EA, Senzolo M, Germani G, Gatt A, Burroughs AK. Systematic review: portal vein thrombosis in cirrhosis. Aliment Pharmacol Ther 2010; 31:366–374.
- Kobori L, van der Kolk MJ, de Jong KP, et al. Splenic artery aneurysms in liver transplant patients. Liver Transplant Group. J Hepatol 1997; 27:890–893.
- Manzano-Robleda Mdel C, Barranco-Fragoso B, Uribe M, Mendez-Sanchez N. Portal vein thrombosis: what is new? Ann Hepatol 2015; 14:20–27.
- Sarin SK, Philips CA, Kamath PS, et al. Toward a comprehensive new classification of portal vein thrombosis in patients with cirrhosis. Gastroenterology 2016; 151:574–577.e3.
- DeLeve LD, Valla DC, Garcia-Tsao G; American Association for the Study of Liver Diseases. Vascular disorders of the liver. Hepatology 2009; 49:1729–1764.
- Manzanet G, Sanjuan F, Orbis P, et al. Liver transplantation in patients with portal vein thrombosis. Liver Transpl 2001; 7:125–131.
- John BV, Konjeti R, Aggarwal A, et al. Impact of untreated portal vein thrombosis on pre and post liver transplant outcomes in cirrhosis. Ann Hepatol 2013; 12:952–958.
- Hirsch AT, Haskal ZJ, Hertzer NR, et al; American Association for Vascular Surgery/Society for Vascular Surgery; Society for Cardiovascular Angiography and Interventions; Society for Vascular Medicine and Biology; Society of Interventional Radiology; ACC/AHA Task Force on Practice Guidelines. ACC/AHA Guidelines for the Management of Patients with Peripheral Arterial Disease (lower extremity, renal, mesenteric, and abdominal aortic): a collaborative report from the American Associations for Vascular Surgery/Society for Vascular Surgery, Society for Cardiovascular Angiography and Interventions, Society for Vascular Medicine and Biology, Society of Interventional Radiology, and the ACC/AHA Task Force on Practice Guidelines (writing committee to develop guidelines for the management of patients with peripheral arterial disease)—summary of recommendations. J Vasc Interv Radiol 2006; 17:1383–1397.
- Schermerhorn ML, O’Malley AJ, Jhaveri A, Cotterill P, Pomposelli F, Landon BE. Endovascular vs open repair of abdominal aortic aneurysms in the Medicare population. N Engl J Med 2008; 358:464–474.
- Ohta M, Hashizume M, Ueno K, Tanoue K, Sugimachi K, Hasuo K. Hemodynamic study of splenic artery aneurysm in portal hypertension. Hepatogastroenterology 1994; 41:181–184.
- Sunagozaka H, Tsuji H, Mizukoshi E, et al. The development and clinical features of splenic aneurysm associated with liver cirrhosis. Liver Int 2006; 26:291–297.
- Manenti F, Williams R. Injection studies of the splenic vasculature in portal hypertension. Gut 1966; 7:175–180.
- Stanley JC, Fry WJ. Pathogenesis and clinical significance of splenic artery aneurysms. Surgery 1974; 76:898–909.
- Lee PC, Rhee RY, Gordon RY, Fung JJ, Webster MW. Management of splenic artery aneurysms: the significance of portal and essential hypertension. J Am Coll Surg 1999; 189:483–490.
- Al-Habbal Y, Christophi C, Muralidharan V. Aneurysms of the splenic artery—a review. Surgeon 2010; 8:223–231.
- Mattar SG, Lumsden AB. The management of splenic artery aneurysms: experience with 23 cases. Am J Surg 1995; 169:580–584.
- Akbulut S, Otan E. Management of giant splenic artery aneurysm: comprehensive literature review. Medicine (Baltimore) 2015; 94:e1016.
- Agrawal GA, Johnson PT, Fishman EK. Splenic artery aneurysms and pseudoaneurysms: clinical distinctions and CT appearances. AJR Am J Roentgenol 2007; 188:992–999.
- Tessier DJ, Stone WM, Fowl RJ, et al. Clinical features and management of splenic artery pseudoaneurysm: case series and cumulative review of literature. J Vasc Surg 2003; 38:969–974.
- Dave SP, Reis ED, Hossain A, Taub PJ, Kerstein MD, Hollier LH. Splenic artery aneurysm in the 1990s. Ann Vasc Surg 2000; 14:223–229.
- Parrish J, Maxwell C, Beecroft JR. Splenic artery aneurysm in pregnancy. J Obstet Gynaecol Can 2015; 37:816–818.
- Moon DB, Lee SG, Hwang S, et al. Characteristics and management of splenic artery aneurysms in adult living donor liver transplant recipients. Liver Transpl 2009; 15:1535–1541.
- Sadat U, Dar O, Walsh S, Varty K. Splenic artery aneurysms in pregnancy—a systematic review. Int J Surg 2008; 6:261–265.
- Geoghegan T, McAuley G, Snow A, Torreggiani WC. Emergency embolization of multiple splenic artery pseudoaneurysms associated with portal hypertension complicating cystic fibrosis. Australas Radiol 2007; 51(suppl):B337–B339.
- Jiang R, Ding X, Jian W, Jiang J, Hu S, Zhang Z. Combined endovascular embolization and open surgery for splenic artery aneurysm with arteriovenous fistula. Ann Vasc Surg 2016; 30:311.e1–311.e4.
- Naganuma M, Matsui H, Koizumi J, Fushimi K, Yasunaga H. Short-term outcomes following elective transcatheter arterial embolization for splenic artery aneurysms: data from a nationwide administrative database. Acta Radiol Open 2015; 4:2047981615574354.
- Batagini NC, El-Arousy H, Clair DG, Kirksey L. Open versus endovascular treatment of visceral artery aneurysms and pseudoaneurysms. Ann Vasc Surg 2016; 35:1–8.
- Marone EM, Mascia D, Kahlberg A, Brioschi C, Tshomba Y, Chiesa R. Is open repair still the gold standard in visceral artery aneurysm management? Ann Vasc Surg 2011; 25:936–946.
- Sticco A, Aggarwal A, Shapiro M, Pratt A, Rissuci D, D'Ayala M. A comparison of open and endovascular treatment strategies for the management of splenic artery aneurysms. Vascular 2016; 24:487–491.
- Hogendoorn W, Lavida A, Hunink MG, et al. Cost-effectiveness of endovascular repair, open repair, and conservative management of splenic artery aneurysms. J Vasc Surg 2015; 61:1432–1440.
- Fankhauser GT, Stone WM, Naidu SG, et al; Mayo Vascular Research Center Consortium. The minimally invasive management of visceral artery aneurysms and pseudoaneurysms. J Vasc Surg 2011; 53:966–970.
- Lagana D, Carrafiello G, Mangini M, et al. Multimodal approach to endovascular treatment of visceral artery aneurysms and pseudoaneurysms. Eur J Radiol 2006; 59:104–111.
- Guillon R, Garcier JM, Abergel A, et al. Management of splenic artery aneurysms and false aneurysms with endovascular treatment in 12 patients. Cardiovasc Intervent Radiol 2003; 26:256–260.
- Northup PG, Wanamaker RC, Lee VD, Adams RB, Berg CL. Model for end-stage liver disease (MELD) predicts nontransplant surgical mortality in patients with cirrhosis. Ann Surg 2005; 242:244–251.
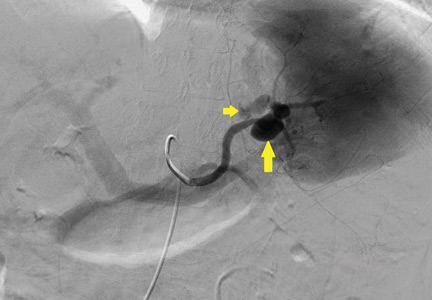
National Trends (2007-2013) of Clostridium difficile Infection in Patients with Septic Shock: Impact on Outcome
Clostridium difficile infection (CDI) is the most common infectious cause of healthcare-associated diarrhea.1 Development of a CDI during hospitalization is associated with increases in morbidity, mortality, length of stay (LOS), and cost.2-5 The prevalence of CDI in hospitalized patients has increased dramatically from the mid-1990s to the mid-2000s to almost 9 cases per 1000 discharges; however, the CDI rate since 2007 appears to have plateaued.6,7 Antibiotic use has historically been the most important risk factor for acquiring CDI; however, use of acid-suppressing agents, chemotherapy, chronic comorbidities, and healthcare exposure all also increase the risk of CDI.7-10 The elderly (> 65 years of age) are particularly at risk for developing CDI and having worse clinical outcomes with CDI.6,7
Patients with septic shock (SS) often have multiple CDI risk factors (in particular, extensive antibiotic exposure) and thus, represent a population at a particularly high risk for acquiring a CDI during hospitalization. However, little data are available on the prevalence of CDI acquired in patients hospitalized with SS. We sought to determine the national-level temporal trends in the prevalence of CDI in patients with SS and the impact of CDI complicating SS on clinical outcomes between 2007 and 2013.
METHODS
Data Source
We used the National Inpatient Sample (NIS) and Nationwide Readmissions Database (NRD) for this study. The NIS is a database developed by the Agency of Healthcare Research and Quality for the Healthcare Cost and Utilization Project (HCUP).11 It is the largest all-payer inpatient database in the United States and has been used by researchers and policy makers to analyze national trends in outcomes and healthcare utilization. The NIS database now approximates a 20% stratified sample of all discharges from all participating US hospitals. Sampling weights are provided by the manufacturer and can be used to produce national-level estimates. Following the redesign of the NIS in 2012, new sampling weights were provided for trend analysis for the years prior to 2012 to account for the new design. Every hospitalization is deidentified and converted into one unique entry that provides information on demographics, hospital characteristics, 1 primary and up to 24 secondary discharge diagnoses, comorbidities, LOS, in-hospital mortality, and procedures performed during stay. The discharge diagnoses are provided in the form of the International Classification of Diseases, 9th Revision-Clinical Modification (ICD-9-CM) codes.
The NRD is a database developed for HCUP that contains about 35 million discharges each year and supports readmission data analyses. In 2013, the NRD contained data from 21 geographically diverse states, accounting for 49.1% of all US hospitalizations. Diagnosis, comorbidities, and outcomes are presented in a similar manner to NIS.
Study Design
This was a retrospective cohort study. Data from the NIS between 2007 and 2013 were used for the analysis. Demographic data obtained included age, gender, race, Charlson-Deyo Comorbidity Index,12 hospital characteristics (hospital region, hospital-bed size, urban versus rural location, and teaching status), calendar year, and use of mechanical ventilation. Cases with information missing on key demographic variables (age, gender, and race) were excluded. Only adults (>18 years of age) were included for the analysis.
SS was identified by either (1) ICD-9-CM diagnosis code for SS (785.52) or (2) presence of vasopressor use (00.17) along with ICD-9-CM codes of sepsis, severe sepsis, septicemia, bacteremia, or fungemia. This approach is consistent with what has been utilized in other studies to identify cases of sepsis or SS from administrative databases.13-15 The appendix provides a complete list of ICD-9-CM codes used in the study. CDI was identified by ICD-9-CM code 008.45 among the secondary diagnosis. This code has been shown to have good accuracy for identifying CDI using administrative data.16 To minimize the inclusion of cases in which a CDI was present at admission, hospitalizations with a primary diagnosis of CDI were not included as cases of CDI complicating SS.
We used NRD 2013 for estimating the effect of CDI on 30-day readmission after initial hospitalizations with SS. We used the criteria for index admissions and 30-day readmissions as defined by the Centers for Medicare and Medicaid Services. We excluded patients who died during their index admission, patients with index discharges in December due to a lack of sufficient time to capture 30-day readmissions, and patients with missing information on key variables. We also excluded patients who were not a resident of the state of index hospitalization since readmission across state boundaries could not be identified in NRD. Manufacturer provided sampling weights were used to produce national level estimates. The cases of SS and CDI were identified by ICD-9-CM codes using the methodology described above.
Outcomes
Our primary outcome of interest was the total and yearly prevalence of CDI in patients with SS from 2007 to 2013. The secondary outcomes were mortality, LOS, and 30-day readmissions in patients with SS with and without CDI.
Statistical Analysis
Weighted data from NIS were used for all analyses. Demographics, hospital characteristics, and outcomes of all patients with SS were obtained. The prevalence of CDI was calculated for each calendar year. The temporal trends of outcomes (LOS and in-hospital mortality) of patients were plotted for patients with SS with and without CDI. A χ2 test of trend for proportions was used with the Cochran-Armitage test to calculate statistical significance of changes in prevalence. To test for statistical significance of the temporal trends of LOS, a univariate linear regression was used, with calendar year as a covariate. Independent samples t test, a Mann-Whitney U test, and a χ2 test were used to determine statistical significance of parameters between the group with CDI and the group without CDI.
Prolonged LOS was defined either as a LOS > 75th or > 90th percentile of LOS among all patients with SS. To identify if CDI was associated with a prolonged LOS after adjusting for patient and hospital characteristics, a multivariate logistic regression analysis was used. Variables included in the regression model were age, gender, race, Charlson-Deyo Comorbidity Index, hospital characteristics (hospital region, hospital-bed size, urban versus rural location, and teaching status), calendar year, and use of mechanical ventilation. Data on cases were available for all the above covariates except hospital characteristics, such as teaching status, location, and bed size (these were missing for 0.7% of hospitals).
Stata 13.1.0 (Stata Corp, College Station, TX) and SPSS 23.0 (SPSS Inc., Chicago, IL) were used to perform statistical analyses. A P value of <0.05 was considered statistically significant.
RESULTS
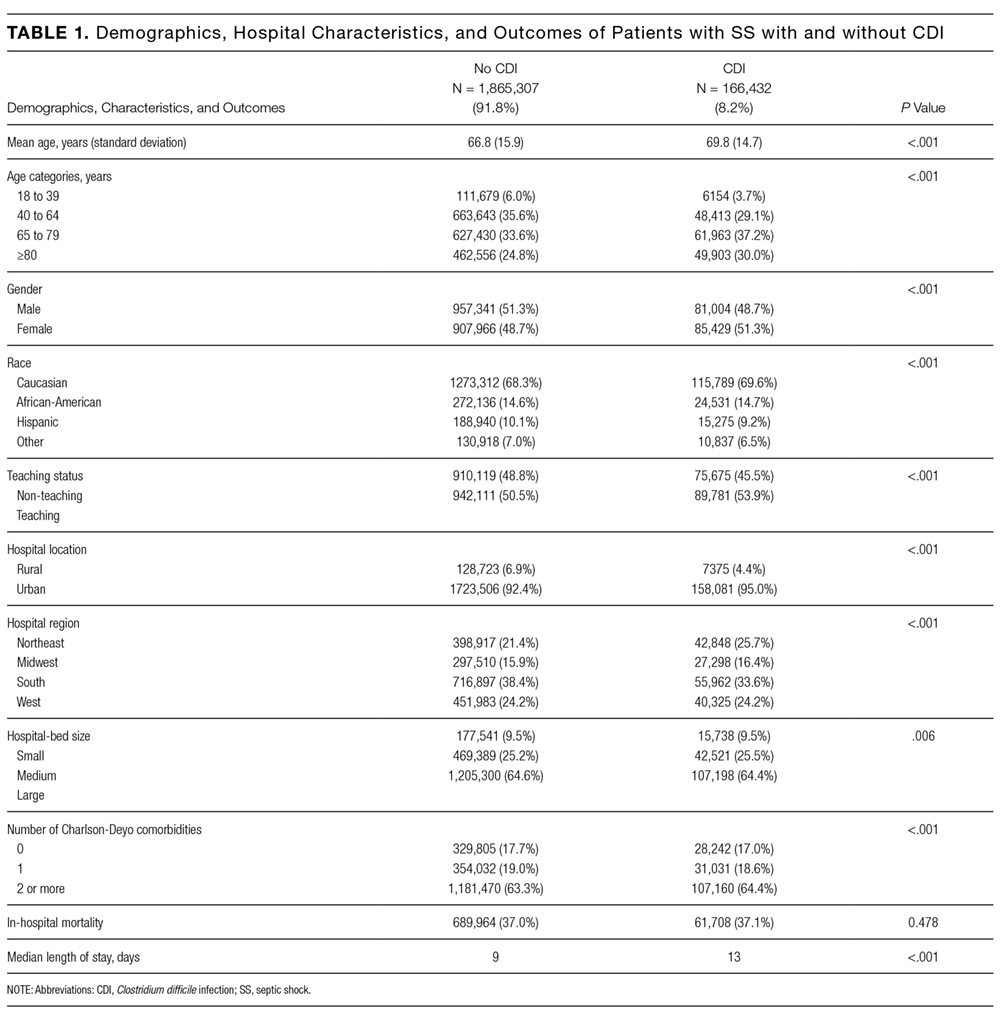
Demographics
A total of 2,031,739 hospitalizations of adults with SS were identified between 2007 and 2013. CDI was present in 166,432 (8.2%) of these patients. Demographic data are displayed in Table 1. CDI was more commonly observed in elderly patients (> 65 years) with SS; 9.3% among the elderly versus 6.6% among individuals < 65 years; P < 0.001. The prevalence of CDI was greater in urban than in rural hospitals (8.4% vs 5.4%; P < 0.001) and greater in teaching than in nonteaching hospitals (8.7% vs 7.7%; P < 0.001). The prevalence of CDI in SS remained stable between 2007 and 2013 (Table 2).

Mortality

In the overall study cohort, the in-hospital mortality for SS was 37%. The in-hospital mortality rate of patients with SS complicated by a CDI was comparable to the mortality rate of patients without a CDI (37.1% vs 37.0%; P = 0.48). The mortality of patients with SS, with or without CDI, progressively decreased from 2007 to 2013 (P value for trend < 0.001 for each group; Figure 1).
Length of Stay

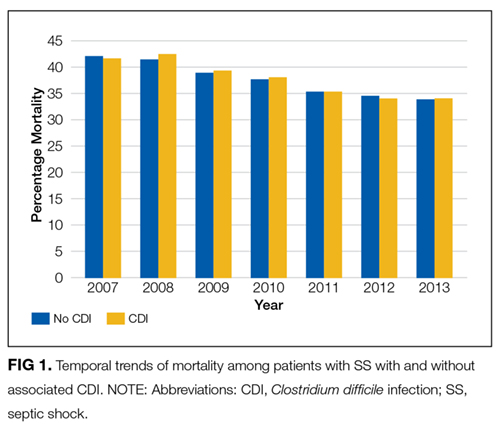
The median LOS for all patients with SS was 9 days. Patients with CDI had a longer median LOS than did those without CDI (13 vs 9 days; P < 0.001). Between 2007 and 2013, the median LOS of CDI group decreased from 14 to 12 days (P < 0.001) while that of non-CDI group decreased from 9 to 8 days (P < 0.001; Figure 2). We also examined LOS among subgroups who were discharged alive and those who died during hospitalization. For patients who were discharged alive, the LOS with and without CDI was 15 days versus 10 days, respectively (P < 0.001). For patients who died during hospitalization, LOS with and without CDI was 10 days versus 6 days, respectively (P < 0.001).
The 75th percentile of LOS of the total SS cohort was 17 days. An LOS > 17 days was observed in 36.9% of SS patients with CDI versus 22.7% without CDI (P < 0.001). After adjusting for patient and provider level variables, the odds of a LOS > 17 days were significantly greater for SS patients with CDI (odds ratio [OR] 2.11; 95% confidence interval [CI], 2.06-2.15; P < 0.001).
The 90th percentile of LOS of the total SS cohort was 29 days. An LOS > 29 days was observed in 17.5% of SS patients with a CDI versus 9.1% without a CDI (P < 0.001). After adjustment for patient and provider level variables, the odds of a LOS > 29 days were significantly greater for SS patients with a CDI (OR 2.25; 95% CI, 2.22-2.28; P < 0.001).
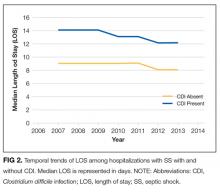
Hospital Readmission
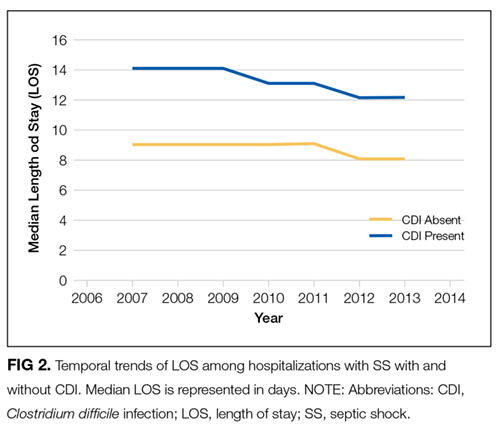
In 2013, patients with SS and CDI had a higher rate of 30-day readmission as compared to patients with SS without CDI (9.8% vs 7.4% respectively; P < 0.001). The multivariate adjusted OR for 30-day readmission for patients with SS and a CDI was 1.26 (95% CI, 1.22-1.31; P < 0.001).
Additional Analyses
Lastly, we performed an additional analysis to confirm our hypothesis that a CDI by itself is rarely a cause of SS, and that CDI as the principal diagnosis would constitute an extremely low number of patients with SS in an administrative dataset. In NIS 2013, there were 105,750 cases with CDI as the primary diagnosis. A total of 4470 (4.2%) had a secondary diagnosis of sepsis and only 930 (0.9%) cases had a secondary diagnosis of SS.
DISCUSSION
This is the first study to report on the prevalence and outcome of CDI complicating SS. By using a large nationally representative sample, we found CDI was very prevalent among individuals hospitalized with SS and, at a level in excess of that seen in other populations. Of interest, we did not observe an increase in mortality of SS when complicated by CDI. On the other hand, patients with SS complicated by CDI were more much likely to have a prolonged hospital LOS and a higher risk of 30-day hospital readmission.
The prevalence of CDI exploded between the mid-1990s and mid-2000s, including community, hospital, and intensive care unit (ICU)–related disease.6,7,17-20 Patients with SS often have multiple risk factors associated with CDI and thus represent a high-risk population for developing CDI.7 Our findings are consistent with the suggestion that individuals with SS are at a higher risk of developing CDI. Compared to the rate of CDI in all hospitalized patients, our data suggest an almost 10-fold increase in CDI rate for patients with SS.6 Patients with SS and CDI may account for as much as 10% of total CDIs.6,7 As has been reported for CDI in general, we observed that CDI complicating SS was more common in those > 65 years of age.4,21 The prevalence of CDI we observed in patients with SS was also higher than has been reported in ICU patients in general (1%), and higher than reported for patients requiring mechanical ventilation (6.6%), including prolonged mechanical ventilation (5.3%); further supporting the conclusion that patients with SS are a particularly high-risk group for acquiring CDI, even compared with other ICU patients.20,22,23 Similarly, the rate of CDI among SS was 8 times higher than that of recently reported hospital-onset CDI among patients with sepsis in general (incidence 1.08%).24 We have no data regarding why patients with SS have a higher rate of CDI; however, the intensity and duration of antibiotic treatment of these patients may certainly play a role.25 It has recently been reported that CDI in itself can be a precursor leading to intestinal dysbiosis that can increase the risk of subsequent sepsis. Similarly, patients with SS may have higher prevalence of dysbiosis that, in turn, might predispose them to CDI at a higher rate than other individuals.
Following the increase in CDIs in the mid-1990s and the mid-2000s, since 2007 the overall prevalence of CDIs has been stable, albeit at the higher rate. More recently, the Centers for Disease Control and Prevention (CDC) has reported a decrease in hospital onset CDI after 2011.26
The finding that CDI in SS patients was not associated with an increase in mortality is consistent with other reports of CDI in ICU patients in general as well as higher-risk ICU populations such as patients requiring mechanical ventilation, including those on long-term mechanical ventilator support.17,18,20,22,23 Why the mortality of ICU patients with CDI is not increased is not completely clear. It has been suggested that this may be related to early recognition and treatment of CDI developing in the ICU.22 Along these lines, it has been previously observed that for patients with CDI on mechanical ventilation, patients who were transferred to the ICU from the ward had worse clinical outcomes compared to patients directly admitted to the ICU, likely due to delayed recognition and treatment in the former.22 Similarly, ICU patients in whom CDI was identified prior to ICU admission had more severe CDI, and mortality that was directly related to CDI was only observed in patients who had CDI identified pre-ICU transfer.18 The increase in mortality observed in patients with sepsis in general with CDI may reflect similar factors.24 We observed a trend of decreasing mortality in SS patients with or without CDI during 2007 to 2013 consistent to what has been generally reported in SS.13,14
The increase in LOS observed in SS patients with CDI is also consistent with what has been observed in other ICU populations, as well as in patients with sepsis in general.17,22-24 Of note, in addition to the increase in median LOS, we found a significant increase in the number of patients with a prolonged LOS associated with having SS with CDI. It is important to note that development of CDI during hospitalization is affected by pre-CDI hospital LOS, so prolonged LOS may not be solely attributable to CDI. The interaction between LOS and CDI remains complex in which higher LOS might be associated with higher incidence of CDI occurrence, and once established, CDI might be associated with changes in LOS for the remaining hospitalization.
Hospitalized patients with CDI have an overall higher resource utilization than those without CDI.27 A recent review has estimated the overall attributable cost of CDI to be $6.3 billion; the attributable cost per case of hospital acquired CDI being 1.5 times the cost of community-acquired CDI.5 We did not look at cost directly. However, in the high-CDI risk ICU population requiring prolonged mechanical ventilation, those with CDI had a substantial increase in total costs.23 Given the substantial increase in LOS associated with CDI complicating SS, there would likely be a significant increase in hospital costs related to providing care for these patients. Further adding to the potential burden of CDI is our finding that CDI and SS was associated with an increase in 30-day hospital readmission rate. This is consistent with a recent report that ICU patients with CDI who are discharged from the hospital have a 25% 30-day hospital readmission rate.28 However, we do not have data either as to the reason for hospital readmission or whether the initial CDI or CDI recurrence played a role. This suggests that, in addition to intervention directed toward preventing CDI, efforts should be directed towards identifying factors that can be modified in CDI patients prior to or after hospital discharge.
This study has several limitations. Using an administrative database (such as NIS) has an inherent limitation of coding errors and reporting bias can lead to misclassification of cohort definition (SS) and outcome (CDI). To minimize bias due to coding errors, we used previously validated ICD-9-CM codes and approach to identify individuals with SS and CDI.13-15 Although the SS population was identified with ICD-9-CM codes using an administrative database, the in-hospital mortality for our septic population was similar to previously reported mortality of SS, suggesting the population selected was appropriate.13 SS due to CDI could not be identified; however, CDI by itself causing SS is rare, as described in recent literature.29,30 An important potential bias that needs to be acknowledged is the immortal time bias. The occurrence of CDI in itself can be influenced by pre-CDI hospital LOS. Patients who were extremely sick could have died early in their hospital course before they could acquire CDI, which would influence the mortality difference between the group with CDI and group without CDI. Furthermore, we did not have information on either the treatment of CDI or SS or any measures of severity of illness, which could lead to residual confounding despite adjusting for multiple variables. In terms of readmission data, it was necessary to exclude nonresidents of a state for the 30-day readmission analysis, as readmissions could not be tracked across state boundaries by using the NRD. This might have resulted in an underrepresentation of the readmission burden. Lastly, it was not possible to identify mortality after hospital discharge as the NIS provides only in-hospital mortality.
In conclusion, CDI is more prevalent in SS than are other ICU populations or the hospital population in general, and CDI complicating SS is associated with significant increase in LOS and risk of 30-day hospital readmission. How much of the increase in resource utilization and cost are in fact attributable to CDI in this population remains to be studied. Our finding of high prevalence of CDI in the SS population further emphasizes the importance of maintaining and furthering approaches to reduce incidence of hospital acquired CDI. While reducing unnecessary antibiotics is important, a multipronged approach that includes education and infection control interventions has also been shown to reduce the incidence of CDI in the ICU.31 Given the economic burden of CDI, implementing these strategies to reduce CDI is warranted. Similarly, the risk of 30-day hospital readmission with CDI highlights the importance of identifying the factors that contribute to hospital readmission prior to initial hospital discharge. Programs to reduce CDI will not only improve outcomes directly attributable to CDI but also decrease the reservoir of CDI. Finally, to the extent that CDI can be reduced in the ICU, the utilization of ICU resources will be more effective.
Disclosure
No conflicts of interest or financial disclosures to report. Author Contributions: KC had full access to all of the data in the study and takes responsibility for the integrity of the data and the accuracy of the data analysis, including and especially any adverse effects. KC, AG, AC, KK, and HC contributed to study design, data analysis, interpretation, and the writing of the manuscript. Guarantor statement: Kshitij Chatterjee takes responsibility for (is the guarantor of) the content of the manuscript, including the data and analysis.
1. Polage CR, Solnick JV, Cohen SH. Nosocomial diarrhea: evaluation and treatment of causes other than Clostridium difficile. Clin Infect Dis. 2012;55(7):982-989. Doi: 10.1093/cid/cis551. PubMed
2. Kyne L, Hamel MB, Polavaram R, Kelly CP. Health care costs and mortality associated with nosocomial diarrhea due to Clostridium difficile. Clin Infect Dis. 2002;34(3):346-353. Doi: 10.1086/338260. PubMed
3. Dubberke ER, Olsen MA. Burden of Clostridium difficile on the healthcare system. Clin Infect Dis. 2012;55(Suppl 2):S88-S92. Doi: 10.1093/cid/cis335. PubMed
4. Lessa FC, Mu Y, Bamberg WM, et al. Burden of Clostridium difficile infection in the United States. N Engl J Med. 2015;372(9):825-834. Doi: 10.1056/NEJMoa1408913. PubMed
5. Zhang S, Palazuelos-Munoz S, Balsells EM, Nair H, Chit A, Kyaw MH. Cost of hospital management of Clostridium difficile infection in United States-a meta-analysis and modelling study. BMC Infect Dis. 2016;16(1):447. Doi: 10.1186/s12879-016-1786-6. PubMed
6. Lessa FC, Gould CV, McDonald LC. Current status of Clostridium difficile infection epidemiology. Clin Infect Dis. 2012;55(Suppl 2):S65-S70. Doi: 10.1093/cid/cis319. PubMed
7. Depestel DD, Aronoff DM. Epidemiology of Clostridium difficile infection. J Pharm Pract. 2013;26(5):464-475. Doi: 10.1177/0897190013499521. PubMed
8. Dial S., Delaney JAC, Barkun AN, Suissa S. Use of gastric acid-suppressive agents and the risk of community-acquired Clostridium difficile-associated disease. JAMA. 2005;294(23):2989-2995. Doi: 10.1001/jama.294.23.2989. PubMed
9. Aseeri M., Schroeder T, Kramer J, Zackula R. Gastric acid suppression by proton pump inhibitors as a risk factor for clostridium difficile-associated diarrhea in hospitalized patients. Am J Gastroenterol. 2008;103(9):2308-2313. Doi: 10.1111/j.1572-0241.2008.01975.x. PubMed
10. Cunningham R, Dial S. Is over-use of proton pump inhibitors fuelling the current epidemic of Clostridium difficile-associated diarrhoea? J Hosp Infect. 2008;70(1):1-6. Doi: 10.1016/j.jhin.2008.04.023. PubMed
11. HCUP-US NIS Overview. https://www.hcup-us.ahrq.gov/nisoverview.jsp. Accessed on April 23, 2016.
12. Deyo RA, Cherkin DC, Ciol MA. Adapting a clinical comorbidity index for use with ICD-9-CM administrative databases. J Clin Epidemiol. 1992;45(6):613-619. PubMed
13. Goto T, Yoshida K, Tsugawa Y, Filbin MR, Camargo CA, Hasegawa K. Mortality trends in U.S. adults with septic shock, 2005-2011: a serial cross-sectional analysis of nationally-representative data. BMC Infect Dis. 2016;16:294. Doi: 10.1186/s12879-016-1620-1. PubMed
14. Kumar G, Kumar N, Taneja A, et al. Nationwide trends of severe sepsis in the 21st century (2000-2007). Chest. 2011;140(5):1223-1231. Doi: 10.1378/chest.11-0352. PubMed
15. Martin GS, Mannino DM, Eaton S, Moss M. The epidemiology of sepsis in the United States from 1979 through 2000. N Engl J Med. 2003;348(16):1546-1554. Doi: 10.1056/NEJMoa022139. PubMed
16. Scheurer DB, Hicks LS, Cook EF, Schnipper JL. Accuracy of ICD-9 coding for Clostridium difficile infections: a retrospective cohort. Epidemiol Infect. 2007;135(6):1010-1013. Doi: 10.1017/S0950268806007655. PubMed
17. Dodek PM, Norena M, Ayas NT, Romney M, Wong H. Length of stay and mortality due to Clostridium difficile infection acquired in the intensive care unit. J Crit Care. 2013;28(4):335-340. Doi: 10.1016/j.jcrc.2012.11.008. PubMed
18. Bouza E, Rodríguez-Créixems M, Alcalá L, et al. Is Clostridium difficile infection an increasingly common severe disease in adult intensive care units? A 10-year experience. J Crit Care. 2015;30(3):543-549. Doi: 10.1016/j.jcrc.2015.02.011. PubMed
19. Karanika S, Paudel S, Zervou FN, Grigoras C, Zacharioudakis IM, Mylonakis E. Prevalence and clinical outcomes of Clostridium difficile infection in the intensive care unit: a systematic review and meta-analysis. Open Forum Infect Dis. 2016;3(1):ofv186. Doi: 10.1093/ofid/ofv186. PubMed
20. Zahar JR, Schwebel C, Adrie C, et al. Outcome of ICU patients with Clostridium difficile infection. Crit Care. 2012;16(6):R215. Doi: 10.1186/cc11852. PubMed
21. Shorr AF, Zilberberg MD, Wang L, Baser O, Yu H. Mortality and costs in clostridium difficile infection among the elderly in the United States. Infect Control Hosp Epidemiol. 2016;37(11):1331-1336. Doi: 10.1017/ice.2016.188. PubMed
22. Micek ST, Schramm G, Morrow L, et al. Clostridium difficile infection: a multicenter study of epidemiology and outcomes in mechanically ventilated patients. Crit Care Med. 2013;41(8):1968-1975. Doi: 10.1097/CCM.0b013e31828a40d5. PubMed
23. Zilberberg MD, Nathanson BH, Sadigov S, Higgins TL, Kollef MH, Shorr AF. Epidemiology and outcomes of clostridium difficile-associated disease among patients on prolonged acute mechanical ventilation. Chest. 2009;136(3):752-758. Doi: 10.1378/chest.09-0596. PubMed
24. Lagu T, Stefan MS, Haessler S, et al. The impact of hospital-onset Clostridium difficile infection on outcomes of hospitalized patients with sepsis. J Hosp Med. 2014;9(7):411-417. Doi: 10.1002/jhm.2199. PubMed
25. Prescott HC, Dickson RP, Rogers MA, Langa KM, Iwashyna TJ. Hospitalization type and subsequent severe sepsis. Am J Respir Crit Care Med. 2015;192(5):581-588. Doi: 10.1164/rccm.201503-0483OC. PubMed
26. Healthcare-associated Infections (HAI) Progress Report. Centers for Disease Control and Prevention. http://www.cdc.gov/hai/surveillance/progress-report/index.html. Accessed on July 29, 2017.
27. Song X, Bartlett JG, Speck K, Naegeli A, Carroll K, Perl TM. Rising economic impact of clostridium difficile-associated disease in adult hospitalized patient population. Infect Control Hosp Epidemiol. 2008;29(9):823-828. Doi: 10.1086/588756. PubMed
28. Zilberberg MD, Shorr AF, Micek ST, et al. Clostridium difficile recurrence is a strong predictor of 30-day rehospitalization among patients in intensive care. Infect Control Hosp Epidemiol. 2015;36(3):273-279. Doi: 10.1017/ice.2014.47. PubMed
29. Loftus KV, Wilson PM. A curiously rare case of septic shock from Clostridium difficile colitis. Pediatr Emerg Care. 2015. [Epub ahead of print]. Doi: 10.1097/PEC.0000000000000496. PubMed
30. Bermejo C, Maseda E, Salgado P, Gabilondo G., Gilsanz F. Septic shock due to a community acquired Clostridium difficile infection. A case study and a review of the literature. Rev Esp Anestesiol Reanimvol. 2014;61(4):219-222. PubMed
31. You E, Song H, Cho J, Lee J. Reduction in the incidence of hospital-acquired Clostridium difficile infection through infection control interventions other than the restriction of antimicrobial use. Int J Infect Dis. 2014;22:9-10. 2014. PubMed
Clostridium difficile infection (CDI) is the most common infectious cause of healthcare-associated diarrhea.1 Development of a CDI during hospitalization is associated with increases in morbidity, mortality, length of stay (LOS), and cost.2-5 The prevalence of CDI in hospitalized patients has increased dramatically from the mid-1990s to the mid-2000s to almost 9 cases per 1000 discharges; however, the CDI rate since 2007 appears to have plateaued.6,7 Antibiotic use has historically been the most important risk factor for acquiring CDI; however, use of acid-suppressing agents, chemotherapy, chronic comorbidities, and healthcare exposure all also increase the risk of CDI.7-10 The elderly (> 65 years of age) are particularly at risk for developing CDI and having worse clinical outcomes with CDI.6,7
Patients with septic shock (SS) often have multiple CDI risk factors (in particular, extensive antibiotic exposure) and thus, represent a population at a particularly high risk for acquiring a CDI during hospitalization. However, little data are available on the prevalence of CDI acquired in patients hospitalized with SS. We sought to determine the national-level temporal trends in the prevalence of CDI in patients with SS and the impact of CDI complicating SS on clinical outcomes between 2007 and 2013.
METHODS
Data Source
We used the National Inpatient Sample (NIS) and Nationwide Readmissions Database (NRD) for this study. The NIS is a database developed by the Agency of Healthcare Research and Quality for the Healthcare Cost and Utilization Project (HCUP).11 It is the largest all-payer inpatient database in the United States and has been used by researchers and policy makers to analyze national trends in outcomes and healthcare utilization. The NIS database now approximates a 20% stratified sample of all discharges from all participating US hospitals. Sampling weights are provided by the manufacturer and can be used to produce national-level estimates. Following the redesign of the NIS in 2012, new sampling weights were provided for trend analysis for the years prior to 2012 to account for the new design. Every hospitalization is deidentified and converted into one unique entry that provides information on demographics, hospital characteristics, 1 primary and up to 24 secondary discharge diagnoses, comorbidities, LOS, in-hospital mortality, and procedures performed during stay. The discharge diagnoses are provided in the form of the International Classification of Diseases, 9th Revision-Clinical Modification (ICD-9-CM) codes.
The NRD is a database developed for HCUP that contains about 35 million discharges each year and supports readmission data analyses. In 2013, the NRD contained data from 21 geographically diverse states, accounting for 49.1% of all US hospitalizations. Diagnosis, comorbidities, and outcomes are presented in a similar manner to NIS.
Study Design
This was a retrospective cohort study. Data from the NIS between 2007 and 2013 were used for the analysis. Demographic data obtained included age, gender, race, Charlson-Deyo Comorbidity Index,12 hospital characteristics (hospital region, hospital-bed size, urban versus rural location, and teaching status), calendar year, and use of mechanical ventilation. Cases with information missing on key demographic variables (age, gender, and race) were excluded. Only adults (>18 years of age) were included for the analysis.
SS was identified by either (1) ICD-9-CM diagnosis code for SS (785.52) or (2) presence of vasopressor use (00.17) along with ICD-9-CM codes of sepsis, severe sepsis, septicemia, bacteremia, or fungemia. This approach is consistent with what has been utilized in other studies to identify cases of sepsis or SS from administrative databases.13-15 The appendix provides a complete list of ICD-9-CM codes used in the study. CDI was identified by ICD-9-CM code 008.45 among the secondary diagnosis. This code has been shown to have good accuracy for identifying CDI using administrative data.16 To minimize the inclusion of cases in which a CDI was present at admission, hospitalizations with a primary diagnosis of CDI were not included as cases of CDI complicating SS.
We used NRD 2013 for estimating the effect of CDI on 30-day readmission after initial hospitalizations with SS. We used the criteria for index admissions and 30-day readmissions as defined by the Centers for Medicare and Medicaid Services. We excluded patients who died during their index admission, patients with index discharges in December due to a lack of sufficient time to capture 30-day readmissions, and patients with missing information on key variables. We also excluded patients who were not a resident of the state of index hospitalization since readmission across state boundaries could not be identified in NRD. Manufacturer provided sampling weights were used to produce national level estimates. The cases of SS and CDI were identified by ICD-9-CM codes using the methodology described above.
Outcomes
Our primary outcome of interest was the total and yearly prevalence of CDI in patients with SS from 2007 to 2013. The secondary outcomes were mortality, LOS, and 30-day readmissions in patients with SS with and without CDI.
Statistical Analysis
Weighted data from NIS were used for all analyses. Demographics, hospital characteristics, and outcomes of all patients with SS were obtained. The prevalence of CDI was calculated for each calendar year. The temporal trends of outcomes (LOS and in-hospital mortality) of patients were plotted for patients with SS with and without CDI. A χ2 test of trend for proportions was used with the Cochran-Armitage test to calculate statistical significance of changes in prevalence. To test for statistical significance of the temporal trends of LOS, a univariate linear regression was used, with calendar year as a covariate. Independent samples t test, a Mann-Whitney U test, and a χ2 test were used to determine statistical significance of parameters between the group with CDI and the group without CDI.
Prolonged LOS was defined either as a LOS > 75th or > 90th percentile of LOS among all patients with SS. To identify if CDI was associated with a prolonged LOS after adjusting for patient and hospital characteristics, a multivariate logistic regression analysis was used. Variables included in the regression model were age, gender, race, Charlson-Deyo Comorbidity Index, hospital characteristics (hospital region, hospital-bed size, urban versus rural location, and teaching status), calendar year, and use of mechanical ventilation. Data on cases were available for all the above covariates except hospital characteristics, such as teaching status, location, and bed size (these were missing for 0.7% of hospitals).
Stata 13.1.0 (Stata Corp, College Station, TX) and SPSS 23.0 (SPSS Inc., Chicago, IL) were used to perform statistical analyses. A P value of <0.05 was considered statistically significant.
RESULTS
Demographics
A total of 2,031,739 hospitalizations of adults with SS were identified between 2007 and 2013. CDI was present in 166,432 (8.2%) of these patients. Demographic data are displayed in Table 1. CDI was more commonly observed in elderly patients (> 65 years) with SS; 9.3% among the elderly versus 6.6% among individuals < 65 years; P < 0.001. The prevalence of CDI was greater in urban than in rural hospitals (8.4% vs 5.4%; P < 0.001) and greater in teaching than in nonteaching hospitals (8.7% vs 7.7%; P < 0.001). The prevalence of CDI in SS remained stable between 2007 and 2013 (Table 2).
Mortality
In the overall study cohort, the in-hospital mortality for SS was 37%. The in-hospital mortality rate of patients with SS complicated by a CDI was comparable to the mortality rate of patients without a CDI (37.1% vs 37.0%; P = 0.48). The mortality of patients with SS, with or without CDI, progressively decreased from 2007 to 2013 (P value for trend < 0.001 for each group; Figure 1).
Length of Stay
The median LOS for all patients with SS was 9 days. Patients with CDI had a longer median LOS than did those without CDI (13 vs 9 days; P < 0.001). Between 2007 and 2013, the median LOS of CDI group decreased from 14 to 12 days (P < 0.001) while that of non-CDI group decreased from 9 to 8 days (P < 0.001; Figure 2). We also examined LOS among subgroups who were discharged alive and those who died during hospitalization. For patients who were discharged alive, the LOS with and without CDI was 15 days versus 10 days, respectively (P < 0.001). For patients who died during hospitalization, LOS with and without CDI was 10 days versus 6 days, respectively (P < 0.001).
The 75th percentile of LOS of the total SS cohort was 17 days. An LOS > 17 days was observed in 36.9% of SS patients with CDI versus 22.7% without CDI (P < 0.001). After adjusting for patient and provider level variables, the odds of a LOS > 17 days were significantly greater for SS patients with CDI (odds ratio [OR] 2.11; 95% confidence interval [CI], 2.06-2.15; P < 0.001).
The 90th percentile of LOS of the total SS cohort was 29 days. An LOS > 29 days was observed in 17.5% of SS patients with a CDI versus 9.1% without a CDI (P < 0.001). After adjustment for patient and provider level variables, the odds of a LOS > 29 days were significantly greater for SS patients with a CDI (OR 2.25; 95% CI, 2.22-2.28; P < 0.001).
Hospital Readmission
In 2013, patients with SS and CDI had a higher rate of 30-day readmission as compared to patients with SS without CDI (9.8% vs 7.4% respectively; P < 0.001). The multivariate adjusted OR for 30-day readmission for patients with SS and a CDI was 1.26 (95% CI, 1.22-1.31; P < 0.001).
Additional Analyses
Lastly, we performed an additional analysis to confirm our hypothesis that a CDI by itself is rarely a cause of SS, and that CDI as the principal diagnosis would constitute an extremely low number of patients with SS in an administrative dataset. In NIS 2013, there were 105,750 cases with CDI as the primary diagnosis. A total of 4470 (4.2%) had a secondary diagnosis of sepsis and only 930 (0.9%) cases had a secondary diagnosis of SS.
DISCUSSION
This is the first study to report on the prevalence and outcome of CDI complicating SS. By using a large nationally representative sample, we found CDI was very prevalent among individuals hospitalized with SS and, at a level in excess of that seen in other populations. Of interest, we did not observe an increase in mortality of SS when complicated by CDI. On the other hand, patients with SS complicated by CDI were more much likely to have a prolonged hospital LOS and a higher risk of 30-day hospital readmission.
The prevalence of CDI exploded between the mid-1990s and mid-2000s, including community, hospital, and intensive care unit (ICU)–related disease.6,7,17-20 Patients with SS often have multiple risk factors associated with CDI and thus represent a high-risk population for developing CDI.7 Our findings are consistent with the suggestion that individuals with SS are at a higher risk of developing CDI. Compared to the rate of CDI in all hospitalized patients, our data suggest an almost 10-fold increase in CDI rate for patients with SS.6 Patients with SS and CDI may account for as much as 10% of total CDIs.6,7 As has been reported for CDI in general, we observed that CDI complicating SS was more common in those > 65 years of age.4,21 The prevalence of CDI we observed in patients with SS was also higher than has been reported in ICU patients in general (1%), and higher than reported for patients requiring mechanical ventilation (6.6%), including prolonged mechanical ventilation (5.3%); further supporting the conclusion that patients with SS are a particularly high-risk group for acquiring CDI, even compared with other ICU patients.20,22,23 Similarly, the rate of CDI among SS was 8 times higher than that of recently reported hospital-onset CDI among patients with sepsis in general (incidence 1.08%).24 We have no data regarding why patients with SS have a higher rate of CDI; however, the intensity and duration of antibiotic treatment of these patients may certainly play a role.25 It has recently been reported that CDI in itself can be a precursor leading to intestinal dysbiosis that can increase the risk of subsequent sepsis. Similarly, patients with SS may have higher prevalence of dysbiosis that, in turn, might predispose them to CDI at a higher rate than other individuals.
Following the increase in CDIs in the mid-1990s and the mid-2000s, since 2007 the overall prevalence of CDIs has been stable, albeit at the higher rate. More recently, the Centers for Disease Control and Prevention (CDC) has reported a decrease in hospital onset CDI after 2011.26
The finding that CDI in SS patients was not associated with an increase in mortality is consistent with other reports of CDI in ICU patients in general as well as higher-risk ICU populations such as patients requiring mechanical ventilation, including those on long-term mechanical ventilator support.17,18,20,22,23 Why the mortality of ICU patients with CDI is not increased is not completely clear. It has been suggested that this may be related to early recognition and treatment of CDI developing in the ICU.22 Along these lines, it has been previously observed that for patients with CDI on mechanical ventilation, patients who were transferred to the ICU from the ward had worse clinical outcomes compared to patients directly admitted to the ICU, likely due to delayed recognition and treatment in the former.22 Similarly, ICU patients in whom CDI was identified prior to ICU admission had more severe CDI, and mortality that was directly related to CDI was only observed in patients who had CDI identified pre-ICU transfer.18 The increase in mortality observed in patients with sepsis in general with CDI may reflect similar factors.24 We observed a trend of decreasing mortality in SS patients with or without CDI during 2007 to 2013 consistent to what has been generally reported in SS.13,14
The increase in LOS observed in SS patients with CDI is also consistent with what has been observed in other ICU populations, as well as in patients with sepsis in general.17,22-24 Of note, in addition to the increase in median LOS, we found a significant increase in the number of patients with a prolonged LOS associated with having SS with CDI. It is important to note that development of CDI during hospitalization is affected by pre-CDI hospital LOS, so prolonged LOS may not be solely attributable to CDI. The interaction between LOS and CDI remains complex in which higher LOS might be associated with higher incidence of CDI occurrence, and once established, CDI might be associated with changes in LOS for the remaining hospitalization.
Hospitalized patients with CDI have an overall higher resource utilization than those without CDI.27 A recent review has estimated the overall attributable cost of CDI to be $6.3 billion; the attributable cost per case of hospital acquired CDI being 1.5 times the cost of community-acquired CDI.5 We did not look at cost directly. However, in the high-CDI risk ICU population requiring prolonged mechanical ventilation, those with CDI had a substantial increase in total costs.23 Given the substantial increase in LOS associated with CDI complicating SS, there would likely be a significant increase in hospital costs related to providing care for these patients. Further adding to the potential burden of CDI is our finding that CDI and SS was associated with an increase in 30-day hospital readmission rate. This is consistent with a recent report that ICU patients with CDI who are discharged from the hospital have a 25% 30-day hospital readmission rate.28 However, we do not have data either as to the reason for hospital readmission or whether the initial CDI or CDI recurrence played a role. This suggests that, in addition to intervention directed toward preventing CDI, efforts should be directed towards identifying factors that can be modified in CDI patients prior to or after hospital discharge.
This study has several limitations. Using an administrative database (such as NIS) has an inherent limitation of coding errors and reporting bias can lead to misclassification of cohort definition (SS) and outcome (CDI). To minimize bias due to coding errors, we used previously validated ICD-9-CM codes and approach to identify individuals with SS and CDI.13-15 Although the SS population was identified with ICD-9-CM codes using an administrative database, the in-hospital mortality for our septic population was similar to previously reported mortality of SS, suggesting the population selected was appropriate.13 SS due to CDI could not be identified; however, CDI by itself causing SS is rare, as described in recent literature.29,30 An important potential bias that needs to be acknowledged is the immortal time bias. The occurrence of CDI in itself can be influenced by pre-CDI hospital LOS. Patients who were extremely sick could have died early in their hospital course before they could acquire CDI, which would influence the mortality difference between the group with CDI and group without CDI. Furthermore, we did not have information on either the treatment of CDI or SS or any measures of severity of illness, which could lead to residual confounding despite adjusting for multiple variables. In terms of readmission data, it was necessary to exclude nonresidents of a state for the 30-day readmission analysis, as readmissions could not be tracked across state boundaries by using the NRD. This might have resulted in an underrepresentation of the readmission burden. Lastly, it was not possible to identify mortality after hospital discharge as the NIS provides only in-hospital mortality.
In conclusion, CDI is more prevalent in SS than are other ICU populations or the hospital population in general, and CDI complicating SS is associated with significant increase in LOS and risk of 30-day hospital readmission. How much of the increase in resource utilization and cost are in fact attributable to CDI in this population remains to be studied. Our finding of high prevalence of CDI in the SS population further emphasizes the importance of maintaining and furthering approaches to reduce incidence of hospital acquired CDI. While reducing unnecessary antibiotics is important, a multipronged approach that includes education and infection control interventions has also been shown to reduce the incidence of CDI in the ICU.31 Given the economic burden of CDI, implementing these strategies to reduce CDI is warranted. Similarly, the risk of 30-day hospital readmission with CDI highlights the importance of identifying the factors that contribute to hospital readmission prior to initial hospital discharge. Programs to reduce CDI will not only improve outcomes directly attributable to CDI but also decrease the reservoir of CDI. Finally, to the extent that CDI can be reduced in the ICU, the utilization of ICU resources will be more effective.
Disclosure
No conflicts of interest or financial disclosures to report. Author Contributions: KC had full access to all of the data in the study and takes responsibility for the integrity of the data and the accuracy of the data analysis, including and especially any adverse effects. KC, AG, AC, KK, and HC contributed to study design, data analysis, interpretation, and the writing of the manuscript. Guarantor statement: Kshitij Chatterjee takes responsibility for (is the guarantor of) the content of the manuscript, including the data and analysis.
1. Polage CR, Solnick JV, Cohen SH. Nosocomial diarrhea: evaluation and treatment of causes other than Clostridium difficile. Clin Infect Dis. 2012;55(7):982-989. Doi: 10.1093/cid/cis551. PubMed
2. Kyne L, Hamel MB, Polavaram R, Kelly CP. Health care costs and mortality associated with nosocomial diarrhea due to Clostridium difficile. Clin Infect Dis. 2002;34(3):346-353. Doi: 10.1086/338260. PubMed
3. Dubberke ER, Olsen MA. Burden of Clostridium difficile on the healthcare system. Clin Infect Dis. 2012;55(Suppl 2):S88-S92. Doi: 10.1093/cid/cis335. PubMed
4. Lessa FC, Mu Y, Bamberg WM, et al. Burden of Clostridium difficile infection in the United States. N Engl J Med. 2015;372(9):825-834. Doi: 10.1056/NEJMoa1408913. PubMed
5. Zhang S, Palazuelos-Munoz S, Balsells EM, Nair H, Chit A, Kyaw MH. Cost of hospital management of Clostridium difficile infection in United States-a meta-analysis and modelling study. BMC Infect Dis. 2016;16(1):447. Doi: 10.1186/s12879-016-1786-6. PubMed
6. Lessa FC, Gould CV, McDonald LC. Current status of Clostridium difficile infection epidemiology. Clin Infect Dis. 2012;55(Suppl 2):S65-S70. Doi: 10.1093/cid/cis319. PubMed
7. Depestel DD, Aronoff DM. Epidemiology of Clostridium difficile infection. J Pharm Pract. 2013;26(5):464-475. Doi: 10.1177/0897190013499521. PubMed
8. Dial S., Delaney JAC, Barkun AN, Suissa S. Use of gastric acid-suppressive agents and the risk of community-acquired Clostridium difficile-associated disease. JAMA. 2005;294(23):2989-2995. Doi: 10.1001/jama.294.23.2989. PubMed
9. Aseeri M., Schroeder T, Kramer J, Zackula R. Gastric acid suppression by proton pump inhibitors as a risk factor for clostridium difficile-associated diarrhea in hospitalized patients. Am J Gastroenterol. 2008;103(9):2308-2313. Doi: 10.1111/j.1572-0241.2008.01975.x. PubMed
10. Cunningham R, Dial S. Is over-use of proton pump inhibitors fuelling the current epidemic of Clostridium difficile-associated diarrhoea? J Hosp Infect. 2008;70(1):1-6. Doi: 10.1016/j.jhin.2008.04.023. PubMed
11. HCUP-US NIS Overview. https://www.hcup-us.ahrq.gov/nisoverview.jsp. Accessed on April 23, 2016.
12. Deyo RA, Cherkin DC, Ciol MA. Adapting a clinical comorbidity index for use with ICD-9-CM administrative databases. J Clin Epidemiol. 1992;45(6):613-619. PubMed
13. Goto T, Yoshida K, Tsugawa Y, Filbin MR, Camargo CA, Hasegawa K. Mortality trends in U.S. adults with septic shock, 2005-2011: a serial cross-sectional analysis of nationally-representative data. BMC Infect Dis. 2016;16:294. Doi: 10.1186/s12879-016-1620-1. PubMed
14. Kumar G, Kumar N, Taneja A, et al. Nationwide trends of severe sepsis in the 21st century (2000-2007). Chest. 2011;140(5):1223-1231. Doi: 10.1378/chest.11-0352. PubMed
15. Martin GS, Mannino DM, Eaton S, Moss M. The epidemiology of sepsis in the United States from 1979 through 2000. N Engl J Med. 2003;348(16):1546-1554. Doi: 10.1056/NEJMoa022139. PubMed
16. Scheurer DB, Hicks LS, Cook EF, Schnipper JL. Accuracy of ICD-9 coding for Clostridium difficile infections: a retrospective cohort. Epidemiol Infect. 2007;135(6):1010-1013. Doi: 10.1017/S0950268806007655. PubMed
17. Dodek PM, Norena M, Ayas NT, Romney M, Wong H. Length of stay and mortality due to Clostridium difficile infection acquired in the intensive care unit. J Crit Care. 2013;28(4):335-340. Doi: 10.1016/j.jcrc.2012.11.008. PubMed
18. Bouza E, Rodríguez-Créixems M, Alcalá L, et al. Is Clostridium difficile infection an increasingly common severe disease in adult intensive care units? A 10-year experience. J Crit Care. 2015;30(3):543-549. Doi: 10.1016/j.jcrc.2015.02.011. PubMed
19. Karanika S, Paudel S, Zervou FN, Grigoras C, Zacharioudakis IM, Mylonakis E. Prevalence and clinical outcomes of Clostridium difficile infection in the intensive care unit: a systematic review and meta-analysis. Open Forum Infect Dis. 2016;3(1):ofv186. Doi: 10.1093/ofid/ofv186. PubMed
20. Zahar JR, Schwebel C, Adrie C, et al. Outcome of ICU patients with Clostridium difficile infection. Crit Care. 2012;16(6):R215. Doi: 10.1186/cc11852. PubMed
21. Shorr AF, Zilberberg MD, Wang L, Baser O, Yu H. Mortality and costs in clostridium difficile infection among the elderly in the United States. Infect Control Hosp Epidemiol. 2016;37(11):1331-1336. Doi: 10.1017/ice.2016.188. PubMed
22. Micek ST, Schramm G, Morrow L, et al. Clostridium difficile infection: a multicenter study of epidemiology and outcomes in mechanically ventilated patients. Crit Care Med. 2013;41(8):1968-1975. Doi: 10.1097/CCM.0b013e31828a40d5. PubMed
23. Zilberberg MD, Nathanson BH, Sadigov S, Higgins TL, Kollef MH, Shorr AF. Epidemiology and outcomes of clostridium difficile-associated disease among patients on prolonged acute mechanical ventilation. Chest. 2009;136(3):752-758. Doi: 10.1378/chest.09-0596. PubMed
24. Lagu T, Stefan MS, Haessler S, et al. The impact of hospital-onset Clostridium difficile infection on outcomes of hospitalized patients with sepsis. J Hosp Med. 2014;9(7):411-417. Doi: 10.1002/jhm.2199. PubMed
25. Prescott HC, Dickson RP, Rogers MA, Langa KM, Iwashyna TJ. Hospitalization type and subsequent severe sepsis. Am J Respir Crit Care Med. 2015;192(5):581-588. Doi: 10.1164/rccm.201503-0483OC. PubMed
26. Healthcare-associated Infections (HAI) Progress Report. Centers for Disease Control and Prevention. http://www.cdc.gov/hai/surveillance/progress-report/index.html. Accessed on July 29, 2017.
27. Song X, Bartlett JG, Speck K, Naegeli A, Carroll K, Perl TM. Rising economic impact of clostridium difficile-associated disease in adult hospitalized patient population. Infect Control Hosp Epidemiol. 2008;29(9):823-828. Doi: 10.1086/588756. PubMed
28. Zilberberg MD, Shorr AF, Micek ST, et al. Clostridium difficile recurrence is a strong predictor of 30-day rehospitalization among patients in intensive care. Infect Control Hosp Epidemiol. 2015;36(3):273-279. Doi: 10.1017/ice.2014.47. PubMed
29. Loftus KV, Wilson PM. A curiously rare case of septic shock from Clostridium difficile colitis. Pediatr Emerg Care. 2015. [Epub ahead of print]. Doi: 10.1097/PEC.0000000000000496. PubMed
30. Bermejo C, Maseda E, Salgado P, Gabilondo G., Gilsanz F. Septic shock due to a community acquired Clostridium difficile infection. A case study and a review of the literature. Rev Esp Anestesiol Reanimvol. 2014;61(4):219-222. PubMed
31. You E, Song H, Cho J, Lee J. Reduction in the incidence of hospital-acquired Clostridium difficile infection through infection control interventions other than the restriction of antimicrobial use. Int J Infect Dis. 2014;22:9-10. 2014. PubMed
© 2017 Society of Hospital Medicine
The Authors Reply, “What Can Be Done to Maintain Positive Patient Experience and Improve Residents’ Satisfaction?” and “Standardized Attending Rounds to Improve the Patient Experience: A Pragmatic Cluster Randomized Controlled Trial”
We thank Talari et al. for their comments in response to our randomized controlled trial evaluating the impact of standardized rounds on patient, attending, and trainee satisfaction. We agree that many factors beyond rounding structure contribute to resident satisfaction, including those highlighted by the authors, and would enthusiastically welcome additional research in this realm.
Because our study intervention addressed rounding structure, we elected to specifically focus on satisfaction with rounds, both from the physician and patient perspectives. We chose to ask about patient satisfaction with attending rounds, as opposed to more generic measures of patient satisfaction, to allow for more direct comparison between attending/resident responses and patient responses. Certainly, there are many other factors that affect overall patient experience. Surveys such as Hospital Consumer Assessment of Healthcare Providers and Systems (HCAHPS) and Press Ganey do not specifically address rounds, are often completed several weeks following hospitalization, and may have low response rates. Relying on such global assessments of patient experience may also reduce the power of the study. Although patient responses to our survey may be higher than scores seen with HCAHPS and Press Ganey, the randomized nature of our study helps control for other differences in the hospitalization experience unrelated to rounding structure. Similarly, because physician teams were randomly assigned, differences in census were not a major factor in the study. Physician blinding was not possible due to the nature of the intervention, which may have affected the satisfaction reports from attendings and residents. For our primary outcome (patient satisfaction with rounds), patients were blinded to the nature of our intervention, and all study team members involved in data collection and statistical analyses were blinded to study arm allocation.
In summary, we feel that evaluating the trade-offs and consequences of interventions should be examined from multiple perspectives, and we welcome additional investigations in this area.
© 2017 Society of Hospital Medicine
What Can Be Done to Maintain Positive Patient Experience and Improve Residents’ Satisfaction? In Reference to: “Standardized Attending Rounds to Improve the Patient Experience: A Pragmatic Cluster Randomized Controlled Trial”
We read the article by Monash et al.1 published in the March 2017 issue with great interest. This randomized study showed a discrepancy between patients’ and residents’ satisfaction with standardized rounds; for example, residents reported less autonomy, efficiency, teaching, and longer time of rounds.
We agree that letting residents lead the rounds with minimal participation of an attending (only when needed) may improve resident satisfaction. Other factors, such as quality of teaching, positive comments to learners during bedside rounds (whenever appropriate), and a positive attending attitude, might be helpful.2,3 We believe that the adaptation of such a model through the prism of residents’ benefit will lead to better satisfaction among trainees.
On the other hand, we note that the nature of the study might have exaggerated patient satisfaction when compared with real-world surveys.4 The survey appears to focus only on attending rounds and did not consider other factors like hospitality, pain control, etc. A low patient census and lack of double blinding are other potential factors.
In conclusion, we want to congratulate the authors for raising this important topic and showing positive patients’ satisfaction with standardized rounds on teaching services. Further research should focus on improving residents’ satisfaction without compromising patients’ experiences.
1. Monash B, Najafi N, Mourad M, et al. Standardized Attending Rounds to Improve the Patient Experience: A Pragmatic Cluster Randomized Controlled Trial. J Hosp Med. 2017;12(3):143-149. PubMed
2. Williams KN, Ramani S, Fraser B, Orlander JD. Improving bedside teaching: findings from a focus group study of learners. Acad Med. 2008;83(3):257-264. PubMed
3. Castiglioni A, Shewchuk RM, Willett LL, Heudebert GR, Centor RM. A pilot study using nominal group technique to assess residents’ perceptions of successful attending rounds. J Gen Intern Med. 2008;23(7):1060-1065. PubMed
4. Siddiqui ZK, Wu AW, Kurbanova N, Qayyum R. Comparison of Hospital Consumer Assessment of Healthcare Providers and Systems patient satisfaction scores for specialty hospitals and general medical hospitals: confounding effect of survey response rate. J Hosp Med. 2014;9(9):590-593. PubMed
We read the article by Monash et al.1 published in the March 2017 issue with great interest. This randomized study showed a discrepancy between patients’ and residents’ satisfaction with standardized rounds; for example, residents reported less autonomy, efficiency, teaching, and longer time of rounds.
We agree that letting residents lead the rounds with minimal participation of an attending (only when needed) may improve resident satisfaction. Other factors, such as quality of teaching, positive comments to learners during bedside rounds (whenever appropriate), and a positive attending attitude, might be helpful.2,3 We believe that the adaptation of such a model through the prism of residents’ benefit will lead to better satisfaction among trainees.
On the other hand, we note that the nature of the study might have exaggerated patient satisfaction when compared with real-world surveys.4 The survey appears to focus only on attending rounds and did not consider other factors like hospitality, pain control, etc. A low patient census and lack of double blinding are other potential factors.
In conclusion, we want to congratulate the authors for raising this important topic and showing positive patients’ satisfaction with standardized rounds on teaching services. Further research should focus on improving residents’ satisfaction without compromising patients’ experiences.
1. Monash B, Najafi N, Mourad M, et al. Standardized Attending Rounds to Improve the Patient Experience: A Pragmatic Cluster Randomized Controlled Trial. J Hosp Med. 2017;12(3):143-149. PubMed
2. Williams KN, Ramani S, Fraser B, Orlander JD. Improving bedside teaching: findings from a focus group study of learners. Acad Med. 2008;83(3):257-264. PubMed
3. Castiglioni A, Shewchuk RM, Willett LL, Heudebert GR, Centor RM. A pilot study using nominal group technique to assess residents’ perceptions of successful attending rounds. J Gen Intern Med. 2008;23(7):1060-1065. PubMed
4. Siddiqui ZK, Wu AW, Kurbanova N, Qayyum R. Comparison of Hospital Consumer Assessment of Healthcare Providers and Systems patient satisfaction scores for specialty hospitals and general medical hospitals: confounding effect of survey response rate. J Hosp Med. 2014;9(9):590-593. PubMed
The Authors Reply: “Cost and Utility of Thrombophilia Testing”
We thank Dr. Berse and colleagues for their correspondence about our paper.1,2 We are pleased they agreed with our conclusion: Thrombophilia testing has limited clinical utility in most inpatient settings.
Berse and colleagues critiqued details of our methodology in calculating payer cost, including how we estimated the number of Medicare claims for thrombophilia testing. We estimated that there were at least 280,000 Medicare claims in 2014 using CodeMap® (Wheaton Partners, LLC, Schaumburg, IL), a dataset of utilization data from the Physician Supplier Procedure Summary Master File from all Medicare Part B carriers.3 This estimate was similar to that reported in a previous publication.4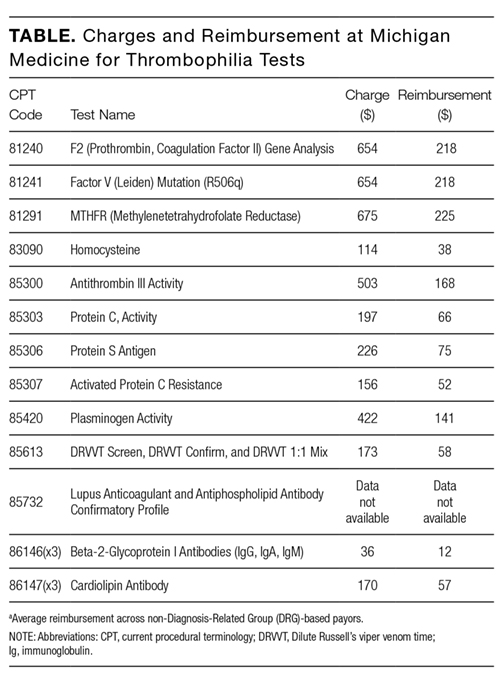
Thus, regardless of the precise estimates, even a conservative estimate of 33 to 80 million dollars of unnecessary spending is far too much. Rather, it is a perfect example of “Things We Do for No Reason.”
Disclosure
Nothing to report.
1. Petrilli CM, Mack M, Petrilli JJ, Hickner A, Saint S, Chopra V. Understanding the role of physician attire on patient perceptions: a systematic review of the literature--targeting attire to improve likelihood of rapport (TAILOR) investigators. BMJ Open. 2015;5(1):e006578. DOI:10.1136/bmjopen-2014-006578. PubMed
2. Berse B, Lynch JA, Bowen S, Grosse SD. In Reference to: “Cost and Utility of Thrombophilia Testing.” J Hosp Med. 2017;12(9):783.
3. CodeMap® https://www.codemap.com/. Accessed March 2, 2017.
4. Somma J, Sussman, II, Rand JH. An evaluation of thrombophilia screening in an urban tertiary care medical center: A “real world” experience. Am J Clin Pathol. 2006;126(1):120-7. DOI:10.1309/KV06-32LJ-8EDM-EWQT. PubMed
We thank Dr. Berse and colleagues for their correspondence about our paper.1,2 We are pleased they agreed with our conclusion: Thrombophilia testing has limited clinical utility in most inpatient settings.
Berse and colleagues critiqued details of our methodology in calculating payer cost, including how we estimated the number of Medicare claims for thrombophilia testing. We estimated that there were at least 280,000 Medicare claims in 2014 using CodeMap® (Wheaton Partners, LLC, Schaumburg, IL), a dataset of utilization data from the Physician Supplier Procedure Summary Master File from all Medicare Part B carriers.3 This estimate was similar to that reported in a previous publication.4
Thus, regardless of the precise estimates, even a conservative estimate of 33 to 80 million dollars of unnecessary spending is far too much. Rather, it is a perfect example of “Things We Do for No Reason.”
Disclosure
Nothing to report.
1. Petrilli CM, Mack M, Petrilli JJ, Hickner A, Saint S, Chopra V. Understanding the role of physician attire on patient perceptions: a systematic review of the literature--targeting attire to improve likelihood of rapport (TAILOR) investigators. BMJ Open. 2015;5(1):e006578. DOI:10.1136/bmjopen-2014-006578. PubMed
2. Berse B, Lynch JA, Bowen S, Grosse SD. In Reference to: “Cost and Utility of Thrombophilia Testing.” J Hosp Med. 2017;12(9):783.
3. CodeMap® https://www.codemap.com/. Accessed March 2, 2017.
4. Somma J, Sussman, II, Rand JH. An evaluation of thrombophilia screening in an urban tertiary care medical center: A “real world” experience. Am J Clin Pathol. 2006;126(1):120-7. DOI:10.1309/KV06-32LJ-8EDM-EWQT. PubMed
© 2017 Society of Hospital Medicine
In Reference to: “Cost and Utility of Thrombophilia Testing”
The article by Petrilli et al. points to the important but complicated issue of ordering laboratory testing for thrombophilia despite multiple guidelines that dispute the clinical utility of such testing for many indications.1 We question the basis of these authors’ assertion that Medicare spends $300 to $672 million for thrombophilia testing annually. They arrived at this figure by multiplying the price of a thrombophilia test panel (between $1100 and $2400) by the number of annual Medicare claims for thrombophilia analysis, which they estimated at 280,000. The price of the panel is derived from two papers: (1) a 2001 review2 that lists prices of various thrombophilia-related tests adding up to $1782, and (2) a 2006 evaluation by Somma et al.3 of thrombophilia screening at one hospital in New York in 2005. The latter paper refers to various thrombophilia panels from Quest Diagnostics with list prices ranging from $1311 to $2429. However, the repertoire of available test panels and their prices have changed over the last decade. The cost evaluation of thrombophilia testing should be based on actual current payments for tests, and not on list prices for laboratory offerings from over a decade ago. Several laboratories offer mutational analysis of 3 genes—F5, F2, and MTHFR—as a thrombophilia risk panel. Based on the Current Procedural Terminology (CPT) codes listed by the test suppliers (81240, 81241, and 81291), the average Medicare payment for the combination of these 3 markers in 2013 was $172.4 A broader panel of several biochemical, immunological, and genetic assays had a maximum Medicare payment in 2015 of $405 (Table).5
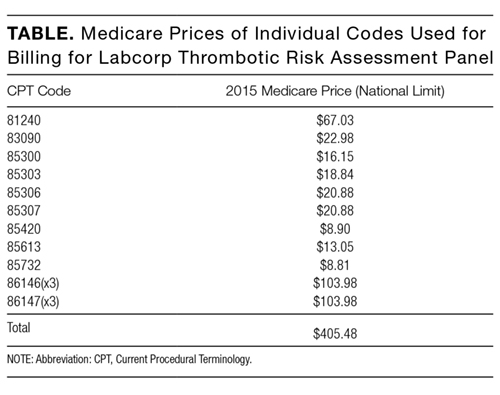
In conclusion, the cost evaluation of thrombophilia screening is more challenging than the calculation by Petrilli et al. suggests.1 Even if Medicare paid as much as $400 per individual tested and assuming up to 200,000 individuals underwent thrombophilia testing per year, the aggregate Medicare expenditure would have been no more than roughly $80 million. Thus, the estimated range in the article appears to have overstated actual Medicare expenditures by an order of magnitude. This does not take away from their overall conclusion that payers are burdened with significant expenditures for laboratory testing that may not present clinical value for many patients.6 We need research into the patterns of utilization as well as improvements in documentation of expenditures associated with these tests.
Disclosure
The findings and conclusions in this report are those of the authors and do not necessarily represent the official position of the Centers for Disease Control and Prevention, the Department of Veterans Affairs, or the United States government. The autho
1. Petrilli CM, Heidemann L, Mack M, Durance P, Chopra V. Inpatient inherited thrombophilia testing. J Hosp Med. 2016;11(11):801-804. PubMed
2. Abramson N, Abramson S. Hypercoagulability: clinical assessment and treatment. South Med J. 2001;94(10):1013-1020. PubMed
3. Somma J, Sussman, II, Rand JH. An evaluation of thrombophilia screening in an urban tertiary care medical center: A “real world” experience. Am J Clin Pathol. 2006;126(1):120-127. PubMed
4. Lynch JA, Berse B, Dotson WD, Khoury MJ, Coomer N, Kautter J. Utilization of genetic tests: Analysis of gene-specific billing in Medicare claims data [Published online ahead of print January 26, 2017]. Genet Med. 2017. doi: 10.1038/gim.2016.209. PubMed
5. Centers for Medicare and Medicaid Services. Clinical Laboratory Fee Schedule 2016. https://www.cms.gov/Medicare/Medicare-fee-for-service-Payment/clinicallabfeesched/index.html. Accessed on December 20, 2016.
6. Stevens SM, Woller SC, Bauer KA, et al. Guidance for the evaluation and treatment of hereditary and acquired thrombophilia. J Thromb Thrombolysis. 2016;41(1):154-164. PubMed
The article by Petrilli et al. points to the important but complicated issue of ordering laboratory testing for thrombophilia despite multiple guidelines that dispute the clinical utility of such testing for many indications.1 We question the basis of these authors’ assertion that Medicare spends $300 to $672 million for thrombophilia testing annually. They arrived at this figure by multiplying the price of a thrombophilia test panel (between $1100 and $2400) by the number of annual Medicare claims for thrombophilia analysis, which they estimated at 280,000. The price of the panel is derived from two papers: (1) a 2001 review2 that lists prices of various thrombophilia-related tests adding up to $1782, and (2) a 2006 evaluation by Somma et al.3 of thrombophilia screening at one hospital in New York in 2005. The latter paper refers to various thrombophilia panels from Quest Diagnostics with list prices ranging from $1311 to $2429. However, the repertoire of available test panels and their prices have changed over the last decade. The cost evaluation of thrombophilia testing should be based on actual current payments for tests, and not on list prices for laboratory offerings from over a decade ago. Several laboratories offer mutational analysis of 3 genes—F5, F2, and MTHFR—as a thrombophilia risk panel. Based on the Current Procedural Terminology (CPT) codes listed by the test suppliers (81240, 81241, and 81291), the average Medicare payment for the combination of these 3 markers in 2013 was $172.4 A broader panel of several biochemical, immunological, and genetic assays had a maximum Medicare payment in 2015 of $405 (Table).5
In conclusion, the cost evaluation of thrombophilia screening is more challenging than the calculation by Petrilli et al. suggests.1 Even if Medicare paid as much as $400 per individual tested and assuming up to 200,000 individuals underwent thrombophilia testing per year, the aggregate Medicare expenditure would have been no more than roughly $80 million. Thus, the estimated range in the article appears to have overstated actual Medicare expenditures by an order of magnitude. This does not take away from their overall conclusion that payers are burdened with significant expenditures for laboratory testing that may not present clinical value for many patients.6 We need research into the patterns of utilization as well as improvements in documentation of expenditures associated with these tests.
Disclosure
The findings and conclusions in this report are those of the authors and do not necessarily represent the official position of the Centers for Disease Control and Prevention, the Department of Veterans Affairs, or the United States government. The autho
1. Petrilli CM, Heidemann L, Mack M, Durance P, Chopra V. Inpatient inherited thrombophilia testing. J Hosp Med. 2016;11(11):801-804. PubMed
2. Abramson N, Abramson S. Hypercoagulability: clinical assessment and treatment. South Med J. 2001;94(10):1013-1020. PubMed
3. Somma J, Sussman, II, Rand JH. An evaluation of thrombophilia screening in an urban tertiary care medical center: A “real world” experience. Am J Clin Pathol. 2006;126(1):120-127. PubMed
4. Lynch JA, Berse B, Dotson WD, Khoury MJ, Coomer N, Kautter J. Utilization of genetic tests: Analysis of gene-specific billing in Medicare claims data [Published online ahead of print January 26, 2017]. Genet Med. 2017. doi: 10.1038/gim.2016.209. PubMed
5. Centers for Medicare and Medicaid Services. Clinical Laboratory Fee Schedule 2016. https://www.cms.gov/Medicare/Medicare-fee-for-service-Payment/clinicallabfeesched/index.html. Accessed on December 20, 2016.
6. Stevens SM, Woller SC, Bauer KA, et al. Guidance for the evaluation and treatment of hereditary and acquired thrombophilia. J Thromb Thrombolysis. 2016;41(1):154-164. PubMed
© 2017 Society of Hospital Medicine
Reducing Routine Labs—Teaching Residents Restraint
Inappropriate resource utilization is a pervasive problem in healthcare, and it has received increasing emphasis over the last few years as financial strain on the healthcare system has grown. This waste has led to new models of care—bundled care payments, accountable care organizations, and merit-based payment systems. Professional organizations have also emphasized the provision of high-value care and avoiding unnecessary diagnostic testing and treatment. In April 2012, the American Board of Internal Medicine (ABIM) launched the Choosing Wisely initiative to assist professional societies in putting forth recommendations on clinical circumstances in which particular tests and procedures should be avoided.
Until recently, teaching cost-effective care was not widely considered an important part of internal medicine residency programs. In a 2010 study surveying residents about resource utilization feedback, only 37% of internal medicine residents reported receiving any feedback on resource utilization and 20% reported receiving regular feedback.1 These findings are especially significant in the broader context of national healthcare spending, as there is evidence that physicians who train in high-spending localities tend to have high-spending patterns later in their careers.2 Another study showed similar findings when looking at region of training relative to success at recognizing high-value care on ABIM test questions.3 The Accreditation Council for Graduate Medical Education has developed the Clinical Learning Environment Review program to help address this need. This program provides feedback to teaching hospitals about their success at teaching residents and fellows to provide high-value medical care.
Given the current zeitgeist of emphasizing cost-effective, high-value care, appropriate utilization of routine labs is one area that stands out as an especially low-hanging fruit. The Society of Hospital Medicine, as part of the Choosing Wisely campaign, recommended minimizing routine lab draws in hospitalized patients with clinical and laboratory stability.4 Certainly, avoiding unnecessary routine lab draws is ideal because it saves patients the pain of superfluous phlebotomy, allows phlebotomy resources to be directed to blood draws with actual clinical utility, and saves money. There is also good evidence that hospital-acquired anemia, an effect of overuse of routine blood draws, has an adverse impact on morbidity and mortality in postmyocardial infarction patients5,6 and more generally in hospitalized patients.7
Several studies have examined lab utilization on teaching services. Not surprisingly, the vast majority of test utilization is attributable to the interns (45%) and residents (26%), rather than attendings.8 Another study showed that internal medicine residents at one center had a much stronger self-reported predilection for ordering daily recurring routine labs rather than one-time labs for the following morning when admitting patients and when picking up patients, as compared with hospitalist attendings.9 This self-reported tendency translated into ordering more complete blood counts and basic chemistry panels per patient per day. A qualitative study looking at why internal medicine and general surgery residents ordered unnecessary labs yielded a number of responses, including ingrained habit, lack of price transparency, clinical uncertainty, belief that the attending expected it, and absence of a culture emphasizing resource utilization.10
In this issue of the Journal of Hospital Medicine, Kurtzman and colleagues report on a mixed-methods study looking at internal medicine resident engagement at their center with an electronic medical record–associated dashboard providing feedback on lab utilization.11 Over a 6-month period, the residents randomized into the dashboard group received weekly e-mails while on service with a brief synopsis of their lab utilization relative to their peers and also a link to a dashboard with a time-series display of their relative lab ordering. While the majority of residents (74%) opened the e-mail, only a minority (21%) actually accessed the dashboard. Also, there was not a statistically significant relationship between dashboard use and lab ordering, though there was a trend to decreased lab ordering associated with opening the dashboard. The residents who participated in a focus group expressed both positive and negative opinions on the dashboard.
This is one example of social comparison feedback, which aims to improve performance by providing information to physicians on their performance relative to their peers. It has been shown to be effective in other areas of clinical medicine like limiting antibiotic overutilization in patients with upper respiratory infections.12 One study examining social comparison feedback and objective feedback found that social comparison feedback improved performance for a simulated work task more for high performers but less for low performers than standard objective feedback.13 The utility of this type of feedback has not been extensively studied in healthcare.
However, the audit and feedback strategy, of which social comparison feedback is a subtype, has been extensively studied in healthcare. A 2012 Cochrane Review found that audit and feedback leads to “small but potentially important improvements in professional practice.”14 They found a wide variation in the effect of feedback among the 140 studies they analyzed. The factors strongly associated with a significant improvement after feedback were as follows: poor performance at baseline, a colleague or supervisor as the one providing the audit and feedback, repetitive feedback, feedback given both verbally and in writing, and clear advice or guidance on how to improve. Many of these components were missing from this study—that may be one reason the authors did not find a significant relationship between dashboard use and lab ordering.
A number of interventions, however, have been shown to decrease lab utilization, including unbundling of the components of the metabolic panel and disallowing daily recurring lab orders,15 fee displays,16 cost reminders,17 didactics and data feedback,18 and a multifaceted approach (didactics, monthly feedback, checklist, and financial incentives).19 A multipronged strategy, including an element of education, audit and feedback, hard-stop limits on redundant lab ordering, and fee information is likely to be the most successful strategy to reducing lab overutilization for both residents and attending physicians. Resource overutilization is a multifactorial problem, and multifactorial problems call for multifaceted solutions. Moreover, it may be necessary to employ both “carrot” and “stick” elements to such an approach, rewarding physicians who practice appropriate stewardship, but also penalizing practitioners who do not appropriately adjust their lab ordering tendencies after receiving feedback showing overuse.
Physician behavior is difficult to change, and there are many reasons why physicians order inappropriate tests and studies, including provider uncertainty, fear of malpractice litigation, and inadequate time to consider the utility of a test. Audit and feedback should be integrated into residency curriculums focusing on high-value care, in which hospitalists should play a central role. If supervising attendings are not integrated into such curriculums and continue to both overorder tests themselves and allow residents to do so, then the informal curriculum will trump the formal one.
Physicians respond to incentives, and appropriately designed incentives should be developed to help steer them to order only those tests and studies that are medically indicated. Such incentives must be provided alongside audit and feedback with appropriate goals that account for patient complexity. Ultimately, routine lab ordering is just one area of overutilization in hospital medicine, and the techniques that are successful at reducing overuse in this arena will need to be applied to other aspects of medicine like imaging and medication prescribing.
Disclosure
The authors declare no conflicts of interest.
1. Dine CJ, Miller J, Fuld A, Bellini LM, Iwashyna TJ. Educating Physicians-in-Training About Resource Utilization and Their Own Outcomes of Care in the Inpatient Setting. J Grad Med Educ. 2010;2(2):175-180. PubMed
2. Chen C, Petterson S, Phillips R, Bazemore A, Mullan F. Spending patterns in region of residency training and subsequent expenditures for care provided by practicing physicians for Medicare beneficiaries. JAMA. 2014;312(22):2385-2393. PubMed
3. Sirovich BE, Lipner RS, Johnston M, Holmboe ES. The association between residency training and internists’ ability to practice conservatively. JAMA Intern Med. 2014;174(10):1640-1648. PubMed
4. Bulger J, Nickel W, Messler J, et al. Choosing wisely in adult hospital medicine: Five opportunities for improved healthcare value. J Hosp Med. 2013;8(9):486-492. PubMed
5. Salisbury AC, Amin AP, Reid KJ, et al. Hospital-acquired anemia and in-hospital mortality in patients with acute myocardial infarction. Am Heart J. 2011;162(2):300-309.e3. PubMed
6. Meroño O, Cladellas M, Recasens L, et al. In-hospital acquired anemia in acute coronary syndrome. Predictors, in-hospital prognosis and one-year mortality. Rev Esp Cardiol (Engl Ed). 2012;65(8):742-748. PubMed
7. Koch CG, Li L, Sun Z, et al. Hospital-acquired anemia: Prevalence, outcomes, and healthcare implications. J Hosp Med. 2013;8(9):506-512. PubMed
8. Iwashyna TJ, Fuld A, Asch DA, Bellini LM. The impact of residents, interns, and attendings on inpatient laboratory ordering patterns: a report from one university’s hospitalist service. Acad Med. 2011;86(1):139-145. PubMed
9. Ellenbogen MI, Ma M, Christensen NP, Lee J, O’Leary KJ. Differences in Routine Laboratory Ordering Between a Teaching Service and a Hospitalist Service at a Single Academic Medical Center. South Med J. 2017;110(1):25-30. PubMed
10. Sedrak MS, Patel MS, Ziemba JB, et al. Residents’ self-report on why they order perceived unnecessary inpatient laboratory tests. J Hosp Med. 2016;11(12):869-872. PubMed
11. Kurtzman G, Dine J, Epstein A, et al. Internal Medicine Resident Engagement with a Laboratory Utilization Dashboard: Mixed Methods Study. J Hosp Med. 2017;12(9):743-746. PubMed
12. Meeker D, Linder JA, Fox CR, et al. Effect of Behavioral Interventions on Inappropriate Antibiotic Prescribing Among Primary Care Practices: A Randomized Clinical Trial. JAMA. 2016;315(6):562-570. PubMed
13. Moon K, Lee K, Lee K, Oah S. The Effects of Social Comparison and Objective Feedback on Work Performance Across Different Performance Levels. J Organ Behav Manage. 2017;37(1):63-74.
14. Ivers N, Jamtvedt G, Flottorp S, et al. Audit and feedback : effects on professional practice and healthcare outcomes ( Review ). Cochrane Database Syst Rev. 2012;(6):CD000259. PubMed
15. Neilson EG, Johnson KB, Rosenbloom ST, Dupont WD, Talbert D, Giuse DA. The Impact of Peer Management on Test-Ordering Behavior. Ann Intern Med. 2004;141:196-204. PubMed
16. Feldman LS, Shihab HM, Thiemann D, et al. Impact of providing fee data on laboratory test ordering: a controlled clinical trial. JAMA Intern Med. 2013;173(10):903-908. PubMed
17. Stuebing EA, Miner TJ. Surgical vampires and rising health care expenditure: reducing the cost of daily phlebotomy. Arch Surg. 2011;146:524-527. PubMed
18. Iams W, Heck J, Kapp M, et al. A Multidisciplinary Housestaff-Led Initiative to Safely Reduce Daily Laboratory Testing. Acad Med. 2016;91(6):813-820. PubMed
19. Yarbrough PM, Kukhareva P V., Horton D, Edholm K, Kawamoto K. Multifaceted intervention including education, rounding checklist implementation, cost feedback, and financial incentives reduces inpatient laboratory costs. J Hosp Med. 2016;11(5):348-354. PubMed
Inappropriate resource utilization is a pervasive problem in healthcare, and it has received increasing emphasis over the last few years as financial strain on the healthcare system has grown. This waste has led to new models of care—bundled care payments, accountable care organizations, and merit-based payment systems. Professional organizations have also emphasized the provision of high-value care and avoiding unnecessary diagnostic testing and treatment. In April 2012, the American Board of Internal Medicine (ABIM) launched the Choosing Wisely initiative to assist professional societies in putting forth recommendations on clinical circumstances in which particular tests and procedures should be avoided.
Until recently, teaching cost-effective care was not widely considered an important part of internal medicine residency programs. In a 2010 study surveying residents about resource utilization feedback, only 37% of internal medicine residents reported receiving any feedback on resource utilization and 20% reported receiving regular feedback.1 These findings are especially significant in the broader context of national healthcare spending, as there is evidence that physicians who train in high-spending localities tend to have high-spending patterns later in their careers.2 Another study showed similar findings when looking at region of training relative to success at recognizing high-value care on ABIM test questions.3 The Accreditation Council for Graduate Medical Education has developed the Clinical Learning Environment Review program to help address this need. This program provides feedback to teaching hospitals about their success at teaching residents and fellows to provide high-value medical care.
Given the current zeitgeist of emphasizing cost-effective, high-value care, appropriate utilization of routine labs is one area that stands out as an especially low-hanging fruit. The Society of Hospital Medicine, as part of the Choosing Wisely campaign, recommended minimizing routine lab draws in hospitalized patients with clinical and laboratory stability.4 Certainly, avoiding unnecessary routine lab draws is ideal because it saves patients the pain of superfluous phlebotomy, allows phlebotomy resources to be directed to blood draws with actual clinical utility, and saves money. There is also good evidence that hospital-acquired anemia, an effect of overuse of routine blood draws, has an adverse impact on morbidity and mortality in postmyocardial infarction patients5,6 and more generally in hospitalized patients.7
Several studies have examined lab utilization on teaching services. Not surprisingly, the vast majority of test utilization is attributable to the interns (45%) and residents (26%), rather than attendings.8 Another study showed that internal medicine residents at one center had a much stronger self-reported predilection for ordering daily recurring routine labs rather than one-time labs for the following morning when admitting patients and when picking up patients, as compared with hospitalist attendings.9 This self-reported tendency translated into ordering more complete blood counts and basic chemistry panels per patient per day. A qualitative study looking at why internal medicine and general surgery residents ordered unnecessary labs yielded a number of responses, including ingrained habit, lack of price transparency, clinical uncertainty, belief that the attending expected it, and absence of a culture emphasizing resource utilization.10
In this issue of the Journal of Hospital Medicine, Kurtzman and colleagues report on a mixed-methods study looking at internal medicine resident engagement at their center with an electronic medical record–associated dashboard providing feedback on lab utilization.11 Over a 6-month period, the residents randomized into the dashboard group received weekly e-mails while on service with a brief synopsis of their lab utilization relative to their peers and also a link to a dashboard with a time-series display of their relative lab ordering. While the majority of residents (74%) opened the e-mail, only a minority (21%) actually accessed the dashboard. Also, there was not a statistically significant relationship between dashboard use and lab ordering, though there was a trend to decreased lab ordering associated with opening the dashboard. The residents who participated in a focus group expressed both positive and negative opinions on the dashboard.
This is one example of social comparison feedback, which aims to improve performance by providing information to physicians on their performance relative to their peers. It has been shown to be effective in other areas of clinical medicine like limiting antibiotic overutilization in patients with upper respiratory infections.12 One study examining social comparison feedback and objective feedback found that social comparison feedback improved performance for a simulated work task more for high performers but less for low performers than standard objective feedback.13 The utility of this type of feedback has not been extensively studied in healthcare.
However, the audit and feedback strategy, of which social comparison feedback is a subtype, has been extensively studied in healthcare. A 2012 Cochrane Review found that audit and feedback leads to “small but potentially important improvements in professional practice.”14 They found a wide variation in the effect of feedback among the 140 studies they analyzed. The factors strongly associated with a significant improvement after feedback were as follows: poor performance at baseline, a colleague or supervisor as the one providing the audit and feedback, repetitive feedback, feedback given both verbally and in writing, and clear advice or guidance on how to improve. Many of these components were missing from this study—that may be one reason the authors did not find a significant relationship between dashboard use and lab ordering.
A number of interventions, however, have been shown to decrease lab utilization, including unbundling of the components of the metabolic panel and disallowing daily recurring lab orders,15 fee displays,16 cost reminders,17 didactics and data feedback,18 and a multifaceted approach (didactics, monthly feedback, checklist, and financial incentives).19 A multipronged strategy, including an element of education, audit and feedback, hard-stop limits on redundant lab ordering, and fee information is likely to be the most successful strategy to reducing lab overutilization for both residents and attending physicians. Resource overutilization is a multifactorial problem, and multifactorial problems call for multifaceted solutions. Moreover, it may be necessary to employ both “carrot” and “stick” elements to such an approach, rewarding physicians who practice appropriate stewardship, but also penalizing practitioners who do not appropriately adjust their lab ordering tendencies after receiving feedback showing overuse.
Physician behavior is difficult to change, and there are many reasons why physicians order inappropriate tests and studies, including provider uncertainty, fear of malpractice litigation, and inadequate time to consider the utility of a test. Audit and feedback should be integrated into residency curriculums focusing on high-value care, in which hospitalists should play a central role. If supervising attendings are not integrated into such curriculums and continue to both overorder tests themselves and allow residents to do so, then the informal curriculum will trump the formal one.
Physicians respond to incentives, and appropriately designed incentives should be developed to help steer them to order only those tests and studies that are medically indicated. Such incentives must be provided alongside audit and feedback with appropriate goals that account for patient complexity. Ultimately, routine lab ordering is just one area of overutilization in hospital medicine, and the techniques that are successful at reducing overuse in this arena will need to be applied to other aspects of medicine like imaging and medication prescribing.
Disclosure
The authors declare no conflicts of interest.
1. Dine CJ, Miller J, Fuld A, Bellini LM, Iwashyna TJ. Educating Physicians-in-Training About Resource Utilization and Their Own Outcomes of Care in the Inpatient Setting. J Grad Med Educ. 2010;2(2):175-180. PubMed
2. Chen C, Petterson S, Phillips R, Bazemore A, Mullan F. Spending patterns in region of residency training and subsequent expenditures for care provided by practicing physicians for Medicare beneficiaries. JAMA. 2014;312(22):2385-2393. PubMed
3. Sirovich BE, Lipner RS, Johnston M, Holmboe ES. The association between residency training and internists’ ability to practice conservatively. JAMA Intern Med. 2014;174(10):1640-1648. PubMed
4. Bulger J, Nickel W, Messler J, et al. Choosing wisely in adult hospital medicine: Five opportunities for improved healthcare value. J Hosp Med. 2013;8(9):486-492. PubMed
5. Salisbury AC, Amin AP, Reid KJ, et al. Hospital-acquired anemia and in-hospital mortality in patients with acute myocardial infarction. Am Heart J. 2011;162(2):300-309.e3. PubMed
6. Meroño O, Cladellas M, Recasens L, et al. In-hospital acquired anemia in acute coronary syndrome. Predictors, in-hospital prognosis and one-year mortality. Rev Esp Cardiol (Engl Ed). 2012;65(8):742-748. PubMed
7. Koch CG, Li L, Sun Z, et al. Hospital-acquired anemia: Prevalence, outcomes, and healthcare implications. J Hosp Med. 2013;8(9):506-512. PubMed
8. Iwashyna TJ, Fuld A, Asch DA, Bellini LM. The impact of residents, interns, and attendings on inpatient laboratory ordering patterns: a report from one university’s hospitalist service. Acad Med. 2011;86(1):139-145. PubMed
9. Ellenbogen MI, Ma M, Christensen NP, Lee J, O’Leary KJ. Differences in Routine Laboratory Ordering Between a Teaching Service and a Hospitalist Service at a Single Academic Medical Center. South Med J. 2017;110(1):25-30. PubMed
10. Sedrak MS, Patel MS, Ziemba JB, et al. Residents’ self-report on why they order perceived unnecessary inpatient laboratory tests. J Hosp Med. 2016;11(12):869-872. PubMed
11. Kurtzman G, Dine J, Epstein A, et al. Internal Medicine Resident Engagement with a Laboratory Utilization Dashboard: Mixed Methods Study. J Hosp Med. 2017;12(9):743-746. PubMed
12. Meeker D, Linder JA, Fox CR, et al. Effect of Behavioral Interventions on Inappropriate Antibiotic Prescribing Among Primary Care Practices: A Randomized Clinical Trial. JAMA. 2016;315(6):562-570. PubMed
13. Moon K, Lee K, Lee K, Oah S. The Effects of Social Comparison and Objective Feedback on Work Performance Across Different Performance Levels. J Organ Behav Manage. 2017;37(1):63-74.
14. Ivers N, Jamtvedt G, Flottorp S, et al. Audit and feedback : effects on professional practice and healthcare outcomes ( Review ). Cochrane Database Syst Rev. 2012;(6):CD000259. PubMed
15. Neilson EG, Johnson KB, Rosenbloom ST, Dupont WD, Talbert D, Giuse DA. The Impact of Peer Management on Test-Ordering Behavior. Ann Intern Med. 2004;141:196-204. PubMed
16. Feldman LS, Shihab HM, Thiemann D, et al. Impact of providing fee data on laboratory test ordering: a controlled clinical trial. JAMA Intern Med. 2013;173(10):903-908. PubMed
17. Stuebing EA, Miner TJ. Surgical vampires and rising health care expenditure: reducing the cost of daily phlebotomy. Arch Surg. 2011;146:524-527. PubMed
18. Iams W, Heck J, Kapp M, et al. A Multidisciplinary Housestaff-Led Initiative to Safely Reduce Daily Laboratory Testing. Acad Med. 2016;91(6):813-820. PubMed
19. Yarbrough PM, Kukhareva P V., Horton D, Edholm K, Kawamoto K. Multifaceted intervention including education, rounding checklist implementation, cost feedback, and financial incentives reduces inpatient laboratory costs. J Hosp Med. 2016;11(5):348-354. PubMed
© 2017 Society of Hospital Medicine
Does the Week-End Justify the Means?
Let’s face it—rates of hospital admission are on the rise, but there are still just 7 days in a week. That means that patients are increasingly admitted on weekdays and on the weekend, requiring more nurses and doctors to look after them. Why then are there no lines for coffee on a Saturday? Does this reduced intensity of staffing translate into worse care for our patients?
Since one of its earliest descriptions in hospitalized patients, the “weekend effect” has been extensively studied in various patient populations and hospital settings.1-5 The results have been varied, depending on the place of care,6 reason for care, type of admission,5,7 or admitting diagnosis.1,8,9 Many researchers have posited the drivers behind the weekend effect, including understaffed wards, intensity of specialist care, delays in procedural treatments, or severity of illness, but the truth is that we still don’t know.
Pauls et al. performed a robust systematic review and meta-analysis examining the rates of in-hospital mortality in patients admitted on the weekend compared with those admitted on weekdays.10 They analyzed predetermined subgroups to identify system- and patient-level factors associated with a difference in weekend mortality.
A total of 97 studies—comprising an astounding 51 million patients—was included in the study. They found that individuals admitted on the weekend carried an almost 20% increase in the risk of death compared with those who landed in hospital on a weekday. The effect was present for both in-hospital deaths and when looking specifically at 30-day mortality. Translating these findings into practice, an additional 14 deaths per 1000 admissions occur when patients are admitted on the weekend. Brain surgery can be less risky.11
Despite this concerning finding, no individual factor was identified that could account for the effect. There was a 16% and 11% increase in mortality in weekend patients associated with decreased hospital staffing and delays to procedural therapies, respectively. No differences were found when examining reduced rates of procedures or illness severity on weekends compared with weekdays. But one must always interpret subgroup analyses, even prespecified ones, with caution because they often lack the statistical power to make concrete conclusions.
To this end, an important finding of the study by Pauls et al. highlights the variation in mortality risk as it relates to the weekend effect.10 Even for individuals with cancer, a disease with a relatively predictable rate of decline, there are weekend differences in mortality risk that depend upon the type of cancer.8,12 This heterogeneity persists when examining for the possible factors that contribute to the effect, introducing a significant amount of noise into the analysis, and may explain why research to date has been unable to find the proverbial black cat in the coal cellar.
One thing Pauls et al. makes clear is that the weekend effect appears to be a real phenomenon, despite significant heterogeneity in the literature.10 Only a high-quality, systematic review has the capability to draw such conclusions. Prior work demonstrates that this effect is substantial in some individuals,and this study confirms that it perseveres beyond an immediate time period following admission.1,9 The elements contributing to the weekend effect remain undefined and are likely as complex as our healthcare system itself.
Society and policy makers should resist the tantalizing urge to invoke interventions aimed at fixing this issue before fully understanding the drivers of a system problem. The government of the United Kingdom has decreed a manifesto to create a “7-day National Health Service,” in which weekend services and physician staffing will match that of the weekdays. Considering recent labor tensions between junior doctors in the United Kingdom over pay and working hours, the stakes are at an all-time high.
But such drastic measures violate a primary directive of quality improvement science to study and understand the problem before reflexively jumping to solutions. This will require new research endeavors aimed at determining the underlying factor(s) responsible for the weekend effect. Once we are confident in its cause, only then can careful evaluation of targeted interventions aimed at the highest-risk admissions be instituted. As global hospital and healthcare budgets bend under increasing strain, a critical component of any proposed intervention must be to examine the cost-effectiveness in doing so. Because the weekend effect is one of increased mortality, it will be hard to justify an acceptable price for an individual’s life. And it is not as straightforward as a randomized trial examining the efficacy of parachutes. Any formal evaluation must account for the unintended consequences and opportunity costs of implementing a potential fix aimed at minimizing the weekend effect.
The weekend effect has now been studied for over 15 years. Pauls et al. add to our knowledge of this phenomenon, confirming that the overall risk of mortality for patients admitted on the weekend is real, variable, and substantial.10 As more individuals are admitted to hospitals, resulting in increasing numbers of admissions on the weekend, a desperate search for the underlying cause must be carried out before we can fix it. Whatever the means to the end, our elation will continue to be tempered by a feeling of uneasiness every time our coworkers joyously exclaim, “TGIF!”
Disclosure
The authors have nothing to disclose.
1. Bell CM, Redelmeier DA. Mortality among patients admitted to hospitals on weekends as compared with weekdays. N Engl J Med. 2001;345(9):663-668. doi:10.1056/NEJMsa003376. PubMed
2. Bell CM, Redelmeier DA. Waiting for urgent procedures on the weekend among emergently hospitalized patients. AJM. 2004;117(3):175-181. doi:10.1016/j.amjmed.2004.02.047. PubMed
3. Kalaitzakis E, Helgeson J, Strömdahl M, Tóth E. Weekend admission in upper GI bleeding: does it have an impact on outcome? Gastrointest Endosc. 2015;81(5):1295-1296. doi:10.1016/j.gie.2014.12.003. PubMed
4. Nanchal R, Kumar G, Taneja A, et al. Pulmonary embolism: the weekend effect. Chest. 2012;142(3):690-696. doi:10.1378/chest.11-2663. PubMed
5. Ricciardi R, Roberts PL, Read TE, Baxter NN, Marcello PW, Schoetz DJ. Mortality rate after nonelective hospital admission. Arch Surg. 2011;146(5):545-551. PubMed
6. Wunsch H, Mapstone J, Brady T, Hanks R, Rowan K. Hospital mortality associated with day and time of admission to intensive care units. Intensive Care Med. 2004;30(5):895-901. doi:10.1007/s00134-004-2170-3. PubMed
7. Freemantle N, Richardson M, Wood J, et al. Weekend hospitalization and additional risk of death: an analysis of inpatient data. J R Soc Med. 2012;105(2):74-84. doi:10.1258/jrsm.2012.120009. PubMed
8. Lapointe-Shaw L, Bell CM. It’s not you, it’s me: time to narrow the gap in weekend care. BMJ Qual Saf. 2014;23(3):180-182. doi:10.1136/bmjqs-2013-002674. PubMed
9. Concha OP, Gallego B, Hillman K, Delaney GP, Coiera E. Do variations in hospital mortality patterns after weekend admission reflect reduced quality of care or different patient cohorts? A population-based study. BMJ Qual Saf. 2014;23(3):215-222. doi:10.1136/bmjqs-2013-002218. PubMed
10. Pauls LA, Johnson-Paben R, McGready J, Murphy JD, Pronovost PJ, Wu CL. The Weekend Effect in Hospitalized Patients: A Meta-analysis. J Hosp Med. 2017;12(9):760-766. PubMed
11. American College of Surgeons. NSQIP Risk Calculator. http://riskcalculator.facs.org/RiskCalculator/. Accessed on July 5, 2017.
12. Lapointe-Shaw L, Abushomar H, Chen XK, et al. Care and outcomes of patients with cancer admitted to the hospital on weekends and holidays: a retrospective cohort study. J Natl Compr Canc Netw. 2016;14(7):867-874. PubMed
Let’s face it—rates of hospital admission are on the rise, but there are still just 7 days in a week. That means that patients are increasingly admitted on weekdays and on the weekend, requiring more nurses and doctors to look after them. Why then are there no lines for coffee on a Saturday? Does this reduced intensity of staffing translate into worse care for our patients?
Since one of its earliest descriptions in hospitalized patients, the “weekend effect” has been extensively studied in various patient populations and hospital settings.1-5 The results have been varied, depending on the place of care,6 reason for care, type of admission,5,7 or admitting diagnosis.1,8,9 Many researchers have posited the drivers behind the weekend effect, including understaffed wards, intensity of specialist care, delays in procedural treatments, or severity of illness, but the truth is that we still don’t know.
Pauls et al. performed a robust systematic review and meta-analysis examining the rates of in-hospital mortality in patients admitted on the weekend compared with those admitted on weekdays.10 They analyzed predetermined subgroups to identify system- and patient-level factors associated with a difference in weekend mortality.
A total of 97 studies—comprising an astounding 51 million patients—was included in the study. They found that individuals admitted on the weekend carried an almost 20% increase in the risk of death compared with those who landed in hospital on a weekday. The effect was present for both in-hospital deaths and when looking specifically at 30-day mortality. Translating these findings into practice, an additional 14 deaths per 1000 admissions occur when patients are admitted on the weekend. Brain surgery can be less risky.11
Despite this concerning finding, no individual factor was identified that could account for the effect. There was a 16% and 11% increase in mortality in weekend patients associated with decreased hospital staffing and delays to procedural therapies, respectively. No differences were found when examining reduced rates of procedures or illness severity on weekends compared with weekdays. But one must always interpret subgroup analyses, even prespecified ones, with caution because they often lack the statistical power to make concrete conclusions.
To this end, an important finding of the study by Pauls et al. highlights the variation in mortality risk as it relates to the weekend effect.10 Even for individuals with cancer, a disease with a relatively predictable rate of decline, there are weekend differences in mortality risk that depend upon the type of cancer.8,12 This heterogeneity persists when examining for the possible factors that contribute to the effect, introducing a significant amount of noise into the analysis, and may explain why research to date has been unable to find the proverbial black cat in the coal cellar.
One thing Pauls et al. makes clear is that the weekend effect appears to be a real phenomenon, despite significant heterogeneity in the literature.10 Only a high-quality, systematic review has the capability to draw such conclusions. Prior work demonstrates that this effect is substantial in some individuals,and this study confirms that it perseveres beyond an immediate time period following admission.1,9 The elements contributing to the weekend effect remain undefined and are likely as complex as our healthcare system itself.
Society and policy makers should resist the tantalizing urge to invoke interventions aimed at fixing this issue before fully understanding the drivers of a system problem. The government of the United Kingdom has decreed a manifesto to create a “7-day National Health Service,” in which weekend services and physician staffing will match that of the weekdays. Considering recent labor tensions between junior doctors in the United Kingdom over pay and working hours, the stakes are at an all-time high.
But such drastic measures violate a primary directive of quality improvement science to study and understand the problem before reflexively jumping to solutions. This will require new research endeavors aimed at determining the underlying factor(s) responsible for the weekend effect. Once we are confident in its cause, only then can careful evaluation of targeted interventions aimed at the highest-risk admissions be instituted. As global hospital and healthcare budgets bend under increasing strain, a critical component of any proposed intervention must be to examine the cost-effectiveness in doing so. Because the weekend effect is one of increased mortality, it will be hard to justify an acceptable price for an individual’s life. And it is not as straightforward as a randomized trial examining the efficacy of parachutes. Any formal evaluation must account for the unintended consequences and opportunity costs of implementing a potential fix aimed at minimizing the weekend effect.
The weekend effect has now been studied for over 15 years. Pauls et al. add to our knowledge of this phenomenon, confirming that the overall risk of mortality for patients admitted on the weekend is real, variable, and substantial.10 As more individuals are admitted to hospitals, resulting in increasing numbers of admissions on the weekend, a desperate search for the underlying cause must be carried out before we can fix it. Whatever the means to the end, our elation will continue to be tempered by a feeling of uneasiness every time our coworkers joyously exclaim, “TGIF!”
Disclosure
The authors have nothing to disclose.
1. Bell CM, Redelmeier DA. Mortality among patients admitted to hospitals on weekends as compared with weekdays. N Engl J Med. 2001;345(9):663-668. doi:10.1056/NEJMsa003376. PubMed
2. Bell CM, Redelmeier DA. Waiting for urgent procedures on the weekend among emergently hospitalized patients. AJM. 2004;117(3):175-181. doi:10.1016/j.amjmed.2004.02.047. PubMed
3. Kalaitzakis E, Helgeson J, Strömdahl M, Tóth E. Weekend admission in upper GI bleeding: does it have an impact on outcome? Gastrointest Endosc. 2015;81(5):1295-1296. doi:10.1016/j.gie.2014.12.003. PubMed
4. Nanchal R, Kumar G, Taneja A, et al. Pulmonary embolism: the weekend effect. Chest. 2012;142(3):690-696. doi:10.1378/chest.11-2663. PubMed
5. Ricciardi R, Roberts PL, Read TE, Baxter NN, Marcello PW, Schoetz DJ. Mortality rate after nonelective hospital admission. Arch Surg. 2011;146(5):545-551. PubMed
6. Wunsch H, Mapstone J, Brady T, Hanks R, Rowan K. Hospital mortality associated with day and time of admission to intensive care units. Intensive Care Med. 2004;30(5):895-901. doi:10.1007/s00134-004-2170-3. PubMed
7. Freemantle N, Richardson M, Wood J, et al. Weekend hospitalization and additional risk of death: an analysis of inpatient data. J R Soc Med. 2012;105(2):74-84. doi:10.1258/jrsm.2012.120009. PubMed
8. Lapointe-Shaw L, Bell CM. It’s not you, it’s me: time to narrow the gap in weekend care. BMJ Qual Saf. 2014;23(3):180-182. doi:10.1136/bmjqs-2013-002674. PubMed
9. Concha OP, Gallego B, Hillman K, Delaney GP, Coiera E. Do variations in hospital mortality patterns after weekend admission reflect reduced quality of care or different patient cohorts? A population-based study. BMJ Qual Saf. 2014;23(3):215-222. doi:10.1136/bmjqs-2013-002218. PubMed
10. Pauls LA, Johnson-Paben R, McGready J, Murphy JD, Pronovost PJ, Wu CL. The Weekend Effect in Hospitalized Patients: A Meta-analysis. J Hosp Med. 2017;12(9):760-766. PubMed
11. American College of Surgeons. NSQIP Risk Calculator. http://riskcalculator.facs.org/RiskCalculator/. Accessed on July 5, 2017.
12. Lapointe-Shaw L, Abushomar H, Chen XK, et al. Care and outcomes of patients with cancer admitted to the hospital on weekends and holidays: a retrospective cohort study. J Natl Compr Canc Netw. 2016;14(7):867-874. PubMed
© 2017 Society of Hospital Medicine