User login
The Authors Reply: “Cost and Utility of Thrombophilia Testing”
We thank Dr. Berse and colleagues for their correspondence about our paper.1,2 We are pleased they agreed with our conclusion: Thrombophilia testing has limited clinical utility in most inpatient settings.
Berse and colleagues critiqued details of our methodology in calculating payer cost, including how we estimated the number of Medicare claims for thrombophilia testing. We estimated that there were at least 280,000 Medicare claims in 2014 using CodeMap® (Wheaton Partners, LLC, Schaumburg, IL), a dataset of utilization data from the Physician Supplier Procedure Summary Master File from all Medicare Part B carriers.3 This estimate was similar to that reported in a previous publication.4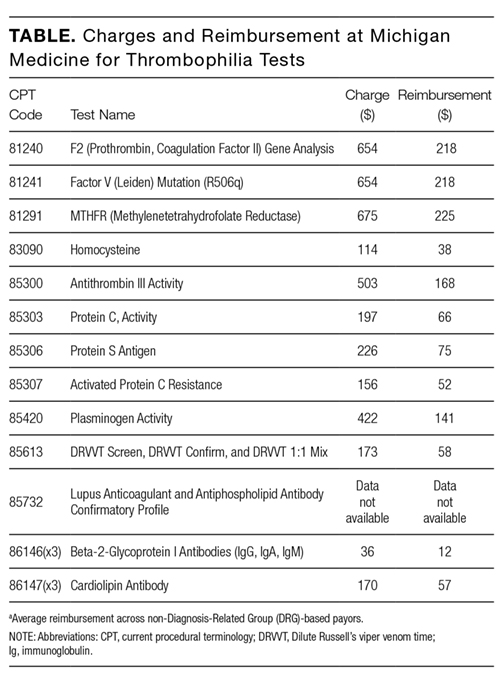
Thus, regardless of the precise estimates, even a conservative estimate of 33 to 80 million dollars of unnecessary spending is far too much. Rather, it is a perfect example of “Things We Do for No Reason.”
Disclosure
Nothing to report.
1. Petrilli CM, Mack M, Petrilli JJ, Hickner A, Saint S, Chopra V. Understanding the role of physician attire on patient perceptions: a systematic review of the literature--targeting attire to improve likelihood of rapport (TAILOR) investigators. BMJ Open. 2015;5(1):e006578. DOI:10.1136/bmjopen-2014-006578. PubMed
2. Berse B, Lynch JA, Bowen S, Grosse SD. In Reference to: “Cost and Utility of Thrombophilia Testing.” J Hosp Med. 2017;12(9):783.
3. CodeMap® https://www.codemap.com/. Accessed March 2, 2017.
4. Somma J, Sussman, II, Rand JH. An evaluation of thrombophilia screening in an urban tertiary care medical center: A “real world” experience. Am J Clin Pathol. 2006;126(1):120-7. DOI:10.1309/KV06-32LJ-8EDM-EWQT. PubMed
We thank Dr. Berse and colleagues for their correspondence about our paper.1,2 We are pleased they agreed with our conclusion: Thrombophilia testing has limited clinical utility in most inpatient settings.
Berse and colleagues critiqued details of our methodology in calculating payer cost, including how we estimated the number of Medicare claims for thrombophilia testing. We estimated that there were at least 280,000 Medicare claims in 2014 using CodeMap® (Wheaton Partners, LLC, Schaumburg, IL), a dataset of utilization data from the Physician Supplier Procedure Summary Master File from all Medicare Part B carriers.3 This estimate was similar to that reported in a previous publication.4
Thus, regardless of the precise estimates, even a conservative estimate of 33 to 80 million dollars of unnecessary spending is far too much. Rather, it is a perfect example of “Things We Do for No Reason.”
Disclosure
Nothing to report.
1. Petrilli CM, Mack M, Petrilli JJ, Hickner A, Saint S, Chopra V. Understanding the role of physician attire on patient perceptions: a systematic review of the literature--targeting attire to improve likelihood of rapport (TAILOR) investigators. BMJ Open. 2015;5(1):e006578. DOI:10.1136/bmjopen-2014-006578. PubMed
2. Berse B, Lynch JA, Bowen S, Grosse SD. In Reference to: “Cost and Utility of Thrombophilia Testing.” J Hosp Med. 2017;12(9):783.
3. CodeMap® https://www.codemap.com/. Accessed March 2, 2017.
4. Somma J, Sussman, II, Rand JH. An evaluation of thrombophilia screening in an urban tertiary care medical center: A “real world” experience. Am J Clin Pathol. 2006;126(1):120-7. DOI:10.1309/KV06-32LJ-8EDM-EWQT. PubMed
© 2017 Society of Hospital Medicine
In Reference to: “Cost and Utility of Thrombophilia Testing”
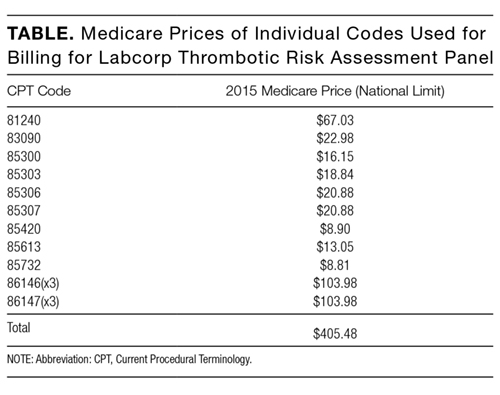
The article by Petrilli et al. points to the important but complicated issue of ordering laboratory testing for thrombophilia despite multiple guidelines that dispute the clinical utility of such testing for many indications.1 We question the basis of these authors’ assertion that Medicare spends $300 to $672 million for thrombophilia testing annually. They arrived at this figure by multiplying the price of a thrombophilia test panel (between $1100 and $2400) by the number of annual Medicare claims for thrombophilia analysis, which they estimated at 280,000. The price of the panel is derived from two papers: (1) a 2001 review2 that lists prices of various thrombophilia-related tests adding up to $1782, and (2) a 2006 evaluation by Somma et al.3 of thrombophilia screening at one hospital in New York in 2005. The latter paper refers to various thrombophilia panels from Quest Diagnostics with list prices ranging from $1311 to $2429. However, the repertoire of available test panels and their prices have changed over the last decade. The cost evaluation of thrombophilia testing should be based on actual current payments for tests, and not on list prices for laboratory offerings from over a decade ago. Several laboratories offer mutational analysis of 3 genes—F5, F2, and MTHFR—as a thrombophilia risk panel. Based on the Current Procedural Terminology (CPT) codes listed by the test suppliers (81240, 81241, and 81291), the average Medicare payment for the combination of these 3 markers in 2013 was $172.4 A broader panel of several biochemical, immunological, and genetic assays had a maximum Medicare payment in 2015 of $405 (Table).5
In conclusion, the cost evaluation of thrombophilia screening is more challenging than the calculation by Petrilli et al. suggests.1 Even if Medicare paid as much as $400 per individual tested and assuming up to 200,000 individuals underwent thrombophilia testing per year, the aggregate Medicare expenditure would have been no more than roughly $80 million. Thus, the estimated range in the article appears to have overstated actual Medicare expenditures by an order of magnitude. This does not take away from their overall conclusion that payers are burdened with significant expenditures for laboratory testing that may not present clinical value for many patients.6 We need research into the patterns of utilization as well as improvements in documentation of expenditures associated with these tests.
Disclosure
The findings and conclusions in this report are those of the authors and do not necessarily represent the official position of the Centers for Disease Control and Prevention, the Department of Veterans Affairs, or the United States government. The autho
1. Petrilli CM, Heidemann L, Mack M, Durance P, Chopra V. Inpatient inherited thrombophilia testing. J Hosp Med. 2016;11(11):801-804. PubMed
2. Abramson N, Abramson S. Hypercoagulability: clinical assessment and treatment. South Med J. 2001;94(10):1013-1020. PubMed
3. Somma J, Sussman, II, Rand JH. An evaluation of thrombophilia screening in an urban tertiary care medical center: A “real world” experience. Am J Clin Pathol. 2006;126(1):120-127. PubMed
4. Lynch JA, Berse B, Dotson WD, Khoury MJ, Coomer N, Kautter J. Utilization of genetic tests: Analysis of gene-specific billing in Medicare claims data [Published online ahead of print January 26, 2017]. Genet Med. 2017. doi: 10.1038/gim.2016.209. PubMed
5. Centers for Medicare and Medicaid Services. Clinical Laboratory Fee Schedule 2016. https://www.cms.gov/Medicare/Medicare-fee-for-service-Payment/clinicallabfeesched/index.html. Accessed on December 20, 2016.
6. Stevens SM, Woller SC, Bauer KA, et al. Guidance for the evaluation and treatment of hereditary and acquired thrombophilia. J Thromb Thrombolysis. 2016;41(1):154-164. PubMed
The article by Petrilli et al. points to the important but complicated issue of ordering laboratory testing for thrombophilia despite multiple guidelines that dispute the clinical utility of such testing for many indications.1 We question the basis of these authors’ assertion that Medicare spends $300 to $672 million for thrombophilia testing annually. They arrived at this figure by multiplying the price of a thrombophilia test panel (between $1100 and $2400) by the number of annual Medicare claims for thrombophilia analysis, which they estimated at 280,000. The price of the panel is derived from two papers: (1) a 2001 review2 that lists prices of various thrombophilia-related tests adding up to $1782, and (2) a 2006 evaluation by Somma et al.3 of thrombophilia screening at one hospital in New York in 2005. The latter paper refers to various thrombophilia panels from Quest Diagnostics with list prices ranging from $1311 to $2429. However, the repertoire of available test panels and their prices have changed over the last decade. The cost evaluation of thrombophilia testing should be based on actual current payments for tests, and not on list prices for laboratory offerings from over a decade ago. Several laboratories offer mutational analysis of 3 genes—F5, F2, and MTHFR—as a thrombophilia risk panel. Based on the Current Procedural Terminology (CPT) codes listed by the test suppliers (81240, 81241, and 81291), the average Medicare payment for the combination of these 3 markers in 2013 was $172.4 A broader panel of several biochemical, immunological, and genetic assays had a maximum Medicare payment in 2015 of $405 (Table).5
In conclusion, the cost evaluation of thrombophilia screening is more challenging than the calculation by Petrilli et al. suggests.1 Even if Medicare paid as much as $400 per individual tested and assuming up to 200,000 individuals underwent thrombophilia testing per year, the aggregate Medicare expenditure would have been no more than roughly $80 million. Thus, the estimated range in the article appears to have overstated actual Medicare expenditures by an order of magnitude. This does not take away from their overall conclusion that payers are burdened with significant expenditures for laboratory testing that may not present clinical value for many patients.6 We need research into the patterns of utilization as well as improvements in documentation of expenditures associated with these tests.
Disclosure
The findings and conclusions in this report are those of the authors and do not necessarily represent the official position of the Centers for Disease Control and Prevention, the Department of Veterans Affairs, or the United States government. The autho
1. Petrilli CM, Heidemann L, Mack M, Durance P, Chopra V. Inpatient inherited thrombophilia testing. J Hosp Med. 2016;11(11):801-804. PubMed
2. Abramson N, Abramson S. Hypercoagulability: clinical assessment and treatment. South Med J. 2001;94(10):1013-1020. PubMed
3. Somma J, Sussman, II, Rand JH. An evaluation of thrombophilia screening in an urban tertiary care medical center: A “real world” experience. Am J Clin Pathol. 2006;126(1):120-127. PubMed
4. Lynch JA, Berse B, Dotson WD, Khoury MJ, Coomer N, Kautter J. Utilization of genetic tests: Analysis of gene-specific billing in Medicare claims data [Published online ahead of print January 26, 2017]. Genet Med. 2017. doi: 10.1038/gim.2016.209. PubMed
5. Centers for Medicare and Medicaid Services. Clinical Laboratory Fee Schedule 2016. https://www.cms.gov/Medicare/Medicare-fee-for-service-Payment/clinicallabfeesched/index.html. Accessed on December 20, 2016.
6. Stevens SM, Woller SC, Bauer KA, et al. Guidance for the evaluation and treatment of hereditary and acquired thrombophilia. J Thromb Thrombolysis. 2016;41(1):154-164. PubMed
© 2017 Society of Hospital Medicine
Reducing Routine Labs—Teaching Residents Restraint
Inappropriate resource utilization is a pervasive problem in healthcare, and it has received increasing emphasis over the last few years as financial strain on the healthcare system has grown. This waste has led to new models of care—bundled care payments, accountable care organizations, and merit-based payment systems. Professional organizations have also emphasized the provision of high-value care and avoiding unnecessary diagnostic testing and treatment. In April 2012, the American Board of Internal Medicine (ABIM) launched the Choosing Wisely initiative to assist professional societies in putting forth recommendations on clinical circumstances in which particular tests and procedures should be avoided.
Until recently, teaching cost-effective care was not widely considered an important part of internal medicine residency programs. In a 2010 study surveying residents about resource utilization feedback, only 37% of internal medicine residents reported receiving any feedback on resource utilization and 20% reported receiving regular feedback.1 These findings are especially significant in the broader context of national healthcare spending, as there is evidence that physicians who train in high-spending localities tend to have high-spending patterns later in their careers.2 Another study showed similar findings when looking at region of training relative to success at recognizing high-value care on ABIM test questions.3 The Accreditation Council for Graduate Medical Education has developed the Clinical Learning Environment Review program to help address this need. This program provides feedback to teaching hospitals about their success at teaching residents and fellows to provide high-value medical care.
Given the current zeitgeist of emphasizing cost-effective, high-value care, appropriate utilization of routine labs is one area that stands out as an especially low-hanging fruit. The Society of Hospital Medicine, as part of the Choosing Wisely campaign, recommended minimizing routine lab draws in hospitalized patients with clinical and laboratory stability.4 Certainly, avoiding unnecessary routine lab draws is ideal because it saves patients the pain of superfluous phlebotomy, allows phlebotomy resources to be directed to blood draws with actual clinical utility, and saves money. There is also good evidence that hospital-acquired anemia, an effect of overuse of routine blood draws, has an adverse impact on morbidity and mortality in postmyocardial infarction patients5,6 and more generally in hospitalized patients.7
Several studies have examined lab utilization on teaching services. Not surprisingly, the vast majority of test utilization is attributable to the interns (45%) and residents (26%), rather than attendings.8 Another study showed that internal medicine residents at one center had a much stronger self-reported predilection for ordering daily recurring routine labs rather than one-time labs for the following morning when admitting patients and when picking up patients, as compared with hospitalist attendings.9 This self-reported tendency translated into ordering more complete blood counts and basic chemistry panels per patient per day. A qualitative study looking at why internal medicine and general surgery residents ordered unnecessary labs yielded a number of responses, including ingrained habit, lack of price transparency, clinical uncertainty, belief that the attending expected it, and absence of a culture emphasizing resource utilization.10
In this issue of the Journal of Hospital Medicine, Kurtzman and colleagues report on a mixed-methods study looking at internal medicine resident engagement at their center with an electronic medical record–associated dashboard providing feedback on lab utilization.11 Over a 6-month period, the residents randomized into the dashboard group received weekly e-mails while on service with a brief synopsis of their lab utilization relative to their peers and also a link to a dashboard with a time-series display of their relative lab ordering. While the majority of residents (74%) opened the e-mail, only a minority (21%) actually accessed the dashboard. Also, there was not a statistically significant relationship between dashboard use and lab ordering, though there was a trend to decreased lab ordering associated with opening the dashboard. The residents who participated in a focus group expressed both positive and negative opinions on the dashboard.
This is one example of social comparison feedback, which aims to improve performance by providing information to physicians on their performance relative to their peers. It has been shown to be effective in other areas of clinical medicine like limiting antibiotic overutilization in patients with upper respiratory infections.12 One study examining social comparison feedback and objective feedback found that social comparison feedback improved performance for a simulated work task more for high performers but less for low performers than standard objective feedback.13 The utility of this type of feedback has not been extensively studied in healthcare.
However, the audit and feedback strategy, of which social comparison feedback is a subtype, has been extensively studied in healthcare. A 2012 Cochrane Review found that audit and feedback leads to “small but potentially important improvements in professional practice.”14 They found a wide variation in the effect of feedback among the 140 studies they analyzed. The factors strongly associated with a significant improvement after feedback were as follows: poor performance at baseline, a colleague or supervisor as the one providing the audit and feedback, repetitive feedback, feedback given both verbally and in writing, and clear advice or guidance on how to improve. Many of these components were missing from this study—that may be one reason the authors did not find a significant relationship between dashboard use and lab ordering.
A number of interventions, however, have been shown to decrease lab utilization, including unbundling of the components of the metabolic panel and disallowing daily recurring lab orders,15 fee displays,16 cost reminders,17 didactics and data feedback,18 and a multifaceted approach (didactics, monthly feedback, checklist, and financial incentives).19 A multipronged strategy, including an element of education, audit and feedback, hard-stop limits on redundant lab ordering, and fee information is likely to be the most successful strategy to reducing lab overutilization for both residents and attending physicians. Resource overutilization is a multifactorial problem, and multifactorial problems call for multifaceted solutions. Moreover, it may be necessary to employ both “carrot” and “stick” elements to such an approach, rewarding physicians who practice appropriate stewardship, but also penalizing practitioners who do not appropriately adjust their lab ordering tendencies after receiving feedback showing overuse.
Physician behavior is difficult to change, and there are many reasons why physicians order inappropriate tests and studies, including provider uncertainty, fear of malpractice litigation, and inadequate time to consider the utility of a test. Audit and feedback should be integrated into residency curriculums focusing on high-value care, in which hospitalists should play a central role. If supervising attendings are not integrated into such curriculums and continue to both overorder tests themselves and allow residents to do so, then the informal curriculum will trump the formal one.
Physicians respond to incentives, and appropriately designed incentives should be developed to help steer them to order only those tests and studies that are medically indicated. Such incentives must be provided alongside audit and feedback with appropriate goals that account for patient complexity. Ultimately, routine lab ordering is just one area of overutilization in hospital medicine, and the techniques that are successful at reducing overuse in this arena will need to be applied to other aspects of medicine like imaging and medication prescribing.
Disclosure
The authors declare no conflicts of interest.
1. Dine CJ, Miller J, Fuld A, Bellini LM, Iwashyna TJ. Educating Physicians-in-Training About Resource Utilization and Their Own Outcomes of Care in the Inpatient Setting. J Grad Med Educ. 2010;2(2):175-180. PubMed
2. Chen C, Petterson S, Phillips R, Bazemore A, Mullan F. Spending patterns in region of residency training and subsequent expenditures for care provided by practicing physicians for Medicare beneficiaries. JAMA. 2014;312(22):2385-2393. PubMed
3. Sirovich BE, Lipner RS, Johnston M, Holmboe ES. The association between residency training and internists’ ability to practice conservatively. JAMA Intern Med. 2014;174(10):1640-1648. PubMed
4. Bulger J, Nickel W, Messler J, et al. Choosing wisely in adult hospital medicine: Five opportunities for improved healthcare value. J Hosp Med. 2013;8(9):486-492. PubMed
5. Salisbury AC, Amin AP, Reid KJ, et al. Hospital-acquired anemia and in-hospital mortality in patients with acute myocardial infarction. Am Heart J. 2011;162(2):300-309.e3. PubMed
6. Meroño O, Cladellas M, Recasens L, et al. In-hospital acquired anemia in acute coronary syndrome. Predictors, in-hospital prognosis and one-year mortality. Rev Esp Cardiol (Engl Ed). 2012;65(8):742-748. PubMed
7. Koch CG, Li L, Sun Z, et al. Hospital-acquired anemia: Prevalence, outcomes, and healthcare implications. J Hosp Med. 2013;8(9):506-512. PubMed
8. Iwashyna TJ, Fuld A, Asch DA, Bellini LM. The impact of residents, interns, and attendings on inpatient laboratory ordering patterns: a report from one university’s hospitalist service. Acad Med. 2011;86(1):139-145. PubMed
9. Ellenbogen MI, Ma M, Christensen NP, Lee J, O’Leary KJ. Differences in Routine Laboratory Ordering Between a Teaching Service and a Hospitalist Service at a Single Academic Medical Center. South Med J. 2017;110(1):25-30. PubMed
10. Sedrak MS, Patel MS, Ziemba JB, et al. Residents’ self-report on why they order perceived unnecessary inpatient laboratory tests. J Hosp Med. 2016;11(12):869-872. PubMed
11. Kurtzman G, Dine J, Epstein A, et al. Internal Medicine Resident Engagement with a Laboratory Utilization Dashboard: Mixed Methods Study. J Hosp Med. 2017;12(9):743-746. PubMed
12. Meeker D, Linder JA, Fox CR, et al. Effect of Behavioral Interventions on Inappropriate Antibiotic Prescribing Among Primary Care Practices: A Randomized Clinical Trial. JAMA. 2016;315(6):562-570. PubMed
13. Moon K, Lee K, Lee K, Oah S. The Effects of Social Comparison and Objective Feedback on Work Performance Across Different Performance Levels. J Organ Behav Manage. 2017;37(1):63-74.
14. Ivers N, Jamtvedt G, Flottorp S, et al. Audit and feedback : effects on professional practice and healthcare outcomes ( Review ). Cochrane Database Syst Rev. 2012;(6):CD000259. PubMed
15. Neilson EG, Johnson KB, Rosenbloom ST, Dupont WD, Talbert D, Giuse DA. The Impact of Peer Management on Test-Ordering Behavior. Ann Intern Med. 2004;141:196-204. PubMed
16. Feldman LS, Shihab HM, Thiemann D, et al. Impact of providing fee data on laboratory test ordering: a controlled clinical trial. JAMA Intern Med. 2013;173(10):903-908. PubMed
17. Stuebing EA, Miner TJ. Surgical vampires and rising health care expenditure: reducing the cost of daily phlebotomy. Arch Surg. 2011;146:524-527. PubMed
18. Iams W, Heck J, Kapp M, et al. A Multidisciplinary Housestaff-Led Initiative to Safely Reduce Daily Laboratory Testing. Acad Med. 2016;91(6):813-820. PubMed
19. Yarbrough PM, Kukhareva P V., Horton D, Edholm K, Kawamoto K. Multifaceted intervention including education, rounding checklist implementation, cost feedback, and financial incentives reduces inpatient laboratory costs. J Hosp Med. 2016;11(5):348-354. PubMed
Inappropriate resource utilization is a pervasive problem in healthcare, and it has received increasing emphasis over the last few years as financial strain on the healthcare system has grown. This waste has led to new models of care—bundled care payments, accountable care organizations, and merit-based payment systems. Professional organizations have also emphasized the provision of high-value care and avoiding unnecessary diagnostic testing and treatment. In April 2012, the American Board of Internal Medicine (ABIM) launched the Choosing Wisely initiative to assist professional societies in putting forth recommendations on clinical circumstances in which particular tests and procedures should be avoided.
Until recently, teaching cost-effective care was not widely considered an important part of internal medicine residency programs. In a 2010 study surveying residents about resource utilization feedback, only 37% of internal medicine residents reported receiving any feedback on resource utilization and 20% reported receiving regular feedback.1 These findings are especially significant in the broader context of national healthcare spending, as there is evidence that physicians who train in high-spending localities tend to have high-spending patterns later in their careers.2 Another study showed similar findings when looking at region of training relative to success at recognizing high-value care on ABIM test questions.3 The Accreditation Council for Graduate Medical Education has developed the Clinical Learning Environment Review program to help address this need. This program provides feedback to teaching hospitals about their success at teaching residents and fellows to provide high-value medical care.
Given the current zeitgeist of emphasizing cost-effective, high-value care, appropriate utilization of routine labs is one area that stands out as an especially low-hanging fruit. The Society of Hospital Medicine, as part of the Choosing Wisely campaign, recommended minimizing routine lab draws in hospitalized patients with clinical and laboratory stability.4 Certainly, avoiding unnecessary routine lab draws is ideal because it saves patients the pain of superfluous phlebotomy, allows phlebotomy resources to be directed to blood draws with actual clinical utility, and saves money. There is also good evidence that hospital-acquired anemia, an effect of overuse of routine blood draws, has an adverse impact on morbidity and mortality in postmyocardial infarction patients5,6 and more generally in hospitalized patients.7
Several studies have examined lab utilization on teaching services. Not surprisingly, the vast majority of test utilization is attributable to the interns (45%) and residents (26%), rather than attendings.8 Another study showed that internal medicine residents at one center had a much stronger self-reported predilection for ordering daily recurring routine labs rather than one-time labs for the following morning when admitting patients and when picking up patients, as compared with hospitalist attendings.9 This self-reported tendency translated into ordering more complete blood counts and basic chemistry panels per patient per day. A qualitative study looking at why internal medicine and general surgery residents ordered unnecessary labs yielded a number of responses, including ingrained habit, lack of price transparency, clinical uncertainty, belief that the attending expected it, and absence of a culture emphasizing resource utilization.10
In this issue of the Journal of Hospital Medicine, Kurtzman and colleagues report on a mixed-methods study looking at internal medicine resident engagement at their center with an electronic medical record–associated dashboard providing feedback on lab utilization.11 Over a 6-month period, the residents randomized into the dashboard group received weekly e-mails while on service with a brief synopsis of their lab utilization relative to their peers and also a link to a dashboard with a time-series display of their relative lab ordering. While the majority of residents (74%) opened the e-mail, only a minority (21%) actually accessed the dashboard. Also, there was not a statistically significant relationship between dashboard use and lab ordering, though there was a trend to decreased lab ordering associated with opening the dashboard. The residents who participated in a focus group expressed both positive and negative opinions on the dashboard.
This is one example of social comparison feedback, which aims to improve performance by providing information to physicians on their performance relative to their peers. It has been shown to be effective in other areas of clinical medicine like limiting antibiotic overutilization in patients with upper respiratory infections.12 One study examining social comparison feedback and objective feedback found that social comparison feedback improved performance for a simulated work task more for high performers but less for low performers than standard objective feedback.13 The utility of this type of feedback has not been extensively studied in healthcare.
However, the audit and feedback strategy, of which social comparison feedback is a subtype, has been extensively studied in healthcare. A 2012 Cochrane Review found that audit and feedback leads to “small but potentially important improvements in professional practice.”14 They found a wide variation in the effect of feedback among the 140 studies they analyzed. The factors strongly associated with a significant improvement after feedback were as follows: poor performance at baseline, a colleague or supervisor as the one providing the audit and feedback, repetitive feedback, feedback given both verbally and in writing, and clear advice or guidance on how to improve. Many of these components were missing from this study—that may be one reason the authors did not find a significant relationship between dashboard use and lab ordering.
A number of interventions, however, have been shown to decrease lab utilization, including unbundling of the components of the metabolic panel and disallowing daily recurring lab orders,15 fee displays,16 cost reminders,17 didactics and data feedback,18 and a multifaceted approach (didactics, monthly feedback, checklist, and financial incentives).19 A multipronged strategy, including an element of education, audit and feedback, hard-stop limits on redundant lab ordering, and fee information is likely to be the most successful strategy to reducing lab overutilization for both residents and attending physicians. Resource overutilization is a multifactorial problem, and multifactorial problems call for multifaceted solutions. Moreover, it may be necessary to employ both “carrot” and “stick” elements to such an approach, rewarding physicians who practice appropriate stewardship, but also penalizing practitioners who do not appropriately adjust their lab ordering tendencies after receiving feedback showing overuse.
Physician behavior is difficult to change, and there are many reasons why physicians order inappropriate tests and studies, including provider uncertainty, fear of malpractice litigation, and inadequate time to consider the utility of a test. Audit and feedback should be integrated into residency curriculums focusing on high-value care, in which hospitalists should play a central role. If supervising attendings are not integrated into such curriculums and continue to both overorder tests themselves and allow residents to do so, then the informal curriculum will trump the formal one.
Physicians respond to incentives, and appropriately designed incentives should be developed to help steer them to order only those tests and studies that are medically indicated. Such incentives must be provided alongside audit and feedback with appropriate goals that account for patient complexity. Ultimately, routine lab ordering is just one area of overutilization in hospital medicine, and the techniques that are successful at reducing overuse in this arena will need to be applied to other aspects of medicine like imaging and medication prescribing.
Disclosure
The authors declare no conflicts of interest.
1. Dine CJ, Miller J, Fuld A, Bellini LM, Iwashyna TJ. Educating Physicians-in-Training About Resource Utilization and Their Own Outcomes of Care in the Inpatient Setting. J Grad Med Educ. 2010;2(2):175-180. PubMed
2. Chen C, Petterson S, Phillips R, Bazemore A, Mullan F. Spending patterns in region of residency training and subsequent expenditures for care provided by practicing physicians for Medicare beneficiaries. JAMA. 2014;312(22):2385-2393. PubMed
3. Sirovich BE, Lipner RS, Johnston M, Holmboe ES. The association between residency training and internists’ ability to practice conservatively. JAMA Intern Med. 2014;174(10):1640-1648. PubMed
4. Bulger J, Nickel W, Messler J, et al. Choosing wisely in adult hospital medicine: Five opportunities for improved healthcare value. J Hosp Med. 2013;8(9):486-492. PubMed
5. Salisbury AC, Amin AP, Reid KJ, et al. Hospital-acquired anemia and in-hospital mortality in patients with acute myocardial infarction. Am Heart J. 2011;162(2):300-309.e3. PubMed
6. Meroño O, Cladellas M, Recasens L, et al. In-hospital acquired anemia in acute coronary syndrome. Predictors, in-hospital prognosis and one-year mortality. Rev Esp Cardiol (Engl Ed). 2012;65(8):742-748. PubMed
7. Koch CG, Li L, Sun Z, et al. Hospital-acquired anemia: Prevalence, outcomes, and healthcare implications. J Hosp Med. 2013;8(9):506-512. PubMed
8. Iwashyna TJ, Fuld A, Asch DA, Bellini LM. The impact of residents, interns, and attendings on inpatient laboratory ordering patterns: a report from one university’s hospitalist service. Acad Med. 2011;86(1):139-145. PubMed
9. Ellenbogen MI, Ma M, Christensen NP, Lee J, O’Leary KJ. Differences in Routine Laboratory Ordering Between a Teaching Service and a Hospitalist Service at a Single Academic Medical Center. South Med J. 2017;110(1):25-30. PubMed
10. Sedrak MS, Patel MS, Ziemba JB, et al. Residents’ self-report on why they order perceived unnecessary inpatient laboratory tests. J Hosp Med. 2016;11(12):869-872. PubMed
11. Kurtzman G, Dine J, Epstein A, et al. Internal Medicine Resident Engagement with a Laboratory Utilization Dashboard: Mixed Methods Study. J Hosp Med. 2017;12(9):743-746. PubMed
12. Meeker D, Linder JA, Fox CR, et al. Effect of Behavioral Interventions on Inappropriate Antibiotic Prescribing Among Primary Care Practices: A Randomized Clinical Trial. JAMA. 2016;315(6):562-570. PubMed
13. Moon K, Lee K, Lee K, Oah S. The Effects of Social Comparison and Objective Feedback on Work Performance Across Different Performance Levels. J Organ Behav Manage. 2017;37(1):63-74.
14. Ivers N, Jamtvedt G, Flottorp S, et al. Audit and feedback : effects on professional practice and healthcare outcomes ( Review ). Cochrane Database Syst Rev. 2012;(6):CD000259. PubMed
15. Neilson EG, Johnson KB, Rosenbloom ST, Dupont WD, Talbert D, Giuse DA. The Impact of Peer Management on Test-Ordering Behavior. Ann Intern Med. 2004;141:196-204. PubMed
16. Feldman LS, Shihab HM, Thiemann D, et al. Impact of providing fee data on laboratory test ordering: a controlled clinical trial. JAMA Intern Med. 2013;173(10):903-908. PubMed
17. Stuebing EA, Miner TJ. Surgical vampires and rising health care expenditure: reducing the cost of daily phlebotomy. Arch Surg. 2011;146:524-527. PubMed
18. Iams W, Heck J, Kapp M, et al. A Multidisciplinary Housestaff-Led Initiative to Safely Reduce Daily Laboratory Testing. Acad Med. 2016;91(6):813-820. PubMed
19. Yarbrough PM, Kukhareva P V., Horton D, Edholm K, Kawamoto K. Multifaceted intervention including education, rounding checklist implementation, cost feedback, and financial incentives reduces inpatient laboratory costs. J Hosp Med. 2016;11(5):348-354. PubMed
© 2017 Society of Hospital Medicine
Does the Week-End Justify the Means?
Let’s face it—rates of hospital admission are on the rise, but there are still just 7 days in a week. That means that patients are increasingly admitted on weekdays and on the weekend, requiring more nurses and doctors to look after them. Why then are there no lines for coffee on a Saturday? Does this reduced intensity of staffing translate into worse care for our patients?
Since one of its earliest descriptions in hospitalized patients, the “weekend effect” has been extensively studied in various patient populations and hospital settings.1-5 The results have been varied, depending on the place of care,6 reason for care, type of admission,5,7 or admitting diagnosis.1,8,9 Many researchers have posited the drivers behind the weekend effect, including understaffed wards, intensity of specialist care, delays in procedural treatments, or severity of illness, but the truth is that we still don’t know.
Pauls et al. performed a robust systematic review and meta-analysis examining the rates of in-hospital mortality in patients admitted on the weekend compared with those admitted on weekdays.10 They analyzed predetermined subgroups to identify system- and patient-level factors associated with a difference in weekend mortality.
A total of 97 studies—comprising an astounding 51 million patients—was included in the study. They found that individuals admitted on the weekend carried an almost 20% increase in the risk of death compared with those who landed in hospital on a weekday. The effect was present for both in-hospital deaths and when looking specifically at 30-day mortality. Translating these findings into practice, an additional 14 deaths per 1000 admissions occur when patients are admitted on the weekend. Brain surgery can be less risky.11
Despite this concerning finding, no individual factor was identified that could account for the effect. There was a 16% and 11% increase in mortality in weekend patients associated with decreased hospital staffing and delays to procedural therapies, respectively. No differences were found when examining reduced rates of procedures or illness severity on weekends compared with weekdays. But one must always interpret subgroup analyses, even prespecified ones, with caution because they often lack the statistical power to make concrete conclusions.
To this end, an important finding of the study by Pauls et al. highlights the variation in mortality risk as it relates to the weekend effect.10 Even for individuals with cancer, a disease with a relatively predictable rate of decline, there are weekend differences in mortality risk that depend upon the type of cancer.8,12 This heterogeneity persists when examining for the possible factors that contribute to the effect, introducing a significant amount of noise into the analysis, and may explain why research to date has been unable to find the proverbial black cat in the coal cellar.
One thing Pauls et al. makes clear is that the weekend effect appears to be a real phenomenon, despite significant heterogeneity in the literature.10 Only a high-quality, systematic review has the capability to draw such conclusions. Prior work demonstrates that this effect is substantial in some individuals,and this study confirms that it perseveres beyond an immediate time period following admission.1,9 The elements contributing to the weekend effect remain undefined and are likely as complex as our healthcare system itself.
Society and policy makers should resist the tantalizing urge to invoke interventions aimed at fixing this issue before fully understanding the drivers of a system problem. The government of the United Kingdom has decreed a manifesto to create a “7-day National Health Service,” in which weekend services and physician staffing will match that of the weekdays. Considering recent labor tensions between junior doctors in the United Kingdom over pay and working hours, the stakes are at an all-time high.
But such drastic measures violate a primary directive of quality improvement science to study and understand the problem before reflexively jumping to solutions. This will require new research endeavors aimed at determining the underlying factor(s) responsible for the weekend effect. Once we are confident in its cause, only then can careful evaluation of targeted interventions aimed at the highest-risk admissions be instituted. As global hospital and healthcare budgets bend under increasing strain, a critical component of any proposed intervention must be to examine the cost-effectiveness in doing so. Because the weekend effect is one of increased mortality, it will be hard to justify an acceptable price for an individual’s life. And it is not as straightforward as a randomized trial examining the efficacy of parachutes. Any formal evaluation must account for the unintended consequences and opportunity costs of implementing a potential fix aimed at minimizing the weekend effect.
The weekend effect has now been studied for over 15 years. Pauls et al. add to our knowledge of this phenomenon, confirming that the overall risk of mortality for patients admitted on the weekend is real, variable, and substantial.10 As more individuals are admitted to hospitals, resulting in increasing numbers of admissions on the weekend, a desperate search for the underlying cause must be carried out before we can fix it. Whatever the means to the end, our elation will continue to be tempered by a feeling of uneasiness every time our coworkers joyously exclaim, “TGIF!”
Disclosure
The authors have nothing to disclose.
1. Bell CM, Redelmeier DA. Mortality among patients admitted to hospitals on weekends as compared with weekdays. N Engl J Med. 2001;345(9):663-668. doi:10.1056/NEJMsa003376. PubMed
2. Bell CM, Redelmeier DA. Waiting for urgent procedures on the weekend among emergently hospitalized patients. AJM. 2004;117(3):175-181. doi:10.1016/j.amjmed.2004.02.047. PubMed
3. Kalaitzakis E, Helgeson J, Strömdahl M, Tóth E. Weekend admission in upper GI bleeding: does it have an impact on outcome? Gastrointest Endosc. 2015;81(5):1295-1296. doi:10.1016/j.gie.2014.12.003. PubMed
4. Nanchal R, Kumar G, Taneja A, et al. Pulmonary embolism: the weekend effect. Chest. 2012;142(3):690-696. doi:10.1378/chest.11-2663. PubMed
5. Ricciardi R, Roberts PL, Read TE, Baxter NN, Marcello PW, Schoetz DJ. Mortality rate after nonelective hospital admission. Arch Surg. 2011;146(5):545-551. PubMed
6. Wunsch H, Mapstone J, Brady T, Hanks R, Rowan K. Hospital mortality associated with day and time of admission to intensive care units. Intensive Care Med. 2004;30(5):895-901. doi:10.1007/s00134-004-2170-3. PubMed
7. Freemantle N, Richardson M, Wood J, et al. Weekend hospitalization and additional risk of death: an analysis of inpatient data. J R Soc Med. 2012;105(2):74-84. doi:10.1258/jrsm.2012.120009. PubMed
8. Lapointe-Shaw L, Bell CM. It’s not you, it’s me: time to narrow the gap in weekend care. BMJ Qual Saf. 2014;23(3):180-182. doi:10.1136/bmjqs-2013-002674. PubMed
9. Concha OP, Gallego B, Hillman K, Delaney GP, Coiera E. Do variations in hospital mortality patterns after weekend admission reflect reduced quality of care or different patient cohorts? A population-based study. BMJ Qual Saf. 2014;23(3):215-222. doi:10.1136/bmjqs-2013-002218. PubMed
10. Pauls LA, Johnson-Paben R, McGready J, Murphy JD, Pronovost PJ, Wu CL. The Weekend Effect in Hospitalized Patients: A Meta-analysis. J Hosp Med. 2017;12(9):760-766. PubMed
11. American College of Surgeons. NSQIP Risk Calculator. http://riskcalculator.facs.org/RiskCalculator/. Accessed on July 5, 2017.
12. Lapointe-Shaw L, Abushomar H, Chen XK, et al. Care and outcomes of patients with cancer admitted to the hospital on weekends and holidays: a retrospective cohort study. J Natl Compr Canc Netw. 2016;14(7):867-874. PubMed
Let’s face it—rates of hospital admission are on the rise, but there are still just 7 days in a week. That means that patients are increasingly admitted on weekdays and on the weekend, requiring more nurses and doctors to look after them. Why then are there no lines for coffee on a Saturday? Does this reduced intensity of staffing translate into worse care for our patients?
Since one of its earliest descriptions in hospitalized patients, the “weekend effect” has been extensively studied in various patient populations and hospital settings.1-5 The results have been varied, depending on the place of care,6 reason for care, type of admission,5,7 or admitting diagnosis.1,8,9 Many researchers have posited the drivers behind the weekend effect, including understaffed wards, intensity of specialist care, delays in procedural treatments, or severity of illness, but the truth is that we still don’t know.
Pauls et al. performed a robust systematic review and meta-analysis examining the rates of in-hospital mortality in patients admitted on the weekend compared with those admitted on weekdays.10 They analyzed predetermined subgroups to identify system- and patient-level factors associated with a difference in weekend mortality.
A total of 97 studies—comprising an astounding 51 million patients—was included in the study. They found that individuals admitted on the weekend carried an almost 20% increase in the risk of death compared with those who landed in hospital on a weekday. The effect was present for both in-hospital deaths and when looking specifically at 30-day mortality. Translating these findings into practice, an additional 14 deaths per 1000 admissions occur when patients are admitted on the weekend. Brain surgery can be less risky.11
Despite this concerning finding, no individual factor was identified that could account for the effect. There was a 16% and 11% increase in mortality in weekend patients associated with decreased hospital staffing and delays to procedural therapies, respectively. No differences were found when examining reduced rates of procedures or illness severity on weekends compared with weekdays. But one must always interpret subgroup analyses, even prespecified ones, with caution because they often lack the statistical power to make concrete conclusions.
To this end, an important finding of the study by Pauls et al. highlights the variation in mortality risk as it relates to the weekend effect.10 Even for individuals with cancer, a disease with a relatively predictable rate of decline, there are weekend differences in mortality risk that depend upon the type of cancer.8,12 This heterogeneity persists when examining for the possible factors that contribute to the effect, introducing a significant amount of noise into the analysis, and may explain why research to date has been unable to find the proverbial black cat in the coal cellar.
One thing Pauls et al. makes clear is that the weekend effect appears to be a real phenomenon, despite significant heterogeneity in the literature.10 Only a high-quality, systematic review has the capability to draw such conclusions. Prior work demonstrates that this effect is substantial in some individuals,and this study confirms that it perseveres beyond an immediate time period following admission.1,9 The elements contributing to the weekend effect remain undefined and are likely as complex as our healthcare system itself.
Society and policy makers should resist the tantalizing urge to invoke interventions aimed at fixing this issue before fully understanding the drivers of a system problem. The government of the United Kingdom has decreed a manifesto to create a “7-day National Health Service,” in which weekend services and physician staffing will match that of the weekdays. Considering recent labor tensions between junior doctors in the United Kingdom over pay and working hours, the stakes are at an all-time high.
But such drastic measures violate a primary directive of quality improvement science to study and understand the problem before reflexively jumping to solutions. This will require new research endeavors aimed at determining the underlying factor(s) responsible for the weekend effect. Once we are confident in its cause, only then can careful evaluation of targeted interventions aimed at the highest-risk admissions be instituted. As global hospital and healthcare budgets bend under increasing strain, a critical component of any proposed intervention must be to examine the cost-effectiveness in doing so. Because the weekend effect is one of increased mortality, it will be hard to justify an acceptable price for an individual’s life. And it is not as straightforward as a randomized trial examining the efficacy of parachutes. Any formal evaluation must account for the unintended consequences and opportunity costs of implementing a potential fix aimed at minimizing the weekend effect.
The weekend effect has now been studied for over 15 years. Pauls et al. add to our knowledge of this phenomenon, confirming that the overall risk of mortality for patients admitted on the weekend is real, variable, and substantial.10 As more individuals are admitted to hospitals, resulting in increasing numbers of admissions on the weekend, a desperate search for the underlying cause must be carried out before we can fix it. Whatever the means to the end, our elation will continue to be tempered by a feeling of uneasiness every time our coworkers joyously exclaim, “TGIF!”
Disclosure
The authors have nothing to disclose.
1. Bell CM, Redelmeier DA. Mortality among patients admitted to hospitals on weekends as compared with weekdays. N Engl J Med. 2001;345(9):663-668. doi:10.1056/NEJMsa003376. PubMed
2. Bell CM, Redelmeier DA. Waiting for urgent procedures on the weekend among emergently hospitalized patients. AJM. 2004;117(3):175-181. doi:10.1016/j.amjmed.2004.02.047. PubMed
3. Kalaitzakis E, Helgeson J, Strömdahl M, Tóth E. Weekend admission in upper GI bleeding: does it have an impact on outcome? Gastrointest Endosc. 2015;81(5):1295-1296. doi:10.1016/j.gie.2014.12.003. PubMed
4. Nanchal R, Kumar G, Taneja A, et al. Pulmonary embolism: the weekend effect. Chest. 2012;142(3):690-696. doi:10.1378/chest.11-2663. PubMed
5. Ricciardi R, Roberts PL, Read TE, Baxter NN, Marcello PW, Schoetz DJ. Mortality rate after nonelective hospital admission. Arch Surg. 2011;146(5):545-551. PubMed
6. Wunsch H, Mapstone J, Brady T, Hanks R, Rowan K. Hospital mortality associated with day and time of admission to intensive care units. Intensive Care Med. 2004;30(5):895-901. doi:10.1007/s00134-004-2170-3. PubMed
7. Freemantle N, Richardson M, Wood J, et al. Weekend hospitalization and additional risk of death: an analysis of inpatient data. J R Soc Med. 2012;105(2):74-84. doi:10.1258/jrsm.2012.120009. PubMed
8. Lapointe-Shaw L, Bell CM. It’s not you, it’s me: time to narrow the gap in weekend care. BMJ Qual Saf. 2014;23(3):180-182. doi:10.1136/bmjqs-2013-002674. PubMed
9. Concha OP, Gallego B, Hillman K, Delaney GP, Coiera E. Do variations in hospital mortality patterns after weekend admission reflect reduced quality of care or different patient cohorts? A population-based study. BMJ Qual Saf. 2014;23(3):215-222. doi:10.1136/bmjqs-2013-002218. PubMed
10. Pauls LA, Johnson-Paben R, McGready J, Murphy JD, Pronovost PJ, Wu CL. The Weekend Effect in Hospitalized Patients: A Meta-analysis. J Hosp Med. 2017;12(9):760-766. PubMed
11. American College of Surgeons. NSQIP Risk Calculator. http://riskcalculator.facs.org/RiskCalculator/. Accessed on July 5, 2017.
12. Lapointe-Shaw L, Abushomar H, Chen XK, et al. Care and outcomes of patients with cancer admitted to the hospital on weekends and holidays: a retrospective cohort study. J Natl Compr Canc Netw. 2016;14(7):867-874. PubMed
© 2017 Society of Hospital Medicine
Inpatient Thrombophilia Testing: At What Expense?
Thrombotic disorders, such as venous thromboembolism (VTE) and acute ischemic stroke, are highly prevalent,1 morbid, and anxiety-provoking conditions for patients, their families, and providers.2 Often, a clear cause for these thrombotic events cannot be found, leading to diagnoses of “cryptogenic stroke” or “idiopathic VTE.” In response, many patients and clinicians search for a cause with thrombophilia testing.
However, evaluation for thrombophilia is rarely clinically useful in hospitalized patients. Test results are often inaccurate in the setting of acute thrombosis or active anticoagulation. Even when thrombophilia results are reliable, they seldom alter immediate management of the underlying condition, especially for the inherited forms.3 An important exception is when there is high clinical suspicion for the antiphospholipid syndrome (APS), because APS test results may affect both short-term and long-term drug choices and international normalized ratio target range. Despite the broad recommendations against routine use of thrombophilia testing (including the Choosing Wisely campaign),4 patterns and cost of testing for inpatient thrombophilia evaluation have not been well reported.
In this issue of Journal of Hospital Medicine, Cox et al.5 and Mou et al.6 retrospectively review the appropriateness and impact of inpatient thrombophilia testing at 2 academic centers. In the report by Mou and colleagues, nearly half of all thrombophilia tests were felt to be inappropriate at an excess cost of over $40,000. Cox and colleagues identified that 77% of patients received 1 or more thrombophilia tests with minimal clinical utility. Perhaps most striking, Cox and colleagues report that management was affected in only 2 of 163 patients (1.2%) that received thrombophilia testing; both had cryptogenic stroke and both were started on anticoagulation after testing positive for multiple coagulation defects.
These studies confirm 2 key findings: first, that 43%-63% of tests are potentially inaccurate or of low utility, and second, that inpatient thrombophilia testing can be costly. Importantly, the costs of inappropriate testing were likely underestimated. For example, Mou et al. excluded 16.6% of tests that were performed for reasons that could not always be easily justified—such as “tests ordered with no documentation or justification” or “work-up sent solely on suspicion of possible thrombotic event without diagnostic confirmation.” Additionally, Mou et al. defined appropriateness more generously than current guidelines; for example, “recurrent provoked VTE” was listed as an appropriate indication for thrombophilia testing, although this is not supported by current guidelines for inherited thrombophilia evaluation. Similarly, Cox et al included cryptogenic stroke as an appropriate indication to perform thrombophilia testing; however, current American Heart Association and American Stroke Association guidelines state that usefulness of screening for hypercoagulable states in such patients is unknown.7 Furthermore, APS testing is not recommended in all cases of cryptogenic stroke in the absence of other clinical manifestations of APS.7
It remains puzzling why physicians continue to order inpatient thrombophilia testing despite their low clinical utility and inaccurate results. Cox and colleagues suggested that a lack of clinician and patient education may explain part of this reason. Likewise, easy access to “thrombophilia panels” make it easy for any clinician to order a number of tests that appear to be expert endorsed due to their inclusion in the panel. Cox et al. found that 79% of all thrombophilia tests were ordered as a part of a panel. Finally, patients and clinicians are continually searching for a reason why the thromboembolic event occurred. The thrombophilia test results (even if potentially inaccurate), may lead to a false sense of relief for both parties, no matter the results. If a thrombophilia is found, then patients and clinicians often have a sense for why the thrombotic event occurred. If the testing is negative, there may be a false sense of reassurance that “no genetic” cause for thrombosis exists.8
How can we improve care in this regard? Given the magnitude of financial and psychological cost of inappropriate inpatient thrombophilia testing,9 a robust deimplementation effort is needed.10,11 Electronic-medical-record–based solutions may be the most effective tool to educate physicians at the point of care while simultaneously deterring inappropriate ordering. Examples include eliminating tests without evidence of clinical utility in the inpatient setting (ie, methylenetetrahydrofolate reductase); using hard stops to prevent unintentional duplicative tests12; and preventing providers from ordering tests that are not reliable in certain settings—such as protein S activity when patients are receiving warfarin. The latter intervention would have prevented 16% of tests (on 44% of the patients) performed in the Cox et al study. Other promising efforts include embedding guidelines into order sets and requiring the provider to choose a guideline-based reason before being allowed to order such a test. Finally, eliminating thrombophilia “panels” may reduce unnecessary duplicate testing and avoid giving a false sense of clinical validation to ordering providers who may not be familiar with the indications or nuances of each individual test.
In light of mounting evidence, including the 2 important studies discussed above, it is no longer appropriate or wise to allow unfettered access to thrombophilia testing in hospitalized patients. The evidence suggests that these tests are often ordered without regard to expense, utility, or accuracy in hospital-based settings. Deimplementation efforts that provide hard stops, education, and limited access to such testing in the electronic medical ordering system when ordering thrombophilia workups now appear necessary.
Disclosure
Lauren Heidemann and Christopher Petrilli have no conflicts of interest to report. Geoffrey Barnes reports the following conflicts of interest: Research funding from NIH/NHLBI (K01 HL135392), Blue Cross-Blue Shield of Michigan, and BMS/Pfizer. Consulting from BMS/Pfizer and Portola.
1. Heit JA. Thrombophilia: common questions on laboratory assessment and management. Hematology Am Soc Hematol Educ Program. 2007:127-135. PubMed
2. Mozaffarian D, Benjamin EJ, Go AS, et al. Heart disease and stroke statistics--2015 update: a report from the American Heart Association. Circulation. 2015;131(4):e29-322. PubMed
3. Petrilli CM, Heidemann L, Mack M, Durance P, Chopra V. Inpatient inherited thrombophilia testing. J Hosp Med. 2016;11(11):801-804. PubMed
4. American Society of Hematology. Ten Things Physicians and Patients Should Question. Choosing Wisely 2014. http://www.choosingwisely.org/societies/american-society-of-hematology/. Accessed July 3, 2017.
5. Cox N, Johnson SA, Vazquez S, et al. Patterns and appropriateness of thrombophilia testing in an academic medical center. J Hosp Med. 2017;12(9):705-709. PubMed
6. Mou E, Kwang H, Hom J, et al. Magnitude of potentially inappropriate thrombophilia testing in the inpatient hospital setting. J Hosp Med. 2017;12(9):735-738. PubMed
7. Kernan WN, Ovbiagele B, Black HR, et al. Guidelines for the prevention of stroke in patients with stroke and transient ischemic attack: a guideline for healthcare professionals from the American Heart Association/American Stroke Association. Stroke. 2014;45(7):2160-2236. PubMed
8. Stevens SM, Woller SC, Bauer KA, et al. Guidance for the evaluation and treatment of hereditary and acquired thrombophilia. J Thromb Thrombolysis. 2016;41(1):154-164. PubMed
9. Bank I, Scavenius MP, Buller HR, Middeldorp S. Social aspects of genetic testing for factor V Leiden mutation in healthy individuals and their importance for daily practice. Thromb Res. 2004;113(1):7-12. PubMed
10. Niven DJ, Mrklas KJ, Holodinsky JK, et al. Towards understanding the de-adoption of low-value clinical practices: a scoping review. BMC Med. 2015;13:255. PubMed
11. Prasad V, Ioannidis JP. Evidence-based de-implementation for contradicted, unproven, and aspiring healthcare practices. Implement Sci. 2014;9:1. PubMed
12. Procop GW, Keating C, Stagno P, et al. Reducing duplicate testing: a comparison of two clinical decision support tools. Am J Clin Pathol. 2015;143(5):623-626. PubMed
Thrombotic disorders, such as venous thromboembolism (VTE) and acute ischemic stroke, are highly prevalent,1 morbid, and anxiety-provoking conditions for patients, their families, and providers.2 Often, a clear cause for these thrombotic events cannot be found, leading to diagnoses of “cryptogenic stroke” or “idiopathic VTE.” In response, many patients and clinicians search for a cause with thrombophilia testing.
However, evaluation for thrombophilia is rarely clinically useful in hospitalized patients. Test results are often inaccurate in the setting of acute thrombosis or active anticoagulation. Even when thrombophilia results are reliable, they seldom alter immediate management of the underlying condition, especially for the inherited forms.3 An important exception is when there is high clinical suspicion for the antiphospholipid syndrome (APS), because APS test results may affect both short-term and long-term drug choices and international normalized ratio target range. Despite the broad recommendations against routine use of thrombophilia testing (including the Choosing Wisely campaign),4 patterns and cost of testing for inpatient thrombophilia evaluation have not been well reported.
In this issue of Journal of Hospital Medicine, Cox et al.5 and Mou et al.6 retrospectively review the appropriateness and impact of inpatient thrombophilia testing at 2 academic centers. In the report by Mou and colleagues, nearly half of all thrombophilia tests were felt to be inappropriate at an excess cost of over $40,000. Cox and colleagues identified that 77% of patients received 1 or more thrombophilia tests with minimal clinical utility. Perhaps most striking, Cox and colleagues report that management was affected in only 2 of 163 patients (1.2%) that received thrombophilia testing; both had cryptogenic stroke and both were started on anticoagulation after testing positive for multiple coagulation defects.
These studies confirm 2 key findings: first, that 43%-63% of tests are potentially inaccurate or of low utility, and second, that inpatient thrombophilia testing can be costly. Importantly, the costs of inappropriate testing were likely underestimated. For example, Mou et al. excluded 16.6% of tests that were performed for reasons that could not always be easily justified—such as “tests ordered with no documentation or justification” or “work-up sent solely on suspicion of possible thrombotic event without diagnostic confirmation.” Additionally, Mou et al. defined appropriateness more generously than current guidelines; for example, “recurrent provoked VTE” was listed as an appropriate indication for thrombophilia testing, although this is not supported by current guidelines for inherited thrombophilia evaluation. Similarly, Cox et al included cryptogenic stroke as an appropriate indication to perform thrombophilia testing; however, current American Heart Association and American Stroke Association guidelines state that usefulness of screening for hypercoagulable states in such patients is unknown.7 Furthermore, APS testing is not recommended in all cases of cryptogenic stroke in the absence of other clinical manifestations of APS.7
It remains puzzling why physicians continue to order inpatient thrombophilia testing despite their low clinical utility and inaccurate results. Cox and colleagues suggested that a lack of clinician and patient education may explain part of this reason. Likewise, easy access to “thrombophilia panels” make it easy for any clinician to order a number of tests that appear to be expert endorsed due to their inclusion in the panel. Cox et al. found that 79% of all thrombophilia tests were ordered as a part of a panel. Finally, patients and clinicians are continually searching for a reason why the thromboembolic event occurred. The thrombophilia test results (even if potentially inaccurate), may lead to a false sense of relief for both parties, no matter the results. If a thrombophilia is found, then patients and clinicians often have a sense for why the thrombotic event occurred. If the testing is negative, there may be a false sense of reassurance that “no genetic” cause for thrombosis exists.8
How can we improve care in this regard? Given the magnitude of financial and psychological cost of inappropriate inpatient thrombophilia testing,9 a robust deimplementation effort is needed.10,11 Electronic-medical-record–based solutions may be the most effective tool to educate physicians at the point of care while simultaneously deterring inappropriate ordering. Examples include eliminating tests without evidence of clinical utility in the inpatient setting (ie, methylenetetrahydrofolate reductase); using hard stops to prevent unintentional duplicative tests12; and preventing providers from ordering tests that are not reliable in certain settings—such as protein S activity when patients are receiving warfarin. The latter intervention would have prevented 16% of tests (on 44% of the patients) performed in the Cox et al study. Other promising efforts include embedding guidelines into order sets and requiring the provider to choose a guideline-based reason before being allowed to order such a test. Finally, eliminating thrombophilia “panels” may reduce unnecessary duplicate testing and avoid giving a false sense of clinical validation to ordering providers who may not be familiar with the indications or nuances of each individual test.
In light of mounting evidence, including the 2 important studies discussed above, it is no longer appropriate or wise to allow unfettered access to thrombophilia testing in hospitalized patients. The evidence suggests that these tests are often ordered without regard to expense, utility, or accuracy in hospital-based settings. Deimplementation efforts that provide hard stops, education, and limited access to such testing in the electronic medical ordering system when ordering thrombophilia workups now appear necessary.
Disclosure
Lauren Heidemann and Christopher Petrilli have no conflicts of interest to report. Geoffrey Barnes reports the following conflicts of interest: Research funding from NIH/NHLBI (K01 HL135392), Blue Cross-Blue Shield of Michigan, and BMS/Pfizer. Consulting from BMS/Pfizer and Portola.
1. Heit JA. Thrombophilia: common questions on laboratory assessment and management. Hematology Am Soc Hematol Educ Program. 2007:127-135. PubMed
2. Mozaffarian D, Benjamin EJ, Go AS, et al. Heart disease and stroke statistics--2015 update: a report from the American Heart Association. Circulation. 2015;131(4):e29-322. PubMed
3. Petrilli CM, Heidemann L, Mack M, Durance P, Chopra V. Inpatient inherited thrombophilia testing. J Hosp Med. 2016;11(11):801-804. PubMed
4. American Society of Hematology. Ten Things Physicians and Patients Should Question. Choosing Wisely 2014. http://www.choosingwisely.org/societies/american-society-of-hematology/. Accessed July 3, 2017.
5. Cox N, Johnson SA, Vazquez S, et al. Patterns and appropriateness of thrombophilia testing in an academic medical center. J Hosp Med. 2017;12(9):705-709. PubMed
6. Mou E, Kwang H, Hom J, et al. Magnitude of potentially inappropriate thrombophilia testing in the inpatient hospital setting. J Hosp Med. 2017;12(9):735-738. PubMed
7. Kernan WN, Ovbiagele B, Black HR, et al. Guidelines for the prevention of stroke in patients with stroke and transient ischemic attack: a guideline for healthcare professionals from the American Heart Association/American Stroke Association. Stroke. 2014;45(7):2160-2236. PubMed
8. Stevens SM, Woller SC, Bauer KA, et al. Guidance for the evaluation and treatment of hereditary and acquired thrombophilia. J Thromb Thrombolysis. 2016;41(1):154-164. PubMed
9. Bank I, Scavenius MP, Buller HR, Middeldorp S. Social aspects of genetic testing for factor V Leiden mutation in healthy individuals and their importance for daily practice. Thromb Res. 2004;113(1):7-12. PubMed
10. Niven DJ, Mrklas KJ, Holodinsky JK, et al. Towards understanding the de-adoption of low-value clinical practices: a scoping review. BMC Med. 2015;13:255. PubMed
11. Prasad V, Ioannidis JP. Evidence-based de-implementation for contradicted, unproven, and aspiring healthcare practices. Implement Sci. 2014;9:1. PubMed
12. Procop GW, Keating C, Stagno P, et al. Reducing duplicate testing: a comparison of two clinical decision support tools. Am J Clin Pathol. 2015;143(5):623-626. PubMed
© 2017 Society of Hospital Medicine
Certification of Point-of-Care Ultrasound Competency
Any conversation about point-of-care ultrasound (POCUS) inevitably brings up discussion about credentialing, privileging, and certification. While credentialing and privileging are institution-specific processes, competency certification can be extramural through a national board or intramural through an institutional process.
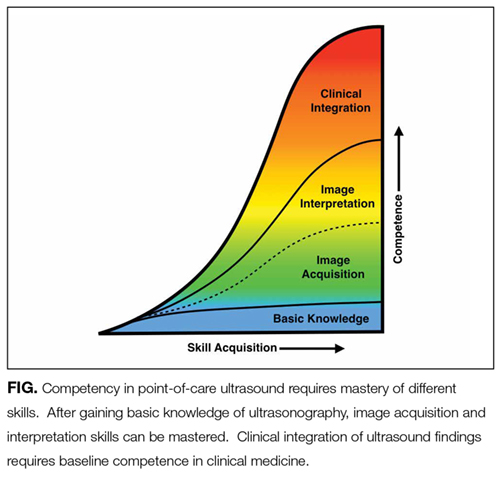
Some institutions have begun to develop intramural certification pathways for POCUS competency in order to grant privileges to hospitalists. In this edition of the Journal of Hospital Medicine, Mathews and Zwank2 describe a multidisciplinary collaboration to provide POCUS training, intramural certification, and quality assurance for hospitalists at one hospital in Minnesota. This model serves as a real-world example of how institutions are addressing the need to certify hospitalists in basic POCUS competency. After engaging stakeholders from radiology, critical care, emergency medicine, and cardiology, institutional standards were developed and hospitalists were assessed for basic POCUS competency. Certification included assessments of hospitalists’ knowledge, image acquisition, and image interpretation skills. The model described by Mathews did not assess competency in clinical integration but laid the groundwork for future evaluation of clinical outcomes in the cohort of certified hospitalists.
Although experts may not agree on all aspects of competency in POCUS, most will agree with the basic principles outlined by Mathews and Zwank. Initial certification should be based on training and an initial assessment of competency. Components of training should include ultrasound didactics, mentored hands-on practice, independent hands-on practice, and image interpretation practice. Ongoing certification should be based on quality assurance incorporated with an ongoing assessment of skills. Additionally, most experts will agree that competency can be recognized, and formative and summative assessments that combine a gestalt of provider skills with quantitative scoring systems using checklists are likely the best approach.
The real question is, what is the goal of certification of POCUS competency? Development of an institutional certification process demands substantive resources of the institution and time of the providers. Institutions would have to invest in equipment and staff to operate a full-time certification program, given the large number of providers that use POCUS and justify why substantive resources are being dedicated to certify POCUS skills and not others. Providers may be dissuaded from using POCUS if certification requirements are burdensome, which has potential negative consequences, such as reverting back to performing bedside procedures without ultrasound guidance or referring all patients to interventional radiology.
Conceptually, one may speculate that certification is required for providers to bill for POCUS exams, but certification is not required to bill, although institutions may require certification before granting privileges to use POCUS. However, based on the emergency medicine experience, a specialty that has been using POCUS for more than 20 years, billing may not be the main driver of POCUS use. A recent review of 2012 Medicare data revealed that <1% of emergency medicine providers received reimbursement for limited ultrasound exams.3 Despite the Accreditation Council for Graduate Medical Education (ACGME) requirement for POCUS competency of all graduating emergency medicine residents since 2001 and the increasing POCUS use reported by emergency medicine physicians,4,5 most emergency medicine physicians are not billing for POCUS exams. Maybe use of POCUS as a “quick look” or extension of the physical examination is more common than previously thought. Although billing for POCUS exams can generate some clinical revenue, the benefits for the healthcare system by expediting care,6,7 reducing ancillary testing,8,9 and reducing procedural complications10,11 likely outweigh the small gains from billing for limited ultrasound exams. As healthcare payment models evolve to reward healthcare systems that achieve good outcomes rather than services rendered, certification for the sole purpose of billing may become obsolete. Furthermore, concerns about billing increasing medical liability from using POCUS are likely overstated because few lawsuits have resulted from missed diagnoses by POCUS, and most lawsuits have been from failure to perform a POCUS exam in a timely manner.12,13
Many medical students graduating today have had some training in POCUS14 and, as this new generation of physicians enters the workforce, they will likely view POCUS as part of their routine bedside evaluation of patients. If POCUS training is integrated into medical school and residency curricula, and national board certification incorporates basic POCUS competency, then most institutions may no longer feel obligated to certify POCUS competency locally, and institutional certification programs, such as the one described by Mathews and Zwank, would become obsolete.
For now, until all providers enter the workforce with basic competency in POCUS and medical culture accepts that ultrasound is a diagnostic tool available to any trained provider, hospitalists may need to provide proof of their competence through intramural or extramural certification. The work of Mathews and Zwank provides an example of how local certification processes can be established. In a future edition of the Journal of Hospital Medicine, the Society of Hospital Medicine Point-of-Care Ultrasound Task Force will present a position statement with recommendations for certification of competency in bedside ultrasound-guided procedures.
Disclosure
Nilam Soni receives support from the U.S. Department of Veterans Affairs, Quality Enhancement Research Initiative (QUERI) Partnered Evaluation Initiative Grant (HX002263-01A1). Brian P. Lucas receives support from the Department of Veterans Affairs, Veterans Health Administration, Office of Research and Development and Dartmouth SYNERGY, National Institutes of Health, National Center for Translational Science (UL1TR001086). The contents of this publication do not represent the views of the U.S. Department of Veterans Affairs or the United States Government.
1. Bahner DP, Hughes D, Royall NA. I-AIM: a novel model for teaching and performing focused sonography. J Ultrasound Med. 2012;31:295-300. PubMed
2. Mathews BK, Zwank M. Hospital Medicine Point of Care Ultrasound Credentialing: An Example Protocol. J Hosp Med. 2017;12(9):767-772. PubMed
3. Hall MK, Hall J, Gross CP, et al. Use of Point-of-Care Ultrasound in the Emergency Department: Insights From the 2012 Medicare National Payment Data Set. J Ultrasound Med. 2016;35:2467-2474. PubMed
4. Amini R, Wyman MT, Hernandez NC, Guisto JA, Adhikari S. Use of Emergency Ultrasound in Arizona Community Emergency Departments. J Ultrasound Med. 2017;36(5):913-921. PubMed
5. Herbst MK, Camargo CA, Jr., Perez A, Moore CL. Use of Point-of-Care Ultrasound in Connecticut Emergency Departments. J Emerg Med. 2015;48:191-196. PubMed
6. Kory PD, Pellecchia CM, Shiloh AL, Mayo PH, DiBello C, Koenig S. Accuracy of ultrasonography performed by critical care physicians for the diagnosis of DVT. Chest. 2011;139:538-542. PubMed
7. Lucas BP, Candotti C, Margeta B, et al. Hand-carried echocardiography by hospitalists: a randomized trial. Am J Med. 2011;124:766-774. PubMed
8. Oks M, Cleven KL, Cardenas-Garcia J, et al. The effect of point-of-care ultrasonography on imaging studies in the medical ICU: a comparative study. Chest. 2014;146:1574-1577. PubMed
9. Koenig S, Chandra S, Alaverdian A, Dibello C, Mayo PH, Narasimhan M. Ultrasound assessment of pulmonary embolism in patients receiving CT pulmonary angiography. Chest. 2014;145:818-823. PubMed
10. Mercaldi CJ, Lanes SF. Ultrasound guidance decreases complications and improves the cost of care among patients undergoing thoracentesis and paracentesis. Chest. 2013;143:532-538. PubMed
11. Patel PA, Ernst FR, Gunnarsson CL. Ultrasonography guidance reduces complications and costs associated with thoracentesis procedures. J Clin Ultrasound. 2012;40:135-141. PubMed
12. Stolz L, O’Brien KM, Miller ML, Winters-Brown ND, Blaivas M, Adhikari S. A review of lawsuits related to point-of-care emergency ultrasound applications. West J Emerg Med. 2015;16:1-4. PubMed
13. Blaivas M, Pawl R. Analysis of lawsuits filed against emergency physicians for point-of-care emergency ultrasound examination performance and interpretation over a 20-year period. Am J Emerg Med. 2012;30:338-341. PubMed
14. Bahner DP, Goldman E, Way D, Royall NA, Liu YT. The state of ultrasound education in U.S. medical schools: results of a national survey. Acad Med. 2014;89:1681-1686. PubMed
Any conversation about point-of-care ultrasound (POCUS) inevitably brings up discussion about credentialing, privileging, and certification. While credentialing and privileging are institution-specific processes, competency certification can be extramural through a national board or intramural through an institutional process.
Some institutions have begun to develop intramural certification pathways for POCUS competency in order to grant privileges to hospitalists. In this edition of the Journal of Hospital Medicine, Mathews and Zwank2 describe a multidisciplinary collaboration to provide POCUS training, intramural certification, and quality assurance for hospitalists at one hospital in Minnesota. This model serves as a real-world example of how institutions are addressing the need to certify hospitalists in basic POCUS competency. After engaging stakeholders from radiology, critical care, emergency medicine, and cardiology, institutional standards were developed and hospitalists were assessed for basic POCUS competency. Certification included assessments of hospitalists’ knowledge, image acquisition, and image interpretation skills. The model described by Mathews did not assess competency in clinical integration but laid the groundwork for future evaluation of clinical outcomes in the cohort of certified hospitalists.
Although experts may not agree on all aspects of competency in POCUS, most will agree with the basic principles outlined by Mathews and Zwank. Initial certification should be based on training and an initial assessment of competency. Components of training should include ultrasound didactics, mentored hands-on practice, independent hands-on practice, and image interpretation practice. Ongoing certification should be based on quality assurance incorporated with an ongoing assessment of skills. Additionally, most experts will agree that competency can be recognized, and formative and summative assessments that combine a gestalt of provider skills with quantitative scoring systems using checklists are likely the best approach.
The real question is, what is the goal of certification of POCUS competency? Development of an institutional certification process demands substantive resources of the institution and time of the providers. Institutions would have to invest in equipment and staff to operate a full-time certification program, given the large number of providers that use POCUS and justify why substantive resources are being dedicated to certify POCUS skills and not others. Providers may be dissuaded from using POCUS if certification requirements are burdensome, which has potential negative consequences, such as reverting back to performing bedside procedures without ultrasound guidance or referring all patients to interventional radiology.
Conceptually, one may speculate that certification is required for providers to bill for POCUS exams, but certification is not required to bill, although institutions may require certification before granting privileges to use POCUS. However, based on the emergency medicine experience, a specialty that has been using POCUS for more than 20 years, billing may not be the main driver of POCUS use. A recent review of 2012 Medicare data revealed that <1% of emergency medicine providers received reimbursement for limited ultrasound exams.3 Despite the Accreditation Council for Graduate Medical Education (ACGME) requirement for POCUS competency of all graduating emergency medicine residents since 2001 and the increasing POCUS use reported by emergency medicine physicians,4,5 most emergency medicine physicians are not billing for POCUS exams. Maybe use of POCUS as a “quick look” or extension of the physical examination is more common than previously thought. Although billing for POCUS exams can generate some clinical revenue, the benefits for the healthcare system by expediting care,6,7 reducing ancillary testing,8,9 and reducing procedural complications10,11 likely outweigh the small gains from billing for limited ultrasound exams. As healthcare payment models evolve to reward healthcare systems that achieve good outcomes rather than services rendered, certification for the sole purpose of billing may become obsolete. Furthermore, concerns about billing increasing medical liability from using POCUS are likely overstated because few lawsuits have resulted from missed diagnoses by POCUS, and most lawsuits have been from failure to perform a POCUS exam in a timely manner.12,13
Many medical students graduating today have had some training in POCUS14 and, as this new generation of physicians enters the workforce, they will likely view POCUS as part of their routine bedside evaluation of patients. If POCUS training is integrated into medical school and residency curricula, and national board certification incorporates basic POCUS competency, then most institutions may no longer feel obligated to certify POCUS competency locally, and institutional certification programs, such as the one described by Mathews and Zwank, would become obsolete.
For now, until all providers enter the workforce with basic competency in POCUS and medical culture accepts that ultrasound is a diagnostic tool available to any trained provider, hospitalists may need to provide proof of their competence through intramural or extramural certification. The work of Mathews and Zwank provides an example of how local certification processes can be established. In a future edition of the Journal of Hospital Medicine, the Society of Hospital Medicine Point-of-Care Ultrasound Task Force will present a position statement with recommendations for certification of competency in bedside ultrasound-guided procedures.
Disclosure
Nilam Soni receives support from the U.S. Department of Veterans Affairs, Quality Enhancement Research Initiative (QUERI) Partnered Evaluation Initiative Grant (HX002263-01A1). Brian P. Lucas receives support from the Department of Veterans Affairs, Veterans Health Administration, Office of Research and Development and Dartmouth SYNERGY, National Institutes of Health, National Center for Translational Science (UL1TR001086). The contents of this publication do not represent the views of the U.S. Department of Veterans Affairs or the United States Government.
1. Bahner DP, Hughes D, Royall NA. I-AIM: a novel model for teaching and performing focused sonography. J Ultrasound Med. 2012;31:295-300. PubMed
2. Mathews BK, Zwank M. Hospital Medicine Point of Care Ultrasound Credentialing: An Example Protocol. J Hosp Med. 2017;12(9):767-772. PubMed
3. Hall MK, Hall J, Gross CP, et al. Use of Point-of-Care Ultrasound in the Emergency Department: Insights From the 2012 Medicare National Payment Data Set. J Ultrasound Med. 2016;35:2467-2474. PubMed
4. Amini R, Wyman MT, Hernandez NC, Guisto JA, Adhikari S. Use of Emergency Ultrasound in Arizona Community Emergency Departments. J Ultrasound Med. 2017;36(5):913-921. PubMed
5. Herbst MK, Camargo CA, Jr., Perez A, Moore CL. Use of Point-of-Care Ultrasound in Connecticut Emergency Departments. J Emerg Med. 2015;48:191-196. PubMed
6. Kory PD, Pellecchia CM, Shiloh AL, Mayo PH, DiBello C, Koenig S. Accuracy of ultrasonography performed by critical care physicians for the diagnosis of DVT. Chest. 2011;139:538-542. PubMed
7. Lucas BP, Candotti C, Margeta B, et al. Hand-carried echocardiography by hospitalists: a randomized trial. Am J Med. 2011;124:766-774. PubMed
8. Oks M, Cleven KL, Cardenas-Garcia J, et al. The effect of point-of-care ultrasonography on imaging studies in the medical ICU: a comparative study. Chest. 2014;146:1574-1577. PubMed
9. Koenig S, Chandra S, Alaverdian A, Dibello C, Mayo PH, Narasimhan M. Ultrasound assessment of pulmonary embolism in patients receiving CT pulmonary angiography. Chest. 2014;145:818-823. PubMed
10. Mercaldi CJ, Lanes SF. Ultrasound guidance decreases complications and improves the cost of care among patients undergoing thoracentesis and paracentesis. Chest. 2013;143:532-538. PubMed
11. Patel PA, Ernst FR, Gunnarsson CL. Ultrasonography guidance reduces complications and costs associated with thoracentesis procedures. J Clin Ultrasound. 2012;40:135-141. PubMed
12. Stolz L, O’Brien KM, Miller ML, Winters-Brown ND, Blaivas M, Adhikari S. A review of lawsuits related to point-of-care emergency ultrasound applications. West J Emerg Med. 2015;16:1-4. PubMed
13. Blaivas M, Pawl R. Analysis of lawsuits filed against emergency physicians for point-of-care emergency ultrasound examination performance and interpretation over a 20-year period. Am J Emerg Med. 2012;30:338-341. PubMed
14. Bahner DP, Goldman E, Way D, Royall NA, Liu YT. The state of ultrasound education in U.S. medical schools: results of a national survey. Acad Med. 2014;89:1681-1686. PubMed
© 2017 Society of Hospital Medicine
A Video Is Worth a Thousand Words
There is no doubt about the importance of assessing, documenting, and honoring patient wishes regarding care. For hospitalized patients, code status is a critical treatment preference to document given that the need for cardiopulmonary resuscitation (CPR) arises suddenly, outcomes are often poor, and the default is for patients to receive the treatment unless they actively decline it. Hospitalists are expected to document code status for every hospitalized patient, but admission code status conversations are often brief—and that might be all right. A code status discussion for a 70-year-old man with no chronic medical problems and excellent functional status who has been admitted for pain after a motor vehicle accident may require only an introduction to the concept of advance care planning, the importance of having a surrogate, and confirmation of full code status. On the other hand, a 45-year-old woman with metastatic pancreatic cancer would likely benefit from a family meeting in which the hospitalist could review her disease course and prognosis, assess her values and priorities in the context of her advanced illness, make treatment recommendations—including code status—that are consistent with her values, and elicit questions.1,2 We need to free up hospitalists from spending time discussing code status with every patient so that they can spend more time in quality goals of care discussions with seriously ill patients. The paradigm of the one doctor—one patient admission code status conversation for every patient is no longer realistic.
As reported by Merino and colleagues in this issue of JHM, video decision aids about CPR for hospitalized patients can offer an innovative solution to determining code status for hospitalized patients.3 The authors conducted a prospective, randomized controlled trial, which enrolled older adults admitted to the hospital medicine service at the Veteran’s Administration (VA) Hospital in Minneapolis. Participants (N = 119) were randomized to usual care or to watch a 6-minute video that explained code status options, used a mannequin to illustrate a mock code, and provided information about potential complications and survival rates. Patients who watched the video were more likely to choose do not resuscitate/do not intubate status, with a large effect size (56% in the intervention group vs. 17% in the control group, P < 0.00001).
This study adds to a growing body of literature about this powerful modality to assist with advanced care planning. Over the past 10 years, studies—conducted primarily by Volandes, El-Jawahri, and colleagues—have demonstrated how video decision aids impact the care that patients want in the setting of cancer, heart failure, serious illness with short prognosis, and future dementia.4-9 This literature has also shown that video decision aids can increase patients’ knowledge about CPR and increase the stability of decisions over time. Further, video decision aids have been well accepted by patients, who report that they would recommended such videos to others. This body of evidence underscores the potential of video decision aids to improve concordance between patient preferences and care provided, which is key given the longstanding and widespread concern about patients receiving care that is inconsistent with their values at the end of life.10 In short, video decision aids work.
Merino and colleagues are the first to examine the use of a video decision aid about code status in a general population of older adults on a hospital medicine service and the second to integrate such a video into usual inpatient care, which are important advancements.2,3 There are several issues that warrant further consideration prior to widely disseminating such a video, however. As the authors note, the participants in this VA study were overwhelmingly white men and their average age was 75. Further, the authors found a nonsignificant trend towards patients in the intervention group having less trust that “my doctors and healthcare team want what is best for me” (76% in the intervention group vs. 93% in the control group; P = 0.083). Decision making about life-sustaining therapies and reactions to communication about serious illness are heavily influenced by cultural and socioeconomic factors, including health literacy.11 It will be important to seek feedback from a diverse group of patients and families to ensure that the video decision aid is interpreted accurately, renders decisions that are consistent with patients’ values, and does not negatively impact the clinician-patient relationship.12 Additionally, as the above cases illustrate, code status discussions should be tailored to patient factors, including illness severity and point in the disease course. Hospitalists will ultimately benefit from having access to multiple different videos about a range of advance care planning topics that can be used when appropriate.
In addition to selecting the right video for the right patient, the next challenge for hospitalists and health systems will be how to implement them within real-world clinical care and a broader approach to advance care planning. There are technical and logistical challenges to displaying videos in hospital rooms, and more significant challenges in ensuring timely follow-up discussions, communication of patients’ dynamic care preferences to their surrogates, changes to inpatient orders, documentation in the electronic medical record where it can be easily found in the future, and completion of advance directives and Physician Orders for Life Sustaining Treatment forms to communicate patients’ goals of care beyond the hospital and health system. Each of these steps is critical and is supported through videos and activities in the free, patient-facing, PREPARE web-based tool (https://www.prepareforyourcare.org/).2,13,14
The ubiquitous presence of videos in our lives speaks to their power to engage and affect us. Video decision aids provide detailed explanations and vivid images that convey more than words can alone. While there is more work to be done to ensure videos are appropriate for all hospitalized patients and support rather than detract from patient-doctor relationships, this study and others like it show that video decision aids are potent tools to promote better decision-making and higher value, more efficient care.
Disclosures
The authors have nothing to disclose.
1. Piscator E, Hedberg P, Göransson K, Djärv T. Survival after in-hospital cardiac arrest is highly associated with the Age-combined Charlson Co-morbidity Index in a cohort study from a two-site Swedish University hospital. Resuscitation. 2016;99:79-83. PubMed
2. Jain A, Corriveau S, Quinn K, Gardhouse A, Vegas DB, You JJ. Video decision aids to assist with advance care planning: a systematic review and meta-analysis. BMJ Open. 2015;5(6):e007491. PubMed
3. Merino AM, Greiner R, Hartwig K. A randomized controlled trial of a CPR decision support video for patients admitted to the general medicine service. J Hosp Med. 2017:12(9):700-704. PubMed
4. Volandes AE, Levin TT, Slovin S, Carvajal RD, O’Reilly EM, et al. Augmenting advance care planning in poor prognosis cancer with a video decision aid: a preintervention-postintervention study. Cancer. 2012;118(17):4331-4338. PubMed
5. El-Jawahri A, Paasche-Orlow MK, Matlock D, Stevenson LW, Lewis EF, Stewart G, et al. Randomized, ontrolled trial of an advance care planning video decision support tool for patients with advanced heart failure. Circulation. 2016;134(1):52-60. PubMed
6. El-Jawahri A, Mitchell SL, Paasche-Orlow MK, Temel JS, Jackson VA, Rutledge RR, et al. A randomized controlled trial of a CPR and intubation video decision support tool for hospitalized patients. J Gen Intern Med. 2015;30(8):1071-1080. PubMed
7. Volandes AE, Ferguson LA, Davis AD, Hull NC, Green MJ, Chang Y, et al. Assessing end-of-life preferences for advanced dementia in rural patients using an educational video: a randomized controlled trial. J Palliat Med. 2011;14(2):169-177. PubMed
8. Volandes AE, Paasche-Orlow MK, Barry MJ, Gillick MR, Minaker KL, Chang Y, et al. Video decision support tool for advance care planning in dementia: randomised controlled trial. BMJ. 2009;338:b2159. PubMed
9. El-Jawahri A, Podgurski LM, Eichler AF, Plotkin SR, Temel JS, Mitchell SL, et al. Use of video to facilitate end-of-life discussions with patients with cancer: a randomized controlled trial. J Clin Oncol. 2010;28(2):305-310. PubMed
10. IOM (Institute of Medicine). Dying in America: Improving Quality and Honoring Individual Preferences Near the End of Life. Washington, DC: The National Academies Press; 2015. PubMed
11. Castillo LS, Williams BA, Hooper SM, Sabatino CP, Weithorn LA, Sudore RL. Lost in translation: the unintended consequences of advance directive law on clinical care. Ann Intern Med. 2011;154(2):121-128. PubMed
12. Anderson WG, Cimino JW, Lo B. Seriously ill hospitalized patients’ perspectives on the benefits and harms of two models of hospital CPR discussions. Patient Educ Couns. 2013;93(3):633-640. PubMed
13. Sudore RL, Boscardin J, Feuz MA, McMahan RD, Katen MT, Barnes DE. Effect of the PREPARE website vs an easy-to-read advance directive on advance care planning documentation and engagement among veterans: a randomized clinical trial [published online ahead of print May 18, 2017]. JAMA Intern Med. 2017; May 18. doi: 10.1001/jamainternmed.20171607. PubMed
14. Improving Communication about Serious Illness: Implementation Toolkit. SHM Center for Quality Improvement. Society of Hospital Medicine. 2017. http://www.hospitalmedicine.org/Web/Quality___Innovation/Implementation_Toolkit/EOL/Palliative_Care_Home_Society_of_Hospital_Medicine.aspx. Accessed June 13, 2017.
There is no doubt about the importance of assessing, documenting, and honoring patient wishes regarding care. For hospitalized patients, code status is a critical treatment preference to document given that the need for cardiopulmonary resuscitation (CPR) arises suddenly, outcomes are often poor, and the default is for patients to receive the treatment unless they actively decline it. Hospitalists are expected to document code status for every hospitalized patient, but admission code status conversations are often brief—and that might be all right. A code status discussion for a 70-year-old man with no chronic medical problems and excellent functional status who has been admitted for pain after a motor vehicle accident may require only an introduction to the concept of advance care planning, the importance of having a surrogate, and confirmation of full code status. On the other hand, a 45-year-old woman with metastatic pancreatic cancer would likely benefit from a family meeting in which the hospitalist could review her disease course and prognosis, assess her values and priorities in the context of her advanced illness, make treatment recommendations—including code status—that are consistent with her values, and elicit questions.1,2 We need to free up hospitalists from spending time discussing code status with every patient so that they can spend more time in quality goals of care discussions with seriously ill patients. The paradigm of the one doctor—one patient admission code status conversation for every patient is no longer realistic.
As reported by Merino and colleagues in this issue of JHM, video decision aids about CPR for hospitalized patients can offer an innovative solution to determining code status for hospitalized patients.3 The authors conducted a prospective, randomized controlled trial, which enrolled older adults admitted to the hospital medicine service at the Veteran’s Administration (VA) Hospital in Minneapolis. Participants (N = 119) were randomized to usual care or to watch a 6-minute video that explained code status options, used a mannequin to illustrate a mock code, and provided information about potential complications and survival rates. Patients who watched the video were more likely to choose do not resuscitate/do not intubate status, with a large effect size (56% in the intervention group vs. 17% in the control group, P < 0.00001).
This study adds to a growing body of literature about this powerful modality to assist with advanced care planning. Over the past 10 years, studies—conducted primarily by Volandes, El-Jawahri, and colleagues—have demonstrated how video decision aids impact the care that patients want in the setting of cancer, heart failure, serious illness with short prognosis, and future dementia.4-9 This literature has also shown that video decision aids can increase patients’ knowledge about CPR and increase the stability of decisions over time. Further, video decision aids have been well accepted by patients, who report that they would recommended such videos to others. This body of evidence underscores the potential of video decision aids to improve concordance between patient preferences and care provided, which is key given the longstanding and widespread concern about patients receiving care that is inconsistent with their values at the end of life.10 In short, video decision aids work.
Merino and colleagues are the first to examine the use of a video decision aid about code status in a general population of older adults on a hospital medicine service and the second to integrate such a video into usual inpatient care, which are important advancements.2,3 There are several issues that warrant further consideration prior to widely disseminating such a video, however. As the authors note, the participants in this VA study were overwhelmingly white men and their average age was 75. Further, the authors found a nonsignificant trend towards patients in the intervention group having less trust that “my doctors and healthcare team want what is best for me” (76% in the intervention group vs. 93% in the control group; P = 0.083). Decision making about life-sustaining therapies and reactions to communication about serious illness are heavily influenced by cultural and socioeconomic factors, including health literacy.11 It will be important to seek feedback from a diverse group of patients and families to ensure that the video decision aid is interpreted accurately, renders decisions that are consistent with patients’ values, and does not negatively impact the clinician-patient relationship.12 Additionally, as the above cases illustrate, code status discussions should be tailored to patient factors, including illness severity and point in the disease course. Hospitalists will ultimately benefit from having access to multiple different videos about a range of advance care planning topics that can be used when appropriate.
In addition to selecting the right video for the right patient, the next challenge for hospitalists and health systems will be how to implement them within real-world clinical care and a broader approach to advance care planning. There are technical and logistical challenges to displaying videos in hospital rooms, and more significant challenges in ensuring timely follow-up discussions, communication of patients’ dynamic care preferences to their surrogates, changes to inpatient orders, documentation in the electronic medical record where it can be easily found in the future, and completion of advance directives and Physician Orders for Life Sustaining Treatment forms to communicate patients’ goals of care beyond the hospital and health system. Each of these steps is critical and is supported through videos and activities in the free, patient-facing, PREPARE web-based tool (https://www.prepareforyourcare.org/).2,13,14
The ubiquitous presence of videos in our lives speaks to their power to engage and affect us. Video decision aids provide detailed explanations and vivid images that convey more than words can alone. While there is more work to be done to ensure videos are appropriate for all hospitalized patients and support rather than detract from patient-doctor relationships, this study and others like it show that video decision aids are potent tools to promote better decision-making and higher value, more efficient care.
Disclosures
The authors have nothing to disclose.
1. Piscator E, Hedberg P, Göransson K, Djärv T. Survival after in-hospital cardiac arrest is highly associated with the Age-combined Charlson Co-morbidity Index in a cohort study from a two-site Swedish University hospital. Resuscitation. 2016;99:79-83. PubMed
2. Jain A, Corriveau S, Quinn K, Gardhouse A, Vegas DB, You JJ. Video decision aids to assist with advance care planning: a systematic review and meta-analysis. BMJ Open. 2015;5(6):e007491. PubMed
3. Merino AM, Greiner R, Hartwig K. A randomized controlled trial of a CPR decision support video for patients admitted to the general medicine service. J Hosp Med. 2017:12(9):700-704. PubMed
4. Volandes AE, Levin TT, Slovin S, Carvajal RD, O’Reilly EM, et al. Augmenting advance care planning in poor prognosis cancer with a video decision aid: a preintervention-postintervention study. Cancer. 2012;118(17):4331-4338. PubMed
5. El-Jawahri A, Paasche-Orlow MK, Matlock D, Stevenson LW, Lewis EF, Stewart G, et al. Randomized, ontrolled trial of an advance care planning video decision support tool for patients with advanced heart failure. Circulation. 2016;134(1):52-60. PubMed
6. El-Jawahri A, Mitchell SL, Paasche-Orlow MK, Temel JS, Jackson VA, Rutledge RR, et al. A randomized controlled trial of a CPR and intubation video decision support tool for hospitalized patients. J Gen Intern Med. 2015;30(8):1071-1080. PubMed
7. Volandes AE, Ferguson LA, Davis AD, Hull NC, Green MJ, Chang Y, et al. Assessing end-of-life preferences for advanced dementia in rural patients using an educational video: a randomized controlled trial. J Palliat Med. 2011;14(2):169-177. PubMed
8. Volandes AE, Paasche-Orlow MK, Barry MJ, Gillick MR, Minaker KL, Chang Y, et al. Video decision support tool for advance care planning in dementia: randomised controlled trial. BMJ. 2009;338:b2159. PubMed
9. El-Jawahri A, Podgurski LM, Eichler AF, Plotkin SR, Temel JS, Mitchell SL, et al. Use of video to facilitate end-of-life discussions with patients with cancer: a randomized controlled trial. J Clin Oncol. 2010;28(2):305-310. PubMed
10. IOM (Institute of Medicine). Dying in America: Improving Quality and Honoring Individual Preferences Near the End of Life. Washington, DC: The National Academies Press; 2015. PubMed
11. Castillo LS, Williams BA, Hooper SM, Sabatino CP, Weithorn LA, Sudore RL. Lost in translation: the unintended consequences of advance directive law on clinical care. Ann Intern Med. 2011;154(2):121-128. PubMed
12. Anderson WG, Cimino JW, Lo B. Seriously ill hospitalized patients’ perspectives on the benefits and harms of two models of hospital CPR discussions. Patient Educ Couns. 2013;93(3):633-640. PubMed
13. Sudore RL, Boscardin J, Feuz MA, McMahan RD, Katen MT, Barnes DE. Effect of the PREPARE website vs an easy-to-read advance directive on advance care planning documentation and engagement among veterans: a randomized clinical trial [published online ahead of print May 18, 2017]. JAMA Intern Med. 2017; May 18. doi: 10.1001/jamainternmed.20171607. PubMed
14. Improving Communication about Serious Illness: Implementation Toolkit. SHM Center for Quality Improvement. Society of Hospital Medicine. 2017. http://www.hospitalmedicine.org/Web/Quality___Innovation/Implementation_Toolkit/EOL/Palliative_Care_Home_Society_of_Hospital_Medicine.aspx. Accessed June 13, 2017.
© 2017 Society of Hospital Medicine
Hospital Medicine Point of Care Ultrasound Credentialing: An Example Protocol
Ultrasound has been used for decades by radiology, obstetrics-gynecology, and cardiology departments within a comprehensive paradigm in which a physician enters an order, then a trained sonographer performs the study, followed by a physician evaluating and interpreting the images.1 Unlike the traditional comprehensive paradigm, point-of-care ultrasound (POCUS) is a focused study that is both performed and interpreted by the bedside provider.2 POCUS has been demonstrated to improve diagnosis and clinical management in multiple studies.3-15
The scope of practice in POCUS differs by specialty, as POCUS is done to achieve specific procedural aims (eg, direct the needle to the correct location) or answer focused questions (eg, does the patient have a distended bladder?) related to the specialty. POCUS in hospital medicine (HM) provides immediate answers, without the delay and potential risk of transportation to other hospital areas. It may be used to diagnose pleural effusion, pneumonia, hydronephrosis, heart failure, deep vein thrombosis, and many other pathologies.5-15 It is important to understand that POCUS performed by HM is a limited study and is not a substitute for more complete ultrasound examinations conducted in the radiology suite or in the echocardiography lab.
POCUS should not be used exclusively in medical decision making, but rather in conjunction with the greater clinical context of each patient, building on established principles of diagnosis and management.
DEFINITIONS
- Credentialing: An umbrella term, which incorporates licensure, education, and certification.
- Privileging: Used to define the scope authorized for a provider by a healthcare organization based on an evaluation of the individual’s credentials and performance.
- Competency: An observable ability of a provider, integrating multiple components, such as knowledge and skills. Since competencies are observable, they can be measured and assessed to ensure their acquisition.
- Certification: The process by which an association grants recognition to a provider who has met certain predetermined qualifications specified by the association. Competence is distinguished from certification, which is defined as the process by which competence is recognized by an external agency.
All of the above mechanisms work together to provide the highest quality of reliability that a practitioner is providing safe, competent care.16-18
STATEMENTS FROM MAJOR SPECIALTY SOCIETIES
Acknowledging that there are no published guidelines in the realm of HM POCUS, the development of the credentialing process at our institution is consistent with published guidelines by Emergency Medicine societies (the most established physician users of POCUS) and the American Medical Association (AMA).19-21
The use of emergency ultrasound by physicians in the emergency department is endorsed by the American College of Emergency Physicians (ACEP).19 ACEP, along with the Society of Academic Emergency Medicine (SAEM), recommends that training in the performance and interpretation of ultrasound imaging be included during residency.20 ACEP and SAEM add that the availability of equivalent training should be made available to practicing physicians. The American Society of Echocardiography has supported the use of POCUS and sees this modality as part of the continuum of care.23,24
The AMA has also recognized that POCUS is within the scope of practice of trained physicians.22 The AMA further recommended hospital staff create their own criteria for granting ultrasound privileges based on the background and training of the physician and in accordance with the standards set within specific specialties.22,23
LOCAL POLICY AND PROCEDURE
The provision of clinical privileges in HM is governed by the rules and regulations of the department and institution for which privileges are sought. In detailing our policies and procedures above, we intend to provide an example for HM departments at other institutions that are attempting to create a POCUS credentialing program.
An interdisciplinary approach was created by our institution to address training, competency, and ongoing quality assurance (QA) concerns due to the increasing popularity of POCUS and variability in its use. We developed a hospital-wide POCUS committee with, among others, members from HM, emergency medicine, critical care, radiology, and cardiology, with a charter to standardize POCUS across departments. After review of the literature,16-18, 20, 21, 23-74 baseline training requirements were established for credentialing and developing a unified delineation of privileges for hospital-wide POCUS. The data support the use of a variety of assessments to ensure a provider has developed competence (portfolio development, knowledge-based examination, skills-based assessment, ongoing QA process). The POCUS committee identified which exams could be performed at bedside for credentialed providers, delineated imaging requirements for each exam, and set up the information technology infrastructure to support ordering and reporting through electronic health records (EHR). While the POCUS committee delineated this process for all hospital providers, we will focus our discussion on the credentialing policy and procedure in HM.
STEP 1: PATHWAY TO POCUS CREDENTIALING IN HM: COMPLETE MINIMAL FORMAL REQUIREMENTS
The credentialing requirements at our institution include one of the the following basic education pathways and minimal formal training:
Residency/Fellowship Based Pathway
Completed training in an Accreditation Council for Graduate Medical Education–approved program that provided opportunities for 20 hours of POCUS training with at least 6 hours of hands-on ultrasound scanning, 5 proctored limited cardiac ultrasound cases and portfolio development.
Practice Based Pathway
Completed 20 hours of POCUS continuing medical education (CME) with at least 6 hours of hands-on ultrasound scanning and has completed 5 proctored limited cardiac ultrasound cases (as part of CME).
The majority of HM providers had little formal residency training in POCUS, so a training program needed to be developed. Our training program, modeled after the American College of Chest Physicians’ CHEST certificate of completion,86 utilizes didactic training, hands-on instruction, and portfolio development that fulfills the minimal formal requirements in the practice-based pathway.

STEP 2: PATHWAY TO POCUS CREDENTIALING IN HM: COMPLETE PORTFOLIO AND FINAL ASSESSMENTS (KNOWLEDGE AND SKILLS–BASED)
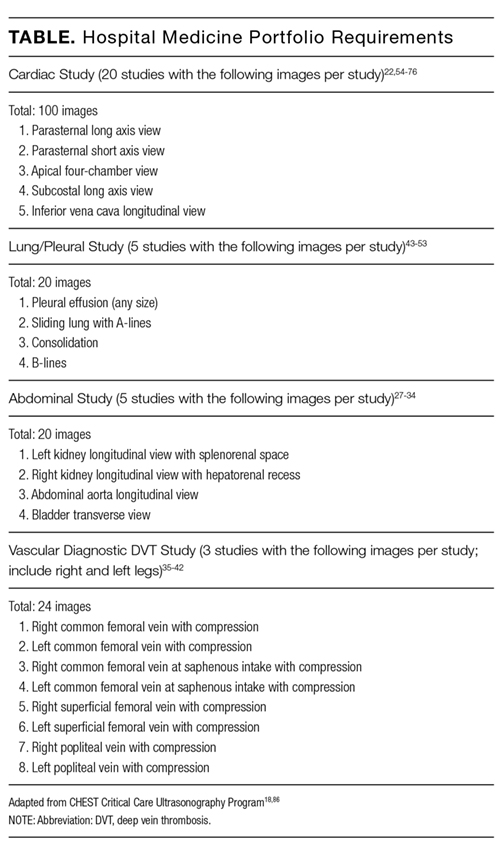
After satisfactory completion of the minimal formal training, applicants need to provide documentation of a set number of cases. To aid this requirement, our HM department developed the portfolio guidelines in the Table. These are minimum requirements, and because of the varying training curves of learning,76-80 1 hospitalist may need to submit 300 files for review to meet the standards, while another may need to submit 500 files. Submissions are not accepted unless they yield high-quality video files with meticulous attention to gain, depth, and appropriate topographic planes. The portfolio development monitors hospitalists’ progression during their deliberate practice, providing objective assessments, feedback, and mentorship.81,82
A final knowledge exam with case-based image interpretation and hands-on examination is also provided. The passing score for the written examination is 85% and was based on the Angoff methodology.75 Providers who meet these requirements are then able to apply for POCUS credentialing in HM. Providers who do not pass the final assessments are required to participate in further training before they reattempt the assessments. There is uniformity in training outcomes but diversity in training time for POCUS providers.
Candidates who complete the portfolio and satisfactorily pass the final assessments are credentialed after review by the POCUS committee. Credentialed physicians are then able to perform POCUS and to integrate the findings into patient care.
MAINTENANCE OF CREDENTIALS
Documentation
After credentialing is obtained, all POCUS studies used in patient care are included in the EHR following a clearly defined workflow. The study is ordered through the EHR and is retrieved wirelessly on the ultrasound machine. After performing the ultrasound, all images are wirelessly transferred to the radiology Picture Archiving and Communication System server. Standardized text reports are used to distinguish focused POCUS from traditional diagnostic ultrasound studies. Documentation is optimized using electronic drop-down menus for documenting ultrasound findings in the EHR.
Minimum Number of Examinations
Maintenance of credentials will require that each hospitalist perform 10 documented ultrasounds per year for each cardiac and noncardiac application for which credentials are requested. If these numbers are not met, then all the studies performed during the previous year will be reviewed by the ultrasound committee, and providers will be provided with opportunities to meet the minimum benchmark (supervised scanning sessions).
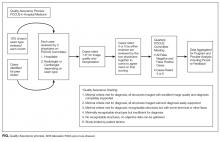
Quality Assurance
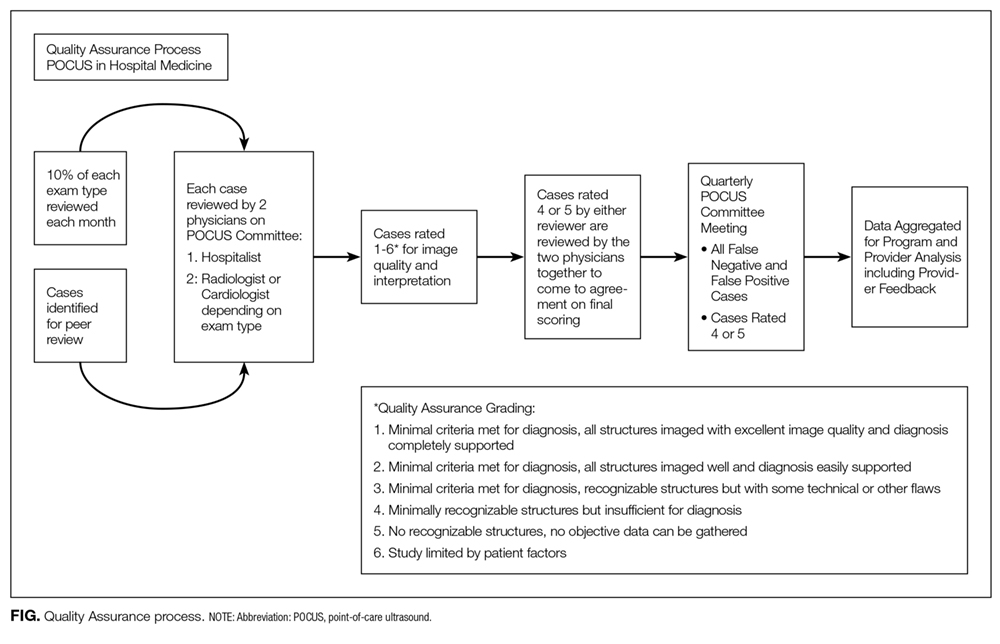
Establishing scope of practice, developing curricula, and credentialing criteria are important steps toward assuring provider competence.16,17,22,74 To be confident that providers are using POCUS appropriately, there must also be a development of standards of periodic assessment that encompass both examination performance and interpretation. The objective of a QA process is to evaluate the POCUS cases for technical competence and the interpretations for clinical accuracy, and to provide feedback to improve performance of providers.
QA is maintained through the interdisciplinary POCUS committee and is described in the Figure.
After initial credentialing, continued QA of HM POCUS is done for a proportion of ongoing exams (10% as per recommendations by ACEP) to document continued competency.2 Credentialed POCUS providers perform and document their exam and interpretations. Ultrasound interpretations are reviewed by the POCUS committee (every case by 2 physicians, 1 hospitalist, and 1 radiologist or cardiologist depending on the study type) at appropriate intervals based on volume (at minimum, quarterly). A standardized review form is used to grade images and interpretations. This is the same general rubric used with the portfolio for initial credentialing. Each case is scored on a scale of 1 to 6, with 1 representing high image quality and support for diagnosis and 6 representing studies limited by patient factors. All scores rated 4 or 5 are reviewed at the larger quarterly POCUS committee meetings. For any provider scoring a 4 or 5, the ultrasound committee will recommend a focused professional practice evaluation as it pertains to POCUS. The committee will also make recommendations on a physician’s continued privileges to the department leaders.83
BILLING
Coding, billing, and reimbursement for focused ultrasound has been supported through the AMA Physicians’ Current Procedural Terminology (CPT) 2011 codes, which includes CPT code modifiers for POCUS.84 There are significant costs associated with building a HM ultrasound program, including the education of hospitalists, ultrasound equipment purchase and maintenance, as well as image archiving and QA. The development of a HM ultrasound billing program can help justify and fund these costs.19,85
To appropriately bill for POCUS, permanently retrievable images and an interpretation document need to be available for review. HM coders are instructed to only bill if both components are available. Because most insurers will not pay for 2 of the same type of study performed within a 24-hour period, coders do not bill for ultrasounds when a comprehensive ultrasound of the same body region is performed within a 24-hour period. The workflow that we have developed, including ordering, performing, and documenting, allows for easy coding and billing.
BARRIERS AND LIMITATIONS
While POCUS has a well-established literature base in other specialties like emergency medicine, it has been a relatively recent addition to the HM specialty. As such, there exists a paucity of evidence-based medicine to support its use of POCUS in HM. While it is tempting to extrapolate from the literature of other specialties, this may not be a valid approach.
Training curves in which novice users of ultrasound become competent in specific applications are incompletely understood. Little research describes the rate of progression of learners in ultrasound towards competency. We have recently started the QA process and hope that the data will further guide feedback to the process.
Additionally, with the portfolios, the raters’ expertise may not be stable (develops through experience). We aim to mitigate this by having a group of raters reviewing each file, particularly if there is a question about if a submission is of high image quality. A notable barrier that groups face is support from their leadership regarding POCUS. Our group has had support from the chief medical officer who helped mandate the development of POCUS standards.
LESSONS LEARNED
We have developed a robust collaborative HM POCUS program. We have noted challenges in motivating all providers to work through this protocol. Development of a POCUS program takes dedicated time, and without a champion, it is at risk for failing. HM departments would be advised to seek out willing collaborators at their institutions. We have seen that it is useful to partner with some experienced emergency medicine providers. Additionally, portfolio development and feedback has been key to demonstrating growth in image acquisition. Deliberate longitudinal practice with feedback and successive refinements with POCUS obtain the highest yield towards competency. We hope our QA data will provide further feedback into the credentialing policy and procedure.
SUMMARY
It is important that POCUS users work together to recognize its potential and limitations, teach current and future care providers’ best practices, and create an infrastructure that maximizes quality of care while minimizing patient risk.
We are hopeful that this document will prove beneficial to other HM departments in the development of successful POCUS programs. We feel that it is important to make available to other HM departments a concise protocol that has successfully passed through the credentialing process at a large tertiary care medical system.
Acknowledgments
The authors would like to acknowledge Susan Truman, MD, for her contributions to the success of the POCUS committee at Regions Hospital. The authors would like to acknowledge Kreegan Reierson, MD, Ankit Mehta, MBBS, and Khuong Vuong, MD for their contributions to the success of POCUS within hospital medicine at HealthPartners. The authors would like to acknowledge Sandi Wewerka, MPH, for her review and input of this manuscript.
Disclosure
The authors do not have any relevant financial disclosures to report.
1. Soni NJ, Nilam J, Arntfield R, Kory P. Point of Care Ultrasound. Philadelphia:
Elsevier; 2015.
2. Moore CL, Copel JA. Point-of-Care Ultrasonography. N Engl J Med.
2011;364(8):749-757. PubMed
3. Randolph AG, Cook DJ, Gonzales CA, et al. Ultrasound guidance for placement
of central venous catheters: A meta-analysis of the literature. Crit Care Med.
1996;24:2053-2058. PubMed
4. Gordon CE, Feller-Kopman D, Balk EM, et al. Pneumothorax following thoracentesis:
A systematic review and meta-analysis. Arch Intern Med. 2010;170:332-339. PubMed
5. Soni NJ, Nilam J, Franco R, et al. Ultrasound in the diagnosis and management of
pleural effusions. J Hosp Med. 2015;10(12):811-816. PubMed
6. Nazerian P, Volpicelli G, Gigli C, et al. Diagnostic performance of Wells score
combined with point-of-care lung and venous ultrasound in suspected pulmonary
embolism. Acad Emerg Med. 2017;24(3):270-280. PubMed
7. Chatziantoniou A, Nazerian P, Vanni S, et al. A combination of the Wells score
with multiorgan ultrasound to stratify patients with suspected pulmonary embolism.
Eur Respir J. 2015;46:OA493; DOI:10.1183/13993003.congress-2015.
OA493.
8. Boyd JH, Sirounis D, Maizel J, Slama M. Echocardiography as a guide for fluid
management. Crit Care. 2016; DOI:10.1186/s13054-016-1407-1. PubMed
9. Mantuani D, Frazee BW, Fahimi J, Nagdev A. Point-of-Care Multi-Organ Ultrasound
Improves Diagnostic Accuracy in Adults Presenting to the Emergency
Department with Acute Dyspnea. West J Emerg Med. 2016;17(1):46-53. PubMed
10. Glockner E, Christ M, Geier F, et al. Accuracy of Point-of-Care B-Line Lung
Ultrasound in Comparison to NT-ProBNP for Screening Acute Heart Failure.
Ultrasound Int Open. 2016;2(3):e90-e92. PubMed
11. Bhagra A, Tierney DM, Sekiguchi H, Soni NJ. Point-of-Care Ultrasonography
for Primary Care Physicians and General Internists. Mayo Clin Proc.
2016;91(12):1811-1827. PubMed
12. Crisp JG, Lovato LM, and Jang TB. Compression ultrasonography of the lower extremity
with portable vascular ultrasonography can accurately detect deep venous
thrombosis in the emergency department. Ann Emerg Med. 2010;56:601-610. PubMed
13. Squire BT, Fox JC, and Anderson C. ABSCESS: Applied bedside sonography
for convenient. Evaluation of superficial soft tissue infections. Acad Emerg Med.
2005;12:601-606. PubMed
14. Narasimhan M, Koenig SJ, Mayo PH. A Whole-Body Approach to Point of Care
Ultrasound. Chest. 2016;150(4):772-776. PubMed
15. Oks M, Cleven KL, Cardenas-Garcia J, et al. The effect of point-of-care ultrasonography
on imaging studies in the medical ICU: a comparative study. Chest.
2014;146(6):1574-1577. PubMed
16. Mayo PH, Beaulieu Y, Doelken P, et al. American College of Chest Physicians/
La Société de Réanimation de Langue Française Statement on Competence in
Critical Care Ultrasonography. Chest. 2009;135(4):1050-1060. PubMed
17. Frank JR, Snell LS, Ten Cate O, et al. Competency-based medical education:
Theory to practice. Med Teach. 2010;32:638-645. PubMed
18. The Who, What, When, and Where’s of Credentialing and Privileging. The
Joint Commission. http://www.jointcommission.org/assets/1/6/AHC_who_what_
when_and_where_credentialing_booklet.pdf. Accessed December 21, 2016.
19. American College of Emergency Physicians Policy Statement: Emergency Ultrasound
Guidelines. 2016. https://www.acep.org/Clinical---Practice-Management/
ACEP-Ultrasound-Guidelines/. Accessed October 26, 2016.
20. Society for Academic Emergency Medicine. Ultrasound Position Statement. Annual
Meeting 1996.
21. American Medical Association. Privileging for ultrasound imaging. 2001; Policy
H-230.960. www.ama-assn.org. Accessed July 28, 2017 PubMed
22. Stein JC, Nobay F. Emergency Department Ultrasound Credentialing: a sample
policy and procedure. J Emerg Med. 2009;37(2):153-159. PubMed
23. Spencer KT, Kimura BJ, Korcarz CE, Pellikka PA, Rahko PS, Siegel RJ. Focused
Cardiac Ultrasound: Recommendations from the American Society of Echocardiography.
J Am Soc Echocardiogr. 2013;26(6):567-581. PubMed
24. Wiegers S. The Point of Care. J Am Soc Echocardiogr. 2016;29(4):19. PubMed
25. Mandavia D, Aragona J, Chan L, et al. Ultrasound training for emergency physicians—
a prospective study. Acad Emerg Med. 2000;7:1008-1014. PubMed
26. American College of Radiology Practice Parameters and Technical Standards.
https://www.acr.org/quality-safety/standards-guidelines. Accessed December 21, 2016.
27. Blois B. Office-based ultrasound screening for abdominal aortic aneurysm. Can
Fam Physician. 2012;58(3):e172-e178. PubMed
28. Rubano E, Mehta N, Caputo W, Paladino L, Sinert R. Systematic review: emergency
department bedside ultrasonography for diagnosing suspected abdominal
aortic aneurysm. Acad Emerg Med. 2013;20:128-138. PubMed
29. Dijos M, Pucheux Y, Lafitte M, et al. Fast track echo of abdominal aortic aneurysm
using a real pocket-ultrasound device at bedside. Echocardiography. PubMed
2012;29(3):285-290.
30. Cox C, MacDonald S, Henneberry R, Atkinson PR. My patient has abdominal
and flank pain: Identifying renal causes. Ultrasound. 2015;23(4):242-250. PubMed
31. Gaspari R, Horst K. Emergency ultrasound and urinalysis in the evaluation of
patients with flank pain. Acad Emerg Med. 2005;12:1180-1184. PubMed
32. Kartal M, Eray O, Erdogru T, et al. Prospective validation of a current algorithm
including bedside US performed by emergency physicians for patients with acute
flank pain suspected for renal colic. Emerg Med J. 2006;23(5):341-344. PubMed
33. Noble VE, Brown DF. Renal ultrasound. Emerg Med Clin North Am. 2004;22:641-659. PubMed
34. Surange R, Jeygopal NS, Chowdhury SD, et al. Bedside ultrasound: a useful tool
for the on call urologist? Int Urol Nephrol. 2001;32:591-596. PubMed
35. Pomero F, Dentali F, Borretta V, et al. Accuracy of emergency physician-performed
ultrasonography in the diagnosis of deep-vein thrombosis. Thromb Haemost.
2013;109(1):137-145. PubMed
36. Bernardi E, Camporese G, Buller HR, et al. Erasmus Study Group. Serial 2-Point
Ultrasonography Plus D-Dimer vs Whole-Leg Color-Coded Doppler Ultrasonography
for Diagnosing Suspected Symptomatic Deep Vein Thrombosis: A Randomized
Controlled Trial. JAMA. 2008;300(14):1653-1659. PubMed
37. Burnside PR, Brown MD, Kline JA. Systematic Review of Emergency Physician–
performed Ultrasonography for Lower-Extremity Deep Vein Thrombosis. Acad
Emerg Med. 2008;15:493-498. PubMed
38. Magazzini S, Vanni S, Toccafondi S, et al. Duplex ultrasound in the emergency
department for the diagnostic management of clinically suspected deep vein
thrombosis. Acad Emerg Med. 2007;14:216-220. PubMed
39. Jacoby J, Cesta M, Axelband J, Melanson S, Heller M, Reed J. Can emergency
medicine residents detect acute deep venous thrombosis with a limited, two-site
ultrasound examination? J Emerg Med. 2007;32:197-200. PubMed
40. Jang T, Docherty M, Aubin C, Polites G. Resident-performed compression ultrasonography
for the detection of proximal deep vein thrombosis: fast and accurate.
Acad Emerg Med. 2004;11:319-322. PubMed
41. Frazee BW, Snoey ER, Levitt A. Emergency Department compression ultrasound
to diagnose proximal deep vein thrombosis. J Emerg Med. 2001;20:107-112. PubMed
42. Blaivas M, Lambert MJ, Harwood RA, Wood JP, Konicki J. Lower-extremity Doppler
for deep venous thrombosis--can emergency physicians be accurate and fast?
Acad Emerg Med. 2000;7:120-126. PubMed
43. Koenig SJ, Narasimhan M, Mayo PH. Thoracic ultrasonography for the pulmonary
specialist. Chest. 2011;140(5):1332-1341. PubMed
44. Lichtenstein, DA. A bedside ultrasound sign ruling out pneumothorax in the critically
ill. Lung sliding. Chest. 1995;108(5):1345-1348. PubMed
45. Lichtenstein D, Mézière G, Biderman P, Gepner A, Barré O. The comet-tail artifact.
An ultrasound sign of alveolar-interstitial syndrome. Am J Respir Crit Care
Med. 1997;156(5):1640-1646. PubMed
46. Copetti R, Soldati G, Copetti P. Chest sonography: a useful tool to differentiate
acute cardiogenic pulmonary edema from acute respiratory distress syndrome. Cardiovasc
Ultrasound. 2008;6:16. PubMed
47. Agricola E, Bove T, Oppizzi M, et al. Ultrasound comet-tail images: a marker
of pulmonary edema: a comparative study with wedge pressure and extravascular
lung water. Chest. 2005;127(5):1690-1695. PubMed
48. Lichtenstein DA, Meziere GA, Laqoueyte JF, Biderman P, Goldstein I, Gepner A.
A-lines and B-lines: lung ultrasound as a bedside tool for predicting pulmonary
artery occlusion pressure in the critically ill. Chest. 2009;136(4):1014-1020. PubMed
49. Lichtenstein DA, Lascols N, Meziere G, Gepner A. Ultrasound diagnosis of alveolar
consolidation in the critically ill. Intensive Care Med. 2004;30(2):276-281. PubMed
50. Lichtenstein D, Mezière G, Seitz J. The dynamic air bronchogram. A lung
ultrasound sign of alveolar consolidation ruling out atelectasis. Chest.
2009;135(6):1421–1425. PubMed
51. Lichtenstein D, Goldstein I, Mourgeon E, Cluzel P, Grenier P, Rouby JJ. Comparative
diagnostic performances of auscultation, chest radiography, and lung ultrasonography
in acute respiratory distress syndrome. Anesthesiology. 2004;100(1):9-15. PubMed
52. Lichtenstein D, Meziere G. Relevance of lung ultrasound in the diagnosis of acute
respiratory failure: the BLUE protocol. Chest. 2008;134(1):117-125. PubMed
53. Mayo P, Doelken P. Pleural ultrasonography. Clin Chest Med. 2006;27(2):215-227. PubMed
54. Galderisi M, Santoro A, Versiero M, et al. Improved cardiovascular diagnostic accuracy
by pocket size imaging device in non-cardiologic outpatients: the NaUSi-
Ca (Naples Ultrasound Stethoscope in Cardiology) study. Cardiovasc Ultrasound.
2010;8:51. PubMed
55. DeCara JM, Lang RM, Koch R, Bala R, Penzotti J, Spencer KT. The use of small
personal ultrasound devices by internists without formal training in echocardiography.
Eur J Echocardiography. 2002;4:141-147. PubMed
56. Martin LD, Howell EE, Ziegelstein RC, Martire C, Shapiro EP, Hellmann DB.
Hospitalist performance of cardiac hand-carried ultrasound after focused training.
Am J Med. 2007;120:1000-1004. PubMed
57. Martin LD, Howell EE, Ziegelstein RC, et al. Hand-carried ultrasound performed
by hospitalists: does it improve the cardiac physical examination? Am J Med.
2009;122:35-41. PubMed
58. Perez-Avraham G, Kobal SL, Etzion O, et al. Left ventricular geometric abnormality
screening in hypertensive patients using a hand-carried ultrasound device.
J Clin Hypertens. 2010;12:181-186. PubMed
59. Lucas BP, Candotti C, Margeta B, et al. Diagnostic accuracy of hospitalist-performed
hand-carried ultrasound echocardiography after a brief training program. J
Hosp Med. 2009;4:340-349. PubMed
60. Kimura BJ, Fowler SJ, Fergus TS, et al. Detection of left atrial enlargement using
hand-carried ultrasound devices to screen for cardiac abnormalities. Am J Med.
2005;118:912-916. PubMed
61. Brennan JM, Blair JE, Goonewardena S, et al. A comparison by medicine residents of physical examination versus hand-carried ultrasound for estimation of
right atrial pressure. Am J Cardiol. 2007;99:1614-1616. PubMed
62. Blair JE, Brennan JM, Goonewardena SN, Shah D, Vasaiwala S, Spencer KT.
Usefulness of hand-carried ultrasound to predict elevated left ventricular filling
pressure. Am J Cardiol. 2009;103:246-247. PubMed
63. Stawicki SP, Braslow BM, Panebianco NL, et al. Intensivist use of hand-carried
ultrasonography to measure IVC collapsibility in estimating intravascular volume
status: correlations with CVP. J Am Coll Surg. 2009;209:55-61. PubMed
64. Gunst M, Ghaemmaghami V, Sperry J, et al. Accuracy of cardiac function and volume
status estimates using the bedside echocardiographic assessment in trauma/
critical care. J Trauma. 2008;65:509-515. PubMed
65. Razi R, Estrada JR, Doll J, Spencer KT. Bedside hand-carried ultrasound by internal
medicine residents versus traditional clinical assessment for the identification
of systolic dysfunction in patients admitted with decompensated heart failure. J
Am Soc Echocardiogr. 2011;24:1319-1324. PubMed
66. Croft LB, Duvall WL, Goldman ME. A pilot study of the clinical impact
of hand-carried cardiac ultrasound in the medical clinic. Echocardiography.
2006;23:439-446. PubMed
67. Vignon P, Dugard A, Abraham J, et al. Focused training for goal-oriented handheld
echocardiography performed by noncardiologist residents in the intensive
care unit. Intensive Care Med. 2007;33:1795-1799. PubMed
68. Melamed R, Sprenkle MD, Ulstad VK, Herzog CA, Leatherman JW. Assessment
of left ventricular function by intensivists using hand-held echocardiography.
Chest. 2009;135:1416-1420. PubMed
69. Mark DG, Hayden GE, Ky B, et al. Hand-carried echocardiography for assessment
of left ventricular filling and ejection fraction in the surgical intensive care unit. J
Crit Care. 2009;24(3):470.e1-470.e7. PubMed
70. Kirkpatrick JN, Davis A, Decara JM, et al. Hand-carried cardiac ultrasound as a
tool to screen for important cardiovascular disease in an underserved minority
health care clinic. J Am Soc Echocardiogr. 2004;17:399-403. PubMed
71. Fedson S, Neithardt G, Thomas P, et al. Unsuspected clinically important findings
detected with a small portable ultrasound device in patients admitted to a general
medicine service. J Am Soc Echocardiogr. 2003;16:901-905. PubMed
72. Ghani SN, Kirkpatrick JN, Spencer, KT, et al. Rapid assessment of left ventricular
systolic function in a pacemaker clinic using a hand-carried ultrasound device.
J Interv Card Electrophysiol. 2006;16:39-43. PubMed
73. Kirkpatrick JN, Ghani SN, Spencer KT. Hand carried echocardiography
screening for LV systolic dysfunction in a pulmonary function laboratory.
Eur J Echocardiogr. 2008;9:381-383. PubMed
74. Alexander JH, Peterson ED, Chen AY, Harding TM, Adams DB, Kisslo JA Jr.
Feasibility of point-of-care echocardiography by internal medicine house staff. Am
Heart J. 2004;147:476-481. PubMed
75. Angoff WH. Scales, norms and equivalent Scores. Washington, DC: American
Council on Education; 1971.
76. Hellmann DB, Whiting-O’Keefe Q, Shapiro EP, Martin LD, Martire C, Ziegelstein
RC. The rate at which residents learn to use hand-held echocardiography at
the bedside. Am J Med. 2005;118:1010-1018. PubMed
77. Kimura BJ, Amundson SA, Phan JN, Agan DL, Shaw DJ. Observations during
development of an internal medicine residency training program in cardiovascular
limited ultrasound examination. J Hosp Med. 2012;7:537-542. PubMed
78. Akhtar S, Theodoro D, Gaspari R, et al. Resident training in emergency ultrasound:
consensus recommendations from the 2008 Council of Emergency Medicine
Residency Directors Conference. Acad Emerg Med. 2009;16(s2):S32-S36. PubMed
79. Ma OJ, Gaddis G, Norvell JG, Subramanian S. How fast is the focused assessment
with sonography for trauma examination learning curve? Emerg Med Australas.
2008;20(1):32-37. PubMed
80. Gaspari RJ, Dickman E, Blehar D. Learning curve of bedside ultrasound of the gallbladder. J Emerg Med. 2009;37(1):51-56. DOI:10.1016/j.jemermed.2007.10.070. PubMed
81. Ericsson KA, Lehmann AC. Expert and exceptional performance: Evidence of
maximal adaptation to task constraints. Ann Rev Psychol. 1996;47:273-305. PubMed
82. Ericcson KA, Krampe RT, Tesch-Romer C. The role of deliberate practice in the
acquisition of expert performance. Psychol Rev. 1993;100:363-406.
83. OPPE and FPPE: Tools to help make privileging decisions. The Joint Commission.
2013. http://www.jointcommission.org/jc_physician_blog/oppe_fppe_tools_privileging_
decisions/ Accessed October 26, 2016.
84. American Medical Association. Physicians’ Current Procedural Terminology (CPT)
2011. American Medical Association, Chicago; 2011.
85. Moore CL, Gregg S, Lambert M. Performance, training, quality assurance, and
reimbursement of emergency physician-performed ultrasonography at academic
medical centers. J Ultrasound Med. 2004;23(4):459-466. PubMed
86. Critical Care Ultrasonography Certificate of Completion Program. CHEST.
American College of Chest Physicians. http://www.chestnet.org/Education/Advanced-
Clinical-Training/Certificate-of-Completion-Program/Critical-Care-Ultrasonography.
Accessed July 28, 2017.
Ultrasound has been used for decades by radiology, obstetrics-gynecology, and cardiology departments within a comprehensive paradigm in which a physician enters an order, then a trained sonographer performs the study, followed by a physician evaluating and interpreting the images.1 Unlike the traditional comprehensive paradigm, point-of-care ultrasound (POCUS) is a focused study that is both performed and interpreted by the bedside provider.2 POCUS has been demonstrated to improve diagnosis and clinical management in multiple studies.3-15
The scope of practice in POCUS differs by specialty, as POCUS is done to achieve specific procedural aims (eg, direct the needle to the correct location) or answer focused questions (eg, does the patient have a distended bladder?) related to the specialty. POCUS in hospital medicine (HM) provides immediate answers, without the delay and potential risk of transportation to other hospital areas. It may be used to diagnose pleural effusion, pneumonia, hydronephrosis, heart failure, deep vein thrombosis, and many other pathologies.5-15 It is important to understand that POCUS performed by HM is a limited study and is not a substitute for more complete ultrasound examinations conducted in the radiology suite or in the echocardiography lab.
POCUS should not be used exclusively in medical decision making, but rather in conjunction with the greater clinical context of each patient, building on established principles of diagnosis and management.
DEFINITIONS
- Credentialing: An umbrella term, which incorporates licensure, education, and certification.
- Privileging: Used to define the scope authorized for a provider by a healthcare organization based on an evaluation of the individual’s credentials and performance.
- Competency: An observable ability of a provider, integrating multiple components, such as knowledge and skills. Since competencies are observable, they can be measured and assessed to ensure their acquisition.
- Certification: The process by which an association grants recognition to a provider who has met certain predetermined qualifications specified by the association. Competence is distinguished from certification, which is defined as the process by which competence is recognized by an external agency.
All of the above mechanisms work together to provide the highest quality of reliability that a practitioner is providing safe, competent care.16-18
STATEMENTS FROM MAJOR SPECIALTY SOCIETIES
Acknowledging that there are no published guidelines in the realm of HM POCUS, the development of the credentialing process at our institution is consistent with published guidelines by Emergency Medicine societies (the most established physician users of POCUS) and the American Medical Association (AMA).19-21
The use of emergency ultrasound by physicians in the emergency department is endorsed by the American College of Emergency Physicians (ACEP).19 ACEP, along with the Society of Academic Emergency Medicine (SAEM), recommends that training in the performance and interpretation of ultrasound imaging be included during residency.20 ACEP and SAEM add that the availability of equivalent training should be made available to practicing physicians. The American Society of Echocardiography has supported the use of POCUS and sees this modality as part of the continuum of care.23,24
The AMA has also recognized that POCUS is within the scope of practice of trained physicians.22 The AMA further recommended hospital staff create their own criteria for granting ultrasound privileges based on the background and training of the physician and in accordance with the standards set within specific specialties.22,23
LOCAL POLICY AND PROCEDURE
The provision of clinical privileges in HM is governed by the rules and regulations of the department and institution for which privileges are sought. In detailing our policies and procedures above, we intend to provide an example for HM departments at other institutions that are attempting to create a POCUS credentialing program.
An interdisciplinary approach was created by our institution to address training, competency, and ongoing quality assurance (QA) concerns due to the increasing popularity of POCUS and variability in its use. We developed a hospital-wide POCUS committee with, among others, members from HM, emergency medicine, critical care, radiology, and cardiology, with a charter to standardize POCUS across departments. After review of the literature,16-18, 20, 21, 23-74 baseline training requirements were established for credentialing and developing a unified delineation of privileges for hospital-wide POCUS. The data support the use of a variety of assessments to ensure a provider has developed competence (portfolio development, knowledge-based examination, skills-based assessment, ongoing QA process). The POCUS committee identified which exams could be performed at bedside for credentialed providers, delineated imaging requirements for each exam, and set up the information technology infrastructure to support ordering and reporting through electronic health records (EHR). While the POCUS committee delineated this process for all hospital providers, we will focus our discussion on the credentialing policy and procedure in HM.
STEP 1: PATHWAY TO POCUS CREDENTIALING IN HM: COMPLETE MINIMAL FORMAL REQUIREMENTS
The credentialing requirements at our institution include one of the the following basic education pathways and minimal formal training:
Residency/Fellowship Based Pathway
Completed training in an Accreditation Council for Graduate Medical Education–approved program that provided opportunities for 20 hours of POCUS training with at least 6 hours of hands-on ultrasound scanning, 5 proctored limited cardiac ultrasound cases and portfolio development.
Practice Based Pathway
Completed 20 hours of POCUS continuing medical education (CME) with at least 6 hours of hands-on ultrasound scanning and has completed 5 proctored limited cardiac ultrasound cases (as part of CME).
The majority of HM providers had little formal residency training in POCUS, so a training program needed to be developed. Our training program, modeled after the American College of Chest Physicians’ CHEST certificate of completion,86 utilizes didactic training, hands-on instruction, and portfolio development that fulfills the minimal formal requirements in the practice-based pathway.
STEP 2: PATHWAY TO POCUS CREDENTIALING IN HM: COMPLETE PORTFOLIO AND FINAL ASSESSMENTS (KNOWLEDGE AND SKILLS–BASED)
After satisfactory completion of the minimal formal training, applicants need to provide documentation of a set number of cases. To aid this requirement, our HM department developed the portfolio guidelines in the Table. These are minimum requirements, and because of the varying training curves of learning,76-80 1 hospitalist may need to submit 300 files for review to meet the standards, while another may need to submit 500 files. Submissions are not accepted unless they yield high-quality video files with meticulous attention to gain, depth, and appropriate topographic planes. The portfolio development monitors hospitalists’ progression during their deliberate practice, providing objective assessments, feedback, and mentorship.81,82
A final knowledge exam with case-based image interpretation and hands-on examination is also provided. The passing score for the written examination is 85% and was based on the Angoff methodology.75 Providers who meet these requirements are then able to apply for POCUS credentialing in HM. Providers who do not pass the final assessments are required to participate in further training before they reattempt the assessments. There is uniformity in training outcomes but diversity in training time for POCUS providers.
Candidates who complete the portfolio and satisfactorily pass the final assessments are credentialed after review by the POCUS committee. Credentialed physicians are then able to perform POCUS and to integrate the findings into patient care.
MAINTENANCE OF CREDENTIALS
Documentation
After credentialing is obtained, all POCUS studies used in patient care are included in the EHR following a clearly defined workflow. The study is ordered through the EHR and is retrieved wirelessly on the ultrasound machine. After performing the ultrasound, all images are wirelessly transferred to the radiology Picture Archiving and Communication System server. Standardized text reports are used to distinguish focused POCUS from traditional diagnostic ultrasound studies. Documentation is optimized using electronic drop-down menus for documenting ultrasound findings in the EHR.
Minimum Number of Examinations
Maintenance of credentials will require that each hospitalist perform 10 documented ultrasounds per year for each cardiac and noncardiac application for which credentials are requested. If these numbers are not met, then all the studies performed during the previous year will be reviewed by the ultrasound committee, and providers will be provided with opportunities to meet the minimum benchmark (supervised scanning sessions).
Quality Assurance
Establishing scope of practice, developing curricula, and credentialing criteria are important steps toward assuring provider competence.16,17,22,74 To be confident that providers are using POCUS appropriately, there must also be a development of standards of periodic assessment that encompass both examination performance and interpretation. The objective of a QA process is to evaluate the POCUS cases for technical competence and the interpretations for clinical accuracy, and to provide feedback to improve performance of providers.
QA is maintained through the interdisciplinary POCUS committee and is described in the Figure.
After initial credentialing, continued QA of HM POCUS is done for a proportion of ongoing exams (10% as per recommendations by ACEP) to document continued competency.2 Credentialed POCUS providers perform and document their exam and interpretations. Ultrasound interpretations are reviewed by the POCUS committee (every case by 2 physicians, 1 hospitalist, and 1 radiologist or cardiologist depending on the study type) at appropriate intervals based on volume (at minimum, quarterly). A standardized review form is used to grade images and interpretations. This is the same general rubric used with the portfolio for initial credentialing. Each case is scored on a scale of 1 to 6, with 1 representing high image quality and support for diagnosis and 6 representing studies limited by patient factors. All scores rated 4 or 5 are reviewed at the larger quarterly POCUS committee meetings. For any provider scoring a 4 or 5, the ultrasound committee will recommend a focused professional practice evaluation as it pertains to POCUS. The committee will also make recommendations on a physician’s continued privileges to the department leaders.83
BILLING
Coding, billing, and reimbursement for focused ultrasound has been supported through the AMA Physicians’ Current Procedural Terminology (CPT) 2011 codes, which includes CPT code modifiers for POCUS.84 There are significant costs associated with building a HM ultrasound program, including the education of hospitalists, ultrasound equipment purchase and maintenance, as well as image archiving and QA. The development of a HM ultrasound billing program can help justify and fund these costs.19,85
To appropriately bill for POCUS, permanently retrievable images and an interpretation document need to be available for review. HM coders are instructed to only bill if both components are available. Because most insurers will not pay for 2 of the same type of study performed within a 24-hour period, coders do not bill for ultrasounds when a comprehensive ultrasound of the same body region is performed within a 24-hour period. The workflow that we have developed, including ordering, performing, and documenting, allows for easy coding and billing.
BARRIERS AND LIMITATIONS
While POCUS has a well-established literature base in other specialties like emergency medicine, it has been a relatively recent addition to the HM specialty. As such, there exists a paucity of evidence-based medicine to support its use of POCUS in HM. While it is tempting to extrapolate from the literature of other specialties, this may not be a valid approach.
Training curves in which novice users of ultrasound become competent in specific applications are incompletely understood. Little research describes the rate of progression of learners in ultrasound towards competency. We have recently started the QA process and hope that the data will further guide feedback to the process.
Additionally, with the portfolios, the raters’ expertise may not be stable (develops through experience). We aim to mitigate this by having a group of raters reviewing each file, particularly if there is a question about if a submission is of high image quality. A notable barrier that groups face is support from their leadership regarding POCUS. Our group has had support from the chief medical officer who helped mandate the development of POCUS standards.
LESSONS LEARNED
We have developed a robust collaborative HM POCUS program. We have noted challenges in motivating all providers to work through this protocol. Development of a POCUS program takes dedicated time, and without a champion, it is at risk for failing. HM departments would be advised to seek out willing collaborators at their institutions. We have seen that it is useful to partner with some experienced emergency medicine providers. Additionally, portfolio development and feedback has been key to demonstrating growth in image acquisition. Deliberate longitudinal practice with feedback and successive refinements with POCUS obtain the highest yield towards competency. We hope our QA data will provide further feedback into the credentialing policy and procedure.
SUMMARY
It is important that POCUS users work together to recognize its potential and limitations, teach current and future care providers’ best practices, and create an infrastructure that maximizes quality of care while minimizing patient risk.
We are hopeful that this document will prove beneficial to other HM departments in the development of successful POCUS programs. We feel that it is important to make available to other HM departments a concise protocol that has successfully passed through the credentialing process at a large tertiary care medical system.
Acknowledgments
The authors would like to acknowledge Susan Truman, MD, for her contributions to the success of the POCUS committee at Regions Hospital. The authors would like to acknowledge Kreegan Reierson, MD, Ankit Mehta, MBBS, and Khuong Vuong, MD for their contributions to the success of POCUS within hospital medicine at HealthPartners. The authors would like to acknowledge Sandi Wewerka, MPH, for her review and input of this manuscript.
Disclosure
The authors do not have any relevant financial disclosures to report.
1. Soni NJ, Nilam J, Arntfield R, Kory P. Point of Care Ultrasound. Philadelphia:
Elsevier; 2015.
2. Moore CL, Copel JA. Point-of-Care Ultrasonography. N Engl J Med.
2011;364(8):749-757. PubMed
3. Randolph AG, Cook DJ, Gonzales CA, et al. Ultrasound guidance for placement
of central venous catheters: A meta-analysis of the literature. Crit Care Med.
1996;24:2053-2058. PubMed
4. Gordon CE, Feller-Kopman D, Balk EM, et al. Pneumothorax following thoracentesis:
A systematic review and meta-analysis. Arch Intern Med. 2010;170:332-339. PubMed
5. Soni NJ, Nilam J, Franco R, et al. Ultrasound in the diagnosis and management of
pleural effusions. J Hosp Med. 2015;10(12):811-816. PubMed
6. Nazerian P, Volpicelli G, Gigli C, et al. Diagnostic performance of Wells score
combined with point-of-care lung and venous ultrasound in suspected pulmonary
embolism. Acad Emerg Med. 2017;24(3):270-280. PubMed
7. Chatziantoniou A, Nazerian P, Vanni S, et al. A combination of the Wells score
with multiorgan ultrasound to stratify patients with suspected pulmonary embolism.
Eur Respir J. 2015;46:OA493; DOI:10.1183/13993003.congress-2015.
OA493.
8. Boyd JH, Sirounis D, Maizel J, Slama M. Echocardiography as a guide for fluid
management. Crit Care. 2016; DOI:10.1186/s13054-016-1407-1. PubMed
9. Mantuani D, Frazee BW, Fahimi J, Nagdev A. Point-of-Care Multi-Organ Ultrasound
Improves Diagnostic Accuracy in Adults Presenting to the Emergency
Department with Acute Dyspnea. West J Emerg Med. 2016;17(1):46-53. PubMed
10. Glockner E, Christ M, Geier F, et al. Accuracy of Point-of-Care B-Line Lung
Ultrasound in Comparison to NT-ProBNP for Screening Acute Heart Failure.
Ultrasound Int Open. 2016;2(3):e90-e92. PubMed
11. Bhagra A, Tierney DM, Sekiguchi H, Soni NJ. Point-of-Care Ultrasonography
for Primary Care Physicians and General Internists. Mayo Clin Proc.
2016;91(12):1811-1827. PubMed
12. Crisp JG, Lovato LM, and Jang TB. Compression ultrasonography of the lower extremity
with portable vascular ultrasonography can accurately detect deep venous
thrombosis in the emergency department. Ann Emerg Med. 2010;56:601-610. PubMed
13. Squire BT, Fox JC, and Anderson C. ABSCESS: Applied bedside sonography
for convenient. Evaluation of superficial soft tissue infections. Acad Emerg Med.
2005;12:601-606. PubMed
14. Narasimhan M, Koenig SJ, Mayo PH. A Whole-Body Approach to Point of Care
Ultrasound. Chest. 2016;150(4):772-776. PubMed
15. Oks M, Cleven KL, Cardenas-Garcia J, et al. The effect of point-of-care ultrasonography
on imaging studies in the medical ICU: a comparative study. Chest.
2014;146(6):1574-1577. PubMed
16. Mayo PH, Beaulieu Y, Doelken P, et al. American College of Chest Physicians/
La Société de Réanimation de Langue Française Statement on Competence in
Critical Care Ultrasonography. Chest. 2009;135(4):1050-1060. PubMed
17. Frank JR, Snell LS, Ten Cate O, et al. Competency-based medical education:
Theory to practice. Med Teach. 2010;32:638-645. PubMed
18. The Who, What, When, and Where’s of Credentialing and Privileging. The
Joint Commission. http://www.jointcommission.org/assets/1/6/AHC_who_what_
when_and_where_credentialing_booklet.pdf. Accessed December 21, 2016.
19. American College of Emergency Physicians Policy Statement: Emergency Ultrasound
Guidelines. 2016. https://www.acep.org/Clinical---Practice-Management/
ACEP-Ultrasound-Guidelines/. Accessed October 26, 2016.
20. Society for Academic Emergency Medicine. Ultrasound Position Statement. Annual
Meeting 1996.
21. American Medical Association. Privileging for ultrasound imaging. 2001; Policy
H-230.960. www.ama-assn.org. Accessed July 28, 2017 PubMed
22. Stein JC, Nobay F. Emergency Department Ultrasound Credentialing: a sample
policy and procedure. J Emerg Med. 2009;37(2):153-159. PubMed
23. Spencer KT, Kimura BJ, Korcarz CE, Pellikka PA, Rahko PS, Siegel RJ. Focused
Cardiac Ultrasound: Recommendations from the American Society of Echocardiography.
J Am Soc Echocardiogr. 2013;26(6):567-581. PubMed
24. Wiegers S. The Point of Care. J Am Soc Echocardiogr. 2016;29(4):19. PubMed
25. Mandavia D, Aragona J, Chan L, et al. Ultrasound training for emergency physicians—
a prospective study. Acad Emerg Med. 2000;7:1008-1014. PubMed
26. American College of Radiology Practice Parameters and Technical Standards.
https://www.acr.org/quality-safety/standards-guidelines. Accessed December 21, 2016.
27. Blois B. Office-based ultrasound screening for abdominal aortic aneurysm. Can
Fam Physician. 2012;58(3):e172-e178. PubMed
28. Rubano E, Mehta N, Caputo W, Paladino L, Sinert R. Systematic review: emergency
department bedside ultrasonography for diagnosing suspected abdominal
aortic aneurysm. Acad Emerg Med. 2013;20:128-138. PubMed
29. Dijos M, Pucheux Y, Lafitte M, et al. Fast track echo of abdominal aortic aneurysm
using a real pocket-ultrasound device at bedside. Echocardiography. PubMed
2012;29(3):285-290.
30. Cox C, MacDonald S, Henneberry R, Atkinson PR. My patient has abdominal
and flank pain: Identifying renal causes. Ultrasound. 2015;23(4):242-250. PubMed
31. Gaspari R, Horst K. Emergency ultrasound and urinalysis in the evaluation of
patients with flank pain. Acad Emerg Med. 2005;12:1180-1184. PubMed
32. Kartal M, Eray O, Erdogru T, et al. Prospective validation of a current algorithm
including bedside US performed by emergency physicians for patients with acute
flank pain suspected for renal colic. Emerg Med J. 2006;23(5):341-344. PubMed
33. Noble VE, Brown DF. Renal ultrasound. Emerg Med Clin North Am. 2004;22:641-659. PubMed
34. Surange R, Jeygopal NS, Chowdhury SD, et al. Bedside ultrasound: a useful tool
for the on call urologist? Int Urol Nephrol. 2001;32:591-596. PubMed
35. Pomero F, Dentali F, Borretta V, et al. Accuracy of emergency physician-performed
ultrasonography in the diagnosis of deep-vein thrombosis. Thromb Haemost.
2013;109(1):137-145. PubMed
36. Bernardi E, Camporese G, Buller HR, et al. Erasmus Study Group. Serial 2-Point
Ultrasonography Plus D-Dimer vs Whole-Leg Color-Coded Doppler Ultrasonography
for Diagnosing Suspected Symptomatic Deep Vein Thrombosis: A Randomized
Controlled Trial. JAMA. 2008;300(14):1653-1659. PubMed
37. Burnside PR, Brown MD, Kline JA. Systematic Review of Emergency Physician–
performed Ultrasonography for Lower-Extremity Deep Vein Thrombosis. Acad
Emerg Med. 2008;15:493-498. PubMed
38. Magazzini S, Vanni S, Toccafondi S, et al. Duplex ultrasound in the emergency
department for the diagnostic management of clinically suspected deep vein
thrombosis. Acad Emerg Med. 2007;14:216-220. PubMed
39. Jacoby J, Cesta M, Axelband J, Melanson S, Heller M, Reed J. Can emergency
medicine residents detect acute deep venous thrombosis with a limited, two-site
ultrasound examination? J Emerg Med. 2007;32:197-200. PubMed
40. Jang T, Docherty M, Aubin C, Polites G. Resident-performed compression ultrasonography
for the detection of proximal deep vein thrombosis: fast and accurate.
Acad Emerg Med. 2004;11:319-322. PubMed
41. Frazee BW, Snoey ER, Levitt A. Emergency Department compression ultrasound
to diagnose proximal deep vein thrombosis. J Emerg Med. 2001;20:107-112. PubMed
42. Blaivas M, Lambert MJ, Harwood RA, Wood JP, Konicki J. Lower-extremity Doppler
for deep venous thrombosis--can emergency physicians be accurate and fast?
Acad Emerg Med. 2000;7:120-126. PubMed
43. Koenig SJ, Narasimhan M, Mayo PH. Thoracic ultrasonography for the pulmonary
specialist. Chest. 2011;140(5):1332-1341. PubMed
44. Lichtenstein, DA. A bedside ultrasound sign ruling out pneumothorax in the critically
ill. Lung sliding. Chest. 1995;108(5):1345-1348. PubMed
45. Lichtenstein D, Mézière G, Biderman P, Gepner A, Barré O. The comet-tail artifact.
An ultrasound sign of alveolar-interstitial syndrome. Am J Respir Crit Care
Med. 1997;156(5):1640-1646. PubMed
46. Copetti R, Soldati G, Copetti P. Chest sonography: a useful tool to differentiate
acute cardiogenic pulmonary edema from acute respiratory distress syndrome. Cardiovasc
Ultrasound. 2008;6:16. PubMed
47. Agricola E, Bove T, Oppizzi M, et al. Ultrasound comet-tail images: a marker
of pulmonary edema: a comparative study with wedge pressure and extravascular
lung water. Chest. 2005;127(5):1690-1695. PubMed
48. Lichtenstein DA, Meziere GA, Laqoueyte JF, Biderman P, Goldstein I, Gepner A.
A-lines and B-lines: lung ultrasound as a bedside tool for predicting pulmonary
artery occlusion pressure in the critically ill. Chest. 2009;136(4):1014-1020. PubMed
49. Lichtenstein DA, Lascols N, Meziere G, Gepner A. Ultrasound diagnosis of alveolar
consolidation in the critically ill. Intensive Care Med. 2004;30(2):276-281. PubMed
50. Lichtenstein D, Mezière G, Seitz J. The dynamic air bronchogram. A lung
ultrasound sign of alveolar consolidation ruling out atelectasis. Chest.
2009;135(6):1421–1425. PubMed
51. Lichtenstein D, Goldstein I, Mourgeon E, Cluzel P, Grenier P, Rouby JJ. Comparative
diagnostic performances of auscultation, chest radiography, and lung ultrasonography
in acute respiratory distress syndrome. Anesthesiology. 2004;100(1):9-15. PubMed
52. Lichtenstein D, Meziere G. Relevance of lung ultrasound in the diagnosis of acute
respiratory failure: the BLUE protocol. Chest. 2008;134(1):117-125. PubMed
53. Mayo P, Doelken P. Pleural ultrasonography. Clin Chest Med. 2006;27(2):215-227. PubMed
54. Galderisi M, Santoro A, Versiero M, et al. Improved cardiovascular diagnostic accuracy
by pocket size imaging device in non-cardiologic outpatients: the NaUSi-
Ca (Naples Ultrasound Stethoscope in Cardiology) study. Cardiovasc Ultrasound.
2010;8:51. PubMed
55. DeCara JM, Lang RM, Koch R, Bala R, Penzotti J, Spencer KT. The use of small
personal ultrasound devices by internists without formal training in echocardiography.
Eur J Echocardiography. 2002;4:141-147. PubMed
56. Martin LD, Howell EE, Ziegelstein RC, Martire C, Shapiro EP, Hellmann DB.
Hospitalist performance of cardiac hand-carried ultrasound after focused training.
Am J Med. 2007;120:1000-1004. PubMed
57. Martin LD, Howell EE, Ziegelstein RC, et al. Hand-carried ultrasound performed
by hospitalists: does it improve the cardiac physical examination? Am J Med.
2009;122:35-41. PubMed
58. Perez-Avraham G, Kobal SL, Etzion O, et al. Left ventricular geometric abnormality
screening in hypertensive patients using a hand-carried ultrasound device.
J Clin Hypertens. 2010;12:181-186. PubMed
59. Lucas BP, Candotti C, Margeta B, et al. Diagnostic accuracy of hospitalist-performed
hand-carried ultrasound echocardiography after a brief training program. J
Hosp Med. 2009;4:340-349. PubMed
60. Kimura BJ, Fowler SJ, Fergus TS, et al. Detection of left atrial enlargement using
hand-carried ultrasound devices to screen for cardiac abnormalities. Am J Med.
2005;118:912-916. PubMed
61. Brennan JM, Blair JE, Goonewardena S, et al. A comparison by medicine residents of physical examination versus hand-carried ultrasound for estimation of
right atrial pressure. Am J Cardiol. 2007;99:1614-1616. PubMed
62. Blair JE, Brennan JM, Goonewardena SN, Shah D, Vasaiwala S, Spencer KT.
Usefulness of hand-carried ultrasound to predict elevated left ventricular filling
pressure. Am J Cardiol. 2009;103:246-247. PubMed
63. Stawicki SP, Braslow BM, Panebianco NL, et al. Intensivist use of hand-carried
ultrasonography to measure IVC collapsibility in estimating intravascular volume
status: correlations with CVP. J Am Coll Surg. 2009;209:55-61. PubMed
64. Gunst M, Ghaemmaghami V, Sperry J, et al. Accuracy of cardiac function and volume
status estimates using the bedside echocardiographic assessment in trauma/
critical care. J Trauma. 2008;65:509-515. PubMed
65. Razi R, Estrada JR, Doll J, Spencer KT. Bedside hand-carried ultrasound by internal
medicine residents versus traditional clinical assessment for the identification
of systolic dysfunction in patients admitted with decompensated heart failure. J
Am Soc Echocardiogr. 2011;24:1319-1324. PubMed
66. Croft LB, Duvall WL, Goldman ME. A pilot study of the clinical impact
of hand-carried cardiac ultrasound in the medical clinic. Echocardiography.
2006;23:439-446. PubMed
67. Vignon P, Dugard A, Abraham J, et al. Focused training for goal-oriented handheld
echocardiography performed by noncardiologist residents in the intensive
care unit. Intensive Care Med. 2007;33:1795-1799. PubMed
68. Melamed R, Sprenkle MD, Ulstad VK, Herzog CA, Leatherman JW. Assessment
of left ventricular function by intensivists using hand-held echocardiography.
Chest. 2009;135:1416-1420. PubMed
69. Mark DG, Hayden GE, Ky B, et al. Hand-carried echocardiography for assessment
of left ventricular filling and ejection fraction in the surgical intensive care unit. J
Crit Care. 2009;24(3):470.e1-470.e7. PubMed
70. Kirkpatrick JN, Davis A, Decara JM, et al. Hand-carried cardiac ultrasound as a
tool to screen for important cardiovascular disease in an underserved minority
health care clinic. J Am Soc Echocardiogr. 2004;17:399-403. PubMed
71. Fedson S, Neithardt G, Thomas P, et al. Unsuspected clinically important findings
detected with a small portable ultrasound device in patients admitted to a general
medicine service. J Am Soc Echocardiogr. 2003;16:901-905. PubMed
72. Ghani SN, Kirkpatrick JN, Spencer, KT, et al. Rapid assessment of left ventricular
systolic function in a pacemaker clinic using a hand-carried ultrasound device.
J Interv Card Electrophysiol. 2006;16:39-43. PubMed
73. Kirkpatrick JN, Ghani SN, Spencer KT. Hand carried echocardiography
screening for LV systolic dysfunction in a pulmonary function laboratory.
Eur J Echocardiogr. 2008;9:381-383. PubMed
74. Alexander JH, Peterson ED, Chen AY, Harding TM, Adams DB, Kisslo JA Jr.
Feasibility of point-of-care echocardiography by internal medicine house staff. Am
Heart J. 2004;147:476-481. PubMed
75. Angoff WH. Scales, norms and equivalent Scores. Washington, DC: American
Council on Education; 1971.
76. Hellmann DB, Whiting-O’Keefe Q, Shapiro EP, Martin LD, Martire C, Ziegelstein
RC. The rate at which residents learn to use hand-held echocardiography at
the bedside. Am J Med. 2005;118:1010-1018. PubMed
77. Kimura BJ, Amundson SA, Phan JN, Agan DL, Shaw DJ. Observations during
development of an internal medicine residency training program in cardiovascular
limited ultrasound examination. J Hosp Med. 2012;7:537-542. PubMed
78. Akhtar S, Theodoro D, Gaspari R, et al. Resident training in emergency ultrasound:
consensus recommendations from the 2008 Council of Emergency Medicine
Residency Directors Conference. Acad Emerg Med. 2009;16(s2):S32-S36. PubMed
79. Ma OJ, Gaddis G, Norvell JG, Subramanian S. How fast is the focused assessment
with sonography for trauma examination learning curve? Emerg Med Australas.
2008;20(1):32-37. PubMed
80. Gaspari RJ, Dickman E, Blehar D. Learning curve of bedside ultrasound of the gallbladder. J Emerg Med. 2009;37(1):51-56. DOI:10.1016/j.jemermed.2007.10.070. PubMed
81. Ericsson KA, Lehmann AC. Expert and exceptional performance: Evidence of
maximal adaptation to task constraints. Ann Rev Psychol. 1996;47:273-305. PubMed
82. Ericcson KA, Krampe RT, Tesch-Romer C. The role of deliberate practice in the
acquisition of expert performance. Psychol Rev. 1993;100:363-406.
83. OPPE and FPPE: Tools to help make privileging decisions. The Joint Commission.
2013. http://www.jointcommission.org/jc_physician_blog/oppe_fppe_tools_privileging_
decisions/ Accessed October 26, 2016.
84. American Medical Association. Physicians’ Current Procedural Terminology (CPT)
2011. American Medical Association, Chicago; 2011.
85. Moore CL, Gregg S, Lambert M. Performance, training, quality assurance, and
reimbursement of emergency physician-performed ultrasonography at academic
medical centers. J Ultrasound Med. 2004;23(4):459-466. PubMed
86. Critical Care Ultrasonography Certificate of Completion Program. CHEST.
American College of Chest Physicians. http://www.chestnet.org/Education/Advanced-
Clinical-Training/Certificate-of-Completion-Program/Critical-Care-Ultrasonography.
Accessed July 28, 2017.
© 2017 Society of Hospital Medicine
The Weekend Effect in Hospitalized Patients: A Meta-Analysis
The presence of a “weekend effect” (increased mortality rate during Saturday and/or Sunday admissions) for hospitalized inpatients is uncertain. Several observational studies1-3 suggested a positive correlation between weekend admission and increased mortality, whereas other studies demonstrated no correlation4-6 or mixed results.7,8 The majority of studies have been published only within the last decade.
Several possible reasons are cited to explain the weekend effect. Decreased and presence of inexperienced staffing on weekends may contribute to a deficit in care.7,9,10 Patients admitted during the weekend may be less likely to undergo procedures or have significant delays before receiving needed intervention.11-13 Another possibility is that there may be differences in severity of illness or comorbidities in patients admitted during the weekend compared with those admitted during the remainder of the week. Due to inconsistency between studies regarding the existence of such an effect, we performed a meta-analysis in hospitalized inpatients to delineate whether or not there is a weekend effect on mortality.
METHODS
Data Sources and Searches
This study was exempt from institutional review board review, and we utilized the recommendations from the Meta-analysis of Observational Studies in Epidemiology statement. We examined the mortality rate for hospital inpatients admitted during the weekend (weekend death) compared with the mortality rate for those admitted during the workweek (workweek death). We performed a literature search (January 1966−April 2013) of multiple databases, including PubMed, EMBASE, SCOPUS, and the Cochrane library (see Appendix). Two reviewers (LP, RJP) independently evaluated the full article of each abstract. Any disputes were resolved by a third reviewer (CW). Bibliographic references were hand searched for additional literature.
Study Selection
To be included in the systematic review, the study had to provide discrete mortality data on the weekends (including holidays) versus weekdays, include patients who were admitted as inpatients over the weekend, and be published in the English language. We excluded studies that combined weekend with weekday “off hours” (eg, weekday night shift) data, which could not be extracted or analyzed separately.
Data Extraction and Quality Assessment
Once an article was accepted to be included for the systematic review, the authors extracted relevant data if available, including study location, number and type of patients studied, patient comorbidity data, procedure-related data (type of procedure, difference in rate of procedure and time to procedure performed for both weekday and weekends), any stated and/or implied differences in staffing patterns between weekend and weekdays, and definition of mortality. We used the Newcastle-Ottawa Quality Assessment Scale to assess the quality of methodological reporting of the study.14 The definition of weekend and extraction and classification of data (weekend versus weekday) was based on the original study definition. We made no attempt to impose a universal definition of “weekend” on all studies. Similarly, the definition of mortality (eg, 3-/7-/30-day) was based according to the original study definition. Death from a patient admitted on the weekend was defined as a “weekend death” (regardless of ultimate time of death) and similarly, death from a patient admitted on a weekday was defined as a “weekday death.” Although some articles provided specific information on healthcare worker staffing patterns between weekends and weekdays, differences in weekend versus weekday staffing were implied in many articles. In these studies, staffing paradigms were considered to be different between weekend and weekdays if there were specific descriptions of the type of hospitals (urban versus rural, teaching versus nonteaching, large versus small) in the database, which would imply a typical routine staffing pattern as currently occurs in most hospitals (ie, generally less healthcare worker staff on weekends). We only included data that provided times (mean minutes/hours) from admission to the specific intervention and that provided actual rates of intervention performed for both weekend and weekday patients. We only included data that provided an actual rate of intervention performed for both weekend and weekday patients. With regard to patient comorbidities or illness severity index, we used the original studies classification (defined by the original manuscripts), which might include widely accepted global indices or a listing of specific comorbidities and/or physiologic parameters present on admission.
Data Synthesis and Analysis
We used a random effects meta-analysis approach for estimating an overall relative risk (RR) and risk differences of mortality for weekends versus weekdays, as well as subgroup specific estimates, and for computing confidence limits. The DerSimonian and Laird approach was used to estimate the random effects. Within each of the 4 subgroups (weekend staffing, procedure rates and delays, illness severity), we grouped each qualified individual study by the presence of a difference (ie, difference, no difference, or mixed) and then pooled the mortality rates for all of the studies in that group. For instance, in the subgroup of staffing, we sorted available studies by whether weekend staffing was the same or decreased versus weekday staffing, then pooled the mortality rates for studies where staffing levels were the same (versus weekday) and also separately pooled studies where staffing levels were decreased (versus weekday). Data were managed with Stata 13 (Stata Statistical Software: Release 13; StataCorp. 2013, College Station, TX) and R, and all meta-analyses were performed with the metafor package in R.15 Pooled estimated are presented as RR (95% confidence intervals [CI]).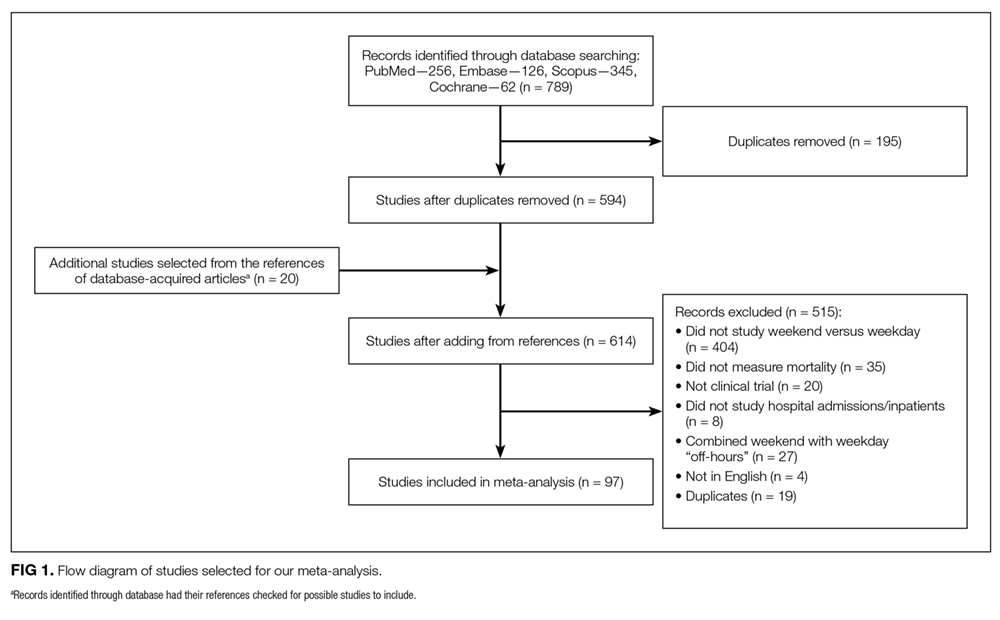
RESULTS
A literature search retrieved a total of 594 unique citations. A review of the bibliographic references yielded an additional 20 articles. Upon evaluation, 97 studies (N = 51,114,109 patients) met inclusion criteria (Figure 1). The articles were published between 2001–2012; the kappa statistic comparing interrater reliability in the selection of articles was 0.86. Supplementary Tables 1 and 2 present a summary of study characteristics and outcomes of the accepted articles. A summary of accepted studies is in Supplementary Table 1. When summing the total number of subjects across all 97 articles, 76% were classified as weekday and 24% were weekend patients.
Weekend Admission/Inpatient Status and Mortality
The definition of the weekend varied among the included studies. The weekend time period was delineated as Friday midnight to Sunday midnight in 66% (65/99) of the studies. The remaining studies typically defined the weekend to be between Friday evening and Monday morning although studies from the Middle East generally defined the weekend as Wednesday/Thursday through Saturday. The definition of mortality also varied among researchers with most studies describing death rate as hospital inpatient mortality although some studies also examined multiple definitions of mortality (eg, 30-day all-cause mortality and hospital inpatient mortality). Not all studies provided a specific timeframe for mortality.
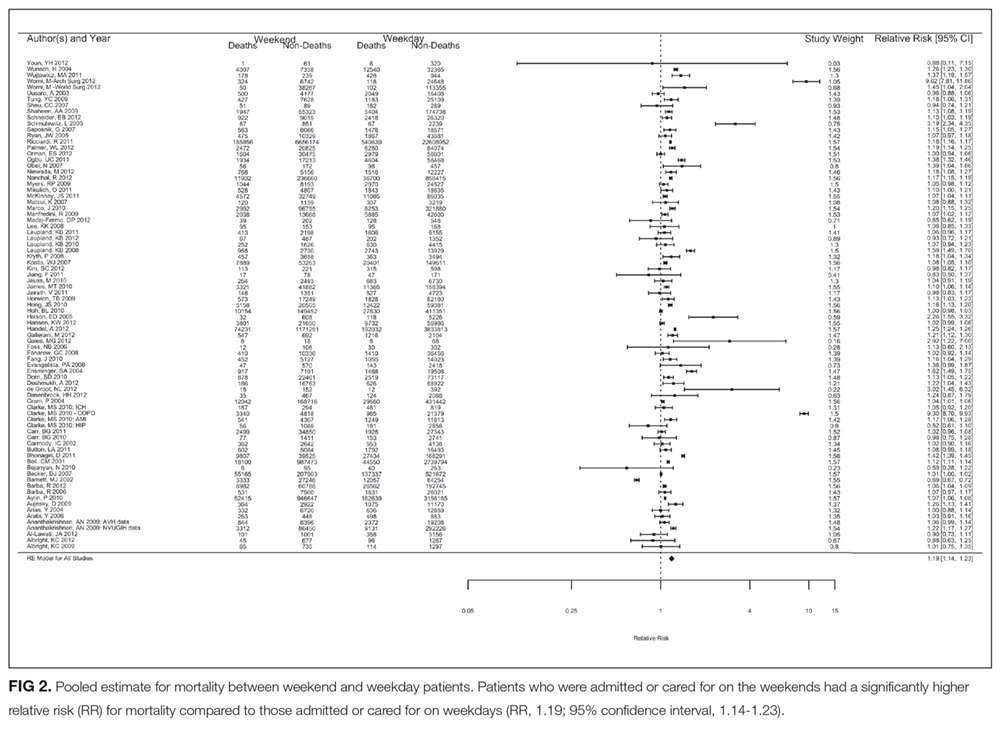
Fifty studies did not report a specific time frame for deaths. When a specific time frame for death was reported, the most common reported time frame was 30 days (n = 15 studies) and risk of mortality at 30 days still was higher for weekends (RR = 1.07; 95% CI,1.03-1.12; I2 = 90%). When we restricted the analysis to the studies that specified any timeframe for mortality (n = 49 studies), the risk of mortality was still significantly higher for weekends (RR = 1.12; 95% CI,1.09-1.15; I2 = 95%).
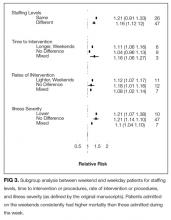
Weekend Effect Factors
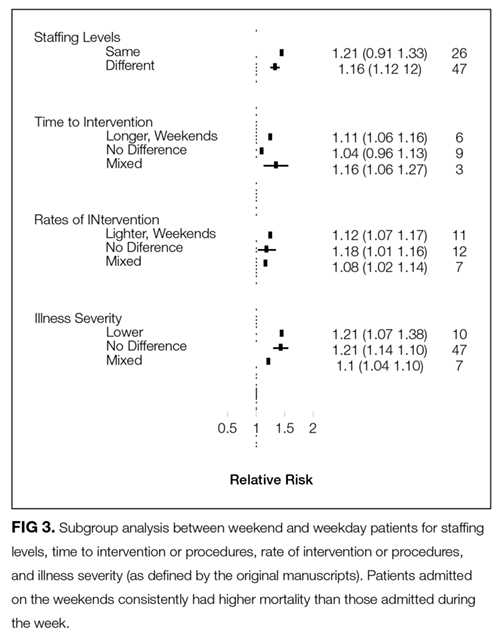
We also performed subgroup analyses to investigate the overall weekend effect by hospital level factors (weekend staffing, procedure rates and delays, illness severity). Complete data were not available for all studies (staffing levels = 73 studies, time to intervention = 18 studies, rate of intervention = 30 studies, illness severity = 64 studies). Patients admitted on the weekends consistently had higher mortality than those admitted during the week, regardless of the levels of weekend/weekday differences in staffing, procedure rates and delays, illness severity (Figure 3). Analysis of studies that included staffing data for weekends revealed that decreased staffing levels on the weekends was associated with a higher mortality for weekend patients (RR = 1.16; 95% CI, 1.12-1.20; I2 = 99%; Figure 3). There was no difference in mortality for weekend patients when staffing was similar to that for the weekdays (RR = 1.21; 95% CI, 0.91-1.63; I2 = 99%).
Analysis for weekend data revealed that longer times to interventions on weekends were associated with significantly higher mortality rates (RR = 1.11; 95% CI, 1.08-1.15; I2 = 0%; Figure 3). When there were no delays to weekend procedure/interventions, there was no difference in mortality between weekend and weekday procedures/interventions (RR = 1.04; 95% CI, 0.96-1.13; I2 = 55%; Figure 3). Some articles included several procedures with “mixed” results (some procedures were “positive,” while other were “negative” for increased mortality). In studies that showed a mixed result for time to intervention, there was a significant increase in mortality (RR = 1.16; 95% CI, 1.06-1.27; I2 = 42%) for weekend patients (Figure 3).
Analyses showed a higher mortality rate on the weekends regardless of whether the rate of intervention/procedures was lower (RR=1.12; 95% CI, 1.07-1.17; I2 = 79%) or the same between weekend and weekdays (RR = 1.08; 95% CI, 1.01-1.16; I2 = 90%; Figure 3). Analyses showed a higher mortality rate on the weekends regardless of whether the illness severity was higher on the weekends (RR = 1.21; 95% CI, 1.07-1.38; I2 = 99%) or the same (RR = 1.21; 95% CI, 1.14-1.28; I2 = 99%) versus that for weekday patients (Figure 3). An inverse funnel plot for publication bias is shown in Figure 4.
DISCUSSION
We have presented one of the first meta-analyses to examine the mortality rate for hospital inpatients admitted during the weekend compared with those admitted during the workweek. We found that patients admitted on the weekends had a significantly higher overall mortality (RR = 1.19; 95% CI, 1.14-1.23; risk difference = 0.014; 95% CI, 0.013-0.016). This association was not modified by differences in weekday and weekend staffing patterns, and other hospital characteristics. Previous systematic reviews have been exclusive to the intensive care unit setting16 or did not specifically examine weekend mortality, which was a component of “off-shift” and/or “after-hours” care.17
These findings should be placed in the context of the recently published literature.18,19 A meta-analysis of cohort studies found that off-hour admission was associated with increased mortality for 28 diseases although the associations varied considerably for different diseases.18 Likewise, a meta-analysis of 21 cohort studies noted that off-hour presentation for patients with acute ischemic stroke was associated with significantly higher short-term mortality.19 Our results of increased weekend mortality corroborate that found in these two meta-analyses. However, our study differs in that we specifically examined only weekend mortality and did not include after-hours care on weekdays, which was included in the off-hour mortality in the other meta-analyses.18,19
Differences in healthcare worker staffing between weekends and weekdays have been proposed to contribute to the observed increase in mortality.7,16,20 Data indicate that lower levels of nursing are associated with increased mortality.10,21-23 The presence of less experienced and/or fewer physician specialists may contribute to increases in mortality.24-26 Fewer or less experienced staff during weekends may contribute to inadequacies in patient handovers and/or handoffs, delays in patient assessment and/or interventions, and overall continuity of care for newly admitted patients.27-33
Our data show little conclusive evidence that the weekend mortality versus weekday mortality vary by staffing level differences. While the estimated RR of mortality differs in magnitude for facilities with no difference in weekend and weekday staffing versus those that have a difference in staffing levels, both estimate an increased mortality on weekends, and the difference in these effects is not statistically significant. It should be noted that there was no difference in mortality for weekend (versus weekday) patients where there was no difference between weekend and weekday staffing; these studies were typically in high acuity units or centers where the general expectation is for 24/7/365 uniform staffing coverage.
A decrease in the use of interventions and/or procedures on weekends has been suggested to contribute to increases in mortality for patients admitted on the weekends.34 Several studies have associated lower weekend rates to higher mortality for a variety of interventions,13,35-37 although some other studies have suggested that lower procedure rates on weekends have no effect on mortality.38-40 Lower diagnostic procedure weekend rates linked to higher mortality rates may exacerbate underlying healthcare disparities.41 Our results do not conclusively show that a decrease rate of intervention and/or procedures for weekends patients is associated with a higher risk of mortality for weekends compared to weekdays.
Delays in intervention and/or procedure on weekends have also been suggested to contribute to increases in mortality.34,42 Similar to that seen with lower rates of diagnostic or therapeutic intervention and/or procedure performed on weekends, delays in potentially critical intervention and/or procedures might ultimately manifest as an increase in mortality.43 Patients admitted to the hospital on weekends and requiring an early procedure were less likely to receive it within 2 days of admission.42 Several studies have shown an association between delays in diagnostic or therapeutic intervention and/or procedure on weekends to a higher hospital inpatient mortality35,42,44,45; however, some data suggested that a delay in time to procedure on weekends may not always be associated with increased mortality.46 Depending on the procedure, there may be a threshold below which the effect of reducing delay times will have no effect on mortality rates.47,48
Patients admitted on the weekends may be different (in the severity of illness and/or comorbidities) than those admitted during the workweek and these potential differences may be a factor for increases in mortality for weekend patients. Whether there is a selection bias for weekend versus weekday patients is not clear.34 This is a complex issue as there is significant heterogeneity in patient case mix depending on the specific disease or condition studied. For instance, one would expect that weekend trauma patients would be different than those seen during the regular workweek.49 Some large scale studies suggest that weekend patients may not be more sick than weekday patients and that any increase in weekend mortality is probably not due to factors such as severity of illness.1,7 Although we were unable to determine if there was an overall difference in illness severity between weekend and weekday patients due to the wide variety of assessments used for illness severity, our results showed statistically comparable higher mortality rate on the weekends regardless of whether the illness severity was higher, the same, or mixed between weekend and weekday patients, suggesting that general illness severity per se may not be as important as the weekend effect on mortality; however, illness severity may still have an important effect on mortality for more specific subgroups (eg, trauma).49
There are several implications of our results. We found a mean increased RR mortality of approximately 19% for patients admitted on the weekends, a number similar to one of the largest published observational studies containing almost 5 million subjects.2 Even if we took a more conservative estimate of 10% increased risk of weekend mortality, this would be equivalent to an excess of 25,000 preventable deaths per year. If the weekend effect were to be placed in context of a public health issue, the weekend effect would be the number 8 cause of death below the 29,000 deaths due to gun violence, but above the 20,000 deaths resulting from sexual behavior (sexual transmitted diseases) in 2000.3, 50,51 Although our data suggest that staffing shortfalls and decreases or delays for procedures on weekends may be associated with an increased mortality for patients admitted on the weekends, further large-scale studies are needed to confirm these findings. Increasing nurse and physician staffing levels and skill mix to cover any potential shortfall on weekends may be expensive, although theoretically, there may be savings accrued from reduced adverse events and shorter length of stay.26,52 Changes to weekend care might only benefit daytime hospitalizations because some studies have shown increased mortality during nighttime regardless of weekend or weekday admission.53
Several methodologic points in our study need to be clarified. We excluded many studies which examined the relationship of off-hours or after-hours admissions and mortality as off-hours studies typically combined weekend and after-hours weekday data. Some studies suggest that off-hour admission may be associated with increased mortality and delays in time for critical procedures during off-hours.18,19 This is a complex topic, but it is clear that the risks of hospitalization vary not just by the day of the week but also by time of the day.54 The use of meta-analyses of nonrandomized trials has been somewhat controversial,55,56 and there may be significant bias or confounding in the pooling of highly varied studies. It is important to keep in mind that there are very different definitions of weekends, populations studied, and measures of mortality rates, even as the pooled statistic suggests a homogeneity among the studies that does not exist.
There are several limitations to our study. Our systematic review may be seen as limited as we included only English language papers. In addition, we did not search nontraditional sources and abstracts. We accepted the definition of a weekend as defined by the original study, which resulted in varied definitions of weekend time period and mortality. There was a lack of specific data on staffing patterns and procedures in many studies, particularly those using databases. We were not able to further subdivide our analysis by admitting service. We were not able to undertake a subgroup analysis by country or continent, which may have implications on the effect of different healthcare systems on healthcare quality. It is unclear whether correlations in our study are a direct consequence of poorer weekend care or are the result of other unknown or unexamined differences between weekend and weekday patient populations.34,57 For instance, there may be other global factors (higher rates of medical errors, higher hospital volumes) which may not be specifically related to weekend care and therefore not been accounted for in many of the studies we examined.10,27,58-61 There may be potential bias of patient phenotypes (are weekend patients different than weekday patients?) admitted on the weekend. Holidays were included in the weekend data and it is not clear how this would affect our findings as some data suggest that there is a significantly higher mortality rate on holidays (versus weekends or weekdays),61 while other data do not.62 There was no universal definition for the timeframe for a weekend and as such, we had to rely on the original article for their determination and definition of weekend versus weekday death.
In summary, our meta-analysis suggests that hospital inpatients admitted during the weekend have a significantly increased mortality compared with those admitted on weekday. While none of our subgroup analyses showed strong evidence on effect modification, the interpretation of these results is hampered by the relatively small number of studies. Further research should be directed to determine the presence of causality between various factors purported to affect mortality and it is possible that we ultimately find that the weekend effect may exist for some but not all patients.
Acknowledgments
The authors would like to acknowledge Jaime Blanck, MLIS, MPA, AHIP, Clinical Informationist, Welch Medical Library, for her invaluable assistance in undertaking the literature searches for this manuscript.
Disclosure
This manuscript has been supported by the Department of Anesthesiology and Critical Care Medicine; The Johns Hopkins School of Medicine; Baltimore, Maryland. There are no relevant conflicts of interests.
1. Aylin P, Yunus A, Bottle A, Majeed A, Bell D. Weekend mortality for emergency
admissions. A large, multicentre study. Qual Saf Health Care. 2010;19(3):213-217. PubMed
2. Handel AE, Patel SV, Skingsley A, Bramley K, Sobieski R, Ramagopalan SV.
Weekend admissions as an independent predictor of mortality: an analysis of
Scottish hospital admissions. BMJ Open. 2012;2(6): pii: e001789. PubMed
3. Ricciardi R, Roberts PL, Read TE, Baxter NN, Marcello PW, Schoetz DJ. Mortality
rate after nonelective hospital admission. Arch Surg. 2011;146(5):545-551. PubMed
4. Fonarow GC, Abraham WT, Albert NM, et al. Day of admission and clinical
outcomes for patients hospitalized for heart failure: findings from the Organized
Program to Initiate Lifesaving Treatment in Hospitalized Patients With Heart
Failure (OPTIMIZE-HF). Circ Heart Fail. 2008;1(1):50-57. PubMed
5. Hoh BL, Chi YY, Waters MF, Mocco J, Barker FG 2nd. Effect of weekend compared
with weekday stroke admission on thrombolytic use, in-hospital mortality,
discharge disposition, hospital charges, and length of stay in the Nationwide Inpatient
Sample Database, 2002 to 2007. Stroke. 2010;41(10):2323-2328. PubMed
6. Koike S, Tanabe S, Ogawa T, et al. Effect of time and day of admission on 1-month
survival and neurologically favourable 1-month survival in out-of-hospital cardiopulmonary
arrest patients. Resuscitation. 2011;82(7):863-868. PubMed
7. Bell CM, Redelmeier DA. Mortality among patients admitted to hospitals on
weekends as compared with weekdays. N Engl J Med. 2001;345(9):663-668. PubMed
8. Freemantle N, Richardson M, Wood J, et al. Weekend hospitalization and additional
risk of death: an analysis of inpatient data. J R Soc Med. 2012;105(2):74-84. PubMed
9. Schilling PL, Campbell DA Jr, Englesbe MJ, Davis MM. A comparison of in-hospital
mortality risk conferred by high hospital occupancy, differences in nurse
staffing levels, weekend admission, and seasonal influenza. Med Care. 2010;48(3):
224-232. PubMed
10. Wong HJ, Morra D. Excellent hospital care for all: open and operating 24/7. J Gen
Intern Med. 2011;26(9):1050-1052. PubMed
11. Dorn SD, Shah ND, Berg BP, Naessens JM. Effect of weekend hospital admission
on gastrointestinal hemorrhage outcomes. Dig Dis Sci. 2010;55(6):1658-1666. PubMed
12. Kostis WJ, Demissie K, Marcella SW, et al. Weekend versus weekday admission
and mortality from myocardial infarction. N Engl J Med. 2007;356(11):1099-1109. PubMed
13. McKinney JS, Deng Y, Kasner SE, Kostis JB; Myocardial Infarction Data Acquisition
System (MIDAS 15) Study Group. Comprehensive stroke centers overcome
the weekend versus weekday gap in stroke treatment and mortality. Stroke.
2011;42(9):2403-2409. PubMed
14. Margulis AV, Pladevall M, Riera-Guardia N, et al. Quality assessment of observational
studies in a drug-safety systematic review, comparison of two tools: the
Newcastle-Ottawa Scale and the RTI item bank. Clin Epidemiol. 2014;6:359-368. PubMed
15. Viechtbauer W. Conducting meta-analyses in R with the metafor package. J Stat
Softw. 2010;36(3):1-48.
16. Cavallazzi R, Marik PE, Hirani A, Pachinburavan M, Vasu TS, Leiby BE. Association
between time of admission to the ICU and mortality: a systematic review and
metaanalysis. Chest. 2010;138(1):68-75. PubMed
17. de Cordova PB, Phibbs CS, Bartel AP, Stone PW. Twenty-four/seven: a
mixed-method systematic review of the off-shift literature. J Adv Nurs.
2012;68(7):1454-1468. PubMed
18. Zhou Y, Li W, Herath C, Xia J, Hu B, Song F, Cao S, Lu Z. Off-hour admission and
mortality risk for 28 specific diseases: a systematic review and meta-analysis of 251
cohorts. J Am Heart Assoc. 2016;5(3):e003102. PubMed
19. Sorita A, Ahmed A, Starr SR, et al. Off-hour presentation and outcomes in
patients with acute myocardial infarction: systematic review and meta-analysis.
BMJ. 2014;348:f7393. PubMed
20. Ricciardi R, Nelson J, Roberts PL, Marcello PW, Read TE, Schoetz DJ. Is the
presence of medical trainees associated with increased mortality with weekend
admission? BMC Med Educ. 2014;14(1):4. PubMed
21. Needleman J, Buerhaus P, Pankratz VS, Leibson CL, Stevens SR, Harris M. Nurse
staffing and inpatient hospital mortality. N Engl J Med. 2011;364(11):1037-1045. PubMed
22. Aiken LH, Clarke SP, Sloane DM, Sochalski J, Silber JH. Hospital nurse
staffing and patient mortality, nurse burnout, and job dissatisfaction. JAMA.
2002;288(16):1987-1993. PubMed
23. Hamilton KE, Redshaw ME, Tarnow-Mordi W. Nurse staffing in relation to
risk-adjusted mortality in neonatal care. Arch Dis Child Fetal Neonatal Ed.
2007;92(2):F99-F103. PubMed
766 An Official Publication of the Society of Hospital Medicine Journal of Hospital Medicine Vol 12 | No 9 | September 2017
Pauls et al | The Weekend Effect: A Meta-Analysis
24. Haut ER, Chang DC, Efron DT, Cornwell EE 3rd. Injured patients have lower
mortality when treated by “full-time” trauma surgeons vs. surgeons who cover
trauma “part-time”. J Trauma. 2006;61(2):272-278. PubMed
25. Wallace DJ, Angus DC, Barnato AE, Kramer AA, Kahn JM. Nighttime intensivist
staffing and mortality among critically ill patients. N Engl J Med.
2012;366(22):2093-2101. PubMed
26. Pronovost PJ, Angus DC, Dorman T, Robinson KA, Dremsizov TT, Young TL.
Physician staffing patterns and clinical outcomes in critically ill patients: a systematic
review. JAMA. 2002;288(17):2151-2162. PubMed
27. Weissman JS, Rothschild JM, Bendavid E, et al. Hospital workload and adverse
events. Med Care. 2007;45(5):448-455. PubMed
28. Hamilton P, Eschiti VS, Hernandez K, Neill D. Differences between weekend and
weekday nurse work environments and patient outcomes: a focus group approach
to model testing. J Perinat Neonatal Nurs. 2007;21(4):331-341. PubMed
29. Johner AM, Merchant S, Aslani N, et al Acute general surgery in Canada: a survey
of current handover practices. Can J Surg. 2013;56(3):E24-E28. PubMed
30. de Cordova PB, Phibbs CS, Stone PW. Perceptions and observations of off-shift
nursing. J Nurs Manag. 2013;21(2):283-292. PubMed
31. Pfeffer PE, Nazareth D, Main N, Hardoon S, Choudhury AB. Are weekend
handovers of adequate quality for the on-call general medical team? Clin Med.
2011;11(6):536-540. PubMed
32. Eschiti V, Hamilton P. Off-peak nurse staffing: critical-care nurses speak. Dimens
Crit Care Nurs. 2011;30(1):62-69. PubMed
33. Button LA, Roberts SE, Evans PA, et al. Hospitalized incidence and case fatality
for upper gastrointestinal bleeding from 1999 to 2007: a record linkage study. Aliment
Pharmacol Ther. 2011;33(1):64-76. PubMed
34. Becker DJ. Weekend hospitalization and mortality: a critical review. Expert Rev
Pharmacoecon Outcomes Res. 2008;8(1):23-26. PubMed
35. Deshmukh A, Pant S, Kumar G, Bursac Z, Paydak H, Mehta JL. Comparison of
outcomes of weekend versus weekday admissions for atrial fibrillation. Am J Cardiol.
2012;110(2):208-211. PubMed
36. Nanchal R, Kumar G, Taneja A, et al. Pulmonary embolism: the weekend effect.
Chest. 2012;142(3):690-696. PubMed
37. Palmer WL, Bottle A, Davie C, Vincent CA, Aylin P. Dying for the weekend: a
retrospective cohort study on the association between day of hospital presentation
and the quality and safety of stroke care. Arch Neurol. 2012;69(10):1296-1302. PubMed
38. Dasenbrock HH, Pradilla G, Witham TF, Gokaslan ZL, Bydon A. The impact
of weekend hospital admission on the timing of intervention and outcomes after
surgery for spinal metastases. Neurosurgery. 2012;70(3):586-593. PubMed
39. Jairath V, Kahan BC, Logan RF, et al. Mortality from acute upper gastrointestinal
bleeding in the United Kingdom: does it display a “weekend effect”? Am J Gastroenterol.
2011;106(9):1621-1628. PubMed
40. Myers RP, Kaplan GG, Shaheen AM. The effect of weekend versus weekday
admission on outcomes of esophageal variceal hemorrhage. Can J Gastroenterol.
2009;23(7):495-501. PubMed
41. Rudd AG, Hoffman A, Down C, Pearson M, Lowe D. Access to stroke care in
England, Wales and Northern Ireland: the effect of age, gender and weekend admission.
Age Ageing. 2007;36(3):247-255. PubMed
42. Lapointe-Shaw L, Abushomar H, Chen XK, et al. Care and outcomes of patients
with cancer admitted to the hospital on weekends and holidays: a retrospective
cohort study. J Natl Compr Canc Netw. 2016;14(7):867-874. PubMed
43. Chan PS, Krumholz HM, Nichol G, Nallamothu BK; American Heart Association
National Registry of Cardiopulmonary Resuscitation Investigators. Delayed time to
defibrillation after in-hospital cardiac arrest. N Engl J Med. 2008;358(1):9-17. PubMed
44. McGuire KJ, Bernstein J, Polsky D, Silber JH. The 2004 Marshall Urist Award:
Delays until surgery after hip fracture increases mortality. Clin Orthop Relat Res.
2004;(428):294-301. PubMed
45. Krüth P, Zeymer U, Gitt A, et al. Influence of presentation at the weekend on
treatment and outcome in ST-elevation myocardial infarction in hospitals with
catheterization laboratories. Clin Res Cardiol. 2008;97(10):742-747. PubMed
46. Jneid H, Fonarow GC, Cannon CP, et al. Impact of time of presentation on the care
and outcomes of acute myocardial infarction. Circulation. 2008;117(19):2502-2509. PubMed
47. Menees DS, Peterson ED, Wang Y, et al. Door-to-balloon time and mortality
among patients undergoing primary PCI. N Engl J Med. 2013;369(10):901-909. PubMed
48. Bates ER, Jacobs AK. Time to treatment in patients with STEMI. N Engl J Med.
2013;369(10):889-892. PubMed
49. Carmody IC, Romero J, Velmahos GC. Day for night: should we staff a trauma
center like a nightclub? Am Surg. 2002;68(12):1048-1051. PubMed
50. Mokdad AH, Marks JS, Stroup DF, Gerberding JL. Actual causes of death in the
United States, 2000. JAMA. 2004;291(10):1238-1245. PubMed
51. McCook A. More hospital deaths on weekends. http://www.reuters.com/article/
2011/05/20/us-more-hospital-deaths-weekends-idUSTRE74J5RM20110520.
Accessed March 7, 2017.
52. Mourad M, Adler J. Safe, high quality care around the clock: what will it take to
get us there? J Gen Intern Med. 2011;26(9):948-950. PubMed
53. Magid DJ, Wang Y, Herrin J, et al. Relationship between time of day, day of week,
timeliness of reperfusion, and in-hospital mortality for patients with acute ST-segment
elevation myocardial infarction. JAMA. 2005;294(7):803-812. PubMed
54. Coiera E, Wang Y, Magrabi F, Concha OP, Gallego B, Runciman W. Predicting
the cumulative risk of death during hospitalization by modeling weekend, weekday
and diurnal mortality risks. BMC Health Serv Res. 2014;14:226. PubMed
55. Greenland S. Can meta-analysis be salvaged? Am J Epidemiol. 1994;140(9):783-787. PubMed
56. Shapiro S. Meta-analysis/Shmeta-analysis. Am J Epidemiol. 1994;140(9):771-778. PubMed
57. Halm EA, Chassin MR. Why do hospital death rates vary? N Engl J Med.
2001;345(9):692-694. PubMed
58. Birkmeyer JD, Siewers AE, Finlayson EV, et al. Hospital volume and surgical mortality
in the United States. N Engl J Med. 2002;346(15):1128-1137. PubMed
59. Kaier K, Mutters NT, Frank U. Bed occupancy rates and hospital-acquired infections
– should beds be kept empty? Clin Microbiol Infect. 2012;18(10):941-945. PubMed
60. Chrusch CA, Olafson KP, McMillian PM, Roberts DE, Gray PR. High occupancy
increases the risk of early death or readmission after transfer from intensive care.
Crit Care Med. 2009;37(10):2753-2758. PubMed
61. Foss NB, Kehlet H. Short-term mortality in hip fracture patients admitted during
weekends and holidays. Br J Anaesth. 2006;96(4):450-454. PubMed
62. Daugaard CL, Jørgensen HL, Riis T, Lauritzen JB, Duus BR, van der Mark S. Is
mortality after hip fracture associated with surgical delay or admission during
weekends and public holidays? A retrospective study of 38,020 patients. Acta Orthop.
2012;83(6):609-613. PubMed
The presence of a “weekend effect” (increased mortality rate during Saturday and/or Sunday admissions) for hospitalized inpatients is uncertain. Several observational studies1-3 suggested a positive correlation between weekend admission and increased mortality, whereas other studies demonstrated no correlation4-6 or mixed results.7,8 The majority of studies have been published only within the last decade.
Several possible reasons are cited to explain the weekend effect. Decreased and presence of inexperienced staffing on weekends may contribute to a deficit in care.7,9,10 Patients admitted during the weekend may be less likely to undergo procedures or have significant delays before receiving needed intervention.11-13 Another possibility is that there may be differences in severity of illness or comorbidities in patients admitted during the weekend compared with those admitted during the remainder of the week. Due to inconsistency between studies regarding the existence of such an effect, we performed a meta-analysis in hospitalized inpatients to delineate whether or not there is a weekend effect on mortality.
METHODS
Data Sources and Searches
This study was exempt from institutional review board review, and we utilized the recommendations from the Meta-analysis of Observational Studies in Epidemiology statement. We examined the mortality rate for hospital inpatients admitted during the weekend (weekend death) compared with the mortality rate for those admitted during the workweek (workweek death). We performed a literature search (January 1966−April 2013) of multiple databases, including PubMed, EMBASE, SCOPUS, and the Cochrane library (see Appendix). Two reviewers (LP, RJP) independently evaluated the full article of each abstract. Any disputes were resolved by a third reviewer (CW). Bibliographic references were hand searched for additional literature.
Study Selection
To be included in the systematic review, the study had to provide discrete mortality data on the weekends (including holidays) versus weekdays, include patients who were admitted as inpatients over the weekend, and be published in the English language. We excluded studies that combined weekend with weekday “off hours” (eg, weekday night shift) data, which could not be extracted or analyzed separately.
Data Extraction and Quality Assessment
Once an article was accepted to be included for the systematic review, the authors extracted relevant data if available, including study location, number and type of patients studied, patient comorbidity data, procedure-related data (type of procedure, difference in rate of procedure and time to procedure performed for both weekday and weekends), any stated and/or implied differences in staffing patterns between weekend and weekdays, and definition of mortality. We used the Newcastle-Ottawa Quality Assessment Scale to assess the quality of methodological reporting of the study.14 The definition of weekend and extraction and classification of data (weekend versus weekday) was based on the original study definition. We made no attempt to impose a universal definition of “weekend” on all studies. Similarly, the definition of mortality (eg, 3-/7-/30-day) was based according to the original study definition. Death from a patient admitted on the weekend was defined as a “weekend death” (regardless of ultimate time of death) and similarly, death from a patient admitted on a weekday was defined as a “weekday death.” Although some articles provided specific information on healthcare worker staffing patterns between weekends and weekdays, differences in weekend versus weekday staffing were implied in many articles. In these studies, staffing paradigms were considered to be different between weekend and weekdays if there were specific descriptions of the type of hospitals (urban versus rural, teaching versus nonteaching, large versus small) in the database, which would imply a typical routine staffing pattern as currently occurs in most hospitals (ie, generally less healthcare worker staff on weekends). We only included data that provided times (mean minutes/hours) from admission to the specific intervention and that provided actual rates of intervention performed for both weekend and weekday patients. We only included data that provided an actual rate of intervention performed for both weekend and weekday patients. With regard to patient comorbidities or illness severity index, we used the original studies classification (defined by the original manuscripts), which might include widely accepted global indices or a listing of specific comorbidities and/or physiologic parameters present on admission.
Data Synthesis and Analysis
We used a random effects meta-analysis approach for estimating an overall relative risk (RR) and risk differences of mortality for weekends versus weekdays, as well as subgroup specific estimates, and for computing confidence limits. The DerSimonian and Laird approach was used to estimate the random effects. Within each of the 4 subgroups (weekend staffing, procedure rates and delays, illness severity), we grouped each qualified individual study by the presence of a difference (ie, difference, no difference, or mixed) and then pooled the mortality rates for all of the studies in that group. For instance, in the subgroup of staffing, we sorted available studies by whether weekend staffing was the same or decreased versus weekday staffing, then pooled the mortality rates for studies where staffing levels were the same (versus weekday) and also separately pooled studies where staffing levels were decreased (versus weekday). Data were managed with Stata 13 (Stata Statistical Software: Release 13; StataCorp. 2013, College Station, TX) and R, and all meta-analyses were performed with the metafor package in R.15 Pooled estimated are presented as RR (95% confidence intervals [CI]).
RESULTS
A literature search retrieved a total of 594 unique citations. A review of the bibliographic references yielded an additional 20 articles. Upon evaluation, 97 studies (N = 51,114,109 patients) met inclusion criteria (Figure 1). The articles were published between 2001–2012; the kappa statistic comparing interrater reliability in the selection of articles was 0.86. Supplementary Tables 1 and 2 present a summary of study characteristics and outcomes of the accepted articles. A summary of accepted studies is in Supplementary Table 1. When summing the total number of subjects across all 97 articles, 76% were classified as weekday and 24% were weekend patients.
Weekend Admission/Inpatient Status and Mortality
The definition of the weekend varied among the included studies. The weekend time period was delineated as Friday midnight to Sunday midnight in 66% (65/99) of the studies. The remaining studies typically defined the weekend to be between Friday evening and Monday morning although studies from the Middle East generally defined the weekend as Wednesday/Thursday through Saturday. The definition of mortality also varied among researchers with most studies describing death rate as hospital inpatient mortality although some studies also examined multiple definitions of mortality (eg, 30-day all-cause mortality and hospital inpatient mortality). Not all studies provided a specific timeframe for mortality.
Fifty studies did not report a specific time frame for deaths. When a specific time frame for death was reported, the most common reported time frame was 30 days (n = 15 studies) and risk of mortality at 30 days still was higher for weekends (RR = 1.07; 95% CI,1.03-1.12; I2 = 90%). When we restricted the analysis to the studies that specified any timeframe for mortality (n = 49 studies), the risk of mortality was still significantly higher for weekends (RR = 1.12; 95% CI,1.09-1.15; I2 = 95%).
Weekend Effect Factors
We also performed subgroup analyses to investigate the overall weekend effect by hospital level factors (weekend staffing, procedure rates and delays, illness severity). Complete data were not available for all studies (staffing levels = 73 studies, time to intervention = 18 studies, rate of intervention = 30 studies, illness severity = 64 studies). Patients admitted on the weekends consistently had higher mortality than those admitted during the week, regardless of the levels of weekend/weekday differences in staffing, procedure rates and delays, illness severity (Figure 3). Analysis of studies that included staffing data for weekends revealed that decreased staffing levels on the weekends was associated with a higher mortality for weekend patients (RR = 1.16; 95% CI, 1.12-1.20; I2 = 99%; Figure 3). There was no difference in mortality for weekend patients when staffing was similar to that for the weekdays (RR = 1.21; 95% CI, 0.91-1.63; I2 = 99%).
Analysis for weekend data revealed that longer times to interventions on weekends were associated with significantly higher mortality rates (RR = 1.11; 95% CI, 1.08-1.15; I2 = 0%; Figure 3). When there were no delays to weekend procedure/interventions, there was no difference in mortality between weekend and weekday procedures/interventions (RR = 1.04; 95% CI, 0.96-1.13; I2 = 55%; Figure 3). Some articles included several procedures with “mixed” results (some procedures were “positive,” while other were “negative” for increased mortality). In studies that showed a mixed result for time to intervention, there was a significant increase in mortality (RR = 1.16; 95% CI, 1.06-1.27; I2 = 42%) for weekend patients (Figure 3).
Analyses showed a higher mortality rate on the weekends regardless of whether the rate of intervention/procedures was lower (RR=1.12; 95% CI, 1.07-1.17; I2 = 79%) or the same between weekend and weekdays (RR = 1.08; 95% CI, 1.01-1.16; I2 = 90%; Figure 3). Analyses showed a higher mortality rate on the weekends regardless of whether the illness severity was higher on the weekends (RR = 1.21; 95% CI, 1.07-1.38; I2 = 99%) or the same (RR = 1.21; 95% CI, 1.14-1.28; I2 = 99%) versus that for weekday patients (Figure 3). An inverse funnel plot for publication bias is shown in Figure 4.
DISCUSSION
We have presented one of the first meta-analyses to examine the mortality rate for hospital inpatients admitted during the weekend compared with those admitted during the workweek. We found that patients admitted on the weekends had a significantly higher overall mortality (RR = 1.19; 95% CI, 1.14-1.23; risk difference = 0.014; 95% CI, 0.013-0.016). This association was not modified by differences in weekday and weekend staffing patterns, and other hospital characteristics. Previous systematic reviews have been exclusive to the intensive care unit setting16 or did not specifically examine weekend mortality, which was a component of “off-shift” and/or “after-hours” care.17
These findings should be placed in the context of the recently published literature.18,19 A meta-analysis of cohort studies found that off-hour admission was associated with increased mortality for 28 diseases although the associations varied considerably for different diseases.18 Likewise, a meta-analysis of 21 cohort studies noted that off-hour presentation for patients with acute ischemic stroke was associated with significantly higher short-term mortality.19 Our results of increased weekend mortality corroborate that found in these two meta-analyses. However, our study differs in that we specifically examined only weekend mortality and did not include after-hours care on weekdays, which was included in the off-hour mortality in the other meta-analyses.18,19
Differences in healthcare worker staffing between weekends and weekdays have been proposed to contribute to the observed increase in mortality.7,16,20 Data indicate that lower levels of nursing are associated with increased mortality.10,21-23 The presence of less experienced and/or fewer physician specialists may contribute to increases in mortality.24-26 Fewer or less experienced staff during weekends may contribute to inadequacies in patient handovers and/or handoffs, delays in patient assessment and/or interventions, and overall continuity of care for newly admitted patients.27-33
Our data show little conclusive evidence that the weekend mortality versus weekday mortality vary by staffing level differences. While the estimated RR of mortality differs in magnitude for facilities with no difference in weekend and weekday staffing versus those that have a difference in staffing levels, both estimate an increased mortality on weekends, and the difference in these effects is not statistically significant. It should be noted that there was no difference in mortality for weekend (versus weekday) patients where there was no difference between weekend and weekday staffing; these studies were typically in high acuity units or centers where the general expectation is for 24/7/365 uniform staffing coverage.
A decrease in the use of interventions and/or procedures on weekends has been suggested to contribute to increases in mortality for patients admitted on the weekends.34 Several studies have associated lower weekend rates to higher mortality for a variety of interventions,13,35-37 although some other studies have suggested that lower procedure rates on weekends have no effect on mortality.38-40 Lower diagnostic procedure weekend rates linked to higher mortality rates may exacerbate underlying healthcare disparities.41 Our results do not conclusively show that a decrease rate of intervention and/or procedures for weekends patients is associated with a higher risk of mortality for weekends compared to weekdays.
Delays in intervention and/or procedure on weekends have also been suggested to contribute to increases in mortality.34,42 Similar to that seen with lower rates of diagnostic or therapeutic intervention and/or procedure performed on weekends, delays in potentially critical intervention and/or procedures might ultimately manifest as an increase in mortality.43 Patients admitted to the hospital on weekends and requiring an early procedure were less likely to receive it within 2 days of admission.42 Several studies have shown an association between delays in diagnostic or therapeutic intervention and/or procedure on weekends to a higher hospital inpatient mortality35,42,44,45; however, some data suggested that a delay in time to procedure on weekends may not always be associated with increased mortality.46 Depending on the procedure, there may be a threshold below which the effect of reducing delay times will have no effect on mortality rates.47,48
Patients admitted on the weekends may be different (in the severity of illness and/or comorbidities) than those admitted during the workweek and these potential differences may be a factor for increases in mortality for weekend patients. Whether there is a selection bias for weekend versus weekday patients is not clear.34 This is a complex issue as there is significant heterogeneity in patient case mix depending on the specific disease or condition studied. For instance, one would expect that weekend trauma patients would be different than those seen during the regular workweek.49 Some large scale studies suggest that weekend patients may not be more sick than weekday patients and that any increase in weekend mortality is probably not due to factors such as severity of illness.1,7 Although we were unable to determine if there was an overall difference in illness severity between weekend and weekday patients due to the wide variety of assessments used for illness severity, our results showed statistically comparable higher mortality rate on the weekends regardless of whether the illness severity was higher, the same, or mixed between weekend and weekday patients, suggesting that general illness severity per se may not be as important as the weekend effect on mortality; however, illness severity may still have an important effect on mortality for more specific subgroups (eg, trauma).49
There are several implications of our results. We found a mean increased RR mortality of approximately 19% for patients admitted on the weekends, a number similar to one of the largest published observational studies containing almost 5 million subjects.2 Even if we took a more conservative estimate of 10% increased risk of weekend mortality, this would be equivalent to an excess of 25,000 preventable deaths per year. If the weekend effect were to be placed in context of a public health issue, the weekend effect would be the number 8 cause of death below the 29,000 deaths due to gun violence, but above the 20,000 deaths resulting from sexual behavior (sexual transmitted diseases) in 2000.3, 50,51 Although our data suggest that staffing shortfalls and decreases or delays for procedures on weekends may be associated with an increased mortality for patients admitted on the weekends, further large-scale studies are needed to confirm these findings. Increasing nurse and physician staffing levels and skill mix to cover any potential shortfall on weekends may be expensive, although theoretically, there may be savings accrued from reduced adverse events and shorter length of stay.26,52 Changes to weekend care might only benefit daytime hospitalizations because some studies have shown increased mortality during nighttime regardless of weekend or weekday admission.53
Several methodologic points in our study need to be clarified. We excluded many studies which examined the relationship of off-hours or after-hours admissions and mortality as off-hours studies typically combined weekend and after-hours weekday data. Some studies suggest that off-hour admission may be associated with increased mortality and delays in time for critical procedures during off-hours.18,19 This is a complex topic, but it is clear that the risks of hospitalization vary not just by the day of the week but also by time of the day.54 The use of meta-analyses of nonrandomized trials has been somewhat controversial,55,56 and there may be significant bias or confounding in the pooling of highly varied studies. It is important to keep in mind that there are very different definitions of weekends, populations studied, and measures of mortality rates, even as the pooled statistic suggests a homogeneity among the studies that does not exist.
There are several limitations to our study. Our systematic review may be seen as limited as we included only English language papers. In addition, we did not search nontraditional sources and abstracts. We accepted the definition of a weekend as defined by the original study, which resulted in varied definitions of weekend time period and mortality. There was a lack of specific data on staffing patterns and procedures in many studies, particularly those using databases. We were not able to further subdivide our analysis by admitting service. We were not able to undertake a subgroup analysis by country or continent, which may have implications on the effect of different healthcare systems on healthcare quality. It is unclear whether correlations in our study are a direct consequence of poorer weekend care or are the result of other unknown or unexamined differences between weekend and weekday patient populations.34,57 For instance, there may be other global factors (higher rates of medical errors, higher hospital volumes) which may not be specifically related to weekend care and therefore not been accounted for in many of the studies we examined.10,27,58-61 There may be potential bias of patient phenotypes (are weekend patients different than weekday patients?) admitted on the weekend. Holidays were included in the weekend data and it is not clear how this would affect our findings as some data suggest that there is a significantly higher mortality rate on holidays (versus weekends or weekdays),61 while other data do not.62 There was no universal definition for the timeframe for a weekend and as such, we had to rely on the original article for their determination and definition of weekend versus weekday death.
In summary, our meta-analysis suggests that hospital inpatients admitted during the weekend have a significantly increased mortality compared with those admitted on weekday. While none of our subgroup analyses showed strong evidence on effect modification, the interpretation of these results is hampered by the relatively small number of studies. Further research should be directed to determine the presence of causality between various factors purported to affect mortality and it is possible that we ultimately find that the weekend effect may exist for some but not all patients.
Acknowledgments
The authors would like to acknowledge Jaime Blanck, MLIS, MPA, AHIP, Clinical Informationist, Welch Medical Library, for her invaluable assistance in undertaking the literature searches for this manuscript.
Disclosure
This manuscript has been supported by the Department of Anesthesiology and Critical Care Medicine; The Johns Hopkins School of Medicine; Baltimore, Maryland. There are no relevant conflicts of interests.
1. Aylin P, Yunus A, Bottle A, Majeed A, Bell D. Weekend mortality for emergency
admissions. A large, multicentre study. Qual Saf Health Care. 2010;19(3):213-217. PubMed
2. Handel AE, Patel SV, Skingsley A, Bramley K, Sobieski R, Ramagopalan SV.
Weekend admissions as an independent predictor of mortality: an analysis of
Scottish hospital admissions. BMJ Open. 2012;2(6): pii: e001789. PubMed
3. Ricciardi R, Roberts PL, Read TE, Baxter NN, Marcello PW, Schoetz DJ. Mortality
rate after nonelective hospital admission. Arch Surg. 2011;146(5):545-551. PubMed
4. Fonarow GC, Abraham WT, Albert NM, et al. Day of admission and clinical
outcomes for patients hospitalized for heart failure: findings from the Organized
Program to Initiate Lifesaving Treatment in Hospitalized Patients With Heart
Failure (OPTIMIZE-HF). Circ Heart Fail. 2008;1(1):50-57. PubMed
5. Hoh BL, Chi YY, Waters MF, Mocco J, Barker FG 2nd. Effect of weekend compared
with weekday stroke admission on thrombolytic use, in-hospital mortality,
discharge disposition, hospital charges, and length of stay in the Nationwide Inpatient
Sample Database, 2002 to 2007. Stroke. 2010;41(10):2323-2328. PubMed
6. Koike S, Tanabe S, Ogawa T, et al. Effect of time and day of admission on 1-month
survival and neurologically favourable 1-month survival in out-of-hospital cardiopulmonary
arrest patients. Resuscitation. 2011;82(7):863-868. PubMed
7. Bell CM, Redelmeier DA. Mortality among patients admitted to hospitals on
weekends as compared with weekdays. N Engl J Med. 2001;345(9):663-668. PubMed
8. Freemantle N, Richardson M, Wood J, et al. Weekend hospitalization and additional
risk of death: an analysis of inpatient data. J R Soc Med. 2012;105(2):74-84. PubMed
9. Schilling PL, Campbell DA Jr, Englesbe MJ, Davis MM. A comparison of in-hospital
mortality risk conferred by high hospital occupancy, differences in nurse
staffing levels, weekend admission, and seasonal influenza. Med Care. 2010;48(3):
224-232. PubMed
10. Wong HJ, Morra D. Excellent hospital care for all: open and operating 24/7. J Gen
Intern Med. 2011;26(9):1050-1052. PubMed
11. Dorn SD, Shah ND, Berg BP, Naessens JM. Effect of weekend hospital admission
on gastrointestinal hemorrhage outcomes. Dig Dis Sci. 2010;55(6):1658-1666. PubMed
12. Kostis WJ, Demissie K, Marcella SW, et al. Weekend versus weekday admission
and mortality from myocardial infarction. N Engl J Med. 2007;356(11):1099-1109. PubMed
13. McKinney JS, Deng Y, Kasner SE, Kostis JB; Myocardial Infarction Data Acquisition
System (MIDAS 15) Study Group. Comprehensive stroke centers overcome
the weekend versus weekday gap in stroke treatment and mortality. Stroke.
2011;42(9):2403-2409. PubMed
14. Margulis AV, Pladevall M, Riera-Guardia N, et al. Quality assessment of observational
studies in a drug-safety systematic review, comparison of two tools: the
Newcastle-Ottawa Scale and the RTI item bank. Clin Epidemiol. 2014;6:359-368. PubMed
15. Viechtbauer W. Conducting meta-analyses in R with the metafor package. J Stat
Softw. 2010;36(3):1-48.
16. Cavallazzi R, Marik PE, Hirani A, Pachinburavan M, Vasu TS, Leiby BE. Association
between time of admission to the ICU and mortality: a systematic review and
metaanalysis. Chest. 2010;138(1):68-75. PubMed
17. de Cordova PB, Phibbs CS, Bartel AP, Stone PW. Twenty-four/seven: a
mixed-method systematic review of the off-shift literature. J Adv Nurs.
2012;68(7):1454-1468. PubMed
18. Zhou Y, Li W, Herath C, Xia J, Hu B, Song F, Cao S, Lu Z. Off-hour admission and
mortality risk for 28 specific diseases: a systematic review and meta-analysis of 251
cohorts. J Am Heart Assoc. 2016;5(3):e003102. PubMed
19. Sorita A, Ahmed A, Starr SR, et al. Off-hour presentation and outcomes in
patients with acute myocardial infarction: systematic review and meta-analysis.
BMJ. 2014;348:f7393. PubMed
20. Ricciardi R, Nelson J, Roberts PL, Marcello PW, Read TE, Schoetz DJ. Is the
presence of medical trainees associated with increased mortality with weekend
admission? BMC Med Educ. 2014;14(1):4. PubMed
21. Needleman J, Buerhaus P, Pankratz VS, Leibson CL, Stevens SR, Harris M. Nurse
staffing and inpatient hospital mortality. N Engl J Med. 2011;364(11):1037-1045. PubMed
22. Aiken LH, Clarke SP, Sloane DM, Sochalski J, Silber JH. Hospital nurse
staffing and patient mortality, nurse burnout, and job dissatisfaction. JAMA.
2002;288(16):1987-1993. PubMed
23. Hamilton KE, Redshaw ME, Tarnow-Mordi W. Nurse staffing in relation to
risk-adjusted mortality in neonatal care. Arch Dis Child Fetal Neonatal Ed.
2007;92(2):F99-F103. PubMed
766 An Official Publication of the Society of Hospital Medicine Journal of Hospital Medicine Vol 12 | No 9 | September 2017
Pauls et al | The Weekend Effect: A Meta-Analysis
24. Haut ER, Chang DC, Efron DT, Cornwell EE 3rd. Injured patients have lower
mortality when treated by “full-time” trauma surgeons vs. surgeons who cover
trauma “part-time”. J Trauma. 2006;61(2):272-278. PubMed
25. Wallace DJ, Angus DC, Barnato AE, Kramer AA, Kahn JM. Nighttime intensivist
staffing and mortality among critically ill patients. N Engl J Med.
2012;366(22):2093-2101. PubMed
26. Pronovost PJ, Angus DC, Dorman T, Robinson KA, Dremsizov TT, Young TL.
Physician staffing patterns and clinical outcomes in critically ill patients: a systematic
review. JAMA. 2002;288(17):2151-2162. PubMed
27. Weissman JS, Rothschild JM, Bendavid E, et al. Hospital workload and adverse
events. Med Care. 2007;45(5):448-455. PubMed
28. Hamilton P, Eschiti VS, Hernandez K, Neill D. Differences between weekend and
weekday nurse work environments and patient outcomes: a focus group approach
to model testing. J Perinat Neonatal Nurs. 2007;21(4):331-341. PubMed
29. Johner AM, Merchant S, Aslani N, et al Acute general surgery in Canada: a survey
of current handover practices. Can J Surg. 2013;56(3):E24-E28. PubMed
30. de Cordova PB, Phibbs CS, Stone PW. Perceptions and observations of off-shift
nursing. J Nurs Manag. 2013;21(2):283-292. PubMed
31. Pfeffer PE, Nazareth D, Main N, Hardoon S, Choudhury AB. Are weekend
handovers of adequate quality for the on-call general medical team? Clin Med.
2011;11(6):536-540. PubMed
32. Eschiti V, Hamilton P. Off-peak nurse staffing: critical-care nurses speak. Dimens
Crit Care Nurs. 2011;30(1):62-69. PubMed
33. Button LA, Roberts SE, Evans PA, et al. Hospitalized incidence and case fatality
for upper gastrointestinal bleeding from 1999 to 2007: a record linkage study. Aliment
Pharmacol Ther. 2011;33(1):64-76. PubMed
34. Becker DJ. Weekend hospitalization and mortality: a critical review. Expert Rev
Pharmacoecon Outcomes Res. 2008;8(1):23-26. PubMed
35. Deshmukh A, Pant S, Kumar G, Bursac Z, Paydak H, Mehta JL. Comparison of
outcomes of weekend versus weekday admissions for atrial fibrillation. Am J Cardiol.
2012;110(2):208-211. PubMed
36. Nanchal R, Kumar G, Taneja A, et al. Pulmonary embolism: the weekend effect.
Chest. 2012;142(3):690-696. PubMed
37. Palmer WL, Bottle A, Davie C, Vincent CA, Aylin P. Dying for the weekend: a
retrospective cohort study on the association between day of hospital presentation
and the quality and safety of stroke care. Arch Neurol. 2012;69(10):1296-1302. PubMed
38. Dasenbrock HH, Pradilla G, Witham TF, Gokaslan ZL, Bydon A. The impact
of weekend hospital admission on the timing of intervention and outcomes after
surgery for spinal metastases. Neurosurgery. 2012;70(3):586-593. PubMed
39. Jairath V, Kahan BC, Logan RF, et al. Mortality from acute upper gastrointestinal
bleeding in the United Kingdom: does it display a “weekend effect”? Am J Gastroenterol.
2011;106(9):1621-1628. PubMed
40. Myers RP, Kaplan GG, Shaheen AM. The effect of weekend versus weekday
admission on outcomes of esophageal variceal hemorrhage. Can J Gastroenterol.
2009;23(7):495-501. PubMed
41. Rudd AG, Hoffman A, Down C, Pearson M, Lowe D. Access to stroke care in
England, Wales and Northern Ireland: the effect of age, gender and weekend admission.
Age Ageing. 2007;36(3):247-255. PubMed
42. Lapointe-Shaw L, Abushomar H, Chen XK, et al. Care and outcomes of patients
with cancer admitted to the hospital on weekends and holidays: a retrospective
cohort study. J Natl Compr Canc Netw. 2016;14(7):867-874. PubMed
43. Chan PS, Krumholz HM, Nichol G, Nallamothu BK; American Heart Association
National Registry of Cardiopulmonary Resuscitation Investigators. Delayed time to
defibrillation after in-hospital cardiac arrest. N Engl J Med. 2008;358(1):9-17. PubMed
44. McGuire KJ, Bernstein J, Polsky D, Silber JH. The 2004 Marshall Urist Award:
Delays until surgery after hip fracture increases mortality. Clin Orthop Relat Res.
2004;(428):294-301. PubMed
45. Krüth P, Zeymer U, Gitt A, et al. Influence of presentation at the weekend on
treatment and outcome in ST-elevation myocardial infarction in hospitals with
catheterization laboratories. Clin Res Cardiol. 2008;97(10):742-747. PubMed
46. Jneid H, Fonarow GC, Cannon CP, et al. Impact of time of presentation on the care
and outcomes of acute myocardial infarction. Circulation. 2008;117(19):2502-2509. PubMed
47. Menees DS, Peterson ED, Wang Y, et al. Door-to-balloon time and mortality
among patients undergoing primary PCI. N Engl J Med. 2013;369(10):901-909. PubMed
48. Bates ER, Jacobs AK. Time to treatment in patients with STEMI. N Engl J Med.
2013;369(10):889-892. PubMed
49. Carmody IC, Romero J, Velmahos GC. Day for night: should we staff a trauma
center like a nightclub? Am Surg. 2002;68(12):1048-1051. PubMed
50. Mokdad AH, Marks JS, Stroup DF, Gerberding JL. Actual causes of death in the
United States, 2000. JAMA. 2004;291(10):1238-1245. PubMed
51. McCook A. More hospital deaths on weekends. http://www.reuters.com/article/
2011/05/20/us-more-hospital-deaths-weekends-idUSTRE74J5RM20110520.
Accessed March 7, 2017.
52. Mourad M, Adler J. Safe, high quality care around the clock: what will it take to
get us there? J Gen Intern Med. 2011;26(9):948-950. PubMed
53. Magid DJ, Wang Y, Herrin J, et al. Relationship between time of day, day of week,
timeliness of reperfusion, and in-hospital mortality for patients with acute ST-segment
elevation myocardial infarction. JAMA. 2005;294(7):803-812. PubMed
54. Coiera E, Wang Y, Magrabi F, Concha OP, Gallego B, Runciman W. Predicting
the cumulative risk of death during hospitalization by modeling weekend, weekday
and diurnal mortality risks. BMC Health Serv Res. 2014;14:226. PubMed
55. Greenland S. Can meta-analysis be salvaged? Am J Epidemiol. 1994;140(9):783-787. PubMed
56. Shapiro S. Meta-analysis/Shmeta-analysis. Am J Epidemiol. 1994;140(9):771-778. PubMed
57. Halm EA, Chassin MR. Why do hospital death rates vary? N Engl J Med.
2001;345(9):692-694. PubMed
58. Birkmeyer JD, Siewers AE, Finlayson EV, et al. Hospital volume and surgical mortality
in the United States. N Engl J Med. 2002;346(15):1128-1137. PubMed
59. Kaier K, Mutters NT, Frank U. Bed occupancy rates and hospital-acquired infections
– should beds be kept empty? Clin Microbiol Infect. 2012;18(10):941-945. PubMed
60. Chrusch CA, Olafson KP, McMillian PM, Roberts DE, Gray PR. High occupancy
increases the risk of early death or readmission after transfer from intensive care.
Crit Care Med. 2009;37(10):2753-2758. PubMed
61. Foss NB, Kehlet H. Short-term mortality in hip fracture patients admitted during
weekends and holidays. Br J Anaesth. 2006;96(4):450-454. PubMed
62. Daugaard CL, Jørgensen HL, Riis T, Lauritzen JB, Duus BR, van der Mark S. Is
mortality after hip fracture associated with surgical delay or admission during
weekends and public holidays? A retrospective study of 38,020 patients. Acta Orthop.
2012;83(6):609-613. PubMed
© 2017 Society of Hospital Medicine
Morbo Serpentino
A 58-year-old Danish man presented to an urgent care center due to several months of gradually worsening fatigue, weight loss, abdominal pain, and changes in vision . His abdominal pain was diffuse, constant, and moderate in severity. There was no association with meals, and he reported no nausea, vomiting, or change in bowel movements. He also said his vision in both eyes was blurry, but denied diplopia and said the blurring did not improve when either eye w as closed. He denied dysphagia, headache, focal weakness, or sensitivity to bright lights.
Fatigue and weight loss in a middle-aged man are nonspecific complaints that mainly help to alert the clinician that there may be a serious, systemic process lurking. Constant abdominal pain without nausea, vomiting, or change in bowel movements makes intestinal obstruction or a motility disorder less likely. Given that the pain is diffuse, it raises the possibility of an intraperitoneal process or a process within an organ that is irritating the peritoneum.
Worsening of vision can result from disorders anywhere along the visual pathway, including the cornea (keratitis or corneal edema from glaucoma), anterior chamber (uveitis or hyphema), lens (cataracts, dislocations, hyperglycemia), vitreous humor (uveitis), retina (infections, ischemia, detachment, diabetic retinopathy), macula (degenerative disease), optic nerve (optic neuritis), optic chiasm, and the visual projections through the hemispheres to the occipital lobes. To narrow the differential diagnosis, it would be important to inquire about prior eye problems, to measure visual acuity and intraocular pressure, to perform fundoscopic and slit-lamp exams to detect retinal and anterior chamber disorders, respectively, and to assess visual fields. An afferent pupillary defect would suggest optic nerve pathology.
Disorders that could unify the constitutional, abdominal, and visual symptoms include systemic inflammatory diseases, such as sarcoidosis (which has an increased incidence among Northern Europeans), tuberculosis, or cancer. While diabetes mellitus could explain his visual problems, weight loss, and fatigue, the absence of polyuria, polydipsia, or polyphagia argues against this possibility.
The patient had hypercholesterolemia and type 2 diabetes mellitus. Medications were metformin, atorvastatin, and glimepiride. He was a former smoker with 23 pack-years and had quit over 5 years prior. He had not traveled outside of Denmark in 2 years and had no pets at home. He reported being monogamous with his same-sex partner for the past 25 years. He had no significant family history, and he worked at a local hospital as a nurse. He denied any previous ocular history.
On examination, the pulse was 67 beats per minute, temperature was 36.7 degrees Celsius, respiratory rate was 16 breaths per minute, oxygen saturation was 99% while breathing ambient air, and blood pressure was 132/78. Oropharynx demonstrated no thrush or other lesions. The heart rhythm was regular and there were no murmurs. Lungs were clear to auscultation bilaterally. Abdominal exam was normal except for mild tenderness upon palpation in all quadrants, but no masses, organomegaly, rigidity, or rebound tenderness were present. Skin examination revealed several subcutaneous nodules measuring up to 0.5 cm in diameter overlying the right and left posterolateral chest walls. T he nodules were rubbery, pink, nontender, and not warm nor fluctuant. Visual acuity was reduced in both eyes. Extraocular movements were intact, and the pupils reacted to light and accommodated appropriately. The sclerae were injected bilaterally. The remainder of the cranial nerves and neurologic exam were normal. Due to the vision loss , the patient was referred to an ophthalmologist who diagnosed bilateral anterior uveitis.
Though monogamous with his male partner for many years, it is mandatory to consider complications of human immunodeficiency virus infection (HIV ). The absence of oral lesions indicative of a low CD4 count, such as oral hairy leukoplakia or thrush, does not rule out HIV disease. Additional history about his work as a nurse might shed light on his risk of infection, such as airborne exposure to tuberculosis or acquisition of blood-borne pathogens through a needle stick injury. His unremarkable vital signs support the chronicity of his medical condition.
Uveitis can result from numerous causes. When confined to the eye, uncommon hereditary and acquired causes are less likely . In many patients, uveitis arises in the setting of systemic infection or inflammation. The numerous infectious causes of uveitis include syphilis, tuberculosis, toxoplasmosis, cat scratch disease, and viruses such as HIV, West Nile, and Ebola. Among the inflammatory diseases that can cause uveitis are sarcoidosis, inflammatory bowel disease, systemic lupus erythematosus, Behçet disease, and Sjogren syndrome.
Several of these conditions, including tuberculosis and syphilis, may also cause subcutaneous nodules. Both tuberculosis and syphilis can cause skin and gastrointestinal disease. Sarcoidosis could involve the skin, peritoneum, and uvea, and is a possibility in this patient. The dermatologic conditions associated with sarcoidosis are protean and include granulomatous inflammation and nongranulomatous processes such as erythema nodosum. Usually the nodules of erythema nodosum are tender, red or purple, and located on the lower extremities. The lack of tenderness points away from erythema nodosum in this patient. Metastatic cancer can disseminate to the subcutaneous tissue, and the patient’s smoking history and age mandate we consider malignancy. However, skin metastases tend to be hard, not rubbery.
A cost-effective evaluation at this point would include syphilis serologies, HIV testing, testing for tuberculosis with either a purified protein derivative test or interferon gamma release assay, chest radiography, and biopsy of 1 of the lesions on his back.
Laboratory data showed 12,400 white blood cells per cubic milliliter (64% neutrophils, 24% lymphocytes, 9% monocytes, 2% eosinophils, 1% basophils), hemoglobin 7.9 g/dL, mean corpuscular volume 85 fL, platelets 476,000 per cubic milliliter , C-reactive protein 43 mg/ d L (normal < 8 mg/L), gamma-glutamyl-transferase 554 IU/L (normal range 0-45), alkaline phosphatase 865 U/L (normal range 60-200), and erythrocyte sedimentation rate (ESR) 71 mm per hour. International normalized ratio was 1.0, albumin was 3.0 mg/dL, activated partial thromboplastin time was 32 seconds (normal 22 to 35 seconds), and bilirubin was 0.3 mg/dL. Antibodies to HIV , hepatitis C, and hepatitis B surface antigen were not detectable. Electrocardiography ( ECG ) was normal. Plain radiograph of the chest demonstrated multiple nodular lesions bilaterally measuring up to 1 cm with no cavitation. There was a left pleural effusion.
The history and exam findings indicate a serious inflammatory condition affecting his lungs, pleura, eyes, skin, liver, and possibly his peritoneum. In this context, the elevated C-reactive protein and ESR are not helpful in differentiating inflammatory from infectious causes. The constellation of uveitis, pulmonary and cutaneous nodules, and marked abnormalities of liver tests in a middle-aged man of Northern European origin points us toward sarcoidosis. Pleural effusions are not common with sarcoidosis but may occur. However, to avoid premature closure, it is important to consider other possibilities.
Metastatic cancer, including lymphoma, could cause pulmonary and cutaneous nodules and liver involvement, but the chronic time course and uveitis are not consistent with malignancy. Tuberculosis is still a consideration, though one would have expected him to report fevers, night sweats, and, perhaps, exposure to patients with pulmonary tuberculosis in his job as a nurse. Multiple solid pulmonary nodules are also uncommon with pulmonary tuberculosis. Fungal infections such as histoplasmosis can cause skin lesions and pulmonary nodules but do not fit well with uveitis.
At this point, “ tissue is the issue.” A skin nodule would be the easiest site to biopsy. If skin biopsy was not diagnostic, computed tomography (CT) of his chest and abdomen should be performed to identify the next most accessible site for biopsy.
Esophagogastroduodenoscopy (EGD) and colonoscopy showed normal findings, and random biopsies from the stomach and colon were normal. CT of the chest, abdomen, and pelvis performed with the administration of intravenous contrast showed multiple solid opacities in both lung fields up to 1 cm, with enlarged mediastinal and retroperitoneal lymph nodes measuring 1 to 3 cm in diameter, a left pleural effusion, wall thickening in the right colon, and several nonspecific hypodensities in the liver. A punch biopsy taken from the right chest wall lesion demonstrated chronic inflammation without granulomas. The patient underwent CT-guided biopsy of 1 of the right-sided lung nodules, which revealed noncaseating granulomatous inflammation, fibrosis, and necrosis. Neither biopsy contained malignant cells, and additional stains revealed no bacteria, fungi, or acid fast bacilli.
The retroperitoneal and mediastinal adenopathy are indicative of a widely disseminated inflammatory process. Lymphoma continues to be a concern, though uveitis as an initial presenting problem would very unusual. Although biopsy of the chest wall lesion failed to demonstrate granulomatous inflammation, the most parsimonious explanation is that the skin and lung nodules are both related to a single systemic process.
Granulomas form in an attempt to wall off offending agents, whether foreign antigens (talc, certain medications), infectious agents, or self-antigens. Review of histopathology and microbiologic studies are useful first steps. Stains for bacteria, fungi, or acid-fast organisms may diagnose an infectious cause, such as tuberculosis, leprosy, syphilis, fungi, or cat scratch disease. Granulomas in association with vascular inflammation would indicate vasculitis. Other autoimmune considerations include sarcoidosis and Crohn disease. Noncaseating granulomas are typically found in sarcoidosis, cat scratch disease, syphilis, leprosy, or Crohn disease, but do not entirely exclude tuberculosis.
The negative infectious studies and lack of classic features of Crohn disease or other autoimmune diseases further point to sarcoidosis as the etiology of this patient’s illness. A Norwegian dermatologist first described the pathology of sarcoidosis based upon specimens taken from skin nodules. He thought the lesions were sarcoma and described them as, “ multiple benign sarcoid of the skin,” which is where the name “ sarcoidosis” originated.
Diagnosing sarcoidosis requires excluding other mimickers. Additional testing should include syphilis serologies, rheumatoid factor, and antineutrophilic cytoplasmic antibodies. The latter is associated with granulomatosis with polyangiitis and eosinophilic granulomatosis with polyangiitis, either of which may produce granulomatous inflammation of the lungs, skin, and uvea.
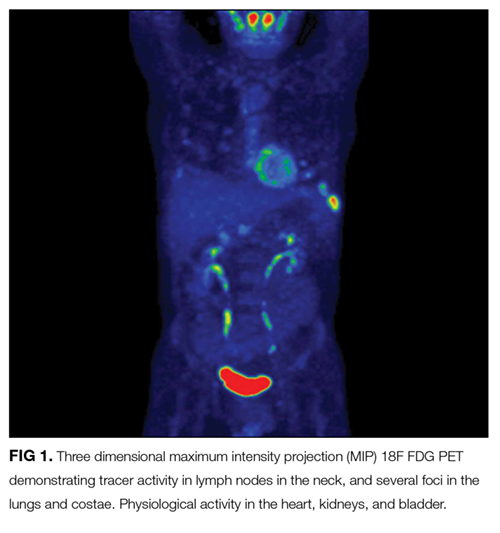
At this juncture, PET-CT represents a costly and unnecessary test that does not narrow our diagnostic possibilities sufficiently to justify its use. Osteolytic lesions would be unusual in sarcoidosis and more likely in lymphoma or infectious processes such as tuberculosis. Tests for syphilis and tuberculosis are required, and are a fraction of the cost of a PET-CT.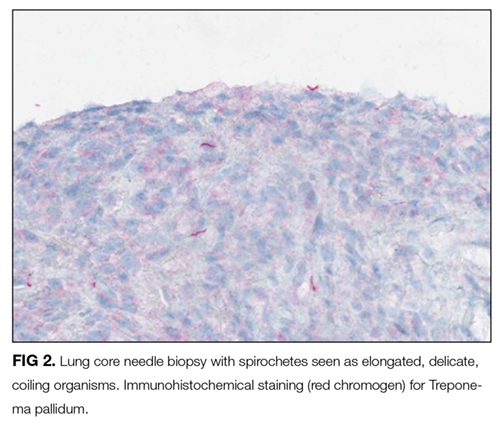
With the biopsy revealing spirochetes, and the positive results of a nontreponemal test (RPR) and confirmatory treponemal results, the diagnosis of syphilis is firmly established. Uveitis indicates neurosyphilis and warrants a longer course of intravenous penicillin. Lumbar puncture should be performed.
A lumbar puncture was performed. Cerebrospinal fluid (CSF) contained 9 white blood cells and 73 red blood cells per cubic milliliter; protein concentration was 73 mg/dL, and glucose was 116 mg/dL. Polymerase chain reaction for T. pallidum was negative. Transthoracic ECG and magnetic resonance imaging of the brain were normal. The patient was treated with intravenous penicillin G at 5 million units 4 times daily for 15 days. A PET-CT scan 3 months later revealed complete resolution of the subcutaneous, pulmonary, liver lesions, lymphadenopathy, and uveitis. Repeat treponemal serologies demonstrated a greater than 4-fold decline in titers.
DISCUSSION
Syphilis is a sexually transmitted disease with increasing incidence worldwide. Untreated infection progresses through 3 stages. The primary stage is characterized by the appearance of a painless chancre after an incubation period of 2 to 3 weeks. Four to 8 weeks later, the secondary stage emerges as a systemic infection, often heralded by a maculopapular rash with desquamation, frequently involving the soles and palms. Hepatitis, iridocyclitis, and early neurosyphilis may also be seen at this stage. Subsequently, syphilis becomes latent. One-third of patients with untreated latent syphilis will develop tertiary syphilis, typified by late neurosyphilis (tabes dorsalis and general paresis), cardiovascular disease (aortitis), or gummatous disease. 1
Gummas are destructive granulomatous lesions that typically present indolently, may occur singly or multiply, and may involve almost any organ. It has been suggested that gummas are the immune system’s defense to slow the bacteria after attempts to kill it have failed. Histologically, gummas are hyalinized nodules with surrounding granulomatous infiltrate of lymphocytes, plasma cells, and multinucleated giant cells with or without necrosis . In the preantibiotic era, gummas were seen in approximately 15% of infected patients, with a latency of 1 to 46 years after primary infection. 2 Penicillin led to a drastic reduction in gummas until the HIV epidemic, which led to the resurgence of gummas at a drastically shortened interval following primary syphilis. 3
Most commonly, gummas affect the skin and bones. In the skin , lesions may be superficial or deep and may progress into ulcerative nodules. In the bones, destructive gummas have a characteristic “moth-eaten” appearance. Less common sequelae of gummas incude gummatous hepatitis, perforated nasal septum (saddle nose deformity), or hard palate erosions. 2,4 R arely, syphilis involves the lungs, appearing as nodules, infiltrates, or pleural effusion. 5
Ocular manifestations occur in approximately 5% of patients with syphilis, more often in secondary and tertiary stages, and are strongly associated with a spread to the central nervous system. Syphilis may affect any structure of the eye, with anterior uveitis as the most frequent manifestation. Partial or complete vision loss is identified in approximately half of the patients with ocular syphilis and may be completely reversed by appropriate treatment. Ophthalmologic findings such as optic neuritis and papilledema imply advanced illness , as do Argyll-Robertson pupils (small pupils that are poorly reactive to light , but with preserved accommodation and convergence). 6,7 The treatment of ocular syphilis is identical to that of neurosyphilis. The Centers for Disease Control and Prevention recommends CSF analysis in any patient with ocular syphilis. Abnormal results should prompt repeat lumbar puncture every 3 to 6 months following treatment until the CSF results normalize. 8
The diagnosis of syphilis relies on indirect serologic tests. T. pallidum cannot be cultured in vitro, and techniques to identify spirochetes directly by using darkfield microscopy or DNA amplification via polymerase chain reaction are limited by availability or by poor sensitivity in advanced syphilis. 1 Imaging modalities including PET cannot reliably differentiate syphilis from other infectious and noninfectious mimickers. 9 F ortunately, syphilis infection can be diagnosed accurately based on reactive treponemal and nontreponemal serum tests. Nontreponemal tests, such as the RPR and Venereal Disease Research Laboratory, have traditionally been utilized as first-line evaluation, followed by a confirmatory treponemal test. However, nontreponemal tests may be nonreactive in a few settings: very early or very late in infection, and in individuals previously treated for syphilis. Thus, newer “reverse testing” algorithms utilize more sensitive and less expensive treponemal tests as the first test, followed by nontreponemal tests if the initial treponemal test is reactive. 8 Regardless of the testing sequence, in patients with no prior history of syphilis, reactive results on both treponemal and nontreponemal assays firmly establish a diagnosis of syphilis, obviating the need for more invasive and costly testing.
In patients with unexplained systemic illness, clinicians should have a low threshold to test for syphilis. Testing should be extended to certain asymptomatic individuals at higher risk of infection, including men who have sex with men, sexual partners of patients infected with syphilis, individuals with HIV or sexually-transmitted diseases, and others with high-risk sexual behavior or a history of sexually-transmitted diseases. 8 As the discussant points out, earlier consideration of and testing for syphilis would have spared the patient from unnecessary and costly EGD, colonoscopy, PET-CT scanning, and 3 biopsies.
Syphilis has been known to be a horribly destructive disease for centuries, earning the moniker “morbo serpentino” (serpentine disease) from the Spanish physician Ruiz Diaz de Isla in the 1500s. 10 In the modern era, physicians must remember to consider the diagnosis of syphilis in order to effectively mitigate the harm from this resurgent disease when it attacks our patients.
TEACHING POINTS
- Syphilis, the great imposter, is rising in incidence and should be on the differential diagnosis in all patients with unexplained multisystem inflammatory disease.
- A cost-effective diagnostic approach to syphilis entails serologic testing with treponemal and nontreponemal assays.
- Unexplained granulomas, especially in the skin, bone, or liver, should prompt consideration of gummatous syphilis.
- Ocular syphilis may involve any part of the visual tract and is treated the same as neurosyphilis.
Disclosure
Dr. Weinreich has received payment for lectures from Boehringer er Ingelheim, Astra Zeneca, TEVA and Novartis in 2016. All other contributors have nothing to report.
1. French P. Syphilis. BMJ. 2007;334:143-147. PubMed
2. Singh AE, Romanowski B. Syphilis: Review with emphasis on clinical, epidemiologic, and some biologic features. Clin Micriobio Rev. 1999;12(2):187-209. PubMed
3. Karp G, Schlaeffer F, Jotkowitz A, Riesenberg K. Syphilis and HIV co-infection. Eur J Int Med. 2009; 20:9-13. PubMed
4. Pilozzi-Edmonds L, Kong LY, Szabo J, Birnbaum LM. Rapid progression to gummatous syphilitic hepatitis and neurosyphilis in a patient with newly diagnosed HIV. Int J STD AIDS. 2014;26(13)985-987. PubMed
5. David G, Perpoint T, Boibieux A, et al. Secondary pulmonary syphilis: report of a likely case and literature review. Clin Infect Dis. 2006;42(3):e11-e15. PubMed
6. Moradi A, Salek S, Daniel E, et al. Clinical features and incidence rates of ocular complications in patients with ocular syphilis. Am J Ophthalmol. 2015;159:334-343. PubMed
7. Aldave AJ, King JA, Cunningham ET Jr. Ocular syphilis. Curr Opin Ophthalmol. 2001;12:433-441. PubMed
8. Workowski KA, Bolan GA. Sexually transmitted diseases treatment guidelines, 2015. MMWR Recomm Rep. 2015;64:1-137. PubMed
9. Lin M, Darwish B, Chu J. Neurosyphilitic gumma on F18-2-fluoro-2-deoxy-D-glucose (FDG) positron emission tomography: An old disease investigated with new technology. J Clin Neurosc. 2009;16:410-412. PubMed
10. de Ricon‐Ferraz A. Early work on syphilis: Diaz de Ysla’s treatise on the serpentine disease of Hispaniola Island. Int J Dermatol. 1999;38(3):222-227. PubMed
A 58-year-old Danish man presented to an urgent care center due to several months of gradually worsening fatigue, weight loss, abdominal pain, and changes in vision . His abdominal pain was diffuse, constant, and moderate in severity. There was no association with meals, and he reported no nausea, vomiting, or change in bowel movements. He also said his vision in both eyes was blurry, but denied diplopia and said the blurring did not improve when either eye w as closed. He denied dysphagia, headache, focal weakness, or sensitivity to bright lights.
Fatigue and weight loss in a middle-aged man are nonspecific complaints that mainly help to alert the clinician that there may be a serious, systemic process lurking. Constant abdominal pain without nausea, vomiting, or change in bowel movements makes intestinal obstruction or a motility disorder less likely. Given that the pain is diffuse, it raises the possibility of an intraperitoneal process or a process within an organ that is irritating the peritoneum.
Worsening of vision can result from disorders anywhere along the visual pathway, including the cornea (keratitis or corneal edema from glaucoma), anterior chamber (uveitis or hyphema), lens (cataracts, dislocations, hyperglycemia), vitreous humor (uveitis), retina (infections, ischemia, detachment, diabetic retinopathy), macula (degenerative disease), optic nerve (optic neuritis), optic chiasm, and the visual projections through the hemispheres to the occipital lobes. To narrow the differential diagnosis, it would be important to inquire about prior eye problems, to measure visual acuity and intraocular pressure, to perform fundoscopic and slit-lamp exams to detect retinal and anterior chamber disorders, respectively, and to assess visual fields. An afferent pupillary defect would suggest optic nerve pathology.
Disorders that could unify the constitutional, abdominal, and visual symptoms include systemic inflammatory diseases, such as sarcoidosis (which has an increased incidence among Northern Europeans), tuberculosis, or cancer. While diabetes mellitus could explain his visual problems, weight loss, and fatigue, the absence of polyuria, polydipsia, or polyphagia argues against this possibility.
The patient had hypercholesterolemia and type 2 diabetes mellitus. Medications were metformin, atorvastatin, and glimepiride. He was a former smoker with 23 pack-years and had quit over 5 years prior. He had not traveled outside of Denmark in 2 years and had no pets at home. He reported being monogamous with his same-sex partner for the past 25 years. He had no significant family history, and he worked at a local hospital as a nurse. He denied any previous ocular history.
On examination, the pulse was 67 beats per minute, temperature was 36.7 degrees Celsius, respiratory rate was 16 breaths per minute, oxygen saturation was 99% while breathing ambient air, and blood pressure was 132/78. Oropharynx demonstrated no thrush or other lesions. The heart rhythm was regular and there were no murmurs. Lungs were clear to auscultation bilaterally. Abdominal exam was normal except for mild tenderness upon palpation in all quadrants, but no masses, organomegaly, rigidity, or rebound tenderness were present. Skin examination revealed several subcutaneous nodules measuring up to 0.5 cm in diameter overlying the right and left posterolateral chest walls. T he nodules were rubbery, pink, nontender, and not warm nor fluctuant. Visual acuity was reduced in both eyes. Extraocular movements were intact, and the pupils reacted to light and accommodated appropriately. The sclerae were injected bilaterally. The remainder of the cranial nerves and neurologic exam were normal. Due to the vision loss , the patient was referred to an ophthalmologist who diagnosed bilateral anterior uveitis.
Though monogamous with his male partner for many years, it is mandatory to consider complications of human immunodeficiency virus infection (HIV ). The absence of oral lesions indicative of a low CD4 count, such as oral hairy leukoplakia or thrush, does not rule out HIV disease. Additional history about his work as a nurse might shed light on his risk of infection, such as airborne exposure to tuberculosis or acquisition of blood-borne pathogens through a needle stick injury. His unremarkable vital signs support the chronicity of his medical condition.
Uveitis can result from numerous causes. When confined to the eye, uncommon hereditary and acquired causes are less likely . In many patients, uveitis arises in the setting of systemic infection or inflammation. The numerous infectious causes of uveitis include syphilis, tuberculosis, toxoplasmosis, cat scratch disease, and viruses such as HIV, West Nile, and Ebola. Among the inflammatory diseases that can cause uveitis are sarcoidosis, inflammatory bowel disease, systemic lupus erythematosus, Behçet disease, and Sjogren syndrome.
Several of these conditions, including tuberculosis and syphilis, may also cause subcutaneous nodules. Both tuberculosis and syphilis can cause skin and gastrointestinal disease. Sarcoidosis could involve the skin, peritoneum, and uvea, and is a possibility in this patient. The dermatologic conditions associated with sarcoidosis are protean and include granulomatous inflammation and nongranulomatous processes such as erythema nodosum. Usually the nodules of erythema nodosum are tender, red or purple, and located on the lower extremities. The lack of tenderness points away from erythema nodosum in this patient. Metastatic cancer can disseminate to the subcutaneous tissue, and the patient’s smoking history and age mandate we consider malignancy. However, skin metastases tend to be hard, not rubbery.
A cost-effective evaluation at this point would include syphilis serologies, HIV testing, testing for tuberculosis with either a purified protein derivative test or interferon gamma release assay, chest radiography, and biopsy of 1 of the lesions on his back.
Laboratory data showed 12,400 white blood cells per cubic milliliter (64% neutrophils, 24% lymphocytes, 9% monocytes, 2% eosinophils, 1% basophils), hemoglobin 7.9 g/dL, mean corpuscular volume 85 fL, platelets 476,000 per cubic milliliter , C-reactive protein 43 mg/ d L (normal < 8 mg/L), gamma-glutamyl-transferase 554 IU/L (normal range 0-45), alkaline phosphatase 865 U/L (normal range 60-200), and erythrocyte sedimentation rate (ESR) 71 mm per hour. International normalized ratio was 1.0, albumin was 3.0 mg/dL, activated partial thromboplastin time was 32 seconds (normal 22 to 35 seconds), and bilirubin was 0.3 mg/dL. Antibodies to HIV , hepatitis C, and hepatitis B surface antigen were not detectable. Electrocardiography ( ECG ) was normal. Plain radiograph of the chest demonstrated multiple nodular lesions bilaterally measuring up to 1 cm with no cavitation. There was a left pleural effusion.
The history and exam findings indicate a serious inflammatory condition affecting his lungs, pleura, eyes, skin, liver, and possibly his peritoneum. In this context, the elevated C-reactive protein and ESR are not helpful in differentiating inflammatory from infectious causes. The constellation of uveitis, pulmonary and cutaneous nodules, and marked abnormalities of liver tests in a middle-aged man of Northern European origin points us toward sarcoidosis. Pleural effusions are not common with sarcoidosis but may occur. However, to avoid premature closure, it is important to consider other possibilities.
Metastatic cancer, including lymphoma, could cause pulmonary and cutaneous nodules and liver involvement, but the chronic time course and uveitis are not consistent with malignancy. Tuberculosis is still a consideration, though one would have expected him to report fevers, night sweats, and, perhaps, exposure to patients with pulmonary tuberculosis in his job as a nurse. Multiple solid pulmonary nodules are also uncommon with pulmonary tuberculosis. Fungal infections such as histoplasmosis can cause skin lesions and pulmonary nodules but do not fit well with uveitis.
At this point, “ tissue is the issue.” A skin nodule would be the easiest site to biopsy. If skin biopsy was not diagnostic, computed tomography (CT) of his chest and abdomen should be performed to identify the next most accessible site for biopsy.
Esophagogastroduodenoscopy (EGD) and colonoscopy showed normal findings, and random biopsies from the stomach and colon were normal. CT of the chest, abdomen, and pelvis performed with the administration of intravenous contrast showed multiple solid opacities in both lung fields up to 1 cm, with enlarged mediastinal and retroperitoneal lymph nodes measuring 1 to 3 cm in diameter, a left pleural effusion, wall thickening in the right colon, and several nonspecific hypodensities in the liver. A punch biopsy taken from the right chest wall lesion demonstrated chronic inflammation without granulomas. The patient underwent CT-guided biopsy of 1 of the right-sided lung nodules, which revealed noncaseating granulomatous inflammation, fibrosis, and necrosis. Neither biopsy contained malignant cells, and additional stains revealed no bacteria, fungi, or acid fast bacilli.
The retroperitoneal and mediastinal adenopathy are indicative of a widely disseminated inflammatory process. Lymphoma continues to be a concern, though uveitis as an initial presenting problem would very unusual. Although biopsy of the chest wall lesion failed to demonstrate granulomatous inflammation, the most parsimonious explanation is that the skin and lung nodules are both related to a single systemic process.
Granulomas form in an attempt to wall off offending agents, whether foreign antigens (talc, certain medications), infectious agents, or self-antigens. Review of histopathology and microbiologic studies are useful first steps. Stains for bacteria, fungi, or acid-fast organisms may diagnose an infectious cause, such as tuberculosis, leprosy, syphilis, fungi, or cat scratch disease. Granulomas in association with vascular inflammation would indicate vasculitis. Other autoimmune considerations include sarcoidosis and Crohn disease. Noncaseating granulomas are typically found in sarcoidosis, cat scratch disease, syphilis, leprosy, or Crohn disease, but do not entirely exclude tuberculosis.
The negative infectious studies and lack of classic features of Crohn disease or other autoimmune diseases further point to sarcoidosis as the etiology of this patient’s illness. A Norwegian dermatologist first described the pathology of sarcoidosis based upon specimens taken from skin nodules. He thought the lesions were sarcoma and described them as, “ multiple benign sarcoid of the skin,” which is where the name “ sarcoidosis” originated.
Diagnosing sarcoidosis requires excluding other mimickers. Additional testing should include syphilis serologies, rheumatoid factor, and antineutrophilic cytoplasmic antibodies. The latter is associated with granulomatosis with polyangiitis and eosinophilic granulomatosis with polyangiitis, either of which may produce granulomatous inflammation of the lungs, skin, and uvea.
At this juncture, PET-CT represents a costly and unnecessary test that does not narrow our diagnostic possibilities sufficiently to justify its use. Osteolytic lesions would be unusual in sarcoidosis and more likely in lymphoma or infectious processes such as tuberculosis. Tests for syphilis and tuberculosis are required, and are a fraction of the cost of a PET-CT.
With the biopsy revealing spirochetes, and the positive results of a nontreponemal test (RPR) and confirmatory treponemal results, the diagnosis of syphilis is firmly established. Uveitis indicates neurosyphilis and warrants a longer course of intravenous penicillin. Lumbar puncture should be performed.
A lumbar puncture was performed. Cerebrospinal fluid (CSF) contained 9 white blood cells and 73 red blood cells per cubic milliliter; protein concentration was 73 mg/dL, and glucose was 116 mg/dL. Polymerase chain reaction for T. pallidum was negative. Transthoracic ECG and magnetic resonance imaging of the brain were normal. The patient was treated with intravenous penicillin G at 5 million units 4 times daily for 15 days. A PET-CT scan 3 months later revealed complete resolution of the subcutaneous, pulmonary, liver lesions, lymphadenopathy, and uveitis. Repeat treponemal serologies demonstrated a greater than 4-fold decline in titers.
DISCUSSION
Syphilis is a sexually transmitted disease with increasing incidence worldwide. Untreated infection progresses through 3 stages. The primary stage is characterized by the appearance of a painless chancre after an incubation period of 2 to 3 weeks. Four to 8 weeks later, the secondary stage emerges as a systemic infection, often heralded by a maculopapular rash with desquamation, frequently involving the soles and palms. Hepatitis, iridocyclitis, and early neurosyphilis may also be seen at this stage. Subsequently, syphilis becomes latent. One-third of patients with untreated latent syphilis will develop tertiary syphilis, typified by late neurosyphilis (tabes dorsalis and general paresis), cardiovascular disease (aortitis), or gummatous disease. 1
Gummas are destructive granulomatous lesions that typically present indolently, may occur singly or multiply, and may involve almost any organ. It has been suggested that gummas are the immune system’s defense to slow the bacteria after attempts to kill it have failed. Histologically, gummas are hyalinized nodules with surrounding granulomatous infiltrate of lymphocytes, plasma cells, and multinucleated giant cells with or without necrosis . In the preantibiotic era, gummas were seen in approximately 15% of infected patients, with a latency of 1 to 46 years after primary infection. 2 Penicillin led to a drastic reduction in gummas until the HIV epidemic, which led to the resurgence of gummas at a drastically shortened interval following primary syphilis. 3
Most commonly, gummas affect the skin and bones. In the skin , lesions may be superficial or deep and may progress into ulcerative nodules. In the bones, destructive gummas have a characteristic “moth-eaten” appearance. Less common sequelae of gummas incude gummatous hepatitis, perforated nasal septum (saddle nose deformity), or hard palate erosions. 2,4 R arely, syphilis involves the lungs, appearing as nodules, infiltrates, or pleural effusion. 5
Ocular manifestations occur in approximately 5% of patients with syphilis, more often in secondary and tertiary stages, and are strongly associated with a spread to the central nervous system. Syphilis may affect any structure of the eye, with anterior uveitis as the most frequent manifestation. Partial or complete vision loss is identified in approximately half of the patients with ocular syphilis and may be completely reversed by appropriate treatment. Ophthalmologic findings such as optic neuritis and papilledema imply advanced illness , as do Argyll-Robertson pupils (small pupils that are poorly reactive to light , but with preserved accommodation and convergence). 6,7 The treatment of ocular syphilis is identical to that of neurosyphilis. The Centers for Disease Control and Prevention recommends CSF analysis in any patient with ocular syphilis. Abnormal results should prompt repeat lumbar puncture every 3 to 6 months following treatment until the CSF results normalize. 8
The diagnosis of syphilis relies on indirect serologic tests. T. pallidum cannot be cultured in vitro, and techniques to identify spirochetes directly by using darkfield microscopy or DNA amplification via polymerase chain reaction are limited by availability or by poor sensitivity in advanced syphilis. 1 Imaging modalities including PET cannot reliably differentiate syphilis from other infectious and noninfectious mimickers. 9 F ortunately, syphilis infection can be diagnosed accurately based on reactive treponemal and nontreponemal serum tests. Nontreponemal tests, such as the RPR and Venereal Disease Research Laboratory, have traditionally been utilized as first-line evaluation, followed by a confirmatory treponemal test. However, nontreponemal tests may be nonreactive in a few settings: very early or very late in infection, and in individuals previously treated for syphilis. Thus, newer “reverse testing” algorithms utilize more sensitive and less expensive treponemal tests as the first test, followed by nontreponemal tests if the initial treponemal test is reactive. 8 Regardless of the testing sequence, in patients with no prior history of syphilis, reactive results on both treponemal and nontreponemal assays firmly establish a diagnosis of syphilis, obviating the need for more invasive and costly testing.
In patients with unexplained systemic illness, clinicians should have a low threshold to test for syphilis. Testing should be extended to certain asymptomatic individuals at higher risk of infection, including men who have sex with men, sexual partners of patients infected with syphilis, individuals with HIV or sexually-transmitted diseases, and others with high-risk sexual behavior or a history of sexually-transmitted diseases. 8 As the discussant points out, earlier consideration of and testing for syphilis would have spared the patient from unnecessary and costly EGD, colonoscopy, PET-CT scanning, and 3 biopsies.
Syphilis has been known to be a horribly destructive disease for centuries, earning the moniker “morbo serpentino” (serpentine disease) from the Spanish physician Ruiz Diaz de Isla in the 1500s. 10 In the modern era, physicians must remember to consider the diagnosis of syphilis in order to effectively mitigate the harm from this resurgent disease when it attacks our patients.
TEACHING POINTS
- Syphilis, the great imposter, is rising in incidence and should be on the differential diagnosis in all patients with unexplained multisystem inflammatory disease.
- A cost-effective diagnostic approach to syphilis entails serologic testing with treponemal and nontreponemal assays.
- Unexplained granulomas, especially in the skin, bone, or liver, should prompt consideration of gummatous syphilis.
- Ocular syphilis may involve any part of the visual tract and is treated the same as neurosyphilis.
Disclosure
Dr. Weinreich has received payment for lectures from Boehringer er Ingelheim, Astra Zeneca, TEVA and Novartis in 2016. All other contributors have nothing to report.
1. French P. Syphilis. BMJ. 2007;334:143-147. PubMed
2. Singh AE, Romanowski B. Syphilis: Review with emphasis on clinical, epidemiologic, and some biologic features. Clin Micriobio Rev. 1999;12(2):187-209. PubMed
3. Karp G, Schlaeffer F, Jotkowitz A, Riesenberg K. Syphilis and HIV co-infection. Eur J Int Med. 2009; 20:9-13. PubMed
4. Pilozzi-Edmonds L, Kong LY, Szabo J, Birnbaum LM. Rapid progression to gummatous syphilitic hepatitis and neurosyphilis in a patient with newly diagnosed HIV. Int J STD AIDS. 2014;26(13)985-987. PubMed
5. David G, Perpoint T, Boibieux A, et al. Secondary pulmonary syphilis: report of a likely case and literature review. Clin Infect Dis. 2006;42(3):e11-e15. PubMed
6. Moradi A, Salek S, Daniel E, et al. Clinical features and incidence rates of ocular complications in patients with ocular syphilis. Am J Ophthalmol. 2015;159:334-343. PubMed
7. Aldave AJ, King JA, Cunningham ET Jr. Ocular syphilis. Curr Opin Ophthalmol. 2001;12:433-441. PubMed
8. Workowski KA, Bolan GA. Sexually transmitted diseases treatment guidelines, 2015. MMWR Recomm Rep. 2015;64:1-137. PubMed
9. Lin M, Darwish B, Chu J. Neurosyphilitic gumma on F18-2-fluoro-2-deoxy-D-glucose (FDG) positron emission tomography: An old disease investigated with new technology. J Clin Neurosc. 2009;16:410-412. PubMed
10. de Ricon‐Ferraz A. Early work on syphilis: Diaz de Ysla’s treatise on the serpentine disease of Hispaniola Island. Int J Dermatol. 1999;38(3):222-227. PubMed
© 2017 Society of Hospital Medicine