User login
Immunotherapy-Induced Colitis: An Emerging Problem for the Hospitalist
Immune checkpoint inhibitors (ICIs), a form of immunotherapy, have changed the management of cancer since their introduction in 2011.1 They were initially tested on melanoma.2 Their use in the advanced stages of the disease demonstrated a 2-year survival of 18% compared with 5% by using other therapies.3 Similar results were observed in nonsmall cell lung carcinoma (NSCLC); the overall survival benefit was 3 months with the use of ICIs compared with traditional chemotherapy (42% and 24% at 1 year, respectively).4 Antitumor activity has also been seen in the treatment of other malignancies, including renal cell carcinoma,5 bladder carcinoma,6,7 head and neck carcinoma,8 colorectal cancer,9 Hodgkin lymphoma,10 and, more recently, hepatocellular carcinoma.11 The use of ICIs has also been linked to serious complications.12 Although the skin, kidneys, lungs, and endocrine and nervous systems may be affected, complications of the gastrointestinal (GI) tract are frequent and can be life-threatening.12-16 We performed a thorough review of the literature to familiarize hospitalists with the mechanism of action and uses of ICIs, the clinical presentation of their GI toxicity, and the current recommendations regarding diagnosis and treatment.
CASE PRESENTATION
A 66-year-old man was admitted to our institution with a 1-week history of severe, diffuse abdominal pain and profuse watery diarrhea. He reported having more than 8 watery bowel movements per day and denied fever, recent travel, ill contacts, or ingestion of undercooked food. He had a history of metastatic melanoma and was undergoing treatment with both nivolumab and ipilimumab; the drugs were started 6 weeks prior to presentation. Physical examination revealed a heart rate of 110 beats/minute while supine and 123 beats/minute while standing, blood pressure of 112/69 mm Hg while supine and 92/62 mm Hg while standing, and a temperature of 37.2°C. He was in mild distress and had dry oral mucosa. Abdominal examination revealed hyperactive bowel sounds and mild diffuse abdominal tenderness with no guarding or rebound. His extremities were cool, but peripheral pulses were present. Initial laboratory results included a hemoglobin level of 15.3 g/dL (range 12.0-16.0 mg/dL), white blood cell count 14.2 × 10⁹/L (range 4.5-11.0 × 10⁹/L), and platelet count 236 × 109/L (range 150-400 × 109/L); other test results included a sodium level of 130 mmol/L (range 135-145 mmol/L), potassium 2.3 mmol/L (range 3.5-5.5 mmol/L), serum creatinine 2.2 mg/dL (range 0.8-1.3 mg/dL), blood urea nitrogen 72 mg/dL (range 8-21 mg/dL), and serum venous lactate 5.9 mmol/L (range 0.9-1.7 mmol/L).
MECHANISM OF ACTION AND USES OF ICIS
T-cell lymphocytes play a pivotal role in acquired immunity, but their function requires an appropriate balance between stimulatory and inhibitory signals to prevent autoimmunity.17 Immune checkpoint molecules are used by the immune system to assist with this balance.18 Although several of these molecules exist, the cytotoxic T-lymphocyte antigen-4 (CTLA-4) and programmed cell death-1 (PD-1) are among the most widely studied.12
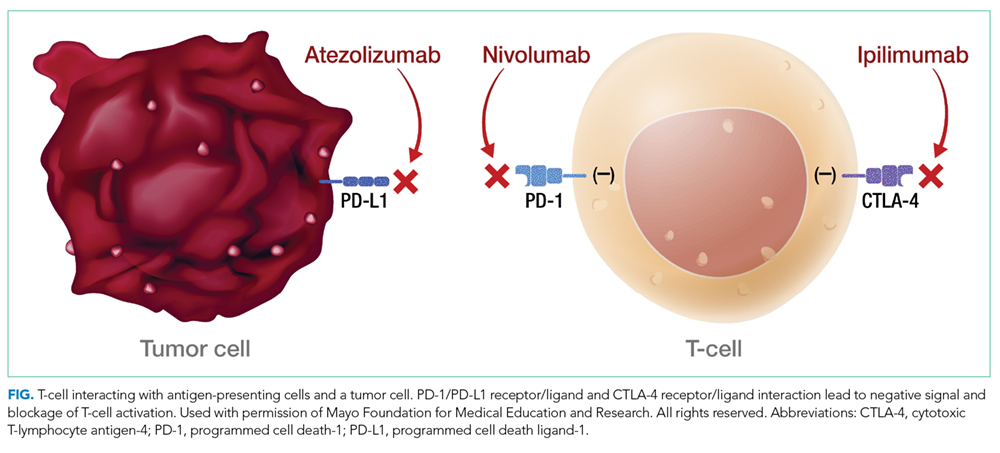
Ipilimumab is a monoclonal antibody directed against CTLA-4.24 After demonstrating survival benefits in patients with unresectable and metastatic melanoma, ipilimumab was the first ICI approved for use by the US Food and Drug Administration (FDA).1,3 Another monoclonal antibody directed against CTLA-4, tremelimumab, is not currently approved for use by the FDA.
TOXIC PROFILE
Because of the sustained T-cell activation, ICIs have been associated with autoimmune-like toxicities known as immune-related adverse events (irAEs).19,31 Because the PD-1/PD-L1 pathway is more tumor-specific than the CTLA-4 pathway,21-23 there is a higher incidence of serious irAEs seen with ipilimumab, reported to be around 27%.18,22 Furthermore, the risk of developing irAEs is dose-dependent and can increase up to 55% when anti-CTLA-4 are used with other ICIs such as nivolumab.13,32-34
The skin and GI tract are the most commonly involved organs.14-16 Skin is affected in 50% of patients receiving ipilimumab and 40% of patients on nivolumab or pembrolizumab, often in the form of a rash or pruritus.12,35-37 The rash is often described as faintly erythematous, reticular, and maculopapular and typically affects the trunk and extremities.38 Importantly, these events usually occur within the first 2 weeks of treatment, and fewer than 5% are severe.12,36,39 A higher percentage of severe adverse events occurs in the GI tract, with a reported incidence of 12%.3,14,36,39
CLINICAL PRESENTATION
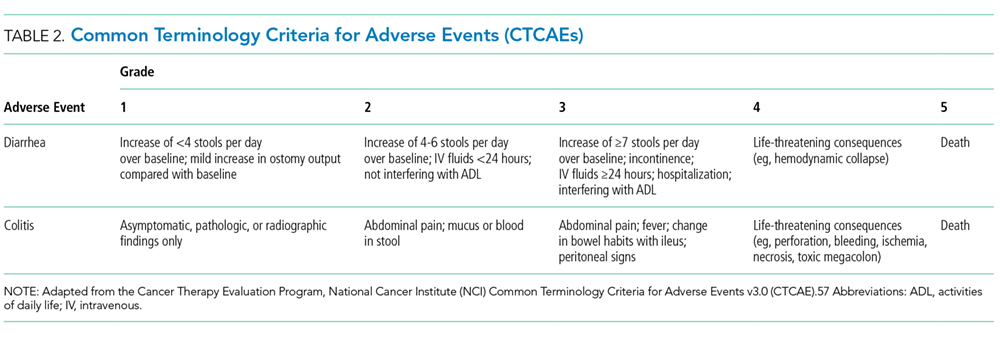
Colitis, defined by either the presence of symptoms or radiologic findings suggestive of inflammation, occurs less often than diarrhea alone, with a reported incidence of 2.3%.37,43 This incidence increases to almost 12% when anti-CTLA-4 and anti-PD-1/PD-L1 are combined.32 Colitis symptoms include abdominal pain (20%), nausea and vomiting (15%), fever (12%), and, less often, bloody diarrhea or rectal bleeding.19,20 Colitis severity is graded according to the CTCAE (Table 2).42 Most patients have mild colitis (grade 1 or 2).19 The risk for developing severe colitis (grade 3 or higher) is almost 10 times higher with the use of anti-CTLA-4 compared with anti-PD-1/PD-L1 agents.43 Patients with severe disease are at risk of developing life-threatening complications, such as ileus, toxic megacolon, bowel ischemia, necrosis, or even perforation, which has been reported in up to 5% of patients with colitis because of ipilimumab.13,17
CASE APPROACH STRATEGY
Based on the patient’s symptoms, physical findings, and temporal relationship to ICI therapy, he was believed to have immune-mediated colitis. Stool studies, including those looking for ova and parasites, C
DIAGNOSIS
In a patient undergoing ICI treatment who has diarrhea, the initial assessment should exclude C. difficile and Salmonella by stool culture, PCR, or pathogenic antigens.19 Cytomegalovirus reactivation should also be considered. Immune-mediated colitis and infection can coexist; thus, a positive infectious etiology does not rule out the presence of immune colitis or vice versa.44 Fecal calprotectin, a marker of neutrophil-associated inflammation, is nonspecific for ICI-induced colitis; however, it may help to distinguish inflammatory from noninflammatory diarrhea.33,45
No clear guideline exists for the use of abdominal imaging. Some experts suggest using computed tomography in patients with severe, persistent, or progressive symptoms in order to exclude bowel obstruction, toxic megacolon, or perforation.19,46
In patients with typical symptoms, and after infectious etiologies are ruled out, empiric use of corticosteroids can be initiated without an endoscopic evaluation, which is not necessary to establish a diagnosis and rarely changes management.12,37,47 In patients with atypical presentations or for whom the diagnosis remains in question, endoscopic evaluation with biopsies may be required. Macroscopic findings may be similar to those seen with inflammatory bowel disease (IBD), including erythema, edema, ulceration, granularity, or loss of vascular pattern. Although immune-mediated colitis affects the descending colon more often than IBD, this feature and any macroscopic findings are insufficient to make this distinction.20,36 Furthermore, the lack of macroscopic abnormalities does not rule out immune-mediated colitis.20
When endoscopic biopsies are obtained, histologic findings for anti-CTLA-4 medications (eg, ipilimumab) usually follow 3 patterns: neutrophilic infiltrate (46%), lymphocytic infiltrate (15%), and mixed infiltrate (38%).41 Other findings include crypt abscesses and tissue destruction.20 No biopsy-specific pattern has been described with anti-PD-1/PD-L1 medications, such as nivolumab or pembrolizumab.18 A normal colonic tissue does not exclude the presence of an irAE, as cases of isolated ileitis48 or enteritis49 without colitis can also occur.
CASE MANAGEMENT STRATEGY
The patient was started on intravenous (IV) methylprednisolone 2 mg/kg twice a day. After 48 hours, he still had more than 7 episodes of diarrhea per day, so he was treated with 1 dose of infliximab 5 mg/kg without stopping corticosteroids. Within 72 hours, the patient’s abdominal pain improved and his diarrhea stopped. He was discharged on an 8-week taper of prednisone starting at 1 mg/kg/day, pneumocystis pneumonia (PCP) prophylaxis was started, and ICI therapy was discontinued indefinitely.
MANAGEMENT OF COLITIS
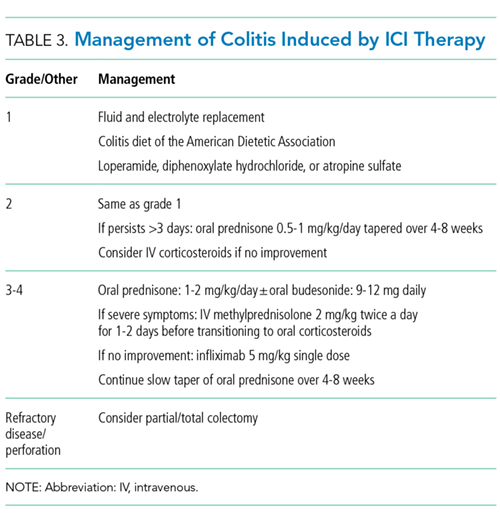
Management of grade 1 and 2 colitis is mainly supportive, consisting of fluid and electrolyte replacement, the American Dietetic Association colitis diet, and antimotility agents, such as loperamide, oral diphenoxylate hydrochloride, or atropine sulfate.36,37 Persistent grade 2 symptoms (lasting >3 days), should prompt initiation of 0.5 to 1 mg/kg/day of oral prednisone or an equivalent.19 If symptoms do not improve with oral corticosteroids, patient hospitalization for IV corticosteroids should be considered.37 Importantly, opioids and antidiarrheals may mask the pain and severity of symptoms and, therefore, should be used cautiously.19
Patients with grade 3 and 4 colitis (≥7 stools per day, severe abdominal pain, or complications) require the use of systemic corticosteroids at a dose of 1 to 2 mg/kg/day of prednisone or an equivalent.15 Patients who fail to respond to prednisone alone may benefit from the addition of oral budesonide at a dose of 9 to 12 mg/day.50 In severe cases of colitis, hospitalization may be necessary for IV hydration, electrolyte replacement, and IV methylprednisolone at a starting dose of 2 mg/kg twice a day for 1 to 2 days before transitioning to oral corticosteroids.12,15 Though improvement is usually noted within the first 2 weeks of treatment, prednisone should be slowly tapered over a period of 4 to 8 weeks to ensure complete healing and prevent relapse.20,36 Patients who receive an equivalent dose of prednisone 20 mg daily during a period of 4 weeks or more should receive PCP prophylaxis.51 Some patients fail to respond to IV corticosteroids despite adequate dosing. Many of these patients have severe disease, possibly because of delayed recognition and initiation of treatment.19 As with IBD, the addition of infliximab to corticosteroids at 5 mg/kg as a single dose is usually successful for this population subset.52-54 Although a response is seen within 1 to 3 days,41 some patients benefit from an additional dose of infliximab 2 weeks after the initial dose.19 If sepsis or perforation is suspected at any point, corticosteroids or infliximab should be avoided and antibiotics should be started immediately.15,19 Patients with a medically unresponsive disease may require partial or complete colectomy.20 The use of prophylactic budesonide to prevent diarrhea or colitis has not been proven effective and should not be used.55 Despite complications, mortality from colitis has markedly decreased given the increased awareness of this adverse event, reduction in the time to recognition and treatment, and increased adherence to corticosteroids.12
Treating physicians may be delayed in starting appropriate therapy because patients are concerned that using corticosteroids will negatively impact immunotherapy efficacy. Current evidence shows that the use of temporary immunosuppression to treat irAEs does not affect overall survival, efficacy, or time to treatment failure of the ICI.12,56 Restarting ICI therapy is a complex decision and should always be individualized. In grade 1 and 2 colitis, ICI therapy is typically restarted after symptoms have improved.5 In grade 3 and 4 colitis, ICI therapy is often permanently discontinued.20
CONCLUSION
ICIs have not only increased our understanding of the biology of cancer, but they have also improved survival in advanced stages of malignancies like melanoma, NSCLC, and renal cell carcinoma. The expanding use of these medications increases the likelihood that healthcare providers will encounter patients experiencing their adverse events.
Immune-mediated GI adverse events include a wide range of symptoms, from mild diarrhea to severe colitis complicated by perforation and death. Diagnosis requires exclusion of an infectious process. Early recognition and treatment with corticosteroids or another immunosuppressant such as infliximab hastens recovery and decreases complications and mortality. Treatment should be started within 5 days of symptom onset. Corticosteroids should be slowly tapered for no less than 4 weeks to prevent relapse and PCP prophylaxis administered in appropriate patients. Restarting ICI therapy may be considered in cases of mild colitis, but in severe cases, ICI therapy is usually discontinued.
Disclosure
Julian Marin-Acevedo, Dana Harris, and M. Caroline Burton have no conflicts of interest or funding sources to declare.
1. Ledford H. Melanoma drug wins US approval. Nature. 2011;471(7340):561. PubMed
2. Ribas A. Clinical development of the anti-CTLA-4 antibody tremelimumab. Semin Oncol. 2010;37(5):450-454. PubMed
3. Hodi FS, O’Day SJ, McDermott DF, et al. Improved survival with ipilimumab in patients with metastatic melanoma. N Engl J Med. 2010;363(8):711-723. PubMed
4. Brahmer J, Reckamp KL, Baas P, et al. Nivolumab versus Docetaxel in Advanced Squamous-Cell Non-Small-Cell Lung Cancer. N Engl J Med. 2015;373(2):123-135. PubMed
5. Motzer RJ, Rini BI, McDermott DF, et al. Nivolumab for Metastatic Renal Cell Carcinoma: Results of a Randomized Phase II Trial. J Clin Oncol. 2015;33(13):1430-1437. PubMed
6. Powles T, Eder JP, Fine GD, et al. MPDL3280A (anti-PD-L1) treatment leads to clinical activity in metastatic bladder cancer. Nature. 2014;515(7528):558-562. PubMed
7. Massard C, Gordon MS, Sharma S, et al. Safety and Efficacy of Durvalumab (MEDI4736), an Anti-Programmed Cell Death Ligand-1 Immune Checkpoint Inhibitor, in Patients With Advanced Urothelial Bladder Cancer. J Clin Oncol. 2016;34(26):3119-3125. PubMed
8. Ferris RL, Blumenschein G Jr, Fayette J, et al. Nivolumab for Recurrent Squamous-Cell Carcinoma of the Head and Neck. N Engl J Med. 2016;375(19):1856-1867. PubMed
9. Le DT, Uram JN, Wang H, et al. PD-1 Blockade in Tumors with Mismatch-Repair Deficiency. N Engl J Med. 2015;372(26):2509-2520. PubMed
10. Ansell SM, Lesokhin AM, Borrello I, et al. PD-1 blockade with nivolumab in relapsed or refractory Hodgkin’s lymphoma. N Engl J Med. 2015;372(4):311-319. PubMed
11. El-Khoueiry AB, Sangro B, Yau T, et al. Nivolumab in patients with advanced hepatocellular carcinoma (CheckMate 040): an open-label, non-comparative, phase 1/2 dose escalation and expansion trial. Lancet. 2017;389(10088)2492-2502. PubMed
12. Friedman CF, Proverbs-Singh TA, Postow MA. Treatment of the Immune-Related Adverse Effects of Immune Checkpoint Inhibitors: A Review. JAMA Oncol. 2016;2(10):1346-1353. PubMed
13. Heinzerling L, Goldinger SM. A review of serious adverse effects under treatment with checkpoint inhibitors. Curr Opin Oncol. 2017;29(2):136-144. PubMed
14. Kahler KC, Hauschild A. Treatment and side effect management of CTLA-4 antibody therapy in metastatic melanoma. J Dtsch Dermatol Ges. 2011;9(4):277-286. PubMed
15. Weber JS, Postow M, Lao CD, Schadendorf D. Management of Adverse Events Following Treatment With Anti-Programmed Death-1 Agents. Oncologist. 2016;21(10):1230-1240. PubMed
16. Bertrand A, Kostine M, Barnetche T, Truchetet ME, Schaeverbeke T. Immune related adverse events associated with anti-CTLA-4 antibodies: systematic review and meta-analysis. BMC Med. 2015;13:211-224. PubMed
17. Abdel-Wahab N, Shah M, Suarez-Almazor ME. Adverse Events Associated with Immune Checkpoint Blockade in Patients with Cancer: A Systematic Review of Case Reports. PLoS One. 2016;11(7):e0160221. doi:10.1371/journal.pone.0160221 PubMed
18. Naidoo J, Page DB, Li BT, et al. Toxicities of the anti-PD-1 and anti-PD-L1 immune checkpoint antibodies. Ann Oncol. 2015;26(12):2375-2391. PubMed
19. Gupta A, De Felice KM, Loftus EV Jr, Khanna S. Systematic review: colitis associated with anti-CTLA-4 therapy. Aliment Pharmacol Ther. 2015;42(4):406-417. PubMed
20. Pernot S, Ramtohul T, Taieb J. Checkpoint inhibitors and gastrointestinal immune-related adverse events. Curr Opin Oncol. 2016;28(4):264-268. PubMed
21. Kamata T, Suzuki A, Mise N, et al. Blockade of programmed death-1/programmed death ligand pathway enhances the antitumor immunity of human invariant natural killer T cells. Cancer Immunol Immunother. 2016;65(12):1477-1489. PubMed
22. Pardoll DM. The blockade of immune checkpoints in cancer immunotherapy. Nat Rev Cancer. 2012;12(4):252-264. PubMed
23. Velu V, Titanji K, Zhu B, et al. Enhancing SIV-specific immunity in vivo by PD-1 blockade. Nature. 2009;458(7235):206-210. PubMed
24. Phan GQ, Yang JC, Sherry RM, et al. Cancer regression and autoimmunity induced by cytotoxic T lymphocyte-associated antigen 4 blockade in patients with metastatic melanoma. Proc Natl Acad Sci U S A. 2003;100(14):8372-8377. PubMed
25. U.S. Food and Drug Administration, Center for Drug Evaluation and Research. Atezolizumab BLA 761041 approval letter (urothelial carcinoma). https://www.genentech-access.com/content/dam/gene/accesssolutions/brands/tecentriq/Appeals%20Tips/TECENTRIQ-FDA-Approval-Letter-Metastatic-Urothelial-Carcinoma-First-Line-Therapy.pdf. Accessed September 30, 2017.
26. U.S. Food and Drug Administration, Center for Drug Evaluation and Research. Imfinzi (durvalumab) approval letter. https://www.accessdata.fda.gov/drugsatfda_docs/appletter/2017/761069Orig1s000ltr.pdf. Accessed September 30, 2017.
27. U.S. Food and Drug Administration, Center for Drug Evaluation and Research. Bavencio (avelumab) accelerated approval letter - urothelial carcinoma. https://www.accessdata.fda.gov/drugsatfda_docs/appletter/2017/761078Orig1s000ltr.pdf. Accessed May 16, 2017.
28. U.S. Food and Drug Administration, Center for Drug Evaluation and Research. Atezolizumab BLA 761041 approval letter (NSCLC).
29. U.S. Food and Drug Administration, Center for Drug Evaluation and Research. Bavencio (avelumab) approval letter - Merkel cell carcinoma. https://www.accessdata.fda.gov/drugsatfda_docs/appletter/2017/761049Orig1s000ltr.pdf. Accessed April 27, 2017.
30. U.S. Food and Drug Administration, Center for Drug Evaluation and Research. Atezolizumab BLA 761041 approval letter. https://www.accessdata.fda.gov/drugsatfda_docs/nda/2016/761034Orig1s000Approv.pdf. Accessed April 6, 2017.
31. Voskens CJ, Goldinger SM, Loquai C, et al. The price of tumor control: an analysis of rare side effects of anti-CTLA-4 therapy in metastatic melanoma from the ipilimumab network. PLoS One. 2013;8(1):e53745. doi:10.1371/journal.pone.0053745. PubMed
32. Larkin J, Chiarion-Sileni V, Gonzalez R, et al. Combined Nivolumab and Ipilimumab or Monotherapy in Untreated Melanoma. N Engl J Med. 2015;373(1):23-34. PubMed
33. Michot JM, Bigenwald C, Champiat S, et al. Immune-related adverse events with immune checkpoint blockade: a comprehensive review. Eur J Cancer. 2016;54:139-148. PubMed
34. Villadolid J, Amin A. Immune checkpoint inhibitors in clinical practice: update on management of immune-related toxicities. Transl Lung Cancer Res. 2015;4(5):560-575. PubMed
35. Weber JS, Kahler KC, Hauschild A. Management of immune-related adverse events and kinetics of response with ipilimumab. J Clin Oncol. 2012;30(21):2691-2697. PubMed
36. Kahler KC, Hassel JC, Heinzerling L, et al. Management of side effects of immune checkpoint blockade by anti-CTLA-4 and anti-PD-1 antibodies in metastatic melanoma. J Dtsch Dermatol Ges. 2016;14(7):662-681. PubMed
37. Postow MA. Managing immune checkpoint-blocking antibody side effects. Am Soc Clin Oncol Educ Book. 2015:76-83. PubMed
38. Lacouture ME, Wolchok JD, Yosipovitch G, Kahler KC, Busam KJ, Hauschild A. Ipilimumab in patients with cancer and the management of dermatologic adverse events. J Am Acad Dermatol. 2014;71(1):161-169. PubMed
39. Robert C, Schachter J, Long GV, et al. Pembrolizumab versus Ipilimumab in Advanced Melanoma. N Engl J Med. 2015;372(26):2521-2532. PubMed
40. Weber J. Ipilimumab: controversies in its development, utility and autoimmune adverse events. Cancer Immunol Immunother. 2009;58(5):823-830. PubMed
41. Beck KE, Blansfield JA, Tran KQ, et al. Enterocolitis in patients with cancer after antibody blockade of cytotoxic T-lymphocyte-associated antigen 4. J Clin Oncol. 2006;24(15):2283-2289. PubMed
42. Cancer Therapy Evaluation Program, National Cancer Institute (NCI). Common terminology criteria for adverse events v3.0 (CTCAE). https://ctep.cancer.gov/protocoldevelopment/electronic_applications/docs/ctcaev3.pdf. Accessed April 9, 2017.
43. De Velasco G, Je Y, Bosse D, et al. Comprehensive Meta-analysis of Key Immune-Related Adverse Events from CTLA-4 and PD-1/PD-L1 Inhibitors in Cancer Patients. Cancer Immunol Res. 2017;5(4):312-318. PubMed
44. McCutcheon JL, McClain CM, Puzanov I, Smith TA. Infectious Colitis Associated With Ipilimumab Therapy. Gastroenterology Res. 2014;7(1):28-31. PubMed
45. Berman D, Parker SM, Siegel J, et al. Blockade of cytotoxic T-lymphocyte antigen-4 by ipilimumab results in dysregulation of gastrointestinal immunity in patients with advanced melanoma. Cancer Immun. 2010;10:11-20. PubMed
46. Reynolds K, Ananthakrishnan A, Dougan M, Bardia A. Immune-Related Adverse Events (irAEs) in Cancer Patients. In: McKean SC, Ross JJ, Dressler DD, Scheurer DB, eds. Principles and Practice of Hospital Medicine. 2nd ed. New York: McGraw-Hill Education; 2017.
47. Garcia-Neuer M, Marmarelis ME, Jangi SR, et al. Diagnostic Comparison of CT Scans and Colonoscopy for Immune-Related Colitis in Ipilimumab-Treated Advanced Melanoma Patients. Cancer Immunol Res. 2017;5(4):286-291. PubMed
48. Venditti O, De Lisi D, Caricato M, et al. Ipilimumab and immune-mediated adverse events: a case report of anti-CTLA4 induced ileitis. BMC Cancer. 2015;15:87-91. PubMed
49. Messmer M, Upreti S, Tarabishy Y, et al. Ipilimumab-Induced Enteritis without Colitis: A New Challenge. Case Rep Oncol. 2016;9(3):705-713. PubMed
50. De Felice KM, Gupta A, Rakshit S, et al. Ipilimumab-induced colitis in patients with metastatic melanoma. Melanoma Res. 2015;25(4):321-327. PubMed
51. Baden LR, Swaminathan S, Angarone M, et al. Prevention and Treatment of Cancer-Related Infections, Version 2.2017, NCCN Clinical Practice Guidelines in Oncology. J Natl Compr Canc Newt. 2017;14(7):882-913. PubMed
52. Minor DR, Chin K, Kashani-Sabet M. Infliximab in the treatment of anti-CTLA4 antibody (ipilimumab) induced immune-related colitis. Cancer Biother Radiopharm. 2009;24(3):321-325. PubMed
53. Merrill SP, Reynolds P, Kalra A, Biehl J, Vandivier RW, Mueller SW. Early administration of infliximab for severe ipilimumab-related diarrhea in a critically ill patient. Ann Pharmacother. 2014;48(6):806-810. PubMed
54. Pages C, Gornet JM, Monsel G, et al. Ipilimumab-induced acute severe colitis treated by infliximab. Melanoma Res. 2013;23(3):227-230. PubMed
55. Weber J, Thompson JA, Hamid O, et al. A randomized, double-blind, placebo-controlled, phase II study comparing the tolerability and efficacy of ipilimumab administered with or without prophylactic budesonide in patients with unresectable stage III or IV melanoma. Clin Cancer Res. 2009;15(17):5591-5598. PubMed
56. Horvat TZ, Adel NG, Dung TO, et al. Immune-Related Adverse Events, Need for Systemic Immunosuppression, and Effects on Survival and Time to Treatment Failure in Patients With Melanoma Treated With Ipilimumab at Memorial Sloan Kettering Cancer Center. J Clin Oncol. 2015;33(28):3193-3198. PubMed
57. Cancer Therapy Evaluation Program, National Cancer Institute (NCI). Common terminology criteria for adverse events v3.0 (CTCAE). https://ctep.cancer.gov/protocoldevelopment/electronic_applications/docs/ctcaev3.pdf. Accessed April 9, 2017.
Immune checkpoint inhibitors (ICIs), a form of immunotherapy, have changed the management of cancer since their introduction in 2011.1 They were initially tested on melanoma.2 Their use in the advanced stages of the disease demonstrated a 2-year survival of 18% compared with 5% by using other therapies.3 Similar results were observed in nonsmall cell lung carcinoma (NSCLC); the overall survival benefit was 3 months with the use of ICIs compared with traditional chemotherapy (42% and 24% at 1 year, respectively).4 Antitumor activity has also been seen in the treatment of other malignancies, including renal cell carcinoma,5 bladder carcinoma,6,7 head and neck carcinoma,8 colorectal cancer,9 Hodgkin lymphoma,10 and, more recently, hepatocellular carcinoma.11 The use of ICIs has also been linked to serious complications.12 Although the skin, kidneys, lungs, and endocrine and nervous systems may be affected, complications of the gastrointestinal (GI) tract are frequent and can be life-threatening.12-16 We performed a thorough review of the literature to familiarize hospitalists with the mechanism of action and uses of ICIs, the clinical presentation of their GI toxicity, and the current recommendations regarding diagnosis and treatment.
CASE PRESENTATION
A 66-year-old man was admitted to our institution with a 1-week history of severe, diffuse abdominal pain and profuse watery diarrhea. He reported having more than 8 watery bowel movements per day and denied fever, recent travel, ill contacts, or ingestion of undercooked food. He had a history of metastatic melanoma and was undergoing treatment with both nivolumab and ipilimumab; the drugs were started 6 weeks prior to presentation. Physical examination revealed a heart rate of 110 beats/minute while supine and 123 beats/minute while standing, blood pressure of 112/69 mm Hg while supine and 92/62 mm Hg while standing, and a temperature of 37.2°C. He was in mild distress and had dry oral mucosa. Abdominal examination revealed hyperactive bowel sounds and mild diffuse abdominal tenderness with no guarding or rebound. His extremities were cool, but peripheral pulses were present. Initial laboratory results included a hemoglobin level of 15.3 g/dL (range 12.0-16.0 mg/dL), white blood cell count 14.2 × 10⁹/L (range 4.5-11.0 × 10⁹/L), and platelet count 236 × 109/L (range 150-400 × 109/L); other test results included a sodium level of 130 mmol/L (range 135-145 mmol/L), potassium 2.3 mmol/L (range 3.5-5.5 mmol/L), serum creatinine 2.2 mg/dL (range 0.8-1.3 mg/dL), blood urea nitrogen 72 mg/dL (range 8-21 mg/dL), and serum venous lactate 5.9 mmol/L (range 0.9-1.7 mmol/L).
MECHANISM OF ACTION AND USES OF ICIS
T-cell lymphocytes play a pivotal role in acquired immunity, but their function requires an appropriate balance between stimulatory and inhibitory signals to prevent autoimmunity.17 Immune checkpoint molecules are used by the immune system to assist with this balance.18 Although several of these molecules exist, the cytotoxic T-lymphocyte antigen-4 (CTLA-4) and programmed cell death-1 (PD-1) are among the most widely studied.12
Ipilimumab is a monoclonal antibody directed against CTLA-4.24 After demonstrating survival benefits in patients with unresectable and metastatic melanoma, ipilimumab was the first ICI approved for use by the US Food and Drug Administration (FDA).1,3 Another monoclonal antibody directed against CTLA-4, tremelimumab, is not currently approved for use by the FDA.
TOXIC PROFILE
Because of the sustained T-cell activation, ICIs have been associated with autoimmune-like toxicities known as immune-related adverse events (irAEs).19,31 Because the PD-1/PD-L1 pathway is more tumor-specific than the CTLA-4 pathway,21-23 there is a higher incidence of serious irAEs seen with ipilimumab, reported to be around 27%.18,22 Furthermore, the risk of developing irAEs is dose-dependent and can increase up to 55% when anti-CTLA-4 are used with other ICIs such as nivolumab.13,32-34
The skin and GI tract are the most commonly involved organs.14-16 Skin is affected in 50% of patients receiving ipilimumab and 40% of patients on nivolumab or pembrolizumab, often in the form of a rash or pruritus.12,35-37 The rash is often described as faintly erythematous, reticular, and maculopapular and typically affects the trunk and extremities.38 Importantly, these events usually occur within the first 2 weeks of treatment, and fewer than 5% are severe.12,36,39 A higher percentage of severe adverse events occurs in the GI tract, with a reported incidence of 12%.3,14,36,39
CLINICAL PRESENTATION
Colitis, defined by either the presence of symptoms or radiologic findings suggestive of inflammation, occurs less often than diarrhea alone, with a reported incidence of 2.3%.37,43 This incidence increases to almost 12% when anti-CTLA-4 and anti-PD-1/PD-L1 are combined.32 Colitis symptoms include abdominal pain (20%), nausea and vomiting (15%), fever (12%), and, less often, bloody diarrhea or rectal bleeding.19,20 Colitis severity is graded according to the CTCAE (Table 2).42 Most patients have mild colitis (grade 1 or 2).19 The risk for developing severe colitis (grade 3 or higher) is almost 10 times higher with the use of anti-CTLA-4 compared with anti-PD-1/PD-L1 agents.43 Patients with severe disease are at risk of developing life-threatening complications, such as ileus, toxic megacolon, bowel ischemia, necrosis, or even perforation, which has been reported in up to 5% of patients with colitis because of ipilimumab.13,17
CASE APPROACH STRATEGY
Based on the patient’s symptoms, physical findings, and temporal relationship to ICI therapy, he was believed to have immune-mediated colitis. Stool studies, including those looking for ova and parasites, C
DIAGNOSIS
In a patient undergoing ICI treatment who has diarrhea, the initial assessment should exclude C. difficile and Salmonella by stool culture, PCR, or pathogenic antigens.19 Cytomegalovirus reactivation should also be considered. Immune-mediated colitis and infection can coexist; thus, a positive infectious etiology does not rule out the presence of immune colitis or vice versa.44 Fecal calprotectin, a marker of neutrophil-associated inflammation, is nonspecific for ICI-induced colitis; however, it may help to distinguish inflammatory from noninflammatory diarrhea.33,45
No clear guideline exists for the use of abdominal imaging. Some experts suggest using computed tomography in patients with severe, persistent, or progressive symptoms in order to exclude bowel obstruction, toxic megacolon, or perforation.19,46
In patients with typical symptoms, and after infectious etiologies are ruled out, empiric use of corticosteroids can be initiated without an endoscopic evaluation, which is not necessary to establish a diagnosis and rarely changes management.12,37,47 In patients with atypical presentations or for whom the diagnosis remains in question, endoscopic evaluation with biopsies may be required. Macroscopic findings may be similar to those seen with inflammatory bowel disease (IBD), including erythema, edema, ulceration, granularity, or loss of vascular pattern. Although immune-mediated colitis affects the descending colon more often than IBD, this feature and any macroscopic findings are insufficient to make this distinction.20,36 Furthermore, the lack of macroscopic abnormalities does not rule out immune-mediated colitis.20
When endoscopic biopsies are obtained, histologic findings for anti-CTLA-4 medications (eg, ipilimumab) usually follow 3 patterns: neutrophilic infiltrate (46%), lymphocytic infiltrate (15%), and mixed infiltrate (38%).41 Other findings include crypt abscesses and tissue destruction.20 No biopsy-specific pattern has been described with anti-PD-1/PD-L1 medications, such as nivolumab or pembrolizumab.18 A normal colonic tissue does not exclude the presence of an irAE, as cases of isolated ileitis48 or enteritis49 without colitis can also occur.
CASE MANAGEMENT STRATEGY
The patient was started on intravenous (IV) methylprednisolone 2 mg/kg twice a day. After 48 hours, he still had more than 7 episodes of diarrhea per day, so he was treated with 1 dose of infliximab 5 mg/kg without stopping corticosteroids. Within 72 hours, the patient’s abdominal pain improved and his diarrhea stopped. He was discharged on an 8-week taper of prednisone starting at 1 mg/kg/day, pneumocystis pneumonia (PCP) prophylaxis was started, and ICI therapy was discontinued indefinitely.
MANAGEMENT OF COLITIS
Management of grade 1 and 2 colitis is mainly supportive, consisting of fluid and electrolyte replacement, the American Dietetic Association colitis diet, and antimotility agents, such as loperamide, oral diphenoxylate hydrochloride, or atropine sulfate.36,37 Persistent grade 2 symptoms (lasting >3 days), should prompt initiation of 0.5 to 1 mg/kg/day of oral prednisone or an equivalent.19 If symptoms do not improve with oral corticosteroids, patient hospitalization for IV corticosteroids should be considered.37 Importantly, opioids and antidiarrheals may mask the pain and severity of symptoms and, therefore, should be used cautiously.19
Patients with grade 3 and 4 colitis (≥7 stools per day, severe abdominal pain, or complications) require the use of systemic corticosteroids at a dose of 1 to 2 mg/kg/day of prednisone or an equivalent.15 Patients who fail to respond to prednisone alone may benefit from the addition of oral budesonide at a dose of 9 to 12 mg/day.50 In severe cases of colitis, hospitalization may be necessary for IV hydration, electrolyte replacement, and IV methylprednisolone at a starting dose of 2 mg/kg twice a day for 1 to 2 days before transitioning to oral corticosteroids.12,15 Though improvement is usually noted within the first 2 weeks of treatment, prednisone should be slowly tapered over a period of 4 to 8 weeks to ensure complete healing and prevent relapse.20,36 Patients who receive an equivalent dose of prednisone 20 mg daily during a period of 4 weeks or more should receive PCP prophylaxis.51 Some patients fail to respond to IV corticosteroids despite adequate dosing. Many of these patients have severe disease, possibly because of delayed recognition and initiation of treatment.19 As with IBD, the addition of infliximab to corticosteroids at 5 mg/kg as a single dose is usually successful for this population subset.52-54 Although a response is seen within 1 to 3 days,41 some patients benefit from an additional dose of infliximab 2 weeks after the initial dose.19 If sepsis or perforation is suspected at any point, corticosteroids or infliximab should be avoided and antibiotics should be started immediately.15,19 Patients with a medically unresponsive disease may require partial or complete colectomy.20 The use of prophylactic budesonide to prevent diarrhea or colitis has not been proven effective and should not be used.55 Despite complications, mortality from colitis has markedly decreased given the increased awareness of this adverse event, reduction in the time to recognition and treatment, and increased adherence to corticosteroids.12
Treating physicians may be delayed in starting appropriate therapy because patients are concerned that using corticosteroids will negatively impact immunotherapy efficacy. Current evidence shows that the use of temporary immunosuppression to treat irAEs does not affect overall survival, efficacy, or time to treatment failure of the ICI.12,56 Restarting ICI therapy is a complex decision and should always be individualized. In grade 1 and 2 colitis, ICI therapy is typically restarted after symptoms have improved.5 In grade 3 and 4 colitis, ICI therapy is often permanently discontinued.20
CONCLUSION
ICIs have not only increased our understanding of the biology of cancer, but they have also improved survival in advanced stages of malignancies like melanoma, NSCLC, and renal cell carcinoma. The expanding use of these medications increases the likelihood that healthcare providers will encounter patients experiencing their adverse events.
Immune-mediated GI adverse events include a wide range of symptoms, from mild diarrhea to severe colitis complicated by perforation and death. Diagnosis requires exclusion of an infectious process. Early recognition and treatment with corticosteroids or another immunosuppressant such as infliximab hastens recovery and decreases complications and mortality. Treatment should be started within 5 days of symptom onset. Corticosteroids should be slowly tapered for no less than 4 weeks to prevent relapse and PCP prophylaxis administered in appropriate patients. Restarting ICI therapy may be considered in cases of mild colitis, but in severe cases, ICI therapy is usually discontinued.
Disclosure
Julian Marin-Acevedo, Dana Harris, and M. Caroline Burton have no conflicts of interest or funding sources to declare.
1. Ledford H. Melanoma drug wins US approval. Nature. 2011;471(7340):561. PubMed
2. Ribas A. Clinical development of the anti-CTLA-4 antibody tremelimumab. Semin Oncol. 2010;37(5):450-454. PubMed
3. Hodi FS, O’Day SJ, McDermott DF, et al. Improved survival with ipilimumab in patients with metastatic melanoma. N Engl J Med. 2010;363(8):711-723. PubMed
4. Brahmer J, Reckamp KL, Baas P, et al. Nivolumab versus Docetaxel in Advanced Squamous-Cell Non-Small-Cell Lung Cancer. N Engl J Med. 2015;373(2):123-135. PubMed
5. Motzer RJ, Rini BI, McDermott DF, et al. Nivolumab for Metastatic Renal Cell Carcinoma: Results of a Randomized Phase II Trial. J Clin Oncol. 2015;33(13):1430-1437. PubMed
6. Powles T, Eder JP, Fine GD, et al. MPDL3280A (anti-PD-L1) treatment leads to clinical activity in metastatic bladder cancer. Nature. 2014;515(7528):558-562. PubMed
7. Massard C, Gordon MS, Sharma S, et al. Safety and Efficacy of Durvalumab (MEDI4736), an Anti-Programmed Cell Death Ligand-1 Immune Checkpoint Inhibitor, in Patients With Advanced Urothelial Bladder Cancer. J Clin Oncol. 2016;34(26):3119-3125. PubMed
8. Ferris RL, Blumenschein G Jr, Fayette J, et al. Nivolumab for Recurrent Squamous-Cell Carcinoma of the Head and Neck. N Engl J Med. 2016;375(19):1856-1867. PubMed
9. Le DT, Uram JN, Wang H, et al. PD-1 Blockade in Tumors with Mismatch-Repair Deficiency. N Engl J Med. 2015;372(26):2509-2520. PubMed
10. Ansell SM, Lesokhin AM, Borrello I, et al. PD-1 blockade with nivolumab in relapsed or refractory Hodgkin’s lymphoma. N Engl J Med. 2015;372(4):311-319. PubMed
11. El-Khoueiry AB, Sangro B, Yau T, et al. Nivolumab in patients with advanced hepatocellular carcinoma (CheckMate 040): an open-label, non-comparative, phase 1/2 dose escalation and expansion trial. Lancet. 2017;389(10088)2492-2502. PubMed
12. Friedman CF, Proverbs-Singh TA, Postow MA. Treatment of the Immune-Related Adverse Effects of Immune Checkpoint Inhibitors: A Review. JAMA Oncol. 2016;2(10):1346-1353. PubMed
13. Heinzerling L, Goldinger SM. A review of serious adverse effects under treatment with checkpoint inhibitors. Curr Opin Oncol. 2017;29(2):136-144. PubMed
14. Kahler KC, Hauschild A. Treatment and side effect management of CTLA-4 antibody therapy in metastatic melanoma. J Dtsch Dermatol Ges. 2011;9(4):277-286. PubMed
15. Weber JS, Postow M, Lao CD, Schadendorf D. Management of Adverse Events Following Treatment With Anti-Programmed Death-1 Agents. Oncologist. 2016;21(10):1230-1240. PubMed
16. Bertrand A, Kostine M, Barnetche T, Truchetet ME, Schaeverbeke T. Immune related adverse events associated with anti-CTLA-4 antibodies: systematic review and meta-analysis. BMC Med. 2015;13:211-224. PubMed
17. Abdel-Wahab N, Shah M, Suarez-Almazor ME. Adverse Events Associated with Immune Checkpoint Blockade in Patients with Cancer: A Systematic Review of Case Reports. PLoS One. 2016;11(7):e0160221. doi:10.1371/journal.pone.0160221 PubMed
18. Naidoo J, Page DB, Li BT, et al. Toxicities of the anti-PD-1 and anti-PD-L1 immune checkpoint antibodies. Ann Oncol. 2015;26(12):2375-2391. PubMed
19. Gupta A, De Felice KM, Loftus EV Jr, Khanna S. Systematic review: colitis associated with anti-CTLA-4 therapy. Aliment Pharmacol Ther. 2015;42(4):406-417. PubMed
20. Pernot S, Ramtohul T, Taieb J. Checkpoint inhibitors and gastrointestinal immune-related adverse events. Curr Opin Oncol. 2016;28(4):264-268. PubMed
21. Kamata T, Suzuki A, Mise N, et al. Blockade of programmed death-1/programmed death ligand pathway enhances the antitumor immunity of human invariant natural killer T cells. Cancer Immunol Immunother. 2016;65(12):1477-1489. PubMed
22. Pardoll DM. The blockade of immune checkpoints in cancer immunotherapy. Nat Rev Cancer. 2012;12(4):252-264. PubMed
23. Velu V, Titanji K, Zhu B, et al. Enhancing SIV-specific immunity in vivo by PD-1 blockade. Nature. 2009;458(7235):206-210. PubMed
24. Phan GQ, Yang JC, Sherry RM, et al. Cancer regression and autoimmunity induced by cytotoxic T lymphocyte-associated antigen 4 blockade in patients with metastatic melanoma. Proc Natl Acad Sci U S A. 2003;100(14):8372-8377. PubMed
25. U.S. Food and Drug Administration, Center for Drug Evaluation and Research. Atezolizumab BLA 761041 approval letter (urothelial carcinoma). https://www.genentech-access.com/content/dam/gene/accesssolutions/brands/tecentriq/Appeals%20Tips/TECENTRIQ-FDA-Approval-Letter-Metastatic-Urothelial-Carcinoma-First-Line-Therapy.pdf. Accessed September 30, 2017.
26. U.S. Food and Drug Administration, Center for Drug Evaluation and Research. Imfinzi (durvalumab) approval letter. https://www.accessdata.fda.gov/drugsatfda_docs/appletter/2017/761069Orig1s000ltr.pdf. Accessed September 30, 2017.
27. U.S. Food and Drug Administration, Center for Drug Evaluation and Research. Bavencio (avelumab) accelerated approval letter - urothelial carcinoma. https://www.accessdata.fda.gov/drugsatfda_docs/appletter/2017/761078Orig1s000ltr.pdf. Accessed May 16, 2017.
28. U.S. Food and Drug Administration, Center for Drug Evaluation and Research. Atezolizumab BLA 761041 approval letter (NSCLC).
29. U.S. Food and Drug Administration, Center for Drug Evaluation and Research. Bavencio (avelumab) approval letter - Merkel cell carcinoma. https://www.accessdata.fda.gov/drugsatfda_docs/appletter/2017/761049Orig1s000ltr.pdf. Accessed April 27, 2017.
30. U.S. Food and Drug Administration, Center for Drug Evaluation and Research. Atezolizumab BLA 761041 approval letter. https://www.accessdata.fda.gov/drugsatfda_docs/nda/2016/761034Orig1s000Approv.pdf. Accessed April 6, 2017.
31. Voskens CJ, Goldinger SM, Loquai C, et al. The price of tumor control: an analysis of rare side effects of anti-CTLA-4 therapy in metastatic melanoma from the ipilimumab network. PLoS One. 2013;8(1):e53745. doi:10.1371/journal.pone.0053745. PubMed
32. Larkin J, Chiarion-Sileni V, Gonzalez R, et al. Combined Nivolumab and Ipilimumab or Monotherapy in Untreated Melanoma. N Engl J Med. 2015;373(1):23-34. PubMed
33. Michot JM, Bigenwald C, Champiat S, et al. Immune-related adverse events with immune checkpoint blockade: a comprehensive review. Eur J Cancer. 2016;54:139-148. PubMed
34. Villadolid J, Amin A. Immune checkpoint inhibitors in clinical practice: update on management of immune-related toxicities. Transl Lung Cancer Res. 2015;4(5):560-575. PubMed
35. Weber JS, Kahler KC, Hauschild A. Management of immune-related adverse events and kinetics of response with ipilimumab. J Clin Oncol. 2012;30(21):2691-2697. PubMed
36. Kahler KC, Hassel JC, Heinzerling L, et al. Management of side effects of immune checkpoint blockade by anti-CTLA-4 and anti-PD-1 antibodies in metastatic melanoma. J Dtsch Dermatol Ges. 2016;14(7):662-681. PubMed
37. Postow MA. Managing immune checkpoint-blocking antibody side effects. Am Soc Clin Oncol Educ Book. 2015:76-83. PubMed
38. Lacouture ME, Wolchok JD, Yosipovitch G, Kahler KC, Busam KJ, Hauschild A. Ipilimumab in patients with cancer and the management of dermatologic adverse events. J Am Acad Dermatol. 2014;71(1):161-169. PubMed
39. Robert C, Schachter J, Long GV, et al. Pembrolizumab versus Ipilimumab in Advanced Melanoma. N Engl J Med. 2015;372(26):2521-2532. PubMed
40. Weber J. Ipilimumab: controversies in its development, utility and autoimmune adverse events. Cancer Immunol Immunother. 2009;58(5):823-830. PubMed
41. Beck KE, Blansfield JA, Tran KQ, et al. Enterocolitis in patients with cancer after antibody blockade of cytotoxic T-lymphocyte-associated antigen 4. J Clin Oncol. 2006;24(15):2283-2289. PubMed
42. Cancer Therapy Evaluation Program, National Cancer Institute (NCI). Common terminology criteria for adverse events v3.0 (CTCAE). https://ctep.cancer.gov/protocoldevelopment/electronic_applications/docs/ctcaev3.pdf. Accessed April 9, 2017.
43. De Velasco G, Je Y, Bosse D, et al. Comprehensive Meta-analysis of Key Immune-Related Adverse Events from CTLA-4 and PD-1/PD-L1 Inhibitors in Cancer Patients. Cancer Immunol Res. 2017;5(4):312-318. PubMed
44. McCutcheon JL, McClain CM, Puzanov I, Smith TA. Infectious Colitis Associated With Ipilimumab Therapy. Gastroenterology Res. 2014;7(1):28-31. PubMed
45. Berman D, Parker SM, Siegel J, et al. Blockade of cytotoxic T-lymphocyte antigen-4 by ipilimumab results in dysregulation of gastrointestinal immunity in patients with advanced melanoma. Cancer Immun. 2010;10:11-20. PubMed
46. Reynolds K, Ananthakrishnan A, Dougan M, Bardia A. Immune-Related Adverse Events (irAEs) in Cancer Patients. In: McKean SC, Ross JJ, Dressler DD, Scheurer DB, eds. Principles and Practice of Hospital Medicine. 2nd ed. New York: McGraw-Hill Education; 2017.
47. Garcia-Neuer M, Marmarelis ME, Jangi SR, et al. Diagnostic Comparison of CT Scans and Colonoscopy for Immune-Related Colitis in Ipilimumab-Treated Advanced Melanoma Patients. Cancer Immunol Res. 2017;5(4):286-291. PubMed
48. Venditti O, De Lisi D, Caricato M, et al. Ipilimumab and immune-mediated adverse events: a case report of anti-CTLA4 induced ileitis. BMC Cancer. 2015;15:87-91. PubMed
49. Messmer M, Upreti S, Tarabishy Y, et al. Ipilimumab-Induced Enteritis without Colitis: A New Challenge. Case Rep Oncol. 2016;9(3):705-713. PubMed
50. De Felice KM, Gupta A, Rakshit S, et al. Ipilimumab-induced colitis in patients with metastatic melanoma. Melanoma Res. 2015;25(4):321-327. PubMed
51. Baden LR, Swaminathan S, Angarone M, et al. Prevention and Treatment of Cancer-Related Infections, Version 2.2017, NCCN Clinical Practice Guidelines in Oncology. J Natl Compr Canc Newt. 2017;14(7):882-913. PubMed
52. Minor DR, Chin K, Kashani-Sabet M. Infliximab in the treatment of anti-CTLA4 antibody (ipilimumab) induced immune-related colitis. Cancer Biother Radiopharm. 2009;24(3):321-325. PubMed
53. Merrill SP, Reynolds P, Kalra A, Biehl J, Vandivier RW, Mueller SW. Early administration of infliximab for severe ipilimumab-related diarrhea in a critically ill patient. Ann Pharmacother. 2014;48(6):806-810. PubMed
54. Pages C, Gornet JM, Monsel G, et al. Ipilimumab-induced acute severe colitis treated by infliximab. Melanoma Res. 2013;23(3):227-230. PubMed
55. Weber J, Thompson JA, Hamid O, et al. A randomized, double-blind, placebo-controlled, phase II study comparing the tolerability and efficacy of ipilimumab administered with or without prophylactic budesonide in patients with unresectable stage III or IV melanoma. Clin Cancer Res. 2009;15(17):5591-5598. PubMed
56. Horvat TZ, Adel NG, Dung TO, et al. Immune-Related Adverse Events, Need for Systemic Immunosuppression, and Effects on Survival and Time to Treatment Failure in Patients With Melanoma Treated With Ipilimumab at Memorial Sloan Kettering Cancer Center. J Clin Oncol. 2015;33(28):3193-3198. PubMed
57. Cancer Therapy Evaluation Program, National Cancer Institute (NCI). Common terminology criteria for adverse events v3.0 (CTCAE). https://ctep.cancer.gov/protocoldevelopment/electronic_applications/docs/ctcaev3.pdf. Accessed April 9, 2017.
© 2018 Society of Hospital Medicine
Poor Adherence to Risk Stratification Guidelines Results in Overuse of Venous Thromboembolism Prophylaxis in Hospitalized Older Adults
Venous thromboembolism (VTE) prophylaxis is an important consideration for every older adult admitted to the hospital1 but should not be prescribed to all patients. Use of anticoagulants (specifically low-molecular-weight heparin, low-dose unfractionated heparin, and fondaparinux) when not medically indicated may be harmful, especially for older adults who on average have more chronic conditions,1 take more potentially interacting medications,2 and have higher risks of bleeding.3 The American College of Chest Physicians (ACCP) Ninth Edition Guidelines for Antithrombotic Therapy and Prevention of Thrombosis explicitly recommend a risk-stratification approach using the Padua Prediction Score (PPS) to select those patients most likely to benefit from VTE prophylaxis.4,5 This study aimed to describe the use of risk stratification and pharmacologic VTE prophylaxis use in a population of medically ill, hospitalized older patients.
METHODS
We conducted a retrospective cohort study using data from patients aged 70 years or older admitted to Duke University Hospital general medicine services between January 1, 2014, to December 31, 2014. The PPS variables, 11 in total, are each weighed and sum to a score that stratifies patients into either high or low risk for VTE occurrence.5 Manual chart abstraction was performed using the electronic health record (EHR) to determine each patient’s PPS, inpatient pharmacologic VTE prophylaxis use, and contraindications to VTE prophylaxis. Descriptive statistics are presented for the important confounders/covariates, VTE risk, and VTE prophylaxis use.
RESULTS
Of the total eligible cohort (N = 1399), 400 patients were randomly selected for manual chart review; 89 of these patients were not eligible because they were on anticoagulation upon admission, leaving n = 311 patients in the analytic sample. Mean age for the sample was 80.6 years (standard deviation [SD]: 7.3); 42% were male and 34% were African American, and median length of stay was 4.0 days. The overall mean PPS for the sample was 3.6 (SD 1.8), resulting in 59% (n = 182) defined as “low risk.” Reasons for admission, median length of stay, and aspirin use did not differ between the risk groups.
Pharmacological VTE prophylaxis was present in 74% (134 out of 182) of low-risk patients and 71% (92 out of 129) of high-risk patients (Figure). In both low- and high-risk patients who received pharmacological VTE prophylaxis, over 90% had the therapy initiated within 24 hours of admission, and it was continued for over 60% of their hospital days.
DISCUSSION
We found no association between PPS and use of anticoagulants for VTE prophylaxis, suggesting that risk stratification is not being used to guide clinical decision-making. There are several barriers to implementing guideline directed use of VTE risk stratification. First, there is a lack of consensus on which VTE risk assessment tool is best to use with medically ill, hospitalized patients. While the ACCP Ninth Edition Guidelines support the use of the PPS, the American College of Physicians does not recommend a specific tool for VTE risk assessment.5,6 Although other risk stratification tools exist, concordance between these tools has not been well studied.7 Second, manual calculation of the PPS can be cumbersome, error prone, and disruptive to the clinical workflow. Automated data extraction leveraging existing structured data elements in the EHR may be particularly attractive to many health systems striving to use EHRs to improve care. Designing and testing automatically populated VTE risk stratification tools may facilitate translation of evidence-based guidelines into routine clinical practice. Lastly, a key barrier is clinician education and awareness about these tools. Adding risk stratification tools to admission order sets is one way to increase clinician awareness and has been shown to decrease inappropriate VTE prophylaxis use.8 High-quality studies that use implementation science to promote uptake and efficacy of risk stratification tools into clinical practice are urgently needed.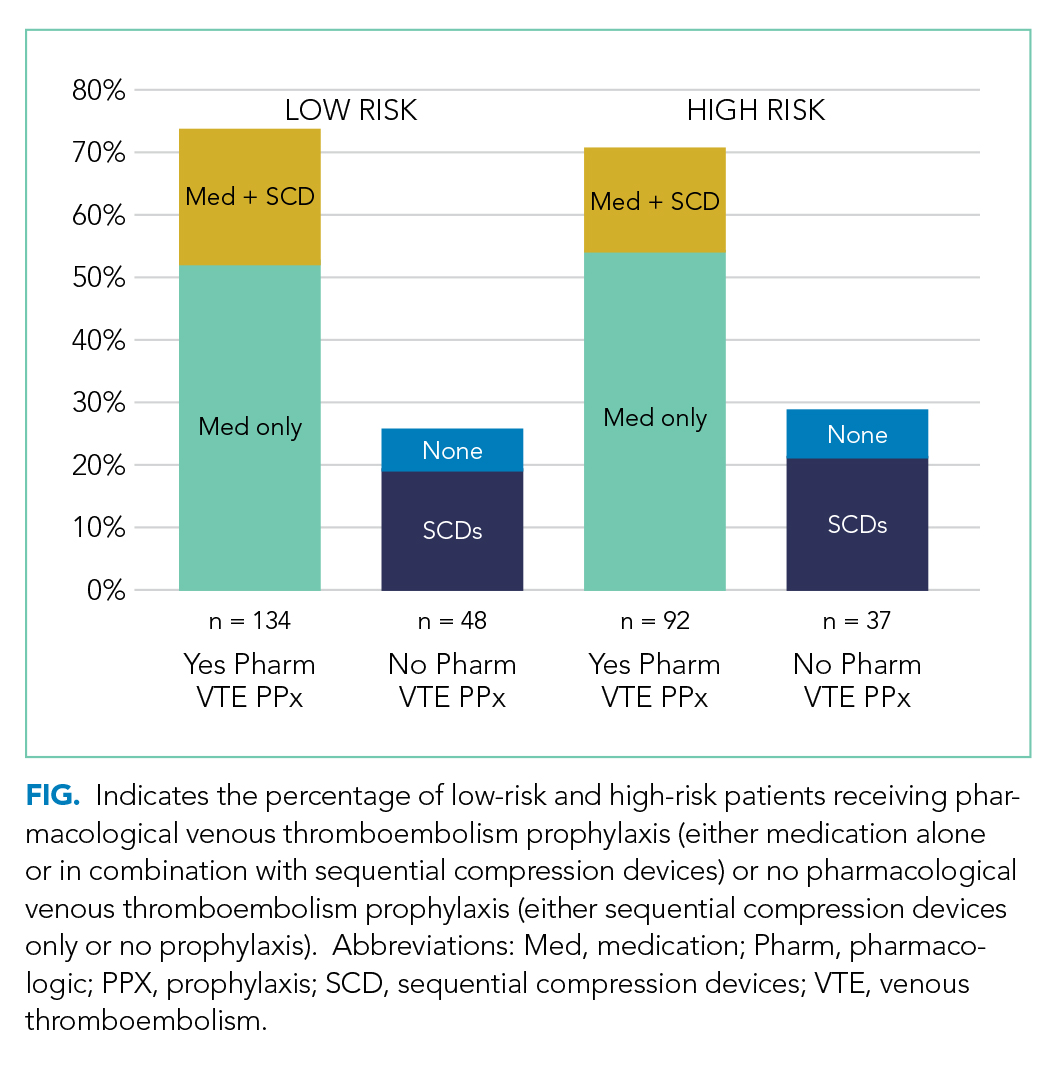
Our study has several limitations. First, this was a single-site study at an academic center, which may limit generalizability of the findings. However, our design enabled us to look at other specific patient-level data that is typically not available in larger databases. Second, determination of PPS is limited to data available in the EHR, resulting in measurement error and possibly the underreporting of risk factors. Finally, due to feasibility and the low probability of VTE, we did not collect data on long-term VTE outcome and were unable to determine the impact that inappropriate VTE prophylaxis use has in low-risk hospitalized older adults.
In summary, we found poor adherence to risk stratification guidelines among medically ill, hospitalized older adults, resulting in overuse of anticoagulants for VTE prophylaxis. Automating risk stratification tools and incorporating results into order sets may ensure that adequate prophylaxis is used for patients who need it, while minimizing excess prophylaxis in those who do not.
Acknowledgments
The authors would like to thank Shenglan Li from Research Triangle Institute for her assistance in the data programming and database creation.
Disclosure
The authors have no conflicts of interest to report. This study was funded by the National Institute on Aging (NIA) GEMSSTAR Award (NIA R03AG048007) and the Duke Older Americans Independence Center (NIA P30 AG028716–01). This work was also supported by the Duke University Internal Medicine Chair’s Award, the Duke University Hartford Center of Excellence, and the Center of Innovation for Health Services Research in Primary Care (CIN 13-410) at the Durham VA Health Care System. This work was conducted while Dr. Pavon was supported by the T. Franklin Williams Scholars Program. Dr. Colón-Emeric is supported by K24 AG049077-01A1. The funding sources had no role in the design and conduct of the study; analysis or interpretation of the data; preparation or final approval of the manuscript before publication, and decision to submit the manuscript for publication. Disclaimer: The views expressed in this article are those of the authors and do not necessarily reflect the position or policy of Duke University or the Department of Veterans Affairs.
1. Kniffin WD, Baron JA, Barrett J, Birkmeyer JD, Anderson FA. The epidemiology of diagnosed pulmonary embolism and deep venous thrombosis in the elderly. Arch Intern Med. 1994;154(8):861-866. PubMed
2. Pasina L, Djade CD, Nobili A, et al. Drug-drug interactions in a cohort of hospitalized elderly patients. Pharmacoepidemiol Drug Saf. 2013; 22(10):1054-1060. PubMed
3. Campbell NR, Hull RD, Brant R, Hogan DB, Pineo GF, Raskob GE. Aging and heparin-related bleeding. Arch Intern Med. 1996;156(8):857-860. PubMed
4. Gould MK, Garcia DA, Wren SM, et al. Prevention of VTE in nonorthopedic surgical patients: Antithrombotic Therapy and Prevention of Thrombosis, 9th ed: American College of Chest Physicians Evidence-Based Clinical Practice Guidelines. Chest. 2012;141(2 Suppl):e227S-e277S. PubMed
5. Barbar S, Noventa F, Rossetto V, et al. A risk assessment model for the identification of hospitalized medical patients at risk for venous thromboembolism: the Padua Prediction Score. J Thromb Haemost. 2010;8(11):2450-2457. PubMed
6. Qaseem A, Chou R, Humphrey LL, Starkey M, Shekelle P. Venous thromboembolism prophylaxis in hospitalized patients: a clinical practice guideline from the American College of Physicians. Ann Intern Med. 2011;155(9):625-632. PubMed
7. Stuck AK, Spirk D, Schaudt J, Kucher N. Risk assessment models for venous thromboembolism in acutely ill medical patients. A systematic review. Thromb Haemost. 2017;117(4):801-808. PubMed
8. Khanna R, Vittinghoff E, Maselli J, Auerbach A. Unintended consequences of a standard admission order set on venous thromboembolism prophylaxis and patient outcomes. J Gen Intern Med. 2012;27(3):318-324. PubMed
Venous thromboembolism (VTE) prophylaxis is an important consideration for every older adult admitted to the hospital1 but should not be prescribed to all patients. Use of anticoagulants (specifically low-molecular-weight heparin, low-dose unfractionated heparin, and fondaparinux) when not medically indicated may be harmful, especially for older adults who on average have more chronic conditions,1 take more potentially interacting medications,2 and have higher risks of bleeding.3 The American College of Chest Physicians (ACCP) Ninth Edition Guidelines for Antithrombotic Therapy and Prevention of Thrombosis explicitly recommend a risk-stratification approach using the Padua Prediction Score (PPS) to select those patients most likely to benefit from VTE prophylaxis.4,5 This study aimed to describe the use of risk stratification and pharmacologic VTE prophylaxis use in a population of medically ill, hospitalized older patients.
METHODS
We conducted a retrospective cohort study using data from patients aged 70 years or older admitted to Duke University Hospital general medicine services between January 1, 2014, to December 31, 2014. The PPS variables, 11 in total, are each weighed and sum to a score that stratifies patients into either high or low risk for VTE occurrence.5 Manual chart abstraction was performed using the electronic health record (EHR) to determine each patient’s PPS, inpatient pharmacologic VTE prophylaxis use, and contraindications to VTE prophylaxis. Descriptive statistics are presented for the important confounders/covariates, VTE risk, and VTE prophylaxis use.
RESULTS
Of the total eligible cohort (N = 1399), 400 patients were randomly selected for manual chart review; 89 of these patients were not eligible because they were on anticoagulation upon admission, leaving n = 311 patients in the analytic sample. Mean age for the sample was 80.6 years (standard deviation [SD]: 7.3); 42% were male and 34% were African American, and median length of stay was 4.0 days. The overall mean PPS for the sample was 3.6 (SD 1.8), resulting in 59% (n = 182) defined as “low risk.” Reasons for admission, median length of stay, and aspirin use did not differ between the risk groups.
Pharmacological VTE prophylaxis was present in 74% (134 out of 182) of low-risk patients and 71% (92 out of 129) of high-risk patients (Figure). In both low- and high-risk patients who received pharmacological VTE prophylaxis, over 90% had the therapy initiated within 24 hours of admission, and it was continued for over 60% of their hospital days.
DISCUSSION
We found no association between PPS and use of anticoagulants for VTE prophylaxis, suggesting that risk stratification is not being used to guide clinical decision-making. There are several barriers to implementing guideline directed use of VTE risk stratification. First, there is a lack of consensus on which VTE risk assessment tool is best to use with medically ill, hospitalized patients. While the ACCP Ninth Edition Guidelines support the use of the PPS, the American College of Physicians does not recommend a specific tool for VTE risk assessment.5,6 Although other risk stratification tools exist, concordance between these tools has not been well studied.7 Second, manual calculation of the PPS can be cumbersome, error prone, and disruptive to the clinical workflow. Automated data extraction leveraging existing structured data elements in the EHR may be particularly attractive to many health systems striving to use EHRs to improve care. Designing and testing automatically populated VTE risk stratification tools may facilitate translation of evidence-based guidelines into routine clinical practice. Lastly, a key barrier is clinician education and awareness about these tools. Adding risk stratification tools to admission order sets is one way to increase clinician awareness and has been shown to decrease inappropriate VTE prophylaxis use.8 High-quality studies that use implementation science to promote uptake and efficacy of risk stratification tools into clinical practice are urgently needed.
Our study has several limitations. First, this was a single-site study at an academic center, which may limit generalizability of the findings. However, our design enabled us to look at other specific patient-level data that is typically not available in larger databases. Second, determination of PPS is limited to data available in the EHR, resulting in measurement error and possibly the underreporting of risk factors. Finally, due to feasibility and the low probability of VTE, we did not collect data on long-term VTE outcome and were unable to determine the impact that inappropriate VTE prophylaxis use has in low-risk hospitalized older adults.
In summary, we found poor adherence to risk stratification guidelines among medically ill, hospitalized older adults, resulting in overuse of anticoagulants for VTE prophylaxis. Automating risk stratification tools and incorporating results into order sets may ensure that adequate prophylaxis is used for patients who need it, while minimizing excess prophylaxis in those who do not.
Acknowledgments
The authors would like to thank Shenglan Li from Research Triangle Institute for her assistance in the data programming and database creation.
Disclosure
The authors have no conflicts of interest to report. This study was funded by the National Institute on Aging (NIA) GEMSSTAR Award (NIA R03AG048007) and the Duke Older Americans Independence Center (NIA P30 AG028716–01). This work was also supported by the Duke University Internal Medicine Chair’s Award, the Duke University Hartford Center of Excellence, and the Center of Innovation for Health Services Research in Primary Care (CIN 13-410) at the Durham VA Health Care System. This work was conducted while Dr. Pavon was supported by the T. Franklin Williams Scholars Program. Dr. Colón-Emeric is supported by K24 AG049077-01A1. The funding sources had no role in the design and conduct of the study; analysis or interpretation of the data; preparation or final approval of the manuscript before publication, and decision to submit the manuscript for publication. Disclaimer: The views expressed in this article are those of the authors and do not necessarily reflect the position or policy of Duke University or the Department of Veterans Affairs.
1. Kniffin WD, Baron JA, Barrett J, Birkmeyer JD, Anderson FA. The epidemiology of diagnosed pulmonary embolism and deep venous thrombosis in the elderly. Arch Intern Med. 1994;154(8):861-866. PubMed
2. Pasina L, Djade CD, Nobili A, et al. Drug-drug interactions in a cohort of hospitalized elderly patients. Pharmacoepidemiol Drug Saf. 2013; 22(10):1054-1060. PubMed
3. Campbell NR, Hull RD, Brant R, Hogan DB, Pineo GF, Raskob GE. Aging and heparin-related bleeding. Arch Intern Med. 1996;156(8):857-860. PubMed
4. Gould MK, Garcia DA, Wren SM, et al. Prevention of VTE in nonorthopedic surgical patients: Antithrombotic Therapy and Prevention of Thrombosis, 9th ed: American College of Chest Physicians Evidence-Based Clinical Practice Guidelines. Chest. 2012;141(2 Suppl):e227S-e277S. PubMed
5. Barbar S, Noventa F, Rossetto V, et al. A risk assessment model for the identification of hospitalized medical patients at risk for venous thromboembolism: the Padua Prediction Score. J Thromb Haemost. 2010;8(11):2450-2457. PubMed
6. Qaseem A, Chou R, Humphrey LL, Starkey M, Shekelle P. Venous thromboembolism prophylaxis in hospitalized patients: a clinical practice guideline from the American College of Physicians. Ann Intern Med. 2011;155(9):625-632. PubMed
7. Stuck AK, Spirk D, Schaudt J, Kucher N. Risk assessment models for venous thromboembolism in acutely ill medical patients. A systematic review. Thromb Haemost. 2017;117(4):801-808. PubMed
8. Khanna R, Vittinghoff E, Maselli J, Auerbach A. Unintended consequences of a standard admission order set on venous thromboembolism prophylaxis and patient outcomes. J Gen Intern Med. 2012;27(3):318-324. PubMed
© 2018 Society of Hospital Medicine
Shared Decision-Making During Inpatient Rounds: Opportunities for Improvement in Patient Engagement and Communication
The ethos of medicine has shifted from paternalistic, physician-driven care to patient autonomy and engagement, in which the physician shares information and advises.1-3 Although there are ethical, legal, and practical reasons to respect patient preferences,1-4 patient engagement also fosters quality and safety5 and may improve clinical outcomes.5-8 Patients whose preferences are respected are more likely to trust their doctor, feel empowered, and adhere to treatments.9
Providers may partner with patients through shared decision-making (SDM).10,11 Several SDM models describe the process of providers and patients balancing evidence, preferences and context to arrive at a clinical decision.12-15 The National Academy of Medicine and the American Academy of Pediatrics has called for more SDM,16,17 including when clinical evidence is limited,2 equally beneficial options exist,18 clinical stakes are high,19 and even with deferential patients.20 Despite its value, SDM does not reliably occur21,22 and SDM training is often unavailable.4 Clinical decision tools, patient education aids, and various training interventions have shown promising, although inconsistent results.23, 24
Little is known about SDM in inpatient settings where unique patient, clinician, and environmental factors may influence SDM. This study describes the quality and possible predictors of inpatient SDM during attending rounds in 4 academic training settings. Although SDM may occur anytime during a hospitalization, attending rounds present a valuable opportunity for SDM observation given their centrality to inpatient care and teaching.25,26 Because attending physicians bear ultimate responsibility for patient management, we examined whether SDM performance varies among attendings within each service. In addition, we tested the hypothesis that service-level, team-level, and patient-level features explain variation in SDM quality more than individual attending physicians. Finally, we compared peer-observer perspectives of SDM behaviors with patient and/or guardian perspectives.
METHODS
Study Design and Setting
This cross-sectional, observational study examined the diversity of SDM practice within and between 4 inpatient services during attending rounds, including the internal medicine and pediatrics services at Stanford University and the University of California, San Francisco (UCSF). Both institutions provide quaternary care to diverse patient populations with approximately half enrolled in Medicare and/or Medicaid.
One institution had 42 internal medicine (Med-1) and 15 pediatric hospitalists (Peds-1) compared to 8 internal medicine (Med-2) and 12 pediatric hospitalists (Peds-2) at the second location. Both pediatric services used family-centered rounds that included discussions between the patients’ families and the whole team. One medicine service used a similar rounding model that did not necessarily involve the patients’ families. In contrast, the smaller medicine service typically began rounds by discussing all patients in a conference room and then visiting select patients afterwards.
From August 2014 to November 2014, peer observers gathered data on team SDM behaviors during attending rounds. After the rounding team departed, nonphysician interviewers surveyed consenting patients’ (or guardians’) views of the SDM experience, yielding paired evaluations for a subset of SDM encounters. Institutional review board approval was obtained from Stanford University and UCSF.
Participants and Inclusion Criteria
Attending physicians were hospitalists who supervised rounds at least 1 month per year, and did not include those conducting the study. All provided verbal assent to be observed on 3 days within a 7-day period. While team composition varied as needed (eg, to include the nurse, pharmacist, interpreter, etc), we restricted study observations to those teams with an attending and at least one learner (eg, resident, intern, medical student) to capture the influence of attending physicians in their training role. Because services vary in number of attendings on staff, rounds assigned per attending, and patients per round, it was not possible to enroll equal sample sizes per service in the study.
Nonintensive care unit patients who were deemed medically stable by the team were eligible for peer observation and participation in a subsequent patient interview once during the study period. Pediatric patients were invited for an interview if they were between 13 and 21 years old and had the option of having a parent or guardian present; if the pediatric patients were less than 13 years old or they were not interested in being interviewed, then their parents or guardians were invited to be interviewed. Interpreters were on rounds, and thus, non-English participants were able to participate in the peer observations, but could not participate in patient interviews because interpreters were not available during afternoons for study purposes. Consent was obtained from all participating patients and/or guardians.
Data Collection
Round and Patient Characteristics
Peer observers recorded rounding, team, and patient characteristics using a standardized form. Rounding data included date, attending name, duration of rounds, and patient census. Patient level data included the decision(s) discussed, the seniority of the clinician leading the discussion, team composition, minutes spent discussing the patient (both with the patient and/or guardian and total time), hospitalization week, and patient’s primary language. Additional patient data obtained from electronic health records included age, gender, race, ethnicity, date of admission, and admitting diagnosis.
SDM Measures
Peer-observed SDM behaviors were quantified per patient encounter using the 9-item Rochester Participatory Decision-Making Scale (RPAD), with credit given for SDM behaviors exhibited by anyone on the rounding team (team-level metric).27 Each item was scored on a 3-point scale (0 = absent, 0.5 = partial, and 1 = present) for a maximum of 9 points, with higher scores indicating higher-quality SDM (Peer-RPAD Score). We created semistructured patient interview guides by adapting each RPAD item into layperson language (Patient-RPAD Score) and adding open-ended questions to assess the patient experience.
Peer-Observer Training
Eight peer-observers (7 hospitalists and 1 palliative care physician) were trained to perform RPAD ratings using videos of patient encounters. Initially, raters viewed videos together and discussed ratings for each RPAD item. The observers incorporated behavioral anchors and clinical examples into the development of an RPAD rating guide, which they subsequently used to independently score 4 videos from an online medical communication library.28 These scores were discussed to resolve any differences before 4 additional videos were independently viewed, scored, and compared. Interrater reliability was achieved when the standard deviation of summed SDM scores across raters was less than 1 for all 4 videos.
Patient Interviewers
Interviewers were English-speaking volunteers without formal medical training. They were educated in hospital etiquette by a physician and in administering patient interviews through peer-to-peer role playing and an observation and feedback interview with at least 1 patient.
Data Analysis
The analysis set included every unique patient with whom a medical decision was made by an eligible clinical team. To account for the nested study design (patient-level scores within rounds, rounds within attending, and attendings within service), we used mixed-effects models to estimate mean (summary or item) RPAD score by levels of fixed covariate(s). The models included random effects accounting for attending-level and round-level correlations among scores via variance components, and allowing the attending-level random effect to differ by service. Analyses were performed using SAS version 9.4 (SAS Institute Inc, Cary, NC). We used descriptive statistics to summarize round- and patient-level characteristics.
SDM Variation by Attending and Service
Box plots were used to summarize raw patient-level, Peer-RPAD scores by service and attending. By using the methods described above, we estimated the mean score overall and by service. In both models, we examined the statistical significance of service-specific variation in attending-level random effects by using likelihood-ratio test (LRT) to compare models.
SDM Variation by Round and Patient Characteristics
We used the models described above to identify covariates associated with Peer-RPAD scores. We fit univariate models separately for each covariate, then fit 2 multivariable models, including (1) all covariates and (2) all effects significant in either model at P ≤ .20 according to F tests. For uniformity of presentation, we express continuous covariates categorically; however, we report P values based on continuous versions. Means generated by the multivariable models were calculated at the mean values of all other covariates in model.
Patient-Level RPAD Data
A subsample of patients completed semistructured interviews with analogous RPAD questions. To identify possible selection bias in the full sample, we summarized response rates by service and patient language and modeled Peer-RPAD scores by interview response status. Among responders, we estimated the mean Peer-RPAD and Patient-RPAD scores and their paired differences and correlations, testing for non-zero correlations via the Spearman rank test.
RESULTS
All Patient Encounters
![]()
The median duration of rounding sessions was 1.8 hours, median patient census was 9, and median patient encounter was 13 minutes. The duration of rounds and minutes per patient were longest at Med-2 and shortest at Peds-1. See Table 1 for other team characteristics.
Peer Evaluations of SDM Encounters
Characteristics of Patients
![]()
Teams spent a median of 13 minutes per SDM encounter, which was not higher than the round median. SDM topics discussed included 47% treatment, 15% diagnostic, 30% both treatment and diagnostic, and 7% other.
Variation in SDM Quality Among Attending Physicians
Overall Peer-RPAD Scores were normally distributed. After adjusting for the nested study design, the overall mean (standard error) score was 4.16 (0.11). Score variability among attendings differed significantly by service (LRT P = .0067). For example, raw scores were lower and more variable among attending physicians at Med-2 than other among attendings in other services (see Appendix Figure in Supporting Information). However, when service was included in the model as a fixed effect, mean scores varied significantly, from 3.0 at Med-2 to 4.7 at Med-1 (P < .0001), but the random variation among attendings no longer differed significantly by service (P = .13). This finding supports the hypothesis that service-level influences are stronger than influences of individual attending physicians, that is, that variation between services exceeded variation among attendings within service.
Aspects of SDM That Are More Prevalent on Rounds
![]()
Rounds and Patient Characteristics Associated With Peer-RPAD Scores
![]()
Patient-RPAD Results: Dissimilar Perspectives of Patients and/or Guardians and Physician Observers
![]()
Among responders, mean Patient-RPAD scores were 6.8 to 7.1 for medicine services and 7.6 to 7.8 for pediatric services (P = .01). The overall mean Patient-RPAD score, 7.46, was significantly greater than the paired Peer-RPAD score by 3.5 (P = .011); however, correlations were not statistically significantly different from 0 (by service, each P > .12).
To understand drivers of the differences between Peer-RPAD and Patient-RPAD scores, we analyzed findings by item. Each mean patient-item score exceeded its peer counterpart (P ≤ .01; panel B of Figure). Peer-item scores fell below 33% on 2 items (Items 9 and 4) and only exceeded 67% on 2 items (Items 1 and 6), whereas patient-item scores ranged from 60% (Item 8) to 97% (Item 7). Three paired differences exceeded 50% (Items 9, 4, and 7) and 3 were below 20% (Items 6, 8 and 1), underlying the lack of correlation between peer and patient scores.
DISCUSSION
In this multisite study of SDM during inpatient attending rounds, SDM quality, specific SDM behaviors, and factors contributing to SDM were identified. Our study found an adjusted overall Peer-RPAD Score of 4.4 out of 9, and found the following 3 SDM elements most needing improvement according to trained peer observers: (1) “Checking understanding of the patient’s perspective”, (2) “Examining barriers to follow-through with the treatment plan”, and (3) “Asking if the patient has questions.” Areas of strength included explaining the clinical issue or nature of the decision and matching medical language to the patient’s level of understanding, with each rated highly by both peer-observers and patients. Broadly speaking, physicians were skillful in delivering information to patients but failed to solicit input from patients. Characteristics associated with increased SDM in the multivariate analysis included the following: service, patient gender, timing of rounds during patient’s hospital stay, and amount of time rounding with each patient.
Patients similarly found that physicians could improve their abilities to elicit information from patients and families, noting the 3 lowest patient-rated SDM elements were as follows: (1) asking open-ended questions, (2) discussing alternatives or uncertainties, and (3) discussing barriers to treatment plan follow through. Overall, patients and guardians perceived the quantity and quality of SDM on rounds more favorably than peer observers, which is consistent with other studies of patient perceptions of communication. 29-31 It is possible that patient ratings are more influenced by demand characteristics, fear of negatively impacting their patient-provider relationships, and conflation of overall satisfaction with quality of communication.32 This difference in patient perception of SDM is worthy of further study.
Prior work has revealed that SDM may occur infrequently during inpatient rounds.11 This study further elucidates specific SDM behaviors used along with univariate and multivariate modeling to explore possible contributing factors. The strengths and weaknesses found were similar at all 4 services and the influence of the service was more important than variability across attendings. This study’s findings are similar to a study by Shields et al.,33 in which the findings in a geographically different outpatient setting 10 years earlier suggesting global and enduring challenges to SDM. To our knowledge, this is the first published study to characterize inpatient SDM behaviors and may serve as the basis for future interventions.
Although the item-level components were ranked similarly across services, on average the summary Peer-RPAD score was lowest at Med-2, where we observed high variability within and between attendings, and was highest at Med-1, where variability was low. Med-2 carried the highest caseload and held the longest rounds, while Med-1 carried the lowest caseload, suggesting that modifiable burdens may hamper SDM performance. Prior studies suggest that patients are often selected based on teaching opportunities, immediate medical need and being newly admitted.34 The high scores at Med-1 may reflect that service’s prediscussion of patients during card-flipping rounds or their selection of which patients to round on as a team. Consistent with prior studies29,35 of SDM and the family-centered rounding model, which includes the involvement of nurses, respiratory therapists, pharmacists, case managers, social workers, and interpreters on rounds, both pediatrics services showed higher SDM scores.
In contrast to prior studies,34,36 team size and number of learners did not affect SDM performance, nor did decision type. Despite teams having up to 17 members, 8 learners, and 14 complex patients, SDM scores did not vary significantly by team. Nonetheless, trends were in the directions expected: Scores tended to decrease as the team size or the percentage of trainees grew, and increased with the seniority of the presenting physician. Interestingly, SDM performance decreased with round-average minutes per patient, which may be measuring on-going intensity across cases that leads to exhaustion. Statistically significant patient factors for increased SDM included longer duration of patient encounters, second week of hospital stay, and female patient gender. Although we anticipated that the high number of decisions made early in hospitalization would facilitate higher SDM scores, continuity and stronger patient-provider relationships may enhance SDM.36 We report service-specific team and patient characteristics, in addition to SDM findings in anticipation that some readers will identify with 1 service more than others.
This study has several important limitations. First, our peer observers were not blinded and primarily observed encounters at their own site. To minimize bias, observers periodically rated videos to recalibrate RPAD scoring. Second, additional SDM conversations with a patient and/or guardian may have occurred outside of rounds and were not captured, and poor patient recall may have affected Patient-RPAD scores despite interviewer prompts and timeliness of interviews within 12 hours of rounds. Third, there might have been a selection bias for the one service who selected a smaller number of patients to see, compared with the three other services that performed bedside rounds on all patients. It is possible that attending physicians selected patients who were deemed most able to have SDM conversations, thus affecting RPAD scores on that service. Fourth, study services had fewer patients on average than other academic hospitals (median 9, range 3-14), which might limit its generalizability. Last, as in any observational study, there is always the possibility of the Hawthorne effect. However, neither teams nor patients knew the study objectives.
Nevertheless, important findings emerged through the use of RPAD Scores to evaluate inpatient SDM practices. In particular, we found that to increase SDM quality in inpatient settings, practitioners should (1) check their understanding of the patient’s perspective, (2) examine barriers to follow-through with the treatment plan, and (3) ask if the patient has questions. Variation among services remained very influential after adjusting for team and patient characteristics, which suggests that “climate” or service culture should be targeted by an intervention, rather than individual attendings or subgroups defined by team or patient characteristics. Notably, team size, number of learners, patient census, and type of decision being made did not affect SDM performance, suggesting that even large, busy services can perform SDM if properly trained.
Acknowledgments
The authors thank the patients, families, pediatric and internal medicine residents, and hospitalists at Stanford School of Medicine and University of California, San Francisco School of Medicine for their participation in this study. We would also like to thank the student volunteers who collected patient perspectives on the encounters.
Disclosure
The author(s) declared no potential conflicts of interest with respect to the research, authorship, and/or publication of this article. The author(s) disclosed receipt of the following financial support for the research, authorship, and/or publication of this article: This study was supported by an NIH/NCCIH grant R25 AT006573.
1. Braddock CH. The emerging importance and relevance of shared decision making to clinical practice. Med Decis Mak. 2010;30(5 Suppl):5S-7S. doi:10.1177/0272989X10381344. PubMed
2. Braddock CH. Supporting shared decision making when clinical evidence is low. Med Care Res Rev MCRR. 2013;70(1 Suppl):129S-140S. doi:10.1177/1077558712460280. PubMed
3. Elwyn G, Tilburt J, Montori V. The ethical imperative for shared decision-making. Eur J Pers Centered Healthc. 2013;1(1):129-131. doi:10.5750/ejpch.v1i1.645.
4. Stiggelbout AM, Pieterse AH, De Haes JCJM. Shared decision making: Concepts, evidence, and practice. Patient Educ Couns. 2015;98(10):1172-1179. doi:10.1016/j.pec.2015.06.022. PubMed
5. Stacey D, Légaré F, Col NF, et al. Decision aids for people facing health treatment or screening decisions. Cochrane Database Syst Rev. 2014;(10):CD001431. doi:10.1002/14651858.CD001431.pub4. PubMed
6. Wilson SR, Strub P, Buist AS, et al. Shared treatment decision making improves adherence and outcomes in poorly controlled asthma. Am J Respir Crit Care Med. 2010;181(6):566-577. doi:10.1164/rccm.200906-0907OC. PubMed
7. Parchman ML, Zeber JE, Palmer RF. Participatory decision making, patient activation, medication adherence, and intermediate clinical outcomes in type 2 diabetes: a STARNet study. Ann Fam Med. 2010;8(5):410-417. doi:10.1370/afm.1161. PubMed
8. Weiner SJ, Schwartz A, Sharma G, et al. Patient-centered decision making and health care outcomes: an observational study. Ann Intern Med. 2013;158(8):573-579. doi:10.7326/0003-4819-158-8-201304160-00001. PubMed
9. Butterworth JE, Campbell JL. Older patients and their GPs: shared decision making in enhancing trust. Br J Gen Pract. 2014;64(628):e709-e718. doi:10.3399/bjgp14X682297. PubMed
10. Barry MJ, Edgman-Levitan S. Shared decision making--pinnacle of patient-centered care. N Engl J Med. 2012;366(9):780-781. doi:10.1056/NEJMp1109283. PubMed
11. Satterfield JM, Bereknyei S, Hilton JF, et al. The prevalence of social and behavioral topics and related educational opportunities during attending rounds. Acad Med J Assoc Am Med Coll. 2014;89(11):1548-1557. doi:10.1097/ACM.0000000000000483. PubMed
12. Charles C, Gafni A, Whelan T. Shared decision-making in the medical encounter: what does it mean? (or it takes at least two to tango). Soc Sci Med. 1997;44(5):681-692. PubMed
13. Elwyn G, Frosch D, Thomson R, et al. Shared decision making: a model for clinical practice. J Gen Intern Med. 2012;27(10):1361-1367. doi:10.1007/s11606-012-2077-6. PubMed
14. Légaré F, St-Jacques S, Gagnon S, et al. Prenatal screening for Down syndrome: a survey of willingness in women and family physicians to engage in shared decision-making. Prenat Diagn. 2011;31(4):319-326. doi:10.1002/pd.2624. PubMed
15. Satterfield JM, Spring B, Brownson RC, et al. Toward a Transdisciplinary Model of Evidence-Based Practice. Milbank Q. 2009;87(2):368-390. PubMed
16. National Academy of Medicine. Crossing the quality chasm: a new health system for the 21st century. https://www.nationalacademies.org/hmd/~/media/Files/Report%20Files/2001/Crossing-the-Quality-Chasm/Quality%20Chasm%202001%20%20report%20brief.pdf. Accessed on November 30, 2016.
17. Adams RC, Levy SE, Council on Children with Disabilities. Shared Decision-Making and Children with Disabilities: Pathways to Consensus. Pediatrics. 2017; 139(6):1-9. PubMed
18. Müller-Engelmann M, Keller H, Donner-Banzhoff N, Krones T. Shared decision making in medicine: The influence of situational treatment factors. Patient Educ Couns. 2011;82(2):240-246. doi:10.1016/j.pec.2010.04.028. PubMed
19. Whitney SN. A New Model of Medical Decisions: Exploring the Limits of Shared Decision Making. Med Decis Making. 2003;23(4):275-280. doi:10.1177/0272989X03256006. PubMed
20. Kehl KL, Landrum MB, Arora NK, et al. Association of Actual and Preferred Decision Roles With Patient-Reported Quality of Care: Shared Decision Making in Cancer Care. JAMA Oncol. 2015;1(1):50-58. doi:10.1001/jamaoncol.2014.112. PubMed
21. Couët N, Desroches S, Robitaille H, et al. Assessments of the extent to which health-care providers involve patients in decision making: a systematic review of studies using the OPTION instrument. Health Expect Int J Public Particip Health Care Health Policy. 2015;18(4):542-561. doi:10.1111/hex.12054. PubMed
22. Fowler FJ, Gerstein BS, Barry MJ. How patient centered are medical decisions?: Results of a national survey. JAMA Intern Med. 2013;173(13):1215-1221. doi:10.1001/jamainternmed.2013.6172. PubMed
23. Légaré F, Stacey D, Turcotte S, et al. Interventions for improving the adoption of shared decision making by healthcare professionals. Cochrane Database Syst Rev. 2014;(9):CD006732. doi:10.1002/14651858.CD006732.pub3. PubMed
24. Stacey D, Bennett CL, Barry MJ, et al. Decision aids for people facing health treatment or screening decisions. Cochrane Database Syst Rev. 2011;(10):CD001431. doi:10.1002/14651858.CD001431.pub3. PubMed
25. Di Francesco L, Pistoria MJ, Auerbach AD, Nardino RJ, Holmboe ES. Internal medicine training in the inpatient setting. A review of published educational interventions. J Gen Intern Med. 2005;20(12):1173-1180. doi:10.1111/j.1525-1497.2005.00250.x. PubMed
26. Janicik RW, Fletcher KE. Teaching at the bedside: a new model. Med Teach. 2003;25(2):127-130. PubMed
27. Shields CG, Franks P, Fiscella K, Meldrum S, Epstein RM. Rochester Participatory Decision-Making Scale (RPAD): reliability and validity. Ann Fam Med. 2005;3(5):436-442. doi:10.1370/afm.305. PubMed
28. DocCom - enhancing competence in healthcare communication. https://webcampus.drexelmed.edu/doccom/user/. Accessed on November 30, 2016.
29. Bailey SM, Hendricks-Muñoz KD, Mally P. Parental influence on clinical management during neonatal intensive care: a survey of US neonatologists. J Matern Fetal Neonatal Med. 2013;26(12):1239-1244. doi:10.3109/14767058.2013.776531. PubMed
30. Janz NK, Wren PA, Copeland LA, Lowery JC, Goldfarb SL, Wilkins EG. Patient-physician concordance: preferences, perceptions, and factors influencing the breast cancer surgical decision. J Clin Oncol. 2004;22(15):3091-3098. doi:10.1200/JCO.2004.09.069. PubMed
31. Schoenborn NL, Cayea D, McNabney M, Ray A, Boyd C. Prognosis communication with older patients with multimorbidity: Assessment after an educational intervention. Gerontol Geriatr Educ. 2016;38(4):471-481. doi:10.1080/02701960.2015.1115983. PubMed
32. Lipkin M. Shared decision making. JAMA Intern Med. 2013;173(13):1204-1205. doi:10.1001/jamainternmed.2013.6248. PubMed
33. Gonzalo JD, Heist BS, Duffy BL, et al. The art of bedside rounds: a multi-center qualitative study of strategies used by experienced bedside teachers. J Gen Intern Med. 2013;28(3):412-420. doi:10.1007/s11606-012-2259-2. PubMed
34. Rosen P, Stenger E, Bochkoris M, Hannon MJ, Kwoh CK. Family-centered multidisciplinary rounds enhance the team approach in pediatrics. Pediatrics. 2009;123(4):e603-e608. doi:10.1542/peds.2008-2238. PubMed
35. Harrison R, Allen E. Teaching internal medicine residents in the new era. Inpatient attending with duty-hour regulations. J Gen Intern Med. 2006;21(5):447-452. doi:10.1111/j.1525-1497.2006.00425.x. PubMed
36. Smith SK, Dixon A, Trevena L, Nutbeam D, McCaffery KJ. Exploring patient involvement in healthcare decision making across different education and functional health literacy groups. Soc Sci Med 1982. 2009;69(12):1805-1812. doi:10.1016/j.socscimed.2009.09.056. PubMed
The ethos of medicine has shifted from paternalistic, physician-driven care to patient autonomy and engagement, in which the physician shares information and advises.1-3 Although there are ethical, legal, and practical reasons to respect patient preferences,1-4 patient engagement also fosters quality and safety5 and may improve clinical outcomes.5-8 Patients whose preferences are respected are more likely to trust their doctor, feel empowered, and adhere to treatments.9
Providers may partner with patients through shared decision-making (SDM).10,11 Several SDM models describe the process of providers and patients balancing evidence, preferences and context to arrive at a clinical decision.12-15 The National Academy of Medicine and the American Academy of Pediatrics has called for more SDM,16,17 including when clinical evidence is limited,2 equally beneficial options exist,18 clinical stakes are high,19 and even with deferential patients.20 Despite its value, SDM does not reliably occur21,22 and SDM training is often unavailable.4 Clinical decision tools, patient education aids, and various training interventions have shown promising, although inconsistent results.23, 24
Little is known about SDM in inpatient settings where unique patient, clinician, and environmental factors may influence SDM. This study describes the quality and possible predictors of inpatient SDM during attending rounds in 4 academic training settings. Although SDM may occur anytime during a hospitalization, attending rounds present a valuable opportunity for SDM observation given their centrality to inpatient care and teaching.25,26 Because attending physicians bear ultimate responsibility for patient management, we examined whether SDM performance varies among attendings within each service. In addition, we tested the hypothesis that service-level, team-level, and patient-level features explain variation in SDM quality more than individual attending physicians. Finally, we compared peer-observer perspectives of SDM behaviors with patient and/or guardian perspectives.
METHODS
Study Design and Setting
This cross-sectional, observational study examined the diversity of SDM practice within and between 4 inpatient services during attending rounds, including the internal medicine and pediatrics services at Stanford University and the University of California, San Francisco (UCSF). Both institutions provide quaternary care to diverse patient populations with approximately half enrolled in Medicare and/or Medicaid.
One institution had 42 internal medicine (Med-1) and 15 pediatric hospitalists (Peds-1) compared to 8 internal medicine (Med-2) and 12 pediatric hospitalists (Peds-2) at the second location. Both pediatric services used family-centered rounds that included discussions between the patients’ families and the whole team. One medicine service used a similar rounding model that did not necessarily involve the patients’ families. In contrast, the smaller medicine service typically began rounds by discussing all patients in a conference room and then visiting select patients afterwards.
From August 2014 to November 2014, peer observers gathered data on team SDM behaviors during attending rounds. After the rounding team departed, nonphysician interviewers surveyed consenting patients’ (or guardians’) views of the SDM experience, yielding paired evaluations for a subset of SDM encounters. Institutional review board approval was obtained from Stanford University and UCSF.
Participants and Inclusion Criteria
Attending physicians were hospitalists who supervised rounds at least 1 month per year, and did not include those conducting the study. All provided verbal assent to be observed on 3 days within a 7-day period. While team composition varied as needed (eg, to include the nurse, pharmacist, interpreter, etc), we restricted study observations to those teams with an attending and at least one learner (eg, resident, intern, medical student) to capture the influence of attending physicians in their training role. Because services vary in number of attendings on staff, rounds assigned per attending, and patients per round, it was not possible to enroll equal sample sizes per service in the study.
Nonintensive care unit patients who were deemed medically stable by the team were eligible for peer observation and participation in a subsequent patient interview once during the study period. Pediatric patients were invited for an interview if they were between 13 and 21 years old and had the option of having a parent or guardian present; if the pediatric patients were less than 13 years old or they were not interested in being interviewed, then their parents or guardians were invited to be interviewed. Interpreters were on rounds, and thus, non-English participants were able to participate in the peer observations, but could not participate in patient interviews because interpreters were not available during afternoons for study purposes. Consent was obtained from all participating patients and/or guardians.
Data Collection
Round and Patient Characteristics
Peer observers recorded rounding, team, and patient characteristics using a standardized form. Rounding data included date, attending name, duration of rounds, and patient census. Patient level data included the decision(s) discussed, the seniority of the clinician leading the discussion, team composition, minutes spent discussing the patient (both with the patient and/or guardian and total time), hospitalization week, and patient’s primary language. Additional patient data obtained from electronic health records included age, gender, race, ethnicity, date of admission, and admitting diagnosis.
SDM Measures
Peer-observed SDM behaviors were quantified per patient encounter using the 9-item Rochester Participatory Decision-Making Scale (RPAD), with credit given for SDM behaviors exhibited by anyone on the rounding team (team-level metric).27 Each item was scored on a 3-point scale (0 = absent, 0.5 = partial, and 1 = present) for a maximum of 9 points, with higher scores indicating higher-quality SDM (Peer-RPAD Score). We created semistructured patient interview guides by adapting each RPAD item into layperson language (Patient-RPAD Score) and adding open-ended questions to assess the patient experience.
Peer-Observer Training
Eight peer-observers (7 hospitalists and 1 palliative care physician) were trained to perform RPAD ratings using videos of patient encounters. Initially, raters viewed videos together and discussed ratings for each RPAD item. The observers incorporated behavioral anchors and clinical examples into the development of an RPAD rating guide, which they subsequently used to independently score 4 videos from an online medical communication library.28 These scores were discussed to resolve any differences before 4 additional videos were independently viewed, scored, and compared. Interrater reliability was achieved when the standard deviation of summed SDM scores across raters was less than 1 for all 4 videos.
Patient Interviewers
Interviewers were English-speaking volunteers without formal medical training. They were educated in hospital etiquette by a physician and in administering patient interviews through peer-to-peer role playing and an observation and feedback interview with at least 1 patient.
Data Analysis
The analysis set included every unique patient with whom a medical decision was made by an eligible clinical team. To account for the nested study design (patient-level scores within rounds, rounds within attending, and attendings within service), we used mixed-effects models to estimate mean (summary or item) RPAD score by levels of fixed covariate(s). The models included random effects accounting for attending-level and round-level correlations among scores via variance components, and allowing the attending-level random effect to differ by service. Analyses were performed using SAS version 9.4 (SAS Institute Inc, Cary, NC). We used descriptive statistics to summarize round- and patient-level characteristics.
SDM Variation by Attending and Service
Box plots were used to summarize raw patient-level, Peer-RPAD scores by service and attending. By using the methods described above, we estimated the mean score overall and by service. In both models, we examined the statistical significance of service-specific variation in attending-level random effects by using likelihood-ratio test (LRT) to compare models.
SDM Variation by Round and Patient Characteristics
We used the models described above to identify covariates associated with Peer-RPAD scores. We fit univariate models separately for each covariate, then fit 2 multivariable models, including (1) all covariates and (2) all effects significant in either model at P ≤ .20 according to F tests. For uniformity of presentation, we express continuous covariates categorically; however, we report P values based on continuous versions. Means generated by the multivariable models were calculated at the mean values of all other covariates in model.
Patient-Level RPAD Data
A subsample of patients completed semistructured interviews with analogous RPAD questions. To identify possible selection bias in the full sample, we summarized response rates by service and patient language and modeled Peer-RPAD scores by interview response status. Among responders, we estimated the mean Peer-RPAD and Patient-RPAD scores and their paired differences and correlations, testing for non-zero correlations via the Spearman rank test.
RESULTS
All Patient Encounters
![]()
The median duration of rounding sessions was 1.8 hours, median patient census was 9, and median patient encounter was 13 minutes. The duration of rounds and minutes per patient were longest at Med-2 and shortest at Peds-1. See Table 1 for other team characteristics.
Peer Evaluations of SDM Encounters
Characteristics of Patients
![]()
Teams spent a median of 13 minutes per SDM encounter, which was not higher than the round median. SDM topics discussed included 47% treatment, 15% diagnostic, 30% both treatment and diagnostic, and 7% other.
Variation in SDM Quality Among Attending Physicians
Overall Peer-RPAD Scores were normally distributed. After adjusting for the nested study design, the overall mean (standard error) score was 4.16 (0.11). Score variability among attendings differed significantly by service (LRT P = .0067). For example, raw scores were lower and more variable among attending physicians at Med-2 than other among attendings in other services (see Appendix Figure in Supporting Information). However, when service was included in the model as a fixed effect, mean scores varied significantly, from 3.0 at Med-2 to 4.7 at Med-1 (P < .0001), but the random variation among attendings no longer differed significantly by service (P = .13). This finding supports the hypothesis that service-level influences are stronger than influences of individual attending physicians, that is, that variation between services exceeded variation among attendings within service.
Aspects of SDM That Are More Prevalent on Rounds
![]()
Rounds and Patient Characteristics Associated With Peer-RPAD Scores
![]()
Patient-RPAD Results: Dissimilar Perspectives of Patients and/or Guardians and Physician Observers
![]()
Among responders, mean Patient-RPAD scores were 6.8 to 7.1 for medicine services and 7.6 to 7.8 for pediatric services (P = .01). The overall mean Patient-RPAD score, 7.46, was significantly greater than the paired Peer-RPAD score by 3.5 (P = .011); however, correlations were not statistically significantly different from 0 (by service, each P > .12).
To understand drivers of the differences between Peer-RPAD and Patient-RPAD scores, we analyzed findings by item. Each mean patient-item score exceeded its peer counterpart (P ≤ .01; panel B of Figure). Peer-item scores fell below 33% on 2 items (Items 9 and 4) and only exceeded 67% on 2 items (Items 1 and 6), whereas patient-item scores ranged from 60% (Item 8) to 97% (Item 7). Three paired differences exceeded 50% (Items 9, 4, and 7) and 3 were below 20% (Items 6, 8 and 1), underlying the lack of correlation between peer and patient scores.
DISCUSSION
In this multisite study of SDM during inpatient attending rounds, SDM quality, specific SDM behaviors, and factors contributing to SDM were identified. Our study found an adjusted overall Peer-RPAD Score of 4.4 out of 9, and found the following 3 SDM elements most needing improvement according to trained peer observers: (1) “Checking understanding of the patient’s perspective”, (2) “Examining barriers to follow-through with the treatment plan”, and (3) “Asking if the patient has questions.” Areas of strength included explaining the clinical issue or nature of the decision and matching medical language to the patient’s level of understanding, with each rated highly by both peer-observers and patients. Broadly speaking, physicians were skillful in delivering information to patients but failed to solicit input from patients. Characteristics associated with increased SDM in the multivariate analysis included the following: service, patient gender, timing of rounds during patient’s hospital stay, and amount of time rounding with each patient.
Patients similarly found that physicians could improve their abilities to elicit information from patients and families, noting the 3 lowest patient-rated SDM elements were as follows: (1) asking open-ended questions, (2) discussing alternatives or uncertainties, and (3) discussing barriers to treatment plan follow through. Overall, patients and guardians perceived the quantity and quality of SDM on rounds more favorably than peer observers, which is consistent with other studies of patient perceptions of communication. 29-31 It is possible that patient ratings are more influenced by demand characteristics, fear of negatively impacting their patient-provider relationships, and conflation of overall satisfaction with quality of communication.32 This difference in patient perception of SDM is worthy of further study.
Prior work has revealed that SDM may occur infrequently during inpatient rounds.11 This study further elucidates specific SDM behaviors used along with univariate and multivariate modeling to explore possible contributing factors. The strengths and weaknesses found were similar at all 4 services and the influence of the service was more important than variability across attendings. This study’s findings are similar to a study by Shields et al.,33 in which the findings in a geographically different outpatient setting 10 years earlier suggesting global and enduring challenges to SDM. To our knowledge, this is the first published study to characterize inpatient SDM behaviors and may serve as the basis for future interventions.
Although the item-level components were ranked similarly across services, on average the summary Peer-RPAD score was lowest at Med-2, where we observed high variability within and between attendings, and was highest at Med-1, where variability was low. Med-2 carried the highest caseload and held the longest rounds, while Med-1 carried the lowest caseload, suggesting that modifiable burdens may hamper SDM performance. Prior studies suggest that patients are often selected based on teaching opportunities, immediate medical need and being newly admitted.34 The high scores at Med-1 may reflect that service’s prediscussion of patients during card-flipping rounds or their selection of which patients to round on as a team. Consistent with prior studies29,35 of SDM and the family-centered rounding model, which includes the involvement of nurses, respiratory therapists, pharmacists, case managers, social workers, and interpreters on rounds, both pediatrics services showed higher SDM scores.
In contrast to prior studies,34,36 team size and number of learners did not affect SDM performance, nor did decision type. Despite teams having up to 17 members, 8 learners, and 14 complex patients, SDM scores did not vary significantly by team. Nonetheless, trends were in the directions expected: Scores tended to decrease as the team size or the percentage of trainees grew, and increased with the seniority of the presenting physician. Interestingly, SDM performance decreased with round-average minutes per patient, which may be measuring on-going intensity across cases that leads to exhaustion. Statistically significant patient factors for increased SDM included longer duration of patient encounters, second week of hospital stay, and female patient gender. Although we anticipated that the high number of decisions made early in hospitalization would facilitate higher SDM scores, continuity and stronger patient-provider relationships may enhance SDM.36 We report service-specific team and patient characteristics, in addition to SDM findings in anticipation that some readers will identify with 1 service more than others.
This study has several important limitations. First, our peer observers were not blinded and primarily observed encounters at their own site. To minimize bias, observers periodically rated videos to recalibrate RPAD scoring. Second, additional SDM conversations with a patient and/or guardian may have occurred outside of rounds and were not captured, and poor patient recall may have affected Patient-RPAD scores despite interviewer prompts and timeliness of interviews within 12 hours of rounds. Third, there might have been a selection bias for the one service who selected a smaller number of patients to see, compared with the three other services that performed bedside rounds on all patients. It is possible that attending physicians selected patients who were deemed most able to have SDM conversations, thus affecting RPAD scores on that service. Fourth, study services had fewer patients on average than other academic hospitals (median 9, range 3-14), which might limit its generalizability. Last, as in any observational study, there is always the possibility of the Hawthorne effect. However, neither teams nor patients knew the study objectives.
Nevertheless, important findings emerged through the use of RPAD Scores to evaluate inpatient SDM practices. In particular, we found that to increase SDM quality in inpatient settings, practitioners should (1) check their understanding of the patient’s perspective, (2) examine barriers to follow-through with the treatment plan, and (3) ask if the patient has questions. Variation among services remained very influential after adjusting for team and patient characteristics, which suggests that “climate” or service culture should be targeted by an intervention, rather than individual attendings or subgroups defined by team or patient characteristics. Notably, team size, number of learners, patient census, and type of decision being made did not affect SDM performance, suggesting that even large, busy services can perform SDM if properly trained.
Acknowledgments
The authors thank the patients, families, pediatric and internal medicine residents, and hospitalists at Stanford School of Medicine and University of California, San Francisco School of Medicine for their participation in this study. We would also like to thank the student volunteers who collected patient perspectives on the encounters.
Disclosure
The author(s) declared no potential conflicts of interest with respect to the research, authorship, and/or publication of this article. The author(s) disclosed receipt of the following financial support for the research, authorship, and/or publication of this article: This study was supported by an NIH/NCCIH grant R25 AT006573.
1. Braddock CH. The emerging importance and relevance of shared decision making to clinical practice. Med Decis Mak. 2010;30(5 Suppl):5S-7S. doi:10.1177/0272989X10381344. PubMed
2. Braddock CH. Supporting shared decision making when clinical evidence is low. Med Care Res Rev MCRR. 2013;70(1 Suppl):129S-140S. doi:10.1177/1077558712460280. PubMed
3. Elwyn G, Tilburt J, Montori V. The ethical imperative for shared decision-making. Eur J Pers Centered Healthc. 2013;1(1):129-131. doi:10.5750/ejpch.v1i1.645.
4. Stiggelbout AM, Pieterse AH, De Haes JCJM. Shared decision making: Concepts, evidence, and practice. Patient Educ Couns. 2015;98(10):1172-1179. doi:10.1016/j.pec.2015.06.022. PubMed
5. Stacey D, Légaré F, Col NF, et al. Decision aids for people facing health treatment or screening decisions. Cochrane Database Syst Rev. 2014;(10):CD001431. doi:10.1002/14651858.CD001431.pub4. PubMed
6. Wilson SR, Strub P, Buist AS, et al. Shared treatment decision making improves adherence and outcomes in poorly controlled asthma. Am J Respir Crit Care Med. 2010;181(6):566-577. doi:10.1164/rccm.200906-0907OC. PubMed
7. Parchman ML, Zeber JE, Palmer RF. Participatory decision making, patient activation, medication adherence, and intermediate clinical outcomes in type 2 diabetes: a STARNet study. Ann Fam Med. 2010;8(5):410-417. doi:10.1370/afm.1161. PubMed
8. Weiner SJ, Schwartz A, Sharma G, et al. Patient-centered decision making and health care outcomes: an observational study. Ann Intern Med. 2013;158(8):573-579. doi:10.7326/0003-4819-158-8-201304160-00001. PubMed
9. Butterworth JE, Campbell JL. Older patients and their GPs: shared decision making in enhancing trust. Br J Gen Pract. 2014;64(628):e709-e718. doi:10.3399/bjgp14X682297. PubMed
10. Barry MJ, Edgman-Levitan S. Shared decision making--pinnacle of patient-centered care. N Engl J Med. 2012;366(9):780-781. doi:10.1056/NEJMp1109283. PubMed
11. Satterfield JM, Bereknyei S, Hilton JF, et al. The prevalence of social and behavioral topics and related educational opportunities during attending rounds. Acad Med J Assoc Am Med Coll. 2014;89(11):1548-1557. doi:10.1097/ACM.0000000000000483. PubMed
12. Charles C, Gafni A, Whelan T. Shared decision-making in the medical encounter: what does it mean? (or it takes at least two to tango). Soc Sci Med. 1997;44(5):681-692. PubMed
13. Elwyn G, Frosch D, Thomson R, et al. Shared decision making: a model for clinical practice. J Gen Intern Med. 2012;27(10):1361-1367. doi:10.1007/s11606-012-2077-6. PubMed
14. Légaré F, St-Jacques S, Gagnon S, et al. Prenatal screening for Down syndrome: a survey of willingness in women and family physicians to engage in shared decision-making. Prenat Diagn. 2011;31(4):319-326. doi:10.1002/pd.2624. PubMed
15. Satterfield JM, Spring B, Brownson RC, et al. Toward a Transdisciplinary Model of Evidence-Based Practice. Milbank Q. 2009;87(2):368-390. PubMed
16. National Academy of Medicine. Crossing the quality chasm: a new health system for the 21st century. https://www.nationalacademies.org/hmd/~/media/Files/Report%20Files/2001/Crossing-the-Quality-Chasm/Quality%20Chasm%202001%20%20report%20brief.pdf. Accessed on November 30, 2016.
17. Adams RC, Levy SE, Council on Children with Disabilities. Shared Decision-Making and Children with Disabilities: Pathways to Consensus. Pediatrics. 2017; 139(6):1-9. PubMed
18. Müller-Engelmann M, Keller H, Donner-Banzhoff N, Krones T. Shared decision making in medicine: The influence of situational treatment factors. Patient Educ Couns. 2011;82(2):240-246. doi:10.1016/j.pec.2010.04.028. PubMed
19. Whitney SN. A New Model of Medical Decisions: Exploring the Limits of Shared Decision Making. Med Decis Making. 2003;23(4):275-280. doi:10.1177/0272989X03256006. PubMed
20. Kehl KL, Landrum MB, Arora NK, et al. Association of Actual and Preferred Decision Roles With Patient-Reported Quality of Care: Shared Decision Making in Cancer Care. JAMA Oncol. 2015;1(1):50-58. doi:10.1001/jamaoncol.2014.112. PubMed
21. Couët N, Desroches S, Robitaille H, et al. Assessments of the extent to which health-care providers involve patients in decision making: a systematic review of studies using the OPTION instrument. Health Expect Int J Public Particip Health Care Health Policy. 2015;18(4):542-561. doi:10.1111/hex.12054. PubMed
22. Fowler FJ, Gerstein BS, Barry MJ. How patient centered are medical decisions?: Results of a national survey. JAMA Intern Med. 2013;173(13):1215-1221. doi:10.1001/jamainternmed.2013.6172. PubMed
23. Légaré F, Stacey D, Turcotte S, et al. Interventions for improving the adoption of shared decision making by healthcare professionals. Cochrane Database Syst Rev. 2014;(9):CD006732. doi:10.1002/14651858.CD006732.pub3. PubMed
24. Stacey D, Bennett CL, Barry MJ, et al. Decision aids for people facing health treatment or screening decisions. Cochrane Database Syst Rev. 2011;(10):CD001431. doi:10.1002/14651858.CD001431.pub3. PubMed
25. Di Francesco L, Pistoria MJ, Auerbach AD, Nardino RJ, Holmboe ES. Internal medicine training in the inpatient setting. A review of published educational interventions. J Gen Intern Med. 2005;20(12):1173-1180. doi:10.1111/j.1525-1497.2005.00250.x. PubMed
26. Janicik RW, Fletcher KE. Teaching at the bedside: a new model. Med Teach. 2003;25(2):127-130. PubMed
27. Shields CG, Franks P, Fiscella K, Meldrum S, Epstein RM. Rochester Participatory Decision-Making Scale (RPAD): reliability and validity. Ann Fam Med. 2005;3(5):436-442. doi:10.1370/afm.305. PubMed
28. DocCom - enhancing competence in healthcare communication. https://webcampus.drexelmed.edu/doccom/user/. Accessed on November 30, 2016.
29. Bailey SM, Hendricks-Muñoz KD, Mally P. Parental influence on clinical management during neonatal intensive care: a survey of US neonatologists. J Matern Fetal Neonatal Med. 2013;26(12):1239-1244. doi:10.3109/14767058.2013.776531. PubMed
30. Janz NK, Wren PA, Copeland LA, Lowery JC, Goldfarb SL, Wilkins EG. Patient-physician concordance: preferences, perceptions, and factors influencing the breast cancer surgical decision. J Clin Oncol. 2004;22(15):3091-3098. doi:10.1200/JCO.2004.09.069. PubMed
31. Schoenborn NL, Cayea D, McNabney M, Ray A, Boyd C. Prognosis communication with older patients with multimorbidity: Assessment after an educational intervention. Gerontol Geriatr Educ. 2016;38(4):471-481. doi:10.1080/02701960.2015.1115983. PubMed
32. Lipkin M. Shared decision making. JAMA Intern Med. 2013;173(13):1204-1205. doi:10.1001/jamainternmed.2013.6248. PubMed
33. Gonzalo JD, Heist BS, Duffy BL, et al. The art of bedside rounds: a multi-center qualitative study of strategies used by experienced bedside teachers. J Gen Intern Med. 2013;28(3):412-420. doi:10.1007/s11606-012-2259-2. PubMed
34. Rosen P, Stenger E, Bochkoris M, Hannon MJ, Kwoh CK. Family-centered multidisciplinary rounds enhance the team approach in pediatrics. Pediatrics. 2009;123(4):e603-e608. doi:10.1542/peds.2008-2238. PubMed
35. Harrison R, Allen E. Teaching internal medicine residents in the new era. Inpatient attending with duty-hour regulations. J Gen Intern Med. 2006;21(5):447-452. doi:10.1111/j.1525-1497.2006.00425.x. PubMed
36. Smith SK, Dixon A, Trevena L, Nutbeam D, McCaffery KJ. Exploring patient involvement in healthcare decision making across different education and functional health literacy groups. Soc Sci Med 1982. 2009;69(12):1805-1812. doi:10.1016/j.socscimed.2009.09.056. PubMed
© 2018 Society of Hospital Medicine
Preparing from the Outside Looking In for Safely Transitioning Pediatric Inpatients to Home
The transition of children from hospital to home introduces a unique set of challenges to patients and families who may not be well-versed in the healthcare system. In addition to juggling the stress and worry of a sick child, which can inhibit the ability to understand complicated discharge instructions prior to leaving the hospital,1 caregivers need to navigate the medical system to ensure continued recovery. The responsibility to fill and administer medications, arrange follow up appointments, and determine when to seek care if the child’s condition changes are burdens we as healthcare providers expect caregivers to manage but may underestimate how frequently they are reliably completed.2-4
In this issue of the Journal of Hospital Medicine, the article by Rehm et al.5 adds to the growing body of evidence highlighting challenges that caregivers of children face upon discharge from the hospital. The multicenter, retrospective study of postdischarge encounters for over 12,000 patients discharged from 4 children’s hospitals aimed to evaluate the following: (1) various methods for hospital-initiated postdischarge contact of families, (2) the type and frequency of postdischarge issues, and (3) specific characteristics of pediatric patients most commonly affected by postdischarge issues.
Using standardized questions administered through telephone, text, or e-mail contact, postdischarge issues were identified in 25% of discharges across all hospitals. Notably, there was considerable variation of rates of postdischarge issues among hospitals (from 16% to 62.8%). The hospital with the highest rate of postdischarge issues identified had attending hospitalists calling families after discharge. Thus, postdischarge issues may be most easily identified by providers who are familiar with both the patient and the expected postdischarge care.
Often, postdischarge issues represented events that could be mitigated with intentional planning to better anticipate and address patient and family needs prior to discharge. The vast majority of postdischarge issues identified across all hospitals were related to appointments, accounting for 76.3% of postdischarge issues, which may be attributed to a variety of causes, from inadequate or unclear provider recommendations to difficulty scheduling the appointments. The most common medication postdischarge issue was difficulty filling prescriptions, accounting for 84.8% of the medication issues. “Other” postdischarge issues (12.7%) as reported by caregivers included challenges with understanding discharge instructions and concerns about changes in their child’s clinical status. Forty percent of included patients had a chronic care condition. Older children, patients with more medication classes, shorter length of stay, and neuromuscular chronic care conditions had higher odds of postdischarge issues. Although a high proportion of postdischarge issues suggests a systemic problem addressing the needs of patients and families after hospital discharge, these data likely underestimate the magnitude of the problem; as such, the need for improvement may be higher.
Postdischarge challenges faced by families are not unique to pediatrics. Pediatric and adult medical patients face similar rates of challenges after
Given the prevalence of postdischarge issues after both pediatric and adult hospitalizations, how should hospitalists proceed? Physicians and health systems should explore approaches to better prepare caregivers, perhaps using models akin to the Seamless Transitions and (Re)admissions Network model of enhanced communication, care coordination, and family engagement.10 Pediatric hospitalists can prepare children for discharge long before departure by delivering medications to patients prior to discharge,11,12 providing discharge instructions that are clear and readable,13,14 as well as utilizing admission-discharge teaching nurses,15 inpatient care managers,16,17 and pediatric nurse practitioners18 to aid transition.
While a variety of interventions show promise in securing a successful transition to home from the hospitalist vantage point, a partnership with primary care physicians (PCPs) in our communities is paramount. Though the evidence linking gaps in primary care after discharge and readmission rates remain elusive, effective partnerships with PCPs are important for ensuring discharge plans are carried out, which may ultimately lead to decreased rates of unanticipated adverse outcomes. Several adult studies note that no single intervention is likely to prevent issues after discharge, but interventions should include high-quality communication with and involvement of community partners.9,19,20 In practice, providing a high-quality, reliable handoff can be difficult given competing priorities of busy outpatient clinic schedules and inpatient bed capacity concerns, necessitating efficient discharge practices. Some of these challenges are amenable to quality improvement efforts to improve discharge communication.21 Innovative ideas include collaborating with PCPs earlier in the admission to design the care plan up front, including PCPs in weekly team meetings for patients with chronic care conditions,16,17 and using telehealth to communicate with PCPs.
Ensuring a safe transition to home is our responsibility as hospitalists, but the solutions to doing so reliably require multi-fold interventions that build teams within hospitals, innovative outreach to those patients recently discharged to ensure their well-being and mitigate postdischarge issues and broad community programs—including greater access to primary care—to meet our urgent imperative.
Disclosure
The authors declare no conflicts of interest. Dr. Auger’s research is funded by the Agency for Healthcare Research and Quality (1K08HS024735).
1. Solan LG, Beck AF, Brunswick SA, et al. The Family Perspective on Hospital to Home Transitions: A Qualitative Study. Pediatrics. 2015;136(6):e1539-1549. PubMed
2. Misky GJ, Wald HL, Coleman EA. Post-hospitalization transitions: Examining the effects of timing of primary care provider follow-up. J Hosp Med. 2010;5(7):392-397. PubMed
3. Yin HS, Johnson M, Mendelsohn AL, Abrams MA, Sanders LM, Dreyer BP. The health literacy of parents in the United States: a nationally representative study. Pediatrics. 2009;124 Suppl 3:S289-298. PubMed
4. Glick AF, Farkas JS, Nicholson J, et al. Parental Management of Discharge Instructions: A Systematic Review. Pediatrics. 2017. [Epub ahead of print]. PubMed
5. Rehm KP, Brittan MS, Stephens JR, et al. Issues Identified by Post-Discharge Contact after Pediatric Hospitalization: A Multi-site Study (published online ahead of print February 2, 2018) J Hosp Med. doi: 10.12788/jhm.2934
6. Forster AJ, Murff HJ, Peterson JF, Gandhi TK, Bates DW. The incidence and severity of adverse events affecting patients after discharge from the hospital. Ann Intern Med. 2003;138(3):161-167. PubMed
7. Hansen LO, Greenwald JL, Budnitz T, et al. Project BOOST: effectiveness of a multihospital effort to reduce rehospitalization. J Hosp Med. 2013;8(8):421-427. PubMed
8. Auerbach AD, Kripalani S, Vasilevskis EE, et al. Preventability and Causes of Readmissions in a National Cohort of General Medicine Patients. JAMA Intern Med. 2016;176(4):484-493. PubMed
9. Kripalani S, LeFevre F, Phillips CO, Williams MV, Basaviah P, Baker DW. Deficits in communication and information transfer between hospital-based and primary care physicians: implications for patient safety and continuity of care. JAMA. 2007;297(8):831-841. PubMed
10. Auger KA, Simon TD, Cooperberg D, et al. Summary of STARNet: Seamless Transitions and (Re)admissions Network. Pediatrics. 2015;135(1):164-175. PubMed
11. Hatoun J, Bair-Merritt M, Cabral H, Moses J. Increasing Medication Possession at Discharge for Patients With Asthma: The Meds-in-Hand Project. Pediatrics. 2016;137(3):e20150461. PubMed
12. White CM, Statile AM, White DL, et al. Using quality improvement to optimise paediatric discharge efficiency. BMJ Qual Saf. 2014;23(5):428-436. PubMed
13. Unaka N, Statile A, Jerardi K, et al. Improving the Readability of Pediatric Hospital Medicine Discharge Instructions. J Hosp Med. 2017;12(7):551-557. PubMed
14. Wu S, Tyler A, Logsdon T, et al. A Quality Improvement Collaborative to Improve the Discharge Process for Hospitalized Children. Pediatrics. 2016;138(2). PubMed
15. Blankenship JS, Winslow SA. Admission-discharge-teaching nurses: bridging the gap in today’s workforce. J Nurs Adm. 2003;33(1):11-13. PubMed
16. White CM, Thomson JE, Statile AM, et al. Development of a New Care Model for Hospitalized Children With Medical Complexity. Hosp Pediatr. 2017;7(7):410-414. PubMed
17. Statile AM, Schondelmeyer AC, Thomson JE, et al. Improving Discharge Efficiency in Medically Complex Pediatric Patients. Pediatrics. 2016;138(2). PubMed
18. Dunn K, Rogers J. Discharge Facilitation: An Innovative PNP Role. J Pediatr Health Care. 2016;30(5):499-505. PubMed
19. Kripalani S, Jackson AT, Schnipper JL, Coleman EA. Promoting effective transitions of care at hospital discharge: a review of key issues for hospitalists. J Hosp Med. 2007;2(5):314-323. PubMed
20. Scott AM, Li J, Oyewole-Eletu S, et al. Understanding Facilitators and Barriers to Care Transitions: Insights from Project ACHIEVE Site Visits. Jt Comm J Qual Patient Saf. 2017;43(9):433-447. PubMed
21. Shen MW, Hershey D, Bergert L, Mallory L, Fisher ES, Cooperberg D. Pediatric hospitalists collaborate to improve timeliness of discharge communication. Hosp Pediatr. 2013;3(3):258-265. PubMed
The transition of children from hospital to home introduces a unique set of challenges to patients and families who may not be well-versed in the healthcare system. In addition to juggling the stress and worry of a sick child, which can inhibit the ability to understand complicated discharge instructions prior to leaving the hospital,1 caregivers need to navigate the medical system to ensure continued recovery. The responsibility to fill and administer medications, arrange follow up appointments, and determine when to seek care if the child’s condition changes are burdens we as healthcare providers expect caregivers to manage but may underestimate how frequently they are reliably completed.2-4
In this issue of the Journal of Hospital Medicine, the article by Rehm et al.5 adds to the growing body of evidence highlighting challenges that caregivers of children face upon discharge from the hospital. The multicenter, retrospective study of postdischarge encounters for over 12,000 patients discharged from 4 children’s hospitals aimed to evaluate the following: (1) various methods for hospital-initiated postdischarge contact of families, (2) the type and frequency of postdischarge issues, and (3) specific characteristics of pediatric patients most commonly affected by postdischarge issues.
Using standardized questions administered through telephone, text, or e-mail contact, postdischarge issues were identified in 25% of discharges across all hospitals. Notably, there was considerable variation of rates of postdischarge issues among hospitals (from 16% to 62.8%). The hospital with the highest rate of postdischarge issues identified had attending hospitalists calling families after discharge. Thus, postdischarge issues may be most easily identified by providers who are familiar with both the patient and the expected postdischarge care.
Often, postdischarge issues represented events that could be mitigated with intentional planning to better anticipate and address patient and family needs prior to discharge. The vast majority of postdischarge issues identified across all hospitals were related to appointments, accounting for 76.3% of postdischarge issues, which may be attributed to a variety of causes, from inadequate or unclear provider recommendations to difficulty scheduling the appointments. The most common medication postdischarge issue was difficulty filling prescriptions, accounting for 84.8% of the medication issues. “Other” postdischarge issues (12.7%) as reported by caregivers included challenges with understanding discharge instructions and concerns about changes in their child’s clinical status. Forty percent of included patients had a chronic care condition. Older children, patients with more medication classes, shorter length of stay, and neuromuscular chronic care conditions had higher odds of postdischarge issues. Although a high proportion of postdischarge issues suggests a systemic problem addressing the needs of patients and families after hospital discharge, these data likely underestimate the magnitude of the problem; as such, the need for improvement may be higher.
Postdischarge challenges faced by families are not unique to pediatrics. Pediatric and adult medical patients face similar rates of challenges after
Given the prevalence of postdischarge issues after both pediatric and adult hospitalizations, how should hospitalists proceed? Physicians and health systems should explore approaches to better prepare caregivers, perhaps using models akin to the Seamless Transitions and (Re)admissions Network model of enhanced communication, care coordination, and family engagement.10 Pediatric hospitalists can prepare children for discharge long before departure by delivering medications to patients prior to discharge,11,12 providing discharge instructions that are clear and readable,13,14 as well as utilizing admission-discharge teaching nurses,15 inpatient care managers,16,17 and pediatric nurse practitioners18 to aid transition.
While a variety of interventions show promise in securing a successful transition to home from the hospitalist vantage point, a partnership with primary care physicians (PCPs) in our communities is paramount. Though the evidence linking gaps in primary care after discharge and readmission rates remain elusive, effective partnerships with PCPs are important for ensuring discharge plans are carried out, which may ultimately lead to decreased rates of unanticipated adverse outcomes. Several adult studies note that no single intervention is likely to prevent issues after discharge, but interventions should include high-quality communication with and involvement of community partners.9,19,20 In practice, providing a high-quality, reliable handoff can be difficult given competing priorities of busy outpatient clinic schedules and inpatient bed capacity concerns, necessitating efficient discharge practices. Some of these challenges are amenable to quality improvement efforts to improve discharge communication.21 Innovative ideas include collaborating with PCPs earlier in the admission to design the care plan up front, including PCPs in weekly team meetings for patients with chronic care conditions,16,17 and using telehealth to communicate with PCPs.
Ensuring a safe transition to home is our responsibility as hospitalists, but the solutions to doing so reliably require multi-fold interventions that build teams within hospitals, innovative outreach to those patients recently discharged to ensure their well-being and mitigate postdischarge issues and broad community programs—including greater access to primary care—to meet our urgent imperative.
Disclosure
The authors declare no conflicts of interest. Dr. Auger’s research is funded by the Agency for Healthcare Research and Quality (1K08HS024735).
1. Solan LG, Beck AF, Brunswick SA, et al. The Family Perspective on Hospital to Home Transitions: A Qualitative Study. Pediatrics. 2015;136(6):e1539-1549. PubMed
2. Misky GJ, Wald HL, Coleman EA. Post-hospitalization transitions: Examining the effects of timing of primary care provider follow-up. J Hosp Med. 2010;5(7):392-397. PubMed
3. Yin HS, Johnson M, Mendelsohn AL, Abrams MA, Sanders LM, Dreyer BP. The health literacy of parents in the United States: a nationally representative study. Pediatrics. 2009;124 Suppl 3:S289-298. PubMed
4. Glick AF, Farkas JS, Nicholson J, et al. Parental Management of Discharge Instructions: A Systematic Review. Pediatrics. 2017. [Epub ahead of print]. PubMed
5. Rehm KP, Brittan MS, Stephens JR, et al. Issues Identified by Post-Discharge Contact after Pediatric Hospitalization: A Multi-site Study (published online ahead of print February 2, 2018) J Hosp Med. doi: 10.12788/jhm.2934
6. Forster AJ, Murff HJ, Peterson JF, Gandhi TK, Bates DW. The incidence and severity of adverse events affecting patients after discharge from the hospital. Ann Intern Med. 2003;138(3):161-167. PubMed
7. Hansen LO, Greenwald JL, Budnitz T, et al. Project BOOST: effectiveness of a multihospital effort to reduce rehospitalization. J Hosp Med. 2013;8(8):421-427. PubMed
8. Auerbach AD, Kripalani S, Vasilevskis EE, et al. Preventability and Causes of Readmissions in a National Cohort of General Medicine Patients. JAMA Intern Med. 2016;176(4):484-493. PubMed
9. Kripalani S, LeFevre F, Phillips CO, Williams MV, Basaviah P, Baker DW. Deficits in communication and information transfer between hospital-based and primary care physicians: implications for patient safety and continuity of care. JAMA. 2007;297(8):831-841. PubMed
10. Auger KA, Simon TD, Cooperberg D, et al. Summary of STARNet: Seamless Transitions and (Re)admissions Network. Pediatrics. 2015;135(1):164-175. PubMed
11. Hatoun J, Bair-Merritt M, Cabral H, Moses J. Increasing Medication Possession at Discharge for Patients With Asthma: The Meds-in-Hand Project. Pediatrics. 2016;137(3):e20150461. PubMed
12. White CM, Statile AM, White DL, et al. Using quality improvement to optimise paediatric discharge efficiency. BMJ Qual Saf. 2014;23(5):428-436. PubMed
13. Unaka N, Statile A, Jerardi K, et al. Improving the Readability of Pediatric Hospital Medicine Discharge Instructions. J Hosp Med. 2017;12(7):551-557. PubMed
14. Wu S, Tyler A, Logsdon T, et al. A Quality Improvement Collaborative to Improve the Discharge Process for Hospitalized Children. Pediatrics. 2016;138(2). PubMed
15. Blankenship JS, Winslow SA. Admission-discharge-teaching nurses: bridging the gap in today’s workforce. J Nurs Adm. 2003;33(1):11-13. PubMed
16. White CM, Thomson JE, Statile AM, et al. Development of a New Care Model for Hospitalized Children With Medical Complexity. Hosp Pediatr. 2017;7(7):410-414. PubMed
17. Statile AM, Schondelmeyer AC, Thomson JE, et al. Improving Discharge Efficiency in Medically Complex Pediatric Patients. Pediatrics. 2016;138(2). PubMed
18. Dunn K, Rogers J. Discharge Facilitation: An Innovative PNP Role. J Pediatr Health Care. 2016;30(5):499-505. PubMed
19. Kripalani S, Jackson AT, Schnipper JL, Coleman EA. Promoting effective transitions of care at hospital discharge: a review of key issues for hospitalists. J Hosp Med. 2007;2(5):314-323. PubMed
20. Scott AM, Li J, Oyewole-Eletu S, et al. Understanding Facilitators and Barriers to Care Transitions: Insights from Project ACHIEVE Site Visits. Jt Comm J Qual Patient Saf. 2017;43(9):433-447. PubMed
21. Shen MW, Hershey D, Bergert L, Mallory L, Fisher ES, Cooperberg D. Pediatric hospitalists collaborate to improve timeliness of discharge communication. Hosp Pediatr. 2013;3(3):258-265. PubMed
© 2018 Society of Hospital Medicine
Accuracy Comparisons between Manual and Automated Respiratory Rate for Detecting Clinical Deterioration in Ward Patients
Respiratory rate is the most accurate vital sign for predicting adverse outcomes in ward patients.1,2 Though other vital signs are typically collected by using machines, respiratory rate is collected manually by caregivers counting the breathing rate. However, studies have shown significant discrepancies between a patient’s respiratory rate documented in the medical record, which is often 18 or 20, and the value measured by counting the rate over a full minute.3 Thus, despite the high accuracy of respiratory rate, it is possible that these values do not represent true patient physiology. It is unknown whether a valid automated measurement of respiratory rate would be more predictive than a manually collected respiratory rate for identifying patients who develop deterioration. The aim of this study was to compare the distribution and predictive accuracy of manually and automatically recorded respiratory rates.
METHODS
In this prospective cohort study, adult patients admitted to one oncology ward at the University of Chicago from April 2015 to May 2016 were approached for consent (Institutional Review Board #14-0682). Enrolled patients were fit with a cableless, FDA-approved respiratory pod device (Philips IntelliVue clResp Pod; Philips Healthcare, Andover, MA) that automatically recorded respiratory rate and heart rate every 15 minutes while they remained on the ward. Pod data were paired with vital sign data documented in the electronic health record (EHR) by taking the automated value closest, but prior to, the manual value up to a maximum of 4 hours. Automated and manual respiratory rate were compared by using the area under the receiver operating characteristic curve (AUC) for whether an intensive care unit (ICU) transfer occurred within 24 hours of each paired observation without accounting for patient-level clustering.
RESULTS

DISCUSSION
In this prospective cohort study, we found that manual respiratory rates were different than those collected from an automated system and, yet, were significantly more accurate for predicting ICU transfer. These results suggest that the predictive accuracy of respiratory rates documented in the EHR is due to more than just physiology. Our findings have important implications for the risk stratification of ward patients.
Though previous literature has suggested that respiratory rate is the most accurate predictor of deterioration, this may not be true.1 Respiratory rates manually recorded by clinical staff may contain information beyond pure physiology, such as a proxy of clinician concern, which may inflate the predictive value. Nursing staff may record standard respiratory rate values for patients that appear to be well (eg, 18) but count actual rates for those patients they suspect have a more severe disease, which is one possible explanation for our findings. In addition, automated assessments are likely to be more sensitive to intermittent fluctuations in respiratory rate associated with patient movement or emotion. This might explain the improved accuracy at higher rates for manually recorded vital signs.
Although limited by its small sample size, our results have important implications for patient monitoring and early warning scores designed to identify high-risk ward patients given that both simple scores and statistically derived models include respiratory rates as a predictor.4 As hospitals move to use newer technologies to automate vital sign monitoring and decrease nursing workload, our findings suggest that accuracy for identifying high-risk patients may be lost. Additional methods for capturing subjective assessments from clinical providers may be necessary and could be incorporated into risk scores.5 For example, the 7-point subjective Patient Acuity Rating has been shown to augment the Modified Early Warning Score for predicting ICU transfer, rapid response activation, or cardiac arrest within 24 hours.6
Manually recorded respiratory rate may include information beyond pure physiology, which inflates its predictive value. This has important implications for the use of automated monitoring technology in hospitals and the integration of these measurements into early warning scores.
Acknowledgments
The authors thank Pamela McCall, BSN, OCN for her assistance with study implementation, Kevin Ig-Izevbekhai and Shivraj Grewal for assistance with data collection, UCM Clinical Engineering for technical support, and Timothy Holper, MS, Julie Johnson, MPH, RN, and Thomas Sutton for assistance with data abstraction.
Disclosure
Dr. Churpek is supported by a career development award from the National Heart, Lung, and Blood Institute (K08 HL121080) and has received honoraria from Chest for invited speaking engagements. Dr. Churpek and Dr. Edelson have a patent pending (ARCD. P0535US.P2) for risk stratification algorithms for hospitalized patients. In addition, Dr. Edelson has received research support from Philips Healthcare (Andover, MA), research support from the American Heart Association (Dallas, TX) and Laerdal Medical (Stavanger, Norway), and research support from EarlySense (Tel Aviv, Israel). She has ownership interest in Quant HC (Chicago, IL), which is developing products for risk stratification of hospitalized patients. This study was supported by a grant from Philips Healthcare in Andover, MA. The sponsor had no role in data collection, interpretation of results, or drafting of the manuscript.
1. Churpek MM, Yuen TC, Huber MT, Park SY, Hall JB, Edelson DP. Predicting cardiac arrest on the wards: a nested case-control study. Chest. 2012;141(5):1170-1176. PubMed
2. Fieselmann JF, Hendryx MS, Helms CM, Wakefield DS. Respiratory rate predicts cardiopulmonary arrest for internal medicine inpatients. J Gen Intern Med. 1993;8(7):354-360. PubMed
3. Semler MW, Stover DG, Copland AP, et al. Flash mob research: a single-day, multicenter, resident-directed study of respiratory rate. Chest. 2013;143(6):1740-1744. PubMed
4. Churpek MM, Yuen TC, Edelson DP. Risk stratification of hospitalized patients on the wards. Chest. 2013;143(6):1758-1765. PubMed
5. Edelson DP, Retzer E, Weidman EK, et al. Patient acuity rating: quantifying clinical judgment regarding inpatient stability. J Hosp Med. 2011;6(8):475-479. PubMed
6. Patel AR, Zadravecz FJ, Young RS, Williams MV, Churpek MM, Edelson DP. The value of clinical judgment in the detection of clinical deterioration. JAMA Intern Med. 2015;175(3):456-458. PubMed
Respiratory rate is the most accurate vital sign for predicting adverse outcomes in ward patients.1,2 Though other vital signs are typically collected by using machines, respiratory rate is collected manually by caregivers counting the breathing rate. However, studies have shown significant discrepancies between a patient’s respiratory rate documented in the medical record, which is often 18 or 20, and the value measured by counting the rate over a full minute.3 Thus, despite the high accuracy of respiratory rate, it is possible that these values do not represent true patient physiology. It is unknown whether a valid automated measurement of respiratory rate would be more predictive than a manually collected respiratory rate for identifying patients who develop deterioration. The aim of this study was to compare the distribution and predictive accuracy of manually and automatically recorded respiratory rates.
METHODS
In this prospective cohort study, adult patients admitted to one oncology ward at the University of Chicago from April 2015 to May 2016 were approached for consent (Institutional Review Board #14-0682). Enrolled patients were fit with a cableless, FDA-approved respiratory pod device (Philips IntelliVue clResp Pod; Philips Healthcare, Andover, MA) that automatically recorded respiratory rate and heart rate every 15 minutes while they remained on the ward. Pod data were paired with vital sign data documented in the electronic health record (EHR) by taking the automated value closest, but prior to, the manual value up to a maximum of 4 hours. Automated and manual respiratory rate were compared by using the area under the receiver operating characteristic curve (AUC) for whether an intensive care unit (ICU) transfer occurred within 24 hours of each paired observation without accounting for patient-level clustering.
RESULTS
DISCUSSION
In this prospective cohort study, we found that manual respiratory rates were different than those collected from an automated system and, yet, were significantly more accurate for predicting ICU transfer. These results suggest that the predictive accuracy of respiratory rates documented in the EHR is due to more than just physiology. Our findings have important implications for the risk stratification of ward patients.
Though previous literature has suggested that respiratory rate is the most accurate predictor of deterioration, this may not be true.1 Respiratory rates manually recorded by clinical staff may contain information beyond pure physiology, such as a proxy of clinician concern, which may inflate the predictive value. Nursing staff may record standard respiratory rate values for patients that appear to be well (eg, 18) but count actual rates for those patients they suspect have a more severe disease, which is one possible explanation for our findings. In addition, automated assessments are likely to be more sensitive to intermittent fluctuations in respiratory rate associated with patient movement or emotion. This might explain the improved accuracy at higher rates for manually recorded vital signs.
Although limited by its small sample size, our results have important implications for patient monitoring and early warning scores designed to identify high-risk ward patients given that both simple scores and statistically derived models include respiratory rates as a predictor.4 As hospitals move to use newer technologies to automate vital sign monitoring and decrease nursing workload, our findings suggest that accuracy for identifying high-risk patients may be lost. Additional methods for capturing subjective assessments from clinical providers may be necessary and could be incorporated into risk scores.5 For example, the 7-point subjective Patient Acuity Rating has been shown to augment the Modified Early Warning Score for predicting ICU transfer, rapid response activation, or cardiac arrest within 24 hours.6
Manually recorded respiratory rate may include information beyond pure physiology, which inflates its predictive value. This has important implications for the use of automated monitoring technology in hospitals and the integration of these measurements into early warning scores.
Acknowledgments
The authors thank Pamela McCall, BSN, OCN for her assistance with study implementation, Kevin Ig-Izevbekhai and Shivraj Grewal for assistance with data collection, UCM Clinical Engineering for technical support, and Timothy Holper, MS, Julie Johnson, MPH, RN, and Thomas Sutton for assistance with data abstraction.
Disclosure
Dr. Churpek is supported by a career development award from the National Heart, Lung, and Blood Institute (K08 HL121080) and has received honoraria from Chest for invited speaking engagements. Dr. Churpek and Dr. Edelson have a patent pending (ARCD. P0535US.P2) for risk stratification algorithms for hospitalized patients. In addition, Dr. Edelson has received research support from Philips Healthcare (Andover, MA), research support from the American Heart Association (Dallas, TX) and Laerdal Medical (Stavanger, Norway), and research support from EarlySense (Tel Aviv, Israel). She has ownership interest in Quant HC (Chicago, IL), which is developing products for risk stratification of hospitalized patients. This study was supported by a grant from Philips Healthcare in Andover, MA. The sponsor had no role in data collection, interpretation of results, or drafting of the manuscript.
1. Churpek MM, Yuen TC, Huber MT, Park SY, Hall JB, Edelson DP. Predicting cardiac arrest on the wards: a nested case-control study. Chest. 2012;141(5):1170-1176. PubMed
2. Fieselmann JF, Hendryx MS, Helms CM, Wakefield DS. Respiratory rate predicts cardiopulmonary arrest for internal medicine inpatients. J Gen Intern Med. 1993;8(7):354-360. PubMed
3. Semler MW, Stover DG, Copland AP, et al. Flash mob research: a single-day, multicenter, resident-directed study of respiratory rate. Chest. 2013;143(6):1740-1744. PubMed
4. Churpek MM, Yuen TC, Edelson DP. Risk stratification of hospitalized patients on the wards. Chest. 2013;143(6):1758-1765. PubMed
5. Edelson DP, Retzer E, Weidman EK, et al. Patient acuity rating: quantifying clinical judgment regarding inpatient stability. J Hosp Med. 2011;6(8):475-479. PubMed
6. Patel AR, Zadravecz FJ, Young RS, Williams MV, Churpek MM, Edelson DP. The value of clinical judgment in the detection of clinical deterioration. JAMA Intern Med. 2015;175(3):456-458. PubMed
© 2018 Society of Hospital Medicine
Lean-Based Redesign of Multidisciplinary Rounds on General Medicine Service
Given that multiple disciplines are often involved in caring for patients admitted to the hospital, timely communication, collaboration, and coordination amongst various disciplines is necessary for safe and effective patient care.1 With the focus on improving patient satisfaction and throughput in hospitals, it is also important to make more accurate predictions of the discharge date and allow time for patients and their families to prepare for discharge.2-4
Multidisciplinary rounds (MDR) are defined as structured daily communication amongst key members of the patient’s care team (eg, nurses, physicians, case managers, social workers, pharmacists, and rehabilitation services). MDR have shown to be a useful strategy for ensuring that all members of the care team are updated on the plan of care for the patient.5 During MDR, a brief “check-in” discussing the patient’s plan of care, pending needs, and barriers to discharge allows all team members, patients, and families to effectively coordinate care and plan and prepare for discharge.
Multiple studies have reported increased collaboration and improved communication between disciplines with the use of such multidisciplinary rounding.2,5-7 Additionally, MDR have been shown to improve patient outcomes8 and reduce adverse events,9 length of stay (LOS),6,8 cost of care,8 and readmissions.1
We redesigned MDR on the general medicine wards at our institution in October 2014 by using Lean management techniques. Lean is defined as a set of philosophies and methods that aim to create transformation in thinking, behavior, and culture in each process, with the goal of maximizing the value for the patients and providers, adding efficiency, and reducing waste and waits.10
In this study, we evaluate whether this new model of MDR was associated with a decrease in the LOS. We also evaluate whether this new model of MDR was associated with an increase in discharges before noon, documentation of estimated discharge date (EDD) in our electronic health record (EHR), and patient satisfaction.
METHODS
Setting, Design, and Patients
The study was conducted on the teaching general medicine service at our institution, an urban, 484-bed academic hospital. The general medicine service has patients on 4 inpatient units (total of 95 beds) and is managed by 5 teaching service teams.
We performed a pre-post study. The preperiod (in which the old model of MDR was followed) included 4000 patients discharged between September 1, 2013, and October 22, 2014. The postperiod (in which the new model of MDR was followed) included 2085 patients discharged between October 23, 2014, and April 30, 2015. We excluded 139 patients that died in the hospital prior to discharge and patients on the nonteaching and/or private practice service.
All data were provided by our institution’s Digital Solutions Department. Our institutional review board issued a letter of determination exempting this study from further review because it was deemed to be a quality improvement initiative.
Use of Lean Management to Redesign our MDR
Our institution has incorporated the Lean management system to continually add value to services through the elimination of waste, thus simultaneously optimizing the quality of patient care, cost, and patient satisfaction.11 Lean, derived from the Toyota Production System, has long been used in manufacturing and in recent decades has spread to healthcare.12 We leveraged the following 3 key Lean techniques to redesign our MDR: (1) value stream management (VSM), (2) rapid process improvement workshops (RPIW), and (3) active daily management (ADM), as detailed in supplementary Appendix 1.
Interventions
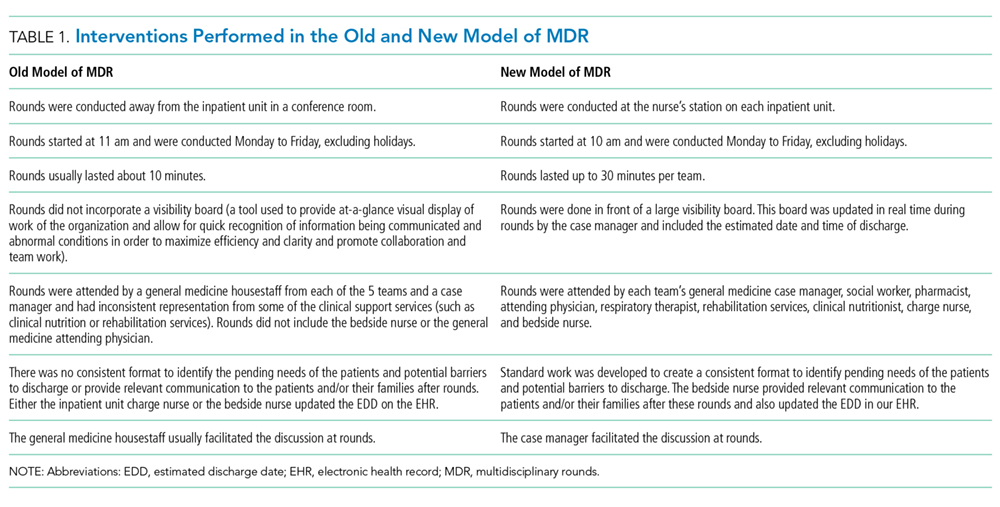
Outcomes
The primary outcome was mean LOS. The secondary outcomes were (1) discharges before noon, (2) recording of the EDD in our EHR within 24 hours of admission (as time stamped on our EHR), and (3) patient satisfaction.
Data for patient satisfaction were obtained using the Press Ganey survey. We used data on patient satisfaction scores for the following 2 relevant questions on this survey: (1) extent to which the patient felt ready to be discharged and (2) how well staff worked together to care for the patient. Proportions of the “top-box” (“very good”) were used for the analysis. These survey data were available on 467 patients (11.7%) in the preperiod and 188 patients (9.0%) in the postperiod.
Data Analysis
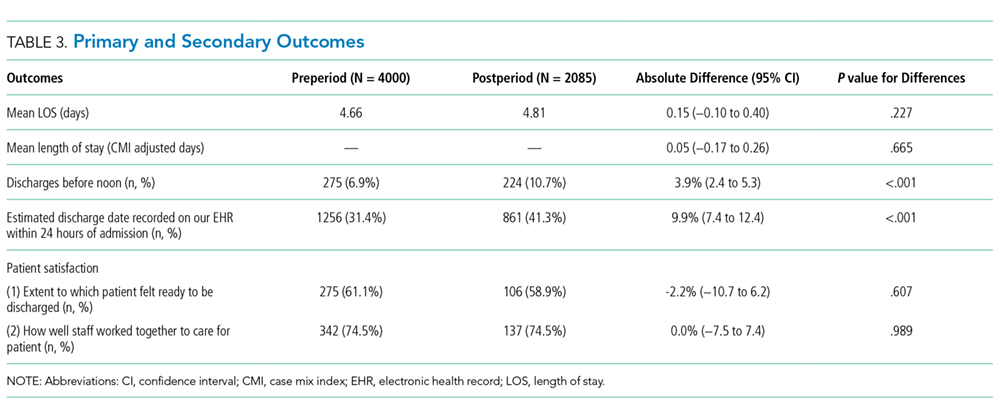
A sensitivity analysis was conducted on a second cohort that included a subset of patients from the preperiod between November 1, 2013, and April 30, 2014, and a subset of patients from the postperiod between November 1, 2014, and April 1, 2015, to control for the calendar period (supplementary Appendix 2).
All analyses were conducted in R version 3.3.0, with the linear mixed-effects model lme4 statistical package.13,14
RESULTS
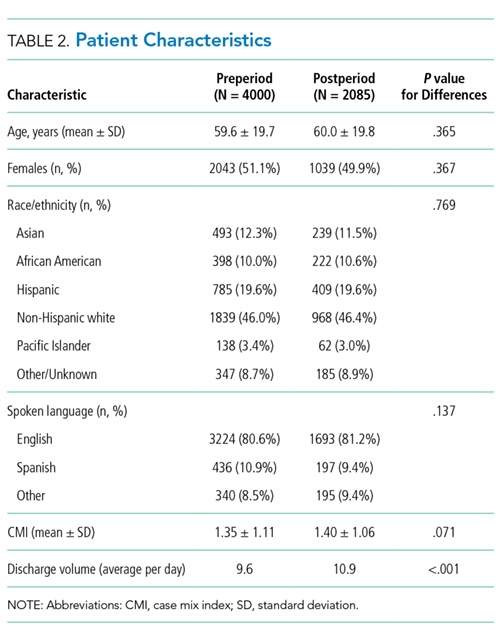
Table 3 shows the differences in the outcomes between the pre- and postperiods. There was no change in the LOS or LOS adjusted for CMI. There was a 3.9% increase in discharges before noon in the postperiod compared with the preperiod (95% CI, 2.4% to 5.3%; P < .001). There was a 9.9% increase in the percentage of patients for whom the EDD was recorded in our EHR within 24 hours of admission (95% CI, 7.4% to 12.4%; P < .001). There was no change in the “top-box” patient satisfaction scores.
There were only marginal differences in the results between the entire cohort and a second subset cohort used for sensitivity analysis (supplementary Appendix 2).
DISCUSSION
In our study, there was no change in the mean LOS with the new model of MDR. There was an increase in discharges before noon and in recording of the EDD in our EHR within 24 hours of admission in the postperiod when the Lean-based new model of MDR was utilized. There was no change in patient satisfaction. With no change in staffing, we were able to accommodate the increase in the discharge volume in the postperiod.
We believe our results are attributable to several factors, including clearly defined roles and responsibilities for all participants of MDR, the inclusion of more experienced general medicine attending physician (compared with housestaff), Lean management techniques to identify gaps in the patient’s journey from emergency department to discharge using VSM, the development of appropriate workflows and standard work on how the multidisciplinary teams would work together at RPIWs, and ADM to ensure sustainability and engagement among frontline members and institutional leaders. In order to sustain this, we planned to continue monitoring data in daily, weekly, and monthly forums with senior physician and administrative leaders. Planning for additional interventions is underway, including moving MDR to the bedside, instituting an afternoon “check-in” that would enable more detailed action planning, and addressing barriers in a timely manner for patients ready to discharge the following day.
Our study has a few limitations. First, this is an observational study that cannot determine causation. Second, this is a single-center study conducted on patients only on the general medicine teaching service. Third, there were several concurrent interventions implemented at our institution to improve LOS, throughput, and patient satisfaction in addition to MDR, thus making it difficult to isolate the impact of our intervention. Fourth, in the new model of MDR, rounds took place only 5 days per week, thereby possibly limiting the potential impact on our outcomes. Fifth, while we showed improvements in the discharges before noon and recording of EDD in the post period, we were not able to achieve our target of 25% discharges before noon or 100% recording of EDD in this time period. We believe the limited amount of time between the pre- and postperiods to allow for adoption and learning of the processes might have contributed to the underestimation of the impact of the new model of MDR, thereby limiting our ability to achieve our targets. Sixth, the response rate on the Press Ganey survey was low, and we did not directly survey patients or families for their satisfaction with MDR.
Our study has several strengths. To our knowledge, this is the first study to embed Lean management techniques in the design of MDR in the inpatient setting. While several studies have demonstrated improvements in discharges before noon through the implementation of MDR, they have not incorporated Lean management techniques, which we believe are critical to ensure the sustainability of results.1,3,5,6,8,15 Second, while it was not measured, there was a high level of provider engagement in the process in the new model of MDR. Third, because the MDR were conducted at the nurse’s station on each inpatient unit in the new model instead of in a conference room, it was well attended by all members of the multidisciplinary team. Fourth, the presence of a visibility board allowed for all team members to have easy access to visual feedback throughout the day, even if they were not present at the MDR. Fifth, we believe that there was also more accurate estimation of the date and time of discharge in the new model of MDR because the discussion was facilitated by the case manager, who is experienced in identifying barriers to discharge (compared with the housestaff in the old model of MDR), and included the more experienced attending physician. Finally, the consistent presence of a multidisciplinary team at MDR allowed for the incorporation of everyone’s concerns at one time, thereby limiting the need for paging multiple disciplines throughout the day, which led to quicker resolution of issues and assignment of pending tasks.
In conclusion, our study shows no change in the mean LOS when the Lean-based model of MDR was utilized. Our study demonstrates an increase in discharges before noon and in recording of EDD on our EHR within 24 hours of admission in the post period when the Lean-based model of MDR was utilized. There was no change in patient satisfaction. While this study was conducted at an academic medical center on the general medicine wards, we believe our new model of MDR, which leveraged Lean management techniques, may successfully impact patient flow in all inpatient clinical services and nonteaching hospitals.
Disclosure
The authors report no financial conflicts of interest and have nothing to disclose.
1. Townsend-Gervis M, Cornell P, Vardaman JM. Interdisciplinary Rounds and Structured Communication Reduce Re-Admissions and Improve Some Patient Outcomes. West J Nurs Res. 2014;36(7):917-928. PubMed
2. Vazirani S, Hays RD, Shapiro MF, Cowan M. Effect of a multidisciplinary intervention on communication and collaboration among physicians and nurses. Am J Crit Care. 2005;14(1):71-77. PubMed
3. Wertheimer B, Jacobs RE, Bailey M, et al. Discharge before noon: an achievable hospital goal. J Hosp Med. 2014;9(4):210-214. PubMed
4. Wertheimer B, Jacobs RE, Iturrate E, Bailey M, Hochman K. Discharge before noon: Effect on throughput and sustainability. J Hosp Med. 2015;10(10):664-669. PubMed
5. Halm MA, Gagner S, Goering M, Sabo J, Smith M, Zaccagnini M. Interdisciplinary rounds: impact on patients, families, and staff. Clin Nurse Spec. 2003;17(3):133-142. PubMed
6. O’Mahony S, Mazur E, Charney P, Wang Y, Fine J. Use of multidisciplinary rounds to simultaneously improve quality outcomes, enhance resident education, and shorten length of stay. J Gen Intern Med. 2007;22(8):1073-1079. PubMed
7. Reimer N, Herbener L. Round and round we go: rounding strategies to impact exemplary professional practice. Clin J Oncol Nurs. 2014;18(6):654-660. PubMed
8. Curley C, McEachern JE, Speroff T. A firm trial of interdisciplinary rounds on the inpatient medical wards: an intervention designed using continuous quality improvement. Med Care. 1998;36(8 Suppl):AS4-AS12. PubMed
9. Baggs JG, Ryan SA, Phelps CE, Richeson JF, Johnson JE. The association between interdisciplinary collaboration and patient outcomes in a medical intensive care unit. Heart Lung. 1992;21(1):18-24. PubMed
10. Lawal AK, Rotter T, Kinsman L, et al. Lean management in health care: definition, concepts, methodology and effects reported (systematic review protocol). Syst Rev. 2014;3:103. PubMed
11. Liker JK. Toyota Way: 14 Management Principles from the World’s Greatest Manufacturer. New York, Chicago, San Francisco, Athens, London, Madrid, Mexico City, Milan, New Delhi, Singapore, Sydney, Toronto: McGraw-Hill Education; 2004.
12. Kane M, Chui K, Rimicci J, et al. Lean Manufacturing Improves Emergency Department Throughput and Patient Satisfaction. J Nurs Adm. 2015;45(9):429-434. PubMed
13. R Core Team. R: A language and environment for statistical computing. R Foundation for Statistical Computing, Vienna, Austria. 2016. http://www.R-project.org/. Accessed November 7, 2017.
14. Bates D, Mächler M, Bolker B, Walker S. Fitting Linear Mixed-Effects Models Using lme4. J Stat Softw. 2015;67(1):1-48.
15. O’Leary KJ, Buck R, Fligiel HM, et al. Structured interdisciplinary rounds in a medical teaching unit: improving patient safety. Arch Intern Med. 2011;171(7):678-684. PubMed
Given that multiple disciplines are often involved in caring for patients admitted to the hospital, timely communication, collaboration, and coordination amongst various disciplines is necessary for safe and effective patient care.1 With the focus on improving patient satisfaction and throughput in hospitals, it is also important to make more accurate predictions of the discharge date and allow time for patients and their families to prepare for discharge.2-4
Multidisciplinary rounds (MDR) are defined as structured daily communication amongst key members of the patient’s care team (eg, nurses, physicians, case managers, social workers, pharmacists, and rehabilitation services). MDR have shown to be a useful strategy for ensuring that all members of the care team are updated on the plan of care for the patient.5 During MDR, a brief “check-in” discussing the patient’s plan of care, pending needs, and barriers to discharge allows all team members, patients, and families to effectively coordinate care and plan and prepare for discharge.
Multiple studies have reported increased collaboration and improved communication between disciplines with the use of such multidisciplinary rounding.2,5-7 Additionally, MDR have been shown to improve patient outcomes8 and reduce adverse events,9 length of stay (LOS),6,8 cost of care,8 and readmissions.1
We redesigned MDR on the general medicine wards at our institution in October 2014 by using Lean management techniques. Lean is defined as a set of philosophies and methods that aim to create transformation in thinking, behavior, and culture in each process, with the goal of maximizing the value for the patients and providers, adding efficiency, and reducing waste and waits.10
In this study, we evaluate whether this new model of MDR was associated with a decrease in the LOS. We also evaluate whether this new model of MDR was associated with an increase in discharges before noon, documentation of estimated discharge date (EDD) in our electronic health record (EHR), and patient satisfaction.
METHODS
Setting, Design, and Patients
The study was conducted on the teaching general medicine service at our institution, an urban, 484-bed academic hospital. The general medicine service has patients on 4 inpatient units (total of 95 beds) and is managed by 5 teaching service teams.
We performed a pre-post study. The preperiod (in which the old model of MDR was followed) included 4000 patients discharged between September 1, 2013, and October 22, 2014. The postperiod (in which the new model of MDR was followed) included 2085 patients discharged between October 23, 2014, and April 30, 2015. We excluded 139 patients that died in the hospital prior to discharge and patients on the nonteaching and/or private practice service.
All data were provided by our institution’s Digital Solutions Department. Our institutional review board issued a letter of determination exempting this study from further review because it was deemed to be a quality improvement initiative.
Use of Lean Management to Redesign our MDR
Our institution has incorporated the Lean management system to continually add value to services through the elimination of waste, thus simultaneously optimizing the quality of patient care, cost, and patient satisfaction.11 Lean, derived from the Toyota Production System, has long been used in manufacturing and in recent decades has spread to healthcare.12 We leveraged the following 3 key Lean techniques to redesign our MDR: (1) value stream management (VSM), (2) rapid process improvement workshops (RPIW), and (3) active daily management (ADM), as detailed in supplementary Appendix 1.
Interventions
Outcomes
The primary outcome was mean LOS. The secondary outcomes were (1) discharges before noon, (2) recording of the EDD in our EHR within 24 hours of admission (as time stamped on our EHR), and (3) patient satisfaction.
Data for patient satisfaction were obtained using the Press Ganey survey. We used data on patient satisfaction scores for the following 2 relevant questions on this survey: (1) extent to which the patient felt ready to be discharged and (2) how well staff worked together to care for the patient. Proportions of the “top-box” (“very good”) were used for the analysis. These survey data were available on 467 patients (11.7%) in the preperiod and 188 patients (9.0%) in the postperiod.
Data Analysis
A sensitivity analysis was conducted on a second cohort that included a subset of patients from the preperiod between November 1, 2013, and April 30, 2014, and a subset of patients from the postperiod between November 1, 2014, and April 1, 2015, to control for the calendar period (supplementary Appendix 2).
All analyses were conducted in R version 3.3.0, with the linear mixed-effects model lme4 statistical package.13,14
RESULTS
Table 3 shows the differences in the outcomes between the pre- and postperiods. There was no change in the LOS or LOS adjusted for CMI. There was a 3.9% increase in discharges before noon in the postperiod compared with the preperiod (95% CI, 2.4% to 5.3%; P < .001). There was a 9.9% increase in the percentage of patients for whom the EDD was recorded in our EHR within 24 hours of admission (95% CI, 7.4% to 12.4%; P < .001). There was no change in the “top-box” patient satisfaction scores.
There were only marginal differences in the results between the entire cohort and a second subset cohort used for sensitivity analysis (supplementary Appendix 2).
DISCUSSION
In our study, there was no change in the mean LOS with the new model of MDR. There was an increase in discharges before noon and in recording of the EDD in our EHR within 24 hours of admission in the postperiod when the Lean-based new model of MDR was utilized. There was no change in patient satisfaction. With no change in staffing, we were able to accommodate the increase in the discharge volume in the postperiod.
We believe our results are attributable to several factors, including clearly defined roles and responsibilities for all participants of MDR, the inclusion of more experienced general medicine attending physician (compared with housestaff), Lean management techniques to identify gaps in the patient’s journey from emergency department to discharge using VSM, the development of appropriate workflows and standard work on how the multidisciplinary teams would work together at RPIWs, and ADM to ensure sustainability and engagement among frontline members and institutional leaders. In order to sustain this, we planned to continue monitoring data in daily, weekly, and monthly forums with senior physician and administrative leaders. Planning for additional interventions is underway, including moving MDR to the bedside, instituting an afternoon “check-in” that would enable more detailed action planning, and addressing barriers in a timely manner for patients ready to discharge the following day.
Our study has a few limitations. First, this is an observational study that cannot determine causation. Second, this is a single-center study conducted on patients only on the general medicine teaching service. Third, there were several concurrent interventions implemented at our institution to improve LOS, throughput, and patient satisfaction in addition to MDR, thus making it difficult to isolate the impact of our intervention. Fourth, in the new model of MDR, rounds took place only 5 days per week, thereby possibly limiting the potential impact on our outcomes. Fifth, while we showed improvements in the discharges before noon and recording of EDD in the post period, we were not able to achieve our target of 25% discharges before noon or 100% recording of EDD in this time period. We believe the limited amount of time between the pre- and postperiods to allow for adoption and learning of the processes might have contributed to the underestimation of the impact of the new model of MDR, thereby limiting our ability to achieve our targets. Sixth, the response rate on the Press Ganey survey was low, and we did not directly survey patients or families for their satisfaction with MDR.
Our study has several strengths. To our knowledge, this is the first study to embed Lean management techniques in the design of MDR in the inpatient setting. While several studies have demonstrated improvements in discharges before noon through the implementation of MDR, they have not incorporated Lean management techniques, which we believe are critical to ensure the sustainability of results.1,3,5,6,8,15 Second, while it was not measured, there was a high level of provider engagement in the process in the new model of MDR. Third, because the MDR were conducted at the nurse’s station on each inpatient unit in the new model instead of in a conference room, it was well attended by all members of the multidisciplinary team. Fourth, the presence of a visibility board allowed for all team members to have easy access to visual feedback throughout the day, even if they were not present at the MDR. Fifth, we believe that there was also more accurate estimation of the date and time of discharge in the new model of MDR because the discussion was facilitated by the case manager, who is experienced in identifying barriers to discharge (compared with the housestaff in the old model of MDR), and included the more experienced attending physician. Finally, the consistent presence of a multidisciplinary team at MDR allowed for the incorporation of everyone’s concerns at one time, thereby limiting the need for paging multiple disciplines throughout the day, which led to quicker resolution of issues and assignment of pending tasks.
In conclusion, our study shows no change in the mean LOS when the Lean-based model of MDR was utilized. Our study demonstrates an increase in discharges before noon and in recording of EDD on our EHR within 24 hours of admission in the post period when the Lean-based model of MDR was utilized. There was no change in patient satisfaction. While this study was conducted at an academic medical center on the general medicine wards, we believe our new model of MDR, which leveraged Lean management techniques, may successfully impact patient flow in all inpatient clinical services and nonteaching hospitals.
Disclosure
The authors report no financial conflicts of interest and have nothing to disclose.
1. Townsend-Gervis M, Cornell P, Vardaman JM. Interdisciplinary Rounds and Structured Communication Reduce Re-Admissions and Improve Some Patient Outcomes. West J Nurs Res. 2014;36(7):917-928. PubMed
2. Vazirani S, Hays RD, Shapiro MF, Cowan M. Effect of a multidisciplinary intervention on communication and collaboration among physicians and nurses. Am J Crit Care. 2005;14(1):71-77. PubMed
3. Wertheimer B, Jacobs RE, Bailey M, et al. Discharge before noon: an achievable hospital goal. J Hosp Med. 2014;9(4):210-214. PubMed
4. Wertheimer B, Jacobs RE, Iturrate E, Bailey M, Hochman K. Discharge before noon: Effect on throughput and sustainability. J Hosp Med. 2015;10(10):664-669. PubMed
5. Halm MA, Gagner S, Goering M, Sabo J, Smith M, Zaccagnini M. Interdisciplinary rounds: impact on patients, families, and staff. Clin Nurse Spec. 2003;17(3):133-142. PubMed
6. O’Mahony S, Mazur E, Charney P, Wang Y, Fine J. Use of multidisciplinary rounds to simultaneously improve quality outcomes, enhance resident education, and shorten length of stay. J Gen Intern Med. 2007;22(8):1073-1079. PubMed
7. Reimer N, Herbener L. Round and round we go: rounding strategies to impact exemplary professional practice. Clin J Oncol Nurs. 2014;18(6):654-660. PubMed
8. Curley C, McEachern JE, Speroff T. A firm trial of interdisciplinary rounds on the inpatient medical wards: an intervention designed using continuous quality improvement. Med Care. 1998;36(8 Suppl):AS4-AS12. PubMed
9. Baggs JG, Ryan SA, Phelps CE, Richeson JF, Johnson JE. The association between interdisciplinary collaboration and patient outcomes in a medical intensive care unit. Heart Lung. 1992;21(1):18-24. PubMed
10. Lawal AK, Rotter T, Kinsman L, et al. Lean management in health care: definition, concepts, methodology and effects reported (systematic review protocol). Syst Rev. 2014;3:103. PubMed
11. Liker JK. Toyota Way: 14 Management Principles from the World’s Greatest Manufacturer. New York, Chicago, San Francisco, Athens, London, Madrid, Mexico City, Milan, New Delhi, Singapore, Sydney, Toronto: McGraw-Hill Education; 2004.
12. Kane M, Chui K, Rimicci J, et al. Lean Manufacturing Improves Emergency Department Throughput and Patient Satisfaction. J Nurs Adm. 2015;45(9):429-434. PubMed
13. R Core Team. R: A language and environment for statistical computing. R Foundation for Statistical Computing, Vienna, Austria. 2016. http://www.R-project.org/. Accessed November 7, 2017.
14. Bates D, Mächler M, Bolker B, Walker S. Fitting Linear Mixed-Effects Models Using lme4. J Stat Softw. 2015;67(1):1-48.
15. O’Leary KJ, Buck R, Fligiel HM, et al. Structured interdisciplinary rounds in a medical teaching unit: improving patient safety. Arch Intern Med. 2011;171(7):678-684. PubMed
© 2018 Society of Hospital Medicine
Issues Identified by Postdischarge Contact after Pediatric Hospitalization: A Multisite Study
Many hospitals are considering or currently employing initiatives to contact patients after discharge. Whether conducted via telephone or other means, the purpose of the contact is to help patients adhere to discharge plans, fulfill discharge needs, and alleviate postdischarge issues (PDIs). The effectiveness of hospital-initiated postdischarge phone calls has been studied in adult patients after hospitalization, and though some studies report positive outcomes,1-3 a 2006 Cochrane review found insufficient evidence to recommend for or against the practice.4
Little is known about follow-up contact after hospitalization for children.5-11 Rates of PDI vary substantially across hospitals. For example, one single-center study of postdischarge telephone contact after hospitalization on a general pediatric ward identified PDIs in ~20% of patients.10 Another study identified PDIs in 84% of patients discharged from a pediatric rehabilitation facility.11 Telephone follow-up has been associated with reduced health resource utilization and improved patient satisfaction for children discharged after an elective surgical procedure6 and for children discharged home from the emergency department.7-9
More information is needed on the clinical experiences of postdischarge contact in hospitalized children to improve the understanding of how the contact is made, who makes it, and which patients are most likely to report a PDI. These experiences are crucial to understand given the expense and time commitment involved in postdischarge contact, as many hospitals may not be positioned to contact all discharged patients. Therefore, we conducted a pragmatic, retrospective, naturalistic study of differing approaches to postdischarge contact occurring in multiple hospitals. Our main objective was to describe the prevalence and types of PDIs identified by the different approaches for follow-up contact across 4 children’s hospitals. We also assessed the characteristics of children who have the highest likelihood of having a PDI identified from the contact within each hospital.
METHODS
Study Design, Setting, and Population
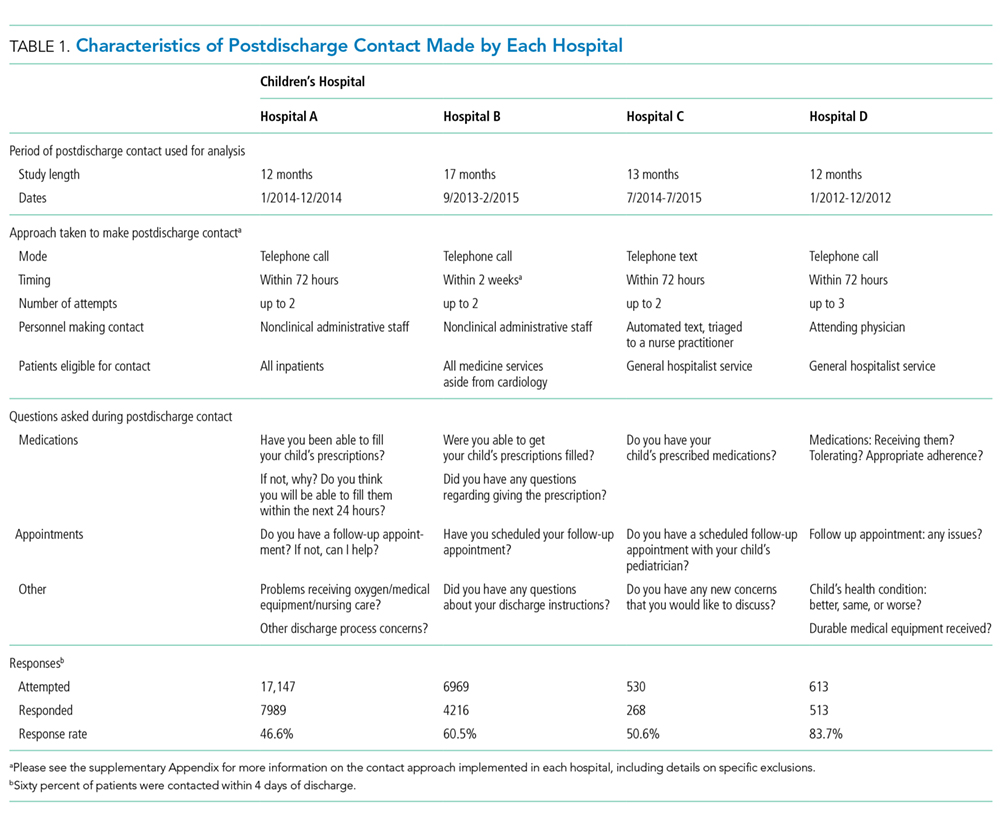
Main Outcome Measures
The main outcome measure was identification of a PDI, defined as a medication, appointment, or other discharge-related issue, that was reported and recorded by the child’s caregiver during conversation from the standardized questions that were asked during follow-up contact as part of routine discharge care (Table 1). Medication PDIs included issues filling prescriptions and tolerating medications. Appointment PDIs included not having a follow-up appointment scheduled. Other PDIs included issues with the child’s health condition, discharge instructions, or any other concerns. All PDIs had been recorded prospectively by hospital contact personnel (hospitals A, B, and D) or through an automated texting system into a database (hospital C). Where available, free text comments that were recorded by contact personnel were reviewed by one of the authors (KB) and categorized via an existing framework of PDI designed by Heath et al.10 in order to further understand the problems that were reported.
Patient Characteristics
Patient hospitalization, demographic, and clinical characteristics were obtained from administrative health data at each institution and compared between children with versus without a PDI. Hospitalization characteristics included length of stay, season of admission, and reason for admission. Reason for admission was categorized by using 3M Health’s All Patient Refined Diagnosis Related Groups (APR-DRG) (3M, Maplewood, MN). Demographic characteristics included age at admission in years, insurance type (eg, public, private, and other), and race/ethnicity (Asian/Pacific Islander, Hispanic, non-Hispanic black, non-Hispanic white, and other).
Clinical characteristics included a count of the different classes of medications (eg, antibiotics, antiepileptic medications, digestive motility medications, etc.) administered to the child during admission, the type and number of chronic conditions, and assistance with medical technology (eg, gastrostomy, tracheostomy, etc.). Except for medications, these characteristics were assessed with International Classification of Diseases, Ninth Revision-Clinical Modification (ICD-9-CM) diagnosis codes.
We used the Agency for Healthcare Research and Quality Chronic Condition Indicator classification system, which categorizes over 14,000 ICD-9-CM diagnosis codes into chronic versus nonchronic conditions to identify the presence and number of chronic conditions.12 Children hospitalized with a chronic condition were further classified as having a complex chronic condition (CCC) by using the ICD-9-CM diagnosis classification scheme of Feudtner et al.13 CCCs represent defined diagnosis groupings of conditions expected to last longer than 12 months and involve either multiple organ systems or a single organ system severely enough to require specialty pediatric care and hospitalization.13,14 Children requiring medical technology were identified by using ICD-9-CM codes indicating their use of a medical device to manage and treat a chronic illness (eg, ventricular shunt to treat hydrocephalus) or to maintain basic body functions necessary for sustaining life (eg a tracheostomy tube for breathing).15,16
Statistical Analysis
Given that the primary purpose for this study was to leverage the natural heterogeneity in the approach to follow-up contact across hospitals, we assessed and reported the prevalence and type of PDIs independently for each hospital. Relatedly, we assessed the relationship between patient characteristics and PDI likelihood independently within each hospital as well rather than pool the data and perform a central analysis across hospitals. Of note, APR-DRG and medication class were not assessed for hospital D, as this information was unavailable. We used χ2 tests for univariable analysis and logistic regression with a backwards elimination derivation process (for variables with P ≥ .05) for multivariable analysis; all patient demographic, clinical, and hospitalization characteristics were entered initially into the models. All statistical analyses were performed using SAS version 9.3 (SAS Institute, Cary, NC), and P < .05 was considered statistically significant. This study was approved by the institutional review board at all hospitals.
RESULTS
Study Population
There were 12,986 (51.4%) of 25,259 patients reached by follow-up contact after discharge across the 4 hospitals. Median age at admission for contacted patients was 4.0 years (interquartile range [IQR] 0-11). Of those contacted, 45.2% were female, 59.9% were non-Hispanic white, 51.0% used Medicaid, and 95.4% were discharged to home. Seventy-one percent had a chronic condition (of any complexity) and 40.8% had a CCC. Eighty percent received a prescribed medication during the hospitalization. Median (IQR) length of stay was 2.0 days (IQR 1-4 days). The top 5 most common reasons for admission were bronchiolitis (6.3%), pneumonia (6.2%), asthma (5.2%), seizure (4.9%), and tonsil and adenoid procedures (4.1%).
PDIs
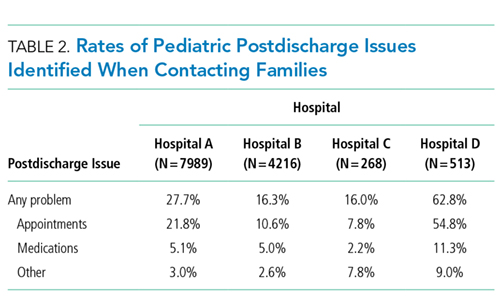
Characteristics Associated with PDIs
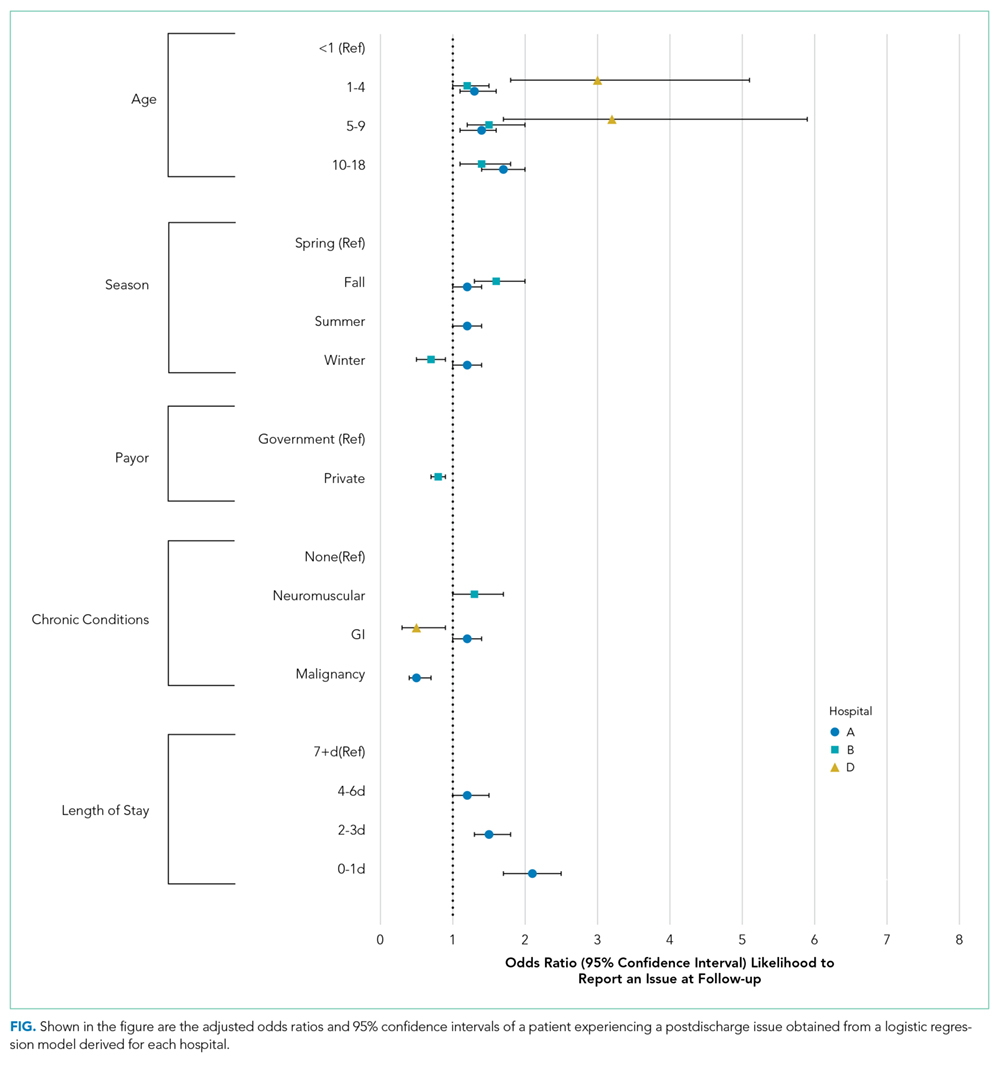
Age
Older age was a consistent characteristic associated with PDIs in 3 hospitals. For example, PDI rates in children 10 to 18 years versus <1 year were 30.8% versus 21.4% (P < .001) in hospital A, 19.4% versus 13.7% (P = .002) in hospital B, and 70.3% versus 62.8% (P < .001) in hospital D. In multivariable analysis, age 10 to 18 years versus <1 year at admission was associated with an increased likelihood of PDI in hospital A (odds ratio [OR] 1.7; 95% CI, 1.4-2.0), hospital B (OR 1.4; 95% CI, 1.1-1.8), and hospital D (OR 1.7; 95% CI, 0.9-3.0) (Table 3 and Figure).
Medications
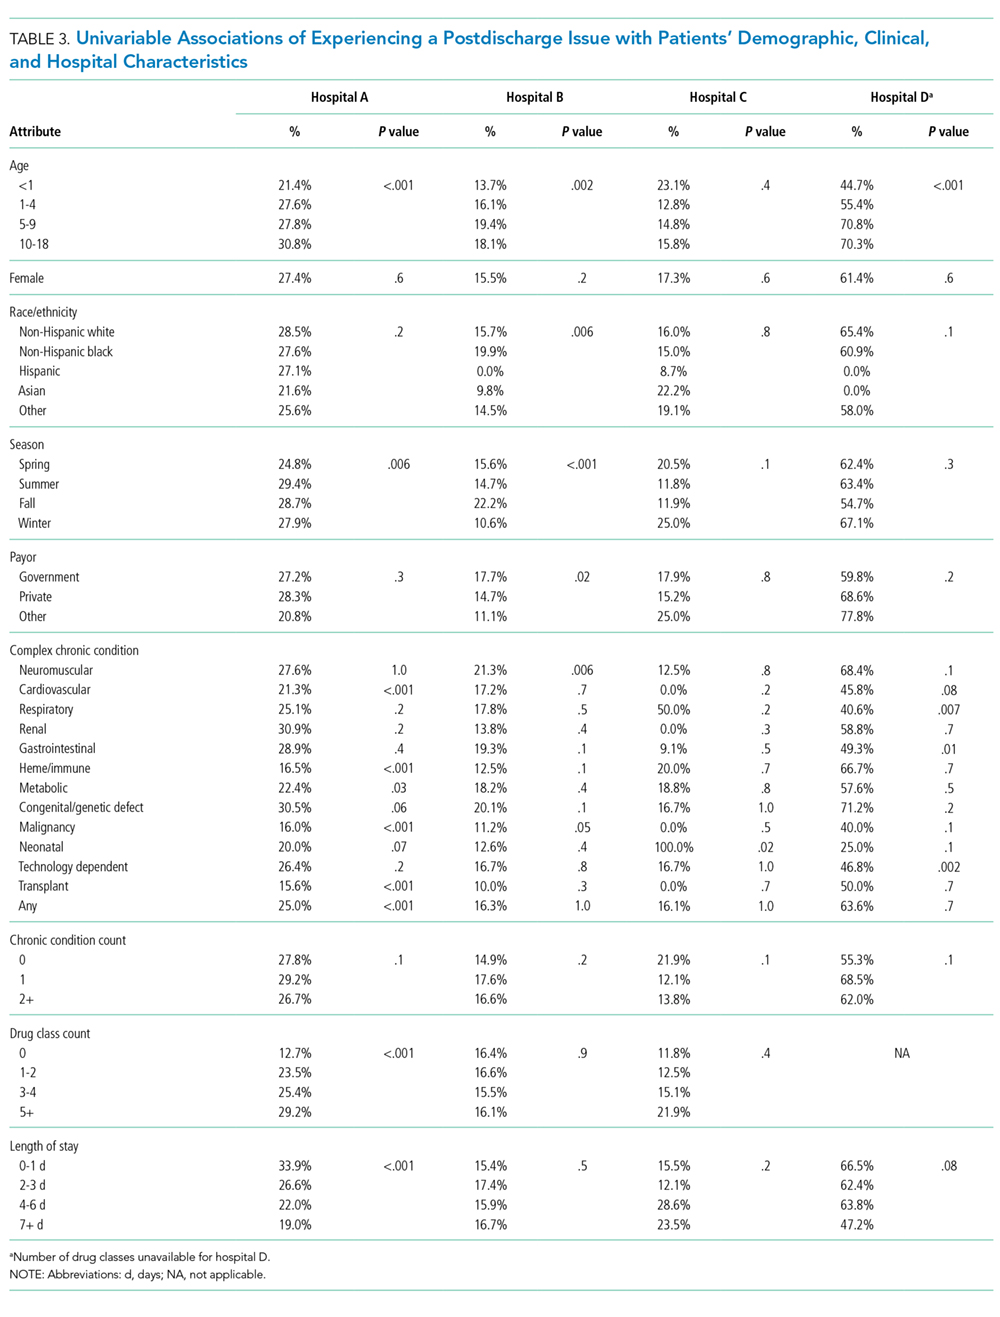
Length of Stay
Shorter length of stay was associated with PDI in 1 hospital. In hospital A, the PDI rate increased significantly (P < .001) from 19.0% to 33.9% as length of stay decreased from ≥7 days to ≤1 day (Table 3). In multivariable analysis, length of stay to ≤1 day versus ≥7 days was associated with increased likelihood of PDI (OR 2.1; 95% CI, 1.7-2.5) in hospital A (Table 3 and Figure).
CCCs
A neuromuscular CCC was associated with PDI in 2 hospitals. In hospital B, the PDI rate was higher in children with a neuromuscular CCC compared with a malignancy CCC (21.3% vs 11.2%). In hospital D, the PDI rates were higher in children with a neuromuscular CCC compared with a respiratory CCC (68.9% vs 40.6%) (Table 3). In multivariable analysis, children with versus without a neuromuscular CCC had an increased likelihood of PDI (OR 1.3; 95% CI, 1.0-1.7) in hospital B (Table 3 and Figure).
DISCUSSION
In this retrospective, pragmatic, multicentered study of follow-up contact with a standardized set of questions asked after discharge for hospitalized children, we found that PDIs were identified often, regardless of who made the contact or how the contact was made. The PDI rates varied substantially across hospitals and were likely influenced by the different follow-up approaches that were used. Most PDIs were related to appointments; fewer PDIs were related to medications and other problems. Older age, shorter length of stay, and neuromuscular CCCs were among the identified risk factors for PDIs.
Our assessment of PDIs was, by design, associated with variation in methods and approach for detection across sites. Further investigation is needed to understand how different approaches for follow-up contact after discharge may influence the identification of PDIs. For example, in the current study, the hospital with the highest PDI rate (hospital D) used hospitalists who provided inpatient care for the patient to make follow-up contact. Although not determined from the current study, this approach could have led the hospitalists to ask questions beyond the standardized ones when assessing for PDIs. Perhaps some of the hospitalists had a better understanding of how to probe for PDIs specific to each patient; this understanding may not have been forthcoming for staff in the other hospitals who were unfamiliar with the patients’ hospitalization course and medical history.
Similar to previous studies in adults, our study reported that appointment PDIs in children may be more common than other types of PDIs.17 Appointment PDIs could have been due to scheduling difficulties, inadequate discharge instructions, lack of adherence to recommended follow-up, or other reasons. Further investigation is needed to elucidate these reasons and to determine how to reduce PDIs related to postdischarge appointments. Some children’s hospitals schedule follow-up appointments prior to discharge to mitigate appointment PDIs that might arise.18 However, doing that for every hospitalized child is challenging, especially for very short admissions or for weekend discharges when many outpatient and community practices are not open to schedule appointments. Additional exploration is necessary to assess whether this might help explain why some children in the current study with a short versus long length of stay had a higher likelihood of PDI.
The rate of medication PDIs (5.2%) observed in the current study is lower than the rate that is reported in prior literature. Dudas et al.1 found that medication PDIs occurred in 21% of hospitalized adult patients. One reason for the lower rate of medication PDIs in children may be that they require the use of postdischarge medications less often than adults. Most medication PDIs in the current study involved problems filling a prescription. There was not enough information in the notes taken from the follow-up contact to distinguish the medication PDI etiologies (eg, a prescription was not sent from the hospital team to the pharmacy, prior authorization from an insurance company for a prescription was not obtained, the pharmacy did not stock the medication). To help overcome medication access barriers, some hospitals fill and deliver discharge medications to the patients’ bedside. One study found that children discharged with medication in hand were less likely to have emergency department revisits within 30 days of discharge.19 Further investigation is needed to assess whether initiatives like these help mitigate medication PDIs in children.
Hospitals may benefit from considering how risk factors for PDIs can be used to prioritize which patients receive follow-up contact, especially in hospitals where contact for all hospitalized patients is not feasible. In the current study, there was variation across hospitals in the profile of risk factors that correlated with increased likelihood of PDI. Some of the risk factors are easier to explain than others. For example, as mentioned above, for some hospitalized children, short length of stay might not permit enough time for hospital staff to set up discharge plans that may sufficiently prevent PDIs. Other risk factors, including older age and neuromuscular CCCs, may require additional assessment (eg, through chart review or in-depth patient and provider interviews) to discover the reasons why they were associated with increased likelihood of PDI. There are additional risk factors that might influence the likelihood of PDI that the current study was not positioned to assess, including health literacy, transportation availability, and language spoken.20-23
This study has several other limitations in addition to the ones already mentioned. Some children may have experienced PDIs that were not reported at contact (eg, the respondent was unaware that an issue was present), which may have led to an undercounting of PDIs. Alternatively, some caregivers may have been more likely to respond to the contact if their child was experiencing a PDI, which may have led to overcounting. PDIs of nonrespondents were not measured. PDIs identified by postdischarge outpatient and community providers or by families outside of contact were not measured. The current study was not positioned to assess the severity of the PDIs or what interventions (including additional health services) were needed to address them. Although we assessed medication use during admission, we were unable to assess the number and type of medications that were prescribed for use postdischarge. Information about the number and type of follow-up visits needed for each child was not assessed. Given the variety of approaches for follow-up contact, the findings may generalize best to individual hospitals by using an approach that best matches to one of them. The current study is not positioned to correlate quality of discharge care with the rate of PDI.
Despite these limitations, the findings from the current study reinforce that PDIs identified through follow-up contact in discharged patients appear to be common. Of PDIs identified, appointment problems were more prevalent than medication or other types of problems. Short length of stay, older age, and other patient and/or hospitalization attributes were associated with an increased likelihood of PDI. Hospitals caring for children may find this information useful as they strive to optimize their processes for follow-up contact after discharge. To help further evaluate the value and importance of contacting patients after discharge, additional study of PDI in children is warranted, including (1) actions taken to resolve PDIs, (2) the impact of identifying and addressing PDIs on hospital readmission, and (3) postdischarge experiences and health outcomes of children who responded versus those who did not respond to the follow-up contact. Moreover, future multisite, comparative effectiveness studies of PDI may wish to consider standardization of follow-up contact procedures with controlled manipulation of key processes (eg, contact by administrator vs nurse vs physician) to assess best practices.
Disclosure
Mr. Blaine, Ms. O’Neill, and Drs. Berry, Brittan, Rehm, and Steiner were supported by the Lucile Packard Foundation for Children’s Health. The authors have no financial relationships relative to this article to disclose. The authors have no conflicts of interest to disclose.
1. Dudas V, Bookwalter T, Kerr KM, Pantilat SZ. The impact of follow-up telephone calls to patients after hospitalization. Dis Mon. 2002;48(4):239-248. PubMed
2. Sanchez GM, Douglass MA, Mancuso MA. Revisiting Project Re-Engineered Discharge (RED): The Impact of a Pharmacist Telephone Intervention on Hospital Readmission Rates. Pharmacotherapy. 2015;35(9):805-812. PubMed
3. Jones J, Clark W, Bradford J, Dougherty J. Efficacy of a telephone follow-up system in the emergency department. J Emerg Med. 1988;6(3):249-254. PubMed
4. Mistiaen P, Poot E. Telephone follow-up, initiated by a hospital-based health professional, for postdischarge problems in patients discharged from hospital to home. Cochrane Database Syst Rev. 2006(4):CD004510. PubMed
5. Lushaj EB, Nelson K, Amond K, Kenny E, Badami A, Anagnostopoulos PV. Timely Post-discharge Telephone Follow-Up is a Useful Tool in Identifying Post-discharge Complications Patients After Congenital Heart Surgery. Pediatr Cardiol. 2016;37(6):1106-1110. PubMed
6. McVay MR, Kelley KR, Mathews DL, Jackson RJ, Kokoska ER, Smith SD. Postoperative follow-up: is a phone call enough? J Pediatr Surg. 2008;43(1):83-86. PubMed
7. Chande VT, Exum V. Follow-up phone calls after an emergency department visit. Pediatrics. 1994;93(3):513-514. PubMed
8. Sutton D, Stanley P, Babl FE, Phillips F. Preventing or accelerating emergency care for children with complex healthcare needs. Arch Dis Child. 2008;93(1):17-22. PubMed
9. Patel PB, Vinson DR. Physician e-mail and telephone contact after emergency department visit improves patient satisfaction: a crossover trial. Ann Emerg Med. 2013;61(6):631-637. PubMed
10. Heath J, Dancel R, Stephens JR. Postdischarge phone calls after pediatric hospitalization: an observational study. Hosp Pediatr. 2015;5(5):241-248. PubMed
11. Biffl SE, Biffl WL. Improving transitions of care for complex pediatric trauma patients from inpatient rehabilitation to home: an observational pilot study. Patient Saf Surg. 2015;9:33-37. PubMed
12. AHRQ. Clinical Classifications Software (CCS) for ICD-9-CM. http://www.hcup-us.ahrq.gov/toolssoftware/ccs/ccs.jsp. Accessed on January 31,2012.
13. Feudtner C, Christakis DA, Connell FA. Pediatric deaths attributable to complex chronic conditions: a population-based study of Washington State, 1980-1997. Pediatrics. 2000;106(1 Pt 2):205-209. PubMed
14. Berry JG, Hall DE, Kuo DZ, et al. Hospital utilization and characteristics of patients experiencing recurrent readmissions within children’s hospitals. JAMA. 2011;305(7):682-690. PubMed
15. Palfrey JS, Walker DK, Haynie M, et al. Technology’s children: report of a statewide census of children dependent on medical supports. Pediatrics. 1991;87(5):611-618. PubMed
16. Feudtner C, Villareale NL, Morray B, Sharp V, Hays RM, Neff JM. Technology-dependency among patients discharged from a children’s hospital: a retrospective cohort study. BMC Pediatr. 2005;5(1):8-15. PubMed
17. Arora VM, Prochaska ML, Farnan JM, et al. Problems after discharge and understanding of communication with their primary care physicians among hospitalized seniors: a mixed methods study. J Hosp Med. 2010;5(7):385-391. PubMed
18. Brittan M, Tyler A, Martin S, et al. A Discharge Planning Template for the Electronic Medical Record Improves Scheduling of Neurology Follow-up for Comanaged Seizure Patients. Hosp Pediatr. 2014;4(6):366-371. PubMed
19. Hatoun J, Bair-Merritt M, Cabral H, Moses J. Increasing Medication Possession at Discharge for Patients With Asthma: The Meds-in-Hand Project. Pediatrics. 2016;137(3):e20150461. doi:10.1542/peds.2015-0461. PubMed
20. Berry JG, Goldmann DA, Mandl KD, et al. Health information management and perceptions of the quality of care for children with tracheotomy: a qualitative study. BMC Health Serv Res. 2011;11:117-125. PubMed
21. Berry JG, Ziniel SI, Freeman L, et al. Hospital readmission and parent perceptions of their child’s hospital discharge. Int J Qual Health Care. 2013;25(5):573-581. PubMed
22. Carusone SC, O’Leary B, McWatt S, Stewart A, Craig S, Brennan DJ. The Lived Experience of the Hospital Discharge “Plan”: A Longitudinal Qualitative Study of Complex Patients. J Hosp Med. 2017;12(1):5-10. PubMed
23. Leyenaar JK, O’Brien ER, Leslie LK, Lindenauer PK, Mangione-Smith RM. Families’ Priorities Regarding Hospital-to-Home Transitions for Children With Medical Complexity. Pediatrics. 2017;139(1):e20161581. doi:10.1542/peds.2016-1581. PubMed
Many hospitals are considering or currently employing initiatives to contact patients after discharge. Whether conducted via telephone or other means, the purpose of the contact is to help patients adhere to discharge plans, fulfill discharge needs, and alleviate postdischarge issues (PDIs). The effectiveness of hospital-initiated postdischarge phone calls has been studied in adult patients after hospitalization, and though some studies report positive outcomes,1-3 a 2006 Cochrane review found insufficient evidence to recommend for or against the practice.4
Little is known about follow-up contact after hospitalization for children.5-11 Rates of PDI vary substantially across hospitals. For example, one single-center study of postdischarge telephone contact after hospitalization on a general pediatric ward identified PDIs in ~20% of patients.10 Another study identified PDIs in 84% of patients discharged from a pediatric rehabilitation facility.11 Telephone follow-up has been associated with reduced health resource utilization and improved patient satisfaction for children discharged after an elective surgical procedure6 and for children discharged home from the emergency department.7-9
More information is needed on the clinical experiences of postdischarge contact in hospitalized children to improve the understanding of how the contact is made, who makes it, and which patients are most likely to report a PDI. These experiences are crucial to understand given the expense and time commitment involved in postdischarge contact, as many hospitals may not be positioned to contact all discharged patients. Therefore, we conducted a pragmatic, retrospective, naturalistic study of differing approaches to postdischarge contact occurring in multiple hospitals. Our main objective was to describe the prevalence and types of PDIs identified by the different approaches for follow-up contact across 4 children’s hospitals. We also assessed the characteristics of children who have the highest likelihood of having a PDI identified from the contact within each hospital.
METHODS
Study Design, Setting, and Population
Main Outcome Measures
The main outcome measure was identification of a PDI, defined as a medication, appointment, or other discharge-related issue, that was reported and recorded by the child’s caregiver during conversation from the standardized questions that were asked during follow-up contact as part of routine discharge care (Table 1). Medication PDIs included issues filling prescriptions and tolerating medications. Appointment PDIs included not having a follow-up appointment scheduled. Other PDIs included issues with the child’s health condition, discharge instructions, or any other concerns. All PDIs had been recorded prospectively by hospital contact personnel (hospitals A, B, and D) or through an automated texting system into a database (hospital C). Where available, free text comments that were recorded by contact personnel were reviewed by one of the authors (KB) and categorized via an existing framework of PDI designed by Heath et al.10 in order to further understand the problems that were reported.
Patient Characteristics
Patient hospitalization, demographic, and clinical characteristics were obtained from administrative health data at each institution and compared between children with versus without a PDI. Hospitalization characteristics included length of stay, season of admission, and reason for admission. Reason for admission was categorized by using 3M Health’s All Patient Refined Diagnosis Related Groups (APR-DRG) (3M, Maplewood, MN). Demographic characteristics included age at admission in years, insurance type (eg, public, private, and other), and race/ethnicity (Asian/Pacific Islander, Hispanic, non-Hispanic black, non-Hispanic white, and other).
Clinical characteristics included a count of the different classes of medications (eg, antibiotics, antiepileptic medications, digestive motility medications, etc.) administered to the child during admission, the type and number of chronic conditions, and assistance with medical technology (eg, gastrostomy, tracheostomy, etc.). Except for medications, these characteristics were assessed with International Classification of Diseases, Ninth Revision-Clinical Modification (ICD-9-CM) diagnosis codes.
We used the Agency for Healthcare Research and Quality Chronic Condition Indicator classification system, which categorizes over 14,000 ICD-9-CM diagnosis codes into chronic versus nonchronic conditions to identify the presence and number of chronic conditions.12 Children hospitalized with a chronic condition were further classified as having a complex chronic condition (CCC) by using the ICD-9-CM diagnosis classification scheme of Feudtner et al.13 CCCs represent defined diagnosis groupings of conditions expected to last longer than 12 months and involve either multiple organ systems or a single organ system severely enough to require specialty pediatric care and hospitalization.13,14 Children requiring medical technology were identified by using ICD-9-CM codes indicating their use of a medical device to manage and treat a chronic illness (eg, ventricular shunt to treat hydrocephalus) or to maintain basic body functions necessary for sustaining life (eg a tracheostomy tube for breathing).15,16
Statistical Analysis
Given that the primary purpose for this study was to leverage the natural heterogeneity in the approach to follow-up contact across hospitals, we assessed and reported the prevalence and type of PDIs independently for each hospital. Relatedly, we assessed the relationship between patient characteristics and PDI likelihood independently within each hospital as well rather than pool the data and perform a central analysis across hospitals. Of note, APR-DRG and medication class were not assessed for hospital D, as this information was unavailable. We used χ2 tests for univariable analysis and logistic regression with a backwards elimination derivation process (for variables with P ≥ .05) for multivariable analysis; all patient demographic, clinical, and hospitalization characteristics were entered initially into the models. All statistical analyses were performed using SAS version 9.3 (SAS Institute, Cary, NC), and P < .05 was considered statistically significant. This study was approved by the institutional review board at all hospitals.
RESULTS
Study Population
There were 12,986 (51.4%) of 25,259 patients reached by follow-up contact after discharge across the 4 hospitals. Median age at admission for contacted patients was 4.0 years (interquartile range [IQR] 0-11). Of those contacted, 45.2% were female, 59.9% were non-Hispanic white, 51.0% used Medicaid, and 95.4% were discharged to home. Seventy-one percent had a chronic condition (of any complexity) and 40.8% had a CCC. Eighty percent received a prescribed medication during the hospitalization. Median (IQR) length of stay was 2.0 days (IQR 1-4 days). The top 5 most common reasons for admission were bronchiolitis (6.3%), pneumonia (6.2%), asthma (5.2%), seizure (4.9%), and tonsil and adenoid procedures (4.1%).
PDIs
Characteristics Associated with PDIs
Age
Older age was a consistent characteristic associated with PDIs in 3 hospitals. For example, PDI rates in children 10 to 18 years versus <1 year were 30.8% versus 21.4% (P < .001) in hospital A, 19.4% versus 13.7% (P = .002) in hospital B, and 70.3% versus 62.8% (P < .001) in hospital D. In multivariable analysis, age 10 to 18 years versus <1 year at admission was associated with an increased likelihood of PDI in hospital A (odds ratio [OR] 1.7; 95% CI, 1.4-2.0), hospital B (OR 1.4; 95% CI, 1.1-1.8), and hospital D (OR 1.7; 95% CI, 0.9-3.0) (Table 3 and Figure).
Medications
Length of Stay
Shorter length of stay was associated with PDI in 1 hospital. In hospital A, the PDI rate increased significantly (P < .001) from 19.0% to 33.9% as length of stay decreased from ≥7 days to ≤1 day (Table 3). In multivariable analysis, length of stay to ≤1 day versus ≥7 days was associated with increased likelihood of PDI (OR 2.1; 95% CI, 1.7-2.5) in hospital A (Table 3 and Figure).
CCCs
A neuromuscular CCC was associated with PDI in 2 hospitals. In hospital B, the PDI rate was higher in children with a neuromuscular CCC compared with a malignancy CCC (21.3% vs 11.2%). In hospital D, the PDI rates were higher in children with a neuromuscular CCC compared with a respiratory CCC (68.9% vs 40.6%) (Table 3). In multivariable analysis, children with versus without a neuromuscular CCC had an increased likelihood of PDI (OR 1.3; 95% CI, 1.0-1.7) in hospital B (Table 3 and Figure).
DISCUSSION
In this retrospective, pragmatic, multicentered study of follow-up contact with a standardized set of questions asked after discharge for hospitalized children, we found that PDIs were identified often, regardless of who made the contact or how the contact was made. The PDI rates varied substantially across hospitals and were likely influenced by the different follow-up approaches that were used. Most PDIs were related to appointments; fewer PDIs were related to medications and other problems. Older age, shorter length of stay, and neuromuscular CCCs were among the identified risk factors for PDIs.
Our assessment of PDIs was, by design, associated with variation in methods and approach for detection across sites. Further investigation is needed to understand how different approaches for follow-up contact after discharge may influence the identification of PDIs. For example, in the current study, the hospital with the highest PDI rate (hospital D) used hospitalists who provided inpatient care for the patient to make follow-up contact. Although not determined from the current study, this approach could have led the hospitalists to ask questions beyond the standardized ones when assessing for PDIs. Perhaps some of the hospitalists had a better understanding of how to probe for PDIs specific to each patient; this understanding may not have been forthcoming for staff in the other hospitals who were unfamiliar with the patients’ hospitalization course and medical history.
Similar to previous studies in adults, our study reported that appointment PDIs in children may be more common than other types of PDIs.17 Appointment PDIs could have been due to scheduling difficulties, inadequate discharge instructions, lack of adherence to recommended follow-up, or other reasons. Further investigation is needed to elucidate these reasons and to determine how to reduce PDIs related to postdischarge appointments. Some children’s hospitals schedule follow-up appointments prior to discharge to mitigate appointment PDIs that might arise.18 However, doing that for every hospitalized child is challenging, especially for very short admissions or for weekend discharges when many outpatient and community practices are not open to schedule appointments. Additional exploration is necessary to assess whether this might help explain why some children in the current study with a short versus long length of stay had a higher likelihood of PDI.
The rate of medication PDIs (5.2%) observed in the current study is lower than the rate that is reported in prior literature. Dudas et al.1 found that medication PDIs occurred in 21% of hospitalized adult patients. One reason for the lower rate of medication PDIs in children may be that they require the use of postdischarge medications less often than adults. Most medication PDIs in the current study involved problems filling a prescription. There was not enough information in the notes taken from the follow-up contact to distinguish the medication PDI etiologies (eg, a prescription was not sent from the hospital team to the pharmacy, prior authorization from an insurance company for a prescription was not obtained, the pharmacy did not stock the medication). To help overcome medication access barriers, some hospitals fill and deliver discharge medications to the patients’ bedside. One study found that children discharged with medication in hand were less likely to have emergency department revisits within 30 days of discharge.19 Further investigation is needed to assess whether initiatives like these help mitigate medication PDIs in children.
Hospitals may benefit from considering how risk factors for PDIs can be used to prioritize which patients receive follow-up contact, especially in hospitals where contact for all hospitalized patients is not feasible. In the current study, there was variation across hospitals in the profile of risk factors that correlated with increased likelihood of PDI. Some of the risk factors are easier to explain than others. For example, as mentioned above, for some hospitalized children, short length of stay might not permit enough time for hospital staff to set up discharge plans that may sufficiently prevent PDIs. Other risk factors, including older age and neuromuscular CCCs, may require additional assessment (eg, through chart review or in-depth patient and provider interviews) to discover the reasons why they were associated with increased likelihood of PDI. There are additional risk factors that might influence the likelihood of PDI that the current study was not positioned to assess, including health literacy, transportation availability, and language spoken.20-23
This study has several other limitations in addition to the ones already mentioned. Some children may have experienced PDIs that were not reported at contact (eg, the respondent was unaware that an issue was present), which may have led to an undercounting of PDIs. Alternatively, some caregivers may have been more likely to respond to the contact if their child was experiencing a PDI, which may have led to overcounting. PDIs of nonrespondents were not measured. PDIs identified by postdischarge outpatient and community providers or by families outside of contact were not measured. The current study was not positioned to assess the severity of the PDIs or what interventions (including additional health services) were needed to address them. Although we assessed medication use during admission, we were unable to assess the number and type of medications that were prescribed for use postdischarge. Information about the number and type of follow-up visits needed for each child was not assessed. Given the variety of approaches for follow-up contact, the findings may generalize best to individual hospitals by using an approach that best matches to one of them. The current study is not positioned to correlate quality of discharge care with the rate of PDI.
Despite these limitations, the findings from the current study reinforce that PDIs identified through follow-up contact in discharged patients appear to be common. Of PDIs identified, appointment problems were more prevalent than medication or other types of problems. Short length of stay, older age, and other patient and/or hospitalization attributes were associated with an increased likelihood of PDI. Hospitals caring for children may find this information useful as they strive to optimize their processes for follow-up contact after discharge. To help further evaluate the value and importance of contacting patients after discharge, additional study of PDI in children is warranted, including (1) actions taken to resolve PDIs, (2) the impact of identifying and addressing PDIs on hospital readmission, and (3) postdischarge experiences and health outcomes of children who responded versus those who did not respond to the follow-up contact. Moreover, future multisite, comparative effectiveness studies of PDI may wish to consider standardization of follow-up contact procedures with controlled manipulation of key processes (eg, contact by administrator vs nurse vs physician) to assess best practices.
Disclosure
Mr. Blaine, Ms. O’Neill, and Drs. Berry, Brittan, Rehm, and Steiner were supported by the Lucile Packard Foundation for Children’s Health. The authors have no financial relationships relative to this article to disclose. The authors have no conflicts of interest to disclose.
1. Dudas V, Bookwalter T, Kerr KM, Pantilat SZ. The impact of follow-up telephone calls to patients after hospitalization. Dis Mon. 2002;48(4):239-248. PubMed
2. Sanchez GM, Douglass MA, Mancuso MA. Revisiting Project Re-Engineered Discharge (RED): The Impact of a Pharmacist Telephone Intervention on Hospital Readmission Rates. Pharmacotherapy. 2015;35(9):805-812. PubMed
3. Jones J, Clark W, Bradford J, Dougherty J. Efficacy of a telephone follow-up system in the emergency department. J Emerg Med. 1988;6(3):249-254. PubMed
4. Mistiaen P, Poot E. Telephone follow-up, initiated by a hospital-based health professional, for postdischarge problems in patients discharged from hospital to home. Cochrane Database Syst Rev. 2006(4):CD004510. PubMed
5. Lushaj EB, Nelson K, Amond K, Kenny E, Badami A, Anagnostopoulos PV. Timely Post-discharge Telephone Follow-Up is a Useful Tool in Identifying Post-discharge Complications Patients After Congenital Heart Surgery. Pediatr Cardiol. 2016;37(6):1106-1110. PubMed
6. McVay MR, Kelley KR, Mathews DL, Jackson RJ, Kokoska ER, Smith SD. Postoperative follow-up: is a phone call enough? J Pediatr Surg. 2008;43(1):83-86. PubMed
7. Chande VT, Exum V. Follow-up phone calls after an emergency department visit. Pediatrics. 1994;93(3):513-514. PubMed
8. Sutton D, Stanley P, Babl FE, Phillips F. Preventing or accelerating emergency care for children with complex healthcare needs. Arch Dis Child. 2008;93(1):17-22. PubMed
9. Patel PB, Vinson DR. Physician e-mail and telephone contact after emergency department visit improves patient satisfaction: a crossover trial. Ann Emerg Med. 2013;61(6):631-637. PubMed
10. Heath J, Dancel R, Stephens JR. Postdischarge phone calls after pediatric hospitalization: an observational study. Hosp Pediatr. 2015;5(5):241-248. PubMed
11. Biffl SE, Biffl WL. Improving transitions of care for complex pediatric trauma patients from inpatient rehabilitation to home: an observational pilot study. Patient Saf Surg. 2015;9:33-37. PubMed
12. AHRQ. Clinical Classifications Software (CCS) for ICD-9-CM. http://www.hcup-us.ahrq.gov/toolssoftware/ccs/ccs.jsp. Accessed on January 31,2012.
13. Feudtner C, Christakis DA, Connell FA. Pediatric deaths attributable to complex chronic conditions: a population-based study of Washington State, 1980-1997. Pediatrics. 2000;106(1 Pt 2):205-209. PubMed
14. Berry JG, Hall DE, Kuo DZ, et al. Hospital utilization and characteristics of patients experiencing recurrent readmissions within children’s hospitals. JAMA. 2011;305(7):682-690. PubMed
15. Palfrey JS, Walker DK, Haynie M, et al. Technology’s children: report of a statewide census of children dependent on medical supports. Pediatrics. 1991;87(5):611-618. PubMed
16. Feudtner C, Villareale NL, Morray B, Sharp V, Hays RM, Neff JM. Technology-dependency among patients discharged from a children’s hospital: a retrospective cohort study. BMC Pediatr. 2005;5(1):8-15. PubMed
17. Arora VM, Prochaska ML, Farnan JM, et al. Problems after discharge and understanding of communication with their primary care physicians among hospitalized seniors: a mixed methods study. J Hosp Med. 2010;5(7):385-391. PubMed
18. Brittan M, Tyler A, Martin S, et al. A Discharge Planning Template for the Electronic Medical Record Improves Scheduling of Neurology Follow-up for Comanaged Seizure Patients. Hosp Pediatr. 2014;4(6):366-371. PubMed
19. Hatoun J, Bair-Merritt M, Cabral H, Moses J. Increasing Medication Possession at Discharge for Patients With Asthma: The Meds-in-Hand Project. Pediatrics. 2016;137(3):e20150461. doi:10.1542/peds.2015-0461. PubMed
20. Berry JG, Goldmann DA, Mandl KD, et al. Health information management and perceptions of the quality of care for children with tracheotomy: a qualitative study. BMC Health Serv Res. 2011;11:117-125. PubMed
21. Berry JG, Ziniel SI, Freeman L, et al. Hospital readmission and parent perceptions of their child’s hospital discharge. Int J Qual Health Care. 2013;25(5):573-581. PubMed
22. Carusone SC, O’Leary B, McWatt S, Stewart A, Craig S, Brennan DJ. The Lived Experience of the Hospital Discharge “Plan”: A Longitudinal Qualitative Study of Complex Patients. J Hosp Med. 2017;12(1):5-10. PubMed
23. Leyenaar JK, O’Brien ER, Leslie LK, Lindenauer PK, Mangione-Smith RM. Families’ Priorities Regarding Hospital-to-Home Transitions for Children With Medical Complexity. Pediatrics. 2017;139(1):e20161581. doi:10.1542/peds.2016-1581. PubMed
© 2018 Society of Hospital Medicine
Major General David N.W. Grant: An Early Leader in Air Force Medicine
The U.S. Air Force Medical Center at Travis Air Force Base near Fairfield, California, is named in honor of Major General David Norvell Walker Grant, considered by many to be the father of the U.S. Air Force Medical Service. The first legacy organization of the U.S. Air Force was created within the U.S. Army in 1907 (Aeronautical Division, Signal Corps). Through a succession of evolutionary, organizational, and mission changes over 40 years, it became an independent service when the National Security Act of 1947 created the Department of the Air Force. Grant spent most of his career in the predecessor organizations, the U.S. Army Air Corps (1926-1941) and U.S. Army Air Forces (1941-1947). 
A native Virginian, Grant graduated from the University of Virginia School of Medicine in 1915 and joined the Army Medical Corps in 1916. His service in World War I included assignments in Panama and within the continental U.S. From 1919 to 1922, he served in Germany in the Army of Occupation. Grant’s aviation medicine career began in 1931 when he attended the School of Aviation Medicine. After he completed the 6-month course, he was stationed at Randolph Field, Texas, for 5 years. In 1937, after more than a decade as a major, he was promoted to lieutenant colonel. He completed the Air Force Tactical School that same year.
In 1939, Grant became chief of the Medical Division, Office of the Chief of the Air Corps in Washington, DC. On creation of the U.S. Army Air Forces in 1941, he was appointed air surgeon and served in this capacity throughout World War II. He was promoted to colonel in 1941, brigadier general in 1942, and major general in 1943.
Early in preparations for war, Grant recognized that the medical needs of an air force differed significantly from those of large land armies. He and others were successful in their fight to establish a separate medical service for the air forces. During World War II, the U.S. Army Air Forces consisted of 2.4 million personnel and more than 80,000 aircraft. Today the U.S. Air Force has about 320,000 personnel who support and operate about 5,500 aircraft.
Grant was one of the first to understand the need for aeromedical evacuation and was responsible for its organization and operation in World War II. He also was instrumental in the establishment of the Convalescent Rehabilitation Program to help restore the wounded, ill, and injured to full capacity for further service or for their return to the civilian world.
The development and training of flight nurses were inherent in the aeromedical evacuation program. In 1943, the first class of flight nurses graduated from the U.S. Army Air Force School of Air Evacuations at Bowman Field, Kentucky. Second Lieutenant Geraldine Dishroon of Tulsa, Oklahoma, was the honor graduate in her class of 39 students. As she was to receive the first wings presented to a flight nurse, Grant removed his flight surgeon wings and pinned them on Lieutenant Dishroon as a sign of respect for her and the other new flight nurses. In 1944, Lieutenant Dishroon landed with the first air evacuation team on Omaha Beach after the D-Day invasion.
Under Grant’s leadership and guidance, aviation psychologists developed comprehensive mass testing procedures for selecting and classifying potential aircrew members, based on aptitude, personality, and interest. After 3 decades on active duty, Grant retired in 1946 and became medical director for the American Red Cross and national director of the Red Cross Blood Program.
In 1966, 2 years after Grant died, the 4167th Station Hospital at Travis Air Force Base was renamed the David Grant U.S. Air Force Medical Center in his honor.
About this column
This column provides biographical sketches of the namesakes of military and VA health care facilities. To learn more about the individual your facility was named for or to offer a topic suggestion, contact us at [email protected] or on Facebook.
The U.S. Air Force Medical Center at Travis Air Force Base near Fairfield, California, is named in honor of Major General David Norvell Walker Grant, considered by many to be the father of the U.S. Air Force Medical Service. The first legacy organization of the U.S. Air Force was created within the U.S. Army in 1907 (Aeronautical Division, Signal Corps). Through a succession of evolutionary, organizational, and mission changes over 40 years, it became an independent service when the National Security Act of 1947 created the Department of the Air Force. Grant spent most of his career in the predecessor organizations, the U.S. Army Air Corps (1926-1941) and U.S. Army Air Forces (1941-1947).
A native Virginian, Grant graduated from the University of Virginia School of Medicine in 1915 and joined the Army Medical Corps in 1916. His service in World War I included assignments in Panama and within the continental U.S. From 1919 to 1922, he served in Germany in the Army of Occupation. Grant’s aviation medicine career began in 1931 when he attended the School of Aviation Medicine. After he completed the 6-month course, he was stationed at Randolph Field, Texas, for 5 years. In 1937, after more than a decade as a major, he was promoted to lieutenant colonel. He completed the Air Force Tactical School that same year.
In 1939, Grant became chief of the Medical Division, Office of the Chief of the Air Corps in Washington, DC. On creation of the U.S. Army Air Forces in 1941, he was appointed air surgeon and served in this capacity throughout World War II. He was promoted to colonel in 1941, brigadier general in 1942, and major general in 1943.
Early in preparations for war, Grant recognized that the medical needs of an air force differed significantly from those of large land armies. He and others were successful in their fight to establish a separate medical service for the air forces. During World War II, the U.S. Army Air Forces consisted of 2.4 million personnel and more than 80,000 aircraft. Today the U.S. Air Force has about 320,000 personnel who support and operate about 5,500 aircraft.
Grant was one of the first to understand the need for aeromedical evacuation and was responsible for its organization and operation in World War II. He also was instrumental in the establishment of the Convalescent Rehabilitation Program to help restore the wounded, ill, and injured to full capacity for further service or for their return to the civilian world.
The development and training of flight nurses were inherent in the aeromedical evacuation program. In 1943, the first class of flight nurses graduated from the U.S. Army Air Force School of Air Evacuations at Bowman Field, Kentucky. Second Lieutenant Geraldine Dishroon of Tulsa, Oklahoma, was the honor graduate in her class of 39 students. As she was to receive the first wings presented to a flight nurse, Grant removed his flight surgeon wings and pinned them on Lieutenant Dishroon as a sign of respect for her and the other new flight nurses. In 1944, Lieutenant Dishroon landed with the first air evacuation team on Omaha Beach after the D-Day invasion.
Under Grant’s leadership and guidance, aviation psychologists developed comprehensive mass testing procedures for selecting and classifying potential aircrew members, based on aptitude, personality, and interest. After 3 decades on active duty, Grant retired in 1946 and became medical director for the American Red Cross and national director of the Red Cross Blood Program.
In 1966, 2 years after Grant died, the 4167th Station Hospital at Travis Air Force Base was renamed the David Grant U.S. Air Force Medical Center in his honor.
About this column
This column provides biographical sketches of the namesakes of military and VA health care facilities. To learn more about the individual your facility was named for or to offer a topic suggestion, contact us at [email protected] or on Facebook.

Recommendations on the Use of Ultrasound Guidance for Adult Thoracentesis: A Position Statement of the Society of Hospital Medicine
Approximately 1.5 million people develop a pleural effusion in the United States annually, and approximately 173,000 people (12%) undergo thoracentesis.1 A recent review of thoracenteses performed at 234 University Health System Consortium hospitals between January 2010 and September 2013 demonstrated that 16% of 132,472 thoracenteses were performed by general internists and hospitalists, 33.1% were performed by interventional radiologists, and 20.3% were performed by pulmonologists.2 The iatrogenic pneumothorax rate was not significantly different between interventional radiologists and internists (2.8% and 2.9% risk, respectively); however, the admissions associated with bedside thoracentesis were less expensive than the admissions associated with thoracentesis performed in radiology suites, even after controlling for clinical covariates.2 In addition, the use of ultrasound guidance has been associated with a reduced risk of complications and cost of thoracentesis.3,4 In most of the early published studies on ultrasound-guided thoracentesis, the procedures were performed by radiologists.5-12 However, in 2010, the British Thoracic Society published guidelines on pleural procedures and thoracic ultrasound geared toward any trained provider.13 The purpose of this guideline is to review the literature and present evidence-based recommendations on the performance of ultrasound-guided thoracentesis at the bedside.
METHODS
Detailed methods are described in Appendix 1. The Society of Hospital Medicine (SHM) Point-of-care Ultrasound (POCUS) Task Force was assembled to carry out this guideline development project under the direction of the SHM Board of Directors, Director of Education, and Education Committee. All expert panel members were physicians or advanced practice providers with expertise in POCUS. The expert panel members were divided into working group members, external peer reviewers, and a methodologist. All the Task Force members were required to disclose any potential conflicts of interests (Appendix 2). The literature search was conducted in two independent phases. The first phase included literature searches conducted by the four working group members themselves. Key clinical questions were prepared prior to conducting a systematic literature search by a medical librarian. The Medline, Embase, CINAHL, and Cochrane medical databases were searched from 1975 to September 2015 initially. Updated searches were conducted in November 2016 and in August 2017 (Appendix 3). All article abstracts were first screened for relevance by at least two members of the working group. Full-text versions of the screened articles were reviewed, and the articles focusing on the use of ultrasound to guide thoracentesis were selected. Articles that discussed thoracentesis without ultrasound guidance were excluded. In addition, the following article types were excluded: non-English language, nonhuman, subjects’ age <18 years, meeting abstracts, meeting posters, letters, and editorials. All relevant systematic reviews, meta-analyses, randomized controlled trials, and observational studies of ultrasound-guided thoracentesis were screened and selected. Final article selection was based on working group consensus, and the selected literature was incorporated into draft recommendations.
We used the RAND Appropriateness Method that required panel judgment and consensus.14 The 30 voting members of the SHM POCUS Task Force reviewed and voted on the draft recommendations considering the following five transforming factors: 1) Problem priority and importance, 2) Level of quality of evidence, 3) Benefit/harm balance, 4) Benefit/burden balance, and 5) Certainty/concerns about PEAF (Preferences/Equity Acceptability/Feasibility). Panel members participated in two rounds of electronic voting using an internet-based electronic data collection tool (Redcap™) in December 2016 and January 2017 (Appendix 4). Voting on appropriateness was conducted using a 9-point Likert scale, and the degree of consensus was assessed using the RAND algorithm. Establishing a recommendation required at least 70% agreement and a strong recommendation required 80% agreement according to the RAND rules (Appendix 1, Figure 1). Disagreement was defined as >30% of panelists voting outside of the zone of the median (appropriate, uncertain, inappropriate).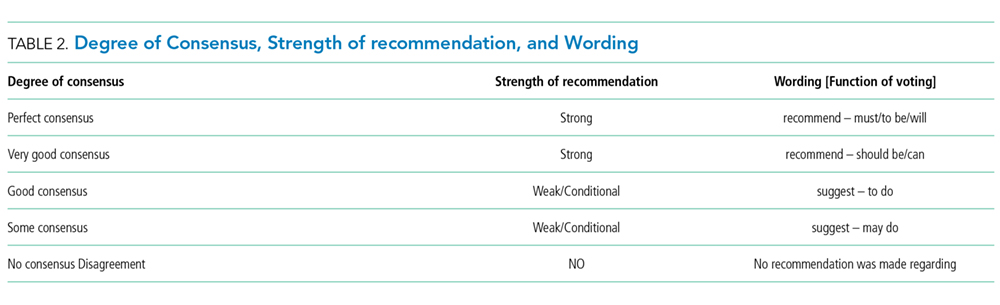
RESULTS
Literature search
A total of 1,556 references were pooled from the following four different sources: a search by a certified librarian in September 2015 (1066 citations) that was updated in November 2016 (165 citations) and again in August 2017 (9 citations), working group members’ literature searches (47 citations), and a search focused on training (269 citations). The final selection included 94 articles that were abstracted into a data table and incorporated into the draft recommendations. The details of the literature search strategy are given in Appendix 3.
Recommendations
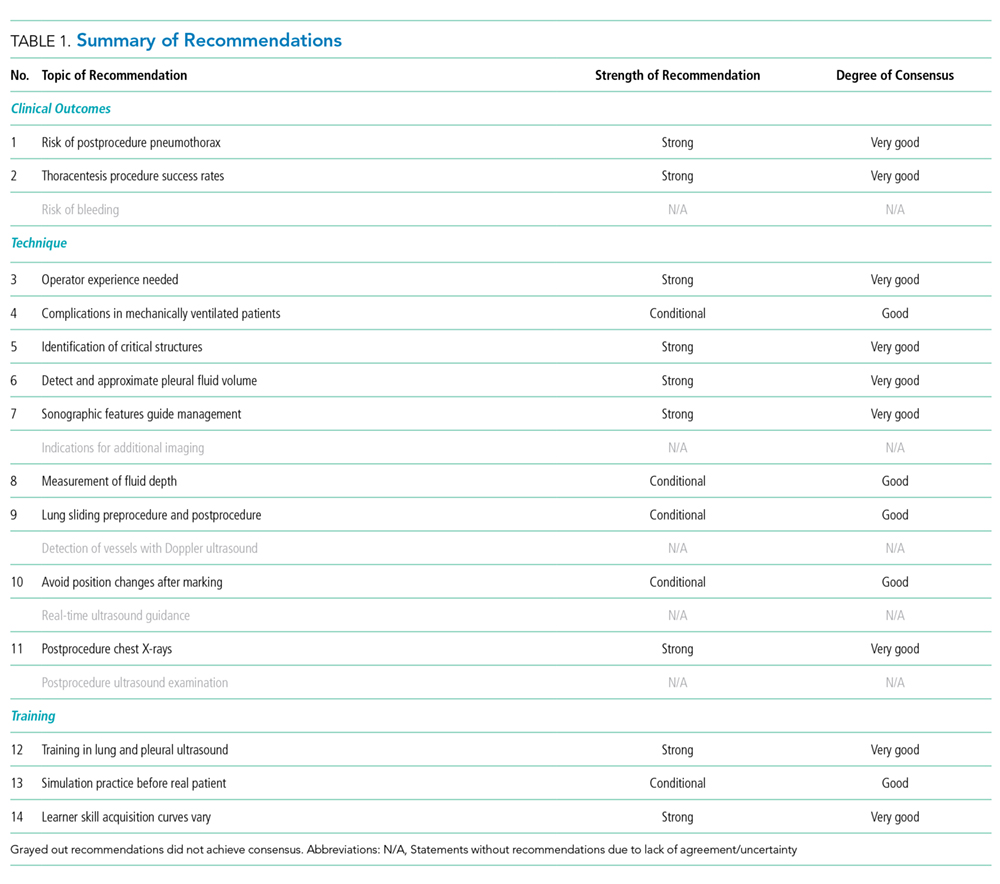
Terminology
- Thoracentesis is a procedure of aspiration of fluid from the pleural space by percutaneous insertion of a needle through the chest wall with or without the insertion of a catheter.
- In this document, ultrasound guidance refers to static guidance and site marking performed at the bedside immediately before the procedure, as opposed to real-time (dynamic) ultrasound guidance or radiology performed site marking. The static method is the most commonly used method of ultrasound guidance and is supported by current evidence.
RECOMMENDATIONS
Clinical Outcomes
1.We recommend that ultrasound should be used to guide thoracentesis to reduce the risk of complications, the most common being pneumothorax.
Rationale: Both static ultrasound guidance and dynamic ultrasound guidance have been reported to be associated with a reduced risk of pneumothorax.4-7,15-18 A meta-analysis of 24 studies that included 6,605 thoracenteses showed a significant decrease in the risk of postprocedure pneumothorax with the use of ultrasound guidance compared to the risk associated with thoracentesis performed based on landmarks alone (OR 0.3, 95% CI 0.2–0.7).3 The meta-analysis included both prospective and retrospective studies conducted using both static and dynamic ultrasound guidance.3 A large retrospective cohort study conducted by Mercaldi et al. comprising more than 61,000 patients who underwent thoracentesis also showed that ultrasound guidance was associated with reduced odds of pneumothorax (OR 0.8 [0.7–0.9]).4 When pneumothorax did occur during that hospitalization, the cost of hospitalization increased by $2800 and the length of stay increased by 1.5 days.4 A 2008 review of 19,339 thoracenteses conducted by Patel et al. also demonstrated an association between ultrasound guidance and reduced odds of pneumothorax (OR 0.8 [0.7–0.96]).18 Although these findings were significant, it is important to note that the studies of both Mercaldi et al. and Patel et al. were reviews of administrative databases conducted using the International Classification of Diseases, 9th Revision (ICD-9) codes for thoracentesis and Current Procedure Terminology–4th edition (CPT) codes for the use of ultrasound.4,18 Patel et al. identified pneumothorax using ICD-9 codes for “pneumothorax–iatrogenic” and “pneumothorax–not specified as due to the procedure.” The association between ultrasound guidance and the reduced odds of pneumothorax was driven by the latter code.18 However, as with most retrospective studies using administrative data, granular data about the patients, procedure, proceduralists, and complications were not available in these reviews and conclusions may be limited by erroneous coding or documentation.4,18 In a third retrospective cohort study, Raptopoulos et al. compared 154 landmark-based thoracenteses performed by “clinical physicians” and 188 ultrasound-guided thoracenteses performed by radiologists and found that ultrasound-guided site selection reduced the rate of pneumothorax from 18% to 3% (P < .0001).6 Finally, one single-center randomized controlled trial of 160 thoracenteses performed by pulmonologists showed that ultrasound guidance reduced the relative risk of pneumothorax by 90% (12.5% vs 1.3%; P =.009) with a number needed to treat of 9.15 It was not possible to blind the operators to the use of ultrasound guidance, but the data analysis was blinded.15 Furthermore, while there was no explicit comparison of the intervention vs. the control groups, randomization would have presumably rendered both groups similar in terms of patient characteristics and effusion characteristics.15 Ultrasound may reduce the risk of pneumothorax through several mechanisms, including identifying patients in whom thoracentesis cannot be safely performed, allowing selection of the safest needle insertion site, and revealing the optimal depth of needle insertion.
2.We recommend that ultrasound guidance should be used to increase the success rate of thoracentesis.
Rationale: Thoracentesis guided by ultrasound has lower rates of failed attempts, or “dry taps,” compared to thoracentesis guided solely by physical examination. In 1977, Ravin described a method of using ultrasound to guide successful drainage of six complex pleural effusions (empyema or loculated effusion) after multiple (5–7) failed attempts by clinicians using physical examination alone.8 In a second study by radiologists, Weingardt et al. demonstrated that 20 of 26 failed landmark-based thoracenteses were due to incorrect site selection by physical examination–15 sites were below the diaphragm and 5 sites were above the pleural effusion or in the consolidated lung–and the use of ultrasound allowed successful sampling in 14 of 16 patients who had a failed landmark-based thoracentesis.9 Diacon et al. asked 30 physicians, ranging from junior housestaff to pulmonologists, to mark 172 potential thoracentesis sites in 67 patients with pleural effusions using physical examination alone. Ultrasound was then used to evaluate the proposed puncture sites. They found that using ultrasound would have avoided puncture on “dry chests” in 2% and avoided potential laceration of a solid organ in 10% of patients compared to site selection by physical examination alone.19 Finally, Perazzo et al. randomized 160 patients to landmark-based thoracentesis and ultrasound-guided thoracentesis and demonstrated that half of the eight dry taps that occurred in the control group could be successfully drained using subsequent ultrasound guidance.15
Technique
3. We recommend that ultrasound-guided thoracentesis should be performed or closely supervised by experienced operators.
Rationale: Current evidence suggests lower complication rates when thoracentesis is performed by experienced healthcare providers. A systematic review of 6,605 thoracenteses showed a significantly lower pneumothorax rate when thoracentesis was performed by pulmonology or radiology faculty versus resident physicians (3.9% vs 8.5%; P =.04), although this finding was not significant in the four studies that directly compared this factor.3 In a quality improvement study performed by Duncan et al., pulmonology and critical care physicians combining multiple quality improvement initiatives to achieve and maintain competency decreased the rate of pneumothorax from 8.6% to 1.1% (P =.0034).20 Interventions included ultrasound training, performance of 10 thoracenteses under expert supervision, and restriction of privileges to proceduralists who perform 10 or more thoracenteses per year.20 Finally, a series of 9,320 ultrasound-guided thoracenteses performed or supervised by a single expert internist over a period of 12 years resulted in a pneumothorax rate of 0.6% and a composite complication rate of 0.98% (pneumothorax, reexpansion pulmonary edema, hemothorax, site bleeding, hematoma, splenic laceration, and vasovagal reaction).21 Notably, pneumothorax rate in resident physician hands was reported to be 8.5% in the meta-analysis performed by Gordon et al., which is similar to the initial rate in the pulmonologists who participated in the study by Duncan et al.3,20 However, after instituting formal ultrasound training and other initiatives aimed at maintaining competency, the pneumothorax rate in the study by Duncan et al. decreased to 1.1%, similar to the rate observed in the series by Ault et al.21 This suggests that training and supervision are necessary to achieve competency and reduce the rate of complications.3,20,21
4. We suggest that ultrasound guidance be used to reduce the risk of complications from thoracentesis in mechanically ventilated patients.
Rationale: The rest of this guideline refers to ultrasound-guided thoracentesis performed in spontaneously breathing patients; however, this recommendation is specific to mechanically ventilated patients. Two prospective observational studies have shown no increase in complications when ultrasound-guided thoracentesis is performed on mechanically ventilated patients compared to patients not receiving positive pressure ventilation. A feasibility study of 45 thoracenteses performed on ventilated patients reported no complications,22 whereas another study on 232 patients reported a pneumothorax rate of 1.3%.23 In a larger study conducted by Mayo et al., medicine housestaff performed thoracentesis under the supervision of intensivists who had undergone training in ultrasound prior to performing the procedure.23 In both studies, most of the patients were in a supine position, although positioning and puncture site were at the discretion of the physician, and both studies employed use of static ultrasound guidance.22,23 A large series of 9,320 ultrasound-guided thoracenteses that included 1,377 mechanically ventilated patients did not report a higher rate of pneumothorax (0.8%) compared to that in spontaneously breathing patients (0.61%).21 Finally, a meta-analysis of 19 observational studies comprising 1,124 mechanically ventilated patients who underwent pleural drainage procedures showed a low rate of pneumothorax (3.4%) and hemothorax (1.9%).24 Although the rate of complication was reported to be low in this meta-analysis, ultrasound was not employed in all studies and its use was not associated with a significant reduction in pneumothorax.24 This may be because 8 of the 19 studies used pigtail catheters or large-bore thoracostomy tubes which treat pneumothorax as they occur.24
5. We recommend that ultrasound should be used to identify the chest wall, pleura, diaphragm, lung, and subdiaphragmatic organs throughout the respiratory cycle before selecting a needle insertion site.
Rationale: The use of ultrasound improves the selection of a safe needle insertion site because sites chosen without ultrasound guidance may be below the diaphragm, over solid organs,9,19 or in locations that risk puncture of the lung.9 Visualization of the chest wall, diaphragm, and lung, which define the boundaries of a pleural effusion, allows the clinician to confirm the presence of a drainable pleural effusion and assess for other pathologies, such as ascites and tumor, that may be mistaken for a pleural effusion.22,25,26 Hypoechoic lesions can represent small loculated pleural effusions but also pleural plaques, pleural masses, peripheral lung masses, or abscesses.27,28
6. We recommend that ultrasound should be used to detect the presence or absence of an effusion and approximate the volume of pleural fluid to guide clinical decision-making.
Rationale: The presence and approximate size of pleural fluid collections are important determinants of whether thoracentesis, another procedure, or no procedure should be performed. Ultrasonography has higher sensitivity and specificity for detecting pleural effusions and better differentiates effusions from consolidations compared with chest radiography.29-42 Ultrasound allows semiquantitative estimation of pleural fluid volume to determine whether thoracentesis should be performed.41-45 When using ultrasound to choose a site for thoracentesis, the British Thoracic Society Pleural Disease guidelines recommend ≥10 mm of pleural fluid between the visceral and parietal pleura.13 Pleural effusions of <10–15 mm are considered too small to tap.22,23 In a prospective study of 45 patients, a measurement of >9.9 cm by ultrasound between the chest wall and the “V-point,” the intersection of the diaphragm and the collapsed lung, correlated with a pleural fluid volume of >1 liter.46 Another prospective study of 73 patients showed that a pleural effusion spanning >3 intercostal spaces by ultrasound also correlated with a pleural fluid volume of >1 liter.47 Anticipating the volume of fluid to be removed may aid in preplanning and procurement of larger capacity drainage containers prior to starting the procedure. Lung ultrasound can also change the management if the characteristic of the effusion suggests that an invasive procedure is unsafe or another diagnostic or therapeutic option is more appropriate.39 In a prospective cohort study of 189 mechanically ventilated patients, lung ultrasound guided the management in all patients with suspected effusion, leading to chest tube placement in 7 patients and thoracentesis in 34 patients.48
7. We recommend that ultrasound should be used to detect complex sonographic features, such as septations, to guide clinical decision-making regarding the timing and method of pleural drainage.
Rationale: Pleural effusions can be broadly categorized sonographically as simple or complex. Complex effusions are further categorized as with or without septation. Simple effusions are anechoic and are often, but not invariably, transudative.49-51 The use of sonography and computerized tomography (CT) is complementary, but features of complex pleural effusions (fibrin stranding and septations) may be better visualized by ultrasound than by CT of the thorax.52 Detection of complex features should prompt the consideration of pleural fluid sampling.53,54 Exudative effusions from tuberculosis, malignancy, or other etiologies more often include debris, septations, or other complex features.55,56 Certain features such as a swirling debris, pleural thickening, and nodularity may be more often associated with malignancy,54,56 and advanced ultrasound techniques may be used to detect a trapped lung prior to attempting drainage of a malignant pleural effusion.57 Two studies found complex septated pleural effusions to be invariably exudative50,58 and drainage was unlikely to be successful without the placement of a chest tube.50,58-60 Chest tube placement through fibrinolytic administration or video-assisted thoracoscopic surgery (VATS) may be more appropriate in the management of complex septated pleural effusions,59-61 and expert consultation with a thoracic specialist is recommended in these cases.
8. We suggest that ultrasound can be used to measure the depth from the skin surface to the parietal pleura to help select an appropriate length needle and determine the maximum needle insertion depth.
Rationale: The distance from the skin to the parietal and visceral pleura can be measured by ultrasound to determine whether thoracentesis can be safely performed and to guide selection of an adequate length needle.38 The length of needle required to penetrate the pleural space varies based on the thickness of the chest wall. Percussion of the chest wall is limited when there is more than 6 cm of subcutaneous tissue,62 making physical examination in obese patients unreliable for selecting an appropriate site or needle length for thoracentesis. Ultrasound allows visualization of deep soft tissues, well beyond the limits of percussion, and allows an accurate measurement of the chest wall.63
9. We suggest that ultrasound can be used to evaluate normal lung sliding pre- and postprocedure to rule out pneumothorax.
Rationale: Normal lung sliding indicates normal apposition and movement of visceral and parietal pleura and rules out pneumothorax with a sensitivity that exceeds that of chest radiography, according to a meta-analysis of 20 studies using computed tomography or escape of intrapleural air at the time of drainage as the gold standard.64 In this meta-analysis, the pooled sensitivity of ultrasound was reported to be 88% (85-91%) compared to 52% (49-55%) for radiography, although the analysis also suggests that the test characteristics are dependent on operator skill.64 However, although lung sliding rules out pneumothorax, absence of lung sliding is not specific for pneumothorax and other conditions, including pleural adhesions, pleurodesis, and bronchial obstruction, can cause the absence of lung sliding.64 Detection of a lung point conclusively rules in a pneumothorax.65 Provided that the preprocedure lung ultrasound examination revealed normal lung sliding, a postprocedure examination can be performed to effectively evaluate for pneumothorax. This modality does not use ionizing radiation, is less expensive than computed tomography, can be performed faster than bedside chest radiography, and is more sensitive than supine or upright chest radiography.64,66-71
10. We suggest avoiding delay or interval change in patient position between the time of marking the needle insertion site and performing the thoracentesis.
Rationale: Optimal patient positioning and ultrasound-guided site marking should be performed by the primary operator immediately before beginning an invasive procedure. Remote sonographic localization in which a radiologist marks a needle insertion site using ultrasound and the thoracentesis is performed at a later time by a different provider is an antiquated practice. Two early studies demonstrated that this practice is no safer than landmark-based thoracentesis.6,72 One prospective study of 205 patients performed in 1986 showed no significant decrease in the incidence of complications from thoracentesis performed using remote sonographic localization versus landmark-based drainage.72 Complications in that study included a total of 22 pneumothoraces and 1 hematoma. The rate of complications in the group of patients who had site marking performed by radiology faculty and subsequent thoracentesis by medicine housestaff or attending physicians was 9.7% versus a complication rate of 12.7% in the landmark-based group.72 In addition, Raptopoulos et al. observed no significant difference in the pneumothorax rate between 106 patients with landmark-based thoracenteses and 48 patients who were sonographically marked by radiology faculty and then returned to the ward for completion of the thoracentesis by medicine housestaff (19% vs. 15%, respectively).6 Both groups had significantly higher rates of pneumothorax compared to those who underwent thoracentesis performed using real-time ultrasound guidance by radiology trainees (3%).6 The authors speculated that changing the patient’s position shifted the position of the pleural effusion, ultimately leading to the reliance on physical examination for the tap site.6
11. We recommend against performing routine postprocedure chest radiographs in patients who have undergone thoracentesis successfully with ultrasound guidance and are asymptomatic with normal lung sliding postprocedure.
Rationale: Chest radiography post-thoracentesis is unlikely to add information that changes management, especially if performed routinely, but does add expense, radiation, and inconvenience.73 The most common serious complication of thoracentesis is pneumothorax, which is often accompanied by symptoms, particularly in those patients with pneumothorax large enough to warrant chest tube placement.10,74,75 Pihlajamaa et al. retrospectively studied 264 ultrasound-guided thoracenteses performed by radiologists or radiology residents and noted that of 11 pneumothoraces, only 1 necessitated chest tube placement.10 Aleman et al. prospectively studied 506 ultrasound-guided and physical examination-guided thoracenteses and found that only 1% of asymptomatic patients developed a pneumothorax.74 Eight of the 18 symptomatic patients required chest tube placement as opposed to 1 of the 488 asymptomatic patients.74 A large prospective study of 941 ultrasound-guided thoracentesis reported that only 0.3% of asymptomatic patients with no suspicion of pneumothorax required tube thoracostomy.5 Postprocedure chest radiographs may be considered when thoracentesis is performed on mechanically ventilated patients, particularly when high airway pressures exist. In a study of 434 patients undergoing thoracentesis, only 10 patients had a pneumothorax (2.3%).11 Six of these pneumothoraces occurred in 92 mechanically ventilated patients (6.5%), and 2 of these 6 patients required a chest tube.11 None of the 4 spontaneously breathing patients with pneumothorax required a chest tube.11
Training
12. We recommend that novices who use ultrasound guidance for thoracentesis should receive focused training in lung and pleural ultrasonography and hands-on practice in procedural technique.
Rationale: Healthcare providers have to gain various skills to safely perform ultrasound-guided thoracentesis independently. Trainees should learn how to use ultrasound to identify important structures (chest wall, ribs, lung, pleura, diaphragm, and subdiaphragmatic organs); detect pleural effusions with complex features, such as septations; identify consolidated lung tissue; and rule out a pneumothorax. Prospective studies done with novice learners have shown that focused training combining didactics and hands-on practice using simulation or live models improves skills to assess pleural effusions.76-84 Several additional procedural techniques such as patient positioning and needle insertion are also important but are beyond the scope of these guidelines.
13. We suggest that novices undergo simulation-based training prior to performing ultrasound-guided thoracentesis on patients.
Rationale: Simulation-based training for thoracentesis has been studied in providers with different levels of medical training, ranging from medical students and internal medicine residents to practicing pulmonologists. Studies suggest that training in a zero-risk environment with simulation task trainers leads to increased knowledge and skills without subjecting the patients to inexperienced operators.85-87 One study on simulator-based training in medical students showed skill retention at 6 months and these skills were at least partially transferred to increased competency on live patients.88 Checklists to train providers in ultrasound-guided thoracentesis have been published.89,90 An experiential training program for attending physicians that utilized task trainers, along with standardized equipment and procedural technique, resulted in a reduction in the pneumothorax rate from 8.6% to 1.1%.20
14. Training curves for novices to become competent in lung ultrasound and ultrasound-guided thoracentesis are not completely understood. We recommend that training should be tailored to the skill acquisition of the learner and the resources of the institution.
Rationale: Understanding the rates at which novices progress from performing procedures under direct supervision to performing them independently would be highly desirable to ensure patient safety, guide supervision, and maximize efficiency of training. However, there is limited research describing the rate of progression of learners through these stages, either with regard to time or number of procedures performed. Two studies have shown that with brief training programs, medical students88 and internal medicine residents87 can achieve high levels of proficiency to perform thoracentesis on simulators, which is durable over time; however, whether these findings in a simulated environment translate into clinically significant outcomes is largely unknown, and neither of these studies incorporated the use of ultrasound guidance in their training curricula.87,88 Another study of pulmonary and critical care physicians combined multiple quality improvement initiatives with a half day of ultrasound-guided thoracentesis training, a requirement to perform 10 supervised thoracenteses prior to independent practice, and an additional requirement to perform 10 thoracenteses per year to maintain privileges.20 These interventions resulted in a concentration of competency among a few proceduralists, decreasing the rate of pneumothorax from 8.6% to 1.1%.20 Degradation of skills with disuse may also occur84; thus, procedures performed infrequently should at a minimum be subjected to increased supervision and/or retesting.
KNOWLEDGE GAPS
The process of developing these guidelines revealed important gaps in the literature regarding the use of ultrasound guidance for thoracentesis. First, it is uncertain whether the use of ultrasound reduces the risk of bleeding with thoracentesis. A retrospective cohort study of 19,339 thoracenteses suggests that ultrasound guidance is associated with a 38.7% relative reduction in the odds of hemorrhage, although this reduction did not reach statistical significance (OR 0.6 [0.4–1.04]).18 Ultrasound may reduce the risk of bleeding by reducing the number of attempts and needle passes and potentially avoiding tortuous intercostal vessels, which can be found especially in elderly patients and more cephalad rib spaces.91 In an observational study of 22 patients undergoing thoracentesis, the intercostal artery (ICA) was identified by a high-frequency ultrasound transducer in 74 of 88 intercostal spaces.92 The ICA is more exposed in the intercostal space within the first 6 cm lateral to the spinous processes and can be seen as far lateral as the midaxillary line.92-95 Thus, the ICA will most likely be avoided if a procedure site is selected >6 cm lateral to the spinous processes and the needle is inserted above the rib.
Second, although all three studies conducted using real-time (dynamic) ultrasound guidance reported a pneumothorax rate of <1%, it is uncertain whether real-time ultrasound guidance confers any additional benefit compared to static guidance for site marking as direct comparisons were not made.17,96,97 It is possible that real-time ultrasound guidance may be superior to static guidance in certain situations, such as small pleural effusions of <10–15 mm that have historically been considered too small to tap.13,22,23,96
Third, although one study suggests that general internists can safely perform thoracentesis with low complication rates similar to those of interventional radiologists,2 limited data exists on how to train practicing hospitalists to use ultrasound to guide thoracentesis. The effectiveness of different training protocols to acquire competence in ultrasound-guided thoracentesis has not been compared.
Finally, the impact of ultrasound use on patient experience has yet to be explored.
CONCLUSION
The use of ultrasound guidance for thoracentesis has been associated with increased success rates and decreased complication rates. Ultrasound can be used to estimate the pleural fluid volume, characterize the effusion as simple or complex, identify an optimal needle insertion site, and reduce the need for postprocedural chest radiographs. Training and experience are essential to reap the benefits of using ultrasound for thoracentesis, although our understanding of optimal educational strategies and learning curves is limited. Once training has occurred and competence is achieved, hospitalists can perform ultrasound-guided thoracentesis as safely as radiologists, pulmonologists, and other specialists.
Acknowledgments
Collaborators from the Society of Hospital Medicine Point-of-care Ultrasound Task Force: Saaid Abdel-Ghani, Robert Arntfield, Jeffrey Bates, Anjali Bhagra, Michael Blaivas, Daniel Brotman, Carolina Candotti, Richard Hoppmann, Susan Hunt, Trevor P. Jensen, Venkat Kalidindi, Ketino Kobaidze, Joshua Lenchus, Benji Mathews, Paul, Mayo, Satyen Nichani, Vicki Noble, Martin Perez, Aliaksei Pustavoitau, Kreegan Reierson, Sophia Rodgers, Gerard Salame, Kirk Spencer, Vivek Tayal, David M. Tierney.
Disclosures
Ricardo Franco-Sadud reports institutional funds received from the Society of Hospital Medicine Annual Meeting for travel expenses and accommodations outside the submitted work. Nitin Puri reports Payment for lectures including service on speakers bureaus from Fujifilm Sonosite and royalties from Elsevier, both outside the submitted work. All other authors have nothing to disclose.
Funding
Brian P Lucas: Department of Veterans Affairs, Veterans Health Administration, Office of Research and Development and Dartmouth SYNERGY, National Institutes of Health, National Center for Translational Science (UL1TR001086). Nilam Soni: Department of Veterans Affairs, Quality Enhancement Research Initiative (QUERI) Partnered Evaluation Initiative Grant (HX002263-01A1)
Disclaimer
The contents of this publication do not represent the views of the U.S. Department of Veterans Affairs or the United States Government.
The authors thank all the members of the Society of Hospital Medicine Point-of-care Ultrasound Task Force and the Education Committee members for their time and dedication to develop these guidelines.
CHAIRS: Nilam Soni, Ricardo Franco Sadud, Jeff Bates. WORKING GROUPS: Thoracentesis Working Group: Ria Dancel (chair), Daniel Schnobrich, Nitin Puri. Vascular Access Working Group: Ricardo Franco (chair), Benji Matthews, Saaid Abdel-Ghani, Sophia Rodgers, Martin Perez, Daniel Schnobrich. Paracentesis Working Group: Joel Cho (chair), Benji Matthews, Kreegan Reierson, Anjali Bhagra, Trevor P. Jensen. Lumbar puncture Working Group: Nilam Soni (chair), Ricardo Franco, Gerard Salame, Josh Lenchus, Venkat Kalidindi, Ketino Kobaidze. Credentialing Working Group: Brian P Lucas (chair), David Tierney, Trevor P. Jensen. PEER REVIEWERS: Robert Arntfield, Michael Blaivas, Richard Hoppmann, Paul Mayo, Vicki Noble, Aliaksei Pustavoitau, Kirk Spencer, Vivek Tayal. METHODOLOGIST: Mahmoud El Barbary. LIBRARIAN: Loretta Grikis. SOCIETY OF HOSPITAL MEDICINE EDUCATION COMMITTEE: Dan Brotman (past chair), Satyen Nichani (current chair), Susan Hunt. SOCIETY OF HOSPITAL MEDICINE STAFF: Nick Marzano.
1. Owings MF, Kozak LJ. Ambulatory and inpatient procedures in the United States, 1996. Vital Health Stat 13. 1998;139:1-119. PubMed
2. Kozmic SE, Wayne DB, Feinglass J, Hohmann SF, Barsuk JH. Factors associated with inpatient thoracentesis procedure quality at university hospitals. Jt Comm J Qual Patient Saf. 2016;42(1):34-40. PubMed
3. Gordon CE, Feller-Kopman D, Balk EM, Smetana GW. Pneumothorax following thoracentesis: a systematic review and meta-analysis. Arch Intern Med. 2010;170(4):332-339. PubMed
4. Mercaldi CJ, Lanes SF. Ultrasound guidance decreases complications and improves the cost of care among patients undergoing thoracentesis and paracentesis. Chest. 2013;143(2):532-538. PubMed
5. Jones PW, Moyers JP, Rogers JT, Rodriguez RM, Lee YC, Light RW. Ultrasound-guided thoracentesis: is it a safer method? Chest. 2003;123(2):418-423. PubMed
6. Raptopoulos V, Davis LM, Lee G, Umali C, Lew R, Irwin RS. Factors affecting the development of pneumothorax associated with thoracentesis. AJR Am J Roentgenol. 1991;156(5):917-920. PubMed
7. Grogan DR, Irwin RS, Channick R, et al. Complications associated with thoracentesis. A prospective, randomized study comparing three different methods. Arch Intern Med. 1990;150(4):873-877. PubMed
8. Ravin CE. Thoracocentesis of loculated pleural effusions using grey scale ultrasonic guidance. Chest. 1977;71(5):666-668. PubMed
9. Weingardt JP, Guico RR, Nemcek AA, Jr., Li YP, Chiu ST. Ultrasound findings following failed, clinically directed thoracenteses. J Clin Ultrasound. 1994;22(7):419-426. PubMed
10. Pihlajamaa K, Bode MK, Puumalainen T, Lehtimaki A, Marjelund S, Tikkakoski T. Pneumothorax and the value of chest radiography after ultrasound-guided thoracocentesis. Acta Radiol. 2004;45(8):828-832. PubMed
11. Gervais DA, Petersein A, Lee MJ, Hahn PF, Saini S, Mueller PR. US-guided thoracentesis: requirement for postprocedure chest radiography in patients who receive mechanical ventilation versus patients who breathe spontaneously. Radiology. 1997;204(2):503-506. PubMed
12. Boland GW, Gazelle GS, Girard MJ, Mueller PR. Asymptomatic hydropneumothorax after therapeutic thoracentesis for malignant pleural effusions. AJR Am J Roentgenol. 1998;170(4):943-946. PubMed
13. Havelock T, Teoh R, Laws D, Gleeson F. Pleural procedures and thoracic ultrasound: British Thoracic Society Pleural Disease Guideline 2010. Thorax. 2010;65(2):ii61-76. PubMed
14. Fitch K, Bernstein SJ, Aguilar MD, Burnand B, LaCalle JR. The RAND/UCLA appropriateness method user’s manual. DTIC Document; 2001.
15. Perazzo A, Gatto P, Barlascini C, Ferrari-Bravo M, Nicolini A. Can ultrasound guidance reduce the risk of pneumothorax following thoracentesis? J Bras Pneumol. 2014;40(1):6-12. PubMed
16. Barnes TW, Morgenthaler TI, Olson EJ, Hesley GK, Decker PA, Ryu JH. Sonographically guided thoracentesis and rate of pneumothorax. J Clin Ultrasound. 2005;33(9):442-446. PubMed
17. Cavanna L, Mordenti P, Berte R, et al. Ultrasound guidance reduces pneumothorax rate and improves safety of thoracentesis in malignant pleural effusion: report on 445 consecutive patients with advanced cancer. World J Surg Oncol. 2014;12:139. PubMed
18. Patel PA, Ernst FR, Gunnarsson CL. Ultrasonography guidance reduces complications and costs associated with thoracentesis procedures. J Clin Ultrasound. 2012;40(3):135-141. PubMed
19. Diacon AH, Brutsche MH, Soler M. Accuracy of pleural puncture sites: a prospective comparison of clinical examination with ultrasound. Chest. 2003;123(2):436-441. PubMed
20. Duncan DR, Morgenthaler TI, Ryu JH, Daniels CE. Reducing iatrogenic risk in thoracentesis: establishing best practice via experiential training in a zero-risk environment. Chest. 2009;135(5):1315-1320. PubMed
21. Ault MJ, Rosen BT, Scher J, Feinglass J, Barsuk JH. Thoracentesis outcomes: a 12-year experience. Thorax. 2015;70(2):127-132. PubMed
22. Lichtenstein D, Hulot JS, Rabiller A, Tostivint I, Meziere G. Feasibility and safety of ultrasound-aided thoracentesis in mechanically ventilated patients. Intensive Care Med. 1999;25(9):955-958. PubMed
23. Mayo PH, Goltz HR, Tafreshi M, Doelken P. Safety of ultrasound-guided thoracentesis in patients receiving mechanical ventilation. Chest. 2004;125(3):1059-1062. PubMed
24. Goligher EC, Leis JA, Fowler RA, Pinto R, Adhikari NK, Ferguson ND. Utility and safety of draining pleural effusions in mechanically ventilated patients: a systematic review and meta-analysis. Crit Care. 2011;15(1):R46. PubMed
25. Landay M, Harless W. Ultrasonic differentiation of right pleural effusion from subphrenic fluid on longitudinal scans of the right upper quadrant: importance of recognizing the diaphragm. Radiology. 1977;123(1):155-158. PubMed
26. Mayo PH, Doelken P. Pleural ultrasonography. Clin Chest Med. 2006;27(2):215-227. PubMed
27. Rosenberg ER. Ultrasound in the assessment of pleural densities. Chest. 1983;84(3):283-285. PubMed
28. Gorg C, Restrepo I, Schwerk WB. Sonography of malignant pleural effusion. Eur Radiol. 1997;7(8):1195-1198. PubMed
29. Gryminski J, Krakowka P, Lypacewicz G. The diagnosis of pleural effusion by ultrasonic and radiologic techniques. Chest. 1976;70(1):33-37. PubMed
30. Kalokairinou-Motogna M, Maratou K, Paianid I, et al. Application of color Doppler ultrasound in the study of small pleural effusion. Med Ultrason. 2010;12(1):12-16. PubMed
31. Lichtenstein D, Goldstein I, Mourgeon E, Cluzel P, Grenier P, Rouby JJ. Comparative diagnostic performances of auscultation, chest radiography, and lung ultrasonography in acute respiratory distress syndrome. Anesthesiology. 2004;100(1):9-15. PubMed
32. Grimberg A, Shigueoka DC, Atallah AN, Ajzen S, Iared W. Diagnostic accuracy of sonography for pleural effusion: systematic review. Sao Paulo Med J.. 2010;128(2):90-95. PubMed
33. Kataoka H. Utility of thoracic sonography for follow-up examination of chronic heart failure patients with previous decompensation. Clin Cardiol. 2007;30(7):336-341. PubMed
34. Ma OJ, Mateer JR. Trauma ultrasound examination versus chest radiography in the detection of hemothorax. Ann Emerg Med. 1997;29(3):312-315. PubMed
35. Rocco M, Carbone I, Morelli A, et al. Diagnostic accuracy of bedside ultrasonography in the ICU: feasibility of detecting pulmonary effusion and lung contusion in patients on respiratory support after severe blunt thoracic trauma. Acta Anaesthesiol Scand. 2008;52(6):776-784. PubMed
36. Kocijancic I, Vidmar K, Ivanovi-Herceg Z. Chest sonography versus lateral decubitus radiography in the diagnosis of small pleural effusions. J Clin Ultrasound. 2003;31(2):69-74. PubMed
37. Lichtenstein DA. Lung ultrasound in the critically ill. Ann Intensive Care. 2014;4(1):1. PubMed
38. Soni NJ, Franco R, Velez MI, et al. Ultrasound in the diagnosis and management of pleural effusions. J Hosp Med. 2015;10(12):811-816. PubMed
39. Medford AR, Entwisle JJ. Indications for thoracic ultrasound in chest medicine: an observational study. Postgrad Med J. 2010;86(1011):8-11. PubMed
40. Lin MS, Hwang JJ, Chong IW, et al. Ultrasonography of chest diseases: analysis of 154 cases. Gaoxiong Yi Xue Ke Xue Za Zhi . 1992;8(10):525-534. PubMed
41. Eibenberger KL, Dock WI, Ammann ME, Dorffner R, Hormann MF, Grabenwoger F. Quantification of pleural effusions: sonography versus radiography. Radiology. 1994;191(3):681-684. PubMed
42. Vignon P, Chastagner C, Berkane V, et al. Quantitative assessment of pleural effusion in critically ill patients by means of ultrasonography. Crit Care Med. 2005;33(8):1757-1763. PubMed
43. Usta E, Mustafi M, Ziemer G. Ultrasound estimation of volume of postoperative pleural effusion in cardiac surgery patients. Interact Cardiovasc Thorac Surg. 2010;10(2):204-207. PubMed
44. Remerand F, Dellamonica J, Mao Z, et al. Multiplane ultrasound approach to quantify pleural effusion at the bedside. Intensive Care Med. 2010;36(4):656-664.
PubMed
45. Balik M, Plasil P, Waldauf P, et al. Ultrasound estimation of volume of pleural fluid in mechanically ventilated patients. Intensive Care Med. 2006;32(2):318-321. PubMed
46. Zanforlin A, Gavelli G, Oboldi D, Galletti S. Ultrasound-guided thoracentesis: the V-point as a site for optimal drainage positioning. Eur Rev Med Pharmacol Sci. 2013;17(1):25-28. PubMed
47. Lisi M, Cameli M, Mondillo S, et al. Incremental value of pocket-sized imaging device for bedside diagnosis of unilateral pleural effusions and ultrasound-guided thoracentesis. Interact Cardiovasc Thorac Surg. 2012;15(4):596-601. PubMed
48. Xirouchaki N, Kondili E, Prinianakis G, Malliotakis P, Georgopoulos D. Impact of lung ultrasound on clinical decision making in critically ill patients. Intensive Care Med. 2014;40(1):57-65. PubMed
49. Chen HJ, Tu CY, Ling SJ, et al. Sonographic appearances in transudative pleural effusions: not always an anechoic pattern. Ultrasound Med Biol. 2008;34(3):362-369. PubMed
50. Yang PC, Luh KT, Chang DB, Wu HD, Yu CJ, Kuo SH. Value of sonography in determining the nature of pleural effusion: analysis of 320 cases. AJR Am J Roentgenol. 1992;159(1):29-33. PubMed
51. Liang SJ, Tu CY, Chen HJ, et al. Application of ultrasound-guided pigtail catheter for drainage of pleural effusions in the ICU. Intensive Care Med. 2009;35(2):350-354. PubMed
52. McLoud TC, Flower CD. Imaging the pleura: sonography, CT, and MR imaging. AJR Am J Roentgenol. 1991;156(6):1145-1153. PubMed
53. Tu CY, Hsu WH, Hsia TC, et al. Pleural effusions in febrile medical ICU patients: chest ultrasound study. Chest. 2004;126(4):1274-1280. PubMed
54. Sajadieh H, Afzali F, Sajadieh V, Sajadieh A. Ultrasound as an alternative to aspiration for determining the nature of pleural effusion, especially in older people. Ann N Y Acad Sci. 2004;1019:585-592. PubMed
55. Marcun R, Sustic A. Sonographic evaluation of unexplained pleural exudate: a prospective case series. Wien Klin Wochenschr. 2009;121(9-10):334-338. PubMed
56. Bugalho A, Ferreira D, Dias SS, et al. The diagnostic value of transthoracic ultrasonographic features in predicting malignancy in undiagnosed pleural effusions: a prospective observational study. Respiration. 2014;87(4):270-278. PubMed
57. Salamonsen MR, Lo AK, Ng AC, Bashirzadeh F, Wang WY, Fielding DI. Novel use of pleural ultrasound can identify malignant entrapped lung prior to effusion drainage. Chest. 2014;146(5):1286-1293. PubMed
58. Himelman RB, Callen PW. The prognostic value of loculations in parapneumonic pleural effusions. Chest. 1986;90(6):852-856. PubMed
59. Chen CH, Chen W, Chen HJ, et al. Transthoracic ultrasonography in predicting the outcome of small-bore catheter drainage in empyemas or complicated parapneumonic effusions. Ultrasound Med Biol. 2009;35(9):1468-1474. PubMed
60. Hirsch JH, Rogers JV, Mack LA. Real-time sonography of pleural opacities. AJR Am J Roentgenol. 1981;136(2):297-301. PubMed
61. Chen KY, Liaw YS, Wang HC, Luh KT, Yang PC. Sonographic septation: a useful prognostic indicator of acute thoracic empyema. J Ultrasound Med. 2000;19(12):837-843. PubMed
62. Diaz-Guzman E, Budev MM. Accuracy of the physical examination in evaluating pleural effusion. Cleve Clin J Med. 2008;75(4):297-303. PubMed
63. Rhyne T, Birnholz JC. Simple measurement of chest-wall thickness with ultrasound. Radiology. 1973;108(2):436-438. PubMed
64. Ding W, Shen Y, Yang J, He X, Zhang M. Diagnosis of pneumothorax by radiography and ultrasonography: a meta-analysis. Chest. 2011;140(4):859-866. PubMed
65. Lichtenstein D, Meziere G, Biderman P, Gepner A. The “lung point”: an ultrasound sign specific to pneumothorax. Intensive Care Med. 2000;26(10):1434-1440. PubMed
66. Shostak E, Brylka D, Krepp J, Pua B, Sanders A. Bedside sonography for detection of postprocedure pneumothorax. J Ultrasound Med. 2013;32(6):1003-1009. PubMed
67. Alrajab S, Youssef AM, Akkus NI, Caldito G. Pleural ultrasonography versus chest radiography for the diagnosis of pneumothorax: review of the literature and meta-analysis. Crit Care. 2013;17(5):R208. PubMed
68. Alrajhi K, Woo MY, Vaillancourt C. Test characteristics of ultrasonography for the detection of pneumothorax: a systematic review and meta-analysis. Chest. 2012;141(3):703-708. PubMed
69. Sartori S, Tombesi P, Trevisani L, Nielsen I, Tassinari D, Abbasciano V. Accuracy of transthoracic sonography in detection of pneumothorax after sonographically guided lung biopsy: prospective comparison with chest radiography. AJR Am J Roentgenol. 2007;188(1):37-41. PubMed
70. Blaivas M, Lyon M, Duggal S. A prospective comparison of supine chest radiography and bedside ultrasound for the diagnosis of traumatic pneumothorax. Acad Emerg Med. 2005;12(9):844-849. PubMed
71. Lichtenstein DA, Meziere G, Lascols N, et al. Ultrasound diagnosis of occult pneumothorax. Crit Care Med. 2005;33(6):1231-1238. PubMed
72. Kohan JM, Poe RH, Israel RH, et al. Value of chest ultrasonography versus decubitus roentgenography for thoracentesis. Am Rev Respir Dis. 1986;133(6):1124-1126. PubMed
73. Capizzi SA, Prakash UB. Chest roentgenography after outpatient thoracentesis. Mayo Clin Proc. 1998;73(10):948-950. PubMed
74. Aleman C, Alegre J, Armadans L, et al. The value of chest roentgenography in the diagnosis of pneumothorax after thoracentesis. Am J Med. 1999;107(4):340-343. PubMed
75. Petersen WG, Zimmerman R. Limited utility of chest radiograph after thoracentesis. Chest. 2000;117(4):1038-1042. PubMed
76. Begot E, Grumann A, Duvoid T, et al. Ultrasonographic identification and semiquantitative assessment of unloculated pleural effusions in critically ill patients by residents after a focused training. Intensive Care Med. 2014;40(10):1475-1480. PubMed
77. Kotagal M, Quiroga E, Ruffatto BJ, et al. Impact of point-of-care ultrasound training on surgical residents’ confidence. J Surg Educ. 2015;72(4):e82-87. PubMed
78. Beaulieu Y, Laprise R, Drolet P, et al. Bedside ultrasound training using web-based e-learning and simulation early in the curriculum of residents. Crit Ultrasound J. 2015;7:1. PubMed
79. Schnobrich DJ, Olson AP, Broccard A, Duran-Nelson A. Feasibility and acceptability of a structured curriculum in teaching procedural and basic diagnostic ultrasound skills to internal medicine residents. J Grad Med Educ. 2013;5(3):493-497. PubMed
80. Chalumeau-Lemoine L, Baudel JL, Das V, et al. Results of short-term training of naive physicians in focused general ultrasonography in an intensive-care unit. Intensive Care Med. 2009;35(10):1767-1771. PubMed
81. Keddis MT, Cullen MW, Reed DA, et al. Effectiveness of an ultrasound training module for internal medicine residents. BMC Med Educ. 2011;11:75. PubMed
82. Ramsingh D, Alexander B, Le K, Williams W, Canales C, Cannesson M. Comparison of the didactic lecture with the simulation/model approach for the teaching of a novel perioperative ultrasound curriculum to anesthesiology residents. J Clin Anesth. 2014;26(6):443-454. PubMed
83. Sekiguchi H, Bhagra A, Gajic O, Kashani KB. A general Critical Care Ultrasonography workshop: results of a novel Web-based learning program combined with simulation-based hands-on training. J Crit Care. 2013;28(2):217.e217-212. PubMed
84. Dulohery MM, Stoven S, Kurklinsky AK, Halvorsen A, McDonald FS, Bhagra A. Ultrasound for internal medicine physicians: the future of the physical examination. J Ultrasound Med. 2014;33(6):1005-1011. PubMed
85. Lenchus J, Issenberg SB, Murphy D, et al. A blended approach to invasive bedside procedural instruction. Med Teach. 2011;33(2):116-123. PubMed
86. Lenchus JD. End of the “see one, do one, teach one” era: the next generation of invasive bedside procedural instruction. J Am Osteopath Assoc. 2010;110(6):340-346. PubMed
87. Wayne DB, Barsuk JH, O’Leary KJ, Fudala MJ, McGaghie WC. Mastery learning of thoracentesis skills by internal medicine residents using simulation technology and deliberate practice. J Hosp Med. 2008;3(1):48-54. PubMed
88. Jiang G, Chen H, Wang S, et al. Learning curves and long-term outcome of simulation-based thoracentesis training for medical students. BMC Med Educ. 2011;11:39. PubMed
89. Salamonsen M, McGrath D, Steiler G, Ware R, Colt H, Fielding D. A new instrument to assess physician skill at thoracic ultrasound, including pleural effusion markup. Chest. 2013;144(3):930-934. PubMed
90. Berg D, Berg K, Riesenberg LA, et al. The development of a validated checklist for thoracentesis: preliminary results. Am J Med Qual. 2013;28(3):220-226. PubMed
91. Shurtleff E, Olinger A. Posterior intercostal artery tortuosity and collateral branch points: a cadaveric study. Folia Morphol. 2012;71(4):245-251. PubMed
92. Salamonsen M, Ellis S, Paul E, Steinke K, Fielding D. Thoracic ultrasound demonstrates variable location of the intercostal artery. Respiration. 2012;83(4):323-329. PubMed
93. Salamonsen M, Dobeli K, McGrath D, et al. Physician-performed ultrasound can accurately screen for a vulnerable intercostal artery prior to chest drainage procedures. Respirology. 2013;18(6):942-947. PubMed
94. Helm EJ, Rahman NM, Talakoub O, Fox DL, Gleeson FV. Course and variation of the intercostal artery by CT scan. Chest. 2013;143(3):634-639. PubMed
95. Yoneyama H, Arahata M, Temaru R, Ishizaka S, Minami S. Evaluation of the risk of intercostal artery laceration during thoracentesis in elderly patients by using 3D-CT angiography. Intern Med. 2010;49(4):289-292. PubMed
96. Soldati G, Smargiassi A, Inchingolo R, Sher S, Valente S, Corbo GM. Ultrasound-guided pleural puncture in supine or recumbent lateral position - feasibility study. Multidiscip Respir Med. 2013;8(1):18. PubMed
97. Harnsberger HR, Lee TG, Mukuno DH. Rapid, inexpensive real-time directed thoracentesis. Radiology. 1983;146(2):545-546. PubMed
Approximately 1.5 million people develop a pleural effusion in the United States annually, and approximately 173,000 people (12%) undergo thoracentesis.1 A recent review of thoracenteses performed at 234 University Health System Consortium hospitals between January 2010 and September 2013 demonstrated that 16% of 132,472 thoracenteses were performed by general internists and hospitalists, 33.1% were performed by interventional radiologists, and 20.3% were performed by pulmonologists.2 The iatrogenic pneumothorax rate was not significantly different between interventional radiologists and internists (2.8% and 2.9% risk, respectively); however, the admissions associated with bedside thoracentesis were less expensive than the admissions associated with thoracentesis performed in radiology suites, even after controlling for clinical covariates.2 In addition, the use of ultrasound guidance has been associated with a reduced risk of complications and cost of thoracentesis.3,4 In most of the early published studies on ultrasound-guided thoracentesis, the procedures were performed by radiologists.5-12 However, in 2010, the British Thoracic Society published guidelines on pleural procedures and thoracic ultrasound geared toward any trained provider.13 The purpose of this guideline is to review the literature and present evidence-based recommendations on the performance of ultrasound-guided thoracentesis at the bedside.
METHODS
Detailed methods are described in Appendix 1. The Society of Hospital Medicine (SHM) Point-of-care Ultrasound (POCUS) Task Force was assembled to carry out this guideline development project under the direction of the SHM Board of Directors, Director of Education, and Education Committee. All expert panel members were physicians or advanced practice providers with expertise in POCUS. The expert panel members were divided into working group members, external peer reviewers, and a methodologist. All the Task Force members were required to disclose any potential conflicts of interests (Appendix 2). The literature search was conducted in two independent phases. The first phase included literature searches conducted by the four working group members themselves. Key clinical questions were prepared prior to conducting a systematic literature search by a medical librarian. The Medline, Embase, CINAHL, and Cochrane medical databases were searched from 1975 to September 2015 initially. Updated searches were conducted in November 2016 and in August 2017 (Appendix 3). All article abstracts were first screened for relevance by at least two members of the working group. Full-text versions of the screened articles were reviewed, and the articles focusing on the use of ultrasound to guide thoracentesis were selected. Articles that discussed thoracentesis without ultrasound guidance were excluded. In addition, the following article types were excluded: non-English language, nonhuman, subjects’ age <18 years, meeting abstracts, meeting posters, letters, and editorials. All relevant systematic reviews, meta-analyses, randomized controlled trials, and observational studies of ultrasound-guided thoracentesis were screened and selected. Final article selection was based on working group consensus, and the selected literature was incorporated into draft recommendations.
We used the RAND Appropriateness Method that required panel judgment and consensus.14 The 30 voting members of the SHM POCUS Task Force reviewed and voted on the draft recommendations considering the following five transforming factors: 1) Problem priority and importance, 2) Level of quality of evidence, 3) Benefit/harm balance, 4) Benefit/burden balance, and 5) Certainty/concerns about PEAF (Preferences/Equity Acceptability/Feasibility). Panel members participated in two rounds of electronic voting using an internet-based electronic data collection tool (Redcap™) in December 2016 and January 2017 (Appendix 4). Voting on appropriateness was conducted using a 9-point Likert scale, and the degree of consensus was assessed using the RAND algorithm. Establishing a recommendation required at least 70% agreement and a strong recommendation required 80% agreement according to the RAND rules (Appendix 1, Figure 1). Disagreement was defined as >30% of panelists voting outside of the zone of the median (appropriate, uncertain, inappropriate).
RESULTS
Literature search
A total of 1,556 references were pooled from the following four different sources: a search by a certified librarian in September 2015 (1066 citations) that was updated in November 2016 (165 citations) and again in August 2017 (9 citations), working group members’ literature searches (47 citations), and a search focused on training (269 citations). The final selection included 94 articles that were abstracted into a data table and incorporated into the draft recommendations. The details of the literature search strategy are given in Appendix 3.
Recommendations
Terminology
- Thoracentesis is a procedure of aspiration of fluid from the pleural space by percutaneous insertion of a needle through the chest wall with or without the insertion of a catheter.
- In this document, ultrasound guidance refers to static guidance and site marking performed at the bedside immediately before the procedure, as opposed to real-time (dynamic) ultrasound guidance or radiology performed site marking. The static method is the most commonly used method of ultrasound guidance and is supported by current evidence.
RECOMMENDATIONS
Clinical Outcomes
1.We recommend that ultrasound should be used to guide thoracentesis to reduce the risk of complications, the most common being pneumothorax.
Rationale: Both static ultrasound guidance and dynamic ultrasound guidance have been reported to be associated with a reduced risk of pneumothorax.4-7,15-18 A meta-analysis of 24 studies that included 6,605 thoracenteses showed a significant decrease in the risk of postprocedure pneumothorax with the use of ultrasound guidance compared to the risk associated with thoracentesis performed based on landmarks alone (OR 0.3, 95% CI 0.2–0.7).3 The meta-analysis included both prospective and retrospective studies conducted using both static and dynamic ultrasound guidance.3 A large retrospective cohort study conducted by Mercaldi et al. comprising more than 61,000 patients who underwent thoracentesis also showed that ultrasound guidance was associated with reduced odds of pneumothorax (OR 0.8 [0.7–0.9]).4 When pneumothorax did occur during that hospitalization, the cost of hospitalization increased by $2800 and the length of stay increased by 1.5 days.4 A 2008 review of 19,339 thoracenteses conducted by Patel et al. also demonstrated an association between ultrasound guidance and reduced odds of pneumothorax (OR 0.8 [0.7–0.96]).18 Although these findings were significant, it is important to note that the studies of both Mercaldi et al. and Patel et al. were reviews of administrative databases conducted using the International Classification of Diseases, 9th Revision (ICD-9) codes for thoracentesis and Current Procedure Terminology–4th edition (CPT) codes for the use of ultrasound.4,18 Patel et al. identified pneumothorax using ICD-9 codes for “pneumothorax–iatrogenic” and “pneumothorax–not specified as due to the procedure.” The association between ultrasound guidance and the reduced odds of pneumothorax was driven by the latter code.18 However, as with most retrospective studies using administrative data, granular data about the patients, procedure, proceduralists, and complications were not available in these reviews and conclusions may be limited by erroneous coding or documentation.4,18 In a third retrospective cohort study, Raptopoulos et al. compared 154 landmark-based thoracenteses performed by “clinical physicians” and 188 ultrasound-guided thoracenteses performed by radiologists and found that ultrasound-guided site selection reduced the rate of pneumothorax from 18% to 3% (P < .0001).6 Finally, one single-center randomized controlled trial of 160 thoracenteses performed by pulmonologists showed that ultrasound guidance reduced the relative risk of pneumothorax by 90% (12.5% vs 1.3%; P =.009) with a number needed to treat of 9.15 It was not possible to blind the operators to the use of ultrasound guidance, but the data analysis was blinded.15 Furthermore, while there was no explicit comparison of the intervention vs. the control groups, randomization would have presumably rendered both groups similar in terms of patient characteristics and effusion characteristics.15 Ultrasound may reduce the risk of pneumothorax through several mechanisms, including identifying patients in whom thoracentesis cannot be safely performed, allowing selection of the safest needle insertion site, and revealing the optimal depth of needle insertion.
2.We recommend that ultrasound guidance should be used to increase the success rate of thoracentesis.
Rationale: Thoracentesis guided by ultrasound has lower rates of failed attempts, or “dry taps,” compared to thoracentesis guided solely by physical examination. In 1977, Ravin described a method of using ultrasound to guide successful drainage of six complex pleural effusions (empyema or loculated effusion) after multiple (5–7) failed attempts by clinicians using physical examination alone.8 In a second study by radiologists, Weingardt et al. demonstrated that 20 of 26 failed landmark-based thoracenteses were due to incorrect site selection by physical examination–15 sites were below the diaphragm and 5 sites were above the pleural effusion or in the consolidated lung–and the use of ultrasound allowed successful sampling in 14 of 16 patients who had a failed landmark-based thoracentesis.9 Diacon et al. asked 30 physicians, ranging from junior housestaff to pulmonologists, to mark 172 potential thoracentesis sites in 67 patients with pleural effusions using physical examination alone. Ultrasound was then used to evaluate the proposed puncture sites. They found that using ultrasound would have avoided puncture on “dry chests” in 2% and avoided potential laceration of a solid organ in 10% of patients compared to site selection by physical examination alone.19 Finally, Perazzo et al. randomized 160 patients to landmark-based thoracentesis and ultrasound-guided thoracentesis and demonstrated that half of the eight dry taps that occurred in the control group could be successfully drained using subsequent ultrasound guidance.15
Technique
3. We recommend that ultrasound-guided thoracentesis should be performed or closely supervised by experienced operators.
Rationale: Current evidence suggests lower complication rates when thoracentesis is performed by experienced healthcare providers. A systematic review of 6,605 thoracenteses showed a significantly lower pneumothorax rate when thoracentesis was performed by pulmonology or radiology faculty versus resident physicians (3.9% vs 8.5%; P =.04), although this finding was not significant in the four studies that directly compared this factor.3 In a quality improvement study performed by Duncan et al., pulmonology and critical care physicians combining multiple quality improvement initiatives to achieve and maintain competency decreased the rate of pneumothorax from 8.6% to 1.1% (P =.0034).20 Interventions included ultrasound training, performance of 10 thoracenteses under expert supervision, and restriction of privileges to proceduralists who perform 10 or more thoracenteses per year.20 Finally, a series of 9,320 ultrasound-guided thoracenteses performed or supervised by a single expert internist over a period of 12 years resulted in a pneumothorax rate of 0.6% and a composite complication rate of 0.98% (pneumothorax, reexpansion pulmonary edema, hemothorax, site bleeding, hematoma, splenic laceration, and vasovagal reaction).21 Notably, pneumothorax rate in resident physician hands was reported to be 8.5% in the meta-analysis performed by Gordon et al., which is similar to the initial rate in the pulmonologists who participated in the study by Duncan et al.3,20 However, after instituting formal ultrasound training and other initiatives aimed at maintaining competency, the pneumothorax rate in the study by Duncan et al. decreased to 1.1%, similar to the rate observed in the series by Ault et al.21 This suggests that training and supervision are necessary to achieve competency and reduce the rate of complications.3,20,21
4. We suggest that ultrasound guidance be used to reduce the risk of complications from thoracentesis in mechanically ventilated patients.
Rationale: The rest of this guideline refers to ultrasound-guided thoracentesis performed in spontaneously breathing patients; however, this recommendation is specific to mechanically ventilated patients. Two prospective observational studies have shown no increase in complications when ultrasound-guided thoracentesis is performed on mechanically ventilated patients compared to patients not receiving positive pressure ventilation. A feasibility study of 45 thoracenteses performed on ventilated patients reported no complications,22 whereas another study on 232 patients reported a pneumothorax rate of 1.3%.23 In a larger study conducted by Mayo et al., medicine housestaff performed thoracentesis under the supervision of intensivists who had undergone training in ultrasound prior to performing the procedure.23 In both studies, most of the patients were in a supine position, although positioning and puncture site were at the discretion of the physician, and both studies employed use of static ultrasound guidance.22,23 A large series of 9,320 ultrasound-guided thoracenteses that included 1,377 mechanically ventilated patients did not report a higher rate of pneumothorax (0.8%) compared to that in spontaneously breathing patients (0.61%).21 Finally, a meta-analysis of 19 observational studies comprising 1,124 mechanically ventilated patients who underwent pleural drainage procedures showed a low rate of pneumothorax (3.4%) and hemothorax (1.9%).24 Although the rate of complication was reported to be low in this meta-analysis, ultrasound was not employed in all studies and its use was not associated with a significant reduction in pneumothorax.24 This may be because 8 of the 19 studies used pigtail catheters or large-bore thoracostomy tubes which treat pneumothorax as they occur.24
5. We recommend that ultrasound should be used to identify the chest wall, pleura, diaphragm, lung, and subdiaphragmatic organs throughout the respiratory cycle before selecting a needle insertion site.
Rationale: The use of ultrasound improves the selection of a safe needle insertion site because sites chosen without ultrasound guidance may be below the diaphragm, over solid organs,9,19 or in locations that risk puncture of the lung.9 Visualization of the chest wall, diaphragm, and lung, which define the boundaries of a pleural effusion, allows the clinician to confirm the presence of a drainable pleural effusion and assess for other pathologies, such as ascites and tumor, that may be mistaken for a pleural effusion.22,25,26 Hypoechoic lesions can represent small loculated pleural effusions but also pleural plaques, pleural masses, peripheral lung masses, or abscesses.27,28
6. We recommend that ultrasound should be used to detect the presence or absence of an effusion and approximate the volume of pleural fluid to guide clinical decision-making.
Rationale: The presence and approximate size of pleural fluid collections are important determinants of whether thoracentesis, another procedure, or no procedure should be performed. Ultrasonography has higher sensitivity and specificity for detecting pleural effusions and better differentiates effusions from consolidations compared with chest radiography.29-42 Ultrasound allows semiquantitative estimation of pleural fluid volume to determine whether thoracentesis should be performed.41-45 When using ultrasound to choose a site for thoracentesis, the British Thoracic Society Pleural Disease guidelines recommend ≥10 mm of pleural fluid between the visceral and parietal pleura.13 Pleural effusions of <10–15 mm are considered too small to tap.22,23 In a prospective study of 45 patients, a measurement of >9.9 cm by ultrasound between the chest wall and the “V-point,” the intersection of the diaphragm and the collapsed lung, correlated with a pleural fluid volume of >1 liter.46 Another prospective study of 73 patients showed that a pleural effusion spanning >3 intercostal spaces by ultrasound also correlated with a pleural fluid volume of >1 liter.47 Anticipating the volume of fluid to be removed may aid in preplanning and procurement of larger capacity drainage containers prior to starting the procedure. Lung ultrasound can also change the management if the characteristic of the effusion suggests that an invasive procedure is unsafe or another diagnostic or therapeutic option is more appropriate.39 In a prospective cohort study of 189 mechanically ventilated patients, lung ultrasound guided the management in all patients with suspected effusion, leading to chest tube placement in 7 patients and thoracentesis in 34 patients.48
7. We recommend that ultrasound should be used to detect complex sonographic features, such as septations, to guide clinical decision-making regarding the timing and method of pleural drainage.
Rationale: Pleural effusions can be broadly categorized sonographically as simple or complex. Complex effusions are further categorized as with or without septation. Simple effusions are anechoic and are often, but not invariably, transudative.49-51 The use of sonography and computerized tomography (CT) is complementary, but features of complex pleural effusions (fibrin stranding and septations) may be better visualized by ultrasound than by CT of the thorax.52 Detection of complex features should prompt the consideration of pleural fluid sampling.53,54 Exudative effusions from tuberculosis, malignancy, or other etiologies more often include debris, septations, or other complex features.55,56 Certain features such as a swirling debris, pleural thickening, and nodularity may be more often associated with malignancy,54,56 and advanced ultrasound techniques may be used to detect a trapped lung prior to attempting drainage of a malignant pleural effusion.57 Two studies found complex septated pleural effusions to be invariably exudative50,58 and drainage was unlikely to be successful without the placement of a chest tube.50,58-60 Chest tube placement through fibrinolytic administration or video-assisted thoracoscopic surgery (VATS) may be more appropriate in the management of complex septated pleural effusions,59-61 and expert consultation with a thoracic specialist is recommended in these cases.
8. We suggest that ultrasound can be used to measure the depth from the skin surface to the parietal pleura to help select an appropriate length needle and determine the maximum needle insertion depth.
Rationale: The distance from the skin to the parietal and visceral pleura can be measured by ultrasound to determine whether thoracentesis can be safely performed and to guide selection of an adequate length needle.38 The length of needle required to penetrate the pleural space varies based on the thickness of the chest wall. Percussion of the chest wall is limited when there is more than 6 cm of subcutaneous tissue,62 making physical examination in obese patients unreliable for selecting an appropriate site or needle length for thoracentesis. Ultrasound allows visualization of deep soft tissues, well beyond the limits of percussion, and allows an accurate measurement of the chest wall.63
9. We suggest that ultrasound can be used to evaluate normal lung sliding pre- and postprocedure to rule out pneumothorax.
Rationale: Normal lung sliding indicates normal apposition and movement of visceral and parietal pleura and rules out pneumothorax with a sensitivity that exceeds that of chest radiography, according to a meta-analysis of 20 studies using computed tomography or escape of intrapleural air at the time of drainage as the gold standard.64 In this meta-analysis, the pooled sensitivity of ultrasound was reported to be 88% (85-91%) compared to 52% (49-55%) for radiography, although the analysis also suggests that the test characteristics are dependent on operator skill.64 However, although lung sliding rules out pneumothorax, absence of lung sliding is not specific for pneumothorax and other conditions, including pleural adhesions, pleurodesis, and bronchial obstruction, can cause the absence of lung sliding.64 Detection of a lung point conclusively rules in a pneumothorax.65 Provided that the preprocedure lung ultrasound examination revealed normal lung sliding, a postprocedure examination can be performed to effectively evaluate for pneumothorax. This modality does not use ionizing radiation, is less expensive than computed tomography, can be performed faster than bedside chest radiography, and is more sensitive than supine or upright chest radiography.64,66-71
10. We suggest avoiding delay or interval change in patient position between the time of marking the needle insertion site and performing the thoracentesis.
Rationale: Optimal patient positioning and ultrasound-guided site marking should be performed by the primary operator immediately before beginning an invasive procedure. Remote sonographic localization in which a radiologist marks a needle insertion site using ultrasound and the thoracentesis is performed at a later time by a different provider is an antiquated practice. Two early studies demonstrated that this practice is no safer than landmark-based thoracentesis.6,72 One prospective study of 205 patients performed in 1986 showed no significant decrease in the incidence of complications from thoracentesis performed using remote sonographic localization versus landmark-based drainage.72 Complications in that study included a total of 22 pneumothoraces and 1 hematoma. The rate of complications in the group of patients who had site marking performed by radiology faculty and subsequent thoracentesis by medicine housestaff or attending physicians was 9.7% versus a complication rate of 12.7% in the landmark-based group.72 In addition, Raptopoulos et al. observed no significant difference in the pneumothorax rate between 106 patients with landmark-based thoracenteses and 48 patients who were sonographically marked by radiology faculty and then returned to the ward for completion of the thoracentesis by medicine housestaff (19% vs. 15%, respectively).6 Both groups had significantly higher rates of pneumothorax compared to those who underwent thoracentesis performed using real-time ultrasound guidance by radiology trainees (3%).6 The authors speculated that changing the patient’s position shifted the position of the pleural effusion, ultimately leading to the reliance on physical examination for the tap site.6
11. We recommend against performing routine postprocedure chest radiographs in patients who have undergone thoracentesis successfully with ultrasound guidance and are asymptomatic with normal lung sliding postprocedure.
Rationale: Chest radiography post-thoracentesis is unlikely to add information that changes management, especially if performed routinely, but does add expense, radiation, and inconvenience.73 The most common serious complication of thoracentesis is pneumothorax, which is often accompanied by symptoms, particularly in those patients with pneumothorax large enough to warrant chest tube placement.10,74,75 Pihlajamaa et al. retrospectively studied 264 ultrasound-guided thoracenteses performed by radiologists or radiology residents and noted that of 11 pneumothoraces, only 1 necessitated chest tube placement.10 Aleman et al. prospectively studied 506 ultrasound-guided and physical examination-guided thoracenteses and found that only 1% of asymptomatic patients developed a pneumothorax.74 Eight of the 18 symptomatic patients required chest tube placement as opposed to 1 of the 488 asymptomatic patients.74 A large prospective study of 941 ultrasound-guided thoracentesis reported that only 0.3% of asymptomatic patients with no suspicion of pneumothorax required tube thoracostomy.5 Postprocedure chest radiographs may be considered when thoracentesis is performed on mechanically ventilated patients, particularly when high airway pressures exist. In a study of 434 patients undergoing thoracentesis, only 10 patients had a pneumothorax (2.3%).11 Six of these pneumothoraces occurred in 92 mechanically ventilated patients (6.5%), and 2 of these 6 patients required a chest tube.11 None of the 4 spontaneously breathing patients with pneumothorax required a chest tube.11
Training
12. We recommend that novices who use ultrasound guidance for thoracentesis should receive focused training in lung and pleural ultrasonography and hands-on practice in procedural technique.
Rationale: Healthcare providers have to gain various skills to safely perform ultrasound-guided thoracentesis independently. Trainees should learn how to use ultrasound to identify important structures (chest wall, ribs, lung, pleura, diaphragm, and subdiaphragmatic organs); detect pleural effusions with complex features, such as septations; identify consolidated lung tissue; and rule out a pneumothorax. Prospective studies done with novice learners have shown that focused training combining didactics and hands-on practice using simulation or live models improves skills to assess pleural effusions.76-84 Several additional procedural techniques such as patient positioning and needle insertion are also important but are beyond the scope of these guidelines.
13. We suggest that novices undergo simulation-based training prior to performing ultrasound-guided thoracentesis on patients.
Rationale: Simulation-based training for thoracentesis has been studied in providers with different levels of medical training, ranging from medical students and internal medicine residents to practicing pulmonologists. Studies suggest that training in a zero-risk environment with simulation task trainers leads to increased knowledge and skills without subjecting the patients to inexperienced operators.85-87 One study on simulator-based training in medical students showed skill retention at 6 months and these skills were at least partially transferred to increased competency on live patients.88 Checklists to train providers in ultrasound-guided thoracentesis have been published.89,90 An experiential training program for attending physicians that utilized task trainers, along with standardized equipment and procedural technique, resulted in a reduction in the pneumothorax rate from 8.6% to 1.1%.20
14. Training curves for novices to become competent in lung ultrasound and ultrasound-guided thoracentesis are not completely understood. We recommend that training should be tailored to the skill acquisition of the learner and the resources of the institution.
Rationale: Understanding the rates at which novices progress from performing procedures under direct supervision to performing them independently would be highly desirable to ensure patient safety, guide supervision, and maximize efficiency of training. However, there is limited research describing the rate of progression of learners through these stages, either with regard to time or number of procedures performed. Two studies have shown that with brief training programs, medical students88 and internal medicine residents87 can achieve high levels of proficiency to perform thoracentesis on simulators, which is durable over time; however, whether these findings in a simulated environment translate into clinically significant outcomes is largely unknown, and neither of these studies incorporated the use of ultrasound guidance in their training curricula.87,88 Another study of pulmonary and critical care physicians combined multiple quality improvement initiatives with a half day of ultrasound-guided thoracentesis training, a requirement to perform 10 supervised thoracenteses prior to independent practice, and an additional requirement to perform 10 thoracenteses per year to maintain privileges.20 These interventions resulted in a concentration of competency among a few proceduralists, decreasing the rate of pneumothorax from 8.6% to 1.1%.20 Degradation of skills with disuse may also occur84; thus, procedures performed infrequently should at a minimum be subjected to increased supervision and/or retesting.
KNOWLEDGE GAPS
The process of developing these guidelines revealed important gaps in the literature regarding the use of ultrasound guidance for thoracentesis. First, it is uncertain whether the use of ultrasound reduces the risk of bleeding with thoracentesis. A retrospective cohort study of 19,339 thoracenteses suggests that ultrasound guidance is associated with a 38.7% relative reduction in the odds of hemorrhage, although this reduction did not reach statistical significance (OR 0.6 [0.4–1.04]).18 Ultrasound may reduce the risk of bleeding by reducing the number of attempts and needle passes and potentially avoiding tortuous intercostal vessels, which can be found especially in elderly patients and more cephalad rib spaces.91 In an observational study of 22 patients undergoing thoracentesis, the intercostal artery (ICA) was identified by a high-frequency ultrasound transducer in 74 of 88 intercostal spaces.92 The ICA is more exposed in the intercostal space within the first 6 cm lateral to the spinous processes and can be seen as far lateral as the midaxillary line.92-95 Thus, the ICA will most likely be avoided if a procedure site is selected >6 cm lateral to the spinous processes and the needle is inserted above the rib.
Second, although all three studies conducted using real-time (dynamic) ultrasound guidance reported a pneumothorax rate of <1%, it is uncertain whether real-time ultrasound guidance confers any additional benefit compared to static guidance for site marking as direct comparisons were not made.17,96,97 It is possible that real-time ultrasound guidance may be superior to static guidance in certain situations, such as small pleural effusions of <10–15 mm that have historically been considered too small to tap.13,22,23,96
Third, although one study suggests that general internists can safely perform thoracentesis with low complication rates similar to those of interventional radiologists,2 limited data exists on how to train practicing hospitalists to use ultrasound to guide thoracentesis. The effectiveness of different training protocols to acquire competence in ultrasound-guided thoracentesis has not been compared.
Finally, the impact of ultrasound use on patient experience has yet to be explored.
CONCLUSION
The use of ultrasound guidance for thoracentesis has been associated with increased success rates and decreased complication rates. Ultrasound can be used to estimate the pleural fluid volume, characterize the effusion as simple or complex, identify an optimal needle insertion site, and reduce the need for postprocedural chest radiographs. Training and experience are essential to reap the benefits of using ultrasound for thoracentesis, although our understanding of optimal educational strategies and learning curves is limited. Once training has occurred and competence is achieved, hospitalists can perform ultrasound-guided thoracentesis as safely as radiologists, pulmonologists, and other specialists.
Acknowledgments
Collaborators from the Society of Hospital Medicine Point-of-care Ultrasound Task Force: Saaid Abdel-Ghani, Robert Arntfield, Jeffrey Bates, Anjali Bhagra, Michael Blaivas, Daniel Brotman, Carolina Candotti, Richard Hoppmann, Susan Hunt, Trevor P. Jensen, Venkat Kalidindi, Ketino Kobaidze, Joshua Lenchus, Benji Mathews, Paul, Mayo, Satyen Nichani, Vicki Noble, Martin Perez, Aliaksei Pustavoitau, Kreegan Reierson, Sophia Rodgers, Gerard Salame, Kirk Spencer, Vivek Tayal, David M. Tierney.
Disclosures
Ricardo Franco-Sadud reports institutional funds received from the Society of Hospital Medicine Annual Meeting for travel expenses and accommodations outside the submitted work. Nitin Puri reports Payment for lectures including service on speakers bureaus from Fujifilm Sonosite and royalties from Elsevier, both outside the submitted work. All other authors have nothing to disclose.
Funding
Brian P Lucas: Department of Veterans Affairs, Veterans Health Administration, Office of Research and Development and Dartmouth SYNERGY, National Institutes of Health, National Center for Translational Science (UL1TR001086). Nilam Soni: Department of Veterans Affairs, Quality Enhancement Research Initiative (QUERI) Partnered Evaluation Initiative Grant (HX002263-01A1)
Disclaimer
The contents of this publication do not represent the views of the U.S. Department of Veterans Affairs or the United States Government.
The authors thank all the members of the Society of Hospital Medicine Point-of-care Ultrasound Task Force and the Education Committee members for their time and dedication to develop these guidelines.
CHAIRS: Nilam Soni, Ricardo Franco Sadud, Jeff Bates. WORKING GROUPS: Thoracentesis Working Group: Ria Dancel (chair), Daniel Schnobrich, Nitin Puri. Vascular Access Working Group: Ricardo Franco (chair), Benji Matthews, Saaid Abdel-Ghani, Sophia Rodgers, Martin Perez, Daniel Schnobrich. Paracentesis Working Group: Joel Cho (chair), Benji Matthews, Kreegan Reierson, Anjali Bhagra, Trevor P. Jensen. Lumbar puncture Working Group: Nilam Soni (chair), Ricardo Franco, Gerard Salame, Josh Lenchus, Venkat Kalidindi, Ketino Kobaidze. Credentialing Working Group: Brian P Lucas (chair), David Tierney, Trevor P. Jensen. PEER REVIEWERS: Robert Arntfield, Michael Blaivas, Richard Hoppmann, Paul Mayo, Vicki Noble, Aliaksei Pustavoitau, Kirk Spencer, Vivek Tayal. METHODOLOGIST: Mahmoud El Barbary. LIBRARIAN: Loretta Grikis. SOCIETY OF HOSPITAL MEDICINE EDUCATION COMMITTEE: Dan Brotman (past chair), Satyen Nichani (current chair), Susan Hunt. SOCIETY OF HOSPITAL MEDICINE STAFF: Nick Marzano.
1. Owings MF, Kozak LJ. Ambulatory and inpatient procedures in the United States, 1996. Vital Health Stat 13. 1998;139:1-119. PubMed
2. Kozmic SE, Wayne DB, Feinglass J, Hohmann SF, Barsuk JH. Factors associated with inpatient thoracentesis procedure quality at university hospitals. Jt Comm J Qual Patient Saf. 2016;42(1):34-40. PubMed
3. Gordon CE, Feller-Kopman D, Balk EM, Smetana GW. Pneumothorax following thoracentesis: a systematic review and meta-analysis. Arch Intern Med. 2010;170(4):332-339. PubMed
4. Mercaldi CJ, Lanes SF. Ultrasound guidance decreases complications and improves the cost of care among patients undergoing thoracentesis and paracentesis. Chest. 2013;143(2):532-538. PubMed
5. Jones PW, Moyers JP, Rogers JT, Rodriguez RM, Lee YC, Light RW. Ultrasound-guided thoracentesis: is it a safer method? Chest. 2003;123(2):418-423. PubMed
6. Raptopoulos V, Davis LM, Lee G, Umali C, Lew R, Irwin RS. Factors affecting the development of pneumothorax associated with thoracentesis. AJR Am J Roentgenol. 1991;156(5):917-920. PubMed
7. Grogan DR, Irwin RS, Channick R, et al. Complications associated with thoracentesis. A prospective, randomized study comparing three different methods. Arch Intern Med. 1990;150(4):873-877. PubMed
8. Ravin CE. Thoracocentesis of loculated pleural effusions using grey scale ultrasonic guidance. Chest. 1977;71(5):666-668. PubMed
9. Weingardt JP, Guico RR, Nemcek AA, Jr., Li YP, Chiu ST. Ultrasound findings following failed, clinically directed thoracenteses. J Clin Ultrasound. 1994;22(7):419-426. PubMed
10. Pihlajamaa K, Bode MK, Puumalainen T, Lehtimaki A, Marjelund S, Tikkakoski T. Pneumothorax and the value of chest radiography after ultrasound-guided thoracocentesis. Acta Radiol. 2004;45(8):828-832. PubMed
11. Gervais DA, Petersein A, Lee MJ, Hahn PF, Saini S, Mueller PR. US-guided thoracentesis: requirement for postprocedure chest radiography in patients who receive mechanical ventilation versus patients who breathe spontaneously. Radiology. 1997;204(2):503-506. PubMed
12. Boland GW, Gazelle GS, Girard MJ, Mueller PR. Asymptomatic hydropneumothorax after therapeutic thoracentesis for malignant pleural effusions. AJR Am J Roentgenol. 1998;170(4):943-946. PubMed
13. Havelock T, Teoh R, Laws D, Gleeson F. Pleural procedures and thoracic ultrasound: British Thoracic Society Pleural Disease Guideline 2010. Thorax. 2010;65(2):ii61-76. PubMed
14. Fitch K, Bernstein SJ, Aguilar MD, Burnand B, LaCalle JR. The RAND/UCLA appropriateness method user’s manual. DTIC Document; 2001.
15. Perazzo A, Gatto P, Barlascini C, Ferrari-Bravo M, Nicolini A. Can ultrasound guidance reduce the risk of pneumothorax following thoracentesis? J Bras Pneumol. 2014;40(1):6-12. PubMed
16. Barnes TW, Morgenthaler TI, Olson EJ, Hesley GK, Decker PA, Ryu JH. Sonographically guided thoracentesis and rate of pneumothorax. J Clin Ultrasound. 2005;33(9):442-446. PubMed
17. Cavanna L, Mordenti P, Berte R, et al. Ultrasound guidance reduces pneumothorax rate and improves safety of thoracentesis in malignant pleural effusion: report on 445 consecutive patients with advanced cancer. World J Surg Oncol. 2014;12:139. PubMed
18. Patel PA, Ernst FR, Gunnarsson CL. Ultrasonography guidance reduces complications and costs associated with thoracentesis procedures. J Clin Ultrasound. 2012;40(3):135-141. PubMed
19. Diacon AH, Brutsche MH, Soler M. Accuracy of pleural puncture sites: a prospective comparison of clinical examination with ultrasound. Chest. 2003;123(2):436-441. PubMed
20. Duncan DR, Morgenthaler TI, Ryu JH, Daniels CE. Reducing iatrogenic risk in thoracentesis: establishing best practice via experiential training in a zero-risk environment. Chest. 2009;135(5):1315-1320. PubMed
21. Ault MJ, Rosen BT, Scher J, Feinglass J, Barsuk JH. Thoracentesis outcomes: a 12-year experience. Thorax. 2015;70(2):127-132. PubMed
22. Lichtenstein D, Hulot JS, Rabiller A, Tostivint I, Meziere G. Feasibility and safety of ultrasound-aided thoracentesis in mechanically ventilated patients. Intensive Care Med. 1999;25(9):955-958. PubMed
23. Mayo PH, Goltz HR, Tafreshi M, Doelken P. Safety of ultrasound-guided thoracentesis in patients receiving mechanical ventilation. Chest. 2004;125(3):1059-1062. PubMed
24. Goligher EC, Leis JA, Fowler RA, Pinto R, Adhikari NK, Ferguson ND. Utility and safety of draining pleural effusions in mechanically ventilated patients: a systematic review and meta-analysis. Crit Care. 2011;15(1):R46. PubMed
25. Landay M, Harless W. Ultrasonic differentiation of right pleural effusion from subphrenic fluid on longitudinal scans of the right upper quadrant: importance of recognizing the diaphragm. Radiology. 1977;123(1):155-158. PubMed
26. Mayo PH, Doelken P. Pleural ultrasonography. Clin Chest Med. 2006;27(2):215-227. PubMed
27. Rosenberg ER. Ultrasound in the assessment of pleural densities. Chest. 1983;84(3):283-285. PubMed
28. Gorg C, Restrepo I, Schwerk WB. Sonography of malignant pleural effusion. Eur Radiol. 1997;7(8):1195-1198. PubMed
29. Gryminski J, Krakowka P, Lypacewicz G. The diagnosis of pleural effusion by ultrasonic and radiologic techniques. Chest. 1976;70(1):33-37. PubMed
30. Kalokairinou-Motogna M, Maratou K, Paianid I, et al. Application of color Doppler ultrasound in the study of small pleural effusion. Med Ultrason. 2010;12(1):12-16. PubMed
31. Lichtenstein D, Goldstein I, Mourgeon E, Cluzel P, Grenier P, Rouby JJ. Comparative diagnostic performances of auscultation, chest radiography, and lung ultrasonography in acute respiratory distress syndrome. Anesthesiology. 2004;100(1):9-15. PubMed
32. Grimberg A, Shigueoka DC, Atallah AN, Ajzen S, Iared W. Diagnostic accuracy of sonography for pleural effusion: systematic review. Sao Paulo Med J.. 2010;128(2):90-95. PubMed
33. Kataoka H. Utility of thoracic sonography for follow-up examination of chronic heart failure patients with previous decompensation. Clin Cardiol. 2007;30(7):336-341. PubMed
34. Ma OJ, Mateer JR. Trauma ultrasound examination versus chest radiography in the detection of hemothorax. Ann Emerg Med. 1997;29(3):312-315. PubMed
35. Rocco M, Carbone I, Morelli A, et al. Diagnostic accuracy of bedside ultrasonography in the ICU: feasibility of detecting pulmonary effusion and lung contusion in patients on respiratory support after severe blunt thoracic trauma. Acta Anaesthesiol Scand. 2008;52(6):776-784. PubMed
36. Kocijancic I, Vidmar K, Ivanovi-Herceg Z. Chest sonography versus lateral decubitus radiography in the diagnosis of small pleural effusions. J Clin Ultrasound. 2003;31(2):69-74. PubMed
37. Lichtenstein DA. Lung ultrasound in the critically ill. Ann Intensive Care. 2014;4(1):1. PubMed
38. Soni NJ, Franco R, Velez MI, et al. Ultrasound in the diagnosis and management of pleural effusions. J Hosp Med. 2015;10(12):811-816. PubMed
39. Medford AR, Entwisle JJ. Indications for thoracic ultrasound in chest medicine: an observational study. Postgrad Med J. 2010;86(1011):8-11. PubMed
40. Lin MS, Hwang JJ, Chong IW, et al. Ultrasonography of chest diseases: analysis of 154 cases. Gaoxiong Yi Xue Ke Xue Za Zhi . 1992;8(10):525-534. PubMed
41. Eibenberger KL, Dock WI, Ammann ME, Dorffner R, Hormann MF, Grabenwoger F. Quantification of pleural effusions: sonography versus radiography. Radiology. 1994;191(3):681-684. PubMed
42. Vignon P, Chastagner C, Berkane V, et al. Quantitative assessment of pleural effusion in critically ill patients by means of ultrasonography. Crit Care Med. 2005;33(8):1757-1763. PubMed
43. Usta E, Mustafi M, Ziemer G. Ultrasound estimation of volume of postoperative pleural effusion in cardiac surgery patients. Interact Cardiovasc Thorac Surg. 2010;10(2):204-207. PubMed
44. Remerand F, Dellamonica J, Mao Z, et al. Multiplane ultrasound approach to quantify pleural effusion at the bedside. Intensive Care Med. 2010;36(4):656-664.
PubMed
45. Balik M, Plasil P, Waldauf P, et al. Ultrasound estimation of volume of pleural fluid in mechanically ventilated patients. Intensive Care Med. 2006;32(2):318-321. PubMed
46. Zanforlin A, Gavelli G, Oboldi D, Galletti S. Ultrasound-guided thoracentesis: the V-point as a site for optimal drainage positioning. Eur Rev Med Pharmacol Sci. 2013;17(1):25-28. PubMed
47. Lisi M, Cameli M, Mondillo S, et al. Incremental value of pocket-sized imaging device for bedside diagnosis of unilateral pleural effusions and ultrasound-guided thoracentesis. Interact Cardiovasc Thorac Surg. 2012;15(4):596-601. PubMed
48. Xirouchaki N, Kondili E, Prinianakis G, Malliotakis P, Georgopoulos D. Impact of lung ultrasound on clinical decision making in critically ill patients. Intensive Care Med. 2014;40(1):57-65. PubMed
49. Chen HJ, Tu CY, Ling SJ, et al. Sonographic appearances in transudative pleural effusions: not always an anechoic pattern. Ultrasound Med Biol. 2008;34(3):362-369. PubMed
50. Yang PC, Luh KT, Chang DB, Wu HD, Yu CJ, Kuo SH. Value of sonography in determining the nature of pleural effusion: analysis of 320 cases. AJR Am J Roentgenol. 1992;159(1):29-33. PubMed
51. Liang SJ, Tu CY, Chen HJ, et al. Application of ultrasound-guided pigtail catheter for drainage of pleural effusions in the ICU. Intensive Care Med. 2009;35(2):350-354. PubMed
52. McLoud TC, Flower CD. Imaging the pleura: sonography, CT, and MR imaging. AJR Am J Roentgenol. 1991;156(6):1145-1153. PubMed
53. Tu CY, Hsu WH, Hsia TC, et al. Pleural effusions in febrile medical ICU patients: chest ultrasound study. Chest. 2004;126(4):1274-1280. PubMed
54. Sajadieh H, Afzali F, Sajadieh V, Sajadieh A. Ultrasound as an alternative to aspiration for determining the nature of pleural effusion, especially in older people. Ann N Y Acad Sci. 2004;1019:585-592. PubMed
55. Marcun R, Sustic A. Sonographic evaluation of unexplained pleural exudate: a prospective case series. Wien Klin Wochenschr. 2009;121(9-10):334-338. PubMed
56. Bugalho A, Ferreira D, Dias SS, et al. The diagnostic value of transthoracic ultrasonographic features in predicting malignancy in undiagnosed pleural effusions: a prospective observational study. Respiration. 2014;87(4):270-278. PubMed
57. Salamonsen MR, Lo AK, Ng AC, Bashirzadeh F, Wang WY, Fielding DI. Novel use of pleural ultrasound can identify malignant entrapped lung prior to effusion drainage. Chest. 2014;146(5):1286-1293. PubMed
58. Himelman RB, Callen PW. The prognostic value of loculations in parapneumonic pleural effusions. Chest. 1986;90(6):852-856. PubMed
59. Chen CH, Chen W, Chen HJ, et al. Transthoracic ultrasonography in predicting the outcome of small-bore catheter drainage in empyemas or complicated parapneumonic effusions. Ultrasound Med Biol. 2009;35(9):1468-1474. PubMed
60. Hirsch JH, Rogers JV, Mack LA. Real-time sonography of pleural opacities. AJR Am J Roentgenol. 1981;136(2):297-301. PubMed
61. Chen KY, Liaw YS, Wang HC, Luh KT, Yang PC. Sonographic septation: a useful prognostic indicator of acute thoracic empyema. J Ultrasound Med. 2000;19(12):837-843. PubMed
62. Diaz-Guzman E, Budev MM. Accuracy of the physical examination in evaluating pleural effusion. Cleve Clin J Med. 2008;75(4):297-303. PubMed
63. Rhyne T, Birnholz JC. Simple measurement of chest-wall thickness with ultrasound. Radiology. 1973;108(2):436-438. PubMed
64. Ding W, Shen Y, Yang J, He X, Zhang M. Diagnosis of pneumothorax by radiography and ultrasonography: a meta-analysis. Chest. 2011;140(4):859-866. PubMed
65. Lichtenstein D, Meziere G, Biderman P, Gepner A. The “lung point”: an ultrasound sign specific to pneumothorax. Intensive Care Med. 2000;26(10):1434-1440. PubMed
66. Shostak E, Brylka D, Krepp J, Pua B, Sanders A. Bedside sonography for detection of postprocedure pneumothorax. J Ultrasound Med. 2013;32(6):1003-1009. PubMed
67. Alrajab S, Youssef AM, Akkus NI, Caldito G. Pleural ultrasonography versus chest radiography for the diagnosis of pneumothorax: review of the literature and meta-analysis. Crit Care. 2013;17(5):R208. PubMed
68. Alrajhi K, Woo MY, Vaillancourt C. Test characteristics of ultrasonography for the detection of pneumothorax: a systematic review and meta-analysis. Chest. 2012;141(3):703-708. PubMed
69. Sartori S, Tombesi P, Trevisani L, Nielsen I, Tassinari D, Abbasciano V. Accuracy of transthoracic sonography in detection of pneumothorax after sonographically guided lung biopsy: prospective comparison with chest radiography. AJR Am J Roentgenol. 2007;188(1):37-41. PubMed
70. Blaivas M, Lyon M, Duggal S. A prospective comparison of supine chest radiography and bedside ultrasound for the diagnosis of traumatic pneumothorax. Acad Emerg Med. 2005;12(9):844-849. PubMed
71. Lichtenstein DA, Meziere G, Lascols N, et al. Ultrasound diagnosis of occult pneumothorax. Crit Care Med. 2005;33(6):1231-1238. PubMed
72. Kohan JM, Poe RH, Israel RH, et al. Value of chest ultrasonography versus decubitus roentgenography for thoracentesis. Am Rev Respir Dis. 1986;133(6):1124-1126. PubMed
73. Capizzi SA, Prakash UB. Chest roentgenography after outpatient thoracentesis. Mayo Clin Proc. 1998;73(10):948-950. PubMed
74. Aleman C, Alegre J, Armadans L, et al. The value of chest roentgenography in the diagnosis of pneumothorax after thoracentesis. Am J Med. 1999;107(4):340-343. PubMed
75. Petersen WG, Zimmerman R. Limited utility of chest radiograph after thoracentesis. Chest. 2000;117(4):1038-1042. PubMed
76. Begot E, Grumann A, Duvoid T, et al. Ultrasonographic identification and semiquantitative assessment of unloculated pleural effusions in critically ill patients by residents after a focused training. Intensive Care Med. 2014;40(10):1475-1480. PubMed
77. Kotagal M, Quiroga E, Ruffatto BJ, et al. Impact of point-of-care ultrasound training on surgical residents’ confidence. J Surg Educ. 2015;72(4):e82-87. PubMed
78. Beaulieu Y, Laprise R, Drolet P, et al. Bedside ultrasound training using web-based e-learning and simulation early in the curriculum of residents. Crit Ultrasound J. 2015;7:1. PubMed
79. Schnobrich DJ, Olson AP, Broccard A, Duran-Nelson A. Feasibility and acceptability of a structured curriculum in teaching procedural and basic diagnostic ultrasound skills to internal medicine residents. J Grad Med Educ. 2013;5(3):493-497. PubMed
80. Chalumeau-Lemoine L, Baudel JL, Das V, et al. Results of short-term training of naive physicians in focused general ultrasonography in an intensive-care unit. Intensive Care Med. 2009;35(10):1767-1771. PubMed
81. Keddis MT, Cullen MW, Reed DA, et al. Effectiveness of an ultrasound training module for internal medicine residents. BMC Med Educ. 2011;11:75. PubMed
82. Ramsingh D, Alexander B, Le K, Williams W, Canales C, Cannesson M. Comparison of the didactic lecture with the simulation/model approach for the teaching of a novel perioperative ultrasound curriculum to anesthesiology residents. J Clin Anesth. 2014;26(6):443-454. PubMed
83. Sekiguchi H, Bhagra A, Gajic O, Kashani KB. A general Critical Care Ultrasonography workshop: results of a novel Web-based learning program combined with simulation-based hands-on training. J Crit Care. 2013;28(2):217.e217-212. PubMed
84. Dulohery MM, Stoven S, Kurklinsky AK, Halvorsen A, McDonald FS, Bhagra A. Ultrasound for internal medicine physicians: the future of the physical examination. J Ultrasound Med. 2014;33(6):1005-1011. PubMed
85. Lenchus J, Issenberg SB, Murphy D, et al. A blended approach to invasive bedside procedural instruction. Med Teach. 2011;33(2):116-123. PubMed
86. Lenchus JD. End of the “see one, do one, teach one” era: the next generation of invasive bedside procedural instruction. J Am Osteopath Assoc. 2010;110(6):340-346. PubMed
87. Wayne DB, Barsuk JH, O’Leary KJ, Fudala MJ, McGaghie WC. Mastery learning of thoracentesis skills by internal medicine residents using simulation technology and deliberate practice. J Hosp Med. 2008;3(1):48-54. PubMed
88. Jiang G, Chen H, Wang S, et al. Learning curves and long-term outcome of simulation-based thoracentesis training for medical students. BMC Med Educ. 2011;11:39. PubMed
89. Salamonsen M, McGrath D, Steiler G, Ware R, Colt H, Fielding D. A new instrument to assess physician skill at thoracic ultrasound, including pleural effusion markup. Chest. 2013;144(3):930-934. PubMed
90. Berg D, Berg K, Riesenberg LA, et al. The development of a validated checklist for thoracentesis: preliminary results. Am J Med Qual. 2013;28(3):220-226. PubMed
91. Shurtleff E, Olinger A. Posterior intercostal artery tortuosity and collateral branch points: a cadaveric study. Folia Morphol. 2012;71(4):245-251. PubMed
92. Salamonsen M, Ellis S, Paul E, Steinke K, Fielding D. Thoracic ultrasound demonstrates variable location of the intercostal artery. Respiration. 2012;83(4):323-329. PubMed
93. Salamonsen M, Dobeli K, McGrath D, et al. Physician-performed ultrasound can accurately screen for a vulnerable intercostal artery prior to chest drainage procedures. Respirology. 2013;18(6):942-947. PubMed
94. Helm EJ, Rahman NM, Talakoub O, Fox DL, Gleeson FV. Course and variation of the intercostal artery by CT scan. Chest. 2013;143(3):634-639. PubMed
95. Yoneyama H, Arahata M, Temaru R, Ishizaka S, Minami S. Evaluation of the risk of intercostal artery laceration during thoracentesis in elderly patients by using 3D-CT angiography. Intern Med. 2010;49(4):289-292. PubMed
96. Soldati G, Smargiassi A, Inchingolo R, Sher S, Valente S, Corbo GM. Ultrasound-guided pleural puncture in supine or recumbent lateral position - feasibility study. Multidiscip Respir Med. 2013;8(1):18. PubMed
97. Harnsberger HR, Lee TG, Mukuno DH. Rapid, inexpensive real-time directed thoracentesis. Radiology. 1983;146(2):545-546. PubMed
© 2018 Society of Hospital Medicine
Patterns and Predictors of Short-Term Peripherally Inserted Central Catheter Use: A Multicenter Prospective Cohort Study
Peripherally inserted central catheters (PICCs) are integral to the care of hospitalized patients in the United States.1 Consequently, utilization of these devices in acutely ill patients has steadily increased in the past decade.2 Although originally designed to support the delivery of total parenteral nutrition, PICCs have found broader applications in the hospital setting given the ease and safety of placement, the advances in technology that facilitate insertion, and the growing availability of specially trained vascular nurses that place these devices at the bedside.3 Furthermore, because they are placed in deeper veins of the arm, PICCs are more durable than peripheral catheters and can support venous access for extended durations.4-6
However, the growing use of PICCs has led to the realization that these devices are not without attendant risks. For example, PICCs are associated with venous thromboembolism (VTE) and central-line associated blood stream infection (CLABSI).7,8 Additionally, complications such as catheter occlusion and tip migration commonly occur and may interrupt care or necessitate device removal.9-11 Hence, thoughtful weighing of the risks against the benefits of PICC use prior to placement is necessary. To facilitate such decision-making, we developed the Michigan Appropriateness Guide for Intravenous (IV) Catheters (MAGIC) criteria,12 which is an evidence-based tool that defines when the use of a PICC is appropriate in hospitalized adults.
The use of PICCs for infusion of peripherally compatible therapies for 5 or fewer days is rated as inappropriate by MAGIC.12 This strategy is also endorsed by the Centers for Disease Control and Prevention’s (CDC) guidelines for the prevention of catheter-related infections.13 Despite these recommendations, short-term PICC use remains common. For example, a study conducted at a tertiary pediatric care center reported a trend toward shorter PICC dwell times and increasing rates of early removal.2 However, factors that prompt such short-term PICC use are poorly understood. Without understanding drivers and outcomes of short-term PICC use, interventions to prevent such practice are unlikely to succeed.
Therefore, by using data from a multicenter cohort study, we examined patterns of short-term PICC use and sought to identify which patient, provider, and device factors were associated with such use. We hypothesized that short-term placement would be associated with difficult venous access and would also be associated with the risk of major and minor complications.
METHODS
Study Setting and Design
We used data from the Michigan Hospital Medicine Safety (HMS) Consortium to examine patterns and predictors of short-term PICC use.14 As a multi-institutional clinical quality initiative sponsored by Blue Cross Blue Shield of Michigan and Blue Care Network, HMS aims to improve the quality of care by preventing adverse events in hospitalized medical patients.4,15-17 In January of 2014, dedicated, trained abstractors started collecting data on PICC placements at participating HMS hospitals by using a standard protocol and template for data collection. Patients who received PICCs while admitted to either a general medicine unit or an intensive care unit (ICU) during clinical care were eligible for inclusion. Patients were excluded if they were (a) under the age of 18 years, (b) pregnant, (c) admitted to a nonmedical service (eg, surgery), or (d) admitted under observation status.
Every 14 days, each hospital collected data on the first 17 eligible patients that received a PICC, with at least 7 of these placements occurring in an ICU setting. All patients were prospectively followed until the PICC was removed, death, or until 70 days after insertion, whichever occurred first. For patients who had their PICC removed prior to hospital discharge, follow-up occurred via a review of medical records. For those discharged with a PICC in place, both medical record review and telephone follow-up were performed. To ensure data quality, annual random audits at each participating hospital were performed by the coordinating center at the University of Michigan.
For this analysis, we included all available data as of June 30, 2016. However, HMS hospitals continue to collect data on PICC use and outcomes as part of an ongoing clinical quality initiative to reduce the incidence of PICC-related complications.
Patient, Provider, and Device Data
Patient characteristics, including demographics, detailed medical history, comorbidities, physical findings, laboratory results, and medications were abstracted directly from medical records. To estimate the comorbidity burden, the Charlson-Deyo comorbidity score was calculated for each patient by using data available in the medical record at the time of PICC placement.18 Data, such as the documented indication for PICC insertion and the reason for removal, were obtained directly from medical records. Provider characteristics, including the specialty of the attending physician at the time of insertion and the type of operator who inserted the PICC, were also collected. Institutional characteristics, such as total number of beds, teaching versus nonteaching, and urban versus rural, were obtained from hospital publicly reported data and semiannual surveys of HMS sites.19,20 Data on device characteristics, such as catheter gauge, coating, insertion attempts, tip location, and number of lumens, were abstracted from PICC insertion notes.
Outcomes of Interest
The outcome of interest was short-term PICC use, defined as PICCs removed within 5 days of insertion. Patients who expired with a PICC in situ were excluded. Secondary outcomes of interest included PICC-related complications, categorized as major (eg, symptomatic VTE and CLABSI) or minor (eg, catheter occlusion, superficial thrombosis, mechanical complications [kinking, coiling], exit site infection, and tip migration). Symptomatic VTE was defined as clinically diagnosed deep venous thrombosis (DVT) and/or pulmonary embolism (PE) not present at the time of PICC placement and confirmed via imaging (ultrasound or venogram for DVT; computed tomography scan, ventilation perfusion scan, or pulmonary angiogram for PE). CLABSI was defined in accordance with the CDC’s National Healthcare Safety Network criteria or according to Infectious Diseases Society of America recommendations.21,22 All minor PICC complications were defined in accordance with prior published definitions.4
Statistical Analysis
Cases of short-term PICC use were identified and compared with patients with a PICC dwell time of 6 or more days by patient, provider, and device characteristics. The initial analyses for the associations of putative factors with short-term PICC use were performed using χ2 or Wilcoxon tests for categorical and continuous variables, respectively. Univariable mixed effect logistic regression models (with a random hospital-specific intercept) were then used to control for hospital-level clustering. Next, a mixed effects multivariable logistic regression model was used to identify factors associated with short-term PICC use. Variables with P ≤ .25 were considered as candidate predictors for the final multivariable model, which was chosen through a stepwise variable selection algorithm performed on 1000 bootstrapped data sets.23 Variables in the final model were retained based on their frequency of selection in the bootstrapped samples, significance level, and contribution to the overall model likelihood. Results were expressed as odds ratios (OR) with corresponding 95% confidence intervals (CI). SAS for Windows (version 9.3, SAS Institute Inc., Cary, NC) was used for analyses.
Ethical and Regulatory Oversight
The study was classified as “not regulated” by the Institutional Review Board at the University of Michigan (HUM00078730).
RESULTS
Overall Characteristics of the Study Cohort
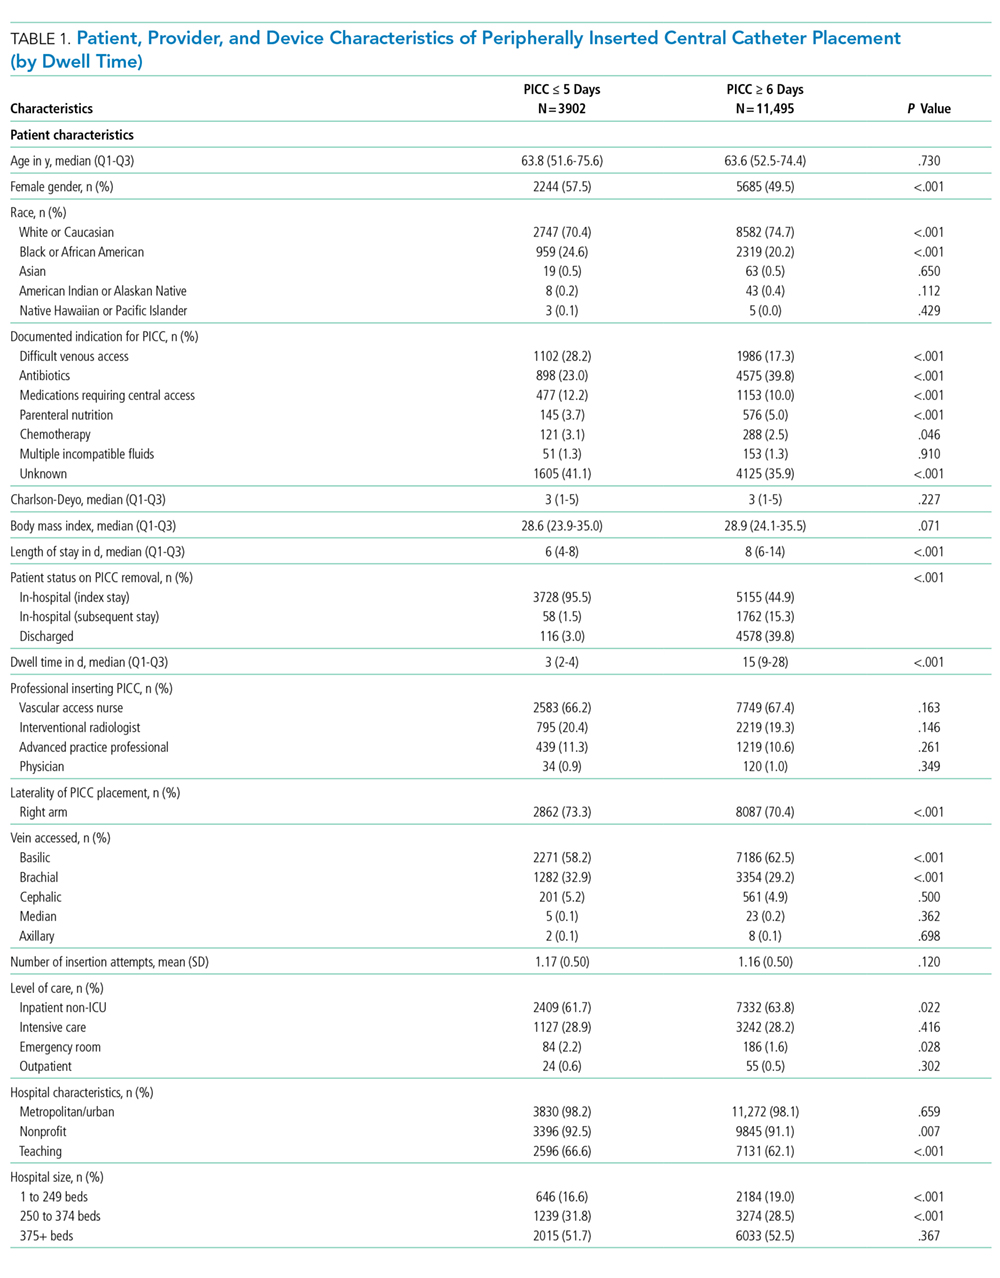
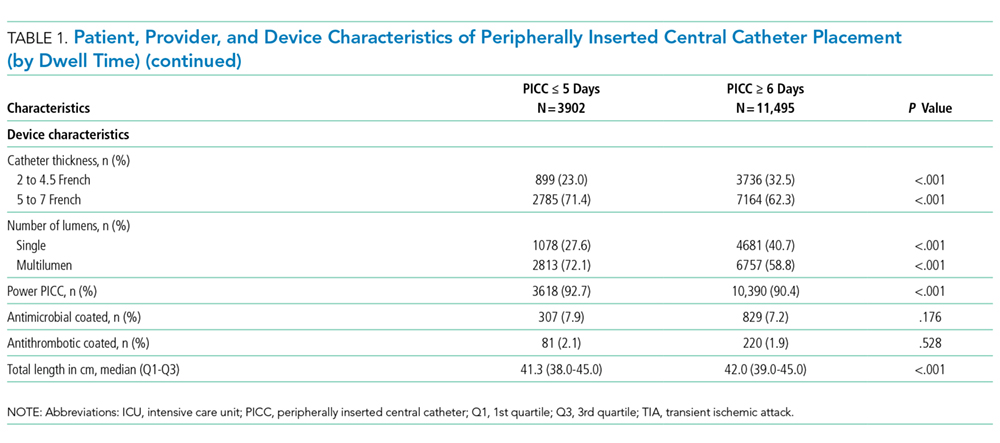
Characteristics of Short-Term Peripherally Inserted Central Catheter Use
Of the 15,397 PICCs included, we identified 3902 PICCs (25.3%) with a dwell time of ≤5 days (median = 3 days; IQR, 2-4 days). When compared to PICCs that were in place for longer durations, no significant differences in age or comorbidity scores were observed. Importantly, despite recommendations to avoid PICCs in patients with moderate to severe chronic kidney disease (glomerular filtration rate [GFR] ≤ 59 ml/min), 1292 (33.1%) short-term PICCs occurred in patients that met such criteria.
Among short-term PICCs, 3618 (92.7%) were power-capable devices, 2785 (71.4%) were 5-French, and 2813 (72.1%) were multilumen. Indications for the use of short-term PICCs differed from longer term devices in important ways (P < .001). For example, the most common documented indication for short-term PICC use was difficult venous access (28.2%), while for long-term PICCs, it was antibiotic administration (39.8%). General internists and hospitalists were the most common attending physicians for patients with short-term and long-term PICCs (65.1% and 65.5%, respectively [P = .73]). Also, the proportion of critical care physicians responsible for patients with short versus long-term PICC use was similar (14.0% vs 15.0%, respectively [P = .123]). Of the short-term PICCs, 2583 (66.2%) were inserted by vascular access nurses, 795 (20.4%) by interventional radiologists, and 439 (11.3%) by advance practice professionals. Almost all of the PICCs placed ≤5 days (95.5%) were removed during hospitalization.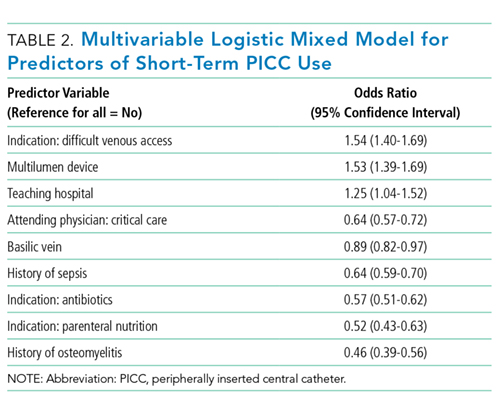
Complications Associated with Short-Term Peripherally Inserted Central Catheter Use
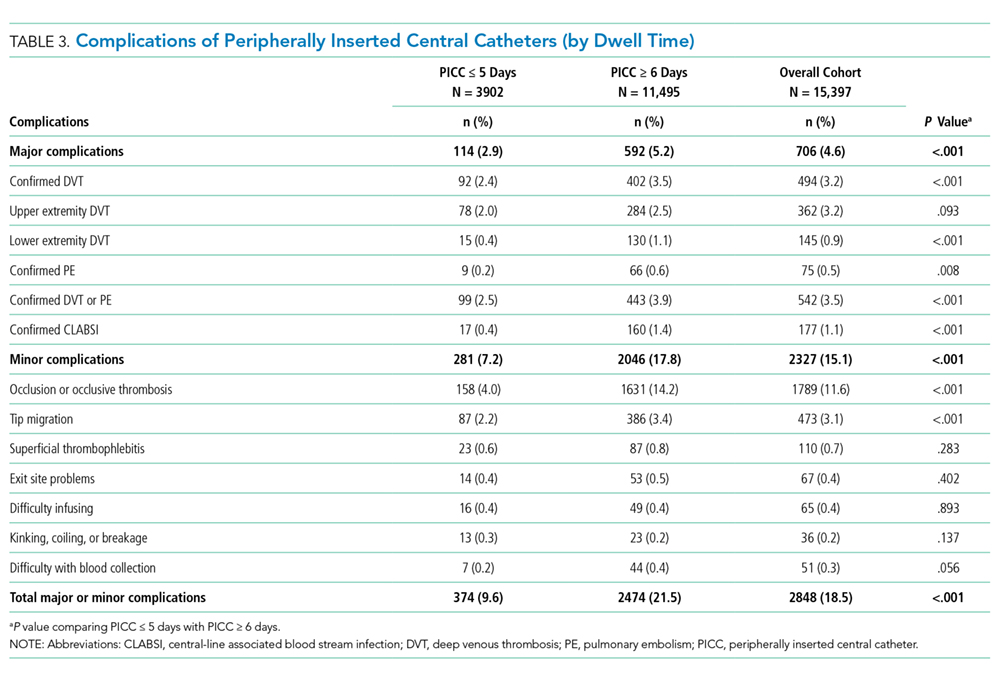
DISCUSSION
This large, multisite prospective cohort study is the first to examine patterns and predictors of short-term PICC use in hospitalized adults. By examining clinically granular data derived from the medical records of patients across 52 hospitals, we found that short-term use was common, representing 25% of all PICCs placed. Almost all such PICCs were removed prior to discharge, suggesting that they were placed primarily to meet acute needs during hospitalization. Multivariable models indicated that patients with difficult venous access, multilumen devices, and teaching hospital settings were associated with short-term use. Given that (a) short term PICC use is not recommended by published evidence-based guidelines,12,13 (b) both major and minor complications were not uncommon despite brief exposure, and (c) specific factors might be targeted to avoid such use, strategies to improve PICC decision-making in the hospital appear increasingly necessary.
In our study, difficult venous access was the most common documented indication for short-term PICC placement. For patients in whom an anticipated catheter dwell time of 5 days or less is expected, MAGIC recommends the consideration of midline or peripheral IV catheters placed under ultrasound guidance.12 A midline is a type of peripheral IV catheter that is about 7.5 cm to 25 cm in length and is typically inserted in the larger diameter veins of the upper extremity, such as the cephalic or basilic veins, with the tip terminating distal to the subclavian vein.7,12 While there is a paucity of information that directly compares PICCs to midlines, some data suggest a lower risk of bloodstream infection and thrombosis associated with the latter.24-26 For example, at one quaternary teaching hospital, house staff who are trained to insert midline catheters under ultrasound guidance in critically ill patients with difficult venous access reported no CLABSI and DVT events.26
Interestingly, multilumen catheters were used twice as often as single lumen catheters in patients with short-term PICCs. In these instances, the use of additional lumens is questionable, as infusion of multiple incompatible fluids was not commonly listed as an indication prompting PICC use. Because multilumen PICCs are associated with higher risks of both VTE and CLABSI compared to single lumen devices, such use represents an important safety concern.27-29 Institutional efforts that not only limit the use of multilumen PICCs but also fundamentally define when use of a PICC is appropriate may substantially improve outcomes related to vascular access.28,30,31We observed that short-term PICCs were more common in teaching compared to nonteaching hospitals. While the design of the present study precludes understanding the reasons for such a difference, some plausible theories include the presence of physician trainees who may not appreciate the risks of PICC use, diminishing peripheral IV access securement skills, and the lack of alternatives to PICC use. Educating trainees who most often order PICCs in teaching settings as to when they should or should not consider this device may represent an important quality improvement opportunity.32 Similarly, auditing and assessing the clinical skills of those entrusted to place peripheral IVs might prove helpful.33,34 Finally, the introduction of a midline program, or similar programs that expand the scope of vascular access teams to place alternative devices, should be explored as a means to improve PICC use and patient safety.
Our study also found that a third of patients who received PICCs for 5 or fewer days had moderate to severe chronic kidney disease. In these patients who may require renal replacement therapy, prior PICC placement is among the strongest predictors of arteriovenous fistula failure.35,36 Therefore, even though national guidelines discourage the use of PICCs in these patients and recommend alternative routes of venous access,12,37,38 such practice is clearly not happening. System-based interventions that begin by identifying patients who require vein preservation (eg, those with a GFR < 45 ml/min) and are therefore not appropriate for a PICC would be a welcomed first step in improving care for such patients.37,38Our study has limitations. First, the observational nature of the study limits the ability to assess for causality or to account for the effects of unmeasured confounders. Second, while the use of medical records to collect granular data is valuable, differences in documentation patterns within and across hospitals, including patterns of missing data, may produce a misclassification of covariates or outcomes. Third, while we found that higher rates of short-term PICC use were associated with teaching hospitals and patients with difficult venous access, we were unable to determine the precise reasons for this practice trend. Qualitative or mixed-methods approaches to understand provider decision-making in these settings would be welcomed.
Our study also has several strengths. First, to our knowledge, this is the first study to systematically describe and evaluate patterns and predictors of short-term PICC use. The finding that PICCs placed for difficult venous access is a dominant category of short-term placement confirms clinical suspicions regarding inappropriate use and strengthens the need for pathways or protocols to manage such patients. Second, the inclusion of medical patients in diverse institutions offers not only real-world insights related to PICC use, but also offers findings that should be generalizable to other hospitals and health systems. Third, the use of a robust data collection strategy that emphasized standardized data collection, dedicated trained abstractors, and random audits to ensure data quality strengthen the findings of this work. Finally, our findings highlight an urgent need to develop policies related to PICC use, including limiting the use of multiple lumens and avoidance in patients with moderate to severe kidney disease.
In conclusion, short-term use of PICCs is prevalent and associated with key patient, provider, and device factors. Such use is also associated with complications, such as catheter occlusion, tip migration, VTE, and CLABSI. Limiting the use of multiple-lumen PICCs, enhancing education for when a PICC should be used, and defining strategies for patients with difficult access may help reduce inappropriate PICC use and improve patient safety. Future studies to examine implementation of such interventions would be welcomed.
Disclosure: Drs. Paje, Conlon, Swaminathan, and Boldenow disclose no conflicts of interest. Dr. Chopra has received honoraria for talks at hospitals as a visiting professor. Dr. Flanders discloses consultancies for the Institute for Healthcare Improvement and the Society of Hospital Medicine, royalties from Wiley Publishing, honoraria for various talks at hospitals as a visiting professor, grants from the CDC Foundation, Agency for Healthcare Research and Quality, Blue Cross Blue Shield of Michigan (BCBSM), and Michigan Hospital Association, and expert witness testimony. Dr. Bernstein discloses consultancies for Blue Care Network and grants from BCBSM, Department of Veterans Affairs, and National Institutes of Health. Dr. Kaatz discloses no relevant conflicts of interest. BCBSM and Blue Care Network provided support for the Michigan HMS Consortium as part of the BCBSM Value Partnerships program. Although BCBSM and HMS work collaboratively, the opinions, beliefs, and viewpoints expressed by the author do not necessarily reflect the opinions, beliefs, and viewpoints of BCBSM or any of its employees. Dr. Chopra is supported by a career development award from the Agency for Healthcare Research and Quality (1-K08-HS022835-01). BCBSM and Blue Care Network supported data collection at each participating site and funded the data coordinating center but had no role in study concept, interpretation of findings, or in the preparation, final approval, or decision to submit the manuscript.
1. Al Raiy B, Fakih MG, Bryan-Nomides N, et al. Peripherally inserted central venous catheters in the acute care setting: A safe alternative to high-risk short-term central venous catheters. Am J Infect Control. 2010;38(2):149-153. PubMed
2. Gibson C, Connolly BL, Moineddin R, Mahant S, Filipescu D, Amaral JG. Peripherally inserted central catheters: use at a tertiary care pediatric center. J Vasc Interv Radiol. 2013;24(9):1323-1331. PubMed
3. Chopra V, Flanders SA, Saint S. The problem with peripherally inserted central catheters. JAMA. 2012;308(15):1527-1528. PubMed
4. Chopra V, Smith S, Swaminathan L, et al. Variations in Peripherally Inserted Central Catheter Use and Outcomes in Michigan Hospitals. JAMA Intern Med. 2016;176(4):548-551. PubMed
5. Cowl CT, Weinstock JV, Al-Jurf A, Ephgrave K, Murray JA, Dillon K. Complications and cost associated with parenteral nutrition delivered to hospitalized patients through either subclavian or peripherally-inserted central catheters. Clin Nutr. 2000;19(4):237-243. PubMed
6. MacDonald AS, Master SK, Moffitt EA. A comparative study of peripherally inserted silicone catheters for parenteral nutrition. Can J Anaesth. 1977;24(2):263-269. PubMed
7. Chopra V, O’Horo JC, Rogers MA, Maki DG, Safdar N. The risk of bloodstream infection associated with peripherally inserted central catheters compared with central venous catheters in adults: a systematic review and meta-analysis. Infect Control Hosp Epidemiol. 2013;34(9):908-918. PubMed
8. Chopra V, Anand S, Hickner A, et al. Risk of venous thromboembolism associated with peripherally inserted central catheters: a systematic review and meta-analysis. Lancet. 2013;382(9889):311-325. PubMed
9. Beccaria P, Silvetti S, Mucci M, Battini I, Brambilla P, Zangrillo A. Contributing factors for a late spontaneous peripherally inserted central catheter migration: a case report and review of literature. J Vasc Access. 2015;16(3):178-182. PubMed
10. Turcotte S, Dube S, Beauchamp G. Peripherally inserted central venous catheters are not superior to central venous catheters in the acute care of surgical patients on the ward. World J Surg. 2006;30(8):1605-1619. PubMed
11. Pikwer A, Akeson J, Lindgren S. Complications associated with peripheral or central routes for central venous cannulation. Anaesthesia. 2012;67(1):65-71. PubMed
12. Chopra V, Flanders SA, Saint S, et al. The Michigan Appropriateness Guide for Intravenous Catheters (MAGIC): Results From a Multispecialty Panel Using the RAND/UCLA Appropriateness Method. Ann Intern Med. 15 2015;163(6 Suppl):S1-S40. PubMed
13. O’Grady NP, Alexander M, Burns LA, et al. Guidelines for the prevention of intravascular catheter-related infections. Am J Infect Control. 2011;39(4 Suppl 1):S1-S34. PubMed
14. Michigan Hospital Medicine Safety Consortium. 2016; http://mi-hms.org/. Accessed November 11, 2016.
15. Greene MT, Spyropoulos AC, Chopra V, et al. Validation of Risk Assessment Models of Venous Thromboembolism in Hospitalized Medical Patients. Am J Med. 2016;129(9):1001.e1009-1001.e1018. PubMed
16. Greene MT, Flanders SA, Woller SC, Bernstein SJ, Chopra V. The Association Between PICC Use and Venous Thromboembolism in Upper and Lower Extremities. Am J Med. 2015;128(9):986-993. PubMed
17. Flanders SA, Greene MT, Grant P, et al. Hospital performance for pharmacologic venous thromboembolism prophylaxis and rate of venous thromboembolism : a cohort study. JAMA Intern Med. 2014;174(10):1577-1584. PubMed
18. Deyo RA, Cherkin DC, Ciol MA. Adapting a clinical comorbidity index for use with ICD-9-CM administrative databases. J Clin Epidemiol. 1992;45(6):613-619. PubMed
19. Hospital Bed Inventory. 2016; http://www.michigan.gov/documents/mdhhs/HOSPBEDINV_October_3__2016_536834_7.pdf. Accessed November 22, 2016.
20. Compare Hospitals. 2016; http://www.leapfroggroup.org/compare-hospitals. Accessed November 22, 2016.
21. NHSN Patient Safety Component Manual. 2016; http://www.cdc.gov/nhsn/pdfs/pscmanual/pcsmanual_current.pdf. Accessed November 22, 2016.
22. Mermel LA, Allon M, Bouza E, et al. Clinical practice guidelines for the diagnosis and management of intravascular catheter-related infection: 2009 Update by the Infectious Diseases Society of America. Clin Infect Dis. 2009;49(1):1-45. PubMed
23. Austin PC, Tu JV. Bootstrap Methods for Developing Predictive Models. Am Stat. 2004;58(2):131-137.
24. Pathak R, Patel A, Enuh H, Adekunle O, Shrisgantharajah V, Diaz K. The Incidence of Central Line-Associated Bacteremia After the Introduction of Midline Catheters in a Ventilator Unit Population. Infect Dis Clin Pract. 2015;23(3):131-134. PubMed
25. Adams DZ, Little A, Vinsant C, Khandelwal S. The Midline Catheter: A Clinical Review. J Emerg Med. 2016;51(3):252-258. PubMed
26. Deutsch GB, Sathyanarayana SA, Singh N, Nicastro J. Ultrasound-guided placement of midline catheters in the surgical intensive care unit: a cost-effective proposal for timely central line removal. J Surg Res. 2014;191(1):1-5. PubMed
27. Chopra V, Anand S, Krein SL, Chenoweth C, Saint S. Bloodstream Infection, Venous Thrombosis, and Peripherally Inserted Central Catheters: Reappraising the Evidence. Am J Med. 2012;125(8):733-741. PubMed
28. Ratz D, Hofer T, Flanders SA, Saint S, Chopra V. Limiting the Number of Lumens in Peripherally Inserted Central Catheters to Improve Outcomes and Reduce Cost: A Simulation Study. Infect Control Hosp Epidemiol. 2016;37(7):811-817. PubMed
29. Pongruangporn M, Ajenjo MC, Russo AJ, et al. Patient- and device-specific risk factors for peripherally inserted central venous catheter-related bloodstream infections. Infect Control Hosp Epidemiol. 2013;34(2):184-189. PubMed
30. Shannon RP, Patel B, Cummins D, Shannon AH, Ganguli G, Lu Y. Economics of central line--associated bloodstream infections. Am J Med Qual. 2006;21(6 Suppl):7S-16S. PubMed
31. O’Brien J, Paquet F, Lindsay R, Valenti D. Insertion of PICCs with minimum number of lumens reduces complications and costs. J AmColl Radiol. 2013;10(11):864-868. PubMed
32. Wong BM, Etchells EE, Kuper A, Levinson W, Shojania KG. Teaching quality improvement and patient safety to trainees: a systematic review. Acad Med. 2010;85(9):1425-1439. PubMed
33. Conlon T, Himebauch A, Marie Cahill A, et al. 1246: Bedside Picc Placement by Pediatric Icu Providers Is Feasible and Safe. Crit Care Med. 2016;44(12 Suppl 1):387.
34. Moran J, Colbert CY, Song J, et al. Screening for novel risk factors related to peripherally inserted central catheter-associated complications. J Hosp Med. 2014;9(8):481-489. PubMed
35. Gonsalves CF, Eschelman DJ, Sullivan KL, DuBois N, Bonn J. Incidence of central vein stenosis and occlusion following upper extremity PICC and port placement. Cardiovasc Intervent Radiol. 2003;26(2):123-127. PubMed
36. El Ters M, Schears GJ, Taler SJ, et al. Association between prior peripherally inserted central catheters and lack of functioning arteriovenous fistulas: a case-control study in hemodialysis patients. Am J Kidney Dis. 2012;60(4):601-608. PubMed
37. Vascular Access 2006 Work Group. Clinical practice guidelines for vascular access. Am J Kidney Dis. 2006;48 Suppl 1:S248-S273. PubMed
38. Hoggard J, Saad T, Schon D, et al. Guidelines for venous access in patients with chronic kidney disease. A Position Statement from the American Society of Diagnostic and Interventional Nephrology, Clinical Practice Committee and the Association for Vascular Access. Semin Dial. 2008;21(2):186-191. PubMed
Peripherally inserted central catheters (PICCs) are integral to the care of hospitalized patients in the United States.1 Consequently, utilization of these devices in acutely ill patients has steadily increased in the past decade.2 Although originally designed to support the delivery of total parenteral nutrition, PICCs have found broader applications in the hospital setting given the ease and safety of placement, the advances in technology that facilitate insertion, and the growing availability of specially trained vascular nurses that place these devices at the bedside.3 Furthermore, because they are placed in deeper veins of the arm, PICCs are more durable than peripheral catheters and can support venous access for extended durations.4-6
However, the growing use of PICCs has led to the realization that these devices are not without attendant risks. For example, PICCs are associated with venous thromboembolism (VTE) and central-line associated blood stream infection (CLABSI).7,8 Additionally, complications such as catheter occlusion and tip migration commonly occur and may interrupt care or necessitate device removal.9-11 Hence, thoughtful weighing of the risks against the benefits of PICC use prior to placement is necessary. To facilitate such decision-making, we developed the Michigan Appropriateness Guide for Intravenous (IV) Catheters (MAGIC) criteria,12 which is an evidence-based tool that defines when the use of a PICC is appropriate in hospitalized adults.
The use of PICCs for infusion of peripherally compatible therapies for 5 or fewer days is rated as inappropriate by MAGIC.12 This strategy is also endorsed by the Centers for Disease Control and Prevention’s (CDC) guidelines for the prevention of catheter-related infections.13 Despite these recommendations, short-term PICC use remains common. For example, a study conducted at a tertiary pediatric care center reported a trend toward shorter PICC dwell times and increasing rates of early removal.2 However, factors that prompt such short-term PICC use are poorly understood. Without understanding drivers and outcomes of short-term PICC use, interventions to prevent such practice are unlikely to succeed.
Therefore, by using data from a multicenter cohort study, we examined patterns of short-term PICC use and sought to identify which patient, provider, and device factors were associated with such use. We hypothesized that short-term placement would be associated with difficult venous access and would also be associated with the risk of major and minor complications.
METHODS
Study Setting and Design
We used data from the Michigan Hospital Medicine Safety (HMS) Consortium to examine patterns and predictors of short-term PICC use.14 As a multi-institutional clinical quality initiative sponsored by Blue Cross Blue Shield of Michigan and Blue Care Network, HMS aims to improve the quality of care by preventing adverse events in hospitalized medical patients.4,15-17 In January of 2014, dedicated, trained abstractors started collecting data on PICC placements at participating HMS hospitals by using a standard protocol and template for data collection. Patients who received PICCs while admitted to either a general medicine unit or an intensive care unit (ICU) during clinical care were eligible for inclusion. Patients were excluded if they were (a) under the age of 18 years, (b) pregnant, (c) admitted to a nonmedical service (eg, surgery), or (d) admitted under observation status.
Every 14 days, each hospital collected data on the first 17 eligible patients that received a PICC, with at least 7 of these placements occurring in an ICU setting. All patients were prospectively followed until the PICC was removed, death, or until 70 days after insertion, whichever occurred first. For patients who had their PICC removed prior to hospital discharge, follow-up occurred via a review of medical records. For those discharged with a PICC in place, both medical record review and telephone follow-up were performed. To ensure data quality, annual random audits at each participating hospital were performed by the coordinating center at the University of Michigan.
For this analysis, we included all available data as of June 30, 2016. However, HMS hospitals continue to collect data on PICC use and outcomes as part of an ongoing clinical quality initiative to reduce the incidence of PICC-related complications.
Patient, Provider, and Device Data
Patient characteristics, including demographics, detailed medical history, comorbidities, physical findings, laboratory results, and medications were abstracted directly from medical records. To estimate the comorbidity burden, the Charlson-Deyo comorbidity score was calculated for each patient by using data available in the medical record at the time of PICC placement.18 Data, such as the documented indication for PICC insertion and the reason for removal, were obtained directly from medical records. Provider characteristics, including the specialty of the attending physician at the time of insertion and the type of operator who inserted the PICC, were also collected. Institutional characteristics, such as total number of beds, teaching versus nonteaching, and urban versus rural, were obtained from hospital publicly reported data and semiannual surveys of HMS sites.19,20 Data on device characteristics, such as catheter gauge, coating, insertion attempts, tip location, and number of lumens, were abstracted from PICC insertion notes.
Outcomes of Interest
The outcome of interest was short-term PICC use, defined as PICCs removed within 5 days of insertion. Patients who expired with a PICC in situ were excluded. Secondary outcomes of interest included PICC-related complications, categorized as major (eg, symptomatic VTE and CLABSI) or minor (eg, catheter occlusion, superficial thrombosis, mechanical complications [kinking, coiling], exit site infection, and tip migration). Symptomatic VTE was defined as clinically diagnosed deep venous thrombosis (DVT) and/or pulmonary embolism (PE) not present at the time of PICC placement and confirmed via imaging (ultrasound or venogram for DVT; computed tomography scan, ventilation perfusion scan, or pulmonary angiogram for PE). CLABSI was defined in accordance with the CDC’s National Healthcare Safety Network criteria or according to Infectious Diseases Society of America recommendations.21,22 All minor PICC complications were defined in accordance with prior published definitions.4
Statistical Analysis
Cases of short-term PICC use were identified and compared with patients with a PICC dwell time of 6 or more days by patient, provider, and device characteristics. The initial analyses for the associations of putative factors with short-term PICC use were performed using χ2 or Wilcoxon tests for categorical and continuous variables, respectively. Univariable mixed effect logistic regression models (with a random hospital-specific intercept) were then used to control for hospital-level clustering. Next, a mixed effects multivariable logistic regression model was used to identify factors associated with short-term PICC use. Variables with P ≤ .25 were considered as candidate predictors for the final multivariable model, which was chosen through a stepwise variable selection algorithm performed on 1000 bootstrapped data sets.23 Variables in the final model were retained based on their frequency of selection in the bootstrapped samples, significance level, and contribution to the overall model likelihood. Results were expressed as odds ratios (OR) with corresponding 95% confidence intervals (CI). SAS for Windows (version 9.3, SAS Institute Inc., Cary, NC) was used for analyses.
Ethical and Regulatory Oversight
The study was classified as “not regulated” by the Institutional Review Board at the University of Michigan (HUM00078730).
RESULTS
Overall Characteristics of the Study Cohort
Characteristics of Short-Term Peripherally Inserted Central Catheter Use
Of the 15,397 PICCs included, we identified 3902 PICCs (25.3%) with a dwell time of ≤5 days (median = 3 days; IQR, 2-4 days). When compared to PICCs that were in place for longer durations, no significant differences in age or comorbidity scores were observed. Importantly, despite recommendations to avoid PICCs in patients with moderate to severe chronic kidney disease (glomerular filtration rate [GFR] ≤ 59 ml/min), 1292 (33.1%) short-term PICCs occurred in patients that met such criteria.
Among short-term PICCs, 3618 (92.7%) were power-capable devices, 2785 (71.4%) were 5-French, and 2813 (72.1%) were multilumen. Indications for the use of short-term PICCs differed from longer term devices in important ways (P < .001). For example, the most common documented indication for short-term PICC use was difficult venous access (28.2%), while for long-term PICCs, it was antibiotic administration (39.8%). General internists and hospitalists were the most common attending physicians for patients with short-term and long-term PICCs (65.1% and 65.5%, respectively [P = .73]). Also, the proportion of critical care physicians responsible for patients with short versus long-term PICC use was similar (14.0% vs 15.0%, respectively [P = .123]). Of the short-term PICCs, 2583 (66.2%) were inserted by vascular access nurses, 795 (20.4%) by interventional radiologists, and 439 (11.3%) by advance practice professionals. Almost all of the PICCs placed ≤5 days (95.5%) were removed during hospitalization.
Complications Associated with Short-Term Peripherally Inserted Central Catheter Use
DISCUSSION
This large, multisite prospective cohort study is the first to examine patterns and predictors of short-term PICC use in hospitalized adults. By examining clinically granular data derived from the medical records of patients across 52 hospitals, we found that short-term use was common, representing 25% of all PICCs placed. Almost all such PICCs were removed prior to discharge, suggesting that they were placed primarily to meet acute needs during hospitalization. Multivariable models indicated that patients with difficult venous access, multilumen devices, and teaching hospital settings were associated with short-term use. Given that (a) short term PICC use is not recommended by published evidence-based guidelines,12,13 (b) both major and minor complications were not uncommon despite brief exposure, and (c) specific factors might be targeted to avoid such use, strategies to improve PICC decision-making in the hospital appear increasingly necessary.
In our study, difficult venous access was the most common documented indication for short-term PICC placement. For patients in whom an anticipated catheter dwell time of 5 days or less is expected, MAGIC recommends the consideration of midline or peripheral IV catheters placed under ultrasound guidance.12 A midline is a type of peripheral IV catheter that is about 7.5 cm to 25 cm in length and is typically inserted in the larger diameter veins of the upper extremity, such as the cephalic or basilic veins, with the tip terminating distal to the subclavian vein.7,12 While there is a paucity of information that directly compares PICCs to midlines, some data suggest a lower risk of bloodstream infection and thrombosis associated with the latter.24-26 For example, at one quaternary teaching hospital, house staff who are trained to insert midline catheters under ultrasound guidance in critically ill patients with difficult venous access reported no CLABSI and DVT events.26
Interestingly, multilumen catheters were used twice as often as single lumen catheters in patients with short-term PICCs. In these instances, the use of additional lumens is questionable, as infusion of multiple incompatible fluids was not commonly listed as an indication prompting PICC use. Because multilumen PICCs are associated with higher risks of both VTE and CLABSI compared to single lumen devices, such use represents an important safety concern.27-29 Institutional efforts that not only limit the use of multilumen PICCs but also fundamentally define when use of a PICC is appropriate may substantially improve outcomes related to vascular access.28,30,31We observed that short-term PICCs were more common in teaching compared to nonteaching hospitals. While the design of the present study precludes understanding the reasons for such a difference, some plausible theories include the presence of physician trainees who may not appreciate the risks of PICC use, diminishing peripheral IV access securement skills, and the lack of alternatives to PICC use. Educating trainees who most often order PICCs in teaching settings as to when they should or should not consider this device may represent an important quality improvement opportunity.32 Similarly, auditing and assessing the clinical skills of those entrusted to place peripheral IVs might prove helpful.33,34 Finally, the introduction of a midline program, or similar programs that expand the scope of vascular access teams to place alternative devices, should be explored as a means to improve PICC use and patient safety.
Our study also found that a third of patients who received PICCs for 5 or fewer days had moderate to severe chronic kidney disease. In these patients who may require renal replacement therapy, prior PICC placement is among the strongest predictors of arteriovenous fistula failure.35,36 Therefore, even though national guidelines discourage the use of PICCs in these patients and recommend alternative routes of venous access,12,37,38 such practice is clearly not happening. System-based interventions that begin by identifying patients who require vein preservation (eg, those with a GFR < 45 ml/min) and are therefore not appropriate for a PICC would be a welcomed first step in improving care for such patients.37,38Our study has limitations. First, the observational nature of the study limits the ability to assess for causality or to account for the effects of unmeasured confounders. Second, while the use of medical records to collect granular data is valuable, differences in documentation patterns within and across hospitals, including patterns of missing data, may produce a misclassification of covariates or outcomes. Third, while we found that higher rates of short-term PICC use were associated with teaching hospitals and patients with difficult venous access, we were unable to determine the precise reasons for this practice trend. Qualitative or mixed-methods approaches to understand provider decision-making in these settings would be welcomed.
Our study also has several strengths. First, to our knowledge, this is the first study to systematically describe and evaluate patterns and predictors of short-term PICC use. The finding that PICCs placed for difficult venous access is a dominant category of short-term placement confirms clinical suspicions regarding inappropriate use and strengthens the need for pathways or protocols to manage such patients. Second, the inclusion of medical patients in diverse institutions offers not only real-world insights related to PICC use, but also offers findings that should be generalizable to other hospitals and health systems. Third, the use of a robust data collection strategy that emphasized standardized data collection, dedicated trained abstractors, and random audits to ensure data quality strengthen the findings of this work. Finally, our findings highlight an urgent need to develop policies related to PICC use, including limiting the use of multiple lumens and avoidance in patients with moderate to severe kidney disease.
In conclusion, short-term use of PICCs is prevalent and associated with key patient, provider, and device factors. Such use is also associated with complications, such as catheter occlusion, tip migration, VTE, and CLABSI. Limiting the use of multiple-lumen PICCs, enhancing education for when a PICC should be used, and defining strategies for patients with difficult access may help reduce inappropriate PICC use and improve patient safety. Future studies to examine implementation of such interventions would be welcomed.
Disclosure: Drs. Paje, Conlon, Swaminathan, and Boldenow disclose no conflicts of interest. Dr. Chopra has received honoraria for talks at hospitals as a visiting professor. Dr. Flanders discloses consultancies for the Institute for Healthcare Improvement and the Society of Hospital Medicine, royalties from Wiley Publishing, honoraria for various talks at hospitals as a visiting professor, grants from the CDC Foundation, Agency for Healthcare Research and Quality, Blue Cross Blue Shield of Michigan (BCBSM), and Michigan Hospital Association, and expert witness testimony. Dr. Bernstein discloses consultancies for Blue Care Network and grants from BCBSM, Department of Veterans Affairs, and National Institutes of Health. Dr. Kaatz discloses no relevant conflicts of interest. BCBSM and Blue Care Network provided support for the Michigan HMS Consortium as part of the BCBSM Value Partnerships program. Although BCBSM and HMS work collaboratively, the opinions, beliefs, and viewpoints expressed by the author do not necessarily reflect the opinions, beliefs, and viewpoints of BCBSM or any of its employees. Dr. Chopra is supported by a career development award from the Agency for Healthcare Research and Quality (1-K08-HS022835-01). BCBSM and Blue Care Network supported data collection at each participating site and funded the data coordinating center but had no role in study concept, interpretation of findings, or in the preparation, final approval, or decision to submit the manuscript.
1. Al Raiy B, Fakih MG, Bryan-Nomides N, et al. Peripherally inserted central venous catheters in the acute care setting: A safe alternative to high-risk short-term central venous catheters. Am J Infect Control. 2010;38(2):149-153. PubMed
2. Gibson C, Connolly BL, Moineddin R, Mahant S, Filipescu D, Amaral JG. Peripherally inserted central catheters: use at a tertiary care pediatric center. J Vasc Interv Radiol. 2013;24(9):1323-1331. PubMed
3. Chopra V, Flanders SA, Saint S. The problem with peripherally inserted central catheters. JAMA. 2012;308(15):1527-1528. PubMed
4. Chopra V, Smith S, Swaminathan L, et al. Variations in Peripherally Inserted Central Catheter Use and Outcomes in Michigan Hospitals. JAMA Intern Med. 2016;176(4):548-551. PubMed
5. Cowl CT, Weinstock JV, Al-Jurf A, Ephgrave K, Murray JA, Dillon K. Complications and cost associated with parenteral nutrition delivered to hospitalized patients through either subclavian or peripherally-inserted central catheters. Clin Nutr. 2000;19(4):237-243. PubMed
6. MacDonald AS, Master SK, Moffitt EA. A comparative study of peripherally inserted silicone catheters for parenteral nutrition. Can J Anaesth. 1977;24(2):263-269. PubMed
7. Chopra V, O’Horo JC, Rogers MA, Maki DG, Safdar N. The risk of bloodstream infection associated with peripherally inserted central catheters compared with central venous catheters in adults: a systematic review and meta-analysis. Infect Control Hosp Epidemiol. 2013;34(9):908-918. PubMed
8. Chopra V, Anand S, Hickner A, et al. Risk of venous thromboembolism associated with peripherally inserted central catheters: a systematic review and meta-analysis. Lancet. 2013;382(9889):311-325. PubMed
9. Beccaria P, Silvetti S, Mucci M, Battini I, Brambilla P, Zangrillo A. Contributing factors for a late spontaneous peripherally inserted central catheter migration: a case report and review of literature. J Vasc Access. 2015;16(3):178-182. PubMed
10. Turcotte S, Dube S, Beauchamp G. Peripherally inserted central venous catheters are not superior to central venous catheters in the acute care of surgical patients on the ward. World J Surg. 2006;30(8):1605-1619. PubMed
11. Pikwer A, Akeson J, Lindgren S. Complications associated with peripheral or central routes for central venous cannulation. Anaesthesia. 2012;67(1):65-71. PubMed
12. Chopra V, Flanders SA, Saint S, et al. The Michigan Appropriateness Guide for Intravenous Catheters (MAGIC): Results From a Multispecialty Panel Using the RAND/UCLA Appropriateness Method. Ann Intern Med. 15 2015;163(6 Suppl):S1-S40. PubMed
13. O’Grady NP, Alexander M, Burns LA, et al. Guidelines for the prevention of intravascular catheter-related infections. Am J Infect Control. 2011;39(4 Suppl 1):S1-S34. PubMed
14. Michigan Hospital Medicine Safety Consortium. 2016; http://mi-hms.org/. Accessed November 11, 2016.
15. Greene MT, Spyropoulos AC, Chopra V, et al. Validation of Risk Assessment Models of Venous Thromboembolism in Hospitalized Medical Patients. Am J Med. 2016;129(9):1001.e1009-1001.e1018. PubMed
16. Greene MT, Flanders SA, Woller SC, Bernstein SJ, Chopra V. The Association Between PICC Use and Venous Thromboembolism in Upper and Lower Extremities. Am J Med. 2015;128(9):986-993. PubMed
17. Flanders SA, Greene MT, Grant P, et al. Hospital performance for pharmacologic venous thromboembolism prophylaxis and rate of venous thromboembolism : a cohort study. JAMA Intern Med. 2014;174(10):1577-1584. PubMed
18. Deyo RA, Cherkin DC, Ciol MA. Adapting a clinical comorbidity index for use with ICD-9-CM administrative databases. J Clin Epidemiol. 1992;45(6):613-619. PubMed
19. Hospital Bed Inventory. 2016; http://www.michigan.gov/documents/mdhhs/HOSPBEDINV_October_3__2016_536834_7.pdf. Accessed November 22, 2016.
20. Compare Hospitals. 2016; http://www.leapfroggroup.org/compare-hospitals. Accessed November 22, 2016.
21. NHSN Patient Safety Component Manual. 2016; http://www.cdc.gov/nhsn/pdfs/pscmanual/pcsmanual_current.pdf. Accessed November 22, 2016.
22. Mermel LA, Allon M, Bouza E, et al. Clinical practice guidelines for the diagnosis and management of intravascular catheter-related infection: 2009 Update by the Infectious Diseases Society of America. Clin Infect Dis. 2009;49(1):1-45. PubMed
23. Austin PC, Tu JV. Bootstrap Methods for Developing Predictive Models. Am Stat. 2004;58(2):131-137.
24. Pathak R, Patel A, Enuh H, Adekunle O, Shrisgantharajah V, Diaz K. The Incidence of Central Line-Associated Bacteremia After the Introduction of Midline Catheters in a Ventilator Unit Population. Infect Dis Clin Pract. 2015;23(3):131-134. PubMed
25. Adams DZ, Little A, Vinsant C, Khandelwal S. The Midline Catheter: A Clinical Review. J Emerg Med. 2016;51(3):252-258. PubMed
26. Deutsch GB, Sathyanarayana SA, Singh N, Nicastro J. Ultrasound-guided placement of midline catheters in the surgical intensive care unit: a cost-effective proposal for timely central line removal. J Surg Res. 2014;191(1):1-5. PubMed
27. Chopra V, Anand S, Krein SL, Chenoweth C, Saint S. Bloodstream Infection, Venous Thrombosis, and Peripherally Inserted Central Catheters: Reappraising the Evidence. Am J Med. 2012;125(8):733-741. PubMed
28. Ratz D, Hofer T, Flanders SA, Saint S, Chopra V. Limiting the Number of Lumens in Peripherally Inserted Central Catheters to Improve Outcomes and Reduce Cost: A Simulation Study. Infect Control Hosp Epidemiol. 2016;37(7):811-817. PubMed
29. Pongruangporn M, Ajenjo MC, Russo AJ, et al. Patient- and device-specific risk factors for peripherally inserted central venous catheter-related bloodstream infections. Infect Control Hosp Epidemiol. 2013;34(2):184-189. PubMed
30. Shannon RP, Patel B, Cummins D, Shannon AH, Ganguli G, Lu Y. Economics of central line--associated bloodstream infections. Am J Med Qual. 2006;21(6 Suppl):7S-16S. PubMed
31. O’Brien J, Paquet F, Lindsay R, Valenti D. Insertion of PICCs with minimum number of lumens reduces complications and costs. J AmColl Radiol. 2013;10(11):864-868. PubMed
32. Wong BM, Etchells EE, Kuper A, Levinson W, Shojania KG. Teaching quality improvement and patient safety to trainees: a systematic review. Acad Med. 2010;85(9):1425-1439. PubMed
33. Conlon T, Himebauch A, Marie Cahill A, et al. 1246: Bedside Picc Placement by Pediatric Icu Providers Is Feasible and Safe. Crit Care Med. 2016;44(12 Suppl 1):387.
34. Moran J, Colbert CY, Song J, et al. Screening for novel risk factors related to peripherally inserted central catheter-associated complications. J Hosp Med. 2014;9(8):481-489. PubMed
35. Gonsalves CF, Eschelman DJ, Sullivan KL, DuBois N, Bonn J. Incidence of central vein stenosis and occlusion following upper extremity PICC and port placement. Cardiovasc Intervent Radiol. 2003;26(2):123-127. PubMed
36. El Ters M, Schears GJ, Taler SJ, et al. Association between prior peripherally inserted central catheters and lack of functioning arteriovenous fistulas: a case-control study in hemodialysis patients. Am J Kidney Dis. 2012;60(4):601-608. PubMed
37. Vascular Access 2006 Work Group. Clinical practice guidelines for vascular access. Am J Kidney Dis. 2006;48 Suppl 1:S248-S273. PubMed
38. Hoggard J, Saad T, Schon D, et al. Guidelines for venous access in patients with chronic kidney disease. A Position Statement from the American Society of Diagnostic and Interventional Nephrology, Clinical Practice Committee and the Association for Vascular Access. Semin Dial. 2008;21(2):186-191. PubMed
© 2018 Society of Hospital Medicine