User login
FDA Pledges Faster Updates for Antibiotics
The FDA is launching a new website to get critical updates about antibiotics and antifungals out faster to health care professionals to help them make more informed prescribing decisions. The site will provide “direct and timely access” to information about when bacterial or fungal infections are likely to respond to a specific drug.
“When you are treating critically ill patients, you want as much information as possible about the pathogen…and the susceptibility of that pathogen to various treatment,” said FDA Commissioner Scott Gottlieb, MD. Under the old approach, he said, updating each drug’s individual labeling took too long. Only after the revised drug labeling was approved could a drug or device manufacturer update testing criteria and labeling for the latest antimicrobial susceptibility test results. Each drug and device labeling had to be updated whenever criteria changed.
The new tool will allow the FDA to simultaneously provide updates multiple drugs that have the same active ingredient and share that information transparently via a dedicated web page.
In Reference to “The Weekend Effect in Hospitalized Patients: A Meta-Analysis”
The prevalent reason offered for increased mortality rates during weekend hours are shortages in staffing and services. The “weekend effect,” elucidated by Pauls et al.1 in their recent meta-analysis, and the accompanying editorial by Quinn and Bell,2 highlight these and other potential causes for this anomaly.
Pauls et al.1 also cite patient selection bias as a possible explanation for the uptick in deaths during this span (off-hour admissions may be sicker). It is due to the latter that we wish to highlight additional studies published after mid-2013 when the authors concluded their search.
Recent disputes within the UK’s National Health Service3 concerning health system funding spurred timely papers in BMJ4 and Lancet5 on the uncertainty. They both discovered a stronger signal from patient characteristics admitted during this time rather than on-hand resources and workforce. These new investigations strengthen the support for patient acuity as a determinant in explaining worse outcomes.
We highlight these manuscripts so investigators will continue their attempts to understand the weekend phenomena as suggested by both Pauls et al.1 and the editorialists.2 To allow for the delivery of correct interventions, we must understand its root causes. In this case, it may be the unique features of patients presenting on Saturdays and Sundays and, hence, would require a different set of process changes.
Disclosure: The authors declare no conflict of interest.
1. Pauls L, Johnson-Paben R, McGready J, Murphy J, Pronovost P, Wu C. The weekend effect in hospitalized patients: A meta-analysis. J Hosp Med. 2017;12(9):760-766. PubMed
2. Quinn K, Bell C. Does the week-end justify the means? J Hosp Med. 2017;12(9):779-780. PubMed
3. Weaver M. Junior Doctors: Jeremy Hunt says five-day strike will be ‘worst in NHS history.’ The Guardian. https://www.theguardian.com/society/2016/sep/01/jeremy-hunt-five-day-doctors-strike-worst-in-nhs-history. Accessed September 20, 2017.
4. Freemantle N, Ray D, McNulty D, et al. Increased mortality associated with weekend hospital admission: a case for expanded seven day services? BMJ. 2015;351:h4596. doi:10.1136/bmj.h4598. PubMed
5. Walker S, Mason A, Phuong Quan T, et al. Mortality risks associated with emergency admissions during weekends and public holidays: an analysis of electronic health records. The Lancet. 2017;390(10089):62-72. PubMed
The prevalent reason offered for increased mortality rates during weekend hours are shortages in staffing and services. The “weekend effect,” elucidated by Pauls et al.1 in their recent meta-analysis, and the accompanying editorial by Quinn and Bell,2 highlight these and other potential causes for this anomaly.
Pauls et al.1 also cite patient selection bias as a possible explanation for the uptick in deaths during this span (off-hour admissions may be sicker). It is due to the latter that we wish to highlight additional studies published after mid-2013 when the authors concluded their search.
Recent disputes within the UK’s National Health Service3 concerning health system funding spurred timely papers in BMJ4 and Lancet5 on the uncertainty. They both discovered a stronger signal from patient characteristics admitted during this time rather than on-hand resources and workforce. These new investigations strengthen the support for patient acuity as a determinant in explaining worse outcomes.
We highlight these manuscripts so investigators will continue their attempts to understand the weekend phenomena as suggested by both Pauls et al.1 and the editorialists.2 To allow for the delivery of correct interventions, we must understand its root causes. In this case, it may be the unique features of patients presenting on Saturdays and Sundays and, hence, would require a different set of process changes.
Disclosure: The authors declare no conflict of interest.
1. Pauls L, Johnson-Paben R, McGready J, Murphy J, Pronovost P, Wu C. The weekend effect in hospitalized patients: A meta-analysis. J Hosp Med. 2017;12(9):760-766. PubMed
2. Quinn K, Bell C. Does the week-end justify the means? J Hosp Med. 2017;12(9):779-780. PubMed
3. Weaver M. Junior Doctors: Jeremy Hunt says five-day strike will be ‘worst in NHS history.’ The Guardian. https://www.theguardian.com/society/2016/sep/01/jeremy-hunt-five-day-doctors-strike-worst-in-nhs-history. Accessed September 20, 2017.
4. Freemantle N, Ray D, McNulty D, et al. Increased mortality associated with weekend hospital admission: a case for expanded seven day services? BMJ. 2015;351:h4596. doi:10.1136/bmj.h4598. PubMed
5. Walker S, Mason A, Phuong Quan T, et al. Mortality risks associated with emergency admissions during weekends and public holidays: an analysis of electronic health records. The Lancet. 2017;390(10089):62-72. PubMed
© 2018 Society of Hospital Medicine
Sharing Our Homes With Allergens
No shocker here: > 90% of American homes have ≥ 3 detectable allergens, and 73% have at least 1 allergen at elevated levels, acceding to the largest U.S. indoor allergen study to date.
Using data from National Institute of Environmental Health Sciences (NHANES) 2005-2006, researchers studied levels of 8 common allergens (cat, dog, cockroach, mouse, rat, mold, and 2 types of dust mite allergens) in nearly 7,000 homes.
Mobile homes, older homes, rental homes, and rural homes were more likely to have higher amounts of indoor allergens, as were homes with pets and pests.
Elevated levels of dust mites were more common in the South and Northeast and humid regions. Cat and dust mite allergens were more common in rural settings compared with urban.
The NHANES 2005-2006 data allowed national comparisons for the first time of exposure and sensitization. Men and non-Hispanic blacks were less likely to be exposed to multiple allergens, and sensitization was more common in those groups compared with women and other racial groups, respectively. Exposure to several elevated allergens was most prevalent in rural areas. Sensitization rates were higher in urban areas.
The researchers emphasize that the relationships between allergen exposures, allergic sensitization, and disease are complex. They also note that studies are still investigating how allergen exposures interact with other environmental and genetic factors in asthma and allergies. However, among the tips they offer: vacuum every week, wash sheets and blankets in hot water every week, and lower indoor humidity levels below 50%.
Mortality, Length of Stay, and Cost of Weekend Admissions
The “weekend effect” refers to the association between weekend hospital admissions and poorer outcomes, such as higher mortality rates. Analysis of National Health Service claims data from the United Kingdom suggested a 10% increase in 30-day mortality in patients admitted on Saturdays and 15% in patients admitted on Sundays,1 leading to the push for a 7-day work week and invoking controversial changes in their junior doctor (residency) working contract. Studies in the United States highlighting differences in outcomes for patients admitted on weekends compared to weekdays have mostly focused on specific diagnoses and results have been variable. Few have gone on to look at the association of weekend hospital admissions on cost2,3 and length of stay3 but results are overall inconclusive. Some have suggested that such poorer outcomes for patients admitted on weekends are due to reduced staffing and delayed procedures on weekends compared to weekdays, although this has been debated.4 The lack of consensus has made it difficult for hospitals to plan if and how to expand weekend manpower or services.
In the United States, increase in mortality rate for patients admitted on weekends has been demonstrated for a range of diagnoses, including pulmonary embolism,5 intracerebral hemorrhage,6 upper gastrointestinal hemorrhage,7,8 ruptured aortic aneurysm,9 heart failure,10 and acute kidney injury.11 However, other diagnoses such as atrial flutter or fibrillation,2 hip fractures,12 ischemic stroke,13 and esophageal variceal hemorrhage,14 show no difference in mortality between weekday and weekend admissions. Yet, other conditions such as myocardial infarction15,16 and subarachnoid hemorrhage17,18 have multiple studies with conflicting results. None of these studies have comprehensively looked at the effect of weekend admissions across all diagnoses nor compared the effect size between common diagnoses in the United States using the same risk adjustment. Reporting of differences in length of stay and cost is also rare.
We postulated that the weekend admissions are associated with increased mortality and length of stay, but that the effect would be heterogeneous between different diagnosis groups. Using a large nationally representative inpatient database, we investigated the association between weekend versus weekday admissions on in-hospital mortality, length of stay, and cost for acute hospitalizations in the United States. We performed subgroup analyses of the top 20 diagnoses to determine which diagnoses, if any, should be targeted for expanded weekend manpower or services.
METHODS
Data Sources
We used information from the National Inpatient Sample (NIS) database for this study,19 which is the largest all-payer inpatient healthcare database in the United States. It contains administrative claims information on a 20% stratified sample of discharges from all hospitals participating in the Healthcare Cost and Utilization Project (HCUP), which includes over 90% of hospitals and 95% of discharges in the country. The NIS contains clinical and nonclinical data elements, including diagnoses, severity and comorbidity measures, demographics, admission characteristics, and charges.
Study Patients
The study included all patients who were 18 years or older and were admitted to hospitals participating in HCUP from 2012 to 2014. Elective or planned admissions were excluded from this study because of the anticipated degree of unmeasured confounding that would be present between patients electively admitted on weekends compared to weekdays.
Study Variables
The primary exposure variable was admission on weekends (defined as Friday midnight to Sunday midnight) compared to the rest of the week. The primary outcome variable was in-hospital mortality. The secondary outcome variables were length of stay (measured in integer days) and cost. Length of stay was compared only using only patients who survived the hospital admission to eliminate the effect of death in shortening the length of stay. Cost was calculated by using charges available in the NIS and multiplied by the accompanying cost-to-charge ratios. Charges reflect total amount that hospitals billed for services but do not reflect how much these services actually cost. The HCUP cost-to-charge ratios are hospital-specific data based on hospital accounting reports collected by the Centers for Medicare & Medicaid Services.19
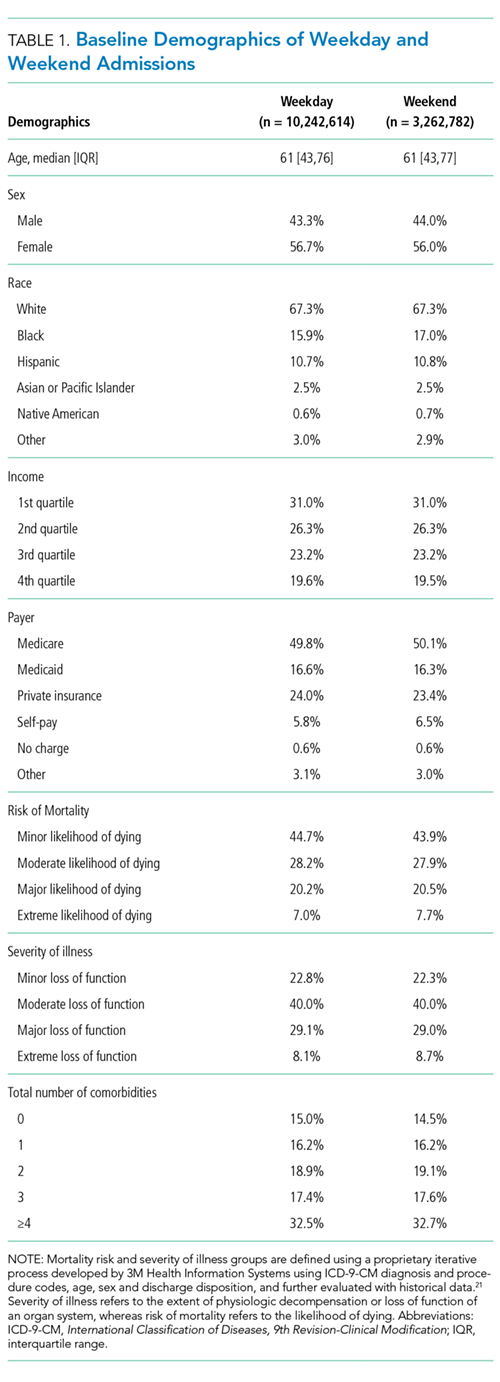
Covariates included age, sex, race, income, payer, presence or absence of comorbidities as defined by the Elixhauser comorbidity index,20 risk of mortality, and severity of illness scores as defined by the 3M Health Information Systems.21 Mortality risk and severity of illness groups are defined by using a proprietary iterative process developed by 3M Health Information Systems using International Classification of Diseases, 9th Revision-Clinical Modification (ICD-9-CM) principal and secondary diagnosis codes and procedure codes, age, sex, and discharge disposition, evaluated with historical data.21 Severity of illness refers to the extent of physiologic decompensation or loss of function of an organ system, whereas risk of mortality refers to the likelihood of dying.
Statistical Analysis
We compared patient characteristics and other covariates between patients emergently admitted on weekends and weekdays. Continuous variables that were not normally distributed were either categorized (age, risk of mortality, and severity of illness scores) or log-transformed if right skewed (length of stay and cost). Categorical data were reported as percentages and continuous data as medians (interquartile range). We compared the inpatient mortality rate between weekend and weekday admissions by using χ2 tests. Multivariable logistic regression was used to adjust for covariates of age, gender, race, payer, income, risk of mortality and severity of illness scores, number of comorbidities, and the presence or absence of each of the 29 comorbidities available in the database to determine an adjusted odds ratio (OR), P values, and confidence intervals (CIs).
We also compared the length of stay amongst survivors and costs between weekend and weekday admissions. Multivariable linear regression was applied to the natural log of these outcome variables and the coefficients exponentiated to determine the difference in length of stay and cost of weekend admissions as compared to weekday. Covariates in the model were the same as those used for the primary outcome.
To determine if particular diagnoses had a pronounced weekend effect, the above analyses were repeated in subgroups of the top 20 most prevalent diagnoses on weekends by using the Clinical Classifications Software for ICD-9-CM diagnosis groups. For subgroup analyses, a Bonferroni correction was used, so P values of <.0025 were considered significant.
Statistical analyses were performed by using SAS version 9.4 (SAS Institute Inc, Cary, NC). All regression models were run using PROC SURVEYREG for continuous outcomes and PROC SURVEYLOGISTIC for binary outcomes to account for the sampling structure of NIS. Two-sided P values of .05 were considered significant, apart from the Bonferroni correction applied to the subgroup analysis. As this study involved publicly available deidentified data, our study was exempt from institutional board review.
RESULTS
Patient Characteristics
Mortality
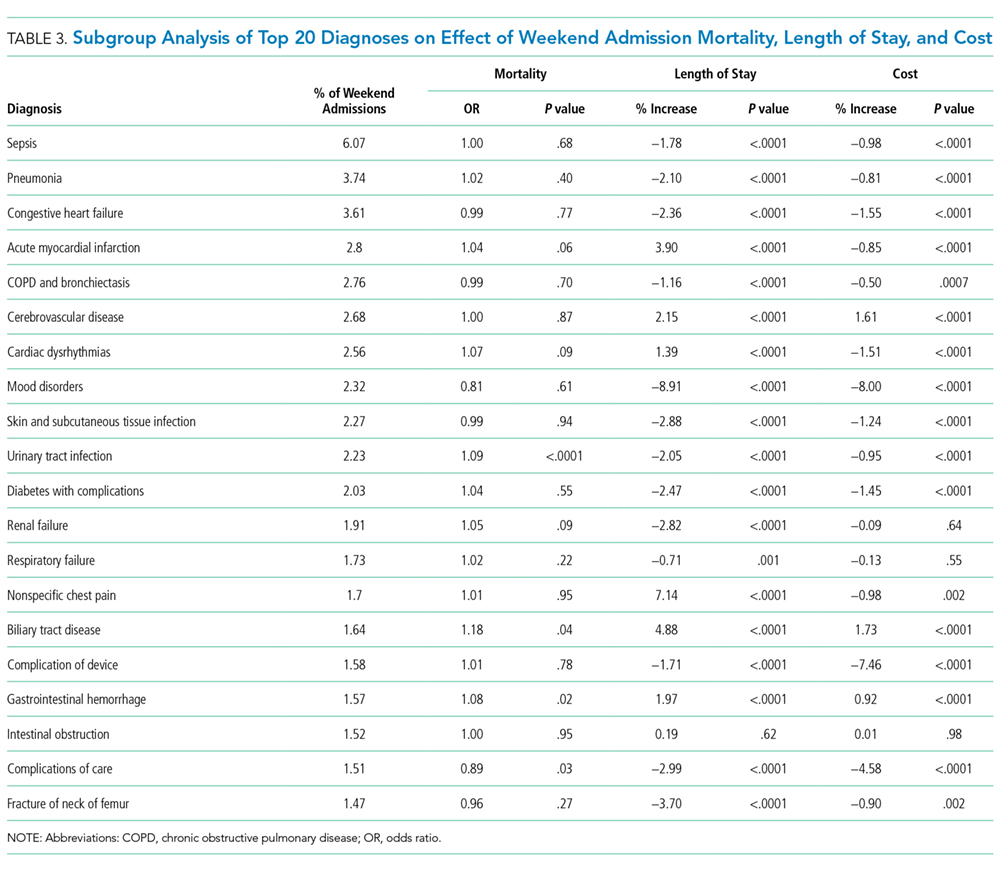
The crude in-hospital mortality rate was 2.8% for patients admitted on weekends and 2.5% for patients admitted on weekdays (unadjusted OR, 1.110; 95% CI, 1.105-1.113; P < .0001). This relationship was attenuated after adjustment for demographics, severity, and comorbidities, but remained statistically significant (OR 1.029; 95% CI, 1.020-1.039; P < .0001; Table 2), which corresponds to an adjusted risk difference of 0.07% increase in mortality of weekend admissions. The OR for mortality on weekends compared to weekdays was further calculated for each of the top 20 diagnoses (Table 3). Out of all the diagnosis groups, only 1 (urinary tract infection) had a statistically significant P value after Bonferroni correction. We also looked separately at patients who were electively admitted—there was a highly significant OR of mortality of 1.67 (95% CI, 1.60-1.74). Patients classified as elective admissions were excluded for subsequent analyses.
Length of Stay
![]()
Cost
DISCUSSION

The magnitude of association between weekend admissions and mortality in this large administrative database contradicts existing literature, which some believe conclusively proves the international phenomenon of the weekend effect.22,23 However, our results support a minimal increase in odds of death of 2.9%, with no consistent effect amongst the top 20 diagnoses. Only 1 diagnosis group (urinary tract infection) showed a statistically significant increase in mortality, which could be due to chance. In contrast, the policy-influencing paper in the United Kingdom reports that patients admitted on Saturdays and Sundays have an increased risk of death of 10% and 15%, respectively, compared to patients admitted on Wednesdays.24 They also repeated their measurements on a United Health Care Systems database, comprising 254 leading managed care hospitals in the US, over a time period of 3 months in 2010, and found a hazard ratio of 1.18 (95% CI, 1.11-1.26). Ruiz et al.22 combined almost 3 million medical records from 28 metropolitan hospitals in 5 different countries in the Global Comparators Project, including 5 in the United States, and showed increased mortality on weekends in all countries, concluding that the weekend effect is a systematic phenomenon.
There are several possible explanations for differences in our findings. Freemantle’s study differed to ours by comparing outcomes of weekends to an index of Wednesday; they also found an increased mortality on Mondays and Fridays, which could suggest the presence of residual confounding and doubt as to whether Wednesday is the ideal control group. A further difference is the definition of mortality—we looked at in-hospital mortality, as compared to 30-day mortality. In addition, Freemantle’s study included elective admissions. When we looked at the effect of weekend admissions on mortality, we found a highly significant OR of 1.67, compared to 1.03 in emergency admissions. We attributed this discrepancy to unmeasured confounding, such as preference of physicians or difference in classification of elective admissions in different hospitals. Because of significant effect modification of elective compared to emergency admissions, we decided to restrict our analysis to emergency admissions only. This also enabled direct associations with potential policy recommendations on whether to expand weekend clinical care, which is most relevant to emergency admissions. Finally, the Global Comparators Project only samples a small proportion of hospitals in each country, leading to limited generalizability; in addition, international comparisons are difficult to interpret due to differing health systems.
The overall and diagnosis-specific difference in length of stay was small and of doubtful clinical significance. With an adjusted decrease in length of stay in patients admitted on weekends of 2.24%, when applied to a median length of stay of 3 days, it translates into a 1.7-hour difference in length of stay. However, there was striking heterogeneity noted between diagnoses, with a difference ranging from 8.91% decrease in length of stay (mood disorders) to 7.14% increase in length of stay (nonspecific chest pain), which is likely to explain the overall small magnitude of effect. We noted that the diagnoses associated with increased length of stay for weekend admissions tended to be those requiring inpatient procedures or investigations, such as acute myocardial infarction (3.90% increase), acute cerebrovascular disease (2.15% increase), cardiac dysrhythmias (1.39% increase), nonspecific chest pain (7.14% increase), and biliary tract disease (4.88% increase). As hospitals often do not provide certain nonemergent procedures or investigations on weekends, delay in procedures or investigations may explain the increase in length of stay. These include percutaneous coronary intervention or stress testing for evaluation of cardiac ischemia and endoscopic procedures for biliary tract disease and gastrointestinal hemorrhage. It must, however, be noted in conjunction that numerous studies have established higher complication rates when nonemergent surgeries are performed out of hours or on weekends.25-28 Therefore, we suggest further studies to compare the effect of weekends on increased procedural complications as to any morbidity caused by increased length of stay, which the present dataset was unable to capture. Another potential explanation for the heterogeneity in length of stay could be the greater availability of caregivers to assist with discharge on weekends, such as for patients admitted for mood disorders.
Surprisingly, weekend admissions appeared to be less costly than weekday admissions overall. Because of the large sample size, very minor differences in cost are likely to be statistically significant. Indeed, for the absolute difference of 0.45%, given a median cost of $6562 on weekends, this only represents a cost saving of approximately $30 per patient admission. There was also heterogeneity observed amongst the different diagnosis groups, and cerebrovascular disease, biliary tract disease and gastrointestinal hemorrhage, which were also associated with increase length of stay, were associated with an increased cost. However, our study is unable to establish causation, and differences in staffing numbers and reimbursement on weekends may confound cost estimates. We propose that further studies using hospital databases with greater granularity in data are necessary to determine the etiology of cost differences between weekends and weekdays.
Our study’s key strengths are the large sample size and generalizability to the US. As a large administrative database, we recognize the likelihood of inconsistencies in hospital coding for covariates, diagnoses, and charges, which may lead to misclassification bias. The NIS definition of weekend (Friday midnight to Sunday midnight) may differ from other definitions of weekend; ideally Friday 5
CONCLUSION
Our study does not suggest that system-wide policies to increase weekend service coverage will impact mortality, although effects on length of stay and cost are inconclusive. Hospitals wishing to improve coverage may consider focusing on procedural diagnoses as listed above which may shorten length of stay, although the out-of-hours complication rate should be carefully monitored.
Disclosure
The authors declare no conflicts of interest.
1. Freemantle N, Ray D, McNulty D, et al. Increased mortality associated with weekend hospital admission: a case for expanded seven day services? BMJ. 2015;351:h4596. PubMed
2. Weeda ER, Hodgdon N, Do T, et al. Association between weekend admission for atrial fibrillation or flutter and in-hospital mortality, procedure utilization, length-of-stay and treatment costs. Int J Cardiol. 2016;202:427-429. PubMed
3. Khanna R, Wachsberg K, Marouni A, Feinglass J, Williams MV, Wayne DB. The association between night or weekend admission and hospitalization-relevant patient outcomes. J Hosp Med. 2011;6(1):10-14. PubMed
4. Aldridge C, Bion J, Boyal A, et al. Weekend specialist intensity and admission mortality in acute hospital trusts in England: a cross-sectional study. Lancet. 2016;388(10040):178-186. PubMed
5. Coleman CI, Brunault RD, Saulsberry WJ. Association between weekend admission and in-hospital mortality for pulmonary embolism: An observational study and meta-analysis. Int J Cardiol. 2015;194:72-74. PubMed
6. Crowley RW, Yeoh HK, Stukenborg GJ, Medel R, Kassell NF, Dumont AS. Influence of weekend hospital admission on short-term mortality after intracerebral hemorrhage. Stroke. 2009;40(7):2387-2392. PubMed
7. Dorn SD, Shah ND, Berg BP, Naessens JM. Effect of weekend hospital admission on gastrointestinal hemorrhage outcomes. Dig Dis Sci. 2010;55(6):1658-1666. PubMed
8. Shaheen AA, Kaplan GG, Myers RP. Weekend versus weekday admission and mortality from gastrointestinal hemorrhage caused by peptic ulcer disease. Clin Gastroenterol Hepatol. 2009;7(3):303-310. PubMed
9. Groves EM, Khoshchehreh M, Le C, Malik S. Effects of weekend admission on the outcomes and management of ruptured aortic aneurysms. J Vasc Surg. 2014;60(2):318-324. PubMed
10. Horwich TB, Hernandez AF, Liang L, et al. Weekend hospital admission and discharge for heart failure: association with quality of care and clinical outcomes. Am Heart J. 2009;158(3):451-458. PubMed
11. James MT, Wald R, Bell CM, et al. Weekend hospital admission, acute kidney injury, and mortality. J Am Soc Nephrol. 2010;21(5):845-851. PubMed
12. Boylan MR, Rosenbaum J, Adler A, Naziri Q, Paulino CB. Hip Fracture and the Weekend Effect: Does Weekend Admission Affect Patient Outcomes? Am J Orthop (Belle Mead NJ). 2015;44(10):458-464. PubMed
13. Myers RP, Kaplan GG, Shaheen AM. The effect of weekend versus weekday admission on outcomes of esophageal variceal hemorrhage. Can J Gastroenterol. 2009;23(7):495-501. PubMed
14. Hoh BL, Chi YY, Waters MF, Mocco J, Barker FG 2nd. Effect of weekend compared with weekday stroke admission on thrombolytic use, in-hospital mortality, discharge disposition, hospital charges, and length of stay in the Nationwide Inpatient Sample Database, 2002 to 2007. Stroke. 2010;41(10):2323-2328. PubMed
15. Kostis WJ, Demissie K, Marcella SW, Shao YH, Wilson AC, Moreyra AE. Weekend versus weekday admission and mortality from myocardial infarction. N Engl J Med. 2007;356(11):1099-1109. PubMed
16. Noad R, Stevenson M, Herity NA. Analysis of weekend effect on 30-day mortality among patients with acute myocardial infarction. Open Heart. 2017;4:1-5. PubMed
17. Crowley RW, Yeoh HK, Stukenborg GJ, Ionescu AA, Kassell NF, Dumont AS. Influence of weekend versus weekday hospital admission on mortality following subarachnoid hemorrhage. J Neurosurg. 2009;111(1):60-66. PubMed
18. Nguyen E, Tsoi A, Lee K, Farasat S, Coleman CI. Association between weekend admission for intracerebral and subarachnoid hemorrhage and in-hospital mortality. Int J Cardiol. 2016;212:26-28. PubMed
19. Healthcare Cost and Utilization Project. Overview of the National (Nationwide) Inpatient Sample (NIS). https://www.hcup-us.ahrq.gov/nisoverview.jsp. Accessed June 20, 2017.
20. Healthcare Cost and Utilization Project. Elixhauser Comorbidity Software, Version 3.7. https://www.hcup-us.ahrq.gov/toolssoftware/comorbidity/comorbidity.jsp. Accessed Feburary 20, 2017.
21. 3M Health Information Systems. All Patient Refined Diagnosis Related Groups (APR-DRGs), Version 20.0, Methodology Overview. 2003; https://www.hcup-us.ahrq.gov/db/nation/nis/APR-DRGsV20MethodologyOverviewandBibliography.pdf. Accessed on Feburary 20, 2017.
22. Ruiz M, Bottle A, Aylin PP. The Global Comparators project: international comparison of 30-day in-hospital mortality by day of the week. BMJ Qual Saf. 2015;24(8):492-504. PubMed
23. Lilford RJ, Chen YF. The ubiquitous weekend effect: moving past proving it exists to clarifying what causes it. BMJ Qual Saf. 2015;24(8):480-482. PubMed
24. Freemantle N, Richardson M, Wood J, et al. Weekend hospitalization and additional risk of death: an analysis of inpatient data. J R Soc Med. 2012;105(2):74-84. PubMed
25. Aylin P, Alexandrescu R, Jen MH, Mayer EK, Bottle A. Day of week of procedure and 30 day mortality for elective surgery: retrospective analysis of hospital episode statistics. BMJ. 2013;346:f2424. PubMed
26. Bendavid E, Kaganova Y, Needleman J, Gruenberg L, Weissman JS. Complication rates on weekends and weekdays in US hospitals. Am J Med. 2007;120(5):422-428. PubMed
27. Zapf MA, Kothari AN, Markossian T, et al. The “weekend effect” in urgent general operative procedures. Surgery. 2015;158(2):508-514. PubMed
28. Glaser R, Naidu SS, Selzer F, et al. Factors associated with poorer prognosis for patients undergoing primary percutaneous coronary intervention during off-hours: biology or systems failure? JACC Cardiovasc Interv. 2008;1(6):681-688. PubMed
The “weekend effect” refers to the association between weekend hospital admissions and poorer outcomes, such as higher mortality rates. Analysis of National Health Service claims data from the United Kingdom suggested a 10% increase in 30-day mortality in patients admitted on Saturdays and 15% in patients admitted on Sundays,1 leading to the push for a 7-day work week and invoking controversial changes in their junior doctor (residency) working contract. Studies in the United States highlighting differences in outcomes for patients admitted on weekends compared to weekdays have mostly focused on specific diagnoses and results have been variable. Few have gone on to look at the association of weekend hospital admissions on cost2,3 and length of stay3 but results are overall inconclusive. Some have suggested that such poorer outcomes for patients admitted on weekends are due to reduced staffing and delayed procedures on weekends compared to weekdays, although this has been debated.4 The lack of consensus has made it difficult for hospitals to plan if and how to expand weekend manpower or services.
In the United States, increase in mortality rate for patients admitted on weekends has been demonstrated for a range of diagnoses, including pulmonary embolism,5 intracerebral hemorrhage,6 upper gastrointestinal hemorrhage,7,8 ruptured aortic aneurysm,9 heart failure,10 and acute kidney injury.11 However, other diagnoses such as atrial flutter or fibrillation,2 hip fractures,12 ischemic stroke,13 and esophageal variceal hemorrhage,14 show no difference in mortality between weekday and weekend admissions. Yet, other conditions such as myocardial infarction15,16 and subarachnoid hemorrhage17,18 have multiple studies with conflicting results. None of these studies have comprehensively looked at the effect of weekend admissions across all diagnoses nor compared the effect size between common diagnoses in the United States using the same risk adjustment. Reporting of differences in length of stay and cost is also rare.
We postulated that the weekend admissions are associated with increased mortality and length of stay, but that the effect would be heterogeneous between different diagnosis groups. Using a large nationally representative inpatient database, we investigated the association between weekend versus weekday admissions on in-hospital mortality, length of stay, and cost for acute hospitalizations in the United States. We performed subgroup analyses of the top 20 diagnoses to determine which diagnoses, if any, should be targeted for expanded weekend manpower or services.
METHODS
Data Sources
We used information from the National Inpatient Sample (NIS) database for this study,19 which is the largest all-payer inpatient healthcare database in the United States. It contains administrative claims information on a 20% stratified sample of discharges from all hospitals participating in the Healthcare Cost and Utilization Project (HCUP), which includes over 90% of hospitals and 95% of discharges in the country. The NIS contains clinical and nonclinical data elements, including diagnoses, severity and comorbidity measures, demographics, admission characteristics, and charges.
Study Patients
The study included all patients who were 18 years or older and were admitted to hospitals participating in HCUP from 2012 to 2014. Elective or planned admissions were excluded from this study because of the anticipated degree of unmeasured confounding that would be present between patients electively admitted on weekends compared to weekdays.
Study Variables
The primary exposure variable was admission on weekends (defined as Friday midnight to Sunday midnight) compared to the rest of the week. The primary outcome variable was in-hospital mortality. The secondary outcome variables were length of stay (measured in integer days) and cost. Length of stay was compared only using only patients who survived the hospital admission to eliminate the effect of death in shortening the length of stay. Cost was calculated by using charges available in the NIS and multiplied by the accompanying cost-to-charge ratios. Charges reflect total amount that hospitals billed for services but do not reflect how much these services actually cost. The HCUP cost-to-charge ratios are hospital-specific data based on hospital accounting reports collected by the Centers for Medicare & Medicaid Services.19
Covariates included age, sex, race, income, payer, presence or absence of comorbidities as defined by the Elixhauser comorbidity index,20 risk of mortality, and severity of illness scores as defined by the 3M Health Information Systems.21 Mortality risk and severity of illness groups are defined by using a proprietary iterative process developed by 3M Health Information Systems using International Classification of Diseases, 9th Revision-Clinical Modification (ICD-9-CM) principal and secondary diagnosis codes and procedure codes, age, sex, and discharge disposition, evaluated with historical data.21 Severity of illness refers to the extent of physiologic decompensation or loss of function of an organ system, whereas risk of mortality refers to the likelihood of dying.
Statistical Analysis
We compared patient characteristics and other covariates between patients emergently admitted on weekends and weekdays. Continuous variables that were not normally distributed were either categorized (age, risk of mortality, and severity of illness scores) or log-transformed if right skewed (length of stay and cost). Categorical data were reported as percentages and continuous data as medians (interquartile range). We compared the inpatient mortality rate between weekend and weekday admissions by using χ2 tests. Multivariable logistic regression was used to adjust for covariates of age, gender, race, payer, income, risk of mortality and severity of illness scores, number of comorbidities, and the presence or absence of each of the 29 comorbidities available in the database to determine an adjusted odds ratio (OR), P values, and confidence intervals (CIs).
We also compared the length of stay amongst survivors and costs between weekend and weekday admissions. Multivariable linear regression was applied to the natural log of these outcome variables and the coefficients exponentiated to determine the difference in length of stay and cost of weekend admissions as compared to weekday. Covariates in the model were the same as those used for the primary outcome.
To determine if particular diagnoses had a pronounced weekend effect, the above analyses were repeated in subgroups of the top 20 most prevalent diagnoses on weekends by using the Clinical Classifications Software for ICD-9-CM diagnosis groups. For subgroup analyses, a Bonferroni correction was used, so P values of <.0025 were considered significant.
Statistical analyses were performed by using SAS version 9.4 (SAS Institute Inc, Cary, NC). All regression models were run using PROC SURVEYREG for continuous outcomes and PROC SURVEYLOGISTIC for binary outcomes to account for the sampling structure of NIS. Two-sided P values of .05 were considered significant, apart from the Bonferroni correction applied to the subgroup analysis. As this study involved publicly available deidentified data, our study was exempt from institutional board review.
RESULTS
Patient Characteristics
Mortality
The crude in-hospital mortality rate was 2.8% for patients admitted on weekends and 2.5% for patients admitted on weekdays (unadjusted OR, 1.110; 95% CI, 1.105-1.113; P < .0001). This relationship was attenuated after adjustment for demographics, severity, and comorbidities, but remained statistically significant (OR 1.029; 95% CI, 1.020-1.039; P < .0001; Table 2), which corresponds to an adjusted risk difference of 0.07% increase in mortality of weekend admissions. The OR for mortality on weekends compared to weekdays was further calculated for each of the top 20 diagnoses (Table 3). Out of all the diagnosis groups, only 1 (urinary tract infection) had a statistically significant P value after Bonferroni correction. We also looked separately at patients who were electively admitted—there was a highly significant OR of mortality of 1.67 (95% CI, 1.60-1.74). Patients classified as elective admissions were excluded for subsequent analyses.
Length of Stay
![]()
Cost
DISCUSSION
The magnitude of association between weekend admissions and mortality in this large administrative database contradicts existing literature, which some believe conclusively proves the international phenomenon of the weekend effect.22,23 However, our results support a minimal increase in odds of death of 2.9%, with no consistent effect amongst the top 20 diagnoses. Only 1 diagnosis group (urinary tract infection) showed a statistically significant increase in mortality, which could be due to chance. In contrast, the policy-influencing paper in the United Kingdom reports that patients admitted on Saturdays and Sundays have an increased risk of death of 10% and 15%, respectively, compared to patients admitted on Wednesdays.24 They also repeated their measurements on a United Health Care Systems database, comprising 254 leading managed care hospitals in the US, over a time period of 3 months in 2010, and found a hazard ratio of 1.18 (95% CI, 1.11-1.26). Ruiz et al.22 combined almost 3 million medical records from 28 metropolitan hospitals in 5 different countries in the Global Comparators Project, including 5 in the United States, and showed increased mortality on weekends in all countries, concluding that the weekend effect is a systematic phenomenon.
There are several possible explanations for differences in our findings. Freemantle’s study differed to ours by comparing outcomes of weekends to an index of Wednesday; they also found an increased mortality on Mondays and Fridays, which could suggest the presence of residual confounding and doubt as to whether Wednesday is the ideal control group. A further difference is the definition of mortality—we looked at in-hospital mortality, as compared to 30-day mortality. In addition, Freemantle’s study included elective admissions. When we looked at the effect of weekend admissions on mortality, we found a highly significant OR of 1.67, compared to 1.03 in emergency admissions. We attributed this discrepancy to unmeasured confounding, such as preference of physicians or difference in classification of elective admissions in different hospitals. Because of significant effect modification of elective compared to emergency admissions, we decided to restrict our analysis to emergency admissions only. This also enabled direct associations with potential policy recommendations on whether to expand weekend clinical care, which is most relevant to emergency admissions. Finally, the Global Comparators Project only samples a small proportion of hospitals in each country, leading to limited generalizability; in addition, international comparisons are difficult to interpret due to differing health systems.
The overall and diagnosis-specific difference in length of stay was small and of doubtful clinical significance. With an adjusted decrease in length of stay in patients admitted on weekends of 2.24%, when applied to a median length of stay of 3 days, it translates into a 1.7-hour difference in length of stay. However, there was striking heterogeneity noted between diagnoses, with a difference ranging from 8.91% decrease in length of stay (mood disorders) to 7.14% increase in length of stay (nonspecific chest pain), which is likely to explain the overall small magnitude of effect. We noted that the diagnoses associated with increased length of stay for weekend admissions tended to be those requiring inpatient procedures or investigations, such as acute myocardial infarction (3.90% increase), acute cerebrovascular disease (2.15% increase), cardiac dysrhythmias (1.39% increase), nonspecific chest pain (7.14% increase), and biliary tract disease (4.88% increase). As hospitals often do not provide certain nonemergent procedures or investigations on weekends, delay in procedures or investigations may explain the increase in length of stay. These include percutaneous coronary intervention or stress testing for evaluation of cardiac ischemia and endoscopic procedures for biliary tract disease and gastrointestinal hemorrhage. It must, however, be noted in conjunction that numerous studies have established higher complication rates when nonemergent surgeries are performed out of hours or on weekends.25-28 Therefore, we suggest further studies to compare the effect of weekends on increased procedural complications as to any morbidity caused by increased length of stay, which the present dataset was unable to capture. Another potential explanation for the heterogeneity in length of stay could be the greater availability of caregivers to assist with discharge on weekends, such as for patients admitted for mood disorders.
Surprisingly, weekend admissions appeared to be less costly than weekday admissions overall. Because of the large sample size, very minor differences in cost are likely to be statistically significant. Indeed, for the absolute difference of 0.45%, given a median cost of $6562 on weekends, this only represents a cost saving of approximately $30 per patient admission. There was also heterogeneity observed amongst the different diagnosis groups, and cerebrovascular disease, biliary tract disease and gastrointestinal hemorrhage, which were also associated with increase length of stay, were associated with an increased cost. However, our study is unable to establish causation, and differences in staffing numbers and reimbursement on weekends may confound cost estimates. We propose that further studies using hospital databases with greater granularity in data are necessary to determine the etiology of cost differences between weekends and weekdays.
Our study’s key strengths are the large sample size and generalizability to the US. As a large administrative database, we recognize the likelihood of inconsistencies in hospital coding for covariates, diagnoses, and charges, which may lead to misclassification bias. The NIS definition of weekend (Friday midnight to Sunday midnight) may differ from other definitions of weekend; ideally Friday 5
CONCLUSION
Our study does not suggest that system-wide policies to increase weekend service coverage will impact mortality, although effects on length of stay and cost are inconclusive. Hospitals wishing to improve coverage may consider focusing on procedural diagnoses as listed above which may shorten length of stay, although the out-of-hours complication rate should be carefully monitored.
Disclosure
The authors declare no conflicts of interest.
1. Freemantle N, Ray D, McNulty D, et al. Increased mortality associated with weekend hospital admission: a case for expanded seven day services? BMJ. 2015;351:h4596. PubMed
2. Weeda ER, Hodgdon N, Do T, et al. Association between weekend admission for atrial fibrillation or flutter and in-hospital mortality, procedure utilization, length-of-stay and treatment costs. Int J Cardiol. 2016;202:427-429. PubMed
3. Khanna R, Wachsberg K, Marouni A, Feinglass J, Williams MV, Wayne DB. The association between night or weekend admission and hospitalization-relevant patient outcomes. J Hosp Med. 2011;6(1):10-14. PubMed
4. Aldridge C, Bion J, Boyal A, et al. Weekend specialist intensity and admission mortality in acute hospital trusts in England: a cross-sectional study. Lancet. 2016;388(10040):178-186. PubMed
5. Coleman CI, Brunault RD, Saulsberry WJ. Association between weekend admission and in-hospital mortality for pulmonary embolism: An observational study and meta-analysis. Int J Cardiol. 2015;194:72-74. PubMed
6. Crowley RW, Yeoh HK, Stukenborg GJ, Medel R, Kassell NF, Dumont AS. Influence of weekend hospital admission on short-term mortality after intracerebral hemorrhage. Stroke. 2009;40(7):2387-2392. PubMed
7. Dorn SD, Shah ND, Berg BP, Naessens JM. Effect of weekend hospital admission on gastrointestinal hemorrhage outcomes. Dig Dis Sci. 2010;55(6):1658-1666. PubMed
8. Shaheen AA, Kaplan GG, Myers RP. Weekend versus weekday admission and mortality from gastrointestinal hemorrhage caused by peptic ulcer disease. Clin Gastroenterol Hepatol. 2009;7(3):303-310. PubMed
9. Groves EM, Khoshchehreh M, Le C, Malik S. Effects of weekend admission on the outcomes and management of ruptured aortic aneurysms. J Vasc Surg. 2014;60(2):318-324. PubMed
10. Horwich TB, Hernandez AF, Liang L, et al. Weekend hospital admission and discharge for heart failure: association with quality of care and clinical outcomes. Am Heart J. 2009;158(3):451-458. PubMed
11. James MT, Wald R, Bell CM, et al. Weekend hospital admission, acute kidney injury, and mortality. J Am Soc Nephrol. 2010;21(5):845-851. PubMed
12. Boylan MR, Rosenbaum J, Adler A, Naziri Q, Paulino CB. Hip Fracture and the Weekend Effect: Does Weekend Admission Affect Patient Outcomes? Am J Orthop (Belle Mead NJ). 2015;44(10):458-464. PubMed
13. Myers RP, Kaplan GG, Shaheen AM. The effect of weekend versus weekday admission on outcomes of esophageal variceal hemorrhage. Can J Gastroenterol. 2009;23(7):495-501. PubMed
14. Hoh BL, Chi YY, Waters MF, Mocco J, Barker FG 2nd. Effect of weekend compared with weekday stroke admission on thrombolytic use, in-hospital mortality, discharge disposition, hospital charges, and length of stay in the Nationwide Inpatient Sample Database, 2002 to 2007. Stroke. 2010;41(10):2323-2328. PubMed
15. Kostis WJ, Demissie K, Marcella SW, Shao YH, Wilson AC, Moreyra AE. Weekend versus weekday admission and mortality from myocardial infarction. N Engl J Med. 2007;356(11):1099-1109. PubMed
16. Noad R, Stevenson M, Herity NA. Analysis of weekend effect on 30-day mortality among patients with acute myocardial infarction. Open Heart. 2017;4:1-5. PubMed
17. Crowley RW, Yeoh HK, Stukenborg GJ, Ionescu AA, Kassell NF, Dumont AS. Influence of weekend versus weekday hospital admission on mortality following subarachnoid hemorrhage. J Neurosurg. 2009;111(1):60-66. PubMed
18. Nguyen E, Tsoi A, Lee K, Farasat S, Coleman CI. Association between weekend admission for intracerebral and subarachnoid hemorrhage and in-hospital mortality. Int J Cardiol. 2016;212:26-28. PubMed
19. Healthcare Cost and Utilization Project. Overview of the National (Nationwide) Inpatient Sample (NIS). https://www.hcup-us.ahrq.gov/nisoverview.jsp. Accessed June 20, 2017.
20. Healthcare Cost and Utilization Project. Elixhauser Comorbidity Software, Version 3.7. https://www.hcup-us.ahrq.gov/toolssoftware/comorbidity/comorbidity.jsp. Accessed Feburary 20, 2017.
21. 3M Health Information Systems. All Patient Refined Diagnosis Related Groups (APR-DRGs), Version 20.0, Methodology Overview. 2003; https://www.hcup-us.ahrq.gov/db/nation/nis/APR-DRGsV20MethodologyOverviewandBibliography.pdf. Accessed on Feburary 20, 2017.
22. Ruiz M, Bottle A, Aylin PP. The Global Comparators project: international comparison of 30-day in-hospital mortality by day of the week. BMJ Qual Saf. 2015;24(8):492-504. PubMed
23. Lilford RJ, Chen YF. The ubiquitous weekend effect: moving past proving it exists to clarifying what causes it. BMJ Qual Saf. 2015;24(8):480-482. PubMed
24. Freemantle N, Richardson M, Wood J, et al. Weekend hospitalization and additional risk of death: an analysis of inpatient data. J R Soc Med. 2012;105(2):74-84. PubMed
25. Aylin P, Alexandrescu R, Jen MH, Mayer EK, Bottle A. Day of week of procedure and 30 day mortality for elective surgery: retrospective analysis of hospital episode statistics. BMJ. 2013;346:f2424. PubMed
26. Bendavid E, Kaganova Y, Needleman J, Gruenberg L, Weissman JS. Complication rates on weekends and weekdays in US hospitals. Am J Med. 2007;120(5):422-428. PubMed
27. Zapf MA, Kothari AN, Markossian T, et al. The “weekend effect” in urgent general operative procedures. Surgery. 2015;158(2):508-514. PubMed
28. Glaser R, Naidu SS, Selzer F, et al. Factors associated with poorer prognosis for patients undergoing primary percutaneous coronary intervention during off-hours: biology or systems failure? JACC Cardiovasc Interv. 2008;1(6):681-688. PubMed
© 2018 Society of Hospital Medicine
TXT2STAYQUIT: Pilot Randomized Trial of Brief Automated Smoking Cessation Texting Intervention for Inpatient Smokers Discharged from the Hospital
Hospitalization requires smokers to quit temporarily and offers healthcare professionals an opportunity to provide cessation treatment.1 However, it is important that encouragement continues after the patient has been discharged from the hospital.2 Studies have shown that text messaging interventions for smoking cessation are efficacious in increasing biochemically confirmed cessation rates at 6-month follow-up.3-5 Utilizing technology such as automated voice calls postdischarge has been shown to increase smoking cessation rates; however, text messaging has not been applied to this population.6 This randomized controlled trial of automated smoking cessation support at discharge, coupled with brief advice among hospital inpatients, aimed to assess whether text messaging is a feasible method for providing smoking cessation support and monitoring smoking status postdischarge.
METHODS
Six hundred fifty-five inpatients accepted cessation counseling, 248 were eligible for study participation (including smoking ≥20 cigarettes in 30 days prior to admission and being willing to make a quit attempt and send and/or receive texts), 158 consented to the study, and 140 were included in the analysis (participant removal from analysis was due to technical difficulties prohibiting the participants from receiving the intervention). Participants received texts via an automated system maintained through the College of Information Sciences and Technology at Pennsylvania State University starting at discharge and continuing for 1 month. Control participants received weekly text message smoking status questions. Intervention participants received weekly smoking status questions in addition to daily smoking cessation tips and had the option to interact with the system for additional support. Quit status was based on self-reported, past-week abstinence 28 days after discharge with subsample biochemical verification via carbon monoxide (CO) reading. Intent-to-treat analysis was utilized, and those who did not complete the follow-up phone call were classified as smokers.7 Power was calculated based on the magnitude of change found in the largest published randomized controlled trial of texts for smoking cessation that reported results using a similar 28-day definition.4 This study had 63% power to detect a difference in 28-day abstinence (measured using past 7-day abstinence) of 28.7% in the intervention group compared with 12.1% in the control group.
RESULTS
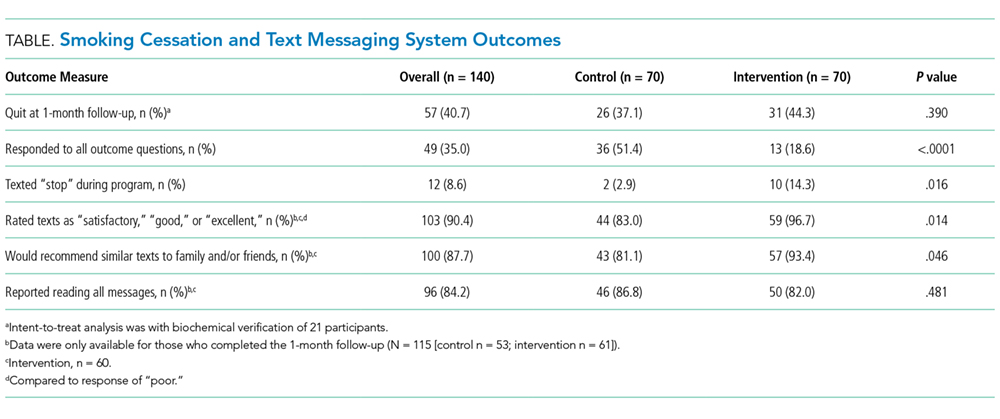
DISCUSSION
This study demonstrates that texting may be a feasible method for following up with hospitalized smokers postdischarge. A majority of participants responded to at least 4 of the 5 outcome questions. Additionally, participants in the intervention group who completed the 1-month follow-up were more likely than those in the control group to rate the texts favorably and to say that they would recommend similar texts to family or friends, indicating that those in the intervention group found the program helpful. However, a majority of participants in the control group also rated the texts favorably and reported they would recommend similar texts to friends or family. This implies that the limited texts provided to the control group may have provided more benefit than researchers previously anticipated.
This study also illustrates the importance of biochemical verification of quit status. Of participants who completed CO verification, 14% did not meet the requirement to be classified as nonsmokers. Other studies of text messaging interventions, including Abroms et al.3 and Free et al.,4 utilized biochemical verification via salivary cotinine and found that of participants who self-reported having quit at follow-up, 24.4% and 28% failed the verification, respectively. In the current study, 10 participants refused verification. It is possible that those who were unwilling to comply may not truly have quit.
While researchers have found that text messaging interventions are efficacious, they have not applied them to an inpatient setting. A limitation is that 62% (n = 407) of the patients counseled were ineligible, and 36% (n = 90) of those who were eligible were not interested in participating. This may indicate that the intervention format is of interest to a limited audience that is already familiar with text messaging. Another limitation is that this was a pilot study conducted with limited power. However, it does provide useful preliminary data for consideration in the development of future text-based smoking cessation interventions.
In conclusion, this study shows that automated text messaging may be a feasible way to monitor smoking status as well as provide smoking cessation support after smokers are discharged from the hospital.
Acknowledgments
The authors gratefully acknowledge those in the respiratory care department at Penn State Health Milton S. Hershey Medical Center for their assistance in the recruitment for this study and providing inpatient smoking cessation counseling.
Disclosure
Dr. Foulds has done paid consulting for pharmaceutical companies that are involved in producing smoking cessation medications, including GlaxoSmithKline, Pfizer, Novartis, Johnson and Johnson, and Cypress Bioscience Inc. All other authors declare that they have no potential conflicts of interest to disclose.
Funding
The project described was supported by the National Center for Advancing Translational Sciences, National Institutes of Health, through an internal pilot grant (PI: JF) as part of parent grant to Penn State CTSI: Grant UL1 TR000127 and TR002014. The content is solely the responsibility of the authors and does not necessarily represent the official views of the NIH.
1. Fiore MC, Jaén CR, Baker TB, et al. Treating Tobacco Use and Dependence: 2008 Update. Rockville, MD: U.S. Department of Health and Human Services; 2008. PubMed
2. Rigotti NA, Munafo MR, Stead LF. Smoking cessation interventions for hospitalized smokers: a systematic review. Arch Intern Med. 2008;168(18):1950-1960. PubMed
3. Abroms LC, Boal AL, Simmens SJ, Mendel JA, Windsor RA. A randomized trial of Text2Quit: a text messaging program for smoking cessation. Am J Prev Med. 2014;47(3):242-250. PubMed
4. Free C, Knight R, Robertson S, et al. Smoking cessation support delivered via mobile phone text messaging (txt2stop): a single-blind, randomised trial. Lancet. 2011;378(9785):49-55. PubMed
5. Spohr SA, Nandy R, Gandhiraj D, Vemulapalli A, Anne S, Walters ST. Efficacy of SMS text message interventions for smoking cessation: a meta-analysis. J Subst Abuse Treat. 2015;56:1-10. PubMed
6. Rigotti NA, Regan S, Levy DE, et al. Sustained care intervention and postdischarge smoking cessation among hospitalized adults: a randomized clinical trial. JAMA. 2014;312(7):719-728. PubMed
7. Gupta SK. Intention-to-treat concept: a review. Perspect Clin Res. 2011;2(3):109-112. PubMed
Hospitalization requires smokers to quit temporarily and offers healthcare professionals an opportunity to provide cessation treatment.1 However, it is important that encouragement continues after the patient has been discharged from the hospital.2 Studies have shown that text messaging interventions for smoking cessation are efficacious in increasing biochemically confirmed cessation rates at 6-month follow-up.3-5 Utilizing technology such as automated voice calls postdischarge has been shown to increase smoking cessation rates; however, text messaging has not been applied to this population.6 This randomized controlled trial of automated smoking cessation support at discharge, coupled with brief advice among hospital inpatients, aimed to assess whether text messaging is a feasible method for providing smoking cessation support and monitoring smoking status postdischarge.
METHODS
Six hundred fifty-five inpatients accepted cessation counseling, 248 were eligible for study participation (including smoking ≥20 cigarettes in 30 days prior to admission and being willing to make a quit attempt and send and/or receive texts), 158 consented to the study, and 140 were included in the analysis (participant removal from analysis was due to technical difficulties prohibiting the participants from receiving the intervention). Participants received texts via an automated system maintained through the College of Information Sciences and Technology at Pennsylvania State University starting at discharge and continuing for 1 month. Control participants received weekly text message smoking status questions. Intervention participants received weekly smoking status questions in addition to daily smoking cessation tips and had the option to interact with the system for additional support. Quit status was based on self-reported, past-week abstinence 28 days after discharge with subsample biochemical verification via carbon monoxide (CO) reading. Intent-to-treat analysis was utilized, and those who did not complete the follow-up phone call were classified as smokers.7 Power was calculated based on the magnitude of change found in the largest published randomized controlled trial of texts for smoking cessation that reported results using a similar 28-day definition.4 This study had 63% power to detect a difference in 28-day abstinence (measured using past 7-day abstinence) of 28.7% in the intervention group compared with 12.1% in the control group.
RESULTS
DISCUSSION
This study demonstrates that texting may be a feasible method for following up with hospitalized smokers postdischarge. A majority of participants responded to at least 4 of the 5 outcome questions. Additionally, participants in the intervention group who completed the 1-month follow-up were more likely than those in the control group to rate the texts favorably and to say that they would recommend similar texts to family or friends, indicating that those in the intervention group found the program helpful. However, a majority of participants in the control group also rated the texts favorably and reported they would recommend similar texts to friends or family. This implies that the limited texts provided to the control group may have provided more benefit than researchers previously anticipated.
This study also illustrates the importance of biochemical verification of quit status. Of participants who completed CO verification, 14% did not meet the requirement to be classified as nonsmokers. Other studies of text messaging interventions, including Abroms et al.3 and Free et al.,4 utilized biochemical verification via salivary cotinine and found that of participants who self-reported having quit at follow-up, 24.4% and 28% failed the verification, respectively. In the current study, 10 participants refused verification. It is possible that those who were unwilling to comply may not truly have quit.
While researchers have found that text messaging interventions are efficacious, they have not applied them to an inpatient setting. A limitation is that 62% (n = 407) of the patients counseled were ineligible, and 36% (n = 90) of those who were eligible were not interested in participating. This may indicate that the intervention format is of interest to a limited audience that is already familiar with text messaging. Another limitation is that this was a pilot study conducted with limited power. However, it does provide useful preliminary data for consideration in the development of future text-based smoking cessation interventions.
In conclusion, this study shows that automated text messaging may be a feasible way to monitor smoking status as well as provide smoking cessation support after smokers are discharged from the hospital.
Acknowledgments
The authors gratefully acknowledge those in the respiratory care department at Penn State Health Milton S. Hershey Medical Center for their assistance in the recruitment for this study and providing inpatient smoking cessation counseling.
Disclosure
Dr. Foulds has done paid consulting for pharmaceutical companies that are involved in producing smoking cessation medications, including GlaxoSmithKline, Pfizer, Novartis, Johnson and Johnson, and Cypress Bioscience Inc. All other authors declare that they have no potential conflicts of interest to disclose.
Funding
The project described was supported by the National Center for Advancing Translational Sciences, National Institutes of Health, through an internal pilot grant (PI: JF) as part of parent grant to Penn State CTSI: Grant UL1 TR000127 and TR002014. The content is solely the responsibility of the authors and does not necessarily represent the official views of the NIH.
1. Fiore MC, Jaén CR, Baker TB, et al. Treating Tobacco Use and Dependence: 2008 Update. Rockville, MD: U.S. Department of Health and Human Services; 2008. PubMed
2. Rigotti NA, Munafo MR, Stead LF. Smoking cessation interventions for hospitalized smokers: a systematic review. Arch Intern Med. 2008;168(18):1950-1960. PubMed
3. Abroms LC, Boal AL, Simmens SJ, Mendel JA, Windsor RA. A randomized trial of Text2Quit: a text messaging program for smoking cessation. Am J Prev Med. 2014;47(3):242-250. PubMed
4. Free C, Knight R, Robertson S, et al. Smoking cessation support delivered via mobile phone text messaging (txt2stop): a single-blind, randomised trial. Lancet. 2011;378(9785):49-55. PubMed
5. Spohr SA, Nandy R, Gandhiraj D, Vemulapalli A, Anne S, Walters ST. Efficacy of SMS text message interventions for smoking cessation: a meta-analysis. J Subst Abuse Treat. 2015;56:1-10. PubMed
6. Rigotti NA, Regan S, Levy DE, et al. Sustained care intervention and postdischarge smoking cessation among hospitalized adults: a randomized clinical trial. JAMA. 2014;312(7):719-728. PubMed
7. Gupta SK. Intention-to-treat concept: a review. Perspect Clin Res. 2011;2(3):109-112. PubMed
© 2018 Society of Hospital Medicine
The Maturing Antibiotic Mantra: “Shorter Is Still Better”
The proper duration of antibiotic therapy for various infections is a matter of long-standing consternation. For decades, the standard antibiotic course for most acute bacterial infections has been 7 to 14 days, based largely on the fact that the week has 7 days in it.1 The reason the week has 7 days in it dates back to an edict issued by Constantine the Great in 321 AD.1 To underscore the absurdity of basing 21st century antibiotic course durations on an ancient Roman Emperor’s decree, I refer to such durations as “Constantine Units.” One Constantine Unit is a 7-day course of antibiotics, and 2 Constantine Units is a 14-day course.
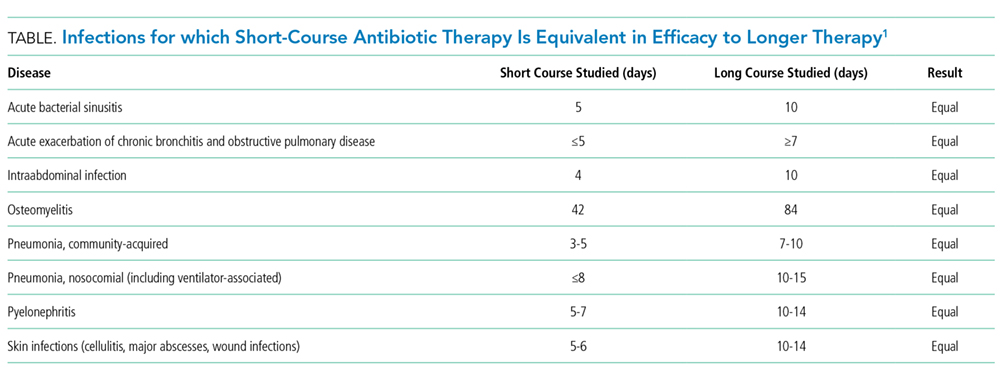
Based on such a plethora of data, a year ago, I suggested that physicians replace the dogma of Constantine-Unit-based durations of therapy with a new mantra, “shorter is better.”1 A year later, that mantra is no longer new. It is maturing, but it is not yet sufficiently widespread among providers. As a result, providers continue to prescribe unnecessarily long durations of antibiotic therapy, which wastes antibiotics, results in increased selective pressure driving antibiotic resistance, and continues to erode the miraculous efficacy of these drugs.
Royer et al.4 have now added to the overwhelming evidence in favor of short-course antibiotic therapy with a new meta-analysis comparing shorter courses with longer courses of therapy for acute bacterial infections, specifically for hospitalized patients. They studied clinical trials comparing shorter versus longer courses of therapy for hospital inpatients with pneumonia, complicated urinary tract infections, intraabdominal infections, or nosocomial infections of unknown origin. Across 13 clinical trials that included efficacy data, cumulatively, the investigators found no difference in clinical cure, microbiological cure, mortality, or infection relapses between short courses and longer courses of therapy. As mentioned, this result is concordant with an extensive body of literature on this topic (Table).
The fact that short durations of antibiotics can cure infections has been known for a long time. In the early penicillin era, courses of therapy were typically 1 to 4 days with good success rates.2 Interestingly, in a recent clinical trial in which daptomycin was found to be ineffective for community-acquired pneumonia (because of inactivation by pulmonary surfactant), a single dose of ceftriaxone markedly improved the cure rate for pneumonia in the daptomycin arm.5,6 The salutary effect of a single dose of ceftriaxone on the clinical cure for pneumonia reinforces how badly we have been overtreating infections for many years.
Many of the signs and symptoms of bacterial infections result from the inflammatory response to the bacteria rather than the direct presence of viable bacteria. Thus, the persistence of symptoms for a few days does not necessarily mean that viable bacteria are still present (ie, symptoms can persist even when all the bacteria are dead). It is likely that a reasonable proportion of patients with acute bacterial infections are cured with 1 day of therapy, and that additional days are decremental to increasing that cure rate. Even 5 days of antibiotics are likely more than is needed to cure the large majority of patients with acute bacterial infections.
Unfortunately, we do not yet have the technology to truly customize durations of therapy in individual patients, although the resolution of high-procalcitonin levels can assist with this question by enabling earlier termination of therapy.7 Rather, we tend to select fixed durations of therapy knowing that we are overtreating some (if not most) patients because we cannot distinguish individual treatment needs, and we want to be sure that the duration we select will maximally cure everyone we treat. Our desire to maximize cures across a population has led us to expand durations of therapy over many decades based on increments of Constantine Units. Fortunately, more recent randomized controlled trials now tell us with great confidence that shorter courses of antibiotic therapy are as effective as longer courses, with the added benefit of reducing the exposure of patients to antibiotics. Reduced exposure intrinsically reduces the risk of adverse events and of selective pressure that drives resistance in our microbiomes.
Thus, shorter is indeed better. The thought is no longer new; it is maturing. It is based on real, repeated, high-quality randomized controlled trials across multiple types of infections. Medical staffs of hospitals should pass expected practices around short-course antibiotic therapy to encourage their providers to practice modern antiinfective medicine. National guidelines for specific types of infections and regulatory standards for clinical trial conduct should also be updated.3,8 In short, it is time for the medical community to support changing our old habits and help to transform how we use and protect the rapidly eroding societal trust8 that is effective antimicrobial therapy.
Disclosure: This work was supported by the National Institute of Allergy and Infectious Diseases at the National Institutes of Health, grant numbers R01 AI130060, R01 HSO25690, R01 AI1081719, and R21 AI127954. In the last 12 months, BS has consulted for Cempra, The Medicines Company, Medimmune, Tetraphase, AstraZeneca, Merck, Genentech, Forge, and Pfizer and owns equity in BioAIM, Synthetic Biologics, and Mycomed.
1. Spellberg B. The New Antibiotic Mantra-”Shorter Is Better.” JAMA Intern Med. 2016;176(9):1254-1255. PubMed
2. Rice LB. The Maxwell Finland Lecture: for the duration-rational antibiotic administration in an era of antimicrobial resistance and clostridium difficile. Clin Infect Dis. 2008;46(4):491-496. PubMed
3. Spellberg B, Bartlett JG, Gilbert DN. The future of antibiotics and resistance. N Engl J Med. 2013;368(4):299-302. PubMed
4. Royer S, DeMerle KM, Dickson RP, Prescott HC. Shorter versus Longer Courses of Antibiotics for Infection in Hospitalized Patients: a Systematic Review and Meta-Analysis. J Hosp Med. In press. PubMed
5. Pertel PE, Bernardo P, Fogarty C, et al. Effects of prior effective therapy on the efficacy of daptomycin and ceftriaxone for the treatment of community-acquired pneumonia. Clin Infect Dis. 2008;46:1142-1151. PubMed
6. Silverman JA, Mortin LI, Vanpraagh AD, Li T, Alder J. Inhibition of daptomycin by pulmonary surfactant: in vitro modeling and clinical impact. J Infect Dis. 2005;191(12):2149-2152. PubMed
7. Sager R, Kutz A, Mueller B, Schuetz P. Procalcitonin-guided diagnosis and antibiotic stewardship revisited. BMC Med. 2017;15(1):15-25. PubMed
8. Spellberg B, Srinivasan A, Chambers HF. New Societal Approaches to Empowering Antibiotic Stewardship. JAMA. 2016;315(12):1229-1230. PubMed
The proper duration of antibiotic therapy for various infections is a matter of long-standing consternation. For decades, the standard antibiotic course for most acute bacterial infections has been 7 to 14 days, based largely on the fact that the week has 7 days in it.1 The reason the week has 7 days in it dates back to an edict issued by Constantine the Great in 321 AD.1 To underscore the absurdity of basing 21st century antibiotic course durations on an ancient Roman Emperor’s decree, I refer to such durations as “Constantine Units.” One Constantine Unit is a 7-day course of antibiotics, and 2 Constantine Units is a 14-day course.
Based on such a plethora of data, a year ago, I suggested that physicians replace the dogma of Constantine-Unit-based durations of therapy with a new mantra, “shorter is better.”1 A year later, that mantra is no longer new. It is maturing, but it is not yet sufficiently widespread among providers. As a result, providers continue to prescribe unnecessarily long durations of antibiotic therapy, which wastes antibiotics, results in increased selective pressure driving antibiotic resistance, and continues to erode the miraculous efficacy of these drugs.
Royer et al.4 have now added to the overwhelming evidence in favor of short-course antibiotic therapy with a new meta-analysis comparing shorter courses with longer courses of therapy for acute bacterial infections, specifically for hospitalized patients. They studied clinical trials comparing shorter versus longer courses of therapy for hospital inpatients with pneumonia, complicated urinary tract infections, intraabdominal infections, or nosocomial infections of unknown origin. Across 13 clinical trials that included efficacy data, cumulatively, the investigators found no difference in clinical cure, microbiological cure, mortality, or infection relapses between short courses and longer courses of therapy. As mentioned, this result is concordant with an extensive body of literature on this topic (Table).
The fact that short durations of antibiotics can cure infections has been known for a long time. In the early penicillin era, courses of therapy were typically 1 to 4 days with good success rates.2 Interestingly, in a recent clinical trial in which daptomycin was found to be ineffective for community-acquired pneumonia (because of inactivation by pulmonary surfactant), a single dose of ceftriaxone markedly improved the cure rate for pneumonia in the daptomycin arm.5,6 The salutary effect of a single dose of ceftriaxone on the clinical cure for pneumonia reinforces how badly we have been overtreating infections for many years.
Many of the signs and symptoms of bacterial infections result from the inflammatory response to the bacteria rather than the direct presence of viable bacteria. Thus, the persistence of symptoms for a few days does not necessarily mean that viable bacteria are still present (ie, symptoms can persist even when all the bacteria are dead). It is likely that a reasonable proportion of patients with acute bacterial infections are cured with 1 day of therapy, and that additional days are decremental to increasing that cure rate. Even 5 days of antibiotics are likely more than is needed to cure the large majority of patients with acute bacterial infections.
Unfortunately, we do not yet have the technology to truly customize durations of therapy in individual patients, although the resolution of high-procalcitonin levels can assist with this question by enabling earlier termination of therapy.7 Rather, we tend to select fixed durations of therapy knowing that we are overtreating some (if not most) patients because we cannot distinguish individual treatment needs, and we want to be sure that the duration we select will maximally cure everyone we treat. Our desire to maximize cures across a population has led us to expand durations of therapy over many decades based on increments of Constantine Units. Fortunately, more recent randomized controlled trials now tell us with great confidence that shorter courses of antibiotic therapy are as effective as longer courses, with the added benefit of reducing the exposure of patients to antibiotics. Reduced exposure intrinsically reduces the risk of adverse events and of selective pressure that drives resistance in our microbiomes.
Thus, shorter is indeed better. The thought is no longer new; it is maturing. It is based on real, repeated, high-quality randomized controlled trials across multiple types of infections. Medical staffs of hospitals should pass expected practices around short-course antibiotic therapy to encourage their providers to practice modern antiinfective medicine. National guidelines for specific types of infections and regulatory standards for clinical trial conduct should also be updated.3,8 In short, it is time for the medical community to support changing our old habits and help to transform how we use and protect the rapidly eroding societal trust8 that is effective antimicrobial therapy.
Disclosure: This work was supported by the National Institute of Allergy and Infectious Diseases at the National Institutes of Health, grant numbers R01 AI130060, R01 HSO25690, R01 AI1081719, and R21 AI127954. In the last 12 months, BS has consulted for Cempra, The Medicines Company, Medimmune, Tetraphase, AstraZeneca, Merck, Genentech, Forge, and Pfizer and owns equity in BioAIM, Synthetic Biologics, and Mycomed.
1. Spellberg B. The New Antibiotic Mantra-”Shorter Is Better.” JAMA Intern Med. 2016;176(9):1254-1255. PubMed
2. Rice LB. The Maxwell Finland Lecture: for the duration-rational antibiotic administration in an era of antimicrobial resistance and clostridium difficile. Clin Infect Dis. 2008;46(4):491-496. PubMed
3. Spellberg B, Bartlett JG, Gilbert DN. The future of antibiotics and resistance. N Engl J Med. 2013;368(4):299-302. PubMed
4. Royer S, DeMerle KM, Dickson RP, Prescott HC. Shorter versus Longer Courses of Antibiotics for Infection in Hospitalized Patients: a Systematic Review and Meta-Analysis. J Hosp Med. In press. PubMed
5. Pertel PE, Bernardo P, Fogarty C, et al. Effects of prior effective therapy on the efficacy of daptomycin and ceftriaxone for the treatment of community-acquired pneumonia. Clin Infect Dis. 2008;46:1142-1151. PubMed
6. Silverman JA, Mortin LI, Vanpraagh AD, Li T, Alder J. Inhibition of daptomycin by pulmonary surfactant: in vitro modeling and clinical impact. J Infect Dis. 2005;191(12):2149-2152. PubMed
7. Sager R, Kutz A, Mueller B, Schuetz P. Procalcitonin-guided diagnosis and antibiotic stewardship revisited. BMC Med. 2017;15(1):15-25. PubMed
8. Spellberg B, Srinivasan A, Chambers HF. New Societal Approaches to Empowering Antibiotic Stewardship. JAMA. 2016;315(12):1229-1230. PubMed
© Society of Hospital Medicine
Shorter Versus Longer Courses of Antibiotics for Infection in Hospitalized Patients: A Systematic Review and Meta-Analysis
Acute infections are a leading cause of hospitalization and are associated with high cost, morbidity, and mortality.1 There is a growing body of literature to support shorter antibiotic courses to treat several different infection types.2-6 This is because longer treatment courses promote the emergence of multidrug resistant (MDR) organisms,7-9 microbiome perturbation,10 and Clostridium difficile infection (CDI).11 They are also associated with more drug side effects, longer hospitalizations, and increased costs.
Despite increasing support for shorter treatment courses, inpatient prescribing practice varies widely, and redundant antibiotic therapy is common.12-14 Furthermore, aside from ventilator-associated pneumonia (VAP),15,16 prior systematic reviews of antibiotic duration have typically included outpatient and pediatric patients,3-6,17-19 for whom the risk of treatment failure may be lower.
Given the potential for harm with inappropriate antibiotic treatment duration and the variation in current clinical practice, we sought to systematically review clinical trials comparing shorter versus longer antibiotic courses in adolescents and adults hospitalized for acute infection. We focused on common sites of infection in hospitalized patients, including pulmonary, bloodstream, soft tissue, intra-abdominal, and urinary.20,21 We hypothesized that shorter courses would be sufficient to cure infection and associated with lower costs and fewer complications. Because we hypothesized that shorter durations would be sufficient regardless of clinical course, we focused on studies in which the short course of antibiotics was specified at study onset, not determined by clinical improvement or biomarkers. We analyzed all infection types together because current sepsis treatment guidelines place little emphasis on infection site.22 In contrast to prior reviews, we focused exclusively on adult and adolescent inpatients because the risks of a too-short treatment duration may be lower in pediatric and outpatient populations.
METHODS
We followed the Preferred Reporting Items for Systematic Reviews and Meta-Analyses.23 The review was registered on the Prospero database.24
Information Sources and Search Strategy
We performed serial literature searches for articles in English comparing shorter versus longer antibiotics courses in hospitalized patients. We searched MEDLINE via PubMed and Embase (January 1, 1990, to July 1, 2017). We used Boolean operators, Boolean logic, and controlled vocabulary (eg, Medical Subject Heading [MeSH] terms) for each key word. We identified published randomized controlled trials (RCTs) of conditions of interest (MeSH terms: “bacteremia,” “sepsis,” “pneumonia,” “pyelonephritis,” “intra-abdominal infection,” “cellulitis,” “soft tissue infection”) that compared differing lengths of antibiotic treatment (keywords: “time factors,” “duration,” “long course,” “short course”) and evaluated outcomes (key words: “mortality,” “recurrence,” “secondary infections”). We hand searched references of included citations. The full search strategy is presented in supplementary Appendix 1.
Study Eligibility and Selection Criteria
To meet criteria for inclusion, a study had to (1) be an RCT; (2) involve an adult or adolescent population age ≥12 years (or report outcomes separately for such patients); (3) involve an inpatient population (or report outcomes separately for inpatients); (4) stipulate a short course of antibiotics per protocol prior to randomization and not determined by clinical response, change in biomarkers, or physician discretion; (5) compare the short course to a longer course of antibiotics, which could be determined either per protocol or by some other measure; and (6) involve antibiotics given to treat infection, not as prophylaxis.
Two authors (SR and HCP) independently reviewed the title and/or abstracts of all articles identified by the search strategy. We calculated interrater agreement with a kappa coefficient. Both authors (SR and HCP) independently reviewed the full text of each article selected for possible inclusion by either author. Disagreement regarding eligibility was adjudicated by discussion.
Data Abstraction
Two authors (SR and HCP) independently abstracted study methodology, definitions, and outcomes for each study using a standardized abstraction tool (see supplementary Appendix 2).
Study Quality
We assessed article quality using the Cochrane Collaboration’s tool,25 which evaluates 6 domains of possible bias, including sequence generation, concealment, blinding, and incomplete or selective outcome reporting. The tool is a 6-point scale, with 6 being the best score. It is recommended for assessing bias because it evaluates randomization and allocation concealment, which are not included in other tools.26 We did not exclude studies based on quality but considered studies with scores of 5-6 to have a low overall risk of bias.
Study Outcomes and Statistical Analysis
Our primary outcomes were clinical cure, microbiologic cure, mortality, and infection recurrence. Secondary outcomes were secondary MDR infection, cost, and length of stay (LOS). We conducted all analyses with Stata MP version 14 (StataCorp, College Station, TX). For each outcome, we reported the difference (95% confidence interval [CI]) between treatment arms as the rate in the short course arm minus the rate in the long course arm, consistent with the typical presentation of noninferiority data. When not reported in a study, we calculated risk difference and 95% CI using reported patient-level data. Positive values for risk difference favor the short course arm for favorable outcomes (ie, clinical and microbiologic cure) and the long course arm for adverse outcomes (ie, mortality and recurrence). A meta-analysis was used to pool risk differences across all studies for primary outcomes and for clinical cure in the community-acquired pneumonia (CAP) subgroup. We also present results as odds ratios and risk ratios in the online supplement. All meta-analyses used random effects models, as described by DerSimonian and Laird,27,28 with variance estimates of heterogeneity taken from the Mantel-Haenszel fixed effects model. We investigated heterogeneity between studies using the χ2 I2 statistic. We considered a P < .1 to indicate statistically significant heterogeneity and classified heterogeneity as low, moderate, or high on the basis of an I2 of 25%, 50%, or 75%, respectively. We used funnel plots to assess for publication bias.
RESULTS
Search Results
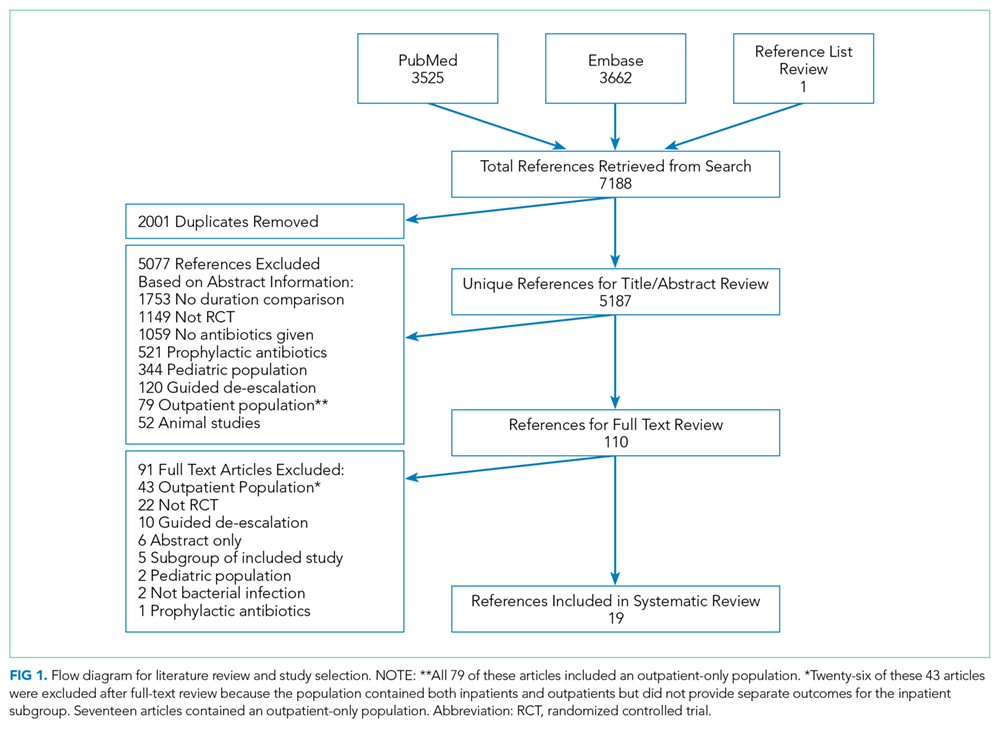
Characteristics of Included Studies
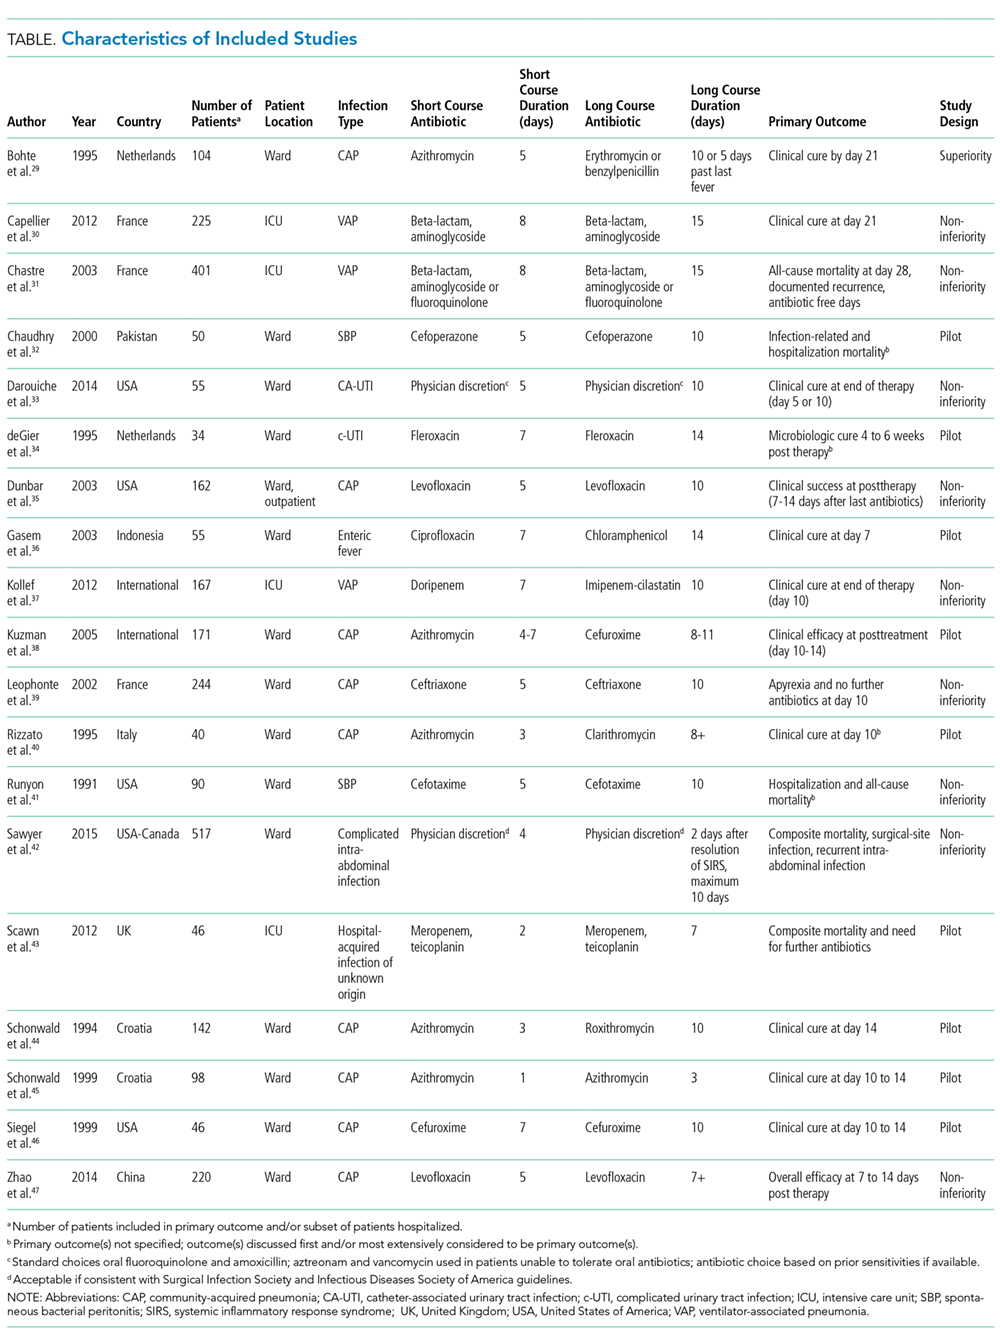
Common study outcomes included clinical cure or efficacy (composite of symptom cure and improvement; n = 13), infection recurrence (n = 10), mortality (n = 9), microbiologic cure (n = 8), and LOS (n = 7; supplementary Table 1).
Nine studies were pilot studies, 1 was a traditional superiority design study, and 9 were noninferiority studies with a prespecified limit of equivalence of either 10% (n = 7) or 15% (n = 2).
Clinical Cure and Efficacy
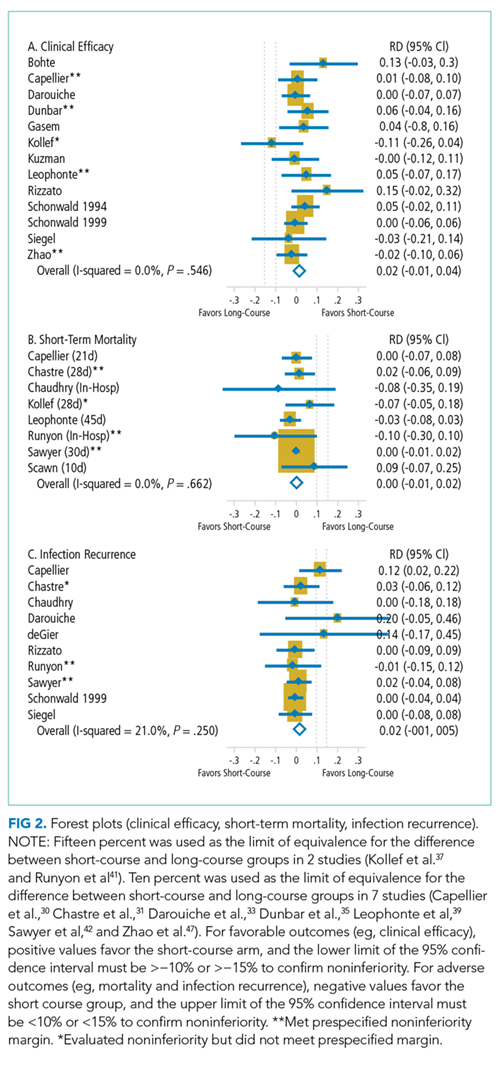
Nine studies of 1225 patients evaluated clinical cure and efficacy in CAP (supplementary Figure 1).29,35,38-40,44-47 The overall risk difference was d = 2.4% (95% CI, −0.7%-5.5%). There was no heterogeneity between studies (I2 = 0%, P = .45).
Microbiologic Cure
Eight studies of 366 patients evaluated microbiologic cure (supplementary Figure 2).32-34,36,38,40,41,47 The overall risk difference was d = 1.2% (95% CI, −4.1%-6.4%). There was no statistically significant heterogeneity between studies (I2 = 13.3%, P = .33).
Mortality
Eight studies of 1740 patients evaluated short-term mortality (in hospital to 45 days; Figure 2),30-32,37,39,41,43 while 3 studies of 654 patients evaluated longer-term mortality (60 to 180 days; supplementary Figure 3).30,31,33 The overall risk difference was d = 0.3% (95% CI, −1.2%-1.8%) for short-term mortality and d = −0.4% (95% CI, −6.3%-5.5%) for longer-term mortality. There was no heterogeneity between studies for either short-term (I2 = 0.0%, P = .66) or longer-term mortality (I2 = 0.0%, P = .69).
Infection Recurrence
Ten studies of 1554 patients evaluated infection recurrence (Figure 2).30-34,40-42,45,46 The overall risk difference was d = 2.1% (95% CI, −1.2%-5.3%). There was no statistically significant heterogeneity between studies (I2 = 21.0%, P = .25). Two of the 3 studies with noninferiority design (both evaluating intra-abdominal infections) met their prespecified margins.41,42 In Chastre et al.,31 the overall population (d = 3.0%; 95% CI, −5.8%-11.7%) and the subgroup with VAP due to nonfermenting gram-negative bacilli (NF-GNB; d = 15.2%; 95% CI, −0.9%-31.4%) failed to meet the 10% noninferiority margin.
Secondary Outcomes
Three studies30,31,42 of 286 patients (with VAP or intra-abdominal infection) evaluated the emergence of MDR organisms. The overall risk difference was d = −9.0% (95% CI, −19.1%-1.1%; P = .081). There was no statistically significant heterogeneity between studies (I2 = 7.6%, P = .34).
Seven studies examined LOS—3 in the intensive care unit (ICU)30,31,43 and 4 on the wards32,36,40,41—none of which found significant differences between treatment arms. Across 3 studies of 672 patients, the weighted average for ICU LOS was 23.6 days in the short arm versus 22.2 days in the long arm. Across 4 studies of 235 patients, the weighted average for hospital LOS was 23.3 days in the short arm versus 29.7 days in the long arm. This difference was driven by a 1991 study41 of spontaneous bacterial peritonitis (SBP), in which the average LOS was 37 days and 50 days in the short- and long-course arms, respectively.
Three studies32,41,43 of 186 total patients (with SBP or hospital-acquired infection of unknown origin) examined the cost of antibiotics. The weighted average cost savings for shorter courses in 2016 US dollars48 was $265.19.
Three studies30,33,43 of 618 patients evaluated cases of CDI, during 10-, 30-, and 180-day total follow-up. The overall risk difference was d = 0.7% (95% CI, −1.3%-2.8%), with no statistically significant heterogeneity between studies (I2 = 0%, P = .97).
Study Quality
Included studies scored 2-5 on the Cochrane Collaboration Risk of Bias Tool (supplementary Figure 4). Four studies had an overall low risk of bias,36,37,43,46 while 15 had a moderate to high risk of bias (supplementary Table 3).29-35,38-42,44,45,47 Common sources of bias included inadequate details to confirm adequate randomization and/or concealment (n = 13) and lack of adequate blinding (n = 18). Two studies were stopped early,37,42 and 3 others were possibly stopped early because it was unclear how the number of participants was determined.29,33,47 Covariate imbalance (failure of randomization) was present in 2 studies.37,47 There was no evidence of selective outcome reporting or publication bias based on the funnel plots (supplementary Figure 5).
DISCUSSION
In this study, we performed a systematic review and meta-analysis of RCTs of shorter versus longer antibiotic courses for adults and adolescents hospitalized for infection. The rate of clinical cure was indistinguishable between patients randomized to shorter versus longer durations of antibiotic therapy, and the meta-analysis was well powered to confirm noninferiority. The lower 95% CI indicates that any potential benefit of longer antibiotics is not more than 1%, far below the typical margin of noninferiority. Subgroup analysis of patients hospitalized with CAP also showed noninferiority of a prespecified shorter treatment duration.
The rate of microbiologic cure was likewise indistinguishable, and the meta-analysis was again well powered to confirm noninferiority. Any potential benefit of longer antibiotics for microbial cure is quite small (not more than 4%).
Our study also demonstrates noninferiority of prespecified shorter antibiotic courses for mortality. Shorter- and longer-term mortality were both indistinguishable in patients randomized to shorter antibiotic courses. The meta-analyses for mortality were well powered, with any potential benefit of longer antibiotic durations being less than 2% for short-term and less than 6% for long-term mortality.
We also examined for complications related to antibiotic therapy. Infection recurrence was indistinguishable, with any potential benefit of longer antibiotics being less than 6%. Select infections (eg, VAP due to NF-GNB, catheter-associated UTI) may be more susceptible to relapse after shorter treatment courses, while most patients hospitalized with infection do not have an increased risk for relapse with shorter treatment courses. Consistent with other studies,8 the emergence of MDR organisms was 9% less common in patients randomized to shorter antibiotic courses. This difference failed to meet statistical significance, likely due to poor power. The emergence of MDR pathogens was included in just 3 of 19 studies, underscoring the need for additional studies on this outcome.
Although our meta-analyses indicate noninferiority of shorter antibiotic courses in hospitalized patients, the included studies are not without shortcomings. Only 4 of the included studies had low risk of bias, while 15 had at least moderate risk. The nearly universal source of bias was a lack of blinding. Only 1 study37 was completely blinded, and only 3 others had partial blinding. Adequate randomization and concealment were also lacking in several studies. However, there was no evidence of selective outcome reporting or publication bias.
Our findings are consistent with prior studies indicating noninferiority of shorter antibiotic courses in other settings and patient populations. Pediatric studies have demonstrated the success of shorter antibiotic courses in both outpatient49 and inpatient populations.50 Prior meta-analyses have shown noninferiority of shorter antibiotic courses in adults with VAP15,16; in neonatal, pediatric, and adult patients with bacteremia17; and in pediatric and adult patients with pneumonia and UTI.3-6,18,19 Our meta-analysis extends the evidence for the safety of shorter treatment courses to adults hospitalized with common infections, including pneumonia, UTI, and intra-abdominal infections. Because neonatal, pediatric, and nonhospitalized adult patients may have a lower risk for treatment failure and lower risk for mortality in the event of treatment failure, we focused exclusively on hospitalized adults and adolescents.
In contrast to prior meta-analyses, we included studies of multiple different sites of infection. This allowed us to assess a large number of hospitalized patients and achieve a narrow margin of noninferiority. It is possible that the benefit of optimal treatment duration varies by type of infection. (And indeed, absolute duration of treatment differed across studies.) We used a random-effects framework, which recognizes that the true benefit of shorter versus longer duration may vary across study populations. The heterogeneity between studies in our meta-analysis was quite low, suggesting that the results are not explained by a single infection type.
There are limited data on late effects of longer antibiotic courses. Antibiotic therapy is associated with an increased risk for CDI for 3 months afterwards.11 However, the duration of follow-up in the included studies rarely exceeded 1 month, which could underestimate incidence. The effect of antibiotics on gut microbiota may persist for months, predisposing patients to secondary infections. It is plausible that disruption in gut microbiota and risk for CDI may persist longer in patients treated with longer antibiotic courses. However, the existing studies do not include sufficient follow-up to confirm or refute this hypothesis.
Our review has several limitations. First, we included studies that compared an a priori-defined short course of antibiotics to a longer course and excluded studies that defined a short course of antibiotics based on clinical response. Because we did not specify an exact length for short or long courses, we cannot make explicit recommendations about the absolute duration of antibiotic therapy. Second, we included multiple infection types. It is possible that the duration of antibiotics required may differ by infection type. However, there were not sufficient data for subgroup analyses for each infection type. This highlights the need for additional data to guide the treatment of severe infections. Third, not all studies considered antibiotic duration in isolation. One study included a catheter change in the short arm only, which could have favored the short course.33 Three studies used different doses of antibiotics in addition to different durations.35,45,47 Fourth, the quality of included studies was variable, with lack of blinding and inadequate randomization present in most studies.
CONCLUSION
Based on the available literature, shorter courses of antibiotics can be safely utilized in hospitalized adults and adolescents to achieve clinical and microbiologic resolution of common infections, including pneumonia, UTI, and intra-abdominal infection, without adverse effect on infection recurrence. Moreover, short- and longer-term mortality are indistinguishable after treatment courses of differing duration. There are limited data on the longer-term risks associated with antibiotic duration, such as secondary infection or the emergence of MDR organisms.
Acknowledgments
The authors would like to thank their research librarian, Marisa Conte, for her help with the literature search for this review.
Disclosure
Drs. Royer and Prescott designed the study, performed data analysis, and drafted the manuscript. Drs. DeMerle and Dickson revised the manuscript critically for intellectual content. Dr. Royer holds stock in Pfizer. The authors have no other potential financial conflicts of interest to report.
1. Torio CM, Andrews RM. National Inpatient Hospital Costs: The Most Expensive Conditions by Payer, 2011: Statistical Brief #160. Healthcare Cost and Utilization Project (HCUP) Statistical Briefs. Rockville, MD: Agency for Healthcare Research and Quality (US); 2006. www.hcup-us.ahrq.gov/reports/statbriefs/sb160.pdf. Accessed May 1, 2016.
2. Kalil AC, Metersky ML, Klompas M, et al. Management of Adults With Hospital-acquired and Ventilator-associated Pneumonia: 2016 Clinical Practice Guidelines by the Infectious Diseases Society of America and the American Thoracic Society. Clin Infect Dis. 2016;63(5):575-582. PubMed
3. Dimopoulos G, Matthaiou DK, Karageorgopoulos DE, Grammatikos AP, Athanassa Z, Falagas ME. Short- versus long-course antibacterial therapy for community-acquired pneumonia : a meta-analysis. Drugs. 2008;68(13):1841-1854. PubMed
4. Li JZ, Winston LG, Moore DH, Bent S. Efficacy of short-course antibiotic regimens for community-acquired pneumonia: a meta-analysis. Am J Med. 2007;120(9):783-790. PubMed
5. Eliakim-Raz N, Yahav D, Paul M, Leibovici L. Duration of antibiotic treatment for acute pyelonephritis and septic urinary tract infection-- 7 days or less versus longer treatment: systematic review and meta-analysis of randomized controlled trials. J Antimicrob Chemother. 2013;68(10):2183-2191. PubMed
6. Kyriakidou KG, Rafailidis P, Matthaiou DK, Athanasiou S, Falagas ME. Short- versus long-course antibiotic therapy for acute pyelonephritis in adolescents and adults: a meta-analysis of randomized controlled trials. Clin Ther. 2008;30(10):1859-1868. PubMed
7. Spellberg B, Bartlett JG, Gilbert DN. The future of antibiotics and resistance. N Engl J Med. 2013;368(4):299-302. PubMed
8. Spellberg B. The New Antibiotic Mantra-”Shorter Is Better”. JAMA Intern Med. 2016;176(9):1254-1255. PubMed
9. Rice LB. The Maxwell Finland Lecture: for the duration-rational antibiotic administration in an era of antimicrobial resistance and clostridium difficile. Clin Infect Dis. 2008;46(4):491-496. PubMed
10. Dethlefsen L, Relman DA. Incomplete recovery and individualized responses of the human distal gut microbiota to repeated antibiotic perturbation. Proc Natl Acad Sci U S A. 2011;108 Suppl 1:4554-4561. PubMed
11. Hensgens MP, Goorhuis A, Dekkers OM, Kuijper EJ. Time interval of increased risk for Clostridium difficile infection after exposure to antibiotics. J Antimicrob Chemother. 2012;67(3):742-748. PubMed
12. Huttner B, Jones M, Huttner A, Rubin M, Samore MH. Antibiotic prescription practices for pneumonia, skin and soft tissue infections and urinary tract infections throughout the US Veterans Affairs system. J Antimicrob Chemother. 2013;68(10):2393-2399. PubMed
13. Daneman N, Shore K, Pinto R, Fowler R. Antibiotic treatment duration for bloodstream infections in critically ill patients: a national survey of Canadian infectious diseases and critical care specialists. Int J Antimicrob Agents. 2011;38(6):480-485. PubMed
14. Schultz L, Lowe TJ, Srinivasan A, Neilson D, Pugliese G. Economic impact of redundant antimicrobial therapy in US hospitals. Infect Control Hosp Epidemiol. 2014;35(10):1229-1235. PubMed
15. Dimopoulos G, Poulakou G, Pneumatikos IA, Armaganidis A, Kollef MH, Matthaiou DK. Short- vs long-duration antibiotic regimens for ventilator-associated pneumonia: a systematic review and meta-analysis. Chest. 2013;144(6):1759-1767. PubMed
16. Pugh R, Grant C, Cooke RP, Dempsey G. Short-course versus prolonged-course antibiotic therapy for hospital-acquired pneumonia in critically ill adults. Cochrane Database Syst Rev. 2015(8):CD007577. PubMed
17. Havey TC, Fowler RA, Daneman N. Duration of antibiotic therapy for bacteremia: a systematic review and meta-analysis. Crit Care. 2011;15(6):R267. PubMed
18. Haider BA, Saeed MA, Bhutta ZA. Short-course versus long-course antibiotic therapy for non-severe community-acquired pneumonia in children aged 2 months to 59 months. Cochrane Database Syst Rev. 2008(2):CD005976. PubMed
19. Strohmeier Y, Hodson EM, Willis NS, Webster AC, Craig JC. Antibiotics for acute pyelonephritis in children. Cochrane Database Syst Rev. 2014(7):Cd003772. PubMed
20. Leligdowicz A, Dodek PM, Norena M, et al. Association between source of infection and hospital mortality in patients who have septic shock. Am J Respir Crit Care Med. 2014;189(10):1204-1213. PubMed
21. Cagatay AA, Tufan F, Hindilerden F, et al. The causes of acute Fever requiring hospitalization in geriatric patients: comparison of infectious and noninfectious etiology. J Aging Res. 2010;2010:380892. PubMed
22. Rhodes A, Evans LE, Alhazzani W, et al. Surviving Sepsis Campaign: International Guidelines for Management of Sepsis and Septic Shock: 2016. Crit Care Med. 2017;45(3):486-552. PubMed
23. Moher D, Liberati A, Tetzlaff J, Altman DG, PRISMA Group. Preferred reporting items for systematic reviews and meta-analyses: the PRISMA statement. Ann Intern Med. 2009;151(4):264-269, W64. PubMed
24. Royer S, DeMerle K, Dickson RP, Prescott HC. Shorter versus longer courses of antibiotics for infection in hospitalized patients: a systematic review and meta-analysis. PROSPERO 2016:CRD42016029549. http://www.crd.york.ac.uk/PROSPERO/display_record.asp?ID=CRD42016029549. Accessed May 2, 2017.
25. Higgins JP, Altman DG, Gøtzsche PC, et al. The Cochrane Collaboration’s tool for assessing risk of bias in randomised trials. BMJ. 2011;343:d5928. PubMed
26. Turner L, Boutron I, Hróbjartsson A, Altman DG, Moher D. The evolution of assessing bias in Cochrane systematic reviews of interventions: celebrating methodological contributions of the Cochrane Collaboration. Syst Rev. 2013;2:79. PubMed
27. DerSimonian R, Laird N. Meta-analysis in clinical trials. Control Clin Trials. 1986;7(3):177-188. PubMed
28. Newton HJ, Cox NJ, Diebold FX, Garrett HM, Pagano M, Royston JP (Eds). Stata Technical Bulletin 44: sbe24. http://www.stata.com/products/stb/journals/stb44.pdf. Accessed February 22, 2017.
29. Bohte R, van’t Wout JW, Lobatto S, et al. Efficacy and safety of azithromycin versus benzylpenicillin or erythromycin in community-acquired pneumonia. Eur J Clin Microbiol Infect Dis. 1995;14(3):182-187. PubMed
30. Capellier G, Mockly H, Charpentier C, et al. Early-onset ventilator-associated pneumonia in adults randomized clinical trial: comparison of 8 versus 15 days of antibiotic treatment. PLoS One. 2012;7(8):e41290. PubMed
31. Chastre J, Wolff M, Fagon JY, et al. Comparison of 8 vs 15 days of antibiotic therapy for ventilator-associated pneumonia in adults: a randomized trial. JAMA. 2003;290(19):2588-2598. PubMed
32. Chaudhry ZI, Nisar S, Ahmed U, Ali M. Short course of antibiotic treatment in spontaneous bacterial peritonitis: A randomized controlled study. Journal of the College of Physicians and Surgeons Pakistan. 2000;10(8):284-288.
33. Darouiche RO, Al Mohajer M, Siddiq DM, Minard CG. Short versus long course of antibiotics for catheter-associated urinary tract infections in patients with spinal cord injury: a randomized controlled noninferiority trial. Arch Phys Med Rehabil. 2014;95(2):290-296. PubMed
34. de Gier R, Karperien A, Bouter K, et al. A sequential study of intravenous and oral Fleroxacin for 7 or 14 days in the treatment of complicated urinary tract infections. Int J Antimicrob Agents. 1995;6(1):27-30. PubMed
35. Dunbar LM, Wunderink RG, Habib MP, et al. High-dose, short-course levofloxacin for community-acquired pneumonia: a new treatment paradigm. Clin Infect Dis. 2003;37(6):752-760. PubMed
36. Gasem MH, Keuter M, Dolmans WM, Van Der Ven-Jongekrijg J, Djokomoeljanto R, Van Der Meer JW. Persistence of Salmonellae in blood and bone marrow: randomized controlled trial comparing ciprofloxacin and chloramphenicol treatments against enteric fever. Antimicrob Agents Chemother. 2003;47(5):1727-1731. PubMed
37. Kollef MH, Chastre J, Clavel M, et al. A randomized trial of 7-day doripenem versus 10-day imipenem-cilastatin for ventilator-associated pneumonia. Crit Care. 2012;16(6):R218. PubMed
38. Kuzman I, Daković-Rode O, Oremus M, Banaszak AM. Clinical efficacy and safety of a short regimen of azithromycin sequential therapy vs standard cefuroxime sequential therapy in the treatment of community-acquired pneumonia: an international, randomized, open-label study. J Chemother. 2005;17(6):636-642. PubMed
39. Léophonte P, Choutet P, Gaillat J, et al. Efficacy of a ten day course of ceftriaxone compared to a shortened five day course in the treatment of community-acquired pneumonia in hospitalized adults with risk factors. Medecine et Maladies Infectieuses. 2002;32(7):369-381.
40. Rizzato G, Montemurro L, Fraioli P, et al. Efficacy of a three day course of azithromycin in moderately severe community-acquired pneumonia. Eur Respir J. 1995;8(3):398-402. PubMed
41. Runyon BA, McHutchison JG, Antillon MR, Akriviadis EA, Montano AA. Short-course versus long-course antibiotic treatment of spontaneous bacterial peritonitis. A randomized controlled study of 100 patients. Gastroenterology. 1991;100(6):1737-1742. PubMed
42. Sawyer RG, Claridge JA, Nathens AB, et al. Trial of short-course antimicrobial therapy for intraabdominal infection. N Engl J Med. 2015;372(21):1996-2005. PubMed
43. Scawn N, Saul D, Pathak D, et al. A pilot randomised controlled trial in intensive care patients comparing 7 days’ treatment with empirical antibiotics with 2 days’ treatment for hospital-acquired infection of unknown origin. Health Technol Assess. 2012;16(36):i-xiii, 1-70. PubMed
44. Schönwald S, Barsić B, Klinar I, Gunjaca M. Three-day azithromycin compared with ten-day roxithromycin treatment of atypical pneumonia. Scand J Infect Dis. 1994;26(6):706-710. PubMed
45. Schönwald S, Kuzman I, Oresković K, et al. Azithromycin: single 1.5 g dose in the treatment of patients with atypical pneumonia syndrome--a randomized study. Infection. 1999;27(3):198-202. PubMed
46. Siegel RE, Alicea M, Lee A, Blaiklock R. Comparison of 7 versus 10 days of antibiotic therapy for hospitalized patients with uncomplicated community-acquired pneumonia: a prospective, randomized, double-blind study. Am J Ther. 1999;6(4):217-222. PubMed
47. Zhao X, Wu JF, Xiu QY, et al. A randomized controlled clinical trial of levofloxacin 750 mg versus 500 mg intravenous infusion in the treatment of community-acquired pneumonia. Diagn Microbiol Infect Dis. 2014;80(2):141-147. PubMed
48. Bureau of Economic Analysis. U.S. Department of Commerce. https://bea.gov/iTable/iTable.cfm?ReqID=9&step=1#reqid=9&step=1&isuri=1&903=4. Accessed March 2, 2017.
49. Pakistan Multicentre Amoxycillin Short Course Therapy (MASCOT) pneumonia study group. Clinical efficacy of 3 days versus 5 days of oral amoxicillin for treatment of childhood pneumonia: a multicentre double-blind trial. Lancet. 2002;360(9336):835-841. PubMed
50. Peltola H, Vuori-Holopainen E, Kallio MJ, SE-TU Study Group. Successful shortening from seven to four days of parenteral beta-lactam treatment for common childhood infections: a prospective and randomized study. Int J Infect Dis. 2001;5(1):3-8. PubMed
Acute infections are a leading cause of hospitalization and are associated with high cost, morbidity, and mortality.1 There is a growing body of literature to support shorter antibiotic courses to treat several different infection types.2-6 This is because longer treatment courses promote the emergence of multidrug resistant (MDR) organisms,7-9 microbiome perturbation,10 and Clostridium difficile infection (CDI).11 They are also associated with more drug side effects, longer hospitalizations, and increased costs.
Despite increasing support for shorter treatment courses, inpatient prescribing practice varies widely, and redundant antibiotic therapy is common.12-14 Furthermore, aside from ventilator-associated pneumonia (VAP),15,16 prior systematic reviews of antibiotic duration have typically included outpatient and pediatric patients,3-6,17-19 for whom the risk of treatment failure may be lower.
Given the potential for harm with inappropriate antibiotic treatment duration and the variation in current clinical practice, we sought to systematically review clinical trials comparing shorter versus longer antibiotic courses in adolescents and adults hospitalized for acute infection. We focused on common sites of infection in hospitalized patients, including pulmonary, bloodstream, soft tissue, intra-abdominal, and urinary.20,21 We hypothesized that shorter courses would be sufficient to cure infection and associated with lower costs and fewer complications. Because we hypothesized that shorter durations would be sufficient regardless of clinical course, we focused on studies in which the short course of antibiotics was specified at study onset, not determined by clinical improvement or biomarkers. We analyzed all infection types together because current sepsis treatment guidelines place little emphasis on infection site.22 In contrast to prior reviews, we focused exclusively on adult and adolescent inpatients because the risks of a too-short treatment duration may be lower in pediatric and outpatient populations.
METHODS
We followed the Preferred Reporting Items for Systematic Reviews and Meta-Analyses.23 The review was registered on the Prospero database.24
Information Sources and Search Strategy
We performed serial literature searches for articles in English comparing shorter versus longer antibiotics courses in hospitalized patients. We searched MEDLINE via PubMed and Embase (January 1, 1990, to July 1, 2017). We used Boolean operators, Boolean logic, and controlled vocabulary (eg, Medical Subject Heading [MeSH] terms) for each key word. We identified published randomized controlled trials (RCTs) of conditions of interest (MeSH terms: “bacteremia,” “sepsis,” “pneumonia,” “pyelonephritis,” “intra-abdominal infection,” “cellulitis,” “soft tissue infection”) that compared differing lengths of antibiotic treatment (keywords: “time factors,” “duration,” “long course,” “short course”) and evaluated outcomes (key words: “mortality,” “recurrence,” “secondary infections”). We hand searched references of included citations. The full search strategy is presented in supplementary Appendix 1.
Study Eligibility and Selection Criteria
To meet criteria for inclusion, a study had to (1) be an RCT; (2) involve an adult or adolescent population age ≥12 years (or report outcomes separately for such patients); (3) involve an inpatient population (or report outcomes separately for inpatients); (4) stipulate a short course of antibiotics per protocol prior to randomization and not determined by clinical response, change in biomarkers, or physician discretion; (5) compare the short course to a longer course of antibiotics, which could be determined either per protocol or by some other measure; and (6) involve antibiotics given to treat infection, not as prophylaxis.
Two authors (SR and HCP) independently reviewed the title and/or abstracts of all articles identified by the search strategy. We calculated interrater agreement with a kappa coefficient. Both authors (SR and HCP) independently reviewed the full text of each article selected for possible inclusion by either author. Disagreement regarding eligibility was adjudicated by discussion.
Data Abstraction
Two authors (SR and HCP) independently abstracted study methodology, definitions, and outcomes for each study using a standardized abstraction tool (see supplementary Appendix 2).
Study Quality
We assessed article quality using the Cochrane Collaboration’s tool,25 which evaluates 6 domains of possible bias, including sequence generation, concealment, blinding, and incomplete or selective outcome reporting. The tool is a 6-point scale, with 6 being the best score. It is recommended for assessing bias because it evaluates randomization and allocation concealment, which are not included in other tools.26 We did not exclude studies based on quality but considered studies with scores of 5-6 to have a low overall risk of bias.
Study Outcomes and Statistical Analysis
Our primary outcomes were clinical cure, microbiologic cure, mortality, and infection recurrence. Secondary outcomes were secondary MDR infection, cost, and length of stay (LOS). We conducted all analyses with Stata MP version 14 (StataCorp, College Station, TX). For each outcome, we reported the difference (95% confidence interval [CI]) between treatment arms as the rate in the short course arm minus the rate in the long course arm, consistent with the typical presentation of noninferiority data. When not reported in a study, we calculated risk difference and 95% CI using reported patient-level data. Positive values for risk difference favor the short course arm for favorable outcomes (ie, clinical and microbiologic cure) and the long course arm for adverse outcomes (ie, mortality and recurrence). A meta-analysis was used to pool risk differences across all studies for primary outcomes and for clinical cure in the community-acquired pneumonia (CAP) subgroup. We also present results as odds ratios and risk ratios in the online supplement. All meta-analyses used random effects models, as described by DerSimonian and Laird,27,28 with variance estimates of heterogeneity taken from the Mantel-Haenszel fixed effects model. We investigated heterogeneity between studies using the χ2 I2 statistic. We considered a P < .1 to indicate statistically significant heterogeneity and classified heterogeneity as low, moderate, or high on the basis of an I2 of 25%, 50%, or 75%, respectively. We used funnel plots to assess for publication bias.
RESULTS
Search Results
Characteristics of Included Studies
Common study outcomes included clinical cure or efficacy (composite of symptom cure and improvement; n = 13), infection recurrence (n = 10), mortality (n = 9), microbiologic cure (n = 8), and LOS (n = 7; supplementary Table 1).
Nine studies were pilot studies, 1 was a traditional superiority design study, and 9 were noninferiority studies with a prespecified limit of equivalence of either 10% (n = 7) or 15% (n = 2).
Clinical Cure and Efficacy
Nine studies of 1225 patients evaluated clinical cure and efficacy in CAP (supplementary Figure 1).29,35,38-40,44-47 The overall risk difference was d = 2.4% (95% CI, −0.7%-5.5%). There was no heterogeneity between studies (I2 = 0%, P = .45).
Microbiologic Cure
Eight studies of 366 patients evaluated microbiologic cure (supplementary Figure 2).32-34,36,38,40,41,47 The overall risk difference was d = 1.2% (95% CI, −4.1%-6.4%). There was no statistically significant heterogeneity between studies (I2 = 13.3%, P = .33).
Mortality
Eight studies of 1740 patients evaluated short-term mortality (in hospital to 45 days; Figure 2),30-32,37,39,41,43 while 3 studies of 654 patients evaluated longer-term mortality (60 to 180 days; supplementary Figure 3).30,31,33 The overall risk difference was d = 0.3% (95% CI, −1.2%-1.8%) for short-term mortality and d = −0.4% (95% CI, −6.3%-5.5%) for longer-term mortality. There was no heterogeneity between studies for either short-term (I2 = 0.0%, P = .66) or longer-term mortality (I2 = 0.0%, P = .69).
Infection Recurrence
Ten studies of 1554 patients evaluated infection recurrence (Figure 2).30-34,40-42,45,46 The overall risk difference was d = 2.1% (95% CI, −1.2%-5.3%). There was no statistically significant heterogeneity between studies (I2 = 21.0%, P = .25). Two of the 3 studies with noninferiority design (both evaluating intra-abdominal infections) met their prespecified margins.41,42 In Chastre et al.,31 the overall population (d = 3.0%; 95% CI, −5.8%-11.7%) and the subgroup with VAP due to nonfermenting gram-negative bacilli (NF-GNB; d = 15.2%; 95% CI, −0.9%-31.4%) failed to meet the 10% noninferiority margin.
Secondary Outcomes
Three studies30,31,42 of 286 patients (with VAP or intra-abdominal infection) evaluated the emergence of MDR organisms. The overall risk difference was d = −9.0% (95% CI, −19.1%-1.1%; P = .081). There was no statistically significant heterogeneity between studies (I2 = 7.6%, P = .34).
Seven studies examined LOS—3 in the intensive care unit (ICU)30,31,43 and 4 on the wards32,36,40,41—none of which found significant differences between treatment arms. Across 3 studies of 672 patients, the weighted average for ICU LOS was 23.6 days in the short arm versus 22.2 days in the long arm. Across 4 studies of 235 patients, the weighted average for hospital LOS was 23.3 days in the short arm versus 29.7 days in the long arm. This difference was driven by a 1991 study41 of spontaneous bacterial peritonitis (SBP), in which the average LOS was 37 days and 50 days in the short- and long-course arms, respectively.
Three studies32,41,43 of 186 total patients (with SBP or hospital-acquired infection of unknown origin) examined the cost of antibiotics. The weighted average cost savings for shorter courses in 2016 US dollars48 was $265.19.
Three studies30,33,43 of 618 patients evaluated cases of CDI, during 10-, 30-, and 180-day total follow-up. The overall risk difference was d = 0.7% (95% CI, −1.3%-2.8%), with no statistically significant heterogeneity between studies (I2 = 0%, P = .97).
Study Quality
Included studies scored 2-5 on the Cochrane Collaboration Risk of Bias Tool (supplementary Figure 4). Four studies had an overall low risk of bias,36,37,43,46 while 15 had a moderate to high risk of bias (supplementary Table 3).29-35,38-42,44,45,47 Common sources of bias included inadequate details to confirm adequate randomization and/or concealment (n = 13) and lack of adequate blinding (n = 18). Two studies were stopped early,37,42 and 3 others were possibly stopped early because it was unclear how the number of participants was determined.29,33,47 Covariate imbalance (failure of randomization) was present in 2 studies.37,47 There was no evidence of selective outcome reporting or publication bias based on the funnel plots (supplementary Figure 5).
DISCUSSION
In this study, we performed a systematic review and meta-analysis of RCTs of shorter versus longer antibiotic courses for adults and adolescents hospitalized for infection. The rate of clinical cure was indistinguishable between patients randomized to shorter versus longer durations of antibiotic therapy, and the meta-analysis was well powered to confirm noninferiority. The lower 95% CI indicates that any potential benefit of longer antibiotics is not more than 1%, far below the typical margin of noninferiority. Subgroup analysis of patients hospitalized with CAP also showed noninferiority of a prespecified shorter treatment duration.
The rate of microbiologic cure was likewise indistinguishable, and the meta-analysis was again well powered to confirm noninferiority. Any potential benefit of longer antibiotics for microbial cure is quite small (not more than 4%).
Our study also demonstrates noninferiority of prespecified shorter antibiotic courses for mortality. Shorter- and longer-term mortality were both indistinguishable in patients randomized to shorter antibiotic courses. The meta-analyses for mortality were well powered, with any potential benefit of longer antibiotic durations being less than 2% for short-term and less than 6% for long-term mortality.
We also examined for complications related to antibiotic therapy. Infection recurrence was indistinguishable, with any potential benefit of longer antibiotics being less than 6%. Select infections (eg, VAP due to NF-GNB, catheter-associated UTI) may be more susceptible to relapse after shorter treatment courses, while most patients hospitalized with infection do not have an increased risk for relapse with shorter treatment courses. Consistent with other studies,8 the emergence of MDR organisms was 9% less common in patients randomized to shorter antibiotic courses. This difference failed to meet statistical significance, likely due to poor power. The emergence of MDR pathogens was included in just 3 of 19 studies, underscoring the need for additional studies on this outcome.
Although our meta-analyses indicate noninferiority of shorter antibiotic courses in hospitalized patients, the included studies are not without shortcomings. Only 4 of the included studies had low risk of bias, while 15 had at least moderate risk. The nearly universal source of bias was a lack of blinding. Only 1 study37 was completely blinded, and only 3 others had partial blinding. Adequate randomization and concealment were also lacking in several studies. However, there was no evidence of selective outcome reporting or publication bias.
Our findings are consistent with prior studies indicating noninferiority of shorter antibiotic courses in other settings and patient populations. Pediatric studies have demonstrated the success of shorter antibiotic courses in both outpatient49 and inpatient populations.50 Prior meta-analyses have shown noninferiority of shorter antibiotic courses in adults with VAP15,16; in neonatal, pediatric, and adult patients with bacteremia17; and in pediatric and adult patients with pneumonia and UTI.3-6,18,19 Our meta-analysis extends the evidence for the safety of shorter treatment courses to adults hospitalized with common infections, including pneumonia, UTI, and intra-abdominal infections. Because neonatal, pediatric, and nonhospitalized adult patients may have a lower risk for treatment failure and lower risk for mortality in the event of treatment failure, we focused exclusively on hospitalized adults and adolescents.
In contrast to prior meta-analyses, we included studies of multiple different sites of infection. This allowed us to assess a large number of hospitalized patients and achieve a narrow margin of noninferiority. It is possible that the benefit of optimal treatment duration varies by type of infection. (And indeed, absolute duration of treatment differed across studies.) We used a random-effects framework, which recognizes that the true benefit of shorter versus longer duration may vary across study populations. The heterogeneity between studies in our meta-analysis was quite low, suggesting that the results are not explained by a single infection type.
There are limited data on late effects of longer antibiotic courses. Antibiotic therapy is associated with an increased risk for CDI for 3 months afterwards.11 However, the duration of follow-up in the included studies rarely exceeded 1 month, which could underestimate incidence. The effect of antibiotics on gut microbiota may persist for months, predisposing patients to secondary infections. It is plausible that disruption in gut microbiota and risk for CDI may persist longer in patients treated with longer antibiotic courses. However, the existing studies do not include sufficient follow-up to confirm or refute this hypothesis.
Our review has several limitations. First, we included studies that compared an a priori-defined short course of antibiotics to a longer course and excluded studies that defined a short course of antibiotics based on clinical response. Because we did not specify an exact length for short or long courses, we cannot make explicit recommendations about the absolute duration of antibiotic therapy. Second, we included multiple infection types. It is possible that the duration of antibiotics required may differ by infection type. However, there were not sufficient data for subgroup analyses for each infection type. This highlights the need for additional data to guide the treatment of severe infections. Third, not all studies considered antibiotic duration in isolation. One study included a catheter change in the short arm only, which could have favored the short course.33 Three studies used different doses of antibiotics in addition to different durations.35,45,47 Fourth, the quality of included studies was variable, with lack of blinding and inadequate randomization present in most studies.
CONCLUSION
Based on the available literature, shorter courses of antibiotics can be safely utilized in hospitalized adults and adolescents to achieve clinical and microbiologic resolution of common infections, including pneumonia, UTI, and intra-abdominal infection, without adverse effect on infection recurrence. Moreover, short- and longer-term mortality are indistinguishable after treatment courses of differing duration. There are limited data on the longer-term risks associated with antibiotic duration, such as secondary infection or the emergence of MDR organisms.
Acknowledgments
The authors would like to thank their research librarian, Marisa Conte, for her help with the literature search for this review.
Disclosure
Drs. Royer and Prescott designed the study, performed data analysis, and drafted the manuscript. Drs. DeMerle and Dickson revised the manuscript critically for intellectual content. Dr. Royer holds stock in Pfizer. The authors have no other potential financial conflicts of interest to report.
1. Torio CM, Andrews RM. National Inpatient Hospital Costs: The Most Expensive Conditions by Payer, 2011: Statistical Brief #160. Healthcare Cost and Utilization Project (HCUP) Statistical Briefs. Rockville, MD: Agency for Healthcare Research and Quality (US); 2006. www.hcup-us.ahrq.gov/reports/statbriefs/sb160.pdf. Accessed May 1, 2016.
2. Kalil AC, Metersky ML, Klompas M, et al. Management of Adults With Hospital-acquired and Ventilator-associated Pneumonia: 2016 Clinical Practice Guidelines by the Infectious Diseases Society of America and the American Thoracic Society. Clin Infect Dis. 2016;63(5):575-582. PubMed
3. Dimopoulos G, Matthaiou DK, Karageorgopoulos DE, Grammatikos AP, Athanassa Z, Falagas ME. Short- versus long-course antibacterial therapy for community-acquired pneumonia : a meta-analysis. Drugs. 2008;68(13):1841-1854. PubMed
4. Li JZ, Winston LG, Moore DH, Bent S. Efficacy of short-course antibiotic regimens for community-acquired pneumonia: a meta-analysis. Am J Med. 2007;120(9):783-790. PubMed
5. Eliakim-Raz N, Yahav D, Paul M, Leibovici L. Duration of antibiotic treatment for acute pyelonephritis and septic urinary tract infection-- 7 days or less versus longer treatment: systematic review and meta-analysis of randomized controlled trials. J Antimicrob Chemother. 2013;68(10):2183-2191. PubMed
6. Kyriakidou KG, Rafailidis P, Matthaiou DK, Athanasiou S, Falagas ME. Short- versus long-course antibiotic therapy for acute pyelonephritis in adolescents and adults: a meta-analysis of randomized controlled trials. Clin Ther. 2008;30(10):1859-1868. PubMed
7. Spellberg B, Bartlett JG, Gilbert DN. The future of antibiotics and resistance. N Engl J Med. 2013;368(4):299-302. PubMed
8. Spellberg B. The New Antibiotic Mantra-”Shorter Is Better”. JAMA Intern Med. 2016;176(9):1254-1255. PubMed
9. Rice LB. The Maxwell Finland Lecture: for the duration-rational antibiotic administration in an era of antimicrobial resistance and clostridium difficile. Clin Infect Dis. 2008;46(4):491-496. PubMed
10. Dethlefsen L, Relman DA. Incomplete recovery and individualized responses of the human distal gut microbiota to repeated antibiotic perturbation. Proc Natl Acad Sci U S A. 2011;108 Suppl 1:4554-4561. PubMed
11. Hensgens MP, Goorhuis A, Dekkers OM, Kuijper EJ. Time interval of increased risk for Clostridium difficile infection after exposure to antibiotics. J Antimicrob Chemother. 2012;67(3):742-748. PubMed
12. Huttner B, Jones M, Huttner A, Rubin M, Samore MH. Antibiotic prescription practices for pneumonia, skin and soft tissue infections and urinary tract infections throughout the US Veterans Affairs system. J Antimicrob Chemother. 2013;68(10):2393-2399. PubMed
13. Daneman N, Shore K, Pinto R, Fowler R. Antibiotic treatment duration for bloodstream infections in critically ill patients: a national survey of Canadian infectious diseases and critical care specialists. Int J Antimicrob Agents. 2011;38(6):480-485. PubMed
14. Schultz L, Lowe TJ, Srinivasan A, Neilson D, Pugliese G. Economic impact of redundant antimicrobial therapy in US hospitals. Infect Control Hosp Epidemiol. 2014;35(10):1229-1235. PubMed
15. Dimopoulos G, Poulakou G, Pneumatikos IA, Armaganidis A, Kollef MH, Matthaiou DK. Short- vs long-duration antibiotic regimens for ventilator-associated pneumonia: a systematic review and meta-analysis. Chest. 2013;144(6):1759-1767. PubMed
16. Pugh R, Grant C, Cooke RP, Dempsey G. Short-course versus prolonged-course antibiotic therapy for hospital-acquired pneumonia in critically ill adults. Cochrane Database Syst Rev. 2015(8):CD007577. PubMed
17. Havey TC, Fowler RA, Daneman N. Duration of antibiotic therapy for bacteremia: a systematic review and meta-analysis. Crit Care. 2011;15(6):R267. PubMed
18. Haider BA, Saeed MA, Bhutta ZA. Short-course versus long-course antibiotic therapy for non-severe community-acquired pneumonia in children aged 2 months to 59 months. Cochrane Database Syst Rev. 2008(2):CD005976. PubMed
19. Strohmeier Y, Hodson EM, Willis NS, Webster AC, Craig JC. Antibiotics for acute pyelonephritis in children. Cochrane Database Syst Rev. 2014(7):Cd003772. PubMed
20. Leligdowicz A, Dodek PM, Norena M, et al. Association between source of infection and hospital mortality in patients who have septic shock. Am J Respir Crit Care Med. 2014;189(10):1204-1213. PubMed
21. Cagatay AA, Tufan F, Hindilerden F, et al. The causes of acute Fever requiring hospitalization in geriatric patients: comparison of infectious and noninfectious etiology. J Aging Res. 2010;2010:380892. PubMed
22. Rhodes A, Evans LE, Alhazzani W, et al. Surviving Sepsis Campaign: International Guidelines for Management of Sepsis and Septic Shock: 2016. Crit Care Med. 2017;45(3):486-552. PubMed
23. Moher D, Liberati A, Tetzlaff J, Altman DG, PRISMA Group. Preferred reporting items for systematic reviews and meta-analyses: the PRISMA statement. Ann Intern Med. 2009;151(4):264-269, W64. PubMed
24. Royer S, DeMerle K, Dickson RP, Prescott HC. Shorter versus longer courses of antibiotics for infection in hospitalized patients: a systematic review and meta-analysis. PROSPERO 2016:CRD42016029549. http://www.crd.york.ac.uk/PROSPERO/display_record.asp?ID=CRD42016029549. Accessed May 2, 2017.
25. Higgins JP, Altman DG, Gøtzsche PC, et al. The Cochrane Collaboration’s tool for assessing risk of bias in randomised trials. BMJ. 2011;343:d5928. PubMed
26. Turner L, Boutron I, Hróbjartsson A, Altman DG, Moher D. The evolution of assessing bias in Cochrane systematic reviews of interventions: celebrating methodological contributions of the Cochrane Collaboration. Syst Rev. 2013;2:79. PubMed
27. DerSimonian R, Laird N. Meta-analysis in clinical trials. Control Clin Trials. 1986;7(3):177-188. PubMed
28. Newton HJ, Cox NJ, Diebold FX, Garrett HM, Pagano M, Royston JP (Eds). Stata Technical Bulletin 44: sbe24. http://www.stata.com/products/stb/journals/stb44.pdf. Accessed February 22, 2017.
29. Bohte R, van’t Wout JW, Lobatto S, et al. Efficacy and safety of azithromycin versus benzylpenicillin or erythromycin in community-acquired pneumonia. Eur J Clin Microbiol Infect Dis. 1995;14(3):182-187. PubMed
30. Capellier G, Mockly H, Charpentier C, et al. Early-onset ventilator-associated pneumonia in adults randomized clinical trial: comparison of 8 versus 15 days of antibiotic treatment. PLoS One. 2012;7(8):e41290. PubMed
31. Chastre J, Wolff M, Fagon JY, et al. Comparison of 8 vs 15 days of antibiotic therapy for ventilator-associated pneumonia in adults: a randomized trial. JAMA. 2003;290(19):2588-2598. PubMed
32. Chaudhry ZI, Nisar S, Ahmed U, Ali M. Short course of antibiotic treatment in spontaneous bacterial peritonitis: A randomized controlled study. Journal of the College of Physicians and Surgeons Pakistan. 2000;10(8):284-288.
33. Darouiche RO, Al Mohajer M, Siddiq DM, Minard CG. Short versus long course of antibiotics for catheter-associated urinary tract infections in patients with spinal cord injury: a randomized controlled noninferiority trial. Arch Phys Med Rehabil. 2014;95(2):290-296. PubMed
34. de Gier R, Karperien A, Bouter K, et al. A sequential study of intravenous and oral Fleroxacin for 7 or 14 days in the treatment of complicated urinary tract infections. Int J Antimicrob Agents. 1995;6(1):27-30. PubMed
35. Dunbar LM, Wunderink RG, Habib MP, et al. High-dose, short-course levofloxacin for community-acquired pneumonia: a new treatment paradigm. Clin Infect Dis. 2003;37(6):752-760. PubMed
36. Gasem MH, Keuter M, Dolmans WM, Van Der Ven-Jongekrijg J, Djokomoeljanto R, Van Der Meer JW. Persistence of Salmonellae in blood and bone marrow: randomized controlled trial comparing ciprofloxacin and chloramphenicol treatments against enteric fever. Antimicrob Agents Chemother. 2003;47(5):1727-1731. PubMed
37. Kollef MH, Chastre J, Clavel M, et al. A randomized trial of 7-day doripenem versus 10-day imipenem-cilastatin for ventilator-associated pneumonia. Crit Care. 2012;16(6):R218. PubMed
38. Kuzman I, Daković-Rode O, Oremus M, Banaszak AM. Clinical efficacy and safety of a short regimen of azithromycin sequential therapy vs standard cefuroxime sequential therapy in the treatment of community-acquired pneumonia: an international, randomized, open-label study. J Chemother. 2005;17(6):636-642. PubMed
39. Léophonte P, Choutet P, Gaillat J, et al. Efficacy of a ten day course of ceftriaxone compared to a shortened five day course in the treatment of community-acquired pneumonia in hospitalized adults with risk factors. Medecine et Maladies Infectieuses. 2002;32(7):369-381.
40. Rizzato G, Montemurro L, Fraioli P, et al. Efficacy of a three day course of azithromycin in moderately severe community-acquired pneumonia. Eur Respir J. 1995;8(3):398-402. PubMed
41. Runyon BA, McHutchison JG, Antillon MR, Akriviadis EA, Montano AA. Short-course versus long-course antibiotic treatment of spontaneous bacterial peritonitis. A randomized controlled study of 100 patients. Gastroenterology. 1991;100(6):1737-1742. PubMed
42. Sawyer RG, Claridge JA, Nathens AB, et al. Trial of short-course antimicrobial therapy for intraabdominal infection. N Engl J Med. 2015;372(21):1996-2005. PubMed
43. Scawn N, Saul D, Pathak D, et al. A pilot randomised controlled trial in intensive care patients comparing 7 days’ treatment with empirical antibiotics with 2 days’ treatment for hospital-acquired infection of unknown origin. Health Technol Assess. 2012;16(36):i-xiii, 1-70. PubMed
44. Schönwald S, Barsić B, Klinar I, Gunjaca M. Three-day azithromycin compared with ten-day roxithromycin treatment of atypical pneumonia. Scand J Infect Dis. 1994;26(6):706-710. PubMed
45. Schönwald S, Kuzman I, Oresković K, et al. Azithromycin: single 1.5 g dose in the treatment of patients with atypical pneumonia syndrome--a randomized study. Infection. 1999;27(3):198-202. PubMed
46. Siegel RE, Alicea M, Lee A, Blaiklock R. Comparison of 7 versus 10 days of antibiotic therapy for hospitalized patients with uncomplicated community-acquired pneumonia: a prospective, randomized, double-blind study. Am J Ther. 1999;6(4):217-222. PubMed
47. Zhao X, Wu JF, Xiu QY, et al. A randomized controlled clinical trial of levofloxacin 750 mg versus 500 mg intravenous infusion in the treatment of community-acquired pneumonia. Diagn Microbiol Infect Dis. 2014;80(2):141-147. PubMed
48. Bureau of Economic Analysis. U.S. Department of Commerce. https://bea.gov/iTable/iTable.cfm?ReqID=9&step=1#reqid=9&step=1&isuri=1&903=4. Accessed March 2, 2017.
49. Pakistan Multicentre Amoxycillin Short Course Therapy (MASCOT) pneumonia study group. Clinical efficacy of 3 days versus 5 days of oral amoxicillin for treatment of childhood pneumonia: a multicentre double-blind trial. Lancet. 2002;360(9336):835-841. PubMed
50. Peltola H, Vuori-Holopainen E, Kallio MJ, SE-TU Study Group. Successful shortening from seven to four days of parenteral beta-lactam treatment for common childhood infections: a prospective and randomized study. Int J Infect Dis. 2001;5(1):3-8. PubMed
© 2018 Society of Hospital Medicine
Implementation of a Process for Initiating Naltrexone in Patients Hospitalized for Alcohol Detoxification or Withdrawal
Alcohol use disorders (AUDs) are common, with an estimated lifetime prevalence of 17.8% for alcohol dependence.1 Alcohol misuse is costly, accounting for $24.6 billion in annual healthcare expenditures, including $5.1 billion for alcohol-related hospitalizations.2 A number of trials have demonstrated that naltrexone can help patients with AUDs maintain abstinence or diminish heavy drinking.3-10 A recent meta-analysis of pharmacotherapy trials for patients with AUDs reported that for patients using 50 mg of naltrexone daily, the number needed to treat was 12 to prevent a return to heavy drinking and 20 to prevent a return to any drinking.11 Despite good evidence for its effectiveness, naltrexone is not prescribed to the majority of patients with AUDs. In a study of veterans with AUDs cared for in the Veterans Affairs health system, only 1.9% of patients were prescribed naltrexone over the 6-month study period.12 A 2003 survey of 2 professional organizations for addiction treatment specialists reported that a mean of 13% of providers prescribed naltrexone to their patients.13
When naltrexone is prescribed, it is most frequently in the outpatient setting.3-10 Data for initiation of naltrexone in the inpatient setting are more limited. Wei et al.14 reported on the implementation of a discharge protocol, including counseling about naltrexone, for hospitalized patients with AUDs at an urban academic medical center. They reported a significant increase in the prescription of naltrexone to eligible patients by the time of discharge that was associated with a significant decrease in 30-day readmissions. Initiation of naltrexone in the inpatient versus the outpatient setting has some potential advantages. First, patients hospitalized for alcohol withdrawal have AUDs, obviating the need for screening. Second, the outpatient trials of naltrexone typically required 3 days of sobriety before initiation, which is generally achieved during hospitalization for detoxification or withdrawal.
Previous work at our institution centered on standardizing the process of evaluating patients needing alcohol detoxification at the time of referral for admission.15 The use of a standardized protocol reduced the number of inpatient admissions for alcohol-related diagnoses but had no effect on the 30-day readmission rate (28%) for those patients who were hospitalized. Our hospitalist group had no standardized process for discharging hospitalized patients with AUDs, and the discharge process rarely included counseling on medications for maintenance of sobriety. In this manuscript, we describe the implementation and impact of a process for counseling patients hospitalized for alcohol detoxification or withdrawal about naltrexone for maintenance of sobriety by the time of hospital discharge.
METHODS
Study Setting
The University of North Carolina (UNC) Hospitals is an 803-bed tertiary academic center. UNC Hospital Medicine is staffed by 29 physicians and 3 advanced practice providers (APPs). During the study period, there were 3 hospital medicine services at UNC Hospitals with a combined average daily census of approximately 40 patients, and each service was staffed by one attending physician every day of the week and one APP Monday through Friday.
Study Design
We used a pre-post study design, in which we implemented a new process for standardizing the discharge of hospitalized patients with AUDs, including a process for counseling about naltrexone by the time of discharge. We sought and received institutional review board (IRB) approval for this study (UNC IRB 15-1441).
Interventions
We formed an improvement team that included 3 physicians and an APP in hospital medicine, a general internist and a psychiatrist, both with expertise in the use of medications for maintenance of sobriety, the director of UNC’s Alcohol and Substance Abuse Program, and 2 case managers. The team developed a number of interventions, including group education, a process for patient identification, and algorithms for counseling about, prescribing, and documenting the discussion of naltrexone.
Group Education
We presented evidence about medications for the maintenance of sobriety at a regularly scheduled hospitalist meeting. An hour-long session on motivational interviewing techniques was also presented at a separate meeting. All created algorithms were circulated to the group electronically and posted at workstations in the hospitalist work area. As data were generated postimplementation, control charts of process measures were created, posted in the hospitalist work area, and presented at subsequent group meetings.
Identification of Patients
We focused our interventions on patients admitted for alcohol detoxification or withdrawal (including withdrawal seizures). We asked our group to preferentially admit these patients to 1 of our 3 hospitalists services, on which the service APP (K.S.) was also an improvement team member.
Creation of Algorithms and Scripts for Counseling
We created a simple algorithm for evaluating patients for naltrexone. We recommended that all patients admitted for alcohol detoxification or withdrawal be counseled about naltrexone for the maintenance of sobriety before discharge. The contraindications to naltrexone we included were (1) concurrent opioid use, (2) documented cirrhosis, and/or (3) liver function tests greater than 3 times the upper limit of normal by the time of hospital discharge.
We also created a suggested script for motivational interviewing (supplemental Appendix 1). This was presented at a group meeting and circulated via e-mail. The actual counseling technique and process was left up to individual providers. In practice, counseling took place in the course of daily rounds, generally the day before or day of hospital discharge.
Prescription of Medication
For interested patients without contraindications, we recommended a prescription of naltrexone at 50 mg daily for 3 months. For patients prescribed naltrexone without medical insurance (n = 17), we utilized our existing pharmacy assistance program, whereby discharging patients can obtain an initial 14-day supply after applying to the program and then can fill subsequent prescriptions if they meet program financial requirements.
Follow-up Appointments
For patients with established outpatient providers, we asked patients to schedule follow-up appointments within a month of discharge. Patients prescribed naltrexone without primary providers (n = 16) were eligible for an existing program, the UNC Transitions Program, whereby patients identified as having moderate-to-high risk of hospital readmission can receive a follow-up appointment at UNC Internal Medicine or UNC Family Medicine within 2 weeks of discharge.
Creation of “Smart Phrases”
To aid in documentation, we created “smart phrases” (easily accessed, previously created phrases that can be adopted by all users) within the hospital electronic health record. We created one smart phrase for documentation of counseling about naltrexone, which included dropdown menus for contraindications and the patient’s preference and one for discharge instructions for patients started on naltrexone (supplemental Appendix 2).
Implementation
After the presentation of suggested interventions in July 2015 and the subsequent dissemination of educational materials, we implemented our new process on August 1, 2015.
Data Collection
Patients were identified for inclusion in the study analysis by querying UNC Hospitals’ billing database for the inpatient diagnosis codes (diagnosis-related groupings) 896 and 897, “alcohol/drug abuse or dependence without rehabilitation therapy,” with and without major comorbidity or complication, respectively, and with hospital medicine as the discharging service. All encounters were then manually reviewed by 2 investigators (J.S. and C.M.). Encounters were included if the history and physical indicated that the primary reason for admission was alcohol detoxification or withdrawal. Encounters with other primary reasons for admission (eg, pancreatitis, gastrointestinal bleeding) were excluded. For patients with multiple encounters, only the first eligible encounter in the pre- and/or postimplementation period was included. Comorbidities for identified patients were assessed via the search of study encounters for the International Classification of Diseases, 9th Revision-Clinical Modification codes for hypertension, anxiety, depression, cirrhosis, diabetes, and congestive heart failure.
Process, Outcomes, and Balancing Measures
The study process measures included the percentage of patients hospitalized for alcohol detoxification or withdrawal with documentation of counseling about naltrexone by the time of discharge, before and after process intervention. Documentation was defined as the description of counseling about naltrexone in the discharge summary or progress notes of identified encounters. We also measured the percentage of patients started on naltrexone before and after intervention. Lastly, we measured the percentage of patients prescribed naltrexone who filled at least 1 prescription for the medication, assessed by calls to the pharmacy where the medication was prescribed. Prescriptions that could not be confirmed (ie, paper rather than electronic prescriptions) were counted as not filled.
For outcome measures, we recorded the percentages of study patients who returned to the emergency department (ED) and were readmitted to UNC Hospitals (inpatient or observation) for any reason within 30 days of discharge. These outcomes were determined by a manual chart review.
In order to ensure the new process was not associated with delays in patient discharge, we measured the mean length of stay in days for study patient encounters before and after intervention as a balancing measure.
Statistical Analysis
Demographic and clinical characteristics for included patients were compared for the 16 months preimplementation (April 1, 2014 through July 31, 2015) and the 19 months postimplementation (August 1, 2015 through February 28, 2017). Descriptive statistics were calculated by using the Student t test for continuous variables and the χ2 test for dichotomous variables. We used multivariate logistic regression to evaluate the associations between the intervention arms (pre- vs postintervention) and study outcomes, adjusting for age, gender, race, insurance type, and medical comorbidities. We chose these variables for inclusion based on their association with study outcomes at the P ≤ .20 level in bivariate analyses. P < .05 was considered statistically significant. All analyses were performed by using Stata version 13.1 (StataCorp LLC, College Station, TX).
For 2 process measures, the percentages of patients counseled about and started on naltrexone, we plotted consecutive samples of 10 patients before and after intervention on a control chart, using preintervention data to calculate means and control limits.
Subgroup Analysis
We used multivariate logistic regression to evaluate the associations between counseling versus no counseling and prescription of naltrexone versus no prescription for study outcomes in the postintervention subgroup, adjusting for age, gender, race, insurance type, and medical comorbidities.
RESULTS
Patients
We identified 188 preimplementation encounters and excluded 12 patients (6.4%) for primary admission reasons other than alcohol withdrawal or detoxification and 48 (25.5%) repeat hospitalizations, leaving 128 unique patient encounters. We identified 166 postimplementation encounters and excluded 25 (15.1%) hospitalizations for admission reason and 27 repeat hospitalizations (16.3%), leaving 114 unique patient encounters (flow diagram in supplemental Appendix 3). The most common admission reason for the exclusion of encounters was withdrawal from a substance other than alcohol (supplemental Appendix 4). The percentages of encounters excluded in preimplementation and postimplementation periods were similar at 31.9% and 31.4%, respectively.
The majority of patients were male and white, and almost half were uninsured (Table 1). There were no demographic differences between patients in the pre- versus postimplementation groups. For studied comorbidities, postintervention patients were more likely to have hypertension, anxiety, and depression.
Process Measures
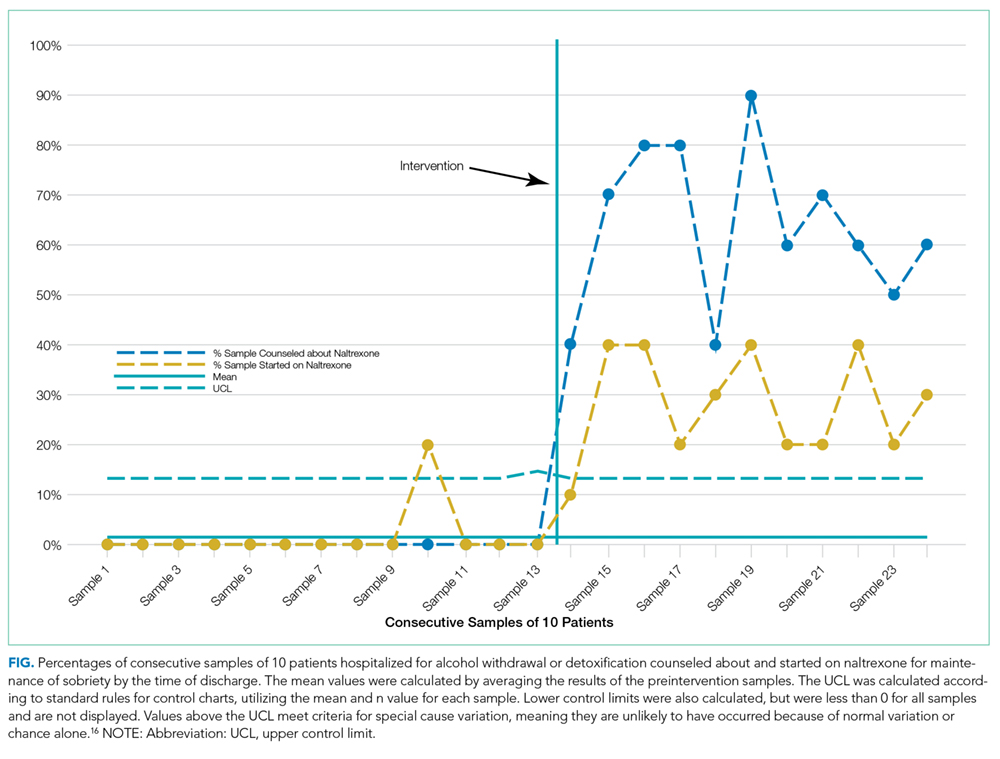
Among those counseled about naltrexone before discharge, 34 of 74 patients (45.9%) had no contraindications to naltrexone and were interested in taking the medication. Among the 40 patients who were counseled about but not prescribed naltrexone, 19 (47.5%) declined, 9 (22.5%) had liver function tests elevated more than 3 times the upper limit of the reference range, 9 (22.5%) had concurrent opiate use, and 3 (7.5%) had multiple contraindications.
Among the 34 patients who were prescribed naltrexone, 25 (73.5%) filled at least 1 prescription as confirmed by phone call to the relevant pharmacy.
Outcome Measures
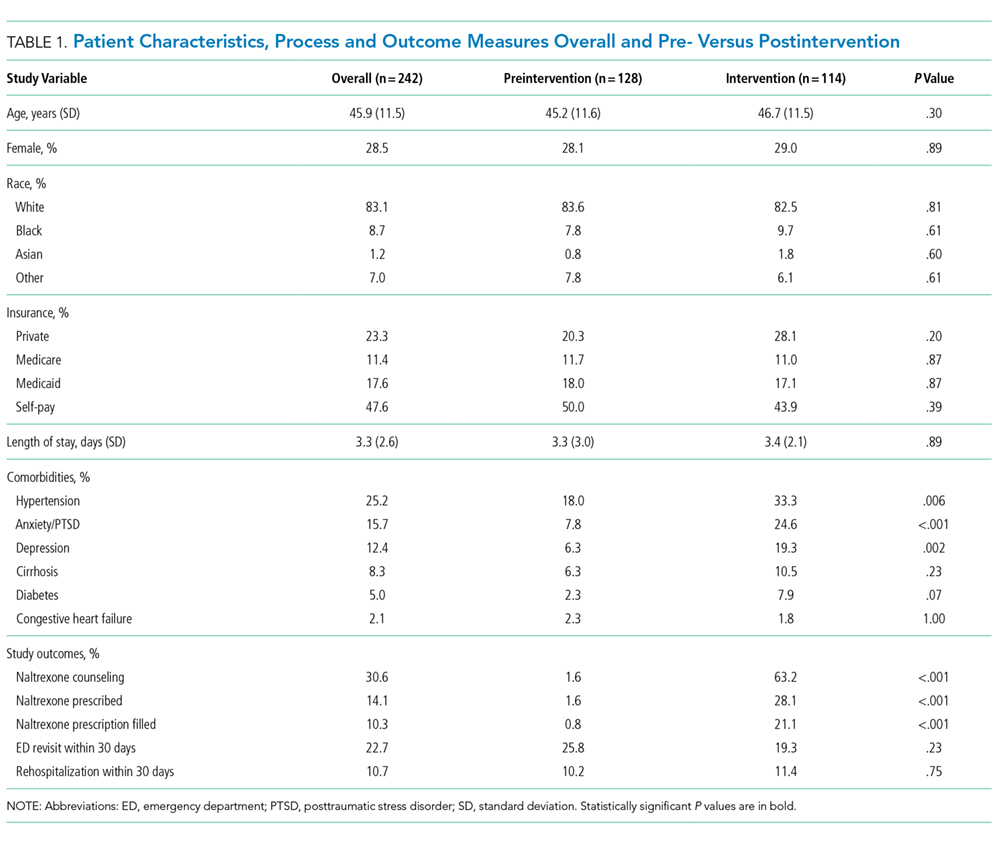
Subgroup Analysis
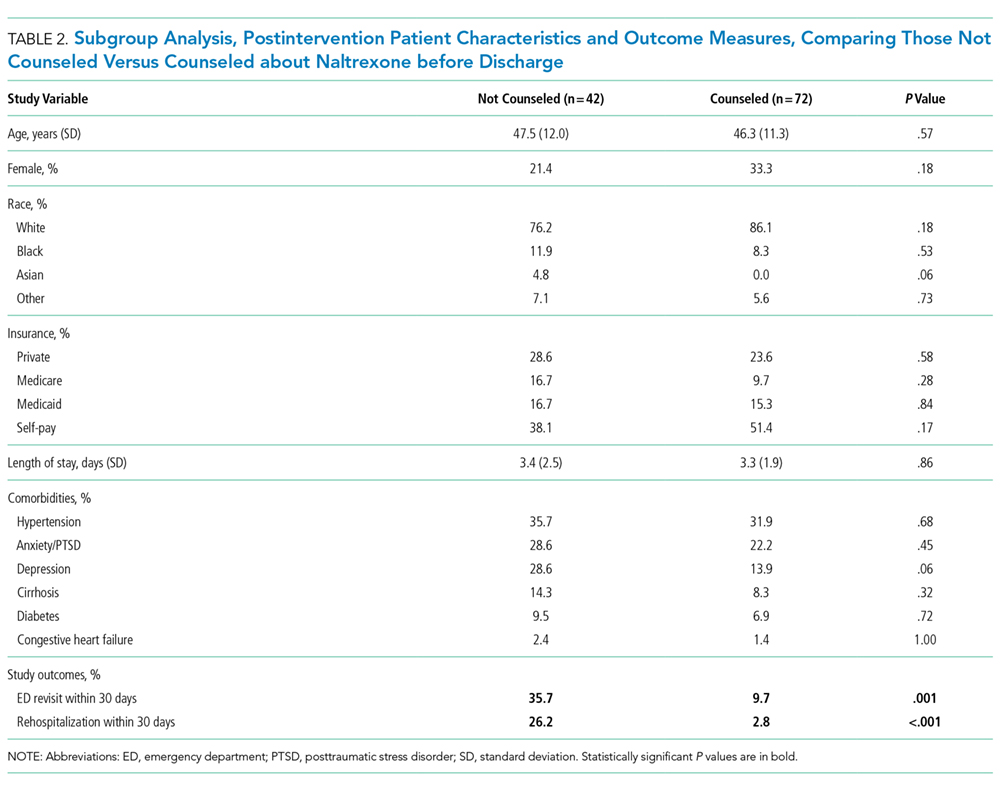
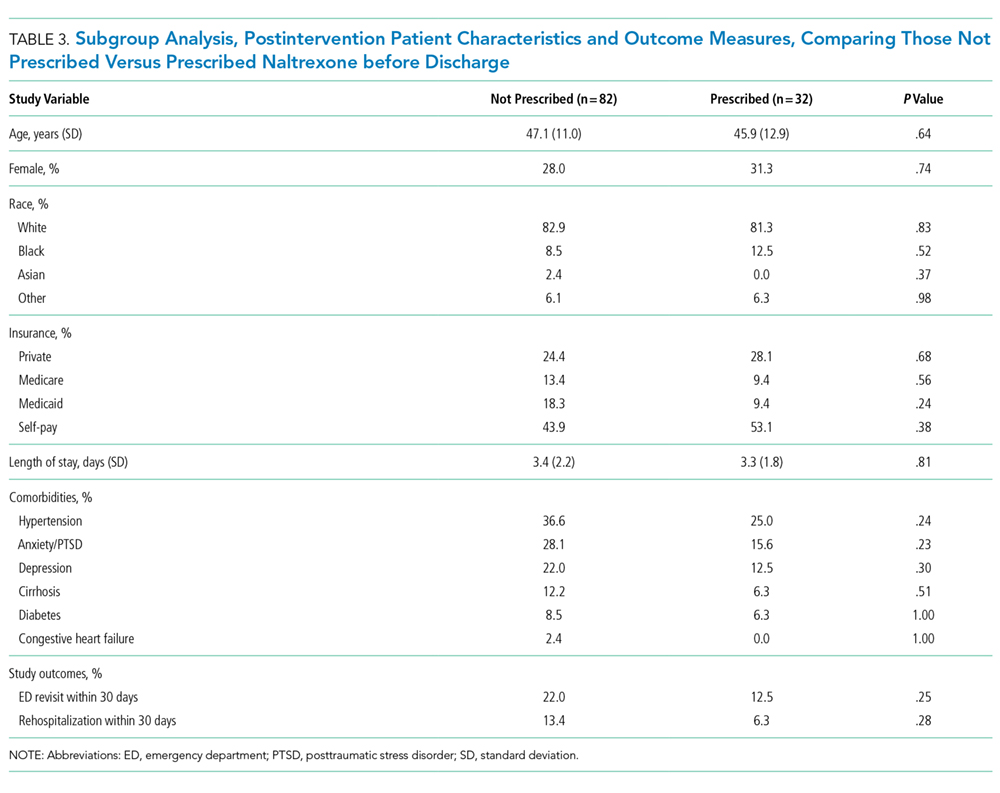
Balancing Measure
The mean length of stay for all patient encounters was 3.3 days. There were no differences in length of stay comparing pre- with postintervention patient encounters (Table 1) or those postintervention patients counseled versus not counseled (Table 2).
DISCUSSION
Our study demonstrates that counseling about medications for the maintenance of sobriety can be implemented as part of the routine care of hospitalized patients with AUDs. In our experience, about half of the patients counseled had no contraindications to naltrexone and were willing to take it at discharge. Almost three-fourths of those who were prescribed naltrexone filled the prescription at least once. The counseling process was not associated with increased length of stay. In the adjusted analysis, postintervention patients had significantly lower odds of 30-day ED returns. Additionally, in subgroup analysis, postintervention patients counseled about naltrexone had significantly lower rates of subsequent healthcare utilization compared with those not counseled, with absolute differences of 26% for ED revisits and 22% for rehospitalizations within 30 days.
The failure to demonstrate a difference in adjusted rehospitalization rates in the postintervention versus the preintervention group has several possible explanations. First, we had incomplete fidelity to our interventions, documenting counseling about naltrexone before discharge in over 60% of postintervention patients, raising the possibility that better fidelity may have resulted in improved outcomes. Related to this, only 28% of postintervention patients were prescribed naltrexone, which may be an inadequate sample size to demonstrate positive effects from the medication. Another possible explanation is that the postintervention group had higher rates of some of the comorbidities we assessed, namely, anxiety, depression, and hypertension, which could have negatively impacted the effectiveness of the interventions to prevent rehospitalization; however, after adjusting for comorbidities, the odds of rehospitalization were still not significantly different. It is interesting that the odds of postintervention ED revisits (but not rehospitalizations) were lower in the adjusted analysis. It may be that patients who revisit the ED and are not rehospitalized are different in important ways from those who are readmitted. Alternately, the larger number of ED revisits overall (about twice the rate of rehospitalization) may have made it easier to identify positive effects from the intervention for this outcome than rehospitalization (ie, the study may have been underpowered to detect a relatively small reduction in rehospitalization). It is also possible, however, that the interventions were simply insufficient to prevent rehospitalization.
The subgroup analysis, however, did find significant differences in both outcome measures for postintervention patients counseled versus not counseled about naltrexone before discharge. There are several possible explanations for these results. First, there may have been unmeasured differences in those counseled versus not counseled that explain the reductions observed in subsequent healthcare utilization. For example, the counseled patients could have been more motivated to change and, thus, more readily approached by providers for counseling. The lack of any demographic differences between the 2 groups and the relative simplicity of the counseling part of the intervention occurring as part of daily rounds argue against this hypothesis, but there are many potential unmeasured confounders (eg, homelessness, ability to afford medications), and this possibility remains. A second possible explanation is that patients counseled about naltrexone could have been more likely than those not counseled to seek subsequent care at other institutions. A third possibility is that that the counseling about (and prescribing when appropriate) naltrexone itself led to the observed decreases in subsequent ED visits and hospitalizations. This hypothesis would have been more supported had we been able to demonstrate a statistically significant reduction in healthcare utilization in those prescribed versus not prescribed naltrexone. But there were nonsignificant trends in the reduction of ED revisits and rehospitalizations among those prescribed the medication, suggesting we may have been able to demonstrate statistically significant reductions with a larger sample size.
Comparing our results with existing literature is challenging. The majority of randomized trials of naltrexone for AUDs were conducted in the outpatient setting.3-10 Most of these trials utilized some type of psychosocial intervention in addition to naltrexone.3-5,8-10 The 1 prior naltrexone study we identified conducted in the inpatient setting by Wei et al.14 is the most similar to our study. The authors reported the effects of a new process for assessing hospitalized patients with AUDs, including the use of a discharge planning tool for all patients admitted with alcohol dependence. The discharge tool included prompts for naltrexone in appropriate patients. The measured outcomes included the percentage of eligible patients prescribed naltrexone at discharge and the percentages of ED revisits and rehospitalizations within 30 days. Postintervention, 64% of eligible patients were prescribed naltrexone compared with 0% before, very similar to our results. There were significant decreases among all discharged patients with alcohol dependence for 30-day ED revisits (18.8% pre- vs 6.1% postimplementation) and rehospitalizations (23.4% vs 8.2%). The study differed from ours in a number of important respects, including a location in a large urban setting and implementation on a teaching service rather than an attending-only hospitalist service. Additionally, the authors studied 1 month of process implementation and compared it to another month 1 year before the new process, with an overall smaller sample size of 64 patients before and 49 patients after implementation. Potential reasons why Wei et al.14 were able to document lower rehospitalization rates postintervention when we did not include the differences in patient population (eg, high homeless rate, lower percentage of female patients in Wei study) and secular trends unrelated to interventions in either study.
Limitations of our study include the nonrandomized and uncontrolled design, which introduces the possibility of unmeasured confounding factors leading to the decrease we observed in healthcare utilization. Additionally, the single-center design precludes our ability to assess for healthcare utilization outcomes in other nearby facilities. We had incomplete implementation of our new process, counseling just over 60% of patients. As our primary outcomes relied on documentation in the medical record, both undersampling (not documenting some interventions) and reporting bias (being more likely to record positive sessions from intervention) are possible. Lastly, despite a moderate total sample size of almost 250 patients, the relatively small numbers of patients who were actually prescribed naltrexone in our study lessens our ability to show direct impact.
In conclusion, our study demonstrates a practical process for counseling about and prescribing naltrexone to patients hospitalized for alcohol detoxification or withdrawal. We demonstrate that many of these patients will be interested in starting naltrexone at discharge and will reliably fill the prescriptions if written. Counseling was associated with a significant reduction in subsequent healthcare utilization. These results have a wide potential impact given the ubiquitous nature of AUDs among hospitalized patients in community and academic settings.
Disclosure
The authors have no conflicts of interest relevant to this article to disclose. There were no sources of funding for this work.
1. Hasin DS, Stinson FS, Ogburn E, Grant BF. Prevalence, correlates, disability, and comorbidity of DSM-IV alcohol abuse and dependence in the United States: results from the National Epidemiologic Survey on Alcohol and Related Conditions. Arch Gen Psychiatry. 2007;64(7):830-842. PubMed
2. Bouchery EE, Harwood HJ, Sacks JJ, Simon CJ, Brewer RD. Economic costs of excessive alcohol consumption in the U.S., 2006. Am J Prev Med. 2011;41(5):516-524. PubMed
3. Anton RF, Moak DH, Waid LR, Latham PK, Malcolm RJ, Dias JK. Naltrexone and cognitive behavioral therapy for the treatment of outpatient alcoholics: results of a placebo-controlled trial. Am J Psychiatry. 1999;156(11):1758-1764. PubMed
4. Anton RF, Moak DH, Latham P, et al. Naltrexone combined with either cognitive behavioral or motivational enhancement therapy for alcohol dependence. J Clin Psychopharmacol. 2005;25(4):349-357. PubMed
5. Guardia J, Caso C, Arias F, et al. A double-blind, placebo-controlled study of naltrexone in the treatment of alcohol-dependence disorder: results from a multicenter clinical trial. Alcohol Clin Exp Res. 2002;26(9):1381-1387. PubMed
6. Kiefer F, Jahn H, Tarnaske T, et al. Comparing and combining naltrexone and acamprosate in relapse prevention of alcoholism: a double-blind, placebo-controlled study. Arch Gen Psychiatry. 2003;60(1):92-99. PubMed
7. Latt NC, Jurd S, Houseman J, Wutzke SE. Naltrexone in alcohol dependence: a randomised controlled trial of effectiveness in a standard clinical setting. Med J Aust. 2002;176(11):530-534. PubMed
8. Morris PL, Hopwood M, Whelan G, Gardiner J, Drummond E. Naltrexone for alcohol dependence: a randomized controlled trial. Addiction. 2001;96(11):1565-1573. PubMed
9. O’Malley SS, Jaffe AJ, Chang G, Schottenfeld RS, Meyer RE, Rounsaville B. Naltrexone and coping skills therapy for alcohol dependence. A controlled study. Arch Gen Psychiatry. 1992;49(11):881-887. PubMed
10. O’Malley SS, Robin RW, Levenson AL, et al. Naltrexone alone and with sertraline for the treatment of alcohol dependence in Alaska natives and non-natives residing in rural settings: a randomized controlled trial. Alcohol Clin Exp Res. 2008;32(7):1271-1283. PubMed
11. Jonas DE, Amick HR, Feltner C, et al. Pharmacotherapy for adults with alcohol use disorders in outpatient settings: a systematic review and meta-analysis. JAMA 2014;311(18):1889-1900. PubMed
12. Petrakis IL, Leslie D, Rosenheck R. Use of naltrexone in the treatment of alcoholism nationally in the Department of Veterans Affairs. Alcohol Clin Exp Res. 2003;27(11):1780-1784. PubMed
13. Mark TL, Kranzler HR, Song X. Understanding US addiction physicians’ low rate of naltrexone prescription. Drug Alcohol Depend. 2003;71(3):219-228. PubMed
14. Wei J, Defries T, Lozada M, Young N, Huen W, Tulsky J. An inpatient treatment and discharge planning protocol for alcohol dependence: efficacy in reducing 30-day readmissions and emergency department visits. J Gen Intern Med. 2015;30(3):365-370. PubMed
15. Stephens JR, Liles EA, Dancel R, Gilchrist M, Kirsch J, DeWalt DA. Who needs inpatient detox? Development and implementation of a hospitalist protocol for the evaluation of patients for alcohol detoxification. J Gen Intern Med. 2014;29(4):587-593. PubMed
16. Provost LP, Murray SK. The Health Care Data Guide: Learning from Data for Improvement. San Francisco: Jossey-Bass; 2011.
Alcohol use disorders (AUDs) are common, with an estimated lifetime prevalence of 17.8% for alcohol dependence.1 Alcohol misuse is costly, accounting for $24.6 billion in annual healthcare expenditures, including $5.1 billion for alcohol-related hospitalizations.2 A number of trials have demonstrated that naltrexone can help patients with AUDs maintain abstinence or diminish heavy drinking.3-10 A recent meta-analysis of pharmacotherapy trials for patients with AUDs reported that for patients using 50 mg of naltrexone daily, the number needed to treat was 12 to prevent a return to heavy drinking and 20 to prevent a return to any drinking.11 Despite good evidence for its effectiveness, naltrexone is not prescribed to the majority of patients with AUDs. In a study of veterans with AUDs cared for in the Veterans Affairs health system, only 1.9% of patients were prescribed naltrexone over the 6-month study period.12 A 2003 survey of 2 professional organizations for addiction treatment specialists reported that a mean of 13% of providers prescribed naltrexone to their patients.13
When naltrexone is prescribed, it is most frequently in the outpatient setting.3-10 Data for initiation of naltrexone in the inpatient setting are more limited. Wei et al.14 reported on the implementation of a discharge protocol, including counseling about naltrexone, for hospitalized patients with AUDs at an urban academic medical center. They reported a significant increase in the prescription of naltrexone to eligible patients by the time of discharge that was associated with a significant decrease in 30-day readmissions. Initiation of naltrexone in the inpatient versus the outpatient setting has some potential advantages. First, patients hospitalized for alcohol withdrawal have AUDs, obviating the need for screening. Second, the outpatient trials of naltrexone typically required 3 days of sobriety before initiation, which is generally achieved during hospitalization for detoxification or withdrawal.
Previous work at our institution centered on standardizing the process of evaluating patients needing alcohol detoxification at the time of referral for admission.15 The use of a standardized protocol reduced the number of inpatient admissions for alcohol-related diagnoses but had no effect on the 30-day readmission rate (28%) for those patients who were hospitalized. Our hospitalist group had no standardized process for discharging hospitalized patients with AUDs, and the discharge process rarely included counseling on medications for maintenance of sobriety. In this manuscript, we describe the implementation and impact of a process for counseling patients hospitalized for alcohol detoxification or withdrawal about naltrexone for maintenance of sobriety by the time of hospital discharge.
METHODS
Study Setting
The University of North Carolina (UNC) Hospitals is an 803-bed tertiary academic center. UNC Hospital Medicine is staffed by 29 physicians and 3 advanced practice providers (APPs). During the study period, there were 3 hospital medicine services at UNC Hospitals with a combined average daily census of approximately 40 patients, and each service was staffed by one attending physician every day of the week and one APP Monday through Friday.
Study Design
We used a pre-post study design, in which we implemented a new process for standardizing the discharge of hospitalized patients with AUDs, including a process for counseling about naltrexone by the time of discharge. We sought and received institutional review board (IRB) approval for this study (UNC IRB 15-1441).
Interventions
We formed an improvement team that included 3 physicians and an APP in hospital medicine, a general internist and a psychiatrist, both with expertise in the use of medications for maintenance of sobriety, the director of UNC’s Alcohol and Substance Abuse Program, and 2 case managers. The team developed a number of interventions, including group education, a process for patient identification, and algorithms for counseling about, prescribing, and documenting the discussion of naltrexone.
Group Education
We presented evidence about medications for the maintenance of sobriety at a regularly scheduled hospitalist meeting. An hour-long session on motivational interviewing techniques was also presented at a separate meeting. All created algorithms were circulated to the group electronically and posted at workstations in the hospitalist work area. As data were generated postimplementation, control charts of process measures were created, posted in the hospitalist work area, and presented at subsequent group meetings.
Identification of Patients
We focused our interventions on patients admitted for alcohol detoxification or withdrawal (including withdrawal seizures). We asked our group to preferentially admit these patients to 1 of our 3 hospitalists services, on which the service APP (K.S.) was also an improvement team member.
Creation of Algorithms and Scripts for Counseling
We created a simple algorithm for evaluating patients for naltrexone. We recommended that all patients admitted for alcohol detoxification or withdrawal be counseled about naltrexone for the maintenance of sobriety before discharge. The contraindications to naltrexone we included were (1) concurrent opioid use, (2) documented cirrhosis, and/or (3) liver function tests greater than 3 times the upper limit of normal by the time of hospital discharge.
We also created a suggested script for motivational interviewing (supplemental Appendix 1). This was presented at a group meeting and circulated via e-mail. The actual counseling technique and process was left up to individual providers. In practice, counseling took place in the course of daily rounds, generally the day before or day of hospital discharge.
Prescription of Medication
For interested patients without contraindications, we recommended a prescription of naltrexone at 50 mg daily for 3 months. For patients prescribed naltrexone without medical insurance (n = 17), we utilized our existing pharmacy assistance program, whereby discharging patients can obtain an initial 14-day supply after applying to the program and then can fill subsequent prescriptions if they meet program financial requirements.
Follow-up Appointments
For patients with established outpatient providers, we asked patients to schedule follow-up appointments within a month of discharge. Patients prescribed naltrexone without primary providers (n = 16) were eligible for an existing program, the UNC Transitions Program, whereby patients identified as having moderate-to-high risk of hospital readmission can receive a follow-up appointment at UNC Internal Medicine or UNC Family Medicine within 2 weeks of discharge.
Creation of “Smart Phrases”
To aid in documentation, we created “smart phrases” (easily accessed, previously created phrases that can be adopted by all users) within the hospital electronic health record. We created one smart phrase for documentation of counseling about naltrexone, which included dropdown menus for contraindications and the patient’s preference and one for discharge instructions for patients started on naltrexone (supplemental Appendix 2).
Implementation
After the presentation of suggested interventions in July 2015 and the subsequent dissemination of educational materials, we implemented our new process on August 1, 2015.
Data Collection
Patients were identified for inclusion in the study analysis by querying UNC Hospitals’ billing database for the inpatient diagnosis codes (diagnosis-related groupings) 896 and 897, “alcohol/drug abuse or dependence without rehabilitation therapy,” with and without major comorbidity or complication, respectively, and with hospital medicine as the discharging service. All encounters were then manually reviewed by 2 investigators (J.S. and C.M.). Encounters were included if the history and physical indicated that the primary reason for admission was alcohol detoxification or withdrawal. Encounters with other primary reasons for admission (eg, pancreatitis, gastrointestinal bleeding) were excluded. For patients with multiple encounters, only the first eligible encounter in the pre- and/or postimplementation period was included. Comorbidities for identified patients were assessed via the search of study encounters for the International Classification of Diseases, 9th Revision-Clinical Modification codes for hypertension, anxiety, depression, cirrhosis, diabetes, and congestive heart failure.
Process, Outcomes, and Balancing Measures
The study process measures included the percentage of patients hospitalized for alcohol detoxification or withdrawal with documentation of counseling about naltrexone by the time of discharge, before and after process intervention. Documentation was defined as the description of counseling about naltrexone in the discharge summary or progress notes of identified encounters. We also measured the percentage of patients started on naltrexone before and after intervention. Lastly, we measured the percentage of patients prescribed naltrexone who filled at least 1 prescription for the medication, assessed by calls to the pharmacy where the medication was prescribed. Prescriptions that could not be confirmed (ie, paper rather than electronic prescriptions) were counted as not filled.
For outcome measures, we recorded the percentages of study patients who returned to the emergency department (ED) and were readmitted to UNC Hospitals (inpatient or observation) for any reason within 30 days of discharge. These outcomes were determined by a manual chart review.
In order to ensure the new process was not associated with delays in patient discharge, we measured the mean length of stay in days for study patient encounters before and after intervention as a balancing measure.
Statistical Analysis
Demographic and clinical characteristics for included patients were compared for the 16 months preimplementation (April 1, 2014 through July 31, 2015) and the 19 months postimplementation (August 1, 2015 through February 28, 2017). Descriptive statistics were calculated by using the Student t test for continuous variables and the χ2 test for dichotomous variables. We used multivariate logistic regression to evaluate the associations between the intervention arms (pre- vs postintervention) and study outcomes, adjusting for age, gender, race, insurance type, and medical comorbidities. We chose these variables for inclusion based on their association with study outcomes at the P ≤ .20 level in bivariate analyses. P < .05 was considered statistically significant. All analyses were performed by using Stata version 13.1 (StataCorp LLC, College Station, TX).
For 2 process measures, the percentages of patients counseled about and started on naltrexone, we plotted consecutive samples of 10 patients before and after intervention on a control chart, using preintervention data to calculate means and control limits.
Subgroup Analysis
We used multivariate logistic regression to evaluate the associations between counseling versus no counseling and prescription of naltrexone versus no prescription for study outcomes in the postintervention subgroup, adjusting for age, gender, race, insurance type, and medical comorbidities.
RESULTS
Patients
We identified 188 preimplementation encounters and excluded 12 patients (6.4%) for primary admission reasons other than alcohol withdrawal or detoxification and 48 (25.5%) repeat hospitalizations, leaving 128 unique patient encounters. We identified 166 postimplementation encounters and excluded 25 (15.1%) hospitalizations for admission reason and 27 repeat hospitalizations (16.3%), leaving 114 unique patient encounters (flow diagram in supplemental Appendix 3). The most common admission reason for the exclusion of encounters was withdrawal from a substance other than alcohol (supplemental Appendix 4). The percentages of encounters excluded in preimplementation and postimplementation periods were similar at 31.9% and 31.4%, respectively.
The majority of patients were male and white, and almost half were uninsured (Table 1). There were no demographic differences between patients in the pre- versus postimplementation groups. For studied comorbidities, postintervention patients were more likely to have hypertension, anxiety, and depression.
Process Measures
Among those counseled about naltrexone before discharge, 34 of 74 patients (45.9%) had no contraindications to naltrexone and were interested in taking the medication. Among the 40 patients who were counseled about but not prescribed naltrexone, 19 (47.5%) declined, 9 (22.5%) had liver function tests elevated more than 3 times the upper limit of the reference range, 9 (22.5%) had concurrent opiate use, and 3 (7.5%) had multiple contraindications.
Among the 34 patients who were prescribed naltrexone, 25 (73.5%) filled at least 1 prescription as confirmed by phone call to the relevant pharmacy.
Outcome Measures
Subgroup Analysis
Balancing Measure
The mean length of stay for all patient encounters was 3.3 days. There were no differences in length of stay comparing pre- with postintervention patient encounters (Table 1) or those postintervention patients counseled versus not counseled (Table 2).
DISCUSSION
Our study demonstrates that counseling about medications for the maintenance of sobriety can be implemented as part of the routine care of hospitalized patients with AUDs. In our experience, about half of the patients counseled had no contraindications to naltrexone and were willing to take it at discharge. Almost three-fourths of those who were prescribed naltrexone filled the prescription at least once. The counseling process was not associated with increased length of stay. In the adjusted analysis, postintervention patients had significantly lower odds of 30-day ED returns. Additionally, in subgroup analysis, postintervention patients counseled about naltrexone had significantly lower rates of subsequent healthcare utilization compared with those not counseled, with absolute differences of 26% for ED revisits and 22% for rehospitalizations within 30 days.
The failure to demonstrate a difference in adjusted rehospitalization rates in the postintervention versus the preintervention group has several possible explanations. First, we had incomplete fidelity to our interventions, documenting counseling about naltrexone before discharge in over 60% of postintervention patients, raising the possibility that better fidelity may have resulted in improved outcomes. Related to this, only 28% of postintervention patients were prescribed naltrexone, which may be an inadequate sample size to demonstrate positive effects from the medication. Another possible explanation is that the postintervention group had higher rates of some of the comorbidities we assessed, namely, anxiety, depression, and hypertension, which could have negatively impacted the effectiveness of the interventions to prevent rehospitalization; however, after adjusting for comorbidities, the odds of rehospitalization were still not significantly different. It is interesting that the odds of postintervention ED revisits (but not rehospitalizations) were lower in the adjusted analysis. It may be that patients who revisit the ED and are not rehospitalized are different in important ways from those who are readmitted. Alternately, the larger number of ED revisits overall (about twice the rate of rehospitalization) may have made it easier to identify positive effects from the intervention for this outcome than rehospitalization (ie, the study may have been underpowered to detect a relatively small reduction in rehospitalization). It is also possible, however, that the interventions were simply insufficient to prevent rehospitalization.
The subgroup analysis, however, did find significant differences in both outcome measures for postintervention patients counseled versus not counseled about naltrexone before discharge. There are several possible explanations for these results. First, there may have been unmeasured differences in those counseled versus not counseled that explain the reductions observed in subsequent healthcare utilization. For example, the counseled patients could have been more motivated to change and, thus, more readily approached by providers for counseling. The lack of any demographic differences between the 2 groups and the relative simplicity of the counseling part of the intervention occurring as part of daily rounds argue against this hypothesis, but there are many potential unmeasured confounders (eg, homelessness, ability to afford medications), and this possibility remains. A second possible explanation is that patients counseled about naltrexone could have been more likely than those not counseled to seek subsequent care at other institutions. A third possibility is that that the counseling about (and prescribing when appropriate) naltrexone itself led to the observed decreases in subsequent ED visits and hospitalizations. This hypothesis would have been more supported had we been able to demonstrate a statistically significant reduction in healthcare utilization in those prescribed versus not prescribed naltrexone. But there were nonsignificant trends in the reduction of ED revisits and rehospitalizations among those prescribed the medication, suggesting we may have been able to demonstrate statistically significant reductions with a larger sample size.
Comparing our results with existing literature is challenging. The majority of randomized trials of naltrexone for AUDs were conducted in the outpatient setting.3-10 Most of these trials utilized some type of psychosocial intervention in addition to naltrexone.3-5,8-10 The 1 prior naltrexone study we identified conducted in the inpatient setting by Wei et al.14 is the most similar to our study. The authors reported the effects of a new process for assessing hospitalized patients with AUDs, including the use of a discharge planning tool for all patients admitted with alcohol dependence. The discharge tool included prompts for naltrexone in appropriate patients. The measured outcomes included the percentage of eligible patients prescribed naltrexone at discharge and the percentages of ED revisits and rehospitalizations within 30 days. Postintervention, 64% of eligible patients were prescribed naltrexone compared with 0% before, very similar to our results. There were significant decreases among all discharged patients with alcohol dependence for 30-day ED revisits (18.8% pre- vs 6.1% postimplementation) and rehospitalizations (23.4% vs 8.2%). The study differed from ours in a number of important respects, including a location in a large urban setting and implementation on a teaching service rather than an attending-only hospitalist service. Additionally, the authors studied 1 month of process implementation and compared it to another month 1 year before the new process, with an overall smaller sample size of 64 patients before and 49 patients after implementation. Potential reasons why Wei et al.14 were able to document lower rehospitalization rates postintervention when we did not include the differences in patient population (eg, high homeless rate, lower percentage of female patients in Wei study) and secular trends unrelated to interventions in either study.
Limitations of our study include the nonrandomized and uncontrolled design, which introduces the possibility of unmeasured confounding factors leading to the decrease we observed in healthcare utilization. Additionally, the single-center design precludes our ability to assess for healthcare utilization outcomes in other nearby facilities. We had incomplete implementation of our new process, counseling just over 60% of patients. As our primary outcomes relied on documentation in the medical record, both undersampling (not documenting some interventions) and reporting bias (being more likely to record positive sessions from intervention) are possible. Lastly, despite a moderate total sample size of almost 250 patients, the relatively small numbers of patients who were actually prescribed naltrexone in our study lessens our ability to show direct impact.
In conclusion, our study demonstrates a practical process for counseling about and prescribing naltrexone to patients hospitalized for alcohol detoxification or withdrawal. We demonstrate that many of these patients will be interested in starting naltrexone at discharge and will reliably fill the prescriptions if written. Counseling was associated with a significant reduction in subsequent healthcare utilization. These results have a wide potential impact given the ubiquitous nature of AUDs among hospitalized patients in community and academic settings.
Disclosure
The authors have no conflicts of interest relevant to this article to disclose. There were no sources of funding for this work.
1. Hasin DS, Stinson FS, Ogburn E, Grant BF. Prevalence, correlates, disability, and comorbidity of DSM-IV alcohol abuse and dependence in the United States: results from the National Epidemiologic Survey on Alcohol and Related Conditions. Arch Gen Psychiatry. 2007;64(7):830-842. PubMed
2. Bouchery EE, Harwood HJ, Sacks JJ, Simon CJ, Brewer RD. Economic costs of excessive alcohol consumption in the U.S., 2006. Am J Prev Med. 2011;41(5):516-524. PubMed
3. Anton RF, Moak DH, Waid LR, Latham PK, Malcolm RJ, Dias JK. Naltrexone and cognitive behavioral therapy for the treatment of outpatient alcoholics: results of a placebo-controlled trial. Am J Psychiatry. 1999;156(11):1758-1764. PubMed
4. Anton RF, Moak DH, Latham P, et al. Naltrexone combined with either cognitive behavioral or motivational enhancement therapy for alcohol dependence. J Clin Psychopharmacol. 2005;25(4):349-357. PubMed
5. Guardia J, Caso C, Arias F, et al. A double-blind, placebo-controlled study of naltrexone in the treatment of alcohol-dependence disorder: results from a multicenter clinical trial. Alcohol Clin Exp Res. 2002;26(9):1381-1387. PubMed
6. Kiefer F, Jahn H, Tarnaske T, et al. Comparing and combining naltrexone and acamprosate in relapse prevention of alcoholism: a double-blind, placebo-controlled study. Arch Gen Psychiatry. 2003;60(1):92-99. PubMed
7. Latt NC, Jurd S, Houseman J, Wutzke SE. Naltrexone in alcohol dependence: a randomised controlled trial of effectiveness in a standard clinical setting. Med J Aust. 2002;176(11):530-534. PubMed
8. Morris PL, Hopwood M, Whelan G, Gardiner J, Drummond E. Naltrexone for alcohol dependence: a randomized controlled trial. Addiction. 2001;96(11):1565-1573. PubMed
9. O’Malley SS, Jaffe AJ, Chang G, Schottenfeld RS, Meyer RE, Rounsaville B. Naltrexone and coping skills therapy for alcohol dependence. A controlled study. Arch Gen Psychiatry. 1992;49(11):881-887. PubMed
10. O’Malley SS, Robin RW, Levenson AL, et al. Naltrexone alone and with sertraline for the treatment of alcohol dependence in Alaska natives and non-natives residing in rural settings: a randomized controlled trial. Alcohol Clin Exp Res. 2008;32(7):1271-1283. PubMed
11. Jonas DE, Amick HR, Feltner C, et al. Pharmacotherapy for adults with alcohol use disorders in outpatient settings: a systematic review and meta-analysis. JAMA 2014;311(18):1889-1900. PubMed
12. Petrakis IL, Leslie D, Rosenheck R. Use of naltrexone in the treatment of alcoholism nationally in the Department of Veterans Affairs. Alcohol Clin Exp Res. 2003;27(11):1780-1784. PubMed
13. Mark TL, Kranzler HR, Song X. Understanding US addiction physicians’ low rate of naltrexone prescription. Drug Alcohol Depend. 2003;71(3):219-228. PubMed
14. Wei J, Defries T, Lozada M, Young N, Huen W, Tulsky J. An inpatient treatment and discharge planning protocol for alcohol dependence: efficacy in reducing 30-day readmissions and emergency department visits. J Gen Intern Med. 2015;30(3):365-370. PubMed
15. Stephens JR, Liles EA, Dancel R, Gilchrist M, Kirsch J, DeWalt DA. Who needs inpatient detox? Development and implementation of a hospitalist protocol for the evaluation of patients for alcohol detoxification. J Gen Intern Med. 2014;29(4):587-593. PubMed
16. Provost LP, Murray SK. The Health Care Data Guide: Learning from Data for Improvement. San Francisco: Jossey-Bass; 2011.
© 2018 Society of Hospital Medicine
Periprocedural Bridging Anticoagulation
The “Things We Do for No Reason” (TWDFNR) series reviews practices that have become common parts of hospital care but that may provide little value to our patients. Practices reviewed in the TWDFNR series do not represent “black and white” conclusions or clinical practice standards, but are meant as a starting place for research and active discussions among hospitalists and patients. We invite you to be part of that discussion. https://www.choosingwisely.org/
Oral anticoagulation (OAC) is commonly prescribed to patients with atrial fibrillation, venous thromboembolism (VTE), and mechanical heart valves (MHVs) for primary and secondary thromboembolism prevention. When patients require surgery or an invasive procedure, “bridging” anticoagulants (eg, enoxaparin) are commonly administered during the period of OAC interruption to reduce thromboembolic risk. This practice stems from small observational studies and expert opinion, which influenced several clinical guidelines despite the lack of high-quality evidence. Although prospective randomized trials of periprocedural bridging in patients with VTE and MHVs are lacking, available evidence is consistent with findings from the BRIDGE trial, which guides the following general recommendations: (1) avoid unnecessary periprocedural interruptions of OAC, especially for low bleeding risk procedures; (2) avoid the administration of periprocedural bridging anticoagulation in patients with low to moderate thromboembolic risk; (3) in patients with high thromboembolic risk, individually assess the patient-specific and procedure-specific bleeding risks versus thromboembolic risks.
A 75-year-old man with a history of hypertension, diabetes mellitus, and atrial fibrillation is admitted for surgical repair of a comminuted intertrochanteric left hip fracture. He suffered a mechanical ground-level fall without loss of consciousness. At baseline, he denies any chest pain, dyspnea on exertion, or recent change in his exercise tolerance. A physical examination is notable for stable vital signs, irregular cardiac rhythm, and a shortened and externally rotated left lower extremity with exquisite tenderness to palpation and range of motion. The patient is taking warfarin for stroke prophylaxis based on a CHA2DS2VaSc score of 4 points. The international normalized ratio (INR) is 1.9 upon admission, and surgery is planned within 48 hours, once the patient is “medically cleared.” Will this patient benefit from periprocedural bridging anticoagulation?
WHY YOU MIGHT THINK PERIPROCEDURAL “BRIDGING” ANTICOAGULATION IS HELPFUL
OAC is commonly prescribed to patients with atrial fibrillation, venous thromboembolism (VTE), and mechanical heart valves (MHVs) for the primary or secondary prevention of thromboembolic events, with more than 35 million prescriptions written annually in the United States alone.1 Many of these patients will require a temporary interruption of their OAC for surgery or an invasive procedure.2 As a result, patients may be treated with short-acting, or “bridging,” anticoagulants, such as low-molecular-weight heparin (LMWH), to minimize the duration of anticoagulation interruption and theoretically reduce their thromboembolic risk. The rationale for bridging stemmed from small observational studies and expert opinion that perceived the estimated thromboembolic risk to be higher than the estimated bleeding risk.3-5 One such example estimated that the VTE risk increased 100-fold postoperatively, whereas heparin administration only doubled the bleeding risk.3 Furthermore, clinical practice guidelines published from the American Heart Association, American College of Cardiology, European Heart Rhythm Society, and American College of Chest Physicians recommend when and how to initiate bridging anticoagulation. Clinicians have widely adopted these recommendations despite an acknowledged paucity of high-quality supporting evidence.6,7
WHY PERIPROCEDURAL “BRIDGING” ANTICOAGULATION IS MORE HARMFUL THAN HELPFUL
Periprocedural Anticoagulation Interruption is Often Not Indicated
Patients undergoing a surgical or invasive procedure may require an interruption of OAC to minimize the periprocedural bleeding risk. The decision to interrupt OAC should generally be based on the procedure-specific bleeding risk. Procedures with low bleeding risk such as cataract surgery, dermatologic biopsy (including Mohs), arthrocentesis, diagnostic gastrointestinal endoscopy, and cardiac pacemaker implantation can be performed safely without OAC interruption.5,7 Despite evidence supporting the safety of periprocedural OAC continuation, unnecessary OAC interruptions remain commonplace and are associated with increased adverse outcomes.8 The BRUISE CONTROL trial compared uninterrupted OAC to interrupted OAC with periprocedural bridging for cardiac pacemaker or defibrillator implantation in a moderate to high thromboembolic risk population. The uninterrupted OAC group experienced significantly fewer pocket hematomas, hematoma evacuations, and prolonged hospitalizations (relative risk [RR] 0.19-0.24; P < .05) without significantly increased thromboembolic events, highlighting the potential benefits of this approach.9
Nevertheless, many surgical and invasive procedures do warrant OAC interruption due to the inherent bleeding risk of the procedure or other logistical considerations. Procedures associated with an increased bleeding risk include urologic surgery (except laser lithotripsy), surgery on highly vascular organs (eg, kidney, liver, spleen), bowel resection, cardiac surgery, and intracranial or spinal surgery.7 Alternatively, some procedures with acceptably low bleeding risk (eg, colonoscopy) are routinely performed during an OAC interruption due to the fact that a high bleeding risk intervention may be necessary during the procedure (eg, polypectomy). This approach may be preferable when a significant amount of preparation is required (eg, bowel preparation) and may be a more efficient use of healthcare resources by avoiding repeat procedures.
Bridging Anticoagulation Does Not Significantly Reduce Thromboembolic Events
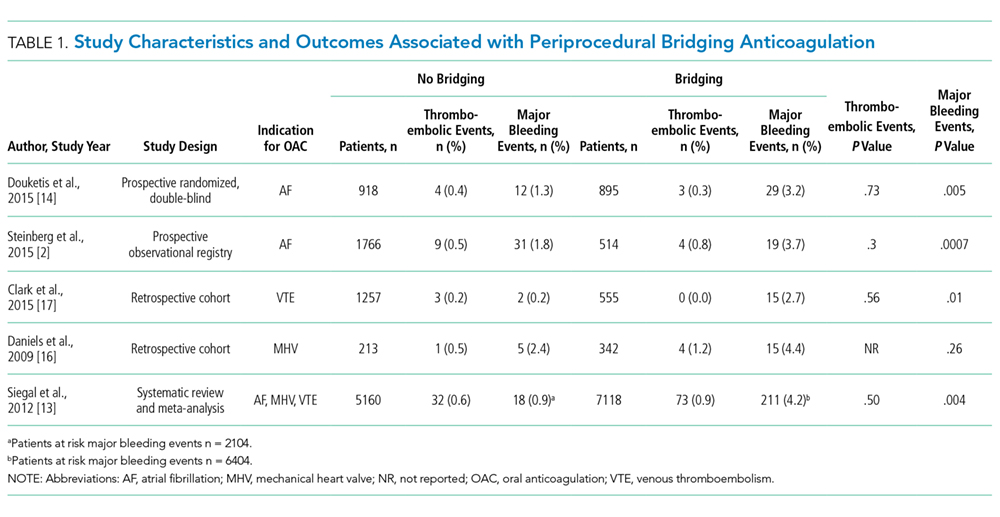
BRIDGE was a randomized, double-blind, placebo-controlled trial among patients with atrial fibrillation (n = 1884) requiring OAC interruption for mostly low-risk, ambulatory surgeries or invasive procedures (eg, gastrointestinal endoscopy, cardiac catheterization). Notably, thromboembolism events were rare, and there was no significant difference in thromboembolism events between patients randomized to placebo or bridging with LMWH (0.4% vs 0.3%, respectively; P = .73).14 However, the proportion of patients enrolled with the highest thromboembolic risk (ie, CHADS2 score 5-6 or prior transient ischemic attack and/or stroke) was low, potentially indicating an underestimated benefit in these patients. Major bleeding was significantly reduced in patients forgoing bridging anticoagulation (1.3% vs 3.2%; RR 0.41; 95% confidence interval, 0.20-0.78; P = .005), although bleeding occurred more frequently than thromboembolism in both groups.
Even though randomized trials assessing the safety and efficacy of bridging for VTE or MHVs have not been completed, evidence is not entirely lacking.16,17 A rigorous observational study limited to a VTE cohort (deep vein thrombosis of upper or lower extremity and/or pulmonary embolism) analyzed the effects of bridging in patients with a surgical or invasive procedure-related OAC interruption. Patients were stratified according to the American College of Chest Physicians perioperative guideline risk-stratification schema, and most VTE events (≥93%) occurred more than 12 months prior to OAC interruption.7 Importantly, the study found a nonsignificant difference in thromboembolism events between patients who were bridged and those who were not (0.0% vs 0.2%, respectively; P = .56), a very low overall thromboembolism event rate (0.2%), and a lack of correlation between events and risk-stratification category.17 In other words, all thromboembolic events occurred in the low- and moderate-risk groups, which include patients who do not warrant bridging under current guidelines. Clinically relevant bleeding occurred in 17 (0.9%) of 1812 patients studied. Notably, 15 (2.7%) of 555 patients receiving bridging suffered clinically relevant bleeding as compared with 2 (0.2%) of 1257 patients forgoing bridging anticoagulation.
The Bleeding Risk of Bridging Anticoagulation Often Outweighs the Potential Benefits
The early observational studies on LMWH bridging demonstrated that thromboembolic events are infrequent (0.4%-0.9%), whereas major bleeding events occur up to 7 times more often (0.7%-6.7%).10-12 The BRIDGE trial demonstrated comparably low thromboembolic events (0.3%). In the patients treated with bridging LMWH, major bleeding (3.2%) occurred 10 times more frequently than thromboembolism.14 Likewise, in a VTE cohort study, Clark et al.17 demonstrated “a 17-fold higher risk of bleeding without a significant difference in the rate of recurrent VTE” in patients bridged with heparin as compared with those who were not. Considering that recurrent VTE and major bleeding events have similar case-fatality rates,18 these increases in major bleeding events without reductions in thromboembolic events unmistakably tip the risk–benefit balance sharply towards an increased risk of harm.
When is bridging anticoagulation potentially helpful?
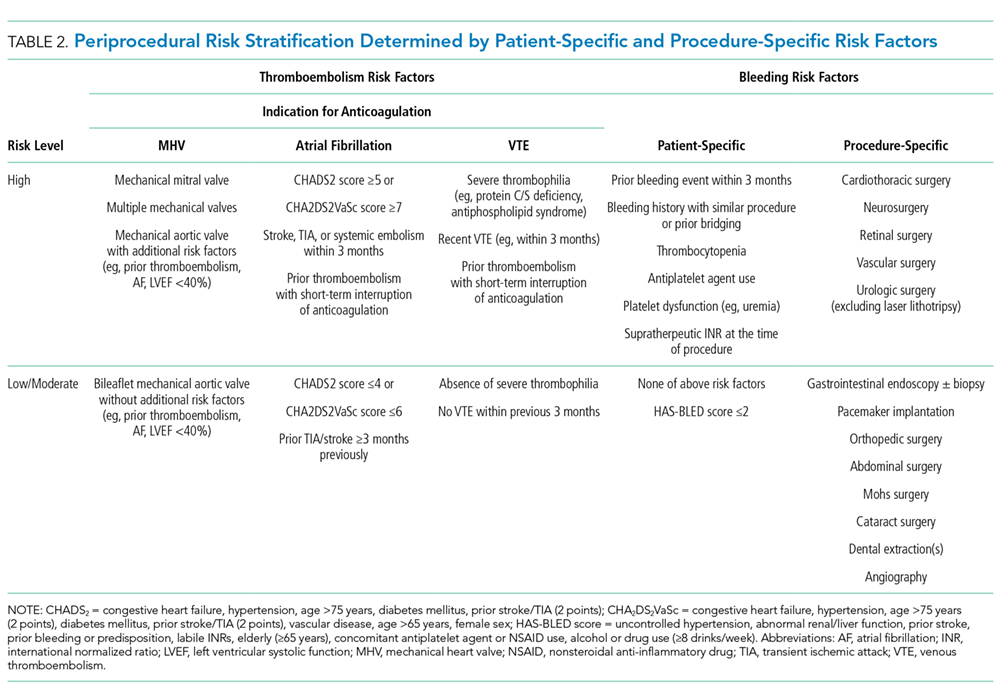
WHAT SHOULD YOU DO INSTEAD?
First, determine whether periprocedural OAC interruption is necessary for patients on chronic OAC due to atrial fibrillation, VTE, or MHVs. Avoid unwarranted OAC interruption by discussing the need for OAC interruptions with the surgeon or proceduralist, especially if the surgery is associated with a low bleeding risk and the patient has a high thromboembolic risk. When a periprocedural OAC interruption is justified, bridging should be avoided in the majority of patients, especially those with low to moderate thromboembolic risk or increased bleeding risk according to current risk-stratification schema.7,15,19
Periprocedural management of direct oral anticoagulants (DOACs) is different than that of warfarin. The duration of DOAC interruption is determined by the procedural bleeding risk, drug half-life, and a patient’s creatinine clearance. Although the pharmacokinetics of DOACs generally allow for brief interruptions (eg, 24-48 hours), longer interruptions (eg, 96-120 hours) are warranted prior to high bleeding risk procedures, when drug half-life is prolonged (ie, dabigatran), and in patients with renal impairment. Parenteral bridging anticoagulation is not recommended during brief DOAC interruptions, and substituting a DOAC in place of LMWH for bridging is not advised. The 2017 American College of Cardiology Expert Consensus Decision Pathway provides periprocedural OAC interruption guidance for atrial fibrillation, with many principles applicable to other OAC indications.15We developed an institutional guideline that provides clinicians a structured approach to bridging OAC that steers them away from inappropriate bridging and helps them make decisions when evidence is lacking. Shared decision-making represents another effective method for well-informed patients and clinicians to arrive at a mutually agreed upon bridging decision.
RECOMMENDATIONS
- Avoid unnecessary periprocedural interruptions of OAC, especially for procedures with a low bleeding risk.
- Avoid the administration of bridging anticoagulation in patients with low to moderate thromboembolic risk during periprocedural OAC interruptions.
- In patients with a high thromboembolic risk, an individualized assessment of the patient-specific and procedure-specific bleeding risks versus the thromboembolic risks is necessary when considering bridging anticoagulation administration.
CONCLUSION
Returning to the opening case, the patient requires an anticoagulation interruption and INR correction prior to surgery. Because the CHA2DS2VaSc score of 4 does not categorize him as a high thromboembolic risk, bridging anticoagulation should be avoided. In the majority of patients on OAC, bridging anticoagulation does not reduce thromboembolic events and is associated with increased major bleeding. Unnecessary anticoagulation interruptions should be avoided for procedures associated with low bleeding risk. Bridging should not be administered to the majority of patients requiring a periprocedural anticoagulation interruption.
Do
Disclosure: The authors report no conflicts of interest relevant to this article to disclose.
1. Kirley K, Qato DM, Kornfield R, Stafford RS, Alexander GC. National trends in oral anticoagulant use in the United States, 2007 to 2011. Circ Cardiovasc Qual Outcomes. 2012;5(5):615-621. PubMed
2. Steinberg BA, Peterson ED, Kim S, et al. Use and outcomes associated with bridging during anticoagulation interruptions in patients with atrial fibrillation: findings from the Outcomes Registry for Better Informed Treatment of Atrial Fibrillation (ORBIT-AF). Circulation. 2015;131(5):488-494. PubMed
3. Kearon C, Hirsh J. Management of anticoagulation before and after elective surgery. N Engl J Med. 1997;336(21):1506-1511. PubMed
4. Eckman MH. “Bridging on the river Kwai”: the perioperative management of anticoagulation therapy. Med Decis Making. 2005;25(4):370-373. PubMed
5. Dunn AS, Turpie AG. Perioperative management of patients receiving oral anticoagulants: a systematic review. Arch Intern Med. 2003;163(8):901-908. PubMed
6. January CT, Wann LS, Alpert JS, et al. 2014 AHA/ACC/HRS guideline for the management of patients with atrial fibrillation: executive summary: a report of the American College of Cardiology/American Heart Association Task Force on practice guidelines and the Heart Rhythm Society. Circulation. 2014;130(23):2071-2104. PubMed
7. Douketis JD, Spyropoulos AC, Spencer FA, et al. Perioperative management of antithrombotic therapy: Antithrombotic Therapy and Prevention of Thrombosis, 9th ed: American College of Chest Physicians Evidence-Based Clinical Practice Guidelines. Chest. 2012;141(2 Suppl):e326S-e350S. PubMed
8. Gerson LB, Gage BF, Owens DK, Triadafilopoulos G. Effect and outcomes of the ASGE guidelines on the periendoscopic management of patients who take anticoagulants. Am J Gastroenterol. 2000;95(7):1717-1724. PubMed
9. Birnie DH, Healey JS, Wells GA, et al. Pacemaker or defibrillator surgery without interruption of anticoagulation. N Engl J Med. 2013;368(22):2084-2093. PubMed
10. Douketis JD, Johnson JA, Turpie AG. Low-molecular-weight heparin as bridging anticoagulation during interruption of warfarin: assessment of a standardized periprocedural anticoagulation regimen. Arch Intern Med. 2004;164(12):1319-1326. PubMed
11. Spyropoulos AC, Turpie AG, Dunn AS, et al. Clinical outcomes with unfractionated heparin or low-molecular-weight heparin as bridging therapy in patients on long-term oral anticoagulants: the REGIMEN registry. J Thromb Haemost. 2006;4(6):1246-1252. PubMed
12. Kovacs MJ, Kearon C, Rodger M, et al. Single-arm study of bridging therapy with low-molecular-weight heparin for patients at risk of arterial embolism who require temporary interruption of warfarin. Circulation. 2004;110(12):1658-1663. PubMed
13. Siegal D, Yudin J, Kaatz S, Douketis JD, Lim W, Spyropoulos AC. Periprocedural heparin bridging in patients receiving vitamin K antagonists: systematic review and meta-analysis of bleeding and thromboembolic rates. Circulation. 2012;126(13):1630-1639. PubMed
14. Douketis JD, Spyropoulos AC, Kaatz S, et al. Perioperative Bridging Anticoagulation in Patients with Atrial Fibrillation. N Engl J Med. 2015;373(9):823-833. PubMed
15. Doherty JU, Gluckman TJ, Hucker WJ, et al. 2017 ACC Expert Consensus Decision Pathway for Periprocedural Management of Anticoagulation in Patients With Nonvalvular Atrial Fibrillation: A Report of the American College of Cardiology Clinical Expert Consensus Document Task Force. J Am Coll Cardiol. 2017;69(7):871-898. PubMed
16. Daniels PR, McBane RD, Litin SC, et al. Peri-procedural anticoagulation management of mechanical prosthetic heart valve patients. Thromb Res. 2009;124(3):300-305. PubMed
17. Clark NP, Witt DM, Davies LE, et al. Bleeding, Recurrent Venous Thromboembolism, and Mortality Risks During Warfarin Interruption for Invasive Procedures. JAMA Intern Med. 2015;175(7):1163-1168. PubMed
18. Carrier M, Le Gal G, Wells PS, Rodger MA. Systematic review: case-fatality rates of recurrent venous thromboembolism and major bleeding events among patients treated for venous thromboembolism. Ann Intern Med. 2010;152(9):578-589. PubMed
19. Nishimura RA, Otto CM, Bonow RO, et al. 2017 AHA/ACC Focused Update of the 2014 AHA/ACC Guideline for the Management of Patients With Valvular Heart Disease: A Report of the American College of Cardiology/American Heart Association Task Force on Clinical Practice Guidelines. Circulation. 2017;135(25):e1159-e1195. PubMed
The “Things We Do for No Reason” (TWDFNR) series reviews practices that have become common parts of hospital care but that may provide little value to our patients. Practices reviewed in the TWDFNR series do not represent “black and white” conclusions or clinical practice standards, but are meant as a starting place for research and active discussions among hospitalists and patients. We invite you to be part of that discussion. https://www.choosingwisely.org/
Oral anticoagulation (OAC) is commonly prescribed to patients with atrial fibrillation, venous thromboembolism (VTE), and mechanical heart valves (MHVs) for primary and secondary thromboembolism prevention. When patients require surgery or an invasive procedure, “bridging” anticoagulants (eg, enoxaparin) are commonly administered during the period of OAC interruption to reduce thromboembolic risk. This practice stems from small observational studies and expert opinion, which influenced several clinical guidelines despite the lack of high-quality evidence. Although prospective randomized trials of periprocedural bridging in patients with VTE and MHVs are lacking, available evidence is consistent with findings from the BRIDGE trial, which guides the following general recommendations: (1) avoid unnecessary periprocedural interruptions of OAC, especially for low bleeding risk procedures; (2) avoid the administration of periprocedural bridging anticoagulation in patients with low to moderate thromboembolic risk; (3) in patients with high thromboembolic risk, individually assess the patient-specific and procedure-specific bleeding risks versus thromboembolic risks.
A 75-year-old man with a history of hypertension, diabetes mellitus, and atrial fibrillation is admitted for surgical repair of a comminuted intertrochanteric left hip fracture. He suffered a mechanical ground-level fall without loss of consciousness. At baseline, he denies any chest pain, dyspnea on exertion, or recent change in his exercise tolerance. A physical examination is notable for stable vital signs, irregular cardiac rhythm, and a shortened and externally rotated left lower extremity with exquisite tenderness to palpation and range of motion. The patient is taking warfarin for stroke prophylaxis based on a CHA2DS2VaSc score of 4 points. The international normalized ratio (INR) is 1.9 upon admission, and surgery is planned within 48 hours, once the patient is “medically cleared.” Will this patient benefit from periprocedural bridging anticoagulation?
WHY YOU MIGHT THINK PERIPROCEDURAL “BRIDGING” ANTICOAGULATION IS HELPFUL
OAC is commonly prescribed to patients with atrial fibrillation, venous thromboembolism (VTE), and mechanical heart valves (MHVs) for the primary or secondary prevention of thromboembolic events, with more than 35 million prescriptions written annually in the United States alone.1 Many of these patients will require a temporary interruption of their OAC for surgery or an invasive procedure.2 As a result, patients may be treated with short-acting, or “bridging,” anticoagulants, such as low-molecular-weight heparin (LMWH), to minimize the duration of anticoagulation interruption and theoretically reduce their thromboembolic risk. The rationale for bridging stemmed from small observational studies and expert opinion that perceived the estimated thromboembolic risk to be higher than the estimated bleeding risk.3-5 One such example estimated that the VTE risk increased 100-fold postoperatively, whereas heparin administration only doubled the bleeding risk.3 Furthermore, clinical practice guidelines published from the American Heart Association, American College of Cardiology, European Heart Rhythm Society, and American College of Chest Physicians recommend when and how to initiate bridging anticoagulation. Clinicians have widely adopted these recommendations despite an acknowledged paucity of high-quality supporting evidence.6,7
WHY PERIPROCEDURAL “BRIDGING” ANTICOAGULATION IS MORE HARMFUL THAN HELPFUL
Periprocedural Anticoagulation Interruption is Often Not Indicated
Patients undergoing a surgical or invasive procedure may require an interruption of OAC to minimize the periprocedural bleeding risk. The decision to interrupt OAC should generally be based on the procedure-specific bleeding risk. Procedures with low bleeding risk such as cataract surgery, dermatologic biopsy (including Mohs), arthrocentesis, diagnostic gastrointestinal endoscopy, and cardiac pacemaker implantation can be performed safely without OAC interruption.5,7 Despite evidence supporting the safety of periprocedural OAC continuation, unnecessary OAC interruptions remain commonplace and are associated with increased adverse outcomes.8 The BRUISE CONTROL trial compared uninterrupted OAC to interrupted OAC with periprocedural bridging for cardiac pacemaker or defibrillator implantation in a moderate to high thromboembolic risk population. The uninterrupted OAC group experienced significantly fewer pocket hematomas, hematoma evacuations, and prolonged hospitalizations (relative risk [RR] 0.19-0.24; P < .05) without significantly increased thromboembolic events, highlighting the potential benefits of this approach.9
Nevertheless, many surgical and invasive procedures do warrant OAC interruption due to the inherent bleeding risk of the procedure or other logistical considerations. Procedures associated with an increased bleeding risk include urologic surgery (except laser lithotripsy), surgery on highly vascular organs (eg, kidney, liver, spleen), bowel resection, cardiac surgery, and intracranial or spinal surgery.7 Alternatively, some procedures with acceptably low bleeding risk (eg, colonoscopy) are routinely performed during an OAC interruption due to the fact that a high bleeding risk intervention may be necessary during the procedure (eg, polypectomy). This approach may be preferable when a significant amount of preparation is required (eg, bowel preparation) and may be a more efficient use of healthcare resources by avoiding repeat procedures.
Bridging Anticoagulation Does Not Significantly Reduce Thromboembolic Events
BRIDGE was a randomized, double-blind, placebo-controlled trial among patients with atrial fibrillation (n = 1884) requiring OAC interruption for mostly low-risk, ambulatory surgeries or invasive procedures (eg, gastrointestinal endoscopy, cardiac catheterization). Notably, thromboembolism events were rare, and there was no significant difference in thromboembolism events between patients randomized to placebo or bridging with LMWH (0.4% vs 0.3%, respectively; P = .73).14 However, the proportion of patients enrolled with the highest thromboembolic risk (ie, CHADS2 score 5-6 or prior transient ischemic attack and/or stroke) was low, potentially indicating an underestimated benefit in these patients. Major bleeding was significantly reduced in patients forgoing bridging anticoagulation (1.3% vs 3.2%; RR 0.41; 95% confidence interval, 0.20-0.78; P = .005), although bleeding occurred more frequently than thromboembolism in both groups.
Even though randomized trials assessing the safety and efficacy of bridging for VTE or MHVs have not been completed, evidence is not entirely lacking.16,17 A rigorous observational study limited to a VTE cohort (deep vein thrombosis of upper or lower extremity and/or pulmonary embolism) analyzed the effects of bridging in patients with a surgical or invasive procedure-related OAC interruption. Patients were stratified according to the American College of Chest Physicians perioperative guideline risk-stratification schema, and most VTE events (≥93%) occurred more than 12 months prior to OAC interruption.7 Importantly, the study found a nonsignificant difference in thromboembolism events between patients who were bridged and those who were not (0.0% vs 0.2%, respectively; P = .56), a very low overall thromboembolism event rate (0.2%), and a lack of correlation between events and risk-stratification category.17 In other words, all thromboembolic events occurred in the low- and moderate-risk groups, which include patients who do not warrant bridging under current guidelines. Clinically relevant bleeding occurred in 17 (0.9%) of 1812 patients studied. Notably, 15 (2.7%) of 555 patients receiving bridging suffered clinically relevant bleeding as compared with 2 (0.2%) of 1257 patients forgoing bridging anticoagulation.
The Bleeding Risk of Bridging Anticoagulation Often Outweighs the Potential Benefits
The early observational studies on LMWH bridging demonstrated that thromboembolic events are infrequent (0.4%-0.9%), whereas major bleeding events occur up to 7 times more often (0.7%-6.7%).10-12 The BRIDGE trial demonstrated comparably low thromboembolic events (0.3%). In the patients treated with bridging LMWH, major bleeding (3.2%) occurred 10 times more frequently than thromboembolism.14 Likewise, in a VTE cohort study, Clark et al.17 demonstrated “a 17-fold higher risk of bleeding without a significant difference in the rate of recurrent VTE” in patients bridged with heparin as compared with those who were not. Considering that recurrent VTE and major bleeding events have similar case-fatality rates,18 these increases in major bleeding events without reductions in thromboembolic events unmistakably tip the risk–benefit balance sharply towards an increased risk of harm.
When is bridging anticoagulation potentially helpful?
WHAT SHOULD YOU DO INSTEAD?
First, determine whether periprocedural OAC interruption is necessary for patients on chronic OAC due to atrial fibrillation, VTE, or MHVs. Avoid unwarranted OAC interruption by discussing the need for OAC interruptions with the surgeon or proceduralist, especially if the surgery is associated with a low bleeding risk and the patient has a high thromboembolic risk. When a periprocedural OAC interruption is justified, bridging should be avoided in the majority of patients, especially those with low to moderate thromboembolic risk or increased bleeding risk according to current risk-stratification schema.7,15,19
Periprocedural management of direct oral anticoagulants (DOACs) is different than that of warfarin. The duration of DOAC interruption is determined by the procedural bleeding risk, drug half-life, and a patient’s creatinine clearance. Although the pharmacokinetics of DOACs generally allow for brief interruptions (eg, 24-48 hours), longer interruptions (eg, 96-120 hours) are warranted prior to high bleeding risk procedures, when drug half-life is prolonged (ie, dabigatran), and in patients with renal impairment. Parenteral bridging anticoagulation is not recommended during brief DOAC interruptions, and substituting a DOAC in place of LMWH for bridging is not advised. The 2017 American College of Cardiology Expert Consensus Decision Pathway provides periprocedural OAC interruption guidance for atrial fibrillation, with many principles applicable to other OAC indications.15We developed an institutional guideline that provides clinicians a structured approach to bridging OAC that steers them away from inappropriate bridging and helps them make decisions when evidence is lacking. Shared decision-making represents another effective method for well-informed patients and clinicians to arrive at a mutually agreed upon bridging decision.
RECOMMENDATIONS
- Avoid unnecessary periprocedural interruptions of OAC, especially for procedures with a low bleeding risk.
- Avoid the administration of bridging anticoagulation in patients with low to moderate thromboembolic risk during periprocedural OAC interruptions.
- In patients with a high thromboembolic risk, an individualized assessment of the patient-specific and procedure-specific bleeding risks versus the thromboembolic risks is necessary when considering bridging anticoagulation administration.
CONCLUSION
Returning to the opening case, the patient requires an anticoagulation interruption and INR correction prior to surgery. Because the CHA2DS2VaSc score of 4 does not categorize him as a high thromboembolic risk, bridging anticoagulation should be avoided. In the majority of patients on OAC, bridging anticoagulation does not reduce thromboembolic events and is associated with increased major bleeding. Unnecessary anticoagulation interruptions should be avoided for procedures associated with low bleeding risk. Bridging should not be administered to the majority of patients requiring a periprocedural anticoagulation interruption.
Do
Disclosure: The authors report no conflicts of interest relevant to this article to disclose.
1. Kirley K, Qato DM, Kornfield R, Stafford RS, Alexander GC. National trends in oral anticoagulant use in the United States, 2007 to 2011. Circ Cardiovasc Qual Outcomes. 2012;5(5):615-621. PubMed
2. Steinberg BA, Peterson ED, Kim S, et al. Use and outcomes associated with bridging during anticoagulation interruptions in patients with atrial fibrillation: findings from the Outcomes Registry for Better Informed Treatment of Atrial Fibrillation (ORBIT-AF). Circulation. 2015;131(5):488-494. PubMed
3. Kearon C, Hirsh J. Management of anticoagulation before and after elective surgery. N Engl J Med. 1997;336(21):1506-1511. PubMed
4. Eckman MH. “Bridging on the river Kwai”: the perioperative management of anticoagulation therapy. Med Decis Making. 2005;25(4):370-373. PubMed
5. Dunn AS, Turpie AG. Perioperative management of patients receiving oral anticoagulants: a systematic review. Arch Intern Med. 2003;163(8):901-908. PubMed
6. January CT, Wann LS, Alpert JS, et al. 2014 AHA/ACC/HRS guideline for the management of patients with atrial fibrillation: executive summary: a report of the American College of Cardiology/American Heart Association Task Force on practice guidelines and the Heart Rhythm Society. Circulation. 2014;130(23):2071-2104. PubMed
7. Douketis JD, Spyropoulos AC, Spencer FA, et al. Perioperative management of antithrombotic therapy: Antithrombotic Therapy and Prevention of Thrombosis, 9th ed: American College of Chest Physicians Evidence-Based Clinical Practice Guidelines. Chest. 2012;141(2 Suppl):e326S-e350S. PubMed
8. Gerson LB, Gage BF, Owens DK, Triadafilopoulos G. Effect and outcomes of the ASGE guidelines on the periendoscopic management of patients who take anticoagulants. Am J Gastroenterol. 2000;95(7):1717-1724. PubMed
9. Birnie DH, Healey JS, Wells GA, et al. Pacemaker or defibrillator surgery without interruption of anticoagulation. N Engl J Med. 2013;368(22):2084-2093. PubMed
10. Douketis JD, Johnson JA, Turpie AG. Low-molecular-weight heparin as bridging anticoagulation during interruption of warfarin: assessment of a standardized periprocedural anticoagulation regimen. Arch Intern Med. 2004;164(12):1319-1326. PubMed
11. Spyropoulos AC, Turpie AG, Dunn AS, et al. Clinical outcomes with unfractionated heparin or low-molecular-weight heparin as bridging therapy in patients on long-term oral anticoagulants: the REGIMEN registry. J Thromb Haemost. 2006;4(6):1246-1252. PubMed
12. Kovacs MJ, Kearon C, Rodger M, et al. Single-arm study of bridging therapy with low-molecular-weight heparin for patients at risk of arterial embolism who require temporary interruption of warfarin. Circulation. 2004;110(12):1658-1663. PubMed
13. Siegal D, Yudin J, Kaatz S, Douketis JD, Lim W, Spyropoulos AC. Periprocedural heparin bridging in patients receiving vitamin K antagonists: systematic review and meta-analysis of bleeding and thromboembolic rates. Circulation. 2012;126(13):1630-1639. PubMed
14. Douketis JD, Spyropoulos AC, Kaatz S, et al. Perioperative Bridging Anticoagulation in Patients with Atrial Fibrillation. N Engl J Med. 2015;373(9):823-833. PubMed
15. Doherty JU, Gluckman TJ, Hucker WJ, et al. 2017 ACC Expert Consensus Decision Pathway for Periprocedural Management of Anticoagulation in Patients With Nonvalvular Atrial Fibrillation: A Report of the American College of Cardiology Clinical Expert Consensus Document Task Force. J Am Coll Cardiol. 2017;69(7):871-898. PubMed
16. Daniels PR, McBane RD, Litin SC, et al. Peri-procedural anticoagulation management of mechanical prosthetic heart valve patients. Thromb Res. 2009;124(3):300-305. PubMed
17. Clark NP, Witt DM, Davies LE, et al. Bleeding, Recurrent Venous Thromboembolism, and Mortality Risks During Warfarin Interruption for Invasive Procedures. JAMA Intern Med. 2015;175(7):1163-1168. PubMed
18. Carrier M, Le Gal G, Wells PS, Rodger MA. Systematic review: case-fatality rates of recurrent venous thromboembolism and major bleeding events among patients treated for venous thromboembolism. Ann Intern Med. 2010;152(9):578-589. PubMed
19. Nishimura RA, Otto CM, Bonow RO, et al. 2017 AHA/ACC Focused Update of the 2014 AHA/ACC Guideline for the Management of Patients With Valvular Heart Disease: A Report of the American College of Cardiology/American Heart Association Task Force on Clinical Practice Guidelines. Circulation. 2017;135(25):e1159-e1195. PubMed
© 2018 Society of Hospital Medicine
The Authors Reply, “The Weekend Effect in Hospitalized Patients”
We would like to thank Drs. Flansbaum and Sheehy for their interest in our article.1 We appreciate their mentioning the highly publicized disputes and additional manuscripts2,3 that were published after our literature review, which was conducted in 2013
Despite the uncertainty surrounding the exact composition and contributions of various elements to the weekend effect, it does appear to be a real phenomenon, as noted by the editorialists.4 We hope that our manuscript encourages future investigators to help elucidate the nature of the input contributing to the weekend effect.
1. Pauls LA, Johnson-Paben R, McGready J, Murphy JD, Pronovost PJ, Wu CL. The weekend effect in hospitalized patients: A meta-analysis. J Hosp Med. 2017;12(9):760-766. PubMed
2. Freemantle N, Ray D, McNulty D, et al. Increased mortality associated with weekend hospital admission: a case for expanded seven day service? BMJ. 2015;351:h4596. PubMed
3. Walker AS, Mason A, Phoung Quan TP, et al. Mortality risks associated with emergency admissions during weekends and public holidays: An analysis of electronic health records. Lancet. 2017;390(10089):62-72. PubMed
4. Quinn KL, Bell CM. Does the week-end justify the means? J Hosp Med. 2017;12(9):779-780. PubMed
We would like to thank Drs. Flansbaum and Sheehy for their interest in our article.1 We appreciate their mentioning the highly publicized disputes and additional manuscripts2,3 that were published after our literature review, which was conducted in 2013
Despite the uncertainty surrounding the exact composition and contributions of various elements to the weekend effect, it does appear to be a real phenomenon, as noted by the editorialists.4 We hope that our manuscript encourages future investigators to help elucidate the nature of the input contributing to the weekend effect.
1. Pauls LA, Johnson-Paben R, McGready J, Murphy JD, Pronovost PJ, Wu CL. The weekend effect in hospitalized patients: A meta-analysis. J Hosp Med. 2017;12(9):760-766. PubMed
2. Freemantle N, Ray D, McNulty D, et al. Increased mortality associated with weekend hospital admission: a case for expanded seven day service? BMJ. 2015;351:h4596. PubMed
3. Walker AS, Mason A, Phoung Quan TP, et al. Mortality risks associated with emergency admissions during weekends and public holidays: An analysis of electronic health records. Lancet. 2017;390(10089):62-72. PubMed
4. Quinn KL, Bell CM. Does the week-end justify the means? J Hosp Med. 2017;12(9):779-780. PubMed
© 2018 Society of Hospital Medicine