User login
A 71-year-old woman with shock and a high INR
A 71-year-old woman is brought to the emergency department by her neighbor after complaining of fatigue and light-headedness for the last 8 hours. The patient lives alone and was feeling well when she woke up this morning, but then began to feel nauseated and vomited twice.
The patient appears drowsy and confused and cannot provide any further history. Her medical records show that she was seen in the cardiology clinic 6 months ago but has not kept her appointments since then.
Her medical history includes atrial fibrillation, hypertension, type 2 diabetes mellitus, and osteoarthritis. Her medications are daily warfarin, atenolol, aspirin, candesartan, and metformin, and she takes acetaminophen as needed. She is neither a smoker nor a drug user, but she drinks alcohol occasionally. Her family history is significant for her mother’s death from breast cancer at age 55.
The neighbor confirms that the patient appeared well this morning and has not had any recent illnesses except for a minor cold last week that improved over 5 days with acetaminophen only.
INITIAL EVALUATION AND MANAGEMENT
Physical examination
On physical examination, her blood pressure is 80/40 mm Hg, respiratory rate 25 breaths per minute, oral temperature 38.3°C (100.9°F), and heart rate 130 beats per minute and irregular.
Her neck veins are flat, and her chest is clear to auscultation with normal heart sounds. Abdominal palpation elicits discomfort in the middle segments, voluntary withdrawal, and abdominal wall rigidity. Her skin feels dry and cool, with decreased turgor.
Initial treatment
The patient is given 1 L of 0.9% saline intravenously over the first hour and then is transferred to the intensive care unit, where a norepinephrine drip is started to treat her ongoing hypotension. Normal saline is continued at a rate of 500 mL per hour for the next 4 hours.
Cardiac monitoring and 12-lead electrocardiography show atrial fibrillation with a rapid ventricular response of 138 beats per minute, but electrical cardioversion is not done.
Initial laboratory tests

Of note, her international normalized ratio (INR) is 6.13, while the therapeutic range for a patient taking warfarin because of atrial fibrillation is 2.0 to 3.0.
Her blood pH is 7.34 (reference range 7.35–7.45), and her bicarbonate level is 18 mmol/L (22–26); a low pH and low bicarbonate together indicate metabolic acidosis. Her sodium level is 128 mmol/L (135–145), her chloride level is 100 mmol/L (97–107), and, as mentioned, her bicarbonate level is 18 mmol/L; therefore, her anion gap is 128 – (100 + 18) = 10 mmol/L, which is normal (≤ 10).1
Her serum creatinine level is 1.3 mg/dL (0.5–1.1), and her blood urea nitrogen level is 35 mg/dL (7–20).
Her potassium level is 5.8 mmol/L, which is consistent with hyperkalemia (reference range 3.5–5.2).
DIFFERENTIAL DIAGNOSIS
1. Which of the following is the most likely cause of this patient’s symptoms?
- Adrenal crisis
- Cardiogenic shock due to decreased cardiac contractility
- Intracranial hemorrhage
- Acute abdomen due to small bowel obstruction
- Septic shock due to bacterial toxin-induced loss of vascular tone
Our patient is presenting with shock. Given our inability to obtain a meaningful history, the differential diagnosis is broad and includes all of the above.
Adrenal crisis
The sudden onset and laboratory results that include hyperkalemia, hyponatremia, and normal anion gap metabolic acidosis raise suspicion of adrenal crisis resulting in acute mineralocorticoid and glucocorticoid insufficiency.1
The patient’s elevated serum creatinine and high blood urea nitrogen-to-creatinine ratio of 26.9 (reference range 10–20) also suggest intravascular volume contraction. Her low hemoglobin level and supratherapeutic INR, possibly due to an interaction between warfarin and acetaminophen combined with poor medical follow-up, raise suspicion of acute bilateral adrenal necrosis due to hemorrhage.

Bilateral adrenal hemorrhage is one cause of adrenal crisis resulting in bilateral adrenal necrosis. Risk factors for adrenal hemorrhage include anticoagulation therapy, underlying coagulopathy, postoperative states, and certain infections such as meningococcemia and Haemophilus influenzae infection.2–5 Nevertheless, in most cases the INR is in the therapeutic range and the patient has no bleeding elsewhere.4 Other causes of adrenal necrosis include emboli, sepsis, and blunt trauma.6,7
Other causes of adrenal crisis are listed in Table 3.
Cardiogenic shock

Intracranial hemorrhage
Intracranial hemorrhage can present with a decreased level of consciousness, but it is less likely to cause hypotension, as the cranial space is limited. If massive intracranial hemorrhage would occur, the increase in intracranial pressure would more likely cause hypertension by the Cushing reflex than hypotension.
Acute abdomen
Abdominal pain and rigidity along with fever can be presenting symptoms of both adrenal insufficiency and an acute abdomen due to intestinal obstruction.4 However, intestinal obstruction typically causes a high anion gap metabolic acidosis due to lactic acidosis, instead of the normal anion gap metabolic acidosis present in this patient.8 Moreover, her deranged electrolytes, supratherapeutic INR, and absence of previous gastroenterologic conditions make adrenal crisis a more likely diagnosis.
Septic shock
Septic shock would also cause fever and hypotension as bacterial toxins induce a pyrexic response and vasodilation. However, at such an early stage of sepsis, the patient would be expected to be warm and hyperemic, whereas this patient’s skin is cool and dry due to volume depletion secondary to adrenal insufficiency.9 Sepsis would also cause a high anion gap metabolic acidosis due to lactic acidosis, as opposed to this patient’s normal anion gap metabolic acidosis. These findings, along with the metabolic derangements and the absence of a focus of infection, make sepsis a less likely possibility.
CASE CONTINUED: CARDIOMEGALY, PERSISTENT HYPOTENSION
Blood is drawn for cultures and measurement of troponins and lactic acid, and urine samples are taken for culture and biochemical analysis. Chest radiography shows mild cardiomegaly. The patient is started empirically on vancomycin and cefepime, and her warfarin is discontinued.
Five hours after presenting to the emergency department, her blood pressure remains at 80/40 mm Hg even after receiving 3 L of normal saline intravenously.
PROMPT MANAGEMENT OF ADRENAL CRISIS
2. Which of the following is the most appropriate next step in managing this patient?
- Draw samples for serum cortisol and plasma adrenocorticotropic hormone (ACTH) levels, then give hydrocortisone 100 mg intravenously
- Perform abdominal computed tomography (CT) without contrast
- Perform transthoracic echocardiography
- Increase the norepinephrine infusion
- Immediately give fludrocortisone
First give fluids
The first step in managing a patient with suspected adrenal crisis is liberal intravenous fluid administration to replenish the depleted intravascular space. The amount and choice of fluid is empiric, but a recommendation is 1 L of normal saline or dextrose 5% in normal saline, infused quickly over the first hour and then titrated according to the patient’s fluid status.10
Measure cortisol and ACTH; start corticosteroids immediately
Immediate therapy with an appropriate stress dose of intravenous corticosteroids (eg, hydrocortisone 100 mg) is essential. However, this should be done after drawing blood for cortisol and ACTH measurements.10
Do not delay corticosteroid therapy while awaiting the results of the diagnostic tests.

In addition, in the early phase of evolving primary adrenal insufficiency, measurement of plasma renin and aldosterone levels may be beneficial, as mineralocorticoid deficiency may predominate.10,12,13
One of the most important aims of early corticosteroid supplementation is to prevent further hyponatremia by reducing a reactive increase in antidiuretic hormone secretion caused by cortisol deficiency. Corticosteroids also help to restore normal blood pressure by increasing vascular tone, as glucocorticoid receptor activation potentiates the vasoconstrictor actions of norepinephrine, angiotensin II, and other vasoconstrictors.14,15
Which corticosteroid to use?
Which corticosteroid to use in previously undiagnosed adrenal insufficiency is controversial. The Endocrine Society10 and Japan Endocrine Society16 clinical practice guidelines recommend hydrocortisone in a 100-mg intravenous bolus followed by 200 mg over 24 hours.
The choice of hydrocortisone is justified by its superior mineralocorticoid activity.10,16 Further, hydrocortisone is preferred over dexamethasone if the patient is known to have primary adrenal insufficiency, or if the serum potassium level is higher than 6.0 mmol/L.
Some clinicians, on the other hand, recommend dexamethasone, given as a 4-mg intravenous bolus followed by 4-mg boluses every 12 hours. Their rationale is that dexamethasone, unlike hydrocortisone, does not interfere with subsequent serum cortisol assays if the patient later undergoes ACTH stimulation testing.17 Dexamethasone may also be preferred to minimize unwanted mineralocorticoid effects, such as in neurosurgical patients at risk of brain edema.
If hydrocortisone is used, ACTH stimulation testing can be done after withholding hydrocortisone for 24 hours once the patient is stable. (It should be restarted after the test if the results are abnormal.)
Other possible steps
Abdominal CT should be done in our patient to address the possibility of bilateral adrenal hemorrhage. However, it is preferable to wait until the patient is stabilized.
Echocardiography. Our patient is likely to have an element of cardiac failure, given her hypertension and cardiomegaly. However, decompensated heart failure is probably not the cause of her presentation. Thus, the first priority is to treat her adrenal crisis, and echocardiography should be deferred.
Increasing the norepinephrine infusion is unlikely to improve her blood pressure very much, as she is significantly volume-depleted. Further, low cortisol decreases the vascular response to norepinephrine.15
Mineralocorticoids such as fludrocortisone are used to treat primary adrenal insufficiency. However, they are not required during acute management of adrenal crisis, as 40 mg of hydrocortisone offers mineralocorticoid activity equivalent to 100 µg of fludrocortisone. Thus, the high doses of hydrocortisone used to treat adrenal crisis provide adequate mineralocorticoid therapy.10,18
If dexamethasone is used, its effect along with normal saline supplementation would be sufficient to replete the intravenous space and bring the sodium level back up to normal in the acute setting.
CASE RESUMED: IMPROVEMENT WITH HYDROCORTISONE
The patient’s blood is drawn for serum cortisol and plasma ACTH measurements. A 100-mg intravenous bolus of hydrocortisone is given, followed by a 50-mg bolus every 6 hours until the patient stabilizes.
Twenty-four hours later, the patient states that she has more energy, and her appetite has improved. The norepinephrine infusion is stopped 48 hours after presentation, at which time her blood pressure is 120/70 mm Hg, heart rate 85 beats per minute and irregular, and temperature 36.7°C (98.1°F). Her current laboratory values include the following:
- Serum sodium 137 mmolL
- Serum potassium 4.3 mmol/L
- Hemoglobin 9.3 g/dL
- Serum cortisol (random) 7.2 μg/dL
- Plasma ACTH 752 pg/mL (10–60 pg/mL).
ESTABLISHING THE DIAGNOSIS OF ADRENAL INSUFFICIENCY
3. Which of the following is the most appropriate test to establish the diagnosis of adrenal insufficiency?
- 7 am total serum cortisol measurement
- Random serum cortisol measurement
- 7 am salivary cortisol measurement
- 24-hour urinary free cortisol measurement
- ACTH stimulation test for cortisol
- Insulin tolerance test for cortisol

These tests also help determine the type of adrenal insufficiency (primary, secondary, or tertiary) and guide further management. Secondary adrenal insufficiency is caused by inadequate pituitary ACTH secretion and subsequent inadequate cortisol production, whereas tertiary adrenal insufficiency is caused by inadequate hypothalamic corticotropin-releasing hormone secretion and subsequent inadequate ACTH and cortisol production. The diagnosis of adrenal insufficiency relies first on demonstrating inappropriately low total serum cortisol production. Subsequently, serum ACTH helps to differentiate between primary (high ACTH) and secondary or tertiary (low or inappropriately normal ACTH) adrenal insufficiency.
Each test listed above may demonstrate a low cortisol level. However, in a nonacute setting, safety concerns (especially regarding insulin tolerance testing), poor diagnostic value, feasibility (ie, the difficulty of 24-hour tests), and poor sensitivity of 7 am cortisol make the ACTH stimulation test the most appropriate test in clinical practice to establish the diagnosis of adrenal insufficiency.
7 am serum cortisol measurement
Measuring the serum cortisol level early in the morning in the nonacute setting could be of diagnostic value, as an extremely low value (< 3–5 μg/dL) is almost 100% specific for adrenal insufficiency in the absence of concurrent exogenous steroid intake. However, the very low cutoff for this test causes poor sensitivity (about 33%), as many patients have partial adrenal insufficiency and hence have higher serum cortisol levels that may even be in the normal physiologic range.19–22
Random serum cortisol measurements
Random serum cortisol measurements are not very useful in a nonacute setting, since cortisol levels are affected by factors such as stress and hydration status. Moreover, they fluctuate during the day in a circadian rhythm.
On the other hand, random serum cortisol is a very good test to evaluate for adrenal insufficiency in the acute setting. A random value higher than 15 to 18 μg/dL is almost always associated with adequate adrenal function and generally rules out adrenal insufficiency.11,23,24
7 am salivary cortisol measurement
The same principle applies to early morning salivary cortisol. Only extremely low values (< 2.65 ng/mL) may distinguish patients with adrenal insufficiency from healthy individuals, with 97.1% sensitivity and 93.3% specificity.25
Of note, early morning salivary cortisol is not routinely measured in most clinical practices for evaluation of adrenal function. Hence, morning serum and morning salivary cortisol are useful screening tools and have meaningful results when their values are in the extremes of the spectrum, but they are not reliable as a single test, as they may overlook patients with partial adrenal insufficiency.
Urinary cortisol measurement
Urinary cortisol measurement is not used to diagnose adrenal insufficiency, as values can be normal in patients with partial adrenal insufficiency.
The ACTH stimulation test
The ACTH stimulation test involves an intramuscular or intravenous injection of cosyntropin (a synthetic analogue of ACTH fragment 1–24 that has the full activity of native ACTH) and measuring total serum cortisol at baseline, 30 minutes, and 60 minutes to assess the response of the adrenal glands.
The test can be done using a high or low dose of cosyntropin. The Endocrine Society’s 2016 guidelines recommend the high dose (250 μg) for most patients.10 The standard high-dose stimulation test can be done at any time during the day.26 If the cosyntropin is injected intravenously, any value higher than 18 to 20 μg/dL indicates normal adrenal function and excludes adrenal insufficiency.27,28 If intramuscular injection is used, any value higher than 16 to 18 μg/dL at 30 minutes post-consyntropin excludes adrenal insufficiency.29
The ACTH stimulation test may not exclude acute secondary or tertiary adrenal insufficiency.
Insulin tolerance testing
Insulin tolerance testing remains the gold standard for diagnosing adrenal insufficiency and assessing the integrity of the pituitary-adrenal axis. However, given its difficulty to perform, safety concerns, and the availability of other reliable tests, its use in clinical practice is limited. It is nonetheless useful in assessing patients with recent onset of ACTH deficiency.30,31
CASE RESUMED: PATIENT DISCHARGED, LOST TO FOLLOW-UP
Abdominal CT without contrast is done and demonstrates bilateral adrenal hemorrhage. Thus, the patient is diagnosed with primary acute adrenal insufficiency due to adrenal necrosis.
She is started on oral hydrocortisone and fludrocortisone after intravenous hydrocortisone is discontinued. She is counseled about adhering to medications, wearing a medical alert bracelet, giving herself emergency cortisol injections, taking higher doses of hydrocortisone if she is ill, and monitoring her INR. She is discharged home after her symptoms resolve.
The patient does not keep her scheduled appointment and is lost to follow-up. She returns 2 years later complaining of fatigue and feeling unwell. She admits that she stopped taking hydrocortisone 1 year ago after reading an online article about corticosteroid side effects. She has continued to take fludrocortisone.
MINERALOCORTICOID VS CORTICOSTEROID DEFICIENCY

4. Which of the following is least likely to be present in this patient at this time?
- Intravascular volume depletion
- Hyponatremia
- Skin hyperpigmentation
- Normokalemia
- Elevated serum ACTH level
Intravascular volume depletion
Intravascular volume depletion is the least likely to be present. This is because intravascular volume depletion is mainly secondary to mineralocorticoid deficiency rather than corticosteroid deficiency, which is not present in this patient, as she is compliant with her mineralocorticoid replacement therapy.32,33 However, even with sufficient mineralocorticoid replacement, mild hypotension may be present in this patient due to corticosteroid deficiency-induced loss of vascular tone.
Hyponatremia
Hyponatremia in adrenal insufficiency is not due only to mineralocorticoid deficiency. Patients with secondary or tertiary adrenal insufficiency may also exhibit hyponatremia.34 ACTH deficiency in such patients is not expected to cause mineralocorticoid deficiency, as ACTH has only a minor role in aldosterone production.
It has been proposed that hyponatremia in secondary adrenal insufficiency is due to cortisol deficiency resulting in an increase of antidiuretic hormone secretion.35,36 The mechanisms for increased antidiuretic hormone include cortisol deficiency resulting in an increased corticotropin-releasing hormone level, which acts as an antidiuretic hormone secretagogue,37,38 and cortisol directly suppressing antidiuretic hormone secretion.39
In our patient, volume expansion and hyponatremia are expected due to increased antidiuretic hormone secretion as a result of corticosteroid insufficiency.
Hyperpigmentation
Hyperpigmentation of the skin is present only in long-standing primary adrenal insufficiency. This is due to chronic cortisol deficiency causing an increased secretion of pro-opiomelanocortin, a prohormone that is cleaved into ACTH, melanocyte-stimulating hormone, and other hormones. Melanocyte-stimulating hormone causes skin hyperpigmentation due to increased melanin synthesis.40 The hyperpigmentation is seen in sun-exposed areas, pressure areas, palmar creases, nipples, and mucous membranes.
This patient has long-standing corticosteroid deficiency due to noncompliance and primary adrenal insufficiency, and as a result she is expected to have elevated serum ACTH and hyperpigmentation.
Normokalemia
Mineralocorticoid deficiency results in hyperkalemia and metabolic acidosis by impairing renal excretion of potassium and acid.41 This patient is compliant with her mineralocorticoid replacement regimen; thus, potassium levels and pH are expected to be normal.
TAKE-HOME POINTS
- Suspect adrenal crisis in any patient who presents with shock.
- Acute abdomen or unexplained fever could be among the manifestations.
- Initial management requires liberal normal saline intravenous fluid administration to replete the intravascular space.
- Draw blood samples for serum chemistry, cortisol, and ACTH, followed immediately by intravenous hydrocortisone supplementation.
- In critically ill patients, evaluate adrenal function with random serum cortisol; in a nonacute setting use the ACTH stimulation test.
- Chronic management of primary adrenal insufficiency requires corticosteroid and mineralocorticoid therapy.
- Mani S, Rutecki GW. A patient with altered mental status and an acid-base disturbance. Cleve Clin J Med 2017; 84(1):27–34. doi:10.3949/ccjm.84a.16042
- Almiani M, Gorthi J, Subbiah S, Firoz M. Quiz page November 2012: an unusual case of acute hyponatremia and normal anion gap metabolic acidosis. Am J Kidney Dis 2012; 60(5):xxxiii–xxxvi. doi:10.1053/j.ajkd.2012.05.026
- Migeon CJ, Kenny FM, Hung W, Voorhess ML. Study of adrenal function in children with meningitis. Pediatrics 1967; 40(2):163–183.
- Rao RH, Vagnucci AH, Amico JA. Bilateral massive adrenal hemorrhage: early recognition and treatment. Ann Intern Med 1989; 110(3):227–235.
- Shimizu S, Tahara Y, Atsumi T, et al. Waterhouse-Friderichsen syndrome caused by invasive Haemophilus influenzae type B infection in a previously healthy young man. Anaesth Intensive Care 2010; 38(1):214–215.
- Castaldo ET, Guillamondegui OD, Greco JA 3rd, Feurer ID, Miller RS, Morris JA Jr. Are adrenal injuries predictive of adrenal insufficiency in patients sustaining blunt trauma? Am Surg 2008; 74(3):262–266.
- Xarli VP, Steele AA, Davis PJ, Buescher ES, Rios CN, Garcia-Bunuel R. Adrenal hemorrhage in the adult. Medicine (Baltimore) 1978; 57(3):211–221.
- Takeuchi K, Tsuzuki Y, Ando T, et al. Clinical studies of strangulating small bowel obstruction. Am Surg 2004; 70(1):40–44.
- MacKenzie IM. The haemodynamics of human septic shock. Anaesthesia 2001; 56(2):130–144.
- Bornstein SR, Allolio B, Arlt W, et al. Diagnosis and treatment of primary adrenal insufficiency: an Endocrine Society clinical practice guideline. J Clin Endocrinol Metab 2016; 101(2):364–389. doi:10.1210/jc.2015-1710
- Hamrahian AH, Fleseriu M; AACE Adrenal Scientific Committee. Evaluation and management of adrenal insufficiency in critically ill patients: disease state review. Endocr Pract 2017; 23(6):716–725. doi:10.4158/EP161720.RA
- Saenger P, Levine LS, Irvine WJ, et al. Progressive adrenal failure in polyglandular autoimmune disease. J Clin Endocrinol Metab 1982; 54(4):863–867.
- Coco G, Dal Pra C, Presotto F, et al. Estimated risk for developing autoimmune Addison's disease in patients with adrenal cortex autoantibodies. J Clin Endocrinol Metab 2006; 91(5):1637–1645. doi:10.1210/jc.2005-0860
- Ullian ME. The role of corticosteroids in the regulation of vascular tone. Cardiovasc Res 1999; 41(1):55–64.
- Yang S, Zhang L. Glucocorticoids and vascular reactivity. Curr Vasc Pharmacol 2004; 2(1):1–12.
- Yanase T, Tajima T, Katabami T, et al. Diagnosis and treatment of adrenal insufficiency including adrenal crisis: a Japan Endocrine Society clinical practice guideline [Opinion]. Endocr J 2016; 63(9):765–784. doi:10.1507/endocrj.EJ16-0242
- Taylor RL, Grebe SK, Singh RJ. Quantitative, highly sensitive liquid chromatography-tandem mass spectrometry method for detection of synthetic corticosteroids. Clin Chem 2004; 50(10):2345–2352. doi:10.1373/clinchem.2004.033605
- Goldfien A, Laidlaw JC, Haydar NA, Renold AE, Thorn GW. Fluorohydrocortisone and chlorohydrocortisone, highly potent derivatives of compound F. N Engl J Med 1955; 252(11):415–421. doi:10.1056/NEJM195503172521101
- Jenkins D, Forsham PH, Laidlaw JC, Reddy WJ, Thorn GW. Use of ACTH in the diagnosis of adrenal cortical insufficiency. Am J Med 1955; 18(1):3–14.
- Hägg E, Asplund K, Lithner F. Value of basal plasma cortisol assays in the assessment of pituitary-adrenal insufficiency. Clin Endocrinol (Oxf) 1987; 26(2):221–226.
- Deutschbein T, Unger N, Mann K, Petersenn S. Diagnosis of secondary adrenal insufficiency: unstimulated early morning cortisol in saliva and serum in comparison with the insulin tolerance test. Horm Metab Res 2009; 41(4):834–839. doi:10.1055/s-0029-1225630
- Erturk E, Jaffe CA, Barkan AL. Evaluation of the integrity of the hypothalamic-pituitary-adrenal axis by insulin hypoglycemia test. J Clin Endocrinol Metab 1998; 83(7):2350–2354.
- Cooper MS, Stewart PM. Corticosteroid insufficiency in acutely ill patients. N Engl J Med 2003; 348(8):727–734. doi:10.1056/NEJMra020529
- Dellinger RP, Levy MM, Rhodes A, et al; Surviving Sepsis Campaign Guidelines Committee including the Pediatric Subgroup. Surviving Sepsis Campaign: international guidelines for management of severe sepsis and septic shock, 2012. Intensive Care Med 2013; 39(2):165–228. doi:10.1007/s00134-012-2769-8
- Ceccato F, Barbot M, Zilio M, et al. Performance of salivary cortisol in the diagnosis of Cushing's syndrome, adrenal incidentaloma, and adrenal insufficiency. Eur J Endocrinol 2013; 169(1):31–36. doi:10.1530/EJE-13-0159
- Dickstein G, Shechner C, Nicholson WE, et al. Adrenocorticotropin stimulation test: effects of basal cortisol level, time of day, and suggested new sensitive low dose test. J Clin Endocrinol Metab 1991; 72(4):773–778. doi:10.1210/jcem-72-4-773
- May ME, Carey RM. Rapid adrenocorticotropic hormone test in practice. Retrospective review. Am J Med 1985; 79(6):679–884.
- Speckart PF, Nicoloff JT, Bethune JE. Screening for adrenocortical insufficiency with cosyntropin (synthetic ACTH). Arch Intern Med 1971; 128(5):761–763.
- Peechakara S, Bena J, Clarke NJ, et al. Total and free cortisol levels during 1 μg, 25 μg, and 250 μg cosyntropin stimulation tests compared to insulin tolerance test: results of a randomized, prospective, pilot study. Endocrine 2017; 57(3):388–393. doi:10.1007/s12020-017-1371-9
- Finucane FM, Liew A, Thornton E, Rogers B, Tormey W, Agha A. Clinical insights into the safety and utility of the insulin tolerance test (ITT) in the assessment of the hypothalamo-pituitary-adrenal axis. Clin Endocrinol (Oxf) 2008; 69(4):603–607. doi:10.1111/j.1365-2265.2008.03240.x
- Lindholm J, Kehlet H. Re-evaluation of the clinical value of the 30 min ACTH test in assessing the hypothalamic-pituitary-adrenocortical function. Clin Endocrinol (Oxf) 1987; 26(1):53–59.
- Charmandari E, Nicolaides NC, Chrousos GP. Adrenal insufficiency. Lancet 2014; 383(9935):2152–2167. doi:10.1016/S0140-6736(13)61684-0
- Burke CW. Adrenocortical insufficiency. Clin Endocrinol Metab 1985; 14(4):947–976.
- Jessani N, Jehangir W, Behman D, Yousif A, Spiler IJ. Secondary adrenal insufficiency: an overlooked cause of hyponatremia. J Clin Med Res 2015; 7(4):286–288. doi:10.14740/jocmr2041w
- Oelkers W. Hyponatremia and inappropriate secretion of vasopressin (antidiuretic hormone) in patients with hypopituitarism. N Engl J Med 1989; 321(8):492–496. doi:10.1056/NEJM198908243210802
- Ishikawa S, Schrier RW. Effect of arginine vasopressin antagonist on renal water excretion in glucocorticoid and mineralocorticoid deficient rats. Kidney Int 1982; 22(6):587–593.
- Wolfson B, Manning RW, Davis LG, Arentzen R, Baldino F Jr. Co-localization of corticotropin releasing factor and vasopressin mRNA in neurones after adrenalectomy. Nature 1985; 315(6014):59–61.
- Kalogeras KT, Nieman LK, Friedman TC, et al. Inferior petrosal sinus sampling in healthy subjects reveals a unilateral corticotropin-releasing hormone-induced arginine vasopressin release associated with ipsilateral adrenocorticotropin secretion. J Clin Invest 1996; 97:2045–2050.
- Kovacs KJ, Foldes A, Sawchenko PE. Glucocorticoid negative feedback selectively targets vasopressin transcription in parvocellular neurosecretory neurons. J Neurosci 2000; 20:3843–3852.
- Sarkar SB, Sarkar S, Ghosh S, Bandyopadhyay S. Addison's disease. Contemp Clin Dent 2012; 3(4):484–486. doi:10.4103/0976-237X.107450
- Szylman P, Better OS, Chaimowitz C, Rosler A. Role of hyperkalemia in the metabolic acidosis of isolated hypoaldosteronism. N Engl J Med 1976; 294(7):361–365. doi:10.1056/NEJM197602122940703
A 71-year-old woman is brought to the emergency department by her neighbor after complaining of fatigue and light-headedness for the last 8 hours. The patient lives alone and was feeling well when she woke up this morning, but then began to feel nauseated and vomited twice.
The patient appears drowsy and confused and cannot provide any further history. Her medical records show that she was seen in the cardiology clinic 6 months ago but has not kept her appointments since then.
Her medical history includes atrial fibrillation, hypertension, type 2 diabetes mellitus, and osteoarthritis. Her medications are daily warfarin, atenolol, aspirin, candesartan, and metformin, and she takes acetaminophen as needed. She is neither a smoker nor a drug user, but she drinks alcohol occasionally. Her family history is significant for her mother’s death from breast cancer at age 55.
The neighbor confirms that the patient appeared well this morning and has not had any recent illnesses except for a minor cold last week that improved over 5 days with acetaminophen only.
INITIAL EVALUATION AND MANAGEMENT
Physical examination
On physical examination, her blood pressure is 80/40 mm Hg, respiratory rate 25 breaths per minute, oral temperature 38.3°C (100.9°F), and heart rate 130 beats per minute and irregular.
Her neck veins are flat, and her chest is clear to auscultation with normal heart sounds. Abdominal palpation elicits discomfort in the middle segments, voluntary withdrawal, and abdominal wall rigidity. Her skin feels dry and cool, with decreased turgor.
Initial treatment
The patient is given 1 L of 0.9% saline intravenously over the first hour and then is transferred to the intensive care unit, where a norepinephrine drip is started to treat her ongoing hypotension. Normal saline is continued at a rate of 500 mL per hour for the next 4 hours.
Cardiac monitoring and 12-lead electrocardiography show atrial fibrillation with a rapid ventricular response of 138 beats per minute, but electrical cardioversion is not done.
Initial laboratory tests
Of note, her international normalized ratio (INR) is 6.13, while the therapeutic range for a patient taking warfarin because of atrial fibrillation is 2.0 to 3.0.
Her blood pH is 7.34 (reference range 7.35–7.45), and her bicarbonate level is 18 mmol/L (22–26); a low pH and low bicarbonate together indicate metabolic acidosis. Her sodium level is 128 mmol/L (135–145), her chloride level is 100 mmol/L (97–107), and, as mentioned, her bicarbonate level is 18 mmol/L; therefore, her anion gap is 128 – (100 + 18) = 10 mmol/L, which is normal (≤ 10).1
Her serum creatinine level is 1.3 mg/dL (0.5–1.1), and her blood urea nitrogen level is 35 mg/dL (7–20).
Her potassium level is 5.8 mmol/L, which is consistent with hyperkalemia (reference range 3.5–5.2).
DIFFERENTIAL DIAGNOSIS
1. Which of the following is the most likely cause of this patient’s symptoms?
- Adrenal crisis
- Cardiogenic shock due to decreased cardiac contractility
- Intracranial hemorrhage
- Acute abdomen due to small bowel obstruction
- Septic shock due to bacterial toxin-induced loss of vascular tone
Our patient is presenting with shock. Given our inability to obtain a meaningful history, the differential diagnosis is broad and includes all of the above.
Adrenal crisis
The sudden onset and laboratory results that include hyperkalemia, hyponatremia, and normal anion gap metabolic acidosis raise suspicion of adrenal crisis resulting in acute mineralocorticoid and glucocorticoid insufficiency.1
The patient’s elevated serum creatinine and high blood urea nitrogen-to-creatinine ratio of 26.9 (reference range 10–20) also suggest intravascular volume contraction. Her low hemoglobin level and supratherapeutic INR, possibly due to an interaction between warfarin and acetaminophen combined with poor medical follow-up, raise suspicion of acute bilateral adrenal necrosis due to hemorrhage.
Bilateral adrenal hemorrhage is one cause of adrenal crisis resulting in bilateral adrenal necrosis. Risk factors for adrenal hemorrhage include anticoagulation therapy, underlying coagulopathy, postoperative states, and certain infections such as meningococcemia and Haemophilus influenzae infection.2–5 Nevertheless, in most cases the INR is in the therapeutic range and the patient has no bleeding elsewhere.4 Other causes of adrenal necrosis include emboli, sepsis, and blunt trauma.6,7
Other causes of adrenal crisis are listed in Table 3.
Cardiogenic shock
Intracranial hemorrhage
Intracranial hemorrhage can present with a decreased level of consciousness, but it is less likely to cause hypotension, as the cranial space is limited. If massive intracranial hemorrhage would occur, the increase in intracranial pressure would more likely cause hypertension by the Cushing reflex than hypotension.
Acute abdomen
Abdominal pain and rigidity along with fever can be presenting symptoms of both adrenal insufficiency and an acute abdomen due to intestinal obstruction.4 However, intestinal obstruction typically causes a high anion gap metabolic acidosis due to lactic acidosis, instead of the normal anion gap metabolic acidosis present in this patient.8 Moreover, her deranged electrolytes, supratherapeutic INR, and absence of previous gastroenterologic conditions make adrenal crisis a more likely diagnosis.
Septic shock
Septic shock would also cause fever and hypotension as bacterial toxins induce a pyrexic response and vasodilation. However, at such an early stage of sepsis, the patient would be expected to be warm and hyperemic, whereas this patient’s skin is cool and dry due to volume depletion secondary to adrenal insufficiency.9 Sepsis would also cause a high anion gap metabolic acidosis due to lactic acidosis, as opposed to this patient’s normal anion gap metabolic acidosis. These findings, along with the metabolic derangements and the absence of a focus of infection, make sepsis a less likely possibility.
CASE CONTINUED: CARDIOMEGALY, PERSISTENT HYPOTENSION
Blood is drawn for cultures and measurement of troponins and lactic acid, and urine samples are taken for culture and biochemical analysis. Chest radiography shows mild cardiomegaly. The patient is started empirically on vancomycin and cefepime, and her warfarin is discontinued.
Five hours after presenting to the emergency department, her blood pressure remains at 80/40 mm Hg even after receiving 3 L of normal saline intravenously.
PROMPT MANAGEMENT OF ADRENAL CRISIS
2. Which of the following is the most appropriate next step in managing this patient?
- Draw samples for serum cortisol and plasma adrenocorticotropic hormone (ACTH) levels, then give hydrocortisone 100 mg intravenously
- Perform abdominal computed tomography (CT) without contrast
- Perform transthoracic echocardiography
- Increase the norepinephrine infusion
- Immediately give fludrocortisone
First give fluids
The first step in managing a patient with suspected adrenal crisis is liberal intravenous fluid administration to replenish the depleted intravascular space. The amount and choice of fluid is empiric, but a recommendation is 1 L of normal saline or dextrose 5% in normal saline, infused quickly over the first hour and then titrated according to the patient’s fluid status.10
Measure cortisol and ACTH; start corticosteroids immediately
Immediate therapy with an appropriate stress dose of intravenous corticosteroids (eg, hydrocortisone 100 mg) is essential. However, this should be done after drawing blood for cortisol and ACTH measurements.10
Do not delay corticosteroid therapy while awaiting the results of the diagnostic tests.
In addition, in the early phase of evolving primary adrenal insufficiency, measurement of plasma renin and aldosterone levels may be beneficial, as mineralocorticoid deficiency may predominate.10,12,13
One of the most important aims of early corticosteroid supplementation is to prevent further hyponatremia by reducing a reactive increase in antidiuretic hormone secretion caused by cortisol deficiency. Corticosteroids also help to restore normal blood pressure by increasing vascular tone, as glucocorticoid receptor activation potentiates the vasoconstrictor actions of norepinephrine, angiotensin II, and other vasoconstrictors.14,15
Which corticosteroid to use?
Which corticosteroid to use in previously undiagnosed adrenal insufficiency is controversial. The Endocrine Society10 and Japan Endocrine Society16 clinical practice guidelines recommend hydrocortisone in a 100-mg intravenous bolus followed by 200 mg over 24 hours.
The choice of hydrocortisone is justified by its superior mineralocorticoid activity.10,16 Further, hydrocortisone is preferred over dexamethasone if the patient is known to have primary adrenal insufficiency, or if the serum potassium level is higher than 6.0 mmol/L.
Some clinicians, on the other hand, recommend dexamethasone, given as a 4-mg intravenous bolus followed by 4-mg boluses every 12 hours. Their rationale is that dexamethasone, unlike hydrocortisone, does not interfere with subsequent serum cortisol assays if the patient later undergoes ACTH stimulation testing.17 Dexamethasone may also be preferred to minimize unwanted mineralocorticoid effects, such as in neurosurgical patients at risk of brain edema.
If hydrocortisone is used, ACTH stimulation testing can be done after withholding hydrocortisone for 24 hours once the patient is stable. (It should be restarted after the test if the results are abnormal.)
Other possible steps
Abdominal CT should be done in our patient to address the possibility of bilateral adrenal hemorrhage. However, it is preferable to wait until the patient is stabilized.
Echocardiography. Our patient is likely to have an element of cardiac failure, given her hypertension and cardiomegaly. However, decompensated heart failure is probably not the cause of her presentation. Thus, the first priority is to treat her adrenal crisis, and echocardiography should be deferred.
Increasing the norepinephrine infusion is unlikely to improve her blood pressure very much, as she is significantly volume-depleted. Further, low cortisol decreases the vascular response to norepinephrine.15
Mineralocorticoids such as fludrocortisone are used to treat primary adrenal insufficiency. However, they are not required during acute management of adrenal crisis, as 40 mg of hydrocortisone offers mineralocorticoid activity equivalent to 100 µg of fludrocortisone. Thus, the high doses of hydrocortisone used to treat adrenal crisis provide adequate mineralocorticoid therapy.10,18
If dexamethasone is used, its effect along with normal saline supplementation would be sufficient to replete the intravenous space and bring the sodium level back up to normal in the acute setting.
CASE RESUMED: IMPROVEMENT WITH HYDROCORTISONE
The patient’s blood is drawn for serum cortisol and plasma ACTH measurements. A 100-mg intravenous bolus of hydrocortisone is given, followed by a 50-mg bolus every 6 hours until the patient stabilizes.
Twenty-four hours later, the patient states that she has more energy, and her appetite has improved. The norepinephrine infusion is stopped 48 hours after presentation, at which time her blood pressure is 120/70 mm Hg, heart rate 85 beats per minute and irregular, and temperature 36.7°C (98.1°F). Her current laboratory values include the following:
- Serum sodium 137 mmolL
- Serum potassium 4.3 mmol/L
- Hemoglobin 9.3 g/dL
- Serum cortisol (random) 7.2 μg/dL
- Plasma ACTH 752 pg/mL (10–60 pg/mL).
ESTABLISHING THE DIAGNOSIS OF ADRENAL INSUFFICIENCY
3. Which of the following is the most appropriate test to establish the diagnosis of adrenal insufficiency?
- 7 am total serum cortisol measurement
- Random serum cortisol measurement
- 7 am salivary cortisol measurement
- 24-hour urinary free cortisol measurement
- ACTH stimulation test for cortisol
- Insulin tolerance test for cortisol
These tests also help determine the type of adrenal insufficiency (primary, secondary, or tertiary) and guide further management. Secondary adrenal insufficiency is caused by inadequate pituitary ACTH secretion and subsequent inadequate cortisol production, whereas tertiary adrenal insufficiency is caused by inadequate hypothalamic corticotropin-releasing hormone secretion and subsequent inadequate ACTH and cortisol production. The diagnosis of adrenal insufficiency relies first on demonstrating inappropriately low total serum cortisol production. Subsequently, serum ACTH helps to differentiate between primary (high ACTH) and secondary or tertiary (low or inappropriately normal ACTH) adrenal insufficiency.
Each test listed above may demonstrate a low cortisol level. However, in a nonacute setting, safety concerns (especially regarding insulin tolerance testing), poor diagnostic value, feasibility (ie, the difficulty of 24-hour tests), and poor sensitivity of 7 am cortisol make the ACTH stimulation test the most appropriate test in clinical practice to establish the diagnosis of adrenal insufficiency.
7 am serum cortisol measurement
Measuring the serum cortisol level early in the morning in the nonacute setting could be of diagnostic value, as an extremely low value (< 3–5 μg/dL) is almost 100% specific for adrenal insufficiency in the absence of concurrent exogenous steroid intake. However, the very low cutoff for this test causes poor sensitivity (about 33%), as many patients have partial adrenal insufficiency and hence have higher serum cortisol levels that may even be in the normal physiologic range.19–22
Random serum cortisol measurements
Random serum cortisol measurements are not very useful in a nonacute setting, since cortisol levels are affected by factors such as stress and hydration status. Moreover, they fluctuate during the day in a circadian rhythm.
On the other hand, random serum cortisol is a very good test to evaluate for adrenal insufficiency in the acute setting. A random value higher than 15 to 18 μg/dL is almost always associated with adequate adrenal function and generally rules out adrenal insufficiency.11,23,24
7 am salivary cortisol measurement
The same principle applies to early morning salivary cortisol. Only extremely low values (< 2.65 ng/mL) may distinguish patients with adrenal insufficiency from healthy individuals, with 97.1% sensitivity and 93.3% specificity.25
Of note, early morning salivary cortisol is not routinely measured in most clinical practices for evaluation of adrenal function. Hence, morning serum and morning salivary cortisol are useful screening tools and have meaningful results when their values are in the extremes of the spectrum, but they are not reliable as a single test, as they may overlook patients with partial adrenal insufficiency.
Urinary cortisol measurement
Urinary cortisol measurement is not used to diagnose adrenal insufficiency, as values can be normal in patients with partial adrenal insufficiency.
The ACTH stimulation test
The ACTH stimulation test involves an intramuscular or intravenous injection of cosyntropin (a synthetic analogue of ACTH fragment 1–24 that has the full activity of native ACTH) and measuring total serum cortisol at baseline, 30 minutes, and 60 minutes to assess the response of the adrenal glands.
The test can be done using a high or low dose of cosyntropin. The Endocrine Society’s 2016 guidelines recommend the high dose (250 μg) for most patients.10 The standard high-dose stimulation test can be done at any time during the day.26 If the cosyntropin is injected intravenously, any value higher than 18 to 20 μg/dL indicates normal adrenal function and excludes adrenal insufficiency.27,28 If intramuscular injection is used, any value higher than 16 to 18 μg/dL at 30 minutes post-consyntropin excludes adrenal insufficiency.29
The ACTH stimulation test may not exclude acute secondary or tertiary adrenal insufficiency.
Insulin tolerance testing
Insulin tolerance testing remains the gold standard for diagnosing adrenal insufficiency and assessing the integrity of the pituitary-adrenal axis. However, given its difficulty to perform, safety concerns, and the availability of other reliable tests, its use in clinical practice is limited. It is nonetheless useful in assessing patients with recent onset of ACTH deficiency.30,31
CASE RESUMED: PATIENT DISCHARGED, LOST TO FOLLOW-UP
Abdominal CT without contrast is done and demonstrates bilateral adrenal hemorrhage. Thus, the patient is diagnosed with primary acute adrenal insufficiency due to adrenal necrosis.
She is started on oral hydrocortisone and fludrocortisone after intravenous hydrocortisone is discontinued. She is counseled about adhering to medications, wearing a medical alert bracelet, giving herself emergency cortisol injections, taking higher doses of hydrocortisone if she is ill, and monitoring her INR. She is discharged home after her symptoms resolve.
The patient does not keep her scheduled appointment and is lost to follow-up. She returns 2 years later complaining of fatigue and feeling unwell. She admits that she stopped taking hydrocortisone 1 year ago after reading an online article about corticosteroid side effects. She has continued to take fludrocortisone.
MINERALOCORTICOID VS CORTICOSTEROID DEFICIENCY
4. Which of the following is least likely to be present in this patient at this time?
- Intravascular volume depletion
- Hyponatremia
- Skin hyperpigmentation
- Normokalemia
- Elevated serum ACTH level
Intravascular volume depletion
Intravascular volume depletion is the least likely to be present. This is because intravascular volume depletion is mainly secondary to mineralocorticoid deficiency rather than corticosteroid deficiency, which is not present in this patient, as she is compliant with her mineralocorticoid replacement therapy.32,33 However, even with sufficient mineralocorticoid replacement, mild hypotension may be present in this patient due to corticosteroid deficiency-induced loss of vascular tone.
Hyponatremia
Hyponatremia in adrenal insufficiency is not due only to mineralocorticoid deficiency. Patients with secondary or tertiary adrenal insufficiency may also exhibit hyponatremia.34 ACTH deficiency in such patients is not expected to cause mineralocorticoid deficiency, as ACTH has only a minor role in aldosterone production.
It has been proposed that hyponatremia in secondary adrenal insufficiency is due to cortisol deficiency resulting in an increase of antidiuretic hormone secretion.35,36 The mechanisms for increased antidiuretic hormone include cortisol deficiency resulting in an increased corticotropin-releasing hormone level, which acts as an antidiuretic hormone secretagogue,37,38 and cortisol directly suppressing antidiuretic hormone secretion.39
In our patient, volume expansion and hyponatremia are expected due to increased antidiuretic hormone secretion as a result of corticosteroid insufficiency.
Hyperpigmentation
Hyperpigmentation of the skin is present only in long-standing primary adrenal insufficiency. This is due to chronic cortisol deficiency causing an increased secretion of pro-opiomelanocortin, a prohormone that is cleaved into ACTH, melanocyte-stimulating hormone, and other hormones. Melanocyte-stimulating hormone causes skin hyperpigmentation due to increased melanin synthesis.40 The hyperpigmentation is seen in sun-exposed areas, pressure areas, palmar creases, nipples, and mucous membranes.
This patient has long-standing corticosteroid deficiency due to noncompliance and primary adrenal insufficiency, and as a result she is expected to have elevated serum ACTH and hyperpigmentation.
Normokalemia
Mineralocorticoid deficiency results in hyperkalemia and metabolic acidosis by impairing renal excretion of potassium and acid.41 This patient is compliant with her mineralocorticoid replacement regimen; thus, potassium levels and pH are expected to be normal.
TAKE-HOME POINTS
- Suspect adrenal crisis in any patient who presents with shock.
- Acute abdomen or unexplained fever could be among the manifestations.
- Initial management requires liberal normal saline intravenous fluid administration to replete the intravascular space.
- Draw blood samples for serum chemistry, cortisol, and ACTH, followed immediately by intravenous hydrocortisone supplementation.
- In critically ill patients, evaluate adrenal function with random serum cortisol; in a nonacute setting use the ACTH stimulation test.
- Chronic management of primary adrenal insufficiency requires corticosteroid and mineralocorticoid therapy.
- Mani S, Rutecki GW. A patient with altered mental status and an acid-base disturbance. Cleve Clin J Med 2017; 84(1):27–34. doi:10.3949/ccjm.84a.16042
- Almiani M, Gorthi J, Subbiah S, Firoz M. Quiz page November 2012: an unusual case of acute hyponatremia and normal anion gap metabolic acidosis. Am J Kidney Dis 2012; 60(5):xxxiii–xxxvi. doi:10.1053/j.ajkd.2012.05.026
- Migeon CJ, Kenny FM, Hung W, Voorhess ML. Study of adrenal function in children with meningitis. Pediatrics 1967; 40(2):163–183.
- Rao RH, Vagnucci AH, Amico JA. Bilateral massive adrenal hemorrhage: early recognition and treatment. Ann Intern Med 1989; 110(3):227–235.
- Shimizu S, Tahara Y, Atsumi T, et al. Waterhouse-Friderichsen syndrome caused by invasive Haemophilus influenzae type B infection in a previously healthy young man. Anaesth Intensive Care 2010; 38(1):214–215.
- Castaldo ET, Guillamondegui OD, Greco JA 3rd, Feurer ID, Miller RS, Morris JA Jr. Are adrenal injuries predictive of adrenal insufficiency in patients sustaining blunt trauma? Am Surg 2008; 74(3):262–266.
- Xarli VP, Steele AA, Davis PJ, Buescher ES, Rios CN, Garcia-Bunuel R. Adrenal hemorrhage in the adult. Medicine (Baltimore) 1978; 57(3):211–221.
- Takeuchi K, Tsuzuki Y, Ando T, et al. Clinical studies of strangulating small bowel obstruction. Am Surg 2004; 70(1):40–44.
- MacKenzie IM. The haemodynamics of human septic shock. Anaesthesia 2001; 56(2):130–144.
- Bornstein SR, Allolio B, Arlt W, et al. Diagnosis and treatment of primary adrenal insufficiency: an Endocrine Society clinical practice guideline. J Clin Endocrinol Metab 2016; 101(2):364–389. doi:10.1210/jc.2015-1710
- Hamrahian AH, Fleseriu M; AACE Adrenal Scientific Committee. Evaluation and management of adrenal insufficiency in critically ill patients: disease state review. Endocr Pract 2017; 23(6):716–725. doi:10.4158/EP161720.RA
- Saenger P, Levine LS, Irvine WJ, et al. Progressive adrenal failure in polyglandular autoimmune disease. J Clin Endocrinol Metab 1982; 54(4):863–867.
- Coco G, Dal Pra C, Presotto F, et al. Estimated risk for developing autoimmune Addison's disease in patients with adrenal cortex autoantibodies. J Clin Endocrinol Metab 2006; 91(5):1637–1645. doi:10.1210/jc.2005-0860
- Ullian ME. The role of corticosteroids in the regulation of vascular tone. Cardiovasc Res 1999; 41(1):55–64.
- Yang S, Zhang L. Glucocorticoids and vascular reactivity. Curr Vasc Pharmacol 2004; 2(1):1–12.
- Yanase T, Tajima T, Katabami T, et al. Diagnosis and treatment of adrenal insufficiency including adrenal crisis: a Japan Endocrine Society clinical practice guideline [Opinion]. Endocr J 2016; 63(9):765–784. doi:10.1507/endocrj.EJ16-0242
- Taylor RL, Grebe SK, Singh RJ. Quantitative, highly sensitive liquid chromatography-tandem mass spectrometry method for detection of synthetic corticosteroids. Clin Chem 2004; 50(10):2345–2352. doi:10.1373/clinchem.2004.033605
- Goldfien A, Laidlaw JC, Haydar NA, Renold AE, Thorn GW. Fluorohydrocortisone and chlorohydrocortisone, highly potent derivatives of compound F. N Engl J Med 1955; 252(11):415–421. doi:10.1056/NEJM195503172521101
- Jenkins D, Forsham PH, Laidlaw JC, Reddy WJ, Thorn GW. Use of ACTH in the diagnosis of adrenal cortical insufficiency. Am J Med 1955; 18(1):3–14.
- Hägg E, Asplund K, Lithner F. Value of basal plasma cortisol assays in the assessment of pituitary-adrenal insufficiency. Clin Endocrinol (Oxf) 1987; 26(2):221–226.
- Deutschbein T, Unger N, Mann K, Petersenn S. Diagnosis of secondary adrenal insufficiency: unstimulated early morning cortisol in saliva and serum in comparison with the insulin tolerance test. Horm Metab Res 2009; 41(4):834–839. doi:10.1055/s-0029-1225630
- Erturk E, Jaffe CA, Barkan AL. Evaluation of the integrity of the hypothalamic-pituitary-adrenal axis by insulin hypoglycemia test. J Clin Endocrinol Metab 1998; 83(7):2350–2354.
- Cooper MS, Stewart PM. Corticosteroid insufficiency in acutely ill patients. N Engl J Med 2003; 348(8):727–734. doi:10.1056/NEJMra020529
- Dellinger RP, Levy MM, Rhodes A, et al; Surviving Sepsis Campaign Guidelines Committee including the Pediatric Subgroup. Surviving Sepsis Campaign: international guidelines for management of severe sepsis and septic shock, 2012. Intensive Care Med 2013; 39(2):165–228. doi:10.1007/s00134-012-2769-8
- Ceccato F, Barbot M, Zilio M, et al. Performance of salivary cortisol in the diagnosis of Cushing's syndrome, adrenal incidentaloma, and adrenal insufficiency. Eur J Endocrinol 2013; 169(1):31–36. doi:10.1530/EJE-13-0159
- Dickstein G, Shechner C, Nicholson WE, et al. Adrenocorticotropin stimulation test: effects of basal cortisol level, time of day, and suggested new sensitive low dose test. J Clin Endocrinol Metab 1991; 72(4):773–778. doi:10.1210/jcem-72-4-773
- May ME, Carey RM. Rapid adrenocorticotropic hormone test in practice. Retrospective review. Am J Med 1985; 79(6):679–884.
- Speckart PF, Nicoloff JT, Bethune JE. Screening for adrenocortical insufficiency with cosyntropin (synthetic ACTH). Arch Intern Med 1971; 128(5):761–763.
- Peechakara S, Bena J, Clarke NJ, et al. Total and free cortisol levels during 1 μg, 25 μg, and 250 μg cosyntropin stimulation tests compared to insulin tolerance test: results of a randomized, prospective, pilot study. Endocrine 2017; 57(3):388–393. doi:10.1007/s12020-017-1371-9
- Finucane FM, Liew A, Thornton E, Rogers B, Tormey W, Agha A. Clinical insights into the safety and utility of the insulin tolerance test (ITT) in the assessment of the hypothalamo-pituitary-adrenal axis. Clin Endocrinol (Oxf) 2008; 69(4):603–607. doi:10.1111/j.1365-2265.2008.03240.x
- Lindholm J, Kehlet H. Re-evaluation of the clinical value of the 30 min ACTH test in assessing the hypothalamic-pituitary-adrenocortical function. Clin Endocrinol (Oxf) 1987; 26(1):53–59.
- Charmandari E, Nicolaides NC, Chrousos GP. Adrenal insufficiency. Lancet 2014; 383(9935):2152–2167. doi:10.1016/S0140-6736(13)61684-0
- Burke CW. Adrenocortical insufficiency. Clin Endocrinol Metab 1985; 14(4):947–976.
- Jessani N, Jehangir W, Behman D, Yousif A, Spiler IJ. Secondary adrenal insufficiency: an overlooked cause of hyponatremia. J Clin Med Res 2015; 7(4):286–288. doi:10.14740/jocmr2041w
- Oelkers W. Hyponatremia and inappropriate secretion of vasopressin (antidiuretic hormone) in patients with hypopituitarism. N Engl J Med 1989; 321(8):492–496. doi:10.1056/NEJM198908243210802
- Ishikawa S, Schrier RW. Effect of arginine vasopressin antagonist on renal water excretion in glucocorticoid and mineralocorticoid deficient rats. Kidney Int 1982; 22(6):587–593.
- Wolfson B, Manning RW, Davis LG, Arentzen R, Baldino F Jr. Co-localization of corticotropin releasing factor and vasopressin mRNA in neurones after adrenalectomy. Nature 1985; 315(6014):59–61.
- Kalogeras KT, Nieman LK, Friedman TC, et al. Inferior petrosal sinus sampling in healthy subjects reveals a unilateral corticotropin-releasing hormone-induced arginine vasopressin release associated with ipsilateral adrenocorticotropin secretion. J Clin Invest 1996; 97:2045–2050.
- Kovacs KJ, Foldes A, Sawchenko PE. Glucocorticoid negative feedback selectively targets vasopressin transcription in parvocellular neurosecretory neurons. J Neurosci 2000; 20:3843–3852.
- Sarkar SB, Sarkar S, Ghosh S, Bandyopadhyay S. Addison's disease. Contemp Clin Dent 2012; 3(4):484–486. doi:10.4103/0976-237X.107450
- Szylman P, Better OS, Chaimowitz C, Rosler A. Role of hyperkalemia in the metabolic acidosis of isolated hypoaldosteronism. N Engl J Med 1976; 294(7):361–365. doi:10.1056/NEJM197602122940703
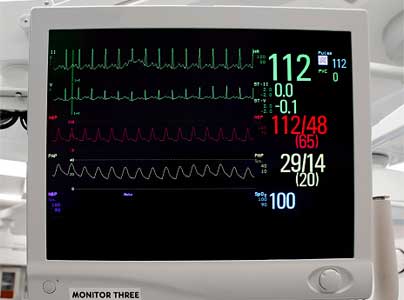
Perioperative interruption of dual antiplatelet therapy
To the Editor: We read with great interest the article by Munyon et al1 addressing recent developments in perioperative medicine. We would like to comment on the perioperative interruption of dual antiplatelet therapy, a common clinical problem.
Several registry analyses have shown that, with second-generation drug-eluting stents, interruption of 1 antiplatelet agent after the first month is safe.2,3 These registries included a substantial proportion of patients whose index stenting procedure was performed for acute coronary syndrome (up to 60%).2 On average, antiplatelet therapy interruption was brief (about 6 to 7 days).
Additional registry analyses have shown that surgery may be safely performed beyond the first month after drug-eluting stent placement.4,5 Specifically, a large Danish analysis of patients with a drug-eluting stent who underwent noncardiac surgery, matched to control patients without ischemic heart disease, showed that the risk of perioperative myocardial infarction and death was not increased beyond the first month after drug-eluting stent implantation. Specifically, the risk was not increased at the 1- to 2-month and 2- to 12-month postimplantation intervals. Acute coronary syndrome was the indication for stenting in 56% of the patients.
Therefore, while surgery is preferably delayed 6 months after drug-eluting stent implantation (class I recommendation in the European Society of Cardiology guidelines), surgery may be selectively performed 1 to 6 months after drug-eluting stent implantation with an acceptable risk. This is particularly so if the index stenting was performed in the setting of stable coronary arterial disease (class IIa recommendation if stenting was performed in the setting of stable coronary arterial disease without complex procedural features; class IIb recommendation if stenting was performed in the setting of acute coronary syndrome or complex procedural features).6 After drug-eluting stent implantation, the earliest cutpoint for considering surgery is 1 month rather than 3 months.
When surgery is performed within this 1- to 6-month interval, thienopyridine interruption should be kept brief and dual antiplatelet therapy reinitiated as soon as possible postoperatively. In fact, when thienopyridine therapy is interrupted 1 to 6 months after drug-eluting stent implantation, stent thrombosis typically occurs more than 6 or 7 days after interruption.7
- Munyon R, Cohn SL, Slawski B, Smetana GW, Pfeifer K. 2017 update in perioperative medicine: 6 questions answered. Cleve Clin J Med 2017; 84(11):863–872. doi:10.3949/ccjm.84a.17068
- Ferreira-Gonzáles, Marsal JR, Ribera A, et al. Double antiplatelet therapy after drug-eluting stent implantation: risk associated with discontinuation within the first year. J Am Coll Cardiol 2012; 60(15):1333–1339. doi:10.1016/j.jacc.2012.04.057
- Naidu SS, Krucoff MW, Rutledge DR, et al. Contemporary incidence and predictors of stent thrombosis and other major adverse cardiac events in the year after XIENCE V implantation: results from the 8,061-patient XIENCE V United States study. JACC Cardiovasc Interv 2012; 5(5):626–635. doi:10.1016/j.jcin.2012.02.014
- Egholm G, Kristensen SD, Thim T, et al. Risk associated with surgery within 12 months after coronary drug-eluting stent implantation. J Am Coll Cardiol 2016; 68(24):2622–2632. doi:10.1016/j.jacc.2016.09.967
- Singla S, Sachdeva R, Uretsky BF. The risk of adverse cardiac and bleeding events following noncardiac surgery relative to antiplatelet therapy in patients with prior percutaneous coronary intervention. J Am Coll Cardiol 2012; 60(20):2005–2016. doi:10.1016/j.jacc.2012.04.062
- Valgimigli M, Bueno H, Byrne RA, et al. 2017 ESC focused update on dual antiplatelet therapy in coronary artery disease developed in collaboration with EACTS: The Task Force for dual antiplatelet therapy in coronary artery disease of the European Society of Cardiology (ESC) and of the European Association for Cardio-Thoracic Surgery (EACTS). Eur Heart J 2018; 39(3):213–260. doi:10.1093/eurheartj/ehx419
- Airoldi F, Colombo A, Morici N, et al. Incidence and predictors of drug-eluting stent thrombosis during and after discontinuation of thienopyridine treatment. Circulation 2007; 116(7):745–754. doi:10.1161/CIRCULATIONAHA.106.686048
To the Editor: We read with great interest the article by Munyon et al1 addressing recent developments in perioperative medicine. We would like to comment on the perioperative interruption of dual antiplatelet therapy, a common clinical problem.
Several registry analyses have shown that, with second-generation drug-eluting stents, interruption of 1 antiplatelet agent after the first month is safe.2,3 These registries included a substantial proportion of patients whose index stenting procedure was performed for acute coronary syndrome (up to 60%).2 On average, antiplatelet therapy interruption was brief (about 6 to 7 days).
Additional registry analyses have shown that surgery may be safely performed beyond the first month after drug-eluting stent placement.4,5 Specifically, a large Danish analysis of patients with a drug-eluting stent who underwent noncardiac surgery, matched to control patients without ischemic heart disease, showed that the risk of perioperative myocardial infarction and death was not increased beyond the first month after drug-eluting stent implantation. Specifically, the risk was not increased at the 1- to 2-month and 2- to 12-month postimplantation intervals. Acute coronary syndrome was the indication for stenting in 56% of the patients.
Therefore, while surgery is preferably delayed 6 months after drug-eluting stent implantation (class I recommendation in the European Society of Cardiology guidelines), surgery may be selectively performed 1 to 6 months after drug-eluting stent implantation with an acceptable risk. This is particularly so if the index stenting was performed in the setting of stable coronary arterial disease (class IIa recommendation if stenting was performed in the setting of stable coronary arterial disease without complex procedural features; class IIb recommendation if stenting was performed in the setting of acute coronary syndrome or complex procedural features).6 After drug-eluting stent implantation, the earliest cutpoint for considering surgery is 1 month rather than 3 months.
When surgery is performed within this 1- to 6-month interval, thienopyridine interruption should be kept brief and dual antiplatelet therapy reinitiated as soon as possible postoperatively. In fact, when thienopyridine therapy is interrupted 1 to 6 months after drug-eluting stent implantation, stent thrombosis typically occurs more than 6 or 7 days after interruption.7
- Munyon R, Cohn SL, Slawski B, Smetana GW, Pfeifer K. 2017 update in perioperative medicine: 6 questions answered. Cleve Clin J Med 2017; 84(11):863–872. doi:10.3949/ccjm.84a.17068
- Ferreira-Gonzáles, Marsal JR, Ribera A, et al. Double antiplatelet therapy after drug-eluting stent implantation: risk associated with discontinuation within the first year. J Am Coll Cardiol 2012; 60(15):1333–1339. doi:10.1016/j.jacc.2012.04.057
- Naidu SS, Krucoff MW, Rutledge DR, et al. Contemporary incidence and predictors of stent thrombosis and other major adverse cardiac events in the year after XIENCE V implantation: results from the 8,061-patient XIENCE V United States study. JACC Cardiovasc Interv 2012; 5(5):626–635. doi:10.1016/j.jcin.2012.02.014
- Egholm G, Kristensen SD, Thim T, et al. Risk associated with surgery within 12 months after coronary drug-eluting stent implantation. J Am Coll Cardiol 2016; 68(24):2622–2632. doi:10.1016/j.jacc.2016.09.967
- Singla S, Sachdeva R, Uretsky BF. The risk of adverse cardiac and bleeding events following noncardiac surgery relative to antiplatelet therapy in patients with prior percutaneous coronary intervention. J Am Coll Cardiol 2012; 60(20):2005–2016. doi:10.1016/j.jacc.2012.04.062
- Valgimigli M, Bueno H, Byrne RA, et al. 2017 ESC focused update on dual antiplatelet therapy in coronary artery disease developed in collaboration with EACTS: The Task Force for dual antiplatelet therapy in coronary artery disease of the European Society of Cardiology (ESC) and of the European Association for Cardio-Thoracic Surgery (EACTS). Eur Heart J 2018; 39(3):213–260. doi:10.1093/eurheartj/ehx419
- Airoldi F, Colombo A, Morici N, et al. Incidence and predictors of drug-eluting stent thrombosis during and after discontinuation of thienopyridine treatment. Circulation 2007; 116(7):745–754. doi:10.1161/CIRCULATIONAHA.106.686048
In reply: Perioperative interruption of dual antiplatelet therapy
In Reply: We reported on publications from 2016–2017 and, unfortunately, at the time we were writing our paper, the European Society of Cardiology (ESC) update on dual antiplatelet therapy1 had not yet been published. We presented the recommendations from the American College of Cardiology (ACC) and American Heart Association (AHA),2 which differ from the recently published ESC guidelines. The ESC suggests that the minimum waiting period after drug-eluting stent placement before noncardiac surgery should be 1 month rather than 3 months but acknowledges that in the setting of complex stenting or recent acute coronary syndrome, 6 months is preferred. The recommendation in this latter scenario is a class IIb C recommendation—essentially expert consensus opinion.
Further, in the study by Egholm et al,3 the event rates in patients undergoing noncardiac surgery in the 1- to 2-month period were numerically higher than in the control group, and no adjusted odds ratios were given. The numbers of events were very low, and a change of only 1 or 2 events in the other direction in the groups would likely make it statistically significant.
All of these recommendations are based on observational studies and registry data, as there are no randomized controlled trials to address this issue. There are many complexities to be accounted for including the type of stent, timing, circumstances surrounding stenting, anatomy, number of stents, patient comorbidities (particularly age, diabetes mellitus, cardiac disease), type of surgery and anesthesia, and perioperative management of antiplatelet therapy. While we acknowledge the ESC recommendation, we would urge caution in the recommendation to wait only 1 month, and in the United States most would prefer to wait 3 months if possible.
- Valgimigli M, Bueno H, Byrne RA, et al. 2017 ESC focused update on dual antiplatelet therapy in coronary artery disease developed in collaboration with EACTS: The Task Force for dual antiplatelet therapy in coronary artery disease of the European Society of Cardiology (ESC) and of the European Association for Cardio-Thoracic Surgery (EACTS). Eur Heart J 2018; 39(3):213–260. doi:10.1093/eurheartj/ehx419
- Levine GN, Bates ER, Bittl JA, et al. 2016 ACC/AHA guideline focused update on duration of dual antiplatelet therapy in patients with coronary artery disease. Circulation 2016; 134(10):e123–e155. doi:10.1161/CIR.0000000000000404
- Egholm G, Kristensen SD, Thim T, et al. Risk associated with surgery within 12 months after coronary drug-eluting stent implantation. J Am Coll Cardiol 2016; 68(24):2622–2632. doi:10.1016/j.jacc.2016.09.967
In Reply: We reported on publications from 2016–2017 and, unfortunately, at the time we were writing our paper, the European Society of Cardiology (ESC) update on dual antiplatelet therapy1 had not yet been published. We presented the recommendations from the American College of Cardiology (ACC) and American Heart Association (AHA),2 which differ from the recently published ESC guidelines. The ESC suggests that the minimum waiting period after drug-eluting stent placement before noncardiac surgery should be 1 month rather than 3 months but acknowledges that in the setting of complex stenting or recent acute coronary syndrome, 6 months is preferred. The recommendation in this latter scenario is a class IIb C recommendation—essentially expert consensus opinion.
Further, in the study by Egholm et al,3 the event rates in patients undergoing noncardiac surgery in the 1- to 2-month period were numerically higher than in the control group, and no adjusted odds ratios were given. The numbers of events were very low, and a change of only 1 or 2 events in the other direction in the groups would likely make it statistically significant.
All of these recommendations are based on observational studies and registry data, as there are no randomized controlled trials to address this issue. There are many complexities to be accounted for including the type of stent, timing, circumstances surrounding stenting, anatomy, number of stents, patient comorbidities (particularly age, diabetes mellitus, cardiac disease), type of surgery and anesthesia, and perioperative management of antiplatelet therapy. While we acknowledge the ESC recommendation, we would urge caution in the recommendation to wait only 1 month, and in the United States most would prefer to wait 3 months if possible.
- Valgimigli M, Bueno H, Byrne RA, et al. 2017 ESC focused update on dual antiplatelet therapy in coronary artery disease developed in collaboration with EACTS: The Task Force for dual antiplatelet therapy in coronary artery disease of the European Society of Cardiology (ESC) and of the European Association for Cardio-Thoracic Surgery (EACTS). Eur Heart J 2018; 39(3):213–260. doi:10.1093/eurheartj/ehx419
- Levine GN, Bates ER, Bittl JA, et al. 2016 ACC/AHA guideline focused update on duration of dual antiplatelet therapy in patients with coronary artery disease. Circulation 2016; 134(10):e123–e155. doi:10.1161/CIR.0000000000000404
- Egholm G, Kristensen SD, Thim T, et al. Risk associated with surgery within 12 months after coronary drug-eluting stent implantation. J Am Coll Cardiol 2016; 68(24):2622–2632. doi:10.1016/j.jacc.2016.09.967
Some Health Care Workers Are at Risk for Hearing Loss
As many as one-third of workers in some sectors of health care and social service may have hearing loss, according to the researchers at the National Institute for Occupational Safety and Health (NIOSH) who studied audiograms from hundreds of US companies. Theirs is the first known study to estimate and compare the prevalence of noise-exposed worker hearing loss by subsector within the Health Care and Social Assistance (HSA) sector.
Some subsectors had higher than expected prevalence of hearing loss for an industry that has had assumed “low exposure” to noise, NIOSH says. Most of the HSA subsector prevalence estimates ranged from 14% to 18%, but the Medical and Diagnostic Laboratories subsector had 31% prevalence, the Offices of All Other Miscellaneous Health Practitioners had 24% prevalence, and Child Day Care Services had a 52% higher risk compared with that of the reference industry.
NIOSH says successful noise reduction measures have been documented in hospital settings. Exposure to chemotherapy drugs can be better prevented and laboratories can be modified to reduce the level of noise. When noise can’t be removed or reduced to safe levels, NIOSH recommends implementing an effective hearing conservation program.
Hearing loss is the third most common chronic physical condition in the US, NIOSH says. But Elizabeth Masterson, PhD, epidemiologist and lead author of the study, says, “Occupational hearing loss is entirely preventable.”
SHM Research, Innovation, and Clinical Vignettes, 2018 Abstracts
SHM Research, Innovation, and Clinical Vignettes Abstracts, Hospital Medicine 2018, April 8-11
SHM Research, Innovation, and Clinical Vignettes Abstracts, Hospital Medicine 2018, April 8-11
SHM Research, Innovation, and Clinical Vignettes Abstracts, Hospital Medicine 2018, April 8-11
Brigadier General Carl Rogers Darnall: Saving Lives on a Massive Scale
The Carl R. Darnall Army Medical Center at Fort Hood, Texas, is named in honor of Brigadier General Carl Rogers Darnall, a Texas native and career Army physician whose active-duty service spanned 35 years. Darnall, the oldest of 7 siblings, could not have imagined the enormity of the contributions that he would make and the lives that would be saved as he pursued a career in medicine.
Born on the family farm north of Dallas on Christmas Day in 1867, Darnall attended college in nearby Bonham and graduated from Transylvania University in Kentucky. He attended Jefferson Medical College in Philadelphia, Pennsylvania, graduating in 1890. Darnall spent several years in private practice before he joined the Army Medical Corps in 1896. He completed the Army Medical School in 1897. Opened in 1893, the Army Medical School was a 4-to-6-month course for civilian physicians entering active duty. The courses introduced physicians to the duties of medical officers as well as military surgery, medicine, and hygiene. It is considered by many to be the first school of public health in the U.S.
Darnall’s first assignments in Texas were followed by deployment to Cuba during the Spanish American War and then the Philippines, where he served as an operating surgeon and pathologist aboard the hospital ship, USS Relief. Darnall later accompanied an international expeditionary force to China in response to the Boxer Rebellion. In 1902, Darnall received an assignment to the Army Medical School in Washington, DC, that would change his life and the lives of millions around the world. Detailed as instructor for sanitary chemistry and operative surgery, he also served as secretary of the faculty. Just as Major Walter Reed and others before him, Darnall used his position at the Army Medical School to pursue important clinical research.
The complete story of the purification of drinking water is beyond the scope of this short biography. In brief, as early as 1894 the addition of chlorine to water was shown to render it “germ free.” In the 1890s, there were at least 2 attempts at water purification on a large scale with chlorine in European cities. One of the first uses of chlorine in the U.S. occurred in 1908 in Jersey City, New Jersey. At the Army Medical School, Darnall discovered the value of using compressed liquefied chlorine gas to purify water. He invented a mechanical liquid chlorine purifier in 1910 that became known as a chlorinator. In November 1911, Major Darnall authored a 15-page article concerning water purification.1 Darnall also devised and patented a water filter, which the U.S. Army used for many years.
The principles of his chlorinator and use of anhydrous liquid chlorine were later applied to municipal water supplies throughout the world. The positive benefit of clean drinking water to improving public health is beyond measure. It has been said that more lives have been saved and more sickness prevented by Darnall’s contribution to sanitary water than by any other single achievement in medicine.
During World War I, Darnall was promoted to colonel and assigned to the Finance and Supply Division in the Office of the Surgeon General. After the war, he served as department surgeon in Hawaii. In 1925, he returned to the Office of the Surgeon General as executive officer. In November 1929, he was promoted to brigadier general and became the commanding general of the Army Medical Center and Walter Reed General Hospital, a position he held for 2 years until his retirement in 1931.Darnall died on January 18, 1941, at Walter Reed General Hospital just 6 days after his wife of 48 years had died at their home in Washington, DC. He is buried in Section 3 at Arlington National Cemetery. His 3 sons, Joseph Rogers, William Major, and Carl Robert, all served in some capacity in the Army.
Darnall Army Community Hospital opened in 1965, replacing the World War II-era hospital at Fort Hood. In 1984 a 5-year reconstruction project with additional floor space was completed. On May 1, 2006, the hospital was officially renamed the Carl R. Darnall Army Medical Center.
About this column
This column provides biographical sketches of the namesakes of military and VA health care facilities. To learn more about the individual your facility was named for or to offer a topic suggestion, contact us at [email protected] or on Facebook.
1. Darnall CR. The purification of water by anhydrous chlorine. J Am Public Health Assoc. 1911;1(11):783-797.
The Carl R. Darnall Army Medical Center at Fort Hood, Texas, is named in honor of Brigadier General Carl Rogers Darnall, a Texas native and career Army physician whose active-duty service spanned 35 years. Darnall, the oldest of 7 siblings, could not have imagined the enormity of the contributions that he would make and the lives that would be saved as he pursued a career in medicine.
Born on the family farm north of Dallas on Christmas Day in 1867, Darnall attended college in nearby Bonham and graduated from Transylvania University in Kentucky. He attended Jefferson Medical College in Philadelphia, Pennsylvania, graduating in 1890. Darnall spent several years in private practice before he joined the Army Medical Corps in 1896. He completed the Army Medical School in 1897. Opened in 1893, the Army Medical School was a 4-to-6-month course for civilian physicians entering active duty. The courses introduced physicians to the duties of medical officers as well as military surgery, medicine, and hygiene. It is considered by many to be the first school of public health in the U.S.
Darnall’s first assignments in Texas were followed by deployment to Cuba during the Spanish American War and then the Philippines, where he served as an operating surgeon and pathologist aboard the hospital ship, USS Relief. Darnall later accompanied an international expeditionary force to China in response to the Boxer Rebellion. In 1902, Darnall received an assignment to the Army Medical School in Washington, DC, that would change his life and the lives of millions around the world. Detailed as instructor for sanitary chemistry and operative surgery, he also served as secretary of the faculty. Just as Major Walter Reed and others before him, Darnall used his position at the Army Medical School to pursue important clinical research.
The complete story of the purification of drinking water is beyond the scope of this short biography. In brief, as early as 1894 the addition of chlorine to water was shown to render it “germ free.” In the 1890s, there were at least 2 attempts at water purification on a large scale with chlorine in European cities. One of the first uses of chlorine in the U.S. occurred in 1908 in Jersey City, New Jersey. At the Army Medical School, Darnall discovered the value of using compressed liquefied chlorine gas to purify water. He invented a mechanical liquid chlorine purifier in 1910 that became known as a chlorinator. In November 1911, Major Darnall authored a 15-page article concerning water purification.1 Darnall also devised and patented a water filter, which the U.S. Army used for many years.
The principles of his chlorinator and use of anhydrous liquid chlorine were later applied to municipal water supplies throughout the world. The positive benefit of clean drinking water to improving public health is beyond measure. It has been said that more lives have been saved and more sickness prevented by Darnall’s contribution to sanitary water than by any other single achievement in medicine.
During World War I, Darnall was promoted to colonel and assigned to the Finance and Supply Division in the Office of the Surgeon General. After the war, he served as department surgeon in Hawaii. In 1925, he returned to the Office of the Surgeon General as executive officer. In November 1929, he was promoted to brigadier general and became the commanding general of the Army Medical Center and Walter Reed General Hospital, a position he held for 2 years until his retirement in 1931.Darnall died on January 18, 1941, at Walter Reed General Hospital just 6 days after his wife of 48 years had died at their home in Washington, DC. He is buried in Section 3 at Arlington National Cemetery. His 3 sons, Joseph Rogers, William Major, and Carl Robert, all served in some capacity in the Army.
Darnall Army Community Hospital opened in 1965, replacing the World War II-era hospital at Fort Hood. In 1984 a 5-year reconstruction project with additional floor space was completed. On May 1, 2006, the hospital was officially renamed the Carl R. Darnall Army Medical Center.
About this column
This column provides biographical sketches of the namesakes of military and VA health care facilities. To learn more about the individual your facility was named for or to offer a topic suggestion, contact us at [email protected] or on Facebook.
1. Darnall CR. The purification of water by anhydrous chlorine. J Am Public Health Assoc. 1911;1(11):783-797.
1. Darnall CR. The purification of water by anhydrous chlorine. J Am Public Health Assoc. 1911;1(11):783-797.

Reducing SNF Readmissions: At What Cost?
The landscape of postacute care in skilled nursing facilities (SNFs) in the United States is evolving. As the population ages, a growing number of elderly persons are being discharged to SNFs at an enormous cost and with clear evidence of disappointing outcomes. The reaction to these trends includes payment reforms that “bundle” hospital and postacute care, act as incentives to discourage SNFs, or penalize SNFs for undesired patient outcomes. Hospitalists are expected to increasingly feel the effect of these reforms.1
Thus, hospitals are demonstrating renewed interest in reducing readmissions from SNFs. In this issue of Journal of Hospital Medicine, Rosen and colleagues present the results of the Enhanced Care Program (ECP), a multicomponent intervention consisting of 9 nurse practitioners (NPs), a pharmacist, a pharmacy technician, a nurse educator, a program administrator, and a medical director.2 These providers are deployed to 8 SNFs around a large teaching hospital, providing direct clinical care as well as 24/7 call availability for enrolled patients, robust medication reconciliation, and monthly education for SNF nursing staff. A unique aspect of this model was that individual attending physicians in the associated SNFs could decide whether to enroll their patients in the model; patients not enrolled represented a contemporaneous control cohort. The authors found a nearly 30% reduction in the odds of 30-day readmission (OR 0.71 [0.60–0.85] after adjustment), which was robust to multiple sensitivity analyses, including a propensity-matched cohort comparison. The authors should be commended for working to mitigate these potential confounders, thereby strengthening their conclusions. Such a large reduction in readmissions reflects their high underlying prevalence (23% in the nonintervention cohort).
This report closely follows the evaluation of a similar program at the Cleveland Clinic called Connected Care Model (CCM), in which 4 physicians and 5 NPs or physician assistants provided care, including 24/7 call availability, in 7 associated SNFs.3 In a retrospective pre-post analysis comparing the 30-day readmission rates of these SNFs with those of others in the network, similar reductions in readmissions were observed. ECP and CCM represent important extensions of a much larger body of evidence, from the Evercare model4 to the Initiative to Reduce Avoidable Hospitalizations demonstration project, which suggests that adding NPs to nursing homes reduces hospitalizations.5
However, several factors have to be considered before disseminating ECP or CCM. First, other promising “proof of concept” quality improvement studies were not efficacious when rigorously tested in nursing homes.6 Second, these programs are representative of large academic medical centers, which may establish different relationships with different SNFs compared with smaller or less well-resourced hospitals. As the Initiative to Reduce Hospitalizations demonstrated, even a fundamentally similar intervention can have extremely different results depending on the nursing homes involved,5 and the science behind establishing effective hospital–SNF partnerships is still in its infancy.7 Third, both studies have significant methodological limitations, including most importantly that they are conducted within SNFs selected to be part of their hospitals’ network.
These significant early efforts also present an opportunity to reconsider the underlying assumption of these models: that adding more supervisory clinicians to SNFs is the right approach to reduce hospitalizations. Although adding resources is an attractive “plug and play” solution for many problems in healthcare delivery, placing only 1 NP in each of the 15,583 certified nursing facilities in the United States would employ fully 10% of the entire NP workforce. Amid rising concerns about costs related to our aging population, these interventions face substantial headwinds toward becoming the standard of care without demonstrating cost effectiveness. Furthermore, many SNF directors might suggest that hospitals and hospitalists working with them to address fundamental (but much more intransigent) problems in SNFs, such as high staff turnover, low concentration of highly skilled staff (RNs and MDs), regulatory burden, and hospitals using SNFs like stepdown units, could represent a generalizable and sustainable solution.
We realize that this argument is tricky for hospitalists because its underlying logic (care has become too complex, patients are too sick, and dedicated personnel are needed) also played a major role in establishing our existence. One possibility is that like hospitalists, NPs and a growing cadre of “SNFists” will become major drivers of quality improvement, education, and leadership locally at these facilities, thereby leading to sustainable change.8 Similarly, current conditions may drive recognition that a specific set of skills is required to function effectively in the SNF environment,9 just as we believe hospitalists need unique skills to excel in today’s hospital environment.
Studies such as that of Rosen et al. are valuable for JHM because they prompt us to recognize that we as hospitalists have much to share and learn from nursing homes and the dedicated practitioners who work there. In fact, we argue that few places in the healthcare system are more in need of innovation than hospital–nursing home relationships, and hospitalists do not just have a vested clinical interest; in many ways, we see a mirror of our own development as a “specialty.” We encourage hospitals and hospitalists to take up this challenge on behalf of some of the most vulnerable patients in our system during critical times in their care trajectory. As the Commission for Long-Term Care (www.ltccommission.org) wrote in its final report to Congress: “The need is great. The time to act is now.”
Disclosures
Dr. Burke is supported by a VA Health Services Research and Development (HSR&D) Career Development Award. All opinions are those of the authors and do not necessarily represent those of the Department of Veterans Affairs. Dr. Greysen has nothing to disclose.
1. Burke RE, Cumbler E, Coleman EA, Levy C. Post-acute care reform: Implications and opportunities for hospitalists. J Hosp Med. 2017;12(1):46-51. 10.3810/hp.2012.02.958. PubMed
2. Rosen BT, Halbert RJ, Hart K, Diniz MA, Isonaka S, Black JT. The enhanced care program: Impact of a care transitions program on 30-day hospital readmissions for patients discharged from an acute care facility to skilled nursing facilities. J Hosp Med. 2018;13(4):229-235.
3. Rothberg MB. Impact of a connected care model on 30-day readmission rates from skilled nursing facilities. J Hosp Med. 2017;12(4):238-244. 10.12788/jhm.2710. PubMed
4. Kane RL, Keckhafer G, Flood S, Bershadsky B, Siadaty MS. The effect of Evercare on hospital use. J Am Geriatr Soc. 2003;51(10):1427-1434. 10.1046/j.1532-5415.2003.51461.x. PubMed
5. Ingber MJ, Feng Z, Khatutsky G, et al. Initiative to reduce avoidable hospitalizations among nursing facility residents shows promising results. Health Aff Proj Hope. 2017;36(3):441-450. 10.1377/hlthaff.2016.1310. PubMed
6. Kane RL, Huckfeldt P, Tappen R, et al. Effects of an intervention to reduce hospitalizations from nursing homes: A randomized implementation trial of the INTERACT Program. JAMA Intern Med. 2017;177(9):1257-1264. 10.1001/jamainternmed.2017.2657. PubMed
7. Lage DE, Rusinak D, Carr D, Grabowski DC, Ackerly DC. Creating a network of high-quality skilled nursing facilities: preliminary data on the postacute care quality improvement experiences of an accountable care organization. J Am Geriatr Soc. 2015;63(4):804-808. 10.1111/jgs.13351. PubMed
8. Ryskina KL, Polsky D, Werner RM. Physicians and advanced practitioners specializing in nursing home care. JAMA. 2017;318(20):2040-2042. 10.1001/jama.2017.13378. PubMed
9. Gillespie SM, Levy CR, Katz PR. What exactly is an “SNF-ist?” JAMA Intern Med. 2018;178(1):153-154. 10.1001/jamainternmed.2017.7212. PubMed
The landscape of postacute care in skilled nursing facilities (SNFs) in the United States is evolving. As the population ages, a growing number of elderly persons are being discharged to SNFs at an enormous cost and with clear evidence of disappointing outcomes. The reaction to these trends includes payment reforms that “bundle” hospital and postacute care, act as incentives to discourage SNFs, or penalize SNFs for undesired patient outcomes. Hospitalists are expected to increasingly feel the effect of these reforms.1
Thus, hospitals are demonstrating renewed interest in reducing readmissions from SNFs. In this issue of Journal of Hospital Medicine, Rosen and colleagues present the results of the Enhanced Care Program (ECP), a multicomponent intervention consisting of 9 nurse practitioners (NPs), a pharmacist, a pharmacy technician, a nurse educator, a program administrator, and a medical director.2 These providers are deployed to 8 SNFs around a large teaching hospital, providing direct clinical care as well as 24/7 call availability for enrolled patients, robust medication reconciliation, and monthly education for SNF nursing staff. A unique aspect of this model was that individual attending physicians in the associated SNFs could decide whether to enroll their patients in the model; patients not enrolled represented a contemporaneous control cohort. The authors found a nearly 30% reduction in the odds of 30-day readmission (OR 0.71 [0.60–0.85] after adjustment), which was robust to multiple sensitivity analyses, including a propensity-matched cohort comparison. The authors should be commended for working to mitigate these potential confounders, thereby strengthening their conclusions. Such a large reduction in readmissions reflects their high underlying prevalence (23% in the nonintervention cohort).
This report closely follows the evaluation of a similar program at the Cleveland Clinic called Connected Care Model (CCM), in which 4 physicians and 5 NPs or physician assistants provided care, including 24/7 call availability, in 7 associated SNFs.3 In a retrospective pre-post analysis comparing the 30-day readmission rates of these SNFs with those of others in the network, similar reductions in readmissions were observed. ECP and CCM represent important extensions of a much larger body of evidence, from the Evercare model4 to the Initiative to Reduce Avoidable Hospitalizations demonstration project, which suggests that adding NPs to nursing homes reduces hospitalizations.5
However, several factors have to be considered before disseminating ECP or CCM. First, other promising “proof of concept” quality improvement studies were not efficacious when rigorously tested in nursing homes.6 Second, these programs are representative of large academic medical centers, which may establish different relationships with different SNFs compared with smaller or less well-resourced hospitals. As the Initiative to Reduce Hospitalizations demonstrated, even a fundamentally similar intervention can have extremely different results depending on the nursing homes involved,5 and the science behind establishing effective hospital–SNF partnerships is still in its infancy.7 Third, both studies have significant methodological limitations, including most importantly that they are conducted within SNFs selected to be part of their hospitals’ network.
These significant early efforts also present an opportunity to reconsider the underlying assumption of these models: that adding more supervisory clinicians to SNFs is the right approach to reduce hospitalizations. Although adding resources is an attractive “plug and play” solution for many problems in healthcare delivery, placing only 1 NP in each of the 15,583 certified nursing facilities in the United States would employ fully 10% of the entire NP workforce. Amid rising concerns about costs related to our aging population, these interventions face substantial headwinds toward becoming the standard of care without demonstrating cost effectiveness. Furthermore, many SNF directors might suggest that hospitals and hospitalists working with them to address fundamental (but much more intransigent) problems in SNFs, such as high staff turnover, low concentration of highly skilled staff (RNs and MDs), regulatory burden, and hospitals using SNFs like stepdown units, could represent a generalizable and sustainable solution.
We realize that this argument is tricky for hospitalists because its underlying logic (care has become too complex, patients are too sick, and dedicated personnel are needed) also played a major role in establishing our existence. One possibility is that like hospitalists, NPs and a growing cadre of “SNFists” will become major drivers of quality improvement, education, and leadership locally at these facilities, thereby leading to sustainable change.8 Similarly, current conditions may drive recognition that a specific set of skills is required to function effectively in the SNF environment,9 just as we believe hospitalists need unique skills to excel in today’s hospital environment.
Studies such as that of Rosen et al. are valuable for JHM because they prompt us to recognize that we as hospitalists have much to share and learn from nursing homes and the dedicated practitioners who work there. In fact, we argue that few places in the healthcare system are more in need of innovation than hospital–nursing home relationships, and hospitalists do not just have a vested clinical interest; in many ways, we see a mirror of our own development as a “specialty.” We encourage hospitals and hospitalists to take up this challenge on behalf of some of the most vulnerable patients in our system during critical times in their care trajectory. As the Commission for Long-Term Care (www.ltccommission.org) wrote in its final report to Congress: “The need is great. The time to act is now.”
Disclosures
Dr. Burke is supported by a VA Health Services Research and Development (HSR&D) Career Development Award. All opinions are those of the authors and do not necessarily represent those of the Department of Veterans Affairs. Dr. Greysen has nothing to disclose.
1. Burke RE, Cumbler E, Coleman EA, Levy C. Post-acute care reform: Implications and opportunities for hospitalists. J Hosp Med. 2017;12(1):46-51. 10.3810/hp.2012.02.958. PubMed
2. Rosen BT, Halbert RJ, Hart K, Diniz MA, Isonaka S, Black JT. The enhanced care program: Impact of a care transitions program on 30-day hospital readmissions for patients discharged from an acute care facility to skilled nursing facilities. J Hosp Med. 2018;13(4):229-235.
3. Rothberg MB. Impact of a connected care model on 30-day readmission rates from skilled nursing facilities. J Hosp Med. 2017;12(4):238-244. 10.12788/jhm.2710. PubMed
4. Kane RL, Keckhafer G, Flood S, Bershadsky B, Siadaty MS. The effect of Evercare on hospital use. J Am Geriatr Soc. 2003;51(10):1427-1434. 10.1046/j.1532-5415.2003.51461.x. PubMed
5. Ingber MJ, Feng Z, Khatutsky G, et al. Initiative to reduce avoidable hospitalizations among nursing facility residents shows promising results. Health Aff Proj Hope. 2017;36(3):441-450. 10.1377/hlthaff.2016.1310. PubMed
6. Kane RL, Huckfeldt P, Tappen R, et al. Effects of an intervention to reduce hospitalizations from nursing homes: A randomized implementation trial of the INTERACT Program. JAMA Intern Med. 2017;177(9):1257-1264. 10.1001/jamainternmed.2017.2657. PubMed
7. Lage DE, Rusinak D, Carr D, Grabowski DC, Ackerly DC. Creating a network of high-quality skilled nursing facilities: preliminary data on the postacute care quality improvement experiences of an accountable care organization. J Am Geriatr Soc. 2015;63(4):804-808. 10.1111/jgs.13351. PubMed
8. Ryskina KL, Polsky D, Werner RM. Physicians and advanced practitioners specializing in nursing home care. JAMA. 2017;318(20):2040-2042. 10.1001/jama.2017.13378. PubMed
9. Gillespie SM, Levy CR, Katz PR. What exactly is an “SNF-ist?” JAMA Intern Med. 2018;178(1):153-154. 10.1001/jamainternmed.2017.7212. PubMed
© 2018 Society of Hospital Medicine
Hospitalist Value in an ACO World
The accountable care organization (ACO) concept, elucidated in 2006 as the development of partnerships between hospitals and physicians to coordinate and deliver efficient care,1 seeks to remove existing barriers to improving value.2 Some advocate this concept as a promising payment model that could successfully realign the current payment system to financially reward improvements in quality and efficiency that bend the cost curve.3,4 Hospitalists fit well with this philosophy. As the fastest growing medical specialty in the history of American medicine, from a couple of thousand hospitalists in the mid-1990s to more than 50,000, the remarkable progression of hospitalists has ostensibly been driven partially by hospitals’ efforts to improve the value equation through enhanced efficiency in inpatient care. Importantly, hospitalists probably provide care for more than half of all hospitalized Medicare beneficiaries and increasingly patients in skilled nursing facilities (ie, SNFists).5 Along with primary care physicians, hospitalists thus represent an essential group of physicians needed to transform care delivery.
RAPID GROWTH AND THE FUTURE OF ACOs
When the Affordable Care Act (ACA) established the Medicare Shared Savings Program (MSSP), ACOs leaped from being an intellectual concept1,2 into a pragmatic health system strategy.3,4 Following Medicare, various private health insurance plans and some state Medicaid programs entered into contracts with groups of healthcare providers (hospitals, physicians, or health systems) to serve as ACOs for their insured enrollees.6 Leavitt Partners’ ACO tracking database showed that the number of ACOs increased from 157 in March of 2012 to 782 in December of 2015.7
Until recently, the federal government’s commitment to having 50% of total Medicare spending via value-based payment models by 2018, coupled with endorsement from state Medicaid programs and commercial insurers, demonstrated strong support for continuation of ACOs. Unexpectedly on August 15, 2017, the Centers for Medicare & Medicaid Services (CMS) outlined a plan in its proposed rulemaking to cancel the Episode Payment Models and the Cardiac Rehabilitation incentive payment model, which were scheduled to commence on January 1, 2018. CMS also plans to scale back the mandatory Comprehensive Care for Joint Replacement (CCJR) bundled payment model from 67 selected geographic areas to 34. Although this proposed rulemaking created some equipoise in the healthcare industry regarding the future of value-based reimbursement approaches, cost containment and improved efficiency remain as major focuses of the federal government’s healthcare effort. Notably, CMS offers providers that are newly excluded from the CCJR model the opportunity to voluntarily participate in the program and is expected to increase opportunities for providers to participate in voluntary rather than large-scale mandatory episode payment model initiatives. In 2018, the agency also plans to develop new voluntary bundled payment models that will meet criteria to be considered an advanced alternative payment model for Quality Payment Program purposes.
Importantly, the value-based reimbursement movement was well underway before ACA legislation. Through ACA health reform, value-based reimbursement efforts were expanded through ACOs, bundled payments, value-based purchasing, the CMS Innovation Center and other initiatives. With health systems having an overflowing plate of activities, a wait-and-see attitude might seem reasonable at first. However, being unprepared for the inevitable shift to value-based reimbursement and reduced fee-for-service revenue places an organization at risk. A successful ACO requires system-level transformation, especially cultural and structural changes to achieve clinical integration. Being embedded in health system delivery, hospitalists can help shape a team-oriented culture and foster success in value-based payment models. This requires hospitalists to take a more active role in assessing and striking a balance between high-quality, cost-efficient care and financial risk inherent in ACO models.
WHAT HOSPITALISTS NEED TO KNOW ABOUT ACOs
The key to hospitalists fulfilling their value creation potential and becoming enablers for ACO success lies in developing a thorough understanding of the aspects of an ACO that promote efficient and effective care, while accounting for financial factors. Fundamentally, the ACO concept combines provider payment and delivery system reforms. Specifically, the definition of an ACO contains 3 factors: (1) a local healthcare organization (eg, hospital or multispecialty group of physicians) with a related set of providers that (2) can be held accountable for the cost and quality of care delivered to (3) a defined population. While the notion of accountability is not new, the locus of accountability is changed in the ACO model—emphasizing accountability at the level of actual care delivery with documentation of quality and cost outcomes. The ACO approach aims to address multiple, frequent, and recurring problems, including lack of financial incentives to improve quality and reduce cost, as well as the negative consequences of a pay-for-volume system—uncoordinated and fragmented care, overutilization of unnecessary tests and treatments, and poor patient experience all manifested as unwarranted geographic variation in practice patterns, clinical outcomes, and health spending. Participants in an ACO are rewarded financially if they can slow the growth of their patients’ healthcare costs while maintaining or improving the quality of care delivered. To succeed in this ACO world, hospitalists must assume greater prudence in the use of healthcare services while improving (or at a minimum, maintaining) patient outcomes, thus excising avoidable waste across the continuum of care.
More than half of ACOs include a hospital.8 However, whether hospital-led ACOs possess an advantage remains to be elucidated. Early reports indicated that physician-led ACOs saved more money.9,10 However, others argue that hospitals11 are better capitalized, have greater capacity for data sharing, and possess economies of scale that allow them to invest in more advanced technology, such as predictive modeling and/or simulation software. Such analytics can identify high-cost patients (ie, multiple comorbidities), super utilizers and populations lacking care, allowing ACOs to implement preventive measures to reduce unnecessary utilization. Recently released CMS MSSP 2016 performance data12 showed that nearly half (45%) of physician-only ACOs earned shared savings, whereas 23% of ACOs that include hospitals earned shared savings. However, among all the ACOs that achieved savings, ACO entities that include hospitals generated the highest amount of shared savings (eg, Advocate, Hackensack Alliance, Cleveland Clinic, and AMITA Health). Notably, hospital-led ACOs tend to have much larger beneficiary populations than physician-led ACOs, which may create a scenario of higher risk but higher potential reward.
HOW HOSPITALISTS CONTRIBUTE VALUE TO ACO SUCCESS
The emphasis on value over volume inherent in the development of ACOs occurs through employing care strategies implemented through changes in policies, and eventual structural and cultural changes. These changes require participating organizations to possess certain key competencies, including the following: 1) leadership that facilitates change; 2) organizational culture of teamwork; 3) collaborative relationships among providers; 4) information technology infrastructure for population management and care coordination; 5) infrastructure for monitoring, managing, and reporting quality; 6) ability to manage financial risk; 7) ability to receive and distribute payments or savings; and 8) resources for patient education and support.2,3,13-16 Table 1 summarizes the broad range of roles that hospitalists can serve in delivering care to ACO populations.17-19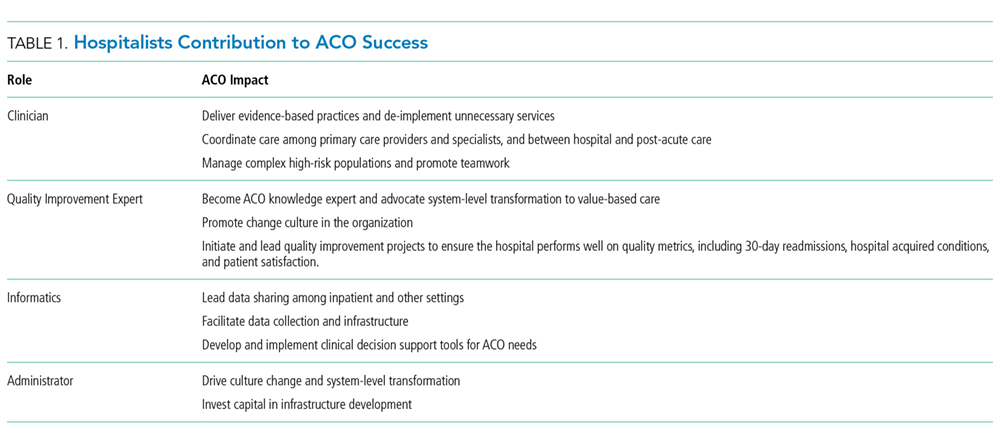
Hospitalists’ active pursuit of nonclinical training and selection for administrative positions demonstrate their proclivity to provide these competencies. In addition to full-time clinician hospitalists, who can directly influence the delivery of high-value care to patients, hospitalists serve many other roles in hospitals and each can contribute differently based on their specialized expertise. Examples include the success of the Society of Hospital Medicine’s Leadership Academy; the acknowledged expertise of hospitalists in quality improvement (QI), informatics, teamwork, patient experience, care coordination and utilization; and advancement of hospitalists to senior leadership positions (eg, CQO, CMO, CEO). Given that nearly a third of healthcare expenditures are for hospital care,20 hospitalists are in a unique position to foster ACO competencies while impacting the quality of care episodes associated with an index hospital stay.
Importantly, hospitalists cannot act as gatekeepers to restrict care. Managed care organizations and health maintenance organizations use of this approach in the 1990s to limit access to services in order to reduce costs led to unacceptable outcomes and numerous malpractice lawsuits. ACOs should aspire to deliver the most cost-effective high-quality care, and their performance should be monitored to ensure that they provide recommended services and timely access. The Medicare ACO contract holds the provider accountable for meeting 34 different quality measures (Supplemental Table 1), and hospitalists can influence outcomes for the majority. Especially through hospital and health system QI initiatives, hospitalists can directly impact and share accountability for measures ranging from care coordination to implementation of evidence-based care (eg, ACE inhibitors and beta blockers for heart failure) to patient and family caregiver experience.
Aligned with Medicare ACO quality measures, 5 high-impact target areas were identified for ACOs21: (1) Prevention and wellness; (2) Chronic conditions/care management; (3) Reduced hospitalizations; (4) Care transitions across the fragmented system; and (5) Multispecialty care coordination of complex patients. One essential element of a successful ACO is the ability to implement evidence-based medical guidelines and/or practices across the continuum of care for selected targeted initiatives. Optimizing care coordination/continuum requires team-based care, and hospitalists already routinely collaborate with nurses, social workers, case managers, pharmacists, and other stakeholders such as dieticians and physical therapists on inpatient care. Hospitalists are also experienced in facilitating communication and improving integration and coordination efficiencies among primary care providers and specialists, and between hospital care and post-acute care, as they coordinate post-hospital care and follow-up. This provides an opportunity to lead health system care coordination efforts, especially for complex and/or high-risk patients.22,23 CMS MSSP 2016 performance data12 showed that ACOs achieving shared savings had a decline in inpatient expenditures and utilization across several facility types (hospital, SNF, rehabilitation, long term). Postacute care management is critical to earning shared savings; SNF and Home Health expenditures fell by 18.3% and 9.7%, respectively, on average. We believe that hospitalists can have more influence over these cost areas by influencing treatment of hospitalized patients in a timely manner, discharge coordination, and selection of appropriate disposition locations. Hospitalists also play an integral role in ensuring the hospital performs well on quality metrics, including 30-day readmissions, hospital acquired conditions, and patient satisfaction. Examples below document the effectiveness of hospitalists in this new ACO era.
Care Transitions/Coordination
Before the Hospital Readmission Reduction Program (HRRP) delineated in the ACA, hospitalists developed Project BOOST (Better Outcomes by Optimizing Care Transitions) to improve hospital discharge care transition. The evidence-based foundation of this project led CMS to list Project BOOST as an example program that can reduce readmissions.24 Through the dissemination and mentored implementation of Project BOOST to over 200 hospitals across the United States,25 hospitalists contributed to the marked reduction in hospital readmission occurring since 2010.26 Although hospital medicine began as a practice specific to the hospital setting, hospitalists’ skills generated growing demand for them in postacute facilities. SNF residents commonly come from hospitals postdischarge and suffer from multiple comorbidities and limitations in activities of daily living. Not surprisingly, SNF residents experience high rates of rehospitalizations.27 Hospitalists can serve as a bridge between hospitals and SNFs and optimize this transition process to yield improved outcomes. Industry experts endorse this approach.28 A recent study demonstrated a significant reduction in readmissions in 1 SNF (32.3% to 16.1%, odds ratio = 0.403, P < .001), by having a hospitalist-led team follow patients discharged from the hospital.29
Chronic Conditions Management/High-Risk Patients
Interest in patients with multiple chronic comorbidities and social issues intensifies as healthcare systems focus limited resources on these high-risk patients to prevent the unnecessary use of costly services.30,31 As health systems assume financial risk for health outcomes and costs of designated patient groups, they undertake efforts to understand the population they serve. Such efforts aim to identify patients with established high utilization patterns (or those at risk for high utilization). This knowledge enables targeted actions to provide access, treatment, and preventive interventions to avoid unneeded emergency and hospital services. Hospitalists commonly care for these patients and are positioned to lead the implementation of patient risk assessment and stratification, develop patient-centered care models across care settings, and act as a liaison with primary care. For frail elderly and seriously ill patients, the integration of hospitalists into palliative care provides several opportunities for improving the quality of care at the end of life.32 As patients and their family caregivers commonly do not address goals of care until faced with a life-threatening condition in the hospital, hospitalists represent ideal primary palliative care physicians to initiate these conversations.33 A hospitalist communicating with a patient and/or their family caregiver about alleviating symptoms and clarifying patients’ preferences for care often yields decreases in ineffective healthcare utilization and better patient outcomes. The hospitalists’ ability to communicate with other providers within the hospital setting also allows them to better coordinate interdisciplinary care and prevent unnecessary and ineffective treatments and procedures.
De-Implementation/Waste Reduction
The largest inefficiencies in healthcare noted in the National Academy of Medicine report, Demanding Value from Our Health Care (2012), are failure to deliver known beneficial therapies or providing unnecessary or nonevidenced based services that do not improve outcomes, but come with associated risk and cost.34 “De-implementation” of unnecessary diagnostic tests or ineffective or even harmful treatments by hospitalists represents a significant opportunity to reduce costs while maintaining or even improving the quality of care. The Society of Hospital Medicine joined the Choosing Wisely® campaign and made 5 recommendations in adult care as an explicit starting point for eliminating waste in the hospital in 2013.35 Since then, hospitalists have participated in multiple successful efforts to address overutilization of care; some published results include the following:
- decreased frequency of unnecessary common labs through a multifaceted hospitalist QI intervention;36
- reduced length of stay and cost by appropriate use of telemetry;37 and
- reduced unnecessary radiology testing by providing physicians with individualized audit and feedback reports.38
CONCLUSION
Hundreds of ACOs now exist across the US, formed by a variety of providers including hospitals, physician groups, and integrated delivery systems. Provider groups range in size from primary care-focused physician groups with a handful of offices to large, multistate integrated delivery systems with dozens of hospitals and hundreds of office locations. Evaluations of ACO outcomes reveal mixed results.9,39-53 Admittedly, assessments attempting to compare the magnitude of savings across ACO models are difficult given the variation in size, variability in specific efforts to influence utilization, and substantial turnover among participating beneficiaries.54 Nonetheless, a newly published Office of Inspector General report55 showed that most Medicare ACOs reduced spending and improved care quality (82% of the individual quality measures) over the first 3 years of the program, and savings increased with duration of an ACO program. The report also noted that considerable time and managerial resources are required to implement changes to improve quality and lower costs. While the political terrain ostensibly supports value-based care and the need to diminish the proportion of our nation’s gross domestic product dedicated to healthcare, health systems are navigating an environment that still largely rewards volume. Hospitalists may be ideal facilitators for this transitional period as they possess the clinical experience caring for complex patients with multiple comorbidities and quality improvement skills to lead efforts in this new ACO era.
Disclosures
The authors have nothing to disclose.
1. Fisher ES, Staiger DO, Bynum JP, Gottlieb DJ. Creating accountable care organizations: the extended hospital medical staff. Health Aff(Project Hope). 2007;26(1):w44-w57. PubMed
2. Fisher ES, McClellan MB, Bertko J, et al. Fostering accountable health care: moving forward in medicare. Health Aff(Project Hope). 2009;28(2):w219-w231. PubMed
3. McClellan M, McKethan AN, Lewis JL, Roski J, Fisher ES. A national strategy to put accountable care into practice. Health Aff(Project Hope). 2010;29(5):982-990. PubMed
4. Berwick DM. Making good on ACOs’ promise--the final rule for the Medicare shared savings program. N Engl J Med. 2011;365(19):1753-1756. PubMed
5. Kuo YF, Sharma G, Freeman JL, Goodwin JS. Growth in the care of older patients by hospitalists in the United States. N Engl J Med. 2009;360(11):1102-1112. PubMed
6. Kennedy K. Health Care Providers Embracing Cost-saving Groups. USA Today, July 24, 2011.
7. Leavitt Partners. Available at http://leavittpartners.com, April 2016.
8. Colla CH, Lewis VA, Tierney E, Muhlestein DB. Hospitals Participating In ACOs Tend To Be Large And Urban, Allowing Access To Capital And Data. Health Aff(Millwood). 2016;35(3):431-439. PubMed
9. McWilliams JM, Hatfield LA, Chernew ME, Landon BE, Schwartz AL. Early Performance of Accountable Care Organizations in Medicare. N Engl J Med. 2016;374(24):2357-2366. PubMed
10. Muhlestein D, Saunders R, McClellan M. Medicare Accountable Care Organization Results For 2015: The Journey To Better Quality And Lower Costs Continues. In. Health Affairs Blog. Bethesda, MD 2016.
11. Chernew ME. New Health Care Symposium: Building An ACO---What Services Do You Need And How Are Physicians Impacted? In Health Affairs Blog. Bethesda, MD 2016.
12. Centers for Medicare & Medicaid Services. Performance Year 2016 Quality Performance and Financial Reconciliation Results for ACOs with 2012-2016 Start Dates. Available at https://strategichealthcare.net/wp-content/uploads/2017/10/CMS-Slides-on-ACOs.pdf. 2017.
13. Shortell SM, Casalino LP. Implementing qualifications criteria and technical assistance for accountable care organizations. JAMA. 2010;303(17):1747-1748. PubMed
14. Shortell SM, Casalino LP, Fisher ES. How the center for Medicare and Medicaid innovation should test accountable care organizations. Health Aff (Project Hope). 2010;29(7):1293-1298. PubMed
15. Medicare Payment Advisory Commission. Accountable Care Organizations Payment Systems October 2015. Available at http://www.medpac.gov/documents/payment-basics/accountable-care-organization-payment-systems-15.pdf?sfvrsn=0.
16. American Hospital Association. 2010 Committee on Research. AHA Research Synthesis Report: Accountable Care Organization.
17. D’Aunno T, Broffman L, Sparer M, Kumar SR. Factors That Distinguish High-Performing Accountable Care Organizations in the Medicare Shared Savings Program. Health Serv. Res. 2016. PubMed
18. Peiris D, Phipps-Taylor MC, Stachowski CA, et al. ACOs Holding Commercial Contracts Are Larger And More Efficient Than Noncommercial ACOs. Health Aff (Project Hope). 2016;35(10):1849-1856. PubMed
19. Ouayogode MH, Colla CH, Lewis VA. Determinants of success in Shared Savings Programs: An analysis of ACO and market characteristics. Healthcare (Amsterdam, Netherlands). 2017;5(1-2):53-61. PubMed
20. National Center for Health Statistics. Health, United States, 2016: With Chartbook on Long-term Trends in Health. In: Hyattsville, MD.2017. PubMed
21. Gbemudu JN. Larson BK, Van Citters AD, Kreindler SA, Nelson EC, Shortell SM, Fisher ES. Norton Healthcare: A Strong Payer–Provider Partnership for the Journey to Accountable Care. January 2012. Available at http://www.commonwealthfund.org/~/media/files/publications/case-study/2012/jan/1574_gbemudu_norton_case-study_01_12_2012.pdf.
22. O’Leary KJ, Haviley C, Slade ME, Shah HM, Lee J, Williams MV. Improving teamwork: impact of structured interdisciplinary rounds on a hospitalist unit. J Hosp Med. 2011;6(2):88-93. PubMed
23. Hansen LO, Greenwald JL, Budnitz T, et al. Project BOOST: effectiveness of a multihospital effort to reduce rehospitalization. J. Hosp. Med.. 2013;8(8):421-427. PubMed
24. Centers for Medicare and Medicaid Services. Solicitation for Applications: Community-based Care Transitions Program. Available at https://innovation.cms.gov/Files/Migrated-Medicare-Demonstration-x/CCTP-Solicitation.pdf. September 7, 2017.
25. Li J, Hinami K, Hansen LO, Maynard G, Budnitz T, Williams MV. The physician mentored implementation model: a promising quality improvement framework for health care change. Acad Med. 2015;90(3):303-310. PubMed
26. Williams MV, Li J, Hansen LO, et al. Project BOOST implementation: lessons learned. South Med J. 2014;107(7):455-465. PubMed
27. Ouslander JG, Lamb G, Perloe M, et al. Potentially avoidable hospitalizations of nursing home residents: frequency, causes, and costs: [see editorial comments by Drs. Jean F. Wyman and William R. Hazzard, pp 760-761]. J Am Geriatr Soc. 2010;58(4):627-635. PubMed
28. Pittman D. SNFs: New Turf for Hospitalists? 2013. Available at https://www.medpagetoday.com/hospitalbasedmedicine/hospitalists/39401.
29. Petigara S, Krishnamurthy M, Livert D. Necessity is the mother of invention: an innovative hospitalist-resident initiative for improving quality and reducing readmissions from skilled nursing facilities. J Community Hosp Intern Med Perspect. 2017;7(2):66-69. PubMed
30. Silow-Carroll S, Edwards J. Early Adopters of the Accountable Care Model: A Field Report on Improvements in Health Care Delivery. New York, NY: The Commonwealth Fund;March 2013.
31. Hasselman D. Super-Utilizer Summit: Common Themes from Innovative Complex Care Management Programs. Hamilton, NJ: Center for Health Care Strategies;October 2013.
32. Wald HL, Glasheen JJ, Guerrasio J, Youngwerth JM, Cumbler EU. Evaluation of a hospitalist-run acute care for the elderly service. J Hosp Med. 2011;6(6):313-321. PubMed
33. Quill TE, Abernethy AP. Generalist plus specialist palliative care--creating a more sustainable model. N Engl J Med. 2013;368(13):1173-1175. PubMed
34. O’Kane M, Buto K, Alteras T, et. al. Demanding Value from Our Health Care: Motivating Patient Action to Reduce Waste in Health Care. Institute of Medicine of the National Academies. July 2012. https://nam.edu/wp-content/uploads/2015/06/VSRT-DemandingValue.pdf. Accessed Accessed June 18, 2017.
35. Bulger J, Nickel W, Messler J, et al. Choosing wisely in adult hospital medicine: five opportunities for improved healthcare value. J Hosp Med. 2013;8(9):486-492. PubMed
36. Corson AH, Fan VS, White T, et al. A multifaceted hospitalist quality improvement intervention: Decreased frequency of common labs. J Hosp Med. 2015;10(6):390-395. PubMed
37. Svec D, Ahuja N, Evans KH, et al. Hospitalist intervention for appropriate use of telemetry reduces length of stay and cost. J Hosp Med. 2015;10(9):627-632. PubMed
38. Neeman N, Quinn K, Soni K, Mourad M, Sehgal NL. Reducing radiology use on an inpatient medical service: choosing wisely. JAMA Intern Med. 2012;172(20):1606-1608. PubMed
39. Abrams M, Nuzum R, Zezza M, Ryan J, Kiszla J, Guterman S. The Affordable Care Act’s Payment and Delivery System Reforms: A Progress Report at Five Years. Bipartisan Policy Center, May 2015. Available at http://www.commonwealthfund.org/publications/issue-briefs/2015/may/aca-payment-and-delivery-system-reforms-at-5-years.
40. Kocot SL, White R, Katikaneni P, McClellan MB. A More Complete Picture of Pioneer ACO Results. The Brookings Institution, October 13, 2014. Available at http://www.brookings.edu/blogs/up-front/posts/2014/10/09-pioneer-aco-results-mcclellan/#recent_rr/
41. Blumenthal D, Abrams M, Nuzum R. The Affordable Care Act at 5 Years. N Engl J Med. 2015;372(25):2451-2458. PubMed
42. Colla CH, Lewis VA, Kao LS, O’Malley AJ, Chang CH, Fisher ES. Association Between Medicare Accountable Care Organization Implementation and Spending Among Clinically Vulnerable Beneficiaries. JAMA Intern Med. 2016;176(8):1167-1175. PubMed
43. Epstein AM, Jha AK, Orav EJ, et al. Analysis of early accountable care organizations defines patient, structural, cost, and quality-of-care characteristics. Health Aff (Project Hope). 2014;33(1):95-102. PubMed
44. Fullerton CA, Henke RM, Crable E, Hohlbauch A, Cummings N. The Impact Of Medicare ACOs On Improving Integration And Coordination Of Physical And Behavioral Health Care. Health Aff (Project Hope). 2016;35(7):1257-1265. PubMed
45. Herrel LA, Norton EC, Hawken SR, Ye Z, Hollenbeck BK, Miller DC. Early impact of Medicare accountable care organizations on cancer surgery outcomes. Cancer. 2016;122(17):2739-2746. PubMed
46. McConnell KJ, Renfro S, Chan BK, et al. Early Performance in Medicaid Accountable Care Organizations: A Comparison of Oregon and Colorado. JAMA Intern Med. 2017;177(4):538-545. PubMed
47. Nyweide DJ, Lee W, Cuerdon TT, et al. Association of Pioneer Accountable Care Organizations vs traditional Medicare fee for service with spending, utilization, and patient experience. JAMA. 2015;313(21):2152-2161. PubMed
48. Rajkumar R, Press MJ, Conway PH. The CMS Innovation Center--a five-year self-assessment. N Engl J Med. 2015;372(21):1981-1983. PubMed
49. Rose S, Zaslavsky AM, McWilliams JM. Variation In Accountable Care Organization Spending And Sensitivity To Risk Adjustment: Implications For Benchmarking. Health affairs (Project Hope). 2016;35(3):440-448. PubMed
50. Shortell SM, Poon BY, Ramsay PP, et al. A Multilevel Analysis of Patient Engagement and Patient-Reported Outcomes in Primary Care Practices of Accountable Care Organizations. J Gen Intern Med. 2017;32(6):640-647. PubMed
51. Winblad U, Mor V, McHugh JP, Rahman M. ACO-Affiliated Hospitals Reduced Rehospitalizations From Skilled Nursing Facilities Faster Than Other Hospitals. Health Aff (Project Hope). 2017;36(1):67-73. PubMed
52. Zhang Y, Caines KJ, Powers CA. Evaluating the Effects of Pioneer Accountable Care Organizations on Medicare Part D Drug Spending and Utilization. Med Care. 2017;55(5):470-475. PubMed
53. Muhlestein D. Medicare ACOs: Mixed Initial Results and Cautious Optimism. Health Affairs Blog, February 4, 2014. Available at http://healthaffairs.org/blog/2014/02/04/medicare-acos-mixed-initial-results-and-cautious-optimism/.
54. Hsu J, Price M, Vogeli C, et al. Bending The Spending Curve By Altering Care Delivery Patterns: The Role Of Care Management Within A Pioneer ACO. Health Aff (Project Hope). 2017;36(5):876-884. PubMed
55. Medicare Shared Savings Program Accountable Care Organizations Have Shown Potential For Reducing Spending And Improving Quality. Office of Inspector General;August 2017.
The accountable care organization (ACO) concept, elucidated in 2006 as the development of partnerships between hospitals and physicians to coordinate and deliver efficient care,1 seeks to remove existing barriers to improving value.2 Some advocate this concept as a promising payment model that could successfully realign the current payment system to financially reward improvements in quality and efficiency that bend the cost curve.3,4 Hospitalists fit well with this philosophy. As the fastest growing medical specialty in the history of American medicine, from a couple of thousand hospitalists in the mid-1990s to more than 50,000, the remarkable progression of hospitalists has ostensibly been driven partially by hospitals’ efforts to improve the value equation through enhanced efficiency in inpatient care. Importantly, hospitalists probably provide care for more than half of all hospitalized Medicare beneficiaries and increasingly patients in skilled nursing facilities (ie, SNFists).5 Along with primary care physicians, hospitalists thus represent an essential group of physicians needed to transform care delivery.
RAPID GROWTH AND THE FUTURE OF ACOs
When the Affordable Care Act (ACA) established the Medicare Shared Savings Program (MSSP), ACOs leaped from being an intellectual concept1,2 into a pragmatic health system strategy.3,4 Following Medicare, various private health insurance plans and some state Medicaid programs entered into contracts with groups of healthcare providers (hospitals, physicians, or health systems) to serve as ACOs for their insured enrollees.6 Leavitt Partners’ ACO tracking database showed that the number of ACOs increased from 157 in March of 2012 to 782 in December of 2015.7
Until recently, the federal government’s commitment to having 50% of total Medicare spending via value-based payment models by 2018, coupled with endorsement from state Medicaid programs and commercial insurers, demonstrated strong support for continuation of ACOs. Unexpectedly on August 15, 2017, the Centers for Medicare & Medicaid Services (CMS) outlined a plan in its proposed rulemaking to cancel the Episode Payment Models and the Cardiac Rehabilitation incentive payment model, which were scheduled to commence on January 1, 2018. CMS also plans to scale back the mandatory Comprehensive Care for Joint Replacement (CCJR) bundled payment model from 67 selected geographic areas to 34. Although this proposed rulemaking created some equipoise in the healthcare industry regarding the future of value-based reimbursement approaches, cost containment and improved efficiency remain as major focuses of the federal government’s healthcare effort. Notably, CMS offers providers that are newly excluded from the CCJR model the opportunity to voluntarily participate in the program and is expected to increase opportunities for providers to participate in voluntary rather than large-scale mandatory episode payment model initiatives. In 2018, the agency also plans to develop new voluntary bundled payment models that will meet criteria to be considered an advanced alternative payment model for Quality Payment Program purposes.
Importantly, the value-based reimbursement movement was well underway before ACA legislation. Through ACA health reform, value-based reimbursement efforts were expanded through ACOs, bundled payments, value-based purchasing, the CMS Innovation Center and other initiatives. With health systems having an overflowing plate of activities, a wait-and-see attitude might seem reasonable at first. However, being unprepared for the inevitable shift to value-based reimbursement and reduced fee-for-service revenue places an organization at risk. A successful ACO requires system-level transformation, especially cultural and structural changes to achieve clinical integration. Being embedded in health system delivery, hospitalists can help shape a team-oriented culture and foster success in value-based payment models. This requires hospitalists to take a more active role in assessing and striking a balance between high-quality, cost-efficient care and financial risk inherent in ACO models.
WHAT HOSPITALISTS NEED TO KNOW ABOUT ACOs
The key to hospitalists fulfilling their value creation potential and becoming enablers for ACO success lies in developing a thorough understanding of the aspects of an ACO that promote efficient and effective care, while accounting for financial factors. Fundamentally, the ACO concept combines provider payment and delivery system reforms. Specifically, the definition of an ACO contains 3 factors: (1) a local healthcare organization (eg, hospital or multispecialty group of physicians) with a related set of providers that (2) can be held accountable for the cost and quality of care delivered to (3) a defined population. While the notion of accountability is not new, the locus of accountability is changed in the ACO model—emphasizing accountability at the level of actual care delivery with documentation of quality and cost outcomes. The ACO approach aims to address multiple, frequent, and recurring problems, including lack of financial incentives to improve quality and reduce cost, as well as the negative consequences of a pay-for-volume system—uncoordinated and fragmented care, overutilization of unnecessary tests and treatments, and poor patient experience all manifested as unwarranted geographic variation in practice patterns, clinical outcomes, and health spending. Participants in an ACO are rewarded financially if they can slow the growth of their patients’ healthcare costs while maintaining or improving the quality of care delivered. To succeed in this ACO world, hospitalists must assume greater prudence in the use of healthcare services while improving (or at a minimum, maintaining) patient outcomes, thus excising avoidable waste across the continuum of care.
More than half of ACOs include a hospital.8 However, whether hospital-led ACOs possess an advantage remains to be elucidated. Early reports indicated that physician-led ACOs saved more money.9,10 However, others argue that hospitals11 are better capitalized, have greater capacity for data sharing, and possess economies of scale that allow them to invest in more advanced technology, such as predictive modeling and/or simulation software. Such analytics can identify high-cost patients (ie, multiple comorbidities), super utilizers and populations lacking care, allowing ACOs to implement preventive measures to reduce unnecessary utilization. Recently released CMS MSSP 2016 performance data12 showed that nearly half (45%) of physician-only ACOs earned shared savings, whereas 23% of ACOs that include hospitals earned shared savings. However, among all the ACOs that achieved savings, ACO entities that include hospitals generated the highest amount of shared savings (eg, Advocate, Hackensack Alliance, Cleveland Clinic, and AMITA Health). Notably, hospital-led ACOs tend to have much larger beneficiary populations than physician-led ACOs, which may create a scenario of higher risk but higher potential reward.
HOW HOSPITALISTS CONTRIBUTE VALUE TO ACO SUCCESS
The emphasis on value over volume inherent in the development of ACOs occurs through employing care strategies implemented through changes in policies, and eventual structural and cultural changes. These changes require participating organizations to possess certain key competencies, including the following: 1) leadership that facilitates change; 2) organizational culture of teamwork; 3) collaborative relationships among providers; 4) information technology infrastructure for population management and care coordination; 5) infrastructure for monitoring, managing, and reporting quality; 6) ability to manage financial risk; 7) ability to receive and distribute payments or savings; and 8) resources for patient education and support.2,3,13-16 Table 1 summarizes the broad range of roles that hospitalists can serve in delivering care to ACO populations.17-19
Hospitalists’ active pursuit of nonclinical training and selection for administrative positions demonstrate their proclivity to provide these competencies. In addition to full-time clinician hospitalists, who can directly influence the delivery of high-value care to patients, hospitalists serve many other roles in hospitals and each can contribute differently based on their specialized expertise. Examples include the success of the Society of Hospital Medicine’s Leadership Academy; the acknowledged expertise of hospitalists in quality improvement (QI), informatics, teamwork, patient experience, care coordination and utilization; and advancement of hospitalists to senior leadership positions (eg, CQO, CMO, CEO). Given that nearly a third of healthcare expenditures are for hospital care,20 hospitalists are in a unique position to foster ACO competencies while impacting the quality of care episodes associated with an index hospital stay.
Importantly, hospitalists cannot act as gatekeepers to restrict care. Managed care organizations and health maintenance organizations use of this approach in the 1990s to limit access to services in order to reduce costs led to unacceptable outcomes and numerous malpractice lawsuits. ACOs should aspire to deliver the most cost-effective high-quality care, and their performance should be monitored to ensure that they provide recommended services and timely access. The Medicare ACO contract holds the provider accountable for meeting 34 different quality measures (Supplemental Table 1), and hospitalists can influence outcomes for the majority. Especially through hospital and health system QI initiatives, hospitalists can directly impact and share accountability for measures ranging from care coordination to implementation of evidence-based care (eg, ACE inhibitors and beta blockers for heart failure) to patient and family caregiver experience.
Aligned with Medicare ACO quality measures, 5 high-impact target areas were identified for ACOs21: (1) Prevention and wellness; (2) Chronic conditions/care management; (3) Reduced hospitalizations; (4) Care transitions across the fragmented system; and (5) Multispecialty care coordination of complex patients. One essential element of a successful ACO is the ability to implement evidence-based medical guidelines and/or practices across the continuum of care for selected targeted initiatives. Optimizing care coordination/continuum requires team-based care, and hospitalists already routinely collaborate with nurses, social workers, case managers, pharmacists, and other stakeholders such as dieticians and physical therapists on inpatient care. Hospitalists are also experienced in facilitating communication and improving integration and coordination efficiencies among primary care providers and specialists, and between hospital care and post-acute care, as they coordinate post-hospital care and follow-up. This provides an opportunity to lead health system care coordination efforts, especially for complex and/or high-risk patients.22,23 CMS MSSP 2016 performance data12 showed that ACOs achieving shared savings had a decline in inpatient expenditures and utilization across several facility types (hospital, SNF, rehabilitation, long term). Postacute care management is critical to earning shared savings; SNF and Home Health expenditures fell by 18.3% and 9.7%, respectively, on average. We believe that hospitalists can have more influence over these cost areas by influencing treatment of hospitalized patients in a timely manner, discharge coordination, and selection of appropriate disposition locations. Hospitalists also play an integral role in ensuring the hospital performs well on quality metrics, including 30-day readmissions, hospital acquired conditions, and patient satisfaction. Examples below document the effectiveness of hospitalists in this new ACO era.
Care Transitions/Coordination
Before the Hospital Readmission Reduction Program (HRRP) delineated in the ACA, hospitalists developed Project BOOST (Better Outcomes by Optimizing Care Transitions) to improve hospital discharge care transition. The evidence-based foundation of this project led CMS to list Project BOOST as an example program that can reduce readmissions.24 Through the dissemination and mentored implementation of Project BOOST to over 200 hospitals across the United States,25 hospitalists contributed to the marked reduction in hospital readmission occurring since 2010.26 Although hospital medicine began as a practice specific to the hospital setting, hospitalists’ skills generated growing demand for them in postacute facilities. SNF residents commonly come from hospitals postdischarge and suffer from multiple comorbidities and limitations in activities of daily living. Not surprisingly, SNF residents experience high rates of rehospitalizations.27 Hospitalists can serve as a bridge between hospitals and SNFs and optimize this transition process to yield improved outcomes. Industry experts endorse this approach.28 A recent study demonstrated a significant reduction in readmissions in 1 SNF (32.3% to 16.1%, odds ratio = 0.403, P < .001), by having a hospitalist-led team follow patients discharged from the hospital.29
Chronic Conditions Management/High-Risk Patients
Interest in patients with multiple chronic comorbidities and social issues intensifies as healthcare systems focus limited resources on these high-risk patients to prevent the unnecessary use of costly services.30,31 As health systems assume financial risk for health outcomes and costs of designated patient groups, they undertake efforts to understand the population they serve. Such efforts aim to identify patients with established high utilization patterns (or those at risk for high utilization). This knowledge enables targeted actions to provide access, treatment, and preventive interventions to avoid unneeded emergency and hospital services. Hospitalists commonly care for these patients and are positioned to lead the implementation of patient risk assessment and stratification, develop patient-centered care models across care settings, and act as a liaison with primary care. For frail elderly and seriously ill patients, the integration of hospitalists into palliative care provides several opportunities for improving the quality of care at the end of life.32 As patients and their family caregivers commonly do not address goals of care until faced with a life-threatening condition in the hospital, hospitalists represent ideal primary palliative care physicians to initiate these conversations.33 A hospitalist communicating with a patient and/or their family caregiver about alleviating symptoms and clarifying patients’ preferences for care often yields decreases in ineffective healthcare utilization and better patient outcomes. The hospitalists’ ability to communicate with other providers within the hospital setting also allows them to better coordinate interdisciplinary care and prevent unnecessary and ineffective treatments and procedures.
De-Implementation/Waste Reduction
The largest inefficiencies in healthcare noted in the National Academy of Medicine report, Demanding Value from Our Health Care (2012), are failure to deliver known beneficial therapies or providing unnecessary or nonevidenced based services that do not improve outcomes, but come with associated risk and cost.34 “De-implementation” of unnecessary diagnostic tests or ineffective or even harmful treatments by hospitalists represents a significant opportunity to reduce costs while maintaining or even improving the quality of care. The Society of Hospital Medicine joined the Choosing Wisely® campaign and made 5 recommendations in adult care as an explicit starting point for eliminating waste in the hospital in 2013.35 Since then, hospitalists have participated in multiple successful efforts to address overutilization of care; some published results include the following:
- decreased frequency of unnecessary common labs through a multifaceted hospitalist QI intervention;36
- reduced length of stay and cost by appropriate use of telemetry;37 and
- reduced unnecessary radiology testing by providing physicians with individualized audit and feedback reports.38
CONCLUSION
Hundreds of ACOs now exist across the US, formed by a variety of providers including hospitals, physician groups, and integrated delivery systems. Provider groups range in size from primary care-focused physician groups with a handful of offices to large, multistate integrated delivery systems with dozens of hospitals and hundreds of office locations. Evaluations of ACO outcomes reveal mixed results.9,39-53 Admittedly, assessments attempting to compare the magnitude of savings across ACO models are difficult given the variation in size, variability in specific efforts to influence utilization, and substantial turnover among participating beneficiaries.54 Nonetheless, a newly published Office of Inspector General report55 showed that most Medicare ACOs reduced spending and improved care quality (82% of the individual quality measures) over the first 3 years of the program, and savings increased with duration of an ACO program. The report also noted that considerable time and managerial resources are required to implement changes to improve quality and lower costs. While the political terrain ostensibly supports value-based care and the need to diminish the proportion of our nation’s gross domestic product dedicated to healthcare, health systems are navigating an environment that still largely rewards volume. Hospitalists may be ideal facilitators for this transitional period as they possess the clinical experience caring for complex patients with multiple comorbidities and quality improvement skills to lead efforts in this new ACO era.
Disclosures
The authors have nothing to disclose.
1. Fisher ES, Staiger DO, Bynum JP, Gottlieb DJ. Creating accountable care organizations: the extended hospital medical staff. Health Aff(Project Hope). 2007;26(1):w44-w57. PubMed
2. Fisher ES, McClellan MB, Bertko J, et al. Fostering accountable health care: moving forward in medicare. Health Aff(Project Hope). 2009;28(2):w219-w231. PubMed
3. McClellan M, McKethan AN, Lewis JL, Roski J, Fisher ES. A national strategy to put accountable care into practice. Health Aff(Project Hope). 2010;29(5):982-990. PubMed
4. Berwick DM. Making good on ACOs’ promise--the final rule for the Medicare shared savings program. N Engl J Med. 2011;365(19):1753-1756. PubMed
5. Kuo YF, Sharma G, Freeman JL, Goodwin JS. Growth in the care of older patients by hospitalists in the United States. N Engl J Med. 2009;360(11):1102-1112. PubMed
6. Kennedy K. Health Care Providers Embracing Cost-saving Groups. USA Today, July 24, 2011.
7. Leavitt Partners. Available at http://leavittpartners.com, April 2016.
8. Colla CH, Lewis VA, Tierney E, Muhlestein DB. Hospitals Participating In ACOs Tend To Be Large And Urban, Allowing Access To Capital And Data. Health Aff(Millwood). 2016;35(3):431-439. PubMed
9. McWilliams JM, Hatfield LA, Chernew ME, Landon BE, Schwartz AL. Early Performance of Accountable Care Organizations in Medicare. N Engl J Med. 2016;374(24):2357-2366. PubMed
10. Muhlestein D, Saunders R, McClellan M. Medicare Accountable Care Organization Results For 2015: The Journey To Better Quality And Lower Costs Continues. In. Health Affairs Blog. Bethesda, MD 2016.
11. Chernew ME. New Health Care Symposium: Building An ACO---What Services Do You Need And How Are Physicians Impacted? In Health Affairs Blog. Bethesda, MD 2016.
12. Centers for Medicare & Medicaid Services. Performance Year 2016 Quality Performance and Financial Reconciliation Results for ACOs with 2012-2016 Start Dates. Available at https://strategichealthcare.net/wp-content/uploads/2017/10/CMS-Slides-on-ACOs.pdf. 2017.
13. Shortell SM, Casalino LP. Implementing qualifications criteria and technical assistance for accountable care organizations. JAMA. 2010;303(17):1747-1748. PubMed
14. Shortell SM, Casalino LP, Fisher ES. How the center for Medicare and Medicaid innovation should test accountable care organizations. Health Aff (Project Hope). 2010;29(7):1293-1298. PubMed
15. Medicare Payment Advisory Commission. Accountable Care Organizations Payment Systems October 2015. Available at http://www.medpac.gov/documents/payment-basics/accountable-care-organization-payment-systems-15.pdf?sfvrsn=0.
16. American Hospital Association. 2010 Committee on Research. AHA Research Synthesis Report: Accountable Care Organization.
17. D’Aunno T, Broffman L, Sparer M, Kumar SR. Factors That Distinguish High-Performing Accountable Care Organizations in the Medicare Shared Savings Program. Health Serv. Res. 2016. PubMed
18. Peiris D, Phipps-Taylor MC, Stachowski CA, et al. ACOs Holding Commercial Contracts Are Larger And More Efficient Than Noncommercial ACOs. Health Aff (Project Hope). 2016;35(10):1849-1856. PubMed
19. Ouayogode MH, Colla CH, Lewis VA. Determinants of success in Shared Savings Programs: An analysis of ACO and market characteristics. Healthcare (Amsterdam, Netherlands). 2017;5(1-2):53-61. PubMed
20. National Center for Health Statistics. Health, United States, 2016: With Chartbook on Long-term Trends in Health. In: Hyattsville, MD.2017. PubMed
21. Gbemudu JN. Larson BK, Van Citters AD, Kreindler SA, Nelson EC, Shortell SM, Fisher ES. Norton Healthcare: A Strong Payer–Provider Partnership for the Journey to Accountable Care. January 2012. Available at http://www.commonwealthfund.org/~/media/files/publications/case-study/2012/jan/1574_gbemudu_norton_case-study_01_12_2012.pdf.
22. O’Leary KJ, Haviley C, Slade ME, Shah HM, Lee J, Williams MV. Improving teamwork: impact of structured interdisciplinary rounds on a hospitalist unit. J Hosp Med. 2011;6(2):88-93. PubMed
23. Hansen LO, Greenwald JL, Budnitz T, et al. Project BOOST: effectiveness of a multihospital effort to reduce rehospitalization. J. Hosp. Med.. 2013;8(8):421-427. PubMed
24. Centers for Medicare and Medicaid Services. Solicitation for Applications: Community-based Care Transitions Program. Available at https://innovation.cms.gov/Files/Migrated-Medicare-Demonstration-x/CCTP-Solicitation.pdf. September 7, 2017.
25. Li J, Hinami K, Hansen LO, Maynard G, Budnitz T, Williams MV. The physician mentored implementation model: a promising quality improvement framework for health care change. Acad Med. 2015;90(3):303-310. PubMed
26. Williams MV, Li J, Hansen LO, et al. Project BOOST implementation: lessons learned. South Med J. 2014;107(7):455-465. PubMed
27. Ouslander JG, Lamb G, Perloe M, et al. Potentially avoidable hospitalizations of nursing home residents: frequency, causes, and costs: [see editorial comments by Drs. Jean F. Wyman and William R. Hazzard, pp 760-761]. J Am Geriatr Soc. 2010;58(4):627-635. PubMed
28. Pittman D. SNFs: New Turf for Hospitalists? 2013. Available at https://www.medpagetoday.com/hospitalbasedmedicine/hospitalists/39401.
29. Petigara S, Krishnamurthy M, Livert D. Necessity is the mother of invention: an innovative hospitalist-resident initiative for improving quality and reducing readmissions from skilled nursing facilities. J Community Hosp Intern Med Perspect. 2017;7(2):66-69. PubMed
30. Silow-Carroll S, Edwards J. Early Adopters of the Accountable Care Model: A Field Report on Improvements in Health Care Delivery. New York, NY: The Commonwealth Fund;March 2013.
31. Hasselman D. Super-Utilizer Summit: Common Themes from Innovative Complex Care Management Programs. Hamilton, NJ: Center for Health Care Strategies;October 2013.
32. Wald HL, Glasheen JJ, Guerrasio J, Youngwerth JM, Cumbler EU. Evaluation of a hospitalist-run acute care for the elderly service. J Hosp Med. 2011;6(6):313-321. PubMed
33. Quill TE, Abernethy AP. Generalist plus specialist palliative care--creating a more sustainable model. N Engl J Med. 2013;368(13):1173-1175. PubMed
34. O’Kane M, Buto K, Alteras T, et. al. Demanding Value from Our Health Care: Motivating Patient Action to Reduce Waste in Health Care. Institute of Medicine of the National Academies. July 2012. https://nam.edu/wp-content/uploads/2015/06/VSRT-DemandingValue.pdf. Accessed Accessed June 18, 2017.
35. Bulger J, Nickel W, Messler J, et al. Choosing wisely in adult hospital medicine: five opportunities for improved healthcare value. J Hosp Med. 2013;8(9):486-492. PubMed
36. Corson AH, Fan VS, White T, et al. A multifaceted hospitalist quality improvement intervention: Decreased frequency of common labs. J Hosp Med. 2015;10(6):390-395. PubMed
37. Svec D, Ahuja N, Evans KH, et al. Hospitalist intervention for appropriate use of telemetry reduces length of stay and cost. J Hosp Med. 2015;10(9):627-632. PubMed
38. Neeman N, Quinn K, Soni K, Mourad M, Sehgal NL. Reducing radiology use on an inpatient medical service: choosing wisely. JAMA Intern Med. 2012;172(20):1606-1608. PubMed
39. Abrams M, Nuzum R, Zezza M, Ryan J, Kiszla J, Guterman S. The Affordable Care Act’s Payment and Delivery System Reforms: A Progress Report at Five Years. Bipartisan Policy Center, May 2015. Available at http://www.commonwealthfund.org/publications/issue-briefs/2015/may/aca-payment-and-delivery-system-reforms-at-5-years.
40. Kocot SL, White R, Katikaneni P, McClellan MB. A More Complete Picture of Pioneer ACO Results. The Brookings Institution, October 13, 2014. Available at http://www.brookings.edu/blogs/up-front/posts/2014/10/09-pioneer-aco-results-mcclellan/#recent_rr/
41. Blumenthal D, Abrams M, Nuzum R. The Affordable Care Act at 5 Years. N Engl J Med. 2015;372(25):2451-2458. PubMed
42. Colla CH, Lewis VA, Kao LS, O’Malley AJ, Chang CH, Fisher ES. Association Between Medicare Accountable Care Organization Implementation and Spending Among Clinically Vulnerable Beneficiaries. JAMA Intern Med. 2016;176(8):1167-1175. PubMed
43. Epstein AM, Jha AK, Orav EJ, et al. Analysis of early accountable care organizations defines patient, structural, cost, and quality-of-care characteristics. Health Aff (Project Hope). 2014;33(1):95-102. PubMed
44. Fullerton CA, Henke RM, Crable E, Hohlbauch A, Cummings N. The Impact Of Medicare ACOs On Improving Integration And Coordination Of Physical And Behavioral Health Care. Health Aff (Project Hope). 2016;35(7):1257-1265. PubMed
45. Herrel LA, Norton EC, Hawken SR, Ye Z, Hollenbeck BK, Miller DC. Early impact of Medicare accountable care organizations on cancer surgery outcomes. Cancer. 2016;122(17):2739-2746. PubMed
46. McConnell KJ, Renfro S, Chan BK, et al. Early Performance in Medicaid Accountable Care Organizations: A Comparison of Oregon and Colorado. JAMA Intern Med. 2017;177(4):538-545. PubMed
47. Nyweide DJ, Lee W, Cuerdon TT, et al. Association of Pioneer Accountable Care Organizations vs traditional Medicare fee for service with spending, utilization, and patient experience. JAMA. 2015;313(21):2152-2161. PubMed
48. Rajkumar R, Press MJ, Conway PH. The CMS Innovation Center--a five-year self-assessment. N Engl J Med. 2015;372(21):1981-1983. PubMed
49. Rose S, Zaslavsky AM, McWilliams JM. Variation In Accountable Care Organization Spending And Sensitivity To Risk Adjustment: Implications For Benchmarking. Health affairs (Project Hope). 2016;35(3):440-448. PubMed
50. Shortell SM, Poon BY, Ramsay PP, et al. A Multilevel Analysis of Patient Engagement and Patient-Reported Outcomes in Primary Care Practices of Accountable Care Organizations. J Gen Intern Med. 2017;32(6):640-647. PubMed
51. Winblad U, Mor V, McHugh JP, Rahman M. ACO-Affiliated Hospitals Reduced Rehospitalizations From Skilled Nursing Facilities Faster Than Other Hospitals. Health Aff (Project Hope). 2017;36(1):67-73. PubMed
52. Zhang Y, Caines KJ, Powers CA. Evaluating the Effects of Pioneer Accountable Care Organizations on Medicare Part D Drug Spending and Utilization. Med Care. 2017;55(5):470-475. PubMed
53. Muhlestein D. Medicare ACOs: Mixed Initial Results and Cautious Optimism. Health Affairs Blog, February 4, 2014. Available at http://healthaffairs.org/blog/2014/02/04/medicare-acos-mixed-initial-results-and-cautious-optimism/.
54. Hsu J, Price M, Vogeli C, et al. Bending The Spending Curve By Altering Care Delivery Patterns: The Role Of Care Management Within A Pioneer ACO. Health Aff (Project Hope). 2017;36(5):876-884. PubMed
55. Medicare Shared Savings Program Accountable Care Organizations Have Shown Potential For Reducing Spending And Improving Quality. Office of Inspector General;August 2017.
© Society of Hospital Medicine
Predictors of Long-Term Opioid Use After Opioid Initiation at Discharge From Medical and Surgical Hospitalizations
While patients may be newly exposed to opioids during medical and surgical hospitalization and the prescription of opioids at discharge is common,1-5 prescribers of opioids at discharge may not intend to initiate long-term opioid (LTO) use. By understanding the frequency of progression to LTO use, hospitalists can better balance postdischarge pain treatment and the risk for unintended LTO initiation.
Estimates of LTO use rates following hospital discharge in selected populations1,2,4-6 have varied depending on the population studied and the method of defining LTO use.7 Rates of LTO use following incident opioid prescription have not been directly compared at medical versus surgical discharge or compared with initiation in the ambulatory setting. We present the rates of LTO use following incident opioid exposure at surgical discharge and medical discharge and identify the factors associated with LTO use following surgical and medical discharge.
METHODS
Data Sources
Veterans Health Administration (VHA) data were obtained through the Austin Information Technology Center for fiscal years (FYs) 2003 through 2012 (Austin, Texas). Decision support system national data extracts were used to identify prescription-dispensing events, and inpatient and outpatient medical SAS data sets were used to identify diagnostic codes. The study was approved by the University of Iowa Institutional Review Board and the Iowa City Veterans Affairs (VA) Health Care System Research and Development Committee.
Patients
We included all patients with an outpatient opioid prescription during FY 2011 that was preceded by a 1-year opioid-free period.7 Patients with broadly accepted indications for LTO use (eg, metastatic cancer, palliative care, or opioid-dependence treatment) were excluded.7
Opioid Exposure
We included all outpatient prescription fills for noninjectable dosage forms of butorphanol, fentanyl, hydrocodone, hydromorphone, levorphanol, meperidine, methadone, morphine, oxycodone, oxymorphone, pentazocine, and tramadol. Consistent with the Centers for Disease Control and Prevention and VA/Department of Defense guidelines, LTO use was defined conceptually as regular use for >90 days. Operationalizing this definition to pharmacy refill data was established by using a cabinet supply methodology,7 which allows for the construction of episodes of continuous medication therapy by estimating the medication supply available to a patient for each day during a defined period based on the pattern of observed refills. LTO use was defined as an episode of continuous opioid supply for >90 days and beginning within 30 days of the initial prescription. While some studies have defined LTO use based on onset within 1 year following surgery,5 the requirement for onset within 30 days of initiation was applied to more strongly tie the association of developing LTO use with the discharge event and minimize various forms of bias that are introduced with extended follow-up periods.
Clinical Characteristics
Patients were classified as being medical discharges, surgical discharges, or outpatient initiators. Patients with an opioid index date within 2 days following discharge were designated based on discharge bed section; additionally, if patients had a surgical bed section during hospitalization, they were assigned as surgical discharges. Demographic, diagnosis, and medication exposure variables that were previously associated with LTO use were selected.8,9 Substance use disorder, chronic pain, anxiety disorder, and depressive disorder were based on International Classification of Diseases, 9th Revision (ICD-9) codes in the preceding year. The use of concurrent benzodiazepines, skeletal muscle relaxants, and antidepressants were determined at opioid initiation.10 Rural or urban residence was assigned by using the Rural-Urban Commuting Area Codes system and mapped with the zip code of a veteran’s residence.11
Analysis
Bivariate and multivariable relationships were determined by using logistic regression. The multivariable model considered all pairwise interaction terms between inpatient service (surgery versus medicine) and each of the variables in the model. Statistically significant interaction terms (P < .05) were retained, and all others were omitted from the final model. The main effects for variables that were involved in a significant interaction term were not reported in the final multivariable model; instead, we created fully specified multivariable models for surgery service and medicine service and reported odds ratios (ORs) for the main effects. All analyses were conducted by using SAS version 9.4 (SAS Institute Inc, Cary, North Carolina).
RESULTS

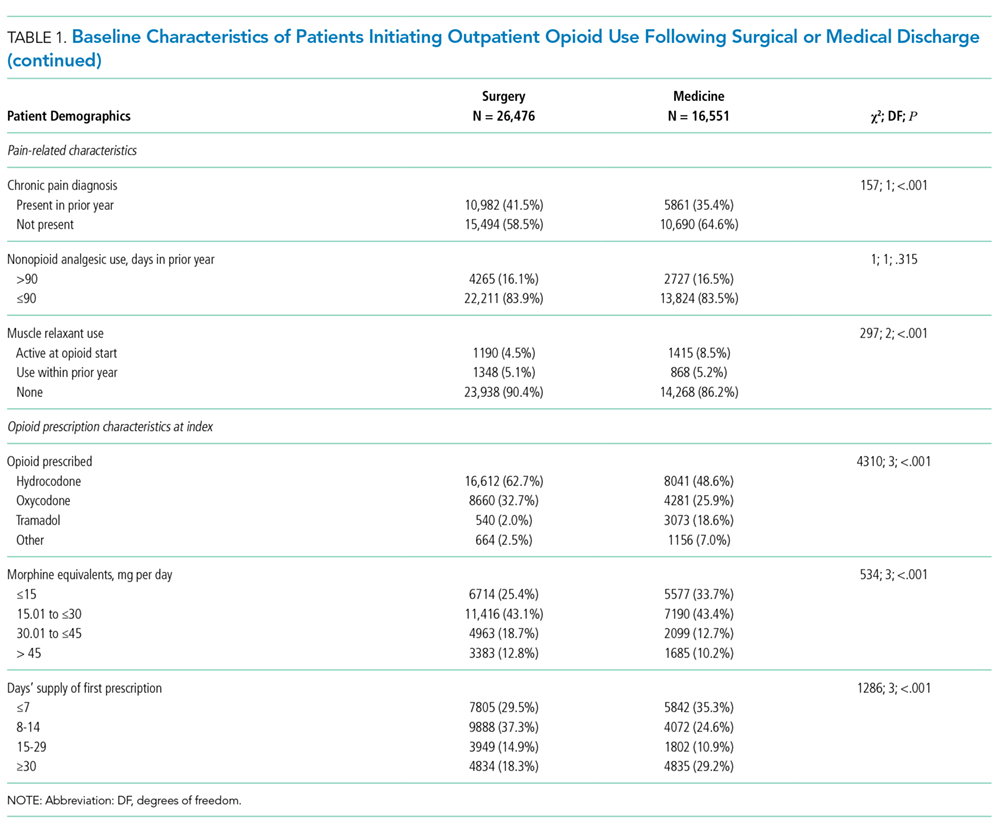
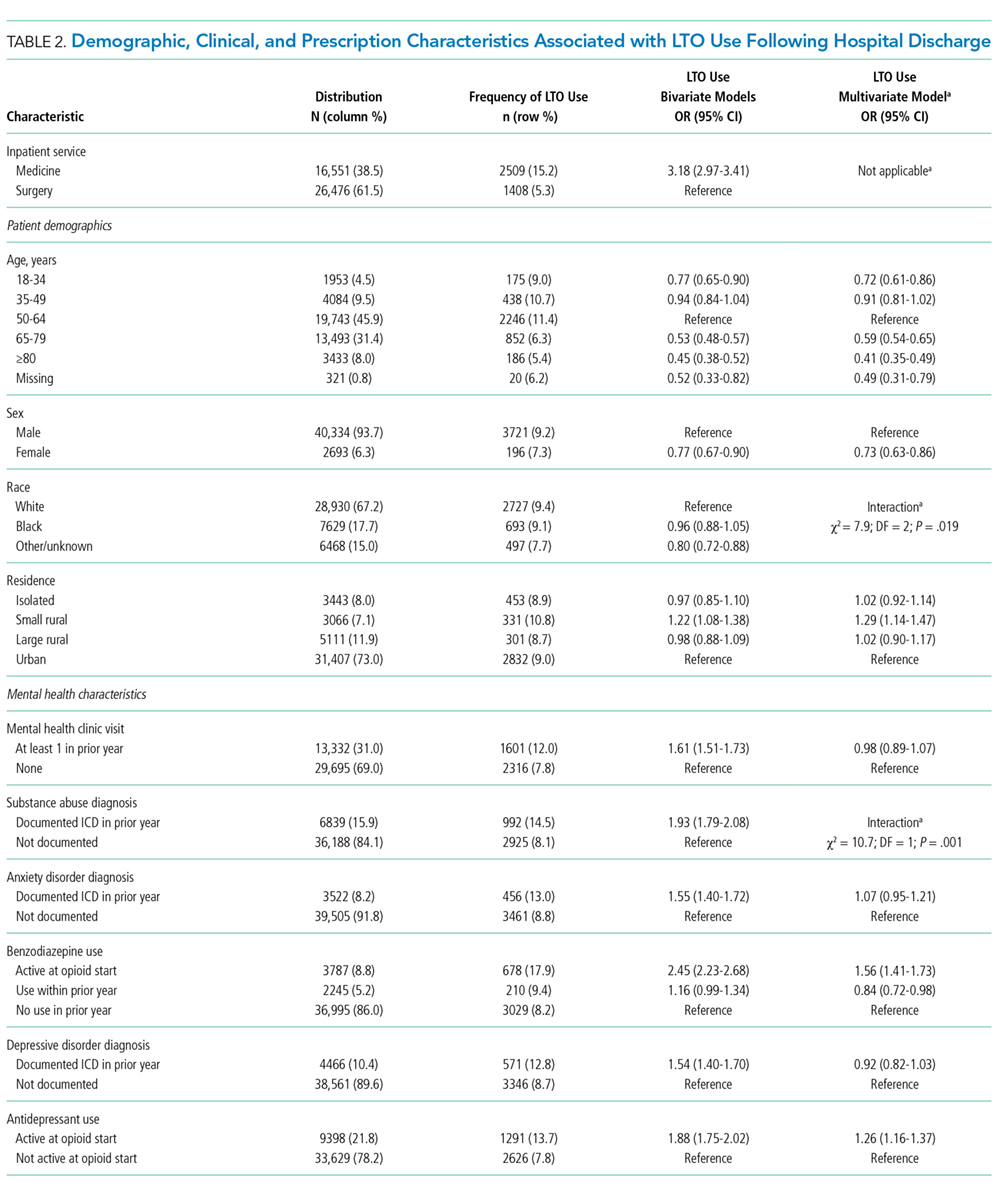
Days’ supply was associated with LTO use in a dose-dependent fashion relative to the reference category of ≤7 days: OR of 1.24 (95% CI, 1.12-1.37) for 8 to 14 days; OR of 1.56 (95% CI, 1.39-1.76) for 15 to 29 days; and OR of 2.59 (95% CI, 2.35-2.86) for 30 days (Table 2). LTO risk was higher among patients with an estimated dose of ≥15 morphine equivalents per day (MED) compared with those with doses of <15 equivalents (OR = 1.11; 95% CI, 1.02-1.21); patients who received >45 MED were at the greatest risk (OR = 1.70; 95% CI, 1.49-1.94).
DISCUSSION

The observation that subsequent LTO use occurs more frequently in discharged medical patients than surgical patients is consistent with the findings of Calcaterra et al.1 that among patients with no surgery versus surgery during hospitalization, opioid receipt at discharge resulted in a higher adjusted OR (7.24 for no surgery versus 3.40 for surgery) for chronic opioid use at 1 year. One explanation for this finding may be an artifact of cohort selection in the study design: patients with prior opioid use are excluded from the cohort, and prior use may be more common among surgical patients presenting for elective inpatient surgery for painful conditions. Previous work suggests that opioid use preoperatively is a robust predictor of postoperative use, and rates of LTO use are low among patients without preoperative opioid exposure.6
Demographic characteristics associated with persistent opioid receipt were similar to those previously reported.5,8,9 The inclusion of medication classes indicated in the treatment of mental health or pain conditions (ie, antidepressants, benzodiazepines, muscle relaxants, and nonopioid analgesics) resulted in diagnoses based on ICD-9 codes being no longer associated with LTO use. Severity or activity of illness, preferences regarding pharmacologic or nonpharmacologic treatment and undiagnosed or undocumented pain-comorbid conditions may all contribute to this finding. Future work studying opioid-related outcomes should include variables that reflect pharmacologic management of comorbid diagnoses in the cohort development or analytic design.
The strongest risk factors were potentially modifiable: days’ supply, dose, and concurrent medications. The measures of opioid quantity supplied are associated with subsequent ongoing use and are consistent with recent work based on prescription drug–monitoring data in a single state14 and in a nationally representative sample.15 That this relationship persists following hospital discharge, a scenario in which LTO use is unlikely to be initiated by a provider (who would be expected to subsequently titrate or monitor therapy), further supports the potential to curtail unintended LTO use through judicious early prescribing decisions.
We assessed only opioids that were supplied through a VA pharmacy, which may lead to the misclassification of patients as opioid naive for inclusion and an underestimation of the rate of opioid use following discharge. It is possible that differences in the rates of non-VA pharmacy use differ in medical and surgical populations in a nonrandom way. This study was performed in a large, integrated health system and may not be generalizable outside the VA system, where more discontinuities between hospital and ambulatory care may exist.
CONCLUSION
The initiation of LTO use at discharge is more common in veterans who are discharged from medical than surgical hospitalizations, likely reflecting differences in the patient population, pain conditions, and discharge prescribing decisions. While patient characteristics are associated with LTO use, the strongest associations are with increasing index dose and days’ supply; both represent potentially modifiable prescriber behaviors. These findings support policy changes and other efforts to minimize dose and days supplied when short-term use is intended as a means to address the current opioid epidemic.
Acknowledgments
The work reported here was supported by the Department of Veterans Affairs Office of Academic Affiliations and Office of Research and Development (Dr. Mosher and Dr. Hofmeyer), and Health Services Research and Development Service (HSR&D) through the Comprehensive Access and Delivery Research and Evaluation Center (CIN 13-412) and a Career Development Award (CDA 10-017; Dr. Lund).
Disclosures
The authors report no conflict of interest in regard to this study. The authors had full access to and take full responsibility for the integrity of the data. All analyses were conducted by using SAS version 9.2 (SAS Institute Inc, Cary, NC). This manuscript is not under review elsewhere, and there is no prior publication of the manuscript contents. The views expressed in this article are those of the authors and do not necessarily represent the views of the Department of Veterans Affairs. The study was approved by the University of Iowa Institutional Review Board and the Iowa City Healthcare System Research and Development Committee.
1. Calcaterra SL, Yamashita TE, Min SJ, Keniston A, Frank JW, Binswanger IA. Opioid Prescribing at Hospital Discharge Contributes to Chronic Opioid Use. J Gen Intern Med. 2016;31(5):478-485. PubMed
2. Raebel MA, Newcomer SR, Reifler LM, et al. Chronic use of opioid medications before and after bariatric surgery. JAMA. 2013;310(13):1369-1376. PubMed
3. Mosher HJ, Jiang L, Vaughan Sarrazin MS, Cram P, Kaboli PJ, Vander Weg MW. Prevalence and characteristics of hospitalized adults on chronic opioid therapy. J Hosp Med. 2014;9(2):82-87. PubMed
4. Holman JE, Stoddard GJ, Higgins TF. Rates of prescription opiate use before and after injury in patients with orthopaedic trauma and the risk factors for prolonged opiate use. J Bone Joint Surg Am. 2013;95(12):1075-1080.
5. Sun EC, Darnall BD, Baker LC, Mackey S. Incidence of and Risk Factors for Chronic Opioid Use Among Opioid-Naive Patients in the Postoperative Period. JAMA Intern Med. 2016;176(9):1286-1293. PubMed
6. Goesling J, Moser SE, Zaidi B, et al. Trends and predictors of opioid use after total knee and total hip arthroplasty. Pain. 2016;157(6):1259-1265. PubMed
7. Mosher HJ, Richardson KK, Lund BC. The 1-Year Treatment Course of New Opioid Recipients in Veterans Health Administration. Pain Med. 2016. [Epub ahead of print]. PubMed
8. Sullivan MD, Edlund MJ, Fan MY, Devries A, Brennan Braden J, Martin BC. Risks for possible and probable opioid misuse among recipients of chronic opioid therapy in commercial and medicaid insurance plans: The TROUP Study. Pain. 2010;150(2):332-339. PubMed
9. Seal KH, Shi Y, Cohen G, et al. Association of mental health disorders with prescription opioids and high-risk opioid use in US veterans of Iraq and Afghanistan. JAMA. 2012;307(9):940-947. PubMed
10. Mosher HJ, Richardson KK, Lund BC. Sedative Prescriptions Are Common at Opioid Initiation: An Observational Study in the Veterans Health Administration. Pain Med. 2017. [Epub ahead of print]. PubMed
11. Lund BC, Abrams TE, Bernardy NC, Alexander B, Friedman MJ. Benzodiazepine prescribing variation and clinical uncertainty in treating posttraumatic stress disorder. Psychiatr Serv. 2013;64(1):21-27. PubMed
12. Brummett CM, Waljee JF, Goesling J, et al. New Persistent Opioid Use After Minor and Major Surgical Procedures in US Adults. JAMA Surg. 2017;152(6):e170504. PubMed
13. Mellbye A, Karlstad O, Skurtveit S, Borchgrevink PC, Fredheim OM. The duration and course of opioid therapy in patients with chronic non-malignant pain. Acta Anaesthesiol Scand. 2016;60(1):128-137. PubMed
14. Deyo RA, Hallvik SE, Hildebran C, et al. Association Between Initial Opioid Prescribing Patterns and Subsequent Long-Term Use Among Opioid-Naive Patients: A Statewide Retrospective Cohort Study. J Gen Intern Med. 2017;32(1):21-27. PubMed
15. Shah A, Hayes CJ, Martin BC. Factors Influencing Long-Term Opioid Use Among Opioid Naive Patients: An Examination of Initial Prescription Characteristics and Pain Etiologies. J Pain. 2017;18(11):1374-1383. PubMed
While patients may be newly exposed to opioids during medical and surgical hospitalization and the prescription of opioids at discharge is common,1-5 prescribers of opioids at discharge may not intend to initiate long-term opioid (LTO) use. By understanding the frequency of progression to LTO use, hospitalists can better balance postdischarge pain treatment and the risk for unintended LTO initiation.
Estimates of LTO use rates following hospital discharge in selected populations1,2,4-6 have varied depending on the population studied and the method of defining LTO use.7 Rates of LTO use following incident opioid prescription have not been directly compared at medical versus surgical discharge or compared with initiation in the ambulatory setting. We present the rates of LTO use following incident opioid exposure at surgical discharge and medical discharge and identify the factors associated with LTO use following surgical and medical discharge.
METHODS
Data Sources
Veterans Health Administration (VHA) data were obtained through the Austin Information Technology Center for fiscal years (FYs) 2003 through 2012 (Austin, Texas). Decision support system national data extracts were used to identify prescription-dispensing events, and inpatient and outpatient medical SAS data sets were used to identify diagnostic codes. The study was approved by the University of Iowa Institutional Review Board and the Iowa City Veterans Affairs (VA) Health Care System Research and Development Committee.
Patients
We included all patients with an outpatient opioid prescription during FY 2011 that was preceded by a 1-year opioid-free period.7 Patients with broadly accepted indications for LTO use (eg, metastatic cancer, palliative care, or opioid-dependence treatment) were excluded.7
Opioid Exposure
We included all outpatient prescription fills for noninjectable dosage forms of butorphanol, fentanyl, hydrocodone, hydromorphone, levorphanol, meperidine, methadone, morphine, oxycodone, oxymorphone, pentazocine, and tramadol. Consistent with the Centers for Disease Control and Prevention and VA/Department of Defense guidelines, LTO use was defined conceptually as regular use for >90 days. Operationalizing this definition to pharmacy refill data was established by using a cabinet supply methodology,7 which allows for the construction of episodes of continuous medication therapy by estimating the medication supply available to a patient for each day during a defined period based on the pattern of observed refills. LTO use was defined as an episode of continuous opioid supply for >90 days and beginning within 30 days of the initial prescription. While some studies have defined LTO use based on onset within 1 year following surgery,5 the requirement for onset within 30 days of initiation was applied to more strongly tie the association of developing LTO use with the discharge event and minimize various forms of bias that are introduced with extended follow-up periods.
Clinical Characteristics
Patients were classified as being medical discharges, surgical discharges, or outpatient initiators. Patients with an opioid index date within 2 days following discharge were designated based on discharge bed section; additionally, if patients had a surgical bed section during hospitalization, they were assigned as surgical discharges. Demographic, diagnosis, and medication exposure variables that were previously associated with LTO use were selected.8,9 Substance use disorder, chronic pain, anxiety disorder, and depressive disorder were based on International Classification of Diseases, 9th Revision (ICD-9) codes in the preceding year. The use of concurrent benzodiazepines, skeletal muscle relaxants, and antidepressants were determined at opioid initiation.10 Rural or urban residence was assigned by using the Rural-Urban Commuting Area Codes system and mapped with the zip code of a veteran’s residence.11
Analysis
Bivariate and multivariable relationships were determined by using logistic regression. The multivariable model considered all pairwise interaction terms between inpatient service (surgery versus medicine) and each of the variables in the model. Statistically significant interaction terms (P < .05) were retained, and all others were omitted from the final model. The main effects for variables that were involved in a significant interaction term were not reported in the final multivariable model; instead, we created fully specified multivariable models for surgery service and medicine service and reported odds ratios (ORs) for the main effects. All analyses were conducted by using SAS version 9.4 (SAS Institute Inc, Cary, North Carolina).
RESULTS
Days’ supply was associated with LTO use in a dose-dependent fashion relative to the reference category of ≤7 days: OR of 1.24 (95% CI, 1.12-1.37) for 8 to 14 days; OR of 1.56 (95% CI, 1.39-1.76) for 15 to 29 days; and OR of 2.59 (95% CI, 2.35-2.86) for 30 days (Table 2). LTO risk was higher among patients with an estimated dose of ≥15 morphine equivalents per day (MED) compared with those with doses of <15 equivalents (OR = 1.11; 95% CI, 1.02-1.21); patients who received >45 MED were at the greatest risk (OR = 1.70; 95% CI, 1.49-1.94).
DISCUSSION
The observation that subsequent LTO use occurs more frequently in discharged medical patients than surgical patients is consistent with the findings of Calcaterra et al.1 that among patients with no surgery versus surgery during hospitalization, opioid receipt at discharge resulted in a higher adjusted OR (7.24 for no surgery versus 3.40 for surgery) for chronic opioid use at 1 year. One explanation for this finding may be an artifact of cohort selection in the study design: patients with prior opioid use are excluded from the cohort, and prior use may be more common among surgical patients presenting for elective inpatient surgery for painful conditions. Previous work suggests that opioid use preoperatively is a robust predictor of postoperative use, and rates of LTO use are low among patients without preoperative opioid exposure.6
Demographic characteristics associated with persistent opioid receipt were similar to those previously reported.5,8,9 The inclusion of medication classes indicated in the treatment of mental health or pain conditions (ie, antidepressants, benzodiazepines, muscle relaxants, and nonopioid analgesics) resulted in diagnoses based on ICD-9 codes being no longer associated with LTO use. Severity or activity of illness, preferences regarding pharmacologic or nonpharmacologic treatment and undiagnosed or undocumented pain-comorbid conditions may all contribute to this finding. Future work studying opioid-related outcomes should include variables that reflect pharmacologic management of comorbid diagnoses in the cohort development or analytic design.
The strongest risk factors were potentially modifiable: days’ supply, dose, and concurrent medications. The measures of opioid quantity supplied are associated with subsequent ongoing use and are consistent with recent work based on prescription drug–monitoring data in a single state14 and in a nationally representative sample.15 That this relationship persists following hospital discharge, a scenario in which LTO use is unlikely to be initiated by a provider (who would be expected to subsequently titrate or monitor therapy), further supports the potential to curtail unintended LTO use through judicious early prescribing decisions.
We assessed only opioids that were supplied through a VA pharmacy, which may lead to the misclassification of patients as opioid naive for inclusion and an underestimation of the rate of opioid use following discharge. It is possible that differences in the rates of non-VA pharmacy use differ in medical and surgical populations in a nonrandom way. This study was performed in a large, integrated health system and may not be generalizable outside the VA system, where more discontinuities between hospital and ambulatory care may exist.
CONCLUSION
The initiation of LTO use at discharge is more common in veterans who are discharged from medical than surgical hospitalizations, likely reflecting differences in the patient population, pain conditions, and discharge prescribing decisions. While patient characteristics are associated with LTO use, the strongest associations are with increasing index dose and days’ supply; both represent potentially modifiable prescriber behaviors. These findings support policy changes and other efforts to minimize dose and days supplied when short-term use is intended as a means to address the current opioid epidemic.
Acknowledgments
The work reported here was supported by the Department of Veterans Affairs Office of Academic Affiliations and Office of Research and Development (Dr. Mosher and Dr. Hofmeyer), and Health Services Research and Development Service (HSR&D) through the Comprehensive Access and Delivery Research and Evaluation Center (CIN 13-412) and a Career Development Award (CDA 10-017; Dr. Lund).
Disclosures
The authors report no conflict of interest in regard to this study. The authors had full access to and take full responsibility for the integrity of the data. All analyses were conducted by using SAS version 9.2 (SAS Institute Inc, Cary, NC). This manuscript is not under review elsewhere, and there is no prior publication of the manuscript contents. The views expressed in this article are those of the authors and do not necessarily represent the views of the Department of Veterans Affairs. The study was approved by the University of Iowa Institutional Review Board and the Iowa City Healthcare System Research and Development Committee.
1. Calcaterra SL, Yamashita TE, Min SJ, Keniston A, Frank JW, Binswanger IA. Opioid Prescribing at Hospital Discharge Contributes to Chronic Opioid Use. J Gen Intern Med. 2016;31(5):478-485. PubMed
2. Raebel MA, Newcomer SR, Reifler LM, et al. Chronic use of opioid medications before and after bariatric surgery. JAMA. 2013;310(13):1369-1376. PubMed
3. Mosher HJ, Jiang L, Vaughan Sarrazin MS, Cram P, Kaboli PJ, Vander Weg MW. Prevalence and characteristics of hospitalized adults on chronic opioid therapy. J Hosp Med. 2014;9(2):82-87. PubMed
4. Holman JE, Stoddard GJ, Higgins TF. Rates of prescription opiate use before and after injury in patients with orthopaedic trauma and the risk factors for prolonged opiate use. J Bone Joint Surg Am. 2013;95(12):1075-1080.
5. Sun EC, Darnall BD, Baker LC, Mackey S. Incidence of and Risk Factors for Chronic Opioid Use Among Opioid-Naive Patients in the Postoperative Period. JAMA Intern Med. 2016;176(9):1286-1293. PubMed
6. Goesling J, Moser SE, Zaidi B, et al. Trends and predictors of opioid use after total knee and total hip arthroplasty. Pain. 2016;157(6):1259-1265. PubMed
7. Mosher HJ, Richardson KK, Lund BC. The 1-Year Treatment Course of New Opioid Recipients in Veterans Health Administration. Pain Med. 2016. [Epub ahead of print]. PubMed
8. Sullivan MD, Edlund MJ, Fan MY, Devries A, Brennan Braden J, Martin BC. Risks for possible and probable opioid misuse among recipients of chronic opioid therapy in commercial and medicaid insurance plans: The TROUP Study. Pain. 2010;150(2):332-339. PubMed
9. Seal KH, Shi Y, Cohen G, et al. Association of mental health disorders with prescription opioids and high-risk opioid use in US veterans of Iraq and Afghanistan. JAMA. 2012;307(9):940-947. PubMed
10. Mosher HJ, Richardson KK, Lund BC. Sedative Prescriptions Are Common at Opioid Initiation: An Observational Study in the Veterans Health Administration. Pain Med. 2017. [Epub ahead of print]. PubMed
11. Lund BC, Abrams TE, Bernardy NC, Alexander B, Friedman MJ. Benzodiazepine prescribing variation and clinical uncertainty in treating posttraumatic stress disorder. Psychiatr Serv. 2013;64(1):21-27. PubMed
12. Brummett CM, Waljee JF, Goesling J, et al. New Persistent Opioid Use After Minor and Major Surgical Procedures in US Adults. JAMA Surg. 2017;152(6):e170504. PubMed
13. Mellbye A, Karlstad O, Skurtveit S, Borchgrevink PC, Fredheim OM. The duration and course of opioid therapy in patients with chronic non-malignant pain. Acta Anaesthesiol Scand. 2016;60(1):128-137. PubMed
14. Deyo RA, Hallvik SE, Hildebran C, et al. Association Between Initial Opioid Prescribing Patterns and Subsequent Long-Term Use Among Opioid-Naive Patients: A Statewide Retrospective Cohort Study. J Gen Intern Med. 2017;32(1):21-27. PubMed
15. Shah A, Hayes CJ, Martin BC. Factors Influencing Long-Term Opioid Use Among Opioid Naive Patients: An Examination of Initial Prescription Characteristics and Pain Etiologies. J Pain. 2017;18(11):1374-1383. PubMed
Focusing on Inattention: The Diagnostic Accuracy of Brief Measures of Inattention for Detecting Delirium
Delirium is an acute neurocognitive disorder1 that affects up to 25% of older emergency department (ED) and hospitalized patients.2-4 The relationship between delirium and adverse outcomes is well documented.5-7 Delirium is a strong predictor of increased length of mechanical ventilation, longer intensive care unit and hospital stays, increased risk of falls, long-term cognitive impairment, and mortality.8-13 Delirium is frequently missed by healthcare professionals2,14-16 and goes undetected in up to 3 out of 4 patients by bedside nurses and medical practitioners in many hospital settings.14,17-22 A significant barrier to recognizing delirium is the absence of brief delirium assessments.
In an effort to improve delirium recognition in the acute care setting, there has been a concerted effort to develop and validate brief delirium assessments. To address this unmet need, 4 ‘A’s Test (4AT), the Brief Confusion Assessment Method (bCAM), and the 3-minute diagnostic assessment for CAM-defined delirium (3D-CAM) are 1- to 3-minute delirium assessments that were validated in acutely ill older patients.23 However, 1 to 3 minutes may still be too long in busy clinical environments, and briefer (<30 seconds) delirium assessments may be needed.
One potential more-rapid method to screen for delirium is to specifically test for the presence of inattention, which is a cardinal feature of delirium.24,25 Inattention can be ascertained by having the patient recite the months backwards, recite the days of the week backwards, or spell a word backwards.26 Recent studies have evaluated the diagnostic accuracy of reciting the months of the year backwards for delirium. O’Regan et al.27 evaluated the diagnostic accuracy of the month of the year backwards from December to July (MOTYB-6) and observed that this task was 84% sensitive and 90% specific for delirium in older patients. However, they performed the reference standard delirium assessments in patients who had a positive MOTYB-6, which can overestimate sensitivity and underestimate specificity (verification bias).28 Fick et al.29 examined the diagnostic accuracy of 20 individual elements of the 3D-CAM and observed that reciting the months of the year backwards from December to January (MOTYB-12) was 83% sensitive and 69% specific for delirium. However, this was an exploratory study that was designed to identify an element of the 3D-CAM that had the best diagnostic accuracy.
To address these limitations, we sought to evaluate the diagnostic performance of the MOTYB-6 and MOTYB-12 for delirium as diagnosed by a reference standard. We also explored other brief tests of inattention such as spelling a word (“LUNCH”) backwards, reciting the days of the week backwards, 10-letter vigilance “A” task, and 5 picture recognition task.
METHODS
Study Design and Setting
This was a preplanned secondary analysis of a prospective observational study that validated 3 delirium assessments.30,31 This study was conducted at a tertiary care, academic ED. The local institutional review board (IRB) reviewed and approved this study. Informed consent from the patient or an authorized surrogate was obtained whenever possible. Because this was an observational study and posed minimal risk to the patient, the IRB granted a waiver of consent for patients who were both unable to provide consent and were without an authorized surrogate available in the ED or by phone.
Selection of Participants
We enrolled a convenience sample of patients between June 2010 and February 2012 Monday through Friday from 8
Research assistants approached patients who met inclusion criteria and determined if any exclusion criteria were present. If none of the exclusion criteria were present, then the research assistant reviewed the informed consent document with the patient or authorized surrogate if the patient was not capable of providing consent. If a patient was not capable of providing consent and no authorized surrogate was available, then the patient was enrolled (under the waiver of consent) as long as the patient assented to be a part of the study. Once the patient was enrolled, the research assistant contacted the physician rater and reference standard psychiatrists to approach the patient.
Measures of Inattention
An emergency physician (JHH) who had no formal training in the mental status assessment of elders administered a cognitive battery to the patient, including tests of inattention. The following inattention tasks were administered:
- Spell the word “LUNCH” backwards.30 Patients were initially allowed to spell the word “LUNCH” forwards. Patients who were unable to perform the task were assigned 5 errors.
- Recite the months of the year backwards from December to July.23,26,27,30,32 Patients who were unable to perform the task were assigned 6 errors.
- Recite the days of the week backwards.23,26,33 Patients who were unable to perform the task were assigned 7 errors.
- Ten-letter vigilance “A” task.34 The patient was given a series of 10 letters (“S-A-V-E-A-H-A-A-R-T”) every 3 seconds and was asked to squeeze the rater’s hand every time the patient heard the letter “A.” Patients who were unable to perform the task were assigned 10 errors.
- Five picture recognition task.34 Patients were shown 5 objects on picture cards. Afterwards, patients were shown 10 pictures with the previously shown objects intermingled. The patient had to identify which objects were seen previously in the first 5 pictures. Patients who were unable to perform the task were assigned 10 errors.
- Recite the months of the year backwards from December to January.29 Patients who were unable to perform the task were assigned 12 errors.
Reference Standard for Delirium
A comprehensive consultation-liaison psychiatrist assessment was the reference standard for delirium; the diagnosis of delirium was based on Diagnostic and Statistical Manual of Mental Disorders, Fourth Edition, Text Revision (DSM-IV-TR) criteria.35 Three psychiatrists who each had an average of 11 years of clinical experience and regularly diagnosed delirium as part of their daily clinical practice were available to perform these assessments. To arrive at the diagnosis of delirium, they interviewed those who best understood the patient’s mental status (eg, the patient’s family members or caregivers, physician, and nurses). They also reviewed the patient’s medical record and radiology and laboratory test results. They performed bedside cognitive testing that included, but was not limited to, the Mini-Mental State Examination, Clock Drawing Test, Luria hand sequencing task, and tests for verbal fluency. A focused neurological examination was also performed (ie, screening for paraphasic errors, tremors, tone, asterixis, frontal release signs, etc.), and they also evaluated the patient for affective lability, hallucinations, and level of alertness. If the presence of delirium was still questionable, then confrontational naming, proverb interpretation or similarities, and assessments for apraxias were performed at the discretion of the psychiatrist. The psychiatrists were blinded to the physician’s assessments, and the assessments were conducted within 3 hours of each other.
Additional Variables Collected
Using medical record review, comorbidity burden, severity of illness, and premorbid cognition were ascertained. The Charlson Comorbidity Index, a weighted index that takes into account the number and seriousness of 19 preexisting comorbid conditions, was used to quantify comorbidity burden; higher scores indicate higher comorbid burden.36,37 The Acute Physiology Score of the Acute Physiology and Chronic Health Evaluation II was used to quantify severity of illness.38 This score is based upon the initial values of 12 routine physiologic measurements such as vital sign and laboratory abnormalities; higher scores represent higher severities of illness.38 The medical record was reviewed to ascertain the presence of premorbid cognitive impairment; any documentation of dementia in the patient’s clinical problem list or physician history and physical examination from the outpatient or inpatient settings was considered positive. The medical record review was performed by a research assistant and was double-checked for accuracy by one of the investigators (JHH).
Data Analyses
Measures of central tendency and dispersion for continuous variables were reported as medians and interquartile ranges. Categorical variables were reported as proportions. Receiver operating characteristic curves were constructed for each inattention task. Area under the receiver operating characteristic curves (AUC) was reported to provide a global measure of diagnostic accuracy. Sensitivities, specificities, positive likelihood ratios (PLRs), and negative likelihood ratios (NLRs) with their 95% CIs were calculated using the psychiatrist’s assessment as the reference standard.39 Cut-points with PLRs greater than 10 (strongly increased the likelihood of delirium) or NLRs less than 0.1 (strongly decreased the likelihood of delirium) were preferentially reported whenever possible.
All statistical analyses were performed with open source R statistical software version 3.0.1 (http://www.r-project.org/), SAS 9.4 (SAS Institute, Cary, NC), and Microsoft Excel 2010 (Microsoft Inc., Redmond, WA).
RESULTS
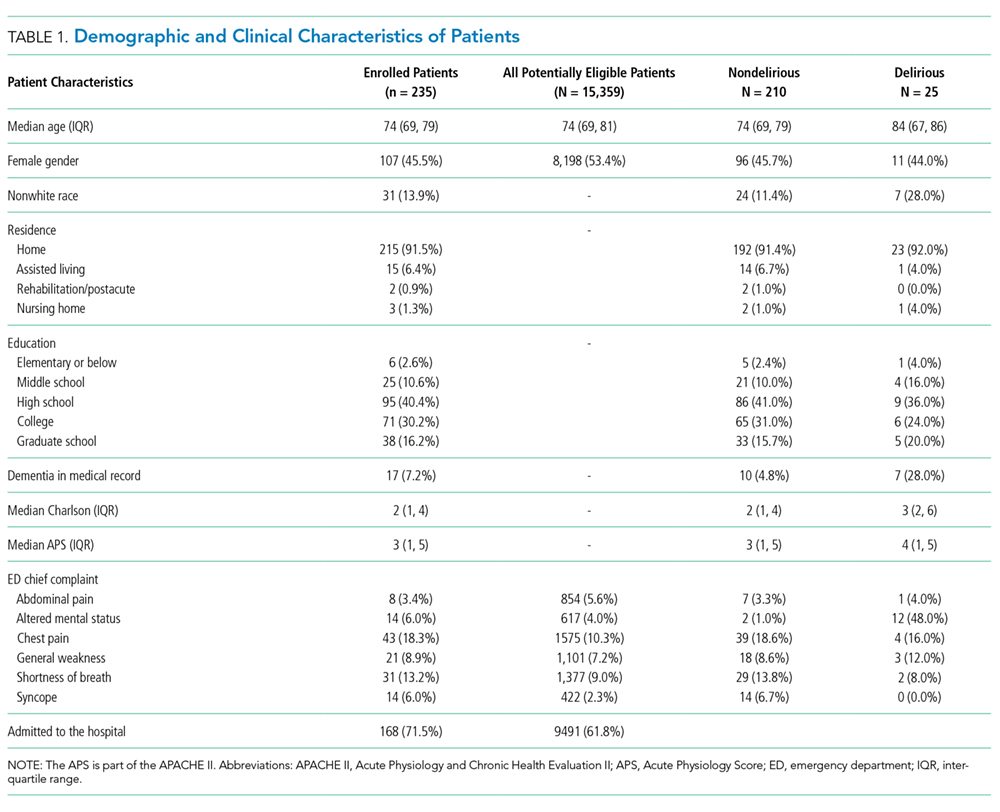
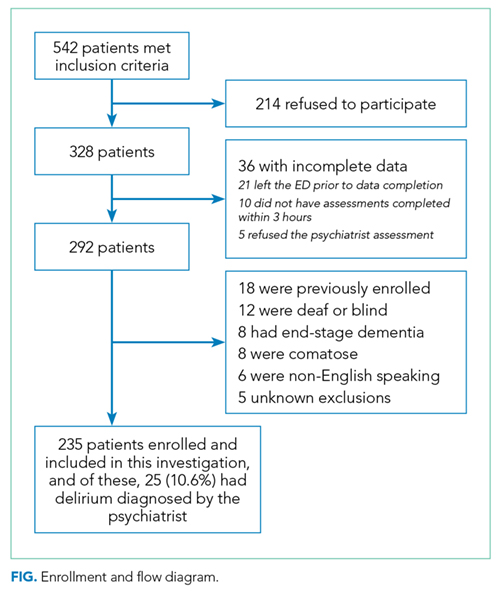
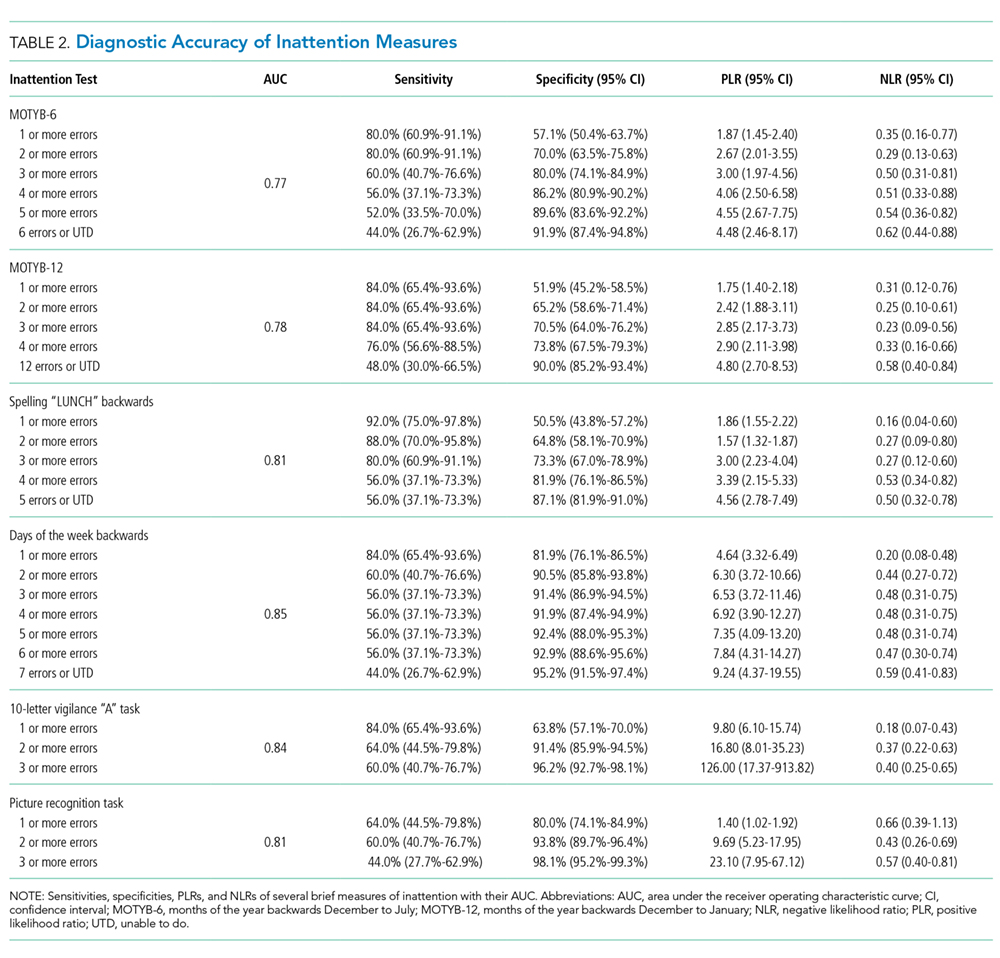
DISCUSSION
Delirium is frequently missed by healthcare providers because it is not routinely screened for in the acute care setting. To help address this deficiency of care, we evaluated several brief measures of inattention that take less than 30 seconds to complete. We observed that any errors made on the MOTYB-6 and MOTYB-12 tasks had very good sensitivities (80% and 84%) but were limited by their modest specificities (approximately 50%) for delirium. As a result, these assessments have limited clinical utility as standalone delirium screens. We also explored other commonly used brief measures of inattention and at a variety of error cutoffs. Reciting the days of the week backwards appeared to best balance sensitivity and specificity. None of the inattention measures could convincingly rule out delirium (NLR < 0.10), but the vigilance “A” and picture recognition tasks may have clinical utility in ruling in delirium (PLR > 10). Overall, all the inattention tasks, including MOTYB-6 and MOTYB-12, had very good diagnostic performances based upon their AUC. However, achieving a high sensitivity often had to be sacrificed for specificity or, alternatively, achieving a high specificity had to be sacrificed for sensitivity.
Inattention has been shown to be the cardinal feature for delirium,40 and its assessment using cognitive testing has been recommended to help identify the presence of delirium according to an expert consensus panel.26 The diagnostic performance of the MOTYB-12 observed in our study is similar to a study by Fick et al., who reported that MOTYB-12 had very good sensitivity (83%) but had modest specificity (69%) with a cutoff of 1 or more errors. Hendry et al. observed that the MOTYB-12 was 91% sensitive and 50% specific using a cutoff of 4 or more errors. With regard to the MOTYB-6, our reported specificity was different from what was observed by O’Regan et al.27 Using 1 or more errors as a cutoff, they observed a much higher specificity for delirium than we did (90% vs 57%). Discordant observations regarding the diagnostic accuracy for other inattention tasks also exist. We observed that making any error on the days of the week backwards task was 84% sensitive and 82% specific for delirium, whereas Fick et al. observed a sensitivity and specificity of 50% and 94%, respectively. For the vigilance “A” task, we observed that making 2 or more errors over a series of 10 letters was 64.0% sensitive and 91.4% specific for delirium, whereas Pompei et al.41 observed that making 2 or more errors over a series of 60 letters was 51% sensitive and 77% specific for delirium.
The abovementioned discordant findings may be driven by spectrum bias, wherein the sensitivities and specificities for each inattention task may differ in different subgroups. As a result, differences in the age distribution, proportion of college graduates, history of dementia, and susceptibility to delirium can influence overall sensitivity and specificity. Objective measures of delirium, including the inattention screens studied, are particularly prone to spectrum bias.31,34 However, the strength of this approach is that the assessment of inattention becomes less reliant upon clinical judgment and allows it to be used by raters from a wide range of clinical backgrounds. On the other hand, a subjective interpretation of these inattention tasks may allow the rater to capture the subtleties of inattention (ie, decreased speed of performance in a highly intelligent and well-educated patient without dementia). The disadvantage of this approach, however, is that it is more dependent on clinical judgment and may have decreased diagnostic accuracy in those with less clinical experience or with limited training.14,42,43 These factors must be carefully considered when determining which delirium assessment to use.
Additional research is required to determine the clinical utility of these brief inattention assessments. These findings need to be further validated in larger studies, and the optimal cutoff of each task for different subgroup of patients (eg, demented vs nondemented) needs to be further clarified. It is not completely clear whether these inattention tests can serve as standalone assessments. Depending on the cutoff used, some of these assessments may have unacceptable false negative or false positive rates that may lead to increased adverse patient outcomes or increased resource utilization, respectively. Additional components or assessments may be needed to improve the diagnostic accuracy of these assessments. In addition to understanding these inattention assessments’ diagnostic accuracies, their ability to predict adverse outcomes also needs to be investigated. While a previous study observed that making any error on the MOTYB-12 task was associated with increased physical restraint use and prolonged hospital length of stay,44 these assessments’ ability to prognosticate long-term outcomes such as mortality or long-term cognition or function need to be studied. Lastly, studies should also evaluate how easily implementable these assessments are and whether improved delirium recognition leads to improved patient outcomes.
This study has several notable limitations. Though planned a priori, this was a secondary analysis of a larger investigation designed to validate 3 delirium assessments. Our sample size was also relatively small, causing our 95% CIs to overlap in most cases and limiting the statistical power to truly determine whether one measure is better than the other. We also asked the patient to recite the months backwards from December to July as well as recite the months backwards from December to January. It is possible that the patient may have performed better at going from December to January because of learning effect. Our reference standard for delirium was based upon DSM-IV-TR criteria. The new DSM-V criteria may be more restrictive and may slightly change the sensitivities and specificities of the inattention tasks. We enrolled a convenience sample and enrolled patients who were more likely to be male, have cardiovascular chief complaints, and be admitted to the hospital; as a result, selection bias may have been introduced. Lastly, this study was conducted in a single center and enrolled patients who were 65 years and older. Our findings may not be generalizable to other settings and in those who are less than 65 years of age.
CONCLUSIONS
The MOTYB-6 and MOTYB-12 tasks had very good sensitivities but modest specificities (approximately 50%) using any error made as a cutoff; increasing cutoff to 2 errors and 3 errors, respectively, improved their specificities (approximately 70%) with minimal impact to their sensitivities. Reciting the days of the week backwards, spelling the word “LUNCH” backwards, and the 10-letter vigilance “A” task appeared to perform the best in ruling out delirium but only moderately decreased the likelihood of delirium. The 10-letter Vigilance “A” and picture recognition task
Disclosure
This study was funded by the Emergency Medicine Foundation Career Development Award, National Institutes of Health K23AG032355, and National Center for Research Resources, Grant UL1 RR024975-01. The authors report no financial conflicts of interest.
1. American Psychiatric Association. Diagnostic and statistical manual of mental disorders: DSM-5. Washington, DC: American Psychiatric Association; 2013.
33. Hamrick I, Hafiz R, Cummings DM. Use of days of the week in a modified mini-mental state exam (M-MMSE) for detecting geriatric cognitive impairment. J Am Board Fam Med. 2013;26(4):429-435.
Delirium is an acute neurocognitive disorder1 that affects up to 25% of older emergency department (ED) and hospitalized patients.2-4 The relationship between delirium and adverse outcomes is well documented.5-7 Delirium is a strong predictor of increased length of mechanical ventilation, longer intensive care unit and hospital stays, increased risk of falls, long-term cognitive impairment, and mortality.8-13 Delirium is frequently missed by healthcare professionals2,14-16 and goes undetected in up to 3 out of 4 patients by bedside nurses and medical practitioners in many hospital settings.14,17-22 A significant barrier to recognizing delirium is the absence of brief delirium assessments.
In an effort to improve delirium recognition in the acute care setting, there has been a concerted effort to develop and validate brief delirium assessments. To address this unmet need, 4 ‘A’s Test (4AT), the Brief Confusion Assessment Method (bCAM), and the 3-minute diagnostic assessment for CAM-defined delirium (3D-CAM) are 1- to 3-minute delirium assessments that were validated in acutely ill older patients.23 However, 1 to 3 minutes may still be too long in busy clinical environments, and briefer (<30 seconds) delirium assessments may be needed.
One potential more-rapid method to screen for delirium is to specifically test for the presence of inattention, which is a cardinal feature of delirium.24,25 Inattention can be ascertained by having the patient recite the months backwards, recite the days of the week backwards, or spell a word backwards.26 Recent studies have evaluated the diagnostic accuracy of reciting the months of the year backwards for delirium. O’Regan et al.27 evaluated the diagnostic accuracy of the month of the year backwards from December to July (MOTYB-6) and observed that this task was 84% sensitive and 90% specific for delirium in older patients. However, they performed the reference standard delirium assessments in patients who had a positive MOTYB-6, which can overestimate sensitivity and underestimate specificity (verification bias).28 Fick et al.29 examined the diagnostic accuracy of 20 individual elements of the 3D-CAM and observed that reciting the months of the year backwards from December to January (MOTYB-12) was 83% sensitive and 69% specific for delirium. However, this was an exploratory study that was designed to identify an element of the 3D-CAM that had the best diagnostic accuracy.
To address these limitations, we sought to evaluate the diagnostic performance of the MOTYB-6 and MOTYB-12 for delirium as diagnosed by a reference standard. We also explored other brief tests of inattention such as spelling a word (“LUNCH”) backwards, reciting the days of the week backwards, 10-letter vigilance “A” task, and 5 picture recognition task.
METHODS
Study Design and Setting
This was a preplanned secondary analysis of a prospective observational study that validated 3 delirium assessments.30,31 This study was conducted at a tertiary care, academic ED. The local institutional review board (IRB) reviewed and approved this study. Informed consent from the patient or an authorized surrogate was obtained whenever possible. Because this was an observational study and posed minimal risk to the patient, the IRB granted a waiver of consent for patients who were both unable to provide consent and were without an authorized surrogate available in the ED or by phone.
Selection of Participants
We enrolled a convenience sample of patients between June 2010 and February 2012 Monday through Friday from 8
Research assistants approached patients who met inclusion criteria and determined if any exclusion criteria were present. If none of the exclusion criteria were present, then the research assistant reviewed the informed consent document with the patient or authorized surrogate if the patient was not capable of providing consent. If a patient was not capable of providing consent and no authorized surrogate was available, then the patient was enrolled (under the waiver of consent) as long as the patient assented to be a part of the study. Once the patient was enrolled, the research assistant contacted the physician rater and reference standard psychiatrists to approach the patient.
Measures of Inattention
An emergency physician (JHH) who had no formal training in the mental status assessment of elders administered a cognitive battery to the patient, including tests of inattention. The following inattention tasks were administered:
- Spell the word “LUNCH” backwards.30 Patients were initially allowed to spell the word “LUNCH” forwards. Patients who were unable to perform the task were assigned 5 errors.
- Recite the months of the year backwards from December to July.23,26,27,30,32 Patients who were unable to perform the task were assigned 6 errors.
- Recite the days of the week backwards.23,26,33 Patients who were unable to perform the task were assigned 7 errors.
- Ten-letter vigilance “A” task.34 The patient was given a series of 10 letters (“S-A-V-E-A-H-A-A-R-T”) every 3 seconds and was asked to squeeze the rater’s hand every time the patient heard the letter “A.” Patients who were unable to perform the task were assigned 10 errors.
- Five picture recognition task.34 Patients were shown 5 objects on picture cards. Afterwards, patients were shown 10 pictures with the previously shown objects intermingled. The patient had to identify which objects were seen previously in the first 5 pictures. Patients who were unable to perform the task were assigned 10 errors.
- Recite the months of the year backwards from December to January.29 Patients who were unable to perform the task were assigned 12 errors.
Reference Standard for Delirium
A comprehensive consultation-liaison psychiatrist assessment was the reference standard for delirium; the diagnosis of delirium was based on Diagnostic and Statistical Manual of Mental Disorders, Fourth Edition, Text Revision (DSM-IV-TR) criteria.35 Three psychiatrists who each had an average of 11 years of clinical experience and regularly diagnosed delirium as part of their daily clinical practice were available to perform these assessments. To arrive at the diagnosis of delirium, they interviewed those who best understood the patient’s mental status (eg, the patient’s family members or caregivers, physician, and nurses). They also reviewed the patient’s medical record and radiology and laboratory test results. They performed bedside cognitive testing that included, but was not limited to, the Mini-Mental State Examination, Clock Drawing Test, Luria hand sequencing task, and tests for verbal fluency. A focused neurological examination was also performed (ie, screening for paraphasic errors, tremors, tone, asterixis, frontal release signs, etc.), and they also evaluated the patient for affective lability, hallucinations, and level of alertness. If the presence of delirium was still questionable, then confrontational naming, proverb interpretation or similarities, and assessments for apraxias were performed at the discretion of the psychiatrist. The psychiatrists were blinded to the physician’s assessments, and the assessments were conducted within 3 hours of each other.
Additional Variables Collected
Using medical record review, comorbidity burden, severity of illness, and premorbid cognition were ascertained. The Charlson Comorbidity Index, a weighted index that takes into account the number and seriousness of 19 preexisting comorbid conditions, was used to quantify comorbidity burden; higher scores indicate higher comorbid burden.36,37 The Acute Physiology Score of the Acute Physiology and Chronic Health Evaluation II was used to quantify severity of illness.38 This score is based upon the initial values of 12 routine physiologic measurements such as vital sign and laboratory abnormalities; higher scores represent higher severities of illness.38 The medical record was reviewed to ascertain the presence of premorbid cognitive impairment; any documentation of dementia in the patient’s clinical problem list or physician history and physical examination from the outpatient or inpatient settings was considered positive. The medical record review was performed by a research assistant and was double-checked for accuracy by one of the investigators (JHH).
Data Analyses
Measures of central tendency and dispersion for continuous variables were reported as medians and interquartile ranges. Categorical variables were reported as proportions. Receiver operating characteristic curves were constructed for each inattention task. Area under the receiver operating characteristic curves (AUC) was reported to provide a global measure of diagnostic accuracy. Sensitivities, specificities, positive likelihood ratios (PLRs), and negative likelihood ratios (NLRs) with their 95% CIs were calculated using the psychiatrist’s assessment as the reference standard.39 Cut-points with PLRs greater than 10 (strongly increased the likelihood of delirium) or NLRs less than 0.1 (strongly decreased the likelihood of delirium) were preferentially reported whenever possible.
All statistical analyses were performed with open source R statistical software version 3.0.1 (http://www.r-project.org/), SAS 9.4 (SAS Institute, Cary, NC), and Microsoft Excel 2010 (Microsoft Inc., Redmond, WA).
RESULTS
DISCUSSION
Delirium is frequently missed by healthcare providers because it is not routinely screened for in the acute care setting. To help address this deficiency of care, we evaluated several brief measures of inattention that take less than 30 seconds to complete. We observed that any errors made on the MOTYB-6 and MOTYB-12 tasks had very good sensitivities (80% and 84%) but were limited by their modest specificities (approximately 50%) for delirium. As a result, these assessments have limited clinical utility as standalone delirium screens. We also explored other commonly used brief measures of inattention and at a variety of error cutoffs. Reciting the days of the week backwards appeared to best balance sensitivity and specificity. None of the inattention measures could convincingly rule out delirium (NLR < 0.10), but the vigilance “A” and picture recognition tasks may have clinical utility in ruling in delirium (PLR > 10). Overall, all the inattention tasks, including MOTYB-6 and MOTYB-12, had very good diagnostic performances based upon their AUC. However, achieving a high sensitivity often had to be sacrificed for specificity or, alternatively, achieving a high specificity had to be sacrificed for sensitivity.
Inattention has been shown to be the cardinal feature for delirium,40 and its assessment using cognitive testing has been recommended to help identify the presence of delirium according to an expert consensus panel.26 The diagnostic performance of the MOTYB-12 observed in our study is similar to a study by Fick et al., who reported that MOTYB-12 had very good sensitivity (83%) but had modest specificity (69%) with a cutoff of 1 or more errors. Hendry et al. observed that the MOTYB-12 was 91% sensitive and 50% specific using a cutoff of 4 or more errors. With regard to the MOTYB-6, our reported specificity was different from what was observed by O’Regan et al.27 Using 1 or more errors as a cutoff, they observed a much higher specificity for delirium than we did (90% vs 57%). Discordant observations regarding the diagnostic accuracy for other inattention tasks also exist. We observed that making any error on the days of the week backwards task was 84% sensitive and 82% specific for delirium, whereas Fick et al. observed a sensitivity and specificity of 50% and 94%, respectively. For the vigilance “A” task, we observed that making 2 or more errors over a series of 10 letters was 64.0% sensitive and 91.4% specific for delirium, whereas Pompei et al.41 observed that making 2 or more errors over a series of 60 letters was 51% sensitive and 77% specific for delirium.
The abovementioned discordant findings may be driven by spectrum bias, wherein the sensitivities and specificities for each inattention task may differ in different subgroups. As a result, differences in the age distribution, proportion of college graduates, history of dementia, and susceptibility to delirium can influence overall sensitivity and specificity. Objective measures of delirium, including the inattention screens studied, are particularly prone to spectrum bias.31,34 However, the strength of this approach is that the assessment of inattention becomes less reliant upon clinical judgment and allows it to be used by raters from a wide range of clinical backgrounds. On the other hand, a subjective interpretation of these inattention tasks may allow the rater to capture the subtleties of inattention (ie, decreased speed of performance in a highly intelligent and well-educated patient without dementia). The disadvantage of this approach, however, is that it is more dependent on clinical judgment and may have decreased diagnostic accuracy in those with less clinical experience or with limited training.14,42,43 These factors must be carefully considered when determining which delirium assessment to use.
Additional research is required to determine the clinical utility of these brief inattention assessments. These findings need to be further validated in larger studies, and the optimal cutoff of each task for different subgroup of patients (eg, demented vs nondemented) needs to be further clarified. It is not completely clear whether these inattention tests can serve as standalone assessments. Depending on the cutoff used, some of these assessments may have unacceptable false negative or false positive rates that may lead to increased adverse patient outcomes or increased resource utilization, respectively. Additional components or assessments may be needed to improve the diagnostic accuracy of these assessments. In addition to understanding these inattention assessments’ diagnostic accuracies, their ability to predict adverse outcomes also needs to be investigated. While a previous study observed that making any error on the MOTYB-12 task was associated with increased physical restraint use and prolonged hospital length of stay,44 these assessments’ ability to prognosticate long-term outcomes such as mortality or long-term cognition or function need to be studied. Lastly, studies should also evaluate how easily implementable these assessments are and whether improved delirium recognition leads to improved patient outcomes.
This study has several notable limitations. Though planned a priori, this was a secondary analysis of a larger investigation designed to validate 3 delirium assessments. Our sample size was also relatively small, causing our 95% CIs to overlap in most cases and limiting the statistical power to truly determine whether one measure is better than the other. We also asked the patient to recite the months backwards from December to July as well as recite the months backwards from December to January. It is possible that the patient may have performed better at going from December to January because of learning effect. Our reference standard for delirium was based upon DSM-IV-TR criteria. The new DSM-V criteria may be more restrictive and may slightly change the sensitivities and specificities of the inattention tasks. We enrolled a convenience sample and enrolled patients who were more likely to be male, have cardiovascular chief complaints, and be admitted to the hospital; as a result, selection bias may have been introduced. Lastly, this study was conducted in a single center and enrolled patients who were 65 years and older. Our findings may not be generalizable to other settings and in those who are less than 65 years of age.
CONCLUSIONS
The MOTYB-6 and MOTYB-12 tasks had very good sensitivities but modest specificities (approximately 50%) using any error made as a cutoff; increasing cutoff to 2 errors and 3 errors, respectively, improved their specificities (approximately 70%) with minimal impact to their sensitivities. Reciting the days of the week backwards, spelling the word “LUNCH” backwards, and the 10-letter vigilance “A” task appeared to perform the best in ruling out delirium but only moderately decreased the likelihood of delirium. The 10-letter Vigilance “A” and picture recognition task
Disclosure
This study was funded by the Emergency Medicine Foundation Career Development Award, National Institutes of Health K23AG032355, and National Center for Research Resources, Grant UL1 RR024975-01. The authors report no financial conflicts of interest.
1. American Psychiatric Association. Diagnostic and statistical manual of mental disorders: DSM-5. Washington, DC: American Psychiatric Association; 2013.
33. Hamrick I, Hafiz R, Cummings DM. Use of days of the week in a modified mini-mental state exam (M-MMSE) for detecting geriatric cognitive impairment. J Am Board Fam Med. 2013;26(4):429-435.
© 2018 Society of Hospital Medicine