User login
Which patients with a parapneumonic effusion need a chest tube?
Hospitalized patients with pneumonia who develop a complicated parapneumonic effusion or empyema need to undergo chest tube placement.
WHAT IS PARAPNEUMONIC EFFUSION?
Parapneumonic effusion is a pleural effusion that forms concurrently with bacterial or viral pneumonia. Up to 40% of patients hospitalized with pneumonia develop a parapneumonic effusion.1 The effusion progresses through a continuum of 3 stages: uncomplicated, complicated, and empyema.
Uncomplicated parapneumonic effusion is an exudative effusion without bacteria or pus that is caused by movement of fluid and neutrophils into the pleural space. Pneumonia itself causes an increase in interstitial fluid and capillary leakage. The effusion becomes complicated as a result of bacteria invading the pleural space, causing a further increase in neutrophils in the pleural fluid. Empyema is defined as the presence of frank pus in the pleural space.
CLINICAL SIGNIFICANCE
According to the US Centers for Disease Control and Prevention, pneumonia accounts for 674,000 emergency department visits each year; of the patients hospitalized, up to 40% develop a parapneumonic effusion.2 The only study done on rates of death associated with parapneumonic effusion showed that, compared with patients with no effusion, the risk of death was 3.7 times higher with a unilateral effusion and 6.5 times higher with bilateral effusions.3
INITIAL EVALUATION
The initial evaluation of suspected parapneumonic effusion should include chest radiography with lateral or decubitus views, followed by thoracentesis if indicated. If thoracentesis is performed, the fluid should be tested as follows:
- Gram stain
- Appropriate cultures based on clinical scenario (eg, aerobic, anaerobic, fungal)
- Total protein in pleural fluid and serum
- Lactate dehydrogenase (LDH) in pleural fluid and serum
- Glucose
- pH.
CLASSIFICATION OF EFFUSIONS
When pleural fluid is obtained, the total protein and LDH levels are used to categorize the effusion as either transudative or exudative based on the Light criteria.4 An effusion is confirmed as exudative when 1 of the following 3 criteria is met:
- The ratio of pleural fluid protein to serum protein is greater than 0.5
- The ratio of pleural fluid LDH to serum LDH is greater than 0.6
- The pleural fluid LDH is greater than two-thirds the upper limit of normal for the serum LDH.

Category 1 effusions are defined as free- flowing fluid with a thickness of less than 10 mm on any imaging modality. Thoracentesis for pleural fluid analysis is not required. The prognosis is very good.
Category 2 effusions are defined as free- flowing fluid with a thickness greater than 10 mm and less than 50% of the hemithorax. Thoracentesis is typically done because of the size of the effusion, but Gram stain and culture of the pleural fluid are usually negative, and the pH is at least 7.2. The prognosis is good.
Category 3 effusions are considered complicated because the anatomy of the pleural space becomes altered or because bacteria have invaded the pleural space. The effusion is larger than 50% of the hemithorax or is loculated, or the parietal pleura is thickened. Since the bacteria have invaded the pleural space, Gram stain or culture of pleural fluid may be positive, the pleural fluid pH may be less than 7.2, or the glucose level of the fluid may be less than 60 mg/dL. The prognosis for category 3 is poor.
Category 4 effusions are defined as empyema. The only characteristic that separates this from category 3 is frank pus in the pleural space. The prognosis is very poor.
TO PLACE A CHEST TUBE OR NOT
For category 1 or 2 effusions, treatment with antibiotics alone is typically enough. Category 3 effusions usually do not respond to antibiotics alone and may require complete drainage of the fluid with or without a chest tube depending on whether loculations are present, as loculations are difficult to drain with a chest tube. Category 4 effusions require both antibiotics and chest tube placement.
WHAT TYPE OF CHEST TUBE?
Studies have shown that small-bore chest tubes (< 20 F) are as efficacious as larger tubes (≥ 20 F) for the treatment of complicated parapneumonic effusion and empyema.6,7 Studies have also shown that the size of the tube makes no difference in the time needed to drain the effusion, the length of hospital stay, or the complication rate.8,9 Based on these studies, a small-bore chest tube should be placed first when clinically appropriate. When a chest tube is placed for empyema, computed tomography should be performed within 24 hours to confirm proper tube placement.
ADVANCED THERAPIES FOR EMPYEMA
Empyema treatment fails when antibiotic coverage is inadequate or when a loculation is not drained appropriately. Options if treatment fails include instillation of fibrinolytics into the pleural space, video-assisted thorascopic surgery, and decortication.
The role of fibrinolytics has not been well-established, but fibrinolytics should be considered in loculated effusions or empyema, or if drainage of the effusion slows.10 Video-assisted thorascopic surgery is reserved for effusions that are incompletely drained with a chest tube with or without fibrinolytics; studies have shown shorter hospital length of stay and higher treatment efficacy when this is performed earlier for loculated effusions.11 Decortication is reserved for symptomatic patients who have a thickened pleura more than 6 months after the initial infection.12 Timing for each of these procedures is not clearly defined and so must be individualized.
TAKE-AWAY POINTS
- Parapneumonic effusion occurs concurrently with pneumonia and with a high frequency.1
- Effusions are associated with an increased risk of death.3
- Categorizing the effusion helps guide treatment.
- Chest tubes should be placed for some cases of complicated effusion and for all cases of empyema.
- A small-bore chest tube (< 20 F) should be tried first.
- Light RW. Parapneumonic effusions and empyema. Proc Am Thorac Soc 2006; 3(1):75–80. doi:10.1513/pats.200510-113JH
- US Department of Health and Human Services; Centers for Disease Control and Prevention; National Center for Health Statistics. National hospital ambulatory medical care survey: 2013 emergency department summary tables. www.cdc.gov/nchs/data/ahcd/nhamcs_emergency/2013_ed_web_tables.pdf.
- Hasley PB, Albaum MN, Li YH, et al. Do pulmonary radiographic findings at presentation predict mortality in patients with community-acquired pneumonia? Arch Intern Med 1996; 156(19):2206–2212. doi:10.1001/archinte.1996.00440180068008
- Light RW, Macgregor MI, Luchsinger PC, Ball WC. Pleural effusions: the diagnostic separation of transudates and exudates. Ann Intern Med 1972; 77(4):507–513. doi:10.7326/0003-4819-77-4-507
- Colice GL, Curtis A, Deslauriers J, et al. Medical and surgical treatment of parapneumonic effusions: an evidence-based guideline. Chest 2000; 118(4):1158–1171. doi:10.1378/CHEST.118.4.1158
- Ali I, Unruh H. Management of empyema thoracis. Ann Thorac Surg 1990; 50(3):355–359. doi:10.1016/0003-4975(90)90474-K
- Ashbaugh DG. Empyema thoracis. Factors influencing morbidity and mortality. Chest 1991; 99(5):1162–1165. doi:10.1378/CHEST.99.5.1162
- Cooke DT, David EA. Large-bore and small-bore chest tubes: types, function, and placement. Thorac Surg Clin 2013; 23(1):17–24. doi:10.1016/j.thorsurg.2012.10.006
- Halifax RJ, Psallidas I, Rahman NM. Chest drain size: the debate continues. Curr Pulmonol Rep 2017; 6(1):26–29. doi:10.1007/s13665-017-0162-3
- Maskell NA, Davies CW, Nunn AJ, et al; First Multicenter Intrapleural Sepsis Trial (MIST1) Group. UK controlled trial of intrapleural streptokinase for pleural infection. N Engl J Med 2005; 352(9):865–874. doi:10.1056/NEJMoa042473
- Wait MA, Sharma S, Hohn J, Dal Nogare A. A randomized trial of empyema therapy. Chest 1997; 111(6):1548–1551. doi:10.1378/chest.111.6.1548
- Rzyman W, Skokowski J, Romanowicz G, Lass P, Dziadziuszko R. Decortication in chronic pleural empyema—effect on lung function. Eur J Cardiothorac Surg 2002; 21(3):502–507. doi:10.1016/S1010-7940(01)01167-8
Hospitalized patients with pneumonia who develop a complicated parapneumonic effusion or empyema need to undergo chest tube placement.
WHAT IS PARAPNEUMONIC EFFUSION?
Parapneumonic effusion is a pleural effusion that forms concurrently with bacterial or viral pneumonia. Up to 40% of patients hospitalized with pneumonia develop a parapneumonic effusion.1 The effusion progresses through a continuum of 3 stages: uncomplicated, complicated, and empyema.
Uncomplicated parapneumonic effusion is an exudative effusion without bacteria or pus that is caused by movement of fluid and neutrophils into the pleural space. Pneumonia itself causes an increase in interstitial fluid and capillary leakage. The effusion becomes complicated as a result of bacteria invading the pleural space, causing a further increase in neutrophils in the pleural fluid. Empyema is defined as the presence of frank pus in the pleural space.
CLINICAL SIGNIFICANCE
According to the US Centers for Disease Control and Prevention, pneumonia accounts for 674,000 emergency department visits each year; of the patients hospitalized, up to 40% develop a parapneumonic effusion.2 The only study done on rates of death associated with parapneumonic effusion showed that, compared with patients with no effusion, the risk of death was 3.7 times higher with a unilateral effusion and 6.5 times higher with bilateral effusions.3
INITIAL EVALUATION
The initial evaluation of suspected parapneumonic effusion should include chest radiography with lateral or decubitus views, followed by thoracentesis if indicated. If thoracentesis is performed, the fluid should be tested as follows:
- Gram stain
- Appropriate cultures based on clinical scenario (eg, aerobic, anaerobic, fungal)
- Total protein in pleural fluid and serum
- Lactate dehydrogenase (LDH) in pleural fluid and serum
- Glucose
- pH.
CLASSIFICATION OF EFFUSIONS
When pleural fluid is obtained, the total protein and LDH levels are used to categorize the effusion as either transudative or exudative based on the Light criteria.4 An effusion is confirmed as exudative when 1 of the following 3 criteria is met:
- The ratio of pleural fluid protein to serum protein is greater than 0.5
- The ratio of pleural fluid LDH to serum LDH is greater than 0.6
- The pleural fluid LDH is greater than two-thirds the upper limit of normal for the serum LDH.
Category 1 effusions are defined as free- flowing fluid with a thickness of less than 10 mm on any imaging modality. Thoracentesis for pleural fluid analysis is not required. The prognosis is very good.
Category 2 effusions are defined as free- flowing fluid with a thickness greater than 10 mm and less than 50% of the hemithorax. Thoracentesis is typically done because of the size of the effusion, but Gram stain and culture of the pleural fluid are usually negative, and the pH is at least 7.2. The prognosis is good.
Category 3 effusions are considered complicated because the anatomy of the pleural space becomes altered or because bacteria have invaded the pleural space. The effusion is larger than 50% of the hemithorax or is loculated, or the parietal pleura is thickened. Since the bacteria have invaded the pleural space, Gram stain or culture of pleural fluid may be positive, the pleural fluid pH may be less than 7.2, or the glucose level of the fluid may be less than 60 mg/dL. The prognosis for category 3 is poor.
Category 4 effusions are defined as empyema. The only characteristic that separates this from category 3 is frank pus in the pleural space. The prognosis is very poor.
TO PLACE A CHEST TUBE OR NOT
For category 1 or 2 effusions, treatment with antibiotics alone is typically enough. Category 3 effusions usually do not respond to antibiotics alone and may require complete drainage of the fluid with or without a chest tube depending on whether loculations are present, as loculations are difficult to drain with a chest tube. Category 4 effusions require both antibiotics and chest tube placement.
WHAT TYPE OF CHEST TUBE?
Studies have shown that small-bore chest tubes (< 20 F) are as efficacious as larger tubes (≥ 20 F) for the treatment of complicated parapneumonic effusion and empyema.6,7 Studies have also shown that the size of the tube makes no difference in the time needed to drain the effusion, the length of hospital stay, or the complication rate.8,9 Based on these studies, a small-bore chest tube should be placed first when clinically appropriate. When a chest tube is placed for empyema, computed tomography should be performed within 24 hours to confirm proper tube placement.
ADVANCED THERAPIES FOR EMPYEMA
Empyema treatment fails when antibiotic coverage is inadequate or when a loculation is not drained appropriately. Options if treatment fails include instillation of fibrinolytics into the pleural space, video-assisted thorascopic surgery, and decortication.
The role of fibrinolytics has not been well-established, but fibrinolytics should be considered in loculated effusions or empyema, or if drainage of the effusion slows.10 Video-assisted thorascopic surgery is reserved for effusions that are incompletely drained with a chest tube with or without fibrinolytics; studies have shown shorter hospital length of stay and higher treatment efficacy when this is performed earlier for loculated effusions.11 Decortication is reserved for symptomatic patients who have a thickened pleura more than 6 months after the initial infection.12 Timing for each of these procedures is not clearly defined and so must be individualized.
TAKE-AWAY POINTS
- Parapneumonic effusion occurs concurrently with pneumonia and with a high frequency.1
- Effusions are associated with an increased risk of death.3
- Categorizing the effusion helps guide treatment.
- Chest tubes should be placed for some cases of complicated effusion and for all cases of empyema.
- A small-bore chest tube (< 20 F) should be tried first.
- Light RW. Parapneumonic effusions and empyema. Proc Am Thorac Soc 2006; 3(1):75–80. doi:10.1513/pats.200510-113JH
- US Department of Health and Human Services; Centers for Disease Control and Prevention; National Center for Health Statistics. National hospital ambulatory medical care survey: 2013 emergency department summary tables. www.cdc.gov/nchs/data/ahcd/nhamcs_emergency/2013_ed_web_tables.pdf.
- Hasley PB, Albaum MN, Li YH, et al. Do pulmonary radiographic findings at presentation predict mortality in patients with community-acquired pneumonia? Arch Intern Med 1996; 156(19):2206–2212. doi:10.1001/archinte.1996.00440180068008
- Light RW, Macgregor MI, Luchsinger PC, Ball WC. Pleural effusions: the diagnostic separation of transudates and exudates. Ann Intern Med 1972; 77(4):507–513. doi:10.7326/0003-4819-77-4-507
- Colice GL, Curtis A, Deslauriers J, et al. Medical and surgical treatment of parapneumonic effusions: an evidence-based guideline. Chest 2000; 118(4):1158–1171. doi:10.1378/CHEST.118.4.1158
- Ali I, Unruh H. Management of empyema thoracis. Ann Thorac Surg 1990; 50(3):355–359. doi:10.1016/0003-4975(90)90474-K
- Ashbaugh DG. Empyema thoracis. Factors influencing morbidity and mortality. Chest 1991; 99(5):1162–1165. doi:10.1378/CHEST.99.5.1162
- Cooke DT, David EA. Large-bore and small-bore chest tubes: types, function, and placement. Thorac Surg Clin 2013; 23(1):17–24. doi:10.1016/j.thorsurg.2012.10.006
- Halifax RJ, Psallidas I, Rahman NM. Chest drain size: the debate continues. Curr Pulmonol Rep 2017; 6(1):26–29. doi:10.1007/s13665-017-0162-3
- Maskell NA, Davies CW, Nunn AJ, et al; First Multicenter Intrapleural Sepsis Trial (MIST1) Group. UK controlled trial of intrapleural streptokinase for pleural infection. N Engl J Med 2005; 352(9):865–874. doi:10.1056/NEJMoa042473
- Wait MA, Sharma S, Hohn J, Dal Nogare A. A randomized trial of empyema therapy. Chest 1997; 111(6):1548–1551. doi:10.1378/chest.111.6.1548
- Rzyman W, Skokowski J, Romanowicz G, Lass P, Dziadziuszko R. Decortication in chronic pleural empyema—effect on lung function. Eur J Cardiothorac Surg 2002; 21(3):502–507. doi:10.1016/S1010-7940(01)01167-8

How Does Your PICCOMPARE? A Pilot Randomized Controlled Trial Comparing Various PICC Materials in Pediatrics
Peripherally inserted central catheters (PICCs) have evolved since their inception in the early 1970s and are used with increasing frequency for pediatric inpatients and outpatients.1-3 Emerging literature, including a meta-analysis of international observational studies,4 reports PICC failure (complications necessitating premature removal) occurs in up to 30% of PICCs, most commonly due to infection, thrombosis, occlusion, and fracture.4-7 Raffini et al.7 report the increasing incidence of pediatric PICC-related thrombosis increases morbidity and mortality8 and negatively impacts future vessel health and preservation.9
PICCs have progressed from relatively simple, silicone-based catheters with an external clamp to chemically engineered polyurethane with pressure-activated valves placed at the proximal or distal catheter hub with the intent to reduce occlusion.10 Further modernization of PICC material occurred with the incorporation of antithrombogenic (AT) material (Endexo®). These PICCs are designed to contain a nonstick polymer, which is designed to reduce the adherence of blood components (platelets and clotting factors) and inhibit thrombus formation (and hence prevent deep vein thrombosis andocclusion, as well as inhibit microbial biofilm attachment [and subsequent infection]).11
In addition to new materials, other aspects of this PICC design have been the addition of a pressure-activated safety valve (PASV®) built into the proximal hub. Pressure-activated valve technology promises to prevent catheter occlusion by reducing blood reflux into the PICC; the valve opens with pressure during infusion and aspiration and remains closed with normal venous pressure, circumventing the need for clinicians to manually clamp the PICC and reducing human error and the potential for thrombosis, occlusion, and fracture development.12 Hoffer et al.13 reported half as many occlusions of valved PICCs (3.3%) compared with nonvalved or clamped PICCs (7.1%); although not statistically significant (P = .10), perhaps due to the small sample, overall complications, including occlusion and infection, were significantly lessened with the valved PICC (35% vs 79%; P = .02). Comparatively, Pittiruti et al.14 conducted a trial of 2 types of valved PICCs with an open-ended, nonvalved PICC and found no reduction in PICC occlusion or catheter malfunction.
Today, PICC use is common for patients who require short-to-medium intravenous therapy. PICCs are increasingly recognized for their significant complications, including thrombosis and infection.15 Novel PICC technology, including the incorporation of AT material such as Endexo® and PASV®, may reduce complications; however, the clinical efficacy, cost-effectiveness, and acceptability of these innovations have not been tested through randomized trials in pediatric patients. In accordance with Medical Research Council guidelines16 for developing interventions, we pilot tested the feasibility of the BioFlo® PICC, including intervention acceptability, compliance, recruitment, and initial estimates of effect, in anticipation of a subsequent full-scale efficacy randomized controlled trial. Our secondary aim was to compare the effectiveness of the BioFlo® PICC with Endexo® and PASV® technology in reducing PICC complications and failure.
METHODS
Design
We undertook a pilot randomized controlled trial comparing the standard polyurethane PICC (with external clamp) with the BioFlo® PICC (with internal valve) in preventing catheter failure in pediatric patients. The study was prospectively registered with the Australian Clinical Trials Registry (ACTRN12615001290583), and the research protocol was published.17
Study Setting
The study commenced in March 2016 at the Lady Cilento Children’s Hospital in South Brisbane, Australia, a tertiary-level, specialist, pediatric teaching hospital in Queensland, Australia, providing full-spectrum health services to children and young people from birth to 18 years of age. Recruitment, including data collection, was completed in November 2016.
Sample
The target sample size was 110 participants, 50 participants per group plus 10% for potential attrition, as determined by standard pilot trial sample size recommendations.18 With ethics approval, the sample size was later increased to 150 participants in order to adequately pilot a microbiological substudy method (published separately).17 Participants were consecutively recruited if they met the inclusion criteria: PICC insertion, age <18 years, predicted hospital stay >24 hours, single-lumen PICC, and written informed consent by an English-speaking, legal parent or guardian. Patients were excluded if they had a current (<48 hours) blood stream infection (BSI), vessel size <2 mm, could not speak English without an interpreter, required a multilumen PICC, or were previously enrolled in the study.
Interventions
Participants were randomized to receive either of the following PICCs: (1) standard care: Cook™ polyurethane, turbo-ject, power-injectable PICC (Cook Medical, Bloomington, IN) or (2) comparison: BioFlo® polyurethane with Endexo® technology (AngioDynamics Inc, Queensbury, NY).
Outcomes
The primary outcome was feasibility of a full-efficacy trial established by composite analysis of the elements of eligibility (>70% of patients will be eligible), recruitment (>70% of patients will agree to enroll), retention and attrition (<15% of participants are lost to follow-up or withdraw from the study), protocol adherence (>80% of participants receive their allocated, randomly assigned study product), missing data (<10% of data are missed during data collection), parent and healthcare staff satisfaction, and PICC failure effect size estimates to allow sample size calculations.18,19 PICC failure was defined as the following complications associated with PICC removal: (1) catheter-associated BSI,8,20-22 (2) local site infection,22 (3) venous thrombosis,23 (4) occlusion,24,25 (5) PICC fracture, or (6) PICC dislodgement.25,26 Parents (or caregivers) and healthcare staff were asked to rate their level of confidence with the study product and ease of PICC removal by using a 0 to 100 numeric rating scale (NRS) of increasing confidence and/or ease. These data were collected at the time of PICC removal. Operators were also asked to rate their levels of satisfaction with the insertion equipment and ease of PICC insertion immediately upon completion of the insertion procedure (both 0-100 NRS of increasing satisfaction and/or ease). Secondary outcomes included individual PICC complications (eg, occlusion) occurring at any time point during the PICC dwell (including at removal), adverse events, pain, redness at the insertion site, and overall PICC dwell.
Study Procedures
The research nurse (ReN) screened operating theater lists for patients, obtained written informed consent, and initiated the randomization. Randomization was computer generated, and web based via Griffith University (https://www151.griffith.edu.au/random) to ensure allocation concealment until study entry. Patients were randomly assigned in a 1:1 ratio with computer-generated and randomly varied block sizes of 2 and 4. Data were collected by the ReN on the day of insertion, at day 1 postinsertion, then every 2 to 3 days thereafter so that PICCs were checked at least twice per week until study completion. Participants were included in the trial until 12 weeks post-PICC insertion, study withdrawal or PICC removal (whichever came first), with an additional 48 hours follow-up for infection outcomes. Patient review was face to face during the inpatient stay, with discharged patients’ follow-up occurring via outpatient clinics, hospital-in-the-home service, or telephone.
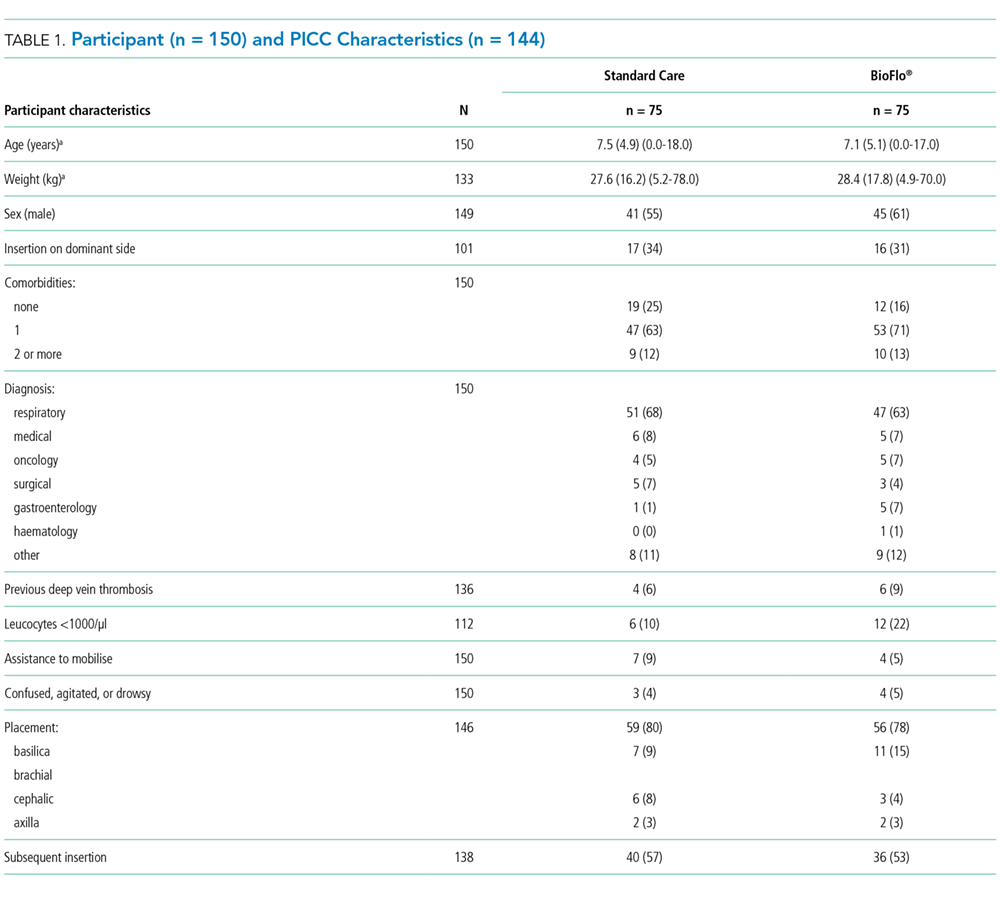
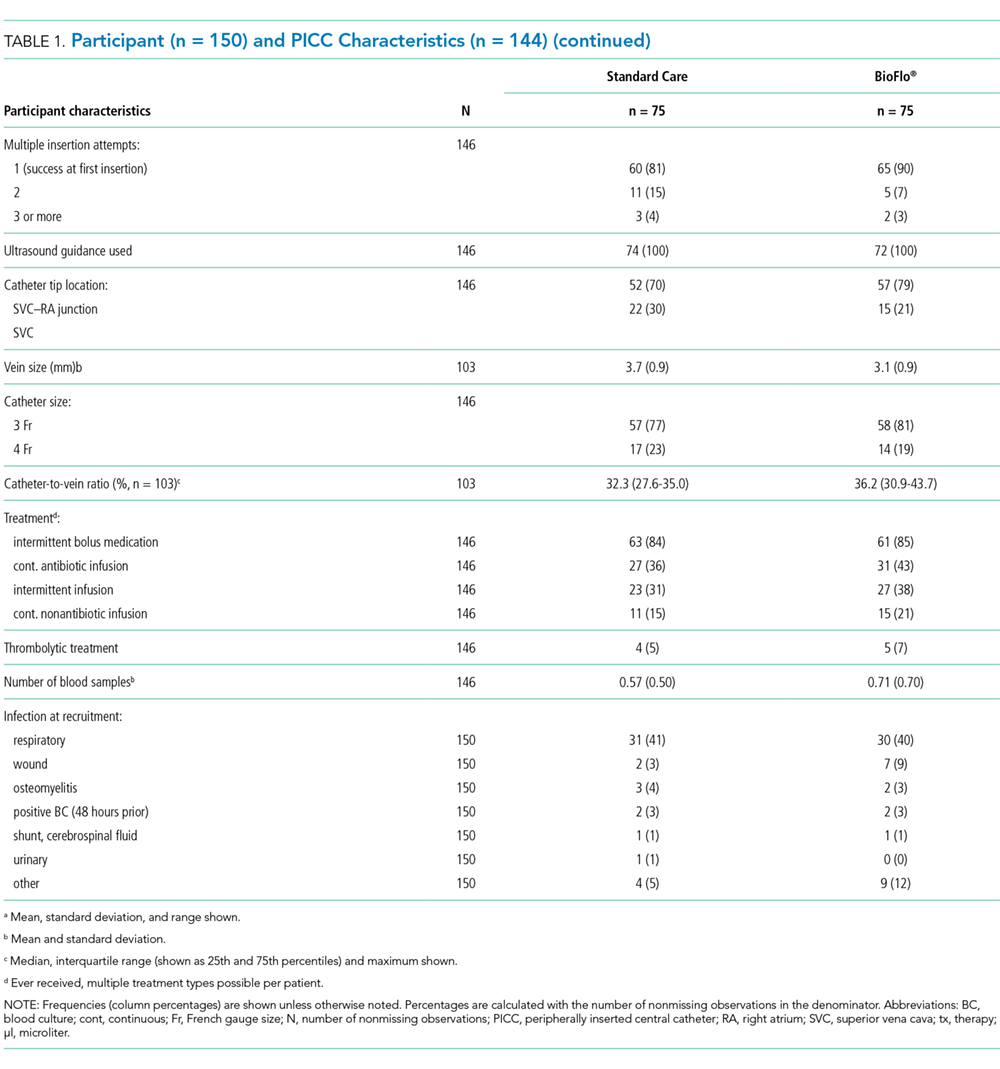
Data collection was via Research Electronic Data Capture (http://project-redcap.org/). The ReN collected data on primary and secondary outcomes by using the predefined criteria. Demographic and clinical data were collected to assess the success of randomization, describe the participant group, and display characteristics known to increase the risk of PICC complication and thrombosis. A blinded radiologist and infectious disease specialist reviewed and diagnosed thrombosis of deep veins and catheter-associated BSI outcomes, respectively.
PICC Procedures
Extensive prestudy education for 2 months prior to trial commencement was provided to all clinicians involved with the insertion and care of PICCs, including the study products. PICCs were inserted in an operating theater environment by a qualified consultant pediatric anesthetist, a senior anesthetic registrar or fellow in an approved anesthetic training program, or pediatric vascular access nurse practitioner. Ultrasound guidance was used to assess a patient’s vasculature and puncture the vessel. The operator chose the PICC size on the basis of clinical judgment of vessel size and patient needs and then inserted the allocated PICC.27 Preferred PICC tip location was the cavoatrial junction. All PICC tip positions were confirmed with a chest x-ray before use.
Postinsertion, PICCs were managed by local interdisciplinary clinicians in accordance with local practice guidelines.27-31 PICC care and management includes the use of 2% chlorhexidine gluconate in 70% alcohol for site antisepsis and neutral displacement needleless connectors (TUTA Pulse; Medical Australia Limited, Lidcombe, New South Wales, Australia); normal saline was used to flush after medication administration, and if the device was not in use for 6 hours or longer, heparin is instilled with securement via bordered polyurethane dressing (Tegaderm 1616; 3M, St Paul, Minnesota) and a sutureless securement device (Statlock VPPCSP; Bard, Georgia).
Statistical Analyses
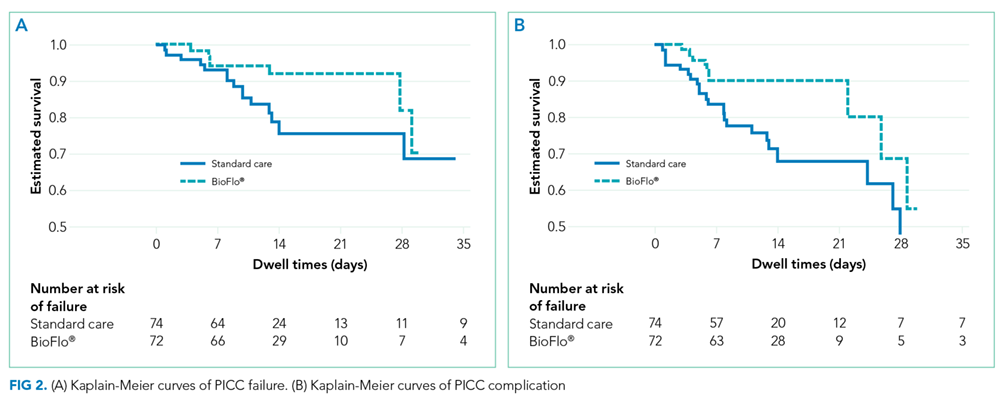
Data were exported to Stata 1532 for cleaning and analysis. Data cleaning of outlying figures and missing and implausible data was undertaken prior to analysis. Missing data were not imputed. The PICC was the unit of measurement, and all randomly assigned patients were analyzed on an intention-to-treat basis.33 Descriptive statistics (frequencies and percentages) were used to ascertain the primary outcome of feasibility for the larger trial. Incidence rates (per 1,000 catheter days) and rate ratios, including 95% confidence intervals (CIs), were calculated. The comparability of groups at baseline was described across demographic, clinical, and device characteristics. Kaplan-Meier survival curves (with log-rank tests) were used to compare PICC failure between study groups over time. Associations between baseline characteristics and failure were described by calculating hazard ratios (HRs). Univariable Cox regression was performed only due to the relatively low number of outcomes. P values of <.05 were considered statistically significant.
Ethics
The Children’s Health Service District, Queensland (Human Research Ethics Committee/15/QRCH/164), and Griffith University (2016/077) Human Research Ethics Committees provided ethics and governance approval. Informed consent was obtained from parents or legal guardians, with children providing youth assent if they were 7 years or older, dependent upon cognitive ability.
RESULTS
Participant and PICC Characteristics
Feasibility Outcomes
PICC Failure and Complications
As per supplementary Table 1, univariate Cox regression identified PICC failure as significantly associated with tip placement in the proximal superior vena cava (SVC) compared to the SVC–right atrium junction (HR 2.61; 95% CI, 1.17-5.82; P = .024). Reduced risk of PICC failure was significantly associated with any infusion during the dwell (continuous fluid infusion, P = .007; continuous antibiotic, P = .042; or intermittent infusion, P = .046) compared to no infusion. Other variables potentially influencing the risk of failure included PICC insertion by nurse specialist compared to consultant anesthetist (HR 2.61; 95% CI, 0.85-5.44) or registrar (HR 1.97; 95% CI, 0.57-6.77). These differences were not statistically significant; however, baseline imbalance between study groups for this variable and the feasibility design preclude absolute conclusions.
DISCUSSION
This is the first pilot feasibility trial of new PICC materials and valve design incorporated in the BioFlo® PICC in the pediatric population. The trial incorporated best practice for randomized trials, including using a concurrent control group, centralized and concealed randomization, predetermined feasibility criteria, and a registered and published trial protocol.17 As in other studies,15,24,34 PICC failure and complication prevalence was unacceptably high for this essential device. Standard care PICCs failed twice as often as the new BioFlo® PICCs (22% vs 11%), which is a clinically important difference. As researchers in a pilot study, we did not expect to detect statistically significant differences; however, we found that overall complications during the dwell occurred significantly more with the standard care than BioFlo® PICCs (P = .009).
BioFlo® PICC material offers a major advancement in PICC material through the incorporation of AT technologies into catheter materials, such as PICCs. Endexo® is a low molecular–weight, fluoro-oligomeric additive that self-locates to the top few nanometers of the material surface. When added to power-injectable polyurethane, the additive results in a strong but passive, nonstick, fluorinated surface in the base PICC material. This inhibits platelet adhesion, suppresses protein procoagulant conformation, and thereby reduces thrombus formation in medical devices. Additionally, Endexo® is not a catheter coating; rather, it is incorporated within the polyurethane of the PICC, thereby ensuring these AT properties are present on the internal, external, and cut surfaces of the PICC. If this technology can reduce complication during treatment and reduce failure from infection, thrombosis, occlusion, fracture, and dislodgement, it will improve patient outcomes considerably and lower health system costs. Previous studies investigating valve technology in PICC design to reduce occlusion have been inconclusive.12-14,35,36 Occlusion (both partial and complete) was less frequent in our study with the BioFlo® group (n = 3; 4%) compared to the standard care group (n = 6; 8%). The results of this pilot study suggest that either the Endexo® material or PASV® technology has a positive association with occlusion reduction during PICC treatment.
Thrombosis was the primary failure type for the standard care PICCs, comprising one-third of failures. All but one patient with radiologically confirmed thrombosis required the removal of the PICC prior to completion of treatment. The decision to remove the PICC or retain and treat conservatively remained with the treating team. Raffini et al.7 found thrombosis to increase in patients with one or more coexisting chronic medical condition. Slightly more standard care than BioFlo® patients were free of such comorbidities (25% vs 16%), yet standard care patients still had the higher number of thromboses (7% vs 3%). Morgenthaler and Rodriguez37 reported vascular access-associated thrombosis in pediatrics to be less common than in adults but higher in medically complex children. Worryingly, Menendez et al.38 reported pediatric thrombosis to be largely asymptomatic, so the true incidence in our study is likely higher because only radiologically confirmed thromboses were recorded.
Occlusion (partial or complete) was the predominant complication across the study, being associated with one-third of all failures. When occlusion complications during the dwell (some of which were resolved with treatment), in addition to those causing failure, were considered, this number was even greater. Occlusion complications are prevalent and costly. Smith et al.24 reported that occlusion was the most common reason for PICC removal and the most likely complication to delay treatment. Both the BioFlo® and standard care PICCs are pressure rated with good tensile strength; however, fracture occurred in 4% (n = 3) of standard care PICCs compared to no fractures in BioFlo® PICCs. Although the numbers are small, it may suggest a superior tensile strength of the BioFlo® material.
This study reinforces previously published results24,38 that PICC tip position is important and can influence complications, such as occlusion and thrombosis. In addition, we found a significant association with failure when PICCs did not have a continuous infusion. These findings reinforce the need for optimal tip location at insertion and ongoing flushing and maintenance of PICCs not used for infusions.
Limitations of this study include the small sample size, which was not designed to detect statistical differences in the primary outcome between groups. Despite randomization, there were slight imbalances at baseline for inserter type and leukocyte count, although these were not significantly associated with PICC failure in the Cox regression (data not shown), and thus were unlikely to influence findings. Additionally, a difference of <10% was associated with PICC tip position, favoring the BioFlo® group. PICC tip position outside the cavoatrial junction was positively associated with failure; therefore, the effect of tip positioning on outcomes is difficult to ascertain given the small sample size and feasibility nature of the study. Further study is warranted to further explore this effect. The population sampled was pediatric medical and surgical inpatients with a vessel size >2 mm attending the operating theater suite for PICC insertion, thereby limiting the study’s generalizability to adults and other populations, including neonates and those with PICCs inserted in the pediatric intensive care unit. The study could not be blinded because study products had to be visible to the clinical and research staff. However, it is unlikely that staff would intentionally sabotage PICCs to bias the study. Blinding was possible for the assessment of blood culture and ultrasound reports to diagnose infection and thrombosis. Strengths of this study included 100% protocol adherence, and no patients were lost to follow-up.
CONCLUSION
These results confirm that PICC failure is unacceptably high and suggest that the innovative BioFlo® PICC material and design holds promise to improve PICC outcomes by reducing complications and overall PICC failure. Trials of this technology are feasible, safe, and acceptable to healthcare staff and parents. Further trials are required, including in other patient populations, to definitively identify clinical, cost-effective methods to prevent PICC failure and improve reliability during treatment.
Acknowledgments
The authors thank the children and parents of Lady Cilento Children’s Hospital for participating in this important research. A special thank you goes to the nurses within the Vascular Assessment and Management Service and to Karen Turner, Julieta Woosley, and Anna Dean for their efforts in data collecting and ensuring protocol adherence.
Disclosure
Griffith University has received unrestricted, investigator-initiated research or educational grants to support the research of T. K., A. J. U., and C. R. M. from product manufacturers 3M, Adhezion Inc, AngioDynamics, Bard Medical, Baxter, B. Braun Medical Inc, Becton Dickinson, CareFusion, Centurion Medical Products, Cook Medical, Entrotech, FloMedical, ICU Medical Inc, Medical Australia Limited, Medtronic, Smiths Medical, and Teleflex. Griffith University has received consultancy payments on behalf of C. R. M., A. J. U., and T. K. from manufacturers 3M, AngioDynamics, Bard Medical, B. Braun Medical Inc, Becton Dickinson, CareFusion, Mayo Healthcare Inc, ResQDevices, and Smiths Medical. AngioDynamics (the BioFlo® PICC manufacturer) provided partial funds to undertake this research via an unrestricted donation to Griffith University (but not the study authors). Queensland Health provided in-kind support to fund the remainder of the trial. The funders had no role in the study design, collection, analysis, or interpretation of the data, writing of the report, or decision to submit the article for publication.
1. Chopra V, Flanders SA, Saint S. The problem with peripherally inserted central catheters. JAMA. 2012;308(15):1527-1528. PubMed
2. Gibson C, Connolly BL, Moineddin R, Mahant S, Filipescu D, Amaral JG. Peripherally inserted central catheters: use at a tertiary care pediatric center. J Vasc Interv Radiol. 2013;24(9):1323-1331. PubMed
3. Ullman AJ, Cooke M, Kleidon T, Rickard CM. Road map for improvement: point prevalence audit and survey of central venous access devices in paediatric acute care. J Paediatr Child Health. 2017;53(2):123-130. PubMed
4. Ullman AJ, Marsh N, Mihala G, Cooke M, Rickard CM. Complications of central venous access devices: a systematic review. Pediatrics. 2015;136(5):e1331-e1344. PubMed
5. Barrier A, Williams DJ, Connelly M, Creech CB. Frequency of peripherally inserted central catheter complications in children. Pediatr Infect Dis J. 2012;31(5):519-521. PubMed
6. Jumani K, Advani S, Reich NG, Gosey L, Milstone AM. Risk factors for peripherally inserted central venous catheter complications in children. JAMA Pediatr. 2013;167(5):429-435. PubMed
7. Raffini L, Huang YS, Witmer C, Feudtner C. Dramatic increase in venous thromboembolism in children’s hospitals in the United States from 2001 to 2007. Pediatrics. 2009;124(4):1001-1008. PubMed
8. Chopra V, Anand S, Krein SL, Chenoweth C, Saint S. Bloodstream infection, venous thrombosis, and peripherally inserted central catheters: reappraising the evidence. Am J Med. 2012;125(8):733-741. PubMed
9. Moureau NL, Trick N, Nifong T, et al. Vessel health and preservation (part 1): a new evidence-based approach to vascular access selection and management. J Vasc Access. 2012;13(3):351-356. PubMed
10. Poli P, Scocca A, Di Puccio F, Gallone G, Angelini L, Calabro EM. A comparative study on the mechanical behavior of polyurethane PICCs. J Vasc Access. 2016;17(2):175-181. PubMed
11. Interface Biologics. Surface modification technology platform. 2017. http://www.interfacebiologics.com/endexo.htm. Accessed April 5, 2017.
12. Hoffer EK, Bloch RD, Borsa JJ, Santulli P, Fontaine AB, Francoeur N. Peripherally inserted central catheters with distal versus proximal valves: prospective randomized trial. J Vasc Interv Radiol. 2001;12(10):1173-1177. PubMed
13. Hoffer EK, Borsa J, Santulli P, Bloch R, Fontaine AB. Prospective randomized comparison of valved versus nonvalved peripherally inserted central vein catheters. AJR Am J Roentgenol. 1999;173(5):1393-1398. PubMed
14. Pittiruti M, Emoli A, Porta P, Marche B, DeAngelis R, Scoppettuolo G. A prospective, randomized comparison of three different types of valved and nonvalved peripherally inserted central catheters. J Vasc Access. 2014;15(6):519-523.
15. Chopra V, Flanders SA, Saint S, et al. The Michigan Appropriateness Guide for Intravenous Catheters (MAGIC): Results From a Multispecialty Panel Using the RAND/UCLA Appropriateness Method. Ann Intern Med. 2015;163(6 Suppl):S1-S40. PubMed
16. Craig P, Dieppe P, Macintyre S, Michie S, Nazareth I, Petticrew M. Developing and evaluating complex interventions: the new Medical Research Council guidance. BMJ. 2008;337. PubMed
17. Kleidon TM, Ullman AJ, Zhang L, Mihala G, Rickard CM. How does your PICCOMPARE? A pilot randomized controlled trial comparing PICC materials in pediatrics. J Hosp Med. 2017;(under review). PubMed
18. Hertzog MA. Considerations in determining sample size for pilot studies. Res Nurs Health. 2008;31(2):180-191. PubMed
19. Thabane L, Ma J, Chu R, et al. A tutorial on pilot studies: the what, why and how. BMC Med Res Methodol. 2010;10:1. PubMed
20. Chopra V, O’Horo JC, Rogers MA, Maki DG, Safdar N. The risk of bloodstream infection associated with peripherally inserted central catheters compared with central venous catheters in adults: a systematic review and meta-analysis. Infect Control Hosp Epidemiol. 2013;34(9):908-918. PubMed
21. Kramer RD, Rogers MA, Conte M, Mann J, Saint S, Chopra V. Are antimicrobial peripherally inserted central catheters associated with reduction in central line-associated bloodstream infection? A systematic review and meta-analysis. Am J Infect Control. 2017;45(2):108-114. PubMed
22. Centers for Disease Control and Prevention. National Healthcare Safety Network Device Associated Module: CLABSI. 2014.
23. Lobo BL, Vaidean G, Broyles J, Reaves AB, Shorr RI. Risk of venous thromboembolism in hospitalized patients with peripherally inserted central catheters. J Hosp Med. 2009;4(7):417-422. PubMed
24. Smith SN, Moureau N, Vaughn VM, et al. Patterns and Predictors of Peripherally Inserted Central Catheter Occlusion: The 3P-O Study. J Vasc Interv Radiol. 28(5):749.e742-756.e742. PubMed
25. Chow LML, Friedman JN, MacArthur C, et al. Peripherally inserted central catheter (PICC) fracture and embolozation in the pediatric population. Pediatrics. 2003;142(2):141-144. PubMed
26. Chopra V, Kuhn L, Ratz D, Flanders SA, Krein SL. Vascular nursing experience, practice knowledge, and beliefs: Results from the Michigan PICC1 survey. J Hosp Med. 2016;11(4):269-275. PubMed
27. Frasca D, Dahyot-Fizelier C, Mimoz O. Prevention of central venous catheter-related infection in the intensive care unit. Crit Care. 2010;14(2):212. PubMed
28. Centre for Healthcare Related Infection Surveilance and Prevention and Tuberculosis Control. Guideline: Peripherally inserted central catheter (PICC). 2013.
29. Services Children’s Health Service. Central venous catheters: nursing care and management of peripherally inserted central catheter (PICC) in paediatric patients. 2011. http://qheps.health.qld.gov.au/childrenshealth/resources/nursestand/docs/ns_03452.pdf. Accessed Februrary 1, 2016.
30. Services CsH. Central Venous Access Device Insertion and Management. 2014.
31. Central venous access device insertion and management. Queensland Government; 2014. http://qheps.health.qld.gov.au/childrenshealth/resources/proc/docs/proc_03450.pdf Accessed March 13, 2014.
32. StatCorp. Stata Statistical Software: Release 12.1 College Station. 2006.
33. Rothwell PM. Factors that can affect the external validity of randomised controlled trials. PLoS Clin Trials. 2006;1(1):e9. PubMed
34. Chopra V, Ratz D, Kuhn L, Lopus T, Lee A, Krein S. Peripherally inserted central catheter-related deep vein thrombosis: contemporary patterns and predictors. J Thromb Haemost. 2014;12(6):847-854. PubMed
35. Alport B, Burbridge B, Lim H. Bard PowerPICC Solo2 vs Cook Turbo-Ject: A Tale of Two PICCs. Can Assoc Radiol J. 2012;63(4):323-328. PubMed
36. Johnston AJ, Streater CT, Noorani R, Crofts JL, Del Mundo AB, Parker RA. The effect of peripherally inserted central catheter (PICC) valve technology on catheter occlusion rates—the ‘ELeCTRiC’ study. J Vasc Access. 2012;13(4):421-425. PubMed
37. Morgenthaler TI, Rodriguez V. Preventing acute care-associated venous thromboembolism in adult and pediatric patients across a large healthcare system. J Hosp Med. 2016;11(Suppl 2):S15-S21. PubMed
38. Menendez JJ, Verdu C, Calderon B, et al. Incidence and risk factors of superficial and deep vein thrombosis associated with peripherally inserted central catheters in children. J Thromb Haemost. 2016;14(11):2158-2168. PubMed
Peripherally inserted central catheters (PICCs) have evolved since their inception in the early 1970s and are used with increasing frequency for pediatric inpatients and outpatients.1-3 Emerging literature, including a meta-analysis of international observational studies,4 reports PICC failure (complications necessitating premature removal) occurs in up to 30% of PICCs, most commonly due to infection, thrombosis, occlusion, and fracture.4-7 Raffini et al.7 report the increasing incidence of pediatric PICC-related thrombosis increases morbidity and mortality8 and negatively impacts future vessel health and preservation.9
PICCs have progressed from relatively simple, silicone-based catheters with an external clamp to chemically engineered polyurethane with pressure-activated valves placed at the proximal or distal catheter hub with the intent to reduce occlusion.10 Further modernization of PICC material occurred with the incorporation of antithrombogenic (AT) material (Endexo®). These PICCs are designed to contain a nonstick polymer, which is designed to reduce the adherence of blood components (platelets and clotting factors) and inhibit thrombus formation (and hence prevent deep vein thrombosis andocclusion, as well as inhibit microbial biofilm attachment [and subsequent infection]).11
In addition to new materials, other aspects of this PICC design have been the addition of a pressure-activated safety valve (PASV®) built into the proximal hub. Pressure-activated valve technology promises to prevent catheter occlusion by reducing blood reflux into the PICC; the valve opens with pressure during infusion and aspiration and remains closed with normal venous pressure, circumventing the need for clinicians to manually clamp the PICC and reducing human error and the potential for thrombosis, occlusion, and fracture development.12 Hoffer et al.13 reported half as many occlusions of valved PICCs (3.3%) compared with nonvalved or clamped PICCs (7.1%); although not statistically significant (P = .10), perhaps due to the small sample, overall complications, including occlusion and infection, were significantly lessened with the valved PICC (35% vs 79%; P = .02). Comparatively, Pittiruti et al.14 conducted a trial of 2 types of valved PICCs with an open-ended, nonvalved PICC and found no reduction in PICC occlusion or catheter malfunction.
Today, PICC use is common for patients who require short-to-medium intravenous therapy. PICCs are increasingly recognized for their significant complications, including thrombosis and infection.15 Novel PICC technology, including the incorporation of AT material such as Endexo® and PASV®, may reduce complications; however, the clinical efficacy, cost-effectiveness, and acceptability of these innovations have not been tested through randomized trials in pediatric patients. In accordance with Medical Research Council guidelines16 for developing interventions, we pilot tested the feasibility of the BioFlo® PICC, including intervention acceptability, compliance, recruitment, and initial estimates of effect, in anticipation of a subsequent full-scale efficacy randomized controlled trial. Our secondary aim was to compare the effectiveness of the BioFlo® PICC with Endexo® and PASV® technology in reducing PICC complications and failure.
METHODS
Design
We undertook a pilot randomized controlled trial comparing the standard polyurethane PICC (with external clamp) with the BioFlo® PICC (with internal valve) in preventing catheter failure in pediatric patients. The study was prospectively registered with the Australian Clinical Trials Registry (ACTRN12615001290583), and the research protocol was published.17
Study Setting
The study commenced in March 2016 at the Lady Cilento Children’s Hospital in South Brisbane, Australia, a tertiary-level, specialist, pediatric teaching hospital in Queensland, Australia, providing full-spectrum health services to children and young people from birth to 18 years of age. Recruitment, including data collection, was completed in November 2016.
Sample
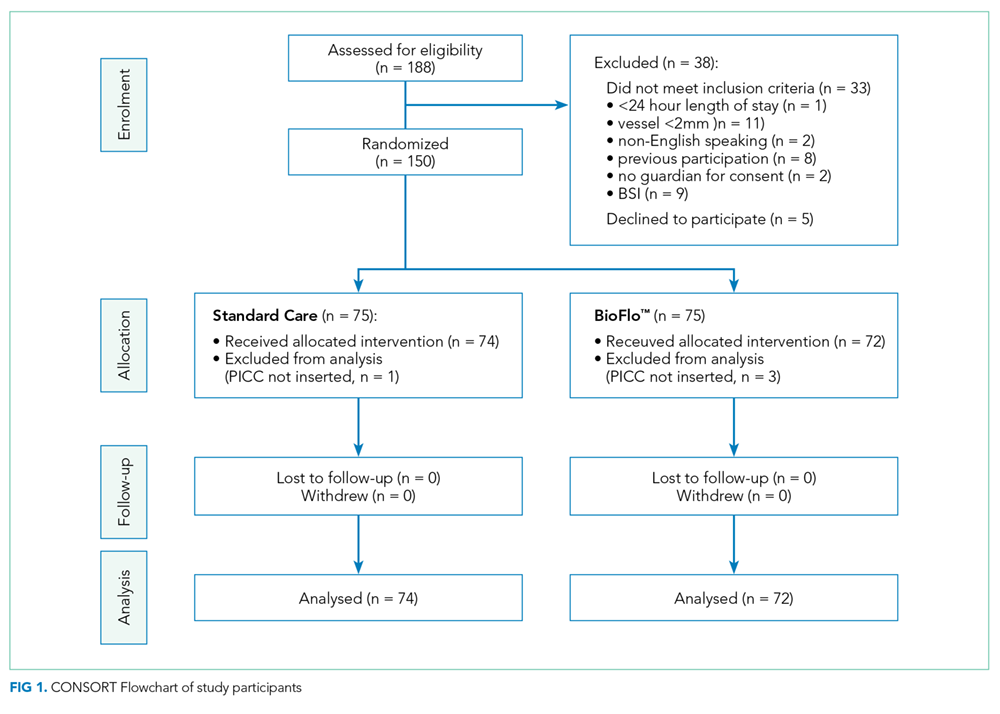
The target sample size was 110 participants, 50 participants per group plus 10% for potential attrition, as determined by standard pilot trial sample size recommendations.18 With ethics approval, the sample size was later increased to 150 participants in order to adequately pilot a microbiological substudy method (published separately).17 Participants were consecutively recruited if they met the inclusion criteria: PICC insertion, age <18 years, predicted hospital stay >24 hours, single-lumen PICC, and written informed consent by an English-speaking, legal parent or guardian. Patients were excluded if they had a current (<48 hours) blood stream infection (BSI), vessel size <2 mm, could not speak English without an interpreter, required a multilumen PICC, or were previously enrolled in the study.
Interventions
Participants were randomized to receive either of the following PICCs: (1) standard care: Cook™ polyurethane, turbo-ject, power-injectable PICC (Cook Medical, Bloomington, IN) or (2) comparison: BioFlo® polyurethane with Endexo® technology (AngioDynamics Inc, Queensbury, NY).
Outcomes
The primary outcome was feasibility of a full-efficacy trial established by composite analysis of the elements of eligibility (>70% of patients will be eligible), recruitment (>70% of patients will agree to enroll), retention and attrition (<15% of participants are lost to follow-up or withdraw from the study), protocol adherence (>80% of participants receive their allocated, randomly assigned study product), missing data (<10% of data are missed during data collection), parent and healthcare staff satisfaction, and PICC failure effect size estimates to allow sample size calculations.18,19 PICC failure was defined as the following complications associated with PICC removal: (1) catheter-associated BSI,8,20-22 (2) local site infection,22 (3) venous thrombosis,23 (4) occlusion,24,25 (5) PICC fracture, or (6) PICC dislodgement.25,26 Parents (or caregivers) and healthcare staff were asked to rate their level of confidence with the study product and ease of PICC removal by using a 0 to 100 numeric rating scale (NRS) of increasing confidence and/or ease. These data were collected at the time of PICC removal. Operators were also asked to rate their levels of satisfaction with the insertion equipment and ease of PICC insertion immediately upon completion of the insertion procedure (both 0-100 NRS of increasing satisfaction and/or ease). Secondary outcomes included individual PICC complications (eg, occlusion) occurring at any time point during the PICC dwell (including at removal), adverse events, pain, redness at the insertion site, and overall PICC dwell.
Study Procedures
The research nurse (ReN) screened operating theater lists for patients, obtained written informed consent, and initiated the randomization. Randomization was computer generated, and web based via Griffith University (https://www151.griffith.edu.au/random) to ensure allocation concealment until study entry. Patients were randomly assigned in a 1:1 ratio with computer-generated and randomly varied block sizes of 2 and 4. Data were collected by the ReN on the day of insertion, at day 1 postinsertion, then every 2 to 3 days thereafter so that PICCs were checked at least twice per week until study completion. Participants were included in the trial until 12 weeks post-PICC insertion, study withdrawal or PICC removal (whichever came first), with an additional 48 hours follow-up for infection outcomes. Patient review was face to face during the inpatient stay, with discharged patients’ follow-up occurring via outpatient clinics, hospital-in-the-home service, or telephone.
Data collection was via Research Electronic Data Capture (http://project-redcap.org/). The ReN collected data on primary and secondary outcomes by using the predefined criteria. Demographic and clinical data were collected to assess the success of randomization, describe the participant group, and display characteristics known to increase the risk of PICC complication and thrombosis. A blinded radiologist and infectious disease specialist reviewed and diagnosed thrombosis of deep veins and catheter-associated BSI outcomes, respectively.
PICC Procedures
Extensive prestudy education for 2 months prior to trial commencement was provided to all clinicians involved with the insertion and care of PICCs, including the study products. PICCs were inserted in an operating theater environment by a qualified consultant pediatric anesthetist, a senior anesthetic registrar or fellow in an approved anesthetic training program, or pediatric vascular access nurse practitioner. Ultrasound guidance was used to assess a patient’s vasculature and puncture the vessel. The operator chose the PICC size on the basis of clinical judgment of vessel size and patient needs and then inserted the allocated PICC.27 Preferred PICC tip location was the cavoatrial junction. All PICC tip positions were confirmed with a chest x-ray before use.
Postinsertion, PICCs were managed by local interdisciplinary clinicians in accordance with local practice guidelines.27-31 PICC care and management includes the use of 2% chlorhexidine gluconate in 70% alcohol for site antisepsis and neutral displacement needleless connectors (TUTA Pulse; Medical Australia Limited, Lidcombe, New South Wales, Australia); normal saline was used to flush after medication administration, and if the device was not in use for 6 hours or longer, heparin is instilled with securement via bordered polyurethane dressing (Tegaderm 1616; 3M, St Paul, Minnesota) and a sutureless securement device (Statlock VPPCSP; Bard, Georgia).
Statistical Analyses
Data were exported to Stata 1532 for cleaning and analysis. Data cleaning of outlying figures and missing and implausible data was undertaken prior to analysis. Missing data were not imputed. The PICC was the unit of measurement, and all randomly assigned patients were analyzed on an intention-to-treat basis.33 Descriptive statistics (frequencies and percentages) were used to ascertain the primary outcome of feasibility for the larger trial. Incidence rates (per 1,000 catheter days) and rate ratios, including 95% confidence intervals (CIs), were calculated. The comparability of groups at baseline was described across demographic, clinical, and device characteristics. Kaplan-Meier survival curves (with log-rank tests) were used to compare PICC failure between study groups over time. Associations between baseline characteristics and failure were described by calculating hazard ratios (HRs). Univariable Cox regression was performed only due to the relatively low number of outcomes. P values of <.05 were considered statistically significant.
Ethics
The Children’s Health Service District, Queensland (Human Research Ethics Committee/15/QRCH/164), and Griffith University (2016/077) Human Research Ethics Committees provided ethics and governance approval. Informed consent was obtained from parents or legal guardians, with children providing youth assent if they were 7 years or older, dependent upon cognitive ability.
RESULTS
Participant and PICC Characteristics
Feasibility Outcomes
PICC Failure and Complications
As per supplementary Table 1, univariate Cox regression identified PICC failure as significantly associated with tip placement in the proximal superior vena cava (SVC) compared to the SVC–right atrium junction (HR 2.61; 95% CI, 1.17-5.82; P = .024). Reduced risk of PICC failure was significantly associated with any infusion during the dwell (continuous fluid infusion, P = .007; continuous antibiotic, P = .042; or intermittent infusion, P = .046) compared to no infusion. Other variables potentially influencing the risk of failure included PICC insertion by nurse specialist compared to consultant anesthetist (HR 2.61; 95% CI, 0.85-5.44) or registrar (HR 1.97; 95% CI, 0.57-6.77). These differences were not statistically significant; however, baseline imbalance between study groups for this variable and the feasibility design preclude absolute conclusions.
DISCUSSION
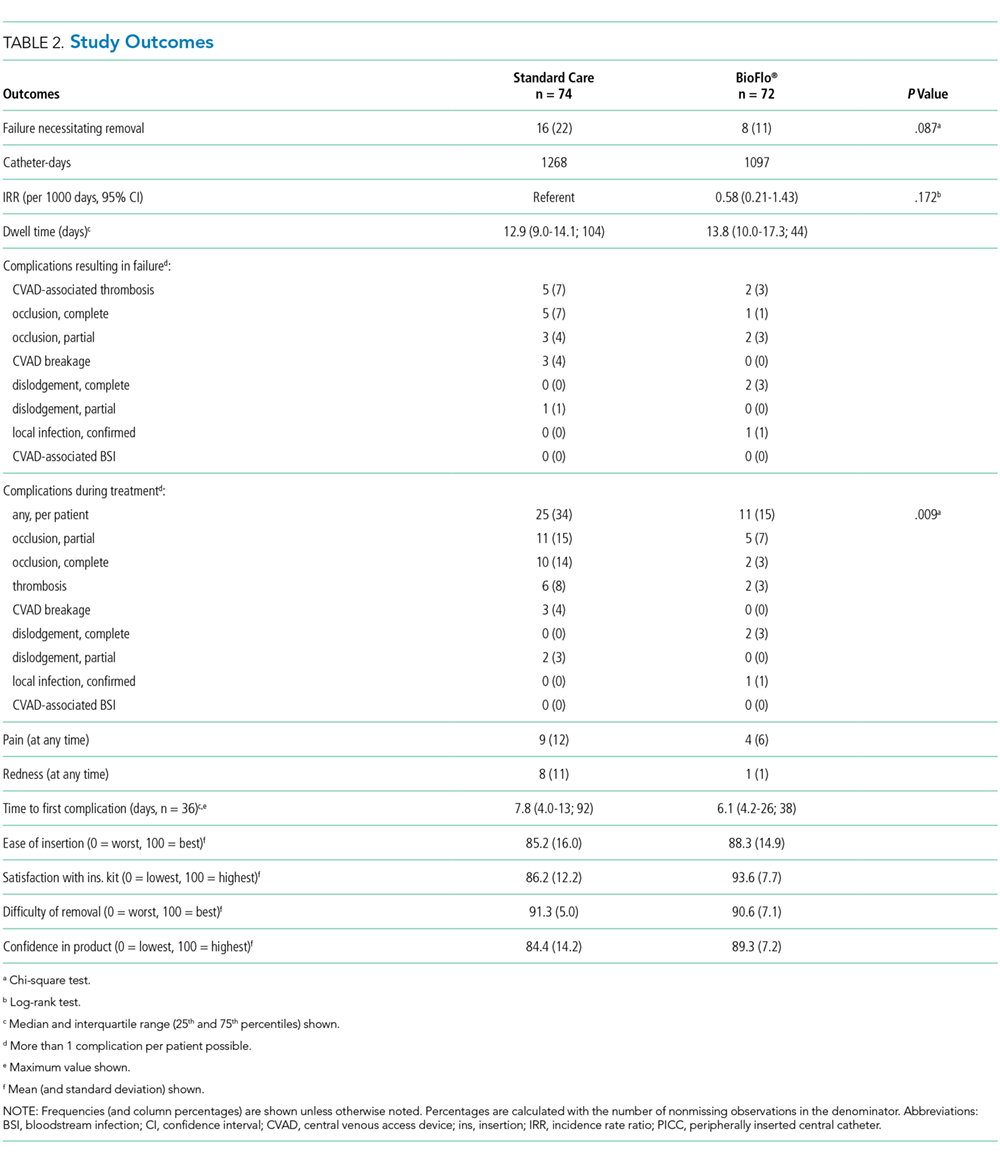
This is the first pilot feasibility trial of new PICC materials and valve design incorporated in the BioFlo® PICC in the pediatric population. The trial incorporated best practice for randomized trials, including using a concurrent control group, centralized and concealed randomization, predetermined feasibility criteria, and a registered and published trial protocol.17 As in other studies,15,24,34 PICC failure and complication prevalence was unacceptably high for this essential device. Standard care PICCs failed twice as often as the new BioFlo® PICCs (22% vs 11%), which is a clinically important difference. As researchers in a pilot study, we did not expect to detect statistically significant differences; however, we found that overall complications during the dwell occurred significantly more with the standard care than BioFlo® PICCs (P = .009).
BioFlo® PICC material offers a major advancement in PICC material through the incorporation of AT technologies into catheter materials, such as PICCs. Endexo® is a low molecular–weight, fluoro-oligomeric additive that self-locates to the top few nanometers of the material surface. When added to power-injectable polyurethane, the additive results in a strong but passive, nonstick, fluorinated surface in the base PICC material. This inhibits platelet adhesion, suppresses protein procoagulant conformation, and thereby reduces thrombus formation in medical devices. Additionally, Endexo® is not a catheter coating; rather, it is incorporated within the polyurethane of the PICC, thereby ensuring these AT properties are present on the internal, external, and cut surfaces of the PICC. If this technology can reduce complication during treatment and reduce failure from infection, thrombosis, occlusion, fracture, and dislodgement, it will improve patient outcomes considerably and lower health system costs. Previous studies investigating valve technology in PICC design to reduce occlusion have been inconclusive.12-14,35,36 Occlusion (both partial and complete) was less frequent in our study with the BioFlo® group (n = 3; 4%) compared to the standard care group (n = 6; 8%). The results of this pilot study suggest that either the Endexo® material or PASV® technology has a positive association with occlusion reduction during PICC treatment.
Thrombosis was the primary failure type for the standard care PICCs, comprising one-third of failures. All but one patient with radiologically confirmed thrombosis required the removal of the PICC prior to completion of treatment. The decision to remove the PICC or retain and treat conservatively remained with the treating team. Raffini et al.7 found thrombosis to increase in patients with one or more coexisting chronic medical condition. Slightly more standard care than BioFlo® patients were free of such comorbidities (25% vs 16%), yet standard care patients still had the higher number of thromboses (7% vs 3%). Morgenthaler and Rodriguez37 reported vascular access-associated thrombosis in pediatrics to be less common than in adults but higher in medically complex children. Worryingly, Menendez et al.38 reported pediatric thrombosis to be largely asymptomatic, so the true incidence in our study is likely higher because only radiologically confirmed thromboses were recorded.
Occlusion (partial or complete) was the predominant complication across the study, being associated with one-third of all failures. When occlusion complications during the dwell (some of which were resolved with treatment), in addition to those causing failure, were considered, this number was even greater. Occlusion complications are prevalent and costly. Smith et al.24 reported that occlusion was the most common reason for PICC removal and the most likely complication to delay treatment. Both the BioFlo® and standard care PICCs are pressure rated with good tensile strength; however, fracture occurred in 4% (n = 3) of standard care PICCs compared to no fractures in BioFlo® PICCs. Although the numbers are small, it may suggest a superior tensile strength of the BioFlo® material.
This study reinforces previously published results24,38 that PICC tip position is important and can influence complications, such as occlusion and thrombosis. In addition, we found a significant association with failure when PICCs did not have a continuous infusion. These findings reinforce the need for optimal tip location at insertion and ongoing flushing and maintenance of PICCs not used for infusions.
Limitations of this study include the small sample size, which was not designed to detect statistical differences in the primary outcome between groups. Despite randomization, there were slight imbalances at baseline for inserter type and leukocyte count, although these were not significantly associated with PICC failure in the Cox regression (data not shown), and thus were unlikely to influence findings. Additionally, a difference of <10% was associated with PICC tip position, favoring the BioFlo® group. PICC tip position outside the cavoatrial junction was positively associated with failure; therefore, the effect of tip positioning on outcomes is difficult to ascertain given the small sample size and feasibility nature of the study. Further study is warranted to further explore this effect. The population sampled was pediatric medical and surgical inpatients with a vessel size >2 mm attending the operating theater suite for PICC insertion, thereby limiting the study’s generalizability to adults and other populations, including neonates and those with PICCs inserted in the pediatric intensive care unit. The study could not be blinded because study products had to be visible to the clinical and research staff. However, it is unlikely that staff would intentionally sabotage PICCs to bias the study. Blinding was possible for the assessment of blood culture and ultrasound reports to diagnose infection and thrombosis. Strengths of this study included 100% protocol adherence, and no patients were lost to follow-up.
CONCLUSION
These results confirm that PICC failure is unacceptably high and suggest that the innovative BioFlo® PICC material and design holds promise to improve PICC outcomes by reducing complications and overall PICC failure. Trials of this technology are feasible, safe, and acceptable to healthcare staff and parents. Further trials are required, including in other patient populations, to definitively identify clinical, cost-effective methods to prevent PICC failure and improve reliability during treatment.
Acknowledgments
The authors thank the children and parents of Lady Cilento Children’s Hospital for participating in this important research. A special thank you goes to the nurses within the Vascular Assessment and Management Service and to Karen Turner, Julieta Woosley, and Anna Dean for their efforts in data collecting and ensuring protocol adherence.
Disclosure
Griffith University has received unrestricted, investigator-initiated research or educational grants to support the research of T. K., A. J. U., and C. R. M. from product manufacturers 3M, Adhezion Inc, AngioDynamics, Bard Medical, Baxter, B. Braun Medical Inc, Becton Dickinson, CareFusion, Centurion Medical Products, Cook Medical, Entrotech, FloMedical, ICU Medical Inc, Medical Australia Limited, Medtronic, Smiths Medical, and Teleflex. Griffith University has received consultancy payments on behalf of C. R. M., A. J. U., and T. K. from manufacturers 3M, AngioDynamics, Bard Medical, B. Braun Medical Inc, Becton Dickinson, CareFusion, Mayo Healthcare Inc, ResQDevices, and Smiths Medical. AngioDynamics (the BioFlo® PICC manufacturer) provided partial funds to undertake this research via an unrestricted donation to Griffith University (but not the study authors). Queensland Health provided in-kind support to fund the remainder of the trial. The funders had no role in the study design, collection, analysis, or interpretation of the data, writing of the report, or decision to submit the article for publication.
Peripherally inserted central catheters (PICCs) have evolved since their inception in the early 1970s and are used with increasing frequency for pediatric inpatients and outpatients.1-3 Emerging literature, including a meta-analysis of international observational studies,4 reports PICC failure (complications necessitating premature removal) occurs in up to 30% of PICCs, most commonly due to infection, thrombosis, occlusion, and fracture.4-7 Raffini et al.7 report the increasing incidence of pediatric PICC-related thrombosis increases morbidity and mortality8 and negatively impacts future vessel health and preservation.9
PICCs have progressed from relatively simple, silicone-based catheters with an external clamp to chemically engineered polyurethane with pressure-activated valves placed at the proximal or distal catheter hub with the intent to reduce occlusion.10 Further modernization of PICC material occurred with the incorporation of antithrombogenic (AT) material (Endexo®). These PICCs are designed to contain a nonstick polymer, which is designed to reduce the adherence of blood components (platelets and clotting factors) and inhibit thrombus formation (and hence prevent deep vein thrombosis andocclusion, as well as inhibit microbial biofilm attachment [and subsequent infection]).11
In addition to new materials, other aspects of this PICC design have been the addition of a pressure-activated safety valve (PASV®) built into the proximal hub. Pressure-activated valve technology promises to prevent catheter occlusion by reducing blood reflux into the PICC; the valve opens with pressure during infusion and aspiration and remains closed with normal venous pressure, circumventing the need for clinicians to manually clamp the PICC and reducing human error and the potential for thrombosis, occlusion, and fracture development.12 Hoffer et al.13 reported half as many occlusions of valved PICCs (3.3%) compared with nonvalved or clamped PICCs (7.1%); although not statistically significant (P = .10), perhaps due to the small sample, overall complications, including occlusion and infection, were significantly lessened with the valved PICC (35% vs 79%; P = .02). Comparatively, Pittiruti et al.14 conducted a trial of 2 types of valved PICCs with an open-ended, nonvalved PICC and found no reduction in PICC occlusion or catheter malfunction.
Today, PICC use is common for patients who require short-to-medium intravenous therapy. PICCs are increasingly recognized for their significant complications, including thrombosis and infection.15 Novel PICC technology, including the incorporation of AT material such as Endexo® and PASV®, may reduce complications; however, the clinical efficacy, cost-effectiveness, and acceptability of these innovations have not been tested through randomized trials in pediatric patients. In accordance with Medical Research Council guidelines16 for developing interventions, we pilot tested the feasibility of the BioFlo® PICC, including intervention acceptability, compliance, recruitment, and initial estimates of effect, in anticipation of a subsequent full-scale efficacy randomized controlled trial. Our secondary aim was to compare the effectiveness of the BioFlo® PICC with Endexo® and PASV® technology in reducing PICC complications and failure.
METHODS
Design
We undertook a pilot randomized controlled trial comparing the standard polyurethane PICC (with external clamp) with the BioFlo® PICC (with internal valve) in preventing catheter failure in pediatric patients. The study was prospectively registered with the Australian Clinical Trials Registry (ACTRN12615001290583), and the research protocol was published.17
Study Setting
The study commenced in March 2016 at the Lady Cilento Children’s Hospital in South Brisbane, Australia, a tertiary-level, specialist, pediatric teaching hospital in Queensland, Australia, providing full-spectrum health services to children and young people from birth to 18 years of age. Recruitment, including data collection, was completed in November 2016.
Sample
The target sample size was 110 participants, 50 participants per group plus 10% for potential attrition, as determined by standard pilot trial sample size recommendations.18 With ethics approval, the sample size was later increased to 150 participants in order to adequately pilot a microbiological substudy method (published separately).17 Participants were consecutively recruited if they met the inclusion criteria: PICC insertion, age <18 years, predicted hospital stay >24 hours, single-lumen PICC, and written informed consent by an English-speaking, legal parent or guardian. Patients were excluded if they had a current (<48 hours) blood stream infection (BSI), vessel size <2 mm, could not speak English without an interpreter, required a multilumen PICC, or were previously enrolled in the study.
Interventions
Participants were randomized to receive either of the following PICCs: (1) standard care: Cook™ polyurethane, turbo-ject, power-injectable PICC (Cook Medical, Bloomington, IN) or (2) comparison: BioFlo® polyurethane with Endexo® technology (AngioDynamics Inc, Queensbury, NY).
Outcomes
The primary outcome was feasibility of a full-efficacy trial established by composite analysis of the elements of eligibility (>70% of patients will be eligible), recruitment (>70% of patients will agree to enroll), retention and attrition (<15% of participants are lost to follow-up or withdraw from the study), protocol adherence (>80% of participants receive their allocated, randomly assigned study product), missing data (<10% of data are missed during data collection), parent and healthcare staff satisfaction, and PICC failure effect size estimates to allow sample size calculations.18,19 PICC failure was defined as the following complications associated with PICC removal: (1) catheter-associated BSI,8,20-22 (2) local site infection,22 (3) venous thrombosis,23 (4) occlusion,24,25 (5) PICC fracture, or (6) PICC dislodgement.25,26 Parents (or caregivers) and healthcare staff were asked to rate their level of confidence with the study product and ease of PICC removal by using a 0 to 100 numeric rating scale (NRS) of increasing confidence and/or ease. These data were collected at the time of PICC removal. Operators were also asked to rate their levels of satisfaction with the insertion equipment and ease of PICC insertion immediately upon completion of the insertion procedure (both 0-100 NRS of increasing satisfaction and/or ease). Secondary outcomes included individual PICC complications (eg, occlusion) occurring at any time point during the PICC dwell (including at removal), adverse events, pain, redness at the insertion site, and overall PICC dwell.
Study Procedures
The research nurse (ReN) screened operating theater lists for patients, obtained written informed consent, and initiated the randomization. Randomization was computer generated, and web based via Griffith University (https://www151.griffith.edu.au/random) to ensure allocation concealment until study entry. Patients were randomly assigned in a 1:1 ratio with computer-generated and randomly varied block sizes of 2 and 4. Data were collected by the ReN on the day of insertion, at day 1 postinsertion, then every 2 to 3 days thereafter so that PICCs were checked at least twice per week until study completion. Participants were included in the trial until 12 weeks post-PICC insertion, study withdrawal or PICC removal (whichever came first), with an additional 48 hours follow-up for infection outcomes. Patient review was face to face during the inpatient stay, with discharged patients’ follow-up occurring via outpatient clinics, hospital-in-the-home service, or telephone.
Data collection was via Research Electronic Data Capture (http://project-redcap.org/). The ReN collected data on primary and secondary outcomes by using the predefined criteria. Demographic and clinical data were collected to assess the success of randomization, describe the participant group, and display characteristics known to increase the risk of PICC complication and thrombosis. A blinded radiologist and infectious disease specialist reviewed and diagnosed thrombosis of deep veins and catheter-associated BSI outcomes, respectively.
PICC Procedures
Extensive prestudy education for 2 months prior to trial commencement was provided to all clinicians involved with the insertion and care of PICCs, including the study products. PICCs were inserted in an operating theater environment by a qualified consultant pediatric anesthetist, a senior anesthetic registrar or fellow in an approved anesthetic training program, or pediatric vascular access nurse practitioner. Ultrasound guidance was used to assess a patient’s vasculature and puncture the vessel. The operator chose the PICC size on the basis of clinical judgment of vessel size and patient needs and then inserted the allocated PICC.27 Preferred PICC tip location was the cavoatrial junction. All PICC tip positions were confirmed with a chest x-ray before use.
Postinsertion, PICCs were managed by local interdisciplinary clinicians in accordance with local practice guidelines.27-31 PICC care and management includes the use of 2% chlorhexidine gluconate in 70% alcohol for site antisepsis and neutral displacement needleless connectors (TUTA Pulse; Medical Australia Limited, Lidcombe, New South Wales, Australia); normal saline was used to flush after medication administration, and if the device was not in use for 6 hours or longer, heparin is instilled with securement via bordered polyurethane dressing (Tegaderm 1616; 3M, St Paul, Minnesota) and a sutureless securement device (Statlock VPPCSP; Bard, Georgia).
Statistical Analyses
Data were exported to Stata 1532 for cleaning and analysis. Data cleaning of outlying figures and missing and implausible data was undertaken prior to analysis. Missing data were not imputed. The PICC was the unit of measurement, and all randomly assigned patients were analyzed on an intention-to-treat basis.33 Descriptive statistics (frequencies and percentages) were used to ascertain the primary outcome of feasibility for the larger trial. Incidence rates (per 1,000 catheter days) and rate ratios, including 95% confidence intervals (CIs), were calculated. The comparability of groups at baseline was described across demographic, clinical, and device characteristics. Kaplan-Meier survival curves (with log-rank tests) were used to compare PICC failure between study groups over time. Associations between baseline characteristics and failure were described by calculating hazard ratios (HRs). Univariable Cox regression was performed only due to the relatively low number of outcomes. P values of <.05 were considered statistically significant.
Ethics
The Children’s Health Service District, Queensland (Human Research Ethics Committee/15/QRCH/164), and Griffith University (2016/077) Human Research Ethics Committees provided ethics and governance approval. Informed consent was obtained from parents or legal guardians, with children providing youth assent if they were 7 years or older, dependent upon cognitive ability.
RESULTS
Participant and PICC Characteristics
Feasibility Outcomes
PICC Failure and Complications
As per supplementary Table 1, univariate Cox regression identified PICC failure as significantly associated with tip placement in the proximal superior vena cava (SVC) compared to the SVC–right atrium junction (HR 2.61; 95% CI, 1.17-5.82; P = .024). Reduced risk of PICC failure was significantly associated with any infusion during the dwell (continuous fluid infusion, P = .007; continuous antibiotic, P = .042; or intermittent infusion, P = .046) compared to no infusion. Other variables potentially influencing the risk of failure included PICC insertion by nurse specialist compared to consultant anesthetist (HR 2.61; 95% CI, 0.85-5.44) or registrar (HR 1.97; 95% CI, 0.57-6.77). These differences were not statistically significant; however, baseline imbalance between study groups for this variable and the feasibility design preclude absolute conclusions.
DISCUSSION
This is the first pilot feasibility trial of new PICC materials and valve design incorporated in the BioFlo® PICC in the pediatric population. The trial incorporated best practice for randomized trials, including using a concurrent control group, centralized and concealed randomization, predetermined feasibility criteria, and a registered and published trial protocol.17 As in other studies,15,24,34 PICC failure and complication prevalence was unacceptably high for this essential device. Standard care PICCs failed twice as often as the new BioFlo® PICCs (22% vs 11%), which is a clinically important difference. As researchers in a pilot study, we did not expect to detect statistically significant differences; however, we found that overall complications during the dwell occurred significantly more with the standard care than BioFlo® PICCs (P = .009).
BioFlo® PICC material offers a major advancement in PICC material through the incorporation of AT technologies into catheter materials, such as PICCs. Endexo® is a low molecular–weight, fluoro-oligomeric additive that self-locates to the top few nanometers of the material surface. When added to power-injectable polyurethane, the additive results in a strong but passive, nonstick, fluorinated surface in the base PICC material. This inhibits platelet adhesion, suppresses protein procoagulant conformation, and thereby reduces thrombus formation in medical devices. Additionally, Endexo® is not a catheter coating; rather, it is incorporated within the polyurethane of the PICC, thereby ensuring these AT properties are present on the internal, external, and cut surfaces of the PICC. If this technology can reduce complication during treatment and reduce failure from infection, thrombosis, occlusion, fracture, and dislodgement, it will improve patient outcomes considerably and lower health system costs. Previous studies investigating valve technology in PICC design to reduce occlusion have been inconclusive.12-14,35,36 Occlusion (both partial and complete) was less frequent in our study with the BioFlo® group (n = 3; 4%) compared to the standard care group (n = 6; 8%). The results of this pilot study suggest that either the Endexo® material or PASV® technology has a positive association with occlusion reduction during PICC treatment.
Thrombosis was the primary failure type for the standard care PICCs, comprising one-third of failures. All but one patient with radiologically confirmed thrombosis required the removal of the PICC prior to completion of treatment. The decision to remove the PICC or retain and treat conservatively remained with the treating team. Raffini et al.7 found thrombosis to increase in patients with one or more coexisting chronic medical condition. Slightly more standard care than BioFlo® patients were free of such comorbidities (25% vs 16%), yet standard care patients still had the higher number of thromboses (7% vs 3%). Morgenthaler and Rodriguez37 reported vascular access-associated thrombosis in pediatrics to be less common than in adults but higher in medically complex children. Worryingly, Menendez et al.38 reported pediatric thrombosis to be largely asymptomatic, so the true incidence in our study is likely higher because only radiologically confirmed thromboses were recorded.
Occlusion (partial or complete) was the predominant complication across the study, being associated with one-third of all failures. When occlusion complications during the dwell (some of which were resolved with treatment), in addition to those causing failure, were considered, this number was even greater. Occlusion complications are prevalent and costly. Smith et al.24 reported that occlusion was the most common reason for PICC removal and the most likely complication to delay treatment. Both the BioFlo® and standard care PICCs are pressure rated with good tensile strength; however, fracture occurred in 4% (n = 3) of standard care PICCs compared to no fractures in BioFlo® PICCs. Although the numbers are small, it may suggest a superior tensile strength of the BioFlo® material.
This study reinforces previously published results24,38 that PICC tip position is important and can influence complications, such as occlusion and thrombosis. In addition, we found a significant association with failure when PICCs did not have a continuous infusion. These findings reinforce the need for optimal tip location at insertion and ongoing flushing and maintenance of PICCs not used for infusions.
Limitations of this study include the small sample size, which was not designed to detect statistical differences in the primary outcome between groups. Despite randomization, there were slight imbalances at baseline for inserter type and leukocyte count, although these were not significantly associated with PICC failure in the Cox regression (data not shown), and thus were unlikely to influence findings. Additionally, a difference of <10% was associated with PICC tip position, favoring the BioFlo® group. PICC tip position outside the cavoatrial junction was positively associated with failure; therefore, the effect of tip positioning on outcomes is difficult to ascertain given the small sample size and feasibility nature of the study. Further study is warranted to further explore this effect. The population sampled was pediatric medical and surgical inpatients with a vessel size >2 mm attending the operating theater suite for PICC insertion, thereby limiting the study’s generalizability to adults and other populations, including neonates and those with PICCs inserted in the pediatric intensive care unit. The study could not be blinded because study products had to be visible to the clinical and research staff. However, it is unlikely that staff would intentionally sabotage PICCs to bias the study. Blinding was possible for the assessment of blood culture and ultrasound reports to diagnose infection and thrombosis. Strengths of this study included 100% protocol adherence, and no patients were lost to follow-up.
CONCLUSION
These results confirm that PICC failure is unacceptably high and suggest that the innovative BioFlo® PICC material and design holds promise to improve PICC outcomes by reducing complications and overall PICC failure. Trials of this technology are feasible, safe, and acceptable to healthcare staff and parents. Further trials are required, including in other patient populations, to definitively identify clinical, cost-effective methods to prevent PICC failure and improve reliability during treatment.
Acknowledgments
The authors thank the children and parents of Lady Cilento Children’s Hospital for participating in this important research. A special thank you goes to the nurses within the Vascular Assessment and Management Service and to Karen Turner, Julieta Woosley, and Anna Dean for their efforts in data collecting and ensuring protocol adherence.
Disclosure
Griffith University has received unrestricted, investigator-initiated research or educational grants to support the research of T. K., A. J. U., and C. R. M. from product manufacturers 3M, Adhezion Inc, AngioDynamics, Bard Medical, Baxter, B. Braun Medical Inc, Becton Dickinson, CareFusion, Centurion Medical Products, Cook Medical, Entrotech, FloMedical, ICU Medical Inc, Medical Australia Limited, Medtronic, Smiths Medical, and Teleflex. Griffith University has received consultancy payments on behalf of C. R. M., A. J. U., and T. K. from manufacturers 3M, AngioDynamics, Bard Medical, B. Braun Medical Inc, Becton Dickinson, CareFusion, Mayo Healthcare Inc, ResQDevices, and Smiths Medical. AngioDynamics (the BioFlo® PICC manufacturer) provided partial funds to undertake this research via an unrestricted donation to Griffith University (but not the study authors). Queensland Health provided in-kind support to fund the remainder of the trial. The funders had no role in the study design, collection, analysis, or interpretation of the data, writing of the report, or decision to submit the article for publication.
1. Chopra V, Flanders SA, Saint S. The problem with peripherally inserted central catheters. JAMA. 2012;308(15):1527-1528. PubMed
2. Gibson C, Connolly BL, Moineddin R, Mahant S, Filipescu D, Amaral JG. Peripherally inserted central catheters: use at a tertiary care pediatric center. J Vasc Interv Radiol. 2013;24(9):1323-1331. PubMed
3. Ullman AJ, Cooke M, Kleidon T, Rickard CM. Road map for improvement: point prevalence audit and survey of central venous access devices in paediatric acute care. J Paediatr Child Health. 2017;53(2):123-130. PubMed
4. Ullman AJ, Marsh N, Mihala G, Cooke M, Rickard CM. Complications of central venous access devices: a systematic review. Pediatrics. 2015;136(5):e1331-e1344. PubMed
5. Barrier A, Williams DJ, Connelly M, Creech CB. Frequency of peripherally inserted central catheter complications in children. Pediatr Infect Dis J. 2012;31(5):519-521. PubMed
6. Jumani K, Advani S, Reich NG, Gosey L, Milstone AM. Risk factors for peripherally inserted central venous catheter complications in children. JAMA Pediatr. 2013;167(5):429-435. PubMed
7. Raffini L, Huang YS, Witmer C, Feudtner C. Dramatic increase in venous thromboembolism in children’s hospitals in the United States from 2001 to 2007. Pediatrics. 2009;124(4):1001-1008. PubMed
8. Chopra V, Anand S, Krein SL, Chenoweth C, Saint S. Bloodstream infection, venous thrombosis, and peripherally inserted central catheters: reappraising the evidence. Am J Med. 2012;125(8):733-741. PubMed
9. Moureau NL, Trick N, Nifong T, et al. Vessel health and preservation (part 1): a new evidence-based approach to vascular access selection and management. J Vasc Access. 2012;13(3):351-356. PubMed
10. Poli P, Scocca A, Di Puccio F, Gallone G, Angelini L, Calabro EM. A comparative study on the mechanical behavior of polyurethane PICCs. J Vasc Access. 2016;17(2):175-181. PubMed
11. Interface Biologics. Surface modification technology platform. 2017. http://www.interfacebiologics.com/endexo.htm. Accessed April 5, 2017.
12. Hoffer EK, Bloch RD, Borsa JJ, Santulli P, Fontaine AB, Francoeur N. Peripherally inserted central catheters with distal versus proximal valves: prospective randomized trial. J Vasc Interv Radiol. 2001;12(10):1173-1177. PubMed
13. Hoffer EK, Borsa J, Santulli P, Bloch R, Fontaine AB. Prospective randomized comparison of valved versus nonvalved peripherally inserted central vein catheters. AJR Am J Roentgenol. 1999;173(5):1393-1398. PubMed
14. Pittiruti M, Emoli A, Porta P, Marche B, DeAngelis R, Scoppettuolo G. A prospective, randomized comparison of three different types of valved and nonvalved peripherally inserted central catheters. J Vasc Access. 2014;15(6):519-523.
15. Chopra V, Flanders SA, Saint S, et al. The Michigan Appropriateness Guide for Intravenous Catheters (MAGIC): Results From a Multispecialty Panel Using the RAND/UCLA Appropriateness Method. Ann Intern Med. 2015;163(6 Suppl):S1-S40. PubMed
16. Craig P, Dieppe P, Macintyre S, Michie S, Nazareth I, Petticrew M. Developing and evaluating complex interventions: the new Medical Research Council guidance. BMJ. 2008;337. PubMed
17. Kleidon TM, Ullman AJ, Zhang L, Mihala G, Rickard CM. How does your PICCOMPARE? A pilot randomized controlled trial comparing PICC materials in pediatrics. J Hosp Med. 2017;(under review). PubMed
18. Hertzog MA. Considerations in determining sample size for pilot studies. Res Nurs Health. 2008;31(2):180-191. PubMed
19. Thabane L, Ma J, Chu R, et al. A tutorial on pilot studies: the what, why and how. BMC Med Res Methodol. 2010;10:1. PubMed
20. Chopra V, O’Horo JC, Rogers MA, Maki DG, Safdar N. The risk of bloodstream infection associated with peripherally inserted central catheters compared with central venous catheters in adults: a systematic review and meta-analysis. Infect Control Hosp Epidemiol. 2013;34(9):908-918. PubMed
21. Kramer RD, Rogers MA, Conte M, Mann J, Saint S, Chopra V. Are antimicrobial peripherally inserted central catheters associated with reduction in central line-associated bloodstream infection? A systematic review and meta-analysis. Am J Infect Control. 2017;45(2):108-114. PubMed
22. Centers for Disease Control and Prevention. National Healthcare Safety Network Device Associated Module: CLABSI. 2014.
23. Lobo BL, Vaidean G, Broyles J, Reaves AB, Shorr RI. Risk of venous thromboembolism in hospitalized patients with peripherally inserted central catheters. J Hosp Med. 2009;4(7):417-422. PubMed
24. Smith SN, Moureau N, Vaughn VM, et al. Patterns and Predictors of Peripherally Inserted Central Catheter Occlusion: The 3P-O Study. J Vasc Interv Radiol. 28(5):749.e742-756.e742. PubMed
25. Chow LML, Friedman JN, MacArthur C, et al. Peripherally inserted central catheter (PICC) fracture and embolozation in the pediatric population. Pediatrics. 2003;142(2):141-144. PubMed
26. Chopra V, Kuhn L, Ratz D, Flanders SA, Krein SL. Vascular nursing experience, practice knowledge, and beliefs: Results from the Michigan PICC1 survey. J Hosp Med. 2016;11(4):269-275. PubMed
27. Frasca D, Dahyot-Fizelier C, Mimoz O. Prevention of central venous catheter-related infection in the intensive care unit. Crit Care. 2010;14(2):212. PubMed
28. Centre for Healthcare Related Infection Surveilance and Prevention and Tuberculosis Control. Guideline: Peripherally inserted central catheter (PICC). 2013.
29. Services Children’s Health Service. Central venous catheters: nursing care and management of peripherally inserted central catheter (PICC) in paediatric patients. 2011. http://qheps.health.qld.gov.au/childrenshealth/resources/nursestand/docs/ns_03452.pdf. Accessed Februrary 1, 2016.
30. Services CsH. Central Venous Access Device Insertion and Management. 2014.
31. Central venous access device insertion and management. Queensland Government; 2014. http://qheps.health.qld.gov.au/childrenshealth/resources/proc/docs/proc_03450.pdf Accessed March 13, 2014.
32. StatCorp. Stata Statistical Software: Release 12.1 College Station. 2006.
33. Rothwell PM. Factors that can affect the external validity of randomised controlled trials. PLoS Clin Trials. 2006;1(1):e9. PubMed
34. Chopra V, Ratz D, Kuhn L, Lopus T, Lee A, Krein S. Peripherally inserted central catheter-related deep vein thrombosis: contemporary patterns and predictors. J Thromb Haemost. 2014;12(6):847-854. PubMed
35. Alport B, Burbridge B, Lim H. Bard PowerPICC Solo2 vs Cook Turbo-Ject: A Tale of Two PICCs. Can Assoc Radiol J. 2012;63(4):323-328. PubMed
36. Johnston AJ, Streater CT, Noorani R, Crofts JL, Del Mundo AB, Parker RA. The effect of peripherally inserted central catheter (PICC) valve technology on catheter occlusion rates—the ‘ELeCTRiC’ study. J Vasc Access. 2012;13(4):421-425. PubMed
37. Morgenthaler TI, Rodriguez V. Preventing acute care-associated venous thromboembolism in adult and pediatric patients across a large healthcare system. J Hosp Med. 2016;11(Suppl 2):S15-S21. PubMed
38. Menendez JJ, Verdu C, Calderon B, et al. Incidence and risk factors of superficial and deep vein thrombosis associated with peripherally inserted central catheters in children. J Thromb Haemost. 2016;14(11):2158-2168. PubMed
© 2018 Society of Hospital Medicine
A Single, Post-ACTH Cortisol Measurement to Screen for Adrenal Insufficiency in the Hospitalized Patient
Testing for adrenal insufficiency (AI) is common in the hospital setting. The gold standard remains the insulin tolerance test (ITT), in which cortisol concentration is measured after the induction of hypoglycemia to <35 mg/dL.1 Alternatively, metyrapone testing works by blocking cortisol synthesis. If pretest adrenocorticotropic hormone (ACTH) concentrations are low and ACTH concentrations do not rise after the administration of metyrapone, the patient is given a diagnosis of AI. Both assays pose some risk to patients with AI and are typically only performed as confirmatory tests. Morning random cortisol concentrations can be used to suggest AI if concentrations are <3 mcg/dL, but they often provide indeterminate results if concentrations are between 3 and 15 mcg/dL.2 Thus, morning cortisol concentrations in isolation are not diagnostic of AI. For these reasons, most experts recommend a dynamic, high-dose cosyntropin stimulation testing (CST) with 250 mcg of intravenous cosyntropin to screen for AI. The test can be done any time of day.3 Historically, an incremental response to cosyntropin, or “delta,” was also required to indicate a normal response to stimulation.4 However, the baseline cortisol concentration is dependent on circadian rhythm and level of stress. For this reason, a delta, whether large or small, has been abandoned as a requisite for the diagnosis of AI.5-7 A normal CST is widely accepted to be identified by any cortisol concentration >18 mcg/dL during the test (basal or poststimulation).8
The seminal studies by Lindholm, Kehlet, and coauthors9-11 validated the CST against the gold standard ITT and utilized only 0- and 30-minute cortisol concentrations. A later study in patients with pituitary disease demonstrated that 30-minute concentrations had a stronger correlation with the ITT than 60-minute concentrations (false-negative rate: 10% vs 27%).12 However, in that study, a higher threshold was used for the 60-minute concentration than for what was obtained at 30 minutes (25.4 vs 21.8 mcg/dL, respectively). Multiple studies have shown that the 60-minute concentration is higher than the 30-minute concentration after cosyntropin stimulation.4,5,13 Subsequent, small studies of patients who were known to have AI have shown that 60-minute concentrations are as useful as 30-minute concentrations.5,14,15 Because 30-minute cortisol concentrations are often lower than 60-minute concentrations, a single 30-minute result may lead to a falsely abnormal test.16,17 As such, the use of a single 60-minute test may be more appropriate. Indeed, some authors have suggested that measuring only 30-minute concentrations may lead to overdiagnosis of AI by missing an appropriate response, serum cortisol >18 mcg/dL, at 60 minutes.17-19 Peak cortisol concentrations after low-dose cosyntropin stimulation (1 mcg) are seen at 60 minutes, and low-dose stimulation has been shown to be more variable than in the high-dose test (250 mg).19,20
There is a lack of consensus to guide clinicians as to when cortisol concentrations should be measured after stimulation, and standard references lack uniformity. Commonly accessed medical resources—such as UpToDate and Jameson’s Endocrinology—recommend basal, 30-minute, and 60-minute cortisol concentrations, while Williams Textbook of Endocrinology recommends basal and 30-minute concentrations, and the Washington Manual recommends only a single 30-minute concentration.7,21,22 Goldman-Cecil Medicine8 recommends checking a cortisol concentration between 30 and 60 minutes and recommends the same 18 mcg/dL cutoff for any test obtained in this time period. As a result of these variable recommendations, all 3 time points are often obtained. Prominent review articles continue to recommend checking all 3 concentrations while presenting evidence of peak cortisol response at 60 minutes poststimulation.13
In this study, we retrospectively examined CSTs in hospitalized, adult patients both in the intensive care unit (ICU) and hospital ward and/or floor settings to evaluate for significant differences in 30- and 60-minute cortisol concentrations and compare the concordance of screening at each time point alone with traditional CST at all 3 time points. By using these results, we discuss the utility of obtaining 3 cortisol samples.
METHODS
After receiving approval from the institutional review board, we retrospectively reviewed all standard, high-dose CSTs performed on adult inpatients at the Barnes-Jewish Hospital laboratory from January 1, 2012, to August 31, 2013. All patients received the same standard dose (250 mcg cosyntropin, a synthetic ACTH, at a concentration of 1 mcg/mL administered over 2 minutes) regardless of age or weight. We collected patient gender; age; time of baseline cortisol measurement; cortisol results at baseline, 30, and 60 minutes; and patient location (inpatient floor vs ICU status). Tests were included if results from all 3 time points (0, 30, 60 minute) were available.
Cortisol concentrations were assessed by the laboratory according to the manufacturer’s instructions by using the ADVIA Centaur Cortisol assay (Siemens Healthcare Diagnostics Inc, Tarrytown, NY), a competitive chemiluminescent immunoassay. For the traditional CST, a cortisol concentration ≥18 mcg/dL at any time point during the test was used to define normal (negative). Patients with a positive (no results >18 mcg/mL) CST were defined as “screen positives” for the purposes of this analysis. Patient location data were available that allowed for an ICU vs non-ICU comparison.
Statistical analyses were performed in SAS version 9.4 (SAS Institute Inc, Cary, North Carolina). Continuous variables were compared by using a 2-tailed Student t test. Percentiles and proportions were compared by using χ2 tests or Fisher’s exact tests when appropriate. The concordance of screening at each time point compared with the traditional CST was calculated. Positive percent agreement (PPA) with the traditional CST in each subgroup (ICU and floor) and combined was also evaluated. A P value of .05 was used to determine significance.
RESULTS

Cortisol concentrations obtained at 30 minutes were significantly higher than baseline cortisol concentrations (baseline: 12.8 mcg/dL; 30 minutes: 23.9 mcg/dL; P < .001) for all patients. The average cortisol concentrations obtained at 60 minutes (27.4 mcg/dL) were significantly higher than those at baseline and 30 minutes (P < .001). This trend was seen in each subgroup of patients in the ICU and on the floor (Figure). The average baseline cortisol concentration was higher for ICU patients compared to floor patients (17.6 mcg/dL vs 10.9 mcg/dL, respectively).
By using the traditional CST, there were 26 (13.1%) positive tests for AI in ICU patients and 84 (16.7%) positive tests in floor patients (Table).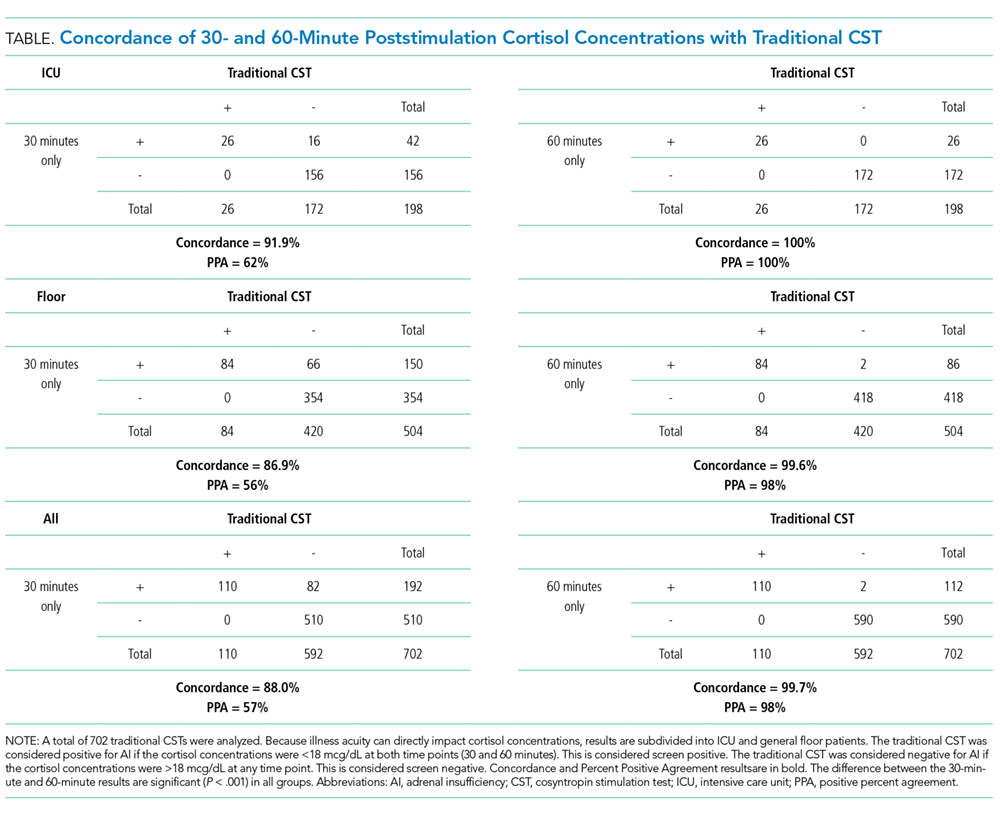
Only 13% of CSTs were started in the recommended 3-hour window from 6:00
DISCUSSION
Our investigation of 702 CSTs, the largest retrospective analysis to date, finds that the 60-minute cortisol concentration is significantly higher than the 30-minute concentration in a standard, high-dose CST. Sixty-minute cortisol concentrations are more concordant with traditional CST results than the 30-minute concentrations in both critically ill ICU and noncritically ill floor patients. This suggests that a single 60-minute measurement is sufficient for AI screening. The use of only 30-minute concentrations would lead to a significant increase in false-positive screening tests and significantly lower PPA (98% vs 57%). With peak cortisol concentrations occurring at 60-minutes poststimulation, measuring both 30- and 60-minute poststimulation concentrations does not appear to be of significant clinical benefit. The cost-saving from reduced phlebotomy and laboratory expenses would be significant, especially in locations with limited staff or financial resources. Our findings are similar to other recent results by Chitale et al.,17 Mansoor et al.,16 and Zueger et al.18
Zueger et al.18 evaluated the results of high-dose CST in 73 patients and found 13.7% of patients with inadequate cortisol response (<18 mcg/dL) at 30 minutes had normal concentrations at 60 minutes (>18 mcg/dL). Their study did not identify a single case of normal cortisol concentration at 30 minutes that would have inappropriately screened positive for AI if cortisol concentrations were only checked at 60 minutes. Similarly, they suggested that the 30-minute test did not add any additional diagnostic value; however, no confirmatory testing was performed.
Higher cortisol concentrations at 60 minutes poststimulation may result in improved specificity for AI without reducing sensitivity, but it may also indicate that the cutoff value may need to be raised from 18 mcg/dL at 60 minutes to maintain an appropriate clinical sensitivity. Continued research should resolve this clinical question with gold-standard confirmatory testing. Furthermore, there is debate about an appropriate screening cortisol concentration threshold for critically ill patients. Researchers have compared concentrations of 25 mcg/dL to the traditional 18 mcg/dL to improve sensitivity for AI, but these studies do not involve comparisons to confirmatory testing and often result in reduced specificity.23,24
In our study, only a small fraction of testing was performed in the early-morning hours, when basal cortisol results are of value. There may be indications to perform traditional CSTs with a basal concentration, such as for suspected secondary AI, but testing must be performed in the early morning for interpretable results per current recommendations. However, poststimulation cortisol concentrations may be interpreted regardless of the time of day at which the test was initiated.3
Our study is limited by its scope because it is a retrospective analysis. It is also limited by a lack of gold-standard, clinical confirmatory testing or analysis of other clinical data. Our method of testing and interpretation is considered the screening standard and is often used to plan treatment for AI without confirmatory testing, as ITT is not routinely available for hospitalized patients. The validation of the traditional CST to the ITT has been performed extensively, but a randomized trial comparing a single 60-minute concentration to the ITT may be useful. The exact timing of blood draws may have introduced error in the concentration measurements, and this is critical to screening accuracy. Total serum cortisol is 10% bound to albumin,25 and medications such as steroids or opioids and medical conditions such as obesity or liver disease can affect cortisol concentrations.26 Albumin and free cortisol concentrations that may be used to adjust for these variables were not available.
CONCLUSION
We recommend changes to the standard CST to exclude a basal cortisol concentration unless it is indicated for the evaluation of secondary AI or obtained at the appropriate early-morning hour. A single 60-minute poststimulation cortisol concentration may be an appropriate screening test for AI and demonstrates high concordance with the traditional CST. The use of a 30-minute poststimulation concentration alone may lead to a significantly higher number of false-positive results. Alternatively, the stimulated cortisol threshold used to define a normal test may need to be higher at 60 minutes to maintain the appropriate sensitivity. Further study and comparison with confirmatory testing are needed.
Disclosure
The authors have no relevant conflicts of interest to disclose.
1. Ajala O, Lockett H, Twine G, Flanagan DE. Depth and duration of hypoglycaemia achieved during the insulin tolerance test. Eur J Endocrinol. 2012;167(1):59-65. PubMed
2. Erturk E, Jaffe CA, Barkan AL. Evaluation of the integrity of the hypothalamic-pituitary-adrenal axis by insulin hypoglycemia test. J Clin Endocrinol Metab. 1998;83(7):2350-2354. PubMed
3. Azziz R, Bradley E Jr, Huth J, et al. Acute adrenocorticotropin-(1-24) (ACTH) adrenal stimulation in eumenorrheic women: reproducibility and effect of ACTH dose, subject weight, and sampling time. J Clin Endocrinol Metab. 1990;70(5):1273-1279. PubMed
4. Wood, JB, Frankland AW, James VH, Landon J. A Rapid Test of Adrenocortical Function. Lancet. 1965;1(7379):243-245. PubMed
5. Speckart PF, Nicoloff JT, Bethune JE. Screening for adrenocortical insufficiency with cosyntropin (synthetic ACTH). Arch Intern Med. 1971;128(5):761-763. PubMed
6. Grinspoon SK, Biller BM. Clinical review 62: Laboratory assessment of adrenal insufficiency. J Clin Endocrinol Metab. 1994;79(4):923-931. PubMed
7. Melmed S, Polonksy K, Larsen PR, Kronenberg H. Williams Textbook of Endocrinology. 13th ed. Elsevier: Amsterdam, Netherlands; 2016.
8. Nieman LK. Adrenal Cortex, in Goldman-Cecil Medicine. ed. L. Goldman. 2016, Elsevier: Amsterdam, Netherlands; 2016:1514-1521.
9. Kehlet H, Blichert-Toft M, Lindholm J, Rasmussen P. Short ACTH test in assessing hypothalamic-pituitary-adrenocortical function. Br Med J. 1976;1(6004):249-251. PubMed
10. Lindholm J, Kehlet H. Re-evaluation of the clinical value of the 30 min ACTH test in assessing the hypothalamic-pituitary-adrenocortical function. Clin Endocrinol (Oxf). 1987;26(1):53-59. PubMed
11. Lindholm J, Kehlet H, Blichert-Toft M, Dinesen B, Riishede J. Reliability of the 30-minute ACTH test in assessing hypothalamic-pituitary-adrenal function. J Clin Endocrinol Metab. 1978;47(2):272-274. PubMed
12. Hurel SJ, Thompson CJ, Watson MJ, Harris MM, Baylis PH, Kendall-Taylor P. The short Synacthen and insulin stress tests in the assessment of the hypothalamic-pituitary-adrenal axis. Clin Endocrinol (Oxf). 1996;44(2):141-146. PubMed
13. Dorin RI, Qualls CR, Crapo LM. Diagnosis of adrenal insufficiency. Ann Intern Med. 2003;139(3):194-204. PubMed
14. Oelkers W, Diederich S, Bahr V. Diagnosis and therapy surveillance in Addison’s disease: rapid adrenocorticotropin (ACTH) test and measurement of plasma ACTH, renin activity, and aldosterone. J Clin Endocrinol Metab. 1992;75(1):259-264. PubMed
15. Gonzalez-Gonzalez JG, De la Garza-Hernandez NE, Mancillas-Adame LG, Montes-Villarreal J, Villarreal-Perez JZ. A high-sensitivity test in the assessment of adrenocortical insufficiency: 10 microg vs 250 microg cosyntropin dose assessment of adrenocortical insufficiency. J Endocrinol. 1998;159(2):275-280. PubMed
16. Mansoor S, Islam N, Siddiqui I, Jabbar A. Sixty-minute post-Synacthen serum cortisol level: a reliable and cost-effective screening test for excluding adrenal insufficiency compared to the conventional short Synacthen test. Singapore Med J. 2007;48(6):519-523. PubMed
17. Chitale A, Musonda P, McGregor AM, Dhatariya KK. Determining the utility of the 60 min cortisol measurement in the short synacthen test. Clin Endocrinol (Oxf). 2013;79(1):14-19. PubMed
18. Zueger T, Jordi M, Laimer M, Stettler C. Utility of 30 and 60 minute cortisol samples after high-dose synthetic ACTH-1-24 injection in the diagnosis of adrenal insufficiency. Swiss Med Wkly. 2014;144:w13987. PubMed
19. Cartaya J, Misra M. The low-dose ACTH stimulation test: is 30 minutes long enough? Endocr Pract. 2015;21(5):508-513. PubMed
20. Gonzálbez, Villabona, Ramon, et al. Establishment of reference values for standard dose short synacthen test (250 μg), low dose short synacthen test (1 μg) and insulin tolerance test for assessment of the hypothalamo–pituitary–adrenal axis in normal subjects. Clin Endocrinol. 2000;53(2):199-204.
21. McGill J, Clutter W, Baranski T. The Washington Manual of Endocrinology Subspecialty Consult. 3rd ed. Washington Manual, ed. Henderson K, De Fer T. Lippincott Williams and Wilkins: Philadelphia, PA; 2012:384.
22. Nieman L. Diagnosis of adrenal insufficiency in adults. In UpToDate, ed. Post T. Wolters Klewer: Waltham, MA; 2017.
23. Marik PE, Kiminyo K, Zaloga GP. Adrenal insufficiency in critically ill patients with human immunodeficiency virus. Crit Care Med. 2002;30(6):1267-1273. PubMed
24. Marik PE, Zaloga GP. Adrenal insufficiency during septic shock. Crit Care Med. 2003;31(1):141-145. PubMed
25. Lewis JG, Bagley CJ, Elder PA, Bachmann AW, Torpy DJ. Plasma free cortisol fraction reflects levels of functioning corticosteroid-binding globulin. Clinica Chemica Acta. 2005;359(1-2):189-194. PubMed
26. Torpy DJ, Ho JT. Value of Free Cortisol Measurement in Systemic Infection. Horm Metab Res. 2007;39(6):439-444. PubMed
Testing for adrenal insufficiency (AI) is common in the hospital setting. The gold standard remains the insulin tolerance test (ITT), in which cortisol concentration is measured after the induction of hypoglycemia to <35 mg/dL.1 Alternatively, metyrapone testing works by blocking cortisol synthesis. If pretest adrenocorticotropic hormone (ACTH) concentrations are low and ACTH concentrations do not rise after the administration of metyrapone, the patient is given a diagnosis of AI. Both assays pose some risk to patients with AI and are typically only performed as confirmatory tests. Morning random cortisol concentrations can be used to suggest AI if concentrations are <3 mcg/dL, but they often provide indeterminate results if concentrations are between 3 and 15 mcg/dL.2 Thus, morning cortisol concentrations in isolation are not diagnostic of AI. For these reasons, most experts recommend a dynamic, high-dose cosyntropin stimulation testing (CST) with 250 mcg of intravenous cosyntropin to screen for AI. The test can be done any time of day.3 Historically, an incremental response to cosyntropin, or “delta,” was also required to indicate a normal response to stimulation.4 However, the baseline cortisol concentration is dependent on circadian rhythm and level of stress. For this reason, a delta, whether large or small, has been abandoned as a requisite for the diagnosis of AI.5-7 A normal CST is widely accepted to be identified by any cortisol concentration >18 mcg/dL during the test (basal or poststimulation).8
The seminal studies by Lindholm, Kehlet, and coauthors9-11 validated the CST against the gold standard ITT and utilized only 0- and 30-minute cortisol concentrations. A later study in patients with pituitary disease demonstrated that 30-minute concentrations had a stronger correlation with the ITT than 60-minute concentrations (false-negative rate: 10% vs 27%).12 However, in that study, a higher threshold was used for the 60-minute concentration than for what was obtained at 30 minutes (25.4 vs 21.8 mcg/dL, respectively). Multiple studies have shown that the 60-minute concentration is higher than the 30-minute concentration after cosyntropin stimulation.4,5,13 Subsequent, small studies of patients who were known to have AI have shown that 60-minute concentrations are as useful as 30-minute concentrations.5,14,15 Because 30-minute cortisol concentrations are often lower than 60-minute concentrations, a single 30-minute result may lead to a falsely abnormal test.16,17 As such, the use of a single 60-minute test may be more appropriate. Indeed, some authors have suggested that measuring only 30-minute concentrations may lead to overdiagnosis of AI by missing an appropriate response, serum cortisol >18 mcg/dL, at 60 minutes.17-19 Peak cortisol concentrations after low-dose cosyntropin stimulation (1 mcg) are seen at 60 minutes, and low-dose stimulation has been shown to be more variable than in the high-dose test (250 mg).19,20
There is a lack of consensus to guide clinicians as to when cortisol concentrations should be measured after stimulation, and standard references lack uniformity. Commonly accessed medical resources—such as UpToDate and Jameson’s Endocrinology—recommend basal, 30-minute, and 60-minute cortisol concentrations, while Williams Textbook of Endocrinology recommends basal and 30-minute concentrations, and the Washington Manual recommends only a single 30-minute concentration.7,21,22 Goldman-Cecil Medicine8 recommends checking a cortisol concentration between 30 and 60 minutes and recommends the same 18 mcg/dL cutoff for any test obtained in this time period. As a result of these variable recommendations, all 3 time points are often obtained. Prominent review articles continue to recommend checking all 3 concentrations while presenting evidence of peak cortisol response at 60 minutes poststimulation.13
In this study, we retrospectively examined CSTs in hospitalized, adult patients both in the intensive care unit (ICU) and hospital ward and/or floor settings to evaluate for significant differences in 30- and 60-minute cortisol concentrations and compare the concordance of screening at each time point alone with traditional CST at all 3 time points. By using these results, we discuss the utility of obtaining 3 cortisol samples.
METHODS
After receiving approval from the institutional review board, we retrospectively reviewed all standard, high-dose CSTs performed on adult inpatients at the Barnes-Jewish Hospital laboratory from January 1, 2012, to August 31, 2013. All patients received the same standard dose (250 mcg cosyntropin, a synthetic ACTH, at a concentration of 1 mcg/mL administered over 2 minutes) regardless of age or weight. We collected patient gender; age; time of baseline cortisol measurement; cortisol results at baseline, 30, and 60 minutes; and patient location (inpatient floor vs ICU status). Tests were included if results from all 3 time points (0, 30, 60 minute) were available.
Cortisol concentrations were assessed by the laboratory according to the manufacturer’s instructions by using the ADVIA Centaur Cortisol assay (Siemens Healthcare Diagnostics Inc, Tarrytown, NY), a competitive chemiluminescent immunoassay. For the traditional CST, a cortisol concentration ≥18 mcg/dL at any time point during the test was used to define normal (negative). Patients with a positive (no results >18 mcg/mL) CST were defined as “screen positives” for the purposes of this analysis. Patient location data were available that allowed for an ICU vs non-ICU comparison.
Statistical analyses were performed in SAS version 9.4 (SAS Institute Inc, Cary, North Carolina). Continuous variables were compared by using a 2-tailed Student t test. Percentiles and proportions were compared by using χ2 tests or Fisher’s exact tests when appropriate. The concordance of screening at each time point compared with the traditional CST was calculated. Positive percent agreement (PPA) with the traditional CST in each subgroup (ICU and floor) and combined was also evaluated. A P value of .05 was used to determine significance.
RESULTS
Cortisol concentrations obtained at 30 minutes were significantly higher than baseline cortisol concentrations (baseline: 12.8 mcg/dL; 30 minutes: 23.9 mcg/dL; P < .001) for all patients. The average cortisol concentrations obtained at 60 minutes (27.4 mcg/dL) were significantly higher than those at baseline and 30 minutes (P < .001). This trend was seen in each subgroup of patients in the ICU and on the floor (Figure). The average baseline cortisol concentration was higher for ICU patients compared to floor patients (17.6 mcg/dL vs 10.9 mcg/dL, respectively).
By using the traditional CST, there were 26 (13.1%) positive tests for AI in ICU patients and 84 (16.7%) positive tests in floor patients (Table).
Only 13% of CSTs were started in the recommended 3-hour window from 6:00
DISCUSSION
Our investigation of 702 CSTs, the largest retrospective analysis to date, finds that the 60-minute cortisol concentration is significantly higher than the 30-minute concentration in a standard, high-dose CST. Sixty-minute cortisol concentrations are more concordant with traditional CST results than the 30-minute concentrations in both critically ill ICU and noncritically ill floor patients. This suggests that a single 60-minute measurement is sufficient for AI screening. The use of only 30-minute concentrations would lead to a significant increase in false-positive screening tests and significantly lower PPA (98% vs 57%). With peak cortisol concentrations occurring at 60-minutes poststimulation, measuring both 30- and 60-minute poststimulation concentrations does not appear to be of significant clinical benefit. The cost-saving from reduced phlebotomy and laboratory expenses would be significant, especially in locations with limited staff or financial resources. Our findings are similar to other recent results by Chitale et al.,17 Mansoor et al.,16 and Zueger et al.18
Zueger et al.18 evaluated the results of high-dose CST in 73 patients and found 13.7% of patients with inadequate cortisol response (<18 mcg/dL) at 30 minutes had normal concentrations at 60 minutes (>18 mcg/dL). Their study did not identify a single case of normal cortisol concentration at 30 minutes that would have inappropriately screened positive for AI if cortisol concentrations were only checked at 60 minutes. Similarly, they suggested that the 30-minute test did not add any additional diagnostic value; however, no confirmatory testing was performed.
Higher cortisol concentrations at 60 minutes poststimulation may result in improved specificity for AI without reducing sensitivity, but it may also indicate that the cutoff value may need to be raised from 18 mcg/dL at 60 minutes to maintain an appropriate clinical sensitivity. Continued research should resolve this clinical question with gold-standard confirmatory testing. Furthermore, there is debate about an appropriate screening cortisol concentration threshold for critically ill patients. Researchers have compared concentrations of 25 mcg/dL to the traditional 18 mcg/dL to improve sensitivity for AI, but these studies do not involve comparisons to confirmatory testing and often result in reduced specificity.23,24
In our study, only a small fraction of testing was performed in the early-morning hours, when basal cortisol results are of value. There may be indications to perform traditional CSTs with a basal concentration, such as for suspected secondary AI, but testing must be performed in the early morning for interpretable results per current recommendations. However, poststimulation cortisol concentrations may be interpreted regardless of the time of day at which the test was initiated.3
Our study is limited by its scope because it is a retrospective analysis. It is also limited by a lack of gold-standard, clinical confirmatory testing or analysis of other clinical data. Our method of testing and interpretation is considered the screening standard and is often used to plan treatment for AI without confirmatory testing, as ITT is not routinely available for hospitalized patients. The validation of the traditional CST to the ITT has been performed extensively, but a randomized trial comparing a single 60-minute concentration to the ITT may be useful. The exact timing of blood draws may have introduced error in the concentration measurements, and this is critical to screening accuracy. Total serum cortisol is 10% bound to albumin,25 and medications such as steroids or opioids and medical conditions such as obesity or liver disease can affect cortisol concentrations.26 Albumin and free cortisol concentrations that may be used to adjust for these variables were not available.
CONCLUSION
We recommend changes to the standard CST to exclude a basal cortisol concentration unless it is indicated for the evaluation of secondary AI or obtained at the appropriate early-morning hour. A single 60-minute poststimulation cortisol concentration may be an appropriate screening test for AI and demonstrates high concordance with the traditional CST. The use of a 30-minute poststimulation concentration alone may lead to a significantly higher number of false-positive results. Alternatively, the stimulated cortisol threshold used to define a normal test may need to be higher at 60 minutes to maintain the appropriate sensitivity. Further study and comparison with confirmatory testing are needed.
Disclosure
The authors have no relevant conflicts of interest to disclose.
1. Ajala O, Lockett H, Twine G, Flanagan DE. Depth and duration of hypoglycaemia achieved during the insulin tolerance test. Eur J Endocrinol. 2012;167(1):59-65. PubMed
2. Erturk E, Jaffe CA, Barkan AL. Evaluation of the integrity of the hypothalamic-pituitary-adrenal axis by insulin hypoglycemia test. J Clin Endocrinol Metab. 1998;83(7):2350-2354. PubMed
3. Azziz R, Bradley E Jr, Huth J, et al. Acute adrenocorticotropin-(1-24) (ACTH) adrenal stimulation in eumenorrheic women: reproducibility and effect of ACTH dose, subject weight, and sampling time. J Clin Endocrinol Metab. 1990;70(5):1273-1279. PubMed
4. Wood, JB, Frankland AW, James VH, Landon J. A Rapid Test of Adrenocortical Function. Lancet. 1965;1(7379):243-245. PubMed
5. Speckart PF, Nicoloff JT, Bethune JE. Screening for adrenocortical insufficiency with cosyntropin (synthetic ACTH). Arch Intern Med. 1971;128(5):761-763. PubMed
6. Grinspoon SK, Biller BM. Clinical review 62: Laboratory assessment of adrenal insufficiency. J Clin Endocrinol Metab. 1994;79(4):923-931. PubMed
7. Melmed S, Polonksy K, Larsen PR, Kronenberg H. Williams Textbook of Endocrinology. 13th ed. Elsevier: Amsterdam, Netherlands; 2016.
8. Nieman LK. Adrenal Cortex, in Goldman-Cecil Medicine. ed. L. Goldman. 2016, Elsevier: Amsterdam, Netherlands; 2016:1514-1521.
9. Kehlet H, Blichert-Toft M, Lindholm J, Rasmussen P. Short ACTH test in assessing hypothalamic-pituitary-adrenocortical function. Br Med J. 1976;1(6004):249-251. PubMed
10. Lindholm J, Kehlet H. Re-evaluation of the clinical value of the 30 min ACTH test in assessing the hypothalamic-pituitary-adrenocortical function. Clin Endocrinol (Oxf). 1987;26(1):53-59. PubMed
11. Lindholm J, Kehlet H, Blichert-Toft M, Dinesen B, Riishede J. Reliability of the 30-minute ACTH test in assessing hypothalamic-pituitary-adrenal function. J Clin Endocrinol Metab. 1978;47(2):272-274. PubMed
12. Hurel SJ, Thompson CJ, Watson MJ, Harris MM, Baylis PH, Kendall-Taylor P. The short Synacthen and insulin stress tests in the assessment of the hypothalamic-pituitary-adrenal axis. Clin Endocrinol (Oxf). 1996;44(2):141-146. PubMed
13. Dorin RI, Qualls CR, Crapo LM. Diagnosis of adrenal insufficiency. Ann Intern Med. 2003;139(3):194-204. PubMed
14. Oelkers W, Diederich S, Bahr V. Diagnosis and therapy surveillance in Addison’s disease: rapid adrenocorticotropin (ACTH) test and measurement of plasma ACTH, renin activity, and aldosterone. J Clin Endocrinol Metab. 1992;75(1):259-264. PubMed
15. Gonzalez-Gonzalez JG, De la Garza-Hernandez NE, Mancillas-Adame LG, Montes-Villarreal J, Villarreal-Perez JZ. A high-sensitivity test in the assessment of adrenocortical insufficiency: 10 microg vs 250 microg cosyntropin dose assessment of adrenocortical insufficiency. J Endocrinol. 1998;159(2):275-280. PubMed
16. Mansoor S, Islam N, Siddiqui I, Jabbar A. Sixty-minute post-Synacthen serum cortisol level: a reliable and cost-effective screening test for excluding adrenal insufficiency compared to the conventional short Synacthen test. Singapore Med J. 2007;48(6):519-523. PubMed
17. Chitale A, Musonda P, McGregor AM, Dhatariya KK. Determining the utility of the 60 min cortisol measurement in the short synacthen test. Clin Endocrinol (Oxf). 2013;79(1):14-19. PubMed
18. Zueger T, Jordi M, Laimer M, Stettler C. Utility of 30 and 60 minute cortisol samples after high-dose synthetic ACTH-1-24 injection in the diagnosis of adrenal insufficiency. Swiss Med Wkly. 2014;144:w13987. PubMed
19. Cartaya J, Misra M. The low-dose ACTH stimulation test: is 30 minutes long enough? Endocr Pract. 2015;21(5):508-513. PubMed
20. Gonzálbez, Villabona, Ramon, et al. Establishment of reference values for standard dose short synacthen test (250 μg), low dose short synacthen test (1 μg) and insulin tolerance test for assessment of the hypothalamo–pituitary–adrenal axis in normal subjects. Clin Endocrinol. 2000;53(2):199-204.
21. McGill J, Clutter W, Baranski T. The Washington Manual of Endocrinology Subspecialty Consult. 3rd ed. Washington Manual, ed. Henderson K, De Fer T. Lippincott Williams and Wilkins: Philadelphia, PA; 2012:384.
22. Nieman L. Diagnosis of adrenal insufficiency in adults. In UpToDate, ed. Post T. Wolters Klewer: Waltham, MA; 2017.
23. Marik PE, Kiminyo K, Zaloga GP. Adrenal insufficiency in critically ill patients with human immunodeficiency virus. Crit Care Med. 2002;30(6):1267-1273. PubMed
24. Marik PE, Zaloga GP. Adrenal insufficiency during septic shock. Crit Care Med. 2003;31(1):141-145. PubMed
25. Lewis JG, Bagley CJ, Elder PA, Bachmann AW, Torpy DJ. Plasma free cortisol fraction reflects levels of functioning corticosteroid-binding globulin. Clinica Chemica Acta. 2005;359(1-2):189-194. PubMed
26. Torpy DJ, Ho JT. Value of Free Cortisol Measurement in Systemic Infection. Horm Metab Res. 2007;39(6):439-444. PubMed
© 2018 Society of Hospital Medicine
Decrease in Inpatient Telemetry Utilization Through a System-Wide Electronic Health Record Change and a Multifaceted Hospitalist Intervention
Wasteful care may account for between 21% and 34% of the United States’ $3.2 trillion in annual healthcare expenditures, making it a prime target for cost-saving initiatives.1,2 Telemetry is a target for value improvement strategies because telemetry is overutilized, rarely leads to a change in management, and has associated guidelines on appropriate use.3-10 Telemetry use has been a focus of the Joint Commission’s National Patient Safety Goals since 2014, and it is also a focus of the Society of Hospital Medicine’s Choosing Wisely® campaign.11-13
Previous initiatives have evaluated how changes to telemetry orders or education and feedback affect telemetry use. Few studies have compared a system-wide electronic health record (EHR) approach to a multifaceted intervention. In seeking to address this gap, we adapted published guidelines from the American Heart Association (AHA) and incorporated them into our EHR ordering process.3 Simultaneously, we implemented a multifaceted quality improvement initiative and compared this combined program’s effectiveness to that of the EHR approach alone.
METHODS
Study Design, Setting, and Population
We performed a 2-group observational pre- to postintervention study at University of Utah Health. Hospital encounters of patients 18 years and older who had at least 1 inpatient acute care, nonintensive care unit (ICU) room charge and an admission date between January 1, 2014, and July 31, 2016, were included. Patient encounters with missing encounter-level covariates, such as case mix index (CMI) or attending provider identification, were excluded. The Institutional Review Board classified this project as quality improvement and did not require review and oversight.
Intervention
On July 6, 2015, our Epic (Epic Systems Corporation, Madison, WI) EHR telemetry order was modified to discourage unnecessary telemetry monitoring. The new order required providers ordering telemetry to choose a clinical indication and select a duration for monitoring, after which the order would expire and require physician renewal or discontinuation. These were the only changes that occurred for nonhospitalist providers. The nonhospitalist group included all admitting providers who were not hospitalists. This group included neurology (6.98%); cardiology (8.13%); other medical specialties such as pulmonology, hematology, and oncology (21.30%); cardiothoracic surgery (3.72%); orthopedic surgery (14.84%); general surgery (11.11%); neurosurgery (11.07%); and other surgical specialties, including urology, transplant, vascular surgery, and plastics (16.68%).
Between January 2015 and June 2015, we implemented a multicomponent program among our hospitalist service. The hospitalist service is composed of 4 teams with internal medicine residents and 2 teams with advanced practice providers, all staffed by academic hospitalists. Our program was composed of 5 elements, all of which were made before the hospital-wide changes to electronic telemetry orders and maintained throughout the study period, as follows: (1) a single provider education session reviewing available evidence (eg, AHA guidelines, Choosing Wisely® campaign), (2) removal of the telemetry order from hospitalist admission order set on March 23, 2015, (3) inclusion of telemetry discussion in the hospitalist group’s daily “Rounding Checklist,”14 (4) monthly feedback provided as part of hospitalist group meetings, and (5) a financial incentive, awarded to the division (no individual provider payment) if performance targets were met. See supplementary Appendix (“Implementation Manual”) for further details.
Data Source
We obtained data on patient age, gender, Medicare Severity-Diagnosis Related Group, Charlson comorbidity index (CCI), CMI, admitting unit, attending physician, admission and discharge dates, length of stay (LOS), 30-day readmission, bed charge (telemetry or nontelemetry), ICU stay, and inpatient mortality from the enterprise data warehouse. Telemetry days were determined through room billing charges, which are assigned based on the presence or absence of an active telemetry order at midnight. Code events came from a log kept by the hospital telephone operator, who is responsible for sending out all calls to the code team. Code event data were available starting July 19, 2014.
Measures
Our primary outcome was the percentage of hospital days that had telemetry charges for individual patients. All billed telemetry days on acute care floors were included regardless of admission status (inpatient vs observation), service, indication, or ordering provider. Secondary outcomes were inpatient mortality, escalation of care, code event rates, and appropriate telemetry utilization rates. Escalation of care was defined as transfer to an ICU after initially being admitted to an acute care floor. The code event rate was defined as the ratio of the number of code team activations to the number of patient days. Appropriate telemetry utilization rates were determined via chart review, as detailed below.
In order to evaluate changes in appropriateness of telemetry monitoring, 4 of the authors who are internal medicine physicians (KE, CC, JC, DG) performed chart reviews of 25 randomly selected patients in each group (hospitalist and nonhospitalist) before and after the intervention who received at least 1 day of telemetry monitoring. Each reviewer was provided a key based on AHA guidelines for monitoring indications and associated maximum allowable durations.3 Chart reviews were performed to determine the indication (if any) for monitoring, as well as the number of days that were indicated. The number of indicated days was compared to the number of telemetry days the patient received to determine the overall proportion of days that were indicated (“Telemetry appropriateness per visit”). Three reviewers (KE, AR, CC) also evaluated 100 patients on the hospitalist service after the intervention who did not receive any telemetry monitoring to evaluate whether patients with indications for telemetry monitoring were not receiving it after the intervention. For patients who had a possible indication, the indication was classified as Class I (“Cardiac monitoring is indicated in most, if not all, patients in this group”) or Class II (“Cardiac monitoring may be of benefit in some patients but is not considered essential for all patients”).3
Adjustment Variables
To account for differences in patient characteristics between hospitalist and nonhospitalist groups, we included age, gender, CMI, and CCI in statistical models. CCI was calculated according to the algorithm specified by Quan et al.15 using all patient diagnoses from previous visits and the index visit identified from the facility billing system.
Statistical Analysis
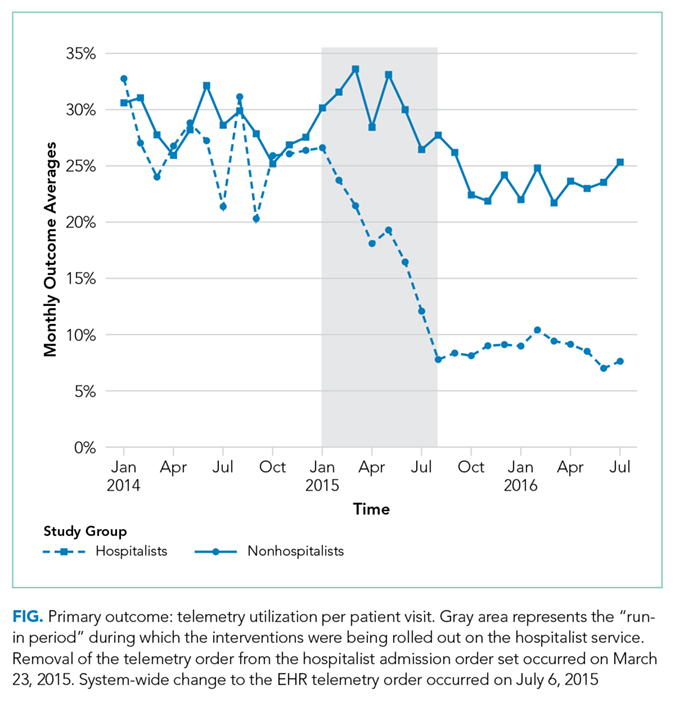
We computed descriptive statistics for study outcomes and visit characteristics for hospitalist and nonhospitalist visits for pre- and postintervention periods. Descriptive statistics were expressed as n (%) for categorical patient characteristics and outcome variables. For continuous patient characteristics, we expressed the variability of individual observations as the mean ± the standard deviation. For continuous outcomes, we expressed the precision of the mean estimates using standard error. Telemetry utilization per visit was weighted by the number of total acute care days per visit. Telemetry appropriateness per visit was weighted by the number of telemetry days per visit. Patients who did not receive any telemetry monitoring were included in the analysis and noted to have 0 telemetry days. All patients had at least 1 acute care day. Categorical variables were compared using χ2 tests, and continuous variables were compared using t tests. Code event rates were compared using the binomial probability mid-p exact test for person-time data.16
We fitted generalized linear regression models using generalized estimating equations to evaluate the relative change in outcomes of interest in the postintervention period compared with the preintervention period after adjusting for study covariates. The models included study group (hospitalist and nonhospitalist), time period (pre- and postintervention), an interaction term between study group and time period, and study covariates (age, gender, CMI, and CCI). The models were defined using a binomial distributional assumption and logit link function for mortality, escalation of care, and whether patients had at least 1 telemetry day. A gamma distributional assumption and log link function were used for LOS, telemetry acute care days per visit, and total acute care days per visit. A negative binomial distributional assumption and log link function were used for telemetry utilization and telemetry appropriateness. We used the log of the acute care days as an offset for telemetry utilization and the log of the telemetry days per visit as an offset for telemetry appropriateness. An exchangeable working correlation matrix was used to account for physician-level clustering for all outcomes. Intervention effects, representing the difference in odds for categorical variables and in amount for continuous variables, were calculated as exponentiation of the beta parameters for the covariate minus 1.
P values <.05 were considered significant. We used SAS version 9.4 statistical software (SAS Institute Inc., Cary, NC) for data analysis.
RESULTS

The percent of patients who had any telemetry charges decreased from 36.2% to 15.9% (P < .001) in the hospitalist group and from 31.8% to 28.0% in the nonhospitalist group (P < .001; Table 1). Rates of code events did not change over time (P = .9).
In the randomly selected sample of patients pre- and postintervention who received telemetry monitoring, there was an increase in telemetry appropriateness on the hospitalist service (46% to 72%, P = .025; Table 1). In the nonhospitalist group, appropriate telemetry utilization did not change significantly. Of the 100 randomly selected patients in the hospitalist group after the intervention who did not receive telemetry, no patient had an AHA Class I indication, and only 4 patients had a Class II indication.3,17
DISCUSSION
In this study, implementing a change in the EHR telemetry order produced reductions in telemetry days. However, when combined with a multicomponent program including education, audit and feedback, financial incentives, and changes to remove telemetry orders from admission orders sets, an even more marked improvement was seen. Neither intervention reduced LOS, increased code event rates, or increased rates of escalation of care.
Prior studies have evaluated interventions to reduce unnecessary telemetry monitoring with varying degrees of success. The most successful EHR intervention to date, from Dressler et al.,18 achieved a 70% reduction in overall telemetry use by integrating the AHA guidelines into their EHR and incorporating nursing discontinuation guidelines to ensure that telemetry discontinuation was both safe and timely. Other studies using stewardship approaches and standardized protocols have been less successful.19,20 One study utilizing a multidisciplinary approach but not including an EHR component showed modest improvements in telemetry.21
Although we are unable to differentiate the exact effect of each component of the intervention, we did note an immediate decrease in telemetry orders after removing the telemetry order from our admission order set, a trend that was magnified after the addition of broader EHR changes (Figure 1). Important additional contributors to our success seem to have been the standardization of rounds to include daily discussion of telemetry and the provision of routine feedback. We cannot discern whether other components of our program (such as the financial incentives) contributed more or less to our program, though the sum of these interventions produced an overall program that required substantial buy in and sustained focus from the hospitalist group. The importance of the hospitalist program is highlighted by the relatively large differences in improvement compared with the nonhospitalist group.
Our study has several limitations. First, the study was conducted at a single center, which may limit its generalizability. Second, the intervention was multifaceted, diminishing our ability to discern which aspects beyond the system-wide change in the telemetry order were most responsible for the observed effect among hospitalists. Third, we are unable to fully account for baseline differences in telemetry utilization between hospitalist and nonhospitalist groups. It is likely that different services utilize telemetry monitoring in different ways, and the hospitalist group may have been more aware of the existing guidelines for monitoring prior to the intervention. Furthermore, we had a limited sample size for the chart audits, which reduced the available statistical power for determining changes in the appropriateness of telemetry utilization. Additionally, because internal medicine residents rotate through various services, it is possible that the education they received on their hospitalist rotation as part of our intervention had a spillover effect in the nonhospitalist group. However, any effect should have decreased the difference between the groups. Lastly, although our postintervention time period was 1 year, we do not have data beyond that to monitor for sustainability of the results.
CONCLUSION
In this single-site study, combining EHR orders prompting physicians to choose a clinical indication and duration for monitoring with a broader program—including upstream changes in ordering as well as education, audit, and feedback—produced reductions in telemetry usage. Whether this reduction improves the appropriateness of telemetry utilization or reduces other effects of telemetry (eg, alert fatigue, calls for benign arrhythmias) cannot be discerned from our study. However, our results support the idea that multipronged approaches to telemetry use are most likely to produce improvements.
Acknowledgments
The authors thank Dr. Frank Thomas for his assistance with process engineering and Mr. Andrew Wood for his routine provision of data. The statistical analysis was supported by the University of Utah Study Design and Biostatistics Center, with funding in part from the National Center for Research Resources and the National Center for Advancing Translational Sciences, National Institutes of Health, through Grant 5UL1TR001067-05 (formerly 8UL1TR000105 and UL1RR025764).
Disclosure
The authors have no conflicts of interest to report.
1. National Health Expenditure Fact Sheet. 2015; https://www.cms.gov/Research-Statistics-Data-and-Systems/Statistics-Trends-and-Reports/NationalHealthExpendData/NHE-Fact-Sheet.html. Accessed June 27, 2017.
2. Berwick DM, Hackbarth AD. Eliminating waste in US health care. JAMA. 2012;307(14):1513-1516. PubMed
3. Drew BJ, Califf RM, Funk M, et al. Practice standards for electrocardiographic monitoring in hospital settings: an American Heart Association scientific statement from the Councils on Cardiovascular Nursing, Clinical Cardiology, and Cardiovascular Disease in the Young: endorsed by the International Society of Computerized Electrocardiology and the American Association of Critical-Care Nurses. Circulation. 2004;110(17):2721-2746. PubMed
4. Sandau KE, Funk M, Auerbach A, et al. Update to Practice Standards for Electrocardiographic Monitoring in Hospital Settings: A Scientific Statement From the American Heart Association. Circulation. 2017;136(19):e273-e344. PubMed
5. Mohammad R, Shah S, Donath E, et al. Non-critical care telemetry and in-hospital cardiac arrest outcomes. J Electrocardiol. 2015;48(3):426-429. PubMed
6. Dhillon SK, Rachko M, Hanon S, Schweitzer P, Bergmann SR. Telemetry monitoring guidelines for efficient and safe delivery of cardiac rhythm monitoring to noncritical hospital inpatients. Crit Pathw Cardiol. 2009;8(3):125-126. PubMed
7. Estrada CA, Rosman HS, Prasad NK, et al. Evaluation of guidelines for the use of telemetry in the non-intensive-care setting. J Gen Intern Med. 2000;15(1):51-55. PubMed
8. Estrada CA, Prasad NK, Rosman HS, Young MJ. Outcomes of patients hospitalized to a telemetry unit. Am J Cardiol. 1994;74(4):357-362. PubMed
9. Atzema C, Schull MJ, Borgundvaag B, Slaughter GR, Lee CK. ALARMED: adverse events in low-risk patients with chest pain receiving continuous electrocardiographic monitoring in the emergency department. A pilot study. Am J Emerg Med. 2006;24(1):62-67. PubMed
10. Schull MJ, Redelmeier DA. Continuous electrocardiographic monitoring and cardiac arrest outcomes in 8,932 telemetry ward patients. Acad Emerg Med. 2000;7(6):647-652. PubMed
11. The Joint Commission 2017 National Patient Safety Goals https://www.jointcommission.org/hap_2017_npsgs/. Accessed on February 15, 2017.
12. Joint Commission on Accreditation of Healthcare Organizations. The Joint Commission announces 2014 National Patient Safety Goal. Jt Comm Perspect. 2013;33(7):1, 3-4. PubMed
13. Bulger J, Nickel W, Messler J, et al. Choosing wisely in adult hospital medicine: five opportunities for improved healthcare value. J Hosp Med. 2013;8(9):486-492. PubMed
14. Yarbrough PM, Kukhareva PV, Horton D, Edholm K, Kawamoto K. Multifaceted intervention including education, rounding checklist implementation, cost feedback, and financial incentives reduces inpatient laboratory costs. J Hosp Med. 2016;11(5):348-354. PubMed
15. Quan H, Li B, Couris CM, et al. Updating and validating the Charlson comorbidity index and score for risk adjustment in hospital discharge abstracts using data from 6 countries. Am J Epidemiol. 2011;173(6):676-682. PubMed
16. Greenland S, Rothman KJ. Introduction to categorical statistics In: Rothman KJ, Greenland S, Lash TL, eds. Modern Epidemiology. Vol 3. Philadelphia, PA: Lippincott Williams & Wilkins; 2008: 238-257.
17. Henriques-Forsythe MN, Ivonye CC, Jamched U, Kamuguisha LK, Olejeme KA, Onwuanyi AE. Is telemetry overused? Is it as helpful as thought? Cleve Clin J Med. 2009;76(6):368-372. PubMed
18. Dressler R, Dryer MM, Coletti C, Mahoney D, Doorey AJ. Altering overuse of cardiac telemetry in non-intensive care unit settings by hardwiring the use of American Heart Association guidelines. JAMA Intern Med. 2014;174(11):1852-1854. PubMed
19. Boggan JC, Navar-Boggan AM, Patel V, Schulteis RD, Simel DL. Reductions in telemetry order duration do not reduce telemetry utilization. J Hosp Med. 2014;9(12):795-796. PubMed
20. Cantillon DJ, Loy M, Burkle A, et al. Association Between Off-site Central Monitoring Using Standardized Cardiac Telemetry and Clinical Outcomes Among Non-Critically Ill Patients. JAMA. 2016;316(5):519-524. PubMed
21. Svec D, Ahuja N, Evans KH, et al. Hospitalist intervention for appropriate use of telemetry reduces length of stay and cost. J Hosp Med. 2015;10(9):627-632. PubMed
Wasteful care may account for between 21% and 34% of the United States’ $3.2 trillion in annual healthcare expenditures, making it a prime target for cost-saving initiatives.1,2 Telemetry is a target for value improvement strategies because telemetry is overutilized, rarely leads to a change in management, and has associated guidelines on appropriate use.3-10 Telemetry use has been a focus of the Joint Commission’s National Patient Safety Goals since 2014, and it is also a focus of the Society of Hospital Medicine’s Choosing Wisely® campaign.11-13
Previous initiatives have evaluated how changes to telemetry orders or education and feedback affect telemetry use. Few studies have compared a system-wide electronic health record (EHR) approach to a multifaceted intervention. In seeking to address this gap, we adapted published guidelines from the American Heart Association (AHA) and incorporated them into our EHR ordering process.3 Simultaneously, we implemented a multifaceted quality improvement initiative and compared this combined program’s effectiveness to that of the EHR approach alone.
METHODS
Study Design, Setting, and Population
We performed a 2-group observational pre- to postintervention study at University of Utah Health. Hospital encounters of patients 18 years and older who had at least 1 inpatient acute care, nonintensive care unit (ICU) room charge and an admission date between January 1, 2014, and July 31, 2016, were included. Patient encounters with missing encounter-level covariates, such as case mix index (CMI) or attending provider identification, were excluded. The Institutional Review Board classified this project as quality improvement and did not require review and oversight.
Intervention
On July 6, 2015, our Epic (Epic Systems Corporation, Madison, WI) EHR telemetry order was modified to discourage unnecessary telemetry monitoring. The new order required providers ordering telemetry to choose a clinical indication and select a duration for monitoring, after which the order would expire and require physician renewal or discontinuation. These were the only changes that occurred for nonhospitalist providers. The nonhospitalist group included all admitting providers who were not hospitalists. This group included neurology (6.98%); cardiology (8.13%); other medical specialties such as pulmonology, hematology, and oncology (21.30%); cardiothoracic surgery (3.72%); orthopedic surgery (14.84%); general surgery (11.11%); neurosurgery (11.07%); and other surgical specialties, including urology, transplant, vascular surgery, and plastics (16.68%).
Between January 2015 and June 2015, we implemented a multicomponent program among our hospitalist service. The hospitalist service is composed of 4 teams with internal medicine residents and 2 teams with advanced practice providers, all staffed by academic hospitalists. Our program was composed of 5 elements, all of which were made before the hospital-wide changes to electronic telemetry orders and maintained throughout the study period, as follows: (1) a single provider education session reviewing available evidence (eg, AHA guidelines, Choosing Wisely® campaign), (2) removal of the telemetry order from hospitalist admission order set on March 23, 2015, (3) inclusion of telemetry discussion in the hospitalist group’s daily “Rounding Checklist,”14 (4) monthly feedback provided as part of hospitalist group meetings, and (5) a financial incentive, awarded to the division (no individual provider payment) if performance targets were met. See supplementary Appendix (“Implementation Manual”) for further details.
Data Source
We obtained data on patient age, gender, Medicare Severity-Diagnosis Related Group, Charlson comorbidity index (CCI), CMI, admitting unit, attending physician, admission and discharge dates, length of stay (LOS), 30-day readmission, bed charge (telemetry or nontelemetry), ICU stay, and inpatient mortality from the enterprise data warehouse. Telemetry days were determined through room billing charges, which are assigned based on the presence or absence of an active telemetry order at midnight. Code events came from a log kept by the hospital telephone operator, who is responsible for sending out all calls to the code team. Code event data were available starting July 19, 2014.
Measures
Our primary outcome was the percentage of hospital days that had telemetry charges for individual patients. All billed telemetry days on acute care floors were included regardless of admission status (inpatient vs observation), service, indication, or ordering provider. Secondary outcomes were inpatient mortality, escalation of care, code event rates, and appropriate telemetry utilization rates. Escalation of care was defined as transfer to an ICU after initially being admitted to an acute care floor. The code event rate was defined as the ratio of the number of code team activations to the number of patient days. Appropriate telemetry utilization rates were determined via chart review, as detailed below.
In order to evaluate changes in appropriateness of telemetry monitoring, 4 of the authors who are internal medicine physicians (KE, CC, JC, DG) performed chart reviews of 25 randomly selected patients in each group (hospitalist and nonhospitalist) before and after the intervention who received at least 1 day of telemetry monitoring. Each reviewer was provided a key based on AHA guidelines for monitoring indications and associated maximum allowable durations.3 Chart reviews were performed to determine the indication (if any) for monitoring, as well as the number of days that were indicated. The number of indicated days was compared to the number of telemetry days the patient received to determine the overall proportion of days that were indicated (“Telemetry appropriateness per visit”). Three reviewers (KE, AR, CC) also evaluated 100 patients on the hospitalist service after the intervention who did not receive any telemetry monitoring to evaluate whether patients with indications for telemetry monitoring were not receiving it after the intervention. For patients who had a possible indication, the indication was classified as Class I (“Cardiac monitoring is indicated in most, if not all, patients in this group”) or Class II (“Cardiac monitoring may be of benefit in some patients but is not considered essential for all patients”).3
Adjustment Variables
To account for differences in patient characteristics between hospitalist and nonhospitalist groups, we included age, gender, CMI, and CCI in statistical models. CCI was calculated according to the algorithm specified by Quan et al.15 using all patient diagnoses from previous visits and the index visit identified from the facility billing system.
Statistical Analysis
We computed descriptive statistics for study outcomes and visit characteristics for hospitalist and nonhospitalist visits for pre- and postintervention periods. Descriptive statistics were expressed as n (%) for categorical patient characteristics and outcome variables. For continuous patient characteristics, we expressed the variability of individual observations as the mean ± the standard deviation. For continuous outcomes, we expressed the precision of the mean estimates using standard error. Telemetry utilization per visit was weighted by the number of total acute care days per visit. Telemetry appropriateness per visit was weighted by the number of telemetry days per visit. Patients who did not receive any telemetry monitoring were included in the analysis and noted to have 0 telemetry days. All patients had at least 1 acute care day. Categorical variables were compared using χ2 tests, and continuous variables were compared using t tests. Code event rates were compared using the binomial probability mid-p exact test for person-time data.16
We fitted generalized linear regression models using generalized estimating equations to evaluate the relative change in outcomes of interest in the postintervention period compared with the preintervention period after adjusting for study covariates. The models included study group (hospitalist and nonhospitalist), time period (pre- and postintervention), an interaction term between study group and time period, and study covariates (age, gender, CMI, and CCI). The models were defined using a binomial distributional assumption and logit link function for mortality, escalation of care, and whether patients had at least 1 telemetry day. A gamma distributional assumption and log link function were used for LOS, telemetry acute care days per visit, and total acute care days per visit. A negative binomial distributional assumption and log link function were used for telemetry utilization and telemetry appropriateness. We used the log of the acute care days as an offset for telemetry utilization and the log of the telemetry days per visit as an offset for telemetry appropriateness. An exchangeable working correlation matrix was used to account for physician-level clustering for all outcomes. Intervention effects, representing the difference in odds for categorical variables and in amount for continuous variables, were calculated as exponentiation of the beta parameters for the covariate minus 1.
P values <.05 were considered significant. We used SAS version 9.4 statistical software (SAS Institute Inc., Cary, NC) for data analysis.
RESULTS
The percent of patients who had any telemetry charges decreased from 36.2% to 15.9% (P < .001) in the hospitalist group and from 31.8% to 28.0% in the nonhospitalist group (P < .001; Table 1). Rates of code events did not change over time (P = .9).
In the randomly selected sample of patients pre- and postintervention who received telemetry monitoring, there was an increase in telemetry appropriateness on the hospitalist service (46% to 72%, P = .025; Table 1). In the nonhospitalist group, appropriate telemetry utilization did not change significantly. Of the 100 randomly selected patients in the hospitalist group after the intervention who did not receive telemetry, no patient had an AHA Class I indication, and only 4 patients had a Class II indication.3,17
DISCUSSION
In this study, implementing a change in the EHR telemetry order produced reductions in telemetry days. However, when combined with a multicomponent program including education, audit and feedback, financial incentives, and changes to remove telemetry orders from admission orders sets, an even more marked improvement was seen. Neither intervention reduced LOS, increased code event rates, or increased rates of escalation of care.
Prior studies have evaluated interventions to reduce unnecessary telemetry monitoring with varying degrees of success. The most successful EHR intervention to date, from Dressler et al.,18 achieved a 70% reduction in overall telemetry use by integrating the AHA guidelines into their EHR and incorporating nursing discontinuation guidelines to ensure that telemetry discontinuation was both safe and timely. Other studies using stewardship approaches and standardized protocols have been less successful.19,20 One study utilizing a multidisciplinary approach but not including an EHR component showed modest improvements in telemetry.21
Although we are unable to differentiate the exact effect of each component of the intervention, we did note an immediate decrease in telemetry orders after removing the telemetry order from our admission order set, a trend that was magnified after the addition of broader EHR changes (Figure 1). Important additional contributors to our success seem to have been the standardization of rounds to include daily discussion of telemetry and the provision of routine feedback. We cannot discern whether other components of our program (such as the financial incentives) contributed more or less to our program, though the sum of these interventions produced an overall program that required substantial buy in and sustained focus from the hospitalist group. The importance of the hospitalist program is highlighted by the relatively large differences in improvement compared with the nonhospitalist group.
Our study has several limitations. First, the study was conducted at a single center, which may limit its generalizability. Second, the intervention was multifaceted, diminishing our ability to discern which aspects beyond the system-wide change in the telemetry order were most responsible for the observed effect among hospitalists. Third, we are unable to fully account for baseline differences in telemetry utilization between hospitalist and nonhospitalist groups. It is likely that different services utilize telemetry monitoring in different ways, and the hospitalist group may have been more aware of the existing guidelines for monitoring prior to the intervention. Furthermore, we had a limited sample size for the chart audits, which reduced the available statistical power for determining changes in the appropriateness of telemetry utilization. Additionally, because internal medicine residents rotate through various services, it is possible that the education they received on their hospitalist rotation as part of our intervention had a spillover effect in the nonhospitalist group. However, any effect should have decreased the difference between the groups. Lastly, although our postintervention time period was 1 year, we do not have data beyond that to monitor for sustainability of the results.
CONCLUSION
In this single-site study, combining EHR orders prompting physicians to choose a clinical indication and duration for monitoring with a broader program—including upstream changes in ordering as well as education, audit, and feedback—produced reductions in telemetry usage. Whether this reduction improves the appropriateness of telemetry utilization or reduces other effects of telemetry (eg, alert fatigue, calls for benign arrhythmias) cannot be discerned from our study. However, our results support the idea that multipronged approaches to telemetry use are most likely to produce improvements.
Acknowledgments
The authors thank Dr. Frank Thomas for his assistance with process engineering and Mr. Andrew Wood for his routine provision of data. The statistical analysis was supported by the University of Utah Study Design and Biostatistics Center, with funding in part from the National Center for Research Resources and the National Center for Advancing Translational Sciences, National Institutes of Health, through Grant 5UL1TR001067-05 (formerly 8UL1TR000105 and UL1RR025764).
Disclosure
The authors have no conflicts of interest to report.
1. National Health Expenditure Fact Sheet. 2015; https://www.cms.gov/Research-Statistics-Data-and-Systems/Statistics-Trends-and-Reports/NationalHealthExpendData/NHE-Fact-Sheet.html. Accessed June 27, 2017.
2. Berwick DM, Hackbarth AD. Eliminating waste in US health care. JAMA. 2012;307(14):1513-1516. PubMed
3. Drew BJ, Califf RM, Funk M, et al. Practice standards for electrocardiographic monitoring in hospital settings: an American Heart Association scientific statement from the Councils on Cardiovascular Nursing, Clinical Cardiology, and Cardiovascular Disease in the Young: endorsed by the International Society of Computerized Electrocardiology and the American Association of Critical-Care Nurses. Circulation. 2004;110(17):2721-2746. PubMed
4. Sandau KE, Funk M, Auerbach A, et al. Update to Practice Standards for Electrocardiographic Monitoring in Hospital Settings: A Scientific Statement From the American Heart Association. Circulation. 2017;136(19):e273-e344. PubMed
5. Mohammad R, Shah S, Donath E, et al. Non-critical care telemetry and in-hospital cardiac arrest outcomes. J Electrocardiol. 2015;48(3):426-429. PubMed
6. Dhillon SK, Rachko M, Hanon S, Schweitzer P, Bergmann SR. Telemetry monitoring guidelines for efficient and safe delivery of cardiac rhythm monitoring to noncritical hospital inpatients. Crit Pathw Cardiol. 2009;8(3):125-126. PubMed
7. Estrada CA, Rosman HS, Prasad NK, et al. Evaluation of guidelines for the use of telemetry in the non-intensive-care setting. J Gen Intern Med. 2000;15(1):51-55. PubMed
8. Estrada CA, Prasad NK, Rosman HS, Young MJ. Outcomes of patients hospitalized to a telemetry unit. Am J Cardiol. 1994;74(4):357-362. PubMed
9. Atzema C, Schull MJ, Borgundvaag B, Slaughter GR, Lee CK. ALARMED: adverse events in low-risk patients with chest pain receiving continuous electrocardiographic monitoring in the emergency department. A pilot study. Am J Emerg Med. 2006;24(1):62-67. PubMed
10. Schull MJ, Redelmeier DA. Continuous electrocardiographic monitoring and cardiac arrest outcomes in 8,932 telemetry ward patients. Acad Emerg Med. 2000;7(6):647-652. PubMed
11. The Joint Commission 2017 National Patient Safety Goals https://www.jointcommission.org/hap_2017_npsgs/. Accessed on February 15, 2017.
12. Joint Commission on Accreditation of Healthcare Organizations. The Joint Commission announces 2014 National Patient Safety Goal. Jt Comm Perspect. 2013;33(7):1, 3-4. PubMed
13. Bulger J, Nickel W, Messler J, et al. Choosing wisely in adult hospital medicine: five opportunities for improved healthcare value. J Hosp Med. 2013;8(9):486-492. PubMed
14. Yarbrough PM, Kukhareva PV, Horton D, Edholm K, Kawamoto K. Multifaceted intervention including education, rounding checklist implementation, cost feedback, and financial incentives reduces inpatient laboratory costs. J Hosp Med. 2016;11(5):348-354. PubMed
15. Quan H, Li B, Couris CM, et al. Updating and validating the Charlson comorbidity index and score for risk adjustment in hospital discharge abstracts using data from 6 countries. Am J Epidemiol. 2011;173(6):676-682. PubMed
16. Greenland S, Rothman KJ. Introduction to categorical statistics In: Rothman KJ, Greenland S, Lash TL, eds. Modern Epidemiology. Vol 3. Philadelphia, PA: Lippincott Williams & Wilkins; 2008: 238-257.
17. Henriques-Forsythe MN, Ivonye CC, Jamched U, Kamuguisha LK, Olejeme KA, Onwuanyi AE. Is telemetry overused? Is it as helpful as thought? Cleve Clin J Med. 2009;76(6):368-372. PubMed
18. Dressler R, Dryer MM, Coletti C, Mahoney D, Doorey AJ. Altering overuse of cardiac telemetry in non-intensive care unit settings by hardwiring the use of American Heart Association guidelines. JAMA Intern Med. 2014;174(11):1852-1854. PubMed
19. Boggan JC, Navar-Boggan AM, Patel V, Schulteis RD, Simel DL. Reductions in telemetry order duration do not reduce telemetry utilization. J Hosp Med. 2014;9(12):795-796. PubMed
20. Cantillon DJ, Loy M, Burkle A, et al. Association Between Off-site Central Monitoring Using Standardized Cardiac Telemetry and Clinical Outcomes Among Non-Critically Ill Patients. JAMA. 2016;316(5):519-524. PubMed
21. Svec D, Ahuja N, Evans KH, et al. Hospitalist intervention for appropriate use of telemetry reduces length of stay and cost. J Hosp Med. 2015;10(9):627-632. PubMed
© 2018 Society of Hospital Medicine
Effect of Hospital Readmission Reduction on Patients at Low, Medium, and High Risk of Readmission in the Medicare Population
Given the high cost of readmissions to the healthcare system, there has been a substantial push to reduce readmissions by policymakers.1 Among these is the Hospital Readmissions Reduction Program (HRRP), in which hospitals with higher than expected readmission rates receive reduced payments from Medicare.2 Recent evidence has suggested the success of such policy changes, with multiple reports demonstrating a decrease in 30-day readmission rates in the Medicare population starting in 2010.3-8
Initiatives to reduce readmissions can also have an effect on total number of admissions.9,10 Indeed, along with the recent reduction in readmission, there has been a reduction in all admissions among Medicare beneficiaries.11,12 Some studies have found that as admissions have decreased, the burden of comorbidity has increased among hospitalized patients,3,11 suggesting that hospitals may be increasingly filled with patients at high risk of readmission. However, whether readmission risk among hospitalized patients has changed remains unknown, and understanding changes in risk profile could help inform which patients to target with future interventions to reduce readmissions.
Hospital efforts to reduce readmissions may have differential effects on types of patients by risk. For instance, low-intensity, system-wide interventions such as standardized discharge instructions or medicine reconciliation may have a stronger effect on patients at relatively low risk of readmission who may have a few important drivers of readmission that are easily overcome. Alternatively, the impact of intensive care transitions management might be greatest for high-risk patients, who have the most need for postdischarge medications, follow-up, and self-care.
The purpose of this study was therefore twofold: (1) to observe changes in average monthly risk of readmission among hospitalized Medicare patients and (2) to examine changes in readmission rates for Medicare patients at various risk of readmission. We hypothesized that readmission risk in the Medicare population would increase in recent years, as overall number of admissions and readmissions have fallen.7,11 Additionally, we hypothesized that standardized readmission rates would decline less in highest risk patients as compared with the lowest risk patients because transitional care interventions may not be able to mitigate the large burden of comorbidity and social issues present in many high-risk patients.13,14
METHODS
We performed a retrospective cohort study of hospitalizations to US nonfederal short-term acute care facilities by Medicare beneficiaries between January 2009 and June 2015. The design involved 4 steps. First, we estimated a predictive model for unplanned readmissions within 30 days of discharge. Second, we assigned each hospitalization a predicted risk of readmission based on the model. Third, we studied trends in mean predicted risk of readmission during the study period. Fourth, we examined trends in observed to expected (O/E) readmission for hospitalizations in the lowest, middle, and highest categories of predicted risk of readmission to determine whether reductions in readmissions were more substantial in certain risk groups than in others.
Data were obtained from the Centers for Medicare and Medicaid Services (CMS) Inpatient Standard Analytic File and the Medicare Enrollment Data Base. We included hospitalizations of fee-for-service Medicare beneficiaries age ≥65 with continuous enrollment in Part A Medicare fee-for-service for at least 1 year prior and 30 days after the hospitalization.15 Hospitalizations with a discharge disposition of death, transfer to another acute hospital, and left against medical advice (AMA) were excluded. We also excluded patients with enrollment in hospice care prior to hospitalization. We excluded hospitalizations in June 2012 because of an irregularity in data availability for that month.
Hospitalizations were categorized into 5 specialty cohorts according to service line. The 5 cohorts were those used for the CMS hospital-wide readmission measure and included surgery/gynecology, medicine, cardiovascular, cardiorespiratory, and neurology.15 Among the 3 clinical conditions tracked as part of HRRP, heart failure and pneumonia were a subset of the cardiorespiratory cohort, while acute myocardial infarction was a subset of the cardiovascular cohort. Our use of cohorts was threefold: first, the average risk of readmission differs substantially across these cohorts, so pooling them produces heterogeneous risk strata; second, risk variables perform differently in different cohorts, so one single model may not be as accurate for calculating risk; and, third, the use of disease cohorts makes our results comparable to the CMS model and similar to other readmission studies in Medicare.7,8,15
For development of the risk model, the outcome was 30-day unplanned hospital readmission. Planned readmissions were excluded; these were defined by the CMS algorithm as readmissions in which a typically planned procedure occurred in a hospitalization with a nonacute principal diagnosis.16 Independent variables included age and comorbidities in the final hospital-wide readmission models for each of the 5 specialty cohorts.15 In order to produce the best possible individual risk prediction for each patient, we added additional independent variables that CMS avoids for hospital quality measurement purposes but that contribute to risk of readmission: sex, race, dual eligibility status, number of prior AMA discharges, intensive care unit stay during current hospitalization, coronary care unit stay during current hospitalization, and hospitalization in the prior 30, 90, and 180 days. We also included an indicator variable for hospitalizations with more than 9 discharge diagnosis codes on or after January 2011, the time at which Medicare allowed an increase of the number of International Classification of Diseases, 9th Revision-Clinical Modification diagnosis billing codes from 9 to 25.17 This indicator adjusts for the increased availability of comorbidity codes, which might otherwise inflate the predicted risk relative to hospitalizations prior to that date.
Based on the risk models, each hospitalization was assigned a predicted risk of readmission. For each specialty cohort, we pooled all hospitalizations across all study years and divided them into risk quintiles. We categorized hospitalizations as high risk if in the highest quintile, medium risk if in the middle 3 quintiles, and low risk if in the lowest quintile of predicted risk for all study hospitalizations in a given specialty cohort.
For our time trend analyses, we studied 2 outcomes: monthly mean predicted risk and monthly ratio of observed readmissions to expected readmissions for patients in the lowest, middle, and highest categories of predicted risk of readmission. We studied monthly predicted risk to determine whether the average readmission risk of patients was changing over time as admission and readmission rates were declining. We studied the ratio of O/E readmissions to determine whether the decline in overall readmissions was more substantial in particular risk strata; we used the ratio of O/E readmissions, which measures number of readmissions divided by number of readmissions predicted by the model, rather than crude observed readmissions, as O/E readmissions account for any changes in risk profiles over time within each risk stratum. Independent variables in our trend analyses were year—entered as a continuous variable—and indicators for postintroduction of the Affordable Care Act (ACA, March 2010) and for postintroduction of HRRP (October 2012); these time indicators were included because of prior studies demonstrating that the introduction of ACA was associated with a decrease from baseline in readmission rates, which leveled off after introduction of HRRP.7 We also included an indicator for calendar quarter to account for seasonal effects.
Statistical Analysis
We developed generalized estimating equation models to predict 30-day unplanned readmission for each of the 5 specialty cohorts. The 5 models were fit using all patients in each cohort for the included time period and were adjusted for clustering by hospital. We assessed discrimination by calculating area under the receiver operating characteristic curve (AUC) for the 5 models; the AUCs measured the models’ ability to distinguish patients who were readmitted versus those who were not.18 We also calculated AUCs for each year to examine model performance over time.
Using these models, we calculated predicted risk for each hospitalization and averaged these to obtain mean predicted risk for each specialty cohort for each month. To test for trends in mean risk, we estimated 5 time series models, one for each cohort, with the dependent variable of monthly mean predicted risk. For each cohort, we first estimated a series of 12 empty autoregressive models, each with a different autoregressive term (1, 2...12). For each model, we calculated χ2 for the test that the autocorrelation was 0; based on a comparison of chi-squared values, we specified an autocorrelation of 1 month for all models. Accordingly, a 1-month lag was used to estimate one final model for each cohort. Independent variables included year and indicators for post-ACA and post-HRRP; these variables captured the effect of trends over time and the introduction of these policy changes, respectively.19
To determine whether changes in risk over time were a result of changes in particular risk groups, we categorized hospitalizations into risk strata based on quintiles of predicted risk for each specialty cohort for the entire study period. For each individual year, we calculated the proportion of hospitalizations in the highest, middle, and lowest readmission risk strata for each cohort.
We calculated the monthly ratio of O/E readmission for hospitalizations in the lowest 20%, middle 60%, and highest 20% of readmission risk by month; O/E reflects the excess or deficit observed events relative to the number predicted by the model. Using this monthly O/E as the dependent variable, we developed autoregressive time series models as above, again with a 1-month lag, for each of these 3 risk strata in each cohort. As before, independent variables were year as a continuous variable, indicator variables for post-ACA and post-HRRP, and a categorical variable for calendar quarter.
All analyses were done in SAS version 9.3 (SAS Institute Inc., Cary, NC) and Stata version 14.2 (StataCorp LLC, College Station, TX).
RESULTS
We included 47,288,961 hospitalizations in the study, of which 11,231,242 (23.8%) were in the surgery/gynecology cohort, 19,548,711 (41.3%) were in the medicine cohort, 5,433,125 (11.5%) were in the cardiovascular cohort, 8,179,691 (17.3%) were in the cardiorespiratory cohort, and 2,896,192 (6.1%) were in the neurology cohort. The readmission rate was 16.2% (n = 7,642,161) overall, with the highest rates observed in the cardiorespiratory (20.5%) and medicine (17.6%) cohorts and the lowest rates observed in the surgery/gynecology (11.8%) and neurology (13.8%) cohorts.
The final predictive models for each cohort ranged in number of parameters from 56 for the cardiorespiratory cohort to 264 for the surgery/gynecology cohort. The models had AUCs of 0.70, 0.65, 0.67, 0.65, and 0.63 for the surgery/gynecology, medicine, cardiovascular, cardiorespiratory, and neurology cohorts, respectively; AUCs remained fairly stable over time for all disease cohorts (Appendix Table 1).
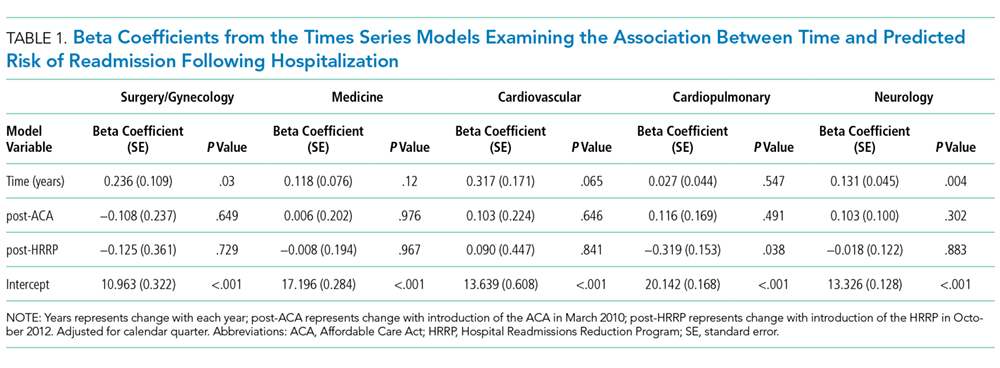
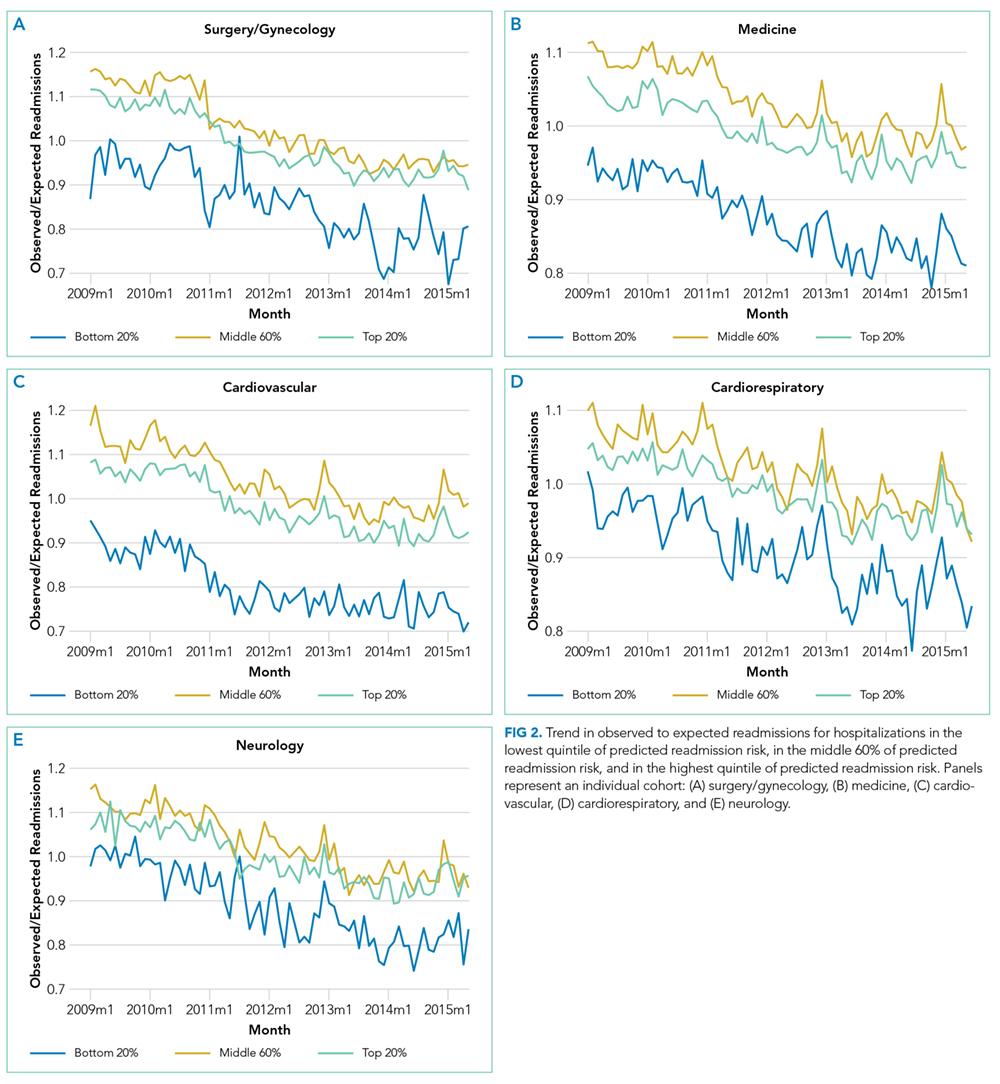
DISCUSSION
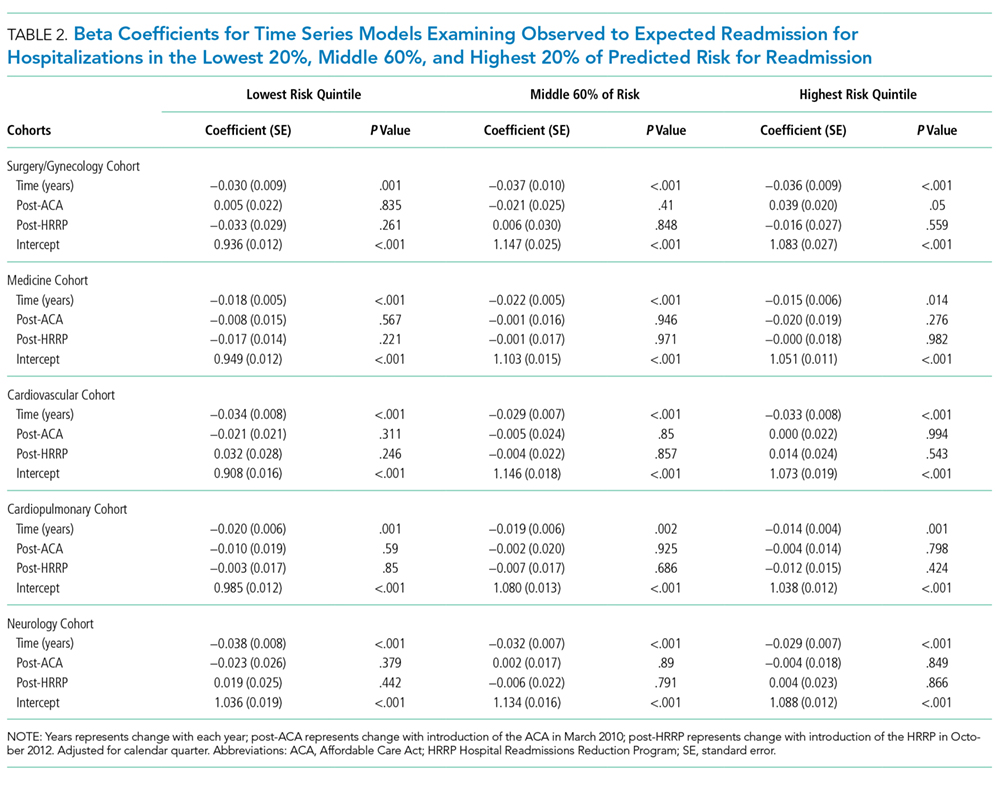
A number of mechanisms may account for the across-the-board improvements in readmission reduction. Many hospitals have instituted system-wide interventions, including patient education, medicine reconciliation, and early postdischarge follow-up,20 which may have reduced readmissions across all patient risk strata. Alternatively, hospitals may have implemented interventions that disproportionally benefited low-risk patients while simultaneously utilizing interventions that only benefited high-risk patients. For instance, increasing threshold for admission7 may have the greatest effect on low-risk patients who could be most easily managed at home, while many intensive transitional care interventions have been developed to target only high-risk patients.21,22
With the introduction of HRRP, there have been a number of concerns about the readmission measure used to penalize hospitals for high readmission rates. One major concern has been that the readmission metric may be flawed in its ability to capture continued improvement related to readmission.23 Some have suggested that with better population health management, admissions will decrease, patient risk of the remaining patients will increase, and hospitals will be increasingly filled with patients who have high likelihood of readmission. This potential for increased risk with HRRP was suggested by a recent study that found that comorbidities increased in hospitalized Medicare beneficiaries between 2010 and 2013.11 Our results were mixed in supporting this potential phenomenon because we examined global risk of readmission and found that some of the cohorts had increased risk over time while others did not. Others have expressed concern that readmission measure does not account for socioeconomic status, which has been associated with readmission rates.24-27 Although we did not directly examine socioeconomic status in our study, we found that hospitals have been able to reduce readmission across all levels of risk, which includes markers of socioeconomic status, including race and Medicaid eligibility status.
Although we hypothesized that readmission risk would increase as number of hospitalizations decreased over time, we found no increase in readmission risk among the cohorts with HRRP diagnoses that had the largest decrease in readmission rates.7,8 Conversely, readmission risk did increase—with a concurrent increase in the proportion of high-risk hospitalizations—in the surgery/gynecology and neurology cohorts that were not subject to HRRP penalties. Nonetheless, rehospitalizations were reduced for all risk categories in these 2 cohorts. Notably, surgery/gynecology and neurology had the lowest readmission rates overall. These findings suggest that initiatives to prevent initial hospitalizations, such as increasing the threshold for postoperative admission, may have had a greater effect on low- versus high-risk patients in low-risk hospitalizations. However, once a patient is hospitalized, multidisciplinary strategies appear to be effective at reducing readmissions for all risk classes in these cohorts.
For the 3 cohorts in which we observed an increase in readmission risk among hospitalized patients, the risk appeared to increase in early 2011. This time was about 10 months after passage of ACA, the timing of which was previously associated with a drop in readmission rates,7,8 but well before HRRP went into effect in October 2012. The increase in readmission risk coincided with an increase in the number of diagnostic codes that could be included on a hospital claim to Medicare.17 This increase in allowable codes allowed us to capture more diagnoses for some patients, potentially resulting in an increase in apparent predicted risk of readmissions. While we adjusted for this in our predictive models, we may not have fully accounted for differences in risk related to coding change. As a result, some of the observed differences in risk in our study may be attributable to coding differences. More broadly, studies demonstrating the success of HRRP have typically examined risk-adjusted rates of readmission.3,7 It is possible that a small portion of the observed reduction in risk-adjusted readmission rates may be related to the increase in predicted risk of readmission observed in our study. Future assessment of trends in readmission during this period should consider accounting for change in the number of allowed billing codes.
Other limitations should be considered in the interpretation of this study. First, like many predictive models for readmission,14 ours had imperfect discrimination, which could affect our results. Second, our study was based on older Medicare patients, so findings may not be applicable to younger patients. Third, while we accounted for surrogates for socioeconomic status, including dual eligibility and race, our models lacked other socioeconomic and community factors that can influence readmission.24-26 Nonetheless, 1 study suggested that easily measured socioeconomic factors may not have a strong influence on the readmission metric used by Medicare.28 Fourth, while our study included over 47 million hospitalizations, our time trend analyses used calendar month as the primary independent variable. As our study included 77 months, we may not have had sufficient power to detect small changes in risk over time.
Medicare readmissions have declined steadily in recent years, presumably at least partly in response to policy changes including HRRP. We found that hospitals have been effective at reducing readmissions across a range of patient risk strata and clinical conditions. As a result, the overall risk of readmission for hospitalized patients has remained constant for some but not all conditions. Whether institutions can continue to reduce readmission rates for most types of patients remains to be seen.
Acknowledgments
This study was supported by the Agency for Healthcare Research and Quality (AHRQ) grant R01HS022882. Dr. Blecker was supported by the AHRQ grant K08HS23683. The authors would like to thank Shawn Hoke and Jane Padikkala for administrative support.
Disclosure
This study was supported by the Agency for Healthcare Research and Quality (AHRQ) grants R01HS022882 and K08HS23683. The authors have no conflicts to report.
1. Jha AK. Seeking Rational Approaches to Fixing Hospital Readmissions. JAMA. 2015;314(16):1681-1682. PubMed
2. Centers for Medicare & Medicaid Services. Readmissions Reduction Program. https://www.cms.gov/Medicare/Medicare-Fee-for-Service-Payment/AcuteInpatientPPS/Readmissions-Reduction-Program.html. Accessed on January 17, 2017.
3. Suter LG, Li SX, Grady JN, et al. National patterns of risk-standardized mortality and readmission after hospitalization for acute myocardial infarction, heart failure, and pneumonia: update on publicly reported outcomes measures based on the 2013 release. J Gen Intern Med. 2014;29(10):1333-1340. PubMed
4. Gerhardt G, Yemane A, Hickman P, Oelschlaeger A, Rollins E, Brennan N. Medicare readmission rates showed meaningful decline in 2012. Medicare Medicaid Res Rev. 2013;3(2):pii:mmrr.003.02.b01. PubMed
5. Centers for Medicare and Medicaid Services. New Data Shows Affordable Care Act Reforms Are Leading to Lower Hospital Readmission Rates for Medicare Beneficiaries. http://blog.cms.gov/2013/12/06/new-data-shows-affordable-care-act-reforms-are-leading-to-lower-hospital-readmission-rates-for-medicare-beneficiaries/. Accessed on January 17, 2017.
6. Krumholz HM, Normand SL, Wang Y. Trends in hospitalizations and outcomes for acute cardiovascular disease and stroke, 1999-2011. Circulation. 2014;130(12):966-975. PubMed
7. Zuckerman RB, Sheingold SH, Orav EJ, Ruhter J, Epstein AM. Readmissions, Observation, and the Hospital Readmissions Reduction Program. N Engl J Med. 2016;374(16):1543-1551. PubMed
8. Desai NR, Ross JS, Kwon JY, et al. Association Between Hospital Penalty Status Under the Hospital Readmission Reduction Program and Readmission Rates for Target and Nontarget Conditions. JAMA. 2016;316(24):2647-2656. PubMed
9. Brock J, Mitchell J, Irby K, et al. Association between quality improvement for care transitions in communities and rehospitalizations among Medicare beneficiaries. JAMA. 2013;309(4):381-391. PubMed
10. Jencks S. Protecting Hospitals That Improve Population Health. http://medicaring.org/2014/12/16/protecting-hospitals/. Accessed on January 5, 2017.
11. Dharmarajan K, Qin L, Lin Z, et al. Declining Admission Rates And Thirty-Day Readmission Rates Positively Associated Even Though Patients Grew Sicker Over Time. Health Aff (Millwood). 2016;35(7):1294-1302. PubMed
12. Krumholz HM, Nuti SV, Downing NS, Normand SL, Wang Y. Mortality, Hospitalizations, and Expenditures for the Medicare Population Aged 65 Years or Older, 1999-2013. JAMA. 2015;314(4):355-365. PubMed
13. Amarasingham R, Moore BJ, Tabak YP, et al. An automated model to identify heart failure patients at risk for 30-day readmission or death using electronic medical record data. Med Care. 2010;48(11):981-988. PubMed
14. Kansagara D, Englander H, Salanitro A, et al. Risk prediction models for hospital readmission: a systematic review. JAMA. 2011;306(15):1688-1698. PubMed
15. Horwitz LI, Partovian C, Lin Z, et al. Development and use of an administrative claims measure for profiling hospital-wide performance on 30-day unplanned readmission. Ann Intern Med. 2014;161(10 Suppl):S66-S75. PubMed
16. 2016 Condition-Specific Measures Updates and Specifications Report Hospital-Level 30-Day Risk-Standardized Readmission Measures. https://www.cms.gov/Medicare/Quality-Initiatives-Patient-Assessment-Instruments/HospitalQualityInits/Downloads/AMI-HF-PN-COPD-and-Stroke-Readmission-Updates.zip. Accessed on January 19, 2017.
17. Centers for Medicare & Medicaid Services. Pub 100-04 Medicare Claims Processing, Transmittal 2028. https://www.cms.gov/Regulations-and-Guidance/Guidance/Transmittals/downloads/R2028CP.pdf. Accessed on November 28, 2016.
18. Martens FK, Tonk EC, Kers JG, Janssens AC. Small improvement in the area under the receiver operating characteristic curve indicated small changes in predicted risks. J Clin Epidemiol. 2016;79:159-164. PubMed
19. Blecker S, Goldfeld K, Park H, et al. Impact of an Intervention to Improve Weekend Hospital Care at an Academic Medical Center: An Observational Study. J Gen Intern Med. 2015;30(11):1657-1664. PubMed
20. Hansen LO, Young RS, Hinami K, Leung A, Williams MV. Interventions to reduce 30-day rehospitalization: a systematic review. Ann Intern Med. 2011;155(8):520-528. PubMed
21. Cavanaugh JJ, Jones CD, Embree G, et al. Implementation Science Workshop: primary care-based multidisciplinary readmission prevention program. J Gen Intern Med. 2014;29(5):798-804. PubMed
22. Jenq GY, Doyle MM, Belton BM, Herrin J, Horwitz LI. Quasi-Experimental Evaluation of the Effectiveness of a Large-Scale Readmission Reduction Program. JAMA Intern Med. 2016;176(5):681-690. PubMed
23. Lynn J, Jencks S. A Dangerous Malfunction in the Measure of Readmission Reduction. http://medicaring.org/2014/08/26/malfunctioning-metrics/. Accessed on January 17, 2017.
24. Calvillo-King L, Arnold D, Eubank KJ, et al. Impact of social factors on risk of readmission or mortality in pneumonia and heart failure: systematic review. J Gen Intern Med. 2013;28(2):269-282. PubMed
25. Barnett ML, Hsu J, McWilliams JM. Patient Characteristics and Differences in Hospital Readmission Rates. JAMA Intern Med. 2015;175(11):1803-1812. PubMed
26. Singh S, Lin YL, Kuo YF, Nattinger AB, Goodwin JS. Variation in the risk of readmission among hospitals: the relative contribution of patient, hospital and inpatient provider characteristics. J Gen Intern Med. 2014;29(4):572-578. PubMed
27. American Hospital Association. American Hospital Association (AHA) Detailed Comments on the Inpatient Prospective Payment System (PPS) Proposed Rule for Fiscal Year (FY) 2016. http://www.aha.org/advocacy-issues/letter/2015/150616-cl-cms1632-p-ipps.pdf. Accessed on January 10, 2017.
28. Bernheim SM, Parzynski CS, Horwitz L, et al. Accounting For Patients’ Socioeconomic Status Does Not Change Hospital Readmission Rates. Health Aff (Millwood). 2016;35(8):1461-1470. PubMed
Given the high cost of readmissions to the healthcare system, there has been a substantial push to reduce readmissions by policymakers.1 Among these is the Hospital Readmissions Reduction Program (HRRP), in which hospitals with higher than expected readmission rates receive reduced payments from Medicare.2 Recent evidence has suggested the success of such policy changes, with multiple reports demonstrating a decrease in 30-day readmission rates in the Medicare population starting in 2010.3-8
Initiatives to reduce readmissions can also have an effect on total number of admissions.9,10 Indeed, along with the recent reduction in readmission, there has been a reduction in all admissions among Medicare beneficiaries.11,12 Some studies have found that as admissions have decreased, the burden of comorbidity has increased among hospitalized patients,3,11 suggesting that hospitals may be increasingly filled with patients at high risk of readmission. However, whether readmission risk among hospitalized patients has changed remains unknown, and understanding changes in risk profile could help inform which patients to target with future interventions to reduce readmissions.
Hospital efforts to reduce readmissions may have differential effects on types of patients by risk. For instance, low-intensity, system-wide interventions such as standardized discharge instructions or medicine reconciliation may have a stronger effect on patients at relatively low risk of readmission who may have a few important drivers of readmission that are easily overcome. Alternatively, the impact of intensive care transitions management might be greatest for high-risk patients, who have the most need for postdischarge medications, follow-up, and self-care.
The purpose of this study was therefore twofold: (1) to observe changes in average monthly risk of readmission among hospitalized Medicare patients and (2) to examine changes in readmission rates for Medicare patients at various risk of readmission. We hypothesized that readmission risk in the Medicare population would increase in recent years, as overall number of admissions and readmissions have fallen.7,11 Additionally, we hypothesized that standardized readmission rates would decline less in highest risk patients as compared with the lowest risk patients because transitional care interventions may not be able to mitigate the large burden of comorbidity and social issues present in many high-risk patients.13,14
METHODS
We performed a retrospective cohort study of hospitalizations to US nonfederal short-term acute care facilities by Medicare beneficiaries between January 2009 and June 2015. The design involved 4 steps. First, we estimated a predictive model for unplanned readmissions within 30 days of discharge. Second, we assigned each hospitalization a predicted risk of readmission based on the model. Third, we studied trends in mean predicted risk of readmission during the study period. Fourth, we examined trends in observed to expected (O/E) readmission for hospitalizations in the lowest, middle, and highest categories of predicted risk of readmission to determine whether reductions in readmissions were more substantial in certain risk groups than in others.
Data were obtained from the Centers for Medicare and Medicaid Services (CMS) Inpatient Standard Analytic File and the Medicare Enrollment Data Base. We included hospitalizations of fee-for-service Medicare beneficiaries age ≥65 with continuous enrollment in Part A Medicare fee-for-service for at least 1 year prior and 30 days after the hospitalization.15 Hospitalizations with a discharge disposition of death, transfer to another acute hospital, and left against medical advice (AMA) were excluded. We also excluded patients with enrollment in hospice care prior to hospitalization. We excluded hospitalizations in June 2012 because of an irregularity in data availability for that month.
Hospitalizations were categorized into 5 specialty cohorts according to service line. The 5 cohorts were those used for the CMS hospital-wide readmission measure and included surgery/gynecology, medicine, cardiovascular, cardiorespiratory, and neurology.15 Among the 3 clinical conditions tracked as part of HRRP, heart failure and pneumonia were a subset of the cardiorespiratory cohort, while acute myocardial infarction was a subset of the cardiovascular cohort. Our use of cohorts was threefold: first, the average risk of readmission differs substantially across these cohorts, so pooling them produces heterogeneous risk strata; second, risk variables perform differently in different cohorts, so one single model may not be as accurate for calculating risk; and, third, the use of disease cohorts makes our results comparable to the CMS model and similar to other readmission studies in Medicare.7,8,15
For development of the risk model, the outcome was 30-day unplanned hospital readmission. Planned readmissions were excluded; these were defined by the CMS algorithm as readmissions in which a typically planned procedure occurred in a hospitalization with a nonacute principal diagnosis.16 Independent variables included age and comorbidities in the final hospital-wide readmission models for each of the 5 specialty cohorts.15 In order to produce the best possible individual risk prediction for each patient, we added additional independent variables that CMS avoids for hospital quality measurement purposes but that contribute to risk of readmission: sex, race, dual eligibility status, number of prior AMA discharges, intensive care unit stay during current hospitalization, coronary care unit stay during current hospitalization, and hospitalization in the prior 30, 90, and 180 days. We also included an indicator variable for hospitalizations with more than 9 discharge diagnosis codes on or after January 2011, the time at which Medicare allowed an increase of the number of International Classification of Diseases, 9th Revision-Clinical Modification diagnosis billing codes from 9 to 25.17 This indicator adjusts for the increased availability of comorbidity codes, which might otherwise inflate the predicted risk relative to hospitalizations prior to that date.
Based on the risk models, each hospitalization was assigned a predicted risk of readmission. For each specialty cohort, we pooled all hospitalizations across all study years and divided them into risk quintiles. We categorized hospitalizations as high risk if in the highest quintile, medium risk if in the middle 3 quintiles, and low risk if in the lowest quintile of predicted risk for all study hospitalizations in a given specialty cohort.
For our time trend analyses, we studied 2 outcomes: monthly mean predicted risk and monthly ratio of observed readmissions to expected readmissions for patients in the lowest, middle, and highest categories of predicted risk of readmission. We studied monthly predicted risk to determine whether the average readmission risk of patients was changing over time as admission and readmission rates were declining. We studied the ratio of O/E readmissions to determine whether the decline in overall readmissions was more substantial in particular risk strata; we used the ratio of O/E readmissions, which measures number of readmissions divided by number of readmissions predicted by the model, rather than crude observed readmissions, as O/E readmissions account for any changes in risk profiles over time within each risk stratum. Independent variables in our trend analyses were year—entered as a continuous variable—and indicators for postintroduction of the Affordable Care Act (ACA, March 2010) and for postintroduction of HRRP (October 2012); these time indicators were included because of prior studies demonstrating that the introduction of ACA was associated with a decrease from baseline in readmission rates, which leveled off after introduction of HRRP.7 We also included an indicator for calendar quarter to account for seasonal effects.
Statistical Analysis
We developed generalized estimating equation models to predict 30-day unplanned readmission for each of the 5 specialty cohorts. The 5 models were fit using all patients in each cohort for the included time period and were adjusted for clustering by hospital. We assessed discrimination by calculating area under the receiver operating characteristic curve (AUC) for the 5 models; the AUCs measured the models’ ability to distinguish patients who were readmitted versus those who were not.18 We also calculated AUCs for each year to examine model performance over time.
Using these models, we calculated predicted risk for each hospitalization and averaged these to obtain mean predicted risk for each specialty cohort for each month. To test for trends in mean risk, we estimated 5 time series models, one for each cohort, with the dependent variable of monthly mean predicted risk. For each cohort, we first estimated a series of 12 empty autoregressive models, each with a different autoregressive term (1, 2...12). For each model, we calculated χ2 for the test that the autocorrelation was 0; based on a comparison of chi-squared values, we specified an autocorrelation of 1 month for all models. Accordingly, a 1-month lag was used to estimate one final model for each cohort. Independent variables included year and indicators for post-ACA and post-HRRP; these variables captured the effect of trends over time and the introduction of these policy changes, respectively.19
To determine whether changes in risk over time were a result of changes in particular risk groups, we categorized hospitalizations into risk strata based on quintiles of predicted risk for each specialty cohort for the entire study period. For each individual year, we calculated the proportion of hospitalizations in the highest, middle, and lowest readmission risk strata for each cohort.
We calculated the monthly ratio of O/E readmission for hospitalizations in the lowest 20%, middle 60%, and highest 20% of readmission risk by month; O/E reflects the excess or deficit observed events relative to the number predicted by the model. Using this monthly O/E as the dependent variable, we developed autoregressive time series models as above, again with a 1-month lag, for each of these 3 risk strata in each cohort. As before, independent variables were year as a continuous variable, indicator variables for post-ACA and post-HRRP, and a categorical variable for calendar quarter.
All analyses were done in SAS version 9.3 (SAS Institute Inc., Cary, NC) and Stata version 14.2 (StataCorp LLC, College Station, TX).
RESULTS
We included 47,288,961 hospitalizations in the study, of which 11,231,242 (23.8%) were in the surgery/gynecology cohort, 19,548,711 (41.3%) were in the medicine cohort, 5,433,125 (11.5%) were in the cardiovascular cohort, 8,179,691 (17.3%) were in the cardiorespiratory cohort, and 2,896,192 (6.1%) were in the neurology cohort. The readmission rate was 16.2% (n = 7,642,161) overall, with the highest rates observed in the cardiorespiratory (20.5%) and medicine (17.6%) cohorts and the lowest rates observed in the surgery/gynecology (11.8%) and neurology (13.8%) cohorts.
The final predictive models for each cohort ranged in number of parameters from 56 for the cardiorespiratory cohort to 264 for the surgery/gynecology cohort. The models had AUCs of 0.70, 0.65, 0.67, 0.65, and 0.63 for the surgery/gynecology, medicine, cardiovascular, cardiorespiratory, and neurology cohorts, respectively; AUCs remained fairly stable over time for all disease cohorts (Appendix Table 1).
DISCUSSION
A number of mechanisms may account for the across-the-board improvements in readmission reduction. Many hospitals have instituted system-wide interventions, including patient education, medicine reconciliation, and early postdischarge follow-up,20 which may have reduced readmissions across all patient risk strata. Alternatively, hospitals may have implemented interventions that disproportionally benefited low-risk patients while simultaneously utilizing interventions that only benefited high-risk patients. For instance, increasing threshold for admission7 may have the greatest effect on low-risk patients who could be most easily managed at home, while many intensive transitional care interventions have been developed to target only high-risk patients.21,22
With the introduction of HRRP, there have been a number of concerns about the readmission measure used to penalize hospitals for high readmission rates. One major concern has been that the readmission metric may be flawed in its ability to capture continued improvement related to readmission.23 Some have suggested that with better population health management, admissions will decrease, patient risk of the remaining patients will increase, and hospitals will be increasingly filled with patients who have high likelihood of readmission. This potential for increased risk with HRRP was suggested by a recent study that found that comorbidities increased in hospitalized Medicare beneficiaries between 2010 and 2013.11 Our results were mixed in supporting this potential phenomenon because we examined global risk of readmission and found that some of the cohorts had increased risk over time while others did not. Others have expressed concern that readmission measure does not account for socioeconomic status, which has been associated with readmission rates.24-27 Although we did not directly examine socioeconomic status in our study, we found that hospitals have been able to reduce readmission across all levels of risk, which includes markers of socioeconomic status, including race and Medicaid eligibility status.
Although we hypothesized that readmission risk would increase as number of hospitalizations decreased over time, we found no increase in readmission risk among the cohorts with HRRP diagnoses that had the largest decrease in readmission rates.7,8 Conversely, readmission risk did increase—with a concurrent increase in the proportion of high-risk hospitalizations—in the surgery/gynecology and neurology cohorts that were not subject to HRRP penalties. Nonetheless, rehospitalizations were reduced for all risk categories in these 2 cohorts. Notably, surgery/gynecology and neurology had the lowest readmission rates overall. These findings suggest that initiatives to prevent initial hospitalizations, such as increasing the threshold for postoperative admission, may have had a greater effect on low- versus high-risk patients in low-risk hospitalizations. However, once a patient is hospitalized, multidisciplinary strategies appear to be effective at reducing readmissions for all risk classes in these cohorts.
For the 3 cohorts in which we observed an increase in readmission risk among hospitalized patients, the risk appeared to increase in early 2011. This time was about 10 months after passage of ACA, the timing of which was previously associated with a drop in readmission rates,7,8 but well before HRRP went into effect in October 2012. The increase in readmission risk coincided with an increase in the number of diagnostic codes that could be included on a hospital claim to Medicare.17 This increase in allowable codes allowed us to capture more diagnoses for some patients, potentially resulting in an increase in apparent predicted risk of readmissions. While we adjusted for this in our predictive models, we may not have fully accounted for differences in risk related to coding change. As a result, some of the observed differences in risk in our study may be attributable to coding differences. More broadly, studies demonstrating the success of HRRP have typically examined risk-adjusted rates of readmission.3,7 It is possible that a small portion of the observed reduction in risk-adjusted readmission rates may be related to the increase in predicted risk of readmission observed in our study. Future assessment of trends in readmission during this period should consider accounting for change in the number of allowed billing codes.
Other limitations should be considered in the interpretation of this study. First, like many predictive models for readmission,14 ours had imperfect discrimination, which could affect our results. Second, our study was based on older Medicare patients, so findings may not be applicable to younger patients. Third, while we accounted for surrogates for socioeconomic status, including dual eligibility and race, our models lacked other socioeconomic and community factors that can influence readmission.24-26 Nonetheless, 1 study suggested that easily measured socioeconomic factors may not have a strong influence on the readmission metric used by Medicare.28 Fourth, while our study included over 47 million hospitalizations, our time trend analyses used calendar month as the primary independent variable. As our study included 77 months, we may not have had sufficient power to detect small changes in risk over time.
Medicare readmissions have declined steadily in recent years, presumably at least partly in response to policy changes including HRRP. We found that hospitals have been effective at reducing readmissions across a range of patient risk strata and clinical conditions. As a result, the overall risk of readmission for hospitalized patients has remained constant for some but not all conditions. Whether institutions can continue to reduce readmission rates for most types of patients remains to be seen.
Acknowledgments
This study was supported by the Agency for Healthcare Research and Quality (AHRQ) grant R01HS022882. Dr. Blecker was supported by the AHRQ grant K08HS23683. The authors would like to thank Shawn Hoke and Jane Padikkala for administrative support.
Disclosure
This study was supported by the Agency for Healthcare Research and Quality (AHRQ) grants R01HS022882 and K08HS23683. The authors have no conflicts to report.
1. Jha AK. Seeking Rational Approaches to Fixing Hospital Readmissions. JAMA. 2015;314(16):1681-1682. PubMed
2. Centers for Medicare & Medicaid Services. Readmissions Reduction Program. https://www.cms.gov/Medicare/Medicare-Fee-for-Service-Payment/AcuteInpatientPPS/Readmissions-Reduction-Program.html. Accessed on January 17, 2017.
3. Suter LG, Li SX, Grady JN, et al. National patterns of risk-standardized mortality and readmission after hospitalization for acute myocardial infarction, heart failure, and pneumonia: update on publicly reported outcomes measures based on the 2013 release. J Gen Intern Med. 2014;29(10):1333-1340. PubMed
4. Gerhardt G, Yemane A, Hickman P, Oelschlaeger A, Rollins E, Brennan N. Medicare readmission rates showed meaningful decline in 2012. Medicare Medicaid Res Rev. 2013;3(2):pii:mmrr.003.02.b01. PubMed
5. Centers for Medicare and Medicaid Services. New Data Shows Affordable Care Act Reforms Are Leading to Lower Hospital Readmission Rates for Medicare Beneficiaries. http://blog.cms.gov/2013/12/06/new-data-shows-affordable-care-act-reforms-are-leading-to-lower-hospital-readmission-rates-for-medicare-beneficiaries/. Accessed on January 17, 2017.
6. Krumholz HM, Normand SL, Wang Y. Trends in hospitalizations and outcomes for acute cardiovascular disease and stroke, 1999-2011. Circulation. 2014;130(12):966-975. PubMed
7. Zuckerman RB, Sheingold SH, Orav EJ, Ruhter J, Epstein AM. Readmissions, Observation, and the Hospital Readmissions Reduction Program. N Engl J Med. 2016;374(16):1543-1551. PubMed
8. Desai NR, Ross JS, Kwon JY, et al. Association Between Hospital Penalty Status Under the Hospital Readmission Reduction Program and Readmission Rates for Target and Nontarget Conditions. JAMA. 2016;316(24):2647-2656. PubMed
9. Brock J, Mitchell J, Irby K, et al. Association between quality improvement for care transitions in communities and rehospitalizations among Medicare beneficiaries. JAMA. 2013;309(4):381-391. PubMed
10. Jencks S. Protecting Hospitals That Improve Population Health. http://medicaring.org/2014/12/16/protecting-hospitals/. Accessed on January 5, 2017.
11. Dharmarajan K, Qin L, Lin Z, et al. Declining Admission Rates And Thirty-Day Readmission Rates Positively Associated Even Though Patients Grew Sicker Over Time. Health Aff (Millwood). 2016;35(7):1294-1302. PubMed
12. Krumholz HM, Nuti SV, Downing NS, Normand SL, Wang Y. Mortality, Hospitalizations, and Expenditures for the Medicare Population Aged 65 Years or Older, 1999-2013. JAMA. 2015;314(4):355-365. PubMed
13. Amarasingham R, Moore BJ, Tabak YP, et al. An automated model to identify heart failure patients at risk for 30-day readmission or death using electronic medical record data. Med Care. 2010;48(11):981-988. PubMed
14. Kansagara D, Englander H, Salanitro A, et al. Risk prediction models for hospital readmission: a systematic review. JAMA. 2011;306(15):1688-1698. PubMed
15. Horwitz LI, Partovian C, Lin Z, et al. Development and use of an administrative claims measure for profiling hospital-wide performance on 30-day unplanned readmission. Ann Intern Med. 2014;161(10 Suppl):S66-S75. PubMed
16. 2016 Condition-Specific Measures Updates and Specifications Report Hospital-Level 30-Day Risk-Standardized Readmission Measures. https://www.cms.gov/Medicare/Quality-Initiatives-Patient-Assessment-Instruments/HospitalQualityInits/Downloads/AMI-HF-PN-COPD-and-Stroke-Readmission-Updates.zip. Accessed on January 19, 2017.
17. Centers for Medicare & Medicaid Services. Pub 100-04 Medicare Claims Processing, Transmittal 2028. https://www.cms.gov/Regulations-and-Guidance/Guidance/Transmittals/downloads/R2028CP.pdf. Accessed on November 28, 2016.
18. Martens FK, Tonk EC, Kers JG, Janssens AC. Small improvement in the area under the receiver operating characteristic curve indicated small changes in predicted risks. J Clin Epidemiol. 2016;79:159-164. PubMed
19. Blecker S, Goldfeld K, Park H, et al. Impact of an Intervention to Improve Weekend Hospital Care at an Academic Medical Center: An Observational Study. J Gen Intern Med. 2015;30(11):1657-1664. PubMed
20. Hansen LO, Young RS, Hinami K, Leung A, Williams MV. Interventions to reduce 30-day rehospitalization: a systematic review. Ann Intern Med. 2011;155(8):520-528. PubMed
21. Cavanaugh JJ, Jones CD, Embree G, et al. Implementation Science Workshop: primary care-based multidisciplinary readmission prevention program. J Gen Intern Med. 2014;29(5):798-804. PubMed
22. Jenq GY, Doyle MM, Belton BM, Herrin J, Horwitz LI. Quasi-Experimental Evaluation of the Effectiveness of a Large-Scale Readmission Reduction Program. JAMA Intern Med. 2016;176(5):681-690. PubMed
23. Lynn J, Jencks S. A Dangerous Malfunction in the Measure of Readmission Reduction. http://medicaring.org/2014/08/26/malfunctioning-metrics/. Accessed on January 17, 2017.
24. Calvillo-King L, Arnold D, Eubank KJ, et al. Impact of social factors on risk of readmission or mortality in pneumonia and heart failure: systematic review. J Gen Intern Med. 2013;28(2):269-282. PubMed
25. Barnett ML, Hsu J, McWilliams JM. Patient Characteristics and Differences in Hospital Readmission Rates. JAMA Intern Med. 2015;175(11):1803-1812. PubMed
26. Singh S, Lin YL, Kuo YF, Nattinger AB, Goodwin JS. Variation in the risk of readmission among hospitals: the relative contribution of patient, hospital and inpatient provider characteristics. J Gen Intern Med. 2014;29(4):572-578. PubMed
27. American Hospital Association. American Hospital Association (AHA) Detailed Comments on the Inpatient Prospective Payment System (PPS) Proposed Rule for Fiscal Year (FY) 2016. http://www.aha.org/advocacy-issues/letter/2015/150616-cl-cms1632-p-ipps.pdf. Accessed on January 10, 2017.
28. Bernheim SM, Parzynski CS, Horwitz L, et al. Accounting For Patients’ Socioeconomic Status Does Not Change Hospital Readmission Rates. Health Aff (Millwood). 2016;35(8):1461-1470. PubMed
© 2018 Society of Hospital Medicine
The Design and Evaluation of the Comprehensive Hospitalist Assessment and Mentorship with Portfolios (CHAMP) Ultrasound Program
Point-of-care ultrasound (POCUS) is a valuable tool to assist in the diagnosis and treatment of many common diseases.1-11 Its use has increased in clinical settings over the years, primarily because of more portable, economical, high-quality devices and training availability.12 POCUS improves procedural success and guides the diagnostic management of hospitalized patients.2,9-12 Literature details the training of medical students,13,14 residents,15-21 and providers in emergency medicine22 and critical care,23,24 as well as focused cardiac training with hospitalists.25-27 However, no literature exists describing a comprehensive longitudinal training program for hospitalists or skills retention.
This document details the hospital medicine department’s ultrasound training program from Regions Hospital, part of HealthPartners in Saint Paul, Minnesota, a large tertiary care medical center. We describe the development and effectiveness of the Comprehensive Hospitalist Assessment and Mentorship with Portfolios (CHAMP) Ultrasound Program. This approach is intended to support the development of POCUS training programs at other organizations.
The aim of the program was to build a comprehensive bedside ultrasound training paradigm for hospitalists. The primary objective of the study was to assess the program’s effect on skills over time. Secondary objectives were confidence ratings in the use of ultrasound and with various patient care realms (volume management, quality of physical exam, and ability to narrow the differential diagnosis). We hypothesized there would be higher retention of ultrasound skills in those who completed portfolios and/or monthly scanning sessions as well as increased confidence through all secondary outcome measures (see below).
MATERIALS AND METHODS
This was a retrospective descriptive report of hospitalists who entered the CHAMP Ultrasound Program. Study participants were providers from the 454-bed Regions Hospital in Saint Paul, Minnesota. The study was deemed exempt by the HealthPartners Institutional Review Board. Three discrete 3-day courses and two 1-day in-person courses held at the Regions Hospital Simulation Center (Saint Paul, Minnesota) were studied.
Program Description
In 2014, a working group was developed in the hospital medicine department to support the hospital-wide POCUS committee with a charter to provide standardized training for providers to complete credentialing.28 The goal of the hospital medicine ultrasound program was to establish the use of ultrasound by credentialed hospitalists into well-defined applications integrated into the practice of hospital medicine. Two providers were selected to lead the efforts and completed additional training through the American College of Chest Physicians (CHEST) Certificate of Completion Program.29 An overall director was designated with the responsibilities delineated in supplementary Appendix 1. This director provided leadership on group practice, protocols, and equipment, creating the organizational framework for success with the training program. The hospital medicine training program had a 3-day in-person component built off the CHEST Critical Care Ultrasonography Program.24 The curriculum was adapted from the American College of Chest Physicians/Société de Réanimation de Langue Française Statement on Competence in Critical Care Ultrasonography.30 See Table 1 for the components of the training program.

Online Modules
3-Day In-Person Course with Assessments
The 3-day course provided 6 hours of didactics, 8 hours of image interpretation, and 9 hours of hands-on instruction (supplementary Appendix 4). Hospitalists first attended a large group didactic, followed by divided groups in image interpretation and hands-on scanning.24
Didactics were provided in a room with a 2-screen set up. Providers used 1 screen to present primary content and the other for simultaneously scanning a human model.
Image interpretation sessions were interactive smaller group learning forums in which participants reviewed high-yield images related to the care of hospital medicine patients and received feedback. Approximately 45 videos with normal and abnormal findings were reviewed during each session.
The hands-on scanning component was accomplished with human models and a faculty-to-participant ratio between 1:2 and
Portfolios
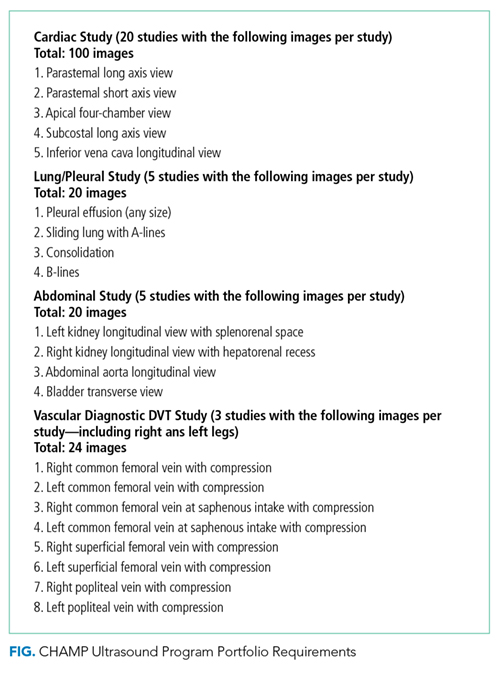
Refresher Training: 1-Day In-Person Course with Assessments and Monthly Scanning Sessions (Optional)
Only hospitalists who completed the 3-day course were eligible to take the 1-day in-person refresher course (supplementary Appendix 5). The first half of the course incorporated scanning with live human models, while the second half of the course had scanning with hospitalized patients focusing on pathology (pleural effusion, hydronephrosis, reduced left ventricular function, etc.). The course was offered at 3, 6, and 12 months after the initial 3-day course.
Monthly scanning sessions occurred for 2 hours every third Friday and were also available prior to the 1-day refresher. The first 90 minutes had a hands-on scanning component with hospitalized patients with faculty supervision (1:2 ratio). The last 30 minutes had an image interpretation component.
Assessments
Knowledge and skills assessment were adapted from the CHEST model (supplementary Appendix 6).24 Before and after the 3-day and 1-day in-person courses, the same hands-on skills assessment with a checklist was provided (supplementary Appendix 7). Before and after the 3-day course, a written knowledge assessment with case-based image interpretation was provided (supplementary Appendix 6).
Measurement
Participant demographic and clinical information was collected at the initial 3-day course for all participants, including age, gender, specialty, years of experience, and number and type of ultrasound procedures personally conducted or supervised in the past year. For skills assessment, a 20-item dichotomous checklist was developed and scored as done correctly or not done/done incorrectly. This same assessment was provided both before and after each of the 3-day and 1-day courses. A 20-question image-based knowledge assessment was also developed and administered both before and after the 3-day course only. The same 20-item checklist was used for the final skills examination. However, a new more detailed 50-question examination was written for the final examination after the portfolio of images was complete. Self-reported measures were confidence in the use of ultrasound, volume management, quality of physical exam, and ability to narrow the differential diagnosis. Confidence in ultrasound use, confidence in volume management, and quality of physical exam were assessed by using a questionnaire both before and after the 3-day course and 1-day course. Participants rated confidence and quality on a 5-point scale, 1 being least confident and 5 being most confident.
Statistical Analysis
Demographics of the included hospitalist population and pre and post 3-day assessments, including knowledge score, skills score, confidence in ultrasound use, confidence in volume management, and quality of physical exam, were summarized. Values for all assessment variables are presented as percentages. Confidence scores were reported as a percentage of the Likert scale (eg, 4/5 was reported as 80%). Skills and written examinations were expressed as percentages of items correct. Data were reported as median and interquartile range or means and standard deviation based on variable distributions. Differences between pre- and postvalues for 3-day course variables were assessed by using 2-sample paired Wilcoxon signed rank tests with a 95% confidence level.
For the subset of hospitalists who also completed the 1-day course, pre and post 1-day course assessments, including skills score, confidence in ultrasound use, confidence in volume management, and quality of physical exam, were summarized. Differences between pre- and postvalues for 1-day assessment variables were assessed by using 2-sample paired Wilcoxon signed rank tests with a 95% confidence level.
Multiple linear regression was performed with the change in skills assessment score from postcompletion of the 3-day course to precompletion of the 1-day course as the dependent variable. Hospitalists were split into 2 age groups (30-39 and 40-49) for the purpose of this analysis. The percent of monthly scanning sessions attended, age category, timing of 1-day course, and percent portfolio were assessed as possible predictors of the skills score by using simple linear regression with a P = .05 cutoff. A final model was chosen based on predictors significant in simple linear regression and included the percent of the portfolio completed and attendance of monthly scanning sessions.
RESULTS
Demographics
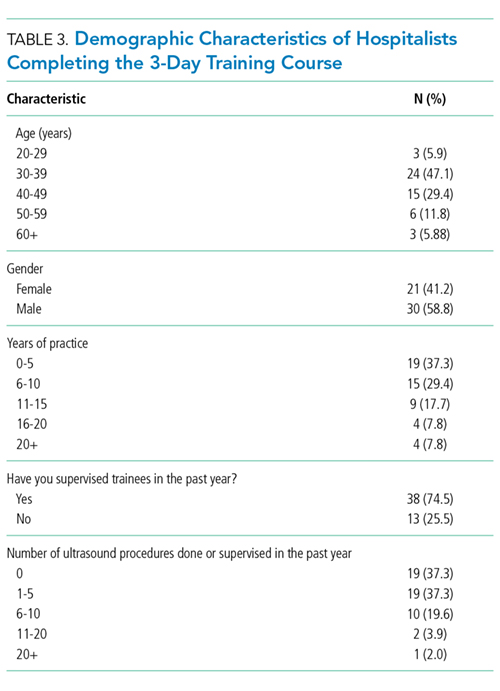
3-Day In-Person Course
For the 53 hospitalists who completed skills-based assessments, performance increased significantly after the 3-day course. Knowledge scores also increased significantly from preassessment to postassessment. Self-reported confidence ratings for ultrasound use, confidence in volume management, and quality of physical exam all increased significantly from preassessment to postassessment (Table 2).
Refresher Training: 1-Day In-Person Course
Because the refresher training was encouraged but not required, only 25 of 53 hospitalists, 23 with complete data, completed the 1-day course. For the 23 hospitalists who completed skills-based assessments before and after the 1-day course, mean skills scores increased significantly (Table 2). Self-reported confidence ratings for ultrasound use, confidence in volume management, and quality of physical exam all increased significantly from preassessment to postassessment (Table 2).
Monthly Scanning Sessions and Portfolio Development
The skills retention from initial course to refresher course by portfolio completion and monthly scanning sessions is shown in Table 2. Multiple regression analysis showed that for every 10% increase in the percent of monthly sessions attended, the mean change in skills score was 3.7% (P = .017), and for every 10% increase in the percent of portfolio completed, the mean change in skills score was 2.5% (P = .04), showing that both monthly scanning session attendance and portfolio completion are significantly predictive of skills retention over time.
Final Assessments
DISCUSSION
This is the first description of a successful longitudinal training program with assessments in POCUS for hospital medicine providers that shows an increase in skill retention with the use of a follow-up course and bedside scanning.
The CHAMP Ultrasound Program was developed to provide hospital medicine clinicians with a specialty focused in-house training pathway in POCUS and to assist in sustained skills acquisition by providing opportunities for regular feedback and practice. Practice with regular expert feedback is a critical aspect to develop and maintain skills in POCUS.32,33 Arntfield34 described the utility of remote supervision with feedback for ultrasound training in critical care, which demonstrated varying learning curves in the submission of portfolio images.35,36 The CHAMP Ultrasound training program provided expert oversight, longitudinal supervision, and feedback for course participants. The educational method of mastery learning was employed by setting minimum standards and allowing learners to practice until they met that standard.37-39
This unique program is made possible by the availability of expert-level faculty. Assessment scores improved with an initial 3-day course; however, they also decayed over time, most prominently with hospitalists that did not continue with POCUS scanning after their initial course. Ironically, those who performed more ultrasounds in the year prior to beginning the 3-day course had lower confidence ratings, likely explained by their awareness of their limitations and opportunities for improvement. The incorporation of refresher training to supplement the core 3-day course and portfolio development are key additions that differentiate this training program. These additions and the demonstration of successful training make this a durable pathway for other hospitalist programs. There are many workshops and short courses for medical students, residents, and practicing providers in POCUS.40-43 However, without an opportunity for longitudinal supervision and feedback, there is a noted decrease in the skills for participants. The refresher training with its 2 components (1-day in-person course and monthly scanning sessions) provides evidence of the value of mentored training.
In the initial program development, refresher training was encouraged but optional. We intentionally tracked those that completed refresher training compared with those that did not. Based on the results showing significant skills retention among those attending some form of refresher training, the program is planned to change to make this a requirement. We recommend refresher training within 12 months of the initial introductory course. There were several hospitalists that were unable to accommodate taking a full-day refresher course and, therefore, monthly scanning sessions were provided as an alternative.
The main limitation of the study is that it was completed in a single hospital system with available training mentors in POCUS. This gave us the ability to perform longitudinal training but may make this less reproducible in other hospital systems. Another limitation is that our course participants did not complete the pre- and postknowledge assessments for the refresher training components of the program, though they did for the initial 3-day course. Our pre- and postassessments have not been externally shown to produce valid data, though they are based on the already validated CHEST ultrasound data.44
Finally, our CHAMP Ultrasound Program required a significant time commitment by both faculty and learners. A relatively small percentage of hospitalists have completed the final assessments. The reasons are multifactorial, including program rigor, desire by certain hospitalists to know the basics but not pursue more expertise, and the challenges of developing a skillset that takes dedicated practice over time. We have aimed to address these barriers by providing additional hands-on scanning opportunities, giving timely feedback with portfolios, and obtaining more ultrasound machines. We expect more hospitalists to complete the final assessments in the coming year as evidenced by portfolio submissions to the shared online portal and many choosing to attend either the monthly scanning sessions and/or the 1-day course. We recognize that other institutions may need to adapt our program to suit their local environment.
CONCLUSION
A comprehensive longitudinal ultrasound training program including competency assessments significantly improved ultrasound acquisition skills with hospitalists. Those attending monthly scanning sessions and participating in the portfolio completion as well as a refresher course significantly retained and augmented their skills.
Acknowledgments
The authors would like to acknowledge Kelly Logue, Jason Robertson, MD, Jerome Siy, MD, Shauna Baer, and Jack Dressen for their support in the development and implementation of the POCUS program in hospital medicine.
Disclosure
The authors do not have any relevant financial disclosures to report.
1. Spevack R, Al Shukairi M, Jayaraman D, Dankoff J, Rudski L, Lipes J. Serial lung and IVC ultrasound in the assessment of congestive heart failure. Crit Ultrasound J. 2017;9:7-13. PubMed
2. Soni NJ, Franco R, Velez M, et al. Ultrasound in the diagnosis and management of pleural effusions. J Hosp Med. 2015 Dec;10(12):811-816. PubMed
3. Boyd JH, Sirounis D, Maizel J, Slama M. Echocardiography as a guide for fluid management. Crit Care. 2016;20(1):274-280. PubMed
4. Mantuani D, Frazee BW, Fahimi J, Nagdev A. Point-of-care multi-organ ultrasound improves diagnostic accuracy in adults presenting to the emergency department with acute dyspnea. West J Emerg Med. 2016;17(1):46-53. PubMed
5. Glockner E, Christ M, Geier F, et al. Accuracy of Point-of-Care B-Line Lung Ultrasound in Comparison to NT-ProBNP for Screening Acute Heart Failure. Ultrasound Int Open. 2016;2(3):E90-E92. PubMed
6. Bhagra A, Tierney DM, Sekiguchi H, Soni NH. Point-of-Care Ultrasonography for Primary Care Physicians and General Internists. Mayo Clin Proc. 2016 Dec;91(12):1811-1827. PubMed
7. Crisp JG, Lovato LM, Jang TB. Compression ultrasonography of the lower extremity with portable vascular ultrasonography can accurately detect deep venous thrombosis in the emergency department. Ann Emerg Med. 2010;56(6):601-610. PubMed
8. Squire BT, Fox JC, Anderson C. ABSCESS: Applied bedside sonography for convenient. Evaluation of superficial soft tissue infections. Acad Emerg Med. 2005;12(7):601-606. PubMed
9. Narasimhan M, Koenig SJ, Mayo PH. A Whole-Body Approach to Point of Care Ultrasound. Chest. 2016;150(4):772-776. PubMed
10. Copetti R, Soldati G, Copetti P. Chest sonography: a useful tool to differentiate acute cardiogenic pulmonary edema from acute respiratory distress syndrome. Cardiovasc Ultrasound. 2008;6:16-25. PubMed
11. Soni NJ, Arntfield R, Kory P. Point of Care Ultrasound. Philadelphia: Elsevier Saunders; 2015.
12. Moore CL, Copel JA. Point-of-Care Ultrasonography. N Engl J Med. 2011;364(8):749-757. PubMed
13. Rempell JS, Saldana F, DiSalvo D, et al. Pilot Point-of-Care Ultrasound Curriculum at Harvard Medical School: Early Experience. West J Emerg Med. 2016;17(6):734-740. doi:10.5811/westjem.2016.8.31387. PubMed
14. Heiberg J, Hansen LS, Wemmelund K, et al. Point-of-Care Clinical Ultrasound for Medical Students. Ultrasound Int Open. 2015;1(2):E58-E66. doi:10.1055/s-0035-1565173. PubMed
15. Razi R, Estrada JR, Doll J, Spencer KT. Bedside hand-carried ultrasound by internal medicine residents versus traditional clinical assessment for the identification of systolic dysfunction in patients admitted with decompensated heart failure. J Am Soc Echocardiogr. 2011;24(12):1319-1324. PubMed
16. Alexander JH, Peterson ED, Chen AY, Harding TM, Adams DB, Kisslo JA Jr. Feasibility of point-of-care echocardiography by internal medicine house staff. Am Heart J. 2004;147(3):476-481. PubMed
17. Hellmann DB, Whiting-O’Keefe Q, Shapiro EP, Martin LD, Martire C, Ziegelstein RC. The rate at which residents learn to use hand-held echocardiography at the bedside. Am J Med. 2005;118(9):1010-1018. PubMed
18. Kimura BJ, Amundson SA, Phan JN, Agan DL, Shaw DJ. Observations during development of an internal medicine residency training program in cardiovascular limited ultrasound examination. J Hosp Med. 2012;7(7):537-542. PubMed
19. Akhtar S, Theodoro D, Gaspari R, et al. Resident training in emergency ultrasound: consensus recommendations from the 2008 Council of Emergency Medicine Residency Directors Conference. Acad Emerg Med. 2009;16(s2):S32-S36. PubMed
, , , , , . Can emergency medicine residents detect acute deep venous thrombosis with a limited, two-site ultrasound examination? J Emerg Med. 2007;32(2):197-200. PubMed
, , , . Resident-performed compression ultrasonography for the detection of proximal deep vein thrombosis: fast and accurate. Acad Emerg Med. 2004;11(3):319-322. PubMed
22. Mandavia D, Aragona J, Chan L, et al. Ultrasound training for emergency physicians—a prospective study. Acad Emerg Med. 2000;7(9):1008-1014. PubMed
23. Koenig SJ, Narasimhan M, Mayo PH. Thoracic ultrasonography for the pulmonary specialist. Chest. 2011;140(5):1332-1341. doi: 10.1378/chest.11-0348. PubMed
24. Greenstein YY, Littauer R, Narasimhan M, Mayo PH, Koenig SJ. Effectiveness of a Critical Care Ultrasonography Course. Chest. 2017;151(1):34-40. doi:10.1016/j.chest.2016.08.1465. PubMed
25. Martin LD, Howell EE, Ziegelstein RC, Martire C, Shapiro EP, Hellmann DB. Hospitalist performance of cardiac hand-carried ultrasound after focused training. Am J Med. 2007;120(11):1000-1004. PubMed
26. Martin LD, Howell EE, Ziegelstein RC, et al.
27. Lucas BP, Candotti C, Margeta B, et al. Diagnostic accuracy of hospitalist-performed hand-carried ultrasound echocardiography after a brief training program. J Hosp Med. 2009;4(6):340-349. PubMed
28.
29. Critical Care Ultrasonography Certificate of Completion Program. American College of Chest Physicians. http://www.chestnet.org/Education/Advanced-Clinical-Training/Certificate-of-Completion-Program/Critical-Care-Ultrasonography. Accessed March 30, 2017
30. Mayo PH, Beaulieu Y, Doelken P, et al. American College of Chest Physicians/Société de Réanimation de Langue Française statement on competence in critical care ultrasonography. Chest. 2009;135(4):1050-1060. PubMed
31. Donlon TF, Angoff WH. The scholastic aptitude test. The College Board Admissions Testing Program; 1971:15-47.
32. Ericsson KA, Lehmann AC. Expert and exceptional performance: Evidence of maximal adaptation to task constraints. Annu Rev Psychol. 1996;47:273-305. PubMed
33. Ericcson KA, Krampe RT, Tesch-Romer C. The role of deliberate practice in the acquisition of expert performance. Psychol Rev. 1993;100(3):363-406.
34. Arntfield RT. The utility of remote supervision with feedback as a method to deliver high-volume critical care ultrasound training. J Crit Care. 2015;30(2):441.e1-e6. PubMed
35. Ma OJ, Gaddis G, Norvell JG, Subramanian S. How fast is the focused assessment with sonography for trauma examination learning curve? Emerg Med Australas. 2008;20(1):32-37. PubMed
36. Gaspari RJ, Dickman E, Blehar D. Learning curve of bedside ultrasound of the gallbladder. J Emerg Med. 2009;37(1):51-66. doi:10.1016/j.jemermed.2007.10.070. PubMed
37. Barsuk JH, McGaghie WC, Cohen ER, Balachandran JS, Wane DB. Use of simulation-based mastery learning to improve quality of central venous catheter placement in a medical intensive care unit. J Hosp Med. 2009:4(7):397-403. PubMed
38. McGaghie WC, Issenberg SB, Cohen ER, Barsuk JH, Wayne DB. A critical review of simulation-based mastery learning with translational outcomes. Med Educ. 2014:48(4):375-385. PubMed
39. Guskey TR. The essential elements of mastery learning. J Classroom Interac. 1987;22:19-22.
40. Ultrasound Institute. Introduction to Primary Care Ultrasound. University of South Carolina School of Medicine. http://ultrasoundinstitute.med.sc.edu/UIcme.asp. Accessed October 24, 2017.
41. Society of Critical Care Medicine. Live Critical Care Ultrasound: Adult. http://www.sccm.org/Education-Center/Ultrasound/Pages/Fundamentals.aspx. Accessed October 24, 2017.
42. Castlefest Ultrasound Event. Castlefest 2018. http://castlefest2018.com/. Accessed October 24, 2017.
43. Office of Continuing Medical Education. Point of Care Ultrasound Workshop. UT Health San Antonio Joe R. & Teresa Lozano Long School of Medicine. http://cme.uthscsa.edu/ultrasound.asp. Accessed October 24, 2017.
44. Patrawalla P, Eisen LA, Shiloh A, et al. Development and Validation of an Assessment Tool for Competency in Critical Care Ultrasound. J Grad Med Educ. 2015;7(4):567-573. PubMed
Point-of-care ultrasound (POCUS) is a valuable tool to assist in the diagnosis and treatment of many common diseases.1-11 Its use has increased in clinical settings over the years, primarily because of more portable, economical, high-quality devices and training availability.12 POCUS improves procedural success and guides the diagnostic management of hospitalized patients.2,9-12 Literature details the training of medical students,13,14 residents,15-21 and providers in emergency medicine22 and critical care,23,24 as well as focused cardiac training with hospitalists.25-27 However, no literature exists describing a comprehensive longitudinal training program for hospitalists or skills retention.
This document details the hospital medicine department’s ultrasound training program from Regions Hospital, part of HealthPartners in Saint Paul, Minnesota, a large tertiary care medical center. We describe the development and effectiveness of the Comprehensive Hospitalist Assessment and Mentorship with Portfolios (CHAMP) Ultrasound Program. This approach is intended to support the development of POCUS training programs at other organizations.
The aim of the program was to build a comprehensive bedside ultrasound training paradigm for hospitalists. The primary objective of the study was to assess the program’s effect on skills over time. Secondary objectives were confidence ratings in the use of ultrasound and with various patient care realms (volume management, quality of physical exam, and ability to narrow the differential diagnosis). We hypothesized there would be higher retention of ultrasound skills in those who completed portfolios and/or monthly scanning sessions as well as increased confidence through all secondary outcome measures (see below).
MATERIALS AND METHODS
This was a retrospective descriptive report of hospitalists who entered the CHAMP Ultrasound Program. Study participants were providers from the 454-bed Regions Hospital in Saint Paul, Minnesota. The study was deemed exempt by the HealthPartners Institutional Review Board. Three discrete 3-day courses and two 1-day in-person courses held at the Regions Hospital Simulation Center (Saint Paul, Minnesota) were studied.
Program Description
In 2014, a working group was developed in the hospital medicine department to support the hospital-wide POCUS committee with a charter to provide standardized training for providers to complete credentialing.28 The goal of the hospital medicine ultrasound program was to establish the use of ultrasound by credentialed hospitalists into well-defined applications integrated into the practice of hospital medicine. Two providers were selected to lead the efforts and completed additional training through the American College of Chest Physicians (CHEST) Certificate of Completion Program.29 An overall director was designated with the responsibilities delineated in supplementary Appendix 1. This director provided leadership on group practice, protocols, and equipment, creating the organizational framework for success with the training program. The hospital medicine training program had a 3-day in-person component built off the CHEST Critical Care Ultrasonography Program.24 The curriculum was adapted from the American College of Chest Physicians/Société de Réanimation de Langue Française Statement on Competence in Critical Care Ultrasonography.30 See Table 1 for the components of the training program.
Online Modules
3-Day In-Person Course with Assessments
The 3-day course provided 6 hours of didactics, 8 hours of image interpretation, and 9 hours of hands-on instruction (supplementary Appendix 4). Hospitalists first attended a large group didactic, followed by divided groups in image interpretation and hands-on scanning.24
Didactics were provided in a room with a 2-screen set up. Providers used 1 screen to present primary content and the other for simultaneously scanning a human model.
Image interpretation sessions were interactive smaller group learning forums in which participants reviewed high-yield images related to the care of hospital medicine patients and received feedback. Approximately 45 videos with normal and abnormal findings were reviewed during each session.
The hands-on scanning component was accomplished with human models and a faculty-to-participant ratio between 1:2 and
Portfolios
Refresher Training: 1-Day In-Person Course with Assessments and Monthly Scanning Sessions (Optional)
Only hospitalists who completed the 3-day course were eligible to take the 1-day in-person refresher course (supplementary Appendix 5). The first half of the course incorporated scanning with live human models, while the second half of the course had scanning with hospitalized patients focusing on pathology (pleural effusion, hydronephrosis, reduced left ventricular function, etc.). The course was offered at 3, 6, and 12 months after the initial 3-day course.
Monthly scanning sessions occurred for 2 hours every third Friday and were also available prior to the 1-day refresher. The first 90 minutes had a hands-on scanning component with hospitalized patients with faculty supervision (1:2 ratio). The last 30 minutes had an image interpretation component.
Assessments
Knowledge and skills assessment were adapted from the CHEST model (supplementary Appendix 6).24 Before and after the 3-day and 1-day in-person courses, the same hands-on skills assessment with a checklist was provided (supplementary Appendix 7). Before and after the 3-day course, a written knowledge assessment with case-based image interpretation was provided (supplementary Appendix 6).
Measurement
Participant demographic and clinical information was collected at the initial 3-day course for all participants, including age, gender, specialty, years of experience, and number and type of ultrasound procedures personally conducted or supervised in the past year. For skills assessment, a 20-item dichotomous checklist was developed and scored as done correctly or not done/done incorrectly. This same assessment was provided both before and after each of the 3-day and 1-day courses. A 20-question image-based knowledge assessment was also developed and administered both before and after the 3-day course only. The same 20-item checklist was used for the final skills examination. However, a new more detailed 50-question examination was written for the final examination after the portfolio of images was complete. Self-reported measures were confidence in the use of ultrasound, volume management, quality of physical exam, and ability to narrow the differential diagnosis. Confidence in ultrasound use, confidence in volume management, and quality of physical exam were assessed by using a questionnaire both before and after the 3-day course and 1-day course. Participants rated confidence and quality on a 5-point scale, 1 being least confident and 5 being most confident.
Statistical Analysis
Demographics of the included hospitalist population and pre and post 3-day assessments, including knowledge score, skills score, confidence in ultrasound use, confidence in volume management, and quality of physical exam, were summarized. Values for all assessment variables are presented as percentages. Confidence scores were reported as a percentage of the Likert scale (eg, 4/5 was reported as 80%). Skills and written examinations were expressed as percentages of items correct. Data were reported as median and interquartile range or means and standard deviation based on variable distributions. Differences between pre- and postvalues for 3-day course variables were assessed by using 2-sample paired Wilcoxon signed rank tests with a 95% confidence level.
For the subset of hospitalists who also completed the 1-day course, pre and post 1-day course assessments, including skills score, confidence in ultrasound use, confidence in volume management, and quality of physical exam, were summarized. Differences between pre- and postvalues for 1-day assessment variables were assessed by using 2-sample paired Wilcoxon signed rank tests with a 95% confidence level.
Multiple linear regression was performed with the change in skills assessment score from postcompletion of the 3-day course to precompletion of the 1-day course as the dependent variable. Hospitalists were split into 2 age groups (30-39 and 40-49) for the purpose of this analysis. The percent of monthly scanning sessions attended, age category, timing of 1-day course, and percent portfolio were assessed as possible predictors of the skills score by using simple linear regression with a P = .05 cutoff. A final model was chosen based on predictors significant in simple linear regression and included the percent of the portfolio completed and attendance of monthly scanning sessions.
RESULTS
Demographics
3-Day In-Person Course
For the 53 hospitalists who completed skills-based assessments, performance increased significantly after the 3-day course. Knowledge scores also increased significantly from preassessment to postassessment. Self-reported confidence ratings for ultrasound use, confidence in volume management, and quality of physical exam all increased significantly from preassessment to postassessment (Table 2).
Refresher Training: 1-Day In-Person Course
Because the refresher training was encouraged but not required, only 25 of 53 hospitalists, 23 with complete data, completed the 1-day course. For the 23 hospitalists who completed skills-based assessments before and after the 1-day course, mean skills scores increased significantly (Table 2). Self-reported confidence ratings for ultrasound use, confidence in volume management, and quality of physical exam all increased significantly from preassessment to postassessment (Table 2).
Monthly Scanning Sessions and Portfolio Development
The skills retention from initial course to refresher course by portfolio completion and monthly scanning sessions is shown in Table 2. Multiple regression analysis showed that for every 10% increase in the percent of monthly sessions attended, the mean change in skills score was 3.7% (P = .017), and for every 10% increase in the percent of portfolio completed, the mean change in skills score was 2.5% (P = .04), showing that both monthly scanning session attendance and portfolio completion are significantly predictive of skills retention over time.
Final Assessments
DISCUSSION
This is the first description of a successful longitudinal training program with assessments in POCUS for hospital medicine providers that shows an increase in skill retention with the use of a follow-up course and bedside scanning.
The CHAMP Ultrasound Program was developed to provide hospital medicine clinicians with a specialty focused in-house training pathway in POCUS and to assist in sustained skills acquisition by providing opportunities for regular feedback and practice. Practice with regular expert feedback is a critical aspect to develop and maintain skills in POCUS.32,33 Arntfield34 described the utility of remote supervision with feedback for ultrasound training in critical care, which demonstrated varying learning curves in the submission of portfolio images.35,36 The CHAMP Ultrasound training program provided expert oversight, longitudinal supervision, and feedback for course participants. The educational method of mastery learning was employed by setting minimum standards and allowing learners to practice until they met that standard.37-39
This unique program is made possible by the availability of expert-level faculty. Assessment scores improved with an initial 3-day course; however, they also decayed over time, most prominently with hospitalists that did not continue with POCUS scanning after their initial course. Ironically, those who performed more ultrasounds in the year prior to beginning the 3-day course had lower confidence ratings, likely explained by their awareness of their limitations and opportunities for improvement. The incorporation of refresher training to supplement the core 3-day course and portfolio development are key additions that differentiate this training program. These additions and the demonstration of successful training make this a durable pathway for other hospitalist programs. There are many workshops and short courses for medical students, residents, and practicing providers in POCUS.40-43 However, without an opportunity for longitudinal supervision and feedback, there is a noted decrease in the skills for participants. The refresher training with its 2 components (1-day in-person course and monthly scanning sessions) provides evidence of the value of mentored training.
In the initial program development, refresher training was encouraged but optional. We intentionally tracked those that completed refresher training compared with those that did not. Based on the results showing significant skills retention among those attending some form of refresher training, the program is planned to change to make this a requirement. We recommend refresher training within 12 months of the initial introductory course. There were several hospitalists that were unable to accommodate taking a full-day refresher course and, therefore, monthly scanning sessions were provided as an alternative.
The main limitation of the study is that it was completed in a single hospital system with available training mentors in POCUS. This gave us the ability to perform longitudinal training but may make this less reproducible in other hospital systems. Another limitation is that our course participants did not complete the pre- and postknowledge assessments for the refresher training components of the program, though they did for the initial 3-day course. Our pre- and postassessments have not been externally shown to produce valid data, though they are based on the already validated CHEST ultrasound data.44
Finally, our CHAMP Ultrasound Program required a significant time commitment by both faculty and learners. A relatively small percentage of hospitalists have completed the final assessments. The reasons are multifactorial, including program rigor, desire by certain hospitalists to know the basics but not pursue more expertise, and the challenges of developing a skillset that takes dedicated practice over time. We have aimed to address these barriers by providing additional hands-on scanning opportunities, giving timely feedback with portfolios, and obtaining more ultrasound machines. We expect more hospitalists to complete the final assessments in the coming year as evidenced by portfolio submissions to the shared online portal and many choosing to attend either the monthly scanning sessions and/or the 1-day course. We recognize that other institutions may need to adapt our program to suit their local environment.
CONCLUSION
A comprehensive longitudinal ultrasound training program including competency assessments significantly improved ultrasound acquisition skills with hospitalists. Those attending monthly scanning sessions and participating in the portfolio completion as well as a refresher course significantly retained and augmented their skills.
Acknowledgments
The authors would like to acknowledge Kelly Logue, Jason Robertson, MD, Jerome Siy, MD, Shauna Baer, and Jack Dressen for their support in the development and implementation of the POCUS program in hospital medicine.
Disclosure
The authors do not have any relevant financial disclosures to report.
1. Spevack R, Al Shukairi M, Jayaraman D, Dankoff J, Rudski L, Lipes J. Serial lung and IVC ultrasound in the assessment of congestive heart failure. Crit Ultrasound J. 2017;9:7-13. PubMed
2. Soni NJ, Franco R, Velez M, et al. Ultrasound in the diagnosis and management of pleural effusions. J Hosp Med. 2015 Dec;10(12):811-816. PubMed
3. Boyd JH, Sirounis D, Maizel J, Slama M. Echocardiography as a guide for fluid management. Crit Care. 2016;20(1):274-280. PubMed
4. Mantuani D, Frazee BW, Fahimi J, Nagdev A. Point-of-care multi-organ ultrasound improves diagnostic accuracy in adults presenting to the emergency department with acute dyspnea. West J Emerg Med. 2016;17(1):46-53. PubMed
5. Glockner E, Christ M, Geier F, et al. Accuracy of Point-of-Care B-Line Lung Ultrasound in Comparison to NT-ProBNP for Screening Acute Heart Failure. Ultrasound Int Open. 2016;2(3):E90-E92. PubMed
6. Bhagra A, Tierney DM, Sekiguchi H, Soni NH. Point-of-Care Ultrasonography for Primary Care Physicians and General Internists. Mayo Clin Proc. 2016 Dec;91(12):1811-1827. PubMed
7. Crisp JG, Lovato LM, Jang TB. Compression ultrasonography of the lower extremity with portable vascular ultrasonography can accurately detect deep venous thrombosis in the emergency department. Ann Emerg Med. 2010;56(6):601-610. PubMed
8. Squire BT, Fox JC, Anderson C. ABSCESS: Applied bedside sonography for convenient. Evaluation of superficial soft tissue infections. Acad Emerg Med. 2005;12(7):601-606. PubMed
9. Narasimhan M, Koenig SJ, Mayo PH. A Whole-Body Approach to Point of Care Ultrasound. Chest. 2016;150(4):772-776. PubMed
10. Copetti R, Soldati G, Copetti P. Chest sonography: a useful tool to differentiate acute cardiogenic pulmonary edema from acute respiratory distress syndrome. Cardiovasc Ultrasound. 2008;6:16-25. PubMed
11. Soni NJ, Arntfield R, Kory P. Point of Care Ultrasound. Philadelphia: Elsevier Saunders; 2015.
12. Moore CL, Copel JA. Point-of-Care Ultrasonography. N Engl J Med. 2011;364(8):749-757. PubMed
13. Rempell JS, Saldana F, DiSalvo D, et al. Pilot Point-of-Care Ultrasound Curriculum at Harvard Medical School: Early Experience. West J Emerg Med. 2016;17(6):734-740. doi:10.5811/westjem.2016.8.31387. PubMed
14. Heiberg J, Hansen LS, Wemmelund K, et al. Point-of-Care Clinical Ultrasound for Medical Students. Ultrasound Int Open. 2015;1(2):E58-E66. doi:10.1055/s-0035-1565173. PubMed
15. Razi R, Estrada JR, Doll J, Spencer KT. Bedside hand-carried ultrasound by internal medicine residents versus traditional clinical assessment for the identification of systolic dysfunction in patients admitted with decompensated heart failure. J Am Soc Echocardiogr. 2011;24(12):1319-1324. PubMed
16. Alexander JH, Peterson ED, Chen AY, Harding TM, Adams DB, Kisslo JA Jr. Feasibility of point-of-care echocardiography by internal medicine house staff. Am Heart J. 2004;147(3):476-481. PubMed
17. Hellmann DB, Whiting-O’Keefe Q, Shapiro EP, Martin LD, Martire C, Ziegelstein RC. The rate at which residents learn to use hand-held echocardiography at the bedside. Am J Med. 2005;118(9):1010-1018. PubMed
18. Kimura BJ, Amundson SA, Phan JN, Agan DL, Shaw DJ. Observations during development of an internal medicine residency training program in cardiovascular limited ultrasound examination. J Hosp Med. 2012;7(7):537-542. PubMed
19. Akhtar S, Theodoro D, Gaspari R, et al. Resident training in emergency ultrasound: consensus recommendations from the 2008 Council of Emergency Medicine Residency Directors Conference. Acad Emerg Med. 2009;16(s2):S32-S36. PubMed
, , , , , . Can emergency medicine residents detect acute deep venous thrombosis with a limited, two-site ultrasound examination? J Emerg Med. 2007;32(2):197-200. PubMed
, , , . Resident-performed compression ultrasonography for the detection of proximal deep vein thrombosis: fast and accurate. Acad Emerg Med. 2004;11(3):319-322. PubMed
22. Mandavia D, Aragona J, Chan L, et al. Ultrasound training for emergency physicians—a prospective study. Acad Emerg Med. 2000;7(9):1008-1014. PubMed
23. Koenig SJ, Narasimhan M, Mayo PH. Thoracic ultrasonography for the pulmonary specialist. Chest. 2011;140(5):1332-1341. doi: 10.1378/chest.11-0348. PubMed
24. Greenstein YY, Littauer R, Narasimhan M, Mayo PH, Koenig SJ. Effectiveness of a Critical Care Ultrasonography Course. Chest. 2017;151(1):34-40. doi:10.1016/j.chest.2016.08.1465. PubMed
25. Martin LD, Howell EE, Ziegelstein RC, Martire C, Shapiro EP, Hellmann DB. Hospitalist performance of cardiac hand-carried ultrasound after focused training. Am J Med. 2007;120(11):1000-1004. PubMed
26. Martin LD, Howell EE, Ziegelstein RC, et al.
27. Lucas BP, Candotti C, Margeta B, et al. Diagnostic accuracy of hospitalist-performed hand-carried ultrasound echocardiography after a brief training program. J Hosp Med. 2009;4(6):340-349. PubMed
28.
29. Critical Care Ultrasonography Certificate of Completion Program. American College of Chest Physicians. http://www.chestnet.org/Education/Advanced-Clinical-Training/Certificate-of-Completion-Program/Critical-Care-Ultrasonography. Accessed March 30, 2017
30. Mayo PH, Beaulieu Y, Doelken P, et al. American College of Chest Physicians/Société de Réanimation de Langue Française statement on competence in critical care ultrasonography. Chest. 2009;135(4):1050-1060. PubMed
31. Donlon TF, Angoff WH. The scholastic aptitude test. The College Board Admissions Testing Program; 1971:15-47.
32. Ericsson KA, Lehmann AC. Expert and exceptional performance: Evidence of maximal adaptation to task constraints. Annu Rev Psychol. 1996;47:273-305. PubMed
33. Ericcson KA, Krampe RT, Tesch-Romer C. The role of deliberate practice in the acquisition of expert performance. Psychol Rev. 1993;100(3):363-406.
34. Arntfield RT. The utility of remote supervision with feedback as a method to deliver high-volume critical care ultrasound training. J Crit Care. 2015;30(2):441.e1-e6. PubMed
35. Ma OJ, Gaddis G, Norvell JG, Subramanian S. How fast is the focused assessment with sonography for trauma examination learning curve? Emerg Med Australas. 2008;20(1):32-37. PubMed
36. Gaspari RJ, Dickman E, Blehar D. Learning curve of bedside ultrasound of the gallbladder. J Emerg Med. 2009;37(1):51-66. doi:10.1016/j.jemermed.2007.10.070. PubMed
37. Barsuk JH, McGaghie WC, Cohen ER, Balachandran JS, Wane DB. Use of simulation-based mastery learning to improve quality of central venous catheter placement in a medical intensive care unit. J Hosp Med. 2009:4(7):397-403. PubMed
38. McGaghie WC, Issenberg SB, Cohen ER, Barsuk JH, Wayne DB. A critical review of simulation-based mastery learning with translational outcomes. Med Educ. 2014:48(4):375-385. PubMed
39. Guskey TR. The essential elements of mastery learning. J Classroom Interac. 1987;22:19-22.
40. Ultrasound Institute. Introduction to Primary Care Ultrasound. University of South Carolina School of Medicine. http://ultrasoundinstitute.med.sc.edu/UIcme.asp. Accessed October 24, 2017.
41. Society of Critical Care Medicine. Live Critical Care Ultrasound: Adult. http://www.sccm.org/Education-Center/Ultrasound/Pages/Fundamentals.aspx. Accessed October 24, 2017.
42. Castlefest Ultrasound Event. Castlefest 2018. http://castlefest2018.com/. Accessed October 24, 2017.
43. Office of Continuing Medical Education. Point of Care Ultrasound Workshop. UT Health San Antonio Joe R. & Teresa Lozano Long School of Medicine. http://cme.uthscsa.edu/ultrasound.asp. Accessed October 24, 2017.
44. Patrawalla P, Eisen LA, Shiloh A, et al. Development and Validation of an Assessment Tool for Competency in Critical Care Ultrasound. J Grad Med Educ. 2015;7(4):567-573. PubMed
© 2018 Society of Hospital Medicine
Evaluating the Benefits of Hospital Room Artwork for Patients Receiving Cancer Treatment: A Randomized Controlled Trial
With hospital reimbursement increasingly being linked to patient satisfaction,1 about half of US hospitals have embraced arts programs as a means of humanizing clinical environments and improving the patient experience.2,3 There is emerging evidence that integrating such programs into clinical settings is associated with less pain, stress, and anxiety4-10 as well as improved mood,11 greater levels of interaction,12 and feeling less institutionalized.13 However, it has been observed that existing studies have been undertaken with variable methodological rigor,14 and few randomized controlled trials (RCTs) have linked specific design features or interventions directly to healthcare outcomes. We designed a RCT to test the hypotheses that (1) placing a painting by a local artist in the line of vision of hospitalized patients would improve psychological and clinical outcomes and patient satisfaction and (2) letting patients choose their own painting would offer even greater benefit in these areas.
METHODS
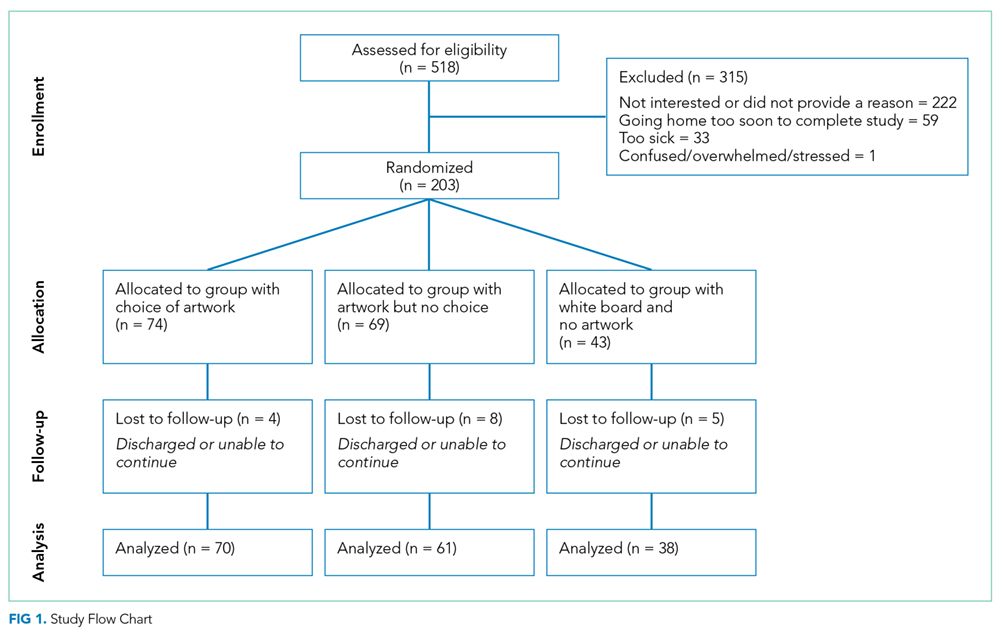
Outcomes and Measures
The primary outcomes were psychological and included the following: anxiety, mood, depression, and sense of control and/or influence. These were measured using the validated State-Trait Anxiety Inventory (STAI)15 an emotional thermometer instrument (ETI)16, and a self-designed instrument measuring one’s sense of control and influence over the environment. Secondary outcomes were clinical, encompassing pain, quality of life (QOL), length of stay (LOS), and related to perceptions of the hospital environment. These were assessed using data extracted from the electronic medical record (EMR) as well as the Room Assessment (RA) survey, a validated instrument used in prior clinical studies to assess inpatient settings.17 The RA survey uses the Semantic Differential scale, a rating scale designed to measure emotional associations by using paired attributes.18 In our scale, we listed 17 paired and polar opposite attributes, with one descriptor reflecting a more positive impression than the other. Anxiety, emotional state, and control and/or influence were assessed at baseline and prior to discharge; emotional state was assessed every 1 to 2 days; and perceptions of the room and overall patient experience were measured once, prior to discharge, using the RA survey.
Data Analysis
A sample of 180 participants were chosen, with a 2:1 ratio of art group to no-art control group to provide at least 80% power to detect a difference in anxiety score of 4 units, for the comparisons of interest among the groups. The calculations assumed a 2-sided test with α = 0.05.
Comparisons were made between (1) those with paintings versus those without and (2) those with a choice of paintings versus those with no choice. For the primary psychological outcome, the average anxiety score at discharge was compared between groups of interest by using analysis of covariance, with adjustment for baseline score. Items measuring mood, depression, control, and influence that were collected more frequently were compared between groups by using repeated measures analysis of covariance, with adjustment for corresponding score at baseline. For clinical outcomes, median LOS was compared between groups by using the Wilcoxon rank sum test due to the skewed distribution of data, and QOL and pain were compared between groups by using repeated measures analysis of covariance. The model for patient-reported pain included covariates for pain medication received and level of pain tolerance. Outcomes measuring perceptions of hospital environment were collected at a single time point and compared between groups by using the 2-sample t-test. Results were reported in terms of means and 95% confidence intervals or medians and quartiles. Significance was defined by P < .05. All facets of this study were approved by the Pennsylvania State University College of Medicine Institutional Review Board.
RESULTS
We approached 518 patients to participate in the study, and 203 elected to enroll. Seventeen patients withdrew from the study because they had been discharged from the hospital or were unable to continue. Of the 186 participants who completed the study, 74 chose the painting displayed in their rooms, 69 had paintings randomly selected for them, and 43 had no paintings in their rooms, only white boards in their line of vision. The average age of participants in the trial was 56 years, 49% were male, and 89% were Caucasian. There were no significant differences between participants and decliners in terms of race (P = .13) and mean age (P = .08). However, they did differ by gender, with 49% of participants being male compared with 68% of decliners (P < .001). There were no significant differences among the 3 study groups with respect to these demographic characteristics. No harms were observed for any patients; however, several patients in the group whose artwork was randomly selected expressed distaste for the image and/or color scheme of their painting.
Psychological Outcomes: Anxiety (STAI), Mood and Depression (ETI), and Sense of Control and/or Influence (Self-Designed Instrument)
There were no differences in anxiety for the primary comparison of artwork versus no artwork or the secondary comparison of choice versus no choice. Likewise, there were no differences in mood, depression, or sense of control and/or influence across the 3 groups.
Clinical Outcomes: Self-Reported Pain, LOS, and QOL (from EMR)
There were no differences in self-reported pain, LOS, or QOL across the 3 groups. With regard to LOS, the median (quartile 1 [Q1], quartile 3 [Q3]) stay was 6 days for the choice group (4.0, 12.0), 6 days for the no-choice group (5.0, 9.5), and 9.5 days for the group with no artwork (5.0, 20.0; see supplementary Table).
Perceptions of Hospital Environment (RA Survey)
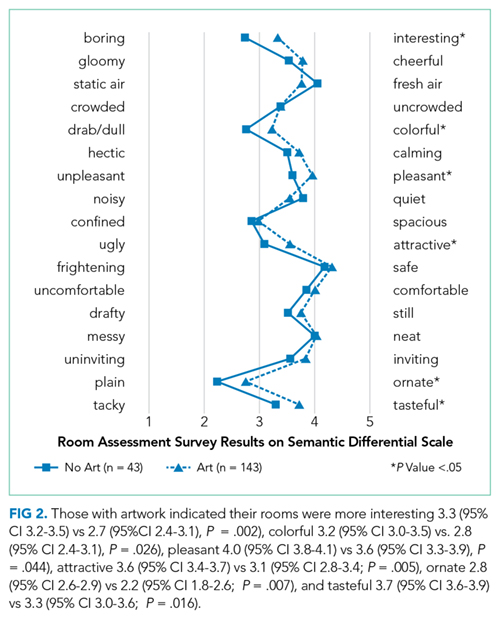
DISCUSSION
While having paintings in cancer inpatient rooms did not affect the psychological or clinical outcomes we assessed, patients who had paintings in their rooms had more positive impressions of the hospital environment. Given that healthcare administrators are under strong pressures to control costs while increasing care quality and patient satisfaction to maximize reimbursement, integrating local artwork into inpatient rooms may represent a simple and relatively inexpensive way (approximately $90 per room) to humanize clinical environments, systematically improve perceptions of the institution, and perhaps contribute to increased patient satisfaction scores. While more work must be done to establish a positive link between access to artwork and improved standardized patient satisfaction outcomes, our results suggest that there may be potential benefit in giving patients an opportunity to engage artwork as a therapeutic resource during the physical, emotional, and spiritual challenges that arise during inpatient treatment.
These findings also have implications for inpatients with illnesses other than cancer. Though we did not explicitly study noncancer patients, we know that nearly 40 million Americans are admitted annually to institutional care (ie, acute hospitalizations, rehabilitation hospitals, and skilled nursing facilities) and often find themselves in environments that can be stark and medicalized. We would anticipate that providing art in these patients’ rooms would likewise improve perceptions of the institutions where they receive their inpatient medical care.
This study had several limitations that could affect the generalizability of our findings. First, it was difficult to enroll patients, with greater than 50% of persons approached declining to participate. Second, nonparticipants were more likely to be male, and this clearly provides a biased sample. Third, we have incomplete data for some patients who were unavailable or changed rooms during the study. Fourth, while each patient room had standardized features (eg, windows, televisions, etc.), there were logistical challenges with placing paintings in the exact same location (ie, in the patient’s direct line of vision) in every hospital room because the shape, size, and idiosyncratic decorating of hospital rooms varied, so we were not able to fully control for all room décor features. Fifth, the study was conducted at a single site and only among patients with cancer; other populations could respond very differently. It is possible that other confounding factors (such as prior hospital experience, patient predilection for artwork, and usage of digital devices during hospitalization) could have affected outcomes, but these were not measured in this study.
In conclusion, as patient satisfaction continues to influence hospital reimbursement, identifying novel and effective approaches to improving patient perceptions can play a meaningful role in patient care. Future research should focus on different inpatient populations and venues; new strategies to effectively evaluate relevant clinical outcomes; comparisons with other nonpharmacological, arts-based interventions in inpatient settings (eg, music, creation of artwork, etc.); and assessment of aggregate scores on standardized patient satisfaction instruments (eg, Press Ganey, Hospital Consumer Assessment of Healthcare Providers and Systems). There may also be an additive benefit in providing “coaching” to healthcare providers on how to engage with patients regarding the artwork they have chosen. Such approaches might also examine the value of giving patients control over multiple opportunities to influence the aesthetics in their room versus a single opportunity during the course of their stay.
Acknowledgments
The authors would like to acknowledge the contributions of Lorna Davis, Lori Snyder, and Renee Stewart to this work.
Disclosure
This work was supported by funding from the National Endowment for the Arts (grant 14-3800-7008). ClinicalTrials.gov Identifier for Penn State Milton S. Hershey Medical Center Protocol Record STUDY00000378: NCT02357160. The authors report no conflicts of interest.
1. Mehta SJ. Patient Satisfaction Reporting and Its Implications for Patient Care. AMA J Ethics. 2015;17(7):616-621. PubMed
2. Hathorn KN. A Guide to Evidence-based Art. The Center for Health and Design; 2008. https://www.healthdesign.org/sites/default/files/Hathorn_Nanda_Mar08.pdf . Accessed November 5, 2017.
3. Sonke J, Rollins J, Brandman R, Graham-Pole J. The state of the arts in healthcare in the United States. Arts & Health. 2009;1(2):107-135.
4. Ulrich RS, Zimring C, Zhu X, et al. A Review of the Research Literature on Evidence-Based Healthcare Design. HERD. 2008;1(3):61-125. PubMed
5. Beukeboom CJ, Langeveld D, Tanja-Dijkstra K. Stress-reducing effects of real and artificial nature in a hospital waiting room. J Altern Complement Med. 2012;18(4):329-333. PubMed
6. Miller AC, Hickman LC, Lemaster GK. A Distraction Technique for Control of Burn Pain. J Burn Care Rehabil. 1992;13(5):576-580. PubMed
7. Diette GB, Lechtzin N, Haponik E, Devrotes A, Rubin HR. Distraction Therapy with Nature Sights and Sounds Reduces Pain During Flexible Bronchoscopy: A Complementary Approach to Routine Analgesic. Chest. 2003;123(3):941-948. PubMed
8. Tse MM, Ng JK, Chung JW, Wong TK. The effect of visual stimuli on pain threshold and tolerance. J Clin Nursing. 2002;11(4):462-469.
PubMed
9. Vincent E, Battisto D, Grimes L. The Effects of Nature Images on Pain in a Simulated Hospital Patient Room. HERD. 2010;3(3):56-69. PubMed
10. Staricoff RL. Arts in health: the value of evaluation. J R Soc Promot Health. 2006;126(3):116-120. PubMed
11. Karnik M, Printz B, Finkel J. A Hospital’s Contemporary Art Collection: Effects on Patient Mood, Stress, Comfort, and Expectations. HERD. 2014;7(3):60-77. PubMed
12. Suter E, Baylin D. Choosing art as a complement to healing. Appl Nurs Res. 2007;20(1):32-38. PubMed
13. Harris PB, McBride G, Ross C, Curtis L. A Place to Heal: Environmental Sources of Satisfaction among Hospital Patients. J Appl Soc Psychol. 2002;32(6):1276-1299.
14. Moss H, Donnellan C, O’Neill D. A review of qualitative methodologies used to explore patient perceptions of arts and healthcare. Med Humanit. 2012;38(2):106-109. PubMed
15. Corsini RJ, Ozaki BD. Encyclopedia of psychology. Vol. 1. New York: Wiley; 1994. State-Trait Anxiety Inventory.
16. Beck KR, Tan SM, Lum SS, Lim LE, Krishna LK. Validation of the emotion thermometers and hospital anxiety and depression scales in Singapore: Screening cancer patients for distress, anxiety and depression. Asia Pac J Clin Oncol. 2016;12(2):e241-e249. PubMed
17. Lohr VI, Pearson-Mims CH. Physical discomfort may be reduced in the presence of interior plants. HortTechnology. 2000;10(1):53-58.
18. Semantic Differential. http://psc.dss.ucdavis.edu/sommerb/sommerdemo/scaling/semdiff.htm. Accessed November 5, 2017.
With hospital reimbursement increasingly being linked to patient satisfaction,1 about half of US hospitals have embraced arts programs as a means of humanizing clinical environments and improving the patient experience.2,3 There is emerging evidence that integrating such programs into clinical settings is associated with less pain, stress, and anxiety4-10 as well as improved mood,11 greater levels of interaction,12 and feeling less institutionalized.13 However, it has been observed that existing studies have been undertaken with variable methodological rigor,14 and few randomized controlled trials (RCTs) have linked specific design features or interventions directly to healthcare outcomes. We designed a RCT to test the hypotheses that (1) placing a painting by a local artist in the line of vision of hospitalized patients would improve psychological and clinical outcomes and patient satisfaction and (2) letting patients choose their own painting would offer even greater benefit in these areas.
METHODS
Outcomes and Measures
The primary outcomes were psychological and included the following: anxiety, mood, depression, and sense of control and/or influence. These were measured using the validated State-Trait Anxiety Inventory (STAI)15 an emotional thermometer instrument (ETI)16, and a self-designed instrument measuring one’s sense of control and influence over the environment. Secondary outcomes were clinical, encompassing pain, quality of life (QOL), length of stay (LOS), and related to perceptions of the hospital environment. These were assessed using data extracted from the electronic medical record (EMR) as well as the Room Assessment (RA) survey, a validated instrument used in prior clinical studies to assess inpatient settings.17 The RA survey uses the Semantic Differential scale, a rating scale designed to measure emotional associations by using paired attributes.18 In our scale, we listed 17 paired and polar opposite attributes, with one descriptor reflecting a more positive impression than the other. Anxiety, emotional state, and control and/or influence were assessed at baseline and prior to discharge; emotional state was assessed every 1 to 2 days; and perceptions of the room and overall patient experience were measured once, prior to discharge, using the RA survey.
Data Analysis
A sample of 180 participants were chosen, with a 2:1 ratio of art group to no-art control group to provide at least 80% power to detect a difference in anxiety score of 4 units, for the comparisons of interest among the groups. The calculations assumed a 2-sided test with α = 0.05.
Comparisons were made between (1) those with paintings versus those without and (2) those with a choice of paintings versus those with no choice. For the primary psychological outcome, the average anxiety score at discharge was compared between groups of interest by using analysis of covariance, with adjustment for baseline score. Items measuring mood, depression, control, and influence that were collected more frequently were compared between groups by using repeated measures analysis of covariance, with adjustment for corresponding score at baseline. For clinical outcomes, median LOS was compared between groups by using the Wilcoxon rank sum test due to the skewed distribution of data, and QOL and pain were compared between groups by using repeated measures analysis of covariance. The model for patient-reported pain included covariates for pain medication received and level of pain tolerance. Outcomes measuring perceptions of hospital environment were collected at a single time point and compared between groups by using the 2-sample t-test. Results were reported in terms of means and 95% confidence intervals or medians and quartiles. Significance was defined by P < .05. All facets of this study were approved by the Pennsylvania State University College of Medicine Institutional Review Board.
RESULTS
We approached 518 patients to participate in the study, and 203 elected to enroll. Seventeen patients withdrew from the study because they had been discharged from the hospital or were unable to continue. Of the 186 participants who completed the study, 74 chose the painting displayed in their rooms, 69 had paintings randomly selected for them, and 43 had no paintings in their rooms, only white boards in their line of vision. The average age of participants in the trial was 56 years, 49% were male, and 89% were Caucasian. There were no significant differences between participants and decliners in terms of race (P = .13) and mean age (P = .08). However, they did differ by gender, with 49% of participants being male compared with 68% of decliners (P < .001). There were no significant differences among the 3 study groups with respect to these demographic characteristics. No harms were observed for any patients; however, several patients in the group whose artwork was randomly selected expressed distaste for the image and/or color scheme of their painting.
Psychological Outcomes: Anxiety (STAI), Mood and Depression (ETI), and Sense of Control and/or Influence (Self-Designed Instrument)
There were no differences in anxiety for the primary comparison of artwork versus no artwork or the secondary comparison of choice versus no choice. Likewise, there were no differences in mood, depression, or sense of control and/or influence across the 3 groups.
Clinical Outcomes: Self-Reported Pain, LOS, and QOL (from EMR)
There were no differences in self-reported pain, LOS, or QOL across the 3 groups. With regard to LOS, the median (quartile 1 [Q1], quartile 3 [Q3]) stay was 6 days for the choice group (4.0, 12.0), 6 days for the no-choice group (5.0, 9.5), and 9.5 days for the group with no artwork (5.0, 20.0; see supplementary Table).
Perceptions of Hospital Environment (RA Survey)
DISCUSSION
While having paintings in cancer inpatient rooms did not affect the psychological or clinical outcomes we assessed, patients who had paintings in their rooms had more positive impressions of the hospital environment. Given that healthcare administrators are under strong pressures to control costs while increasing care quality and patient satisfaction to maximize reimbursement, integrating local artwork into inpatient rooms may represent a simple and relatively inexpensive way (approximately $90 per room) to humanize clinical environments, systematically improve perceptions of the institution, and perhaps contribute to increased patient satisfaction scores. While more work must be done to establish a positive link between access to artwork and improved standardized patient satisfaction outcomes, our results suggest that there may be potential benefit in giving patients an opportunity to engage artwork as a therapeutic resource during the physical, emotional, and spiritual challenges that arise during inpatient treatment.
These findings also have implications for inpatients with illnesses other than cancer. Though we did not explicitly study noncancer patients, we know that nearly 40 million Americans are admitted annually to institutional care (ie, acute hospitalizations, rehabilitation hospitals, and skilled nursing facilities) and often find themselves in environments that can be stark and medicalized. We would anticipate that providing art in these patients’ rooms would likewise improve perceptions of the institutions where they receive their inpatient medical care.
This study had several limitations that could affect the generalizability of our findings. First, it was difficult to enroll patients, with greater than 50% of persons approached declining to participate. Second, nonparticipants were more likely to be male, and this clearly provides a biased sample. Third, we have incomplete data for some patients who were unavailable or changed rooms during the study. Fourth, while each patient room had standardized features (eg, windows, televisions, etc.), there were logistical challenges with placing paintings in the exact same location (ie, in the patient’s direct line of vision) in every hospital room because the shape, size, and idiosyncratic decorating of hospital rooms varied, so we were not able to fully control for all room décor features. Fifth, the study was conducted at a single site and only among patients with cancer; other populations could respond very differently. It is possible that other confounding factors (such as prior hospital experience, patient predilection for artwork, and usage of digital devices during hospitalization) could have affected outcomes, but these were not measured in this study.
In conclusion, as patient satisfaction continues to influence hospital reimbursement, identifying novel and effective approaches to improving patient perceptions can play a meaningful role in patient care. Future research should focus on different inpatient populations and venues; new strategies to effectively evaluate relevant clinical outcomes; comparisons with other nonpharmacological, arts-based interventions in inpatient settings (eg, music, creation of artwork, etc.); and assessment of aggregate scores on standardized patient satisfaction instruments (eg, Press Ganey, Hospital Consumer Assessment of Healthcare Providers and Systems). There may also be an additive benefit in providing “coaching” to healthcare providers on how to engage with patients regarding the artwork they have chosen. Such approaches might also examine the value of giving patients control over multiple opportunities to influence the aesthetics in their room versus a single opportunity during the course of their stay.
Acknowledgments
The authors would like to acknowledge the contributions of Lorna Davis, Lori Snyder, and Renee Stewart to this work.
Disclosure
This work was supported by funding from the National Endowment for the Arts (grant 14-3800-7008). ClinicalTrials.gov Identifier for Penn State Milton S. Hershey Medical Center Protocol Record STUDY00000378: NCT02357160. The authors report no conflicts of interest.
1. Mehta SJ. Patient Satisfaction Reporting and Its Implications for Patient Care. AMA J Ethics. 2015;17(7):616-621. PubMed
2. Hathorn KN. A Guide to Evidence-based Art. The Center for Health and Design; 2008. https://www.healthdesign.org/sites/default/files/Hathorn_Nanda_Mar08.pdf . Accessed November 5, 2017.
3. Sonke J, Rollins J, Brandman R, Graham-Pole J. The state of the arts in healthcare in the United States. Arts & Health. 2009;1(2):107-135.
4. Ulrich RS, Zimring C, Zhu X, et al. A Review of the Research Literature on Evidence-Based Healthcare Design. HERD. 2008;1(3):61-125. PubMed
5. Beukeboom CJ, Langeveld D, Tanja-Dijkstra K. Stress-reducing effects of real and artificial nature in a hospital waiting room. J Altern Complement Med. 2012;18(4):329-333. PubMed
6. Miller AC, Hickman LC, Lemaster GK. A Distraction Technique for Control of Burn Pain. J Burn Care Rehabil. 1992;13(5):576-580. PubMed
7. Diette GB, Lechtzin N, Haponik E, Devrotes A, Rubin HR. Distraction Therapy with Nature Sights and Sounds Reduces Pain During Flexible Bronchoscopy: A Complementary Approach to Routine Analgesic. Chest. 2003;123(3):941-948. PubMed
8. Tse MM, Ng JK, Chung JW, Wong TK. The effect of visual stimuli on pain threshold and tolerance. J Clin Nursing. 2002;11(4):462-469.
PubMed
9. Vincent E, Battisto D, Grimes L. The Effects of Nature Images on Pain in a Simulated Hospital Patient Room. HERD. 2010;3(3):56-69. PubMed
10. Staricoff RL. Arts in health: the value of evaluation. J R Soc Promot Health. 2006;126(3):116-120. PubMed
11. Karnik M, Printz B, Finkel J. A Hospital’s Contemporary Art Collection: Effects on Patient Mood, Stress, Comfort, and Expectations. HERD. 2014;7(3):60-77. PubMed
12. Suter E, Baylin D. Choosing art as a complement to healing. Appl Nurs Res. 2007;20(1):32-38. PubMed
13. Harris PB, McBride G, Ross C, Curtis L. A Place to Heal: Environmental Sources of Satisfaction among Hospital Patients. J Appl Soc Psychol. 2002;32(6):1276-1299.
14. Moss H, Donnellan C, O’Neill D. A review of qualitative methodologies used to explore patient perceptions of arts and healthcare. Med Humanit. 2012;38(2):106-109. PubMed
15. Corsini RJ, Ozaki BD. Encyclopedia of psychology. Vol. 1. New York: Wiley; 1994. State-Trait Anxiety Inventory.
16. Beck KR, Tan SM, Lum SS, Lim LE, Krishna LK. Validation of the emotion thermometers and hospital anxiety and depression scales in Singapore: Screening cancer patients for distress, anxiety and depression. Asia Pac J Clin Oncol. 2016;12(2):e241-e249. PubMed
17. Lohr VI, Pearson-Mims CH. Physical discomfort may be reduced in the presence of interior plants. HortTechnology. 2000;10(1):53-58.
18. Semantic Differential. http://psc.dss.ucdavis.edu/sommerb/sommerdemo/scaling/semdiff.htm. Accessed November 5, 2017.
© 2018 Society of Hospital Medicine
The Use of Individual Provider Performance Reports by US Hospitals
Reimbursement for hospitals and physicians is increasingly tied to performance.1 Bundled payments, for example, require hospitals to share risk for patient outcomes. Medicare bundled payments are becoming mandatory for some surgical and medical conditions, including joint replacement, acute myocardial infarction, and coronary artery bypass graft surgery.2 Value-based payment is anticipated to become the norm as Medicare and private payers strive to control costs and improve outcomes. Although value-based reimbursement for hospitals targets hospital-level costs and outcomes, we know that variations at the level of individual providers explain a considerable proportion of variation in utilization and outcomes.3 However, physicians often lack awareness of their own practice patterns and relative costs, and successful participation in new payment models may require an investment by hospitals in the infrastructure needed to measure and provide feedback on performance to individual providers to affect their behavior.4,5
Electronic health record (EHR)-based reports or “dashboards” have been proposed as one potential tool to provide individualized feedback on provider performance.6 Individual provider performance profiles (IPPs) offer the potential to provide peer comparisons that may adjust individual behavior by correcting misperceptions about norms.7 Behavioral economic theory suggests that individual performance data, if combined with information on peer behavior and normative goals, may be effective in changing behavior.8 Several studies have reported the effects of specific efforts to use IPPs, showing that such reports can improve care in certain clinical areas. For example, individual provider dashboards have been associated with better outcomes for hospitalized patients, such as increased compliance with recommendations for prophylaxis of venous thromboembolism, although evidence in other areas of practice is mixed.9,10 A randomized controlled trial of peer comparison feedback reduced inappropriate antibiotic prescribing for upper respiratory infections by 11% among internists.11
Despite the promise of individualized feedback to optimize behavior, however, little has been reported on trends in the use of IPPs on a population level. It is unknown whether their use is common or rare, or what hospital characteristics are associated with adoption. Such information would help guide future efforts to promote IPP use and understand its effect on practice. We used data from a nationally representative survey of US hospitals to examine the use of individual provider-level performance profiles.
METHODS
We used data from the American Hospital Association (AHA) Annual Survey Information Technology (IT) Supplement, which asked respondents to indicate whether they have used electronic clinical data from the EHR or other electronic system in their hospital to create IPPs. The AHA survey is sent annually to all US operating hospitals. Survey results are supplemented by data from the AHA registration database, US Census Bureau, hospital accrediting bodies, and other organizations. The AHA IT supplement is also sent yearly to each hospital’s chief executive officer, who assigns it to the most knowledgeable person in the institution to complete.12
We linked data on IPP use to AHA Annual Survey responses on hospital characteristics for all general adult and pediatric hospitals. Multivariable logistic regression was used to model the odds of individual provider performance profile use as a function of hospital characteristics, including ownership (nonprofit, for profit, or government), geographic region, teaching versus nonteaching status, rural versus urban location, size, expenditures per bed, proportion of patient days covered by Medicaid, and risk-sharing models of reimbursement (participation in a health maintenance organization or bundled payments program). Variables were chosen a priori to account for important characteristics of US hospitals (eg, size, teaching status, and geographic location). These were combined with variables representing risk-sharing arrangements based on the hypothesis that hospitals whose payments are at greater risk would be more likely to invest in tracking provider performance. We eliminated any variable with an item nonresponse rate greater than 15%, which resulted in elimination of 2 variables representing hospital revenue from capitated payments and any risk-sharing arrangement, respectively. All other variables had item nonresponse rates of 0%, except for 4.7% item nonresponse for the bundled payments variable.
We also measured the trend in individual provider performance report use between 2013 and 2015 by estimating the linear probability between IPP use and year. A P value less than .05 was considered statistically significant.
Because past work has demonstrated nonresponse bias in the AHA Survey and IT Supplement, we performed additional analyses using nonresponsive weights based on hospital characteristics. Weighting methodology was based on prior work with the AHA and AHA IT surveys.13,14 Weighting exploits the fact that a number of hospital characteristics are derived from sources outside the survey and thus are available for both respondents and nonrespondents. We created nonresponse weights based on a logistic regression model of survey response as a function of hospital characteristics (ownership, size, teaching status, systems membership, critical access hospital, and geographic region). Our findings were similar for weighted and nonweighted models and nonweighted estimates are presented throughout.
The University of Pennsylvania Institutional Review Board exempted this study from review. Analyses were performed using Stata statistical software, version 14.0 (StataCorp, College Station, TX).
RESULTS
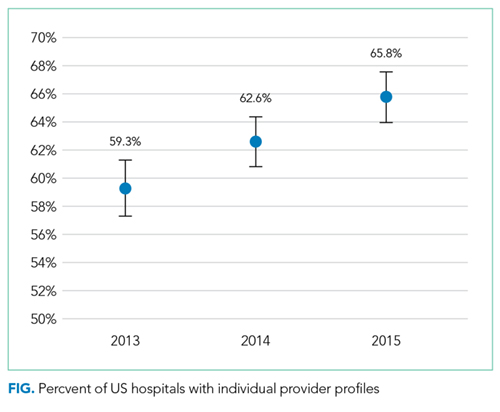
The table shows the association between hospital characteristics and the odds of individual provider performance report use. Report use was associated with nonprofit status (odds ratio [OR], 2.77; 95% confidence interval [CI], 1.94-3.95; P < .01) compared to for-profit, large hospital size (OR, 2.37; 95% CI, 1.56-3.60; P < .01) compared to small size, highest (OR, 2.09; 95% CI, 1.55-2.82; P < .01) and second highest (OR, 1.43; 95% CI, 1.08-1.89; P = .01) quartiles of bed-adjusted expenditures compared to the bottom quartile, and West geographic region compared to Northeast (OR, 2.07; 95% CI, 1.45-2.95; P < .01). Individual provider performance use was also independently associated with participation in a health maintenance organization (OR, 1.50; 95% CI, 1.17-1.90; P < .01) or bundled payment program (OR, 1.61; 95% CI, 1.18-2.19; P < .01), controlling for other covariates. Adjustment for nonresponse bias did not change any coefficients by more than 10% (supplementary Table).
DISCUSSION
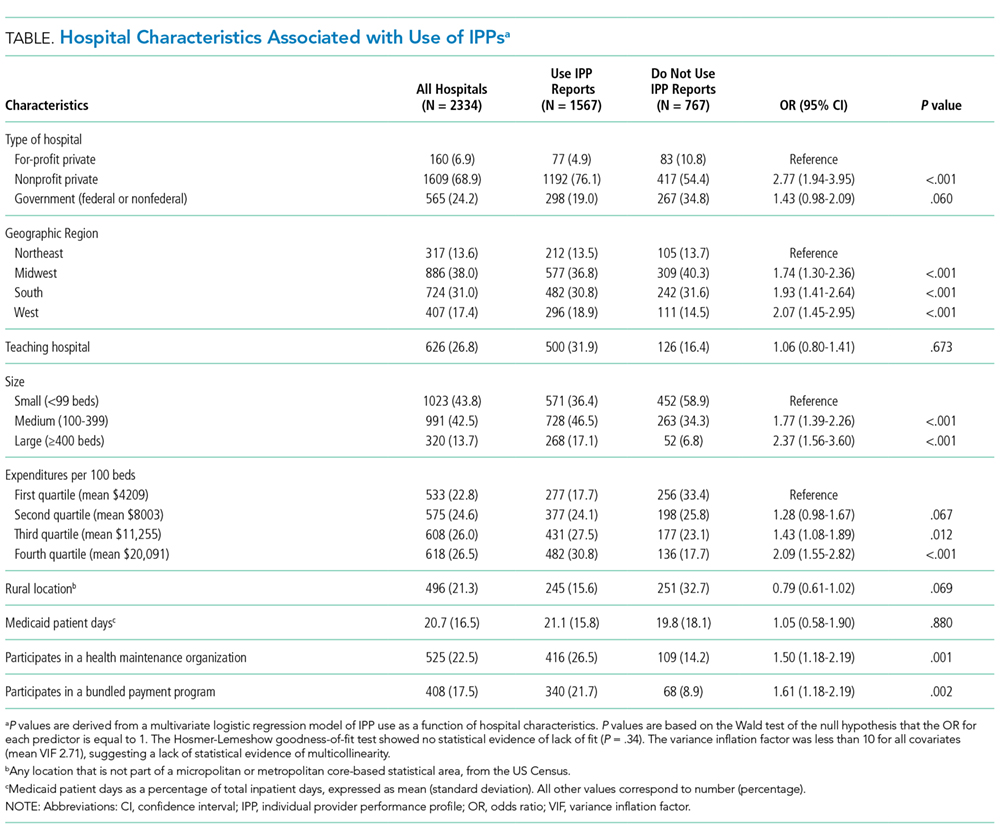
The Medicare Access and Children Health Insurance Program Reauthorization Act is accelerating the shift from quantity based toward value-based reimbursement. The proficient adoption of IT by healthcare providers has been cited as an important factor in adapting to new payment models.15 Physicians, and in particular hospitalists, who practice in an inpatient environment, may not directly access financial incentives aimed to adapt performance for value-based reimbursement. They may also have difficulty assessing their performance relative to peers and longitudinally over time. Individualized EHR-based provider-level performance reports offer 1 option for hospitals to measure performance and provide comparative feedback at the individual physician level. Our findings show that, in fact, a majority of US hospitals have made investments in the infrastructure necessary to create such profiles.
Nevertheless, a third of the hospitals surveyed have not adopted individualized provider performance profiles. If meeting efficiency and outcomes goals for value-based payments necessitates changes to individual provider behavior, those hospitals may be less well positioned to benefit from value-based payment models that incentivize hospitals for efficiency and outcomes. Furthermore, while we observe widespread adoption of individual performance profiles, it is unclear whether those were used to provide feedback to providers, and if so, how the feedback provided may influence its effect on behavior. Behavioral economics theory suggests, for example, that publicly reporting performance compared to peers provides stronger incentives for behavior change than “blinded” personalized reports.16
Our study has important limitations. We cannot exclude the possibility that unmeasured variables help explain individual provider performance adoption. These omitted variables may confound the association between hospital characteristics and individual provider performance adoption observed in this study. We were also unable to establish causality between bundled payments and individual provider performance profile use. For instance, hospitals may elect to make investments in IT infrastructure to enable individual provider performance profile adoption in anticipation of bundled payment reforms. Alternatively, the availability of IPPs may have led hospitals to enter bundled payments reimbursement arrangements. In addition, we are unable to describe how individual provider performance use affects physician practice or healthcare delivery more broadly. Finally, we are also unable to account for other sources of performance data. For example, some physician may receive data from their physician practice groups.
Our study suggests several avenues for future research. First, more work is needed to understand why certain types of hospitals are more likely to use IPPs. Our findings indicate that IPP use may be partly a function of hospital size and resources. However, other factors not measured here may play an important role as well, such as institutional culture. Institutions with a focus on informatics and strong IT leadership may be more likely to use their EHR to monitor performance. Second, further research should explore in greater depth how profiles are used. Future research should evaluate, for example, how hospitals are using behavioral economic principles, such as peer comparison, to motivate behavior change, and if such techniques have successfully influenced practice and patient outcomes. Ultimately, multicentered, randomized evaluations of IPP use may be necessary to understand their risks and evaluate their effect on patient outcomes. This work is necessary to inform policy and practice as hospitals transition from fee-for-service to value-based reimbursement.
In sum, we observed increasing adoption of individualized electronic provider performance profiles by US hospitals from 2013 to 2015. Hospitals that did not use IPPs were more likely to be small, for profit, and less likely to participate in bundled payment programs. Those hospitals may be less well positioned to track provider performance and implement incentives for provider behavior changes needed to meet targets for value-based reimbursement.
Disclosure
Dr. Rolnick is a consultant to Tuple Health, Inc. and was a part-time employee of Acumen, LLC outside the submitted work. Dr. Ryskina has nothing to disclose.
1. Hussey PS, Liu JL, White C. The Medicare Access And CHIP Reauthorization Act: effects On Medicare payment policy and spending. Health Aff. 2017;36(4):697-705. PubMed
2. Navathe AS, Song Z, Emanuel EJ. The next generation of episode-based payments. JAMA. 2017;317(23):2371-2372. PubMed
3. Tsugawa Y, Jha AK, Newhouse JP, Zaslavsky AM, Jena AB. Variation in physician spending and association with patient outcomes. JAMA Intern Med. 2017;177(5):675-682. PubMed
4. Saint S, Wiese J, Amory JK, et al. Are physicians aware of which of their patients have indwelling urinary catheters? Am J Med. 2000;109(6):476-480. PubMed
5. Saturno PJ, Palmer RH, Gascón JJ. Physician attitudes, self-estimated performance and actual compliance with locally peer-defined quality evaluation criteria. Int J Qual Health Care J Int Soc Qual Health Care. 1999;11(6):487-496. PubMed
6. Mehrotra A, Sorbero MES, Damberg CL. Using the lessons of behavioral economics to design more effective pay-for-performance programs. Am J Manag Care. 2010;16(7):497-503. PubMed
7. Emanuel EJ, Ubel PA, Kessler JB, et al. Using behavioral economics to design physician Incentives that deliver high-value care. Ann Intern Med. 2016;164(2):114-119. PubMed
8. Liao JM, Fleisher LA, Navathe AS. Increasing the value of social comparisons of physician performance using norms. JAMA. 2016;316(11):1151-1152. PubMed
9. Michtalik HJ, Carolan HT, Haut ER, et al. Use of provider-level dashboards and pay-for-performance in venous thromboembolism prophylaxis. J Hosp Med. 2015;10(3):172-178. PubMed
10. Kurtzman G, Dine J, Epstein A, et al. Internal medicine resident engagement with a laboratory utilization dashboard: mixed methods study. J Hosp Med. 12(9):743-746. PubMed
11. Linder JA, Schnipper JL, Tsurikova R, et al. Electronic health record feedback to improve antibiotic prescribing for acute respiratory infections. Am J Manag Care. 2010;16 (12 Suppl HIT):e311-e319. PubMed
12. Jha AK, DesRoches CM, Campbell EG, et al. Use of electronic health records in U.S. hospitals. N Engl J Med. 2009;360(16):1628-1638. PubMed
13. Walker DM, Mora AM, Scheck McAlearney A. Accountable care organization hospitals differ in health IT capabilities. Am J Manag Care. 2016;22(12):802-807. PubMed
14. Adler-Milstein J, DesRoches CM, Furukawa MF, et al. More than half of US hospitals have at least a basic EHR, but stage 2 criteria remain challenging for most. Health Aff 2014;33(9):1664-1671. PubMed
15. Porter ME. A strategy for health care reform—toward a value-based system. N Engl J Med. 2009;361(2):109-112. PubMed
16. Navathe AS, Emanuel EJ. Physician peer comparisons as a nonfinancial strategy to improve the value of care. JAMA. 2016;316(17):1759-1760. PubMed
Reimbursement for hospitals and physicians is increasingly tied to performance.1 Bundled payments, for example, require hospitals to share risk for patient outcomes. Medicare bundled payments are becoming mandatory for some surgical and medical conditions, including joint replacement, acute myocardial infarction, and coronary artery bypass graft surgery.2 Value-based payment is anticipated to become the norm as Medicare and private payers strive to control costs and improve outcomes. Although value-based reimbursement for hospitals targets hospital-level costs and outcomes, we know that variations at the level of individual providers explain a considerable proportion of variation in utilization and outcomes.3 However, physicians often lack awareness of their own practice patterns and relative costs, and successful participation in new payment models may require an investment by hospitals in the infrastructure needed to measure and provide feedback on performance to individual providers to affect their behavior.4,5
Electronic health record (EHR)-based reports or “dashboards” have been proposed as one potential tool to provide individualized feedback on provider performance.6 Individual provider performance profiles (IPPs) offer the potential to provide peer comparisons that may adjust individual behavior by correcting misperceptions about norms.7 Behavioral economic theory suggests that individual performance data, if combined with information on peer behavior and normative goals, may be effective in changing behavior.8 Several studies have reported the effects of specific efforts to use IPPs, showing that such reports can improve care in certain clinical areas. For example, individual provider dashboards have been associated with better outcomes for hospitalized patients, such as increased compliance with recommendations for prophylaxis of venous thromboembolism, although evidence in other areas of practice is mixed.9,10 A randomized controlled trial of peer comparison feedback reduced inappropriate antibiotic prescribing for upper respiratory infections by 11% among internists.11
Despite the promise of individualized feedback to optimize behavior, however, little has been reported on trends in the use of IPPs on a population level. It is unknown whether their use is common or rare, or what hospital characteristics are associated with adoption. Such information would help guide future efforts to promote IPP use and understand its effect on practice. We used data from a nationally representative survey of US hospitals to examine the use of individual provider-level performance profiles.
METHODS
We used data from the American Hospital Association (AHA) Annual Survey Information Technology (IT) Supplement, which asked respondents to indicate whether they have used electronic clinical data from the EHR or other electronic system in their hospital to create IPPs. The AHA survey is sent annually to all US operating hospitals. Survey results are supplemented by data from the AHA registration database, US Census Bureau, hospital accrediting bodies, and other organizations. The AHA IT supplement is also sent yearly to each hospital’s chief executive officer, who assigns it to the most knowledgeable person in the institution to complete.12
We linked data on IPP use to AHA Annual Survey responses on hospital characteristics for all general adult and pediatric hospitals. Multivariable logistic regression was used to model the odds of individual provider performance profile use as a function of hospital characteristics, including ownership (nonprofit, for profit, or government), geographic region, teaching versus nonteaching status, rural versus urban location, size, expenditures per bed, proportion of patient days covered by Medicaid, and risk-sharing models of reimbursement (participation in a health maintenance organization or bundled payments program). Variables were chosen a priori to account for important characteristics of US hospitals (eg, size, teaching status, and geographic location). These were combined with variables representing risk-sharing arrangements based on the hypothesis that hospitals whose payments are at greater risk would be more likely to invest in tracking provider performance. We eliminated any variable with an item nonresponse rate greater than 15%, which resulted in elimination of 2 variables representing hospital revenue from capitated payments and any risk-sharing arrangement, respectively. All other variables had item nonresponse rates of 0%, except for 4.7% item nonresponse for the bundled payments variable.
We also measured the trend in individual provider performance report use between 2013 and 2015 by estimating the linear probability between IPP use and year. A P value less than .05 was considered statistically significant.
Because past work has demonstrated nonresponse bias in the AHA Survey and IT Supplement, we performed additional analyses using nonresponsive weights based on hospital characteristics. Weighting methodology was based on prior work with the AHA and AHA IT surveys.13,14 Weighting exploits the fact that a number of hospital characteristics are derived from sources outside the survey and thus are available for both respondents and nonrespondents. We created nonresponse weights based on a logistic regression model of survey response as a function of hospital characteristics (ownership, size, teaching status, systems membership, critical access hospital, and geographic region). Our findings were similar for weighted and nonweighted models and nonweighted estimates are presented throughout.
The University of Pennsylvania Institutional Review Board exempted this study from review. Analyses were performed using Stata statistical software, version 14.0 (StataCorp, College Station, TX).
RESULTS
The table shows the association between hospital characteristics and the odds of individual provider performance report use. Report use was associated with nonprofit status (odds ratio [OR], 2.77; 95% confidence interval [CI], 1.94-3.95; P < .01) compared to for-profit, large hospital size (OR, 2.37; 95% CI, 1.56-3.60; P < .01) compared to small size, highest (OR, 2.09; 95% CI, 1.55-2.82; P < .01) and second highest (OR, 1.43; 95% CI, 1.08-1.89; P = .01) quartiles of bed-adjusted expenditures compared to the bottom quartile, and West geographic region compared to Northeast (OR, 2.07; 95% CI, 1.45-2.95; P < .01). Individual provider performance use was also independently associated with participation in a health maintenance organization (OR, 1.50; 95% CI, 1.17-1.90; P < .01) or bundled payment program (OR, 1.61; 95% CI, 1.18-2.19; P < .01), controlling for other covariates. Adjustment for nonresponse bias did not change any coefficients by more than 10% (supplementary Table).
DISCUSSION
The Medicare Access and Children Health Insurance Program Reauthorization Act is accelerating the shift from quantity based toward value-based reimbursement. The proficient adoption of IT by healthcare providers has been cited as an important factor in adapting to new payment models.15 Physicians, and in particular hospitalists, who practice in an inpatient environment, may not directly access financial incentives aimed to adapt performance for value-based reimbursement. They may also have difficulty assessing their performance relative to peers and longitudinally over time. Individualized EHR-based provider-level performance reports offer 1 option for hospitals to measure performance and provide comparative feedback at the individual physician level. Our findings show that, in fact, a majority of US hospitals have made investments in the infrastructure necessary to create such profiles.
Nevertheless, a third of the hospitals surveyed have not adopted individualized provider performance profiles. If meeting efficiency and outcomes goals for value-based payments necessitates changes to individual provider behavior, those hospitals may be less well positioned to benefit from value-based payment models that incentivize hospitals for efficiency and outcomes. Furthermore, while we observe widespread adoption of individual performance profiles, it is unclear whether those were used to provide feedback to providers, and if so, how the feedback provided may influence its effect on behavior. Behavioral economics theory suggests, for example, that publicly reporting performance compared to peers provides stronger incentives for behavior change than “blinded” personalized reports.16
Our study has important limitations. We cannot exclude the possibility that unmeasured variables help explain individual provider performance adoption. These omitted variables may confound the association between hospital characteristics and individual provider performance adoption observed in this study. We were also unable to establish causality between bundled payments and individual provider performance profile use. For instance, hospitals may elect to make investments in IT infrastructure to enable individual provider performance profile adoption in anticipation of bundled payment reforms. Alternatively, the availability of IPPs may have led hospitals to enter bundled payments reimbursement arrangements. In addition, we are unable to describe how individual provider performance use affects physician practice or healthcare delivery more broadly. Finally, we are also unable to account for other sources of performance data. For example, some physician may receive data from their physician practice groups.
Our study suggests several avenues for future research. First, more work is needed to understand why certain types of hospitals are more likely to use IPPs. Our findings indicate that IPP use may be partly a function of hospital size and resources. However, other factors not measured here may play an important role as well, such as institutional culture. Institutions with a focus on informatics and strong IT leadership may be more likely to use their EHR to monitor performance. Second, further research should explore in greater depth how profiles are used. Future research should evaluate, for example, how hospitals are using behavioral economic principles, such as peer comparison, to motivate behavior change, and if such techniques have successfully influenced practice and patient outcomes. Ultimately, multicentered, randomized evaluations of IPP use may be necessary to understand their risks and evaluate their effect on patient outcomes. This work is necessary to inform policy and practice as hospitals transition from fee-for-service to value-based reimbursement.
In sum, we observed increasing adoption of individualized electronic provider performance profiles by US hospitals from 2013 to 2015. Hospitals that did not use IPPs were more likely to be small, for profit, and less likely to participate in bundled payment programs. Those hospitals may be less well positioned to track provider performance and implement incentives for provider behavior changes needed to meet targets for value-based reimbursement.
Disclosure
Dr. Rolnick is a consultant to Tuple Health, Inc. and was a part-time employee of Acumen, LLC outside the submitted work. Dr. Ryskina has nothing to disclose.
1. Hussey PS, Liu JL, White C. The Medicare Access And CHIP Reauthorization Act: effects On Medicare payment policy and spending. Health Aff. 2017;36(4):697-705. PubMed
2. Navathe AS, Song Z, Emanuel EJ. The next generation of episode-based payments. JAMA. 2017;317(23):2371-2372. PubMed
3. Tsugawa Y, Jha AK, Newhouse JP, Zaslavsky AM, Jena AB. Variation in physician spending and association with patient outcomes. JAMA Intern Med. 2017;177(5):675-682. PubMed
4. Saint S, Wiese J, Amory JK, et al. Are physicians aware of which of their patients have indwelling urinary catheters? Am J Med. 2000;109(6):476-480. PubMed
5. Saturno PJ, Palmer RH, Gascón JJ. Physician attitudes, self-estimated performance and actual compliance with locally peer-defined quality evaluation criteria. Int J Qual Health Care J Int Soc Qual Health Care. 1999;11(6):487-496. PubMed
6. Mehrotra A, Sorbero MES, Damberg CL. Using the lessons of behavioral economics to design more effective pay-for-performance programs. Am J Manag Care. 2010;16(7):497-503. PubMed
7. Emanuel EJ, Ubel PA, Kessler JB, et al. Using behavioral economics to design physician Incentives that deliver high-value care. Ann Intern Med. 2016;164(2):114-119. PubMed
8. Liao JM, Fleisher LA, Navathe AS. Increasing the value of social comparisons of physician performance using norms. JAMA. 2016;316(11):1151-1152. PubMed
9. Michtalik HJ, Carolan HT, Haut ER, et al. Use of provider-level dashboards and pay-for-performance in venous thromboembolism prophylaxis. J Hosp Med. 2015;10(3):172-178. PubMed
10. Kurtzman G, Dine J, Epstein A, et al. Internal medicine resident engagement with a laboratory utilization dashboard: mixed methods study. J Hosp Med. 12(9):743-746. PubMed
11. Linder JA, Schnipper JL, Tsurikova R, et al. Electronic health record feedback to improve antibiotic prescribing for acute respiratory infections. Am J Manag Care. 2010;16 (12 Suppl HIT):e311-e319. PubMed
12. Jha AK, DesRoches CM, Campbell EG, et al. Use of electronic health records in U.S. hospitals. N Engl J Med. 2009;360(16):1628-1638. PubMed
13. Walker DM, Mora AM, Scheck McAlearney A. Accountable care organization hospitals differ in health IT capabilities. Am J Manag Care. 2016;22(12):802-807. PubMed
14. Adler-Milstein J, DesRoches CM, Furukawa MF, et al. More than half of US hospitals have at least a basic EHR, but stage 2 criteria remain challenging for most. Health Aff 2014;33(9):1664-1671. PubMed
15. Porter ME. A strategy for health care reform—toward a value-based system. N Engl J Med. 2009;361(2):109-112. PubMed
16. Navathe AS, Emanuel EJ. Physician peer comparisons as a nonfinancial strategy to improve the value of care. JAMA. 2016;316(17):1759-1760. PubMed
© 2018 Society of Hospital Medicine
Collaborations with Pediatric Hospitalists: National Surveys of Pediatric Surgeons and Orthopedic Surgeons
Pediatric expertise is critical in caring for children during the perioperative and postoperative periods.1,2 Some postoperative care models involve pediatric hospitalists (PH) as collaborators for global care (comanagement),3 as consultants for specific issues, or not at all.
Single-site studies in specific pediatric surgical populations4-7and medically fragile adults8 suggest improved outcomes for patients and systems by using hospitalist-surgeon collaboration. However, including PH in the care of surgical patients may also disrupt systems. No studies have broadly examined the clinical relationships between surgeons and PH.
The aims of this cross-sectional survey of US pediatric surgeons (PS) and pediatric orthopedic surgeons (OS) were to understand (1) the prevalence and characteristics of surgical care models in pediatrics, specifically those involving PH, and (2) surgeons’ perceptions of PH in caring for surgical patients.
METHODS
The target US surgeon population was the estimated 850 active PS and at least 600 pediatric OS.9 Most US PS (n = 606) are affiliated with the American Academy of Pediatrics (AAP) Section on Surgery (SoSu), representing at least 200 programs. Nearly all pediatric OS belong to the Pediatric Orthopedic Society of North America (POSNA) (n = 706), representing 340 programs; a subset (n = 130) also belong to the AAP SoSu.
Survey Development and Distribution
Survey questions were developed to elicit surgeons’ descriptions of their program structure and their perceptions of PH involvement. For programs with PH involvement, program variables included primary assignment of clinical responsibilities by service line (surgery, hospitalist, shared) and use of a written service agreement, which defines each service’s roles and responsibilities.
The web-based survey, created by using Survey Monkey (San Mateo, CA), was pilot tested for usability and clarity among 8 surgeons and 1 PH. The survey had logic points around involvement of hospitalists and multiple hospital affiliations (supplemental Appendix A). The survey request with a web-based link was e-mailed 3 times to surgical and orthopedic distribution outlets, endorsed by organizational leadership. Respondents’ hospital ZIP codes were used as a proxy for program. If there was more than 1 complete survey response per ZIP code, 1 response with complete data was randomly selected to ensure a unique entry per program.
Classification of Care Models
Each surgical program was classified into 1 of the following 3 categories based on reported care of primary surgical patients: (1) comanagement, described as PH writing orders and/or functioning as the primary service; (2) consultation, described as PH providing clinical recommendations only; and (3) no PH involvement, described as “rarely” or “never” involving PH.
Clinical Responsibility Score
To estimate the degree of hospitalist involvement, we devised and calculated a composite score of service responsibilities for each program. This score involved the following 7 clinical domains: management of fluids or nutrition, pain, comorbidities, antibiotics, medication dosing, wound care, and discharge planning. Scores were summed for each domain: 0 for surgical team primary responsibility, 1 for shared surgical and hospitalist responsibility, and 2 for hospitalist primary responsibility. Composite scores could range from 0 to 14; lower scores represented a stronger tendency for surgeon management, and higher scores represented a stronger tendency toward PH management.
Data Analysis
For data analysis, simple exploratory tests with χ2 analysis and Student t tests were performed by using Stata 14.2 (StataCorp LLC, College Station, TX) to compare differences by surgical specialty programs and individuals by role assignment and perceptions of PH involvement.
The NYU School of Medicine Institutional Review Board approved this study.
RESULTS
Respondents and Programs
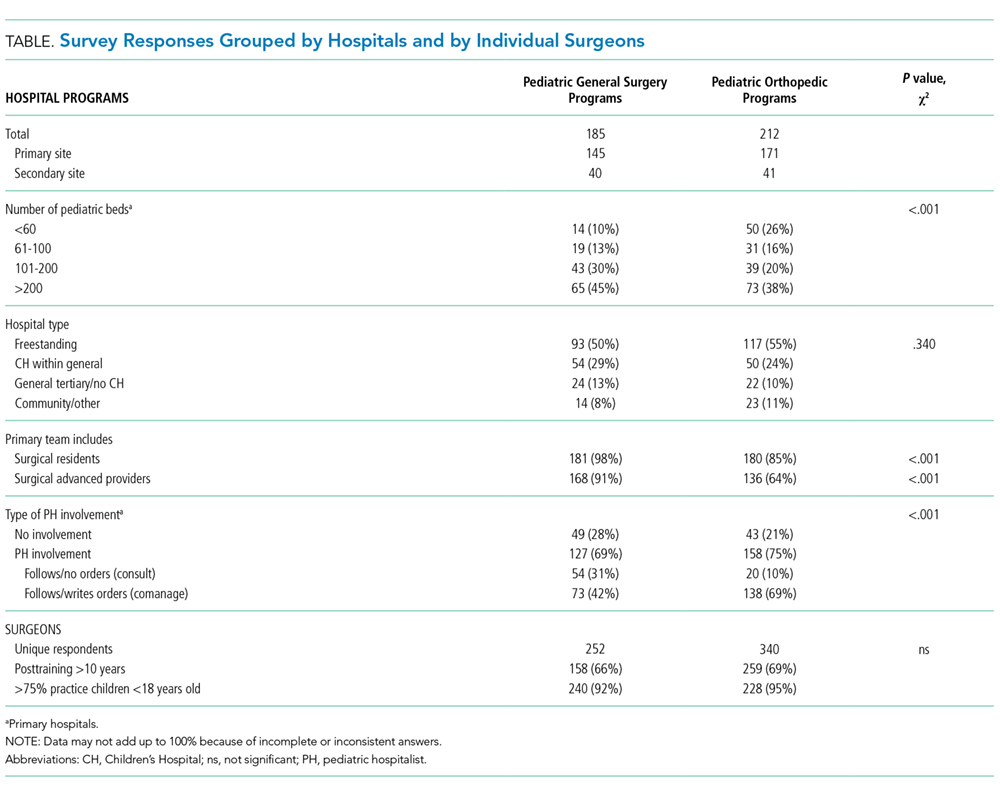
Among the unique 185 PS programs and 212 OS programs represented, PH were often engaged in the care of primary surgical patients (Table).
Roles of PH in Collaborative Programs
Among programs that reported any hospitalist involvement (PS, n = 100; OS, n = 157), few (≤15%) programs involved hospitalists with all patients. Pediatric OS programs were significantly more likely than pediatric surgical programs to involve PH for healthy patients with any high-risk surgery (27% vs 9%; P = .001). Most PS (64%) and OS (83%) reported involving PH for all medically complex patients, regardless of surgery risk (P = .003).
In programs involving PH, few PS (11%) or OS programs (16%) reported by using a written service agreement.
Care of Surgical Patients in PH-involved programs
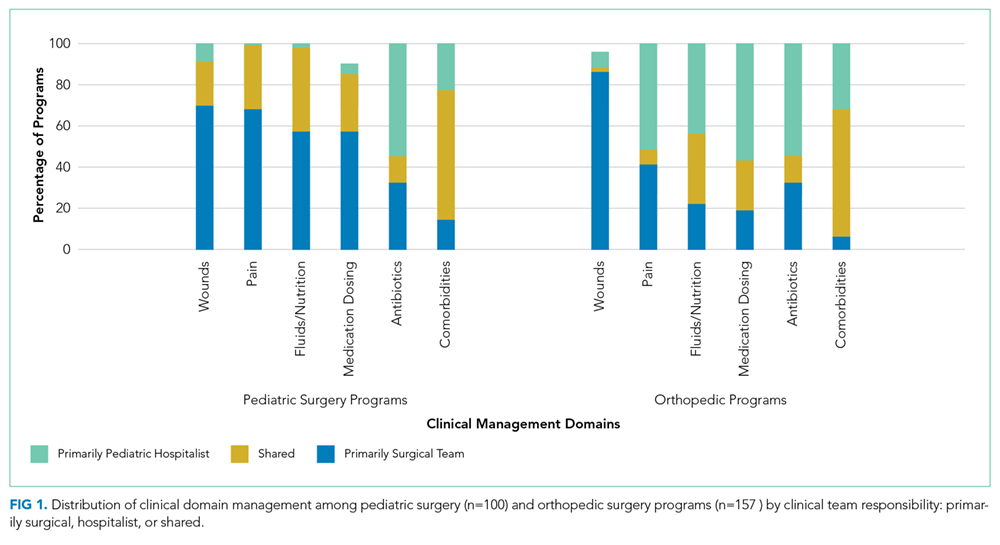
Composite clinical responsibility scores ranged from 0 to 8, with a median score of 2.3 (interquartile range [IQR] 0-3) for consultation programs and 5 (IQR 1-7) for comanagement programs. Composite scores were higher for OS (7.4; SD 3.4) versus PS (3.3; SD 3.4) programs (P < .001; 95% CI, 3.3-5.5; supplemental Appendix C).
Surgeons’ Perspectives on Hospitalist Involvement
Surgeons in programs without PH involvement viewed PH overall impact less positively than those with PH (27% vs 58%). Among all surgeons surveyed, few perceived positive (agree/strongly agree) PH impact on pain management (<15%) or decreasing LOS (<15%; supplemental Appendix D).
Most surgeons (n = 355) believed that PH financial support should come from separate billing (“patient fee”) (48%) or hospital budget (36%). Only 17% endorsed PH receiving part of the surgical global fee, with no significant difference by surgical specialty or current PH involvement status.
DISCUSSION
This study is the first comprehensive assessment of surgeons’ perspectives on the involvement and effectiveness of PH in the postoperative care of children undergoing inpatient general or orthopedic surgeries. The high prevalence (>70%) of PH involvement among responding surgical programs suggests that PH comanagement of hospitalized patients merits attention from providers, systems, educators, and payors.
Collaboration and Roles are Correlated with Surgical Specialty and Setting
Forty percent of inpatient pediatric surgeries occur outside of children’s hospitals.10 We found that PH involvement was higher at smaller and general hospitals where PH may provide pediatric expertise when insufficient pediatric resources, like pain teams, exist.7 Alternately, some quaternary centers have dedicated surgical hospitalists. The extensive involvement of PH in the bulk of certain clinical care domains, especially care coordination, in OS and in many PS programs (Figure) suggests that PH are well integrated into many programs and provide essential clinical care.
In many large freestanding children’s hospitals, though, surgical teams may have sufficient depth and breadth to manage most aspects of care. There may be an exception for care coordination of medically complex patients. Care coordination is a patient- and family-centered care best practice,11 encompasses integrating and aligning medical care among clinical services, and is focused on shared decision making and communication. High-quality care coordination processes are of great value to patients and families, especially in medically complex children,11 and are associated with improved transitions from hospital to home.12 Well-planned transitions likely decrease these special populations’ postoperative readmission risk, complications, and prolonged length of stay.13 Reimbursement for these services could integrate these contributions needed for safe and patient-centered pediatric inpatient surgical care.
Perceptions of PH Impact
The variation in perception of PH by surgical specialty, with higher prevalence as well as higher regard for PH among OS, is intriguing. This disparity may reflect current training and clinical expectations of each surgical specialty, with larger emphasis on medical management for surgical compared with orthopedic curricula (www.acgme.org).
While PS and OS respondents perceived that PH involvement did not influence length of stay, pain management, and resource use, single-site studies suggest otherwise.4,8,14 Objective data on the impact of PH involvement on patient and systems outcomes may help elucidate whether this is a perceived or actual lack of impact. Future metrics might include pain scores, patient centered care measures on communication and coordination, patient complaints and/or lawsuits, resource utilization and/or cost, readmission, and medical errors.
This study has several limitations. There is likely a (self) selection bias by surgeons with either strongly positive or negative views of PH involvement. Future studies may target a random sampling of programs rather than a cross-sectional survey of individual providers. Relatively few respondents represented community hospitals, possibly because these facilities are staffed by general OS and general surgeons10 who were not included in this sample.
CONCLUSION
Given the high prevalence of PH involvement in caring for surgical pediatric patients in varied settings, the field of pediatric hospital medicine should support increased PH training and standardized practice around perioperative management, particularly for medically complex patients with increased care coordination needs. Surgical comanagement, including interdisciplinary communication skills, deserves inclusion as a PH core competency and as an entrustable professional activity for pediatric hospital medicine and pediatric graduate medical education programs,15 especially orthopedic surgeries.
Further research on effective and evidence-based pediatric postoperative care and collaboration models will help PH and surgeons to most effectively and respectfully partner to improve care.
Acknowledgments
The authors thank the members of the AAP Section on Hospital Medicine Surgical Care Subcommittee, AAP SOHM leadership, and Ms. Alexandra Case.
Disclosure
The authors have no conflicts of interest relevant to this manuscript to report. This study was supported in part by the Agency for Health Care Research and Quality (LM, R00HS022198).
1. Task Force for Children’s Surgical Care. Optimal resources for children’s surgical care in the United States. J Am Coll Surg. 2014;218(3):479-487, 487.e1-4. PubMed
2. Section on Hospital Medicine, American Academy of Pediatrics. Guiding principles for pediatric hospital medicine programs. Pediatrics. 2013;132(4):782-786. PubMed
3. Freiburg C, James T, Ashikaga T, Moalem J, Cherr G. Strategies to accommodate resident work-hour restrictions: Impact on surgical education. J Surg Educ. 2011;68(5):387-392. PubMed
4. Pressel DM, Rappaport DI, Watson N. Nurses’ assessment of pediatric physicians: Are hospitalists different? J Healthc Manag. 2008;53(1):14-24; discussion 24-25. PubMed
5. Simon TD, Eilert R, Dickinson LM, Kempe A, Benefield E, Berman S. Pediatric hospitalist comanagement of spinal fusion surgery patients. J Hosp Med. 2007;2(1):23-30. PubMed
6. Rosenberg RE, Ardalan K, Wong W, et al. Postoperative spinal fusion care in pediatric patients: Co-management decreases length of stay. Bull Hosp Jt Dis (2013). 2014;72(3):197-203. PubMed
7. Dua K, McAvoy WC, Klaus SA, Rappaport DI, Rosenberg RE, Abzug JM. Hospitalist co-management of pediatric orthopaedic surgical patients at a community hospital. Md Med. 2016;17(1):34-36. PubMed
8. Rohatgi N, Loftus P, Grujic O, Cullen M, Hopkins J, Ahuja N. Surgical comanagement by hospitalists improves patient outcomes: A propensity score analysis. Ann Surg. 2016;264(2):275-282. PubMed
9. Poley S, Ricketts T, Belsky D, Gaul K. Pediatric surgeons: Subspecialists increase faster than generalists. Bull Amer Coll Surg. 2010;95(10):36-39. PubMed
10. Somme S, Bronsert M, Morrato E, Ziegler M. Frequency and variety of inpatient pediatric surgical procedures in the United States. Pediatrics. 2013;132(6):e1466-e1472. PubMed
11. Frampton SB, Guastello S, Hoy L, Naylor M, Sheridan S, Johnston-Fleece M, eds. Harnessing Evidence and Experience to Change Culture: A Guiding Framework for Patient and Family Engaged Care. Washington, DC: National Academies of Medicine; 2017.
12. Auger KA, Kenyon CC, Feudtner C, Davis MM. Pediatric hospital discharge interventions to reduce subsequent utilization: A systematic review. J Hosp Med. 2014;9(4):251-260. PubMed
13. Simon TD, Berry J, Feudtner C, et al. Children with complex chronic conditions in inpatient hospital settings in the united states. Pediatrics. 2010;126(4):647-655. PubMed
14. Rappaport DI, Adelizzi-Delany J, Rogers KJ, et al. Outcomes and costs associated with hospitalist comanagement of medically complex children undergoing spinal fusion surgery. Hosp Pediatr. 2013;3(3):233-241. PubMed
15. Jerardi K, Meier K, Shaughnessy E. Management of postoperative pediatric patients. MedEdPORTAL. 2015;11:10241. doi:10.15766/mep_2374-8265.10241.
Pediatric expertise is critical in caring for children during the perioperative and postoperative periods.1,2 Some postoperative care models involve pediatric hospitalists (PH) as collaborators for global care (comanagement),3 as consultants for specific issues, or not at all.
Single-site studies in specific pediatric surgical populations4-7and medically fragile adults8 suggest improved outcomes for patients and systems by using hospitalist-surgeon collaboration. However, including PH in the care of surgical patients may also disrupt systems. No studies have broadly examined the clinical relationships between surgeons and PH.
The aims of this cross-sectional survey of US pediatric surgeons (PS) and pediatric orthopedic surgeons (OS) were to understand (1) the prevalence and characteristics of surgical care models in pediatrics, specifically those involving PH, and (2) surgeons’ perceptions of PH in caring for surgical patients.
METHODS
The target US surgeon population was the estimated 850 active PS and at least 600 pediatric OS.9 Most US PS (n = 606) are affiliated with the American Academy of Pediatrics (AAP) Section on Surgery (SoSu), representing at least 200 programs. Nearly all pediatric OS belong to the Pediatric Orthopedic Society of North America (POSNA) (n = 706), representing 340 programs; a subset (n = 130) also belong to the AAP SoSu.
Survey Development and Distribution
Survey questions were developed to elicit surgeons’ descriptions of their program structure and their perceptions of PH involvement. For programs with PH involvement, program variables included primary assignment of clinical responsibilities by service line (surgery, hospitalist, shared) and use of a written service agreement, which defines each service’s roles and responsibilities.
The web-based survey, created by using Survey Monkey (San Mateo, CA), was pilot tested for usability and clarity among 8 surgeons and 1 PH. The survey had logic points around involvement of hospitalists and multiple hospital affiliations (supplemental Appendix A). The survey request with a web-based link was e-mailed 3 times to surgical and orthopedic distribution outlets, endorsed by organizational leadership. Respondents’ hospital ZIP codes were used as a proxy for program. If there was more than 1 complete survey response per ZIP code, 1 response with complete data was randomly selected to ensure a unique entry per program.
Classification of Care Models
Each surgical program was classified into 1 of the following 3 categories based on reported care of primary surgical patients: (1) comanagement, described as PH writing orders and/or functioning as the primary service; (2) consultation, described as PH providing clinical recommendations only; and (3) no PH involvement, described as “rarely” or “never” involving PH.
Clinical Responsibility Score
To estimate the degree of hospitalist involvement, we devised and calculated a composite score of service responsibilities for each program. This score involved the following 7 clinical domains: management of fluids or nutrition, pain, comorbidities, antibiotics, medication dosing, wound care, and discharge planning. Scores were summed for each domain: 0 for surgical team primary responsibility, 1 for shared surgical and hospitalist responsibility, and 2 for hospitalist primary responsibility. Composite scores could range from 0 to 14; lower scores represented a stronger tendency for surgeon management, and higher scores represented a stronger tendency toward PH management.
Data Analysis
For data analysis, simple exploratory tests with χ2 analysis and Student t tests were performed by using Stata 14.2 (StataCorp LLC, College Station, TX) to compare differences by surgical specialty programs and individuals by role assignment and perceptions of PH involvement.
The NYU School of Medicine Institutional Review Board approved this study.
RESULTS
Respondents and Programs
Among the unique 185 PS programs and 212 OS programs represented, PH were often engaged in the care of primary surgical patients (Table).
Roles of PH in Collaborative Programs
Among programs that reported any hospitalist involvement (PS, n = 100; OS, n = 157), few (≤15%) programs involved hospitalists with all patients. Pediatric OS programs were significantly more likely than pediatric surgical programs to involve PH for healthy patients with any high-risk surgery (27% vs 9%; P = .001). Most PS (64%) and OS (83%) reported involving PH for all medically complex patients, regardless of surgery risk (P = .003).
In programs involving PH, few PS (11%) or OS programs (16%) reported by using a written service agreement.
Care of Surgical Patients in PH-involved programs
Composite clinical responsibility scores ranged from 0 to 8, with a median score of 2.3 (interquartile range [IQR] 0-3) for consultation programs and 5 (IQR 1-7) for comanagement programs. Composite scores were higher for OS (7.4; SD 3.4) versus PS (3.3; SD 3.4) programs (P < .001; 95% CI, 3.3-5.5; supplemental Appendix C).
Surgeons’ Perspectives on Hospitalist Involvement
Surgeons in programs without PH involvement viewed PH overall impact less positively than those with PH (27% vs 58%). Among all surgeons surveyed, few perceived positive (agree/strongly agree) PH impact on pain management (<15%) or decreasing LOS (<15%; supplemental Appendix D).
Most surgeons (n = 355) believed that PH financial support should come from separate billing (“patient fee”) (48%) or hospital budget (36%). Only 17% endorsed PH receiving part of the surgical global fee, with no significant difference by surgical specialty or current PH involvement status.
DISCUSSION
This study is the first comprehensive assessment of surgeons’ perspectives on the involvement and effectiveness of PH in the postoperative care of children undergoing inpatient general or orthopedic surgeries. The high prevalence (>70%) of PH involvement among responding surgical programs suggests that PH comanagement of hospitalized patients merits attention from providers, systems, educators, and payors.
Collaboration and Roles are Correlated with Surgical Specialty and Setting
Forty percent of inpatient pediatric surgeries occur outside of children’s hospitals.10 We found that PH involvement was higher at smaller and general hospitals where PH may provide pediatric expertise when insufficient pediatric resources, like pain teams, exist.7 Alternately, some quaternary centers have dedicated surgical hospitalists. The extensive involvement of PH in the bulk of certain clinical care domains, especially care coordination, in OS and in many PS programs (Figure) suggests that PH are well integrated into many programs and provide essential clinical care.
In many large freestanding children’s hospitals, though, surgical teams may have sufficient depth and breadth to manage most aspects of care. There may be an exception for care coordination of medically complex patients. Care coordination is a patient- and family-centered care best practice,11 encompasses integrating and aligning medical care among clinical services, and is focused on shared decision making and communication. High-quality care coordination processes are of great value to patients and families, especially in medically complex children,11 and are associated with improved transitions from hospital to home.12 Well-planned transitions likely decrease these special populations’ postoperative readmission risk, complications, and prolonged length of stay.13 Reimbursement for these services could integrate these contributions needed for safe and patient-centered pediatric inpatient surgical care.
Perceptions of PH Impact
The variation in perception of PH by surgical specialty, with higher prevalence as well as higher regard for PH among OS, is intriguing. This disparity may reflect current training and clinical expectations of each surgical specialty, with larger emphasis on medical management for surgical compared with orthopedic curricula (www.acgme.org).
While PS and OS respondents perceived that PH involvement did not influence length of stay, pain management, and resource use, single-site studies suggest otherwise.4,8,14 Objective data on the impact of PH involvement on patient and systems outcomes may help elucidate whether this is a perceived or actual lack of impact. Future metrics might include pain scores, patient centered care measures on communication and coordination, patient complaints and/or lawsuits, resource utilization and/or cost, readmission, and medical errors.
This study has several limitations. There is likely a (self) selection bias by surgeons with either strongly positive or negative views of PH involvement. Future studies may target a random sampling of programs rather than a cross-sectional survey of individual providers. Relatively few respondents represented community hospitals, possibly because these facilities are staffed by general OS and general surgeons10 who were not included in this sample.
CONCLUSION
Given the high prevalence of PH involvement in caring for surgical pediatric patients in varied settings, the field of pediatric hospital medicine should support increased PH training and standardized practice around perioperative management, particularly for medically complex patients with increased care coordination needs. Surgical comanagement, including interdisciplinary communication skills, deserves inclusion as a PH core competency and as an entrustable professional activity for pediatric hospital medicine and pediatric graduate medical education programs,15 especially orthopedic surgeries.
Further research on effective and evidence-based pediatric postoperative care and collaboration models will help PH and surgeons to most effectively and respectfully partner to improve care.
Acknowledgments
The authors thank the members of the AAP Section on Hospital Medicine Surgical Care Subcommittee, AAP SOHM leadership, and Ms. Alexandra Case.
Disclosure
The authors have no conflicts of interest relevant to this manuscript to report. This study was supported in part by the Agency for Health Care Research and Quality (LM, R00HS022198).
1. Task Force for Children’s Surgical Care. Optimal resources for children’s surgical care in the United States. J Am Coll Surg. 2014;218(3):479-487, 487.e1-4. PubMed
2. Section on Hospital Medicine, American Academy of Pediatrics. Guiding principles for pediatric hospital medicine programs. Pediatrics. 2013;132(4):782-786. PubMed
3. Freiburg C, James T, Ashikaga T, Moalem J, Cherr G. Strategies to accommodate resident work-hour restrictions: Impact on surgical education. J Surg Educ. 2011;68(5):387-392. PubMed
4. Pressel DM, Rappaport DI, Watson N. Nurses’ assessment of pediatric physicians: Are hospitalists different? J Healthc Manag. 2008;53(1):14-24; discussion 24-25. PubMed
5. Simon TD, Eilert R, Dickinson LM, Kempe A, Benefield E, Berman S. Pediatric hospitalist comanagement of spinal fusion surgery patients. J Hosp Med. 2007;2(1):23-30. PubMed
6. Rosenberg RE, Ardalan K, Wong W, et al. Postoperative spinal fusion care in pediatric patients: Co-management decreases length of stay. Bull Hosp Jt Dis (2013). 2014;72(3):197-203. PubMed
7. Dua K, McAvoy WC, Klaus SA, Rappaport DI, Rosenberg RE, Abzug JM. Hospitalist co-management of pediatric orthopaedic surgical patients at a community hospital. Md Med. 2016;17(1):34-36. PubMed
8. Rohatgi N, Loftus P, Grujic O, Cullen M, Hopkins J, Ahuja N. Surgical comanagement by hospitalists improves patient outcomes: A propensity score analysis. Ann Surg. 2016;264(2):275-282. PubMed
9. Poley S, Ricketts T, Belsky D, Gaul K. Pediatric surgeons: Subspecialists increase faster than generalists. Bull Amer Coll Surg. 2010;95(10):36-39. PubMed
10. Somme S, Bronsert M, Morrato E, Ziegler M. Frequency and variety of inpatient pediatric surgical procedures in the United States. Pediatrics. 2013;132(6):e1466-e1472. PubMed
11. Frampton SB, Guastello S, Hoy L, Naylor M, Sheridan S, Johnston-Fleece M, eds. Harnessing Evidence and Experience to Change Culture: A Guiding Framework for Patient and Family Engaged Care. Washington, DC: National Academies of Medicine; 2017.
12. Auger KA, Kenyon CC, Feudtner C, Davis MM. Pediatric hospital discharge interventions to reduce subsequent utilization: A systematic review. J Hosp Med. 2014;9(4):251-260. PubMed
13. Simon TD, Berry J, Feudtner C, et al. Children with complex chronic conditions in inpatient hospital settings in the united states. Pediatrics. 2010;126(4):647-655. PubMed
14. Rappaport DI, Adelizzi-Delany J, Rogers KJ, et al. Outcomes and costs associated with hospitalist comanagement of medically complex children undergoing spinal fusion surgery. Hosp Pediatr. 2013;3(3):233-241. PubMed
15. Jerardi K, Meier K, Shaughnessy E. Management of postoperative pediatric patients. MedEdPORTAL. 2015;11:10241. doi:10.15766/mep_2374-8265.10241.
© 2018 Society of Hospital Medicine
Trends in Inpatient Admission Comorbidity and Electronic Health Data: Implications for Resident Workload Intensity
Since the
METHODS
We conducted an observational, retrospective assessment of all admissions to the Louis Stokes Cleveland VA Medical Center (LSCVAMC) internal medicine service from January 1, 2000 to December 31, 2015. The inclusion criteria were admission to non-ICU internal medicine services and an admission note written by a resident physician. Otherwise, there were no exclusions. Data were accessed using VA Informatics and Computing Infrastructure. This study was approved by the LSCVAMC institutional review board.
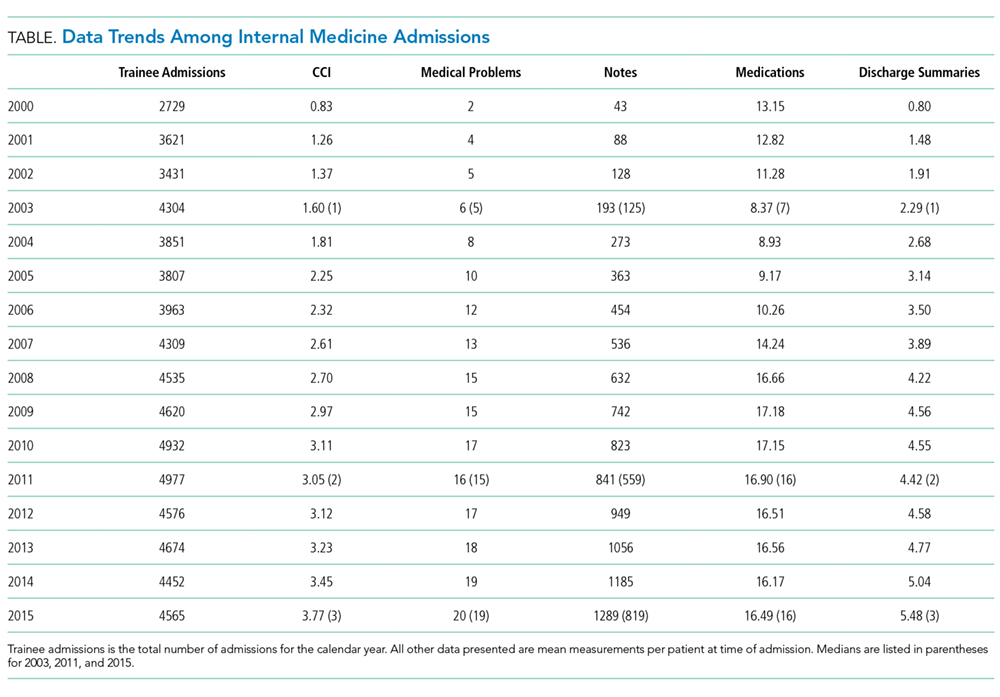
RESULTS
A total of 67,346 admissions were included in the analysis. All parameters increased from 2000 to 2015. Mean CCI increased from 1.60 in 2003 (95% CI, 1.54–1.65) to 3.05 in 2011 (95% CI, 2.97–3.13) and to 3.77 in 2015 (95% CI, 3.67–3.87). Mean number of comorbidities increased from 6.21 in 2003 (95% CI, 6.05–6.36) to 16.09 in 2011 (95% CI, 15.84–16.34) and to 19.89 in 2015 (95% CI, 19.57–20.21). Mean number of notes increased from 193 in 2003 (95% CI, 186–199) to 841 in 2011 (95% CI, 815–868) and to 1289 in 2015 (95% CI, 1243–1335). Mean number of medications increased from 8.37 in 2003 (95% CI, 8.15–8.59) to 16.89 in 2011 (95% CI 16.60–17.20) and decreased to 16.49 in 2015 (95% CI, 16.18–16.80). Mean number of discharge summaries available at admission increased from 2.29 in 2003 (95% CI, 2.19–2.38) to 4.42 in 2011 (95% CI, 4.27–4.58) and to 5.48 in 2015 (95% CI, 5.27–5.69).
DISCUSSION
This retrospective, observational study shows that patient comorbidity and EHR data burden have increased over time, both of which impact resident workload at the time of admission. These findings, combined with the duty hour regulations, suggest that resident workload intensity at the time of admission may be increasing over time.
Patient comorbidity has likely increased due to a combination of factors. Elective admissions have decreased, and demographics have changed consistent with an aging population. Trainee admissions patterns also have changed over time, with less-acute admissions often admitted to nonacademic providers. Additionally, there are more stringent requirements for inpatient admissions, resulting in higher acuity and comorbidity.
As EHRs have matured and documentation requirements have expanded, the amount of electronic data has grown per patient, substantially increasing the time required to review a patient’s medical record.5,10 In our evaluation, all EHR metrics increased between 2003 and 2011. The only metric that did not increase between 2011 and 2015 was the mean number of medications. The number of notes per patient has shown a dramatic increase. Even in an EHR that has reached maturity (in use more than 10 years), the number of notes per patient still increased by greater than 50% between 2011 and 2015. The VA EHR has been in use for more than 15 years, making it an ideal resource to study data trends. As many EHRs are in their infancy in comparison, these data may serve as a predictor of how other EHRs will mature. While all notes are not reviewed at every admission, this illustrates how increasing data burden combined with poor usability can be time consuming and promote inefficient patient care.11 Moreover, many argue that poor EHR usability also affects cognitive workflow and clinical decision making, a task that is of utmost value to patient quality and safety as well as resident education.12Common program requirements for internal medicine as set forth by the ACGME state that residency programs should give adequate attention to scheduling, work intensity, and work compression to optimize resident well-being and prevent burnout.13 Resident workload intensity is multifaceted and encompasses many elements, including patient census and acuity, EHR data assessment, components of patient complexity such as comorbidity and psychosocial situation, and time.13 The work intensity increases with increase in the overall patient census, complexity, acuity, or data burden. Similarly, work intensity increases with time restrictions for patient care (in the form of duty hours). In addition, work intensity is affected by the time allotted for nonclinical responsibilities, such as morning reports and conferences, as these decrease the amount of time a resident can spend providing patient care.
Many programs have responded to the duty hour restrictions by decreasing patient caps.14 Our data suggest that decreasing patient census alone may not adequately mitigate the workload intensity of residents. There are other alternatives to prevent the increasing workload intensity that may have already been employed by some institutions. One such method is that programs can take into account patient complexity or acuity when allocating patients to teaching teams.14 Another method is to adjust the time spent on ancillary tasks such as obtaining outside hospital records, transporting patients, and scheduling follow-up appointments. Foregoing routine conferences such as morning reports or noon conferences would decrease work intensity, although obviously at the expense of resident education. Geographic rounding can encourage more efficient use of clinical time. One of the most difficult, but potentially impactful strategies would be to streamline EHRs to simplify and speed documentation, refocus regulations, and support and build based on the view of clinicians.15
The main limitations of this study include its retrospective design, single-center site, and focus on the internal medicine admissions to a VA hospital. Therefore, these findings may not be generalizable to other patient populations and training programs. Another potential limitation may be that changes in documentation practices have led to “upcoding” of patient comorbidy within the EHR. In addition, in this study, we looked only at the data available at the time of admission. To get a more complete picture of true workload intensity, understanding the day-to-day metrics of inpatient care would be crucial.
CONCLUSION
Our study demonstrates that components of resident workload (patient comorbidity and EHR data burden), specifically at the time of admission, have increased over time. These findings, combined with the duty hour regulations, suggest resident workload intensity at the time of admission has increased over time. This can have significant implications regarding graduate medical education, patient safety, and burnout. To optimize resident workload, innovation will be required in the areas of workflow, informatics, and curriculum. Future studies to assess the workload and intensity of the course of the entire patient hospitalization are needed.
Acknowledgments
The authors thank Paul E. Drawz, MD, MHS, MS (University of Minnesota) for contributions in designing and reviewing the study.
Ethical approval: The study was approved by the Institutional Review Board at the LSCVAMC. The contents do not represent the views of the U.S. Department of Veterans Affairs or the U.S. government. This material is the result of work supported with resources and the use of facilities of the LSCVAMC.
Disclosures
The authors declare that they have no conflicts of interest to disclose.
1. Bolster L, Rourke L. The Effect of Restricting Residents’ Duty Hours on Patient Safety, Resident Well-Being, and Resident Education: An Updated Systematic Review. J Grad Med Educ. 2015;7(3):349-363. PubMed
2. Fletcher KE, Underwood W, Davis SQ, Mangrulkar RS, McMahon LF, Saint S. Effects of work hour reduction on residents’ lives: a systematic review. JAMA. 2005; 294(9):1088-1100. PubMed
3. Amin A, Choe J, Collichio F, et al. Resident Duty Hours: An Alliance for Academic Internal Medicine Position Paper. http://www.im.org/d/do/6967. Published February 2016. Accessed November 30, 2017.
4. Goitein L, Ludmerer KM. Resident workload-let’s treat the disease, not just the symptom. JAMA Intern Med. 2013;173(8):655-656. PubMed
5. Oxentenko AS, West CP, Popkave C, Weinberger SE, Kolars JC. Time spent on clinical documentation: a survey of internal medicine residents and program directors. Arch Intern Med. 2010;170(4):377-380. PubMed
6. Fletcher KE, Reed DA, Arora VM. Doing the dirty work: measuring and optimizing resident workload. J Gen Intern Med. 2011;26(1):8-9. PubMed
7. Linzer M, Levine R, Meltzer D, Poplau S, Warde C, West CP. 10 bold steps to prevent burnout in general internal medicine. J Gen Intern Med. 2014;29(1):18-20. PubMed
8. Charlson ME, Pompei P, Ales KL, MacKenzie CR. A new method of classifying prognostic comorbidity in longitudinal studies: development and validation. J Chronic Dis. 1987;40(5):373-383. PubMed
9. Deyo RA, Cherkin DC, Ciol MA. Adapting a clinical comorbidity index for use with ICD-9-CM administrative databases. J Clin Epidemiol. 1992;45(6):613-619. PubMed
10. Kuhn T, Basch P, Barr M, Yackel T, et al; Physicians MICotACo. Clinical documentation in the 21st century: executive summary of a policy position paper from the American College of Physicians. Ann Intern Med. 2015;162(4):301-303. PubMed
11. Friedberg MW, Chen PG, Van Busum KR, et al. Factors Affecting Physician Professional Satisfaction and Their Implications for Patient Care, Health Systems, and Health Policy. Rand Health Q. 2014;3(4):1. PubMed
12. Smith SW, Koppel R. Healthcare information technology’s relativity problems: a typology of how patients’ physical reality, clinicians’ mental models, and healthcare information technology differ. J Am Med Inform Assoc. 2014; 21(1):117-131. PubMed
13. ACGME Program Requirements for Graduate Medical Education in Internal Medicine. http://www.acgme.org/Portals/0/PFAssets/ProgramRequirements/140_internal_medicine_2017-07-01.pdf. Revised July 1, 2017. Accessed July 22, 2017.
14. Thanarajasingam U, McDonald FS, Halvorsen AJ, et al. Service census caps and unit-based admissions: resident workload, conference attendance, duty hour compliance, and patient safety. Mayo Clin Proc. 2012;87(4):320-327. PubMed
15. Payne TH, Corley S, Cullen TA, et al. Report of the AMIA EHR-2020 Task Force on the status and future direction of EHRs. J Am Med Inform Assoc. 2015;22(5):1102-1110. PubMed
Since the
METHODS
We conducted an observational, retrospective assessment of all admissions to the Louis Stokes Cleveland VA Medical Center (LSCVAMC) internal medicine service from January 1, 2000 to December 31, 2015. The inclusion criteria were admission to non-ICU internal medicine services and an admission note written by a resident physician. Otherwise, there were no exclusions. Data were accessed using VA Informatics and Computing Infrastructure. This study was approved by the LSCVAMC institutional review board.
RESULTS
A total of 67,346 admissions were included in the analysis. All parameters increased from 2000 to 2015. Mean CCI increased from 1.60 in 2003 (95% CI, 1.54–1.65) to 3.05 in 2011 (95% CI, 2.97–3.13) and to 3.77 in 2015 (95% CI, 3.67–3.87). Mean number of comorbidities increased from 6.21 in 2003 (95% CI, 6.05–6.36) to 16.09 in 2011 (95% CI, 15.84–16.34) and to 19.89 in 2015 (95% CI, 19.57–20.21). Mean number of notes increased from 193 in 2003 (95% CI, 186–199) to 841 in 2011 (95% CI, 815–868) and to 1289 in 2015 (95% CI, 1243–1335). Mean number of medications increased from 8.37 in 2003 (95% CI, 8.15–8.59) to 16.89 in 2011 (95% CI 16.60–17.20) and decreased to 16.49 in 2015 (95% CI, 16.18–16.80). Mean number of discharge summaries available at admission increased from 2.29 in 2003 (95% CI, 2.19–2.38) to 4.42 in 2011 (95% CI, 4.27–4.58) and to 5.48 in 2015 (95% CI, 5.27–5.69).
DISCUSSION
This retrospective, observational study shows that patient comorbidity and EHR data burden have increased over time, both of which impact resident workload at the time of admission. These findings, combined with the duty hour regulations, suggest that resident workload intensity at the time of admission may be increasing over time.
Patient comorbidity has likely increased due to a combination of factors. Elective admissions have decreased, and demographics have changed consistent with an aging population. Trainee admissions patterns also have changed over time, with less-acute admissions often admitted to nonacademic providers. Additionally, there are more stringent requirements for inpatient admissions, resulting in higher acuity and comorbidity.
As EHRs have matured and documentation requirements have expanded, the amount of electronic data has grown per patient, substantially increasing the time required to review a patient’s medical record.5,10 In our evaluation, all EHR metrics increased between 2003 and 2011. The only metric that did not increase between 2011 and 2015 was the mean number of medications. The number of notes per patient has shown a dramatic increase. Even in an EHR that has reached maturity (in use more than 10 years), the number of notes per patient still increased by greater than 50% between 2011 and 2015. The VA EHR has been in use for more than 15 years, making it an ideal resource to study data trends. As many EHRs are in their infancy in comparison, these data may serve as a predictor of how other EHRs will mature. While all notes are not reviewed at every admission, this illustrates how increasing data burden combined with poor usability can be time consuming and promote inefficient patient care.11 Moreover, many argue that poor EHR usability also affects cognitive workflow and clinical decision making, a task that is of utmost value to patient quality and safety as well as resident education.12Common program requirements for internal medicine as set forth by the ACGME state that residency programs should give adequate attention to scheduling, work intensity, and work compression to optimize resident well-being and prevent burnout.13 Resident workload intensity is multifaceted and encompasses many elements, including patient census and acuity, EHR data assessment, components of patient complexity such as comorbidity and psychosocial situation, and time.13 The work intensity increases with increase in the overall patient census, complexity, acuity, or data burden. Similarly, work intensity increases with time restrictions for patient care (in the form of duty hours). In addition, work intensity is affected by the time allotted for nonclinical responsibilities, such as morning reports and conferences, as these decrease the amount of time a resident can spend providing patient care.
Many programs have responded to the duty hour restrictions by decreasing patient caps.14 Our data suggest that decreasing patient census alone may not adequately mitigate the workload intensity of residents. There are other alternatives to prevent the increasing workload intensity that may have already been employed by some institutions. One such method is that programs can take into account patient complexity or acuity when allocating patients to teaching teams.14 Another method is to adjust the time spent on ancillary tasks such as obtaining outside hospital records, transporting patients, and scheduling follow-up appointments. Foregoing routine conferences such as morning reports or noon conferences would decrease work intensity, although obviously at the expense of resident education. Geographic rounding can encourage more efficient use of clinical time. One of the most difficult, but potentially impactful strategies would be to streamline EHRs to simplify and speed documentation, refocus regulations, and support and build based on the view of clinicians.15
The main limitations of this study include its retrospective design, single-center site, and focus on the internal medicine admissions to a VA hospital. Therefore, these findings may not be generalizable to other patient populations and training programs. Another potential limitation may be that changes in documentation practices have led to “upcoding” of patient comorbidy within the EHR. In addition, in this study, we looked only at the data available at the time of admission. To get a more complete picture of true workload intensity, understanding the day-to-day metrics of inpatient care would be crucial.
CONCLUSION
Our study demonstrates that components of resident workload (patient comorbidity and EHR data burden), specifically at the time of admission, have increased over time. These findings, combined with the duty hour regulations, suggest resident workload intensity at the time of admission has increased over time. This can have significant implications regarding graduate medical education, patient safety, and burnout. To optimize resident workload, innovation will be required in the areas of workflow, informatics, and curriculum. Future studies to assess the workload and intensity of the course of the entire patient hospitalization are needed.
Acknowledgments
The authors thank Paul E. Drawz, MD, MHS, MS (University of Minnesota) for contributions in designing and reviewing the study.
Ethical approval: The study was approved by the Institutional Review Board at the LSCVAMC. The contents do not represent the views of the U.S. Department of Veterans Affairs or the U.S. government. This material is the result of work supported with resources and the use of facilities of the LSCVAMC.
Disclosures
The authors declare that they have no conflicts of interest to disclose.
1. Bolster L, Rourke L. The Effect of Restricting Residents’ Duty Hours on Patient Safety, Resident Well-Being, and Resident Education: An Updated Systematic Review. J Grad Med Educ. 2015;7(3):349-363. PubMed
2. Fletcher KE, Underwood W, Davis SQ, Mangrulkar RS, McMahon LF, Saint S. Effects of work hour reduction on residents’ lives: a systematic review. JAMA. 2005; 294(9):1088-1100. PubMed
3. Amin A, Choe J, Collichio F, et al. Resident Duty Hours: An Alliance for Academic Internal Medicine Position Paper. http://www.im.org/d/do/6967. Published February 2016. Accessed November 30, 2017.
4. Goitein L, Ludmerer KM. Resident workload-let’s treat the disease, not just the symptom. JAMA Intern Med. 2013;173(8):655-656. PubMed
5. Oxentenko AS, West CP, Popkave C, Weinberger SE, Kolars JC. Time spent on clinical documentation: a survey of internal medicine residents and program directors. Arch Intern Med. 2010;170(4):377-380. PubMed
6. Fletcher KE, Reed DA, Arora VM. Doing the dirty work: measuring and optimizing resident workload. J Gen Intern Med. 2011;26(1):8-9. PubMed
7. Linzer M, Levine R, Meltzer D, Poplau S, Warde C, West CP. 10 bold steps to prevent burnout in general internal medicine. J Gen Intern Med. 2014;29(1):18-20. PubMed
8. Charlson ME, Pompei P, Ales KL, MacKenzie CR. A new method of classifying prognostic comorbidity in longitudinal studies: development and validation. J Chronic Dis. 1987;40(5):373-383. PubMed
9. Deyo RA, Cherkin DC, Ciol MA. Adapting a clinical comorbidity index for use with ICD-9-CM administrative databases. J Clin Epidemiol. 1992;45(6):613-619. PubMed
10. Kuhn T, Basch P, Barr M, Yackel T, et al; Physicians MICotACo. Clinical documentation in the 21st century: executive summary of a policy position paper from the American College of Physicians. Ann Intern Med. 2015;162(4):301-303. PubMed
11. Friedberg MW, Chen PG, Van Busum KR, et al. Factors Affecting Physician Professional Satisfaction and Their Implications for Patient Care, Health Systems, and Health Policy. Rand Health Q. 2014;3(4):1. PubMed
12. Smith SW, Koppel R. Healthcare information technology’s relativity problems: a typology of how patients’ physical reality, clinicians’ mental models, and healthcare information technology differ. J Am Med Inform Assoc. 2014; 21(1):117-131. PubMed
13. ACGME Program Requirements for Graduate Medical Education in Internal Medicine. http://www.acgme.org/Portals/0/PFAssets/ProgramRequirements/140_internal_medicine_2017-07-01.pdf. Revised July 1, 2017. Accessed July 22, 2017.
14. Thanarajasingam U, McDonald FS, Halvorsen AJ, et al. Service census caps and unit-based admissions: resident workload, conference attendance, duty hour compliance, and patient safety. Mayo Clin Proc. 2012;87(4):320-327. PubMed
15. Payne TH, Corley S, Cullen TA, et al. Report of the AMIA EHR-2020 Task Force on the status and future direction of EHRs. J Am Med Inform Assoc. 2015;22(5):1102-1110. PubMed
© 2018 Society of Hospital Medicine