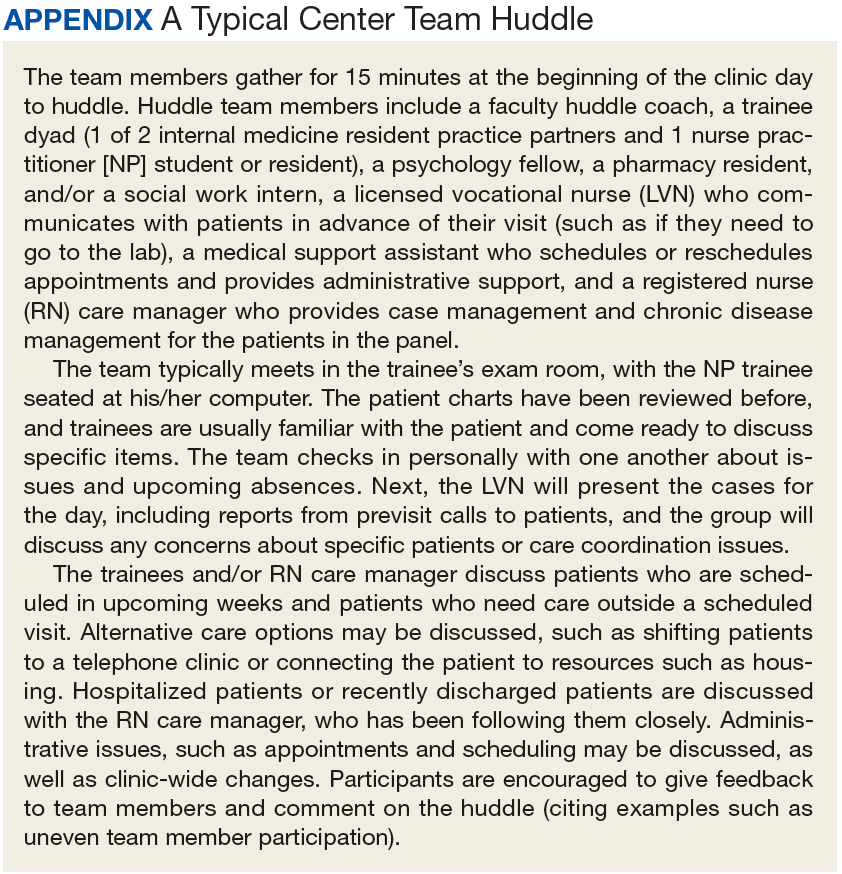
In short team huddles, trainees and PACT teamlets meet to coordinate care and identify ways to improve team processes under the guidance of faculty members who reinforce collaborative practice and continuous improvement.
In 2011, 5 US Department of Veteran Affairs (VA) medical centers were selected by the VA Office of Academic Affiliations (OAA) to establish Centers of Excellence in Primary Care Education (CoEPCE). Part of the VA New Models of Care initiative, the 5 CoEPCEs (Boise, Cleveland, San Francisco, Seattle and West Haven) are utilizing VA primary care settings to develop and test innovative approaches to prepare physician residents, nurse practitioner (NP) students and residents (postgraduate), and other health professions trainees, such as pharmacy, social work, psychology, physician assistants (PAs), dieticians, etc for primary care practice.
The CoEPCEs are interprofessional academic patient aligned care teams (PACTs) defined by VA as a PACT that has at least 2 professions of trainees on the team engaged in learning.
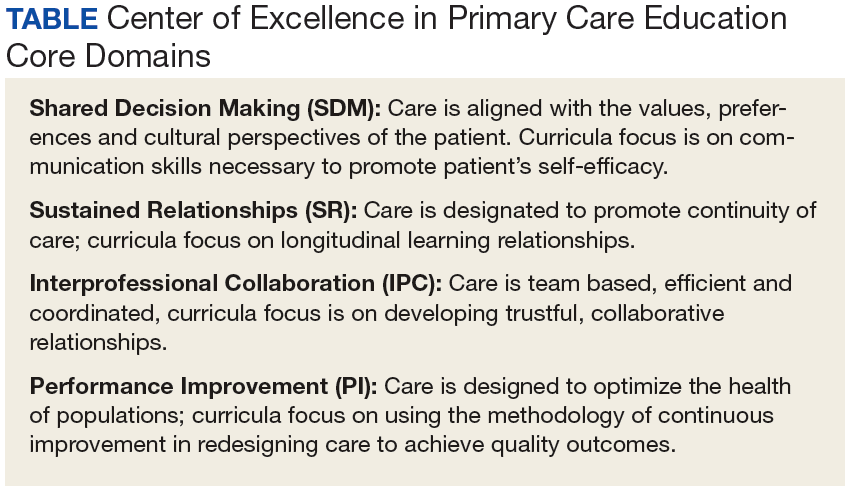
This model is VA’s preferred method for teaching and learning in primary care. The CoEPCEs are developing, implementing and evaluating curricula within 4 core domains designed to prepare learners to practice in primary care settings that are patient-centered, interprofessional, and team-based (Table).
The San Francisco VA Health Care System (SFVAHCS) Education in PACT (EdPACT)/CoEPCE developed and implemented a workplace learning model that embeds trainees into PACT teamlets and clinic workflow.1 Trainees are organized in practice partner triads with 2 second- or third-year internal medicine residents (R2s and R3s) and 1 NP student or resident. Physician residents rotate every 2 months between inpatient and outpatient settings and NP trainees are present continuously for 12 months. In this model, each trainee in the triad has his/her own patient panel and serves as a partner who delivers care to his/her partners’ patients when they are unavailable. Didactic sessions on clinical content and on topics related to the core domains occur 3-times weekly during pre- and postclinic conferences.2
Methods
In 2015, evaluators from the OAA reviewed background documents and conducted open-ended interviews with 9 CoEPCE staff, participating trainees, VA faculty, VA facility leadership, and affiliate faculty. Informants described their involvement, challenges encountered, and benefits of the huddle to participants, veterans, and the VA.
The Huddle
With the emphasis on patient-centered medical homes and team-based care in the Affordable Care Act, there is an urgent need to develop new training models that provide future health professionals with skills that support interprofessional communication and collaborative practice.2,3 A key aim of the CoEPCE is to expand workplace learning strategies and clinical opportunities for interprofessional trainees to work together as a team to anticipate and address the health care needs of veterans. Research suggests that patient care improves when team members develop a shared understanding of each other’s skill sets, care procedures, and values.4 In 2010, the SFVAHCS began phasing in VA-mandated PACTs. Each patient-aligned care teamlet serves about 1,200 patients and is composed of physician or NP primary care provider(s) (PCPs) and a registered nurse (RN) care manager, a licensed vocational nurse (LVN), and a medical support assistant (MSA). About every 3 teamlets also work with a profession-specific team member from the Social Work and Pharmacy departments. The implementation of PACT created an opportunity for the CoEPCE to add trainees of various professions to 13 preexisting PACTs in 3 SFVAHCS primary care clinics. This arrangement benefits both trainees and teamlets: trainees learn how to collaborate with clinic staff while the clinic PACT teamlets benefit from coaching by faculty skilled in team-based care.
As part of routine clinical activities, huddles provide opportunities for workplace learning related to coordination of care, building relationships, and developing a sense of camaraderie that is essential for team-based, patient-centered care. In their ideal state, huddles are “…the hub of interprofessional, team-based care”; they provide a venue where trainees can learn communication skills, team member roles, systems issues and resources, and clinical knowledge expected of full-time providers and staff.5 Embedding faculty in huddles as huddle coaches help ensure trainees are learning and applying these skills.
Planning and Implementation
After OAA funded the CoEPCE in 2011, faculty had 6 months to develop the EdPACT curriculum, which included a team building retreat, interactive didactic sessions, and workplace learning activities (ie, huddles). In July 2011, 10 trainee triads (each consisting of 2 physician residents and either a student NP or resident NP) were added to preexisting PACTs at the San Francisco VA Medical Center primary care clinic and 2 community-based outpatient clinics.
These trainee triads partnered with their PACT teamlets and huddled for 15 minutes at the beginning of each clinic day to plan for the day’s patients and future scheduled patients and to coordinate care needs for their panel of patients. CoEPCE staff built on this basic huddle model and made the following lasting modifications:
Developed and implemented a huddle coach model and a huddle checklist to provide structure and feedback to the huddle (Online Resources);
Scheduled huddles in NP student/resident’s exam room to reduce the hierarchy in the trainee triad;
Incorporated trainees from other professions and levels into the huddle (psychology fellows, pharmacy residents, social work); and
Linked the PACT teamlet (staff) to quality improvement projects that are discussed periodically in huddles and didactics.
Curriculum.The huddle allows for practical application of the 4 core domains: interprofessional collaboration (IPC), performance improvement (PI), sustained relationships (SR), and shared decision making (SDM) that shape the CoE curriculum.
Interprofessional collaboration (IPC) is the primary domain reinforced in the huddle. Trainees learn key content in half-day team retreats held at the beginning of the academic year and in interactive didactic sessions. These sessions, which draw on concepts from the Agency for Healthcare Research and Quality’s TeamSTEPPS, an evidence-based teamwork training program for health care workers, teach skills like closed-loop communication, check-backs, negotiation, and conflict resolution.
The CoE trainee triads also lead quality improvement (QI) projects, and the huddle is a venue for getting input, which reinforces the CoE’s performance improvement (PI) curriculum. For example, PACT teamlet staff members provide trainees with feedback on proposed QI interventions, such as increasing the use of telephone visits. The huddle supports SR among team members that enhance patient care while improving the quality of the clinic experience for team members. Strengthened communications and increased understanding of team member roles and system resources supports a patient-centered approach to care and lays the foundation for SDM between patients and team members.
Faculty Roles and Development. The CoEPCE physician and NP faculty members who precept and function as huddle coaches participate in monthly 2-hour faculty development sessions to address topics related to IPE. At least 1 session each year covers review of the items on the huddle checklist, tips on how to coach a huddle, discussions of the role of huddle coaches, and feedback and mentoring skills. Many huddle coach activities are inherent to clinical precepting, such as identifying appropriate clinical resources and answering clinical questions, but the core function of the huddle coach is to facilitate effective communication among team members.
Initially, a coach may guide the huddle by rounding up team members or directing the agenda of the huddle (ie, prompting the LVN to present the day’s patients and suggesting the group identify and discuss high-risk patients). As the year progresses, coaches often take a backseat, and the huddle may be facilitated by the trainees, the RN, LVN, or a combination of all members. During the huddle, coaches also may reinforce specific communication skills, such as a “check back” or ISBAR ( Identify who you are, describe the Situation, provide Background information, offer an Assessment of the situation/needs, make a Recommendation or Request)—skills that are taught during CoE didactic sessions.
The coach may call attention to particular feedback points, such as clarification of the order as an excellent example of a check-back. Each preceptor coaches 1 huddle per precepting session. After the teams huddle, preceptors do a smaller, shorter huddle in the precepting room to share successes, such as interprofessional trainees demonstrating backup behavior (eg, “in today’s huddle, I saw a great example of backup behavior when the medicine resident offered to show the NP student how to consent someone”) and discuss challenges (eg, getting all team members to the huddle).
Resources.The CoE staff schedule at least 20 huddles per week and coordinate preceptor and room schedules. The other required resources are clinic staff (RNs, LVNs, and MSAs) and exam rooms large enough to accommodate 8 or more people. Sufficient staffing coverage and staggered huddles also are important to allow cross-coverage for other clinical duties while team members and faculty are huddling.
Monitoring and Assessment.The CoE staff administer the Team Development Measure (TDM) twice yearly and a modified version of the TEAM 360 feedback survey once per year.6-9 The TDM member gages perceptions of team functioning (cohesiveness, communication, role clarity, and clarity of goals and means). Teams meet with a facilitator to debrief their TDM results and discuss ways to improve their team processes. Three-quarters of the way through the academic year, team members also complete the modified TEAM 360 survey on trainees. Each trainee receives a report describing his/her self-ratings and aggregate team member ratings on leadership, communication, interpersonal skills, and feedback.
Partnerships
In addition to CoEPCE staff and faculty support and engagement, huddles at SFVAHCS have benefited from partnerships with VA primary care leadership and with academic affiliates. In particular, support from the VA clinic directors and nurse managers was key to instituting changes to the clinics’ structure to include interprofessional trainees in huddles.
The affiliates—the University of California, San Francisco (UCSF) School of Medicine and School of Nursing—are integral partners and assist with NP student and medicine resident recruitment. These affiliates also participate in planning and refinement of CoEPCE curricular activities. The UCSF School of Nursing, School of Medicine, and Center for Faculty Educators were involved in the planning stages of the huddle model.
Challenges and Solutions
Having a staffing ratio that supports trainee participation in and learning through huddles is critical. Preceptor coverage must be in sufficient numbers to allow preceptors to coach the huddles, and clinical staff must be adequate to create cohesive and consistent teams for trainee providers. Clinic staff turnover and changes in teamlet staff can be very disruptive. Over time, teamlet staff often know key details and helpful contextual information about particular patients and clinic processes. This knowledge may be lost with turnover among teamlet staff. If team members miss huddles due to staffing shortages and clinical duties, there may be delays and errors in patient care. For example, if information discussed in the huddle is not relayed to the absent team member in a timely or accurate manner, care may be impacted. However, potential disruptions can be mitigated by a high-functioning team with strong communication skills and situational awareness who readily assist and distribute the workload.
Consistent huddling, huddle coaches, and checklists all help stabilize the group. Integration of trainees in the PACT team initially requires extra work because trainees are part-time and have panels significantly smaller than 1,200 (which means the teamlet staff are assigned to multiple trainee and provider huddles). However, teamlet staff find working with trainee teams personally rewarding, and developing highly functioning teams helps prevent burnout. Integration of pharmacy, psychology, and social work trainees takes time and thoughtful planning of activities and contributions that enhance team functioning while not overburdening trainees with additional responsibilities. If these other professions of health trainees are joining several teams’ huddles, their role may be to weigh in as needed vs preparing for and reviewing several PCPs’ schedules and patients in advance.
Factors for Success
The VA facility and primary care clinic leadership’s commitment to supporting staff participation in huddles was critical for integrating trainees into PACTs. Additionally, VA facility commitment to implementation of PACT was a key facilitating factor. Implementation of PACT, including huddles, has not been consistent at all VA facilities.10 The CoE’s approach to integrating trainees into the huddle was an opportunity to strengthen the huddle and to teach new staff members how to participate with team members in huddles. CoEPCE leadership, which has embraced change, meets regularly with facility leadership as well as an advisory board of UCSF leaders to update them on CoE activities. A critical factor for success was CoE expertise in interprofessional education and its ability to integrate concepts from the 4 core domains into an effective workplace learning experience, including attention to the physical space, scheduling, and the development and implementation of the huddle coach role and checklist.
Accomplishments and Benefits
There is evidence that SFVAHCS team huddles are achieving their goals and CoE trainees are being trained to provide team-based, patient-centered care to veterans. Key outcomes of the CoE’s approach to huddles include components in the next sections.
Interprofessional Educational Capacity.The CoEPCE faculty and staff consider the huddle to be one of the best ways to teach interprofessional communication and collaboration, team functioning, and clinical performance. Unlike a traditional didactic, classroom-based session on interprofessional collaboration, the huddle is an opportunity for health care professionals to work together to provide care in a clinic setting. It also is an activity in which the CoE has continued innovative activities, such as adding a preceptor huddle, incorporating additional professions, and encouraging panel management activities during huddles. The CoE has received significant interest and visibility and has been invited to share the model in numerous presentations.
Participants’ Knowledge, Attitudes, Skills, and Competencies.An aim of the CoE approach to huddles was to provide trainees with general skills in the core domain interprofessional collaboration, including teamwork and communication that transfer to other settings, such as inpatient teams and specialty clinics. Learning about other professions and their scopes of practice and areas of expertise can be helpful beyond huddles and primary care. Trainees also learn concepts and practices from the other core domains:
Performance Improvement: The huddle is a venue for utilizing clinic metrics as well as focusing on QI projects that benefit from a team approach to solving problems;
Sustained Relationships: The huddles support and teach the importance of relationships among the team. Trainees learn about the roles of clinic staff members, and clinic staff have more opportunities to interact with trainees and become comfortable with them, supporting coordinated care; and
Shared Decision Making: The huddle is a venue for discussing options for providing patient decision-making support, such as discussing the pros and cons of colon cancer screening with a patient, improving patient-centered care.
Additionally, huddles can address differences in trainee clinical expertise. For example, new physician interns with less experience in the clinic receive more coaching on system resources and patient histories than they might otherwise. Nurse practitioner residents often participate in more than 1 huddle team and transition to a coaching role.
Sustained Relationships, Role Clarity, and Collaboration.The huddles are structured to facilitate SRs among trainees from different professions and among the PACT teamlet in detail as a team. The huddle increases team efficiency by educating trainees and staff about team member roles. For example, trainees learn how the LVNs and MSAs prepare for patient visits. Moreover, an opportunity exists to learn how provider and clinic staff expertise may overlap. Registered nurse care managers, who have their own hypertension clinics, can help manage a patient’s medication titration. Similarly, pharmacy trainees can suggest a referral for a complicated patient with diabetes to pharmacy clinic, where clinical pharmacists can adjust medications and provide patient education for hypertension, hyperlipidemia, and hyperglycemia. In this way, role clarity is improved and trainees learn how team members work within their scope of practice and are better able to “share the care.”
There is evidence that huddles have resulted in expanded participant interprofessional collaboration. The CoE administers the TDM twice a year and the huddle teams rate themselves on several dimensions—cohesiveness, communications, role clarity, and goals.6,7 The 2011/2012 findings showed that nearly all teams showed improvement, with the mean scores for all teams combined increasing from 59.4 in the fall to 64.6 in the spring (max score is 100).5 These scores increased again from 62.2 to 70.3 in 2012/2013, from 66.6 to 70.2 in 2013/2014, and from 64.6 to 69.9 in 2014/2015.
Expanding Clinical Knowledge.At the individual level, the huddle is an opportunity for a trainees to expand their clinical expertise in real time. The huddle provides exposure to a variety of patients and corresponding patient care needs. Trainees are encouraged to complete patient prerounds before the huddle in order to focus the huddle discussion on patients with chronic conditions, complex needs, recent hospitalizations, and upcoming appointments. The CoEPCE trainees tap into the expertise and experience of their team members and coach.
The clinic staff can get information from trainees about their plan of care while trainees get a more complete picture of a patient’s situation—for example, medical or social history or communication preferences. Additionally, trainees learn team skills, such as communication techniques and warm handoffs, which can be used in other clinical settings outside primary care and beyond the VA. As trainees advance, the huddle helps them learn to delegate appropriately, practice conflict negotiation, and develop leadership skills.
Participants’ Satisfaction With Interventions.There is qualitative evidence that clinic RNs and LVNs like huddles and appreciate having the opportunity to communicate in person with providers as well as to teach trainees how to work interprofessionally. Faculty members who are huddle coaches report that they develop a richer understanding of the skill set of trainees, information that can inform CoE curriculum design. Trainees appreciate the opportunity to develop relationships with team members. In end-of-year interviews, they describe their teams as their families, making them feel more connected to the clinic. They also enjoyed starting their day with familiar faces.
Primary Care Delivery System.The huddle is an important component of a system-wide transformation to provide team-based, patient-centered care to veterans. The efforts to strengthen and standardize the huddle have the potential to hasten this transformation while improving relationships and quality of care. Additionally, the CoE approach to integrating trainees into huddles has broader applicability and is being considered for adoption by other VA centers of excellence in primary care education.Primary Care Services. The huddle may contribute to efficiencies in a busy clinic setting. For example, the RN care manager can have upward of 1,200 patients on his/her panel and, between staff and trainees, as many as 12 health care providers with whom to communicate. The huddle strengthens the communications with providers and is an opportunity to touch base on the patients, coordinate care, and keep track of high-risk patients who might fall off the radar otherwise. The huddle is flexible and can occur with various clinic staff and providers. A 2-person huddle can occur between an RN and the primary provider. The QI projects that have been developed as a result of a huddle have improved clinic primary care services, such as completing opiate consents and urine toxicology or improving continuity through increased telephone clinic usage.Patient Outcomes.The huddle results in a more robust plan of care than might be developed by an individual provider who might not have time to consider options outside the individual’s scope of practice or expertise. While there are few clinical outcomes that are directly influenced by huddles alone, huddles may help indirectly improve patient outcomes on many fronts, including:
Increased continuity of care because the patient now has a team focusing on care. At times throughout the day when team members cannot talk face to face with one another or with the patient, they know about the patient’s situation and are better able to establish a rapport when the patient calls or comes in for the visit. Trainees also become familiar with their practice partners’ patients, which allows them to ensure continuity when the patient’s primary trainee provider is out of clinic;
Panel management and identifying and tracking sicker patients;
Increased access, such as identifying patients who could receive care by a telephone visit, decreasing the number of no shows by making extra efforts to remind patients about appointments and improving follow up; and
Improved population health outcomes from process improvements, such as the development of a process for having patients on opioids sign new contracts or identifying diabetics who might benefit from a group approach to care.
The Future
The huddle coach concept and checklist have been shared broadly and have applicability in other teaching settings where providers and clinic staff are learning how to implement huddles. A video and resources on “How to Huddle” are available at suzannecgordon.com/how-to-huddle/.
Under stage 2 of the CoEPCE program, the CoE will develop a huddle coaching program implementation kit composed of a huddle how-to guide and a coach training manual. The CoE team huddle is one of many VA huddles and an example of how the huddle continues to evolve. It is a versatile tool that can be used to focus on different topics and include different professions. Currently, it is being adapted to specialty care where there is large patient volume, such as cardiology and orthopedics.
References
1. Rugen KW, Watts SA, Janson SL, et al. Veteran Affairs Centers of Excellence in Primary Care Education: transforming nurse practitioner education. Nurs Outlook. 2014;62(2):78-88.
2. Chang A, Bowen JL, Buranosky RA, et al. Transforming primary care training--patient-centered medical home entrustable professional activities for internal medicine residents. J Gen Intern Med. 2013;28(6):801-809.
3. Zabar S, Adams J, Kurland S, et al. Charting a key competency domain: understanding resident physician interprofessional collaboration (IPC) skills. J Gen Intern Med. 2016;31(8):846-853.
4. Institute of Medicine. Measuring the Impact of Interprofessional Education (IPE) on Collaborative Practice and Patient Outcomes. Washington, DC: The National Academies Press; 2015.
5. Shunk R, Dulay M, Chou C, Janson S, O’Brien BC. Huddle-coaching: a dynamic intervention for trainees and staff to support team-based care. Acad Med. 2014;89(2):244-250.
6. Stock R, Mahoney E, Carney PA. Measuring team development in clinical care settings. Fam Med. 2013;45(10):691-700.
8. American Board of Internal Medicine. Teamwork effectiveness assessment module. https://team.abim.org. Accessed August 16, 2018.
9. Chesluk BJ, Bernabeo E, Hess B, Lynn LA, Reddy S, Holmboe ES. A new tool to give hospitalists feedback to improve interprofessional teamwork and advance patient care. Health Aff (Millwood). 2012;31(11):2485-2492.
10. Rodriguez HP, Meredith LS, Hamilton AB, Yano EM, Rubenstein LV. Huddle up!: the adoption and use of structured team communication for VA medical home implementation. Health Care Manage Rev. 2015;40(4):286-299.
Dr. Gardner is an Assistant Professor at the Philip R. Lee Institute for Health Policy Studies and the Department of Social and Behavioral Sciences, University of California, San Francisco (UCSF). Dr. Shunk is the Codirector of the San Francisco VA Center of Excellence in Primary Care Education (CoEPCE) and Associate Chief of Staff for Education at the San Francisco VA Healthcare System (SFVAHCS), and an Associate Professor, Department of Medicine at UCSF. Dr. Dulay is an Associate Professor at UCSF and Associate Director of the SFVAHCS CoEPCE Center of Excellence in Primary Care Education, and Ms. Strewler is Codirector of the SFVAHCS CoEPCE and Assistant Clinical Professor at UCSF. Dr. O’Brien is Director of Evaluation and Scholarship, SFVAHCS CoEPCE and an Associate Professor at UCSF. Correspondence:Dr. Shunk ([email protected])
Author disclosures The authors report no actual or potential conflicts of interest with regard to this article.
Disclaimer The opinions expressed herein are those of the authors and do not necessarily reflect those ofFederal Practitioner, Frontline Medical Communications Inc., the US Government, or any of its agencies.
Author and Disclosure Information
Dr. Gardner is an Assistant Professor at the Philip R. Lee Institute for Health Policy Studies and the Department of Social and Behavioral Sciences, University of California, San Francisco (UCSF). Dr. Shunk is the Codirector of the San Francisco VA Center of Excellence in Primary Care Education (CoEPCE) and Associate Chief of Staff for Education at the San Francisco VA Healthcare System (SFVAHCS), and an Associate Professor, Department of Medicine at UCSF. Dr. Dulay is an Associate Professor at UCSF and Associate Director of the SFVAHCS CoEPCE Center of Excellence in Primary Care Education, and Ms. Strewler is Codirector of the SFVAHCS CoEPCE and Assistant Clinical Professor at UCSF. Dr. O’Brien is Director of Evaluation and Scholarship, SFVAHCS CoEPCE and an Associate Professor at UCSF. Correspondence:Dr. Shunk ([email protected])
Author disclosures The authors report no actual or potential conflicts of interest with regard to this article.
Disclaimer The opinions expressed herein are those of the authors and do not necessarily reflect those ofFederal Practitioner, Frontline Medical Communications Inc., the US Government, or any of its agencies.
In short team huddles, trainees and PACT teamlets meet to coordinate care and identify ways to improve team processes under the guidance of faculty members who reinforce collaborative practice and continuous improvement.
In short team huddles, trainees and PACT teamlets meet to coordinate care and identify ways to improve team processes under the guidance of faculty members who reinforce collaborative practice and continuous improvement.
In 2011, 5 US Department of Veteran Affairs (VA) medical centers were selected by the VA Office of Academic Affiliations (OAA) to establish Centers of Excellence in Primary Care Education (CoEPCE). Part of the VA New Models of Care initiative, the 5 CoEPCEs (Boise, Cleveland, San Francisco, Seattle and West Haven) are utilizing VA primary care settings to develop and test innovative approaches to prepare physician residents, nurse practitioner (NP) students and residents (postgraduate), and other health professions trainees, such as pharmacy, social work, psychology, physician assistants (PAs), dieticians, etc for primary care practice.
The CoEPCEs are interprofessional academic patient aligned care teams (PACTs) defined by VA as a PACT that has at least 2 professions of trainees on the team engaged in learning.
This model is VA’s preferred method for teaching and learning in primary care. The CoEPCEs are developing, implementing and evaluating curricula within 4 core domains designed to prepare learners to practice in primary care settings that are patient-centered, interprofessional, and team-based (Table).
The San Francisco VA Health Care System (SFVAHCS) Education in PACT (EdPACT)/CoEPCE developed and implemented a workplace learning model that embeds trainees into PACT teamlets and clinic workflow.1 Trainees are organized in practice partner triads with 2 second- or third-year internal medicine residents (R2s and R3s) and 1 NP student or resident. Physician residents rotate every 2 months between inpatient and outpatient settings and NP trainees are present continuously for 12 months. In this model, each trainee in the triad has his/her own patient panel and serves as a partner who delivers care to his/her partners’ patients when they are unavailable. Didactic sessions on clinical content and on topics related to the core domains occur 3-times weekly during pre- and postclinic conferences.2
Methods
In 2015, evaluators from the OAA reviewed background documents and conducted open-ended interviews with 9 CoEPCE staff, participating trainees, VA faculty, VA facility leadership, and affiliate faculty. Informants described their involvement, challenges encountered, and benefits of the huddle to participants, veterans, and the VA.
The Huddle
With the emphasis on patient-centered medical homes and team-based care in the Affordable Care Act, there is an urgent need to develop new training models that provide future health professionals with skills that support interprofessional communication and collaborative practice.2,3 A key aim of the CoEPCE is to expand workplace learning strategies and clinical opportunities for interprofessional trainees to work together as a team to anticipate and address the health care needs of veterans. Research suggests that patient care improves when team members develop a shared understanding of each other’s skill sets, care procedures, and values.4 In 2010, the SFVAHCS began phasing in VA-mandated PACTs. Each patient-aligned care teamlet serves about 1,200 patients and is composed of physician or NP primary care provider(s) (PCPs) and a registered nurse (RN) care manager, a licensed vocational nurse (LVN), and a medical support assistant (MSA). About every 3 teamlets also work with a profession-specific team member from the Social Work and Pharmacy departments. The implementation of PACT created an opportunity for the CoEPCE to add trainees of various professions to 13 preexisting PACTs in 3 SFVAHCS primary care clinics. This arrangement benefits both trainees and teamlets: trainees learn how to collaborate with clinic staff while the clinic PACT teamlets benefit from coaching by faculty skilled in team-based care.
As part of routine clinical activities, huddles provide opportunities for workplace learning related to coordination of care, building relationships, and developing a sense of camaraderie that is essential for team-based, patient-centered care. In their ideal state, huddles are “…the hub of interprofessional, team-based care”; they provide a venue where trainees can learn communication skills, team member roles, systems issues and resources, and clinical knowledge expected of full-time providers and staff.5 Embedding faculty in huddles as huddle coaches help ensure trainees are learning and applying these skills.
Planning and Implementation
After OAA funded the CoEPCE in 2011, faculty had 6 months to develop the EdPACT curriculum, which included a team building retreat, interactive didactic sessions, and workplace learning activities (ie, huddles). In July 2011, 10 trainee triads (each consisting of 2 physician residents and either a student NP or resident NP) were added to preexisting PACTs at the San Francisco VA Medical Center primary care clinic and 2 community-based outpatient clinics.
These trainee triads partnered with their PACT teamlets and huddled for 15 minutes at the beginning of each clinic day to plan for the day’s patients and future scheduled patients and to coordinate care needs for their panel of patients. CoEPCE staff built on this basic huddle model and made the following lasting modifications:
Developed and implemented a huddle coach model and a huddle checklist to provide structure and feedback to the huddle (Online Resources);
Scheduled huddles in NP student/resident’s exam room to reduce the hierarchy in the trainee triad;
Incorporated trainees from other professions and levels into the huddle (psychology fellows, pharmacy residents, social work); and
Linked the PACT teamlet (staff) to quality improvement projects that are discussed periodically in huddles and didactics.
Curriculum.The huddle allows for practical application of the 4 core domains: interprofessional collaboration (IPC), performance improvement (PI), sustained relationships (SR), and shared decision making (SDM) that shape the CoE curriculum.
Interprofessional collaboration (IPC) is the primary domain reinforced in the huddle. Trainees learn key content in half-day team retreats held at the beginning of the academic year and in interactive didactic sessions. These sessions, which draw on concepts from the Agency for Healthcare Research and Quality’s TeamSTEPPS, an evidence-based teamwork training program for health care workers, teach skills like closed-loop communication, check-backs, negotiation, and conflict resolution.
The CoE trainee triads also lead quality improvement (QI) projects, and the huddle is a venue for getting input, which reinforces the CoE’s performance improvement (PI) curriculum. For example, PACT teamlet staff members provide trainees with feedback on proposed QI interventions, such as increasing the use of telephone visits. The huddle supports SR among team members that enhance patient care while improving the quality of the clinic experience for team members. Strengthened communications and increased understanding of team member roles and system resources supports a patient-centered approach to care and lays the foundation for SDM between patients and team members.
Faculty Roles and Development. The CoEPCE physician and NP faculty members who precept and function as huddle coaches participate in monthly 2-hour faculty development sessions to address topics related to IPE. At least 1 session each year covers review of the items on the huddle checklist, tips on how to coach a huddle, discussions of the role of huddle coaches, and feedback and mentoring skills. Many huddle coach activities are inherent to clinical precepting, such as identifying appropriate clinical resources and answering clinical questions, but the core function of the huddle coach is to facilitate effective communication among team members.
Initially, a coach may guide the huddle by rounding up team members or directing the agenda of the huddle (ie, prompting the LVN to present the day’s patients and suggesting the group identify and discuss high-risk patients). As the year progresses, coaches often take a backseat, and the huddle may be facilitated by the trainees, the RN, LVN, or a combination of all members. During the huddle, coaches also may reinforce specific communication skills, such as a “check back” or ISBAR ( Identify who you are, describe the Situation, provide Background information, offer an Assessment of the situation/needs, make a Recommendation or Request)—skills that are taught during CoE didactic sessions.
The coach may call attention to particular feedback points, such as clarification of the order as an excellent example of a check-back. Each preceptor coaches 1 huddle per precepting session. After the teams huddle, preceptors do a smaller, shorter huddle in the precepting room to share successes, such as interprofessional trainees demonstrating backup behavior (eg, “in today’s huddle, I saw a great example of backup behavior when the medicine resident offered to show the NP student how to consent someone”) and discuss challenges (eg, getting all team members to the huddle).
Resources.The CoE staff schedule at least 20 huddles per week and coordinate preceptor and room schedules. The other required resources are clinic staff (RNs, LVNs, and MSAs) and exam rooms large enough to accommodate 8 or more people. Sufficient staffing coverage and staggered huddles also are important to allow cross-coverage for other clinical duties while team members and faculty are huddling.
Monitoring and Assessment.The CoE staff administer the Team Development Measure (TDM) twice yearly and a modified version of the TEAM 360 feedback survey once per year.6-9 The TDM member gages perceptions of team functioning (cohesiveness, communication, role clarity, and clarity of goals and means). Teams meet with a facilitator to debrief their TDM results and discuss ways to improve their team processes. Three-quarters of the way through the academic year, team members also complete the modified TEAM 360 survey on trainees. Each trainee receives a report describing his/her self-ratings and aggregate team member ratings on leadership, communication, interpersonal skills, and feedback.
Partnerships
In addition to CoEPCE staff and faculty support and engagement, huddles at SFVAHCS have benefited from partnerships with VA primary care leadership and with academic affiliates. In particular, support from the VA clinic directors and nurse managers was key to instituting changes to the clinics’ structure to include interprofessional trainees in huddles.
The affiliates—the University of California, San Francisco (UCSF) School of Medicine and School of Nursing—are integral partners and assist with NP student and medicine resident recruitment. These affiliates also participate in planning and refinement of CoEPCE curricular activities. The UCSF School of Nursing, School of Medicine, and Center for Faculty Educators were involved in the planning stages of the huddle model.
Challenges and Solutions
Having a staffing ratio that supports trainee participation in and learning through huddles is critical. Preceptor coverage must be in sufficient numbers to allow preceptors to coach the huddles, and clinical staff must be adequate to create cohesive and consistent teams for trainee providers. Clinic staff turnover and changes in teamlet staff can be very disruptive. Over time, teamlet staff often know key details and helpful contextual information about particular patients and clinic processes. This knowledge may be lost with turnover among teamlet staff. If team members miss huddles due to staffing shortages and clinical duties, there may be delays and errors in patient care. For example, if information discussed in the huddle is not relayed to the absent team member in a timely or accurate manner, care may be impacted. However, potential disruptions can be mitigated by a high-functioning team with strong communication skills and situational awareness who readily assist and distribute the workload.
Consistent huddling, huddle coaches, and checklists all help stabilize the group. Integration of trainees in the PACT team initially requires extra work because trainees are part-time and have panels significantly smaller than 1,200 (which means the teamlet staff are assigned to multiple trainee and provider huddles). However, teamlet staff find working with trainee teams personally rewarding, and developing highly functioning teams helps prevent burnout. Integration of pharmacy, psychology, and social work trainees takes time and thoughtful planning of activities and contributions that enhance team functioning while not overburdening trainees with additional responsibilities. If these other professions of health trainees are joining several teams’ huddles, their role may be to weigh in as needed vs preparing for and reviewing several PCPs’ schedules and patients in advance.
Factors for Success
The VA facility and primary care clinic leadership’s commitment to supporting staff participation in huddles was critical for integrating trainees into PACTs. Additionally, VA facility commitment to implementation of PACT was a key facilitating factor. Implementation of PACT, including huddles, has not been consistent at all VA facilities.10 The CoE’s approach to integrating trainees into the huddle was an opportunity to strengthen the huddle and to teach new staff members how to participate with team members in huddles. CoEPCE leadership, which has embraced change, meets regularly with facility leadership as well as an advisory board of UCSF leaders to update them on CoE activities. A critical factor for success was CoE expertise in interprofessional education and its ability to integrate concepts from the 4 core domains into an effective workplace learning experience, including attention to the physical space, scheduling, and the development and implementation of the huddle coach role and checklist.
Accomplishments and Benefits
There is evidence that SFVAHCS team huddles are achieving their goals and CoE trainees are being trained to provide team-based, patient-centered care to veterans. Key outcomes of the CoE’s approach to huddles include components in the next sections.
Interprofessional Educational Capacity.The CoEPCE faculty and staff consider the huddle to be one of the best ways to teach interprofessional communication and collaboration, team functioning, and clinical performance. Unlike a traditional didactic, classroom-based session on interprofessional collaboration, the huddle is an opportunity for health care professionals to work together to provide care in a clinic setting. It also is an activity in which the CoE has continued innovative activities, such as adding a preceptor huddle, incorporating additional professions, and encouraging panel management activities during huddles. The CoE has received significant interest and visibility and has been invited to share the model in numerous presentations.
Participants’ Knowledge, Attitudes, Skills, and Competencies.An aim of the CoE approach to huddles was to provide trainees with general skills in the core domain interprofessional collaboration, including teamwork and communication that transfer to other settings, such as inpatient teams and specialty clinics. Learning about other professions and their scopes of practice and areas of expertise can be helpful beyond huddles and primary care. Trainees also learn concepts and practices from the other core domains:
Performance Improvement: The huddle is a venue for utilizing clinic metrics as well as focusing on QI projects that benefit from a team approach to solving problems;
Sustained Relationships: The huddles support and teach the importance of relationships among the team. Trainees learn about the roles of clinic staff members, and clinic staff have more opportunities to interact with trainees and become comfortable with them, supporting coordinated care; and
Shared Decision Making: The huddle is a venue for discussing options for providing patient decision-making support, such as discussing the pros and cons of colon cancer screening with a patient, improving patient-centered care.
Additionally, huddles can address differences in trainee clinical expertise. For example, new physician interns with less experience in the clinic receive more coaching on system resources and patient histories than they might otherwise. Nurse practitioner residents often participate in more than 1 huddle team and transition to a coaching role.
Sustained Relationships, Role Clarity, and Collaboration.The huddles are structured to facilitate SRs among trainees from different professions and among the PACT teamlet in detail as a team. The huddle increases team efficiency by educating trainees and staff about team member roles. For example, trainees learn how the LVNs and MSAs prepare for patient visits. Moreover, an opportunity exists to learn how provider and clinic staff expertise may overlap. Registered nurse care managers, who have their own hypertension clinics, can help manage a patient’s medication titration. Similarly, pharmacy trainees can suggest a referral for a complicated patient with diabetes to pharmacy clinic, where clinical pharmacists can adjust medications and provide patient education for hypertension, hyperlipidemia, and hyperglycemia. In this way, role clarity is improved and trainees learn how team members work within their scope of practice and are better able to “share the care.”
There is evidence that huddles have resulted in expanded participant interprofessional collaboration. The CoE administers the TDM twice a year and the huddle teams rate themselves on several dimensions—cohesiveness, communications, role clarity, and goals.6,7 The 2011/2012 findings showed that nearly all teams showed improvement, with the mean scores for all teams combined increasing from 59.4 in the fall to 64.6 in the spring (max score is 100).5 These scores increased again from 62.2 to 70.3 in 2012/2013, from 66.6 to 70.2 in 2013/2014, and from 64.6 to 69.9 in 2014/2015.
Expanding Clinical Knowledge.At the individual level, the huddle is an opportunity for a trainees to expand their clinical expertise in real time. The huddle provides exposure to a variety of patients and corresponding patient care needs. Trainees are encouraged to complete patient prerounds before the huddle in order to focus the huddle discussion on patients with chronic conditions, complex needs, recent hospitalizations, and upcoming appointments. The CoEPCE trainees tap into the expertise and experience of their team members and coach.
The clinic staff can get information from trainees about their plan of care while trainees get a more complete picture of a patient’s situation—for example, medical or social history or communication preferences. Additionally, trainees learn team skills, such as communication techniques and warm handoffs, which can be used in other clinical settings outside primary care and beyond the VA. As trainees advance, the huddle helps them learn to delegate appropriately, practice conflict negotiation, and develop leadership skills.
Participants’ Satisfaction With Interventions.There is qualitative evidence that clinic RNs and LVNs like huddles and appreciate having the opportunity to communicate in person with providers as well as to teach trainees how to work interprofessionally. Faculty members who are huddle coaches report that they develop a richer understanding of the skill set of trainees, information that can inform CoE curriculum design. Trainees appreciate the opportunity to develop relationships with team members. In end-of-year interviews, they describe their teams as their families, making them feel more connected to the clinic. They also enjoyed starting their day with familiar faces.
Primary Care Delivery System.The huddle is an important component of a system-wide transformation to provide team-based, patient-centered care to veterans. The efforts to strengthen and standardize the huddle have the potential to hasten this transformation while improving relationships and quality of care. Additionally, the CoE approach to integrating trainees into huddles has broader applicability and is being considered for adoption by other VA centers of excellence in primary care education.Primary Care Services. The huddle may contribute to efficiencies in a busy clinic setting. For example, the RN care manager can have upward of 1,200 patients on his/her panel and, between staff and trainees, as many as 12 health care providers with whom to communicate. The huddle strengthens the communications with providers and is an opportunity to touch base on the patients, coordinate care, and keep track of high-risk patients who might fall off the radar otherwise. The huddle is flexible and can occur with various clinic staff and providers. A 2-person huddle can occur between an RN and the primary provider. The QI projects that have been developed as a result of a huddle have improved clinic primary care services, such as completing opiate consents and urine toxicology or improving continuity through increased telephone clinic usage.Patient Outcomes.The huddle results in a more robust plan of care than might be developed by an individual provider who might not have time to consider options outside the individual’s scope of practice or expertise. While there are few clinical outcomes that are directly influenced by huddles alone, huddles may help indirectly improve patient outcomes on many fronts, including:
Increased continuity of care because the patient now has a team focusing on care. At times throughout the day when team members cannot talk face to face with one another or with the patient, they know about the patient’s situation and are better able to establish a rapport when the patient calls or comes in for the visit. Trainees also become familiar with their practice partners’ patients, which allows them to ensure continuity when the patient’s primary trainee provider is out of clinic;
Panel management and identifying and tracking sicker patients;
Increased access, such as identifying patients who could receive care by a telephone visit, decreasing the number of no shows by making extra efforts to remind patients about appointments and improving follow up; and
Improved population health outcomes from process improvements, such as the development of a process for having patients on opioids sign new contracts or identifying diabetics who might benefit from a group approach to care.
The Future
The huddle coach concept and checklist have been shared broadly and have applicability in other teaching settings where providers and clinic staff are learning how to implement huddles. A video and resources on “How to Huddle” are available at suzannecgordon.com/how-to-huddle/.
Under stage 2 of the CoEPCE program, the CoE will develop a huddle coaching program implementation kit composed of a huddle how-to guide and a coach training manual. The CoE team huddle is one of many VA huddles and an example of how the huddle continues to evolve. It is a versatile tool that can be used to focus on different topics and include different professions. Currently, it is being adapted to specialty care where there is large patient volume, such as cardiology and orthopedics.
References
1. Rugen KW, Watts SA, Janson SL, et al. Veteran Affairs Centers of Excellence in Primary Care Education: transforming nurse practitioner education. Nurs Outlook. 2014;62(2):78-88.
2. Chang A, Bowen JL, Buranosky RA, et al. Transforming primary care training--patient-centered medical home entrustable professional activities for internal medicine residents. J Gen Intern Med. 2013;28(6):801-809.
3. Zabar S, Adams J, Kurland S, et al. Charting a key competency domain: understanding resident physician interprofessional collaboration (IPC) skills. J Gen Intern Med. 2016;31(8):846-853.
4. Institute of Medicine. Measuring the Impact of Interprofessional Education (IPE) on Collaborative Practice and Patient Outcomes. Washington, DC: The National Academies Press; 2015.
5. Shunk R, Dulay M, Chou C, Janson S, O’Brien BC. Huddle-coaching: a dynamic intervention for trainees and staff to support team-based care. Acad Med. 2014;89(2):244-250.
6. Stock R, Mahoney E, Carney PA. Measuring team development in clinical care settings. Fam Med. 2013;45(10):691-700.
8. American Board of Internal Medicine. Teamwork effectiveness assessment module. https://team.abim.org. Accessed August 16, 2018.
9. Chesluk BJ, Bernabeo E, Hess B, Lynn LA, Reddy S, Holmboe ES. A new tool to give hospitalists feedback to improve interprofessional teamwork and advance patient care. Health Aff (Millwood). 2012;31(11):2485-2492.
10. Rodriguez HP, Meredith LS, Hamilton AB, Yano EM, Rubenstein LV. Huddle up!: the adoption and use of structured team communication for VA medical home implementation. Health Care Manage Rev. 2015;40(4):286-299.
An 87-year-old woman was brought to the intensive care unit with worsening shortness of breath on exertion, fatigue, orthopnea, paroxysmal nocturnal dyspnea, lower extremity swelling, subjective fever, productive cough, and rhinorrhea over the last week. She reported no chest pain, lightheadedness, or palpitations. Her medical history included the following:
Cardiac arrest with recurrent ventricular tachycardia requiring an implanted cardioverter-defibrillator and amiodarone therapy
Hypothyroidism requiring levothyroxine
Asthma with a moderate obstructive pattern: forced expiratory volume in 1 second (FEV1) 60% of predicted, forced vital capacity (FVC) 2.06 L, FEV1/FVC 54%, diffusing capacity for carbon monoxide (DLCO) 72% of predicted with positive bronchodilator response
Long-standing essential thrombocythemia treated with hydroxyurea.
Before admission, she had been reliably taking guideline-directed heart failure therapy as well as amiodarone for her recurrent ventricular tachycardia. Her levothyroxine had recently been increased as well.
Physical examination. On admission, her blood pressure was 95/53 mm Hg, heart rate 73 beats per minute, temperature 36.7ºC (98.1ºF), and oxygen saturation 81% requiring supplemental oxygen 15 L/min by nonrebreather face mask. Physical examination revealed elevated jugular venous pressure, bibasilar crackles, lower extremity edema, and a grade 3 of 6 holosystolic murmur both at the left sternal border and at the apex radiating to the axilla. There was no evidence of wheezing or pulsus paradoxus.
Electrocardiography showed sinus rhythm and an old left bundle branch block.
Chest radiography showed cardiomegaly, bilateral pleural effusions, and pulmonary edema.
WHAT IS THE CAUSE OF HER SYMPTOMS?
1. Based on the available information, which of the following is the most likely cause of this patient’s clinical presentation?
Acute decompensated heart failure
Pulmonary embolism
Exacerbation of asthma
Exacerbation of chronic obstructive pulmonary disease (COPD)
Heart failure is a clinical diagnosis based on careful history-taking and physical examination. Major criteria include paroxysmal nocturnal dyspnea, orthopnea, elevated jugular venous pressure, pulmonary crackles, a third heart sound, cardiomegaly, pulmonary edema, and weight loss of more than 4.5 kg with diuretic therapy.1 N-terminal pro-B-type natriuretic peptide (NT-proBNP) is also an effective marker of acute decompensated heart failure in the proper clinical setting.2
Our patient’s elevated jugular venous pressure, bibasilar crackles, lower extremity edema, chest radiography findings consistent with pulmonary edema, markedly elevated NT-proBNP, history of orthopnea, paroxysmal nocturnal dyspnea, and dyspnea on exertion were most consistent with acute decompensated heart failure. Her cough and subjective fevers were thought to be due to an upper respiratory tract viral infection.
Pulmonary embolism causes pleuritic chest pain, dyspnea, and, occasionally, elevated troponin. The most common feature on electrocardiography is sinus tachycardia; nonspecific ST-segment and T-wave changes may also be seen.3
Although pulmonary embolism remained in the differential diagnosis, our patient’s lack of typical features of pulmonary embolism made this less likely.
Asthma is characterized by recurrent airflow obstruction and bronchial hyperresponsiveness.4 Asthma exacerbations present with wheezing, tachypnea, tachycardia, and pulsus paradoxus.5
Despite her previous asthma diagnosis, our patient’s lack of typical features of asthma exacerbation made this diagnosis unlikely.
COPD exacerbations present with increased dyspnea, cough, sputum production, wheezing, lung resonance to percussion, and distant heart sounds, and are characterized by airflow obstruction.6,7
Although our patient presented with cough and dyspnea, she had no history of COPD and her other signs and symptoms (elevated jugular venous pressure, elevated NT-proBNP, and peripheral edema) could not be explained by COPD exacerbation.
OUR PATIENT UNDERWENT FURTHER TESTING
Echocardiography revealed severe left ventricular enlargement, an ejection fraction of 20% (which was near her baseline value), diffuse regional wall-motion abnormalities, severe mitral regurgitation, and moderate tricuspid regurgitation consistent with an exacerbation of heart failure.
We considered the possibility that her heart failure symptoms might be due to precipitous up-titration of her levothyroxine dose, given her borderline-elevated free thyroxine (T4) and increase in cardiac index (currently 4.45 L/min/m2, previously 2.20 L/min/m2 by the left ventricular outflow tract velocity time integral method). However, given her reduced ejection fraction, this clinical presentation most likely represented an acute exacerbation of her chronic heart failure. Her subjective fevers were thought to be due to a viral infection of the upper respiratory tract. The macrocytic anemia and thrombocytopenia were thought to be a side effect of her long-standing treatment with hydroxyurea for essential thrombocythemia, although amiodarone has also been associated with cytopenia.8
Treatment was started with intravenous diuretics and positive pressure ventilation with oxygen supplementation. Her levothyroxine dose was reduced, and her hydroxyurea was stopped.
Figure 1. Chest computed tomography axial views demonstrated increased attenuation in the liver (A, arrow) and left pleural base (B, arrow). Evaluation of the right lung base revealed ground-glass opacities (C, arrow) and honeycombing (D, arrow). These findings were consistent with amiodarone pulmonary toxicity.After aggressive diuresis, our patient returned to euvolemia. However, she had persistent fine crackles and hypoxia. She had no further fever, and her vital signs were otherwise stable. Her cytopenia improved with cessation of hydroxyurea. Chest computed tomography (CT) showed bibasilar ground-glass infiltrates with areas of interstitial fibrosis, high-attenuation pleural lesions, and increased liver attenuation (Figure 1).
Further testing for connective tissue disease and hypersensitivity pneumonitis was also done, and the results were negative. To exclude an atypical infection, bronchoalveolar lavage was performed; preliminary microbial testing was negative, and the white blood cell count in the lavage fluid was 90% macrophages (pigment-laden), 7% neutrophils, and 3% lymphocytes.
WHAT IS THE CAUSE OF HER PERSISTENT PULMONARY FINDINGS?
2. Given the CT findings and laboratory results, what is the most likely cause of our patient’s persistent crackles and hypoxia?
Heart failure with reduced ejection fraction
Bacterial pneumonia
Idiopathic pulmonary fibrosis
Amiodarone pulmonary toxicity
Heart failure with reduced ejection fraction can cause ground-glass opacities on CT due to increased pulmonary edema. Although our patient initially presented with acute decompensation of heart failure with reduced ejection fraction decompensation, she had returned to euvolemia after aggressive diuresis. Moreover, increased pleural and liver attenuation are not typically seen as a result of heart failure with reduced ejection fraction, making this diagnosis less likely.
Bacterial pneumonia typically presents with cough, fever, and purulent sputum production.9 Further evaluation usually reveals decreased breath sounds, dullness to percussion, and leukocytosis.10 Chest CT in bacterial pneumonia commonly shows a focal area of consolidation, which was not seen in our patient.11
Idiopathic pulmonary fibrosis usually presents with slowly progressive dyspnea and nonproductive cough.12 Physical examination usually reveals fine crackles and occasionally end-inspiratory “squeaks” if traction bronchiectasis is present.12 The diagnosis of idiopathic pulmonary fibrosis requires chest CT findings compatible with it (ie, basal fibrosis, reticular abnormalities, and honeycombing). However, it remains a diagnosis of exclusion and requires ruling out conditions known to cause pulmonary fibrosis such as hypersensitivity pneumonitis, connective tissue disease, and certain medications.12
Although idiopathic pulmonary fibrosis remained in the differential diagnosis, our patient remained on amiodarone, a known cause of pulmonary fibrosis.13 Similarly, the high-attenuation pleural lesions likely represented organizing pneumonia, which is more common in amiodarone pulmonary toxicity. And the ground-glass opacities made idiopathic pulmonary fibrosis unlikely, although they may be seen in an acute exacerbation of this disease.14 Thus, a diagnosis of idiopathic pulmonary fibrosis could not be made definitively.
Amiodarone pulmonary toxicity most commonly presents with acute to subacute cough and progressive dyspnea.13 Physical findings are similar to those in idiopathic pulmonary fibrosis and commonly include bibasilar crackles. Chest CT shows diffuse ground-glass opacities, reticular abnormalities, fibrosis, and increased attenuation of multiple organs, including the lungs, liver, and spleen.14 Bronchoalveolar lavage findings of lipid-laden macrophages suggest but do not definitively diagnose amiodarone pulmonary toxicity.15 And patients with acute amiodarone pulmonary toxicity may present with pigment-laden macrophages on bronchoalveolar lavage, as in our patient.16
Exclusion of hypersensitivity pneumonitis, connective tissue disease, and infection made our patient’s progressive dyspnea and chest CT findings of ground-glass opacities, fibrosis, and increased pulmonary and liver attenuation most consistent with amiodarone pulmonary toxicity.
Amiodarone was therefore discontinued. However, the test result of her lavage fluid for influenza A by polymerase chain reaction came back positive a few hours later.
WHAT IS THE NEXT STEP?
3. Given the positive influenza A polymerase chain reaction test, which of the following is the best next step in this patient’s management?
Surgical lung biopsy
Stop amiodarone and start supportive influenza management
Stop amiodarone and start dronedarone
Start an intravenous corticosteroid
Surgical lung biopsy is typically not required for diagnosis in patients with suspected amiodarone pulmonary toxicity. In addition, acute respiratory distress syndrome has been documented in patients who have undergone surgical biopsy for suspected amiodarone pulmonary toxicity.17
Thus, surgical biopsy is typically only done in cases of persistent symptoms despite withdrawal of amiodarone and initiation of steroid therapy.
Stopping amiodarone and starting supportive influenza management are the best next steps, as our patient’s fevers, cough, dyspnea, and laboratory test results were consistent with influenza.18 Moreover, CT findings of ground-glass opacities and reticular abnormalities can be seen in influenza.19
However, concomitant amiodarone pulmonary toxicity could not be ruled out, as CT showed increased lung and liver attenuation and fibrosis that could not be explained by influenza. And the elevation in aminotransferase levels more than 2 times the upper limit of normal and CT findings of increased liver attenuation suggested amiodarone hepatotoxicity. However, definitive diagnosis would require exclusion of other causes such as congestive hepatopathy, in some cases with liver biopsy.13
Our patient’s persistent hypoxia was thought to be due in part to influenza, and thus the best next step in management was to stop amiodarone and provide supportive care for influenza.
Dronedarone is an antiarrhythmic drug structurally and functionally similar to amiodarone. There are far fewer reports of pulmonary toxicity with dronedarone than with amiodarone.20 However, lack of data on dronedarone in amiodarone pulmonary toxicity, increased rates of hospitalization and death associated with dronedarone in patients like ours with advanced heart failure, and our patient’s previously implanted cardioverter-defibrillator for recurrent ventricular tachycardia all made dronedarone an undesirable alternative to amiodarone.21
Corticosteroids are useful in the treatment of amiodarone pulmonary toxicity when hypoxia and dyspnea are present at diagnosis.13 Our patient’s hypoxia and dyspnea were thought to be due in part to her acute influenza infection, and therefore corticosteroids were not used at the outset.
However, concomitant amiodarone pulmonary toxicity could not be excluded, and the elevation in aminotransferases of more than 2 times the upper limit of normal and CT findings of increased liver attenuation suggested amiodarone hepatotoxicity—though congestive hepatopathy remained in the differential diagnosis. Therefore, supportive therapy for influenza was instituted, and amiodarone was withheld. Her condition subsequently improved, and she was discharged.
FOLLOW-UP 1 MONTH LATER
At a follow-up visit 1 month later, our patient continued to have dyspnea and hypoxia. She did not have signs or symptoms consistent with decompensated heart failure.
Pulmonary function testing revealed the following values:
FEV1 0.69 L (56% of predicted)
FVC 1.08 L (64% of predicted)
Figure 2. In A, repeat chest computed tomography demonstrated increased liver attenuation (arrow); in B, it showed persistent ground-glass opacities (white arrow), increased pulmonary attenuation (black arrowhead), and worsening pleural effusions (black arrows). These findings supported the diagnosis of amiodarone pulmonary toxicity.FEV1/FVC ratio 64%
DLCO 2.20 mL/min/mm Hg (12% of predicted).
Aminotransferase levels had also normalized. Repeat chest CT showed persistent bibasilar interstitial fibrotic changes, enlarging bilateral pleural effusions, and persistent peripheral ground-glass opacities (Figure 2).
WHAT FURTHER TREATMENT IS APPROPRIATE?
4. Given the chest CT findings, which of the following is the most appropriate treatment strategy for this patient?
No further management, continue to hold amiodarone
Corticosteroids
Repeat bronchoalveolar lavage
Intravenous antibiotics
No further management of amiodarone pulmonary toxicity would be appropriate if our patient did not have a high burden of symptoms. However, when patients with amiodarone pulmonary toxicity present with hypoxia and dyspnea, corticosteroids should be started.13 Our patient remained symptomatic after discontinuation of amiodarone and resolution of her influenza infection, and CT showed persistent signs of amiodarone pulmonary toxicity, which required further management.
Corticosteroids are useful in treating amiodarone pulmonary toxicity when hypoxia and dyspnea are present at diagnosis. Our patient’s persistent ground-glass opacities, fibrotic changes, and increased attenuation in multiple organs on CT, coupled with a confirmed reduction in FVC of greater than 15% and reduction in DLCO of greater than 20% after recovery from influenza, were most consistent with persistent amiodarone pulmonary toxicity.13
Although our patient’s amiodarone had been discontinued, the long half-life of the drug (45 days) allowed pulmonary toxicity to progress even after the drug was discontinued.22 Because our patient continued to have hypoxia and dyspnea on exertion, the most appropriate next step in management (in addition to managing her pleural effusions) was to start corticosteroids.
For amiodarone pulmonary toxicity, prednisone is typically started at 40 to 60 mg daily and can result in rapid improvement in symptoms.13 Tapering should be slow and may take several months.
Bronchoalveolar lavage is typically used in suspected cases of amiodarone pulmonary toxicity only to rule out an alternative diagnosis such as infection. Lipid-laden macrophages may be seen in the fluid. However, lipid-laden macrophages are not diagnostic of amiodarone pulmonary toxicity, as this finding may also be seen in patients taking amiodarone who do not develop pulmonary toxicity.15 Other findings on bronchoalveolar lavage in amiodarone pulmonary toxicity are nonspecific and are not diagnostically useful.13
Intravenous antibiotics are appropriate if bacterial pneumonia is suspected. However, bacterial pneumonia typically presents with cough, fever, purulent sputum production, and focal consolidation on chest imaging.9 Our patient’s CT findings of persistent peripheral ground-glass opacities and lack of cough, fever, or purulent sputum production were not consistent with bacterial pneumonia, and therefore intravenous antibiotics were not indicated.
CASE CONCLUSION
Given our patient’s persistent dyspnea, hypoxia, and chest CT findings consistent with amiodarone pulmonary toxicity, it was recommended that she start corticosteroids. However, before starting therapy, she suffered a femoral fracture that required surgical intervention. Around the time of the procedure, she had an ST-segment elevation myocardial infarction requiring vasopressor support and mechanical ventilation. At that time, the patient and family decided to pursue comfort measures, and she died peacefully.
MORE ABOUT AMIODARONE PULMONARY TOXICITY
Pulmonary toxicity is a well-described consequence of amiodarone therapy.23 Amiodarone carries a 2% risk of pulmonary toxicity.24 Although higher doses are more likely to cause pulmonary toxicity, lower doses also have been implicated.22,24 Preexisting pulmonary disease may predispose patients taking amiodarone to pulmonary toxicity; however, this is not uniformly seen.25
Mortality rates as high as 10% from amiodarone pulmonary toxicity have been reported. Thus, diligent surveillance for pulmonary toxicity with pulmonary function tests in patients taking amiodarone is mandatory. In particular, a reduction in FVC of greater than 15% or in DLCO of greater than 20% from baseline may be seen in amiodarone pulmonary toxicity.26
Amiodarone pulmonary toxicity can present at any time after the start of therapy, but it occurs most often after 6 to 12 months.13 Patients typically experience insidious dyspnea; however, presentation with acute to subacute cough and progressive dyspnea can occur, especially with high concentrations of supplemental oxygen with or without mechanical ventilation.12,27 Findings on physical examination include bibasilar crackles. CT chest findings include diffuse ground-glass opacities, reticular abnormalities, fibrosis, and increased attenuation in multiple organs, including the lung, liver, and spleen.14
The diagnosis of amiodarone pulmonary toxicity requires ruling out hypersensitivity pneumonitis, connective tissue disease, heart failure, and infection. Surgical biopsy and bronchoalveolar lavage are not commonly used to establish the diagnosis of amiodarone pulmonary toxicity, as surgical biopsy increases the risk of acute respiratory distress syndrome, and the results of bronchoalveolar lavage are usually nonspecific.13,15
Initial treatment involves discontinuing the amiodarone once the diagnosis is suspected. If patients have worsening hypoxia or dyspnea at the time of diagnosis, corticosteroids can be used. Prednisone is typically started at 40 to 60 mg daily and can result in rapid improvement in symptoms.13 Tapering of corticosteroids should occur slowly and may take several months.
References
McKee PA, Castelli WP, McNamara PM, Kannel WB. The natural history of congestive heart failure: the Framingham study. N Engl J Med 1971; 285(26):1441–1446. doi:10.1056/NEJM197112232852601
Stein PD, Terrin ML, Hales CA, et al. Clinical, laboratory, roentgenographic, and electrocardiographic findings in patients with acute pulmonary embolism and no pre-existing cardiac or pulmonary disease. Chest 1991; 100(3):598–603. pmid:1909617
Baggish AL, Siebert U, Lainchbury JG, et al. A validated clinical and biochemical score for the diagnosis of acute heart failure: the ProBNP investigation of dyspnea in the emergency department (PRIDE) acute heart failure score. Am Heart J 2006; 151(1):48–54. doi:10.1016/j.ahj.2005.02.031
National Heart, Lung, and Blood Institute. National Asthma Education and Prevention Program. Expert panel report 3: Guidelines for the diagnosis and management of asthma. www.nhlbi.nih.gov/sites/default/files/media/docs/asthgdln_1.pdf. Accessed August 3, 2018.
Brenner BE, Abraham E, Simon RR. Position and diaphoresis in acute asthma. Am J Med 1983; 74(6):1005–1009. pmid:6407304
Badgett RG, Tanaka DJ, Hunt DK, et al. Can moderate chronic obstructive pulmonary disease be diagnosed by historical and physical findings alone? Am J Med 1993; 94(2):188–196. pmid:8430714
Erie AJ, McClure RF, Wolanskyj AP. Amiodarone-induced bone marrow granulomas: an unusual cause of reversible pancytopenia. Hematol Rep 2010; 2(1):e6. doi:10.4081/hr.2010.e6
Marrie TJ. Community-acquired pneumonia. Clin Infect Dis 1994; 18(4):501–513. pmid:8038304
Metlay JP, Kapoor WN, Fine MJ. Does this patient have community-acquired pneumonia? Diagnosing pneumonia by history and physical examination. JAMA 1997; 278(17):1440–1445. pmid:9356004
Walker CM, Abbott GF, Greene RE, Shepard JA, Vummidi D, Digumarthy SR. Imaging pulmonary infection: classic signs and patterns. AJR Am J Roentgenol 2014; 202(3):479–492. doi:10.2214/AJR.13.11463
Raghu G, Collard HR, Egan JJ, et al; ATS/ERS/JRS/ALAT Committee on Idiopathic Pulmonary Fibrosis. An official ATS/ERS/JRS/ALAT statement: idiopathic pulmonary fibrosis: evidence-based guidelines for diagnosis and management. Am J Respir Crit Care Med 2011; 183(6):788–824. doi:10.1164/rccm.2009-040GL
Goldschlager N, Epstein AE, Naccarelli GV, et al; Practice Guidelines Sub-committee, North American Society of Pacing and Electrophysiology (HRS). A practical guide for clinicians who treat patients with amiodarone: 2007. Heart Rhythm 2007; 4(9):1250–1259. doi:10.1016/j.hrthm.2007.07.020
Martin WJ 2nd, Rosenow EC 3rd. Amiodarone pulmonary toxicity: recognition and pathogenesis (Part I). Chest 1988; 93(5):1067–1075. pmid:3282816
Iskandar SB, Abi-Saleh B, Keith RL, Byrd RP Jr, Roy TM. Amiodarone-induced alveolar hemorrhage. South Med J 2006; 99(4):383–387.
Van Mieghem W, Coolen L, Malysse I, Lacquet LM, Deneffe GJ, Demedts MG. Amiodarone and the development of ARDS after lung surgery. Chest 1994; 105(6):1642–1645. pmid:8205854
Nicholson KG. Clinical features of influenza. Semin Respir Infect 1992; 7(1):26–37. pmid:1609165
Muller NL, Franquet T, Lee KS, Silva CIS. Viruses, mycoplasma, and chlamydia. In: Imaging of Pulmonary Infections. Philadelphia, PA: Lippincott Williams & Wilkins; 2007:94–114.
Stack S, Nguyen DV, Casto A, Ahuja N. Diffuse alveolar damage in a patient receiving dronedarone. Chest 2015; 147(4):e131–e133. doi:10.1378/chest.14-1849
De Ferrari GM, Dusi V. Drug safety evaluation of dronedarone in atrial fibrillation. Expert Opin Drug Saf 2012; 11(6):1023–1045. doi:10.1517/14740338.2012.722994
Okayasu K, Takeda Y, Kojima J, et al. Amiodarone pulmonary toxicity: a patient with three recurrences of pulmonary toxicity and consideration of the probable risk for relapse. Intern Med 2006; 45(22):1303–1307. pmid:17170505
Vorperian VR, Havighurst TC, Miller S, January CT. Adverse effects of low dose amiodarone: a meta-analysis. J Am Coll Cardiol 1997; 30(3):791–798. pmid:9283542
Amiodarone Trials Meta-Analysis Investigators. Effect of prophylactic amiodarone on mortality after acute myocardial infarction and in congestive heart failure: meta-analysis of individual data from 6500 patients in randomised trials. Lancet 1997; 350(9089):1417–1424. pmid:9371164
Olshansky B, Sami M, Rubin A, et al; NHLBI AFFIRM Investigators. Use of amiodarone for atrial fibrillation in patients with preexisting pulmonary disease in the AFFIRM study. Am J Cardiol 2005; 95(3):404–405. doi:10.1016/j.amjcard.2004.09.044
Camus P. Interstitial lung disease from drugs, biologics, and radiation. In: Schwartz MI, King TE Jr, eds. Interstitial Lung Disease. 5th ed. Shelton, CT: People’s Medical Publishing House; 2011:637–644.
Wolkove N, Baltzan M. Amiodarone pulmonary toxicity. Can Respir J 2009; 16(2):43–48. doi:10.1155/2009/282540
An 87-year-old woman was brought to the intensive care unit with worsening shortness of breath on exertion, fatigue, orthopnea, paroxysmal nocturnal dyspnea, lower extremity swelling, subjective fever, productive cough, and rhinorrhea over the last week. She reported no chest pain, lightheadedness, or palpitations. Her medical history included the following:
Cardiac arrest with recurrent ventricular tachycardia requiring an implanted cardioverter-defibrillator and amiodarone therapy
Hypothyroidism requiring levothyroxine
Asthma with a moderate obstructive pattern: forced expiratory volume in 1 second (FEV1) 60% of predicted, forced vital capacity (FVC) 2.06 L, FEV1/FVC 54%, diffusing capacity for carbon monoxide (DLCO) 72% of predicted with positive bronchodilator response
Long-standing essential thrombocythemia treated with hydroxyurea.
Before admission, she had been reliably taking guideline-directed heart failure therapy as well as amiodarone for her recurrent ventricular tachycardia. Her levothyroxine had recently been increased as well.
Physical examination. On admission, her blood pressure was 95/53 mm Hg, heart rate 73 beats per minute, temperature 36.7ºC (98.1ºF), and oxygen saturation 81% requiring supplemental oxygen 15 L/min by nonrebreather face mask. Physical examination revealed elevated jugular venous pressure, bibasilar crackles, lower extremity edema, and a grade 3 of 6 holosystolic murmur both at the left sternal border and at the apex radiating to the axilla. There was no evidence of wheezing or pulsus paradoxus.
Electrocardiography showed sinus rhythm and an old left bundle branch block.
Chest radiography showed cardiomegaly, bilateral pleural effusions, and pulmonary edema.
WHAT IS THE CAUSE OF HER SYMPTOMS?
1. Based on the available information, which of the following is the most likely cause of this patient’s clinical presentation?
Acute decompensated heart failure
Pulmonary embolism
Exacerbation of asthma
Exacerbation of chronic obstructive pulmonary disease (COPD)
Heart failure is a clinical diagnosis based on careful history-taking and physical examination. Major criteria include paroxysmal nocturnal dyspnea, orthopnea, elevated jugular venous pressure, pulmonary crackles, a third heart sound, cardiomegaly, pulmonary edema, and weight loss of more than 4.5 kg with diuretic therapy.1 N-terminal pro-B-type natriuretic peptide (NT-proBNP) is also an effective marker of acute decompensated heart failure in the proper clinical setting.2
Our patient’s elevated jugular venous pressure, bibasilar crackles, lower extremity edema, chest radiography findings consistent with pulmonary edema, markedly elevated NT-proBNP, history of orthopnea, paroxysmal nocturnal dyspnea, and dyspnea on exertion were most consistent with acute decompensated heart failure. Her cough and subjective fevers were thought to be due to an upper respiratory tract viral infection.
Pulmonary embolism causes pleuritic chest pain, dyspnea, and, occasionally, elevated troponin. The most common feature on electrocardiography is sinus tachycardia; nonspecific ST-segment and T-wave changes may also be seen.3
Although pulmonary embolism remained in the differential diagnosis, our patient’s lack of typical features of pulmonary embolism made this less likely.
Asthma is characterized by recurrent airflow obstruction and bronchial hyperresponsiveness.4 Asthma exacerbations present with wheezing, tachypnea, tachycardia, and pulsus paradoxus.5
Despite her previous asthma diagnosis, our patient’s lack of typical features of asthma exacerbation made this diagnosis unlikely.
COPD exacerbations present with increased dyspnea, cough, sputum production, wheezing, lung resonance to percussion, and distant heart sounds, and are characterized by airflow obstruction.6,7
Although our patient presented with cough and dyspnea, she had no history of COPD and her other signs and symptoms (elevated jugular venous pressure, elevated NT-proBNP, and peripheral edema) could not be explained by COPD exacerbation.
OUR PATIENT UNDERWENT FURTHER TESTING
Echocardiography revealed severe left ventricular enlargement, an ejection fraction of 20% (which was near her baseline value), diffuse regional wall-motion abnormalities, severe mitral regurgitation, and moderate tricuspid regurgitation consistent with an exacerbation of heart failure.
We considered the possibility that her heart failure symptoms might be due to precipitous up-titration of her levothyroxine dose, given her borderline-elevated free thyroxine (T4) and increase in cardiac index (currently 4.45 L/min/m2, previously 2.20 L/min/m2 by the left ventricular outflow tract velocity time integral method). However, given her reduced ejection fraction, this clinical presentation most likely represented an acute exacerbation of her chronic heart failure. Her subjective fevers were thought to be due to a viral infection of the upper respiratory tract. The macrocytic anemia and thrombocytopenia were thought to be a side effect of her long-standing treatment with hydroxyurea for essential thrombocythemia, although amiodarone has also been associated with cytopenia.8
Treatment was started with intravenous diuretics and positive pressure ventilation with oxygen supplementation. Her levothyroxine dose was reduced, and her hydroxyurea was stopped.
Figure 1. Chest computed tomography axial views demonstrated increased attenuation in the liver (A, arrow) and left pleural base (B, arrow). Evaluation of the right lung base revealed ground-glass opacities (C, arrow) and honeycombing (D, arrow). These findings were consistent with amiodarone pulmonary toxicity.After aggressive diuresis, our patient returned to euvolemia. However, she had persistent fine crackles and hypoxia. She had no further fever, and her vital signs were otherwise stable. Her cytopenia improved with cessation of hydroxyurea. Chest computed tomography (CT) showed bibasilar ground-glass infiltrates with areas of interstitial fibrosis, high-attenuation pleural lesions, and increased liver attenuation (Figure 1).
Further testing for connective tissue disease and hypersensitivity pneumonitis was also done, and the results were negative. To exclude an atypical infection, bronchoalveolar lavage was performed; preliminary microbial testing was negative, and the white blood cell count in the lavage fluid was 90% macrophages (pigment-laden), 7% neutrophils, and 3% lymphocytes.
WHAT IS THE CAUSE OF HER PERSISTENT PULMONARY FINDINGS?
2. Given the CT findings and laboratory results, what is the most likely cause of our patient’s persistent crackles and hypoxia?
Heart failure with reduced ejection fraction
Bacterial pneumonia
Idiopathic pulmonary fibrosis
Amiodarone pulmonary toxicity
Heart failure with reduced ejection fraction can cause ground-glass opacities on CT due to increased pulmonary edema. Although our patient initially presented with acute decompensation of heart failure with reduced ejection fraction decompensation, she had returned to euvolemia after aggressive diuresis. Moreover, increased pleural and liver attenuation are not typically seen as a result of heart failure with reduced ejection fraction, making this diagnosis less likely.
Bacterial pneumonia typically presents with cough, fever, and purulent sputum production.9 Further evaluation usually reveals decreased breath sounds, dullness to percussion, and leukocytosis.10 Chest CT in bacterial pneumonia commonly shows a focal area of consolidation, which was not seen in our patient.11
Idiopathic pulmonary fibrosis usually presents with slowly progressive dyspnea and nonproductive cough.12 Physical examination usually reveals fine crackles and occasionally end-inspiratory “squeaks” if traction bronchiectasis is present.12 The diagnosis of idiopathic pulmonary fibrosis requires chest CT findings compatible with it (ie, basal fibrosis, reticular abnormalities, and honeycombing). However, it remains a diagnosis of exclusion and requires ruling out conditions known to cause pulmonary fibrosis such as hypersensitivity pneumonitis, connective tissue disease, and certain medications.12
Although idiopathic pulmonary fibrosis remained in the differential diagnosis, our patient remained on amiodarone, a known cause of pulmonary fibrosis.13 Similarly, the high-attenuation pleural lesions likely represented organizing pneumonia, which is more common in amiodarone pulmonary toxicity. And the ground-glass opacities made idiopathic pulmonary fibrosis unlikely, although they may be seen in an acute exacerbation of this disease.14 Thus, a diagnosis of idiopathic pulmonary fibrosis could not be made definitively.
Amiodarone pulmonary toxicity most commonly presents with acute to subacute cough and progressive dyspnea.13 Physical findings are similar to those in idiopathic pulmonary fibrosis and commonly include bibasilar crackles. Chest CT shows diffuse ground-glass opacities, reticular abnormalities, fibrosis, and increased attenuation of multiple organs, including the lungs, liver, and spleen.14 Bronchoalveolar lavage findings of lipid-laden macrophages suggest but do not definitively diagnose amiodarone pulmonary toxicity.15 And patients with acute amiodarone pulmonary toxicity may present with pigment-laden macrophages on bronchoalveolar lavage, as in our patient.16
Exclusion of hypersensitivity pneumonitis, connective tissue disease, and infection made our patient’s progressive dyspnea and chest CT findings of ground-glass opacities, fibrosis, and increased pulmonary and liver attenuation most consistent with amiodarone pulmonary toxicity.
Amiodarone was therefore discontinued. However, the test result of her lavage fluid for influenza A by polymerase chain reaction came back positive a few hours later.
WHAT IS THE NEXT STEP?
3. Given the positive influenza A polymerase chain reaction test, which of the following is the best next step in this patient’s management?
Surgical lung biopsy
Stop amiodarone and start supportive influenza management
Stop amiodarone and start dronedarone
Start an intravenous corticosteroid
Surgical lung biopsy is typically not required for diagnosis in patients with suspected amiodarone pulmonary toxicity. In addition, acute respiratory distress syndrome has been documented in patients who have undergone surgical biopsy for suspected amiodarone pulmonary toxicity.17
Thus, surgical biopsy is typically only done in cases of persistent symptoms despite withdrawal of amiodarone and initiation of steroid therapy.
Stopping amiodarone and starting supportive influenza management are the best next steps, as our patient’s fevers, cough, dyspnea, and laboratory test results were consistent with influenza.18 Moreover, CT findings of ground-glass opacities and reticular abnormalities can be seen in influenza.19
However, concomitant amiodarone pulmonary toxicity could not be ruled out, as CT showed increased lung and liver attenuation and fibrosis that could not be explained by influenza. And the elevation in aminotransferase levels more than 2 times the upper limit of normal and CT findings of increased liver attenuation suggested amiodarone hepatotoxicity. However, definitive diagnosis would require exclusion of other causes such as congestive hepatopathy, in some cases with liver biopsy.13
Our patient’s persistent hypoxia was thought to be due in part to influenza, and thus the best next step in management was to stop amiodarone and provide supportive care for influenza.
Dronedarone is an antiarrhythmic drug structurally and functionally similar to amiodarone. There are far fewer reports of pulmonary toxicity with dronedarone than with amiodarone.20 However, lack of data on dronedarone in amiodarone pulmonary toxicity, increased rates of hospitalization and death associated with dronedarone in patients like ours with advanced heart failure, and our patient’s previously implanted cardioverter-defibrillator for recurrent ventricular tachycardia all made dronedarone an undesirable alternative to amiodarone.21
Corticosteroids are useful in the treatment of amiodarone pulmonary toxicity when hypoxia and dyspnea are present at diagnosis.13 Our patient’s hypoxia and dyspnea were thought to be due in part to her acute influenza infection, and therefore corticosteroids were not used at the outset.
However, concomitant amiodarone pulmonary toxicity could not be excluded, and the elevation in aminotransferases of more than 2 times the upper limit of normal and CT findings of increased liver attenuation suggested amiodarone hepatotoxicity—though congestive hepatopathy remained in the differential diagnosis. Therefore, supportive therapy for influenza was instituted, and amiodarone was withheld. Her condition subsequently improved, and she was discharged.
FOLLOW-UP 1 MONTH LATER
At a follow-up visit 1 month later, our patient continued to have dyspnea and hypoxia. She did not have signs or symptoms consistent with decompensated heart failure.
Pulmonary function testing revealed the following values:
FEV1 0.69 L (56% of predicted)
FVC 1.08 L (64% of predicted)
Figure 2. In A, repeat chest computed tomography demonstrated increased liver attenuation (arrow); in B, it showed persistent ground-glass opacities (white arrow), increased pulmonary attenuation (black arrowhead), and worsening pleural effusions (black arrows). These findings supported the diagnosis of amiodarone pulmonary toxicity.FEV1/FVC ratio 64%
DLCO 2.20 mL/min/mm Hg (12% of predicted).
Aminotransferase levels had also normalized. Repeat chest CT showed persistent bibasilar interstitial fibrotic changes, enlarging bilateral pleural effusions, and persistent peripheral ground-glass opacities (Figure 2).
WHAT FURTHER TREATMENT IS APPROPRIATE?
4. Given the chest CT findings, which of the following is the most appropriate treatment strategy for this patient?
No further management, continue to hold amiodarone
Corticosteroids
Repeat bronchoalveolar lavage
Intravenous antibiotics
No further management of amiodarone pulmonary toxicity would be appropriate if our patient did not have a high burden of symptoms. However, when patients with amiodarone pulmonary toxicity present with hypoxia and dyspnea, corticosteroids should be started.13 Our patient remained symptomatic after discontinuation of amiodarone and resolution of her influenza infection, and CT showed persistent signs of amiodarone pulmonary toxicity, which required further management.
Corticosteroids are useful in treating amiodarone pulmonary toxicity when hypoxia and dyspnea are present at diagnosis. Our patient’s persistent ground-glass opacities, fibrotic changes, and increased attenuation in multiple organs on CT, coupled with a confirmed reduction in FVC of greater than 15% and reduction in DLCO of greater than 20% after recovery from influenza, were most consistent with persistent amiodarone pulmonary toxicity.13
Although our patient’s amiodarone had been discontinued, the long half-life of the drug (45 days) allowed pulmonary toxicity to progress even after the drug was discontinued.22 Because our patient continued to have hypoxia and dyspnea on exertion, the most appropriate next step in management (in addition to managing her pleural effusions) was to start corticosteroids.
For amiodarone pulmonary toxicity, prednisone is typically started at 40 to 60 mg daily and can result in rapid improvement in symptoms.13 Tapering should be slow and may take several months.
Bronchoalveolar lavage is typically used in suspected cases of amiodarone pulmonary toxicity only to rule out an alternative diagnosis such as infection. Lipid-laden macrophages may be seen in the fluid. However, lipid-laden macrophages are not diagnostic of amiodarone pulmonary toxicity, as this finding may also be seen in patients taking amiodarone who do not develop pulmonary toxicity.15 Other findings on bronchoalveolar lavage in amiodarone pulmonary toxicity are nonspecific and are not diagnostically useful.13
Intravenous antibiotics are appropriate if bacterial pneumonia is suspected. However, bacterial pneumonia typically presents with cough, fever, purulent sputum production, and focal consolidation on chest imaging.9 Our patient’s CT findings of persistent peripheral ground-glass opacities and lack of cough, fever, or purulent sputum production were not consistent with bacterial pneumonia, and therefore intravenous antibiotics were not indicated.
CASE CONCLUSION
Given our patient’s persistent dyspnea, hypoxia, and chest CT findings consistent with amiodarone pulmonary toxicity, it was recommended that she start corticosteroids. However, before starting therapy, she suffered a femoral fracture that required surgical intervention. Around the time of the procedure, she had an ST-segment elevation myocardial infarction requiring vasopressor support and mechanical ventilation. At that time, the patient and family decided to pursue comfort measures, and she died peacefully.
MORE ABOUT AMIODARONE PULMONARY TOXICITY
Pulmonary toxicity is a well-described consequence of amiodarone therapy.23 Amiodarone carries a 2% risk of pulmonary toxicity.24 Although higher doses are more likely to cause pulmonary toxicity, lower doses also have been implicated.22,24 Preexisting pulmonary disease may predispose patients taking amiodarone to pulmonary toxicity; however, this is not uniformly seen.25
Mortality rates as high as 10% from amiodarone pulmonary toxicity have been reported. Thus, diligent surveillance for pulmonary toxicity with pulmonary function tests in patients taking amiodarone is mandatory. In particular, a reduction in FVC of greater than 15% or in DLCO of greater than 20% from baseline may be seen in amiodarone pulmonary toxicity.26
Amiodarone pulmonary toxicity can present at any time after the start of therapy, but it occurs most often after 6 to 12 months.13 Patients typically experience insidious dyspnea; however, presentation with acute to subacute cough and progressive dyspnea can occur, especially with high concentrations of supplemental oxygen with or without mechanical ventilation.12,27 Findings on physical examination include bibasilar crackles. CT chest findings include diffuse ground-glass opacities, reticular abnormalities, fibrosis, and increased attenuation in multiple organs, including the lung, liver, and spleen.14
The diagnosis of amiodarone pulmonary toxicity requires ruling out hypersensitivity pneumonitis, connective tissue disease, heart failure, and infection. Surgical biopsy and bronchoalveolar lavage are not commonly used to establish the diagnosis of amiodarone pulmonary toxicity, as surgical biopsy increases the risk of acute respiratory distress syndrome, and the results of bronchoalveolar lavage are usually nonspecific.13,15
Initial treatment involves discontinuing the amiodarone once the diagnosis is suspected. If patients have worsening hypoxia or dyspnea at the time of diagnosis, corticosteroids can be used. Prednisone is typically started at 40 to 60 mg daily and can result in rapid improvement in symptoms.13 Tapering of corticosteroids should occur slowly and may take several months.
References
McKee PA, Castelli WP, McNamara PM, Kannel WB. The natural history of congestive heart failure: the Framingham study. N Engl J Med 1971; 285(26):1441–1446. doi:10.1056/NEJM197112232852601
Stein PD, Terrin ML, Hales CA, et al. Clinical, laboratory, roentgenographic, and electrocardiographic findings in patients with acute pulmonary embolism and no pre-existing cardiac or pulmonary disease. Chest 1991; 100(3):598–603. pmid:1909617
Baggish AL, Siebert U, Lainchbury JG, et al. A validated clinical and biochemical score for the diagnosis of acute heart failure: the ProBNP investigation of dyspnea in the emergency department (PRIDE) acute heart failure score. Am Heart J 2006; 151(1):48–54. doi:10.1016/j.ahj.2005.02.031
National Heart, Lung, and Blood Institute. National Asthma Education and Prevention Program. Expert panel report 3: Guidelines for the diagnosis and management of asthma. www.nhlbi.nih.gov/sites/default/files/media/docs/asthgdln_1.pdf. Accessed August 3, 2018.
Brenner BE, Abraham E, Simon RR. Position and diaphoresis in acute asthma. Am J Med 1983; 74(6):1005–1009. pmid:6407304
Badgett RG, Tanaka DJ, Hunt DK, et al. Can moderate chronic obstructive pulmonary disease be diagnosed by historical and physical findings alone? Am J Med 1993; 94(2):188–196. pmid:8430714
Erie AJ, McClure RF, Wolanskyj AP. Amiodarone-induced bone marrow granulomas: an unusual cause of reversible pancytopenia. Hematol Rep 2010; 2(1):e6. doi:10.4081/hr.2010.e6
Marrie TJ. Community-acquired pneumonia. Clin Infect Dis 1994; 18(4):501–513. pmid:8038304
Metlay JP, Kapoor WN, Fine MJ. Does this patient have community-acquired pneumonia? Diagnosing pneumonia by history and physical examination. JAMA 1997; 278(17):1440–1445. pmid:9356004
Walker CM, Abbott GF, Greene RE, Shepard JA, Vummidi D, Digumarthy SR. Imaging pulmonary infection: classic signs and patterns. AJR Am J Roentgenol 2014; 202(3):479–492. doi:10.2214/AJR.13.11463
Raghu G, Collard HR, Egan JJ, et al; ATS/ERS/JRS/ALAT Committee on Idiopathic Pulmonary Fibrosis. An official ATS/ERS/JRS/ALAT statement: idiopathic pulmonary fibrosis: evidence-based guidelines for diagnosis and management. Am J Respir Crit Care Med 2011; 183(6):788–824. doi:10.1164/rccm.2009-040GL
Goldschlager N, Epstein AE, Naccarelli GV, et al; Practice Guidelines Sub-committee, North American Society of Pacing and Electrophysiology (HRS). A practical guide for clinicians who treat patients with amiodarone: 2007. Heart Rhythm 2007; 4(9):1250–1259. doi:10.1016/j.hrthm.2007.07.020
Martin WJ 2nd, Rosenow EC 3rd. Amiodarone pulmonary toxicity: recognition and pathogenesis (Part I). Chest 1988; 93(5):1067–1075. pmid:3282816
Iskandar SB, Abi-Saleh B, Keith RL, Byrd RP Jr, Roy TM. Amiodarone-induced alveolar hemorrhage. South Med J 2006; 99(4):383–387.
Van Mieghem W, Coolen L, Malysse I, Lacquet LM, Deneffe GJ, Demedts MG. Amiodarone and the development of ARDS after lung surgery. Chest 1994; 105(6):1642–1645. pmid:8205854
Nicholson KG. Clinical features of influenza. Semin Respir Infect 1992; 7(1):26–37. pmid:1609165
Muller NL, Franquet T, Lee KS, Silva CIS. Viruses, mycoplasma, and chlamydia. In: Imaging of Pulmonary Infections. Philadelphia, PA: Lippincott Williams & Wilkins; 2007:94–114.
Stack S, Nguyen DV, Casto A, Ahuja N. Diffuse alveolar damage in a patient receiving dronedarone. Chest 2015; 147(4):e131–e133. doi:10.1378/chest.14-1849
De Ferrari GM, Dusi V. Drug safety evaluation of dronedarone in atrial fibrillation. Expert Opin Drug Saf 2012; 11(6):1023–1045. doi:10.1517/14740338.2012.722994
Okayasu K, Takeda Y, Kojima J, et al. Amiodarone pulmonary toxicity: a patient with three recurrences of pulmonary toxicity and consideration of the probable risk for relapse. Intern Med 2006; 45(22):1303–1307. pmid:17170505
Vorperian VR, Havighurst TC, Miller S, January CT. Adverse effects of low dose amiodarone: a meta-analysis. J Am Coll Cardiol 1997; 30(3):791–798. pmid:9283542
Amiodarone Trials Meta-Analysis Investigators. Effect of prophylactic amiodarone on mortality after acute myocardial infarction and in congestive heart failure: meta-analysis of individual data from 6500 patients in randomised trials. Lancet 1997; 350(9089):1417–1424. pmid:9371164
Olshansky B, Sami M, Rubin A, et al; NHLBI AFFIRM Investigators. Use of amiodarone for atrial fibrillation in patients with preexisting pulmonary disease in the AFFIRM study. Am J Cardiol 2005; 95(3):404–405. doi:10.1016/j.amjcard.2004.09.044
Camus P. Interstitial lung disease from drugs, biologics, and radiation. In: Schwartz MI, King TE Jr, eds. Interstitial Lung Disease. 5th ed. Shelton, CT: People’s Medical Publishing House; 2011:637–644.
Wolkove N, Baltzan M. Amiodarone pulmonary toxicity. Can Respir J 2009; 16(2):43–48. doi:10.1155/2009/282540
Hospital readmissions for acute myocardial infarction (AMI), heart failure, and pneumonia have become central to quality-measurement efforts by the Centers for Medicare & Medicaid Services (CMS), which seek to improve hospital care transitions through public reporting and payment programs.1 Most current measures are limited to readmissions that require inpatient hospitalization and do not capture return visits to the emergency department (ED) that do not result in readmission but rather ED discharge. These visits may reflect important needs for acute, unscheduled care during the vulnerable posthospitalization period.2-5 While previous research has suggested that nearly 10% of patients may return to the ED following hospital discharge without readmission, the characteristics of these visits among Medicare beneficiaries and the implications for national care-coordination quality-measurement initiatives have not been explored.6,7
As the locus of acute outpatient care and the primary portal of hospital admissions and readmissions, ED visits following hospital discharge may convey meaningful information about posthospitalization care transitions.8,9 In addition, recent reviews and perspectives have highlighted the role of ED care-coordination services as interventions to reduce inpatient hospitalizations and improve care transitions,10,11 yet no empirical studies have evaluated the relationship between these unique care-coordination opportunities in the ED and care-coordination outcomes, such as hospital readmissions. As policymakers seek to develop accountability measures that capture the totality of acute, unscheduled visits following hospital discharge, describing the relationship between ED visits and readmissions will be essential to providers for benchmarking and to policymakers and payers seeking to reduce the total cost of care.12,13
Accordingly, we sought to characterize the frequency, diagnoses, and hospital-level variation in treat-and-discharge ED visitation following hospital discharge for 3 conditions for which hospital readmission is publicly reported by the CMS: AMI, heart failure, and pneumonia. We also sought to evaluate the relationship between hospital-level ED visitation following hospital discharge and publicly reported, risk-standardized readmission rates (RSRRs).
METHODS
Study Design
This study was a cross-sectional analysis of Medicare beneficiaries discharged alive following hospitalization for AMI, heart failure, and pneumonia between July 2011 and June 2012.
Selection of Participants
We used Medicare Standard Analytic Files to identify inpatient hospitalizations for each disease cohort based on principal discharge diagnoses. Each condition-specific cohort was constructed to be consistent with the CMS’s readmission measures using International Classification of Diseases, 9th Revision-Clinical Modification codes to identify AMI, heart failure, and pneumonia discharges.1 We included only patients who were enrolled in fee-for-service (FFS) Medicare parts A and B for 12 months prior to their index hospitalization to maximize the capture of diagnoses for risk adjustment. Each cohort included only patients who were discharged alive while maintaining FFS coverage for at least 30 days following hospital discharge to minimize bias in outcome ascertainment. We excluded patients who were discharged against medical advice. All contiguous admissions that were identified in a transfer chain were considered to be a single admission. Hospitals with fewer than 25 condition-specific index hospital admissions were excluded from this analysis for consistency with publicly reported measures.1
Measurements
We measured postdischarge, treat-and release ED visits that occurred at any hospital within 30 days of hospital discharge from the index hospitalization. ED visits were identified as a hospital outpatient claim for ED services using hospital outpatient revenue center codes 0450, 0451, 0452, 0456, and 0981. This definition is consistent with those of previous studies.3,14 We defined postdischarge ED visits as treat-and-discharge visits or visits that did not result in inpatient readmission or observation stays. Similar to readmission measures, only 1 postdischarge ED visit was counted toward the hospital-level outcome in patients with multiple ED visits within the 30 days following hospital discharge. We defined readmission as the first unplanned, inpatient hospitalization occurring at any hospital within the 30-day period following discharge. Any subsequent inpatient admission following the 30-day period was considered a distinct index admission if it met the inclusion criteria. Consistent with CMS methods, unplanned, inpatient readmissions are from any source and are not limited to patients who were first evaluated in the ED.
Outcomes
We describe hospital-level, postdischarge ED visitation as the risk-standardized postdischarge ED visit rate. The general construct of this measure is consistent with those of prior studies that define postdischarge ED visitation as the proportion of index admissions followed by a treat-and-discharge ED visit without hospital readmission2,3; however, this outcome also incorporates a risk-standardization model with covariates that are identical to the risk-standardization approach that is used for readmission measurement.
We describe hospital-level readmission by calculating RSRRs consistent with CMS readmission measures, which are endorsed by the National Quality Forum and used for public reporting.15-17 Detailed technical documentation, including the SAS code used to replicate hospital-level measures of readmission, are available publicly through the CMS QualityNet portal.18
We calculated risk-standardized postdischarge ED visit rates and RSRRs as the ratio of the predicted number of postdischarge ED visits or readmissions for a hospital given its observed case mix to the expected number of postdischarge ED visits or readmissions based on the nation’s performance with that hospital’s case mix, respectively. This approach estimates a distinct risk-standardized postdischarge ED visit rate and RSRR for each hospital using hierarchical generalized linear models (HGLMs) and using a logit link with a first-level adjustment for age, sex, 29 clinical covariates for AMI, 35 clinical covariates for heart failure, and 38 clinical covariates for pneumonia. Each clinical covariate is identified based on inpatient and outpatient claims during the 12 months prior to the index hospitalization. The second level of the HGLM includes a random hospital-level intercept. This approach to measuring hospital readmissions accounts for the correlated nature of observed readmission rates within a hospital and reflects the assumption that after adjustment for patient characteristics and sampling variability, the remaining variation in postdischarge ED visit rates or readmission rates reflects hospital quality.
Analysis
In order to characterize treat-and-discharge postdischarge ED visits, we first described the clinical conditions that were evaluated during the first postdischarge ED visit. Based on the principal discharge diagnosis, ED visits were grouped into clinically meaningful categories using the Agency for Healthcare Research and Quality Clinical Classifications Software (CCS).19 We also report hospital-level variation in risk-standardized postdischarge ED visit rates for AMI, heart failure, and pneumonia.
Next, we examined the relationship between hospital characteristics and risk-standardized postdischarge ED visit rates. We linked hospital characteristics from the American Hospital Association (AHA) Annual Survey to the study dataset, including the following: safety-net status, teaching status, and urban or rural status. Consistent with prior work, hospital safety-net status was defined as a hospital Medicaid caseload greater than 1 standard deviation above the mean Medicaid caseload in the hospital’s state. Approximately 94% of the hospitals included in the 3 condition cohorts in the dataset had complete data in the 2011 AHA Annual Survey to be included in this analysis.
We evaluated the relationship between postdischarge ED visit rates and hospital readmission rates in 2 ways. First, we calculated Spearman rank correlation coefficients between hospital-level, risk-standardized postdischarge ED visit rates and RSRRs. Second, we calculated hospital-level variation in RSRRs based on the strata of risk-standardized postdischarge ED visit rates. Given the normal distribution of postdischarge ED visit rates, we grouped hospitals by quartile of postdischarge ED visit rates and 1 group for hospitals with no postdischarge ED visits.
Based on preliminary analyses indicating a relationship between hospital size, measured by condition-specific index hospitalization volume, and postdischarge treat-and-discharge ED visit rates, all descriptive statistics and correlations reported are weighted by the volume of condition-specific index hospitalizations. The study was approved by the Yale University Human Research Protection Program. All analyses were conducted using SAS 9.1 (SAS Institute Inc, Cary, NC). The analytic plan and results reported in this work are in compliance with the Strengthening the Reporting of Observational Studies in Epidemiology checklist.20
RESULTS
During the 1-year study period, we included a total of 157,035 patients who were hospitalized at 1656 hospitals for AMI, 391,209 at 3044 hospitals for heart failure, and 342,376 at 3484 hospitals for pneumonia. Details of study cohort creation are available in supplementary Table 1. After hospitalization for AMI, 14,714 patients experienced a postdischarge ED visit (8.4%) and 27,214 an inpatient readmissions (17.3%) within 30 days of discharge; 31,621 (7.6%) and 88,106 (22.5%) patients after hospitalization for heart failure and 26,681 (7.4%) and 59,352 (17.3%) patients after hospitalization for pneumonia experienced a postdischarge ED visit and an inpatient readmission within 30 days of discharge, respectively.
Postdischarge ED visits were for a wide variety of conditions, with the top 10 CCS categories comprising 44% of postdischarge ED visits following AMI hospitalizations, 44% of following heart failure hospitalizations, and 41% following pneumonia hospitalizations (supplementary Table 2). The first postdischarge ED visit was rarely for the same condition as the index hospitalization in the AMI cohort (224 visits; 1.5%) as well as the pneumonia cohort (1401 visits; 5.3%). Among patients who were originally admitted for heart failure, 10.6% of the first postdischarge ED visits were also for congestive heart failure. However, the first postdischarge ED visit was commonly for associated conditions, such as coronary artery disease in the case of AMI or chronic obstructive pulmonary disease in the case of pneumonia, albeit these related conditions did not comprise the majority of postdischarge ED visitation.
We found wide hospital-level variation in postdischarge ED visit rates for each condition: AMI (median: 8.3%; 5th and 95th percentile: 2.8%-14.3%), heart failure (median: 7.3%; 5th and 95th percentile: 3.0%-13.3%), and pneumonia (median: 7.1%; 5th and 95th percentile: 2.4%-13.2%; supplementary Table 3). The variation persisted after accounting for hospital case mix, as evidenced in the supplementary Figure, which describes hospital variation in risk-standardized postdischarge ED visit rates. This variation was statistically significant (P < .001), as demonstrated by the isolated relationship between the random effect and the outcome (AMI: random effect estimate 0.0849 [95% confidence interval (CI), 0.0832 to 0.0866]; heart failure: random effect estimate 0.0796 [95% CI, 0.0784 to 0.0809]; pneumonia: random effect estimate 0.0753 [95% CI, 0.0741 to 0.0764]).
Across all 3 conditions, hospitals located in rural areas had significantly higher risk-standardized postdischarge ED visit rates than hospitals located in urban areas (10.1% vs 8.6% for AMI, 8.4% vs 7.5% for heart failure, and 8.0% vs 7.4% for pneumonia). In comparison to teaching hospitals, nonteaching hospitals had significantly higher risk-standardized postdischarge ED visit rates following hospital discharge for pneumonia (7.6% vs 7.1%). Safety-net hospitals also had higher risk-standardized postdischarge ED visitation rates following discharge for heart failure (8.4% vs 7.7%) and pneumonia (7.7% vs 7.3%). Risk-standardized postdischarge ED visit rates were higher in publicly owned hospitals than in nonprofit or privately owned hospitals for heart failure (8.0% vs 7.5% in nonprofit hospitals or 7.5% in private hospitals) and pneumonia (7.7% vs 7.4% in nonprofit hospitals and 7.3% in private hospitals; Table).
Among hospitals with RSRRs that were publicly reported by CMS, we found a moderate inverse correlation between risk-standardized postdischarge ED visit rates and hospital RSRRs for each condition: AMI (r = −0.23; 95% CI, −0.29 to −0.19), heart failure (r = −0.29; 95% CI, −0.34 to −0.27), and pneumonia (r = −0.18; 95% CI, −0.22 to −0.15; Figure).
DISCUSSION
Across a national cohort of Medicare beneficiaries, we found frequent treat-and-discharge ED utilization following hospital discharge for AMI, heart failure, and pneumonia, suggesting that publicly reported readmission measures are capturing only a portion of postdischarge acute-care use. Our findings confirm prior work describing a 30-day postdischarge ED visit rate of 8% to 9% among Medicare beneficiaries for all hospitalizations in several states.3,6While many of the first postdischarge ED visits were for conditions related to the index hospitalization, the majority represent acute, unscheduled visits for different diagnoses. These findings are consistent with prior work studying inpatient readmissions and observation readmissions that find similar heterogeneity in the clinical reasons for hospital return.21,22
We also described substantial hospital-level variation in risk-standardized ED postdischarge rates. Prior work by Vashi et al.3 demonstrated substantial variation in observed postdischarge ED visit rates and inpatient readmissions following hospital discharge between clinical conditions in a population-level study. Our work extends upon this by demonstrating hospital-level variation for 3 conditions of high volume and substantial policy importance after accounting for differences in hospital case mix. Interestingly, our work also found similar rates of postdischarge ED treat-and-discharge visitation as recent work by Sabbatini et al.23 analyzing an all-payer, adult population with any clinical condition. Taken together, these studies show the substantial volume of postdischarge acute-care utilization in the ED not captured by existing readmission measures.
We found several hospital characteristics of importance in describing variation in postdischarge ED visitation rates. Notably, hospitals located in rural areas and safety-net hospitals demonstrated higher postdischarge ED visitation rates. This may reflect a higher use of the ED as an acute, unscheduled care access point in rural communities without access to alternative acute diagnostic and treatment services.24 Similarly, safety-net hospitals may be more likely to provide unscheduled care for patients with poor access to primary care in the ED setting. Yet, consistent with prior work, our results also indicate that these differences do not result in different readmission rates.25 Regarding hospital teaching status, unlike prior work suggesting that teaching hospitals care for more safety-net Medicare beneficiaries,26 our work found opposite patterns of postdischarge ED visitation between hospital teaching and safety-net status following pneumonia hospitalization. This may reflect differences in the organization of acute care as patients with limited access to unscheduled primary and specialty care in safety-net communities utilize the ED, whereas patients in teaching-hospital communities may be able to access hospital-based clinics for care.
Contrary to the expectations of many clinicians and policymakers, we found an inverse relationship between postdischarge ED visit rates and readmission rates. While the cross-sectional design of our study cannot provide a causal explanation, these findings merit policy attention and future exploration of several hypotheses. One possible explanation for this finding is that hospitals with high postdischarge ED visit rates provide care in communities in which acute, unscheduled care is consolidated to the ED setting and thereby permits the ED to serve a gatekeeper function for scarce inpatient resources. This hypothesis may also be supported by recent interventions demonstrating that the use of ED care coordination and geriatric ED services at higher-volume EDs can reduce hospitalizations. Also, hospitals with greater ED capacity may have easier ED access and may be able to see patients earlier in their disease courses post discharge or more frequently in the ED for follow-up, therefore increasing ED visits but avoiding rehospitalization. Another possible explanation is that hospitals with lower postdischarge ED visit rates may also have a lower propensity to admit patients. Because our definition of postdischarge ED visitation did not include ED visits that result in hospitalization, hospitals with a lower propensity to admit from the ED may therefore appear to have higher ED visit rates. This explanation may be further supported by our finding that many postdischarge ED visits are for conditions that are associated with discretionary hospitalization in the ED.27 A third explanation for this finding may be that poor access to outpatient care outside the hospital setting results in higher postdischarge ED visit rates without increasing the acuity of these revisits or increasing readmission rates28; however, given the validated, risk-standardized approach to readmission measurement, this is unlikely. This is also unlikely given recent work by Sabbatini et al.23 demonstrating substantial acuity among patients who return to the ED following hospital discharge. Future work should seek to evaluate the relationship between the availability of ED care-coordination services and the specific ED, hospital, and community care-coordination activities undertaken in the ED following hospital discharge to reduce readmission rates.
This work should be interpreted within the confines of its design. First, it is possible that some of the variation detected in postdischarge ED visit rates is mediated by hospital-level variation in postdischarge observation visits that are not captured in this outcome. However, in previous work, we have demonstrated that almost one-third of hospitals have no postdischarge observation stays and that most postdischarge observation stays are for more than 24 hours, which is unlikely to reflect the intensity of care of postdischarge ED visits.27 Second, our analyses were limited to Medicare FFS beneficiaries, which may limit the generalizability of this work to other patient populations. However, this dataset did include a national cohort of Medicare beneficiaries that is identical to those included in publicly reported CMS readmission measures; therefore, these results have substantial policy relevance. Third, this work was limited to 3 conditions of high illness severity of policy focus, and future work applying similar analyses to less severe conditions may find different degrees of hospital-level variation in postdischarge outcomes that are amenable to quality improvement. Finally, we assessed the rate of treat-and-discharge ED visits only after hospital discharge; this understates the frequency of ED visits since repeat ED visits and ED visits resulting in rehospitalization are not included. However, our definition was designed to mirror the definition used to assess hospital readmissions for policy purposes and is a conservative approach.
In summary, ED visits following hospital discharge are common, as Medicare beneficiaries have 1 treat-and-discharge ED visit for every 2 readmissions within 30 days of hospital discharge. Postdischarge ED visits occur for a wide variety of conditions, with wide risk-standardized, hospital-level variation. Hospitals with the highest risk-standardized postdischarge ED visitation rates demonstrated lower RSRRs, suggesting that policymakers and researchers should further examine the role of the hospital-based ED in providing access to acute care and supporting care transitions for the vulnerable Medicare population.
Disclosure
Dr. Venkatesh received contract support from the CMS, an agency of the U.S. Department of Health & Human Services, and grant support from the Emergency Medicine Foundation’s Health Policy Research Scholar Award during the conduct of the study; and Dr. Wang, Mr. Wang, Ms. Altaf, Dr. Bernheim, and Dr. Horwitz received contract support from the CMS, an agency of the U.S. Department of Health & Human Services, during the conduct of the study.
1. Dorsey KB GJ, Desai N, Lindenauer P, et al. 2015 Condition-Specific Measures Updates and Specifications Report Hospital-Level 30-Day Risk-Standardized Readmission Measures: AMI-Version 8.0, HF-Version 8.0, Pneumonia-Version 8.0, COPD-Version 4.0, and Stroke-Version 4.0. 2015. https://www.qualitynet.org/dcs/BlobServer?blobkey=id&blobnocache=true&blobwhere=1228890435217&blobheader=multipart%2Foctet-stream&blobheadername1=Content-Disposition&blobheadervalue1=attachment%3Bfilename%3DRdmn_AMIHFPNCOPDSTK_Msr_UpdtRpt.pdf&blobcol=urldata&blobtable=MungoBlobs. Accessed on July 8, 2015. 2. Rising KL, White LF, Fernandez WG, Boutwell AE. Emergency department visits after hospital discharge: a missing part of the equation. Ann Emerg Med. 2013;62(2):145-150. PubMed 3. Vashi AA, Fox JP, Carr BG, et al. Use of hospital-based acute care among patients recently discharged from the hospital. JAMA. 2013;309(4):364-371. PubMed 4. Kocher KE, Nallamothu BK, Birkmeyer JD, Dimick JB. Emergency department visits after surgery are common for Medicare patients, suggesting opportunities to improve care. Health Aff (Millwood). 2013;32(9):1600-1607. PubMed 5. Krumholz HM. Post-hospital syndrome–an acquired, transient condition of generalized risk. N Engl J Med. 2013;368(2):100-102. PubMed 6. Baier RR, Gardner RL, Coleman EA, Jencks SF, Mor V, Gravenstein S. Shifting the dialogue from hospital readmissions to unplanned care. Am J Manag Care. 2013;19(6):450-453. PubMed 7. Schuur JD, Venkatesh AK. The growing role of emergency departments in hospital admissions. N Engl J Med. 2012;367(5):391-393. PubMed 8. Kocher KE, Dimick JB, Nallamothu BK. Changes in the source of unscheduled hospitalizations in the United States. Med Care. 2013;51(8):689-698. PubMed 9. Morganti KG, Bauhoff S, Blanchard JC, Abir M, Iyer N. The evolving role of emergency departments in the United States. Santa Monica, CA: Rand Corporation; 2013. PubMed 10. Katz EB, Carrier ER, Umscheid CA, Pines JM. Comparative effectiveness of care coordination interventions in the emergency department: a systematic review. Ann Emerg Med. 2012;60(1):12.e1-23.e1. PubMed 11. Jaquis WP, Kaplan JA, Carpenter C, et al. Transitions of Care Task Force Report. 2012. http://www.acep.org/workarea/DownloadAsset.aspx?id=91206. Accessed on January 2, 2016. 12. Horwitz LI, Wang C, Altaf FK, et al. Excess Days in Acute Care after Hospitalization for Heart Failure (Version 1.0) Final Measure Methodology Report. 2015. https://www.cms.gov/Medicare/Quality-Initiatives-Patient-Assessment-Instruments/HospitalQualityInits/Measure-Methodology.html. Accessed on January 2, 2016. 13. Horwitz LI, Wang C, Altaf FK, et al. Excess Days in Acute Care after Hospitalization for Acute Myocardial Infarction (Version 1.0) Final Measure Methodology Report. 2015. https://www.cms.gov/Medicare/Quality-Initiatives-Patient-Assessment-Instruments/HospitalQualityInits/Measure-Methodology.html. Accessed on January 2, 2016. 14. Hennessy S, Leonard CE, Freeman CP, et al. Validation of diagnostic codes for outpatient-originating sudden cardiac death and ventricular arrhythmia in Medicaid and Medicare claims data. Pharmacoepidemiol Drug Saf. 2010;19(6):555-562. PubMed 15. Krumholz H, Normand S, Keenan P, et al. Hospital 30-Day Acute Myocardial Infarction Readmission Measure Methodology. 2008. http://www.qualitynet.org/dcs/BlobServer?blobkey=id&blobnocache=true&blobwhere=1228873653724&blobheader=multipart%2Foctet-stream&blobheadername1=Content-Disposition&blobheadervalue1=attachment%3Bfilename%3DAMI_ReadmMeasMethod.pdf&blobcol=urldata&blobtable=MungoBlobs. Accessed on February 22, 2016. 16. Krumholz H, Normand S, Keenan P, et al. Hospital 30-Day Heart Failure Readmission Measure Methodology. 2008. http://69.28.93.62/wp-content/uploads/2017/01/2007-Baseline-info-on-Readmissions-krumholz.pdf. Accessed on February 22, 2016. 17. Krumholz H, Normand S, Keenan P, et al. Hospital 30-Day Pneumonia Readmission Measure Methodology. 2008. http://www.qualitynet.org/dcs/BlobServer?blobkey=id&blobnocache=true&blobwhere=1228873654295&blobheader=multipart%2Foctet-stream&blobheadername1=Content-Disposition&blobheadervalue1=attachment%3Bfilename%3DPneumo_ReadmMeasMethod.pdf&blobcol=urldata&blobtable=MungoBlobs. Accessed on February 22, 2016. 18. QualityNet. Claims-based measures: readmission measures. 2016. http://www.qualitynet.org/dcs/ContentServer?cid=1219069855273&pagename=QnetPublic%2FPage%2FQnetTier3. Accessed on December 14, 2017. 19. Agency for Healthcare Research and Quality. Clinical classifications software (CCS) for ICD-9-CM. Healthcare Cost and Utilization Project 2013; https://www.hcup-us.ahrq.gov/toolssoftware/ccs/ccs.jsp. Accessed December 14, 2017. 20. Von Elm E, Altman DG, Egger M, et al. The Strengthening the Reporting of Observational Studies in Epidemiology (STROBE) statement: guidelines for reporting observational studies. Prev Med. 2007;45(4):247-251. PubMed 21. Dharmarajan K, Hsieh AF, Lin Z, et al. Diagnoses and timing of 30-day readmissions after hospitalization for heart failure, acute myocardial infarction, or pneumonia. JAMA. 2013;309(4):355-363. PubMed 22. Venkatesh AK, Wang C, Ross JS, et al. Hospital Use of Observation Stays: Cross-Sectional Study of the Impact on Readmission Rates. Med Care. 2016;54(12):1070-1077. PubMed 23. Sabbatini AK, Kocher KE, Basu A, Hsia RY. In-hospital outcomes and costs among patients hospitalized during a return visit to the emergency department. JAMA. 2016;315(7):663-671. PubMed 24. Pitts SR, Carrier ER, Rich EC, Kellermann AL. Where Americans get acute care: increasingly, it’s not at their doctor’s office. Health Aff (Millwood). 2010;29(9):1620-1629. PubMed 25. Ross JS, Bernheim SM, Lin Z, et al. Based on key measures, care quality for Medicare enrollees at safety-net and non-safety-net hospitals was almost equal. Health Aff (Millwood). 2012;31(8):1739-1748. PubMed 26. Joynt KE, Orav EJ, Jha AK. Thirty-day readmission rates for Medicare beneficiaries by race and site of care. JAMA. 2011;305(7):675-681. PubMed 27. Venkatesh A, Wang C, Suter LG, et al. Hospital Use of Observation Stays: Cross-Sectional Study of the Impact on Readmission Rates. In: Academy Health Annual Research Meeting. San Diego, CA; 2014. PubMed 28. Pittsenbarger ZE, Thurm CW, Neuman MI, et al. Hospital-level factors associated with pediatric emergency department return visits. J Hosp Med. 2017;12(7):536-543. PubMed
Hospital readmissions for acute myocardial infarction (AMI), heart failure, and pneumonia have become central to quality-measurement efforts by the Centers for Medicare & Medicaid Services (CMS), which seek to improve hospital care transitions through public reporting and payment programs.1 Most current measures are limited to readmissions that require inpatient hospitalization and do not capture return visits to the emergency department (ED) that do not result in readmission but rather ED discharge. These visits may reflect important needs for acute, unscheduled care during the vulnerable posthospitalization period.2-5 While previous research has suggested that nearly 10% of patients may return to the ED following hospital discharge without readmission, the characteristics of these visits among Medicare beneficiaries and the implications for national care-coordination quality-measurement initiatives have not been explored.6,7
As the locus of acute outpatient care and the primary portal of hospital admissions and readmissions, ED visits following hospital discharge may convey meaningful information about posthospitalization care transitions.8,9 In addition, recent reviews and perspectives have highlighted the role of ED care-coordination services as interventions to reduce inpatient hospitalizations and improve care transitions,10,11 yet no empirical studies have evaluated the relationship between these unique care-coordination opportunities in the ED and care-coordination outcomes, such as hospital readmissions. As policymakers seek to develop accountability measures that capture the totality of acute, unscheduled visits following hospital discharge, describing the relationship between ED visits and readmissions will be essential to providers for benchmarking and to policymakers and payers seeking to reduce the total cost of care.12,13
Accordingly, we sought to characterize the frequency, diagnoses, and hospital-level variation in treat-and-discharge ED visitation following hospital discharge for 3 conditions for which hospital readmission is publicly reported by the CMS: AMI, heart failure, and pneumonia. We also sought to evaluate the relationship between hospital-level ED visitation following hospital discharge and publicly reported, risk-standardized readmission rates (RSRRs).
METHODS
Study Design
This study was a cross-sectional analysis of Medicare beneficiaries discharged alive following hospitalization for AMI, heart failure, and pneumonia between July 2011 and June 2012.
Selection of Participants
We used Medicare Standard Analytic Files to identify inpatient hospitalizations for each disease cohort based on principal discharge diagnoses. Each condition-specific cohort was constructed to be consistent with the CMS’s readmission measures using International Classification of Diseases, 9th Revision-Clinical Modification codes to identify AMI, heart failure, and pneumonia discharges.1 We included only patients who were enrolled in fee-for-service (FFS) Medicare parts A and B for 12 months prior to their index hospitalization to maximize the capture of diagnoses for risk adjustment. Each cohort included only patients who were discharged alive while maintaining FFS coverage for at least 30 days following hospital discharge to minimize bias in outcome ascertainment. We excluded patients who were discharged against medical advice. All contiguous admissions that were identified in a transfer chain were considered to be a single admission. Hospitals with fewer than 25 condition-specific index hospital admissions were excluded from this analysis for consistency with publicly reported measures.1
Measurements
We measured postdischarge, treat-and release ED visits that occurred at any hospital within 30 days of hospital discharge from the index hospitalization. ED visits were identified as a hospital outpatient claim for ED services using hospital outpatient revenue center codes 0450, 0451, 0452, 0456, and 0981. This definition is consistent with those of previous studies.3,14 We defined postdischarge ED visits as treat-and-discharge visits or visits that did not result in inpatient readmission or observation stays. Similar to readmission measures, only 1 postdischarge ED visit was counted toward the hospital-level outcome in patients with multiple ED visits within the 30 days following hospital discharge. We defined readmission as the first unplanned, inpatient hospitalization occurring at any hospital within the 30-day period following discharge. Any subsequent inpatient admission following the 30-day period was considered a distinct index admission if it met the inclusion criteria. Consistent with CMS methods, unplanned, inpatient readmissions are from any source and are not limited to patients who were first evaluated in the ED.
Outcomes
We describe hospital-level, postdischarge ED visitation as the risk-standardized postdischarge ED visit rate. The general construct of this measure is consistent with those of prior studies that define postdischarge ED visitation as the proportion of index admissions followed by a treat-and-discharge ED visit without hospital readmission2,3; however, this outcome also incorporates a risk-standardization model with covariates that are identical to the risk-standardization approach that is used for readmission measurement.
We describe hospital-level readmission by calculating RSRRs consistent with CMS readmission measures, which are endorsed by the National Quality Forum and used for public reporting.15-17 Detailed technical documentation, including the SAS code used to replicate hospital-level measures of readmission, are available publicly through the CMS QualityNet portal.18
We calculated risk-standardized postdischarge ED visit rates and RSRRs as the ratio of the predicted number of postdischarge ED visits or readmissions for a hospital given its observed case mix to the expected number of postdischarge ED visits or readmissions based on the nation’s performance with that hospital’s case mix, respectively. This approach estimates a distinct risk-standardized postdischarge ED visit rate and RSRR for each hospital using hierarchical generalized linear models (HGLMs) and using a logit link with a first-level adjustment for age, sex, 29 clinical covariates for AMI, 35 clinical covariates for heart failure, and 38 clinical covariates for pneumonia. Each clinical covariate is identified based on inpatient and outpatient claims during the 12 months prior to the index hospitalization. The second level of the HGLM includes a random hospital-level intercept. This approach to measuring hospital readmissions accounts for the correlated nature of observed readmission rates within a hospital and reflects the assumption that after adjustment for patient characteristics and sampling variability, the remaining variation in postdischarge ED visit rates or readmission rates reflects hospital quality.
Analysis
In order to characterize treat-and-discharge postdischarge ED visits, we first described the clinical conditions that were evaluated during the first postdischarge ED visit. Based on the principal discharge diagnosis, ED visits were grouped into clinically meaningful categories using the Agency for Healthcare Research and Quality Clinical Classifications Software (CCS).19 We also report hospital-level variation in risk-standardized postdischarge ED visit rates for AMI, heart failure, and pneumonia.
Next, we examined the relationship between hospital characteristics and risk-standardized postdischarge ED visit rates. We linked hospital characteristics from the American Hospital Association (AHA) Annual Survey to the study dataset, including the following: safety-net status, teaching status, and urban or rural status. Consistent with prior work, hospital safety-net status was defined as a hospital Medicaid caseload greater than 1 standard deviation above the mean Medicaid caseload in the hospital’s state. Approximately 94% of the hospitals included in the 3 condition cohorts in the dataset had complete data in the 2011 AHA Annual Survey to be included in this analysis.
We evaluated the relationship between postdischarge ED visit rates and hospital readmission rates in 2 ways. First, we calculated Spearman rank correlation coefficients between hospital-level, risk-standardized postdischarge ED visit rates and RSRRs. Second, we calculated hospital-level variation in RSRRs based on the strata of risk-standardized postdischarge ED visit rates. Given the normal distribution of postdischarge ED visit rates, we grouped hospitals by quartile of postdischarge ED visit rates and 1 group for hospitals with no postdischarge ED visits.
Based on preliminary analyses indicating a relationship between hospital size, measured by condition-specific index hospitalization volume, and postdischarge treat-and-discharge ED visit rates, all descriptive statistics and correlations reported are weighted by the volume of condition-specific index hospitalizations. The study was approved by the Yale University Human Research Protection Program. All analyses were conducted using SAS 9.1 (SAS Institute Inc, Cary, NC). The analytic plan and results reported in this work are in compliance with the Strengthening the Reporting of Observational Studies in Epidemiology checklist.20
RESULTS
During the 1-year study period, we included a total of 157,035 patients who were hospitalized at 1656 hospitals for AMI, 391,209 at 3044 hospitals for heart failure, and 342,376 at 3484 hospitals for pneumonia. Details of study cohort creation are available in supplementary Table 1. After hospitalization for AMI, 14,714 patients experienced a postdischarge ED visit (8.4%) and 27,214 an inpatient readmissions (17.3%) within 30 days of discharge; 31,621 (7.6%) and 88,106 (22.5%) patients after hospitalization for heart failure and 26,681 (7.4%) and 59,352 (17.3%) patients after hospitalization for pneumonia experienced a postdischarge ED visit and an inpatient readmission within 30 days of discharge, respectively.
Postdischarge ED visits were for a wide variety of conditions, with the top 10 CCS categories comprising 44% of postdischarge ED visits following AMI hospitalizations, 44% of following heart failure hospitalizations, and 41% following pneumonia hospitalizations (supplementary Table 2). The first postdischarge ED visit was rarely for the same condition as the index hospitalization in the AMI cohort (224 visits; 1.5%) as well as the pneumonia cohort (1401 visits; 5.3%). Among patients who were originally admitted for heart failure, 10.6% of the first postdischarge ED visits were also for congestive heart failure. However, the first postdischarge ED visit was commonly for associated conditions, such as coronary artery disease in the case of AMI or chronic obstructive pulmonary disease in the case of pneumonia, albeit these related conditions did not comprise the majority of postdischarge ED visitation.
We found wide hospital-level variation in postdischarge ED visit rates for each condition: AMI (median: 8.3%; 5th and 95th percentile: 2.8%-14.3%), heart failure (median: 7.3%; 5th and 95th percentile: 3.0%-13.3%), and pneumonia (median: 7.1%; 5th and 95th percentile: 2.4%-13.2%; supplementary Table 3). The variation persisted after accounting for hospital case mix, as evidenced in the supplementary Figure, which describes hospital variation in risk-standardized postdischarge ED visit rates. This variation was statistically significant (P < .001), as demonstrated by the isolated relationship between the random effect and the outcome (AMI: random effect estimate 0.0849 [95% confidence interval (CI), 0.0832 to 0.0866]; heart failure: random effect estimate 0.0796 [95% CI, 0.0784 to 0.0809]; pneumonia: random effect estimate 0.0753 [95% CI, 0.0741 to 0.0764]).
Across all 3 conditions, hospitals located in rural areas had significantly higher risk-standardized postdischarge ED visit rates than hospitals located in urban areas (10.1% vs 8.6% for AMI, 8.4% vs 7.5% for heart failure, and 8.0% vs 7.4% for pneumonia). In comparison to teaching hospitals, nonteaching hospitals had significantly higher risk-standardized postdischarge ED visit rates following hospital discharge for pneumonia (7.6% vs 7.1%). Safety-net hospitals also had higher risk-standardized postdischarge ED visitation rates following discharge for heart failure (8.4% vs 7.7%) and pneumonia (7.7% vs 7.3%). Risk-standardized postdischarge ED visit rates were higher in publicly owned hospitals than in nonprofit or privately owned hospitals for heart failure (8.0% vs 7.5% in nonprofit hospitals or 7.5% in private hospitals) and pneumonia (7.7% vs 7.4% in nonprofit hospitals and 7.3% in private hospitals; Table).
Among hospitals with RSRRs that were publicly reported by CMS, we found a moderate inverse correlation between risk-standardized postdischarge ED visit rates and hospital RSRRs for each condition: AMI (r = −0.23; 95% CI, −0.29 to −0.19), heart failure (r = −0.29; 95% CI, −0.34 to −0.27), and pneumonia (r = −0.18; 95% CI, −0.22 to −0.15; Figure).
DISCUSSION
Across a national cohort of Medicare beneficiaries, we found frequent treat-and-discharge ED utilization following hospital discharge for AMI, heart failure, and pneumonia, suggesting that publicly reported readmission measures are capturing only a portion of postdischarge acute-care use. Our findings confirm prior work describing a 30-day postdischarge ED visit rate of 8% to 9% among Medicare beneficiaries for all hospitalizations in several states.3,6While many of the first postdischarge ED visits were for conditions related to the index hospitalization, the majority represent acute, unscheduled visits for different diagnoses. These findings are consistent with prior work studying inpatient readmissions and observation readmissions that find similar heterogeneity in the clinical reasons for hospital return.21,22
We also described substantial hospital-level variation in risk-standardized ED postdischarge rates. Prior work by Vashi et al.3 demonstrated substantial variation in observed postdischarge ED visit rates and inpatient readmissions following hospital discharge between clinical conditions in a population-level study. Our work extends upon this by demonstrating hospital-level variation for 3 conditions of high volume and substantial policy importance after accounting for differences in hospital case mix. Interestingly, our work also found similar rates of postdischarge ED treat-and-discharge visitation as recent work by Sabbatini et al.23 analyzing an all-payer, adult population with any clinical condition. Taken together, these studies show the substantial volume of postdischarge acute-care utilization in the ED not captured by existing readmission measures.
We found several hospital characteristics of importance in describing variation in postdischarge ED visitation rates. Notably, hospitals located in rural areas and safety-net hospitals demonstrated higher postdischarge ED visitation rates. This may reflect a higher use of the ED as an acute, unscheduled care access point in rural communities without access to alternative acute diagnostic and treatment services.24 Similarly, safety-net hospitals may be more likely to provide unscheduled care for patients with poor access to primary care in the ED setting. Yet, consistent with prior work, our results also indicate that these differences do not result in different readmission rates.25 Regarding hospital teaching status, unlike prior work suggesting that teaching hospitals care for more safety-net Medicare beneficiaries,26 our work found opposite patterns of postdischarge ED visitation between hospital teaching and safety-net status following pneumonia hospitalization. This may reflect differences in the organization of acute care as patients with limited access to unscheduled primary and specialty care in safety-net communities utilize the ED, whereas patients in teaching-hospital communities may be able to access hospital-based clinics for care.
Contrary to the expectations of many clinicians and policymakers, we found an inverse relationship between postdischarge ED visit rates and readmission rates. While the cross-sectional design of our study cannot provide a causal explanation, these findings merit policy attention and future exploration of several hypotheses. One possible explanation for this finding is that hospitals with high postdischarge ED visit rates provide care in communities in which acute, unscheduled care is consolidated to the ED setting and thereby permits the ED to serve a gatekeeper function for scarce inpatient resources. This hypothesis may also be supported by recent interventions demonstrating that the use of ED care coordination and geriatric ED services at higher-volume EDs can reduce hospitalizations. Also, hospitals with greater ED capacity may have easier ED access and may be able to see patients earlier in their disease courses post discharge or more frequently in the ED for follow-up, therefore increasing ED visits but avoiding rehospitalization. Another possible explanation is that hospitals with lower postdischarge ED visit rates may also have a lower propensity to admit patients. Because our definition of postdischarge ED visitation did not include ED visits that result in hospitalization, hospitals with a lower propensity to admit from the ED may therefore appear to have higher ED visit rates. This explanation may be further supported by our finding that many postdischarge ED visits are for conditions that are associated with discretionary hospitalization in the ED.27 A third explanation for this finding may be that poor access to outpatient care outside the hospital setting results in higher postdischarge ED visit rates without increasing the acuity of these revisits or increasing readmission rates28; however, given the validated, risk-standardized approach to readmission measurement, this is unlikely. This is also unlikely given recent work by Sabbatini et al.23 demonstrating substantial acuity among patients who return to the ED following hospital discharge. Future work should seek to evaluate the relationship between the availability of ED care-coordination services and the specific ED, hospital, and community care-coordination activities undertaken in the ED following hospital discharge to reduce readmission rates.
This work should be interpreted within the confines of its design. First, it is possible that some of the variation detected in postdischarge ED visit rates is mediated by hospital-level variation in postdischarge observation visits that are not captured in this outcome. However, in previous work, we have demonstrated that almost one-third of hospitals have no postdischarge observation stays and that most postdischarge observation stays are for more than 24 hours, which is unlikely to reflect the intensity of care of postdischarge ED visits.27 Second, our analyses were limited to Medicare FFS beneficiaries, which may limit the generalizability of this work to other patient populations. However, this dataset did include a national cohort of Medicare beneficiaries that is identical to those included in publicly reported CMS readmission measures; therefore, these results have substantial policy relevance. Third, this work was limited to 3 conditions of high illness severity of policy focus, and future work applying similar analyses to less severe conditions may find different degrees of hospital-level variation in postdischarge outcomes that are amenable to quality improvement. Finally, we assessed the rate of treat-and-discharge ED visits only after hospital discharge; this understates the frequency of ED visits since repeat ED visits and ED visits resulting in rehospitalization are not included. However, our definition was designed to mirror the definition used to assess hospital readmissions for policy purposes and is a conservative approach.
In summary, ED visits following hospital discharge are common, as Medicare beneficiaries have 1 treat-and-discharge ED visit for every 2 readmissions within 30 days of hospital discharge. Postdischarge ED visits occur for a wide variety of conditions, with wide risk-standardized, hospital-level variation. Hospitals with the highest risk-standardized postdischarge ED visitation rates demonstrated lower RSRRs, suggesting that policymakers and researchers should further examine the role of the hospital-based ED in providing access to acute care and supporting care transitions for the vulnerable Medicare population.
Disclosure
Dr. Venkatesh received contract support from the CMS, an agency of the U.S. Department of Health & Human Services, and grant support from the Emergency Medicine Foundation’s Health Policy Research Scholar Award during the conduct of the study; and Dr. Wang, Mr. Wang, Ms. Altaf, Dr. Bernheim, and Dr. Horwitz received contract support from the CMS, an agency of the U.S. Department of Health & Human Services, during the conduct of the study.
References
1. Dorsey KB GJ, Desai N, Lindenauer P, et al. 2015 Condition-Specific Measures Updates and Specifications Report Hospital-Level 30-Day Risk-Standardized Readmission Measures: AMI-Version 8.0, HF-Version 8.0, Pneumonia-Version 8.0, COPD-Version 4.0, and Stroke-Version 4.0. 2015. https://www.qualitynet.org/dcs/BlobServer?blobkey=id&blobnocache=true&blobwhere=1228890435217&blobheader=multipart%2Foctet-stream&blobheadername1=Content-Disposition&blobheadervalue1=attachment%3Bfilename%3DRdmn_AMIHFPNCOPDSTK_Msr_UpdtRpt.pdf&blobcol=urldata&blobtable=MungoBlobs. Accessed on July 8, 2015. 2. Rising KL, White LF, Fernandez WG, Boutwell AE. Emergency department visits after hospital discharge: a missing part of the equation. Ann Emerg Med. 2013;62(2):145-150. PubMed 3. Vashi AA, Fox JP, Carr BG, et al. Use of hospital-based acute care among patients recently discharged from the hospital. JAMA. 2013;309(4):364-371. PubMed 4. Kocher KE, Nallamothu BK, Birkmeyer JD, Dimick JB. Emergency department visits after surgery are common for Medicare patients, suggesting opportunities to improve care. Health Aff (Millwood). 2013;32(9):1600-1607. PubMed 5. Krumholz HM. Post-hospital syndrome–an acquired, transient condition of generalized risk. N Engl J Med. 2013;368(2):100-102. PubMed 6. Baier RR, Gardner RL, Coleman EA, Jencks SF, Mor V, Gravenstein S. Shifting the dialogue from hospital readmissions to unplanned care. Am J Manag Care. 2013;19(6):450-453. PubMed 7. Schuur JD, Venkatesh AK. The growing role of emergency departments in hospital admissions. N Engl J Med. 2012;367(5):391-393. PubMed 8. Kocher KE, Dimick JB, Nallamothu BK. Changes in the source of unscheduled hospitalizations in the United States. Med Care. 2013;51(8):689-698. PubMed 9. Morganti KG, Bauhoff S, Blanchard JC, Abir M, Iyer N. The evolving role of emergency departments in the United States. Santa Monica, CA: Rand Corporation; 2013. PubMed 10. Katz EB, Carrier ER, Umscheid CA, Pines JM. Comparative effectiveness of care coordination interventions in the emergency department: a systematic review. Ann Emerg Med. 2012;60(1):12.e1-23.e1. PubMed 11. Jaquis WP, Kaplan JA, Carpenter C, et al. Transitions of Care Task Force Report. 2012. http://www.acep.org/workarea/DownloadAsset.aspx?id=91206. Accessed on January 2, 2016. 12. Horwitz LI, Wang C, Altaf FK, et al. Excess Days in Acute Care after Hospitalization for Heart Failure (Version 1.0) Final Measure Methodology Report. 2015. https://www.cms.gov/Medicare/Quality-Initiatives-Patient-Assessment-Instruments/HospitalQualityInits/Measure-Methodology.html. Accessed on January 2, 2016. 13. Horwitz LI, Wang C, Altaf FK, et al. Excess Days in Acute Care after Hospitalization for Acute Myocardial Infarction (Version 1.0) Final Measure Methodology Report. 2015. https://www.cms.gov/Medicare/Quality-Initiatives-Patient-Assessment-Instruments/HospitalQualityInits/Measure-Methodology.html. Accessed on January 2, 2016. 14. Hennessy S, Leonard CE, Freeman CP, et al. Validation of diagnostic codes for outpatient-originating sudden cardiac death and ventricular arrhythmia in Medicaid and Medicare claims data. Pharmacoepidemiol Drug Saf. 2010;19(6):555-562. PubMed 15. Krumholz H, Normand S, Keenan P, et al. Hospital 30-Day Acute Myocardial Infarction Readmission Measure Methodology. 2008. http://www.qualitynet.org/dcs/BlobServer?blobkey=id&blobnocache=true&blobwhere=1228873653724&blobheader=multipart%2Foctet-stream&blobheadername1=Content-Disposition&blobheadervalue1=attachment%3Bfilename%3DAMI_ReadmMeasMethod.pdf&blobcol=urldata&blobtable=MungoBlobs. Accessed on February 22, 2016. 16. Krumholz H, Normand S, Keenan P, et al. Hospital 30-Day Heart Failure Readmission Measure Methodology. 2008. http://69.28.93.62/wp-content/uploads/2017/01/2007-Baseline-info-on-Readmissions-krumholz.pdf. Accessed on February 22, 2016. 17. Krumholz H, Normand S, Keenan P, et al. Hospital 30-Day Pneumonia Readmission Measure Methodology. 2008. http://www.qualitynet.org/dcs/BlobServer?blobkey=id&blobnocache=true&blobwhere=1228873654295&blobheader=multipart%2Foctet-stream&blobheadername1=Content-Disposition&blobheadervalue1=attachment%3Bfilename%3DPneumo_ReadmMeasMethod.pdf&blobcol=urldata&blobtable=MungoBlobs. Accessed on February 22, 2016. 18. QualityNet. Claims-based measures: readmission measures. 2016. http://www.qualitynet.org/dcs/ContentServer?cid=1219069855273&pagename=QnetPublic%2FPage%2FQnetTier3. Accessed on December 14, 2017. 19. Agency for Healthcare Research and Quality. Clinical classifications software (CCS) for ICD-9-CM. Healthcare Cost and Utilization Project 2013; https://www.hcup-us.ahrq.gov/toolssoftware/ccs/ccs.jsp. Accessed December 14, 2017. 20. Von Elm E, Altman DG, Egger M, et al. The Strengthening the Reporting of Observational Studies in Epidemiology (STROBE) statement: guidelines for reporting observational studies. Prev Med. 2007;45(4):247-251. PubMed 21. Dharmarajan K, Hsieh AF, Lin Z, et al. Diagnoses and timing of 30-day readmissions after hospitalization for heart failure, acute myocardial infarction, or pneumonia. JAMA. 2013;309(4):355-363. PubMed 22. Venkatesh AK, Wang C, Ross JS, et al. Hospital Use of Observation Stays: Cross-Sectional Study of the Impact on Readmission Rates. Med Care. 2016;54(12):1070-1077. PubMed 23. Sabbatini AK, Kocher KE, Basu A, Hsia RY. In-hospital outcomes and costs among patients hospitalized during a return visit to the emergency department. JAMA. 2016;315(7):663-671. PubMed 24. Pitts SR, Carrier ER, Rich EC, Kellermann AL. Where Americans get acute care: increasingly, it’s not at their doctor’s office. Health Aff (Millwood). 2010;29(9):1620-1629. PubMed 25. Ross JS, Bernheim SM, Lin Z, et al. Based on key measures, care quality for Medicare enrollees at safety-net and non-safety-net hospitals was almost equal. Health Aff (Millwood). 2012;31(8):1739-1748. PubMed 26. Joynt KE, Orav EJ, Jha AK. Thirty-day readmission rates for Medicare beneficiaries by race and site of care. JAMA. 2011;305(7):675-681. PubMed 27. Venkatesh A, Wang C, Suter LG, et al. Hospital Use of Observation Stays: Cross-Sectional Study of the Impact on Readmission Rates. In: Academy Health Annual Research Meeting. San Diego, CA; 2014. PubMed 28. Pittsenbarger ZE, Thurm CW, Neuman MI, et al. Hospital-level factors associated with pediatric emergency department return visits. J Hosp Med. 2017;12(7):536-543. PubMed
A central tenet of modern medicine is that patients must provide fully informed consent to receive or refuse medical care offered by their clinical teams.1–4 If a patient is unable to make and communicate a choice or clearly indicate an understanding of the information presented, then he or she is considered to lack the capacity to make medical decisions and the medical team must seek consent from the patient’s surrogate decision-maker.2-7 Every U.S. state recognizes a patient’s healthcare proxy (HCP) and a court-appointed guardian as a legally recognized surrogate.8,9 Most of the states also have statutes or regulations establishing a hierarchy of legally recognized surrogate decision-makers in the absence of a HCP or a court-appointed guardian, such as spouses, adult children, parents, siblings, and grandparents.8,10 In states that do not have such a statute, hospitals develop their own institutional policies for surrogate decision-making.
However, there are important limitations on the authority of these surrogate decision-makers.10 For instance, patients may not have a family member or a friend to serve as a surrogate decision-maker, often family members cannot override a patient’s objection, even when that patient lacks decision-making capacity, and certain decisions require a guardian or a HCP.8-10 In these circumstances, the hospital must petition a court to appoint a guardian as a legally recognized surrogate decision-maker. This can be an involved family member, if one exists, or an independent, typically volunteer, guardian.11 The process of guardian appointment is complex7,11 and can range from a few days to more than a month, largely dependent on court dates and finding a volunteer guardian. Much of the process occurs during the patient’s hospital stay. This prolongation of hospitalization would be expected to increase health care costs and iatrogenic complications,12–14 but data quantifying these for patients requiring guardianship are lacking. The goal of this study was to describe the characteristics of patients who undergo the process of guardianship and measure the associated burdens. These burdens include the financial costs to the medical system, the prolonged length of stay beyond medical necessity, and the costs to the patient in the form of hospital-acquired complications. Investigating the burden of guardianship is an important first step in uncovering opportunities to improve the process. We hypothesized that patients requiring guardianship would have lengths of stay and healthcare costs that were at least as large as those for patients whose conditions required similar durations of hospitalization prior to medical clearance, in part due to iatrogenic complications that would accrue while awaiting guardian appointment.
METHODS
Setting
We conducted a retrospective matched cohort study of adult inpatients at Beth Israel Deaconess Medical Center (BIDMC), a 651-bed academic, tertiary care facility in Boston, MA. The study was approved by the BIDMC Institutional Review Board as a nonhuman subject research consistent with hospital operations.
Population
For this matched cohort study, we identified case patients as those hospitalized for any reason for whom guardianship proceedings were initiated and obtained; only the first hospitalization during which the guardianship was pursued was used. Cases were identified by obtaining the data of all patients for whom the BIDMC general counsel completed the process of guardianship between October 2014 and September 2015. At BIDMC, all the guardianship proceedings are referred to the general counsel.
To determine the postclearance experience for referred patients compared with that for other patients with similar lengths of stay up to those of the referred patients’ point of clearance, we identified up to three matched controls for each case (Supplemental Figure 1). Medical clearance was defined as the date when the patient was medically stable to be discharged from the hospital, and it was determined in an iterative manner. We identified controls as hospitalized patients admitted for any cause and matched to the cases requiring guardianship on discharging service and length of stay prior to clearance. Specifically, we identified patients on the same service as the case whose length of stay was at least as long as the length of stay of the case patient until medical clearance, as defined below. We then determined the total and the excess length of stay, defined as the duration beyond clearance for each case referred for guardianship; for controls, the ‘excess’ length of stay was the number of hospitalized days beyond the corresponding time that a matched case had been provided clearance. To account for seasonal influences and the training level of house officers, we selected the three controls whose discharge date was closest (before or after) to the discharge date of their matched case.
From legal team files, we identified 61 patients hospitalized at BIDMC for whom new guardianship was pursued to completion. Of these 61 patients, 10 could not be matched to an appropriate control and were included in descriptive analyses but not in comparisons with controls.
Covariates and Outcomes
We collected the details regarding age, gender, primary language, highest level of education, marital status, insurance status, race, date of admission, date of discharge, discharge disposition, principal diagnosis, case mix index (CMI), and discharging service from our administrative and billing data. Outcomes of interest included length of stay and total hospital charges that were collected from the same databases. We used hospital charges, rather than payments, to ensure uniformity across payers.
Chart Review
Unique to cases, a team of two medical residents (JP, RP) and a hospitalist (DR) determined the date of medical clearance and hospital-associated complications by a chart review. The date of medical clearance was then used to calculate excess length of stay, ie, the duration of stay beyond the date of medical clearance, by subtracting the time to medical clearance from the total inpatient length of stay.
We developed a novel algorithm to determine the date of medical clearance consistently (Figure 1). We first determined whether the discharge summary indicated a clear date of medical readiness for discharge. If the discharge summary was unclear, then a case management or a social work note was used. The date of medical clearance determined by the case management or the social work note was then confirmed with clinical data. The date was confirmed if there were no significant laboratory orders and major medication changes or procedures for 24 h from the date identified. If notes were also inconclusive, then the medical clearance was determined by a review of provider order entry. Medical readiness for discharge was then defined as the first day when there were no laboratory orders for 48 h and no significant medication changes, imaging studies, or microbiologic orders.
Hospital-acquired complications were determined to be related to the guardianship process if they occurred after the date of medical stability but prior to discharge. We did not investigate hospital-acquired complications among controls. Hospital-acquired complications were defined as follows:
Catheter-associated urinary tract infection (CAUTI): active Foley catheter order and positive urine culture that resulted in antibiotic administration.
Hospital-acquired pneumonia (HAP): chest X-ray or computed tomography (CT) scan showing a consolidation that resulted in antibiotic administration.
Venous thromboembolism (VTE): positive venous ultrasound or CT angiography of the chest for deep venous thrombosis (DVT) or pulmonary embolism (PE).
Decubitus ulcer: new wound care consultation for sacral decubitus ulceration.
Clostridium difficile (C. diff) infection: positive stool polymerase chain reaction that resulted in antibiotic administration.
The algorithm for identifying the date of clearance and the presence of complications was piloted independently by three investigators (RP, JP, DR) using a single chart review and was redesigned until a consensus was obtained. The same three investigators then independently reviewed three additional charts, including all notes, laboratory results, imaging results, and orders, with complete agreement for both date of clearance and presence of complications. Two investigators (RP, JP) then individually reviewed the remaining 57 charts. Of these, 10 were selected a priori for review by both investigators for interrater reliability, with a mean difference of 0.5 days in the estimated time to clearance and complete concordance in complications. In addition, a third investigator (DR) independently reread 5 of the 57 reviewed charts, with complete concordance in both time to clearance and presence of complications with the original readings.
Statistical Analysis
SAS 9.3 was used for all analyses (SAS Institute Inc., Cary, NC, USA).
We first examined the demographic and clinical characteristics of all 61 patients who underwent guardianship proceedings. Second, we described the primary outcomes of interest–length of stay, costs, and likelihood of complications–in this series of patients with associated 95% confidence intervals.
Third, we examined the associations between guardianship and length of stay and healthcare costs using generalized estimating equations with clustering by matched set and compound symmetry. For length of stay, we specifically assessed excess length of stay (the matching variable) to avoid immortal time bias; we also examined the total length of stay. For all regression analyses, we adjusted for the following covariates: age, gender, education, marital status, race/ethnicity, CMI, insurance status, discharging service, and principal diagnosis. To maximize normality of residuals, costs were log-transformed; length of stay beyond clearance was log-transformed after addition of 1. For both outcomes, we back-transformed the regression coefficients and presented percent change between case and control patients. All reported tests are two-sided.
RESULTS
A total of 61 guardianship cases and 118 controls were included in the analysis.
General Characteristics
The characteristics of all cases prior to matching are included in Table 1. The department of internal medicine discharged the largest proportion of cases, followed by neurosurgery and neurology departments. More than 65% of cases were insured by Medicare or Medicaid. Three-quarters of cases were discharged from the hospital to another medical facility, with about half discharged to a skilled nursing facility (SNF) or a rehabilitation center and one-quarter to a long-term acute care hospital (LTACH).
The median length of stay for patients requiring guardianship was 28 (range, 23-36) days, and the median total charges were $171,083 ($106,897-$245,281), with a total cost approximating $10.9 million for these patients. Regarding hospital-acquired complications, 10 (16%; 95% confidence interval, 8%–28%) unique cases suffered from a complication, with HAP being the most frequently (n = 5) occurring complication.
Comparison with Matched Controls
No statistically significant differences were observed between cases and controls in terms of age, primary language, highest level of education, ethnicity, insurance status, or discharging service as shown in Table 2; discharging service was a matched variable and comparable by design. However, cases tended to be less likely to be married and had a higher CMI.
When compared with control patients in terms of similar services who stayed for at least as long as their duration to clearance, the cases had significantly longer lengths of stay compared to those of controls (29 total days compared to 18 days, P < .001; Figure 2). In addition, cases incurred significantly higher median total charges ($168,666) compared to those of controls ($104,190; P = .02).
After accounting for potential confounders, including age, gender, language, education, marital status, discharging service, ethnicity, insurance status, CMI, and principal diagnosis, guardianship was associated with 58% higher excess length of stay (P = .04, 95% CI [2%-145%]). Furthermore, guardianship was associated with 23% higher total charges (P = .02, 95% CI [4%-46%]) and 37% longer total length of stay (P = .002, 95% CI [12%-67%]).
DISCUSSION
In this cohort study of 61 inpatients from a single academic medical center who needed guardianship, patients who required this process had prolonged lengths of stay and substantial healthcare costs even when compared with matched controls who stayed at least as long as the cases’ date of clearance. One in six patients suffered from hospital-associated complications after their date of medical clearance.
To our knowledge, this is among the first studies to investigate healthcare costs and harm to the patient in the form of hospital-associated complications as a result of guardianship proceedings. Other studies15,16 have also demonstrated excessive length of stay attributed to nonclinical factors such as guardianship, though they did not quantify the excess stay or compare guardianship cases with a matched control. One study17 demonstrated total charges of $150,000 per patient requiring guardianship, which are similar to our results. However, Chen et al. also observed an average of 27.8 medically unnecessary days, which are 16 more days than those in our study sample. This may reflect the difference in how excess days were determined, namely, statistical process control analysis in the previous study compared with a manual chart review in our study. To our knowledge, no other study has compared guardianship cases with matched controls to compare their experiences to patients with similarly prolonged stays prior to clearance.
After matching by service and the length of stay until medical clearance in each guardianship case, the subsequent length of stay was higher among cases than among controls, even after adjustment for differences in CMI and diagnosis. This suggests that the process of obtaining guardianship results in a particularly prolonged length of stay, which is presumably attributable to factors other than medical complexity or ongoing illness.
It is probable that at least two interrelated mechanisms are responsible for the particularly high costs and the long stay of patients who require guardianship. First, the process of obtaining guardianship is itself protracted in several cases, necessitating long-term admissions well beyond the point of medical stability. Second, our results suggest that longer hospital stays are apt to grow further in a feed-forward cycle due to hospital-acquired complications that develop after the date of medical clearance. Indeed, in our series, 16% of patients sustained a complication that is readily attributable to hospital care after their date of clearance, and these types of complications are likely to lengthen the stay even further.
We compared cases referred for guardianship to control patients on the same services, at similar time points, whose length of stay was at least as long as the point of medical clearance as their corresponding case patient. Because cases were hospitalized with active medical needs to at least the point of clearance, we anticipated that costs might well be lower among cases, who had no medical necessity for hospitalization at the point of clearance, compared with controls who remained hospitalized presumably for active medical needs. Counter to this hypothesis, and accounting for potentially confounding variables, undergoing a guardianship proceeding was associated with nearly 25% higher costs of patient care. This may ultimately represent a substantial burden on the healthcare system. For example, in just 1 year in our hospital, the total hospital charges reached almost $11 million for the 61 patients who underwent guardianship proceedings. Considering that 65% of the patients requiring guardianship had Medicaid or Medicare coverage, there are significant financial implications for the hospital systems and to the public.
Limitations of our study relate to its retrospective nature at a single center. Investigating guardianship cases at a single center and with a small sample size of 61 patients limits generalizability. Nevertheless, we still had enough power to detect significant differences compared with matched controls, and this study remains the largest investigation into the cost associated with guardianship to date and the only study comparing guardianship cases with matched controls. Furthermore, we did not complete chart reviews of controls, which limits direct comparisons of complications and precluded our matching on variables that required detailed review.
The retrospective design may include confounders unaccounted for in our statistical design, though we attempted to match cases with controls to account for some of these potential differences and included a broad set of covariates that included measures of comorbidity and diagnosis. To this point, we included only CMI and principal diagnosis as the measures of severity, and adjustment for CMI, which includes features of the index hospitalization itself, may represent overadjustment. However, this type of overadjustment would tend to bias toward the null hypothesis.
Investigators only completed chart reviews for cases, which limits our ability to contrast the rate of hospital-associated complications for cases with that of controls. However, the rates of CAUTI and HAP complications among our cases were notably higher than national inpatient estimates, ie, 5% and 8% compared to 0.2%18 and 0.5%-1%,19 respectively. Furthermore, we demonstrated higher total costs and total lengths of stay among guardianship patients, analyses for which the attributed date of clearance for controls was not required, and the rate of complications among the case patients was sizable despite their being formally medically cleared. In other words, regardless of whether a complication rate of 16% is “typical” for inpatients hospitalized for these durations, this suggests that persistent hospitalization after clearance does not carry a benign prognosis.
In addition, to estimate healthcare costs, we relied on total hospital charges, which are readily available and reflect, at least in part, payer costs but do not reflect true costs to the medical center. Nonetheless, charges approximately reflect costs–with some variation across cost centers–and hence provide a useful metric for comparing cases and controls. To provide context, for academic medical centers such as ours, costs are typically about half of charges.
Finally, each state has different statutes for surrogate decision-making. The results of this study reflect the Massachusetts’ experience, with no public guardianship program or hierarchy statute. That being said, while this presumably causes the need for more guardianships in Massachusetts, the mechanisms for guardianship are broadly similar nationwide and are likely to result in excessive length of stay and cost similar to those in our population, as demonstrated in studies from other states.7,15–17
Implications
At a time where medical systems are searching for opportunities to reduce the length of stay, prevent unnecessary hospitalization, and improve the quality of care, reevaluating the guardianship process is ripe with opportunity. In this single academic center, the process of guardianship was associated with 58% excess length of stay and 23% higher total hospital charges. Furthermore, one in six patients requiring guardianship suffered from hospital-associated complications.
This matched cohort study adds quantitative data demonstrating substantial burdens to the healthcare system as a result of the guardianship process and can be used as an impetus for hospital administration and legal systems to expedite the process. Potential improvements include increasing HCP form completions (which would eliminate the need to pursue guardianship for most of such patients), identifying patients who lack a legally recognized surrogate decision-maker earlier in their hospital stay (ideally upon admission), and providing resources to assist clinical teams in the completion of affidavits necessary to support the appointment of a guardian, so that paperwork can be filed with courts sooner. Further research that provides more generalizable prospective data could potentially improve the guardianship process and reduce its burden on hospitals and patients even further.
Acknowledgments
The authors express their tremendous thanks to Gail Piatkowski for her invaluable assistance in collecting administrative and billing data.
Disclosures
The authors report no conflicts of interest. The authors alone are responsible for the content and writing of the article
1. O’Neill O. Autonomy and Trust in Bioethics. Cambridge: Cambridge University Press; 2002. PubMed 2. Beauchamp T, Childress J. Principles of Biomedical Ethics. 7th ed. New York: Oxford University Press; 2013. 3. McMurray RJ, Clarke OW, Barrasso JA, et al. Decisions near the end of life. J Am Med Assoc. 1992;267(16):2229-2233. 4. American Medical Association. AMA Principles of Medical Ethics: Chapter 2 - Opinions on Consent, Communication and Decision Making.; 2016. 5. Arnold RM, Kellum J. Moral justifications for surrogate decision making in the intensive care unit: Implications and limitations. Crit Care Med. 2003;31(Supplement):S347-S353. PubMed 6. Karp N, Wood E. Incapacitated and Alone: Healthcare Decision Making for Unbefriended Older People. Am Bar Assoc Hum Rights. 2003;31(2). 7. Bandy RJ, Helft PR, Bandy RW, Torke AM. Medical decision-making during the guardianship process for incapacitated, hospitalized adults: a descriptive cohort study. J Gen Intern Med. 2010;25(10):1003-1008. PubMed 8. Wynn S. Decisions by surrogates: an overview of surrogate consent laws in the United States. Bifocal. 2014;36(1):10-14. 9. Massachusetts General Laws. Chapter 201D: Health Care Proxies. https://malegislature.gov/Laws/GeneralLaws/PartII/TitleII/Chapter201D. Published 2017. Accessed March 31, 2017. 10. American Bar Association Commision on Law and Aging. Default Surrogate Consent Statutes. Am Bar Assoc. 2016:1-17. 11. Massachusetts General Laws. Chapter 190B: Massachusetts Probate Code. https://malegislature.gov/Laws/GeneralLaws/PartII/TitleII/Chapter190B. Published 2017. Accessed March 31, 2017. 12. Rosman M, Rachminov O, Segal O, Segal G. Prolonged patients’ in-hospital waiting period after discharge eligibility is associated with increased risk of infection, morbidity and mortality: a retrospective cohort analysis. BMC Health Serv Res. 2015;15:246. PubMed 13. Majeed MU, Williams DT, Pollock R, et al. Delay in discharge and its impact on unnecessary hospital bed occupancy. 2012. PubMed 14. Nobili A, Licata G, Salerno F, et al. Polypharmacy, length of hospital stay, and in-hospital mortality among elderly patients in internal medicine wards. The REPOSI study. Eur J Clin Pharmacol. 2011;67(5):507-519. PubMed 15. Chen JJ, Finn CT, Homa K, St Onge KP, Caller TA. Discharge delays for patients requiring in-hospital guardianship: A Cohort Analysis. J Healthc Qual. 2016;38(4):235-242. PubMed 16. Chen JJ, Kwon A, Stevens Y, Finn CT. Barriers beyond clinical control affecting timely hospital discharge for a patient requiring guardianship. Psychosomatics. 2015;56(2):206-209. PubMed 17. Chen JJ, Blanchard MA, Finn CT, et al. A clinical pathway for guardianship at dartmouth-hitchcock medical center. Jt Comm J Qual Patient Saf. 2014;40(9):389-397. PubMed 18. McEachern R, Campbell Jr GD. Hospital-Acquired Pneumonia: Epidemiology, Etiology, and Treatment. Infect Dis Clin North Am. 1998;12(3):761-779. PubMed 19. Zimlichman E, Henderson D, Tamir O, et al. Health care–associated infections. JAMA Intern Med. 2013;173(22):2039. PubMed
A central tenet of modern medicine is that patients must provide fully informed consent to receive or refuse medical care offered by their clinical teams.1–4 If a patient is unable to make and communicate a choice or clearly indicate an understanding of the information presented, then he or she is considered to lack the capacity to make medical decisions and the medical team must seek consent from the patient’s surrogate decision-maker.2-7 Every U.S. state recognizes a patient’s healthcare proxy (HCP) and a court-appointed guardian as a legally recognized surrogate.8,9 Most of the states also have statutes or regulations establishing a hierarchy of legally recognized surrogate decision-makers in the absence of a HCP or a court-appointed guardian, such as spouses, adult children, parents, siblings, and grandparents.8,10 In states that do not have such a statute, hospitals develop their own institutional policies for surrogate decision-making.
However, there are important limitations on the authority of these surrogate decision-makers.10 For instance, patients may not have a family member or a friend to serve as a surrogate decision-maker, often family members cannot override a patient’s objection, even when that patient lacks decision-making capacity, and certain decisions require a guardian or a HCP.8-10 In these circumstances, the hospital must petition a court to appoint a guardian as a legally recognized surrogate decision-maker. This can be an involved family member, if one exists, or an independent, typically volunteer, guardian.11 The process of guardian appointment is complex7,11 and can range from a few days to more than a month, largely dependent on court dates and finding a volunteer guardian. Much of the process occurs during the patient’s hospital stay. This prolongation of hospitalization would be expected to increase health care costs and iatrogenic complications,12–14 but data quantifying these for patients requiring guardianship are lacking. The goal of this study was to describe the characteristics of patients who undergo the process of guardianship and measure the associated burdens. These burdens include the financial costs to the medical system, the prolonged length of stay beyond medical necessity, and the costs to the patient in the form of hospital-acquired complications. Investigating the burden of guardianship is an important first step in uncovering opportunities to improve the process. We hypothesized that patients requiring guardianship would have lengths of stay and healthcare costs that were at least as large as those for patients whose conditions required similar durations of hospitalization prior to medical clearance, in part due to iatrogenic complications that would accrue while awaiting guardian appointment.
METHODS
Setting
We conducted a retrospective matched cohort study of adult inpatients at Beth Israel Deaconess Medical Center (BIDMC), a 651-bed academic, tertiary care facility in Boston, MA. The study was approved by the BIDMC Institutional Review Board as a nonhuman subject research consistent with hospital operations.
Population
For this matched cohort study, we identified case patients as those hospitalized for any reason for whom guardianship proceedings were initiated and obtained; only the first hospitalization during which the guardianship was pursued was used. Cases were identified by obtaining the data of all patients for whom the BIDMC general counsel completed the process of guardianship between October 2014 and September 2015. At BIDMC, all the guardianship proceedings are referred to the general counsel.
To determine the postclearance experience for referred patients compared with that for other patients with similar lengths of stay up to those of the referred patients’ point of clearance, we identified up to three matched controls for each case (Supplemental Figure 1). Medical clearance was defined as the date when the patient was medically stable to be discharged from the hospital, and it was determined in an iterative manner. We identified controls as hospitalized patients admitted for any cause and matched to the cases requiring guardianship on discharging service and length of stay prior to clearance. Specifically, we identified patients on the same service as the case whose length of stay was at least as long as the length of stay of the case patient until medical clearance, as defined below. We then determined the total and the excess length of stay, defined as the duration beyond clearance for each case referred for guardianship; for controls, the ‘excess’ length of stay was the number of hospitalized days beyond the corresponding time that a matched case had been provided clearance. To account for seasonal influences and the training level of house officers, we selected the three controls whose discharge date was closest (before or after) to the discharge date of their matched case.
From legal team files, we identified 61 patients hospitalized at BIDMC for whom new guardianship was pursued to completion. Of these 61 patients, 10 could not be matched to an appropriate control and were included in descriptive analyses but not in comparisons with controls.
Covariates and Outcomes
We collected the details regarding age, gender, primary language, highest level of education, marital status, insurance status, race, date of admission, date of discharge, discharge disposition, principal diagnosis, case mix index (CMI), and discharging service from our administrative and billing data. Outcomes of interest included length of stay and total hospital charges that were collected from the same databases. We used hospital charges, rather than payments, to ensure uniformity across payers.
Chart Review
Unique to cases, a team of two medical residents (JP, RP) and a hospitalist (DR) determined the date of medical clearance and hospital-associated complications by a chart review. The date of medical clearance was then used to calculate excess length of stay, ie, the duration of stay beyond the date of medical clearance, by subtracting the time to medical clearance from the total inpatient length of stay.
We developed a novel algorithm to determine the date of medical clearance consistently (Figure 1). We first determined whether the discharge summary indicated a clear date of medical readiness for discharge. If the discharge summary was unclear, then a case management or a social work note was used. The date of medical clearance determined by the case management or the social work note was then confirmed with clinical data. The date was confirmed if there were no significant laboratory orders and major medication changes or procedures for 24 h from the date identified. If notes were also inconclusive, then the medical clearance was determined by a review of provider order entry. Medical readiness for discharge was then defined as the first day when there were no laboratory orders for 48 h and no significant medication changes, imaging studies, or microbiologic orders.
Hospital-acquired complications were determined to be related to the guardianship process if they occurred after the date of medical stability but prior to discharge. We did not investigate hospital-acquired complications among controls. Hospital-acquired complications were defined as follows:
Catheter-associated urinary tract infection (CAUTI): active Foley catheter order and positive urine culture that resulted in antibiotic administration.
Hospital-acquired pneumonia (HAP): chest X-ray or computed tomography (CT) scan showing a consolidation that resulted in antibiotic administration.
Venous thromboembolism (VTE): positive venous ultrasound or CT angiography of the chest for deep venous thrombosis (DVT) or pulmonary embolism (PE).
Decubitus ulcer: new wound care consultation for sacral decubitus ulceration.
Clostridium difficile (C. diff) infection: positive stool polymerase chain reaction that resulted in antibiotic administration.
The algorithm for identifying the date of clearance and the presence of complications was piloted independently by three investigators (RP, JP, DR) using a single chart review and was redesigned until a consensus was obtained. The same three investigators then independently reviewed three additional charts, including all notes, laboratory results, imaging results, and orders, with complete agreement for both date of clearance and presence of complications. Two investigators (RP, JP) then individually reviewed the remaining 57 charts. Of these, 10 were selected a priori for review by both investigators for interrater reliability, with a mean difference of 0.5 days in the estimated time to clearance and complete concordance in complications. In addition, a third investigator (DR) independently reread 5 of the 57 reviewed charts, with complete concordance in both time to clearance and presence of complications with the original readings.
Statistical Analysis
SAS 9.3 was used for all analyses (SAS Institute Inc., Cary, NC, USA).
We first examined the demographic and clinical characteristics of all 61 patients who underwent guardianship proceedings. Second, we described the primary outcomes of interest–length of stay, costs, and likelihood of complications–in this series of patients with associated 95% confidence intervals.
Third, we examined the associations between guardianship and length of stay and healthcare costs using generalized estimating equations with clustering by matched set and compound symmetry. For length of stay, we specifically assessed excess length of stay (the matching variable) to avoid immortal time bias; we also examined the total length of stay. For all regression analyses, we adjusted for the following covariates: age, gender, education, marital status, race/ethnicity, CMI, insurance status, discharging service, and principal diagnosis. To maximize normality of residuals, costs were log-transformed; length of stay beyond clearance was log-transformed after addition of 1. For both outcomes, we back-transformed the regression coefficients and presented percent change between case and control patients. All reported tests are two-sided.
RESULTS
A total of 61 guardianship cases and 118 controls were included in the analysis.
General Characteristics
The characteristics of all cases prior to matching are included in Table 1. The department of internal medicine discharged the largest proportion of cases, followed by neurosurgery and neurology departments. More than 65% of cases were insured by Medicare or Medicaid. Three-quarters of cases were discharged from the hospital to another medical facility, with about half discharged to a skilled nursing facility (SNF) or a rehabilitation center and one-quarter to a long-term acute care hospital (LTACH).
The median length of stay for patients requiring guardianship was 28 (range, 23-36) days, and the median total charges were $171,083 ($106,897-$245,281), with a total cost approximating $10.9 million for these patients. Regarding hospital-acquired complications, 10 (16%; 95% confidence interval, 8%–28%) unique cases suffered from a complication, with HAP being the most frequently (n = 5) occurring complication.
Comparison with Matched Controls
No statistically significant differences were observed between cases and controls in terms of age, primary language, highest level of education, ethnicity, insurance status, or discharging service as shown in Table 2; discharging service was a matched variable and comparable by design. However, cases tended to be less likely to be married and had a higher CMI.
When compared with control patients in terms of similar services who stayed for at least as long as their duration to clearance, the cases had significantly longer lengths of stay compared to those of controls (29 total days compared to 18 days, P < .001; Figure 2). In addition, cases incurred significantly higher median total charges ($168,666) compared to those of controls ($104,190; P = .02).
After accounting for potential confounders, including age, gender, language, education, marital status, discharging service, ethnicity, insurance status, CMI, and principal diagnosis, guardianship was associated with 58% higher excess length of stay (P = .04, 95% CI [2%-145%]). Furthermore, guardianship was associated with 23% higher total charges (P = .02, 95% CI [4%-46%]) and 37% longer total length of stay (P = .002, 95% CI [12%-67%]).
DISCUSSION
In this cohort study of 61 inpatients from a single academic medical center who needed guardianship, patients who required this process had prolonged lengths of stay and substantial healthcare costs even when compared with matched controls who stayed at least as long as the cases’ date of clearance. One in six patients suffered from hospital-associated complications after their date of medical clearance.
To our knowledge, this is among the first studies to investigate healthcare costs and harm to the patient in the form of hospital-associated complications as a result of guardianship proceedings. Other studies15,16 have also demonstrated excessive length of stay attributed to nonclinical factors such as guardianship, though they did not quantify the excess stay or compare guardianship cases with a matched control. One study17 demonstrated total charges of $150,000 per patient requiring guardianship, which are similar to our results. However, Chen et al. also observed an average of 27.8 medically unnecessary days, which are 16 more days than those in our study sample. This may reflect the difference in how excess days were determined, namely, statistical process control analysis in the previous study compared with a manual chart review in our study. To our knowledge, no other study has compared guardianship cases with matched controls to compare their experiences to patients with similarly prolonged stays prior to clearance.
After matching by service and the length of stay until medical clearance in each guardianship case, the subsequent length of stay was higher among cases than among controls, even after adjustment for differences in CMI and diagnosis. This suggests that the process of obtaining guardianship results in a particularly prolonged length of stay, which is presumably attributable to factors other than medical complexity or ongoing illness.
It is probable that at least two interrelated mechanisms are responsible for the particularly high costs and the long stay of patients who require guardianship. First, the process of obtaining guardianship is itself protracted in several cases, necessitating long-term admissions well beyond the point of medical stability. Second, our results suggest that longer hospital stays are apt to grow further in a feed-forward cycle due to hospital-acquired complications that develop after the date of medical clearance. Indeed, in our series, 16% of patients sustained a complication that is readily attributable to hospital care after their date of clearance, and these types of complications are likely to lengthen the stay even further.
We compared cases referred for guardianship to control patients on the same services, at similar time points, whose length of stay was at least as long as the point of medical clearance as their corresponding case patient. Because cases were hospitalized with active medical needs to at least the point of clearance, we anticipated that costs might well be lower among cases, who had no medical necessity for hospitalization at the point of clearance, compared with controls who remained hospitalized presumably for active medical needs. Counter to this hypothesis, and accounting for potentially confounding variables, undergoing a guardianship proceeding was associated with nearly 25% higher costs of patient care. This may ultimately represent a substantial burden on the healthcare system. For example, in just 1 year in our hospital, the total hospital charges reached almost $11 million for the 61 patients who underwent guardianship proceedings. Considering that 65% of the patients requiring guardianship had Medicaid or Medicare coverage, there are significant financial implications for the hospital systems and to the public.
Limitations of our study relate to its retrospective nature at a single center. Investigating guardianship cases at a single center and with a small sample size of 61 patients limits generalizability. Nevertheless, we still had enough power to detect significant differences compared with matched controls, and this study remains the largest investigation into the cost associated with guardianship to date and the only study comparing guardianship cases with matched controls. Furthermore, we did not complete chart reviews of controls, which limits direct comparisons of complications and precluded our matching on variables that required detailed review.
The retrospective design may include confounders unaccounted for in our statistical design, though we attempted to match cases with controls to account for some of these potential differences and included a broad set of covariates that included measures of comorbidity and diagnosis. To this point, we included only CMI and principal diagnosis as the measures of severity, and adjustment for CMI, which includes features of the index hospitalization itself, may represent overadjustment. However, this type of overadjustment would tend to bias toward the null hypothesis.
Investigators only completed chart reviews for cases, which limits our ability to contrast the rate of hospital-associated complications for cases with that of controls. However, the rates of CAUTI and HAP complications among our cases were notably higher than national inpatient estimates, ie, 5% and 8% compared to 0.2%18 and 0.5%-1%,19 respectively. Furthermore, we demonstrated higher total costs and total lengths of stay among guardianship patients, analyses for which the attributed date of clearance for controls was not required, and the rate of complications among the case patients was sizable despite their being formally medically cleared. In other words, regardless of whether a complication rate of 16% is “typical” for inpatients hospitalized for these durations, this suggests that persistent hospitalization after clearance does not carry a benign prognosis.
In addition, to estimate healthcare costs, we relied on total hospital charges, which are readily available and reflect, at least in part, payer costs but do not reflect true costs to the medical center. Nonetheless, charges approximately reflect costs–with some variation across cost centers–and hence provide a useful metric for comparing cases and controls. To provide context, for academic medical centers such as ours, costs are typically about half of charges.
Finally, each state has different statutes for surrogate decision-making. The results of this study reflect the Massachusetts’ experience, with no public guardianship program or hierarchy statute. That being said, while this presumably causes the need for more guardianships in Massachusetts, the mechanisms for guardianship are broadly similar nationwide and are likely to result in excessive length of stay and cost similar to those in our population, as demonstrated in studies from other states.7,15–17
Implications
At a time where medical systems are searching for opportunities to reduce the length of stay, prevent unnecessary hospitalization, and improve the quality of care, reevaluating the guardianship process is ripe with opportunity. In this single academic center, the process of guardianship was associated with 58% excess length of stay and 23% higher total hospital charges. Furthermore, one in six patients requiring guardianship suffered from hospital-associated complications.
This matched cohort study adds quantitative data demonstrating substantial burdens to the healthcare system as a result of the guardianship process and can be used as an impetus for hospital administration and legal systems to expedite the process. Potential improvements include increasing HCP form completions (which would eliminate the need to pursue guardianship for most of such patients), identifying patients who lack a legally recognized surrogate decision-maker earlier in their hospital stay (ideally upon admission), and providing resources to assist clinical teams in the completion of affidavits necessary to support the appointment of a guardian, so that paperwork can be filed with courts sooner. Further research that provides more generalizable prospective data could potentially improve the guardianship process and reduce its burden on hospitals and patients even further.
Acknowledgments
The authors express their tremendous thanks to Gail Piatkowski for her invaluable assistance in collecting administrative and billing data.
Disclosures
The authors report no conflicts of interest. The authors alone are responsible for the content and writing of the article
References
1. O’Neill O. Autonomy and Trust in Bioethics. Cambridge: Cambridge University Press; 2002. PubMed 2. Beauchamp T, Childress J. Principles of Biomedical Ethics. 7th ed. New York: Oxford University Press; 2013. 3. McMurray RJ, Clarke OW, Barrasso JA, et al. Decisions near the end of life. J Am Med Assoc. 1992;267(16):2229-2233. 4. American Medical Association. AMA Principles of Medical Ethics: Chapter 2 - Opinions on Consent, Communication and Decision Making.; 2016. 5. Arnold RM, Kellum J. Moral justifications for surrogate decision making in the intensive care unit: Implications and limitations. Crit Care Med. 2003;31(Supplement):S347-S353. PubMed 6. Karp N, Wood E. Incapacitated and Alone: Healthcare Decision Making for Unbefriended Older People. Am Bar Assoc Hum Rights. 2003;31(2). 7. Bandy RJ, Helft PR, Bandy RW, Torke AM. Medical decision-making during the guardianship process for incapacitated, hospitalized adults: a descriptive cohort study. J Gen Intern Med. 2010;25(10):1003-1008. PubMed 8. Wynn S. Decisions by surrogates: an overview of surrogate consent laws in the United States. Bifocal. 2014;36(1):10-14. 9. Massachusetts General Laws. Chapter 201D: Health Care Proxies. https://malegislature.gov/Laws/GeneralLaws/PartII/TitleII/Chapter201D. Published 2017. Accessed March 31, 2017. 10. American Bar Association Commision on Law and Aging. Default Surrogate Consent Statutes. Am Bar Assoc. 2016:1-17. 11. Massachusetts General Laws. Chapter 190B: Massachusetts Probate Code. https://malegislature.gov/Laws/GeneralLaws/PartII/TitleII/Chapter190B. Published 2017. Accessed March 31, 2017. 12. Rosman M, Rachminov O, Segal O, Segal G. Prolonged patients’ in-hospital waiting period after discharge eligibility is associated with increased risk of infection, morbidity and mortality: a retrospective cohort analysis. BMC Health Serv Res. 2015;15:246. PubMed 13. Majeed MU, Williams DT, Pollock R, et al. Delay in discharge and its impact on unnecessary hospital bed occupancy. 2012. PubMed 14. Nobili A, Licata G, Salerno F, et al. Polypharmacy, length of hospital stay, and in-hospital mortality among elderly patients in internal medicine wards. The REPOSI study. Eur J Clin Pharmacol. 2011;67(5):507-519. PubMed 15. Chen JJ, Finn CT, Homa K, St Onge KP, Caller TA. Discharge delays for patients requiring in-hospital guardianship: A Cohort Analysis. J Healthc Qual. 2016;38(4):235-242. PubMed 16. Chen JJ, Kwon A, Stevens Y, Finn CT. Barriers beyond clinical control affecting timely hospital discharge for a patient requiring guardianship. Psychosomatics. 2015;56(2):206-209. PubMed 17. Chen JJ, Blanchard MA, Finn CT, et al. A clinical pathway for guardianship at dartmouth-hitchcock medical center. Jt Comm J Qual Patient Saf. 2014;40(9):389-397. PubMed 18. McEachern R, Campbell Jr GD. Hospital-Acquired Pneumonia: Epidemiology, Etiology, and Treatment. Infect Dis Clin North Am. 1998;12(3):761-779. PubMed 19. Zimlichman E, Henderson D, Tamir O, et al. Health care–associated infections. JAMA Intern Med. 2013;173(22):2039. PubMed
Daniel N. Ricotta, MD, Carl J. Shapiro Institute for Education and Research, 330 Brookline Ave, ES-2, Boston, MA 02215; Telephone: 617-667-9120; Fax: 617-667-9122; E-mail:[email protected]
Content Gating
Gated (full article locked unless allowed per User)
Alternative CME
Disqus Comments
Default
Gate On Date
Tue, 03/13/2018 - 06:00
Un-Gate On Date
Tue, 02/27/2018 - 06:00
Consolidated Pubs: Do Not Show Source Publication Logo
Hospitals are increasingly assessed comparatively in terms of costs and quality for benchmarking purposes. These comparisons can be used by patients and families to determine where to seek care, to report compliance and grant certifications by oversight organizations (eg, Leapfrog, Magnet, Joint Commission), and by payers, to determine reimbursement models and/or to assess financial penalty or bonuses for underperforming or overperforming hospitals. As these efforts can cause substantial reputational and financial consequences for hospitals, these metrics must be contextualized within the population of patients that each hospital serves.
In adult Medicare patient populations, methods have been developed to assess the relative severity of a hospital’s full complement of patients.1,2 These methods assume a relationship between severity and hospital resource intensity (ie, cost) and typically assume the form of relative weights (RWs), which are developed for clinically similar groups of patients (eg, Medicare Diagnosis Related Groups; MS-DRG) from a reference population. A RW for each MS-DRG is calculated as the average cost of patients within the group divided by the average cost for all patients in the reference population. These weights are then applied to a hospital’s discharges over a specific time period and averaged to obtain a hospital-level case-mix index (CMI). A value of 1 indicates that a hospital serves a mix of patients with similar severity (or resource intensity) to that of an “average” hospital discharge in the reference population, whereas a value of 1.2 indicates that a hospital serves a population of patients with 20% more severity than that of an “average” hospital discharge. Since 1983, the Centers for Medicare and Medicaid Services (CMS) has used RWs in their inpatient prospective payment system.3
Similar pediatric methods are less developed and necessitate special consideration as the use of existing weights may be inappropriate for a pediatric population. First, MS-DRGs were developed primarily for the Medicare population and lack sufficient granularity for pediatric populations, specifically newborns. Second, a severity stratification which incorporates important patient characteristics, such as age in pediatrics, does not exist in the MS-DRG system . Finally, although the reference populations that are used to develop MS-DRG weights do not explicitly exclude children, children typically account for approximately 15% of hospitalizations (6% excluding neonatal/maternal) and possibly feature different utilization patterns than adults with similar conditions. Thus, weights developed from a combined pediatric/adult reference population primarily reflect an adult population.
With valid pediatric RWs, stakeholders can assess a hospital’s severity mix of patients in a comparable fashion and contextualize outcome metrics. Additionally, these same weights can be used to estimate expected costs for hospitalizations or for risk adjusting various outcomes at the discharge- or hospital-level. Thus, we sought to develop hospitalization resource intensity scores for kids (H-RISK) using pediatric-specific weights and compare hospital-level CMIs across various hospital types and locations as an example of the application of this novel methodology.
METHODS
Dataset
Data for this analysis were obtained from the 2012 Healthcare Cost and Utilization Project (HCUP) Kids’ Inpatient Database (KID).4 KID is the largest publicly available all-payer inpatient administrative database in the United States and is sponsored by the Agency for Healthcare Research and Quality as part of the HCUP. The 2012 KID included a sample of approximately 3.2 million discharge records of children <21 years old from 44 states and 4,179 community, nonrehabilitation hospitals weighted for national estimates.
Hospital discharge costs were estimated from charges using cost-to-charge ratios (CCR) provided by HCUP as a supplement to the 2012 KID.5 Cost estimates associated with a specific discharge were estimated by multiplying the total charges reported in the data by the appropriate hospital-specific CCR and then adjusted for price factors beyond a hospital’s control using the area wage index also provided by HCUP as a supplement.
H-RISK and Case-Mix Index Calculations
We calculated H-RISK as pediatric-specific RWs based on version 30 of 3M’s All Patient Refined DRG (APR-DRG; 3M Health Information Systems, Salt Lake City, Utah) system as a measure of resource intensity. The APR-DRG system classifies hospital discharges into over 300 base DRGs based on demographic, diagnostic, and therapeutic characteristics. Each APR-DRG is further sub-divided into 4 subclasses of severity of illness (SOI; eg, minor, moderate, major, and extreme) to indicate the intensity of resource utilization during hospitalization. However, SOI levels for differing APR-DRGs are not comparable.
For every APR-DRG SOI combinations available in the 2012 KID, calculation of RW was based on the ratio of the mean cost for patients assigned to a particular APR-DRG SOI compared with the mean cost for all patients in the database. Inpatient costs less than $0.50 were set to missing and removed from analysis. Mortalities and discharges with missing CCR and wage index values were also excluded from analysis. We required that estimates for RWs be based on a reasonable set of data (ie, 10 or more discharges) for each APR-DRG SOI, and that estimates across the 4 SOI levels within an APR-DRG be monotonically nondecreasing (ie, as SOI level increases, weights must either be the same or increasing). Winsorized means were used as point estimates for mean cost in both the numerator and denominator of RW computation. Winsorizing refers to an analytic transformation by which the influence of outliers (eg, values beyond a certain threshold) is mitigated by replacing the value of outliers with the value of the threshold. We used the 5th and 95th percentiles as thresholds for Winsorizing our point estimates.
Winsorized point estimates failing to meet the minimum sample size of 10 or nondecreasing monotonicity requirement were modified by one of the two following methods:
Cost data were modeled using a generalized linear model assuming an exponential distribution. Covariates in the model included APR-DRG and SOI within APR-DRG as a continuous variable. Where applicable, Winsorized estimates of the mean were replaced with modeled estimates.
Data from an APR-DRG SOI in question were combined with other SOIs within the same APR-DRG with the closest Winsorized mean value. Once data were combined, a common Winsorized value was re-computed and values across SOIs were checked to ensure that nondecreasing monotonicity was maintained. In some APR-DRGs with sparse data, this involved combining pairs of severity levels; in others, it involved combining three or four severity levels together.
For APR-DRGs in which no discharges at any SOI were recorded in the 2012 KID, we used the Winsorized mean of all encounters with a common major diagnostic category (MDC) as the missing APR-DRG as point estimate for all 4 SOI levels.
To calculate the CMI for a set of discharges (eg, discharges at a hospital in a year), RWs were assigned to each discharge based on APR-DRG SOI designation. Consequently, all discharges from a specific APR-DRG SOI were assigned the same RW. Once RWs were assigned, CMI was calculated as the mean RW across all discharges. To compare hospital types based on acute-care hospital stays which are usually considered with the realm of pediatric care, we excluded RWs for normal newborns, defined as APR-DRG 626 (neonate birthweight of 2000–2499 g, normal newborn or neonate with other problems) and 640 (neonate birthweight >2499 g, normal newborn or neonate with other problems), and maternal hospitalizations, defined as APR-DRG 540 (cesarean delivery) and 560 (vaginal delivery), from our CMI calculations.
Statistical Methodology
Categorical variables were summarized using frequencies and percentages; continuous variables were summarized using medians and interquartile ranges. Differences between hospital
types (eg, rural, urban nonteaching, urban teaching, and
free-standing) were assessed using a Chi-square test for association for categorical variables. Differences in continuous variables including comparisons of neonatal (MDC 15) and nonneonatal discharges, and medical versus procedural discharges as defined by the APR-DRG grouper were assessed using a Kruskal–Wallis test. All analyses were performed using SAS, Version 9.4 (SAS Institute, Cary, North Carolina); P values <.05 were considered statistically significant.
This study was considered nonhuman subjects research by the Institutional Review Board of Vanderbilt University Medical Center.
RESULTS
Patient Population
Table 1 summarizes the patient characteristics for all 4 hospital types. All comparisons of patient characteristics across the four hospital types are significant (P < .001). Of the 6,675,222 weighted discharges in HCUP KID 2012, almost two-thirds were less than one year old (4,269,984). Three-quarters of those infant discharges (3,733,760) were in-hospital births. The South was the Census region with the most number of discharges (38.8%), and over half of discharges (53.2%) included patients who lived in metro areas with more than 1 million residents. Patients disproportionately originated from lower-income areas with 30.9% living in zip codes with median incomes in the first quartile.
More than 80% of discharges were classified by a medical APR-DRG. The most common medical APR-DRG SOI was APR-DRG 640 SOI 1, “Neonate birthweight >2499 g, normal newborn or neonate with other problem,” which accounted for almost half of medical APR-DRG discharges (44.5%, Table 2). Of the 10 most common medical APR-DRG SOIs, the only nonneonate, nonvaginal delivery APR-DRG SOIs included Asthma SOI 1, Bronchiolitis & RSV pneumonia SOI 1, and Pneumonia NEC SOI 1. Caesarian delivery and appendectomy represented half of the 10 most common procedural APR-DRG SOIs.
H-RISK Generation
Of the 1,258 APR-DRG SOI cost-based RWs (H-RISK), 1,119 (89.0%) met the minimum sample size and adhered to the monotonicity requirement. Thus, the Winsorized mean within the APR-DRG SOI was used. Modeling was used for 112 (8.9%) APR-DRG SOIs, and 23 (1.8%) were grouped with others to ensure that results were monotonically nondecreasing. For one APR-DRG, 482–Transurethral Prostatectomy, the dataset contained no discharges. Thus, Winsorized mean of all encounters within MDC 12, Diseases and Disorders of Male Reproductive System, was used.
The weighted Winsorized mean cost of all discharges was $6,135 per discharge. The majority of cost-based H-RISK were higher than 1, with 1,038 (82.5%) of APR-DRG SOIs incurring an estimated cost higher than $6,135. Solid organ and bone marrow transplantations represented 4 of the 10 highest cost-based RWs for procedural APR-DRG SOIs (Table 3). Neonatal APR-DRG SOIs accounted for 8 of the 10 highest medical RWs. A list of all APR-DRG SOIs and H-RISK can be found in Appendix A.
Hospital-Level Case-Mix Index for Acute Hospitalizations
After excluding normal newborn and maternal hospitalizations, median CMI of the 3117 hospitals with at least 20 unweighted discharges was 1.0 (interquartile range [IQR]: 0.8, 1.7). CMI varied significantly across hospital types (P < .001). Free-standing children’s hospitals exhibited the highest cost-based CMI (median: 2.7, IQR: 2.2–3.1), followed by urban teaching hospitals (median: 1.8, IQR: 1.3–2.6), urban nonteaching hospitals (median: 1.1, IQR: 0.9–1.5), and rural hospitals (median: 0.9, IQR: 0.7–0.9).
These differences in CMI persist when analyzing specific subpopulations. Significant differences in CMI were observed across the 4 hospital types for both procedural (P < .001) and medical APR-DRGs (P < .001), with free-standing children’s hospitals demonstrating the highest CMI of all hospital types (Figure). Similarly, within both neonatal and nonneonatal populations, significant variation in CMI was noted across hospital types (P < .001) with free-standing children’s hospitals incurring the highest CMIs (Figure).
DISCUSSION
Currently, no widely available measures can compare the relative intensity of hospital care specific for inpatient pediatric populations. To meet this important need, we have developed a methodology to determine valid pediatric RWs (H-RISK) which can be used to estimate the intensity of care for applications across entire hospital patient populations and specific subpopulations. H-RISK allow calculation of CMIs for risk adjustment of various outcomes at the discharge- or hospital-level and for comparisons among hospitals and populations. Using this methodology, we demonstrated that the CMI for free-standing children’s hospitals was significantly higher than those of rural, urban, nonteaching and urban teaching hospitals for all discharges and medical or procedural subgroups.
CMS has used RWs based on DRGs since the inception of the prospective payment system in 1983. The sequence of DRGs used by CMS has purposely focused on older adult Medicare population, and CMS itself recommends applying Medicare-focused DRGs (MS-DRGs being the current iteration) only for the >65 year population.6 Nevertheless, many payers, both government and commercial, utilize MS-DRGs and their RWs for payment purposes when reimbursing children’s hospitals. The validity of using weights developed using this grouper in hospitals treating large numbers of pediatric patients and childhood illnesses has been called into question, particularly when such weights are used in reimbursement of children’s hospitals.7
Several factors contribute to the validity of a model for developing RWs. First, the system used to describe patient hospitalizations and illnesses should be appropriate to the population in question. As described above, the original DRG system and its subsequent iterations were designed to describe hospitalizations for adults >65 years of age.8, 9 Over the years, CMS DRGs incorporated rudimentary categories for neonatal and obstetrical hospitalizations. Still, the current MS-DRGs lack sufficient focus on common inpatient pediatric conditions to adequately describe pediatric hospitalizations, particularly those in free-standing children’s hospitals delivering tertiary and quaternary care. Thus, a more appropriate classification schema for developing RWs specific for pediatric hospitalization should include patients across the entire age spectrum. APR-DRGs represent one such classification system.
Once an appropriate patient classification system is selected, then the population of hospitalized patients to be used as the reference group becomes important. For a system targeting a pediatric inpatient population, a hospital discharge database representing a broad sample of pediatric hospitalizations offers the best basis for developing a system of weights applicable to different types of hospitals providing care for children. For this purpose, we selected the 2012 KID database, a nationally representative dataset containing data on newborn and pediatric discharges from the majority of states within the US. This choice assured that the RWs developed were based on and applicable to pediatric hospitalizations across the entire spectrum of SOI and resource intensity.
A number of measures of hospital performance and quality have been developed and are used by various entities, including individual hospitals, CMS, Leapfrog, Magnet, Joint Commission, and payers, for purposes ranging from benchmarking for improvement to payment models to reimbursement penalties. However, SOI of a hospital’s patient population influences not only the intensity of care that a hospital provides but also presents a potential impact on process and outcome measures. Thus, fair and appropriate measures must consider differences in SOI when comparing hospital performances. Using the weights derived in this paper, these adjustments can be possibly made at either the discharge- or hospital-level, depending on the application, and may include comparisons by hospital location, ownership, payer mix, or socioeconomic strata.
It is also common for hospitals to quantitatively express the uniqueness of services that they deliver to payers or the general public. A hospital-level CMI (derived as the average discharge weight for patients within a hospital) is one way that hospitals may differentiate themselves. This can be accomplished by considering the ratio of one hospital’s CMI to another hospital’s (or an average of a group of hospitals) as an expression of the relative intensity of services. For example, if hospital x has a CMI of 2.3, and hospital y has a CMI of 1.4, the population of children hospitalized at hospital x was 64.3% (1–2.3/1.4) more resource intensive than the children seen at hospital y.
This study should be considered in terms of several limitations. We used costs as the basis for determining intensity of service. Thus, the difference in cost structure among children’s hospitals and between children’s hospitals and other hospital types in the KID could have affected the final calculated weights. Also, the RWs calculated in this study rely on hospital discharge data. Thus, complications which were not “present on admission” and occurred during a hospitalization could have reflected poor quality of care yet still increase resource intensity as measured by total costs. Future studies should examine the potential impact of using present-on-admission diagnoses only for the APR-DRG grouping on the values of RWs. Significant variation may have existed among hospitals in resource utilization, and some hospitals may have exhibited significant overutilization of resources for the same conditions. However, as we used Winsorized means, the impact of potential outliers should have been reduced. Some APR-DRG-SOI combinations were seen mainly at children’s hospitals. Thus, cost structure and resource utilization practices of this subset of hospitals would have been the only contributors to weights for these patients. Given that the 2012 KID contained a broad representation of pediatric hospitalizations, with age 0–20 years, newborns accounted for the majority of total cases in the database. While providing a full range of pediatric weights, inclusion of these patients lowered the overall average RW. For this reason, we excluded normal newborn categories and maternal categories from analysis of CMI across hospital types and focused on acute-care hospitalizations. Lastly, as with any study relying on administrative data, there is always the possibility of coding errors or data entry errors in the reference dataset.
CONCLUSIONS
H-RISK can be used to risk adjust measures to account for severity differences across populations. These weights can also be averaged across hospitals’ patient populations to compare relative resource intensities of the patients served.
1. Pettengill J, Vertrees J. Reliability and Validity in Hospital Case-Mix Measurement. Health Care Financ Rev. 1982; 4(2): 101-128. PubMed 2. Centers for Medicare & Medicaid Services. Details for title: Case Mix Index. https://www.cms.gov/Medicare/Medicare-Fee-for-Service-Payment/AcuteInpatientPPS/Acute-Inpatient-Files-for-Download-Items/CMS022630.html#. Accessed August 30, 2017. 3. Iglehart JK. Medicare begins prospective payment of hospitals. N. Engl. J. Med 1983; 308(23): 1428-1432. PubMed 4. Healthcare Cost Utilization Project. Overview of the Kids’ Inpatient Database (KID). 2017; https://www.hcup-us.ahrq.gov/kidoverview.jsp. Accessed August 30, 2017. 5. Healthcare Cost Utilization Project. Cost-to-Charge Ratio Files: 2012 Kids’ Inpatient Database (KID) User Guide. 2014; https://www.hcup-us.ahrq.gov/db/state/CCR2012KIDUserGuide.pdf. Accessed August 30, 2017. 6. Centers for Medicare & Medicaid Services. Medicare Program; Changes to the Hospital Inpatient Prospective Payment Systems and Fiscal Year 2005 Rates; Final Rule. Federal Register. 2004;69(154):48,939. PubMed 7. Muldoon JH. Structure and performance of different DRG classification systems for neonatal medicine. Pediatrics. 1999; 103(1 Suppl E): 302-318. PubMed 8. Averill R, Goldfield N, Muldoon J, Steinbeck B, Grant T. A Closer Look at All Patient Refined DRGs. J AHIMA. 2002; 73(1): 46-50. PubMed 9. Centers for Medicare & Medicaid Services. Design and development of the Diagnosis Related Group (DRG). https://www.cms.gov/ICD10Manual/version34-fullcode-cms/fullcode_cms/Design_and_development_of_the_Diagnosis_Related_Group_(DRGs)_PBL-038.pdf. Accessed December 6, 2017.
Hospitals are increasingly assessed comparatively in terms of costs and quality for benchmarking purposes. These comparisons can be used by patients and families to determine where to seek care, to report compliance and grant certifications by oversight organizations (eg, Leapfrog, Magnet, Joint Commission), and by payers, to determine reimbursement models and/or to assess financial penalty or bonuses for underperforming or overperforming hospitals. As these efforts can cause substantial reputational and financial consequences for hospitals, these metrics must be contextualized within the population of patients that each hospital serves.
In adult Medicare patient populations, methods have been developed to assess the relative severity of a hospital’s full complement of patients.1,2 These methods assume a relationship between severity and hospital resource intensity (ie, cost) and typically assume the form of relative weights (RWs), which are developed for clinically similar groups of patients (eg, Medicare Diagnosis Related Groups; MS-DRG) from a reference population. A RW for each MS-DRG is calculated as the average cost of patients within the group divided by the average cost for all patients in the reference population. These weights are then applied to a hospital’s discharges over a specific time period and averaged to obtain a hospital-level case-mix index (CMI). A value of 1 indicates that a hospital serves a mix of patients with similar severity (or resource intensity) to that of an “average” hospital discharge in the reference population, whereas a value of 1.2 indicates that a hospital serves a population of patients with 20% more severity than that of an “average” hospital discharge. Since 1983, the Centers for Medicare and Medicaid Services (CMS) has used RWs in their inpatient prospective payment system.3
Similar pediatric methods are less developed and necessitate special consideration as the use of existing weights may be inappropriate for a pediatric population. First, MS-DRGs were developed primarily for the Medicare population and lack sufficient granularity for pediatric populations, specifically newborns. Second, a severity stratification which incorporates important patient characteristics, such as age in pediatrics, does not exist in the MS-DRG system . Finally, although the reference populations that are used to develop MS-DRG weights do not explicitly exclude children, children typically account for approximately 15% of hospitalizations (6% excluding neonatal/maternal) and possibly feature different utilization patterns than adults with similar conditions. Thus, weights developed from a combined pediatric/adult reference population primarily reflect an adult population.
With valid pediatric RWs, stakeholders can assess a hospital’s severity mix of patients in a comparable fashion and contextualize outcome metrics. Additionally, these same weights can be used to estimate expected costs for hospitalizations or for risk adjusting various outcomes at the discharge- or hospital-level. Thus, we sought to develop hospitalization resource intensity scores for kids (H-RISK) using pediatric-specific weights and compare hospital-level CMIs across various hospital types and locations as an example of the application of this novel methodology.
METHODS
Dataset
Data for this analysis were obtained from the 2012 Healthcare Cost and Utilization Project (HCUP) Kids’ Inpatient Database (KID).4 KID is the largest publicly available all-payer inpatient administrative database in the United States and is sponsored by the Agency for Healthcare Research and Quality as part of the HCUP. The 2012 KID included a sample of approximately 3.2 million discharge records of children <21 years old from 44 states and 4,179 community, nonrehabilitation hospitals weighted for national estimates.
Hospital discharge costs were estimated from charges using cost-to-charge ratios (CCR) provided by HCUP as a supplement to the 2012 KID.5 Cost estimates associated with a specific discharge were estimated by multiplying the total charges reported in the data by the appropriate hospital-specific CCR and then adjusted for price factors beyond a hospital’s control using the area wage index also provided by HCUP as a supplement.
H-RISK and Case-Mix Index Calculations
We calculated H-RISK as pediatric-specific RWs based on version 30 of 3M’s All Patient Refined DRG (APR-DRG; 3M Health Information Systems, Salt Lake City, Utah) system as a measure of resource intensity. The APR-DRG system classifies hospital discharges into over 300 base DRGs based on demographic, diagnostic, and therapeutic characteristics. Each APR-DRG is further sub-divided into 4 subclasses of severity of illness (SOI; eg, minor, moderate, major, and extreme) to indicate the intensity of resource utilization during hospitalization. However, SOI levels for differing APR-DRGs are not comparable.
For every APR-DRG SOI combinations available in the 2012 KID, calculation of RW was based on the ratio of the mean cost for patients assigned to a particular APR-DRG SOI compared with the mean cost for all patients in the database. Inpatient costs less than $0.50 were set to missing and removed from analysis. Mortalities and discharges with missing CCR and wage index values were also excluded from analysis. We required that estimates for RWs be based on a reasonable set of data (ie, 10 or more discharges) for each APR-DRG SOI, and that estimates across the 4 SOI levels within an APR-DRG be monotonically nondecreasing (ie, as SOI level increases, weights must either be the same or increasing). Winsorized means were used as point estimates for mean cost in both the numerator and denominator of RW computation. Winsorizing refers to an analytic transformation by which the influence of outliers (eg, values beyond a certain threshold) is mitigated by replacing the value of outliers with the value of the threshold. We used the 5th and 95th percentiles as thresholds for Winsorizing our point estimates.
Winsorized point estimates failing to meet the minimum sample size of 10 or nondecreasing monotonicity requirement were modified by one of the two following methods:
Cost data were modeled using a generalized linear model assuming an exponential distribution. Covariates in the model included APR-DRG and SOI within APR-DRG as a continuous variable. Where applicable, Winsorized estimates of the mean were replaced with modeled estimates.
Data from an APR-DRG SOI in question were combined with other SOIs within the same APR-DRG with the closest Winsorized mean value. Once data were combined, a common Winsorized value was re-computed and values across SOIs were checked to ensure that nondecreasing monotonicity was maintained. In some APR-DRGs with sparse data, this involved combining pairs of severity levels; in others, it involved combining three or four severity levels together.
For APR-DRGs in which no discharges at any SOI were recorded in the 2012 KID, we used the Winsorized mean of all encounters with a common major diagnostic category (MDC) as the missing APR-DRG as point estimate for all 4 SOI levels.
To calculate the CMI for a set of discharges (eg, discharges at a hospital in a year), RWs were assigned to each discharge based on APR-DRG SOI designation. Consequently, all discharges from a specific APR-DRG SOI were assigned the same RW. Once RWs were assigned, CMI was calculated as the mean RW across all discharges. To compare hospital types based on acute-care hospital stays which are usually considered with the realm of pediatric care, we excluded RWs for normal newborns, defined as APR-DRG 626 (neonate birthweight of 2000–2499 g, normal newborn or neonate with other problems) and 640 (neonate birthweight >2499 g, normal newborn or neonate with other problems), and maternal hospitalizations, defined as APR-DRG 540 (cesarean delivery) and 560 (vaginal delivery), from our CMI calculations.
Statistical Methodology
Categorical variables were summarized using frequencies and percentages; continuous variables were summarized using medians and interquartile ranges. Differences between hospital
types (eg, rural, urban nonteaching, urban teaching, and
free-standing) were assessed using a Chi-square test for association for categorical variables. Differences in continuous variables including comparisons of neonatal (MDC 15) and nonneonatal discharges, and medical versus procedural discharges as defined by the APR-DRG grouper were assessed using a Kruskal–Wallis test. All analyses were performed using SAS, Version 9.4 (SAS Institute, Cary, North Carolina); P values <.05 were considered statistically significant.
This study was considered nonhuman subjects research by the Institutional Review Board of Vanderbilt University Medical Center.
RESULTS
Patient Population
Table 1 summarizes the patient characteristics for all 4 hospital types. All comparisons of patient characteristics across the four hospital types are significant (P < .001). Of the 6,675,222 weighted discharges in HCUP KID 2012, almost two-thirds were less than one year old (4,269,984). Three-quarters of those infant discharges (3,733,760) were in-hospital births. The South was the Census region with the most number of discharges (38.8%), and over half of discharges (53.2%) included patients who lived in metro areas with more than 1 million residents. Patients disproportionately originated from lower-income areas with 30.9% living in zip codes with median incomes in the first quartile.
More than 80% of discharges were classified by a medical APR-DRG. The most common medical APR-DRG SOI was APR-DRG 640 SOI 1, “Neonate birthweight >2499 g, normal newborn or neonate with other problem,” which accounted for almost half of medical APR-DRG discharges (44.5%, Table 2). Of the 10 most common medical APR-DRG SOIs, the only nonneonate, nonvaginal delivery APR-DRG SOIs included Asthma SOI 1, Bronchiolitis & RSV pneumonia SOI 1, and Pneumonia NEC SOI 1. Caesarian delivery and appendectomy represented half of the 10 most common procedural APR-DRG SOIs.
H-RISK Generation
Of the 1,258 APR-DRG SOI cost-based RWs (H-RISK), 1,119 (89.0%) met the minimum sample size and adhered to the monotonicity requirement. Thus, the Winsorized mean within the APR-DRG SOI was used. Modeling was used for 112 (8.9%) APR-DRG SOIs, and 23 (1.8%) were grouped with others to ensure that results were monotonically nondecreasing. For one APR-DRG, 482–Transurethral Prostatectomy, the dataset contained no discharges. Thus, Winsorized mean of all encounters within MDC 12, Diseases and Disorders of Male Reproductive System, was used.
The weighted Winsorized mean cost of all discharges was $6,135 per discharge. The majority of cost-based H-RISK were higher than 1, with 1,038 (82.5%) of APR-DRG SOIs incurring an estimated cost higher than $6,135. Solid organ and bone marrow transplantations represented 4 of the 10 highest cost-based RWs for procedural APR-DRG SOIs (Table 3). Neonatal APR-DRG SOIs accounted for 8 of the 10 highest medical RWs. A list of all APR-DRG SOIs and H-RISK can be found in Appendix A.
Hospital-Level Case-Mix Index for Acute Hospitalizations
After excluding normal newborn and maternal hospitalizations, median CMI of the 3117 hospitals with at least 20 unweighted discharges was 1.0 (interquartile range [IQR]: 0.8, 1.7). CMI varied significantly across hospital types (P < .001). Free-standing children’s hospitals exhibited the highest cost-based CMI (median: 2.7, IQR: 2.2–3.1), followed by urban teaching hospitals (median: 1.8, IQR: 1.3–2.6), urban nonteaching hospitals (median: 1.1, IQR: 0.9–1.5), and rural hospitals (median: 0.9, IQR: 0.7–0.9).
These differences in CMI persist when analyzing specific subpopulations. Significant differences in CMI were observed across the 4 hospital types for both procedural (P < .001) and medical APR-DRGs (P < .001), with free-standing children’s hospitals demonstrating the highest CMI of all hospital types (Figure). Similarly, within both neonatal and nonneonatal populations, significant variation in CMI was noted across hospital types (P < .001) with free-standing children’s hospitals incurring the highest CMIs (Figure).
DISCUSSION
Currently, no widely available measures can compare the relative intensity of hospital care specific for inpatient pediatric populations. To meet this important need, we have developed a methodology to determine valid pediatric RWs (H-RISK) which can be used to estimate the intensity of care for applications across entire hospital patient populations and specific subpopulations. H-RISK allow calculation of CMIs for risk adjustment of various outcomes at the discharge- or hospital-level and for comparisons among hospitals and populations. Using this methodology, we demonstrated that the CMI for free-standing children’s hospitals was significantly higher than those of rural, urban, nonteaching and urban teaching hospitals for all discharges and medical or procedural subgroups.
CMS has used RWs based on DRGs since the inception of the prospective payment system in 1983. The sequence of DRGs used by CMS has purposely focused on older adult Medicare population, and CMS itself recommends applying Medicare-focused DRGs (MS-DRGs being the current iteration) only for the >65 year population.6 Nevertheless, many payers, both government and commercial, utilize MS-DRGs and their RWs for payment purposes when reimbursing children’s hospitals. The validity of using weights developed using this grouper in hospitals treating large numbers of pediatric patients and childhood illnesses has been called into question, particularly when such weights are used in reimbursement of children’s hospitals.7
Several factors contribute to the validity of a model for developing RWs. First, the system used to describe patient hospitalizations and illnesses should be appropriate to the population in question. As described above, the original DRG system and its subsequent iterations were designed to describe hospitalizations for adults >65 years of age.8, 9 Over the years, CMS DRGs incorporated rudimentary categories for neonatal and obstetrical hospitalizations. Still, the current MS-DRGs lack sufficient focus on common inpatient pediatric conditions to adequately describe pediatric hospitalizations, particularly those in free-standing children’s hospitals delivering tertiary and quaternary care. Thus, a more appropriate classification schema for developing RWs specific for pediatric hospitalization should include patients across the entire age spectrum. APR-DRGs represent one such classification system.
Once an appropriate patient classification system is selected, then the population of hospitalized patients to be used as the reference group becomes important. For a system targeting a pediatric inpatient population, a hospital discharge database representing a broad sample of pediatric hospitalizations offers the best basis for developing a system of weights applicable to different types of hospitals providing care for children. For this purpose, we selected the 2012 KID database, a nationally representative dataset containing data on newborn and pediatric discharges from the majority of states within the US. This choice assured that the RWs developed were based on and applicable to pediatric hospitalizations across the entire spectrum of SOI and resource intensity.
A number of measures of hospital performance and quality have been developed and are used by various entities, including individual hospitals, CMS, Leapfrog, Magnet, Joint Commission, and payers, for purposes ranging from benchmarking for improvement to payment models to reimbursement penalties. However, SOI of a hospital’s patient population influences not only the intensity of care that a hospital provides but also presents a potential impact on process and outcome measures. Thus, fair and appropriate measures must consider differences in SOI when comparing hospital performances. Using the weights derived in this paper, these adjustments can be possibly made at either the discharge- or hospital-level, depending on the application, and may include comparisons by hospital location, ownership, payer mix, or socioeconomic strata.
It is also common for hospitals to quantitatively express the uniqueness of services that they deliver to payers or the general public. A hospital-level CMI (derived as the average discharge weight for patients within a hospital) is one way that hospitals may differentiate themselves. This can be accomplished by considering the ratio of one hospital’s CMI to another hospital’s (or an average of a group of hospitals) as an expression of the relative intensity of services. For example, if hospital x has a CMI of 2.3, and hospital y has a CMI of 1.4, the population of children hospitalized at hospital x was 64.3% (1–2.3/1.4) more resource intensive than the children seen at hospital y.
This study should be considered in terms of several limitations. We used costs as the basis for determining intensity of service. Thus, the difference in cost structure among children’s hospitals and between children’s hospitals and other hospital types in the KID could have affected the final calculated weights. Also, the RWs calculated in this study rely on hospital discharge data. Thus, complications which were not “present on admission” and occurred during a hospitalization could have reflected poor quality of care yet still increase resource intensity as measured by total costs. Future studies should examine the potential impact of using present-on-admission diagnoses only for the APR-DRG grouping on the values of RWs. Significant variation may have existed among hospitals in resource utilization, and some hospitals may have exhibited significant overutilization of resources for the same conditions. However, as we used Winsorized means, the impact of potential outliers should have been reduced. Some APR-DRG-SOI combinations were seen mainly at children’s hospitals. Thus, cost structure and resource utilization practices of this subset of hospitals would have been the only contributors to weights for these patients. Given that the 2012 KID contained a broad representation of pediatric hospitalizations, with age 0–20 years, newborns accounted for the majority of total cases in the database. While providing a full range of pediatric weights, inclusion of these patients lowered the overall average RW. For this reason, we excluded normal newborn categories and maternal categories from analysis of CMI across hospital types and focused on acute-care hospitalizations. Lastly, as with any study relying on administrative data, there is always the possibility of coding errors or data entry errors in the reference dataset.
CONCLUSIONS
H-RISK can be used to risk adjust measures to account for severity differences across populations. These weights can also be averaged across hospitals’ patient populations to compare relative resource intensities of the patients served.
Disclosures
The authors have nothing to disclose.
References
1. Pettengill J, Vertrees J. Reliability and Validity in Hospital Case-Mix Measurement. Health Care Financ Rev. 1982; 4(2): 101-128. PubMed 2. Centers for Medicare & Medicaid Services. Details for title: Case Mix Index. https://www.cms.gov/Medicare/Medicare-Fee-for-Service-Payment/AcuteInpatientPPS/Acute-Inpatient-Files-for-Download-Items/CMS022630.html#. Accessed August 30, 2017. 3. Iglehart JK. Medicare begins prospective payment of hospitals. N. Engl. J. Med 1983; 308(23): 1428-1432. PubMed 4. Healthcare Cost Utilization Project. Overview of the Kids’ Inpatient Database (KID). 2017; https://www.hcup-us.ahrq.gov/kidoverview.jsp. Accessed August 30, 2017. 5. Healthcare Cost Utilization Project. Cost-to-Charge Ratio Files: 2012 Kids’ Inpatient Database (KID) User Guide. 2014; https://www.hcup-us.ahrq.gov/db/state/CCR2012KIDUserGuide.pdf. Accessed August 30, 2017. 6. Centers for Medicare & Medicaid Services. Medicare Program; Changes to the Hospital Inpatient Prospective Payment Systems and Fiscal Year 2005 Rates; Final Rule. Federal Register. 2004;69(154):48,939. PubMed 7. Muldoon JH. Structure and performance of different DRG classification systems for neonatal medicine. Pediatrics. 1999; 103(1 Suppl E): 302-318. PubMed 8. Averill R, Goldfield N, Muldoon J, Steinbeck B, Grant T. A Closer Look at All Patient Refined DRGs. J AHIMA. 2002; 73(1): 46-50. PubMed 9. Centers for Medicare & Medicaid Services. Design and development of the Diagnosis Related Group (DRG). https://www.cms.gov/ICD10Manual/version34-fullcode-cms/fullcode_cms/Design_and_development_of_the_Diagnosis_Related_Group_(DRGs)_PBL-038.pdf. Accessed December 6, 2017.
Physiologic monitor alarms occur frequently in the hospital environment, with average rates on pediatric wards between 42 and 155 alarms per monitored patient-day.1 However, average rates do not depict the full story, because only 9%–25% of patients are responsible for most alarms on inpatient wards.1,2 In addition, only 0.5%–1% of alarms on pediatric wards warrant action.3,4 Downstream consequences of high alarm rates include interruptions5,6 and alarm fatigue.3,4,7
Alarm customization, the process of reviewing individual patients’ alarm data and using that data to implement patient-specific alarm reduction interventions, has emerged as a potential approach to unit-wide alarm management.8-11 Potential customizations include broadening alarm thresholds, instituting delays between the time the alarm condition is met and the time the alarm sounds, and changing electrodes.8-11 However, the workflows within which to identify the patients who will benefit from customization, make decisions about how to customize, and implement customizations have not been delineated.
Safety huddles are brief structured discussions among physicians, nurses, and other staff aiming to identify and mitigate threats to patient safety.11-13 In this study, we aimed to evaluate the influence of a safety huddle-based alarm intervention strategy targeting high alarm pediatric ward patients on (a) unit-level alarm rates and (b) patient-level alarm rates, as well as to (c) evaluate implementation outcomes. We hypothesized that patients discussed in huddles would have greater reductions in alarm rates in the 24 hours following their huddle than patients who were not discussed. Given that most alarms are generated by a small fraction of patients,1,2 we hypothesized that patient-level reductions would translate to unit-level reductions.
METHODS
Human Subject Protection
The Institutional Review Board of Children’s Hospital of Philadelphia approved this study with a waiver of informed consent. We registered the study at ClinicalTrials.gov (identifier NCT02458872). The original protocol is available as an Online Supplement.
Design and Framework
We performed a hybrid effectiveness-implementation trial at a single hospital with cluster randomization at the unit level (CONSORT flow diagram in Figure 1). Hybrid trials aim to determine the effectiveness of a clinical intervention (alarm customization) and the feasibility and potential utility of an implementation strategy (safety huddles).14 We used the Consolidated Framework for Implementation Research15 to theoretically ground and frame our implementation and drew upon the work of Proctor and colleagues16 to guide implementation outcome selection.
For our secondary effectiveness outcome evaluating the effect of the intervention on the alarm rates of the individual patients discussed in huddles, we used a cohort design embedded within the trial to analyze patient-specific alarm data collected only on randomly selected “intensive data collection days,” described below and in Figure 1.
Setting and Subjects
All patients hospitalized on 8 units that admit general pediatric and medical subspecialty patients at Children’s Hospital of Philadelphia between June 15, 2015 and May 8, 2016 were included in the primary (unit-level) analysis. Every patient’s bedside included a General Electric Dash 3000 physiologic monitor. Decisions to monitor patients were made by physicians and required orders. Default alarm settings are available in Supplementary Table 1; these settings required orders to change.
All 8 units were already convening scheduled safety huddles led by the charge nurse each day. All nurses and at least one resident were expected to attend; attending physicians and fellows were welcome but not expected to attend. Huddles focused on discussing safety concerns and patient flow. None of the preexisting huddles included alarm discussion.
Intervention
For each nonholiday weekday, we generated customized paper-based alarm huddle data “dashboards” (Supplementary Figure 1) displaying data from the patients (up to a maximum of 4) on each intervention unit with the highest numbers of high-acuity alarms (“crisis” and “warning” audible alarms, see Supplementary Table 2 for detailed listing of alarm types) in the preceding 4 hours by reviewing data from the monitor network using BedMasterEx v4.2 (Excel Medical Electronics). Dashboards listed the most frequent types of alarms, alarm settings, and included a script for discussing the alarms with checkboxes to indicate changes agreed upon by the team during the huddle. Patients with fewer than 20 alarms in the preceding 4h were not included; thus, sometimes fewer than 4 patients’ data were available for discussion. We hand-delivered dashboards to the charge nurses leading huddles, and they facilitated the multidisciplinary alarm discussions focused on reviewing alarm data and customizing settings to reduce unnecessary alarms.
Study Periods
The study had 3 periods as shown in Supplementary Figure 2: (1) 16-week baseline data collection, (2) phased intervention implementation during which we serially spent 2-8 weeks on each of the 4 intervention units implementing the intervention, and (3) 16-week postimplementation data collection.
Outcomes
The primary effectiveness outcome was the change in unit-level alarms per patient-day between the baseline and postimplementation periods in intervention versus control units, with all patients on the units included. The secondary effectiveness outcome (analyzed using the embedded cohort design) was the change in individual patient-level alarms between the 24 hours leading up to a huddle and the 24 hours following huddles in patients who were versus patients who were not discussed in huddles.
Implementation outcomes included adoption and fidelity measures. To measure adoption (defined as “intention to try” the intervention),16 we measured the frequency of discussions attended by patients’ nurses and physicians. We evaluated 3 elements of fidelity: adherence, dose, and quality of delivery.17 We measured adherence as the incorporation of alarm discussion into huddles when there were eligible patients to discuss. We measured dose as the average number of patients discussed on each unit per calendar day during the postimplementation period. We measured quality of delivery as the extent to which changes to monitoring that were agreed upon in the huddles were made at the bedside.
Safety Measures
To surveil for unintended consequences of reduced monitoring, we screened the hospital’s rapid response and code blue team database weekly for any events in patients previously discussed in huddles that occurred between huddle and hospital discharge. We reviewed charts to determine if the events were related to the intervention.
Randomization
Prior to randomization, the 8 units were divided into pairs based on participation in hospital-wide Joint Commission alarm management activities, use of alarm middleware that relayed detailed alarm information to nurses’ mobile phones, and baseline alarm rates. One unit in each pair was randomized to intervention and the other to control by coin flip.
Data Collection
We used Research Electronic Data Capture (REDCap)18 database tools.
Data for Unit-Level Analyses
We captured all alarms occurring on the study units during the study period using data from BedMasterEx. We obtained census data accurate to the hour from the Clinical Data Warehouse.
Data Captured in All Huddles
During each huddle, we collected the number of patients whose alarms were discussed, patient characteristics, presence of nurses and physicians, and monitoring changes agreed upon. We then followed up 4 hours later to determine if changes were made at the bedside by examining monitor settings.
Data Captured Only During Intensive Data Collection Days
We randomly selected 1 day during each of the 16 weeks of the postimplementation period to obtain additional patient-level data. On each intensive data collection day, the 4 monitored patients on each intervention and control unit with the most high-acuity alarms in the 4 hours prior to huddles occurring — regardless of whether or not these patients were later discussed in huddles — were identified for data collection. On these dates, a member of the research team reviewed each patient’s alarm counts in 4-hour blocks during the 24 hours before and after the huddle. Given that the huddles were not always at the same time every day (ranging between 10:00 and 13:00), we operationally set the huddle time as 12:00 for all units.
Data Analysis
We used Stata/SE 14.2 for all analyses.
Unit-Level Alarm Rates
To compare unit-level rates, we performed an interrupted time series analysis using segmented (piecewise) regression to evaluate the impact of the intervention.19,20 We used a multivariable generalized estimating equation model with the negative binomial distribution21 and clustering by unit. We bootstrapped the model and generated percentile-based 95% confidence intervals. We then used the model to estimate the alarm rate difference in differences between the baseline data collection period and the postimplementation data collection period for intervention versus control units.
Patient-Level Alarm Rates
In contrast to unit-level analysis, we used an embedded cohort design to model the change in individual patients’ alarms between the 24 hours leading up to huddles and the 24 hours following huddles in patients who were versus patients who were not discussed in huddles. The analysis was restricted to the patients included in intensive data collection days. We performed bootstrapped linear regression and generated percentile-based 95% confidence intervals using the difference in 4-hour block alarm rate between pre- and posthuddle as the outcome. We clustered within patients. We stratified by unit and preceding alarm rate. We modeled the alarm rate difference between the 24-hour prehuddle and the 24-hour posthuddle for huddled and nonhuddled patients and the difference in differences between exposure groups.
Implementation Outcomes
We summarized adoption and fidelity using proportions.
RESULTS
Alarm dashboards informed 580 structured alarm discussions during 353 safety huddles (huddles often included discussion of more than one patient).
Unit-Level Alarm Rates
A total of 2,874,972 alarms occurred on the 8 units during the study period. We excluded 15,548 alarms that occurred during the same second as another alarm for the same patient because they generated a single alarm. We excluded 24,700 alarms that occurred during 4 days with alarm database downtimes that affected data integrity. Supplementary Table 2 summarizes the characteristics of the remaining 2,834,724 alarms used in the analysis.
Visually, alarm rates over time on each individual unit appeared flat despite the intervention (Supplementary Figure 3). Using piecewise regression, we found that intervention and control units had small increases in alarm rates between the baseline and postimplementation periods with a nonsignificant difference in these differences between the control and intervention groups (Table 1).
Patient-Level Alarm Rates
We then restricted the analysis to the patients whose data were collected during intensive data collection days. We obtained data from 1974 pre-post pairs of 4-hour time periods.
Patients on intervention and control units who were not discussed in huddles had 38 fewer alarms/patient-day (95% CI: 23–54 fewer, P < .001) in the posthuddle period than in the prehuddle period. Patients discussed in huddles had 135 fewer alarms/patient-day (95% CI: 93–178 fewer, P < .001) in the posthuddle 24-hour period than in the prehuddle period. The pairwise comparison reflecting the difference in differences showed that huddled patients had a rate of 97 fewer alarms/patient-day (95% CI: 52–138 fewer, P < .001) in the posthuddle period compared with patients not discussed in huddles.
To better understand the mechanism of reduction, we analyzed alarm rates for the patient categories shown in Table 2 and visually evaluated how average alarm rates changed over time (Figure 2). When analyzing the 6 potential pairwise comparisons between each of the 4 categories separately, we found that the following 2 comparisons were statistically significant: (1) patients whose alarms were discussed in huddles and had changes made to monitoring had greater alarm reductions than patients on control units, and (2) patients whose alarms were discussed in huddles and had changes made to monitoring had greater alarm reductions than patients who were also on intervention units but whose alarms were not discussed (Table 2).
Implementation Outcomes
Adoption
The patient’s nurse attended 482 of the 580 huddle discussions (83.1%), and at least one of the patient’s physicians (resident, fellow, or attending) attended 394 (67.9%).
Fidelity: Adherence
In addition to the 353 huddles that included alarm discussion, 123 instances had no patients with ≥20 high acuity alarms in the preceding 4 hours therefore, no data were brought to the huddle. There were an additional 30 instances when a huddle did not occur or there was no alarm discussion in the huddle despite data being available. Thus, adherence occurred in 353 of 383 huddles (92.2%).
Fidelity: Dose
During the 112 calendar day postimplementation period, 379 patients’ alarms were discussed in huddles for an average intervention dose of 0.85 discussions per unit per calendar day.
Fidelity: Quality of Delivery
In 362 of the 580 huddle discussions (62.4%), changes were agreed upon. The most frequently agreed upon changes were discontinuing monitoring (32.0%), monitoring only when asleep or unsupervised (23.8%), widening heart rate parameters (12.7%), changing electrocardiographic leads/wires (8.6%), changing the pulse oximetry probe (8.0%), and increasing the delay time between when oxygen desaturation was detected and when the alarm was generated (4.7%). Of the huddle discussions with changes agreed upon, 346 (95.6%) changes were enacted at the bedside.
Safety Measures
There were 0 code blue events and 26 rapid response team activations for patients discussed in huddles. None were related to the intervention.
Discussion
Our main finding was that the huddle strategy was effective in safely reducing the burden of alarms for the high alarm pediatric ward patients whose alarms were discussed, but it did not reduce unit-level alarm rates. Implementation outcomes explained this finding. Although adoption and adherence were high, the overall dose of the intervention was low.
We also found that 36% of alarms had technical causes, the majority of which were related to the pulse oximetry probe detecting that it was off the patient or searching for a pulse. Although these alarms are likely perceived differently by clinical staff (most monitors generate different sounds for technical alarms), they still represent a substantial contribution to the alarm environment. Minimizing them in patients who must remain continuously monitored requires more intensive effort to implement other types of interventions than the main focus of this study, such as changing pulse oximetry probes and electrocardiographic leads/wires.
In one-third of huddles, monitoring was simply discontinued. We observed in many cases that, while these patients may have had legitimate indications for monitoring upon admission, their conditions had improved; after brief multidisciplinary discussion, the team concluded that monitoring was no longer indicated. This observation may suggest interventions at the ordering phase, such as prespecifying a monitoring duration.22,23
This study’s findings were consistent with a quasi-experimental study of safety huddle-based alarm discussions in a pediatric intensive care unit that showed a patient-level reduction of 116 alarms per patient-day in those discussed in huddles relative to controls.11 A smaller quasi-experimental study of implementing a nighttime alarm “ward round” in an adult intensive care unit showed a significant reduction in unit-level alarms/patient-day from 168 to 84.9 In a quality improvement report, a monitoring care process bundle that included discussion of alarm settings showed a reduction in unit-level alarms/patient-day from 180 to 40.10 Our study strengthens the body of literature using a cluster-randomized design, measuring patient- and unit-level outcomes, and including implementation outcomes that explain effectiveness findings.
On a hypothetical unit similar to the ones we studied with 20 occupied beds and 60 alarms/patient-day, an average of 1200 alarms would occur each day. We delivered the intervention to 0.85 patients per day. Changes were made at the bedside in 60% of those with the intervention delivered, and those patients had a difference in differences of 119 fewer alarms compared with the comparison patients on control units. In this scenario, we could expect a relative reduction of 0.85 x 0.60 x 119 = 61 fewer alarms/day total on the unit or a 5% reduction. However, that estimated reduction did not account for the arrival of new patients with high alarm rates, which certainly occurred in this study and explained the lack of effect at the unit level.
As described above, the intervention dose was low, which translated into a lack of effect at the unit level despite a strong effect at the patient level. This result was partly due to the manual process required to produce the alarm dashboards that restricted their availability to nonholiday weekdays. The study was performed at one hospital, which limited generalizability. The study hospital was already convening daily safety huddles that were well attended by nurses and physicians. Other hospitals without existing huddle structures may face challenges in implementing similar multidisciplinary alarm discussions. In addition, the study design was randomized at the unit (rather than patient) level, which limited our ability to balance potential confounders at the patient level.
Conclusion
A safety huddle intervention strategy to drive alarm customization was effective in safely reducing alarms for individual children discussed. However, unit-level alarm rates were not affected by the intervention due to a low dose. Leaders of efforts to reduce alarms should consider beginning with passive interventions (such as changes to default settings and alarm delays) and use huddle-based discussion as a second-line intervention to address remaining patients with high alarm rates.
Acknowledgments
We thank Matthew MacMurchy, BA, for his assistance with data collection.
Funding/Support
This study was supported by a Young Investigator Award (Bonafide, PI) from the Academic Pediatric Association.
Role of the Funder/Sponsor
The Academic Pediatric Association had no role in the design or conduct of the study; collection, management, analysis, or interpretation of the data; preparation, review, or approval of the manuscript; or decision to submit for publication.
Disclosures
No relevant financial activities, aside from the grant funding from the Academic Pediatric Association listed above, are reported.
1. Schondelmeyer AC, Brady PW, Goel VV, et al. Physiologic monitor alarm rates at 5 children’s hospitals. J Hosp Med. 2018;In press. PubMed 2. Cvach M, Kitchens M, Smith K, Harris P, Flack MN. Customizing alarm limits based on specific needs of patients. Biomed Instrum Technol. 2017;51(3):227-234. PubMed 3. Bonafide CP, Lin R, Zander M, et al. Association between exposure to nonactionable physiologic monitor alarms and response time in a children’s hospital. J Hosp Med. 2015;10(6):345-351. PubMed 4. Bonafide CP, Localio AR, Holmes JH, et al. Video analysis of factors associated with response time to physiologic monitor alarms in a children’s hospital. JAMA Pediatr. 2017;171(6):524-531. PubMed 5. Lange K, Nowak M, Zoller R, Lauer W. Boundary conditions for safe detection of clinical alarms: An observational study to identify the cognitive and perceptual demands on an Intensive Care Unit. In: In: D. de Waard, K.A. Brookhuis, A. Toffetti, A. Stuiver, C. Weikert, D. Coelho, D. Manzey, A.B. Ünal, S. Röttger, and N. Merat (Eds.) Proceedings of the Human Factors and Ergonomics Society Europe Chapter 2015 Annual Conference. Groningen, Netherlands; 2016. 6. Westbrook JI, Li L, Hooper TD, Raban MZ, Middleton S, Lehnbom EC. Effectiveness of a ‘Do not interrupt’ bundled intervention to reduce interruptions during medication administration: a cluster randomised controlled feasibility study. BMJ Qual Saf. 2017;26:734-742. PubMed 7. Chopra V, McMahon LF Jr. Redesigning hospital alarms for patient safety: alarmed and potentially dangerous. JAMA. 2014;311(12):1199-1200. PubMed 8. Turmell JW, Coke L, Catinella R, Hosford T, Majeski A. Alarm fatigue: use of an evidence-based alarm management strategy. J Nurs Care Qual. 2017;32(1):47-54. PubMed 9. Koerber JP, Walker J, Worsley M, Thorpe CM. An alarm ward round reduces the frequency of false alarms on the ICU at night. J Intensive Care Soc. 2011;12(1):75-76. 10. Dandoy CE, Davies SM, Flesch L, et al. A team-based approach to reducing cardiac monitor alarms. Pediatrics. 2014;134(6):e1686-1694. PubMed 11. Dewan M, Wolfe H, Lin R, et al. Impact of a safety huddle–based intervention on monitor alarm rates in low-acuity pediatric intensive care unit patients. J Hosp Med. 2017;12(8):652-657. PubMed 12. Goldenhar LM, Brady PW, Sutcliffe KM, Muething SE. Huddling for high reliability and situation awareness. BMJ Qual Saf. 2013;22(11):899-906. PubMed 13. Brady PW, Muething S, Kotagal U, et al. Improving situation awareness to reduce unrecognized clinical deterioration and serious safety events. Pediatrics. 2013;131:e298-308. PubMed 14. Curran GM, Bauer M, Mittman B, Pyne JM, Stetler C. Effectiveness-implementation hybrid designs: combining elements of clinical effectiveness and implementation research to enhance public health impact. Med Care. 2012;50(3):217-226. PubMed 15. Damschroder LJ, Aron DC, Keith RE, Kirsh SR, Alexander JA, Lowery JC. Fostering implementation of health services research findings into practice: a consolidated framework for advancing implementation science. Implement Sci. 2009;4(1):50. PubMed 16. Proctor E, Silmere H, Raghavan R, et al. Outcomes for implementation research: conceptual distinctions, measurement challenges, and research agenda. Adm Policy Ment Health. 2011;38(2):65-76. PubMed 17. Allen JD, Linnan LA, Emmons KM. Fidelity and its relationship to implementation effectiveness, adaptation, and dissemination. In: Dissemination and Implementation Research in Health: Translating Science to Practice (Brownson RC, Proctor EK, Colditz GA Eds.). Oxford University Press; 2012:281-304. 18. Harris PA, Taylor R, Thielke R, Payne J, Gonzalez N, Conde JG. Research electronic data capture (REDCap)—a metadata-driven methodology and workflow process for providing translational research informatics support. J Biomed Inf. 2009;42:377-381. PubMed 19. Singer JD, Willett JB. Applied Longitudinal Data Analysis: Modeling Change and Event Occurrence. New York: Oxford University Press; 2003. 20. Wagner AK, Soumerai SB, Zhang F, Ross-Degnan D. Segmented regression analysis of interrupted time series studies in medication use research. J Clin Pharm Ther. 2002;27:299-309. PubMed 21. Gardner W, Mulvey EP, Shaw EC. Regression analyses of counts and rates: Poisson, overdispersed Poisson, and negative binomial models. Psychol Bull. 1995;118:392-404. PubMed 22. Dressler R, Dryer MM, Coletti C, Mahoney D, Doorey AJ. Altering overuse of cardiac telemetry in non-intensive care unit settings by hardwiring the use of American Heart Association guidelines. JAMA Intern Med. 2014;174(11):1852-1854. PubMed 23. Boggan JC, Navar-Boggan AM, Patel V, Schulteis RD, Simel DL. Reductions in telemetry order duration do not reduce telemetry utilization. J Hosp Med. 2014;9(12):795-796. PubMed
Physiologic monitor alarms occur frequently in the hospital environment, with average rates on pediatric wards between 42 and 155 alarms per monitored patient-day.1 However, average rates do not depict the full story, because only 9%–25% of patients are responsible for most alarms on inpatient wards.1,2 In addition, only 0.5%–1% of alarms on pediatric wards warrant action.3,4 Downstream consequences of high alarm rates include interruptions5,6 and alarm fatigue.3,4,7
Alarm customization, the process of reviewing individual patients’ alarm data and using that data to implement patient-specific alarm reduction interventions, has emerged as a potential approach to unit-wide alarm management.8-11 Potential customizations include broadening alarm thresholds, instituting delays between the time the alarm condition is met and the time the alarm sounds, and changing electrodes.8-11 However, the workflows within which to identify the patients who will benefit from customization, make decisions about how to customize, and implement customizations have not been delineated.
Safety huddles are brief structured discussions among physicians, nurses, and other staff aiming to identify and mitigate threats to patient safety.11-13 In this study, we aimed to evaluate the influence of a safety huddle-based alarm intervention strategy targeting high alarm pediatric ward patients on (a) unit-level alarm rates and (b) patient-level alarm rates, as well as to (c) evaluate implementation outcomes. We hypothesized that patients discussed in huddles would have greater reductions in alarm rates in the 24 hours following their huddle than patients who were not discussed. Given that most alarms are generated by a small fraction of patients,1,2 we hypothesized that patient-level reductions would translate to unit-level reductions.
METHODS
Human Subject Protection
The Institutional Review Board of Children’s Hospital of Philadelphia approved this study with a waiver of informed consent. We registered the study at ClinicalTrials.gov (identifier NCT02458872). The original protocol is available as an Online Supplement.
Design and Framework
We performed a hybrid effectiveness-implementation trial at a single hospital with cluster randomization at the unit level (CONSORT flow diagram in Figure 1). Hybrid trials aim to determine the effectiveness of a clinical intervention (alarm customization) and the feasibility and potential utility of an implementation strategy (safety huddles).14 We used the Consolidated Framework for Implementation Research15 to theoretically ground and frame our implementation and drew upon the work of Proctor and colleagues16 to guide implementation outcome selection.
For our secondary effectiveness outcome evaluating the effect of the intervention on the alarm rates of the individual patients discussed in huddles, we used a cohort design embedded within the trial to analyze patient-specific alarm data collected only on randomly selected “intensive data collection days,” described below and in Figure 1.
Setting and Subjects
All patients hospitalized on 8 units that admit general pediatric and medical subspecialty patients at Children’s Hospital of Philadelphia between June 15, 2015 and May 8, 2016 were included in the primary (unit-level) analysis. Every patient’s bedside included a General Electric Dash 3000 physiologic monitor. Decisions to monitor patients were made by physicians and required orders. Default alarm settings are available in Supplementary Table 1; these settings required orders to change.
All 8 units were already convening scheduled safety huddles led by the charge nurse each day. All nurses and at least one resident were expected to attend; attending physicians and fellows were welcome but not expected to attend. Huddles focused on discussing safety concerns and patient flow. None of the preexisting huddles included alarm discussion.
Intervention
For each nonholiday weekday, we generated customized paper-based alarm huddle data “dashboards” (Supplementary Figure 1) displaying data from the patients (up to a maximum of 4) on each intervention unit with the highest numbers of high-acuity alarms (“crisis” and “warning” audible alarms, see Supplementary Table 2 for detailed listing of alarm types) in the preceding 4 hours by reviewing data from the monitor network using BedMasterEx v4.2 (Excel Medical Electronics). Dashboards listed the most frequent types of alarms, alarm settings, and included a script for discussing the alarms with checkboxes to indicate changes agreed upon by the team during the huddle. Patients with fewer than 20 alarms in the preceding 4h were not included; thus, sometimes fewer than 4 patients’ data were available for discussion. We hand-delivered dashboards to the charge nurses leading huddles, and they facilitated the multidisciplinary alarm discussions focused on reviewing alarm data and customizing settings to reduce unnecessary alarms.
Study Periods
The study had 3 periods as shown in Supplementary Figure 2: (1) 16-week baseline data collection, (2) phased intervention implementation during which we serially spent 2-8 weeks on each of the 4 intervention units implementing the intervention, and (3) 16-week postimplementation data collection.
Outcomes
The primary effectiveness outcome was the change in unit-level alarms per patient-day between the baseline and postimplementation periods in intervention versus control units, with all patients on the units included. The secondary effectiveness outcome (analyzed using the embedded cohort design) was the change in individual patient-level alarms between the 24 hours leading up to a huddle and the 24 hours following huddles in patients who were versus patients who were not discussed in huddles.
Implementation outcomes included adoption and fidelity measures. To measure adoption (defined as “intention to try” the intervention),16 we measured the frequency of discussions attended by patients’ nurses and physicians. We evaluated 3 elements of fidelity: adherence, dose, and quality of delivery.17 We measured adherence as the incorporation of alarm discussion into huddles when there were eligible patients to discuss. We measured dose as the average number of patients discussed on each unit per calendar day during the postimplementation period. We measured quality of delivery as the extent to which changes to monitoring that were agreed upon in the huddles were made at the bedside.
Safety Measures
To surveil for unintended consequences of reduced monitoring, we screened the hospital’s rapid response and code blue team database weekly for any events in patients previously discussed in huddles that occurred between huddle and hospital discharge. We reviewed charts to determine if the events were related to the intervention.
Randomization
Prior to randomization, the 8 units were divided into pairs based on participation in hospital-wide Joint Commission alarm management activities, use of alarm middleware that relayed detailed alarm information to nurses’ mobile phones, and baseline alarm rates. One unit in each pair was randomized to intervention and the other to control by coin flip.
Data Collection
We used Research Electronic Data Capture (REDCap)18 database tools.
Data for Unit-Level Analyses
We captured all alarms occurring on the study units during the study period using data from BedMasterEx. We obtained census data accurate to the hour from the Clinical Data Warehouse.
Data Captured in All Huddles
During each huddle, we collected the number of patients whose alarms were discussed, patient characteristics, presence of nurses and physicians, and monitoring changes agreed upon. We then followed up 4 hours later to determine if changes were made at the bedside by examining monitor settings.
Data Captured Only During Intensive Data Collection Days
We randomly selected 1 day during each of the 16 weeks of the postimplementation period to obtain additional patient-level data. On each intensive data collection day, the 4 monitored patients on each intervention and control unit with the most high-acuity alarms in the 4 hours prior to huddles occurring — regardless of whether or not these patients were later discussed in huddles — were identified for data collection. On these dates, a member of the research team reviewed each patient’s alarm counts in 4-hour blocks during the 24 hours before and after the huddle. Given that the huddles were not always at the same time every day (ranging between 10:00 and 13:00), we operationally set the huddle time as 12:00 for all units.
Data Analysis
We used Stata/SE 14.2 for all analyses.
Unit-Level Alarm Rates
To compare unit-level rates, we performed an interrupted time series analysis using segmented (piecewise) regression to evaluate the impact of the intervention.19,20 We used a multivariable generalized estimating equation model with the negative binomial distribution21 and clustering by unit. We bootstrapped the model and generated percentile-based 95% confidence intervals. We then used the model to estimate the alarm rate difference in differences between the baseline data collection period and the postimplementation data collection period for intervention versus control units.
Patient-Level Alarm Rates
In contrast to unit-level analysis, we used an embedded cohort design to model the change in individual patients’ alarms between the 24 hours leading up to huddles and the 24 hours following huddles in patients who were versus patients who were not discussed in huddles. The analysis was restricted to the patients included in intensive data collection days. We performed bootstrapped linear regression and generated percentile-based 95% confidence intervals using the difference in 4-hour block alarm rate between pre- and posthuddle as the outcome. We clustered within patients. We stratified by unit and preceding alarm rate. We modeled the alarm rate difference between the 24-hour prehuddle and the 24-hour posthuddle for huddled and nonhuddled patients and the difference in differences between exposure groups.
Implementation Outcomes
We summarized adoption and fidelity using proportions.
RESULTS
Alarm dashboards informed 580 structured alarm discussions during 353 safety huddles (huddles often included discussion of more than one patient).
Unit-Level Alarm Rates
A total of 2,874,972 alarms occurred on the 8 units during the study period. We excluded 15,548 alarms that occurred during the same second as another alarm for the same patient because they generated a single alarm. We excluded 24,700 alarms that occurred during 4 days with alarm database downtimes that affected data integrity. Supplementary Table 2 summarizes the characteristics of the remaining 2,834,724 alarms used in the analysis.
Visually, alarm rates over time on each individual unit appeared flat despite the intervention (Supplementary Figure 3). Using piecewise regression, we found that intervention and control units had small increases in alarm rates between the baseline and postimplementation periods with a nonsignificant difference in these differences between the control and intervention groups (Table 1).
Patient-Level Alarm Rates
We then restricted the analysis to the patients whose data were collected during intensive data collection days. We obtained data from 1974 pre-post pairs of 4-hour time periods.
Patients on intervention and control units who were not discussed in huddles had 38 fewer alarms/patient-day (95% CI: 23–54 fewer, P < .001) in the posthuddle period than in the prehuddle period. Patients discussed in huddles had 135 fewer alarms/patient-day (95% CI: 93–178 fewer, P < .001) in the posthuddle 24-hour period than in the prehuddle period. The pairwise comparison reflecting the difference in differences showed that huddled patients had a rate of 97 fewer alarms/patient-day (95% CI: 52–138 fewer, P < .001) in the posthuddle period compared with patients not discussed in huddles.
To better understand the mechanism of reduction, we analyzed alarm rates for the patient categories shown in Table 2 and visually evaluated how average alarm rates changed over time (Figure 2). When analyzing the 6 potential pairwise comparisons between each of the 4 categories separately, we found that the following 2 comparisons were statistically significant: (1) patients whose alarms were discussed in huddles and had changes made to monitoring had greater alarm reductions than patients on control units, and (2) patients whose alarms were discussed in huddles and had changes made to monitoring had greater alarm reductions than patients who were also on intervention units but whose alarms were not discussed (Table 2).
Implementation Outcomes
Adoption
The patient’s nurse attended 482 of the 580 huddle discussions (83.1%), and at least one of the patient’s physicians (resident, fellow, or attending) attended 394 (67.9%).
Fidelity: Adherence
In addition to the 353 huddles that included alarm discussion, 123 instances had no patients with ≥20 high acuity alarms in the preceding 4 hours therefore, no data were brought to the huddle. There were an additional 30 instances when a huddle did not occur or there was no alarm discussion in the huddle despite data being available. Thus, adherence occurred in 353 of 383 huddles (92.2%).
Fidelity: Dose
During the 112 calendar day postimplementation period, 379 patients’ alarms were discussed in huddles for an average intervention dose of 0.85 discussions per unit per calendar day.
Fidelity: Quality of Delivery
In 362 of the 580 huddle discussions (62.4%), changes were agreed upon. The most frequently agreed upon changes were discontinuing monitoring (32.0%), monitoring only when asleep or unsupervised (23.8%), widening heart rate parameters (12.7%), changing electrocardiographic leads/wires (8.6%), changing the pulse oximetry probe (8.0%), and increasing the delay time between when oxygen desaturation was detected and when the alarm was generated (4.7%). Of the huddle discussions with changes agreed upon, 346 (95.6%) changes were enacted at the bedside.
Safety Measures
There were 0 code blue events and 26 rapid response team activations for patients discussed in huddles. None were related to the intervention.
Discussion
Our main finding was that the huddle strategy was effective in safely reducing the burden of alarms for the high alarm pediatric ward patients whose alarms were discussed, but it did not reduce unit-level alarm rates. Implementation outcomes explained this finding. Although adoption and adherence were high, the overall dose of the intervention was low.
We also found that 36% of alarms had technical causes, the majority of which were related to the pulse oximetry probe detecting that it was off the patient or searching for a pulse. Although these alarms are likely perceived differently by clinical staff (most monitors generate different sounds for technical alarms), they still represent a substantial contribution to the alarm environment. Minimizing them in patients who must remain continuously monitored requires more intensive effort to implement other types of interventions than the main focus of this study, such as changing pulse oximetry probes and electrocardiographic leads/wires.
In one-third of huddles, monitoring was simply discontinued. We observed in many cases that, while these patients may have had legitimate indications for monitoring upon admission, their conditions had improved; after brief multidisciplinary discussion, the team concluded that monitoring was no longer indicated. This observation may suggest interventions at the ordering phase, such as prespecifying a monitoring duration.22,23
This study’s findings were consistent with a quasi-experimental study of safety huddle-based alarm discussions in a pediatric intensive care unit that showed a patient-level reduction of 116 alarms per patient-day in those discussed in huddles relative to controls.11 A smaller quasi-experimental study of implementing a nighttime alarm “ward round” in an adult intensive care unit showed a significant reduction in unit-level alarms/patient-day from 168 to 84.9 In a quality improvement report, a monitoring care process bundle that included discussion of alarm settings showed a reduction in unit-level alarms/patient-day from 180 to 40.10 Our study strengthens the body of literature using a cluster-randomized design, measuring patient- and unit-level outcomes, and including implementation outcomes that explain effectiveness findings.
On a hypothetical unit similar to the ones we studied with 20 occupied beds and 60 alarms/patient-day, an average of 1200 alarms would occur each day. We delivered the intervention to 0.85 patients per day. Changes were made at the bedside in 60% of those with the intervention delivered, and those patients had a difference in differences of 119 fewer alarms compared with the comparison patients on control units. In this scenario, we could expect a relative reduction of 0.85 x 0.60 x 119 = 61 fewer alarms/day total on the unit or a 5% reduction. However, that estimated reduction did not account for the arrival of new patients with high alarm rates, which certainly occurred in this study and explained the lack of effect at the unit level.
As described above, the intervention dose was low, which translated into a lack of effect at the unit level despite a strong effect at the patient level. This result was partly due to the manual process required to produce the alarm dashboards that restricted their availability to nonholiday weekdays. The study was performed at one hospital, which limited generalizability. The study hospital was already convening daily safety huddles that were well attended by nurses and physicians. Other hospitals without existing huddle structures may face challenges in implementing similar multidisciplinary alarm discussions. In addition, the study design was randomized at the unit (rather than patient) level, which limited our ability to balance potential confounders at the patient level.
Conclusion
A safety huddle intervention strategy to drive alarm customization was effective in safely reducing alarms for individual children discussed. However, unit-level alarm rates were not affected by the intervention due to a low dose. Leaders of efforts to reduce alarms should consider beginning with passive interventions (such as changes to default settings and alarm delays) and use huddle-based discussion as a second-line intervention to address remaining patients with high alarm rates.
Acknowledgments
We thank Matthew MacMurchy, BA, for his assistance with data collection.
Funding/Support
This study was supported by a Young Investigator Award (Bonafide, PI) from the Academic Pediatric Association.
Role of the Funder/Sponsor
The Academic Pediatric Association had no role in the design or conduct of the study; collection, management, analysis, or interpretation of the data; preparation, review, or approval of the manuscript; or decision to submit for publication.
Disclosures
No relevant financial activities, aside from the grant funding from the Academic Pediatric Association listed above, are reported.
References
1. Schondelmeyer AC, Brady PW, Goel VV, et al. Physiologic monitor alarm rates at 5 children’s hospitals. J Hosp Med. 2018;In press. PubMed 2. Cvach M, Kitchens M, Smith K, Harris P, Flack MN. Customizing alarm limits based on specific needs of patients. Biomed Instrum Technol. 2017;51(3):227-234. PubMed 3. Bonafide CP, Lin R, Zander M, et al. Association between exposure to nonactionable physiologic monitor alarms and response time in a children’s hospital. J Hosp Med. 2015;10(6):345-351. PubMed 4. Bonafide CP, Localio AR, Holmes JH, et al. Video analysis of factors associated with response time to physiologic monitor alarms in a children’s hospital. JAMA Pediatr. 2017;171(6):524-531. PubMed 5. Lange K, Nowak M, Zoller R, Lauer W. Boundary conditions for safe detection of clinical alarms: An observational study to identify the cognitive and perceptual demands on an Intensive Care Unit. In: In: D. de Waard, K.A. Brookhuis, A. Toffetti, A. Stuiver, C. Weikert, D. Coelho, D. Manzey, A.B. Ünal, S. Röttger, and N. Merat (Eds.) Proceedings of the Human Factors and Ergonomics Society Europe Chapter 2015 Annual Conference. Groningen, Netherlands; 2016. 6. Westbrook JI, Li L, Hooper TD, Raban MZ, Middleton S, Lehnbom EC. Effectiveness of a ‘Do not interrupt’ bundled intervention to reduce interruptions during medication administration: a cluster randomised controlled feasibility study. BMJ Qual Saf. 2017;26:734-742. PubMed 7. Chopra V, McMahon LF Jr. Redesigning hospital alarms for patient safety: alarmed and potentially dangerous. JAMA. 2014;311(12):1199-1200. PubMed 8. Turmell JW, Coke L, Catinella R, Hosford T, Majeski A. Alarm fatigue: use of an evidence-based alarm management strategy. J Nurs Care Qual. 2017;32(1):47-54. PubMed 9. Koerber JP, Walker J, Worsley M, Thorpe CM. An alarm ward round reduces the frequency of false alarms on the ICU at night. J Intensive Care Soc. 2011;12(1):75-76. 10. Dandoy CE, Davies SM, Flesch L, et al. A team-based approach to reducing cardiac monitor alarms. Pediatrics. 2014;134(6):e1686-1694. PubMed 11. Dewan M, Wolfe H, Lin R, et al. Impact of a safety huddle–based intervention on monitor alarm rates in low-acuity pediatric intensive care unit patients. J Hosp Med. 2017;12(8):652-657. PubMed 12. Goldenhar LM, Brady PW, Sutcliffe KM, Muething SE. Huddling for high reliability and situation awareness. BMJ Qual Saf. 2013;22(11):899-906. PubMed 13. Brady PW, Muething S, Kotagal U, et al. Improving situation awareness to reduce unrecognized clinical deterioration and serious safety events. Pediatrics. 2013;131:e298-308. PubMed 14. Curran GM, Bauer M, Mittman B, Pyne JM, Stetler C. Effectiveness-implementation hybrid designs: combining elements of clinical effectiveness and implementation research to enhance public health impact. Med Care. 2012;50(3):217-226. PubMed 15. Damschroder LJ, Aron DC, Keith RE, Kirsh SR, Alexander JA, Lowery JC. Fostering implementation of health services research findings into practice: a consolidated framework for advancing implementation science. Implement Sci. 2009;4(1):50. PubMed 16. Proctor E, Silmere H, Raghavan R, et al. Outcomes for implementation research: conceptual distinctions, measurement challenges, and research agenda. Adm Policy Ment Health. 2011;38(2):65-76. PubMed 17. Allen JD, Linnan LA, Emmons KM. Fidelity and its relationship to implementation effectiveness, adaptation, and dissemination. In: Dissemination and Implementation Research in Health: Translating Science to Practice (Brownson RC, Proctor EK, Colditz GA Eds.). Oxford University Press; 2012:281-304. 18. Harris PA, Taylor R, Thielke R, Payne J, Gonzalez N, Conde JG. Research electronic data capture (REDCap)—a metadata-driven methodology and workflow process for providing translational research informatics support. J Biomed Inf. 2009;42:377-381. PubMed 19. Singer JD, Willett JB. Applied Longitudinal Data Analysis: Modeling Change and Event Occurrence. New York: Oxford University Press; 2003. 20. Wagner AK, Soumerai SB, Zhang F, Ross-Degnan D. Segmented regression analysis of interrupted time series studies in medication use research. J Clin Pharm Ther. 2002;27:299-309. PubMed 21. Gardner W, Mulvey EP, Shaw EC. Regression analyses of counts and rates: Poisson, overdispersed Poisson, and negative binomial models. Psychol Bull. 1995;118:392-404. PubMed 22. Dressler R, Dryer MM, Coletti C, Mahoney D, Doorey AJ. Altering overuse of cardiac telemetry in non-intensive care unit settings by hardwiring the use of American Heart Association guidelines. JAMA Intern Med. 2014;174(11):1852-1854. PubMed 23. Boggan JC, Navar-Boggan AM, Patel V, Schulteis RD, Simel DL. Reductions in telemetry order duration do not reduce telemetry utilization. J Hosp Med. 2014;9(12):795-796. PubMed
Christopher P. Bonafide, MD, MSCE, Children’s Hospital of Philadelphia, 34th St and Civic Center Blvd, Suite 12NW80, Philadelphia, PA 19104; Telephone: 267-426-2901; Email: [email protected]
Content Gating
Gated (full article locked unless allowed per User)
Alternative CME
Disqus Comments
Default
Gate On Date
Tue, 03/13/2018 - 06:00
Un-Gate On Date
Tue, 02/27/2018 - 06:00
Consolidated Pubs: Do Not Show Source Publication Logo
On general medical wards, effective interprofessional communication is essential for high-quality patient care. Hospitals increasingly adopt secure text-messaging systems for healthcare team members to communicate with physicians in lieu of paging.1-3 Text messages facilitate bidirectional communication4,5 and increase perceived efficiency6-8 and are thus preferred over paging by nurses and trainees. However, this novel technology unintentionally causes high volumes of interruptions.9,10 Compared to paging, sending text messages and calling smartphones are more convenient and encourage communication of issues in real time, regardless of urgency.11 Interrupting messages are often perceived as nonurgent by physicians.6,12 In particular, 73%-93% of pages or messages sent to physicians are found to be nonurgent.13-17
Pages, text messages, or calls not only interrupt day-to-day tasks on the ward6,7,10,11,17,18 but also educational sessions,18-21 which are essential to the clinical teaching unit (CTU). Interruptions reduce learning and retention22 and are disruptive to the medical learning climate.18-20,23
Internal medicine CTUs at our large urban academic hospital network utilize a smartphone-based text messaging tool for interdisciplinary communication. Nonurgent interruptions are frequent during educational seminars, which occur at our institution between 8 AM and 9 AM and 12 PM and 1 PM on weekdays.10,11,19 In a preliminary analysis at one hospital site, an average of three text messages (range 1-11), 2 calls (range 0-8), and 3 emails (range 0-13) interrupted each educational session. Physicians and nurses can disagree on the urgency of messages or calls for the purposes of patient care and workflow.6,11,12,24 Nurses have expressed a desire for guidance regarding what constitutes an urgent clinical communication.6
This project aimed to reduce nonurgent text message interruptions during educational rounds. We hypothesized that improved decision support around clinical prioritization and reminders about educational hours could reduce unnecessary interruptions.
METHODS
This study was approved by the institution’s Research Ethics Board and conducted across 8 general medical CTU teams at an academic hospital network (Sites 1 and 2). Each CTU team provides 24-hour coverage of approximately 20–28 patients. The most responsible resident from each team carries an institution-provided smartphone, which receives secure texts, phone calls, and emails from nurses, social workers, physiotherapists, speech language pathologists, dieticians, pharmacists, and other physicians. Close collaboration with the platform developer permitted changes to be made to the system when needed. Prior to our interventions, a nurse could send a text message as either an “immediate interrupt” or a “delayed interrupt” message. Messages sent via the “delayed interrupt” option would be added to a queue and would eventually lead to an interrupting message if not replied to after a defined period. Direct phone calls were reserved for especially urgent or emergent communications.
Meetings were held with physicians and nursing managers at Site 1 (August 2014) and Site 2 (January 2015) to establish consensus on the communication process and determine clinical scenarios, regardless of time of day, that warrant a phone call, an “immediate interrupt” text, or a “delayed interrupt” text. In March 2015, resident feedback led to the addition of a third option to the sender interface. This option allowed messages to be sent as “For Your Information (FYI)” only, which would not lead to an interruption. “FYI” messages (for example, to notify that an ambulance had been booked for a patient), were instead placed in an electronic message board that could be viewed by the resident through the application. This change relied upon interdisciplinary trust and a commitment from residents to ensure that “FYI” messages were reviewed regularly.
Communication guidelines were transformed into poster format and displayed as a reference at nursing stations in July 2015 (Site 2) and February 2016 (Site 1; Figure 1). Nurse managers audited messages from nurses and provided feedback. In March 2016, a focused intervention was piloted across both sites to specifically limit nonurgent text messages during educational hours. First, educational hours were emphasized within the interface to make senders aware of their potential for interruption. In June 2016, the interface was further modified. Once the message application was opened during a defined educational time, an imbedded notification advised the sender to reevaluate the urgency of the communication and if appropriate, to delay sending the message until educational rounds were over or send an “FYI” message. This “alert” did not impede senders from sending a message through the system at any time (Figure 2A-D illustrates the evolution of the message interface).
Text interruptions (January 2014 to December 2016), phone calls (April 2015-December 2016), and emails (October 2014 to December 2016) received by team smartphones during educational hours were tracked. Total text messages sent over a 24-hour period and the type of message (“immediate interrupt,” “delayed interrupt,” and “FYI”) were also monitored. Calls were encouraged only in the case of emergent patient care matters, and monitoring calls would thus help identify whether senders bypass the message system due to deterioration in patient status or confusion surrounding the new message interface. Emails sent to team smartphones came from a variety of sources, including hospital administration, physicians, and patient flow coordinators who are not involved in direct patient care. Emails served as a “negative control” because of the predicted random variability in the email interruption frequency. Additional balancing measures included tracking Critical Care Outreach Team consultations and “Code Blue” (cardiac arrest) announcements over the same period to ensure that limiting educational interruptions did not result in increased deterioration of patient status.
Statistical process control charts (u charts) assessed the frequency of each type of educational interruption (text, call, or email) per team on a monthly basis. The total educational interruptions per month were divided by the number of educational hours per month to account for variation in educational hours each month (for example, during holidays when educational rounds do not take place). If call logs or email data were unavailable for individual teams or time periods, then the denominator was adjusted to reflect the number of teams and educational hours in the sample for that month.
Two 4-week samples of interrupting text messages received by the 8 teams during educational hours were deidentified, analyzed, and compared in terms of content and urgency. A preintervention sample (November 17 to December 14, 2014) was compared to a postintervention sample (November 14 to December 11, 2016). Messages from the 2014 and 2016 samples were randomized, deidentified for date and time, and analyzed for urgency by 3 independent adjudicators (2 senior residents and 1 staff physician) to avoid biasing the postintervention analysis toward improvement. Messages were classified as “urgent” if the adjudicator felt a response or action was required within 1 hour. Messages not meeting these criteria were classified as “nonurgent” or “indeterminate” if the urgency of the message could not be assessed because it required further context. Fleiss kappa statistic evaluated agreement among adjudicators. Individual urgency designations were compared for each message, and discrepant rankings were addressed through repeated joint assessments. Disagreements were resolved through discussion and comparison against communication guidelines. In addition, messages reporting a “critical lab,” requiring physician notification as per institutional policy, were reclassified as “urgent.” The proportion of “nonurgent” messages sent during educational hours was compared between baseline and post-intervention periods using the Chi-square test.
“FYI” messages sent from November 14 to December 11, 2016 were audited using the same adjudication process to determine if “FYI” designations were appropriate and did not contain urgent patient care communications.
RESULTS
Total text messages sent to team smartphones, the type of message the sender intended (“immediate interrupt,” “delayed interrupt,” or “FYI”), and total text interruptions received by the resident over the study period are illustrated in Figure 3. The introduction of the “FYI” message in March 2015 was associated with reduced text message interruptions, from a mean of 18.0 (95% CI, 17.2 to18.8) interrupting messages per team per day to 14.1 (95% CI, 13.6 to14.5) in March 2015 and 12.7 (95% CI, 12.2 to 13.2) after May 2016 (Supplemental Figure 1). The numbers of “delayed interrupt” and “FYI” messages increased over time.
Analysis of text interruptions during educational hours indicated 3 distinct phases (Figure 4). A mean of 0.92 (95% CI 0.88 to 0.97) text interruptions per team per educational hour was found during the first phase (January 2014 to July 2015). The message frequency decreased to a mean of 0.81 (95% CI, 0.77 to 0.84) messages per team per educational hour starting August 2015, following the implementation of the “FYI” message option for senders (March 2015) and dissemination of communication guidelines (July 2015). Finally, a further reduction to a mean of 0.59 (95% CI, 0.51 to 0.67) messages per team per educational hour began in June 2016 after the creation of the alert message that reminded senders of educational hours (March 2016, modified June 2016). Change in the interruption frequency was sustained over the following 6 months to the end of the observation period in December 2016.
Incoming phone call logs were available from April 2015 to December 2016, with a mean of 0.62 (95% CI, 0.56 to 0.67) calls per team per educational hour, which did not change over the study period (Supplementary Figure 2). The overall number of calls to team smartphones also did not change during the measurement period. Incoming email data were available from October 2014 to December 2016, with a mean of 0.94 (95% CI, 0.88 to 1.0) emails per team per educational hour, which did not change over the study period (Supplementary Figure 3). Internal medicine service discharges, “Code Blue” announcements, and Critical Care Outreach Team consultations remained stable over the measurement period.
Independent ranking of the combined 4-week samples of educational text interruptions from 2014 and 2016 revealed an initial 3-way agreement on 257/455 (56%) messages (Fleiss Kappa 0.298, fair agreement), which increased to 405/455 (89%) messages after the first joint assessment and reached full consensus after a third joint assessment that included classifying all messages that communicated institution-defined “critical lab” values as “urgent.”
Overall, 71 (16%) messages were classified as “urgent,” 346 (76%) as “nonurgent,” and 38 (8%) as “indeterminate.” After unblinding of the message date and time, 273 text messages were received during the baseline measurement period (November 17 to December 14, 2014) and 182 messages were received during the equivalent time period 2 years later (November 14 to December 11, 2016), consistent with the reduced volume of educational interruptions observed (Figure 4). A total of 426 (94%) messages were sent by nurses, and the remaining ones were sent by pharmacists (n = 20), ward clerks (n = 3), social workers (n = 4), speech language pathologist (n = 1), or device administrator (n = 1).
The proportion of “nonurgent” messages decreased from 223/273 (82%) in 2014 to 123/182 (68%) in 2016 (P ≤ .01). Although the absolute number of urgent messages remained similar (33 in 2014 and 38 in 2016), the proportion of “urgent” messages increased from 12% to 21% of the total messages received (P = .02). Seventeen (6%) messages had indeterminate frequency in 2014 compared to 21 (11.5%) in 2016 (NS).
An audit of consecutive “FYI” messages (November 14-December 11, 2016) revealed an initial agreement in 384/431 (89%), reaching full consensus after repeated joint assessments. A total of 406 (94%) “FYI” messages were appropriately sent, while 10 (2%) represented urgent communications that should have been sent as interruptions. In 15 (4%) cases, the appropriateness of the message was indeterminate.
DISCUSSION
Sequential interventions over a 36-month period were associated with reduced nonurgent text message interruptions during educational hours. A clinical communication process was formally defined to accurately match message urgency with communication modality. A “noninterrupt” option allowed nonurgent text messages to be posted to an electronic message board, rather than causing real-time interruption, thereby reducing the overall volume of interrupting text messages. Modifying the interface to alert potential senders to protected educational hours was associated with reductions in educational interruptions. Through a blinded analysis of the text message content between 2014 and 2016, we determined that nonurgent educational interruptions were significantly reduced, and the number of urgent communications remained constant. Reduced nonurgent interruptions have the potential to improve the learning climate on the medical teaching unit during protected educational hours.
At baseline, 82% of the sampled text messages sent during educational hours across both sites were considered nonurgent. The estimated proportion of urgent messages varies in the literature (5%-34%)13-18 possibly due to center-specific methods of defining and measuring urgent messages. For example, different assessor training backgrounds, different numbers of assessors, and varying institutional policies are described.13-17 We considered an urgent message to require a response or action within 1 hour or to represent an established “critical lab value” as per the institution. The high proportion of nonurgent interruptions found in this study and other works demonstrates the widespread nature of this problem within inpatient hospital settings; this phenomenon could potentially lead to unintended consequences on efficiency and medical education.
Few other initiatives have aimed to reduce interruptions to medical trainees during educational sessions. At one center, replacing numeric pagers with alphanumeric pagers decreased the need to return pages during educational sessions but did not decrease the overall number of pages.21 Another center implemented an inbox tool that reduced daytime nonurgent numeric pages.15 Similar to our center’s previous experience,11 the total number of communications increased with the creation of the inbox tool.15 Unexpectedly, the introduction of an “FYI” option for senders in March 2015 did not increase the total number of messages.
Increasing use of text messages for communication between physicians and allied health professions has resulted in higher volumes of interruptions compared with conventional paging.6,7,9 Excessive interruptions create a “crisis mode” work climate,10 which could compromise patient safety25-27 and hamper trainees’ attainment of educational objectives.18-20,23 During educational sessions, audible text, phone call, and email interruptions disrupt all learners in addition to the resident receiving the message. The creation of the “FYI” message option in March 2015 was associated with reduced overall daily interruptions, which may improve efficiency in residents’ clinical duties17,18 and minimize multi-tasking that could lead to errors.28 However, adding a real-time notification during educational hours (March 2016, modified June 2016) exerted the greatest impact specifically on educational interruptions. Engaging physicians in the creation and ongoing modification of instant-messaging interfaces can help customize technology to meet the needs of users.15,29 Our work provides a strategy for improving communication between nurses and physicians in a teaching hospital setting, by achieving consensus on levels of urgency of different messages, providing a non-interrupting message option, and providing nurses with real-time information about educational hours.
Potential unintended consequences of the interventions require consideration. Discouraging interruptions may have reduced urgent patient care communications but were mitigated by enabling senders to ignore/override interruption warnings. We did not observe an increase in the number of overall calls to team devices, “Code Blues,” or critical care team consultations. However, we found that a very small (2%) but important group of “FYI” messages should have been sent as urgent interrupting messages, thereby underscoring the necessity for continuous feedback to senders on the clinical communication process.
Our study has limitations. Although educational interruptions can cause fragmented learning at our institution,19 the impact of reduced interruptions on the quality of educational sessions can only be inferred because we did not formally assess resident or staff physician perceptions on this outcome during the interventions. Moreover, we were unable to quantify interruptions received through personal smartphones, a frequent method of physician-physician communication.30 Phone calls are the most intrusive of interruptions but were not the focus of interventions. Future work must consider documenting perceived appropriateness of calls in real time, similar to previous studies assessing paging urgency.13,14,18 Biased ranking of message urgency was minimized by utilizing 3 independent adjudicators blinded to message date throughout the adjudication process and by applying established communication guidelines where available. Nevertheless, retrospective assessment of message urgency could be limited by a lack of clinical context, which may have been more apparent to the original sender and the recipient. Finally, at our center, a close relationship with the communication platform programmer made sequential modifications possible, while other institutions may have limited ability to make such changes. A different approach may be useful in some cases, such as modifying academic teaching times to limit interruptions.23
In a large academic center, a high number of interrupting smartphone messages cause unnecessary distractions and reduce learning during educational hours. “Nonurgent” educational interruptions were reduced through successive improvement cycles, and ultimately by modifying the program interface to alert senders of educational hours. Further reduction in interruptions and sustainability may be achieved by studying phone call interruptions and by formalizing audit and feedback of sender’s adherence to standardized clinical communication methods.
ACKNOWLEDGMENT
Dr. Wu is supported by an award from the Mak Pak Chiu and Mak-Soo Lai Hing Chair in General Internal Medicine, University of Toronto. The authors would like to acknowledge Jason Uppal for his ongoing contribution to the improvement of clinical text message communications at our institution.
Disclosures
The authors have nothing to disclose.
References
1. Wu R, Lo V, Morra D, et al. A smartphone-enabled communication system to improve hospital communication: usage and perceptions of medical trainees and nurses on general internal medicine wards. J Hosp Med. 2015;10(2):83-89. PubMed 2. Smith CN, Quan SD, Morra D, et al. Understanding interprofessional communication: a content analysis of email communications between doctors and nurses. Appl Clin Inform. 2012;3(1):38-51. PubMed 3. Frizzell JD, Ahmed B. Text messaging versus paging: new technology for the next generation. J Am Coll Cardiol. 2014;64(24):2703-2705. PubMed 4. Wu RC, Morra D, Quan S, et al. The use of smartphones for clinical communication on internal medicine wards. J Hosp Med. 2010;5(9):553-559. PubMed 5. Ighani F, Kapoor KG, Gibran SK, et al. A comparison of two-way text versus conventional paging systems in an academic ophthalmology department. J Med Syst. 2010;34(4):677-684. PubMed 6. Wu R, Rossos P, Quan S, et al. An evaluation of the use of smartphones to communicate between clinicians: a mixed-methods study. J Med Internet Res. 2011;13(3):e59. PubMed 7. Wu RC, Lo V, Morra D, et al. The intended and unintended consequences of communication systems on general internal medicine inpatient care delivery: a prospective observational case study of five teaching hospitals. J Am Med Inform Assoc. 2013;20(4):766-777. PubMed 8. Patel N, Siegler JE, Stromberg N, Ravitz N, Hanson CW. Perfect storm of inpatient communication needs and an innovative solution utilizing smartphones and secured messaging. Appl Clin Inform. 2016;7(3):777-789. PubMed 9. Aungst TD, Belliveau P. Leveraging mobile smart devices to improve interprofessional communications in inpatient practice setting: A literature review. J Interprof Care. 2015;29(6):570-578. PubMed 10. Vaisman A, Wu RC. Analysis of Smartphone Interruptions on Academic General Internal Medicine Wards. Frequent Interruptions may cause a ‘Crisis Mode’ Work Climate. Appl Clin Inform. 2017;8(1):1-11. PubMed 11. Quan SD, Wu RC, Rossos PG, et al. It’s not about pager replacement: an in-depth look at the interprofessional nature of communication in healthcare. J Hosp Med. 2013;8(3):137-143. PubMed 12. Quan SD, Morra D, Lau FY, et al. Perceptions of urgency: defining the gap between what physicians and nurses perceive to be an urgent issue. Int J Med Inform. 2013;82(5):378-386. PubMed 13. Katz MH, Schroeder SA. The sounds of the hospital. Paging patterns in three teaching hospitals. N Engl J Med. 1988;319(24):1585-1589. PubMed 14. Patel R, Reilly K, Old A, Naden G, Child S. Appropriate use of pagers in a New Zealand tertiary hospital. N Z Med J. 2006;119(1231):U1912. PubMed 15. Ferguson A, Aaronson B, Anuradhika A. Inbox messaging: an effective tool for minimizing non-urgent paging related interruptions in hospital medicine provider workflow. BMJ Qual Improv Rep. 2016;5(1):u215856.w7316. PubMed 16. Luxenberg A, Chan B, Khanna R, Sarkar U. Efficiency and interpretability of text paging communication for medical inpatients: A mixed-methods analysis. JAMA Intern Med. 2017;177(8):1218-1220. PubMed 17. Ly T, Korb-Wells CS, Sumpton D, Russo RR, Barnsley L. Nature and impact of interruptions on clinical workflow of medical residents in the inpatient setting. J Grad Med Educ. 2013;5(2):232-237. PubMed 18. Blum NJ, Lieu TA. Interrupted care. The effects of paging on pediatric resident activities. Am J Dis Child. 1992;146(7):806-808. PubMed 19. Wu RC, Tzanetos K, Morra D, Quan S, Lo V, Wong BM. Educational impact of using smartphones for clinical communication on general medicine: more global, less local. J Hosp Med. 2013;8(7):365-372. PubMed 20. Katz-Sidlow RJ, Ludwig A, Miller S, Sidlow R. Smartphone use during inpatient attending rounds: prevalence, patterns and potential for distraction. J Hosp Med. 2012;7(8):595-599. PubMed 21. Wong BM, Quan S, Shadowitz S, Etchells E. Implementation and evaluation of an alpha-numeric paging system on a resident inpatient teaching service. J Hosp Med. 2009;4(8):E34-E40. PubMed 22. Conard MA MR. Interest level improves learning but does not moderate the effects of interruptions: An experiment using simultaneous multitasking. Learn Individ Differ. 2014;30:112-117. 23. Zastoupil L, McIntosh A, Sopfe J, et al. Positive impact of transition from noon conference to academic half day in a pediatric residency program. Acad Pediatr. 2017;17(4):436-442. PubMed 24. Lo V, Wu RC, Morra D, Lee L, Reeves S. The use of smartphones in general and internal medicine units: a boon or a bane to the promotion of interprofessional collaboration? J Interprof Care. 2012;26(4):276-282. PubMed 25. Patterson ME, Bogart MS, Starr KR. Associations between perceived crisis mode work climate and poor information exchange within hospitals. J Hosp Med. 2015;10(3):152-159. PubMed 26. Laxmisan A, Hakimzada F, Sayan OR, Green RA, Zhang J, Patel VL. The multitasking clinician: decision-making and cognitive demand during and after team handoffs in emergency care. Int J Med Inform. 2007;76(11-12):801-811. PubMed 27. Westbrook JI, Woods A, Rob MI, Dunsmuir WT, Day RO. Association of interruptions with an increased risk and severity of medication administration errors. Arch Intern Med. 2010;170(8):683-690. PubMed 28. Collins S, Currie L, Patel V, Bakken S, Cimino JJ. Multitasking by clinicians in the context of CPOE and CIS use. Stud Health Technol Inform. 2007;129(Pt 2):958-962. PubMed 29. Huang ME. It is from mars and physicians from venus: Bridging the gap. PM R. 2017;9(5S):S19-S25. PubMed 30. Tran K, Morra D, Lo V, Quan S, Wu R. The use of smartphones on General Internal Medicine wards: A mixed methods study. Appl Clin Inform. 2014;5(3):814-823. PubMed
On general medical wards, effective interprofessional communication is essential for high-quality patient care. Hospitals increasingly adopt secure text-messaging systems for healthcare team members to communicate with physicians in lieu of paging.1-3 Text messages facilitate bidirectional communication4,5 and increase perceived efficiency6-8 and are thus preferred over paging by nurses and trainees. However, this novel technology unintentionally causes high volumes of interruptions.9,10 Compared to paging, sending text messages and calling smartphones are more convenient and encourage communication of issues in real time, regardless of urgency.11 Interrupting messages are often perceived as nonurgent by physicians.6,12 In particular, 73%-93% of pages or messages sent to physicians are found to be nonurgent.13-17
Pages, text messages, or calls not only interrupt day-to-day tasks on the ward6,7,10,11,17,18 but also educational sessions,18-21 which are essential to the clinical teaching unit (CTU). Interruptions reduce learning and retention22 and are disruptive to the medical learning climate.18-20,23
Internal medicine CTUs at our large urban academic hospital network utilize a smartphone-based text messaging tool for interdisciplinary communication. Nonurgent interruptions are frequent during educational seminars, which occur at our institution between 8 AM and 9 AM and 12 PM and 1 PM on weekdays.10,11,19 In a preliminary analysis at one hospital site, an average of three text messages (range 1-11), 2 calls (range 0-8), and 3 emails (range 0-13) interrupted each educational session. Physicians and nurses can disagree on the urgency of messages or calls for the purposes of patient care and workflow.6,11,12,24 Nurses have expressed a desire for guidance regarding what constitutes an urgent clinical communication.6
This project aimed to reduce nonurgent text message interruptions during educational rounds. We hypothesized that improved decision support around clinical prioritization and reminders about educational hours could reduce unnecessary interruptions.
METHODS
This study was approved by the institution’s Research Ethics Board and conducted across 8 general medical CTU teams at an academic hospital network (Sites 1 and 2). Each CTU team provides 24-hour coverage of approximately 20–28 patients. The most responsible resident from each team carries an institution-provided smartphone, which receives secure texts, phone calls, and emails from nurses, social workers, physiotherapists, speech language pathologists, dieticians, pharmacists, and other physicians. Close collaboration with the platform developer permitted changes to be made to the system when needed. Prior to our interventions, a nurse could send a text message as either an “immediate interrupt” or a “delayed interrupt” message. Messages sent via the “delayed interrupt” option would be added to a queue and would eventually lead to an interrupting message if not replied to after a defined period. Direct phone calls were reserved for especially urgent or emergent communications.
Meetings were held with physicians and nursing managers at Site 1 (August 2014) and Site 2 (January 2015) to establish consensus on the communication process and determine clinical scenarios, regardless of time of day, that warrant a phone call, an “immediate interrupt” text, or a “delayed interrupt” text. In March 2015, resident feedback led to the addition of a third option to the sender interface. This option allowed messages to be sent as “For Your Information (FYI)” only, which would not lead to an interruption. “FYI” messages (for example, to notify that an ambulance had been booked for a patient), were instead placed in an electronic message board that could be viewed by the resident through the application. This change relied upon interdisciplinary trust and a commitment from residents to ensure that “FYI” messages were reviewed regularly.
Communication guidelines were transformed into poster format and displayed as a reference at nursing stations in July 2015 (Site 2) and February 2016 (Site 1; Figure 1). Nurse managers audited messages from nurses and provided feedback. In March 2016, a focused intervention was piloted across both sites to specifically limit nonurgent text messages during educational hours. First, educational hours were emphasized within the interface to make senders aware of their potential for interruption. In June 2016, the interface was further modified. Once the message application was opened during a defined educational time, an imbedded notification advised the sender to reevaluate the urgency of the communication and if appropriate, to delay sending the message until educational rounds were over or send an “FYI” message. This “alert” did not impede senders from sending a message through the system at any time (Figure 2A-D illustrates the evolution of the message interface).
Text interruptions (January 2014 to December 2016), phone calls (April 2015-December 2016), and emails (October 2014 to December 2016) received by team smartphones during educational hours were tracked. Total text messages sent over a 24-hour period and the type of message (“immediate interrupt,” “delayed interrupt,” and “FYI”) were also monitored. Calls were encouraged only in the case of emergent patient care matters, and monitoring calls would thus help identify whether senders bypass the message system due to deterioration in patient status or confusion surrounding the new message interface. Emails sent to team smartphones came from a variety of sources, including hospital administration, physicians, and patient flow coordinators who are not involved in direct patient care. Emails served as a “negative control” because of the predicted random variability in the email interruption frequency. Additional balancing measures included tracking Critical Care Outreach Team consultations and “Code Blue” (cardiac arrest) announcements over the same period to ensure that limiting educational interruptions did not result in increased deterioration of patient status.
Statistical process control charts (u charts) assessed the frequency of each type of educational interruption (text, call, or email) per team on a monthly basis. The total educational interruptions per month were divided by the number of educational hours per month to account for variation in educational hours each month (for example, during holidays when educational rounds do not take place). If call logs or email data were unavailable for individual teams or time periods, then the denominator was adjusted to reflect the number of teams and educational hours in the sample for that month.
Two 4-week samples of interrupting text messages received by the 8 teams during educational hours were deidentified, analyzed, and compared in terms of content and urgency. A preintervention sample (November 17 to December 14, 2014) was compared to a postintervention sample (November 14 to December 11, 2016). Messages from the 2014 and 2016 samples were randomized, deidentified for date and time, and analyzed for urgency by 3 independent adjudicators (2 senior residents and 1 staff physician) to avoid biasing the postintervention analysis toward improvement. Messages were classified as “urgent” if the adjudicator felt a response or action was required within 1 hour. Messages not meeting these criteria were classified as “nonurgent” or “indeterminate” if the urgency of the message could not be assessed because it required further context. Fleiss kappa statistic evaluated agreement among adjudicators. Individual urgency designations were compared for each message, and discrepant rankings were addressed through repeated joint assessments. Disagreements were resolved through discussion and comparison against communication guidelines. In addition, messages reporting a “critical lab,” requiring physician notification as per institutional policy, were reclassified as “urgent.” The proportion of “nonurgent” messages sent during educational hours was compared between baseline and post-intervention periods using the Chi-square test.
“FYI” messages sent from November 14 to December 11, 2016 were audited using the same adjudication process to determine if “FYI” designations were appropriate and did not contain urgent patient care communications.
RESULTS
Total text messages sent to team smartphones, the type of message the sender intended (“immediate interrupt,” “delayed interrupt,” or “FYI”), and total text interruptions received by the resident over the study period are illustrated in Figure 3. The introduction of the “FYI” message in March 2015 was associated with reduced text message interruptions, from a mean of 18.0 (95% CI, 17.2 to18.8) interrupting messages per team per day to 14.1 (95% CI, 13.6 to14.5) in March 2015 and 12.7 (95% CI, 12.2 to 13.2) after May 2016 (Supplemental Figure 1). The numbers of “delayed interrupt” and “FYI” messages increased over time.
Analysis of text interruptions during educational hours indicated 3 distinct phases (Figure 4). A mean of 0.92 (95% CI 0.88 to 0.97) text interruptions per team per educational hour was found during the first phase (January 2014 to July 2015). The message frequency decreased to a mean of 0.81 (95% CI, 0.77 to 0.84) messages per team per educational hour starting August 2015, following the implementation of the “FYI” message option for senders (March 2015) and dissemination of communication guidelines (July 2015). Finally, a further reduction to a mean of 0.59 (95% CI, 0.51 to 0.67) messages per team per educational hour began in June 2016 after the creation of the alert message that reminded senders of educational hours (March 2016, modified June 2016). Change in the interruption frequency was sustained over the following 6 months to the end of the observation period in December 2016.
Incoming phone call logs were available from April 2015 to December 2016, with a mean of 0.62 (95% CI, 0.56 to 0.67) calls per team per educational hour, which did not change over the study period (Supplementary Figure 2). The overall number of calls to team smartphones also did not change during the measurement period. Incoming email data were available from October 2014 to December 2016, with a mean of 0.94 (95% CI, 0.88 to 1.0) emails per team per educational hour, which did not change over the study period (Supplementary Figure 3). Internal medicine service discharges, “Code Blue” announcements, and Critical Care Outreach Team consultations remained stable over the measurement period.
Independent ranking of the combined 4-week samples of educational text interruptions from 2014 and 2016 revealed an initial 3-way agreement on 257/455 (56%) messages (Fleiss Kappa 0.298, fair agreement), which increased to 405/455 (89%) messages after the first joint assessment and reached full consensus after a third joint assessment that included classifying all messages that communicated institution-defined “critical lab” values as “urgent.”
Overall, 71 (16%) messages were classified as “urgent,” 346 (76%) as “nonurgent,” and 38 (8%) as “indeterminate.” After unblinding of the message date and time, 273 text messages were received during the baseline measurement period (November 17 to December 14, 2014) and 182 messages were received during the equivalent time period 2 years later (November 14 to December 11, 2016), consistent with the reduced volume of educational interruptions observed (Figure 4). A total of 426 (94%) messages were sent by nurses, and the remaining ones were sent by pharmacists (n = 20), ward clerks (n = 3), social workers (n = 4), speech language pathologist (n = 1), or device administrator (n = 1).
The proportion of “nonurgent” messages decreased from 223/273 (82%) in 2014 to 123/182 (68%) in 2016 (P ≤ .01). Although the absolute number of urgent messages remained similar (33 in 2014 and 38 in 2016), the proportion of “urgent” messages increased from 12% to 21% of the total messages received (P = .02). Seventeen (6%) messages had indeterminate frequency in 2014 compared to 21 (11.5%) in 2016 (NS).
An audit of consecutive “FYI” messages (November 14-December 11, 2016) revealed an initial agreement in 384/431 (89%), reaching full consensus after repeated joint assessments. A total of 406 (94%) “FYI” messages were appropriately sent, while 10 (2%) represented urgent communications that should have been sent as interruptions. In 15 (4%) cases, the appropriateness of the message was indeterminate.
DISCUSSION
Sequential interventions over a 36-month period were associated with reduced nonurgent text message interruptions during educational hours. A clinical communication process was formally defined to accurately match message urgency with communication modality. A “noninterrupt” option allowed nonurgent text messages to be posted to an electronic message board, rather than causing real-time interruption, thereby reducing the overall volume of interrupting text messages. Modifying the interface to alert potential senders to protected educational hours was associated with reductions in educational interruptions. Through a blinded analysis of the text message content between 2014 and 2016, we determined that nonurgent educational interruptions were significantly reduced, and the number of urgent communications remained constant. Reduced nonurgent interruptions have the potential to improve the learning climate on the medical teaching unit during protected educational hours.
At baseline, 82% of the sampled text messages sent during educational hours across both sites were considered nonurgent. The estimated proportion of urgent messages varies in the literature (5%-34%)13-18 possibly due to center-specific methods of defining and measuring urgent messages. For example, different assessor training backgrounds, different numbers of assessors, and varying institutional policies are described.13-17 We considered an urgent message to require a response or action within 1 hour or to represent an established “critical lab value” as per the institution. The high proportion of nonurgent interruptions found in this study and other works demonstrates the widespread nature of this problem within inpatient hospital settings; this phenomenon could potentially lead to unintended consequences on efficiency and medical education.
Few other initiatives have aimed to reduce interruptions to medical trainees during educational sessions. At one center, replacing numeric pagers with alphanumeric pagers decreased the need to return pages during educational sessions but did not decrease the overall number of pages.21 Another center implemented an inbox tool that reduced daytime nonurgent numeric pages.15 Similar to our center’s previous experience,11 the total number of communications increased with the creation of the inbox tool.15 Unexpectedly, the introduction of an “FYI” option for senders in March 2015 did not increase the total number of messages.
Increasing use of text messages for communication between physicians and allied health professions has resulted in higher volumes of interruptions compared with conventional paging.6,7,9 Excessive interruptions create a “crisis mode” work climate,10 which could compromise patient safety25-27 and hamper trainees’ attainment of educational objectives.18-20,23 During educational sessions, audible text, phone call, and email interruptions disrupt all learners in addition to the resident receiving the message. The creation of the “FYI” message option in March 2015 was associated with reduced overall daily interruptions, which may improve efficiency in residents’ clinical duties17,18 and minimize multi-tasking that could lead to errors.28 However, adding a real-time notification during educational hours (March 2016, modified June 2016) exerted the greatest impact specifically on educational interruptions. Engaging physicians in the creation and ongoing modification of instant-messaging interfaces can help customize technology to meet the needs of users.15,29 Our work provides a strategy for improving communication between nurses and physicians in a teaching hospital setting, by achieving consensus on levels of urgency of different messages, providing a non-interrupting message option, and providing nurses with real-time information about educational hours.
Potential unintended consequences of the interventions require consideration. Discouraging interruptions may have reduced urgent patient care communications but were mitigated by enabling senders to ignore/override interruption warnings. We did not observe an increase in the number of overall calls to team devices, “Code Blues,” or critical care team consultations. However, we found that a very small (2%) but important group of “FYI” messages should have been sent as urgent interrupting messages, thereby underscoring the necessity for continuous feedback to senders on the clinical communication process.
Our study has limitations. Although educational interruptions can cause fragmented learning at our institution,19 the impact of reduced interruptions on the quality of educational sessions can only be inferred because we did not formally assess resident or staff physician perceptions on this outcome during the interventions. Moreover, we were unable to quantify interruptions received through personal smartphones, a frequent method of physician-physician communication.30 Phone calls are the most intrusive of interruptions but were not the focus of interventions. Future work must consider documenting perceived appropriateness of calls in real time, similar to previous studies assessing paging urgency.13,14,18 Biased ranking of message urgency was minimized by utilizing 3 independent adjudicators blinded to message date throughout the adjudication process and by applying established communication guidelines where available. Nevertheless, retrospective assessment of message urgency could be limited by a lack of clinical context, which may have been more apparent to the original sender and the recipient. Finally, at our center, a close relationship with the communication platform programmer made sequential modifications possible, while other institutions may have limited ability to make such changes. A different approach may be useful in some cases, such as modifying academic teaching times to limit interruptions.23
In a large academic center, a high number of interrupting smartphone messages cause unnecessary distractions and reduce learning during educational hours. “Nonurgent” educational interruptions were reduced through successive improvement cycles, and ultimately by modifying the program interface to alert senders of educational hours. Further reduction in interruptions and sustainability may be achieved by studying phone call interruptions and by formalizing audit and feedback of sender’s adherence to standardized clinical communication methods.
ACKNOWLEDGMENT
Dr. Wu is supported by an award from the Mak Pak Chiu and Mak-Soo Lai Hing Chair in General Internal Medicine, University of Toronto. The authors would like to acknowledge Jason Uppal for his ongoing contribution to the improvement of clinical text message communications at our institution.
Disclosures
The authors have nothing to disclose.
References
1. Wu R, Lo V, Morra D, et al. A smartphone-enabled communication system to improve hospital communication: usage and perceptions of medical trainees and nurses on general internal medicine wards. J Hosp Med. 2015;10(2):83-89. PubMed 2. Smith CN, Quan SD, Morra D, et al. Understanding interprofessional communication: a content analysis of email communications between doctors and nurses. Appl Clin Inform. 2012;3(1):38-51. PubMed 3. Frizzell JD, Ahmed B. Text messaging versus paging: new technology for the next generation. J Am Coll Cardiol. 2014;64(24):2703-2705. PubMed 4. Wu RC, Morra D, Quan S, et al. The use of smartphones for clinical communication on internal medicine wards. J Hosp Med. 2010;5(9):553-559. PubMed 5. Ighani F, Kapoor KG, Gibran SK, et al. A comparison of two-way text versus conventional paging systems in an academic ophthalmology department. J Med Syst. 2010;34(4):677-684. PubMed 6. Wu R, Rossos P, Quan S, et al. An evaluation of the use of smartphones to communicate between clinicians: a mixed-methods study. J Med Internet Res. 2011;13(3):e59. PubMed 7. Wu RC, Lo V, Morra D, et al. The intended and unintended consequences of communication systems on general internal medicine inpatient care delivery: a prospective observational case study of five teaching hospitals. J Am Med Inform Assoc. 2013;20(4):766-777. PubMed 8. Patel N, Siegler JE, Stromberg N, Ravitz N, Hanson CW. Perfect storm of inpatient communication needs and an innovative solution utilizing smartphones and secured messaging. Appl Clin Inform. 2016;7(3):777-789. PubMed 9. Aungst TD, Belliveau P. Leveraging mobile smart devices to improve interprofessional communications in inpatient practice setting: A literature review. J Interprof Care. 2015;29(6):570-578. PubMed 10. Vaisman A, Wu RC. Analysis of Smartphone Interruptions on Academic General Internal Medicine Wards. Frequent Interruptions may cause a ‘Crisis Mode’ Work Climate. Appl Clin Inform. 2017;8(1):1-11. PubMed 11. Quan SD, Wu RC, Rossos PG, et al. It’s not about pager replacement: an in-depth look at the interprofessional nature of communication in healthcare. J Hosp Med. 2013;8(3):137-143. PubMed 12. Quan SD, Morra D, Lau FY, et al. Perceptions of urgency: defining the gap between what physicians and nurses perceive to be an urgent issue. Int J Med Inform. 2013;82(5):378-386. PubMed 13. Katz MH, Schroeder SA. The sounds of the hospital. Paging patterns in three teaching hospitals. N Engl J Med. 1988;319(24):1585-1589. PubMed 14. Patel R, Reilly K, Old A, Naden G, Child S. Appropriate use of pagers in a New Zealand tertiary hospital. N Z Med J. 2006;119(1231):U1912. PubMed 15. Ferguson A, Aaronson B, Anuradhika A. Inbox messaging: an effective tool for minimizing non-urgent paging related interruptions in hospital medicine provider workflow. BMJ Qual Improv Rep. 2016;5(1):u215856.w7316. PubMed 16. Luxenberg A, Chan B, Khanna R, Sarkar U. Efficiency and interpretability of text paging communication for medical inpatients: A mixed-methods analysis. JAMA Intern Med. 2017;177(8):1218-1220. PubMed 17. Ly T, Korb-Wells CS, Sumpton D, Russo RR, Barnsley L. Nature and impact of interruptions on clinical workflow of medical residents in the inpatient setting. J Grad Med Educ. 2013;5(2):232-237. PubMed 18. Blum NJ, Lieu TA. Interrupted care. The effects of paging on pediatric resident activities. Am J Dis Child. 1992;146(7):806-808. PubMed 19. Wu RC, Tzanetos K, Morra D, Quan S, Lo V, Wong BM. Educational impact of using smartphones for clinical communication on general medicine: more global, less local. J Hosp Med. 2013;8(7):365-372. PubMed 20. Katz-Sidlow RJ, Ludwig A, Miller S, Sidlow R. Smartphone use during inpatient attending rounds: prevalence, patterns and potential for distraction. J Hosp Med. 2012;7(8):595-599. PubMed 21. Wong BM, Quan S, Shadowitz S, Etchells E. Implementation and evaluation of an alpha-numeric paging system on a resident inpatient teaching service. J Hosp Med. 2009;4(8):E34-E40. PubMed 22. Conard MA MR. Interest level improves learning but does not moderate the effects of interruptions: An experiment using simultaneous multitasking. Learn Individ Differ. 2014;30:112-117. 23. Zastoupil L, McIntosh A, Sopfe J, et al. Positive impact of transition from noon conference to academic half day in a pediatric residency program. Acad Pediatr. 2017;17(4):436-442. PubMed 24. Lo V, Wu RC, Morra D, Lee L, Reeves S. The use of smartphones in general and internal medicine units: a boon or a bane to the promotion of interprofessional collaboration? J Interprof Care. 2012;26(4):276-282. PubMed 25. Patterson ME, Bogart MS, Starr KR. Associations between perceived crisis mode work climate and poor information exchange within hospitals. J Hosp Med. 2015;10(3):152-159. PubMed 26. Laxmisan A, Hakimzada F, Sayan OR, Green RA, Zhang J, Patel VL. The multitasking clinician: decision-making and cognitive demand during and after team handoffs in emergency care. Int J Med Inform. 2007;76(11-12):801-811. PubMed 27. Westbrook JI, Woods A, Rob MI, Dunsmuir WT, Day RO. Association of interruptions with an increased risk and severity of medication administration errors. Arch Intern Med. 2010;170(8):683-690. PubMed 28. Collins S, Currie L, Patel V, Bakken S, Cimino JJ. Multitasking by clinicians in the context of CPOE and CIS use. Stud Health Technol Inform. 2007;129(Pt 2):958-962. PubMed 29. Huang ME. It is from mars and physicians from venus: Bridging the gap. PM R. 2017;9(5S):S19-S25. PubMed 30. Tran K, Morra D, Lo V, Quan S, Wu R. The use of smartphones on General Internal Medicine wards: A mixed methods study. Appl Clin Inform. 2014;5(3):814-823. PubMed
"Arielle Mendel, MD", Division of General Internal Medicine, Toronto General Hospital, 200 Elizabeth St, Toronto, ON M5G 2C4. Telephone: (416)-910-1055; Email: [email protected]
Content Gating
Gated (full article locked unless allowed per User)
Alternative CME
Disqus Comments
Default
Gate On Date
Wed, 05/23/2018 - 06:00
Consolidated Pubs: Do Not Show Source Publication Logo
Hospital medicine has become the fastest growing medicine subspecialty, though no standardized hospitalist-focused educational program is required to become a practicing adult medicine hospitalist.1 Historically, adult hospitalists have had little additional training beyond residency, yet, as residency training adapts to duty hour restrictions, patient caps, and increasing attending oversight, it is not clear if traditional rotations and curricula provide adequate preparation for independent practice as an adult hospitalist.2-5 Several types of training and educational programs have emerged to fill this potential gap. These include hospital medicine fellowships, residency pathways, early career faculty development programs (eg, Society of Hospital Medicine/ Society of General Internal Medicine sponsored Academic Hospitalist Academy), and hospitalist-focused resident rotations.6-10 These activities are intended to ensure that residents and early career physicians gain the skills and competencies required to effectively practice hospital medicine.
Hospital medicine fellowships, residency pathways, and faculty development have been described previously.6-8 However, the prevalence and characteristics of hospital medicine-focused resident rotations are unknown, and these rotations are rarely publicized beyond local residency programs. Our study aims to determine the prevalence, purpose, and function of hospitalist-focused rotations within residency programs and explore the role these rotations have in preparing residents for a career in hospital medicine.
METHODS
Study Design, Setting, and Participants
We conducted a cross-sectional study involving the largest 100 Accreditation Council for Graduate Medical Education (ACGME) internal medicine residency programs. We chose the largest programs as we hypothesized that these programs would be most likely to have the infrastructure to support hospital medicine focused rotations compared to smaller programs. The UCSF Committee on Human Research approved this study.
Survey Development
We developed a study-specific survey (the Hospitalist Elective National Survey [HENS]) to assess the prevalence, structure, curricular goals, and perceived benefits of distinct hospitalist rotations as defined by individual resident programs. The survey prompted respondents to consider a “hospitalist-focused” rotation as one that is different from a traditional inpatient “ward” rotation and whose emphasis is on hospitalist-specific training, clinical skills, or career development. The 18-question survey (Appendix 1) included fixed choice, multiple choice, and open-ended responses.
Data Collection
Using publicly available data from the ACGME website (www.acgme.org), we identified the largest 100 medicine programs based on the total number of residents. This included programs with 81 or more residents. An electronic survey was e-mailed to the leadership of each program. In May 2015, surveys were sent to Residency Program Directors (PD), and if they did not respond after 2 attempts, then Associate Program Directors (APD) were contacted twice. If both these leaders did not respond, then the survey was sent to residency program administrators or Hospital Medicine Division Chiefs. Only one survey was completed per site.
Data Analysis
We used descriptive statistics to summarize quantitative data. Responses to open-ended qualitative questions about the goals, strengths, and design of rotations were analyzed using thematic analysis.11 During analysis, we iteratively developed and refined codes that identified important concepts that emerged from the data. Two members of the research team trained in qualitative data analysis coded these data independently (SL & JH).
RESULTS
Eighty-two residency program leaders (53 PD, 19 APD, 10 chiefs/admin) responded to the survey (82% total response rate). Among all responders, the prevalence of hospitalist-focused rotations was 50% (41/82). Of these 41 rotations, 85% (35/41) were elective rotations and 15% (6/41) were mandatory rotations. Hospitalist rotations ranged in existence from 1 to 15 years with a mean duration of 4.78 years (S.D. 3.5).
Of the 41 programs that did not have a hospital medicine-focused rotation, the key barriers identified were a lack of a well-defined model (29%), low faculty interest (15%), low resident interest (12%), and lack of funding (5%). Despite these barriers, 9 of these 41 programs (22%) stated they planned to start a rotation in the future – of which, 3 programs (7%) planned to start a rotation within the year.
Of the 41 established rotations, most were 1 month in duration (31/41, 76%) and most of the participants included second-year residents (30/41, 73%), and/or third-year residents (32/41, 78%). In addition to clinical work, most rotations had a nonclinical component that included teaching, research/scholarship, and/or work on quality improvement or patient safety (Table 1). Clinical activities, nonclinical activities, and curricular elements varied across institutions (Table 1).
Most programs with rotations (39/41, 95%) reported that their hospitalist rotation filled at least one gap in traditional residency curriculum. The most frequently identified gaps the rotation filled included: allowing progressive clinical autonomy (59%, 24/41), learning about quality improvement and high value care (41%, 17/41), and preparing to become a practicing hospitalist (39%, 16/41). Most respondents (66%, 27/41) reported that the rotation helped to prepare trainees for their first year as an attending.
Results of thematic analysis related to the goals, strengths, and design of rotations are shown in Table 2. Five themes emerged relating to autonomy, mentorship, hospitalist skills, real-world experience, and training and curriculum gaps. These themes describe the underlying structure in which these rotations promote career preparation and skill development.
DISCUSSION
The Hospital Elective National Survey provides insight into a growing component of hospitalist-focused training and preparation. Fifty percent of ACGME residency programs surveyed in this study had a hospitalist-focused rotation. Rotation characteristics were heterogeneous, perhaps reflecting both the homegrown nature of their development and the lack of national study or data to guide what constitutes an “ideal” rotation. Common functions of rotations included providing career mentorship and allowing for trainees to get experience “being a hospitalist.” Other key elements of the rotations included providing additional clinical autonomy and teaching material outside of traditional residency curricula such as quality improvement, patient safety, billing, and healthcare finances.
Prior research has explored other training for hospitalists such as fellowships, pathways, and faculty development.6-8 A hospital medicine fellowship provides extensive training but without a practice requirement in adult medicine (as now exists in pediatric hospital medicine), the impact of fellowship training may be limited by its scale.12,13 Longitudinal hospitalist residency pathways provide comprehensive skill development and often require an early career commitment from trainees.7 Faculty development can be another tool to foster career growth, though requires local investment from hospitalist groups that may not have the resources or experience to support this.8 Our study has highlighted that hospitalist-focused rotations within residency programs can train physicians for a career in hospital medicine. Hospitalist and residency leaders should consider that these rotations might be the only hospital medicine-focused training that new hospitalists will have. Given the variable nature of these rotations nationally, developing standards around core hospitalist competencies within these rotations should be a key component to career preparation and a goal for the field at large.14,15
Our study has limitations. The survey focused only on internal medicine as it is the most common training background of hospitalists; however, the field has grown to include other specialties including pediatrics, neurology, family medicine, and surgery. In addition, the survey reviewed the largest ACGME Internal Medicine programs to best evaluate prevalence and content—it may be that some smaller programs have rotations with different characteristics that we have not captured. Lastly, the survey reviewed the rotations through the lens of residency program leadership and not trainees. A future survey of trainees or early career hospitalists who participated in these rotations could provide a better understanding of their achievements and effectiveness.
CONCLUSION
We anticipate that the demand for hospitalist-focused training will continue to grow as more residents in training seek to enter the specialty. Hospitalist and residency program leaders have an opportunity within residency training programs to build new or further develop existing hospital medicine-focused rotations. The HENS survey demonstrates that hospitalist-focused rotations are prevalent in residency education and have the potential to play an important role in hospitalist training.
Disclosure
The authors declare no conflicts of interest in relation to this manuscript.
1. Wachter RM, Goldman L. Zero to 50,000 – The 20th Anniversary of the Hospitalist. N Engl J Med. 2016;375:1009-1011. PubMed 2. Glasheen JJ, Siegal EM, Epstein K, Kutner J, Prochazka AV. Fulfilling the promise of hospital medicine: tailoring internal medicine training to address hospitalists’ needs.J Gen Intern Med. 2008;23:1110-1115. PubMed 3. Glasheen JJ, Goldenberg J, Nelson JR. Achieving hospital medicine’s promise through internal medicine residency redesign. Mt Sinai J Med. 2008; 5:436-441. PubMed 4. Plauth WH 3rd, Pantilat SZ, Wachter RM, Fenton CL. Hospitalists’ perceptions of their residency training needs: results of a national survey. Am J Med. 2001; 15;111:247-254. PubMed 5. Kumar A, Smeraglio A, Witteles R, Harman S, Nallamshetty, S, Rogers A, Harrington R, Ahuja N. A resident-created hospitalist curriculum for internal medicine housestaff. J Hosp Med. 2016;11:646-649. PubMed 6. Ranji, SR, Rosenman, DJ, Amin, AN, Kripalani, S. Hospital medicine fellowships: works in progress. Am J Med. 2006;119(1):72.e1-7. PubMed 7. Sweigart JR, Tad-Y D, Kneeland P, Williams MV, Glasheen JJ. Hospital medicine resident training tracks: developing the hospital medicine pipeline. J Hosp Med.2017;12:173-176. PubMed 8. Sehgal NL, Sharpe BA, Auerbach AA, Wachter RM. Investing in the future: building an academic hospitalist faculty development program. J Hosp Med. 2011;6:161-166. PubMed 9. Academic Hospitalist Academy. Course Description, Objectives and Society Sponsorship. Available at: https://academichospitalist.org/. Accessed August 23, 2017. 10. Amin AN. A successful hospitalist rotation for senior medicine residents. Med Educ. 2003;37:1042. PubMed 11. Braun V, Clarke V. Using thematic analysis in psychology. Qual Res Psychol. 2006;3:77-101. 12. American Board of Medical Specialties. ABMS Officially Recognizes Pediatric Hospital Medicine Subspecialty Certification Available at: http://www.abms.org/news-events/abms-officially-recognizes-pediatric-hospital-medicine-subspecialty-certification/. Accessed August 23, 2017. PubMed 13. Wiese J. Residency training: beginning with the end in mind.J Gen Intern Med. 2008; 23(7):1122-1123. PubMed 14. Dressler DD, Pistoria MJ, Budnitz TL, McKean SC, Amin AN. Core competencies in hospital medicine: development and methodology. J Hosp Med. 2006; 1 Suppl 1:48-56. PubMed 15. Nichani S, Crocker J, Fitterman N, Lukela M. Updating the core competencies in hospital medicine – 2017 revision: introduction and methodology. J Hosp Med. 2017;4:283-287. PubMed
Hospital medicine has become the fastest growing medicine subspecialty, though no standardized hospitalist-focused educational program is required to become a practicing adult medicine hospitalist.1 Historically, adult hospitalists have had little additional training beyond residency, yet, as residency training adapts to duty hour restrictions, patient caps, and increasing attending oversight, it is not clear if traditional rotations and curricula provide adequate preparation for independent practice as an adult hospitalist.2-5 Several types of training and educational programs have emerged to fill this potential gap. These include hospital medicine fellowships, residency pathways, early career faculty development programs (eg, Society of Hospital Medicine/ Society of General Internal Medicine sponsored Academic Hospitalist Academy), and hospitalist-focused resident rotations.6-10 These activities are intended to ensure that residents and early career physicians gain the skills and competencies required to effectively practice hospital medicine.
Hospital medicine fellowships, residency pathways, and faculty development have been described previously.6-8 However, the prevalence and characteristics of hospital medicine-focused resident rotations are unknown, and these rotations are rarely publicized beyond local residency programs. Our study aims to determine the prevalence, purpose, and function of hospitalist-focused rotations within residency programs and explore the role these rotations have in preparing residents for a career in hospital medicine.
METHODS
Study Design, Setting, and Participants
We conducted a cross-sectional study involving the largest 100 Accreditation Council for Graduate Medical Education (ACGME) internal medicine residency programs. We chose the largest programs as we hypothesized that these programs would be most likely to have the infrastructure to support hospital medicine focused rotations compared to smaller programs. The UCSF Committee on Human Research approved this study.
Survey Development
We developed a study-specific survey (the Hospitalist Elective National Survey [HENS]) to assess the prevalence, structure, curricular goals, and perceived benefits of distinct hospitalist rotations as defined by individual resident programs. The survey prompted respondents to consider a “hospitalist-focused” rotation as one that is different from a traditional inpatient “ward” rotation and whose emphasis is on hospitalist-specific training, clinical skills, or career development. The 18-question survey (Appendix 1) included fixed choice, multiple choice, and open-ended responses.
Data Collection
Using publicly available data from the ACGME website (www.acgme.org), we identified the largest 100 medicine programs based on the total number of residents. This included programs with 81 or more residents. An electronic survey was e-mailed to the leadership of each program. In May 2015, surveys were sent to Residency Program Directors (PD), and if they did not respond after 2 attempts, then Associate Program Directors (APD) were contacted twice. If both these leaders did not respond, then the survey was sent to residency program administrators or Hospital Medicine Division Chiefs. Only one survey was completed per site.
Data Analysis
We used descriptive statistics to summarize quantitative data. Responses to open-ended qualitative questions about the goals, strengths, and design of rotations were analyzed using thematic analysis.11 During analysis, we iteratively developed and refined codes that identified important concepts that emerged from the data. Two members of the research team trained in qualitative data analysis coded these data independently (SL & JH).
RESULTS
Eighty-two residency program leaders (53 PD, 19 APD, 10 chiefs/admin) responded to the survey (82% total response rate). Among all responders, the prevalence of hospitalist-focused rotations was 50% (41/82). Of these 41 rotations, 85% (35/41) were elective rotations and 15% (6/41) were mandatory rotations. Hospitalist rotations ranged in existence from 1 to 15 years with a mean duration of 4.78 years (S.D. 3.5).
Of the 41 programs that did not have a hospital medicine-focused rotation, the key barriers identified were a lack of a well-defined model (29%), low faculty interest (15%), low resident interest (12%), and lack of funding (5%). Despite these barriers, 9 of these 41 programs (22%) stated they planned to start a rotation in the future – of which, 3 programs (7%) planned to start a rotation within the year.
Of the 41 established rotations, most were 1 month in duration (31/41, 76%) and most of the participants included second-year residents (30/41, 73%), and/or third-year residents (32/41, 78%). In addition to clinical work, most rotations had a nonclinical component that included teaching, research/scholarship, and/or work on quality improvement or patient safety (Table 1). Clinical activities, nonclinical activities, and curricular elements varied across institutions (Table 1).
Most programs with rotations (39/41, 95%) reported that their hospitalist rotation filled at least one gap in traditional residency curriculum. The most frequently identified gaps the rotation filled included: allowing progressive clinical autonomy (59%, 24/41), learning about quality improvement and high value care (41%, 17/41), and preparing to become a practicing hospitalist (39%, 16/41). Most respondents (66%, 27/41) reported that the rotation helped to prepare trainees for their first year as an attending.
Results of thematic analysis related to the goals, strengths, and design of rotations are shown in Table 2. Five themes emerged relating to autonomy, mentorship, hospitalist skills, real-world experience, and training and curriculum gaps. These themes describe the underlying structure in which these rotations promote career preparation and skill development.
DISCUSSION
The Hospital Elective National Survey provides insight into a growing component of hospitalist-focused training and preparation. Fifty percent of ACGME residency programs surveyed in this study had a hospitalist-focused rotation. Rotation characteristics were heterogeneous, perhaps reflecting both the homegrown nature of their development and the lack of national study or data to guide what constitutes an “ideal” rotation. Common functions of rotations included providing career mentorship and allowing for trainees to get experience “being a hospitalist.” Other key elements of the rotations included providing additional clinical autonomy and teaching material outside of traditional residency curricula such as quality improvement, patient safety, billing, and healthcare finances.
Prior research has explored other training for hospitalists such as fellowships, pathways, and faculty development.6-8 A hospital medicine fellowship provides extensive training but without a practice requirement in adult medicine (as now exists in pediatric hospital medicine), the impact of fellowship training may be limited by its scale.12,13 Longitudinal hospitalist residency pathways provide comprehensive skill development and often require an early career commitment from trainees.7 Faculty development can be another tool to foster career growth, though requires local investment from hospitalist groups that may not have the resources or experience to support this.8 Our study has highlighted that hospitalist-focused rotations within residency programs can train physicians for a career in hospital medicine. Hospitalist and residency leaders should consider that these rotations might be the only hospital medicine-focused training that new hospitalists will have. Given the variable nature of these rotations nationally, developing standards around core hospitalist competencies within these rotations should be a key component to career preparation and a goal for the field at large.14,15
Our study has limitations. The survey focused only on internal medicine as it is the most common training background of hospitalists; however, the field has grown to include other specialties including pediatrics, neurology, family medicine, and surgery. In addition, the survey reviewed the largest ACGME Internal Medicine programs to best evaluate prevalence and content—it may be that some smaller programs have rotations with different characteristics that we have not captured. Lastly, the survey reviewed the rotations through the lens of residency program leadership and not trainees. A future survey of trainees or early career hospitalists who participated in these rotations could provide a better understanding of their achievements and effectiveness.
CONCLUSION
We anticipate that the demand for hospitalist-focused training will continue to grow as more residents in training seek to enter the specialty. Hospitalist and residency program leaders have an opportunity within residency training programs to build new or further develop existing hospital medicine-focused rotations. The HENS survey demonstrates that hospitalist-focused rotations are prevalent in residency education and have the potential to play an important role in hospitalist training.
Disclosure
The authors declare no conflicts of interest in relation to this manuscript.
References
1. Wachter RM, Goldman L. Zero to 50,000 – The 20th Anniversary of the Hospitalist. N Engl J Med. 2016;375:1009-1011. PubMed 2. Glasheen JJ, Siegal EM, Epstein K, Kutner J, Prochazka AV. Fulfilling the promise of hospital medicine: tailoring internal medicine training to address hospitalists’ needs.J Gen Intern Med. 2008;23:1110-1115. PubMed 3. Glasheen JJ, Goldenberg J, Nelson JR. Achieving hospital medicine’s promise through internal medicine residency redesign. Mt Sinai J Med. 2008; 5:436-441. PubMed 4. Plauth WH 3rd, Pantilat SZ, Wachter RM, Fenton CL. Hospitalists’ perceptions of their residency training needs: results of a national survey. Am J Med. 2001; 15;111:247-254. PubMed 5. Kumar A, Smeraglio A, Witteles R, Harman S, Nallamshetty, S, Rogers A, Harrington R, Ahuja N. A resident-created hospitalist curriculum for internal medicine housestaff. J Hosp Med. 2016;11:646-649. PubMed 6. Ranji, SR, Rosenman, DJ, Amin, AN, Kripalani, S. Hospital medicine fellowships: works in progress. Am J Med. 2006;119(1):72.e1-7. PubMed 7. Sweigart JR, Tad-Y D, Kneeland P, Williams MV, Glasheen JJ. Hospital medicine resident training tracks: developing the hospital medicine pipeline. J Hosp Med.2017;12:173-176. PubMed 8. Sehgal NL, Sharpe BA, Auerbach AA, Wachter RM. Investing in the future: building an academic hospitalist faculty development program. J Hosp Med. 2011;6:161-166. PubMed 9. Academic Hospitalist Academy. Course Description, Objectives and Society Sponsorship. Available at: https://academichospitalist.org/. Accessed August 23, 2017. 10. Amin AN. A successful hospitalist rotation for senior medicine residents. Med Educ. 2003;37:1042. PubMed 11. Braun V, Clarke V. Using thematic analysis in psychology. Qual Res Psychol. 2006;3:77-101. 12. American Board of Medical Specialties. ABMS Officially Recognizes Pediatric Hospital Medicine Subspecialty Certification Available at: http://www.abms.org/news-events/abms-officially-recognizes-pediatric-hospital-medicine-subspecialty-certification/. Accessed August 23, 2017. PubMed 13. Wiese J. Residency training: beginning with the end in mind.J Gen Intern Med. 2008; 23(7):1122-1123. PubMed 14. Dressler DD, Pistoria MJ, Budnitz TL, McKean SC, Amin AN. Core competencies in hospital medicine: development and methodology. J Hosp Med. 2006; 1 Suppl 1:48-56. PubMed 15. Nichani S, Crocker J, Fitterman N, Lukela M. Updating the core competencies in hospital medicine – 2017 revision: introduction and methodology. J Hosp Med. 2017;4:283-287. PubMed
Steven Ludwin, MD, Assistant Professor of Medicine, Division of Hospital Medicine, University of California, San Francisco, 533 Parnassus Avenue, Box 0131, San Francisco, CA 94113; Telephone: 415-476-4814; Fax: 415-502-1963; E-mail: [email protected]
Content Gating
Gated (full article locked unless allowed per User)
Alternative CME
Disqus Comments
Default
Consolidated Pubs: Do Not Show Source Publication Logo
The practice of hospital medicine continues to grow in its scope and complexity. The authors of this article conducted a review of the literature including articles published between March 2016 and March 2017. The key articles selected were of a high methodological quality, had clear findings, and had a high potential for an impact on clinical practice. Twenty articles were presented at the Update in Hospital Medicine at the 2017 Society of Hospital Medicine (SHM) and Society of General Internal Medicine (SGIM) annual meetings selected by the presentation teams (B.A.S., A.B. at SGIM and R.E.T., C.M. at SHM). Through an iterative voting process, 9 articles were selected for inclusion in this review. Each author ranked their top 5 articles from 1 to 5. The points were tallied for each article, and the 5 articles with the most points were included. A second round of voting identified the remaining 4 articles for inclusion. Each article is summarized below, and the key points are highlighted in Table 1.
ESSENTIAL PUBLICATIONS
Prevalence of Pulmonary Embolism among Patients Hospitalized for Syncope. Prandoni P et al. New England Journal of Medicine, 2016;375(16):1524-31.1
Background
Pulmonary embolism (PE), a potentially fatal disease, is rarely considered as a likely cause of syncope. To determine the prevalence of PE among patients presenting with their first episode of syncope, the authors performed a systematic workup for pulmonary embolism in adult patients admitted for syncope at 11 hospitals in Italy.
Findings
Of the 2584 patients who presented to the emergency department (ED) with syncope during the study, 560 patients were admitted and met the inclusion criteria. A modified Wells Score was applied, and a D-dimer was measured on every hospitalized patient. Those with a high pretest probability, a Wells Score of 4.0 or higher, or a positive D-dimer underwent further testing for pulmonary embolism by a CT scan, a ventilation perfusion scan, or an autopsy. Ninety-seven of the 560 patients admitted to the hospital for syncope were found to have a PE (17%). One in 4 patients (25%) with no clear cause for syncope was found to have a PE, and 1 in 4 patients with PE had no tachycardia, tachypnea, hypotension, or clinical signs of DVT.
Cautions
Nearly 72% of the patients with common explanations for syncope, such as vasovagal, drug-induced, or volume depletion, were discharged from the ED and not included in the study. The authors focused on the prevalence of PE. The causation between PE and syncope is not clear in each of the patients. Of the patients’ diagnosis by a CT, only 67% of the PEs were found to be in a main pulmonary artery or lobar artery. The other 33% were segmental or subsegmental. Of those diagnosed by a ventilation perfusion scan, 50% of the patients had 25% or more of the area of both lungs involved. The other 50% involved less than 25% of the area of both lungs. Also, it is important to note that 75% of the patients admitted to the hospital in this study were 70 years of age or older.
Implications
After common diagnoses are ruled out, it is important to consider pulmonary embolism in patients hospitalized with syncope. Providers should calculate a Wells Score and measure a D-dimer to guide the decision making.
Assessing the Risks Associated with MRI in Patients with a Pacemaker or Defibrillator. Russo RJ et al. New England Journal of Medicine, 2017;376(8):755-64.2
Background
Magnetic resonance imaging (MRI) in patients with implantable cardiac devices is considered a safety risk due to the potential of cardiac lead heating and subsequent myocardial injury or alterations of the pacing properties. Although manufacturers have developed “MRI-conditional” devices designed to reduce these risks, still 2 million people in the United States and 6 million people worldwide have “non–MRI-conditional” devices. The authors evaluated the event rates in patients with “non-MRI-conditional” devices undergoing an MRI.
Findings
The authors prospectively followed up 1500 adults with cardiac devices placed since 2001 who received nonthoracic MRIs according to a specific protocol available in the supplemental materials published with this article in the New England Journal of Medicine. Of the 1000 patients with pacemakers only, they observed 5 atrial arrhythmias and 6 electrical resets. Of the 500 patients with implantable cardioverter defibrillators (ICDs), they observed 1 atrial arrhythmia and 1 generator failure (although this case had deviated from the protocol). All of the atrial arrhythmias were self-terminating. No deaths, lead failure requiring an immediate replacement, a loss of capture, or ventricular arrhythmias were observed.
Cautions
Patients who were pacing dependent were excluded. No devices implanted before 2001 were included in the study, and the MRIs performed were only 1.5 Tesla (a lower field strength than the also available 3 Tesla MRIs).
Implications
It is safe to proceed with 1.5 Tesla nonthoracic MRIs in patients, following the protocol outlined in this article, with non–MRI conditional cardiac devices implanted since 2001.
Culture If Spikes? Indications and Yield of Blood Cultures in Hospitalized Medical Patients. Linsenmeyer K et al. Journal of Hospital Medicine, 2016;11(5):336-40.3
Background
Blood cultures are frequently drawn for the evaluation of an inpatient fever. This “culture if spikes” approach may lead to unnecessary testing and false positive results. In this study, the authors evaluated rates of true positive and false positive blood cultures in the setting of an inpatient fever.
Findings
The patients hospitalized on the general medicine or cardiology floors at a Veterans Affairs teaching hospital were prospectively followed over 7 months. A total of 576 blood cultures were ordered among 323 unique patients. The patients were older (average age of 70 years) and predominantly male (94%). The true-positive rate for cultures, determined by a consensus among the microbiology and infectious disease departments based on a review of clinical and laboratory data, was 3.6% compared with a false-positive rate of 2.3%. The clinical characteristics associated with a higher likelihood of a true positive included: the indication for a culture as a follow-up from a previous culture (likelihood ratio [LR] 3.4), a working diagnosis of bacteremia or endocarditis (LR 3.7), and the constellation of fever and leukocytosis in a patient who has not been on antibiotics (LR 5.6).
Cautions
This study was performed at a single center with patients in the medicine and cardiology services, and thus, the data is representative of clinical practice patterns specific to that site.
Implications
Reflexive ordering of blood cultures for inpatient fever is of a low yield with a false-positive rate that approximates the true positive rate. A large number of patients are tested unnecessarily, and for those with positive tests, physicians are as likely to be misled as they are certain to truly identify a pathogen. The positive predictive value of blood cultures is improved when drawn on patients who are not on antibiotics and when the patient has a specific diagnosis, such as pneumonia, previous bacteremia, or suspected endocarditis.
Incidence of and Risk Factors for Chronic Opioid Use among Opioid-Naive Patients in the Postoperative Period. Sun EC et al. JAMA Internal Medicine, 2016;176(9):1286-93.4
Background
Each day in the United States, 650,000 opioid prescriptions are filled, and 78 people suffer an opiate-related death. Opioids are frequently prescribed for inpatient management of postoperative pain. In this study, authors compared the development of chronic opioid use between patients who had undergone surgery and those who had not.
Findings
This was a retrospective analysis of a nationwide insurance claims database. A total of 641,941 opioid-naive patients underwent 1 of 11 designated surgeries in the study period and were compared with 18,011,137 opioid-naive patients who did not undergo surgery. Chronic opioid use was defined as the filling of 10 or more prescriptions or receiving more than a 120-day supply between 90 and 365 days postoperatively (or following the assigned faux surgical date in those not having surgery). This was observed in a small proportion of the surgical patients (less than 0.5%). However, several procedures were associated with the increased odds of postoperative chronic opioid use, including a simple mastectomy (Odds ratio [OR] 2.65), a cesarean delivery (OR 1.28), an open appendectomy (OR 1.69), an open and laparoscopic cholecystectomy (ORs 3.60 and 1.62, respectively), and a total hip and total knee arthroplasty (ORs 2.52 and 5.10, respectively). Also, male sex, age greater than 50 years, preoperative benzodiazepines or antidepressants, and a history of drug abuse were associated with increased odds.
Cautions
This study was limited by the claims-based data and that the nonsurgical population was inherently different from the surgical population in ways that could lead to confounding.
Implications
In perioperative care, there is a need to focus on multimodal approaches to pain and to implement opioid reducing and sparing strategies that might include options such as acetaminophen, NSAIDs, neuropathic pain medications, and Lidocaine patches. Moreover, at discharge, careful consideration should be given to the quantity and duration of the postoperative opioids.
Rapid Rule-out of Acute Myocardial Infarction with a Single High-Sensitivity Cardiac Troponin T Measurement below the Limit of Detection: A Collaborative Meta-Analysis. Pickering JW et al. Annals of Internal Medicine, 2017;166:715-24.5
Background
High-sensitivity cardiac troponin testing (hs-cTnT) is now available in the United States. Studies have found that these can play a significant role in a rapid rule-out of acute myocardial infarction (AMI).
Findings
In this meta-analysis, the authors identified 11 studies with 9241 participants that prospectively evaluated patients presenting to the emergency department (ED) with chest pain, underwent an ECG, and had hs-cTnT drawn. A total of 30% of the patients were classified as low risk with negative hs-cTnT and negative ECG (defined as no ST changes or T-wave inversions indicative of ischemia). Among the low risk patients, only 14 of the 2825 (0.5%) had AMI according to the Global Task Forces definition.6 Seven of these were in patients with hs-cTnT drawn within 3 hours of a chest pain onset. The pooled negative predictive value was 99.0% (CI 93.8%–99.8%).
Cautions
The heterogeneity between the studies in this meta-analysis, especially in the exclusion criteria, warrants careful consideration when being implemented in new settings. A more sensitive test will result in more positive troponins due to different limits of detection. Thus, medical teams and institutions need to plan accordingly. Caution should be taken for any patient presenting within 3 hours of a chest pain onset.
Implications
Rapid rule-out protocols—which include clinical evaluation, a negative ECG, and a negative high-sensitivity cardiac troponin—identify a large proportion of low-risk patients who are unlikely to have a true AMI.
Prevalence and Localization of Pulmonary Embolism in Unexplained Acute Exacerbations of COPD: A Systematic Review and Meta-analysis. Aleva FE et al. Chest, 2017;151(3):544-54.7
Background
Acute exacerbations of chronic obstructive pulmonary disease (AE-COPD) are frequent. In up to 30%, no clear trigger is found. Previous studies suggested that 1 in 4 of these patients may have a pulmonary embolus (PE).7 This study reviewed the literature and meta-data to describe the prevalence, the embolism location, and the clinical predictors of PE among patients with unexplained AE-COPD.
Findings
A systematic review of the literature and meta-analysis identified 7 studies with 880 patients. In the pooled analysis, 16% had PE (range: 3%–29%). Of the 120 patients with PE, two-thirds were in lobar or larger arteries and one-third in segmental or smaller. Pleuritic chest pain and signs of cardiac compromise (hypotension, syncope, and right-sided heart failure) were associated with PE.
Cautions
This study was heterogeneous leading to a broad confidence interval for prevalence ranging from 8%–25%. Given the frequency of AE-COPD with no identified trigger, physicians need to attend to risks of repeat radiation exposure when considering an evaluation for PE.
Implications
One in 6 patients with unexplained AE-COPD was found to have PE; the odds were greater in those with pleuritic chest pain or signs of cardiac compromise. In patients with AE-COPD with an unclear trigger, the providers should consider an evaluation for PE by using a clinical prediction rule and/or a D-dimer.
Sitting at Patients’ Bedsides May Improve Patients’ Perceptions of Physician Communication Skills. Merel SE et al. Journal of Hospital Medicine, 2016;11(12):865-8.9
Background
Sitting at a patient’s bedside in the inpatient setting is considered a best practice, yet it has not been widely adopted. The authors conducted a cluster-randomized trial of physicians on a single 28-bed hospitalist only run unit where physicians were assigned to sitting or standing for the first 3 days of a 7-day workweek assignment. New admissions or transfers to the unit were considered eligible for the study.
Findings
Sixteen hospitalists saw on an average 13 patients daily during the study (a total of 159 patients were included in the analysis after 52 patients were excluded or declined to participate). The hospitalists were 69% female, and 81% had been in practice 3 years or less. The average time spent in the patient’s room was 12:00 minutes while seated and 12:10 minutes while standing. There was no difference in the patients’ perception of the amount of time spent—the patients overestimated this by 4 minutes in both groups. Sitting was associated with higher ratings for “listening carefully” and “explaining things in a way that was easy to understand.” There was no difference in ratings on the physicians interrupting the patient when talking or in treating patients with courtesy and respect.
Cautions
The study had a small sample size, was limited to English-speaking patients, and was a single-site study. It involved only attending-level physicians and did not involve nonphysician team members. The physicians were not blinded and were aware that the interactions were monitored, perhaps creating a Hawthorne effect. The analysis did not control for other factors such as the severity of the illness, the number of consultants used, or the degree of health literacy.
Implications
This study supports an important best practice highlighted in etiquette-based medicine 10: sitting at the bedside provided a benefit in the patient’s perception of communication by physicians without a negative effect on the physician’s workflow.
The Duration of Antibiotic Treatment in Community-Acquired Pneumonia: A Multi-Center Randomized Clinical Trial. Uranga A et al. JAMA Intern Medicine, 2016;176(9):1257-65.11
Background
The optimal duration of treatment for community-acquired pneumonia (CAP) is unclear; a growing body of evidence suggests shorter and longer durations may be equivalent.
Findings
At 4 hospitals in Spain, 312 adults with a mean age of 65 years and a diagnosis of CAP (non-ICU) were randomized to a short (5 days) versus a long (provider discretion) course of antibiotics. In the short-course group, the antibiotics were stopped after 5 days if the body temperature had been 37.8o C or less for 48 hours, and no more than 1 sign of clinical instability was present (SBP < 90 mmHg, HR >100/min, RR > 24/min, O2Sat < 90%). The median number of antibiotic days was 5 for the short-course group and 10 for the long-course group (P < .01). There was no difference in the resolution of pneumonia symptoms at 10 days or 30 days or in 30-day mortality. There were no differences in in-hospital side effects. However, 30-day readmissions were higher in the long-course group compared with the short-course group (6.6% vs 1.4%; P = .02). The results were similar across all of the Pneumonia Severity Index (PSI) classes.
Cautions
Most of the patients were not severely ill (~60% PSI I-III), the level of comorbid disease was low, and nearly 80% of the patients received fluoroquinolone. There was a significant cross over with 30% of patients assigned to the short-course group receiving antibiotics for more than 5 days.
Implications
Inpatient providers should aim to treat patients with community-acquired pneumonia (regardless of the severity of the illness) for 5 days. At day 5, if the patient is afebrile and has no signs of clinical instability, clinicians should be comfortable stopping antibiotics.
Is the Era of Intravenous Proton Pump Inhibitors Coming to an End in Patients with Bleeding Peptic Ulcers? A Meta-Analysis of the Published Literature. Jian Z et al. British Journal of Clinical Pharmacology, 2016;82(3):880-9.12
Background
Guidelines recommend intravenous proton pump inhibitors (PPI) after an endoscopy for patients with a bleeding peptic ulcer. Yet, acid suppression with oral PPI is deemed equivalent to the intravenous route.
Findings
This systematic review and meta-analysis identified 7 randomized controlled trials involving 859 patients. After an endoscopy, the patients were randomized to receive either oral or intravenous PPI. Most of the patients had “high-risk” peptic ulcers (active bleeding, a visible vessel, an adherent clot). The PPI dose and frequency varied between the studies. Re-bleeding rates were no different between the oral and intravenous route at 72 hours (2.4% vs 5.1%; P = .26), 7 days (5.6% vs 6.8%; P =.68), or 30 days (7.9% vs 8.8%; P = .62). There was also no difference in 30-day mortality (2.1% vs 2.4%; P = .88), and the length of stay was the same in both groups. Side effects were not reported.
Cautions
This systematic review and meta-analysis included multiple heterogeneous small studies of moderate quality. A large number of patients were excluded, increasing the risk of a selection bias.
Implications
There is no clear indication for intravenous PPI in the treatment of bleeding peptic ulcers following an endoscopy. Converting to oral PPI is equivalent to intravenous and is a safe, effective, and cost-saving option for patients with bleeding peptic ulcers.
References
1. Prandoni P, Lensing AW, Prins MH, et al. Prevalence of pulmonary embolism among patients hospitalized for syncope. N Engl J Med. 2016; 375(16):1524-1531. PubMed 2. Russo RJ, Costa HS, Silva PD, et al. Assessing the risks associated with MRI in patients with a pacemaker or defibrillator. N Engl J Med. 2017;376(8):755-764. PubMed 3. Linsenmeyer K, Gupta K, Strymish JM, Dhanani M, Brecher SM, Breu AC. Culture if spikes? Indications and yield of blood cultures in hospitalized medical patients. J Hosp Med. 2016;11(5):336-340. PubMed 4. Sun EC, Darnall BD, Baker LC, Mackey S. Incidence of and risk factors for chronic opioid use among opioid-naive patients in the postoperative period. JAMA Intern Med. 2016;176(9):1286-1293. PubMed 5. Pickering JW, Than MP, Cullen L, et al. Rapid rule-out of acute myocardial infarction with a single high-sensitivity cardiac troponin T measurement below the limit of detection: A collaborative meta-analysis. Ann Intern Med. 2017;166(10):715-724. PubMed 6. Thygesen K, Alpert JS, White HD, Jaffe AS, Apple FS, Galvani M, et al; Joint ESC/ACCF/AHA/WHF Task Force for the Redefinition of Myocardial Infarction. Universal definition of myocardial infarction. Circulation. 2007;116:2634-2653. PubMed 7. Aleva FE, Voets LWLM, Simons SO, de Mast Q, van der Ven AJAM, Heijdra YF. Prevalence and localization of pulmonary embolism in unexplained acute exacerbations of COPD: A systematic review and meta-analysis. Chest. 2017; 151(3):544-554. PubMed 8. Rizkallah J, Man SFP, Sin DD. Prevalence of pulmonary embolism in acute exacerbations of COPD: A systematic review and meta-analysis. Chest. 2009;135(3):786-793. PubMed 9. Merel SE, McKinney CM, Ufkes P, Kwan AC, White AA. Sitting at patients’ bedsides may improve patients’ perceptions of physician communication skills. J Hosp Med. 2016;11(12):865-868. PubMed 10. Kahn MW. Etiquette-based medicine. N Engl J Med. 2008;358(19):1988-1989. PubMed 11. Uranga A, España PP, Bilbao A, et al. Duration of antibiotic treatment in community-acquired pneumonia: A multicenter randomized clinical trial. JAMA Intern Med. 2016;176(9):1257-1265. PubMed 12. Jian Z, Li H, Race NS, Ma T, Jin H, Yin Z. Is the era of intravenous proton pump inhibitors coming to an end in patients with bleeding peptic ulcers? Meta-analysis of the published literature. Br J Clin Pharmacol. 2016;82(3):880-889. PubMed
The practice of hospital medicine continues to grow in its scope and complexity. The authors of this article conducted a review of the literature including articles published between March 2016 and March 2017. The key articles selected were of a high methodological quality, had clear findings, and had a high potential for an impact on clinical practice. Twenty articles were presented at the Update in Hospital Medicine at the 2017 Society of Hospital Medicine (SHM) and Society of General Internal Medicine (SGIM) annual meetings selected by the presentation teams (B.A.S., A.B. at SGIM and R.E.T., C.M. at SHM). Through an iterative voting process, 9 articles were selected for inclusion in this review. Each author ranked their top 5 articles from 1 to 5. The points were tallied for each article, and the 5 articles with the most points were included. A second round of voting identified the remaining 4 articles for inclusion. Each article is summarized below, and the key points are highlighted in Table 1.
ESSENTIAL PUBLICATIONS
Prevalence of Pulmonary Embolism among Patients Hospitalized for Syncope. Prandoni P et al. New England Journal of Medicine, 2016;375(16):1524-31.1
Background
Pulmonary embolism (PE), a potentially fatal disease, is rarely considered as a likely cause of syncope. To determine the prevalence of PE among patients presenting with their first episode of syncope, the authors performed a systematic workup for pulmonary embolism in adult patients admitted for syncope at 11 hospitals in Italy.
Findings
Of the 2584 patients who presented to the emergency department (ED) with syncope during the study, 560 patients were admitted and met the inclusion criteria. A modified Wells Score was applied, and a D-dimer was measured on every hospitalized patient. Those with a high pretest probability, a Wells Score of 4.0 or higher, or a positive D-dimer underwent further testing for pulmonary embolism by a CT scan, a ventilation perfusion scan, or an autopsy. Ninety-seven of the 560 patients admitted to the hospital for syncope were found to have a PE (17%). One in 4 patients (25%) with no clear cause for syncope was found to have a PE, and 1 in 4 patients with PE had no tachycardia, tachypnea, hypotension, or clinical signs of DVT.
Cautions
Nearly 72% of the patients with common explanations for syncope, such as vasovagal, drug-induced, or volume depletion, were discharged from the ED and not included in the study. The authors focused on the prevalence of PE. The causation between PE and syncope is not clear in each of the patients. Of the patients’ diagnosis by a CT, only 67% of the PEs were found to be in a main pulmonary artery or lobar artery. The other 33% were segmental or subsegmental. Of those diagnosed by a ventilation perfusion scan, 50% of the patients had 25% or more of the area of both lungs involved. The other 50% involved less than 25% of the area of both lungs. Also, it is important to note that 75% of the patients admitted to the hospital in this study were 70 years of age or older.
Implications
After common diagnoses are ruled out, it is important to consider pulmonary embolism in patients hospitalized with syncope. Providers should calculate a Wells Score and measure a D-dimer to guide the decision making.
Assessing the Risks Associated with MRI in Patients with a Pacemaker or Defibrillator. Russo RJ et al. New England Journal of Medicine, 2017;376(8):755-64.2
Background
Magnetic resonance imaging (MRI) in patients with implantable cardiac devices is considered a safety risk due to the potential of cardiac lead heating and subsequent myocardial injury or alterations of the pacing properties. Although manufacturers have developed “MRI-conditional” devices designed to reduce these risks, still 2 million people in the United States and 6 million people worldwide have “non–MRI-conditional” devices. The authors evaluated the event rates in patients with “non-MRI-conditional” devices undergoing an MRI.
Findings
The authors prospectively followed up 1500 adults with cardiac devices placed since 2001 who received nonthoracic MRIs according to a specific protocol available in the supplemental materials published with this article in the New England Journal of Medicine. Of the 1000 patients with pacemakers only, they observed 5 atrial arrhythmias and 6 electrical resets. Of the 500 patients with implantable cardioverter defibrillators (ICDs), they observed 1 atrial arrhythmia and 1 generator failure (although this case had deviated from the protocol). All of the atrial arrhythmias were self-terminating. No deaths, lead failure requiring an immediate replacement, a loss of capture, or ventricular arrhythmias were observed.
Cautions
Patients who were pacing dependent were excluded. No devices implanted before 2001 were included in the study, and the MRIs performed were only 1.5 Tesla (a lower field strength than the also available 3 Tesla MRIs).
Implications
It is safe to proceed with 1.5 Tesla nonthoracic MRIs in patients, following the protocol outlined in this article, with non–MRI conditional cardiac devices implanted since 2001.
Culture If Spikes? Indications and Yield of Blood Cultures in Hospitalized Medical Patients. Linsenmeyer K et al. Journal of Hospital Medicine, 2016;11(5):336-40.3
Background
Blood cultures are frequently drawn for the evaluation of an inpatient fever. This “culture if spikes” approach may lead to unnecessary testing and false positive results. In this study, the authors evaluated rates of true positive and false positive blood cultures in the setting of an inpatient fever.
Findings
The patients hospitalized on the general medicine or cardiology floors at a Veterans Affairs teaching hospital were prospectively followed over 7 months. A total of 576 blood cultures were ordered among 323 unique patients. The patients were older (average age of 70 years) and predominantly male (94%). The true-positive rate for cultures, determined by a consensus among the microbiology and infectious disease departments based on a review of clinical and laboratory data, was 3.6% compared with a false-positive rate of 2.3%. The clinical characteristics associated with a higher likelihood of a true positive included: the indication for a culture as a follow-up from a previous culture (likelihood ratio [LR] 3.4), a working diagnosis of bacteremia or endocarditis (LR 3.7), and the constellation of fever and leukocytosis in a patient who has not been on antibiotics (LR 5.6).
Cautions
This study was performed at a single center with patients in the medicine and cardiology services, and thus, the data is representative of clinical practice patterns specific to that site.
Implications
Reflexive ordering of blood cultures for inpatient fever is of a low yield with a false-positive rate that approximates the true positive rate. A large number of patients are tested unnecessarily, and for those with positive tests, physicians are as likely to be misled as they are certain to truly identify a pathogen. The positive predictive value of blood cultures is improved when drawn on patients who are not on antibiotics and when the patient has a specific diagnosis, such as pneumonia, previous bacteremia, or suspected endocarditis.
Incidence of and Risk Factors for Chronic Opioid Use among Opioid-Naive Patients in the Postoperative Period. Sun EC et al. JAMA Internal Medicine, 2016;176(9):1286-93.4
Background
Each day in the United States, 650,000 opioid prescriptions are filled, and 78 people suffer an opiate-related death. Opioids are frequently prescribed for inpatient management of postoperative pain. In this study, authors compared the development of chronic opioid use between patients who had undergone surgery and those who had not.
Findings
This was a retrospective analysis of a nationwide insurance claims database. A total of 641,941 opioid-naive patients underwent 1 of 11 designated surgeries in the study period and were compared with 18,011,137 opioid-naive patients who did not undergo surgery. Chronic opioid use was defined as the filling of 10 or more prescriptions or receiving more than a 120-day supply between 90 and 365 days postoperatively (or following the assigned faux surgical date in those not having surgery). This was observed in a small proportion of the surgical patients (less than 0.5%). However, several procedures were associated with the increased odds of postoperative chronic opioid use, including a simple mastectomy (Odds ratio [OR] 2.65), a cesarean delivery (OR 1.28), an open appendectomy (OR 1.69), an open and laparoscopic cholecystectomy (ORs 3.60 and 1.62, respectively), and a total hip and total knee arthroplasty (ORs 2.52 and 5.10, respectively). Also, male sex, age greater than 50 years, preoperative benzodiazepines or antidepressants, and a history of drug abuse were associated with increased odds.
Cautions
This study was limited by the claims-based data and that the nonsurgical population was inherently different from the surgical population in ways that could lead to confounding.
Implications
In perioperative care, there is a need to focus on multimodal approaches to pain and to implement opioid reducing and sparing strategies that might include options such as acetaminophen, NSAIDs, neuropathic pain medications, and Lidocaine patches. Moreover, at discharge, careful consideration should be given to the quantity and duration of the postoperative opioids.
Rapid Rule-out of Acute Myocardial Infarction with a Single High-Sensitivity Cardiac Troponin T Measurement below the Limit of Detection: A Collaborative Meta-Analysis. Pickering JW et al. Annals of Internal Medicine, 2017;166:715-24.5
Background
High-sensitivity cardiac troponin testing (hs-cTnT) is now available in the United States. Studies have found that these can play a significant role in a rapid rule-out of acute myocardial infarction (AMI).
Findings
In this meta-analysis, the authors identified 11 studies with 9241 participants that prospectively evaluated patients presenting to the emergency department (ED) with chest pain, underwent an ECG, and had hs-cTnT drawn. A total of 30% of the patients were classified as low risk with negative hs-cTnT and negative ECG (defined as no ST changes or T-wave inversions indicative of ischemia). Among the low risk patients, only 14 of the 2825 (0.5%) had AMI according to the Global Task Forces definition.6 Seven of these were in patients with hs-cTnT drawn within 3 hours of a chest pain onset. The pooled negative predictive value was 99.0% (CI 93.8%–99.8%).
Cautions
The heterogeneity between the studies in this meta-analysis, especially in the exclusion criteria, warrants careful consideration when being implemented in new settings. A more sensitive test will result in more positive troponins due to different limits of detection. Thus, medical teams and institutions need to plan accordingly. Caution should be taken for any patient presenting within 3 hours of a chest pain onset.
Implications
Rapid rule-out protocols—which include clinical evaluation, a negative ECG, and a negative high-sensitivity cardiac troponin—identify a large proportion of low-risk patients who are unlikely to have a true AMI.
Prevalence and Localization of Pulmonary Embolism in Unexplained Acute Exacerbations of COPD: A Systematic Review and Meta-analysis. Aleva FE et al. Chest, 2017;151(3):544-54.7
Background
Acute exacerbations of chronic obstructive pulmonary disease (AE-COPD) are frequent. In up to 30%, no clear trigger is found. Previous studies suggested that 1 in 4 of these patients may have a pulmonary embolus (PE).7 This study reviewed the literature and meta-data to describe the prevalence, the embolism location, and the clinical predictors of PE among patients with unexplained AE-COPD.
Findings
A systematic review of the literature and meta-analysis identified 7 studies with 880 patients. In the pooled analysis, 16% had PE (range: 3%–29%). Of the 120 patients with PE, two-thirds were in lobar or larger arteries and one-third in segmental or smaller. Pleuritic chest pain and signs of cardiac compromise (hypotension, syncope, and right-sided heart failure) were associated with PE.
Cautions
This study was heterogeneous leading to a broad confidence interval for prevalence ranging from 8%–25%. Given the frequency of AE-COPD with no identified trigger, physicians need to attend to risks of repeat radiation exposure when considering an evaluation for PE.
Implications
One in 6 patients with unexplained AE-COPD was found to have PE; the odds were greater in those with pleuritic chest pain or signs of cardiac compromise. In patients with AE-COPD with an unclear trigger, the providers should consider an evaluation for PE by using a clinical prediction rule and/or a D-dimer.
Sitting at Patients’ Bedsides May Improve Patients’ Perceptions of Physician Communication Skills. Merel SE et al. Journal of Hospital Medicine, 2016;11(12):865-8.9
Background
Sitting at a patient’s bedside in the inpatient setting is considered a best practice, yet it has not been widely adopted. The authors conducted a cluster-randomized trial of physicians on a single 28-bed hospitalist only run unit where physicians were assigned to sitting or standing for the first 3 days of a 7-day workweek assignment. New admissions or transfers to the unit were considered eligible for the study.
Findings
Sixteen hospitalists saw on an average 13 patients daily during the study (a total of 159 patients were included in the analysis after 52 patients were excluded or declined to participate). The hospitalists were 69% female, and 81% had been in practice 3 years or less. The average time spent in the patient’s room was 12:00 minutes while seated and 12:10 minutes while standing. There was no difference in the patients’ perception of the amount of time spent—the patients overestimated this by 4 minutes in both groups. Sitting was associated with higher ratings for “listening carefully” and “explaining things in a way that was easy to understand.” There was no difference in ratings on the physicians interrupting the patient when talking or in treating patients with courtesy and respect.
Cautions
The study had a small sample size, was limited to English-speaking patients, and was a single-site study. It involved only attending-level physicians and did not involve nonphysician team members. The physicians were not blinded and were aware that the interactions were monitored, perhaps creating a Hawthorne effect. The analysis did not control for other factors such as the severity of the illness, the number of consultants used, or the degree of health literacy.
Implications
This study supports an important best practice highlighted in etiquette-based medicine 10: sitting at the bedside provided a benefit in the patient’s perception of communication by physicians without a negative effect on the physician’s workflow.
The Duration of Antibiotic Treatment in Community-Acquired Pneumonia: A Multi-Center Randomized Clinical Trial. Uranga A et al. JAMA Intern Medicine, 2016;176(9):1257-65.11
Background
The optimal duration of treatment for community-acquired pneumonia (CAP) is unclear; a growing body of evidence suggests shorter and longer durations may be equivalent.
Findings
At 4 hospitals in Spain, 312 adults with a mean age of 65 years and a diagnosis of CAP (non-ICU) were randomized to a short (5 days) versus a long (provider discretion) course of antibiotics. In the short-course group, the antibiotics were stopped after 5 days if the body temperature had been 37.8o C or less for 48 hours, and no more than 1 sign of clinical instability was present (SBP < 90 mmHg, HR >100/min, RR > 24/min, O2Sat < 90%). The median number of antibiotic days was 5 for the short-course group and 10 for the long-course group (P < .01). There was no difference in the resolution of pneumonia symptoms at 10 days or 30 days or in 30-day mortality. There were no differences in in-hospital side effects. However, 30-day readmissions were higher in the long-course group compared with the short-course group (6.6% vs 1.4%; P = .02). The results were similar across all of the Pneumonia Severity Index (PSI) classes.
Cautions
Most of the patients were not severely ill (~60% PSI I-III), the level of comorbid disease was low, and nearly 80% of the patients received fluoroquinolone. There was a significant cross over with 30% of patients assigned to the short-course group receiving antibiotics for more than 5 days.
Implications
Inpatient providers should aim to treat patients with community-acquired pneumonia (regardless of the severity of the illness) for 5 days. At day 5, if the patient is afebrile and has no signs of clinical instability, clinicians should be comfortable stopping antibiotics.
Is the Era of Intravenous Proton Pump Inhibitors Coming to an End in Patients with Bleeding Peptic Ulcers? A Meta-Analysis of the Published Literature. Jian Z et al. British Journal of Clinical Pharmacology, 2016;82(3):880-9.12
Background
Guidelines recommend intravenous proton pump inhibitors (PPI) after an endoscopy for patients with a bleeding peptic ulcer. Yet, acid suppression with oral PPI is deemed equivalent to the intravenous route.
Findings
This systematic review and meta-analysis identified 7 randomized controlled trials involving 859 patients. After an endoscopy, the patients were randomized to receive either oral or intravenous PPI. Most of the patients had “high-risk” peptic ulcers (active bleeding, a visible vessel, an adherent clot). The PPI dose and frequency varied between the studies. Re-bleeding rates were no different between the oral and intravenous route at 72 hours (2.4% vs 5.1%; P = .26), 7 days (5.6% vs 6.8%; P =.68), or 30 days (7.9% vs 8.8%; P = .62). There was also no difference in 30-day mortality (2.1% vs 2.4%; P = .88), and the length of stay was the same in both groups. Side effects were not reported.
Cautions
This systematic review and meta-analysis included multiple heterogeneous small studies of moderate quality. A large number of patients were excluded, increasing the risk of a selection bias.
Implications
There is no clear indication for intravenous PPI in the treatment of bleeding peptic ulcers following an endoscopy. Converting to oral PPI is equivalent to intravenous and is a safe, effective, and cost-saving option for patients with bleeding peptic ulcers.
References
1. Prandoni P, Lensing AW, Prins MH, et al. Prevalence of pulmonary embolism among patients hospitalized for syncope. N Engl J Med. 2016; 375(16):1524-1531. PubMed 2. Russo RJ, Costa HS, Silva PD, et al. Assessing the risks associated with MRI in patients with a pacemaker or defibrillator. N Engl J Med. 2017;376(8):755-764. PubMed 3. Linsenmeyer K, Gupta K, Strymish JM, Dhanani M, Brecher SM, Breu AC. Culture if spikes? Indications and yield of blood cultures in hospitalized medical patients. J Hosp Med. 2016;11(5):336-340. PubMed 4. Sun EC, Darnall BD, Baker LC, Mackey S. Incidence of and risk factors for chronic opioid use among opioid-naive patients in the postoperative period. JAMA Intern Med. 2016;176(9):1286-1293. PubMed 5. Pickering JW, Than MP, Cullen L, et al. Rapid rule-out of acute myocardial infarction with a single high-sensitivity cardiac troponin T measurement below the limit of detection: A collaborative meta-analysis. Ann Intern Med. 2017;166(10):715-724. PubMed 6. Thygesen K, Alpert JS, White HD, Jaffe AS, Apple FS, Galvani M, et al; Joint ESC/ACCF/AHA/WHF Task Force for the Redefinition of Myocardial Infarction. Universal definition of myocardial infarction. Circulation. 2007;116:2634-2653. PubMed 7. Aleva FE, Voets LWLM, Simons SO, de Mast Q, van der Ven AJAM, Heijdra YF. Prevalence and localization of pulmonary embolism in unexplained acute exacerbations of COPD: A systematic review and meta-analysis. Chest. 2017; 151(3):544-554. PubMed 8. Rizkallah J, Man SFP, Sin DD. Prevalence of pulmonary embolism in acute exacerbations of COPD: A systematic review and meta-analysis. Chest. 2009;135(3):786-793. PubMed 9. Merel SE, McKinney CM, Ufkes P, Kwan AC, White AA. Sitting at patients’ bedsides may improve patients’ perceptions of physician communication skills. J Hosp Med. 2016;11(12):865-868. PubMed 10. Kahn MW. Etiquette-based medicine. N Engl J Med. 2008;358(19):1988-1989. PubMed 11. Uranga A, España PP, Bilbao A, et al. Duration of antibiotic treatment in community-acquired pneumonia: A multicenter randomized clinical trial. JAMA Intern Med. 2016;176(9):1257-1265. PubMed 12. Jian Z, Li H, Race NS, Ma T, Jin H, Yin Z. Is the era of intravenous proton pump inhibitors coming to an end in patients with bleeding peptic ulcers? Meta-analysis of the published literature. Br J Clin Pharmacol. 2016;82(3):880-889. PubMed
Alfred Burger MD, FACP, SFHM, Senior Associate Program Director, Internal Medicine Residency,Mount Sinai Beth Israel, Icahn School of Medicine at Mount Sinai, 350 East 17th Street Baird Hall, 20th Floor, New York, NY 10003; Telephone: 212-420-2690; Fax: 212-420-4615; Email: [email protected]
Content Gating
Gated (full article locked unless allowed per User)
Alternative CME
Disqus Comments
Default
Gate On Date
Tue, 03/13/2018 - 06:00
Un-Gate On Date
Tue, 02/27/2018 - 06:00
Consolidated Pubs: Do Not Show Source Publication Logo
The 2015 National Academy of Sciences (NAS; formerly the Institute of Medicine [IOM]) report, Improving Diagnosis in Health Care, attributes up to 10% of patient deaths and 17% of hospital adverse events to diagnostic errors,1 one cause of which is absent or delayed follow-up of laboratory test results.2 Poor communication or follow-up of laboratory tests with abnormal results has been cited repeatedly as a threat to patient safety.1,3,4 In a survey of internists, 83% reported at least one unacceptably delayed laboratory test result during the previous 2 months.5
Care transitions magnify the risk of missed test results.6,7 Up to 16% of all emergency department (ED) and 23% of all hospitalized patients will have pending laboratory test results at release or discharge.6 The percentage of tests that received follow-up ranged from 1% to 75% for tests done in the ED and from 20% to 69% for tests ordered on inpatients. In one study, 41% of all surveyed medical inpatients had at least one test result pending at discharge (TPAD). When further studied, over 40% of the results were abnormal and 9% required action, but the responsible physicians were unaware of 62% of the test results.8 Many examples of morbidity from such failure have been reported. One of many described by El-Kareh et al., for example, is that of an 81-year-old man on total parenteral nutrition who was treated for suspected line infection and discharged without antibiotics, but whose blood cultures grew Klebsiella pneumoniae after his discharge.9 Another example, presented on the Agency for Healthcare Research and Quality (AHRQ) Patient Safety Network, reported a patient admitted for a urinary tract infection and then discharged from the hospital on trimethoprim–sulfamethoxazole. He returned to the hospital 11 days later with severe sepsis. Upon review, the urine culture results from his previous admission, which were returned 2 days after his discharge, indicated that the infectious agent was not sensitive to trimethoprim–sulfamethoxazole. The results had not been reviewed by hospital clinicians or forwarded to the patient’s physician, so the patient continued on the ineffective treatment. His second hospital admission lasted 7 days, but he made a complete recovery with the correct antibiotic.10
Several barriers impede the follow-up of TPAD. First, who should receive test results or who is responsible for addressing them may be unclear. Second, even if responsibility is clear, communication between the provider who ordered the test and the provider responsible for follow-up may be suboptimal.11 Finally, providers who need to follow up on abnormal results may not appreciate the urgency or significance of pending results.
The hospitalist model of care increases efficiency during hospitalization but further complicates care coordination.12 The hospitalist who orders a test may not be on duty at discharge or when test results are finalized. Primary care providers may have little contact with their patients during their admission.12 Effective communication between providers is key to ensuring appropriate follow-up care, but primary care physicians and hospital physicians communicate directly in 20% or fewer admissions.13 The hospital discharge summary is the primary method of communication with the next provider, but 65%–84% of all discharge summaries lack information on TPAD.13,14
In this work, we sought to identify and evaluate interventions aimed at improving documentation, communication, and follow-up of TPAD. This review was conducted through the Laboratory Medicine Best Practices (LMBP™) initiative, which is sponsored by the Centers for Disease Control and Prevention’s (CDC’s) Division of Laboratory Systems (https://wwwn.cdc.gov/labbestpractices/). The LMBP™ was initiated as the CDC’s response to the IOM report To Err is Human: Building a Safer Health System.15
METHODS
We applied the first four phases of the LMBP™-developed A-6 Cycle methodology to evaluate quality improvement practices as described below.16 Our report follows the Meta-analysis Of Observational Studies in Epidemiology (MOOSE) guidelines.17
Asking the Question
The full review, which is available from the corresponding author, assessed the evidence that the interventions improved (1) the timeliness of follow-up of TPAD or reduced adverse health events; (2) discharge planning, documentation, or communication with the outpatient care provider regarding TPAD; and (3) health outcomes. In this article, we present the impact of interventions to improve the documentation, communication, and follow-up of TPAD. The review protocol, which is also available from the corresponding author, was developed with the input of a panel of experts (Appendix A) in laboratory medicine, systematic reviews, informatics, and patient safety. The analytic framework (Appendix B) describes the scope of the review. The inclusion criteria for papers reporting on interventions to improve communication of TPAD are the following:
Population: Patients who were admitted to an inpatient facility or who visited an ED (including patients released from the ED) and who had one or more TPADs.
Interventions: Practices that explicitly aimed to improve the documentation, communication, or follow-up of TPAD, alone or as part of a broader quality improvement effort.
Comparators: Standard practice, pre-intervention practice, or any other valid comparator.
Outcomes: Documentation completeness, physician awareness of pending tests, or follow-up of TPAD.
Acquire the Evidence
A professional librarian conducted literature searches in PubMed, CINAHL, Cochrane, and EMBASE using terms that captured relevant health care settings, transition of patient care, laboratory tests, communication, and pending or missed tests (Appendix C). Citations were also identified by expert panel members and by manual searches of bibliographies of relevant studies. We included studies published in English in 2005 or later. We sought unpublished studies through expert panelists and queries to relevant professional organizations.
Appraise the Studies
Two independent reviewers evaluated each retrieved citation for inclusion. We excluded articles that (1) did not explicitly address laboratory TPAD; (2) were letters, editorials, commentaries, or abstracts; (3) did not address transition between settings; (4) did not include an intervention; (5) were case reports or case series; or (6) were not published in English. A team member abstracted predetermined data elements (Appendix D) from each included study, and a senior scientist reviewed the abstraction. Two senior scientists independently scored the quality of the eligible studies on the A-6 domains of study characteristics, practice description, outcome measures, and results and findings; studies scored below 4 points on a 10-point scale were excluded. Based on this appraisal, studies were classified as good, fair, or poor; poor studies were excluded.
Analyze the Evidence
We synthesized the evidence by intervention type and outcome. The strength of the evidence that each intervention improved the desired outcome was rated in accordance with the A-6 methodology as high, moderate, suggestive, or insufficient based on the number of studies, the study ratings, and the consistency and magnitude of the effect size.
RESULTS
We retrieved 9,592 abstracts and included 17 articles after full-text review and study-quality appraisal; of these, 8 provided evidence on communication of TPAD (Figure 1). These eight studies examined four types of interventions: (1) education to improve discharge summaries, (2) electronic tools to aid in preparation of discharge summaries, (3) electronic notification to physicians of pending tests, and (4) online access of test results for patients or parents. The Table and Figure 2 summarize the evidence for each intervention. The appendices provide detailed information on the characteristics of the included studies (Appendix E), the study interventions (Appendix F), and evidence tables (Appendix G).
Education to Improve Discharge Summaries
Three studies18-20 examined educational interventions to improve the completeness of discharge summaries, and all three were of fair quality with moderate effects. Two studies18,19 evaluated educational inventions for first-year residents or fellows and included individual instruction alone18 or in combination with a group session.19 Dinescu et al.18 found a 20% increase in the documentation of ordered tests, and a 39% increase in documented test results in discharge summaries (81% vs. 42%, P = .02) after the intervention. Key-Solle19 reported that individual sessions resulted in a 16.4% (P = .004) increase in the documentation of pending laboratory results in the discharge summary compared with that of the controls; the group session increased documentation by only 5% (P = .403).
Gandara et al.20 conducted a multi-site, multi-intervention study to improve completeness of information in discharge summaries, including documentation of TPAD. All sites implemented physician and nurse education. A significant trend (P < .001) toward more complete information overall was found after implementation; improvement in documentation of TPAD was not provided.
Electronic Tools for Preparation of Discharge Summaries
Two studies 21,22 investigated tools to aid preparation of discharge summaries. Kantor et al.,21 rated fair, evaluated an EMR-generated list of TPAD, and O’Leary et al.,22 rated good, evaluated an electronic discharge summary template. The EMR-generated list resulted in an absolute increase of 25% in the proportion of TPAD documented and of 18% in the percentage of discharge summaries with complete information on TPAD. An electronic discharge summary template increased the percentage of discharge summaries with complete information on TPAD by 32.4%.22 O’Leary et al.22 was the only study that reported a negative effect of an intervention. The authors found a 10% (P = .04) reduction in the documentation of clinically significant laboratory results after implementation of the electronic discharge summary.
Electronic Notifications to Physicians
One good study, El-Kareh et al.,23 and one fair study, Dalal et al.,24 examined the impact of electronic notification of pending laboratory tests or test results to physicians. El-Kareh et al.23 also provided evidence on improved follow-up of test results. Physicians in intervention clusters were three times more likely (OR 3.2 95% CI 1.3-8.4) to have documented follow-up of test results than those in control clusters.23 The absolute increase in awareness of TPAD was 20%,23,24 among primary care physicians and 12%23 or 38%24 among inpatient attending physicians in the intervention clusters.
Notification of Patients or Parents
One study evaluated the impact of online parental access to the results of laboratory tests ordered during a child’s ED visit.25 The intervention indirectly increased physician awareness of the test results: 36 parents (12% of enrolled families) reported informing their physician of the test results. Therapy changed for seven children (5% of 141 whose parents retrieved the child’s test results and completed the follow-up survey).
DISCUSSION
Evidence Summary
We identified four interventions aimed at improving follow-up of TPAD and found suggestive evidence indicating that individual education for preparers of discharge summaries improved the quality of discharge summary documentation of TPAD; however, this type of evidence is below the level of evidence required by the LMBP™ to issue a recommendation. Site variations in the type and timing of interventions,20 small sample size,18 short follow-up,18,19 lack of detail on educational content,18-20 and differences in evaluated interventions limited the evidence quality. The long-term impact of educational interventions is also a concern. Oluma et al., for example, found that the benefits of education interventions were not sustained over time.26
Two studies21,22 evaluated aids to completing discharge summaries. The aids, which include a list of TPADs21 and an electronic template,22 resulted in a substantial increase in the completeness of the documentation of TPAD. Because of the differences in the interventions and the limited number of studies obtained, the evidence was rated as suggestive.
Suggestive evidence that automated e-mail notifications increased awareness of TPAD results by inpatient attending physicians and primary care providers was found. A limitation of this evidence is that both studies23,24 retrieved were conducted at the same institution; thus, the findings may not be generalizable to other institutions. Only one paper25 examined the impact of patient or parental access to laboratory tests results on the primary care physician’s awareness and follow-up of TPAD; as such, we consider the available evidence insufficient to evaluate the intervention.
Limitations
The evidence regarding interventions to improve follow-up of TPAD is limited. The interventions evaluated varied considerably in design and implementation. Most studies were conducted at a single medical center. Few studies had concurrent controls, and even fewer were randomized trials. Some studies included multiple interventions, thereby rendering the isolation of the impact of any single intervention difficult to accomplish.
Comparison to Other Literature
We found no other reviews of interventions to improve follow-up of TPAD. A review of interventions to improve information transfer found that computer-generated discharge summaries improved the timeliness and, less consistently, completeness of the summary.13 The authors of this review13 recommended computer-generated structured summaries that highlight the most pertinent information for follow-up care, as supported by a recent qualitative exploration of care coordination between hospitalists and primary care physicians.27
CONCLUSIONS
Successful follow-up of TPAD during care transition is a multistep process requiring identification and documentation of TPAD, notification of person responsible for follow-up, and their recognition and execution of the appropriate follow-up actions. We found suggestive evidence that individual education and tools, such as automated templates or abstraction, can improve documentation of TPADs and that automated alerts to the physician responsible for follow-up can improve awareness of TPAD results. The interventions were distinct; evidence from one intervention and outcome should be applied cautiously to other interventions and outcomes.
None of the interventions completely resolved the problems of documentation, awareness, or follow-up of TPAD. New interventions should consider the barriers to coordination identified by Jones et al.27 and Callen et al.7 Both studies identified a lack of systems, policies, and practices to support communication across different settings, including lack of access or difficulty navigating electronic medical records at other institutions; unclear or varied accountability for follow-up care; and inconsistent receipt of discharge documents after initial follow-up visit. These systemic problems were exacerbated by a lack of personal relationships between the community physicians, hospital, and ED clinicians, and between acute care clinicians and patients. In EDs, high patient throughput and short length of stay were found to contribute to these barriers. Although laboratories have a responsibility, required by CLIA regulations, to ensure the accurate and complete transmission of test reports,28 none of the interventions appeared to include laboratorians as stakeholders during the design, implementation, or evaluation of the interventions. Incorporating laboratory personnel and processes into the design of follow-up solutions may increase their effectiveness.
Medical informatics tools have the potential to improve patient safety during care transitions. Unfortunately, the evidence regarding informatics interventions to improve follow-up of TPAD was limited by both the number and the quality of the published studies. In addition, better-designed studies in this area are needed. Studies of interventions to improve follow-up of TPAD need to include well-chosen comparator populations and single, well-defined interventions. Evaluation of the interventions would be strengthened if the studies measured both the targeted outcome of the intervention, such as physician awareness of TPAD, and its impact on patient outcomes. Evaluation of the generalizability of the interventions would be strengthened by multi-site studies and, where appropriate, application of the same intervention to multiple study populations. As failure to communicate or follow up on abnormal laboratory tests is a critical threat to patient safety, more research and interventions to address this problem are urgently needed.
Acknowledgments
The authors appreciate the thoughtful insights offered by the following expert panel members: Joanne Callen, PhD; Julie Gayken, MT; Eric Poon, MD; Meera Viswanathan, PhD; and David West, PhD. The authors thank Dr. Jennifer Taylor for her review of the draft manuscript.
Funding
This work was funded by contract number 200-2014-F-61251 from the Centers for Disease Control and Prevention, Division of Laboratory Systems. Dr. Singh was additionally supported by the Houston VA HSR&D Center for Innovations in Quality, Effectiveness, and Safety (CIN 13-413).
Disclaimer
The findings and conclusions in this study are those of the authors and do not necessarily represent the official position of the Centers for Disease Control and Prevention or the Department of Veterans Affairs.
Disclosures
Drs. Whitehead, Graber, and Meleth, Ms. Kennedy, and Mr. Epner received funding for their work on this manuscript (Contract No. 200-2014-F-61251) from the Centers for Disease Control and Prevention. Dr. Graber receives honoraria from several institutions for presentations on diagnostic errors and has a grant from the Macy Foundation to develop a curriculum on diagnostic errors. Unrelated to this publication, Mr. Epner receives payment as a board member of Silicon BioDevices, as a consultant to Kaiser Foundation Health Plan of Colorado, for lectures from Sysmex, Inc., and for meeting expenses from Abbott Laboratories. He has stock or stock options in Silicon BioDevices, Inc. and Viewics, Inc. No other authors have any financial conflicts to report.
1. National Academies of Sciences E, and Medicine. Improving diagnosis in health care. 2015. http://www.nap.edu/catalog/21794/improving-diagnosis-in-health-care. Accessed January 8, 2018. 2. Schiff GD, Hasan O, Kim S, et al. Diagnostic error in medicine: analysis of 583 physician-reported errors. Arch Intern Med. 2009;169(20):1881-1887. PubMed 3. World Alliance for Patient Safety. Summary of the evidence on patient safety: Implications for research. Geneva, Switzerland; 2008. 4. The Joint Commission. National patient safety goals. Effective January 1, 2015. NPSG.02.03.012015. 5. Poon EG, Gandhi TK, Sequist TD, Murff HJ, Karson AS, Bates DW. “I wish I had seen this test result earlier!”: Dissatisfaction with test result management systems in primary care. Arch Intern Med. 2004;164(20):2223-2228. PubMed 6. Callen J, Georgiou A, Li J, Westbrook JI. The safety implications of missed test results for hospitalised patients: a systematic review. BMJ Quality Safety. 2011;20(2):194-199. PubMed 7. Callen JL, Westbrook JI, Georgiou A, Li J. Failure to follow-up test results for ambulatory patients: a systematic review. J Gen Intern Med. 2012;27(10):1334-1348. PubMed 8. Roy CL, Poon EG, Karson AS, et al. Patient safety concerns arising from test results that return after hospital discharge. Ann Intern Med. 2005;143(2):121-128. PubMed 9. El-Kareh R, Roy C, Brodsky G, Perencevich M, Poon EG. Incidence and predictors of microbiology results returning postdischarge and requiring follow-up. J Hosp Med. 2011;6(5):291-296. PubMed 10. Coffey C. Treatment Challenges After Discharge. WebM&M, Cases & Commentaries. 2010;(November 29, 2010). https://psnet.ahrq.gov/webmm/case/227/treatment-challenges-after-discharge. Accessed November 2010. 11. Dalal AK, Schnipper JL, Poon EG, et al. Design and implementation of an automated email notification system for results of tests pending at discharge. J Am Med Inform Assoc. 2012;19(4):523-528. PubMed 12. Wachter RM, Goldman L. The hospitalist movement 5 years later. JAMA. 2002;287(4):487-494. PubMed 13. Kripalani S, LeFevre F, Phillips CO, Williams MV, Basaviah P, Baker DW. Deficits in communication and information transfer between hospital-based and primary care physicians: implications for patient safety and continuity of care. JAMA. 2007;297(8):831-841. PubMed 14. Were MC, Li X, Kesterson J, et al. Adequacy of hospital discharge summaries in documenting tests with pending results and outpatient follow-up providers. J Gen Intern Med. 2009;24(9):1002-1006. PubMed 15. Institute of Medicine. To err is human : building a safer health system Washington, DC.1999. 16. Christenson RH, Snyder SR, Shaw CS, et al. Laboratory medicine best practices: systematic evidence review and evaluation methods for quality improvement. Clin Chem. 2011;57(6):816-825. PubMed 17. Stroup DF, Berlin JA, Morton SC, et al. Meta-analysis of observational studies in epidemiology: a proposal for reporting. Meta-analysis Of Observational Studies in Epidemiology (MOOSE) group. JAMA. 2000;283(15):2008-2012. PubMed 18. Dinescu A, Fernandez H, Ross JS, Karani R. Audit and feedback: An intervention to improve discharge summary completion. J Hosp Med. 2011;6:28-32. PubMed 19. Key-Solle M, Paulk E, Bradford K, Skinner AC, Lewis MC, Shomaker K. Improving the quality of discharge communication with an educational intervention. Pediatrics. 2010;126:734-739. PubMed 20. Gandara E, Ungar J, Lee J, Chan-Macrae M, O’Malley T, Schnipper JL. Discharge documentation of patients discharged to subacute facilities: A three-year quality improvement process across an integrated health care system. Jt Comm J Qual Patient Saf. 2010;36:243-251. PubMed 21. Kantor MA, Evans KH, Shieh L. Pending Studies at Hospital Discharge: A Pre-post Analysis of an Electronic Medical Record Tool to Improve Communication at Hospital Discharge. J Gen Intern Med. 2014;30(3):312-318. PubMed 22. O’Leary KJ, Liebovitz DM, Feinglass J, et al. Creating a better discharge summary: improvement in quality and timeliness using an electronic discharge summary. J Hosp Med. 2009;4(4):219-225. PubMed 23. El-Kareh R, Roy C, Williams DH, Poon EG. Impact of automated alerts on follow-up of post-discharge microbiology results: a cluster randomized controlled trial. J Gen Intern Med. 2012;27:1243-1250. PubMed 24. Dalal AK, Roy CL, Poon EG, et al. Impact of an automated email notification system for results of tests pending at discharge: a cluster-randomized controlled trial. J Am Med Inform Assoc. 2014;21(3):473-480. PubMed 25. Goldman RD, Antoon R, Tait G, Zimmer D, Viegas A, Mounstephen B. Culture results via the internet: A novel way for communication after an emergency department visit. J Pediatr. 2005;147:221-226. PubMed 26. Olomu AB, Stommel M, Holmes-Rovner MM, et al. Is quality improvement sustainable? Findings of the American College of Cardiology’s Guidelines applied in practice. Int J Qual Health Care. 2014;26(3):215-222. PubMed 27. Jones CD, Vu MB, O’Donnell CM, et al. A failure to communicate: a qualitative exploration of care coordination between hospitalists and primary care providers around patient hospitalizations. J Gen Intern Med. 2015;30(4):417-424. PubMed 28. Clinical Laboratory Improvement Amendments Regulations, 42 CFR 493.1291(a)(1988). PubMed
The 2015 National Academy of Sciences (NAS; formerly the Institute of Medicine [IOM]) report, Improving Diagnosis in Health Care, attributes up to 10% of patient deaths and 17% of hospital adverse events to diagnostic errors,1 one cause of which is absent or delayed follow-up of laboratory test results.2 Poor communication or follow-up of laboratory tests with abnormal results has been cited repeatedly as a threat to patient safety.1,3,4 In a survey of internists, 83% reported at least one unacceptably delayed laboratory test result during the previous 2 months.5
Care transitions magnify the risk of missed test results.6,7 Up to 16% of all emergency department (ED) and 23% of all hospitalized patients will have pending laboratory test results at release or discharge.6 The percentage of tests that received follow-up ranged from 1% to 75% for tests done in the ED and from 20% to 69% for tests ordered on inpatients. In one study, 41% of all surveyed medical inpatients had at least one test result pending at discharge (TPAD). When further studied, over 40% of the results were abnormal and 9% required action, but the responsible physicians were unaware of 62% of the test results.8 Many examples of morbidity from such failure have been reported. One of many described by El-Kareh et al., for example, is that of an 81-year-old man on total parenteral nutrition who was treated for suspected line infection and discharged without antibiotics, but whose blood cultures grew Klebsiella pneumoniae after his discharge.9 Another example, presented on the Agency for Healthcare Research and Quality (AHRQ) Patient Safety Network, reported a patient admitted for a urinary tract infection and then discharged from the hospital on trimethoprim–sulfamethoxazole. He returned to the hospital 11 days later with severe sepsis. Upon review, the urine culture results from his previous admission, which were returned 2 days after his discharge, indicated that the infectious agent was not sensitive to trimethoprim–sulfamethoxazole. The results had not been reviewed by hospital clinicians or forwarded to the patient’s physician, so the patient continued on the ineffective treatment. His second hospital admission lasted 7 days, but he made a complete recovery with the correct antibiotic.10
Several barriers impede the follow-up of TPAD. First, who should receive test results or who is responsible for addressing them may be unclear. Second, even if responsibility is clear, communication between the provider who ordered the test and the provider responsible for follow-up may be suboptimal.11 Finally, providers who need to follow up on abnormal results may not appreciate the urgency or significance of pending results.
The hospitalist model of care increases efficiency during hospitalization but further complicates care coordination.12 The hospitalist who orders a test may not be on duty at discharge or when test results are finalized. Primary care providers may have little contact with their patients during their admission.12 Effective communication between providers is key to ensuring appropriate follow-up care, but primary care physicians and hospital physicians communicate directly in 20% or fewer admissions.13 The hospital discharge summary is the primary method of communication with the next provider, but 65%–84% of all discharge summaries lack information on TPAD.13,14
In this work, we sought to identify and evaluate interventions aimed at improving documentation, communication, and follow-up of TPAD. This review was conducted through the Laboratory Medicine Best Practices (LMBP™) initiative, which is sponsored by the Centers for Disease Control and Prevention’s (CDC’s) Division of Laboratory Systems (https://wwwn.cdc.gov/labbestpractices/). The LMBP™ was initiated as the CDC’s response to the IOM report To Err is Human: Building a Safer Health System.15
METHODS
We applied the first four phases of the LMBP™-developed A-6 Cycle methodology to evaluate quality improvement practices as described below.16 Our report follows the Meta-analysis Of Observational Studies in Epidemiology (MOOSE) guidelines.17
Asking the Question
The full review, which is available from the corresponding author, assessed the evidence that the interventions improved (1) the timeliness of follow-up of TPAD or reduced adverse health events; (2) discharge planning, documentation, or communication with the outpatient care provider regarding TPAD; and (3) health outcomes. In this article, we present the impact of interventions to improve the documentation, communication, and follow-up of TPAD. The review protocol, which is also available from the corresponding author, was developed with the input of a panel of experts (Appendix A) in laboratory medicine, systematic reviews, informatics, and patient safety. The analytic framework (Appendix B) describes the scope of the review. The inclusion criteria for papers reporting on interventions to improve communication of TPAD are the following:
Population: Patients who were admitted to an inpatient facility or who visited an ED (including patients released from the ED) and who had one or more TPADs.
Interventions: Practices that explicitly aimed to improve the documentation, communication, or follow-up of TPAD, alone or as part of a broader quality improvement effort.
Comparators: Standard practice, pre-intervention practice, or any other valid comparator.
Outcomes: Documentation completeness, physician awareness of pending tests, or follow-up of TPAD.
Acquire the Evidence
A professional librarian conducted literature searches in PubMed, CINAHL, Cochrane, and EMBASE using terms that captured relevant health care settings, transition of patient care, laboratory tests, communication, and pending or missed tests (Appendix C). Citations were also identified by expert panel members and by manual searches of bibliographies of relevant studies. We included studies published in English in 2005 or later. We sought unpublished studies through expert panelists and queries to relevant professional organizations.
Appraise the Studies
Two independent reviewers evaluated each retrieved citation for inclusion. We excluded articles that (1) did not explicitly address laboratory TPAD; (2) were letters, editorials, commentaries, or abstracts; (3) did not address transition between settings; (4) did not include an intervention; (5) were case reports or case series; or (6) were not published in English. A team member abstracted predetermined data elements (Appendix D) from each included study, and a senior scientist reviewed the abstraction. Two senior scientists independently scored the quality of the eligible studies on the A-6 domains of study characteristics, practice description, outcome measures, and results and findings; studies scored below 4 points on a 10-point scale were excluded. Based on this appraisal, studies were classified as good, fair, or poor; poor studies were excluded.
Analyze the Evidence
We synthesized the evidence by intervention type and outcome. The strength of the evidence that each intervention improved the desired outcome was rated in accordance with the A-6 methodology as high, moderate, suggestive, or insufficient based on the number of studies, the study ratings, and the consistency and magnitude of the effect size.
RESULTS
We retrieved 9,592 abstracts and included 17 articles after full-text review and study-quality appraisal; of these, 8 provided evidence on communication of TPAD (Figure 1). These eight studies examined four types of interventions: (1) education to improve discharge summaries, (2) electronic tools to aid in preparation of discharge summaries, (3) electronic notification to physicians of pending tests, and (4) online access of test results for patients or parents. The Table and Figure 2 summarize the evidence for each intervention. The appendices provide detailed information on the characteristics of the included studies (Appendix E), the study interventions (Appendix F), and evidence tables (Appendix G).
Education to Improve Discharge Summaries
Three studies18-20 examined educational interventions to improve the completeness of discharge summaries, and all three were of fair quality with moderate effects. Two studies18,19 evaluated educational inventions for first-year residents or fellows and included individual instruction alone18 or in combination with a group session.19 Dinescu et al.18 found a 20% increase in the documentation of ordered tests, and a 39% increase in documented test results in discharge summaries (81% vs. 42%, P = .02) after the intervention. Key-Solle19 reported that individual sessions resulted in a 16.4% (P = .004) increase in the documentation of pending laboratory results in the discharge summary compared with that of the controls; the group session increased documentation by only 5% (P = .403).
Gandara et al.20 conducted a multi-site, multi-intervention study to improve completeness of information in discharge summaries, including documentation of TPAD. All sites implemented physician and nurse education. A significant trend (P < .001) toward more complete information overall was found after implementation; improvement in documentation of TPAD was not provided.
Electronic Tools for Preparation of Discharge Summaries
Two studies 21,22 investigated tools to aid preparation of discharge summaries. Kantor et al.,21 rated fair, evaluated an EMR-generated list of TPAD, and O’Leary et al.,22 rated good, evaluated an electronic discharge summary template. The EMR-generated list resulted in an absolute increase of 25% in the proportion of TPAD documented and of 18% in the percentage of discharge summaries with complete information on TPAD. An electronic discharge summary template increased the percentage of discharge summaries with complete information on TPAD by 32.4%.22 O’Leary et al.22 was the only study that reported a negative effect of an intervention. The authors found a 10% (P = .04) reduction in the documentation of clinically significant laboratory results after implementation of the electronic discharge summary.
Electronic Notifications to Physicians
One good study, El-Kareh et al.,23 and one fair study, Dalal et al.,24 examined the impact of electronic notification of pending laboratory tests or test results to physicians. El-Kareh et al.23 also provided evidence on improved follow-up of test results. Physicians in intervention clusters were three times more likely (OR 3.2 95% CI 1.3-8.4) to have documented follow-up of test results than those in control clusters.23 The absolute increase in awareness of TPAD was 20%,23,24 among primary care physicians and 12%23 or 38%24 among inpatient attending physicians in the intervention clusters.
Notification of Patients or Parents
One study evaluated the impact of online parental access to the results of laboratory tests ordered during a child’s ED visit.25 The intervention indirectly increased physician awareness of the test results: 36 parents (12% of enrolled families) reported informing their physician of the test results. Therapy changed for seven children (5% of 141 whose parents retrieved the child’s test results and completed the follow-up survey).
DISCUSSION
Evidence Summary
We identified four interventions aimed at improving follow-up of TPAD and found suggestive evidence indicating that individual education for preparers of discharge summaries improved the quality of discharge summary documentation of TPAD; however, this type of evidence is below the level of evidence required by the LMBP™ to issue a recommendation. Site variations in the type and timing of interventions,20 small sample size,18 short follow-up,18,19 lack of detail on educational content,18-20 and differences in evaluated interventions limited the evidence quality. The long-term impact of educational interventions is also a concern. Oluma et al., for example, found that the benefits of education interventions were not sustained over time.26
Two studies21,22 evaluated aids to completing discharge summaries. The aids, which include a list of TPADs21 and an electronic template,22 resulted in a substantial increase in the completeness of the documentation of TPAD. Because of the differences in the interventions and the limited number of studies obtained, the evidence was rated as suggestive.
Suggestive evidence that automated e-mail notifications increased awareness of TPAD results by inpatient attending physicians and primary care providers was found. A limitation of this evidence is that both studies23,24 retrieved were conducted at the same institution; thus, the findings may not be generalizable to other institutions. Only one paper25 examined the impact of patient or parental access to laboratory tests results on the primary care physician’s awareness and follow-up of TPAD; as such, we consider the available evidence insufficient to evaluate the intervention.
Limitations
The evidence regarding interventions to improve follow-up of TPAD is limited. The interventions evaluated varied considerably in design and implementation. Most studies were conducted at a single medical center. Few studies had concurrent controls, and even fewer were randomized trials. Some studies included multiple interventions, thereby rendering the isolation of the impact of any single intervention difficult to accomplish.
Comparison to Other Literature
We found no other reviews of interventions to improve follow-up of TPAD. A review of interventions to improve information transfer found that computer-generated discharge summaries improved the timeliness and, less consistently, completeness of the summary.13 The authors of this review13 recommended computer-generated structured summaries that highlight the most pertinent information for follow-up care, as supported by a recent qualitative exploration of care coordination between hospitalists and primary care physicians.27
CONCLUSIONS
Successful follow-up of TPAD during care transition is a multistep process requiring identification and documentation of TPAD, notification of person responsible for follow-up, and their recognition and execution of the appropriate follow-up actions. We found suggestive evidence that individual education and tools, such as automated templates or abstraction, can improve documentation of TPADs and that automated alerts to the physician responsible for follow-up can improve awareness of TPAD results. The interventions were distinct; evidence from one intervention and outcome should be applied cautiously to other interventions and outcomes.
None of the interventions completely resolved the problems of documentation, awareness, or follow-up of TPAD. New interventions should consider the barriers to coordination identified by Jones et al.27 and Callen et al.7 Both studies identified a lack of systems, policies, and practices to support communication across different settings, including lack of access or difficulty navigating electronic medical records at other institutions; unclear or varied accountability for follow-up care; and inconsistent receipt of discharge documents after initial follow-up visit. These systemic problems were exacerbated by a lack of personal relationships between the community physicians, hospital, and ED clinicians, and between acute care clinicians and patients. In EDs, high patient throughput and short length of stay were found to contribute to these barriers. Although laboratories have a responsibility, required by CLIA regulations, to ensure the accurate and complete transmission of test reports,28 none of the interventions appeared to include laboratorians as stakeholders during the design, implementation, or evaluation of the interventions. Incorporating laboratory personnel and processes into the design of follow-up solutions may increase their effectiveness.
Medical informatics tools have the potential to improve patient safety during care transitions. Unfortunately, the evidence regarding informatics interventions to improve follow-up of TPAD was limited by both the number and the quality of the published studies. In addition, better-designed studies in this area are needed. Studies of interventions to improve follow-up of TPAD need to include well-chosen comparator populations and single, well-defined interventions. Evaluation of the interventions would be strengthened if the studies measured both the targeted outcome of the intervention, such as physician awareness of TPAD, and its impact on patient outcomes. Evaluation of the generalizability of the interventions would be strengthened by multi-site studies and, where appropriate, application of the same intervention to multiple study populations. As failure to communicate or follow up on abnormal laboratory tests is a critical threat to patient safety, more research and interventions to address this problem are urgently needed.
Acknowledgments
The authors appreciate the thoughtful insights offered by the following expert panel members: Joanne Callen, PhD; Julie Gayken, MT; Eric Poon, MD; Meera Viswanathan, PhD; and David West, PhD. The authors thank Dr. Jennifer Taylor for her review of the draft manuscript.
Funding
This work was funded by contract number 200-2014-F-61251 from the Centers for Disease Control and Prevention, Division of Laboratory Systems. Dr. Singh was additionally supported by the Houston VA HSR&D Center for Innovations in Quality, Effectiveness, and Safety (CIN 13-413).
Disclaimer
The findings and conclusions in this study are those of the authors and do not necessarily represent the official position of the Centers for Disease Control and Prevention or the Department of Veterans Affairs.
Disclosures
Drs. Whitehead, Graber, and Meleth, Ms. Kennedy, and Mr. Epner received funding for their work on this manuscript (Contract No. 200-2014-F-61251) from the Centers for Disease Control and Prevention. Dr. Graber receives honoraria from several institutions for presentations on diagnostic errors and has a grant from the Macy Foundation to develop a curriculum on diagnostic errors. Unrelated to this publication, Mr. Epner receives payment as a board member of Silicon BioDevices, as a consultant to Kaiser Foundation Health Plan of Colorado, for lectures from Sysmex, Inc., and for meeting expenses from Abbott Laboratories. He has stock or stock options in Silicon BioDevices, Inc. and Viewics, Inc. No other authors have any financial conflicts to report.
References
1. National Academies of Sciences E, and Medicine. Improving diagnosis in health care. 2015. http://www.nap.edu/catalog/21794/improving-diagnosis-in-health-care. Accessed January 8, 2018. 2. Schiff GD, Hasan O, Kim S, et al. Diagnostic error in medicine: analysis of 583 physician-reported errors. Arch Intern Med. 2009;169(20):1881-1887. PubMed 3. World Alliance for Patient Safety. Summary of the evidence on patient safety: Implications for research. Geneva, Switzerland; 2008. 4. The Joint Commission. National patient safety goals. Effective January 1, 2015. NPSG.02.03.012015. 5. Poon EG, Gandhi TK, Sequist TD, Murff HJ, Karson AS, Bates DW. “I wish I had seen this test result earlier!”: Dissatisfaction with test result management systems in primary care. Arch Intern Med. 2004;164(20):2223-2228. PubMed 6. Callen J, Georgiou A, Li J, Westbrook JI. The safety implications of missed test results for hospitalised patients: a systematic review. BMJ Quality Safety. 2011;20(2):194-199. PubMed 7. Callen JL, Westbrook JI, Georgiou A, Li J. Failure to follow-up test results for ambulatory patients: a systematic review. J Gen Intern Med. 2012;27(10):1334-1348. PubMed 8. Roy CL, Poon EG, Karson AS, et al. Patient safety concerns arising from test results that return after hospital discharge. Ann Intern Med. 2005;143(2):121-128. PubMed 9. El-Kareh R, Roy C, Brodsky G, Perencevich M, Poon EG. Incidence and predictors of microbiology results returning postdischarge and requiring follow-up. J Hosp Med. 2011;6(5):291-296. PubMed 10. Coffey C. Treatment Challenges After Discharge. WebM&M, Cases & Commentaries. 2010;(November 29, 2010). https://psnet.ahrq.gov/webmm/case/227/treatment-challenges-after-discharge. Accessed November 2010. 11. Dalal AK, Schnipper JL, Poon EG, et al. Design and implementation of an automated email notification system for results of tests pending at discharge. J Am Med Inform Assoc. 2012;19(4):523-528. PubMed 12. Wachter RM, Goldman L. The hospitalist movement 5 years later. JAMA. 2002;287(4):487-494. PubMed 13. Kripalani S, LeFevre F, Phillips CO, Williams MV, Basaviah P, Baker DW. Deficits in communication and information transfer between hospital-based and primary care physicians: implications for patient safety and continuity of care. JAMA. 2007;297(8):831-841. PubMed 14. Were MC, Li X, Kesterson J, et al. Adequacy of hospital discharge summaries in documenting tests with pending results and outpatient follow-up providers. J Gen Intern Med. 2009;24(9):1002-1006. PubMed 15. Institute of Medicine. To err is human : building a safer health system Washington, DC.1999. 16. Christenson RH, Snyder SR, Shaw CS, et al. Laboratory medicine best practices: systematic evidence review and evaluation methods for quality improvement. Clin Chem. 2011;57(6):816-825. PubMed 17. Stroup DF, Berlin JA, Morton SC, et al. Meta-analysis of observational studies in epidemiology: a proposal for reporting. Meta-analysis Of Observational Studies in Epidemiology (MOOSE) group. JAMA. 2000;283(15):2008-2012. PubMed 18. Dinescu A, Fernandez H, Ross JS, Karani R. Audit and feedback: An intervention to improve discharge summary completion. J Hosp Med. 2011;6:28-32. PubMed 19. Key-Solle M, Paulk E, Bradford K, Skinner AC, Lewis MC, Shomaker K. Improving the quality of discharge communication with an educational intervention. Pediatrics. 2010;126:734-739. PubMed 20. Gandara E, Ungar J, Lee J, Chan-Macrae M, O’Malley T, Schnipper JL. Discharge documentation of patients discharged to subacute facilities: A three-year quality improvement process across an integrated health care system. Jt Comm J Qual Patient Saf. 2010;36:243-251. PubMed 21. Kantor MA, Evans KH, Shieh L. Pending Studies at Hospital Discharge: A Pre-post Analysis of an Electronic Medical Record Tool to Improve Communication at Hospital Discharge. J Gen Intern Med. 2014;30(3):312-318. PubMed 22. O’Leary KJ, Liebovitz DM, Feinglass J, et al. Creating a better discharge summary: improvement in quality and timeliness using an electronic discharge summary. J Hosp Med. 2009;4(4):219-225. PubMed 23. El-Kareh R, Roy C, Williams DH, Poon EG. Impact of automated alerts on follow-up of post-discharge microbiology results: a cluster randomized controlled trial. J Gen Intern Med. 2012;27:1243-1250. PubMed 24. Dalal AK, Roy CL, Poon EG, et al. Impact of an automated email notification system for results of tests pending at discharge: a cluster-randomized controlled trial. J Am Med Inform Assoc. 2014;21(3):473-480. PubMed 25. Goldman RD, Antoon R, Tait G, Zimmer D, Viegas A, Mounstephen B. Culture results via the internet: A novel way for communication after an emergency department visit. J Pediatr. 2005;147:221-226. PubMed 26. Olomu AB, Stommel M, Holmes-Rovner MM, et al. Is quality improvement sustainable? Findings of the American College of Cardiology’s Guidelines applied in practice. Int J Qual Health Care. 2014;26(3):215-222. PubMed 27. Jones CD, Vu MB, O’Donnell CM, et al. A failure to communicate: a qualitative exploration of care coordination between hospitalists and primary care providers around patient hospitalizations. J Gen Intern Med. 2015;30(4):417-424. PubMed 28. Clinical Laboratory Improvement Amendments Regulations, 42 CFR 493.1291(a)(1988). PubMed
Laurina Williams, PhD, MPH, Centers for Disease Control and Prevention, Center for Surveillance, Epidemiology, and Laboratory Services, Division of Laboratory Systems,1600 Clifton Road, NE, MS G25, Atlanta, GA 30329; Telephone: (404) 498-2267; Fax: 404-498-2215 E-mail: [email protected]
Content Gating
Gated (full article locked unless allowed per User)
Alternative CME
Disqus Comments
Default
Gate On Date
Tue, 03/13/2018 - 06:00
Un-Gate On Date
Tue, 02/27/2018 - 06:00
Consolidated Pubs: Do Not Show Source Publication Logo