User login
A 50-year-old woman with new-onset seizure
A 50-year-old woman presented to the emergency department after a witnessed loss of consciousness and seizurelike activity. She reported that she had been sitting outside her home, drinking coffee in the morning, but became very lightheaded when she went back into her house. At that time she felt could not focus and had a sense of impending doom. She sat down in a chair and her symptoms worsened.
According to her family, her eyes rolled back and she became rigid. The family helped her to the floor. Her body then made jerking movements that lasted for about 1 minute. She regained consciousness but was very confused for about 10 minutes until emergency medical services personnel arrived. She had no recollection of passing out. She said nothing like this had ever happened to her before.
On arrival in the emergency department, she complained of generalized headache and muscle soreness. She said the headache had been present for 1 week and was constant and dull. There were no aggravating or alleviating factors associated with the headache, and she denied fever, chills, nausea, numbness, tingling, incontinence, tongue biting, tremor, poor balance, ringing in ears, speech difficulty, or weakness.
Medical history: Multiple problems, medications
The patient’s medical history included depression, hypertension, anxiety, osteoarthritis, and asthma. She was allergic to penicillin. She had undergone carpal tunnel surgery on her right hand 5 years previously. She was perimenopausal with no children.
She denied using illicit drugs. She said she had smoked a half pack of cigarettes per day for more than 10 years and was a current smoker but was actively trying to quit. She said she occasionally used alcohol but had not consumed any alcohol in the last 2 weeks.
She had no history of central nervous system infection. She did report an episode of head trauma in grade school when a portable basketball hoop fell, striking her on the top of the head and causing her to briefly lose consciousness, but she did not seek medical attention.
She had no family history of seizure or neurologic disease.
Her current medications included atenolol, naproxen, gabapentin, venlafaxine, zolpidem, lorazepam, bupropion, and meloxicam. The bupropion and lorazepam had been prescribed recently for her anxiety. She reported that she had been given only 10 tablets of lorazepam and had taken the last tablet 48 hours previously. She had been taking the bupropion for 7 days. She reported an increase in stress lately and had been taking zolpidem due to an altered sleep pattern.
PHYSICAL EXAMINATION, INITIAL TESTS
On examination, the patient did not appear to be in acute distress. Her blood pressure was 107/22 mm Hg, pulse 100 beats per minute, respiratory rate 16 breaths per minute, temperature 37.1°C (98.8°F), and oxygen saturation 98% on room air.
Examination of her head, eyes, mouth, and neck were unremarkable. Cardiovascular, pulmonary, and abdominal examinations were normal. She had no neurologic deficits and was fully alert and oriented. She had no visible injuries.
Blood and urine samples were obtained about 15 minutes after her arrival to the emergency department. Results showed:
- Glucose 73 mg/dL (reference range 74–99)
- Sodium 142 mmol/L (136–144)
- Blood urea nitrogen 12 mg/dL (7–21)
- Creatinine 0.95 mg/dL (0.58–0.96)
- Chloride 97 mmol/L (97–105)
- Carbon dioxide (bicarbonate) 16 mmol/L (22–30)
- Prolactin 50.9 ng/mL (4.5–26.8)
- Anion gap 29 mmol/L (9–18)
- Ethanol undetectable
- White blood cell count 11.03 × 10⁹/L (3.70–11.00)
- Creatine kinase 89 U/L (30–220)
- Urinalysis normal, specific gravity 1.010 (1.005–1.030), no detectable ketones, and no crystals seen on microscopic evaluation.
Electrocardiography showed normal sinus rhythm with no ectopy and no ST-segment changes. Chest radiography was negative for any acute process.
The patient was transferred to the 23-hour observation unit in stable condition for further evaluation, monitoring, and management.
SIGNS AND SYMPTOMS OF SEIZURE
1. What findings are consistent with seizure?
- Jerking movements
- Confusion following the event
- Tongue-biting
- Focal motor weakness
- Urinary incontinence
- Aura before the event
All of the above findings are consistent with seizure.
The first consideration in evaluating a patient who presents with a possible seizure is whether the patient’s recollections of the event—and those of the witnesses—are consistent with the symptoms of seizure.1
In generalized tonic-clonic or grand mal seizure, the patient may experience an aura or subjective sensations before the onset. These vary greatly among patients.2 There may be an initial vocalization at the onset of the seizure, such as crying out or unintelligible speech. The patient’s eyes may roll back in the head. This is followed by loss of muscle tone, and if the patient is standing, he or she may fall to the ground. The patient becomes unresponsive and may go into respiratory arrest. There is tonic stiffening of the limbs and body, followed by clonic movements typically lasting 1 to 2 minutes, or sometimes longer.1,3,4 The patient will then relax and experience a period of unconsciousness or confusion (postictal state).
Urinary incontinence and tongue-biting strongly suggest seizure activity, and turning the head to one side and posturing may also be seen.3,5 After the event, the patient may report headache, generalized muscle soreness, exhaustion, or periods of transient focal weakness, also known as Todd paralysis.2,5
Our patient had aura-like symptoms at the outset. She felt very lightheaded, had difficulty focusing, and felt a sense of impending doom. She did not make any vocalizations at the onset, but her eyes did roll backward and she became rigid (tonic). She then lost muscle tone and became unresponsive. Her family had to help her to the floor. Jerking (clonic) movements were witnessed.
She regained consciousness but was described as being confused (postictal) for 10 minutes. Additionally, she denied ever having had symptoms like this previously. On arrival in the emergency department, she reported generalized headache and muscle soreness, but no tongue-biting or urinary incontinence. Her event did not last for more than 1 to 2 minutes according to her family.
Her symptoms strongly suggest new-onset tonic-clonic or grand mal seizure, though this is not completely certain.
LABORATORY FINDINGS IN SEIZURES
2. What laboratory results are consistent with seizure?
- Prolactin elevation
- Anion gap acidosis
- Leukocytosis
As noted above, the patient had an elevated prolactin level and elevated anion gap. Both of these findings can be used, with caution, in evaluating seizure activity.
Prolactin testing is controversial
Prolactin testing in diagnosing seizure activity is controversial. The exact mechanism of prolactin release in seizures is not fully understood. Generalized tonic-clonic seizures and complex partial seizures have both been shown to elevate prolactin. Prolactin levels after these types of seizures should rise within 30 minutes of the event and normalize 1 hour later.6
However, other events and conditions that mimic seizure have been shown to cause a rise in prolactin; these include syncope, transient ischemic attack, cardiac dysrhythmia, migraine, and other epilepsy-like variants. This effect has not been adequately studied. Therefore, an elevated prolactin level alone cannot diagnose or exclude seizure.7
For the prolactin level to be helpful, the blood sample must be drawn within 10 to 20 minutes after a possible seizure. Even if the prolactin level remains normal, it does not rule out seizure. Prolactin levels should therefore be used in combination with other testing to make a definitive diagnosis or exclusion of seizure.8
Anion gap and Denver Seizure Score
The anion gap has also been shown to rise after generalized seizure due to the metabolic acidosis that occurs. With a bicarbonate level of 16 mmol/L, an elevated anion gap, and normal breathing, our patient very likely had metabolic acidosis.
It is sometimes difficult to differentiate syncope from seizure, as they share several features.
The Denver Seizure Score can help differentiate these two conditions. It is based on the patient’s anion gap and bicarbonate level and is calculated as follows:
(24 – bicarbonate) + [2 × (anion gap – 12)]
A score above 20 strongly indicates seizure activity. However, this is not a definitive tool for diagnosis. Like an elevated prolactin level, the Denver Seizure Score should be used in combination with other testing to move toward a definitive diagnosis.9
Our patient’s anion gap was 29 mmol/L and her bicarbonate level was 16 mmol/L. Her Denver Seizure Score was therefore 42, which supports this being an episode of generalized seizure activity.
Leukocytosis
The patient had a white blood cell count of 11.03 × 10⁹/L, which was mildly elevated. She had no history of fever and no source of infection by history.
Leukocytosis is common following generalized tonic-clonic seizure. A fever may lower the seizure threshold; however, our patient was not febrile and clinically had no factors that raised concern for an underlying infection.
ANION GAP ACIDOSIS AND SEIZURE
3. Which of the following can cause both anion gap acidosis and seizure?
- Ethylene glycol
- Salicylate overdose
- Ethanol withdrawal without ketosis
- Alcoholic ketoacidosis
- Methanol
All of the above except for ethanol withdrawal without ketosis can cause both anion gap acidosis and seizure.
Ethylene glycol can cause seizure and an elevated anion gap acidosis. However, this patient had no history of ingesting antifreeze (the most common source of ethylene glycol in the home) and no evidence of calcium oxalate crystals in the urine, which would be a sign of ethylene glycol toxicity. Additional testing for ethylene glycol may include serum ethylene glycol levels and ultraviolet light testing of the urine to detect fluorescein, which is commonly added to automotive antifreeze to help mechanics find fluid leaks in engines.
Salicylate overdose can cause seizure and an elevated anion gap acidosis. However, this patient has no history of aspirin ingestion, and a serum aspirin level was later ordered and found to be negative. In addition, the acid-base disorder in salicylate overdose may be respiratory alkalosis from direct stimulation of respiratory centers in conjunction with metabolic acidosis.
Ethanol withdrawal can cause seizure and may result in ketoacidosis, which would appear as anion gap acidosis. The undetectable ethanol level in this patient would be consistent with withdrawal from ethanol, which may also lead to ketoacidosis.
Alcoholic ketoacidosis is a late finding in patients who have been drinking ethanol and is thus a possible cause of an elevated anion gap in this patient. However, the absence of ketones in her urine speaks against this diagnosis.
Methanol can cause seizure and acidosis, but laboratory testing would reveal a normal anion gap and an elevated osmolar gap. This was not likely in this patient.
The presence of anion gap acidosis is important in forming a differential diagnosis. Several causes of anion gap acidosis may also cause seizure. These include salicylates, ethanol withdrawal with ketosis, methanol, and isoniazid. None of these appears to be a factor in this patient’s case.
DIFFERENTIAL DIAGNOSIS IN OUR PATIENT
4. What is the most likely cause of this patient’s seizure?
- Bupropion side effect
- Benzodiazepine withdrawal
- Ethanol withdrawal
- Brain lesion
- Central nervous system infection
- Unprovoked seizure (new-onset epilepsy)
Bupropion, an inhibitor of neuronal reuptake of norepinephrine and dopamine, has been used in the United States since 1989 to treat major depression.10 At therapeutic doses, it lowers the seizure threshold; in cases of acute overdose, seizures typically occur within hours of the dose, or up to 24 hours in patients taking extended-release formulations.11
Bupropion should be used with caution or avoided in patients taking other medications that also lower the seizure threshold, or during withdrawal from alcohol, benzodiazepines, or barbiturates.10
Benzodiazepine withdrawal. Abrupt cessation of benzodiazepines also lowers the seizure threshold, and seizures are commonly seen in benzodiazepine withdrawal syndrome. The use of benzodiazepines is controversial in many situations, and discontinuing them may prove problematic for both the patient and physician, as the potential for abuse and addiction is significant.
Seizures have occurred during withdrawal from even short-term benzodiazepine use. Other factors, such as concomitant use of other medications that lower the seizure threshold, may play a more significant role in causing withdrawal seizures than the duration of benzodiazepine therapy.12
Medications shown to be useful in managing withdrawal from benzodiazepines include carbamazepine, imipramine, valproate, and trazodone. Paroxetine has also been shown to be helpful in patients with major depression who are being taken off a benzodiazepine.13
Ethanol withdrawal is common in patients presenting to emergency departments, and seizures are frequently seen in these patients. This patient reported social drinking but not drinking ethanol daily, although many patients are not forthcoming about alcohol or drug use when talking with a physician or other healthcare provider.
Alcohol withdrawal seizures may accompany delirium tremens or major withdrawal syndrome, but they are seen more often in the absence of major withdrawal or delirium tremens. Seizures are typically single or occur in a short grouping over a brief period of time and mostly occur in chronic alcoholism. The role of anticonvulsants in patients with alcohol withdrawal seizure has not been established.14
Brain lesion. A previously undiagnosed brain tumor is not a common cause of new-onset seizure, although it is not unusual for a brain tumor to cause new-onset seizure. In 1 study, 6% of patients with new-onset seizure had a clinically significant lesion on brain imaging.15 In addition, 15% to 30% of patients with a previously undiagnosed brain tumor present with seizure as the first symptom.16 Patients with abnormal findings on neurologic examination after the seizure activity are more likely to have a structural lesion that may be identified by computed tomography (CT) or magnetic resonance imaging. (MRI)15
Unprovoked seizure occurs without an identifiable precipitating factor, or from a central nervous system insult that occurred more than 7 days earlier. Patients who may have recurrent unprovoked seizure will likely be diagnosed with epilepsy.15 Patients with a first-time unprovoked seizure have a 30% or higher likelihood of having another unprovoked seizure within 5 years.17
It is most likely that bupropion is the key factor in lowering the seizure threshold in this patient. However, patients sometimes underreport the amount of alcohol they consume, and though less likely, our patient’s report of not drinking for 2 weeks may also be unreliable. Ethanol withdrawal, though unlikely, may also be a consideration with this case.
FURTHER TESTING FOR OUR PATIENT
5. Which tests may be helpful in this patient’s workup?
- CT of the brain
- Lumbar puncture for spinal fluid analysis
- MRI of the brain
- Electroencephalography (EEG)
This patient had had a headache for 1 week before presenting to the emergency department. Indications for neuroimaging in a patient with headache include sudden onset of severe headache, neurologic deficits, human immunodeficiency virus infection, loss of consciousness, immunosuppression, pregnancy, malignancy, and age over 50 with a new type of headache.18,19 Therefore, she should undergo some form of neuroimaging, either CT or MRI.
CT is the most readily available and fastest imaging study for the central nervous system available to emergency physicians. CT is limited, however, due to its decreased sensitivity in detecting some brain lesions. Therefore, many patients with first-time seizure may eventually require MRI.15 Furthermore, patients with focal onset of the seizure activity are more likely to have a structural lesion precipitating the seizure. MRI may have a higher yield than CT in these cases.15,20
Lumbar puncture for spinal fluid analysis is helpful in evaluating a patient with a suspected central nervous system infection such as meningitis or encephalitis, or subarachnoid hemorrhage.
This patient had a normal neurologic examination, no fever, and no meningeal signs, and central nervous system infection was very unlikely. Also, because she had had a headache for 1 week before the presentation with seizurelike activity, subarachnoid hemorrhage was very unlikely, and emergency lumbar puncture was not indicated.
MRI is less readily available than CT in a timely fashion in most emergency departments in the United States. It offers a higher yield than CT in diagnosing pathology such as acute stroke, brain tumor, and plaques seen in multiple sclerosis. CT is superior to MRI in diagnosing bony abnormalities and is very sensitive for detecting acute bleeding.
If MRI is performed, it should follow a specific protocol that includes high-resolution images for epilepsy evaluation rather than the more commonly ordered stroke protocol. The stroke protocol is more likely to be ordered in the emergency department.
EEG is well established in evaluating new-onset seizure in pediatric patients. Studies also demonstrate its utility in evaluating first-time seizure in adults, providing evidence that both epileptiform and nonepileptiform abnormalities seen on EEG are associated with a higher risk of recurrent seizure activity than in patients with normal findings on EEG.1
EEG may be difficult to interpret in adults. According to Benbadis,5 as many as one-third of adult patients diagnosed with epilepsy on EEG did not have epilepsy. This is because of normal variants, simple fluctuations of background rhythms, or fragmented alpha activity that can have a similar appearance to epileptiform patterns. EEG must always be interpreted in the context of the patient’s history and symptoms.5
Though EEG has limitations, it remains a crucial tool for identifying epilepsy. Following a single seizure, the decision to prescribe antiepileptic drugs is highly influenced by patterns on EEG associated with a risk of recurrence. In fact, a patient experiencing a single, idiopathic seizure and exhibiting an EEG pattern of spike wave discharges is likely to have recurrent seizure activity.21 Also, the appropriate use of EEG after even a single unprovoked seizure can identify patients with epilepsy and a risk of recurrent seizure greater than 60%.21,22
NO FURTHER SEIZURES
The patient was admitted to the observation unit from the emergency department after undergoing CT without intravenous contrast. While in observation, she had no additional episodes, and her vital signs remained within normal limits.
She underwent MRI and EEG as well as repeat laboratory studies and consultation by a neurologist. CT showed no structural abnormality, MRI results were read as normal, and EEG showed no epileptiform spikes or abnormal slow waves or other abnormality consistent with seizure. The repeat laboratory studies revealed normalization of the prolactin level at 11.3 ng/mL (reference range 2.0–17.4).
The final impression of the neurology consultant was that the patient had had a seizure that was most likely due to recently starting bupropion in combination with the withdrawal of the benzodiazepine, which lowered the seizure threshold. The neurologist also believed that our patient had no findings or symptoms other than the seizure that would suggest benzodiazepine withdrawal syndrome. According to the patient’s social history, it was unlikely that she had the pattern of alcohol consumption that would result in ethanol withdrawal seizure.
Seizures are common. In fact, every year, 180,000 US adults have their first seizure, and 10% of Americans will experience at least 1 seizure during their lifetime. However, only 20% to 25% of seizures are generalized tonic-clonic seizures as in our patient.23
As this patient had an identifiable cause for the seizure, there was no need to initiate anticonvulsant therapy at the time of discharge. She was discharged to home without any anticonvulsant, the bupropion was discontinued, and the lorazepam was not restarted. When contacted by telephone at 1 month and 18 months after discharge, she reported she had not experienced any additional seizures and has not needed antiepileptic medications.
- Seneviratne U. Management of the first seizure: an evidence based approach. Postgrad Med J 2009; 85:667–673.
- Krumholz A, Wiebe S, Gronseth G, et al; Quality Standards Subcommittee of the American Academy of Neurology; American Epilepsy Society. Practice parameter: evaluating an apparent unprovoked first seizure in adults (an evidence-based review): report of the Quality Standards Subcommittee of the American Academy of Neurology and the American Epilepsy Society. Neurology 2007; 67:1996–2007.
- Gram L. Epileptic seizures and syndromes. Lancet 1990; 336:161–163.
- Smith PE, Cossburn MD. Seizures: assessment and management in the emergency unit. Clin Med (Lond) 2004; 4:118–122.
- Benbadis S. The differential diagnosis of epilepsy: a critical review. Epilepsy Behav 2009; 15:15–21.
- Lusic I, Pintaric I, Hozo I, Boic L, Capkun V. Serum prolactin levels after seizure and syncopal attacks. Seizure 1999; 8:218–222.
- Chen DK, So YT, Fisher RS; Therapeutics and Technology Assessment Subcommittee of the American Academy of Neurology. Use of serum prolactin in diagnosing epileptic seizures: report of the Therapeutics and Technology Assessment Subcommittee of the American Academy of Neurology. Neurology 2005; 65:668–675.
- Ben-Menachem E. Is prolactin a clinically useful measure of epilepsy? Epilepsy Curr 2006; 6:78–79.
- Bakes KM, Faragher J, Markovchick VJ, Donahoe K, Haukoos JS. The Denver Seizure Score: anion gap metabolic acidosis predicts generalized seizure. Am J Emerg Med 2011; 29:1097–1102.
- Jefferson JW, Pradok JF, Muir KT. Bupropion for major depressive disorder: pharmacokinetic and formulation considerations. Clin Ther 2005; 27:1685–1695.
- Stall N, Godwin J, Juurlink D. Bupropion abuse and overdose. CMAJ 2014; 186:1015.
- Fialip J, Aumaitre O, Eschalier A, Maradeix B, Dordain G, Lavarenne J. Benzodiazepine withdrawal seizures: analysis of 48 case reports. Clin Neuropharmacol 1987; 10:538–544.
- Lader M, Tylee A, Donoghue J. Withdrawing benzodiazepines in primary care. CNS Drugs 2009; 23:19–34.
- Chance JF. Emergency department treatment of alcohol withdrawal seizures with phenytoin. Ann Emerg Med 1991; 20:520–522.
- ACEP Clinical Policies Committee; Clinical Policies Subcommittee on Seizures. Clinical policy: critical issues in the evaluation and management of adult patients presenting to the emergency department with seizures. Ann Emerg Med 2004; 43:605–625.
- Sperling MR, Ko J. Seizures and brain tumors. Semin Oncol 2006; 33:333–341.
- Musicco M, Beghi E, Solari A, Viani F. Treatment of first tonic-clonic seizure does not improve the prognosis of epilepsy. First Seizure Trial Group (FIRST Group). Neurology 1997; 49:991–998.
- Edlow JA, Panagos PD, Godwin SA, Thomas TL, Decker WW; American College of Emergency Physicians. Clinical policy: critical issues in the evaluation and management of adult patients presenting to the emergency department with acute headache. Ann Emerg Med 2008; 52:407–436.
- Kaniecki R. Headache assessment and management. JAMA 2003; 289:1430–1433.
- Harden CL, Huff JS, Schwartz TH, et al; Therapeutics and Technology Assessment Subcommittee of the American Academy of Neurology. Reassessment: neuroimaging in the emergency patient presenting with seizure (an evidence-based review): report of the Therapeutics and Technology Assessment Subcommittee of the American Academy of Neurology. Neurology 2007; 69:1772–1780.
- Bergey GK. Management of a first seizure. Continuum (Minneap Minn) 2016; 22:38–50.
- Fisher RS, Acevedo C, Arzimanoglou A, et al. ILAE official report: a practical clinical definition of epilepsy. Epilepsia 2014; 55:475–482.
- Ko DY. Generalized tonic-clonic seizures. Medscape. http://emedicine.medscape.com/article/1184608-overview. Accessed December 5, 2017.
A 50-year-old woman presented to the emergency department after a witnessed loss of consciousness and seizurelike activity. She reported that she had been sitting outside her home, drinking coffee in the morning, but became very lightheaded when she went back into her house. At that time she felt could not focus and had a sense of impending doom. She sat down in a chair and her symptoms worsened.
According to her family, her eyes rolled back and she became rigid. The family helped her to the floor. Her body then made jerking movements that lasted for about 1 minute. She regained consciousness but was very confused for about 10 minutes until emergency medical services personnel arrived. She had no recollection of passing out. She said nothing like this had ever happened to her before.
On arrival in the emergency department, she complained of generalized headache and muscle soreness. She said the headache had been present for 1 week and was constant and dull. There were no aggravating or alleviating factors associated with the headache, and she denied fever, chills, nausea, numbness, tingling, incontinence, tongue biting, tremor, poor balance, ringing in ears, speech difficulty, or weakness.
Medical history: Multiple problems, medications
The patient’s medical history included depression, hypertension, anxiety, osteoarthritis, and asthma. She was allergic to penicillin. She had undergone carpal tunnel surgery on her right hand 5 years previously. She was perimenopausal with no children.
She denied using illicit drugs. She said she had smoked a half pack of cigarettes per day for more than 10 years and was a current smoker but was actively trying to quit. She said she occasionally used alcohol but had not consumed any alcohol in the last 2 weeks.
She had no history of central nervous system infection. She did report an episode of head trauma in grade school when a portable basketball hoop fell, striking her on the top of the head and causing her to briefly lose consciousness, but she did not seek medical attention.
She had no family history of seizure or neurologic disease.
Her current medications included atenolol, naproxen, gabapentin, venlafaxine, zolpidem, lorazepam, bupropion, and meloxicam. The bupropion and lorazepam had been prescribed recently for her anxiety. She reported that she had been given only 10 tablets of lorazepam and had taken the last tablet 48 hours previously. She had been taking the bupropion for 7 days. She reported an increase in stress lately and had been taking zolpidem due to an altered sleep pattern.
PHYSICAL EXAMINATION, INITIAL TESTS
On examination, the patient did not appear to be in acute distress. Her blood pressure was 107/22 mm Hg, pulse 100 beats per minute, respiratory rate 16 breaths per minute, temperature 37.1°C (98.8°F), and oxygen saturation 98% on room air.
Examination of her head, eyes, mouth, and neck were unremarkable. Cardiovascular, pulmonary, and abdominal examinations were normal. She had no neurologic deficits and was fully alert and oriented. She had no visible injuries.
Blood and urine samples were obtained about 15 minutes after her arrival to the emergency department. Results showed:
- Glucose 73 mg/dL (reference range 74–99)
- Sodium 142 mmol/L (136–144)
- Blood urea nitrogen 12 mg/dL (7–21)
- Creatinine 0.95 mg/dL (0.58–0.96)
- Chloride 97 mmol/L (97–105)
- Carbon dioxide (bicarbonate) 16 mmol/L (22–30)
- Prolactin 50.9 ng/mL (4.5–26.8)
- Anion gap 29 mmol/L (9–18)
- Ethanol undetectable
- White blood cell count 11.03 × 10⁹/L (3.70–11.00)
- Creatine kinase 89 U/L (30–220)
- Urinalysis normal, specific gravity 1.010 (1.005–1.030), no detectable ketones, and no crystals seen on microscopic evaluation.
Electrocardiography showed normal sinus rhythm with no ectopy and no ST-segment changes. Chest radiography was negative for any acute process.
The patient was transferred to the 23-hour observation unit in stable condition for further evaluation, monitoring, and management.
SIGNS AND SYMPTOMS OF SEIZURE
1. What findings are consistent with seizure?
- Jerking movements
- Confusion following the event
- Tongue-biting
- Focal motor weakness
- Urinary incontinence
- Aura before the event
All of the above findings are consistent with seizure.
The first consideration in evaluating a patient who presents with a possible seizure is whether the patient’s recollections of the event—and those of the witnesses—are consistent with the symptoms of seizure.1
In generalized tonic-clonic or grand mal seizure, the patient may experience an aura or subjective sensations before the onset. These vary greatly among patients.2 There may be an initial vocalization at the onset of the seizure, such as crying out or unintelligible speech. The patient’s eyes may roll back in the head. This is followed by loss of muscle tone, and if the patient is standing, he or she may fall to the ground. The patient becomes unresponsive and may go into respiratory arrest. There is tonic stiffening of the limbs and body, followed by clonic movements typically lasting 1 to 2 minutes, or sometimes longer.1,3,4 The patient will then relax and experience a period of unconsciousness or confusion (postictal state).
Urinary incontinence and tongue-biting strongly suggest seizure activity, and turning the head to one side and posturing may also be seen.3,5 After the event, the patient may report headache, generalized muscle soreness, exhaustion, or periods of transient focal weakness, also known as Todd paralysis.2,5
Our patient had aura-like symptoms at the outset. She felt very lightheaded, had difficulty focusing, and felt a sense of impending doom. She did not make any vocalizations at the onset, but her eyes did roll backward and she became rigid (tonic). She then lost muscle tone and became unresponsive. Her family had to help her to the floor. Jerking (clonic) movements were witnessed.
She regained consciousness but was described as being confused (postictal) for 10 minutes. Additionally, she denied ever having had symptoms like this previously. On arrival in the emergency department, she reported generalized headache and muscle soreness, but no tongue-biting or urinary incontinence. Her event did not last for more than 1 to 2 minutes according to her family.
Her symptoms strongly suggest new-onset tonic-clonic or grand mal seizure, though this is not completely certain.
LABORATORY FINDINGS IN SEIZURES
2. What laboratory results are consistent with seizure?
- Prolactin elevation
- Anion gap acidosis
- Leukocytosis
As noted above, the patient had an elevated prolactin level and elevated anion gap. Both of these findings can be used, with caution, in evaluating seizure activity.
Prolactin testing is controversial
Prolactin testing in diagnosing seizure activity is controversial. The exact mechanism of prolactin release in seizures is not fully understood. Generalized tonic-clonic seizures and complex partial seizures have both been shown to elevate prolactin. Prolactin levels after these types of seizures should rise within 30 minutes of the event and normalize 1 hour later.6
However, other events and conditions that mimic seizure have been shown to cause a rise in prolactin; these include syncope, transient ischemic attack, cardiac dysrhythmia, migraine, and other epilepsy-like variants. This effect has not been adequately studied. Therefore, an elevated prolactin level alone cannot diagnose or exclude seizure.7
For the prolactin level to be helpful, the blood sample must be drawn within 10 to 20 minutes after a possible seizure. Even if the prolactin level remains normal, it does not rule out seizure. Prolactin levels should therefore be used in combination with other testing to make a definitive diagnosis or exclusion of seizure.8
Anion gap and Denver Seizure Score
The anion gap has also been shown to rise after generalized seizure due to the metabolic acidosis that occurs. With a bicarbonate level of 16 mmol/L, an elevated anion gap, and normal breathing, our patient very likely had metabolic acidosis.
It is sometimes difficult to differentiate syncope from seizure, as they share several features.
The Denver Seizure Score can help differentiate these two conditions. It is based on the patient’s anion gap and bicarbonate level and is calculated as follows:
(24 – bicarbonate) + [2 × (anion gap – 12)]
A score above 20 strongly indicates seizure activity. However, this is not a definitive tool for diagnosis. Like an elevated prolactin level, the Denver Seizure Score should be used in combination with other testing to move toward a definitive diagnosis.9
Our patient’s anion gap was 29 mmol/L and her bicarbonate level was 16 mmol/L. Her Denver Seizure Score was therefore 42, which supports this being an episode of generalized seizure activity.
Leukocytosis
The patient had a white blood cell count of 11.03 × 10⁹/L, which was mildly elevated. She had no history of fever and no source of infection by history.
Leukocytosis is common following generalized tonic-clonic seizure. A fever may lower the seizure threshold; however, our patient was not febrile and clinically had no factors that raised concern for an underlying infection.
ANION GAP ACIDOSIS AND SEIZURE
3. Which of the following can cause both anion gap acidosis and seizure?
- Ethylene glycol
- Salicylate overdose
- Ethanol withdrawal without ketosis
- Alcoholic ketoacidosis
- Methanol
All of the above except for ethanol withdrawal without ketosis can cause both anion gap acidosis and seizure.
Ethylene glycol can cause seizure and an elevated anion gap acidosis. However, this patient had no history of ingesting antifreeze (the most common source of ethylene glycol in the home) and no evidence of calcium oxalate crystals in the urine, which would be a sign of ethylene glycol toxicity. Additional testing for ethylene glycol may include serum ethylene glycol levels and ultraviolet light testing of the urine to detect fluorescein, which is commonly added to automotive antifreeze to help mechanics find fluid leaks in engines.
Salicylate overdose can cause seizure and an elevated anion gap acidosis. However, this patient has no history of aspirin ingestion, and a serum aspirin level was later ordered and found to be negative. In addition, the acid-base disorder in salicylate overdose may be respiratory alkalosis from direct stimulation of respiratory centers in conjunction with metabolic acidosis.
Ethanol withdrawal can cause seizure and may result in ketoacidosis, which would appear as anion gap acidosis. The undetectable ethanol level in this patient would be consistent with withdrawal from ethanol, which may also lead to ketoacidosis.
Alcoholic ketoacidosis is a late finding in patients who have been drinking ethanol and is thus a possible cause of an elevated anion gap in this patient. However, the absence of ketones in her urine speaks against this diagnosis.
Methanol can cause seizure and acidosis, but laboratory testing would reveal a normal anion gap and an elevated osmolar gap. This was not likely in this patient.
The presence of anion gap acidosis is important in forming a differential diagnosis. Several causes of anion gap acidosis may also cause seizure. These include salicylates, ethanol withdrawal with ketosis, methanol, and isoniazid. None of these appears to be a factor in this patient’s case.
DIFFERENTIAL DIAGNOSIS IN OUR PATIENT
4. What is the most likely cause of this patient’s seizure?
- Bupropion side effect
- Benzodiazepine withdrawal
- Ethanol withdrawal
- Brain lesion
- Central nervous system infection
- Unprovoked seizure (new-onset epilepsy)
Bupropion, an inhibitor of neuronal reuptake of norepinephrine and dopamine, has been used in the United States since 1989 to treat major depression.10 At therapeutic doses, it lowers the seizure threshold; in cases of acute overdose, seizures typically occur within hours of the dose, or up to 24 hours in patients taking extended-release formulations.11
Bupropion should be used with caution or avoided in patients taking other medications that also lower the seizure threshold, or during withdrawal from alcohol, benzodiazepines, or barbiturates.10
Benzodiazepine withdrawal. Abrupt cessation of benzodiazepines also lowers the seizure threshold, and seizures are commonly seen in benzodiazepine withdrawal syndrome. The use of benzodiazepines is controversial in many situations, and discontinuing them may prove problematic for both the patient and physician, as the potential for abuse and addiction is significant.
Seizures have occurred during withdrawal from even short-term benzodiazepine use. Other factors, such as concomitant use of other medications that lower the seizure threshold, may play a more significant role in causing withdrawal seizures than the duration of benzodiazepine therapy.12
Medications shown to be useful in managing withdrawal from benzodiazepines include carbamazepine, imipramine, valproate, and trazodone. Paroxetine has also been shown to be helpful in patients with major depression who are being taken off a benzodiazepine.13
Ethanol withdrawal is common in patients presenting to emergency departments, and seizures are frequently seen in these patients. This patient reported social drinking but not drinking ethanol daily, although many patients are not forthcoming about alcohol or drug use when talking with a physician or other healthcare provider.
Alcohol withdrawal seizures may accompany delirium tremens or major withdrawal syndrome, but they are seen more often in the absence of major withdrawal or delirium tremens. Seizures are typically single or occur in a short grouping over a brief period of time and mostly occur in chronic alcoholism. The role of anticonvulsants in patients with alcohol withdrawal seizure has not been established.14
Brain lesion. A previously undiagnosed brain tumor is not a common cause of new-onset seizure, although it is not unusual for a brain tumor to cause new-onset seizure. In 1 study, 6% of patients with new-onset seizure had a clinically significant lesion on brain imaging.15 In addition, 15% to 30% of patients with a previously undiagnosed brain tumor present with seizure as the first symptom.16 Patients with abnormal findings on neurologic examination after the seizure activity are more likely to have a structural lesion that may be identified by computed tomography (CT) or magnetic resonance imaging. (MRI)15
Unprovoked seizure occurs without an identifiable precipitating factor, or from a central nervous system insult that occurred more than 7 days earlier. Patients who may have recurrent unprovoked seizure will likely be diagnosed with epilepsy.15 Patients with a first-time unprovoked seizure have a 30% or higher likelihood of having another unprovoked seizure within 5 years.17
It is most likely that bupropion is the key factor in lowering the seizure threshold in this patient. However, patients sometimes underreport the amount of alcohol they consume, and though less likely, our patient’s report of not drinking for 2 weeks may also be unreliable. Ethanol withdrawal, though unlikely, may also be a consideration with this case.
FURTHER TESTING FOR OUR PATIENT
5. Which tests may be helpful in this patient’s workup?
- CT of the brain
- Lumbar puncture for spinal fluid analysis
- MRI of the brain
- Electroencephalography (EEG)
This patient had had a headache for 1 week before presenting to the emergency department. Indications for neuroimaging in a patient with headache include sudden onset of severe headache, neurologic deficits, human immunodeficiency virus infection, loss of consciousness, immunosuppression, pregnancy, malignancy, and age over 50 with a new type of headache.18,19 Therefore, she should undergo some form of neuroimaging, either CT or MRI.
CT is the most readily available and fastest imaging study for the central nervous system available to emergency physicians. CT is limited, however, due to its decreased sensitivity in detecting some brain lesions. Therefore, many patients with first-time seizure may eventually require MRI.15 Furthermore, patients with focal onset of the seizure activity are more likely to have a structural lesion precipitating the seizure. MRI may have a higher yield than CT in these cases.15,20
Lumbar puncture for spinal fluid analysis is helpful in evaluating a patient with a suspected central nervous system infection such as meningitis or encephalitis, or subarachnoid hemorrhage.
This patient had a normal neurologic examination, no fever, and no meningeal signs, and central nervous system infection was very unlikely. Also, because she had had a headache for 1 week before the presentation with seizurelike activity, subarachnoid hemorrhage was very unlikely, and emergency lumbar puncture was not indicated.
MRI is less readily available than CT in a timely fashion in most emergency departments in the United States. It offers a higher yield than CT in diagnosing pathology such as acute stroke, brain tumor, and plaques seen in multiple sclerosis. CT is superior to MRI in diagnosing bony abnormalities and is very sensitive for detecting acute bleeding.
If MRI is performed, it should follow a specific protocol that includes high-resolution images for epilepsy evaluation rather than the more commonly ordered stroke protocol. The stroke protocol is more likely to be ordered in the emergency department.
EEG is well established in evaluating new-onset seizure in pediatric patients. Studies also demonstrate its utility in evaluating first-time seizure in adults, providing evidence that both epileptiform and nonepileptiform abnormalities seen on EEG are associated with a higher risk of recurrent seizure activity than in patients with normal findings on EEG.1
EEG may be difficult to interpret in adults. According to Benbadis,5 as many as one-third of adult patients diagnosed with epilepsy on EEG did not have epilepsy. This is because of normal variants, simple fluctuations of background rhythms, or fragmented alpha activity that can have a similar appearance to epileptiform patterns. EEG must always be interpreted in the context of the patient’s history and symptoms.5
Though EEG has limitations, it remains a crucial tool for identifying epilepsy. Following a single seizure, the decision to prescribe antiepileptic drugs is highly influenced by patterns on EEG associated with a risk of recurrence. In fact, a patient experiencing a single, idiopathic seizure and exhibiting an EEG pattern of spike wave discharges is likely to have recurrent seizure activity.21 Also, the appropriate use of EEG after even a single unprovoked seizure can identify patients with epilepsy and a risk of recurrent seizure greater than 60%.21,22
NO FURTHER SEIZURES
The patient was admitted to the observation unit from the emergency department after undergoing CT without intravenous contrast. While in observation, she had no additional episodes, and her vital signs remained within normal limits.
She underwent MRI and EEG as well as repeat laboratory studies and consultation by a neurologist. CT showed no structural abnormality, MRI results were read as normal, and EEG showed no epileptiform spikes or abnormal slow waves or other abnormality consistent with seizure. The repeat laboratory studies revealed normalization of the prolactin level at 11.3 ng/mL (reference range 2.0–17.4).
The final impression of the neurology consultant was that the patient had had a seizure that was most likely due to recently starting bupropion in combination with the withdrawal of the benzodiazepine, which lowered the seizure threshold. The neurologist also believed that our patient had no findings or symptoms other than the seizure that would suggest benzodiazepine withdrawal syndrome. According to the patient’s social history, it was unlikely that she had the pattern of alcohol consumption that would result in ethanol withdrawal seizure.
Seizures are common. In fact, every year, 180,000 US adults have their first seizure, and 10% of Americans will experience at least 1 seizure during their lifetime. However, only 20% to 25% of seizures are generalized tonic-clonic seizures as in our patient.23
As this patient had an identifiable cause for the seizure, there was no need to initiate anticonvulsant therapy at the time of discharge. She was discharged to home without any anticonvulsant, the bupropion was discontinued, and the lorazepam was not restarted. When contacted by telephone at 1 month and 18 months after discharge, she reported she had not experienced any additional seizures and has not needed antiepileptic medications.
- Seneviratne U. Management of the first seizure: an evidence based approach. Postgrad Med J 2009; 85:667–673.
- Krumholz A, Wiebe S, Gronseth G, et al; Quality Standards Subcommittee of the American Academy of Neurology; American Epilepsy Society. Practice parameter: evaluating an apparent unprovoked first seizure in adults (an evidence-based review): report of the Quality Standards Subcommittee of the American Academy of Neurology and the American Epilepsy Society. Neurology 2007; 67:1996–2007.
- Gram L. Epileptic seizures and syndromes. Lancet 1990; 336:161–163.
- Smith PE, Cossburn MD. Seizures: assessment and management in the emergency unit. Clin Med (Lond) 2004; 4:118–122.
- Benbadis S. The differential diagnosis of epilepsy: a critical review. Epilepsy Behav 2009; 15:15–21.
- Lusic I, Pintaric I, Hozo I, Boic L, Capkun V. Serum prolactin levels after seizure and syncopal attacks. Seizure 1999; 8:218–222.
- Chen DK, So YT, Fisher RS; Therapeutics and Technology Assessment Subcommittee of the American Academy of Neurology. Use of serum prolactin in diagnosing epileptic seizures: report of the Therapeutics and Technology Assessment Subcommittee of the American Academy of Neurology. Neurology 2005; 65:668–675.
- Ben-Menachem E. Is prolactin a clinically useful measure of epilepsy? Epilepsy Curr 2006; 6:78–79.
- Bakes KM, Faragher J, Markovchick VJ, Donahoe K, Haukoos JS. The Denver Seizure Score: anion gap metabolic acidosis predicts generalized seizure. Am J Emerg Med 2011; 29:1097–1102.
- Jefferson JW, Pradok JF, Muir KT. Bupropion for major depressive disorder: pharmacokinetic and formulation considerations. Clin Ther 2005; 27:1685–1695.
- Stall N, Godwin J, Juurlink D. Bupropion abuse and overdose. CMAJ 2014; 186:1015.
- Fialip J, Aumaitre O, Eschalier A, Maradeix B, Dordain G, Lavarenne J. Benzodiazepine withdrawal seizures: analysis of 48 case reports. Clin Neuropharmacol 1987; 10:538–544.
- Lader M, Tylee A, Donoghue J. Withdrawing benzodiazepines in primary care. CNS Drugs 2009; 23:19–34.
- Chance JF. Emergency department treatment of alcohol withdrawal seizures with phenytoin. Ann Emerg Med 1991; 20:520–522.
- ACEP Clinical Policies Committee; Clinical Policies Subcommittee on Seizures. Clinical policy: critical issues in the evaluation and management of adult patients presenting to the emergency department with seizures. Ann Emerg Med 2004; 43:605–625.
- Sperling MR, Ko J. Seizures and brain tumors. Semin Oncol 2006; 33:333–341.
- Musicco M, Beghi E, Solari A, Viani F. Treatment of first tonic-clonic seizure does not improve the prognosis of epilepsy. First Seizure Trial Group (FIRST Group). Neurology 1997; 49:991–998.
- Edlow JA, Panagos PD, Godwin SA, Thomas TL, Decker WW; American College of Emergency Physicians. Clinical policy: critical issues in the evaluation and management of adult patients presenting to the emergency department with acute headache. Ann Emerg Med 2008; 52:407–436.
- Kaniecki R. Headache assessment and management. JAMA 2003; 289:1430–1433.
- Harden CL, Huff JS, Schwartz TH, et al; Therapeutics and Technology Assessment Subcommittee of the American Academy of Neurology. Reassessment: neuroimaging in the emergency patient presenting with seizure (an evidence-based review): report of the Therapeutics and Technology Assessment Subcommittee of the American Academy of Neurology. Neurology 2007; 69:1772–1780.
- Bergey GK. Management of a first seizure. Continuum (Minneap Minn) 2016; 22:38–50.
- Fisher RS, Acevedo C, Arzimanoglou A, et al. ILAE official report: a practical clinical definition of epilepsy. Epilepsia 2014; 55:475–482.
- Ko DY. Generalized tonic-clonic seizures. Medscape. http://emedicine.medscape.com/article/1184608-overview. Accessed December 5, 2017.
High users of healthcare: Strategies to improve care, reduce costs
Emergency departments are not primary care clinics, but some patients use them that way. This relatively small group of patients consumes a disproportionate share of healthcare at great cost, earning them the label of “high users.” Mostly poor and often burdened with mental illness and addiction, they are not necessarily sicker than other patients, and they do not enjoy better outcomes from the extra money spent on them. (Another subset of high users, those with end-stage chronic disease, is outside the scope of this review.)
Herein lies an opportunity. If—and this is a big if—we could manage their care in a systematic way instead of haphazardly, proactively instead of reactively, with continuity of care instead of episodically, and in a way that is convenient for the patient, we might be able to improve quality and save money.
A DISPROPORTIONATE SHARE OF COSTS
In the United States in 2012, the 5% of the population who were the highest users were responsible for 50% of healthcare costs.1 The mean cost per person in this group was more than $43,000 annually. The top 1% of users accounted for nearly 23% of all expenditures, averaging nearly $98,000 per patient per year—10 times more than the average yearly cost per patient.
CARE IS OFTEN INAPPROPRIATE AND UNNECESSARY
In addition to being disproportionately expensive, the care that these patients receive is often inappropriate and unnecessary for the severity of their disease.
A 2007–2009 study2 of 1,969 patients who had visited the emergency department 10 or more times in a year found they received more than twice as many computed tomography (CT) scans as a control group of infrequent users (< 3 visits/year). This occurred even though they were not as sick as infrequent users, based on significantly lower hospital admission rates (11.1% vs 17.9%; P < .001) and mortality rates (0.7% vs 1.5%; P < .002).2
This inverse relationship between emergency department use and illness severity was even more exaggerated at the upper extreme of the use curve. The highest users (> 29 visits to the emergency department in a year) had the lowest triage acuity and hospital admission rates but the highest number of CT scans. Charges per visit were lower among frequent users, but total charges rose steadily with increasing emergency department use, accounting for significantly more costs per year.2
We believe that one reason these patients receive more medical care than necessary is because their medical records are too large and complex for the average physician to distill effectively in a 20-minute physician-patient encounter. Physicians therefore simply order more tests, procedures, and admissions, which are often medically unnecessary and redundant.
WHAT DRIVES HIGH COST?
Mental illness and chemical dependence
Drug addiction, mental illness, and poverty frequently accompany (and influence) high-use behavior, particularly in patients without end-stage diseases.
Szekendi et al,3 in a study of 28,291 patients who had been admitted at least 5 times in a year in a Chicago health system, found that these high users were 2 to 3 times more likely to suffer from comorbid depression (40% vs 13%), psychosis (18% vs 5%), recreational drug dependence (20% vs 7%), and alcohol abuse (16% vs 7%) than non-high-use hospitalized patients.3
Mercer et al4 conducted a study at Duke University Medical Center, Durham, NC, aimed at reducing emergency department visits and hospital admissions among 24 of its highest users. They found that 23 (96%) were either addicted to drugs or mentally ill, and 20 (83%) suffered from chronic pain.4
Drug abuse among high users is becoming even more relevant as the opioid epidemic worsens. Given that most patients requiring high levels of care suffer from chronic pain and many of them develop an opioid addiction while treating their pain, physicians have a moral imperative to reduce the prevalence of drug abuse in this population.
Low socioeconomic status
Low socioeconomic status is an important factor among high users, as it is highly associated with greater disease severity, which usually increases cost without any guarantee of an associated increase in quality. Data suggest that patients of low socioeconomic status are twice as likely to require urgent emergency department visits, 4 times as likely to require admission to the hospital, and, importantly, about half as likely to use ambulatory care compared with patients of higher socioeconomic status.5 While this pattern of low-quality, high-cost spending in acute care settings reflects spending in the healthcare system at large, the pattern is greatly exaggerated among high users.
Lost to follow-up
Low socioeconomic status also complicates communication and follow-up. In a 2013 study, physician researchers in St. Paul, MN, documented attempts to interview 64 recently discharged high users. They could not reach 47 (73%) of them, for reasons largely attributable to low socioeconomic status, such as disconnected phone lines and changes in address.6
Clearly, the usual contact methods for follow-up care after discharge, such as phone calls and mailings, are unlikely to be effective in coordinating the outpatient care of these individuals.
Additionally, we must find ways of making primary care more convenient, gaining our patients’ trust, and finding ways to engage patients in follow-up without relying on traditional means of communication.
Do high users have medical insurance?
Surprisingly, most high users of the emergency department have health insurance. The Chicago health system study3 found that most (72.4%) of their high users had either Medicare or private health insurance, while 27.6% had either Medicaid or no insurance (compared with 21.6% in the general population). Other studies also found that most of the frequent emergency department users are insured,7 although the overall percentage who rely on publicly paid insurance is greater than in the population at large.
Many prefer acute care over primary care
Although one might think that high users go to the emergency department because they have nowhere else to go for care, a report published in 2013 by Kangovi et al5 suggests another reason—they prefer the emergency department.5 They interviewed 40 urban patients of low socioeconomic status who consistently cited the 24-hour, no-appointment-necessary structure of the emergency department as an advantage over primary care. The flexibility of emergency access to healthcare makes sense if one reflects on how difficult it is for even high-functioning individuals to schedule and keep medical appointments.
Specific reasons for preferring the emergency department included the following:
Affordability. Even if their insurance fully paid for visits to their primary care physicians, the primary care physician was likely to refer them to specialists, whose visits required a copay, and which required taking another day off of work. The emergency department is cheaper for the patient and it is a “one-stop shop.” Patients appreciated the emergency department guarantee of seeing a physician regardless of proof of insurance, a policy not guaranteed in primary care and specialist offices.
Accessibility. For those without a car, public transportation and even patient transportation services are inconvenient and unreliable, whereas emergency medical services will take you to the emergency department.
Accommodations. Although medical centers may tout their same-day appointments, often same-day appointments are all that they have—and you have no choice about the time. You have to call first thing in the morning and stay on hold for a long time, and then when you finally get through, all the same-day appointments are gone.
Availability. Patients said they often had a hard time getting timely medical advice from their primary care physicians. When they could get through to their primary care physicians on the phone, they would be told to go to the emergency department.
Acceptability. Men, especially, feel they need to be very sick indeed to seek medical care, so going to the emergency department is more acceptable.
Trust in the provider. For reasons that were not entirely clear, patients felt that acute care providers were more trustworthy, competent, and compassionate than primary care physicians.5
None of these reasons for using the emergency department has anything to do with disease severity, which supports the findings that high users of the emergency department were not as sick as their normal-use peers.2
QUALITY IMPROVEMENT AND COST-REDUCTION STRATEGIES
Efforts are being made to reduce the cost of healthcare for high users while improving the quality of their care. Promising strategies focus on coordinating care management, creating individualized patient care plans, and improving the components and instructions of discharge summaries.
Care management organizations
A care management organization (CMO) model has emerged as a strategy for quality improvement and cost reduction in the high-use population. In this model, social workers, health coaches, nurses, mid-level providers, and physicians collaborate on designing individualized care plans to meet the specific needs of patients.
Teams typically work in stepwise fashion, first identifying and engaging patients at high risk of poor outcomes and unnecessary care, often using sophisticated quantitative, risk-prediction tools. Then, they perform health assessments and identify potential interventions aimed at preventing expensive acute-care medical interventions. Third, they work with patients to rapidly identify and effectively respond to changes in their conditions and direct them to the most appropriate medical setting, typically primary or urgent care.
Effective models
In 1998, the Camden (NJ) Coalition of Healthcare Providers established a model for CMO care plans. Starting with the first 36 patients enrolled in the program, hospital admissions and emergency department visits were cut by 47% (from 62 to 37 per month), and collective hospital costs were cut by 56% (from $1.2 million to about $500,000 per month).8 It should be noted that this was a small, nonrandomized study and these preliminary numbers did not take into account the cost of outpatient physician visits or new medications. Thus, how much money this program actually saves is not clear.
Similar programs have had similar results. A nurse-led care coordination program in Doylestown, PA, showed an impressive 25% reduction in annual mortality and a 36% reduction in overall costs during a 10-year period.9
A program in Atlantic City, NJ, combined the typical CMO model with a primary care clinic to provide high users with unlimited access, while paying its providers in a capitation model (as opposed to fee for service). It achieved a 40% reduction in yearly emergency department visits and hospital admissions.8
Patient care plans
Individualized patient care plans for high users are among the most promising tools for reducing costs and improving quality in this group. They are low-cost and relatively easy to implement. The goal of these care plans is to provide practitioners with a concise care summary to help them make rational and consistent medical decisions.
Typically, a care plan is written by an interdisciplinary committee composed of physicians, nurses, and social workers. It is based on the patient’s pertinent medical and psychiatric history, which may include recent imaging results or other relevant diagnostic tests. It provides suggestions for managing complex chronic issues, such as drug abuse, that lead to high use of healthcare resources.
These care plans provide a rational and prespecified approach to workup and management, typically including a narcotic prescription protocol, regardless of the setting or the number of providers who see the patient. Practitioners guided by effective care plans are much more likely to effectively navigate a complex patient encounter as opposed to looking through extensive medical notes and hoping to find relevant information.
Effective models
Data show these plans can be effective. For example, Regions Hospital in St. Paul, MN, implemented patient care plans in 2010. During the first 4 months, hospital admissions in the first 94 patients were reduced by 67%.10
A study of high users at Duke University Medical Center reported similar results. One year after starting care plans, inpatient admissions had decreased by 50.5%, readmissions had decreased by 51.5%, and variable direct costs per admission were reduced by 35.8%. Paradoxically, emergency department visits went up, but this anomaly was driven by 134 visits incurred by a single dialysis patient. After removing this patient from the data, emergency department visits were relatively stable.4
Better discharge summaries
Although improving discharge summaries is not a novel concept, changing the summary from a historical document to a proactive discharge plan has the potential to prevent readmissions and promote a durable de-escalation in care acuity.
For example, when moving a patient to a subacute care facility, providing a concise summary of which treatments worked and which did not, a list of comorbidities, and a list of medications and strategies to consider, can help the next providers to better target their plan of care. Studies have shown that nearly half of discharge statements lack important information on treatments and tests.11
Improvement can be as simple as encouraging practitioners to construct their summaries in an “if-then” format. Instead of noting for instance that “Mr. Smith was treated for pneumonia with antibiotics and discharged to a rehab facility,” the following would be more useful: “Family would like to see if Mr. Smith can get back to his functional baseline after his acute pneumonia. If he clinically does not do well over the next 1 to 2 weeks and has a poor quality of life, then family would like to pursue hospice.”
In addition to shifting the philosophy, we believe that providing timely discharge summaries is a fundamental, high-yield aspect of ensuring their effectiveness. As an example, patients being discharged to a skilled nursing facility should have a discharge summary completed and in hand before leaving the hospital.
Evidence suggests that timely writing of discharge summaries improves their quality. In a retrospective cohort study published in 2012, discharge summaries created more than 24 hours after discharge were less likely to include important plan-of-care components.12
FUTURE NEEDS
Randomized trials
Although initial results have been promising for the strategies outlined above, much of the apparent cost reduction of these interventions may be at least partially related to the study design as opposed to the interventions themselves.
For example, Hong et al13 examined 18 of the more promising CMOs that had reported initial cost savings. Of these, only 4 had conducted randomized controlled trials. When broken down further, the initial cost reduction reported by most of these randomized controlled trials was generated primarily by small subgroups.14
These results, however, do not necessarily reflect an inherent failure in the system. We contend that they merely demonstrate that CMOs and care plan administrators need to be more selective about whom they enroll, either by targeting patients at the extremes of the usage curve or by identifying patient characteristics and usage parameters amenable to cost reduction and quality improvement strategies.
Better social infrastructure
Although patient care plans and CMOs have been effective in managing high users, we believe that the most promising quality improvement and cost-reduction strategy involves redirecting much of the expensive healthcare spending to the social determinants of health (eg, homelessness, mental illness, low socioeconomic status).
 spent on healthcare and social service")
Among developed countries, the United States has the highest healthcare spending and the lowest social service spending as a percentage of its gross domestic product (Figure 1).15 Although seemingly discouraging, these data can actually be interpreted as hopeful, as they support the notion that the inefficiencies of our current system are not part of an inescapable reality, but rather reflect a system that has evolved uniquely in this country.
Using the available social programs
Exemplifying this medical and social services balance is a high user who visited her local emergency department 450 times in 1 year for reasons primarily related to homelessness.16 Each time, the medical system (as it is currently designed to do) applied a short-term medical solution to this patient’s problems and discharged her home, ie, back to the street.
But this patient’s high use was really a manifestation of a deeper social issue: homelessness. When the medical staff eventually noted how much this lack of stable shelter was contributing to her pattern of use, she was referred to appropriate social resources and provided with the housing she needed. Her hospital visits decreased from 450 to 12 in the subsequent year, amounting to a huge cost reduction and a clear improvement in her quality of life.
Similar encouraging results have resulted when available social programs are applied to the high-use population at large, which is particularly reassuring given this population’s preponderance of low socioeconomic status, mental illness, and homelessness. (The prevalence of homelessness is roughly 20%, depending on the definition of a high user).
New York Medicaid, for example, has a housing program that provides stable shelter outside of acute care medical settings for patients at a rate as low as $50 per day, compared with area hospital costs that often exceed $2,200 daily.17 A similar program in Westchester County, NY, reported a 45.9% reduction in inpatient costs and a 15.4% reduction in emergency department visits among 61 of its highest users after 2 years of enrollment.17
Need to reform privacy laws
Although legally daunting, reform of the Health Insurance Portability and Accountability Act (HIPAA) and other privacy laws in favor of a more open model of information sharing, particularly for high-risk patients, holds great opportunity for quality improvement. For patients who obtain their care from several healthcare facilities, the documentation is often inscrutable. If some of the HIPAA regulations and other patient privacy laws were exchanged for rules more akin to the current model of narcotic prescription tracking, for example, physicians would be better equipped to provide safe, organized, and efficient medical care for high-use patients.
Need to reform the system
A fundamental flaw in our healthcare system, which is largely based on a fee-for-service model, is that it was not designed for patients who use the system at the highest frequency and greatest cost. Also, it does not account for the psychosocial factors that beset many high-use patients. As such, it is imperative for the safety of our patients as well as the viability of the healthcare system that we change our historical way of thinking and reform this system that provides high users with care that is high-cost, low-quality, and not patient-centered.
IMPROVING QUALITY, REDUCING COST
High users of emergency services are a medically and socially complex group, predominantly characterized by low socioeconomic status and high rates of mental illness and drug dependency. Despite their increased healthcare use, they do not have better outcomes even though they are not sicker. Improving those outcomes requires both medical and social efforts.
Among the effective medical efforts are strategies aimed at creating individualized patient care plans, using coordinated care teams, and improving discharge summaries. Addressing patients’ social factors, such as homelessness, is more difficult, but healthcare systems can help patients navigate the available social programs. These strategies are part of a comprehensive care plan that can help reduce the cost and improve the quality of healthcare for high users.
- Cohen SB; Agency for Healthcare Research and Quality. Statistical Brief #359. The concentration of health care expenditures and related expenses for costly medical conditions, 2009. http://meps.ahrq.gov/mepsweb/data_files/publications/st359/stat359.pdf. Accessed December 18, 2017.
- Oostema J, Troost J, Schurr K, Waller R. High and low frequency emergency department users: a comparative analysis of morbidity, diagnostic testing, and health care costs. Ann Emerg Med 2011; 58:S225. Abstract 142.
- Szekendi MK, Williams MV, Carrier D, Hensley L, Thomas S, Cerese J. The characteristics of patients frequently admitted to academic medical centers in the United States. J Hosp Med 2015; 10:563–568.
- Mercer T, Bae J, Kipnes J, Velazquez M, Thomas S, Setji N. The highest utilizers of care: individualized care plans to coordinate care, improve healthcare service utilization, and reduce costs at an academic tertiary care center. J Hosp Med 2015; 10:419–424.
- Kangovi S, Barg FK, Carter T, Long JA, Shannon R, Grande D. Understanding why patients of low socioeconomic status prefer hospitals over ambulatory care. Health Aff (Millwood) 2013; 32:1196–1203.
- Melander I, Winkelman T, Hilger R. Analysis of high utilizers’ experience with specialized care plans. J Hosp Med 2014; 9(suppl 2):Abstract 229.
- LaCalle EJ, Rabin EJ, Genes NG. High-frequency users of emergency department care. J Emerg Med 2013; 44:1167–1173.
- Gawande A. The Hot Spotters. The New Yorker 2011. www.newyorker.com/magazine/2011/01/24/the-hot-spotters. Accessed December 18, 2017.
- Coburn KD, Marcantonio S, Lazansky R, Keller M, Davis N. Effect of a community-based nursing intervention on mortality in chronically ill older adults: a randomized controlled trial. PLoS Med 2012; 9:e1001265.
- Hilger R, Melander I, Winkelman T. Is specialized care plan work sustainable? A follow-up on healthpartners’ experience with patients who are high-utilizers. Society of Hospital Medicine Annual Meeting, Las Vegas, NV. March 24-27, 2014. www.shmabstracts.com/abstract/is-specialized-care-plan-work-sustainable-a-followup-on-healthpartners-experience-with-patients-who-are-highutilizers. Accessed December 18, 2017.
- Kripalani S, LeFevre F, Phillips CO, Williams MV, Basaviah P, Baker DW. Deficits in communication and information transfer between hospital-based and primary care physicians: implications for patient safety and continuity of care. JAMA 2007; 297:831–841.
- Kind AJ, Thorpe CT, Sattin JA, Walz SE, Smith MA. Provider characteristics, clinical-work processes and their relationship to discharge summary quality for sub-acute care patients. J Gen Intern Med 2012; 27:78–84.
- Hong CS, Siegel AL, Ferris TG. Caring for high-need, high-cost patients: what makes for a successful care management program? Issue Brief (Commonwealth Fund) 2014; 19:1–19.
- Williams B. Limited effects of care management for high utilizers on total healthcare costs. Am J Managed Care 2015; 21:e244–e246.
- Organization for Economic Co-operation and Development. Health at a Glance 2009: OECD Indicators. Paris, France: OECD Publishing; 2009.
- Emeche U. Is a strategy focused on super-utilizers equal to the task of health care system transformation? Yes. Ann Fam Med 2015; 13:6–7.
- Burns J. Do we overspend on healthcare, underspend on social needs? Managed Care. http://ghli.yale.edu/news/do-we-overspend-health-care-underspend-social-needs. Accessed December 18, 2017.
Emergency departments are not primary care clinics, but some patients use them that way. This relatively small group of patients consumes a disproportionate share of healthcare at great cost, earning them the label of “high users.” Mostly poor and often burdened with mental illness and addiction, they are not necessarily sicker than other patients, and they do not enjoy better outcomes from the extra money spent on them. (Another subset of high users, those with end-stage chronic disease, is outside the scope of this review.)
Herein lies an opportunity. If—and this is a big if—we could manage their care in a systematic way instead of haphazardly, proactively instead of reactively, with continuity of care instead of episodically, and in a way that is convenient for the patient, we might be able to improve quality and save money.
A DISPROPORTIONATE SHARE OF COSTS
In the United States in 2012, the 5% of the population who were the highest users were responsible for 50% of healthcare costs.1 The mean cost per person in this group was more than $43,000 annually. The top 1% of users accounted for nearly 23% of all expenditures, averaging nearly $98,000 per patient per year—10 times more than the average yearly cost per patient.
CARE IS OFTEN INAPPROPRIATE AND UNNECESSARY
In addition to being disproportionately expensive, the care that these patients receive is often inappropriate and unnecessary for the severity of their disease.
A 2007–2009 study2 of 1,969 patients who had visited the emergency department 10 or more times in a year found they received more than twice as many computed tomography (CT) scans as a control group of infrequent users (< 3 visits/year). This occurred even though they were not as sick as infrequent users, based on significantly lower hospital admission rates (11.1% vs 17.9%; P < .001) and mortality rates (0.7% vs 1.5%; P < .002).2
This inverse relationship between emergency department use and illness severity was even more exaggerated at the upper extreme of the use curve. The highest users (> 29 visits to the emergency department in a year) had the lowest triage acuity and hospital admission rates but the highest number of CT scans. Charges per visit were lower among frequent users, but total charges rose steadily with increasing emergency department use, accounting for significantly more costs per year.2
We believe that one reason these patients receive more medical care than necessary is because their medical records are too large and complex for the average physician to distill effectively in a 20-minute physician-patient encounter. Physicians therefore simply order more tests, procedures, and admissions, which are often medically unnecessary and redundant.
WHAT DRIVES HIGH COST?
Mental illness and chemical dependence
Drug addiction, mental illness, and poverty frequently accompany (and influence) high-use behavior, particularly in patients without end-stage diseases.
Szekendi et al,3 in a study of 28,291 patients who had been admitted at least 5 times in a year in a Chicago health system, found that these high users were 2 to 3 times more likely to suffer from comorbid depression (40% vs 13%), psychosis (18% vs 5%), recreational drug dependence (20% vs 7%), and alcohol abuse (16% vs 7%) than non-high-use hospitalized patients.3
Mercer et al4 conducted a study at Duke University Medical Center, Durham, NC, aimed at reducing emergency department visits and hospital admissions among 24 of its highest users. They found that 23 (96%) were either addicted to drugs or mentally ill, and 20 (83%) suffered from chronic pain.4
Drug abuse among high users is becoming even more relevant as the opioid epidemic worsens. Given that most patients requiring high levels of care suffer from chronic pain and many of them develop an opioid addiction while treating their pain, physicians have a moral imperative to reduce the prevalence of drug abuse in this population.
Low socioeconomic status
Low socioeconomic status is an important factor among high users, as it is highly associated with greater disease severity, which usually increases cost without any guarantee of an associated increase in quality. Data suggest that patients of low socioeconomic status are twice as likely to require urgent emergency department visits, 4 times as likely to require admission to the hospital, and, importantly, about half as likely to use ambulatory care compared with patients of higher socioeconomic status.5 While this pattern of low-quality, high-cost spending in acute care settings reflects spending in the healthcare system at large, the pattern is greatly exaggerated among high users.
Lost to follow-up
Low socioeconomic status also complicates communication and follow-up. In a 2013 study, physician researchers in St. Paul, MN, documented attempts to interview 64 recently discharged high users. They could not reach 47 (73%) of them, for reasons largely attributable to low socioeconomic status, such as disconnected phone lines and changes in address.6
Clearly, the usual contact methods for follow-up care after discharge, such as phone calls and mailings, are unlikely to be effective in coordinating the outpatient care of these individuals.
Additionally, we must find ways of making primary care more convenient, gaining our patients’ trust, and finding ways to engage patients in follow-up without relying on traditional means of communication.
Do high users have medical insurance?
Surprisingly, most high users of the emergency department have health insurance. The Chicago health system study3 found that most (72.4%) of their high users had either Medicare or private health insurance, while 27.6% had either Medicaid or no insurance (compared with 21.6% in the general population). Other studies also found that most of the frequent emergency department users are insured,7 although the overall percentage who rely on publicly paid insurance is greater than in the population at large.
Many prefer acute care over primary care
Although one might think that high users go to the emergency department because they have nowhere else to go for care, a report published in 2013 by Kangovi et al5 suggests another reason—they prefer the emergency department.5 They interviewed 40 urban patients of low socioeconomic status who consistently cited the 24-hour, no-appointment-necessary structure of the emergency department as an advantage over primary care. The flexibility of emergency access to healthcare makes sense if one reflects on how difficult it is for even high-functioning individuals to schedule and keep medical appointments.
Specific reasons for preferring the emergency department included the following:
Affordability. Even if their insurance fully paid for visits to their primary care physicians, the primary care physician was likely to refer them to specialists, whose visits required a copay, and which required taking another day off of work. The emergency department is cheaper for the patient and it is a “one-stop shop.” Patients appreciated the emergency department guarantee of seeing a physician regardless of proof of insurance, a policy not guaranteed in primary care and specialist offices.
Accessibility. For those without a car, public transportation and even patient transportation services are inconvenient and unreliable, whereas emergency medical services will take you to the emergency department.
Accommodations. Although medical centers may tout their same-day appointments, often same-day appointments are all that they have—and you have no choice about the time. You have to call first thing in the morning and stay on hold for a long time, and then when you finally get through, all the same-day appointments are gone.
Availability. Patients said they often had a hard time getting timely medical advice from their primary care physicians. When they could get through to their primary care physicians on the phone, they would be told to go to the emergency department.
Acceptability. Men, especially, feel they need to be very sick indeed to seek medical care, so going to the emergency department is more acceptable.
Trust in the provider. For reasons that were not entirely clear, patients felt that acute care providers were more trustworthy, competent, and compassionate than primary care physicians.5
None of these reasons for using the emergency department has anything to do with disease severity, which supports the findings that high users of the emergency department were not as sick as their normal-use peers.2
QUALITY IMPROVEMENT AND COST-REDUCTION STRATEGIES
Efforts are being made to reduce the cost of healthcare for high users while improving the quality of their care. Promising strategies focus on coordinating care management, creating individualized patient care plans, and improving the components and instructions of discharge summaries.
Care management organizations
A care management organization (CMO) model has emerged as a strategy for quality improvement and cost reduction in the high-use population. In this model, social workers, health coaches, nurses, mid-level providers, and physicians collaborate on designing individualized care plans to meet the specific needs of patients.
Teams typically work in stepwise fashion, first identifying and engaging patients at high risk of poor outcomes and unnecessary care, often using sophisticated quantitative, risk-prediction tools. Then, they perform health assessments and identify potential interventions aimed at preventing expensive acute-care medical interventions. Third, they work with patients to rapidly identify and effectively respond to changes in their conditions and direct them to the most appropriate medical setting, typically primary or urgent care.
Effective models
In 1998, the Camden (NJ) Coalition of Healthcare Providers established a model for CMO care plans. Starting with the first 36 patients enrolled in the program, hospital admissions and emergency department visits were cut by 47% (from 62 to 37 per month), and collective hospital costs were cut by 56% (from $1.2 million to about $500,000 per month).8 It should be noted that this was a small, nonrandomized study and these preliminary numbers did not take into account the cost of outpatient physician visits or new medications. Thus, how much money this program actually saves is not clear.
Similar programs have had similar results. A nurse-led care coordination program in Doylestown, PA, showed an impressive 25% reduction in annual mortality and a 36% reduction in overall costs during a 10-year period.9
A program in Atlantic City, NJ, combined the typical CMO model with a primary care clinic to provide high users with unlimited access, while paying its providers in a capitation model (as opposed to fee for service). It achieved a 40% reduction in yearly emergency department visits and hospital admissions.8
Patient care plans
Individualized patient care plans for high users are among the most promising tools for reducing costs and improving quality in this group. They are low-cost and relatively easy to implement. The goal of these care plans is to provide practitioners with a concise care summary to help them make rational and consistent medical decisions.
Typically, a care plan is written by an interdisciplinary committee composed of physicians, nurses, and social workers. It is based on the patient’s pertinent medical and psychiatric history, which may include recent imaging results or other relevant diagnostic tests. It provides suggestions for managing complex chronic issues, such as drug abuse, that lead to high use of healthcare resources.
These care plans provide a rational and prespecified approach to workup and management, typically including a narcotic prescription protocol, regardless of the setting or the number of providers who see the patient. Practitioners guided by effective care plans are much more likely to effectively navigate a complex patient encounter as opposed to looking through extensive medical notes and hoping to find relevant information.
Effective models
Data show these plans can be effective. For example, Regions Hospital in St. Paul, MN, implemented patient care plans in 2010. During the first 4 months, hospital admissions in the first 94 patients were reduced by 67%.10
A study of high users at Duke University Medical Center reported similar results. One year after starting care plans, inpatient admissions had decreased by 50.5%, readmissions had decreased by 51.5%, and variable direct costs per admission were reduced by 35.8%. Paradoxically, emergency department visits went up, but this anomaly was driven by 134 visits incurred by a single dialysis patient. After removing this patient from the data, emergency department visits were relatively stable.4
Better discharge summaries
Although improving discharge summaries is not a novel concept, changing the summary from a historical document to a proactive discharge plan has the potential to prevent readmissions and promote a durable de-escalation in care acuity.
For example, when moving a patient to a subacute care facility, providing a concise summary of which treatments worked and which did not, a list of comorbidities, and a list of medications and strategies to consider, can help the next providers to better target their plan of care. Studies have shown that nearly half of discharge statements lack important information on treatments and tests.11
Improvement can be as simple as encouraging practitioners to construct their summaries in an “if-then” format. Instead of noting for instance that “Mr. Smith was treated for pneumonia with antibiotics and discharged to a rehab facility,” the following would be more useful: “Family would like to see if Mr. Smith can get back to his functional baseline after his acute pneumonia. If he clinically does not do well over the next 1 to 2 weeks and has a poor quality of life, then family would like to pursue hospice.”
In addition to shifting the philosophy, we believe that providing timely discharge summaries is a fundamental, high-yield aspect of ensuring their effectiveness. As an example, patients being discharged to a skilled nursing facility should have a discharge summary completed and in hand before leaving the hospital.
Evidence suggests that timely writing of discharge summaries improves their quality. In a retrospective cohort study published in 2012, discharge summaries created more than 24 hours after discharge were less likely to include important plan-of-care components.12
FUTURE NEEDS
Randomized trials
Although initial results have been promising for the strategies outlined above, much of the apparent cost reduction of these interventions may be at least partially related to the study design as opposed to the interventions themselves.
For example, Hong et al13 examined 18 of the more promising CMOs that had reported initial cost savings. Of these, only 4 had conducted randomized controlled trials. When broken down further, the initial cost reduction reported by most of these randomized controlled trials was generated primarily by small subgroups.14
These results, however, do not necessarily reflect an inherent failure in the system. We contend that they merely demonstrate that CMOs and care plan administrators need to be more selective about whom they enroll, either by targeting patients at the extremes of the usage curve or by identifying patient characteristics and usage parameters amenable to cost reduction and quality improvement strategies.
Better social infrastructure
Although patient care plans and CMOs have been effective in managing high users, we believe that the most promising quality improvement and cost-reduction strategy involves redirecting much of the expensive healthcare spending to the social determinants of health (eg, homelessness, mental illness, low socioeconomic status).
Among developed countries, the United States has the highest healthcare spending and the lowest social service spending as a percentage of its gross domestic product (Figure 1).15 Although seemingly discouraging, these data can actually be interpreted as hopeful, as they support the notion that the inefficiencies of our current system are not part of an inescapable reality, but rather reflect a system that has evolved uniquely in this country.
Using the available social programs
Exemplifying this medical and social services balance is a high user who visited her local emergency department 450 times in 1 year for reasons primarily related to homelessness.16 Each time, the medical system (as it is currently designed to do) applied a short-term medical solution to this patient’s problems and discharged her home, ie, back to the street.
But this patient’s high use was really a manifestation of a deeper social issue: homelessness. When the medical staff eventually noted how much this lack of stable shelter was contributing to her pattern of use, she was referred to appropriate social resources and provided with the housing she needed. Her hospital visits decreased from 450 to 12 in the subsequent year, amounting to a huge cost reduction and a clear improvement in her quality of life.
Similar encouraging results have resulted when available social programs are applied to the high-use population at large, which is particularly reassuring given this population’s preponderance of low socioeconomic status, mental illness, and homelessness. (The prevalence of homelessness is roughly 20%, depending on the definition of a high user).
New York Medicaid, for example, has a housing program that provides stable shelter outside of acute care medical settings for patients at a rate as low as $50 per day, compared with area hospital costs that often exceed $2,200 daily.17 A similar program in Westchester County, NY, reported a 45.9% reduction in inpatient costs and a 15.4% reduction in emergency department visits among 61 of its highest users after 2 years of enrollment.17
Need to reform privacy laws
Although legally daunting, reform of the Health Insurance Portability and Accountability Act (HIPAA) and other privacy laws in favor of a more open model of information sharing, particularly for high-risk patients, holds great opportunity for quality improvement. For patients who obtain their care from several healthcare facilities, the documentation is often inscrutable. If some of the HIPAA regulations and other patient privacy laws were exchanged for rules more akin to the current model of narcotic prescription tracking, for example, physicians would be better equipped to provide safe, organized, and efficient medical care for high-use patients.
Need to reform the system
A fundamental flaw in our healthcare system, which is largely based on a fee-for-service model, is that it was not designed for patients who use the system at the highest frequency and greatest cost. Also, it does not account for the psychosocial factors that beset many high-use patients. As such, it is imperative for the safety of our patients as well as the viability of the healthcare system that we change our historical way of thinking and reform this system that provides high users with care that is high-cost, low-quality, and not patient-centered.
IMPROVING QUALITY, REDUCING COST
High users of emergency services are a medically and socially complex group, predominantly characterized by low socioeconomic status and high rates of mental illness and drug dependency. Despite their increased healthcare use, they do not have better outcomes even though they are not sicker. Improving those outcomes requires both medical and social efforts.
Among the effective medical efforts are strategies aimed at creating individualized patient care plans, using coordinated care teams, and improving discharge summaries. Addressing patients’ social factors, such as homelessness, is more difficult, but healthcare systems can help patients navigate the available social programs. These strategies are part of a comprehensive care plan that can help reduce the cost and improve the quality of healthcare for high users.
- Cohen SB; Agency for Healthcare Research and Quality. Statistical Brief #359. The concentration of health care expenditures and related expenses for costly medical conditions, 2009. http://meps.ahrq.gov/mepsweb/data_files/publications/st359/stat359.pdf. Accessed December 18, 2017.
- Oostema J, Troost J, Schurr K, Waller R. High and low frequency emergency department users: a comparative analysis of morbidity, diagnostic testing, and health care costs. Ann Emerg Med 2011; 58:S225. Abstract 142.
- Szekendi MK, Williams MV, Carrier D, Hensley L, Thomas S, Cerese J. The characteristics of patients frequently admitted to academic medical centers in the United States. J Hosp Med 2015; 10:563–568.
- Mercer T, Bae J, Kipnes J, Velazquez M, Thomas S, Setji N. The highest utilizers of care: individualized care plans to coordinate care, improve healthcare service utilization, and reduce costs at an academic tertiary care center. J Hosp Med 2015; 10:419–424.
- Kangovi S, Barg FK, Carter T, Long JA, Shannon R, Grande D. Understanding why patients of low socioeconomic status prefer hospitals over ambulatory care. Health Aff (Millwood) 2013; 32:1196–1203.
- Melander I, Winkelman T, Hilger R. Analysis of high utilizers’ experience with specialized care plans. J Hosp Med 2014; 9(suppl 2):Abstract 229.
- LaCalle EJ, Rabin EJ, Genes NG. High-frequency users of emergency department care. J Emerg Med 2013; 44:1167–1173.
- Gawande A. The Hot Spotters. The New Yorker 2011. www.newyorker.com/magazine/2011/01/24/the-hot-spotters. Accessed December 18, 2017.
- Coburn KD, Marcantonio S, Lazansky R, Keller M, Davis N. Effect of a community-based nursing intervention on mortality in chronically ill older adults: a randomized controlled trial. PLoS Med 2012; 9:e1001265.
- Hilger R, Melander I, Winkelman T. Is specialized care plan work sustainable? A follow-up on healthpartners’ experience with patients who are high-utilizers. Society of Hospital Medicine Annual Meeting, Las Vegas, NV. March 24-27, 2014. www.shmabstracts.com/abstract/is-specialized-care-plan-work-sustainable-a-followup-on-healthpartners-experience-with-patients-who-are-highutilizers. Accessed December 18, 2017.
- Kripalani S, LeFevre F, Phillips CO, Williams MV, Basaviah P, Baker DW. Deficits in communication and information transfer between hospital-based and primary care physicians: implications for patient safety and continuity of care. JAMA 2007; 297:831–841.
- Kind AJ, Thorpe CT, Sattin JA, Walz SE, Smith MA. Provider characteristics, clinical-work processes and their relationship to discharge summary quality for sub-acute care patients. J Gen Intern Med 2012; 27:78–84.
- Hong CS, Siegel AL, Ferris TG. Caring for high-need, high-cost patients: what makes for a successful care management program? Issue Brief (Commonwealth Fund) 2014; 19:1–19.
- Williams B. Limited effects of care management for high utilizers on total healthcare costs. Am J Managed Care 2015; 21:e244–e246.
- Organization for Economic Co-operation and Development. Health at a Glance 2009: OECD Indicators. Paris, France: OECD Publishing; 2009.
- Emeche U. Is a strategy focused on super-utilizers equal to the task of health care system transformation? Yes. Ann Fam Med 2015; 13:6–7.
- Burns J. Do we overspend on healthcare, underspend on social needs? Managed Care. http://ghli.yale.edu/news/do-we-overspend-health-care-underspend-social-needs. Accessed December 18, 2017.
KEY POINTS
- The top 5% of the population in terms of healthcare use account for 50% of costs. The top 1% account for 23% of all expenditures and cost 10 times more per year than the average patient.
- Drug addiction, mental illness, and poverty often accompany and underlie high-use behavior, particularly in patients without end-stage medical conditions.
- Comprehensive patient care plans and care management organizations are among the most effective strategies for cost reduction and quality improvement.
Brace for Impact
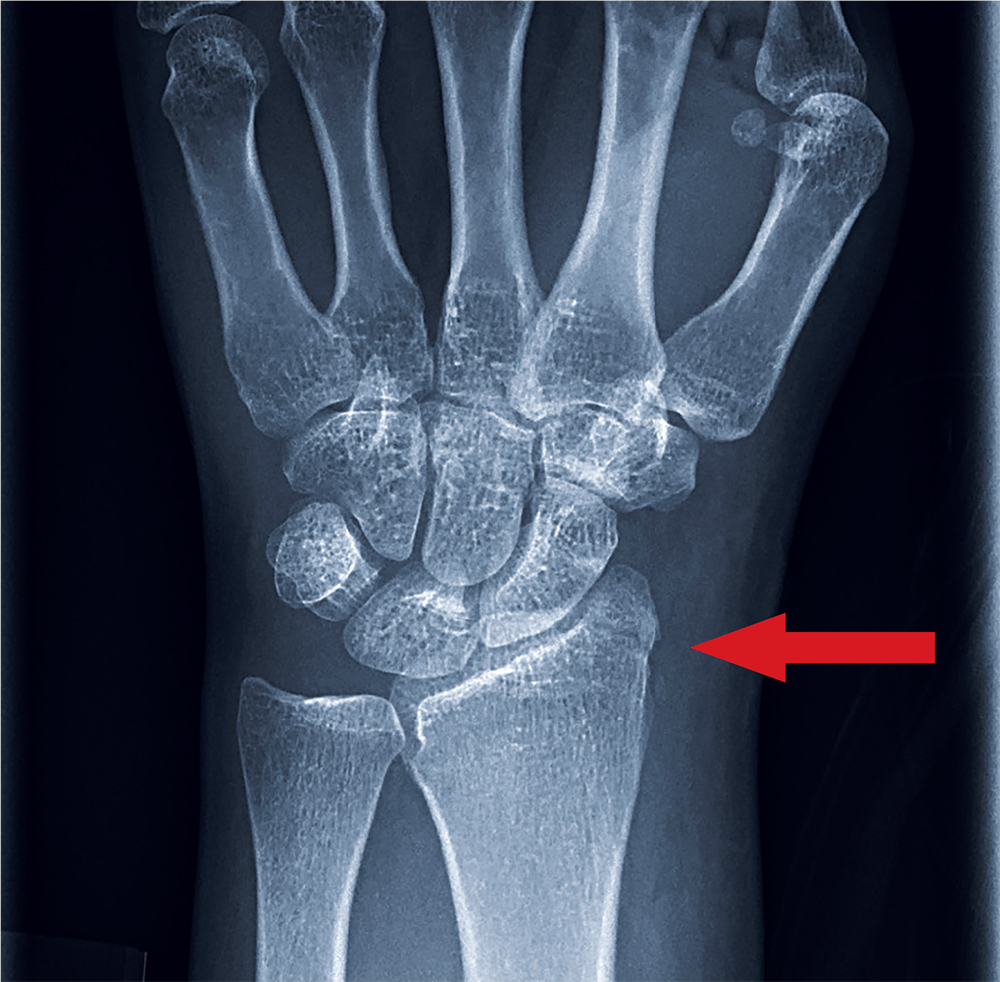
ANSWER
The radiograph shows an oblique fracture through the radial styloid process. The patient was placed in a splint and referred to outpatient orthopedics for follow-up.
ANSWER
The radiograph shows an oblique fracture through the radial styloid process. The patient was placed in a splint and referred to outpatient orthopedics for follow-up.
ANSWER
The radiograph shows an oblique fracture through the radial styloid process. The patient was placed in a splint and referred to outpatient orthopedics for follow-up.
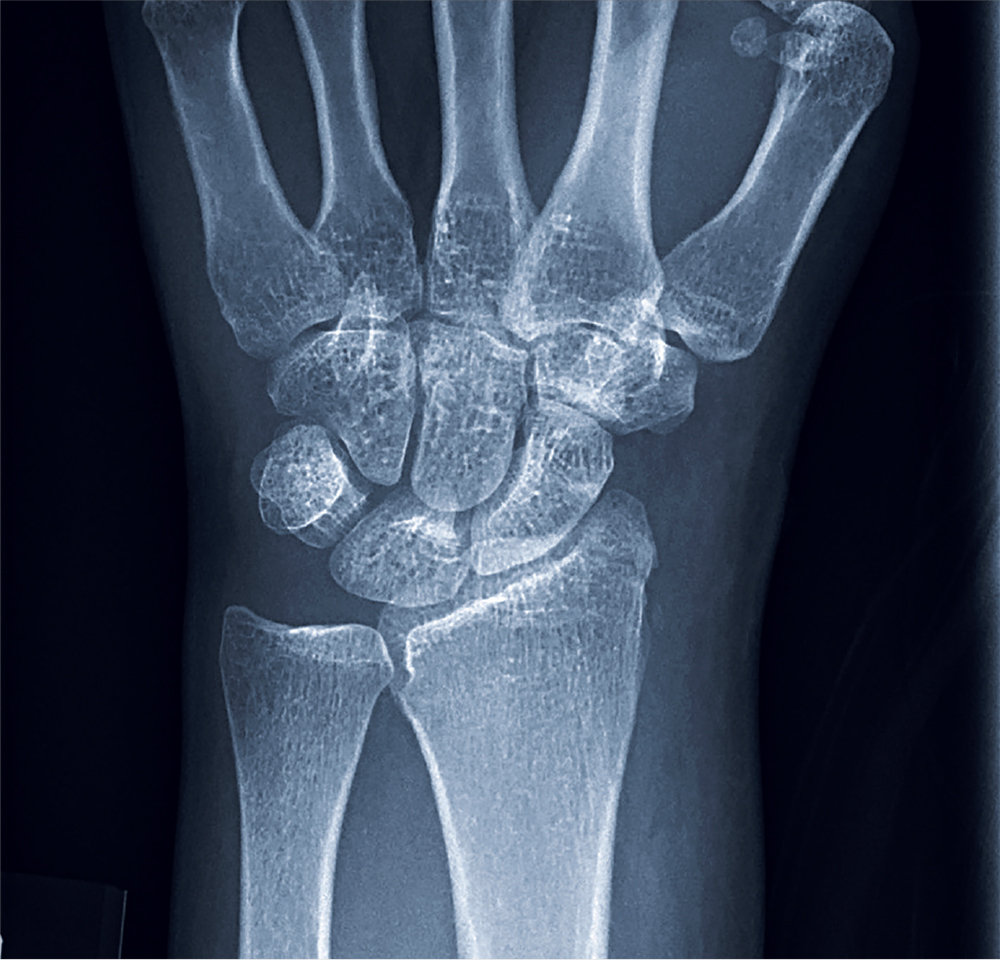
A 35-year-old woman arrives at the emergency department following a motor vehicle accident. She was a restrained driver who was crossing an intersection when another vehicle pulled out in front of her. She recalls gripping the steering wheel in anticipation of impact. No air bags deployed. She complains of wrist pain, but denies any other ailment.
Medical history is unremarkable. Vital signs are normal. Physical examination of the patient’s left wrist shows no obvious deformity. There is mild soft-tissue swelling, decreased range of motion, and moderate point tenderness along the radial aspect of the wrist. The nailbeds have good capillary refill. Strong pulses are present, as well.
Triage has already obtained a radiograph of the left wrist (shown). What is your impression?
Case Studies in Toxicology: Start Low and Go Slow
Case
A woman in her third decade with no known medical history was dropped off at the waiting area of the ED for evaluation of depressed mental status. Upon arrival, the patient was unresponsive and cyanotic, with a pulse oximetry of 65% on room air. Bag-valve mask (BVM) ventilation rapidly improved oxygen saturation to 90%. The patient’s other vital signs were: heart rate, 141 beats/min; blood pressure (BP), 117/65 mm Hg; and temperature, afebrile.
Upon examination, the patient’s pupils were pinpoint and her ventilatory effort was shallow, leading the emergency physician (EP) to suspect the patient’s depressed mental status was due to an opioid overdose.
The patient was given 2 mg of intravenous (IV) naloxone, after which she became more alert and responsive, with improved respiratory effort. After receiving naloxone, the patient vomited copiously. Pulmonary examination revealed diffuse rales, most prominently at the right lung base, and a cough productive of thick sputum.
During the patient’s course in the ED, she became increasingly hypotensive with systolic BP readings around 70 mm Hg; tachycardia, fluctuating at around 120 beats/min; and persistent hypoxia of 90% saturation on a nonrebreather mask. A chest X-ray demonstrated pulmonary edema with a continuous diaphragm sign suggesting pneumomediastinum. A computed tomography (CT) scan of the chest confirmed pulmonary edema with extensive pneumomediastinum, and the patient was admitted to the intensive care unit (ICU).
What is naloxone and why is it used?
Naloxone is a nonselective, short-acting, pure opioid antagonist that works at the mu, kappa, and sigma receptors, with the highest affinity for the mu receptor. It is a competitive opioid receptor antagonist that has an elimination half-life of approximately 30 minutes. Though naloxone was originally developed to reverse the effects of anesthesia postoperatively,1 today it is more commonly used to treat ventilatory depression in patients whose clinical findings are most likely due to an opioid overdose.
Opioid-dependent individuals who abstain from use for more than a few hours generally develop opioid withdrawal syndrome (OWS). The effects of OWS include mild-to-moderate tachycardia and hypertension, nausea, vomiting, piloerection, rhinorrhea, and agitated behavior. However, when opioid-dependent patients receive naloxone, OWS develops at a much faster rate (ie, seconds after naloxone administration) and is often more severe.
Findings of naloxone-precipitated OWS include pronounced vital sign abnormalities, seizures,pulmonary edema, and cardiac arrhythmias such as ventricular tachycardia.2 These latter findings are primarily due to the sudden release of catecholamines.3 In addition, patients suffer the psychological pangs of withdrawal, including dysphoria and drug craving, which often leads to poor decision-making as they search for additional opioids to alleviate these troubling effects.
What determines response to naloxone and development of OWS?
The severity of precipitated OWS following naloxone administration is determined by both the degree of the patient’s opioid dependency and the dosage and rate at which naloxone is given. The depth of opioid dependence is determined to a large extent by the quantity of opioid regularly used and the frequency of exposure. For example, a patient who takes 30 mg of oxycodone daily will likely demonstrate mild OWS, while one who uses 300 mg daily will demonstrate more severe OWS—whether due to abstinence or naloxone.
In addition, longer exposure time of the patient’s brain to opioids increases the dependency level. Continuous use of extended-release opioids or methadone, which are both of long duration, essentially “bathe” the brain receptors in opioid around the clock, whereas short-acting opioids, such as fentanyl or heroin, cause peaks and troughs in brain concentrations throughout the day. These trough periods reduce dependency, but increase the abuse liability of the opioid. Patients who only use opioids on the weekend, for example, will have minimal or no OWS following naloxone administration, nor will the toddler with an exploratory ingestion of an opioid medication found in the home. It is therefore important to gauge the extent of a patient’s opioid use to improve the safe use of naloxone in the ED.
What is the optimal dosing of naloxone and proper patient management?
It is essential for clinicians to remember that the ultimate goal of naloxone administration in the ED is to reverse ventilatory depression—not to restore a patient to a normal mental status.4 In fact, full awakening, in addition to precipitating OWS, may lead to difficult interpersonal situations in the ED, since such patients often insist on leaving the ED before the effects of naloxone wear off. This situation places the EP in the undesirable position of discharging a patient who may predictably relapse—though unlikely to die—after release.5
Management in the Hospital Setting. Given the advanced medical care environment in a hospital, the approach to opioid overdose patients can be metered. This means providing temporary noninvasive mechanical ventilatory support through BVM or laryngeal mask airways, which allow both oxygenation and ventilation (reducing the patient’s partial pressure of carbon dioxide), prior to giving naloxone.6 Studies on animal models have shown that lowering the partial pressure of carbon dioxide reduces the catecholamine response to naloxone.7
Although recent literature and textbook recommendations regarding naloxone dosages vary,1 the safest initial dose of naloxone in the hospital setting is 0.04 mg (40 mcg) IV, or 0.08 mg (80 mcg) intramuscularly (IM).8 Whether given by IV or IM route, frequent reassessment of the adequacy of spontaneous ventilatory effort and oxygenation are required.
While the rate of opioid reversal is slower when giving lower doses of naloxone, this approach reduces the severity of precipitated OWS. In fact, in most patients who receive low-dose naloxone administration will not awaken but will develop life-sustaining spontaneous ventilation.8
By monitoring of the patient’s ventilatory rate and depth, along with capnometry and pulse oximetry (without providing exogenous oxygen), the EP can identify the need for additional naloxone. Since the half-life of naloxone is shorter than that of many opioids, proper ventilatory monitoring is essential to assess for the waning of naloxone’s effects and return of respiratory depression.
Treatment in the Nonhospital Setting. Emergency medical service (EMS) workers typically, and often by situational necessity, approach opioid overdose patients more aggressively than do EPs in the ED. Although some EMS systems utilize the IV route, most EMS workers, like laypersons, administer an initial naloxone dose of 0.4 mg IM or 2 or 4 mg intranasally (IN). Due to the slower rate of absorption and lower bioavailability (with IN administration), both IM and IN naloxone equate to roughly 0.08 mg IV.
For patients in whom there is no risk for opioid dependence, the initial dose of naloxone is relatively inconsequential, and higher doses can be safely administered. However, for most patients, including those in the ED setting, in whom one cannot be certain of their depth of dependence, the safest approach is to “start low and go slow” with naloxone administration, while providing supportive care.
Case Conclusion
The patient was not opioid-naïve, explaining the catecholamine surge and related cardiovascular dysfunction and pulmonary edema. The pneumomediastinum and pulmonary aspiration were due to the violent retching and vomiting. After being admitted to the ICU, the patient was started on vancomycin and piperacillin/tazobactam for empiric coverage for mediastinal emphysema. She was kept NPO, assessed by cardiothoracic surgery, and treated with gentle fluid hydration.
A repeat CT showed a stable pneumomediastinum. Her hypoxia, tachycardia, and hypotension gradually improved over about 6 hours. The following day, the patient’s mental status normalized, and she discharged herself from the hospital against medical advice.
1. Connors NJ, Nelson LS. The evolution of recommended naloxone dosing for opioid overdose by medical specialty. J Med Toxicol. 2016;12(3):276-281. doi:10.1007/s13181-016-0559-3.
2. Lameijer, H, Azizi N, Ligtenberg JJ, Ter Maaten JC. Ventricular tachycardia after naloxone administration: a drug related complication? Case report and literature review. Drug Saf Case Rep. 2014;1(1):2. doi:10.1007/s40800-014-0002-0.
3. Kienbaum P, Thürauf N, Michel MC, Scherbaum N, Gastpar M, Peters J. Profound increase in epinephrine concentration in plasma and cardiovascular stimulation after mu-opioid receptor blockade in opioid-addicted patients during barbiturate-induced anesthesia for acute detoxification. Anesthesiology. 1998;88(5):1154-1161.
4. Kim HK, Nelson LS. Reducing the harm of opioid overdose with the safe use of naloxone: a pharmacologic review. Expert Opin Drug Saf. 2015;14 (7 ):1137-1146. doi:10.1517/14740338.2015.1037274.
5. Willman MW, Liss DB, Schwarz ES, Mullins ME. Do heroin overdose patients require observation after receiving naloxone? Clin Toxicol (Phila). 2017;55(2):81-87. doi:10.1080/15563650.2016.1253846.
6. Boyer EW. Management of opioid analgesic overdose. N Engl J Med. 2012;367(2):146-155. doi:10.1056/NEJMra1202561.
7. Mills CA, Flacke JW, Miller JD, Davis LJ, Bloor BC, Flacke WE. Cardiovascular effects of fentanyl reversal by naloxone at varying arterial carbon dioxide tensions in dogs. Anesth Analg. 1988;67(8):730-736.
8. Kim HK, Nelson LS. Reversal of opioid-induced ventilatory depression using low-dose naloxone (0.04 mg): a case series. J Med Toxicol. 2015;12(1):107-110. doi:10.1007/s13181-015-0499-3.
Case
A woman in her third decade with no known medical history was dropped off at the waiting area of the ED for evaluation of depressed mental status. Upon arrival, the patient was unresponsive and cyanotic, with a pulse oximetry of 65% on room air. Bag-valve mask (BVM) ventilation rapidly improved oxygen saturation to 90%. The patient’s other vital signs were: heart rate, 141 beats/min; blood pressure (BP), 117/65 mm Hg; and temperature, afebrile.
Upon examination, the patient’s pupils were pinpoint and her ventilatory effort was shallow, leading the emergency physician (EP) to suspect the patient’s depressed mental status was due to an opioid overdose.
The patient was given 2 mg of intravenous (IV) naloxone, after which she became more alert and responsive, with improved respiratory effort. After receiving naloxone, the patient vomited copiously. Pulmonary examination revealed diffuse rales, most prominently at the right lung base, and a cough productive of thick sputum.
During the patient’s course in the ED, she became increasingly hypotensive with systolic BP readings around 70 mm Hg; tachycardia, fluctuating at around 120 beats/min; and persistent hypoxia of 90% saturation on a nonrebreather mask. A chest X-ray demonstrated pulmonary edema with a continuous diaphragm sign suggesting pneumomediastinum. A computed tomography (CT) scan of the chest confirmed pulmonary edema with extensive pneumomediastinum, and the patient was admitted to the intensive care unit (ICU).
What is naloxone and why is it used?
Naloxone is a nonselective, short-acting, pure opioid antagonist that works at the mu, kappa, and sigma receptors, with the highest affinity for the mu receptor. It is a competitive opioid receptor antagonist that has an elimination half-life of approximately 30 minutes. Though naloxone was originally developed to reverse the effects of anesthesia postoperatively,1 today it is more commonly used to treat ventilatory depression in patients whose clinical findings are most likely due to an opioid overdose.
Opioid-dependent individuals who abstain from use for more than a few hours generally develop opioid withdrawal syndrome (OWS). The effects of OWS include mild-to-moderate tachycardia and hypertension, nausea, vomiting, piloerection, rhinorrhea, and agitated behavior. However, when opioid-dependent patients receive naloxone, OWS develops at a much faster rate (ie, seconds after naloxone administration) and is often more severe.
Findings of naloxone-precipitated OWS include pronounced vital sign abnormalities, seizures,pulmonary edema, and cardiac arrhythmias such as ventricular tachycardia.2 These latter findings are primarily due to the sudden release of catecholamines.3 In addition, patients suffer the psychological pangs of withdrawal, including dysphoria and drug craving, which often leads to poor decision-making as they search for additional opioids to alleviate these troubling effects.
What determines response to naloxone and development of OWS?
The severity of precipitated OWS following naloxone administration is determined by both the degree of the patient’s opioid dependency and the dosage and rate at which naloxone is given. The depth of opioid dependence is determined to a large extent by the quantity of opioid regularly used and the frequency of exposure. For example, a patient who takes 30 mg of oxycodone daily will likely demonstrate mild OWS, while one who uses 300 mg daily will demonstrate more severe OWS—whether due to abstinence or naloxone.
In addition, longer exposure time of the patient’s brain to opioids increases the dependency level. Continuous use of extended-release opioids or methadone, which are both of long duration, essentially “bathe” the brain receptors in opioid around the clock, whereas short-acting opioids, such as fentanyl or heroin, cause peaks and troughs in brain concentrations throughout the day. These trough periods reduce dependency, but increase the abuse liability of the opioid. Patients who only use opioids on the weekend, for example, will have minimal or no OWS following naloxone administration, nor will the toddler with an exploratory ingestion of an opioid medication found in the home. It is therefore important to gauge the extent of a patient’s opioid use to improve the safe use of naloxone in the ED.
What is the optimal dosing of naloxone and proper patient management?
It is essential for clinicians to remember that the ultimate goal of naloxone administration in the ED is to reverse ventilatory depression—not to restore a patient to a normal mental status.4 In fact, full awakening, in addition to precipitating OWS, may lead to difficult interpersonal situations in the ED, since such patients often insist on leaving the ED before the effects of naloxone wear off. This situation places the EP in the undesirable position of discharging a patient who may predictably relapse—though unlikely to die—after release.5
Management in the Hospital Setting. Given the advanced medical care environment in a hospital, the approach to opioid overdose patients can be metered. This means providing temporary noninvasive mechanical ventilatory support through BVM or laryngeal mask airways, which allow both oxygenation and ventilation (reducing the patient’s partial pressure of carbon dioxide), prior to giving naloxone.6 Studies on animal models have shown that lowering the partial pressure of carbon dioxide reduces the catecholamine response to naloxone.7
Although recent literature and textbook recommendations regarding naloxone dosages vary,1 the safest initial dose of naloxone in the hospital setting is 0.04 mg (40 mcg) IV, or 0.08 mg (80 mcg) intramuscularly (IM).8 Whether given by IV or IM route, frequent reassessment of the adequacy of spontaneous ventilatory effort and oxygenation are required.
While the rate of opioid reversal is slower when giving lower doses of naloxone, this approach reduces the severity of precipitated OWS. In fact, in most patients who receive low-dose naloxone administration will not awaken but will develop life-sustaining spontaneous ventilation.8
By monitoring of the patient’s ventilatory rate and depth, along with capnometry and pulse oximetry (without providing exogenous oxygen), the EP can identify the need for additional naloxone. Since the half-life of naloxone is shorter than that of many opioids, proper ventilatory monitoring is essential to assess for the waning of naloxone’s effects and return of respiratory depression.
Treatment in the Nonhospital Setting. Emergency medical service (EMS) workers typically, and often by situational necessity, approach opioid overdose patients more aggressively than do EPs in the ED. Although some EMS systems utilize the IV route, most EMS workers, like laypersons, administer an initial naloxone dose of 0.4 mg IM or 2 or 4 mg intranasally (IN). Due to the slower rate of absorption and lower bioavailability (with IN administration), both IM and IN naloxone equate to roughly 0.08 mg IV.
For patients in whom there is no risk for opioid dependence, the initial dose of naloxone is relatively inconsequential, and higher doses can be safely administered. However, for most patients, including those in the ED setting, in whom one cannot be certain of their depth of dependence, the safest approach is to “start low and go slow” with naloxone administration, while providing supportive care.
Case Conclusion
The patient was not opioid-naïve, explaining the catecholamine surge and related cardiovascular dysfunction and pulmonary edema. The pneumomediastinum and pulmonary aspiration were due to the violent retching and vomiting. After being admitted to the ICU, the patient was started on vancomycin and piperacillin/tazobactam for empiric coverage for mediastinal emphysema. She was kept NPO, assessed by cardiothoracic surgery, and treated with gentle fluid hydration.
A repeat CT showed a stable pneumomediastinum. Her hypoxia, tachycardia, and hypotension gradually improved over about 6 hours. The following day, the patient’s mental status normalized, and she discharged herself from the hospital against medical advice.
1. Connors NJ, Nelson LS. The evolution of recommended naloxone dosing for opioid overdose by medical specialty. J Med Toxicol. 2016;12(3):276-281. doi:10.1007/s13181-016-0559-3.
2. Lameijer, H, Azizi N, Ligtenberg JJ, Ter Maaten JC. Ventricular tachycardia after naloxone administration: a drug related complication? Case report and literature review. Drug Saf Case Rep. 2014;1(1):2. doi:10.1007/s40800-014-0002-0.
3. Kienbaum P, Thürauf N, Michel MC, Scherbaum N, Gastpar M, Peters J. Profound increase in epinephrine concentration in plasma and cardiovascular stimulation after mu-opioid receptor blockade in opioid-addicted patients during barbiturate-induced anesthesia for acute detoxification. Anesthesiology. 1998;88(5):1154-1161.
4. Kim HK, Nelson LS. Reducing the harm of opioid overdose with the safe use of naloxone: a pharmacologic review. Expert Opin Drug Saf. 2015;14 (7 ):1137-1146. doi:10.1517/14740338.2015.1037274.
5. Willman MW, Liss DB, Schwarz ES, Mullins ME. Do heroin overdose patients require observation after receiving naloxone? Clin Toxicol (Phila). 2017;55(2):81-87. doi:10.1080/15563650.2016.1253846.
6. Boyer EW. Management of opioid analgesic overdose. N Engl J Med. 2012;367(2):146-155. doi:10.1056/NEJMra1202561.
7. Mills CA, Flacke JW, Miller JD, Davis LJ, Bloor BC, Flacke WE. Cardiovascular effects of fentanyl reversal by naloxone at varying arterial carbon dioxide tensions in dogs. Anesth Analg. 1988;67(8):730-736.
8. Kim HK, Nelson LS. Reversal of opioid-induced ventilatory depression using low-dose naloxone (0.04 mg): a case series. J Med Toxicol. 2015;12(1):107-110. doi:10.1007/s13181-015-0499-3.
When the Fix Fails
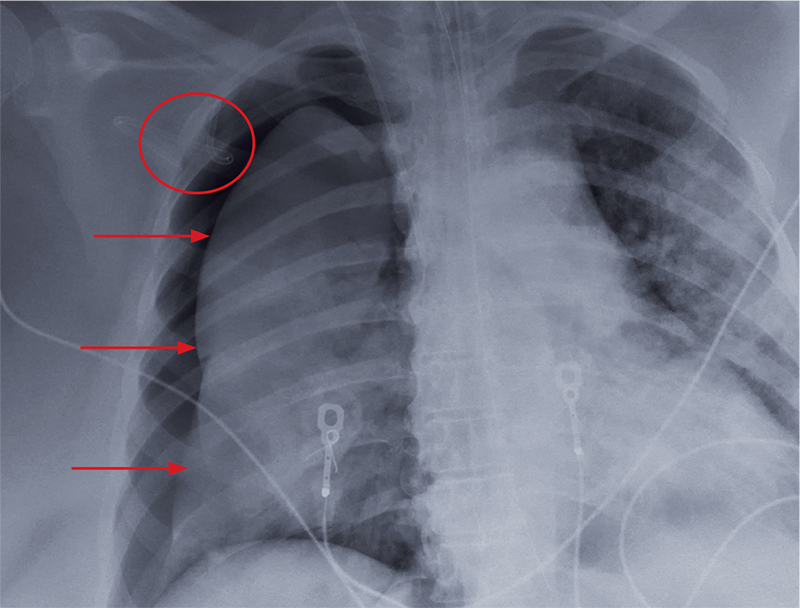
ANSWER
The radiograph shows an adequately positioned endotracheal tube. It also shows bilateral infiltrates, greater in the right than in the left lung.
A pigtail catheter is present, up high near the apex; despite this, a pneumothorax of moderate size remains on the right. The likely explanation is that the catheter is either not properly positioned or is kinked.
Prompt surgical consultation for new chest tube placement was obtained.
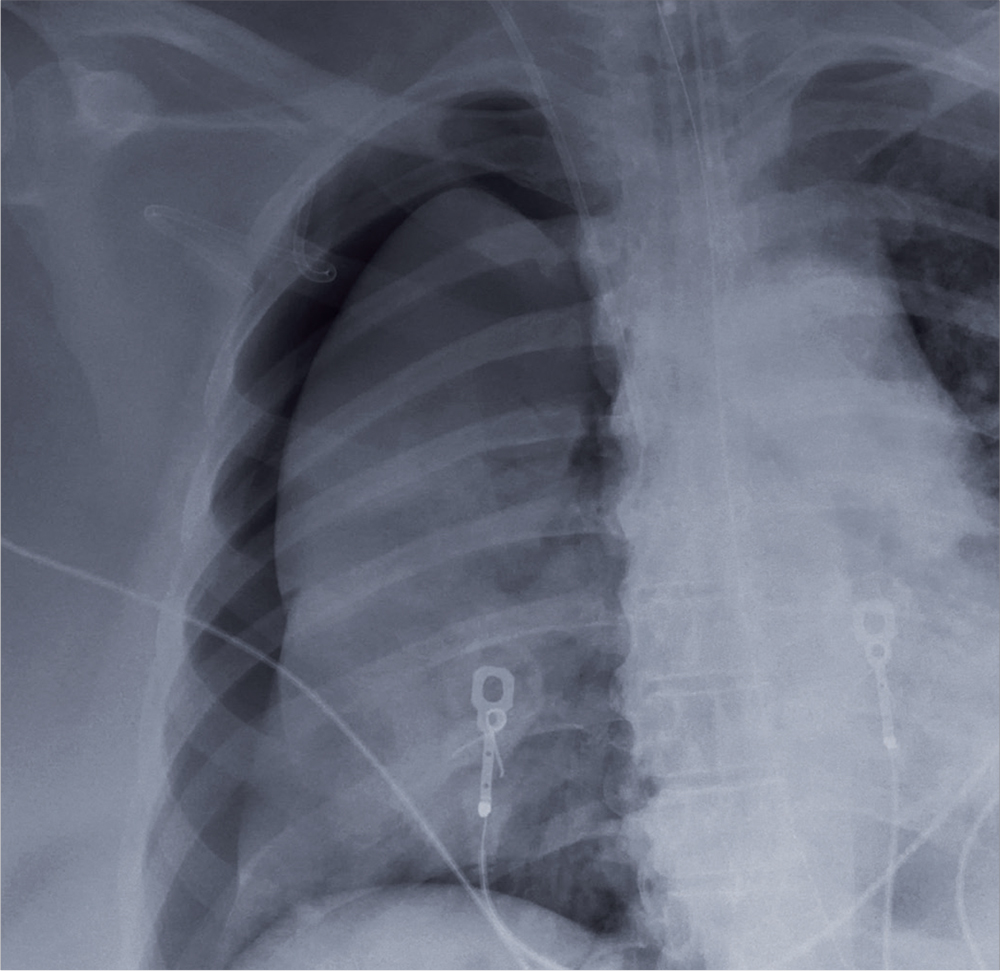
A 60-year-old woman is transferred to your facility from an outside hospital for tertiary care. She was reportedly at home with family when she suddenly collapsed and became unresponsive. She was taken to a nearby hospital, where she was resuscitated, stabilized, and urgently sent to your facility for possible cardiac intervention.
You assess the patient immediately upon arrival;with no family present, history is limited to the chart. You note an intubated female on mild sedation. Her vital signs include a temperature of 37.0°C; blood pressure, 130/80 mm Hg; heart rate, 70 beats/min; and O2 saturation, 98% on 100% FiO2.
The heart rate monitor shows sinus rhythm. A right chest tube is in place. Auscultation reveals bilateral rhonchi.
Portable chest radiograph is obtained (shown). What is your impression?
Diagnosis and treatment of hyperkalemia
Hyperkalemia is common in patients with cardiovascular disease. Its consequences can be severe and life-threatening, and its management and prevention require a multidisciplinary approach that entails reducing intake of high-potassium foods, adjusting medications that cause hyperkalemia, and adding medications that reduce the plasma potassium concentration. With this approach, patients at high risk can receive the cardiorenal benefits of drugs that block the renin-angiotensin-aldosterone system without developing hyperkalemia.
98% OF POTASSIUM IS INSIDE CELLS
The body of a typical 70-kg man contains about 3,500 mmol of potassium, 98% of which is in the intracellular space; the remaining 2% is in the extracellular space. This large intracellular-to-extracellular gradient determines the cell voltage and explains why disorders in plasma potassium give rise to manifestations in excitable tissues such as the heart and nervous system.
The most important determinants of potassium distribution between the intracellular and extracellular space are insulin and beta-adrenergic receptor stimulation.
Maintenance of total-body potassium content is primarily the job of the kidneys, with a small contribution by the gastrointestinal tract.1,2 Hyperkalemia is most commonly encountered in patients with decreased kidney function.
The normal kidney can secrete a large amount of potassium, making hyperkalemia uncommon in the absence of kidney disease. This large capacity may have evolved to handle the diet of Paleolithic humans, which contained 4 times as much potassium as contemporary diets.3,4 With the onset of agriculture, dietary intake of potassium has progressively declined while sodium intake has risen. A popular theory suggests this mismatch between the modern diet and the nutritional requirements encoded in the human genome during evolution may contribute to chronic diseases such as hypertension, stroke, kidney stones, and bone disease.5
MANY POTENTIAL CAUSES OF HYPERKALEMIA

Causes of hyperkalemia are outlined in Table 1. Shifting of potassium from the cells to the extracellular space is a cause of transient hyperkalemia, while chronic hyperkalemia indicates an impairment in renal potassium secretion. The following discussion is a guide to the approach to the hyperkalemic patient.
Is the patient’s hyperkalemia really pseudohyperkalemia?
Pseudohyperkalemia, an artifact of measurement, occurs due to mechanical release of potassium from cells during phlebotomy or specimen processing.6 This diagnosis is made when the serum potassium concentration exceeds the plasma potassium concentration by more than 0.5 mmol/L, and should be considered when hyperkalemia occurs in the absence of a clinical risk factor. Fist-clenching, application of a tight-fitting tourniquet, or use of small-bore needles during phlebotomy can all cause pseudohyperkalemia.
Mechanism of pseudohyperkalemia. Since serum is the liquid part of blood remaining after coagulation, release of potassium from cells injured during the process of coagulation raises the potassium level in the serum. Plasma is the cell-free part of blood that has been treated with anticoagulants; it has no cells that can be injured and release potassium. Thus, the serum potassium level will be higher than that in the plasma.
Reverse pseudohyperkalemia, in contrast, occurs when the plasma potassium level is falsely elevated but the serum value is normal. This situation has been described in hematologic disorders characterized by pronounced leukocytosis in which malignant cells are prone to lysis with minimal mechanical stress due to increased fragility or altered sodium-potassium ATPase pump activity.7 This phenomenon is unusual but occurs because the cells are so fragile.
A spurious increase in plasma potassium concentration along with a low plasma calcium concentration raises the possibility of calcium chelation and release of potassium in a sample tube contaminated with the anticoagulant ethylenediaminetetraacetic acid.
Is there increased potassium intake?
Increased potassium intake is a potential cause of hyperkalemia in patients with decreased kidney function or adrenal disease.
Foods naturally rich in potassium include bananas (a medium-sized banana contains 451 mg or 12 mmol of potassium) and potatoes (844 mg or 22 mmol in a large baked potato with skin). Other potassium-rich foods are melons, citrus juice, and avocados. Less-obvious food sources include raw coconut juice (potassium concentration 44.3 mmol/L) and noni juice (56 mmol/L).
Salt substitutes, recommended to hypertensive patients with chronic kidney disease, can be a hidden source of dietary potassium.
Clay ingestion is a potential cause of dyskalemia. White clay consumption causes hypokalemia due to potassium binding in the gastrointestinal tract. Red clay or river bed clay, on the other hand, is enriched in potassium (100 mmol of potassium in 100 g of clay) and can cause life-threatening hyperkalemia in patients with chronic kidney disease.8
Eating burnt match heads. Some individuals chew and ingest burnt match heads, a condition called cautopyreiophagia. In one reported case,9 this activity contributed an additional 80 mmol of daily potassium intake in a dialysis patient, resulting in a plasma potassium concentration of 8 mmol/L.
Is the hyperkalemia the result of a cellular shift?
Acute hyperkalemia can be the result of redistribution of cellular potassium. Shifting of as little as 2% of the body’s potassium from the intracellular to the extracellular space can double the plasma potassium concentration.
Tissue injury. Hyperkalemia frequently occurs in diseases that cause tissue injury such as rhabdomyolysis, trauma, massive hemolysis, and tumor lysis.
Insulin deficiency. Insulin and catecholamines are major regulators of potassium distribution within the body. After a meal, release of insulin not only regulates the plasma glucose concentration, it also causes potassium to move into cells until the kidneys have had sufficient time to excrete the dietary potassium load and reestablish total-body potassium content.
Exercise, beta-blockers. During exercise, potassium is released from skeletal muscle cells and accumulates in the interstitial compartment, where it exerts a vasodilatory effect. The simultaneous increase in circulating catecholamines regulates this release by promoting cell potassium uptake through beta-adrenergic receptor stimulation.
Metabolic acidosis can facilitate exit (ie, shift) of potassium from cells, but this effect depends on the type of acidosis. Hyperchloremic normal anion gap acidosis (mineral acidosis) most commonly causes this effect due to the relative impermeability of the cell membrane to the chloride anion. As hydrogen ions move into the cell due to accumulation of ammonium chloride or hydrogen chloride, electrical neutrality is maintained by potassium exit.
In contrast, organic acidosis (due to lactic, beta-hydroxybutyric, or methylmalonic acid) tends not to cause a potassium shift, since most organic anions readily cross the cell membrane along with hydrogen. Lactic acidosis is often associated with potassium shift, but this effect is due to loss of cell integrity as a result of cell ischemia. The hyperkalemia typically present on admission in patients with diabetic ketoacidosis is the result of insulin deficiency and hypertonicity and not the underlying organic acidosis.10
Hypertonic states can cause hyperkalemia due to cell shift. For example, hyperglycemia, as in diabetic ketoacidosis, pulls water from the intracellular into the extracellular compartment, thereby concentrating intracellular potassium and creating a more favorable gradient for potassium efflux through membrane channels. This same effect can occur in neurosurgical patients given large amounts of hypertonic mannitol. Repetitive doses of immunoglobulin can lead to extracellular accumulation of sorbitol, maltose, or sucrose, since these sugars are added to the preparations to prevent immunoglobulin aggregation.11
Is a disturbance in renal potassium excretion present?
Sustained hyperkalemia is more commonly associated with decreases in renal potassium excretion than with a cellular shift. In most instances the clinician can distinguish between cell shift and impaired renal excretion based on the available clinical data.
The transtubular potassium gradient has been used to determine whether there is a disturbance in renal potassium excretion and to assess renal potassium handling.12

This calculation is based on the assumption that only water is reabsorbed past the cortical collecting duct, and not solutes. It has fallen out of favor since we have found this assumption to be incorrect; a large amount of urea is reabsorbed daily in the downstream medullary collecting duct as a result of intrarenal recycling of urea.
The one situation in which the transtubular potassium gradient may be of use is determining whether hyperkalemia is a result of low aldosterone levels as opposed to aldosterone resistance. One can compare the transtubular potassium gradient before and after a physiologic dose (0.05 mg) of 9-alpha fludrocortisone. An increase of more than 6 over a 4-hour period favors aldosterone deficiency, whereas smaller changes would indicate aldosterone resistance.
24-hour potassium excretion, spot urine potassium-creatinine ratio. A better way to assess renal potassium handling is to measure the amount of potassium in a 24-hour urine collection or determine a spot urine potassium-creatinine ratio. A 24-hour urinary potassium excretion of less than 15 mmol or a potassium-creatinine ratio less than 1 suggests an extrarenal cause of hypokalemia. A ratio greater than 20 would be an appropriate renal response to hyperkalemia.
One or more of 3 abnormalities should be considered in the hyperkalemic patient with impaired renal excretion of potassium:
- Decreased distal delivery of sodium
- Mineralocorticoid deficiency
- Abnormal cortical collecting tubule function.13
Decreased distal delivery of sodium
Under normal circumstances, potassium is freely filtered across the glomerulus and then mostly reabsorbed in the proximal tubule and thick ascending limb. Potassium secretion begins in the distal convoluted tubule and increases in magnitude into the collecting duct. Tubular secretion is the component of potassium handling that varies and is regulated according to physiologic needs.
In acute kidney injury, the rapid decline in glomerular filtration rate and reduction in functioning nephron mass lead to decreased distal potassium secretion.
Hyperkalemia is a frequent problem when oliguria is present, since the reduction in distal delivery of sodium and water further impairs potassium secretion. Patients with oliguric acute kidney injury are more likely to have a more severe underlying disease state, and therefore tissue breakdown and catabolism further increase the risk of hyperkalemia.
In contrast, in nonoliguric patients, the renal injury tends to be less severe, and enough sodium and water are usually delivered distally to prevent hyperkalemia.
In chronic kidney disease, nephron dropout and reduction in collecting tubule mass also lead to a global decline in distal potassium secretion. However, this is countered by an increased capacity of the remaining individual nephrons for potassium secretion. High flow, increased distal sodium delivery, and increased activity and number of sodium-potassium ATPase pumps in the remaining nephrons account for this increased secretory capacity.14 As renal function declines over time, colonic potassium secretion progressively increases.15
These adaptive changes help to keep the plasma potassium concentration within the normal range until the glomerular filtration rate falls to less than 10 or 15 mL/min. Development of hyperkalemia with more modest reductions in the glomerular filtration rate suggest decreased mineralocorticoid activity or a specific lesion of the tubule.
Mineralocorticoid deficiency

Aldosterone deficiency can occur alone or in combination with decreased cortisol levels. Destruction of the adrenal glands is suggested when both hormones are reduced. Enzyme defects in cortisol metabolism can result in either isolated deficiency of aldosterone or adrenogenital syndromes associated with decreased mineralocorticoid activity.
Heparin administration leads to a reversible defect in adrenal synthesis of aldosterone. Drugs that block the stimulatory effect of angiotensin II on the zona glomerulosa cells of the adrenal gland will lower aldosterone.
Renin-angiotensin-aldosterone system blockers. Angiotensin-converting enzyme inhibitors block the formation of angiotensin II, whereas angiotensin II receptor blockers prevent angiotensin II from binding to its adrenal receptor. The direct renin inhibitor aliskiren lowers angiotensin II levels by blocking the enzymatic activity of renin and lowers the circulating levels of both angiotensin I and II.16
The syndrome of hyporeninemic hypoaldosteronism is a common cause of hyperkalemia in patients who have a glomerular filtration rate between 40 and 60 mL/min. Diabetic nephropathy and interstitial renal disease are the most common clinical entities associated with this syndrome.10 Other causes include analgesic nephropathy, urinary tract obstruction, sickle cell disease, systemic lupus erythematosus, and amyloidosis.
Nonsteroidal anti-inflammatory drugs can cause hyperkalemia by suppressing renin release and reducing delivery of sodium to the distal nephron.18
Calcineurin inhibitors impair potassium secretion by suppressing renin release and by direct tubular effects.19
Beta-blockers. Beta-1 and to a lesser extent beta-2 receptor blockade can also result in a hyporeninemic state.
Distal tubular defect
Hyperkalemia can result from interstitial renal diseases that specifically affect the distal nephron. In this setting, the glomerular filtration rate is only mildly reduced, and circulating aldosterone levels are normal.
Renal transplant, lupus erythematosus, amyloidosis, urinary obstruction, and sickle cell disease are conditions in which an impairment in renin release may coexist with a defect in tubular secretion.
Potassium-sparing diuretics impair the ability of the cortical collecting tubule to secrete potassium. Specifically, amiloride and triamterene inhibit sodium reabsorption mediated by the epithelial sodium channel located on the apical membrane of the principal cell. This effect abolishes the lumen’s negative potential and thereby removes a driving force for potassium secretion.
Trimethoprim and pentamidine cause similar effects.
Spironolactone and eplerenone compete with aldosterone at the level of the mineralocorticoid receptor and can result in hyperkalemia.
Drospirenone, a non-testosterone-derived progestin contained in certain oral contraceptives, possesses mineralocorticoid-blocking effects similar to those of spironolactone.
The plasma potassium level should be monitored when these drugs are prescribed in patients receiving potassium supplements, renin-angiotensin-aldosterone system blockers, or nonsteroidal anti-inflammatory drugs.20
CLINICAL FEATURES OF HYPERKALEMIA
Neuromuscular manifestations of hyperkalemia include paresthesias and fasciculations in the arms and legs. Severe elevation in potassium can give rise to an ascending paralysis with eventual flaccid quadriplegia. Typically, the trunk, head, and respiratory muscles are spared, and respiratory failure is rare.
Cardiac signs

Hyperkalemia has depolarizing effects on the heart that are manifested by changes in the electrocardiogram (Figure 2). The progressive changes of hyperkalemia are classically listed as:
- Peaked T waves that are tall, narrow, and symmetrical and can occasionally be confused with the hyperacute T-wave change associated with an ST-segment elevation myocardial infarction.21 However, in the latter condition, the T waves tend to be more broad-based and asymmetric in shape.
- ST-segment depression
- Widening of the PR interval
- Widening of the QRS interval
- Loss of the P wave
- A sine-wave pattern—an ominous development and a harbinger of impending ventricular fibrillation and asystole.
The plasma potassium concentration often correlates poorly with cardiac manifestations. In a retrospective review, only 16 of 90 cases met strict criteria for electrocardiographic changes reflective of hyperkalemia (defined as new peaked and symmetric T waves that resolved on follow-up).22 In 13 of these cases, the electrocardiogram was interpreted as showing no T-wave changes even when read by a cardiologist. In addition, electrocardiographic criteria for hyperkalemia were noted in only 1 of 14 patients who manifested arrhythmias or cardiac arrest attributed to increased plasma potassium concentration.
TREATMENT OF ACUTE HYPERKALEMIA
The treatment of hyperkalemia depends on the magnitude of increase in the plasma potassium concentration and the presence or absence of electrocardiographic changes or neuromuscular symptoms.23 Acute treatment is indicated for marked electrocardiographic changes and severe muscle weakness.
Intravenous calcium rapidly normalizes membrane excitability by antagonizing the potassium-induced decrease in membrane excitability but does not alter the plasma potassium concentration.
Insulin lowers the plasma potassium concentration by promoting its entry into cells. To avoid hypoglycemia, 10 units of short-acting insulin should be accompanied by a 50-g infusion of glucose, increased to 60 g if 20 units of insulin are given.24
Beta-2 receptor agonists produce a similar effect. The shift of potassium into cells with insulin and beta-2-adrenergic receptor stimulation is brought about by increases in sodium-potassium ATPase pump activity, primarily in skeletal muscle cells.
Sodium bicarbonate, in the absence of acidosis, lowers the plasma potassium concentration only slightly. It should be reserved for hyperkalemic patients who have coexisting metabolic acidosis after the patient has received insulin and glucose, an adrenergic agent, and calcium.
These acute treatments need to be followed by therapies designed to lower the total body potassium content such as diuretics, potassium-binding drugs, and dialysis.
TREATMENT OF CHRONIC HYPERKALEMIA
Review medications. Once the diagnosis of hyperkalemia has been made, the initial approach should be to review the patient’s medications and make every effort to discontinue drugs that can impair renal potassium excretion.16 Patients should be asked about their use of over-the-counter nonsteroidal anti-inflammatory drugs and herbal remedies, since herbs may be a hidden source of dietary potassium.
Dietary counseling. Patients should be instructed to reduce their dietary intake of potassium and to avoid salt substitutes that contain potassium.

Diuretic therapy is beneficial in minimizing hyperkalemia in patients with chronic kidney disease. Thiazide and loop diuretics enhance renal potassium excretion by increasing flow and delivery of sodium to the collecting duct. Thiazide diuretics are effective when the estimated glomerular filtration rate is greater than 30 mL/min, while loop diuretics should be used in patients with more severe renal insufficiency (Table 2).
Sodium bicarbonate is an effective agent to minimize increases in the plasma potassium concentration in patients with chronic kidney disease and metabolic acidosis. This drug increases renal potassium excretion by increasing distal sodium delivery and shifts potassium into cells as the acidosis is corrected. The likelihood of developing volume overload as a complication of sodium bicarbonate administration can be minimized with effective diuretic therapy.
Avoiding hyperkalemia if renin-angiotensin-aldosterone system blockers are needed
Renin-angiotensin-aldosterone system blockers can be problematic, as these drugs cause hyperkalemia, often in the very patients who derive the greatest cardiovascular benefit from them.16 A number of steps can reduce the risk of hyperkalemia and allow these drugs to be used.
The initial dose should be low and the plasma potassium should be measured within 1 to 2 weeks after drug initiation. If the potassium level is normal, the dose can be titrated upwards with remeasurement of the plasma potassium after each dose titration. If the plasma potassium concentration rises to 5.5 mmol/L, in some cases lowering the dose will reduce the potassium concentration and allow the patient to remain on the drug.
In patients at risk of hyperkalemia, angiotensin II receptor blockers and direct renin inhibitors should be used with the same caution as angiotensin-converting enzyme inhibitors.
If the plasma potassium concentration exceeds 5.5 mmol/L despite the above precautions, one can consider using a potassium-binding drug (see below) before deciding to avoid renin-angiotensin-aldosterone system blockers.
Sodium polystyrene sulfonate binds potassium in the gastrointestinal tract in exchange for sodium and has been used to manage hyperkalemia. This drug is most commonly given along with sorbitol as a therapy for acute hyperkalemia. Although the drug is widely used, most of the potassium-lowering effect is due to an increase in stool volume caused by sorbitol.25,26 In addition, long-term use is poorly tolerated, and the drug has been linked to gastrointestinal toxicity in rare cases.
Patiromer and sodium zirconium cyclosilicate are two new potassium-binding drugs that have been shown to be effective in reducing plasma potassium concentration in the setting of ongoing use of renin-angiotensin-aldosterone system blockers.
Patiromer is a nonabsorbed polymer approved for clinical use to treat hyperkalemia. The drug binds potassium in exchange for calcium in the gastrointestinal tract, predominantly in the colon, and lowers the plasma potassium concentration in a dose-dependent manner, with the greatest reduction in those with higher starting values.27,28
Patiromer effectively controlled plasma potassium concentrations in a 1-year randomized trial in high-risk patients on renin-angiotensin-aldosterone system blockers.29 The main adverse events in clinical trials have been constipation and hypomagnesemia, which required magnesium replacement in a small number of patients, but overall, the drug is well tolerated.
Sodium zirconium cyclosilicate is a nonabsorbed microporous compound that binds potassium in exchange for sodium throughout the gastrointestinal tract. It has been found effective in lowering plasma potassium concentration in a dose-dependent fashion in high-risk patients, most of whom were receiving renin-angiotensin-aldosterone system blockers.30–32 Adverse events were generally comparable to those with placebo in clinical trials; however, edema occurred more frequently when higher doses were used. This drug is not yet approved for clinical use.
- Palmer BF, Clegg DJ. Physiology and pathophysiology of potassium homeostasis. Adv Physiol Educ 2016; 40:480–490.
- Palmer BF. Regulation of potassium homeostasis. Clin J Am Soc Nephrol 2015; 10:1050–1060.
- Eaton SB, Konner M. Paleolithic nutrition. A consideration of its nature and current implications. N Engl J Med 1985; 312:283–289.
- Sebastian A, Frassetto LA, Sellmeyer DE, Morris RC Jr. The evolution-informed optimal dietary potassium intake of human beings greatly exceeds current and recommended intakes. Semin Nephrol 2006; 26:447–453.
- Palmer BF, Clegg DJ. Achieving the benefits of a high potassium, Paleolithic diet, without the toxicity. Mayo Clin Proc 2016; 91:496–508.
- Liamis G, Liberopoulos E, Barkas F, Elisaf M. Spurious electrolyte disorders: a diagnostic challenge for clinicians. Am J Nephrol 2013; 38:50–57.
- Mansoor S, Holtzman N, Emadi A. Reverse pseudohyperkalemia: an important clinical entity in chronic lymphocytic leukemia. Case Rep Hematol 2015; 2015:930379.
- Gelfand M, Zarate A, Knepshield J. Geophagia. A cause of life-threatening hyperkalemia in patients with chronic renal failure. JAMA 1975; 234:738–740.
- Abu-Hamdan D, Sondheimer J, Mahajan S. Cautopyreiophagia. Cause of life-threatening hyperkalemia in a patient undergoing hemodialysis. Am J Med 1985; 79:517–519.
- Palmer BF, Clegg DJ. Electrolyte and acid-base disturbances in patients with diabetes mellitus. N Engl J Med 2015; 373:548–559.
- Daphnis E, Stylianou K, Alexandrakis M, et al. Acute renal failure, translocational hyponatremia and hyperkalemia following intravenous immunoglobulin therapy. Nephron Clin Pract 2007; 106:c143–c148.
- Choi M, Ziyadeh F. The utility of the transtubular potassium gradient in the evaluation of hyperkalemia. J Am Soc Nephrol 2008; 19:424–426.
- Palmer BF. A physiologic-based approach to the evaluation of a patient with hyperkalemia. Am J Kidney Dis 2010; 56:387–393.
- Stanton BA. Renal potassium transport: morphological and functional adaptations. Am J Physiol 1989; 257:R989–R997.
- Hayes CP Jr, McLeod ME, Robinson RR. An extravenal mechanism for the maintenance of potassium balance in severe chronic renal failure. Trans Assoc Am Physicians 1967; 80:207–216.
- Palmer BF. Managing hyperkalemia caused by inhibitors of the renin-angiotensin-aldosterone system. N Engl J Med 2004; 351:585–592.
- Palmer BF. Renal dysfunction complicating treatment of hypertension. N Engl J Med 2002; 347:1256–1261.
- Palmer BF. Renal complications associated with use of nonsteroidal anti-inflammatory agents. J Investig Med 1995; 43:516–533.
- Hoorn E, Walsh S, McCormick J, et al. The calcineurin inhibitor tacrolimus activates the renal sodium chloride cotransporter to cause hypertension. Nat Med 2011; 17:1304–1309.
- Bird ST, Pepe SR, Etminan M, Liu X, Brophy JM, Delaney JA. The association between drospirenone and hyperkalemia: a comparative-safety study. BMC Clin Pharmacol 2011; 11:23.
- Wang K. Images in clinical medicine. “Pseudoinfarction” pattern due to hyperkalemia. N Engl J Med 2004; 351:593.
- Montague BT, Ouellette JR, Buller GK. Retrospective review of the frequency of ECG changes in hyperkalemia. Clin J Am Soc Nephrol 2008; 3:324–330.
- Weisberg LS. Management of severe hyperkalemia. Crit Care Med 2008; 36:3246–3251.
- Harel Z, Kamel KS. Optimal dose and method of administration of intravenous insulin in the management of emergency hyperkalemia: a systematic review. PLoS One 2016; 11:e0154963.
- Sterns RH, Rojas M, Bernstein P, Chennupati S. Ion-exchange resins for the treatment of hyperkalemia: are they safe and effective? J Am Soc Nephrol 2010; 21:733–735.
- Emmett M, Hootkins RE, Fine KD, Santa Ana CA, Porter JL, Fordtran JS. Effect of three laxatives and a cation exchange resin on fecal sodium and potassium excretion. Gastroenterology 1995; 108:752–760.
- Bushinsky DA, Spiegel DM, Gross C, et al. Effect of patiromer on urinary ion excretion in healthy adults. Clin J Am Soc Nephrol 2016; 11:1769–1776.
- Weir MR, Bakris GL, Bushinsky DA, et al; OPAL-HK Investigators. Patiromer in patients with kidney disease and hyperkalemia receiving RAAS inhibitors. N Engl J Med 2015; 372:211–221.
- Bakris GL, Pitt B, Weir MR, et al; AMETHYST-DN Investigators. Effect of patiromer on serum potassium level in patients with hyperkalemia and diabetic kidney disease: the AMETHYST-DN randomized clinical trial. JAMA 2015; 314:151–161.
- Kosiborod M, Rasmussen HS, Lavin P, et al. Effect of sodium zirconium cyclosilicate on potassium lowering for 28 days among outpatients with hyperkalemia. The HARMONIZE randomized clinical trial. JAMA 2014; 312:2223–2233.
- Packham DK, Rasmussen HS, Lavin PT, et al. Sodium zirconium cyclosilicate in hyperkalemia. N Engl J Med 2015; 372:222–231.
- Anker SD, Kosiborod M, Zannad F, et al. Maintenance of serum potassium with sodium zirconium cyclosilicate (ZS-9) in heart failure patients: results from a phase 3 randomized, double-blind, placebo-controlled trial. Eur J Heart Fail 2015; 17:1050–1056.
Hyperkalemia is common in patients with cardiovascular disease. Its consequences can be severe and life-threatening, and its management and prevention require a multidisciplinary approach that entails reducing intake of high-potassium foods, adjusting medications that cause hyperkalemia, and adding medications that reduce the plasma potassium concentration. With this approach, patients at high risk can receive the cardiorenal benefits of drugs that block the renin-angiotensin-aldosterone system without developing hyperkalemia.
98% OF POTASSIUM IS INSIDE CELLS
The body of a typical 70-kg man contains about 3,500 mmol of potassium, 98% of which is in the intracellular space; the remaining 2% is in the extracellular space. This large intracellular-to-extracellular gradient determines the cell voltage and explains why disorders in plasma potassium give rise to manifestations in excitable tissues such as the heart and nervous system.
The most important determinants of potassium distribution between the intracellular and extracellular space are insulin and beta-adrenergic receptor stimulation.
Maintenance of total-body potassium content is primarily the job of the kidneys, with a small contribution by the gastrointestinal tract.1,2 Hyperkalemia is most commonly encountered in patients with decreased kidney function.
The normal kidney can secrete a large amount of potassium, making hyperkalemia uncommon in the absence of kidney disease. This large capacity may have evolved to handle the diet of Paleolithic humans, which contained 4 times as much potassium as contemporary diets.3,4 With the onset of agriculture, dietary intake of potassium has progressively declined while sodium intake has risen. A popular theory suggests this mismatch between the modern diet and the nutritional requirements encoded in the human genome during evolution may contribute to chronic diseases such as hypertension, stroke, kidney stones, and bone disease.5
MANY POTENTIAL CAUSES OF HYPERKALEMIA
Causes of hyperkalemia are outlined in Table 1. Shifting of potassium from the cells to the extracellular space is a cause of transient hyperkalemia, while chronic hyperkalemia indicates an impairment in renal potassium secretion. The following discussion is a guide to the approach to the hyperkalemic patient.
Is the patient’s hyperkalemia really pseudohyperkalemia?
Pseudohyperkalemia, an artifact of measurement, occurs due to mechanical release of potassium from cells during phlebotomy or specimen processing.6 This diagnosis is made when the serum potassium concentration exceeds the plasma potassium concentration by more than 0.5 mmol/L, and should be considered when hyperkalemia occurs in the absence of a clinical risk factor. Fist-clenching, application of a tight-fitting tourniquet, or use of small-bore needles during phlebotomy can all cause pseudohyperkalemia.
Mechanism of pseudohyperkalemia. Since serum is the liquid part of blood remaining after coagulation, release of potassium from cells injured during the process of coagulation raises the potassium level in the serum. Plasma is the cell-free part of blood that has been treated with anticoagulants; it has no cells that can be injured and release potassium. Thus, the serum potassium level will be higher than that in the plasma.
Reverse pseudohyperkalemia, in contrast, occurs when the plasma potassium level is falsely elevated but the serum value is normal. This situation has been described in hematologic disorders characterized by pronounced leukocytosis in which malignant cells are prone to lysis with minimal mechanical stress due to increased fragility or altered sodium-potassium ATPase pump activity.7 This phenomenon is unusual but occurs because the cells are so fragile.
A spurious increase in plasma potassium concentration along with a low plasma calcium concentration raises the possibility of calcium chelation and release of potassium in a sample tube contaminated with the anticoagulant ethylenediaminetetraacetic acid.
Is there increased potassium intake?
Increased potassium intake is a potential cause of hyperkalemia in patients with decreased kidney function or adrenal disease.
Foods naturally rich in potassium include bananas (a medium-sized banana contains 451 mg or 12 mmol of potassium) and potatoes (844 mg or 22 mmol in a large baked potato with skin). Other potassium-rich foods are melons, citrus juice, and avocados. Less-obvious food sources include raw coconut juice (potassium concentration 44.3 mmol/L) and noni juice (56 mmol/L).
Salt substitutes, recommended to hypertensive patients with chronic kidney disease, can be a hidden source of dietary potassium.
Clay ingestion is a potential cause of dyskalemia. White clay consumption causes hypokalemia due to potassium binding in the gastrointestinal tract. Red clay or river bed clay, on the other hand, is enriched in potassium (100 mmol of potassium in 100 g of clay) and can cause life-threatening hyperkalemia in patients with chronic kidney disease.8
Eating burnt match heads. Some individuals chew and ingest burnt match heads, a condition called cautopyreiophagia. In one reported case,9 this activity contributed an additional 80 mmol of daily potassium intake in a dialysis patient, resulting in a plasma potassium concentration of 8 mmol/L.
Is the hyperkalemia the result of a cellular shift?
Acute hyperkalemia can be the result of redistribution of cellular potassium. Shifting of as little as 2% of the body’s potassium from the intracellular to the extracellular space can double the plasma potassium concentration.
Tissue injury. Hyperkalemia frequently occurs in diseases that cause tissue injury such as rhabdomyolysis, trauma, massive hemolysis, and tumor lysis.
Insulin deficiency. Insulin and catecholamines are major regulators of potassium distribution within the body. After a meal, release of insulin not only regulates the plasma glucose concentration, it also causes potassium to move into cells until the kidneys have had sufficient time to excrete the dietary potassium load and reestablish total-body potassium content.
Exercise, beta-blockers. During exercise, potassium is released from skeletal muscle cells and accumulates in the interstitial compartment, where it exerts a vasodilatory effect. The simultaneous increase in circulating catecholamines regulates this release by promoting cell potassium uptake through beta-adrenergic receptor stimulation.
Metabolic acidosis can facilitate exit (ie, shift) of potassium from cells, but this effect depends on the type of acidosis. Hyperchloremic normal anion gap acidosis (mineral acidosis) most commonly causes this effect due to the relative impermeability of the cell membrane to the chloride anion. As hydrogen ions move into the cell due to accumulation of ammonium chloride or hydrogen chloride, electrical neutrality is maintained by potassium exit.
In contrast, organic acidosis (due to lactic, beta-hydroxybutyric, or methylmalonic acid) tends not to cause a potassium shift, since most organic anions readily cross the cell membrane along with hydrogen. Lactic acidosis is often associated with potassium shift, but this effect is due to loss of cell integrity as a result of cell ischemia. The hyperkalemia typically present on admission in patients with diabetic ketoacidosis is the result of insulin deficiency and hypertonicity and not the underlying organic acidosis.10
Hypertonic states can cause hyperkalemia due to cell shift. For example, hyperglycemia, as in diabetic ketoacidosis, pulls water from the intracellular into the extracellular compartment, thereby concentrating intracellular potassium and creating a more favorable gradient for potassium efflux through membrane channels. This same effect can occur in neurosurgical patients given large amounts of hypertonic mannitol. Repetitive doses of immunoglobulin can lead to extracellular accumulation of sorbitol, maltose, or sucrose, since these sugars are added to the preparations to prevent immunoglobulin aggregation.11
Is a disturbance in renal potassium excretion present?
Sustained hyperkalemia is more commonly associated with decreases in renal potassium excretion than with a cellular shift. In most instances the clinician can distinguish between cell shift and impaired renal excretion based on the available clinical data.
The transtubular potassium gradient has been used to determine whether there is a disturbance in renal potassium excretion and to assess renal potassium handling.12
This calculation is based on the assumption that only water is reabsorbed past the cortical collecting duct, and not solutes. It has fallen out of favor since we have found this assumption to be incorrect; a large amount of urea is reabsorbed daily in the downstream medullary collecting duct as a result of intrarenal recycling of urea.
The one situation in which the transtubular potassium gradient may be of use is determining whether hyperkalemia is a result of low aldosterone levels as opposed to aldosterone resistance. One can compare the transtubular potassium gradient before and after a physiologic dose (0.05 mg) of 9-alpha fludrocortisone. An increase of more than 6 over a 4-hour period favors aldosterone deficiency, whereas smaller changes would indicate aldosterone resistance.
24-hour potassium excretion, spot urine potassium-creatinine ratio. A better way to assess renal potassium handling is to measure the amount of potassium in a 24-hour urine collection or determine a spot urine potassium-creatinine ratio. A 24-hour urinary potassium excretion of less than 15 mmol or a potassium-creatinine ratio less than 1 suggests an extrarenal cause of hypokalemia. A ratio greater than 20 would be an appropriate renal response to hyperkalemia.
One or more of 3 abnormalities should be considered in the hyperkalemic patient with impaired renal excretion of potassium:
- Decreased distal delivery of sodium
- Mineralocorticoid deficiency
- Abnormal cortical collecting tubule function.13
Decreased distal delivery of sodium
Under normal circumstances, potassium is freely filtered across the glomerulus and then mostly reabsorbed in the proximal tubule and thick ascending limb. Potassium secretion begins in the distal convoluted tubule and increases in magnitude into the collecting duct. Tubular secretion is the component of potassium handling that varies and is regulated according to physiologic needs.
In acute kidney injury, the rapid decline in glomerular filtration rate and reduction in functioning nephron mass lead to decreased distal potassium secretion.
Hyperkalemia is a frequent problem when oliguria is present, since the reduction in distal delivery of sodium and water further impairs potassium secretion. Patients with oliguric acute kidney injury are more likely to have a more severe underlying disease state, and therefore tissue breakdown and catabolism further increase the risk of hyperkalemia.
In contrast, in nonoliguric patients, the renal injury tends to be less severe, and enough sodium and water are usually delivered distally to prevent hyperkalemia.
In chronic kidney disease, nephron dropout and reduction in collecting tubule mass also lead to a global decline in distal potassium secretion. However, this is countered by an increased capacity of the remaining individual nephrons for potassium secretion. High flow, increased distal sodium delivery, and increased activity and number of sodium-potassium ATPase pumps in the remaining nephrons account for this increased secretory capacity.14 As renal function declines over time, colonic potassium secretion progressively increases.15
These adaptive changes help to keep the plasma potassium concentration within the normal range until the glomerular filtration rate falls to less than 10 or 15 mL/min. Development of hyperkalemia with more modest reductions in the glomerular filtration rate suggest decreased mineralocorticoid activity or a specific lesion of the tubule.
Mineralocorticoid deficiency
Aldosterone deficiency can occur alone or in combination with decreased cortisol levels. Destruction of the adrenal glands is suggested when both hormones are reduced. Enzyme defects in cortisol metabolism can result in either isolated deficiency of aldosterone or adrenogenital syndromes associated with decreased mineralocorticoid activity.
Heparin administration leads to a reversible defect in adrenal synthesis of aldosterone. Drugs that block the stimulatory effect of angiotensin II on the zona glomerulosa cells of the adrenal gland will lower aldosterone.
Renin-angiotensin-aldosterone system blockers. Angiotensin-converting enzyme inhibitors block the formation of angiotensin II, whereas angiotensin II receptor blockers prevent angiotensin II from binding to its adrenal receptor. The direct renin inhibitor aliskiren lowers angiotensin II levels by blocking the enzymatic activity of renin and lowers the circulating levels of both angiotensin I and II.16
The syndrome of hyporeninemic hypoaldosteronism is a common cause of hyperkalemia in patients who have a glomerular filtration rate between 40 and 60 mL/min. Diabetic nephropathy and interstitial renal disease are the most common clinical entities associated with this syndrome.10 Other causes include analgesic nephropathy, urinary tract obstruction, sickle cell disease, systemic lupus erythematosus, and amyloidosis.
Nonsteroidal anti-inflammatory drugs can cause hyperkalemia by suppressing renin release and reducing delivery of sodium to the distal nephron.18
Calcineurin inhibitors impair potassium secretion by suppressing renin release and by direct tubular effects.19
Beta-blockers. Beta-1 and to a lesser extent beta-2 receptor blockade can also result in a hyporeninemic state.
Distal tubular defect
Hyperkalemia can result from interstitial renal diseases that specifically affect the distal nephron. In this setting, the glomerular filtration rate is only mildly reduced, and circulating aldosterone levels are normal.
Renal transplant, lupus erythematosus, amyloidosis, urinary obstruction, and sickle cell disease are conditions in which an impairment in renin release may coexist with a defect in tubular secretion.
Potassium-sparing diuretics impair the ability of the cortical collecting tubule to secrete potassium. Specifically, amiloride and triamterene inhibit sodium reabsorption mediated by the epithelial sodium channel located on the apical membrane of the principal cell. This effect abolishes the lumen’s negative potential and thereby removes a driving force for potassium secretion.
Trimethoprim and pentamidine cause similar effects.
Spironolactone and eplerenone compete with aldosterone at the level of the mineralocorticoid receptor and can result in hyperkalemia.
Drospirenone, a non-testosterone-derived progestin contained in certain oral contraceptives, possesses mineralocorticoid-blocking effects similar to those of spironolactone.
The plasma potassium level should be monitored when these drugs are prescribed in patients receiving potassium supplements, renin-angiotensin-aldosterone system blockers, or nonsteroidal anti-inflammatory drugs.20
CLINICAL FEATURES OF HYPERKALEMIA
Neuromuscular manifestations of hyperkalemia include paresthesias and fasciculations in the arms and legs. Severe elevation in potassium can give rise to an ascending paralysis with eventual flaccid quadriplegia. Typically, the trunk, head, and respiratory muscles are spared, and respiratory failure is rare.
Cardiac signs
Hyperkalemia has depolarizing effects on the heart that are manifested by changes in the electrocardiogram (Figure 2). The progressive changes of hyperkalemia are classically listed as:
- Peaked T waves that are tall, narrow, and symmetrical and can occasionally be confused with the hyperacute T-wave change associated with an ST-segment elevation myocardial infarction.21 However, in the latter condition, the T waves tend to be more broad-based and asymmetric in shape.
- ST-segment depression
- Widening of the PR interval
- Widening of the QRS interval
- Loss of the P wave
- A sine-wave pattern—an ominous development and a harbinger of impending ventricular fibrillation and asystole.
The plasma potassium concentration often correlates poorly with cardiac manifestations. In a retrospective review, only 16 of 90 cases met strict criteria for electrocardiographic changes reflective of hyperkalemia (defined as new peaked and symmetric T waves that resolved on follow-up).22 In 13 of these cases, the electrocardiogram was interpreted as showing no T-wave changes even when read by a cardiologist. In addition, electrocardiographic criteria for hyperkalemia were noted in only 1 of 14 patients who manifested arrhythmias or cardiac arrest attributed to increased plasma potassium concentration.
TREATMENT OF ACUTE HYPERKALEMIA
The treatment of hyperkalemia depends on the magnitude of increase in the plasma potassium concentration and the presence or absence of electrocardiographic changes or neuromuscular symptoms.23 Acute treatment is indicated for marked electrocardiographic changes and severe muscle weakness.
Intravenous calcium rapidly normalizes membrane excitability by antagonizing the potassium-induced decrease in membrane excitability but does not alter the plasma potassium concentration.
Insulin lowers the plasma potassium concentration by promoting its entry into cells. To avoid hypoglycemia, 10 units of short-acting insulin should be accompanied by a 50-g infusion of glucose, increased to 60 g if 20 units of insulin are given.24
Beta-2 receptor agonists produce a similar effect. The shift of potassium into cells with insulin and beta-2-adrenergic receptor stimulation is brought about by increases in sodium-potassium ATPase pump activity, primarily in skeletal muscle cells.
Sodium bicarbonate, in the absence of acidosis, lowers the plasma potassium concentration only slightly. It should be reserved for hyperkalemic patients who have coexisting metabolic acidosis after the patient has received insulin and glucose, an adrenergic agent, and calcium.
These acute treatments need to be followed by therapies designed to lower the total body potassium content such as diuretics, potassium-binding drugs, and dialysis.
TREATMENT OF CHRONIC HYPERKALEMIA
Review medications. Once the diagnosis of hyperkalemia has been made, the initial approach should be to review the patient’s medications and make every effort to discontinue drugs that can impair renal potassium excretion.16 Patients should be asked about their use of over-the-counter nonsteroidal anti-inflammatory drugs and herbal remedies, since herbs may be a hidden source of dietary potassium.
Dietary counseling. Patients should be instructed to reduce their dietary intake of potassium and to avoid salt substitutes that contain potassium.
Diuretic therapy is beneficial in minimizing hyperkalemia in patients with chronic kidney disease. Thiazide and loop diuretics enhance renal potassium excretion by increasing flow and delivery of sodium to the collecting duct. Thiazide diuretics are effective when the estimated glomerular filtration rate is greater than 30 mL/min, while loop diuretics should be used in patients with more severe renal insufficiency (Table 2).
Sodium bicarbonate is an effective agent to minimize increases in the plasma potassium concentration in patients with chronic kidney disease and metabolic acidosis. This drug increases renal potassium excretion by increasing distal sodium delivery and shifts potassium into cells as the acidosis is corrected. The likelihood of developing volume overload as a complication of sodium bicarbonate administration can be minimized with effective diuretic therapy.
Avoiding hyperkalemia if renin-angiotensin-aldosterone system blockers are needed
Renin-angiotensin-aldosterone system blockers can be problematic, as these drugs cause hyperkalemia, often in the very patients who derive the greatest cardiovascular benefit from them.16 A number of steps can reduce the risk of hyperkalemia and allow these drugs to be used.
The initial dose should be low and the plasma potassium should be measured within 1 to 2 weeks after drug initiation. If the potassium level is normal, the dose can be titrated upwards with remeasurement of the plasma potassium after each dose titration. If the plasma potassium concentration rises to 5.5 mmol/L, in some cases lowering the dose will reduce the potassium concentration and allow the patient to remain on the drug.
In patients at risk of hyperkalemia, angiotensin II receptor blockers and direct renin inhibitors should be used with the same caution as angiotensin-converting enzyme inhibitors.
If the plasma potassium concentration exceeds 5.5 mmol/L despite the above precautions, one can consider using a potassium-binding drug (see below) before deciding to avoid renin-angiotensin-aldosterone system blockers.
Sodium polystyrene sulfonate binds potassium in the gastrointestinal tract in exchange for sodium and has been used to manage hyperkalemia. This drug is most commonly given along with sorbitol as a therapy for acute hyperkalemia. Although the drug is widely used, most of the potassium-lowering effect is due to an increase in stool volume caused by sorbitol.25,26 In addition, long-term use is poorly tolerated, and the drug has been linked to gastrointestinal toxicity in rare cases.
Patiromer and sodium zirconium cyclosilicate are two new potassium-binding drugs that have been shown to be effective in reducing plasma potassium concentration in the setting of ongoing use of renin-angiotensin-aldosterone system blockers.
Patiromer is a nonabsorbed polymer approved for clinical use to treat hyperkalemia. The drug binds potassium in exchange for calcium in the gastrointestinal tract, predominantly in the colon, and lowers the plasma potassium concentration in a dose-dependent manner, with the greatest reduction in those with higher starting values.27,28
Patiromer effectively controlled plasma potassium concentrations in a 1-year randomized trial in high-risk patients on renin-angiotensin-aldosterone system blockers.29 The main adverse events in clinical trials have been constipation and hypomagnesemia, which required magnesium replacement in a small number of patients, but overall, the drug is well tolerated.
Sodium zirconium cyclosilicate is a nonabsorbed microporous compound that binds potassium in exchange for sodium throughout the gastrointestinal tract. It has been found effective in lowering plasma potassium concentration in a dose-dependent fashion in high-risk patients, most of whom were receiving renin-angiotensin-aldosterone system blockers.30–32 Adverse events were generally comparable to those with placebo in clinical trials; however, edema occurred more frequently when higher doses were used. This drug is not yet approved for clinical use.
- Palmer BF, Clegg DJ. Physiology and pathophysiology of potassium homeostasis. Adv Physiol Educ 2016; 40:480–490.
- Palmer BF. Regulation of potassium homeostasis. Clin J Am Soc Nephrol 2015; 10:1050–1060.
- Eaton SB, Konner M. Paleolithic nutrition. A consideration of its nature and current implications. N Engl J Med 1985; 312:283–289.
- Sebastian A, Frassetto LA, Sellmeyer DE, Morris RC Jr. The evolution-informed optimal dietary potassium intake of human beings greatly exceeds current and recommended intakes. Semin Nephrol 2006; 26:447–453.
- Palmer BF, Clegg DJ. Achieving the benefits of a high potassium, Paleolithic diet, without the toxicity. Mayo Clin Proc 2016; 91:496–508.
- Liamis G, Liberopoulos E, Barkas F, Elisaf M. Spurious electrolyte disorders: a diagnostic challenge for clinicians. Am J Nephrol 2013; 38:50–57.
- Mansoor S, Holtzman N, Emadi A. Reverse pseudohyperkalemia: an important clinical entity in chronic lymphocytic leukemia. Case Rep Hematol 2015; 2015:930379.
- Gelfand M, Zarate A, Knepshield J. Geophagia. A cause of life-threatening hyperkalemia in patients with chronic renal failure. JAMA 1975; 234:738–740.
- Abu-Hamdan D, Sondheimer J, Mahajan S. Cautopyreiophagia. Cause of life-threatening hyperkalemia in a patient undergoing hemodialysis. Am J Med 1985; 79:517–519.
- Palmer BF, Clegg DJ. Electrolyte and acid-base disturbances in patients with diabetes mellitus. N Engl J Med 2015; 373:548–559.
- Daphnis E, Stylianou K, Alexandrakis M, et al. Acute renal failure, translocational hyponatremia and hyperkalemia following intravenous immunoglobulin therapy. Nephron Clin Pract 2007; 106:c143–c148.
- Choi M, Ziyadeh F. The utility of the transtubular potassium gradient in the evaluation of hyperkalemia. J Am Soc Nephrol 2008; 19:424–426.
- Palmer BF. A physiologic-based approach to the evaluation of a patient with hyperkalemia. Am J Kidney Dis 2010; 56:387–393.
- Stanton BA. Renal potassium transport: morphological and functional adaptations. Am J Physiol 1989; 257:R989–R997.
- Hayes CP Jr, McLeod ME, Robinson RR. An extravenal mechanism for the maintenance of potassium balance in severe chronic renal failure. Trans Assoc Am Physicians 1967; 80:207–216.
- Palmer BF. Managing hyperkalemia caused by inhibitors of the renin-angiotensin-aldosterone system. N Engl J Med 2004; 351:585–592.
- Palmer BF. Renal dysfunction complicating treatment of hypertension. N Engl J Med 2002; 347:1256–1261.
- Palmer BF. Renal complications associated with use of nonsteroidal anti-inflammatory agents. J Investig Med 1995; 43:516–533.
- Hoorn E, Walsh S, McCormick J, et al. The calcineurin inhibitor tacrolimus activates the renal sodium chloride cotransporter to cause hypertension. Nat Med 2011; 17:1304–1309.
- Bird ST, Pepe SR, Etminan M, Liu X, Brophy JM, Delaney JA. The association between drospirenone and hyperkalemia: a comparative-safety study. BMC Clin Pharmacol 2011; 11:23.
- Wang K. Images in clinical medicine. “Pseudoinfarction” pattern due to hyperkalemia. N Engl J Med 2004; 351:593.
- Montague BT, Ouellette JR, Buller GK. Retrospective review of the frequency of ECG changes in hyperkalemia. Clin J Am Soc Nephrol 2008; 3:324–330.
- Weisberg LS. Management of severe hyperkalemia. Crit Care Med 2008; 36:3246–3251.
- Harel Z, Kamel KS. Optimal dose and method of administration of intravenous insulin in the management of emergency hyperkalemia: a systematic review. PLoS One 2016; 11:e0154963.
- Sterns RH, Rojas M, Bernstein P, Chennupati S. Ion-exchange resins for the treatment of hyperkalemia: are they safe and effective? J Am Soc Nephrol 2010; 21:733–735.
- Emmett M, Hootkins RE, Fine KD, Santa Ana CA, Porter JL, Fordtran JS. Effect of three laxatives and a cation exchange resin on fecal sodium and potassium excretion. Gastroenterology 1995; 108:752–760.
- Bushinsky DA, Spiegel DM, Gross C, et al. Effect of patiromer on urinary ion excretion in healthy adults. Clin J Am Soc Nephrol 2016; 11:1769–1776.
- Weir MR, Bakris GL, Bushinsky DA, et al; OPAL-HK Investigators. Patiromer in patients with kidney disease and hyperkalemia receiving RAAS inhibitors. N Engl J Med 2015; 372:211–221.
- Bakris GL, Pitt B, Weir MR, et al; AMETHYST-DN Investigators. Effect of patiromer on serum potassium level in patients with hyperkalemia and diabetic kidney disease: the AMETHYST-DN randomized clinical trial. JAMA 2015; 314:151–161.
- Kosiborod M, Rasmussen HS, Lavin P, et al. Effect of sodium zirconium cyclosilicate on potassium lowering for 28 days among outpatients with hyperkalemia. The HARMONIZE randomized clinical trial. JAMA 2014; 312:2223–2233.
- Packham DK, Rasmussen HS, Lavin PT, et al. Sodium zirconium cyclosilicate in hyperkalemia. N Engl J Med 2015; 372:222–231.
- Anker SD, Kosiborod M, Zannad F, et al. Maintenance of serum potassium with sodium zirconium cyclosilicate (ZS-9) in heart failure patients: results from a phase 3 randomized, double-blind, placebo-controlled trial. Eur J Heart Fail 2015; 17:1050–1056.
KEY POINTS
- Exclude pseudohyperkalemia in patients who have a normal electrocardiogram and no risk factors for the development of hyperkalemia.
- Decreased distal delivery of sodium, reduced mineralocorticoid levels or activity, and a distal tubular defect are causes of impaired renal potassium secretion.
- Medical conditions and medications that alter the renin-angiotensin-aldosterone system can give rise to hyperkalemia.
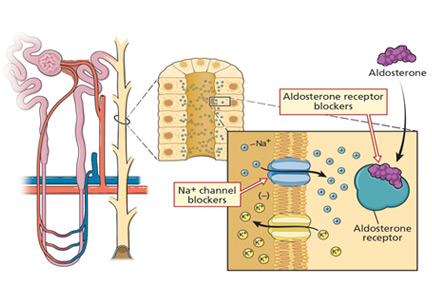
Diagnostic value of the physical examination in patients with dyspnea
Laennec’s stethoscope has survived more than 200 years, much longer than some of his contemporaries predicted. But will it survive the challenge of bedside ultrasonography and other technologic advances?
The physical examination, with its roots extending at least as far back as Hippocrates, may be at a crossroads as the mainstay of diagnosis. Physical signs can be subjective and lack sensitivity and specificity. Modern imaging and laboratory studies may already be more trusted.
If the physical examination is to survive, it must be accurate, reproducible, and efficient. Needed is a simple, evidence-based approach to the physical examination that enhances its diagnostic accuracy while maintaining bedside efficiency.
Here, we analyze the accuracy of the physical signs that are most effective in the clinical diagnosis of 4 common cardiopulmonary conditions that often present with dyspnea: pneumonia, pleural effusion, chronic obstructive pulmonary disease (COPD), and congestive heart failure.
LIKELIHOOD RATIOS
To grasp the significance of physical findings, it is necessary to understand the concept of likelihood ratios, which are widely accepted measures of the accuracy of a test or clinical finding.1,2 The positive likelihood ratio is the probability of a disease being present when the test is positive or the clinical finding is present, while the negative likelihood ratio is the probability that the disease is present when the test is negative or the clinical finding is absent. They are calculated as follows1:
Positive likelihood ratio = sensitivity / (1 – specificity)
Negative likelihood ratio = (1 – sensitivity) / specificity

Table 1 shows how the likelihood ratio of a test changes the posttest probability that a condition is present or absent, according to an analysis by McGee.2
STANDARDIZED TERMINOLOGY

PNEUMONIA
Pneumonia is a common disease, with more than 2 million cases annually in the United States. It is most often diagnosed by standard chest radiography, although computed tomography can identify it earlier and with higher sensitivity and specificity.5 The amount of published data on physical examination findings in pneumonia is surprisingly small.
Asymmetry in chest expansion: Specific, reproducible, but not sensitive
The physical finding with the highest positive likelihood ratio for diagnosing pneumonia is asymmetry in chest expansion.6,7

In a 1984 study of 1,819 patients presenting to an emergency department with acute cough, Diehr et al6 evaluated several physical signs of pneumonia. Asymmetric chest expansion had a specificity and positive predictive value of 100%, but its sensitivity was only 4.3%. Thus, it is not a good screening test, but it is a good diagnostic or confirmatory test. From these numbers, Metlay et al8 calculated that the positive likelihood ratio was infinity and the negative likelihood ratio was 0.96.
McGee,7 on the other hand, calculated the positive likelihood ratio of asymmetric chest expansion at 44.1. McGee also found chest expansion to be a highly reproducible finding, with an interobserver agreement kappa score of 0.85.7 (A kappa score of 1.0 would indicate perfect interobserver agreement.) Interestingly, chest radiographs interpreted for pulmonary infiltrates have an interobserver kappa score of only 0.38.7 Further studies of this physical sign could shed more light upon this area of uncertainty.
Other signs of pneumonia
None of the other physical signs studied for the diagnosis of pneumonia has as high a positive likelihood ratio as asymmetric chest expansion.6–12
Egophony is a high-pitched or nasal quality of the patient’s voice heard on auscultation over lung tissue that is consolidated or fibrosed, due to enhanced transmission of high-frequency sound across fluid. It is often described as the “E-to-A change.” Although listening for egophony is widely done and easy to do, we calculate that this sign has a positive likelihood ratio of only 6.8 based on pooled data from 3 trials with a total of 3,245 patients.6,10,11
Faring less favorably, in descending order of diagnostic accuracy, are:
Percussion dullness (positive likelihood ratio 5.7 based on 4 studies with 3,653 patients)6,10–12
Bronchophony or bronchial breath sounds (positive likelihood ratio 3.3 based on 1,118 patients)10
Crackles have long been taught as a common physical finding in pneumonia. Bohadana et al pointed out that “crackle” can be defined acoustically but does not suggest any means or site of generation.4 Pooled data from 4 studies in 3,647 patients6,10–12 result in a positive likelihood ratio for crackles in the diagnosis of pneumonia of only 3.2.
Diminished breath sounds (positive likelihood ratio 2.5 based on 3 studies with 1,828 patients).10–12
Consider pneumonia signs in combination
These physical examination maneuvers are time-honored and part of the rite of training for medical students and residents. As we have shown, they are not extremely helpful as individual tests in diagnosing pneumonia; however, they may be useful when used in combination as a clinical prediction rule or diagnostic algorithm. These rules often have higher diagnostic accuracy but drawbacks of taking more time and not being easily reproducible.

PLEURAL EFFUSION
Pleural effusion commonly occurs in patients with congestive heart failure, pneumonia, and malignancies. The following are signs of effusion.
Dullness to percussion had a positive likelihood ratio of 5.7 from pooled data from 3 studies analyzed by Wong et al.13
Asymmetric chest expansion, in a study by Kalantri et al,14 had a positive likelihood ratio of 8.1 and a negative likelihood ratio of 0.29, the latter making it a reasonably good test to help rule out a pleural effusion.
Negative signs. Since a pleural effusion is an abnormal fluid collection in the pleural space and not the lung parenchyma, one would not expect it to cause loud breath sounds, adventitious sounds, or vocal resonance. Since these 3 findings emanate from the lung, their absence would be expected to support the presence of a pleural effusion.
Tactile fremitus, also known as vocal fremitus, is the vibration felt on the chest wall while the patient is speaking. Traditionally, the patient says “ninety-nine” as the examiner feels for asymmetry in vibration. A consolidation such as pneumonia increases the vibration, while fluid in a pleural effusion diminishes it.

DIAGNOSTIC ALGORITHM FOR PNEUMONIA OR PLEURAL EFFUSION
Patients presenting with cough or dyspnea will most likely be evaluated for pneumonia and pleural effusion, among other diagnoses. We propose the following physical examination strategy in this setting.
First, evaluate the patient for asymmetric chest expansion. The positive likelihood ratio for this sign is excellent for pneumonia (44.1) and moderate for pleural effusion (8.1); therefore, both conditions are possible with a positive test.
Second, percuss the chest. Dullness to percussion has a low positive likelihood ratio for pneumonia but a moderate one for pleural effusion.13 The absence of this sign is only modest in excluding a pleural effusion (negative likelihood ratio 0.31 in pooled data analyzed by Wong et al).13
Third, auscultate the chest to elicit normal, diminished, or adventitious breath sounds. Diminished breath sounds may be noted in both conditions, but vocal resonance (egophony or bronchophony) and tactile fremitus should not be present directly over a pleural effusion. Either vocal resonance or tactile fremitus in a patient with asymmetric chest expansion would strongly support the diagnosis of pneumonia.

Figure 2 summarizes our proposed diagnostic algorithm for pneumonia and pleural effusion.
CHRONIC OBSTRUCTIVE PULMONARY DISEASE
COPD imposes a heavy burden on public health worldwide in terms of cost and mortality. It is the third leading cause of death in the United States, after heart disease and cancer.15
Spirometry remains the gold standard for diagnosis. The Global Initiative for Chronic Obstructive Lung Disease standard for diagnosing COPD was the better of 2 spirometry test results, showing a forced expiratory volume in 1 second (FEV1) and FEV1/forced vital capacity ratio less than 70%.16
Unfortunately, there is little evidence that physical signs aid in the early diagnosis of COPD, as physical signs of airflow limitation may not manifest until lung function is substantially impaired.17,18
Early inspiratory crackles had a positive likelihood ratio of 14.6 based on 2 small studies.19,20
Percussion dullness over the left sternal border in the fifth intercostal space should be present in the normal situation and is known as cardiac dullness. Absent cardiac dullness had a positive likelihood ratio of 16 and a negative likelihood ratio of 0.8 for diagnosing COPD in a study in 92 patients with a history of smoking or self-reported COPD.21 The kappa score was 0.49, signifying moderate interobserver agreement.
A combined strategy using the history and physical examination may have the highest diagnostic accuracy. Many of these combinations are too cumbersome for practical clinical use. However, 1 of them is based on only 3 questions21:
- Has the patient smoked for more than 70-pack years?
- Has the patient been previously diagnosed with chronic bronchitis or emphysema?
- Are breath sounds diminished in intensity?
Answering yes to 2 of these questions gives a positive likelihood ratio of a diagnosis of COPD of 33.5.
Early detection of COPD may improve outcomes and lower healthcare costs and thus would be clinically useful. Unfortunately, a diagnostic approach using the history and physical in the early diagnosis of COPD remains uncertain at this time.
CONGESTIVE HEART FAILURE
The clinical presentation of acute congestive heart failure has much in common with pneumonia, pleural effusion, and COPD.
Echocardiography, the gold standard for diagnosis, is costly and may not be immediately available for most patients evaluated for cardiorespiratory complaints. The American College of Cardiology reports the cost of standard echocardiography to be between $1,000 and $2,000.22 A physical examination approach in the assessment of dyspnea can be very useful.
Height of jugular venous distention approximates central venous pressure
Assessing the central venous pressure by estimating the vertical height of distention of the right internal or external jugular vein is validated and easily reproducible.23,24 The use of the external jugular vein is supported by correlation with catheter-measured central venous pressure in critically ill patients.25,26 The central venous pressure reflects the right atrial pressure, and in the absence of tricuspid stenosis, the right ventricular end-diastolic pressure. An elevation in central venous pressure can be seen in patients with congestive heart failure, pulmonary hypertension, and pulmonary valve stenosis.
The right side is preferred due to its anatomically direct route to the heart. In contrast, the left internal jugular vein crosses the mediastinum and can be compressed by the aorta, causing a false elevation.

In summary, an elevated jugular venous pressure on examination is a good test to rule in an elevated central venous pressure, and its absence is a good sign in ruling out an elevated central venous pressure. When using jugular venous pressure specifically for the diagnosis of congestive heart failure with reduced ejection fraction (ie, ejection fraction < 50%), the positive likelihood ratio is 6.3 based on 3 studies.25–27
Heart failure with preserved ejection fraction has not been well studied for physical examination. The Irbesartan in Heart Failure with Preserved Ejection Fraction Trial (I-Preserve)28 looked only at the sensitivity of elevated jugular venous pressure in 4,128 patients, which was 8%. Specificity was not reported.
The abdominojugular reflux
Another way to gauge the jugular venous pressure is to examine the neck veins while firmly pressing on the mid-abdomen for 10 to 15 seconds to look for the abdominojugular reflux, also known as the hepatojugular reflux. An increase in the jugular venous pressure of 3 cm from baseline constitutes a positive abdominojugular reflux. It has a positive likelihood ratio of 8.0 and a negative likelihood ratio of 0.3 for the diagnosis of congestive heart failure by the assessment of end-diastolic pressure of the left ventricle (Table 5).29–31
The abdominojugular reflux is a much more reliable test than examination of neck veins for jugular venous pressure. The interobserver agreement for examining neck veins has a wide range of kappa scores (0.08–0.81), whereas the abdominojugular reflux has a very high kappa score of 0.92.7 Interestingly, chest radiography showing interstitial edema has a kappa of 0.83.7
Displaced apical impulse
An evaluation of the apical impulse of the heart is also a very good and quick test in the examination of patients suspected of having congestive heart failure. An abnormal finding is defined by an apical impulse displaced laterally (to the left of the midclavicular line).
Using data from several studies,32–35 a displaced apical impulse has a positive likelihood ratio of 10.3. The absence of this finding, however, is not very good for ruling out congestive heart failure, with a negative likelihood ratio of 0.7. Interobserver agreement is moderate to excellent (kappa score 0.43–0.86).7
A third heart sound
Auscultation to assess the third heart sound is much more difficult. A systematic review found that likelihood ratios vary widely and confidence intervals are wide.36 Interobserver agreement also varies widely (kappa scores –0.17 to 0.84).7 In a primary care study,37 a third heart sound had a very low sensitivity (4.3%) but a specificity of 99.8%.
Therefore, we are uncertain about a conclusion for this physical finding based on the concern for wide ranges in likelihood ratio and poor interobserver reliability.
PHYSICAL EXAMINATION STILL HAS A FUTURE
The physical examination has a long and distinguished place in the history of medicine. Technologic advances have changed the manner in which clinicians practice the art of healing. Modern technology in US healthcare has become a double-edged sword, with many benefits as well as detriments.3 Reproducibility and accuracy are paramount for the physical examination to remain a core component of medical diagnosis. Advances in the diagnostic accuracy of laboratory and imaging studies challenge the importance of the physical examination. However, we firmly believe that the traditional techniques have stood the test of time and have a future in the clinical practice of medicine.
Acknowledgments: The authors thank Ruby Marr, MD, Mohammed Nabhan, MD, Rajiv Doddamani, MD, and Sohaib Galani, MD, for their important contributions to this article, which included research assistance and editorial advice.
- Lang TA, Secic M. Chapter 10. Determining the presence or absence of disease. Reporting the characteristics of diagnostic tests. In: Lang TC, Secic M. How to Report Statistics in Medicine. Annotated Guidelines for Authors, Editors, and Reviewers. Philadelphia, PA, American College of Physicians, 1997:147–169.
- McGee S. Simplifying likelihood ratios. J Gen Intern Med 2002; 17:647–650.
- Mikami R, Murao M, Cugell DW, et al. International symposium on lung sounds. Synopsis of proceedings. Chest 1987; 92:342–345.
- Bohadana A, Izbicki G, Kraman SS. Fundamentals of lung auscultation. N Engl J Med 2014; 370:744–751.
- Heussel CP, Kauczor HU, Ullmann AJ. Pneumonia in neutropenic patients. Eur Radiol 2004; 14:256–271.
- Diehr P, Wood RW, Bushyhead J, Krueger L, Wolcott B, Tompkins RK. Prediction of pneumonia in outpatients with acute cough—a statistical approach. J Chronic Dis 1984; 37:215–225.
- McGee S. Evidence-Based Physical Diagnosis. 4th ed. Philadelphia, PA: Elsevier; 2017.
- Metlay JP, Kapoor WN, Fine MJ. Does this patient have community-acquired pneumonia? Diagnosing pneumonia by history and physical examination. JAMA 1997; 278:1440–1445.
- Melbye H, Straume B, Aasebo U, Brox J. The diagnosis of adult pneumonia in general practice. The diagnostic value of history, physical examination and some blood tests. Scand J Prim Health Care 1988; 6:111–117.
- Heckerling PS, Tape TG, Wigton RS, et al. Clinical prediction rule for pulmonary infiltrates. Ann Intern Med 1990; 113:664–670.
- Gennis P, Gallagher J, Falvo C, Baker S, Than W. Clinical criteria for the detection of pneumonia in adults: guidelines for ordering chest roentgenograms in the emergency department. J Emerg Med 1989; 7:263–268.
- Melbye H, Straume B, Aasebo U, Dale K. Diagnosis of pneumonia in adults in general practice. Relative importance of typical symptoms and abnormal chest signs evaluated against a radiographic reference standard. Scand J Prim Health Care 1992; 10:226–233.
- Wong CL, Holroyd-Leduc J, Straus SE. Does this patient have a pleural effusion? JAMA 2009; 301:309–317.
- Kalantri S, Joshi R, Lokhande T, et al. Accuracy and reliability of physical signs in the diagnosis of pleural effusion. Respir Med 2007; 101:431–438.
- Heron M. Deaths: leading causes for 2014. National Vital Statistics Reports 2016; 65(5) June 30, 2016. www.cdc.gov/nchs/data/nvsr/nvsr65/nvsr65_05.pdf. Accessed October 20, 2017.
- Global Initiative for Chronic Obstructive Lung Disease. Pocket guide to COPD diagnosis, management, and prevention. http://goldcopd.org/wp-content/uploads/2016/12/wms-GOLD-2017-Pocket-Guide.pdf. Accessed November 13, 2017.
- Pauwels RA, Rabe KF. Burden and clinical features of chronic obstructive pulmonary disease (COPD). Lancet 2004; 364:613–620.
- Oshaug K, Halvorsen PA, Melbye H. Should chest examination be reinstated in the early diagnosis of chronic obstructive pulmonary disease? Int J Chron Obstruct Pulmon Dis 2013; 8:369–377.
- Bettencourt PE, Del Bono EA, Spiegelman D, Hertzmark E, Murphy RL Jr. Clinical utility of chest auscultation in common pulmonary diseases. Am J Respir Crit Care Med 1994; 150:1291–1297.
- Nath AR, Capel LH. Inspiratory crackles and mechanical events of breathing. Thorax 1974; 29:695–698.
- Badgett RG, Tanaka DJ, Hunt DK, et al. Can moderate chronic obstructive pulmonary disease be diagnosed by historical and physical findings alone? Am J Med 1993; 94:188–196.
- ABIM Foundation. Choosing wisely. Echocardiograms for heart valve disease. www.choosingwisely.org. Accessed November 13, 2017.
- Davison R, Cannon R. Estimation of central venous pressure by examination of jugular veins. Am Heart J 1974; 87:279–282.
- Ducas J, Magder S, McGregor M. Validity of the hepatojugular reflux as a clinical test for congestive heart failure. Am J Cardiol 1983; 52:1299–1303.
- Vinayak AG, Levitt J, Gehlbach B, Pohlman AS, Hall JB, Kress JP. Usefulness of the external jugular vein examination in detecting abnormal central venous pressure in critically ill patients. Arch Intern Med 2006; 166:2132–2137.
- Sankoff J, Zidulka A. Non-invasive method for the rapid assessment of central venous pressure: description and validation by a single examiner. West J Emerg Med 2008; 9:201–205.
- Davie AP, Francis CM, Caruana L, Sutherland GR, McMurray JJ. Assessing diagnosis in heart failure: which features are any use? QJM 1997; 90:335–339.
- Kristensen SL, Mogensen UM, Jhund PS, et al. Clinical and echocardiographic characeristics and cardiovascular outcomes according to diabetes status in patients with heart failure and preserved ejection fraction. A report from the Irbesartan in Heart Failure with Preserved Ejection Fraction Trial (I-Preserve). Circulation 2017; https://doi.org/10.1161/CIRCULATIONAHA.116.024593. Accessed November 1, 2017.
- Butman SM, Ewy GA, Standen JR, Kern KB, Hahn E. Bedside cardiovascular examination in patients with severe chronic heart failure: importance of rest or inducible jugular venous distension. J Am Coll Cardiol 1993; 22:968–974.
- Sochowski RA, Dubbin JD, Naqvi SZ. Clinical and hemodynamic assessment of the hepatojugular reflux. Am J Cardiol 1990; 66:1002–1006.
- Ewy GA. The abdominojugular test: technique and hemodynamic correlates. Ann Intern Med 1988; 109:456–460.
- Gadsboll N, Hoilund-Carlsen PF, Nielsen GG, et al. Symptoms and signs of heart failure in patients with myocardial infarction: reproducibility and relationship to chest X-ray, radionuclide ventriculography and right heart catheterization. Eur Heart J 1989; 10:1017–1028.
- Fahey T, Jeyaseelan S, McCowan C, et al. Diagnosis of left ventricular systolic dysfunction (LVSD): development and validation of a clinical prediction rule in primary care. Fam Pract 2007; 24:628–635.
- Gadsboll N, Hoilund-Carlsen PF, Nielsen GG, et al. Interobserver agreement and accuracy of bedside estimation of right and left ventricular ejection fraction in acute myocardial infarction. Am J Cardiol 1989; 63:1301–1307.
- Mattleman SJ, Hakki AH, Iskandrian AS, Segal BL, Kane SA. Reliability of bedside evaluation in determining left ventricular function: correlation with left ventricular ejection fraction determined by radionuclide ventriculography. J Am Coll Cardiol 1983; 1:417–420.
- Madhok V, Falk G, Rogers A, Struthers AD, Sullivan FM, Fahey T. The accuracy of symptoms, signs and diagnostic tests in the diagnosis of left ventricular dysfunction in primary care: a diagnostic accuracy systematic review. BMC Fam Pract 2008; 9:56.
- Kelder JC, Cramer MJ, van Wijngaarden J, et al. The diagnostic value of physical examination and additional testing in primary care patients with suspected heart failure. Circulation 2011; 124:2865–2873.
Laennec’s stethoscope has survived more than 200 years, much longer than some of his contemporaries predicted. But will it survive the challenge of bedside ultrasonography and other technologic advances?
The physical examination, with its roots extending at least as far back as Hippocrates, may be at a crossroads as the mainstay of diagnosis. Physical signs can be subjective and lack sensitivity and specificity. Modern imaging and laboratory studies may already be more trusted.
If the physical examination is to survive, it must be accurate, reproducible, and efficient. Needed is a simple, evidence-based approach to the physical examination that enhances its diagnostic accuracy while maintaining bedside efficiency.
Here, we analyze the accuracy of the physical signs that are most effective in the clinical diagnosis of 4 common cardiopulmonary conditions that often present with dyspnea: pneumonia, pleural effusion, chronic obstructive pulmonary disease (COPD), and congestive heart failure.
LIKELIHOOD RATIOS
To grasp the significance of physical findings, it is necessary to understand the concept of likelihood ratios, which are widely accepted measures of the accuracy of a test or clinical finding.1,2 The positive likelihood ratio is the probability of a disease being present when the test is positive or the clinical finding is present, while the negative likelihood ratio is the probability that the disease is present when the test is negative or the clinical finding is absent. They are calculated as follows1:
Positive likelihood ratio = sensitivity / (1 – specificity)
Negative likelihood ratio = (1 – sensitivity) / specificity
Table 1 shows how the likelihood ratio of a test changes the posttest probability that a condition is present or absent, according to an analysis by McGee.2
STANDARDIZED TERMINOLOGY
PNEUMONIA
Pneumonia is a common disease, with more than 2 million cases annually in the United States. It is most often diagnosed by standard chest radiography, although computed tomography can identify it earlier and with higher sensitivity and specificity.5 The amount of published data on physical examination findings in pneumonia is surprisingly small.
Asymmetry in chest expansion: Specific, reproducible, but not sensitive
The physical finding with the highest positive likelihood ratio for diagnosing pneumonia is asymmetry in chest expansion.6,7
In a 1984 study of 1,819 patients presenting to an emergency department with acute cough, Diehr et al6 evaluated several physical signs of pneumonia. Asymmetric chest expansion had a specificity and positive predictive value of 100%, but its sensitivity was only 4.3%. Thus, it is not a good screening test, but it is a good diagnostic or confirmatory test. From these numbers, Metlay et al8 calculated that the positive likelihood ratio was infinity and the negative likelihood ratio was 0.96.
McGee,7 on the other hand, calculated the positive likelihood ratio of asymmetric chest expansion at 44.1. McGee also found chest expansion to be a highly reproducible finding, with an interobserver agreement kappa score of 0.85.7 (A kappa score of 1.0 would indicate perfect interobserver agreement.) Interestingly, chest radiographs interpreted for pulmonary infiltrates have an interobserver kappa score of only 0.38.7 Further studies of this physical sign could shed more light upon this area of uncertainty.
Other signs of pneumonia
None of the other physical signs studied for the diagnosis of pneumonia has as high a positive likelihood ratio as asymmetric chest expansion.6–12
Egophony is a high-pitched or nasal quality of the patient’s voice heard on auscultation over lung tissue that is consolidated or fibrosed, due to enhanced transmission of high-frequency sound across fluid. It is often described as the “E-to-A change.” Although listening for egophony is widely done and easy to do, we calculate that this sign has a positive likelihood ratio of only 6.8 based on pooled data from 3 trials with a total of 3,245 patients.6,10,11
Faring less favorably, in descending order of diagnostic accuracy, are:
Percussion dullness (positive likelihood ratio 5.7 based on 4 studies with 3,653 patients)6,10–12
Bronchophony or bronchial breath sounds (positive likelihood ratio 3.3 based on 1,118 patients)10
Crackles have long been taught as a common physical finding in pneumonia. Bohadana et al pointed out that “crackle” can be defined acoustically but does not suggest any means or site of generation.4 Pooled data from 4 studies in 3,647 patients6,10–12 result in a positive likelihood ratio for crackles in the diagnosis of pneumonia of only 3.2.
Diminished breath sounds (positive likelihood ratio 2.5 based on 3 studies with 1,828 patients).10–12
Consider pneumonia signs in combination
These physical examination maneuvers are time-honored and part of the rite of training for medical students and residents. As we have shown, they are not extremely helpful as individual tests in diagnosing pneumonia; however, they may be useful when used in combination as a clinical prediction rule or diagnostic algorithm. These rules often have higher diagnostic accuracy but drawbacks of taking more time and not being easily reproducible.
PLEURAL EFFUSION
Pleural effusion commonly occurs in patients with congestive heart failure, pneumonia, and malignancies. The following are signs of effusion.
Dullness to percussion had a positive likelihood ratio of 5.7 from pooled data from 3 studies analyzed by Wong et al.13
Asymmetric chest expansion, in a study by Kalantri et al,14 had a positive likelihood ratio of 8.1 and a negative likelihood ratio of 0.29, the latter making it a reasonably good test to help rule out a pleural effusion.
Negative signs. Since a pleural effusion is an abnormal fluid collection in the pleural space and not the lung parenchyma, one would not expect it to cause loud breath sounds, adventitious sounds, or vocal resonance. Since these 3 findings emanate from the lung, their absence would be expected to support the presence of a pleural effusion.
Tactile fremitus, also known as vocal fremitus, is the vibration felt on the chest wall while the patient is speaking. Traditionally, the patient says “ninety-nine” as the examiner feels for asymmetry in vibration. A consolidation such as pneumonia increases the vibration, while fluid in a pleural effusion diminishes it.
DIAGNOSTIC ALGORITHM FOR PNEUMONIA OR PLEURAL EFFUSION
Patients presenting with cough or dyspnea will most likely be evaluated for pneumonia and pleural effusion, among other diagnoses. We propose the following physical examination strategy in this setting.
First, evaluate the patient for asymmetric chest expansion. The positive likelihood ratio for this sign is excellent for pneumonia (44.1) and moderate for pleural effusion (8.1); therefore, both conditions are possible with a positive test.
Second, percuss the chest. Dullness to percussion has a low positive likelihood ratio for pneumonia but a moderate one for pleural effusion.13 The absence of this sign is only modest in excluding a pleural effusion (negative likelihood ratio 0.31 in pooled data analyzed by Wong et al).13
Third, auscultate the chest to elicit normal, diminished, or adventitious breath sounds. Diminished breath sounds may be noted in both conditions, but vocal resonance (egophony or bronchophony) and tactile fremitus should not be present directly over a pleural effusion. Either vocal resonance or tactile fremitus in a patient with asymmetric chest expansion would strongly support the diagnosis of pneumonia.
Figure 2 summarizes our proposed diagnostic algorithm for pneumonia and pleural effusion.
CHRONIC OBSTRUCTIVE PULMONARY DISEASE
COPD imposes a heavy burden on public health worldwide in terms of cost and mortality. It is the third leading cause of death in the United States, after heart disease and cancer.15
Spirometry remains the gold standard for diagnosis. The Global Initiative for Chronic Obstructive Lung Disease standard for diagnosing COPD was the better of 2 spirometry test results, showing a forced expiratory volume in 1 second (FEV1) and FEV1/forced vital capacity ratio less than 70%.16
Unfortunately, there is little evidence that physical signs aid in the early diagnosis of COPD, as physical signs of airflow limitation may not manifest until lung function is substantially impaired.17,18
Early inspiratory crackles had a positive likelihood ratio of 14.6 based on 2 small studies.19,20
Percussion dullness over the left sternal border in the fifth intercostal space should be present in the normal situation and is known as cardiac dullness. Absent cardiac dullness had a positive likelihood ratio of 16 and a negative likelihood ratio of 0.8 for diagnosing COPD in a study in 92 patients with a history of smoking or self-reported COPD.21 The kappa score was 0.49, signifying moderate interobserver agreement.
A combined strategy using the history and physical examination may have the highest diagnostic accuracy. Many of these combinations are too cumbersome for practical clinical use. However, 1 of them is based on only 3 questions21:
- Has the patient smoked for more than 70-pack years?
- Has the patient been previously diagnosed with chronic bronchitis or emphysema?
- Are breath sounds diminished in intensity?
Answering yes to 2 of these questions gives a positive likelihood ratio of a diagnosis of COPD of 33.5.
Early detection of COPD may improve outcomes and lower healthcare costs and thus would be clinically useful. Unfortunately, a diagnostic approach using the history and physical in the early diagnosis of COPD remains uncertain at this time.
CONGESTIVE HEART FAILURE
The clinical presentation of acute congestive heart failure has much in common with pneumonia, pleural effusion, and COPD.
Echocardiography, the gold standard for diagnosis, is costly and may not be immediately available for most patients evaluated for cardiorespiratory complaints. The American College of Cardiology reports the cost of standard echocardiography to be between $1,000 and $2,000.22 A physical examination approach in the assessment of dyspnea can be very useful.
Height of jugular venous distention approximates central venous pressure
Assessing the central venous pressure by estimating the vertical height of distention of the right internal or external jugular vein is validated and easily reproducible.23,24 The use of the external jugular vein is supported by correlation with catheter-measured central venous pressure in critically ill patients.25,26 The central venous pressure reflects the right atrial pressure, and in the absence of tricuspid stenosis, the right ventricular end-diastolic pressure. An elevation in central venous pressure can be seen in patients with congestive heart failure, pulmonary hypertension, and pulmonary valve stenosis.
The right side is preferred due to its anatomically direct route to the heart. In contrast, the left internal jugular vein crosses the mediastinum and can be compressed by the aorta, causing a false elevation.
In summary, an elevated jugular venous pressure on examination is a good test to rule in an elevated central venous pressure, and its absence is a good sign in ruling out an elevated central venous pressure. When using jugular venous pressure specifically for the diagnosis of congestive heart failure with reduced ejection fraction (ie, ejection fraction < 50%), the positive likelihood ratio is 6.3 based on 3 studies.25–27
Heart failure with preserved ejection fraction has not been well studied for physical examination. The Irbesartan in Heart Failure with Preserved Ejection Fraction Trial (I-Preserve)28 looked only at the sensitivity of elevated jugular venous pressure in 4,128 patients, which was 8%. Specificity was not reported.
The abdominojugular reflux
Another way to gauge the jugular venous pressure is to examine the neck veins while firmly pressing on the mid-abdomen for 10 to 15 seconds to look for the abdominojugular reflux, also known as the hepatojugular reflux. An increase in the jugular venous pressure of 3 cm from baseline constitutes a positive abdominojugular reflux. It has a positive likelihood ratio of 8.0 and a negative likelihood ratio of 0.3 for the diagnosis of congestive heart failure by the assessment of end-diastolic pressure of the left ventricle (Table 5).29–31
The abdominojugular reflux is a much more reliable test than examination of neck veins for jugular venous pressure. The interobserver agreement for examining neck veins has a wide range of kappa scores (0.08–0.81), whereas the abdominojugular reflux has a very high kappa score of 0.92.7 Interestingly, chest radiography showing interstitial edema has a kappa of 0.83.7
Displaced apical impulse
An evaluation of the apical impulse of the heart is also a very good and quick test in the examination of patients suspected of having congestive heart failure. An abnormal finding is defined by an apical impulse displaced laterally (to the left of the midclavicular line).
Using data from several studies,32–35 a displaced apical impulse has a positive likelihood ratio of 10.3. The absence of this finding, however, is not very good for ruling out congestive heart failure, with a negative likelihood ratio of 0.7. Interobserver agreement is moderate to excellent (kappa score 0.43–0.86).7
A third heart sound
Auscultation to assess the third heart sound is much more difficult. A systematic review found that likelihood ratios vary widely and confidence intervals are wide.36 Interobserver agreement also varies widely (kappa scores –0.17 to 0.84).7 In a primary care study,37 a third heart sound had a very low sensitivity (4.3%) but a specificity of 99.8%.
Therefore, we are uncertain about a conclusion for this physical finding based on the concern for wide ranges in likelihood ratio and poor interobserver reliability.
PHYSICAL EXAMINATION STILL HAS A FUTURE
The physical examination has a long and distinguished place in the history of medicine. Technologic advances have changed the manner in which clinicians practice the art of healing. Modern technology in US healthcare has become a double-edged sword, with many benefits as well as detriments.3 Reproducibility and accuracy are paramount for the physical examination to remain a core component of medical diagnosis. Advances in the diagnostic accuracy of laboratory and imaging studies challenge the importance of the physical examination. However, we firmly believe that the traditional techniques have stood the test of time and have a future in the clinical practice of medicine.
Acknowledgments: The authors thank Ruby Marr, MD, Mohammed Nabhan, MD, Rajiv Doddamani, MD, and Sohaib Galani, MD, for their important contributions to this article, which included research assistance and editorial advice.
- Lang TA, Secic M. Chapter 10. Determining the presence or absence of disease. Reporting the characteristics of diagnostic tests. In: Lang TC, Secic M. How to Report Statistics in Medicine. Annotated Guidelines for Authors, Editors, and Reviewers. Philadelphia, PA, American College of Physicians, 1997:147–169.
- McGee S. Simplifying likelihood ratios. J Gen Intern Med 2002; 17:647–650.
- Mikami R, Murao M, Cugell DW, et al. International symposium on lung sounds. Synopsis of proceedings. Chest 1987; 92:342–345.
- Bohadana A, Izbicki G, Kraman SS. Fundamentals of lung auscultation. N Engl J Med 2014; 370:744–751.
- Heussel CP, Kauczor HU, Ullmann AJ. Pneumonia in neutropenic patients. Eur Radiol 2004; 14:256–271.
- Diehr P, Wood RW, Bushyhead J, Krueger L, Wolcott B, Tompkins RK. Prediction of pneumonia in outpatients with acute cough—a statistical approach. J Chronic Dis 1984; 37:215–225.
- McGee S. Evidence-Based Physical Diagnosis. 4th ed. Philadelphia, PA: Elsevier; 2017.
- Metlay JP, Kapoor WN, Fine MJ. Does this patient have community-acquired pneumonia? Diagnosing pneumonia by history and physical examination. JAMA 1997; 278:1440–1445.
- Melbye H, Straume B, Aasebo U, Brox J. The diagnosis of adult pneumonia in general practice. The diagnostic value of history, physical examination and some blood tests. Scand J Prim Health Care 1988; 6:111–117.
- Heckerling PS, Tape TG, Wigton RS, et al. Clinical prediction rule for pulmonary infiltrates. Ann Intern Med 1990; 113:664–670.
- Gennis P, Gallagher J, Falvo C, Baker S, Than W. Clinical criteria for the detection of pneumonia in adults: guidelines for ordering chest roentgenograms in the emergency department. J Emerg Med 1989; 7:263–268.
- Melbye H, Straume B, Aasebo U, Dale K. Diagnosis of pneumonia in adults in general practice. Relative importance of typical symptoms and abnormal chest signs evaluated against a radiographic reference standard. Scand J Prim Health Care 1992; 10:226–233.
- Wong CL, Holroyd-Leduc J, Straus SE. Does this patient have a pleural effusion? JAMA 2009; 301:309–317.
- Kalantri S, Joshi R, Lokhande T, et al. Accuracy and reliability of physical signs in the diagnosis of pleural effusion. Respir Med 2007; 101:431–438.
- Heron M. Deaths: leading causes for 2014. National Vital Statistics Reports 2016; 65(5) June 30, 2016. www.cdc.gov/nchs/data/nvsr/nvsr65/nvsr65_05.pdf. Accessed October 20, 2017.
- Global Initiative for Chronic Obstructive Lung Disease. Pocket guide to COPD diagnosis, management, and prevention. http://goldcopd.org/wp-content/uploads/2016/12/wms-GOLD-2017-Pocket-Guide.pdf. Accessed November 13, 2017.
- Pauwels RA, Rabe KF. Burden and clinical features of chronic obstructive pulmonary disease (COPD). Lancet 2004; 364:613–620.
- Oshaug K, Halvorsen PA, Melbye H. Should chest examination be reinstated in the early diagnosis of chronic obstructive pulmonary disease? Int J Chron Obstruct Pulmon Dis 2013; 8:369–377.
- Bettencourt PE, Del Bono EA, Spiegelman D, Hertzmark E, Murphy RL Jr. Clinical utility of chest auscultation in common pulmonary diseases. Am J Respir Crit Care Med 1994; 150:1291–1297.
- Nath AR, Capel LH. Inspiratory crackles and mechanical events of breathing. Thorax 1974; 29:695–698.
- Badgett RG, Tanaka DJ, Hunt DK, et al. Can moderate chronic obstructive pulmonary disease be diagnosed by historical and physical findings alone? Am J Med 1993; 94:188–196.
- ABIM Foundation. Choosing wisely. Echocardiograms for heart valve disease. www.choosingwisely.org. Accessed November 13, 2017.
- Davison R, Cannon R. Estimation of central venous pressure by examination of jugular veins. Am Heart J 1974; 87:279–282.
- Ducas J, Magder S, McGregor M. Validity of the hepatojugular reflux as a clinical test for congestive heart failure. Am J Cardiol 1983; 52:1299–1303.
- Vinayak AG, Levitt J, Gehlbach B, Pohlman AS, Hall JB, Kress JP. Usefulness of the external jugular vein examination in detecting abnormal central venous pressure in critically ill patients. Arch Intern Med 2006; 166:2132–2137.
- Sankoff J, Zidulka A. Non-invasive method for the rapid assessment of central venous pressure: description and validation by a single examiner. West J Emerg Med 2008; 9:201–205.
- Davie AP, Francis CM, Caruana L, Sutherland GR, McMurray JJ. Assessing diagnosis in heart failure: which features are any use? QJM 1997; 90:335–339.
- Kristensen SL, Mogensen UM, Jhund PS, et al. Clinical and echocardiographic characeristics and cardiovascular outcomes according to diabetes status in patients with heart failure and preserved ejection fraction. A report from the Irbesartan in Heart Failure with Preserved Ejection Fraction Trial (I-Preserve). Circulation 2017; https://doi.org/10.1161/CIRCULATIONAHA.116.024593. Accessed November 1, 2017.
- Butman SM, Ewy GA, Standen JR, Kern KB, Hahn E. Bedside cardiovascular examination in patients with severe chronic heart failure: importance of rest or inducible jugular venous distension. J Am Coll Cardiol 1993; 22:968–974.
- Sochowski RA, Dubbin JD, Naqvi SZ. Clinical and hemodynamic assessment of the hepatojugular reflux. Am J Cardiol 1990; 66:1002–1006.
- Ewy GA. The abdominojugular test: technique and hemodynamic correlates. Ann Intern Med 1988; 109:456–460.
- Gadsboll N, Hoilund-Carlsen PF, Nielsen GG, et al. Symptoms and signs of heart failure in patients with myocardial infarction: reproducibility and relationship to chest X-ray, radionuclide ventriculography and right heart catheterization. Eur Heart J 1989; 10:1017–1028.
- Fahey T, Jeyaseelan S, McCowan C, et al. Diagnosis of left ventricular systolic dysfunction (LVSD): development and validation of a clinical prediction rule in primary care. Fam Pract 2007; 24:628–635.
- Gadsboll N, Hoilund-Carlsen PF, Nielsen GG, et al. Interobserver agreement and accuracy of bedside estimation of right and left ventricular ejection fraction in acute myocardial infarction. Am J Cardiol 1989; 63:1301–1307.
- Mattleman SJ, Hakki AH, Iskandrian AS, Segal BL, Kane SA. Reliability of bedside evaluation in determining left ventricular function: correlation with left ventricular ejection fraction determined by radionuclide ventriculography. J Am Coll Cardiol 1983; 1:417–420.
- Madhok V, Falk G, Rogers A, Struthers AD, Sullivan FM, Fahey T. The accuracy of symptoms, signs and diagnostic tests in the diagnosis of left ventricular dysfunction in primary care: a diagnostic accuracy systematic review. BMC Fam Pract 2008; 9:56.
- Kelder JC, Cramer MJ, van Wijngaarden J, et al. The diagnostic value of physical examination and additional testing in primary care patients with suspected heart failure. Circulation 2011; 124:2865–2873.
KEY POINTS
- Asymmetrical chest expansion, diminished breath sounds, egophony, bronchophony, and tactile fremitus can be used in combination to accurately diagnose pneumonia and pleural effusion.
- No physical sign performs with a high degree of accuracy for diagnosing early-stage chronic obstructive pulmonary disease.
- Inspiratory crackles, diminished breath sounds, and cardiac dullness have high diagnostic value for advanced obstructive airway disease.
- Congestive heart failure can be diagnosed at the bedside by examining the jugular veins and palpating the point of maximal intensity.

Case Studies in Toxicology: DILI Dally
Case
A 50-year-old Hispanic woman with a history of rheumatoid arthritis (RA), for which she was not currently taking medication, was referred to the ED by her primary care physician (PCP) for evaluation of generalized pruritus and jaundice, and an abnormal hepatic function panel.
The patient’s recent history was significant for a positive tuberculosis test (purified protein derivative [PPD], 13 mm), for which she had been on prophylactic medication. Laboratory evaluation taken during the patient’s recent follow-up visit with her PCP revealed the following significant hepatic abnormalities: total bilirubin, 20.0 mg/dL; direct bilirubin, 16.4 mg/dL; international normalized ratio, 2.9; aspartate aminotransferase, greater than 2,000 IU/L; and alanine aminotransferase, greater than 2,000 IU/L. The patient had no history of hepatic disease, and a hepatitis panel obtained in the ED was unremarkable.
Can this be drug-induced liver injury?
Drug-induced liver injury (DILI) accounts for nearly 50% of cases of acute liver failure in the United States.1 According to the National Institutes of Health database of drugs, supplements, and herbal medications acetaminophen is the most common drug associated with hepatotoxicity in the United States, whereas amoxicillin-clavulanate is the most common implicated drug worldwide.1,2 The histological pattern of DILI varies by drug (Table).3
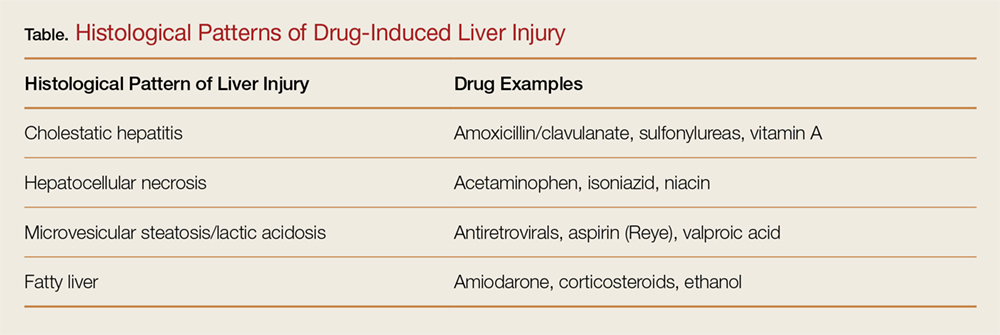
Who is susceptible to drug-induced liver injury?
The factors that help predict DILI include drug pharmacokinetics and metabolism, as well as patient age, sex, and comorbidities. Although some patients are at an increased risk of DILI, it is extraordinarily difficult to accurately predict which patients will develop it. In general, there is a positive correlation between age and risk of developing DILI. For example, in a large US-based tuberculosis study, the incidence of isoniazid (INH)-induced hepatotoxicity was 4.4 per 1,000 patients aged 25 to 34 years. Patients older than age 50 years had a 20.83 per 1,000 incidence of DILI, and women also appear to be at increased risk.4
Pharmacogenetic factors affecting drug metabolism such as the specific cytochrome profile and acetylator status of an individual also influence a patient’s risk of developing DILI. Although our understanding of these issues is growing rapidly, our ability to apply this knowledge to the clinical venue is limited by the available technology, regulatory requirements, and cost.
Case Continuation
A detailed, careful history-taking in the ED revealed that, 2 months prior, the patient had been started on INH, rifampin, and pyridoxine for latent tuberculosis. She had been taking methotrexate for the RA but discontinued it 3 months ago because of the positive PPD. When routine outpatient laboratory testing results demonstrated significant hepatic dysfunction, the patient’s PCP advised her to immediately discontinue her medications and referred her to the ED for further evaluation and management.
By what mechanism does INH cause DILI?
Acute INH-associated hepatitis primarily results from the direct hepatotoxic effects of INH metabolites. Isoniazid is metabolized in the liver via N-acetylation to acetylisoniazid (Figure). Oxidation of this compound in the liver leads to an accumulation of the hepatotoxic metabolites acetylhydrazine and hydrazine.5,6
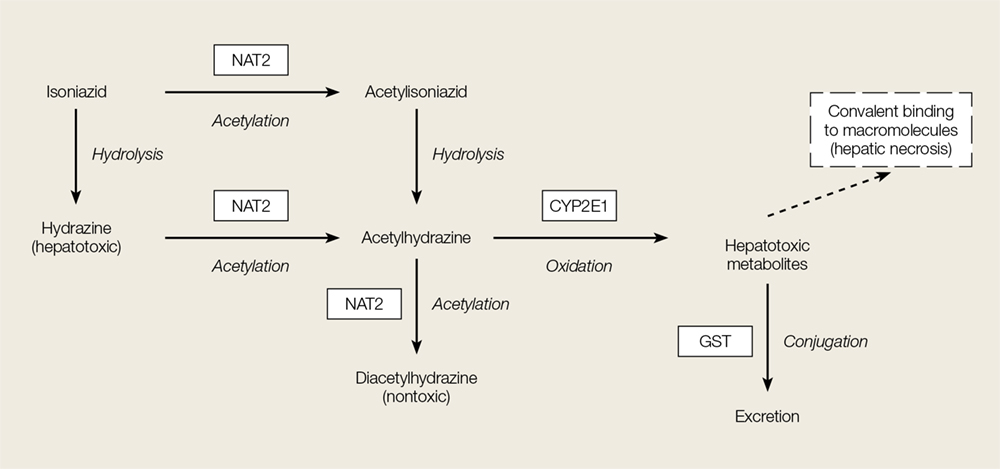
Is there a role for N-acetylcysteine in INH hepatotoxicity?
No antidote is specifically designed to treat INH-induced hepatotoxicity, and management is largely supportive. Observation for progressive liver failure is indicated and evaluation for liver transplant may become necessary.
N-acetylcysteine (NAC) has a clear role in preventing hepatotoxicity from acetaminophen overdose through its ability to act as a precursor for the synthesis of glutathione—a compound that protects hepatocytes from oxidative damage. In advanced acetaminophen-toxic patients and those with non-acetaminophen toxicity, NAC has nonspecific effects that promote healing through several mechanisms, including anti-inflammatory effect and enhanced hepatic perfusion. Though there are no studies that specifically evaluate the role of NAC in patients with INH-induced hepatotoxicity, it is commonly and appropriately administered for its aforementioned nonspecific effects.8 Common side effects from NAC administration include nausea, vomiting, and diarrhea, which are generally treatable with symptomatic and supportive care.
Case Conclusion
The patient was admitted to the hepatology service for continued clinical care. Although she received NAC, hepatic function testing showed only mild improvement. Additional etiologies of liver failure were investigated, including a computed tomography scan of the abdomen/pelvis and an abdominal ultrasound with Doppler. Both studies were negative for any pathology, and autoimmune laboratory studies were likewise unremarkable.
The patient underwent a liver biopsy, which revealed inflammation and scattered eosinophils suggestive of drug-induced hepatic injury. Her clinical condition continued to deteriorate, and she was transferred to another hospital for transplant evaluation.
1. Lee WM. Drug-induced acute liver failure. Clin Liver Dis. 2013;17(4):575-586, viii. doi:10.1016/j.cld.2013.07.001.
2. National Institutes of Health Web site. LiverTox: Clinical and research information on drug-induced liver injury. https://livertox.nlm.nih.gov/. Updated February 10, 2017. Accessed October 12, 2017.
3. Ansari JA, Sayyed M, Sayeed F. Management of non alcoholic fatty liver diseases and their complications. Int J Pharmacol. 2011;7:579-588. doi:10.3923/ijp.2011.579.588.
4. Fountain FF, Tolley E, Chrisman CR, Self TH. Isoniazid hepatotoxicity associated with treatment of latent tuberculosis infection: a 7-year evaluation from a public health tuberculosis clinic. Chest. 2005;128(1):116-123. doi:10.1378/chest.128.1.116.
5. Hernon CH. Antituberculous medications. In: Hoffman RS, Howland MA, Lewin NA, Nelson LS, Goldfrank LR, eds. Goldfrank’s Toxicologic Emergencies. 10th ed. New York, NY: McGraw-Hill; 2015:787-796.
6. Teixeira RL, Morato RG, Cabello PH, et al. Genetic polymorphisms of NAT2, CYP2E1 and GST enzymes and the occurrence of antituberculosis drug-induced hepatitis in Brazilian TB patients. Mem Inst Oswaldo Cruz. 2011;106(6):716-724.
7. Mitchell JR, Thorgeirsson UP, Black M, et al. Increased incidence of isoniazid hepatitis in rapid acetylators: possible relation to hydranize metabolites. Clin Pharmacol Ther. 1975;18(1):70-79.
8. Lee WM, Hynan LS, Rossaro L, et al; Acute Liver Failure Study Group. Intravenous N-acetylcysteine improves transplant-free survival in early stage non-acetaminophen acute liver failure. Gastroenterology. 2009;137(3):856-864. doi:10.1053/j.gastro.2009.06.006.
Case
A 50-year-old Hispanic woman with a history of rheumatoid arthritis (RA), for which she was not currently taking medication, was referred to the ED by her primary care physician (PCP) for evaluation of generalized pruritus and jaundice, and an abnormal hepatic function panel.
The patient’s recent history was significant for a positive tuberculosis test (purified protein derivative [PPD], 13 mm), for which she had been on prophylactic medication. Laboratory evaluation taken during the patient’s recent follow-up visit with her PCP revealed the following significant hepatic abnormalities: total bilirubin, 20.0 mg/dL; direct bilirubin, 16.4 mg/dL; international normalized ratio, 2.9; aspartate aminotransferase, greater than 2,000 IU/L; and alanine aminotransferase, greater than 2,000 IU/L. The patient had no history of hepatic disease, and a hepatitis panel obtained in the ED was unremarkable.
Can this be drug-induced liver injury?
Drug-induced liver injury (DILI) accounts for nearly 50% of cases of acute liver failure in the United States.1 According to the National Institutes of Health database of drugs, supplements, and herbal medications acetaminophen is the most common drug associated with hepatotoxicity in the United States, whereas amoxicillin-clavulanate is the most common implicated drug worldwide.1,2 The histological pattern of DILI varies by drug (Table).3
Who is susceptible to drug-induced liver injury?
The factors that help predict DILI include drug pharmacokinetics and metabolism, as well as patient age, sex, and comorbidities. Although some patients are at an increased risk of DILI, it is extraordinarily difficult to accurately predict which patients will develop it. In general, there is a positive correlation between age and risk of developing DILI. For example, in a large US-based tuberculosis study, the incidence of isoniazid (INH)-induced hepatotoxicity was 4.4 per 1,000 patients aged 25 to 34 years. Patients older than age 50 years had a 20.83 per 1,000 incidence of DILI, and women also appear to be at increased risk.4
Pharmacogenetic factors affecting drug metabolism such as the specific cytochrome profile and acetylator status of an individual also influence a patient’s risk of developing DILI. Although our understanding of these issues is growing rapidly, our ability to apply this knowledge to the clinical venue is limited by the available technology, regulatory requirements, and cost.
Case Continuation
A detailed, careful history-taking in the ED revealed that, 2 months prior, the patient had been started on INH, rifampin, and pyridoxine for latent tuberculosis. She had been taking methotrexate for the RA but discontinued it 3 months ago because of the positive PPD. When routine outpatient laboratory testing results demonstrated significant hepatic dysfunction, the patient’s PCP advised her to immediately discontinue her medications and referred her to the ED for further evaluation and management.
By what mechanism does INH cause DILI?
Acute INH-associated hepatitis primarily results from the direct hepatotoxic effects of INH metabolites. Isoniazid is metabolized in the liver via N-acetylation to acetylisoniazid (Figure). Oxidation of this compound in the liver leads to an accumulation of the hepatotoxic metabolites acetylhydrazine and hydrazine.5,6
Is there a role for N-acetylcysteine in INH hepatotoxicity?
No antidote is specifically designed to treat INH-induced hepatotoxicity, and management is largely supportive. Observation for progressive liver failure is indicated and evaluation for liver transplant may become necessary.
N-acetylcysteine (NAC) has a clear role in preventing hepatotoxicity from acetaminophen overdose through its ability to act as a precursor for the synthesis of glutathione—a compound that protects hepatocytes from oxidative damage. In advanced acetaminophen-toxic patients and those with non-acetaminophen toxicity, NAC has nonspecific effects that promote healing through several mechanisms, including anti-inflammatory effect and enhanced hepatic perfusion. Though there are no studies that specifically evaluate the role of NAC in patients with INH-induced hepatotoxicity, it is commonly and appropriately administered for its aforementioned nonspecific effects.8 Common side effects from NAC administration include nausea, vomiting, and diarrhea, which are generally treatable with symptomatic and supportive care.
Case Conclusion
The patient was admitted to the hepatology service for continued clinical care. Although she received NAC, hepatic function testing showed only mild improvement. Additional etiologies of liver failure were investigated, including a computed tomography scan of the abdomen/pelvis and an abdominal ultrasound with Doppler. Both studies were negative for any pathology, and autoimmune laboratory studies were likewise unremarkable.
The patient underwent a liver biopsy, which revealed inflammation and scattered eosinophils suggestive of drug-induced hepatic injury. Her clinical condition continued to deteriorate, and she was transferred to another hospital for transplant evaluation.
1. Lee WM. Drug-induced acute liver failure. Clin Liver Dis. 2013;17(4):575-586, viii. doi:10.1016/j.cld.2013.07.001.
2. National Institutes of Health Web site. LiverTox: Clinical and research information on drug-induced liver injury. https://livertox.nlm.nih.gov/. Updated February 10, 2017. Accessed October 12, 2017.
3. Ansari JA, Sayyed M, Sayeed F. Management of non alcoholic fatty liver diseases and their complications. Int J Pharmacol. 2011;7:579-588. doi:10.3923/ijp.2011.579.588.
4. Fountain FF, Tolley E, Chrisman CR, Self TH. Isoniazid hepatotoxicity associated with treatment of latent tuberculosis infection: a 7-year evaluation from a public health tuberculosis clinic. Chest. 2005;128(1):116-123. doi:10.1378/chest.128.1.116.
5. Hernon CH. Antituberculous medications. In: Hoffman RS, Howland MA, Lewin NA, Nelson LS, Goldfrank LR, eds. Goldfrank’s Toxicologic Emergencies. 10th ed. New York, NY: McGraw-Hill; 2015:787-796.
6. Teixeira RL, Morato RG, Cabello PH, et al. Genetic polymorphisms of NAT2, CYP2E1 and GST enzymes and the occurrence of antituberculosis drug-induced hepatitis in Brazilian TB patients. Mem Inst Oswaldo Cruz. 2011;106(6):716-724.
7. Mitchell JR, Thorgeirsson UP, Black M, et al. Increased incidence of isoniazid hepatitis in rapid acetylators: possible relation to hydranize metabolites. Clin Pharmacol Ther. 1975;18(1):70-79.
8. Lee WM, Hynan LS, Rossaro L, et al; Acute Liver Failure Study Group. Intravenous N-acetylcysteine improves transplant-free survival in early stage non-acetaminophen acute liver failure. Gastroenterology. 2009;137(3):856-864. doi:10.1053/j.gastro.2009.06.006.
Birthdays, Booze, and … Broken Bones?
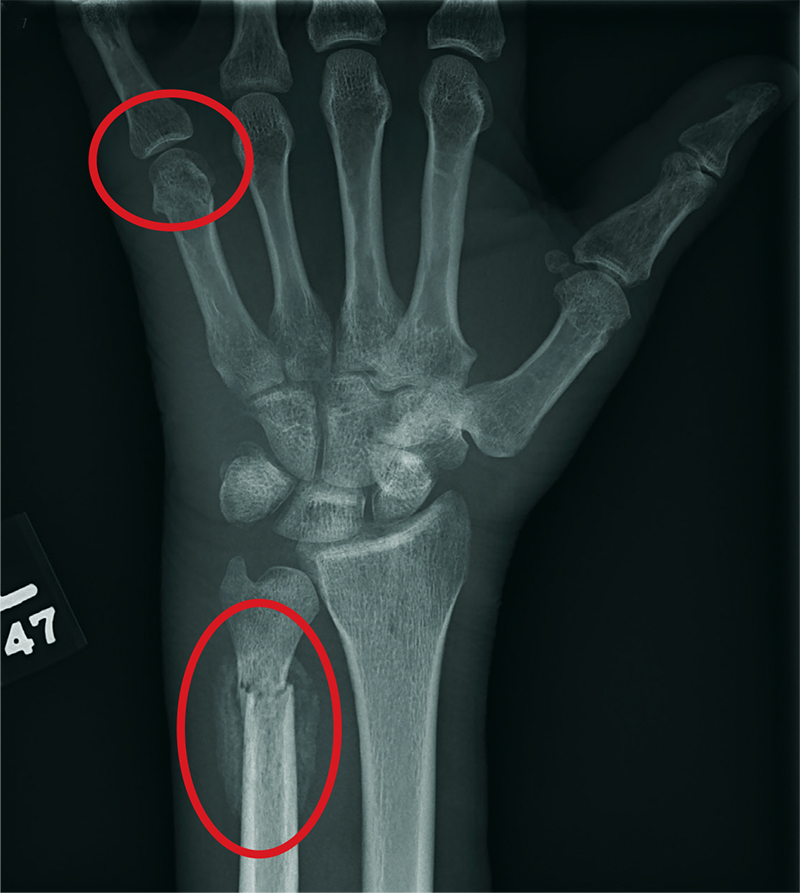
ANSWER
The radiograph shows two fractures: one within the distal ulna and one within the fifth metacarpal. On closer examination, you can see that a bony callous surrounds each of the fracture lines, making these injuries more likely to be subacute or remote than acute.
Review of the patient's electronic health record showed he had presented three months earlier for a left hand and wrist injury, at which time an acute fracture was diagnosed. Nonetheless, he was placed in a splint and referred to orthopedics for outpatient follow-up.
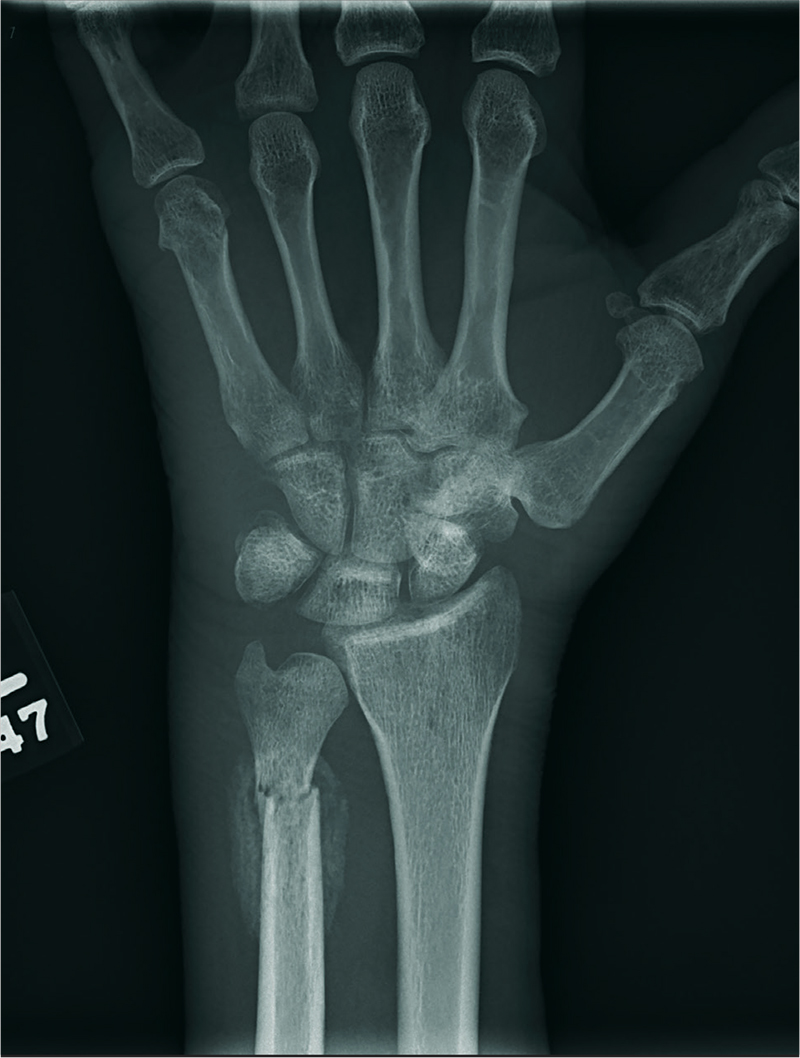
A 60-year-old man is brought to your facility emergently for decreased consciousness secondary to alcohol intoxication. He is somewhat incoherent, but from what you gather, he was attending a birthday celebration. He does not know how much he drank.
The patient complains of a headache and pain in his left wrist. You ask if he fell or was assaulted, but he does not respond. His medical history is otherwise unknown.
His initial vital signs are stable, and primary survey does not show any major injuries. He appears to spontaneously move all four extremities.
Closer examination of his left wrist shows no deformity or swelling, but the dorsolateral aspect of his hand is tender. Radiograph of his left wrist is obtained (shown). What is your impression?
The Impact of Two-Person Indwelling Urinary Catheter Insertion in the Emergency Department Using Technical and Socioadaptive Interventions
From Tampa General Hospital, Tampa, FL.
Abstract
- Objective: To decrease insertion-related catheter-associated urinary tract infections (CAUTIs) attributed to the emergency department (ED) as well as facility-wide within a large teaching hospital.
- Methods: Recommendations from the Agency for Healthcare Research and Quality (AHRQ) toolkit for reducing CAUTIs in hospital units were used to implement both technical and socioadaptive changes focused on prevention of insertion-related CAUTIs in the ED through a trial that required 2 licensed personnel for insertion of all urinary catheters. The process would include a safety time-out to confirm catheter appropriateness and review of the proper steps for insertion as a means to encompass and hardwire both the technical and socioadaptive aspects of the Comprehensive Unit-based Safety Project methodology into ED practice.
- Results: There was a 75% decrease in CAUTI rates following the intervention (P = 0.05). This reduction was sustained for at least 1 year following implementation.
- Conclusion: Using AHRQ recommendations to implement socioadaptive and technical changes through 2-person insertion of urinary catheters yielded a significant and sustainable decrease in insertion-related CAUTI rates and utilization of indwelling urinary catheters in the ED at Tampa General Hospital.
Key words: catheter-associated urinary tract infections; infection prevention; quality improvement; change model.
Each year an estimated 721,800 health care–associated infections occur in U.S. acute care hospitals, resulting in approximately 75,000 deaths [1]. Catheter-associated urinary tract infections (CAUTIs) account for an estimated 449,334 of health care–associated infections s annually [2]. The direct medical cost per CAUTI ranges from $749 to $1007, resulting in direct costs to U.S. facilities of over $340 million annually [2]. Although CAUTIs are one of the most common health care–associated infections, the literature has shown that following well established prevention guidelines can greatly reduce their incidence.
Since most health care–associated infections are preventable and cause unnecessary patient harm, there is pressure from regulatory bodies to prevent such events during a patient’s hospitalization. Prevention of CAUTIs is a Joint Commission National Patient Safety Goal, and as of 2008 the Centers for Medicare and Medicaid Services (CMS) does not reimburse hospitals for the cost of additional care as a result of a CAUTI. Additionally, facility CAUTI data is included in the CMS value-based purchasing program, which can withhold payments to hospitals based on performance, as well as the inpatient quality reporting program, which requires public reporting of CAUTI to receive a higher annual payment.
Even before the external pressures of regulatory bodies, Tampa General Hospital has strived to protect patients by preventing infections through implementing best practices via multidisciplinary committees to maximize impact. Tampa General Hospital, a private not-for-profit level 1 trauma center located in downtown Tampa, Florida, is a teaching facility affiliated with the University of South Florida Morsani College of Medicine. It is licensed for more than 1000 beds and serves 12 surrounding counties with a population in excess of 4 million.
Background
CAUTI data had been collected in all of the intensive care units at the hospital for several years, benchmarked against national unit-specific rates, with feedback provided to committees and the hospital board. However, in 2006, a multidisciplinary committee chaired by the chief operating officer known as Committee Targeting Zero (CTZ) was formed to review best practices and analyze all device-associated infection rates in an effort to reduce hospital-acquired infections. To target reduction of the CAUTI rate, a Foley stabilization device and renewed focus on hand hygiene were implemented, and CAUTI rates were reduced by over 50% by the end of 2007.
When CAUTI rates began to climb in 2008, additional interventions were implemented under the direction of CTZ, including a literature review for CAUTI prevention for any new or novel prevention strategies, reporting of each CAUTI to leadership of the attributed unit at the time of identification, ongoing surveillance of the appropriateness of indwelling urinary catheters at the unit level with feedback to CTZ, and mandatory education focused on infection of CAUTI and proper insertion for all staff inserting indwelling urinary catheters. Additionally, in 2009 an evaluation of an antibiotic-coated Foley catheter was implemented to further decrease rates, resulting in a statistically significant 42% reduction in the CAUTI rate as compared to 2008. Other prevention strategies instituted between 2010 and 2012 included increased availability of condom catheters, a closed system urine culture collection kit, and computer-based learning module for all staff inserting indwelling urinary catheters.
In 2013, the hospital included CAUTI prevention as part of a facility-wide initiative to decrease patient harm. A CAUTI committee led by senior leadership was convened to address CAUTI rates that exceeded national benchmarks. The multidisciplinary team began as a subcommittee of CTZ and was chaired by the chief nursing officer with the support of the chief operations officer and included representation from the infection prevention department and nursing unit leadership. After reviewing the Healthcare Infection Control Practices Advisory Committee’s (HICPAC) guideline for prevention of CAUTIs [3], the committee focused its efforts on appropriate indications for insertion and timely removal, aseptic insertion, and proper maintenance of indwelling urinary catheters.
The key accomplishments of the CAUTI committee during 2014 included development of a comprehensive genitourinary management policy, incorporation of CAUTI prevention into new employee orientation for all patient care staff, aseptic indwelling urinary catheter insertion competency check-off with return demonstration (teachback methodology) for all nursing staff, and reinforcement of insertion criteria and daily assessment for necessity with documentation of indications, and removal via nurse-driven protocol when necessary. Additionally, a requirement to document indications for ordering urine cultures and a pop-up reminder in the electronic medical record for patients with an indwelling urinary catheter requiring indications to continue, both targeted towards physicians and advanced practice providers, were implemented.
In conjunction with the technical changes, additional strategies were executed with the intent of facilitating a culture of patient safety and reinforcing the aforementioned technical changes. In 2014, the hospital implemented Franklin Covey’s “The Speed of Trust” methodology [4] and its associated 13 behaviors hospital-wide. Additionally, several of the inpatient units participated in a quality improvement project with either the Florida Hospital Engagement Network (HEN) [5] or the Agency for Healthcare Research and Quality (AHRQ) Comprehensive Unit-based Safety Program (CUSP) [6] national project. Physician engagement and education was accomplished through a white paper written by the infection prevention department, summarizing the current state of CAUTI within the facility and highlighting strategies to reduce infection, including evidence-based guidelines on ordering urine cultures.
In an attempt to target ongoing improvement strategies, CAUTIs were categorized as either insertion-related, occurring within 7 days of insertion, or maintenance-related, occurring greater than 7 days of insertion; the date of insertion was considered day 1. A review of the facility CAUTI data demonstrated that an opportunity to reduce insertion-related CAUTIs existed and a high volume of urinary catheters were inserted in the emergency department (ED). Therefore, ED leadership agreed to participate in the CUSP initiative for EDs beginning April 2014. The goals of the CUSP initiative include using best practices for CAUTI prevention through the implementation of both technical and socioadaptive changes.
Methods
CUSP Initiative
The CUSP initiative focuses specifically on improving processes for determining catheter appropriateness and promoting proper insertion techniques in addition to changes in culture to facilitate teamwork and communication amongst frontline staff and improve collaboration between the ED and inpatient units. To participate in the project, a multidisciplinary team that included ED leadership, infection prevention department, and nursing clinical quality and research specialists was established.
The team designed an intervention that required 2 licensed personnel for insertion of all urinary catheters. The process would include a safety time-out consisting of a pause before inserting the indwelling urinary catheter to confirm catheter appropriateness and review of the proper steps for insertion as a means to encompass and hardwire both the technical and socioadaptive aspects of the CUSP methodology into ED practice.
Rollout Using 4Es
January through March 2015 was the implementation period during which education and validation of practices were conducted. The 4Es model created by the Johns Hopkins University Quality and Safety Research Group was used to roll out the changes in practice to the ED staff; the 4Es are Engagement, Education, Execution, and Evaluation [7]. To engage staff, the scope of CAUTIs, including the implications to both patients and to the health care system as a whole, were presented from a local (hospital) and a national perspective. Education was achieved by outlining the new process in ED staff education sessions, as well as through handouts, emails, and during shift change huddles. The content included a checklist (Figure 1) staff would use to follow proper aseptic technique as well as reminders of the intent of the project. 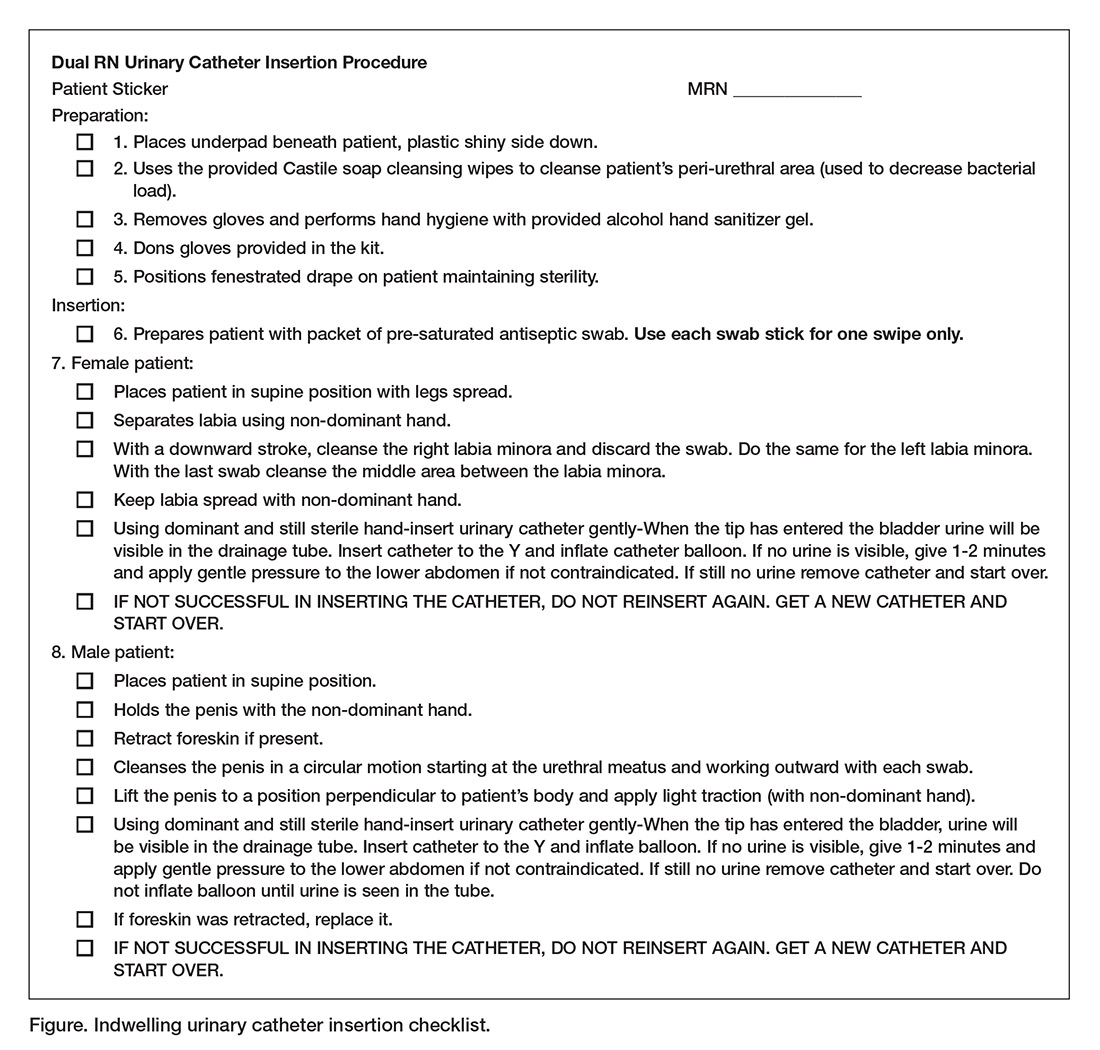
The process was executed through the use of a safety time-out completed by the 2 personnel (nurses) involved in the procedure prior to insertion of an indwelling urinary catheter. The time-out consisted of reviewing the insertion criteria to determine appropriateness for placement and the proper steps for insertion per hospital policy. The catheter was then inserted by one person while the second was solely responsible to assure compliance with proper aseptic technique. The procedure was stopped if aseptic technique was compromised. The indications for insertion and/or maintaining the urinary catheter are based on the HICPAC guidelines [3] and include the following:
- Acute urinary retention/obstruction
- Urologic, urethral or extensive abdominal surgical procedure
- Critically ill patient with unstable vital signs and requires close urine output monitoring (ICU patient receiving aggressive diuretic therapy, vasopressor/inotropic therapy, paralytic therapy, aggressive fluid management or titrated vasoactive medications)
- Stage 3 or 4 sacral or perineal pressure ulcer in a patient with incontinence
- End of life comfort
- Prevention of further trauma due to a difficult insertion
- Prolonged immobility due to unstable spinal fracture or pelvic fracture and inability to use bedpan.
During the implementation period, a process measure was used to evaluate the rollout. The compliance rate of returned insertion checklists versus the total number of insertions was calculated weekly and tracked over time. Although compliance was low at first, through several Plan-Do-Study-Act (PDSA) cycles conducted on a weekly basis, compliance steadily increased during the implementation period. Staff were also kept abreast of the compliance rates and progress of the project with weekly email updates and periodically in daily huddles during shift change.
Rollout Using 4Es
In parallel to the CUSP framework, the ED leadership team discretely used 6 of “The Speed of Trust” behaviors most relevant to the project to help drive the new process including get better, practice accountability, keep commitments, clarify expectations, deliver results, and create transparency. Get better was used to motivate staff to action in order to deliver the highest quality of care to our patients. Practice accountability was exercised by having the staff sign the checklist used in the new process. Deliver results was supported by the timely feedback of data to frontline staff to show whether the goal was being met. Clarifying expectations was demonstrated through feedback from weekly PDSA rapid cycles and constant reinforcement that all insertions must involve 2 personnel. Keeping commitments was established with an agreement amongst the staff and leadership to keep patients safe and deliver high quality care. Creating transparency was exemplified by explaining the initiative clearly to each patient and their family and allowing for any questions.
Outcomes Measurement
During the post-intervention period, progress was evaluated using 2 outcome measures: the insertion-related CAUTI rate and the catheter utilization ratio. National Healthcare Safety Network (NHSN) 2014 and 2015 criteria was used to identify any CAUTI [8] and for the purposes of this project, the insertion-related CAUTI rate was defined as the number of CAUTIs occurring ≤ 7 days after insertion, with the date of insertion being day 1, per 1000 catheters inserted in the ED. The utilization ratio was calculated from the number of catheters inserted per patient ED visits. The insertion-related CAUTI rates for the pre- and post-intervention periods were compared after excluding 2014 yeast CAUTIs to adjust for changes in the 2015 National Healthcare Safety Network CAUTI criteria, which removed yeast as an organism for CAUTI. The utilization ratio was also calculated and compared between pre- and post-intervention periods. All statistical analysis was done using the NHSN statistics calculator.
Results
During the pre-intervention period (April–December 2014) there were 10 infections and 1450 catheters inserted, which equates to an insertion-related CAUTI rate of 6.9/1,000 catheters. In the post-intervention period (April–December 2015), there were 2 infections and 1180 catheters placed, or an insertion-related CAUTI rate of 1.7/1000 catheters (Table 1)—a 75% decrease from the pre-intervention rate (P = 0.05).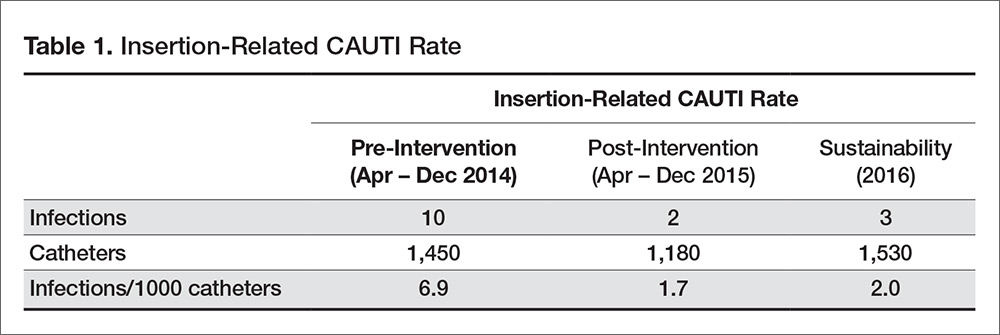
Additionally, the utilization ratio was calculated for 2014 and 2015 based on the number of catheter insertions per total patient ED visits in each year (Table 2). In 2014 the utilization ratio was 2.2 and in 2015 the utilization ratio was 1.7, representing a 23% reduction (P < 0.01).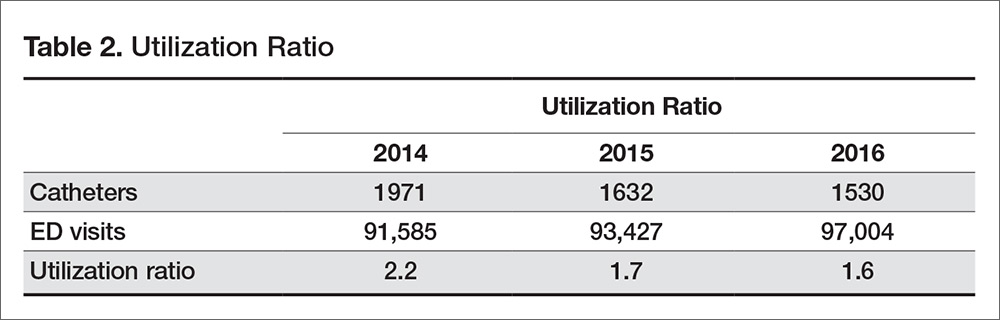
Following the post-intervention period, insertion-related rates and device utilization were also monitored in 2016. There were a total of 97,004 patient visits to the ED in 2016 with 1530 catheters inserted and 3 insertion-related CAUTIs attributed to the ED. The insertion-related CAUTI rate was 2.0/1000 catheters, which is statistically no different from the post-intervention period rate. The utilization ratio was 1.6, which is less than the post-intervention period (P < 0.01).
Discussion
As highlighted in the AHRQ toolkit [5], the project confirmed that using both technical and socioadaptive methodologies yielded a significant and sustainable impact on CAUTIs and utilization of indwelling urinary catheters. Prior to initiating the project, a review of the literature did not show any previous studies involving the insertion of urinary catheters by 2 licensed personnel. Since then, an acute care facility published data demonstrating a sustainable 39% reduction of CAUTI rates in an inpatient post-surgical unit within 6 months after the implementation of 2-person urinary catheter insertion [9]. The facility had also done extensive education and training on the CAUTI prevention best-practices prior to implementing the new insertion practices.
A key measure of success in regards to implementing cultural and technical changes is the sustainability of the results yielded after implementation. According to the AHRQ CAUTI toolkit, several specific strategies are necessary to successfully sustain prevention efforts. Implementing changes in the ED at our hospital in alignment with the goal of creating a culture of safety, incorporating the changes into daily work flow, employing both technical and socioadaptive interventions, empowering staff to stop the procedure if there are any concerns, and monitoring and communicating outcomes all ensure that the changes in practice will be sustained. Additionally, there is an engaged interdisciplinary CAUTI committee that continues to meet regularly as well as required yearly computer-based education for all frontline staff, and a “Safety Day” education session for all newly hired nurses where competency is assessed and validated for proper insertion and maintenance of a urinary catheter.
Initially, barriers for implementation included limited staff to ensure the presence of 2 licensed personnel for every urinary catheter insertion, lack of ability to collect checklist data in the electronic medical record and run compliance reports, and availability of the checklists at the onset of implementation. The staffing limitation seemed to work in favor of meeting the goals of the project, as staff were less likely to insert indwelling urinary catheters for inappropriate indications. In regards to the checklists, the barriers identified via the PDSA rapid cycles included inadequate locations to obtain checklists for use during insertion and drop-off locations for checklists after use. To increase availability and convenience, brightly colored folders labeled “FOLEY!” containing the checklists were placed both on the outside of the supply management stations and on the doors exiting the supply rooms where indwelling urinary catheter kits were located. Rounds were made on these folders approximately 1 to 2 times per week to be sure they remained full. In addition, more locations for dropping off completed forms were placed at all nursing stations as opposed to a single drop off location.
A limitation of the project is that there are not established metrics for infection rates in any outpatient setting nor are there established criteria to differentiate between insertion- and maintenance-related infections. While the metrics were created for the purposes of the project, they are easily reproducible within other health care facilities to track infection rates associated with outpatient areas. Additionally, by ensuring indications are met and proper insertion occurs in ED patients, the overall hospital’s CAUTI infection rate and standardized infection ratio are impacted, which are comparable across facilities. The criteria for differentiating between insertion and maintenance related infections was established in an attempt to define where the biggest vulnerabilities were with insertion versus maintenance. Days from insertion to infection were tracked for all infections, and arbitrarily a 7-day cutoff was used to consider the infection potentially insertion-related, as no evidence has been published to define this previously.
The lessons learned both during implementation of the changes in practice and the impact it can have on infection rates are valuable. Moving forward, Tampa General Hospital plans to spread dual personnel indwelling urinary catheter insertion as a best practice, first targeting inpatient units identified with the highest number of insertion-related infections as well as high device utilization ratios.
1. Magill SS, Edwards JR, Bamberg W, et al. Multistate point-prevalence survey of health care–associated infections. N Engl J Med 2014;370:1198–208.
2. Scott, RD. Center for Disease Control and Prevention. The direct medical costs of healthcare-associated infections in U.S. hospitals and the benefits of prevention. 2009. Accessed at https://www.cdc.gov/HAI/pdfs/hai/Scott_CostPaper.pdf.
3. Gould CV, Umscheid CA, Agarwal RK, et al. The Healthcare Infection Control Practices Advisory Committee (HICPAC). Guidelines for prevention of catheter-associated urinary tract infections. 2009. Accessed at http://www.cdc.gov/hicpac/pdf/CAUTI/CAUTIguideline2009final.pdf.
4. Covey SMR, Merrill RR. The speed of trust: the one thing that changes everything. New York: Free Press; 2008.
5. Florida Hospital Association Hospital Engagement Network. Update, March 2015. Florida Hospital Association, Orlando, FL. Accessed at www.fha.org/showDocument.aspx?f=2015HEN-Brief-Web.pdf.
6. Agency for Healthcare Research and Quality (AHRQ). Toolkit for reducing catheter-associated urinary tract infections in hospital units: implementation guide. 2014. Accessed at https://www.ahrq.gov/professionals/quality-patient-safety/hais/tools/cauti-hospitals/index.html.
7. Pronovost PJ, Berenholtz SM, Goeschel CA, et al. Creating high reliability in health care organizations. Health Serv Res 2006;41(4 Pt 2):1599–617.
8. Centers for Disease Control National Healthcare Safety Network. Urinary tract infection (catheter-associated urinary tract infection [CAUTI] and non-catheter-associated urinary tract infection [UTI]) and other urinary system infection [USI]) events. 2014. Accessed at https://www.cdc.gov/nhsn/pdfs/pscmanual/7psccauticurrent.pdf.
9. Belizario SM, Preventing urinary tract infections with a two-person catheter insertion procedure. Nursing 2015;45:67–9.
From Tampa General Hospital, Tampa, FL.
Abstract
- Objective: To decrease insertion-related catheter-associated urinary tract infections (CAUTIs) attributed to the emergency department (ED) as well as facility-wide within a large teaching hospital.
- Methods: Recommendations from the Agency for Healthcare Research and Quality (AHRQ) toolkit for reducing CAUTIs in hospital units were used to implement both technical and socioadaptive changes focused on prevention of insertion-related CAUTIs in the ED through a trial that required 2 licensed personnel for insertion of all urinary catheters. The process would include a safety time-out to confirm catheter appropriateness and review of the proper steps for insertion as a means to encompass and hardwire both the technical and socioadaptive aspects of the Comprehensive Unit-based Safety Project methodology into ED practice.
- Results: There was a 75% decrease in CAUTI rates following the intervention (P = 0.05). This reduction was sustained for at least 1 year following implementation.
- Conclusion: Using AHRQ recommendations to implement socioadaptive and technical changes through 2-person insertion of urinary catheters yielded a significant and sustainable decrease in insertion-related CAUTI rates and utilization of indwelling urinary catheters in the ED at Tampa General Hospital.
Key words: catheter-associated urinary tract infections; infection prevention; quality improvement; change model.
Each year an estimated 721,800 health care–associated infections occur in U.S. acute care hospitals, resulting in approximately 75,000 deaths [1]. Catheter-associated urinary tract infections (CAUTIs) account for an estimated 449,334 of health care–associated infections s annually [2]. The direct medical cost per CAUTI ranges from $749 to $1007, resulting in direct costs to U.S. facilities of over $340 million annually [2]. Although CAUTIs are one of the most common health care–associated infections, the literature has shown that following well established prevention guidelines can greatly reduce their incidence.
Since most health care–associated infections are preventable and cause unnecessary patient harm, there is pressure from regulatory bodies to prevent such events during a patient’s hospitalization. Prevention of CAUTIs is a Joint Commission National Patient Safety Goal, and as of 2008 the Centers for Medicare and Medicaid Services (CMS) does not reimburse hospitals for the cost of additional care as a result of a CAUTI. Additionally, facility CAUTI data is included in the CMS value-based purchasing program, which can withhold payments to hospitals based on performance, as well as the inpatient quality reporting program, which requires public reporting of CAUTI to receive a higher annual payment.
Even before the external pressures of regulatory bodies, Tampa General Hospital has strived to protect patients by preventing infections through implementing best practices via multidisciplinary committees to maximize impact. Tampa General Hospital, a private not-for-profit level 1 trauma center located in downtown Tampa, Florida, is a teaching facility affiliated with the University of South Florida Morsani College of Medicine. It is licensed for more than 1000 beds and serves 12 surrounding counties with a population in excess of 4 million.
Background
CAUTI data had been collected in all of the intensive care units at the hospital for several years, benchmarked against national unit-specific rates, with feedback provided to committees and the hospital board. However, in 2006, a multidisciplinary committee chaired by the chief operating officer known as Committee Targeting Zero (CTZ) was formed to review best practices and analyze all device-associated infection rates in an effort to reduce hospital-acquired infections. To target reduction of the CAUTI rate, a Foley stabilization device and renewed focus on hand hygiene were implemented, and CAUTI rates were reduced by over 50% by the end of 2007.
When CAUTI rates began to climb in 2008, additional interventions were implemented under the direction of CTZ, including a literature review for CAUTI prevention for any new or novel prevention strategies, reporting of each CAUTI to leadership of the attributed unit at the time of identification, ongoing surveillance of the appropriateness of indwelling urinary catheters at the unit level with feedback to CTZ, and mandatory education focused on infection of CAUTI and proper insertion for all staff inserting indwelling urinary catheters. Additionally, in 2009 an evaluation of an antibiotic-coated Foley catheter was implemented to further decrease rates, resulting in a statistically significant 42% reduction in the CAUTI rate as compared to 2008. Other prevention strategies instituted between 2010 and 2012 included increased availability of condom catheters, a closed system urine culture collection kit, and computer-based learning module for all staff inserting indwelling urinary catheters.
In 2013, the hospital included CAUTI prevention as part of a facility-wide initiative to decrease patient harm. A CAUTI committee led by senior leadership was convened to address CAUTI rates that exceeded national benchmarks. The multidisciplinary team began as a subcommittee of CTZ and was chaired by the chief nursing officer with the support of the chief operations officer and included representation from the infection prevention department and nursing unit leadership. After reviewing the Healthcare Infection Control Practices Advisory Committee’s (HICPAC) guideline for prevention of CAUTIs [3], the committee focused its efforts on appropriate indications for insertion and timely removal, aseptic insertion, and proper maintenance of indwelling urinary catheters.
The key accomplishments of the CAUTI committee during 2014 included development of a comprehensive genitourinary management policy, incorporation of CAUTI prevention into new employee orientation for all patient care staff, aseptic indwelling urinary catheter insertion competency check-off with return demonstration (teachback methodology) for all nursing staff, and reinforcement of insertion criteria and daily assessment for necessity with documentation of indications, and removal via nurse-driven protocol when necessary. Additionally, a requirement to document indications for ordering urine cultures and a pop-up reminder in the electronic medical record for patients with an indwelling urinary catheter requiring indications to continue, both targeted towards physicians and advanced practice providers, were implemented.
In conjunction with the technical changes, additional strategies were executed with the intent of facilitating a culture of patient safety and reinforcing the aforementioned technical changes. In 2014, the hospital implemented Franklin Covey’s “The Speed of Trust” methodology [4] and its associated 13 behaviors hospital-wide. Additionally, several of the inpatient units participated in a quality improvement project with either the Florida Hospital Engagement Network (HEN) [5] or the Agency for Healthcare Research and Quality (AHRQ) Comprehensive Unit-based Safety Program (CUSP) [6] national project. Physician engagement and education was accomplished through a white paper written by the infection prevention department, summarizing the current state of CAUTI within the facility and highlighting strategies to reduce infection, including evidence-based guidelines on ordering urine cultures.
In an attempt to target ongoing improvement strategies, CAUTIs were categorized as either insertion-related, occurring within 7 days of insertion, or maintenance-related, occurring greater than 7 days of insertion; the date of insertion was considered day 1. A review of the facility CAUTI data demonstrated that an opportunity to reduce insertion-related CAUTIs existed and a high volume of urinary catheters were inserted in the emergency department (ED). Therefore, ED leadership agreed to participate in the CUSP initiative for EDs beginning April 2014. The goals of the CUSP initiative include using best practices for CAUTI prevention through the implementation of both technical and socioadaptive changes.
Methods
CUSP Initiative
The CUSP initiative focuses specifically on improving processes for determining catheter appropriateness and promoting proper insertion techniques in addition to changes in culture to facilitate teamwork and communication amongst frontline staff and improve collaboration between the ED and inpatient units. To participate in the project, a multidisciplinary team that included ED leadership, infection prevention department, and nursing clinical quality and research specialists was established.
The team designed an intervention that required 2 licensed personnel for insertion of all urinary catheters. The process would include a safety time-out consisting of a pause before inserting the indwelling urinary catheter to confirm catheter appropriateness and review of the proper steps for insertion as a means to encompass and hardwire both the technical and socioadaptive aspects of the CUSP methodology into ED practice.
Rollout Using 4Es
January through March 2015 was the implementation period during which education and validation of practices were conducted. The 4Es model created by the Johns Hopkins University Quality and Safety Research Group was used to roll out the changes in practice to the ED staff; the 4Es are Engagement, Education, Execution, and Evaluation [7]. To engage staff, the scope of CAUTIs, including the implications to both patients and to the health care system as a whole, were presented from a local (hospital) and a national perspective. Education was achieved by outlining the new process in ED staff education sessions, as well as through handouts, emails, and during shift change huddles. The content included a checklist (Figure 1) staff would use to follow proper aseptic technique as well as reminders of the intent of the project.
The process was executed through the use of a safety time-out completed by the 2 personnel (nurses) involved in the procedure prior to insertion of an indwelling urinary catheter. The time-out consisted of reviewing the insertion criteria to determine appropriateness for placement and the proper steps for insertion per hospital policy. The catheter was then inserted by one person while the second was solely responsible to assure compliance with proper aseptic technique. The procedure was stopped if aseptic technique was compromised. The indications for insertion and/or maintaining the urinary catheter are based on the HICPAC guidelines [3] and include the following:
- Acute urinary retention/obstruction
- Urologic, urethral or extensive abdominal surgical procedure
- Critically ill patient with unstable vital signs and requires close urine output monitoring (ICU patient receiving aggressive diuretic therapy, vasopressor/inotropic therapy, paralytic therapy, aggressive fluid management or titrated vasoactive medications)
- Stage 3 or 4 sacral or perineal pressure ulcer in a patient with incontinence
- End of life comfort
- Prevention of further trauma due to a difficult insertion
- Prolonged immobility due to unstable spinal fracture or pelvic fracture and inability to use bedpan.
During the implementation period, a process measure was used to evaluate the rollout. The compliance rate of returned insertion checklists versus the total number of insertions was calculated weekly and tracked over time. Although compliance was low at first, through several Plan-Do-Study-Act (PDSA) cycles conducted on a weekly basis, compliance steadily increased during the implementation period. Staff were also kept abreast of the compliance rates and progress of the project with weekly email updates and periodically in daily huddles during shift change.
Rollout Using 4Es
In parallel to the CUSP framework, the ED leadership team discretely used 6 of “The Speed of Trust” behaviors most relevant to the project to help drive the new process including get better, practice accountability, keep commitments, clarify expectations, deliver results, and create transparency. Get better was used to motivate staff to action in order to deliver the highest quality of care to our patients. Practice accountability was exercised by having the staff sign the checklist used in the new process. Deliver results was supported by the timely feedback of data to frontline staff to show whether the goal was being met. Clarifying expectations was demonstrated through feedback from weekly PDSA rapid cycles and constant reinforcement that all insertions must involve 2 personnel. Keeping commitments was established with an agreement amongst the staff and leadership to keep patients safe and deliver high quality care. Creating transparency was exemplified by explaining the initiative clearly to each patient and their family and allowing for any questions.
Outcomes Measurement
During the post-intervention period, progress was evaluated using 2 outcome measures: the insertion-related CAUTI rate and the catheter utilization ratio. National Healthcare Safety Network (NHSN) 2014 and 2015 criteria was used to identify any CAUTI [8] and for the purposes of this project, the insertion-related CAUTI rate was defined as the number of CAUTIs occurring ≤ 7 days after insertion, with the date of insertion being day 1, per 1000 catheters inserted in the ED. The utilization ratio was calculated from the number of catheters inserted per patient ED visits. The insertion-related CAUTI rates for the pre- and post-intervention periods were compared after excluding 2014 yeast CAUTIs to adjust for changes in the 2015 National Healthcare Safety Network CAUTI criteria, which removed yeast as an organism for CAUTI. The utilization ratio was also calculated and compared between pre- and post-intervention periods. All statistical analysis was done using the NHSN statistics calculator.
Results
During the pre-intervention period (April–December 2014) there were 10 infections and 1450 catheters inserted, which equates to an insertion-related CAUTI rate of 6.9/1,000 catheters. In the post-intervention period (April–December 2015), there were 2 infections and 1180 catheters placed, or an insertion-related CAUTI rate of 1.7/1000 catheters (Table 1)—a 75% decrease from the pre-intervention rate (P = 0.05).
Additionally, the utilization ratio was calculated for 2014 and 2015 based on the number of catheter insertions per total patient ED visits in each year (Table 2). In 2014 the utilization ratio was 2.2 and in 2015 the utilization ratio was 1.7, representing a 23% reduction (P < 0.01).
Following the post-intervention period, insertion-related rates and device utilization were also monitored in 2016. There were a total of 97,004 patient visits to the ED in 2016 with 1530 catheters inserted and 3 insertion-related CAUTIs attributed to the ED. The insertion-related CAUTI rate was 2.0/1000 catheters, which is statistically no different from the post-intervention period rate. The utilization ratio was 1.6, which is less than the post-intervention period (P < 0.01).
Discussion
As highlighted in the AHRQ toolkit [5], the project confirmed that using both technical and socioadaptive methodologies yielded a significant and sustainable impact on CAUTIs and utilization of indwelling urinary catheters. Prior to initiating the project, a review of the literature did not show any previous studies involving the insertion of urinary catheters by 2 licensed personnel. Since then, an acute care facility published data demonstrating a sustainable 39% reduction of CAUTI rates in an inpatient post-surgical unit within 6 months after the implementation of 2-person urinary catheter insertion [9]. The facility had also done extensive education and training on the CAUTI prevention best-practices prior to implementing the new insertion practices.
A key measure of success in regards to implementing cultural and technical changes is the sustainability of the results yielded after implementation. According to the AHRQ CAUTI toolkit, several specific strategies are necessary to successfully sustain prevention efforts. Implementing changes in the ED at our hospital in alignment with the goal of creating a culture of safety, incorporating the changes into daily work flow, employing both technical and socioadaptive interventions, empowering staff to stop the procedure if there are any concerns, and monitoring and communicating outcomes all ensure that the changes in practice will be sustained. Additionally, there is an engaged interdisciplinary CAUTI committee that continues to meet regularly as well as required yearly computer-based education for all frontline staff, and a “Safety Day” education session for all newly hired nurses where competency is assessed and validated for proper insertion and maintenance of a urinary catheter.
Initially, barriers for implementation included limited staff to ensure the presence of 2 licensed personnel for every urinary catheter insertion, lack of ability to collect checklist data in the electronic medical record and run compliance reports, and availability of the checklists at the onset of implementation. The staffing limitation seemed to work in favor of meeting the goals of the project, as staff were less likely to insert indwelling urinary catheters for inappropriate indications. In regards to the checklists, the barriers identified via the PDSA rapid cycles included inadequate locations to obtain checklists for use during insertion and drop-off locations for checklists after use. To increase availability and convenience, brightly colored folders labeled “FOLEY!” containing the checklists were placed both on the outside of the supply management stations and on the doors exiting the supply rooms where indwelling urinary catheter kits were located. Rounds were made on these folders approximately 1 to 2 times per week to be sure they remained full. In addition, more locations for dropping off completed forms were placed at all nursing stations as opposed to a single drop off location.
A limitation of the project is that there are not established metrics for infection rates in any outpatient setting nor are there established criteria to differentiate between insertion- and maintenance-related infections. While the metrics were created for the purposes of the project, they are easily reproducible within other health care facilities to track infection rates associated with outpatient areas. Additionally, by ensuring indications are met and proper insertion occurs in ED patients, the overall hospital’s CAUTI infection rate and standardized infection ratio are impacted, which are comparable across facilities. The criteria for differentiating between insertion and maintenance related infections was established in an attempt to define where the biggest vulnerabilities were with insertion versus maintenance. Days from insertion to infection were tracked for all infections, and arbitrarily a 7-day cutoff was used to consider the infection potentially insertion-related, as no evidence has been published to define this previously.
The lessons learned both during implementation of the changes in practice and the impact it can have on infection rates are valuable. Moving forward, Tampa General Hospital plans to spread dual personnel indwelling urinary catheter insertion as a best practice, first targeting inpatient units identified with the highest number of insertion-related infections as well as high device utilization ratios.
1. Magill SS, Edwards JR, Bamberg W, et al. Multistate point-prevalence survey of health care–associated infections. N Engl J Med 2014;370:1198–208.
2. Scott, RD. Center for Disease Control and Prevention. The direct medical costs of healthcare-associated infections in U.S. hospitals and the benefits of prevention. 2009. Accessed at https://www.cdc.gov/HAI/pdfs/hai/Scott_CostPaper.pdf.
3. Gould CV, Umscheid CA, Agarwal RK, et al. The Healthcare Infection Control Practices Advisory Committee (HICPAC). Guidelines for prevention of catheter-associated urinary tract infections. 2009. Accessed at http://www.cdc.gov/hicpac/pdf/CAUTI/CAUTIguideline2009final.pdf.
4. Covey SMR, Merrill RR. The speed of trust: the one thing that changes everything. New York: Free Press; 2008.
5. Florida Hospital Association Hospital Engagement Network. Update, March 2015. Florida Hospital Association, Orlando, FL. Accessed at www.fha.org/showDocument.aspx?f=2015HEN-Brief-Web.pdf.
6. Agency for Healthcare Research and Quality (AHRQ). Toolkit for reducing catheter-associated urinary tract infections in hospital units: implementation guide. 2014. Accessed at https://www.ahrq.gov/professionals/quality-patient-safety/hais/tools/cauti-hospitals/index.html.
7. Pronovost PJ, Berenholtz SM, Goeschel CA, et al. Creating high reliability in health care organizations. Health Serv Res 2006;41(4 Pt 2):1599–617.
8. Centers for Disease Control National Healthcare Safety Network. Urinary tract infection (catheter-associated urinary tract infection [CAUTI] and non-catheter-associated urinary tract infection [UTI]) and other urinary system infection [USI]) events. 2014. Accessed at https://www.cdc.gov/nhsn/pdfs/pscmanual/7psccauticurrent.pdf.
9. Belizario SM, Preventing urinary tract infections with a two-person catheter insertion procedure. Nursing 2015;45:67–9.