User login
Head banging: Cause for worry, or normal childhood development?
Most children who head bang—rhythmic movement of the head against a solid object, marked by compulsive repetitiveness1—usually are normal, healthy, well-cared-for children, in whom no cause for this activity can be determined. More common in boys than in girls, childhood head banging usually starts when the child is age 18 months, but he (she) should grow out of it by age 4.1,2 Nevertheless, you should be prepared to provide careful, targeted evaluation when presented with a child who head bangs, and discuss with parents or caregivers the possibility of a nonphysiologic cause, such as disruptions or discord in the home.
First concern: Is this normal?
Although head banging is seen in 5% to 15% of healthy children,1 children who are mentally retarded, blind, deaf, or autistic are more likely to participate in head banging.1 There also may be a familial predisposition; head banging is more frequent among cousins of children who bang their heads.1 Some studies have found that socioeconomic status, birth order, response to music, and motor development are correlated with head banging.1
Leung and colleagues1 propose that head banging is an integral part of normal development; a tension-releasing maneuver; an attention-seeking device; and a form of pain relief in response to acute illnesses. Fatigue, hunger, teething, or discomfort from a wet diaper can increase the tendency to head bang.
How does it happen?
Head banging generally occurs before sleep. The child will repeatedly bang his head—usually the frontal-parietal region—against a pillow, headboard, or railing of a crib 60 to 80 times per minute.1 This repetitive motion may continue for a few minutes or as long as an hour. While head banging, the child does not seem to experience pain or discomfort, but may appear relaxed or happy. Although this habit appears alarming (calluses, bruises, abrasions, and contusions may occur—especially in children with mental retardation)1,2, there rarely is significant head damage.
Talking to concerned parents
Head banging can be confused with typical temper tantrums, spasmus nutans (triad of pendular nystagmus, head nodding, and torticollis), and infantile myoclonic seizures (sudden dropping of the head and flexion of the arms).1 Take a detailed history and careful evaluation of the parent-child relationship to uncover any underlying causes, such as an unhappy home environment (eg, divorce or neglect). A complete physical examination may reveal an ear infection, visual problems, deafness, cerebral palsy, mental retardation, or evidence of abuse.
Psychotropic medication is not recommended. Treatment options include:1
• treating underlying abnormalities, such as otitis media
• padding the sides of the crib
• providing auditory stimulation, including allowing the child to participate in rhythmic actions during the day3
• fitting the child for a protective helmet.
Disclosure
Dr. Jain reports no financial relationship with any company whose products are mentioned in this article or with manufacturers of competing products.
1. Leung AK, Robson WL. Head banging. J Singapore Paediatr Soc. 1990;32(1-2):14-17.
2. Kravitz H, Rosenthal V, Teplitz Z, et al. A study of head-banging in infants and children. Dis Nerv Syst. 1960;21:203-208.
3. Ryan NM. Body rocking, head banging, and head rolling: an analysis of rhythmic motor activities in normal infants. Pediatr Nurs. 1983;9(4):281-285, 296.
Most children who head bang—rhythmic movement of the head against a solid object, marked by compulsive repetitiveness1—usually are normal, healthy, well-cared-for children, in whom no cause for this activity can be determined. More common in boys than in girls, childhood head banging usually starts when the child is age 18 months, but he (she) should grow out of it by age 4.1,2 Nevertheless, you should be prepared to provide careful, targeted evaluation when presented with a child who head bangs, and discuss with parents or caregivers the possibility of a nonphysiologic cause, such as disruptions or discord in the home.
First concern: Is this normal?
Although head banging is seen in 5% to 15% of healthy children,1 children who are mentally retarded, blind, deaf, or autistic are more likely to participate in head banging.1 There also may be a familial predisposition; head banging is more frequent among cousins of children who bang their heads.1 Some studies have found that socioeconomic status, birth order, response to music, and motor development are correlated with head banging.1
Leung and colleagues1 propose that head banging is an integral part of normal development; a tension-releasing maneuver; an attention-seeking device; and a form of pain relief in response to acute illnesses. Fatigue, hunger, teething, or discomfort from a wet diaper can increase the tendency to head bang.
How does it happen?
Head banging generally occurs before sleep. The child will repeatedly bang his head—usually the frontal-parietal region—against a pillow, headboard, or railing of a crib 60 to 80 times per minute.1 This repetitive motion may continue for a few minutes or as long as an hour. While head banging, the child does not seem to experience pain or discomfort, but may appear relaxed or happy. Although this habit appears alarming (calluses, bruises, abrasions, and contusions may occur—especially in children with mental retardation)1,2, there rarely is significant head damage.
Talking to concerned parents
Head banging can be confused with typical temper tantrums, spasmus nutans (triad of pendular nystagmus, head nodding, and torticollis), and infantile myoclonic seizures (sudden dropping of the head and flexion of the arms).1 Take a detailed history and careful evaluation of the parent-child relationship to uncover any underlying causes, such as an unhappy home environment (eg, divorce or neglect). A complete physical examination may reveal an ear infection, visual problems, deafness, cerebral palsy, mental retardation, or evidence of abuse.
Psychotropic medication is not recommended. Treatment options include:1
• treating underlying abnormalities, such as otitis media
• padding the sides of the crib
• providing auditory stimulation, including allowing the child to participate in rhythmic actions during the day3
• fitting the child for a protective helmet.
Disclosure
Dr. Jain reports no financial relationship with any company whose products are mentioned in this article or with manufacturers of competing products.
1. Leung AK, Robson WL. Head banging. J Singapore Paediatr Soc. 1990;32(1-2):14-17.
2. Kravitz H, Rosenthal V, Teplitz Z, et al. A study of head-banging in infants and children. Dis Nerv Syst. 1960;21:203-208.
3. Ryan NM. Body rocking, head banging, and head rolling: an analysis of rhythmic motor activities in normal infants. Pediatr Nurs. 1983;9(4):281-285, 296.
Sleep disturbances in cancer patients: Underrecognized and undertreated
Many cancer patients don't sleep well, for a variety of reasons. It is an important problem: not only does poor sleep worsen quality of life, it may affect prognosis. Moreover, treatment is available.
Yet many physicians caring for cancer patients do not ask about sleep problems, underestimating their impact or focusing on more urgent problems. Also, patients may not want to bring up the topic because they consider poor sleep to be unavoidable and untreatable and because they fear that reporting it may shift the focus of their treatment from trying to cure the cancer to easing its symptoms.
This practical review will help health care professionals avoid the common barriers to diagnosis and treatment of poor sleep in cancer patients. Because there are few data on other sleep disorders such as sleep apnea and restless leg syndrome, we will focus on the most common one in cancer patients—insomnia—and its effects on other symptoms and quality of life.
MORE PATIENTS SURVIVE CANCER NOW
Today, more patients are surviving cancer, but cancer symptoms and the side effects of surgery, chemotherapy, and radiation therapy may persist for years.1,2 The most common complaints include cancer-related fatigue, leg restlessness, anxiety, insomnia, and excessive sleepiness.3
Sleep disturbances appear to contribute to the other problems and are relatively easier to quantify. Most studies of sleep disorders in cancer patients have looked specifically at insomnia,4 although a few have explored the prevalence of other sleep disorders, such as sleep-disordered breathing and limb movements during sleep.5
The International Classification of Sleep Disorders, 2nd edition,6 defines insomnia as difficulty going to sleep or staying asleep (the latter defined as waking up in the middle of the night, with wakeful episodes lasting more than 30 minutes), early-morning awakenings (waking 30 minutes or more before the intended time), or nonrestorative sleep, causing significant distress or impairment of day-time functioning.
INSOMNIA WORSENS QUALITY OF LIFE
Insomnia significantly worsens quality of life in cancer patients, and if it can be detected and effectively treated, quality of life is likely to improve. Studies in cancer patients have found that those with insomnia:
- Were less able to cope with stress and carry on their activities of daily living3
- Were much less able to function and reported more pain, less energy, and greater difficulty in dealing with emotional problems7
- Had poor quality of life, both physically and emotionally.3,8
PERHAPS MORE THAN HALF OF CANCER PATIENTS HAVE INSOMNIA
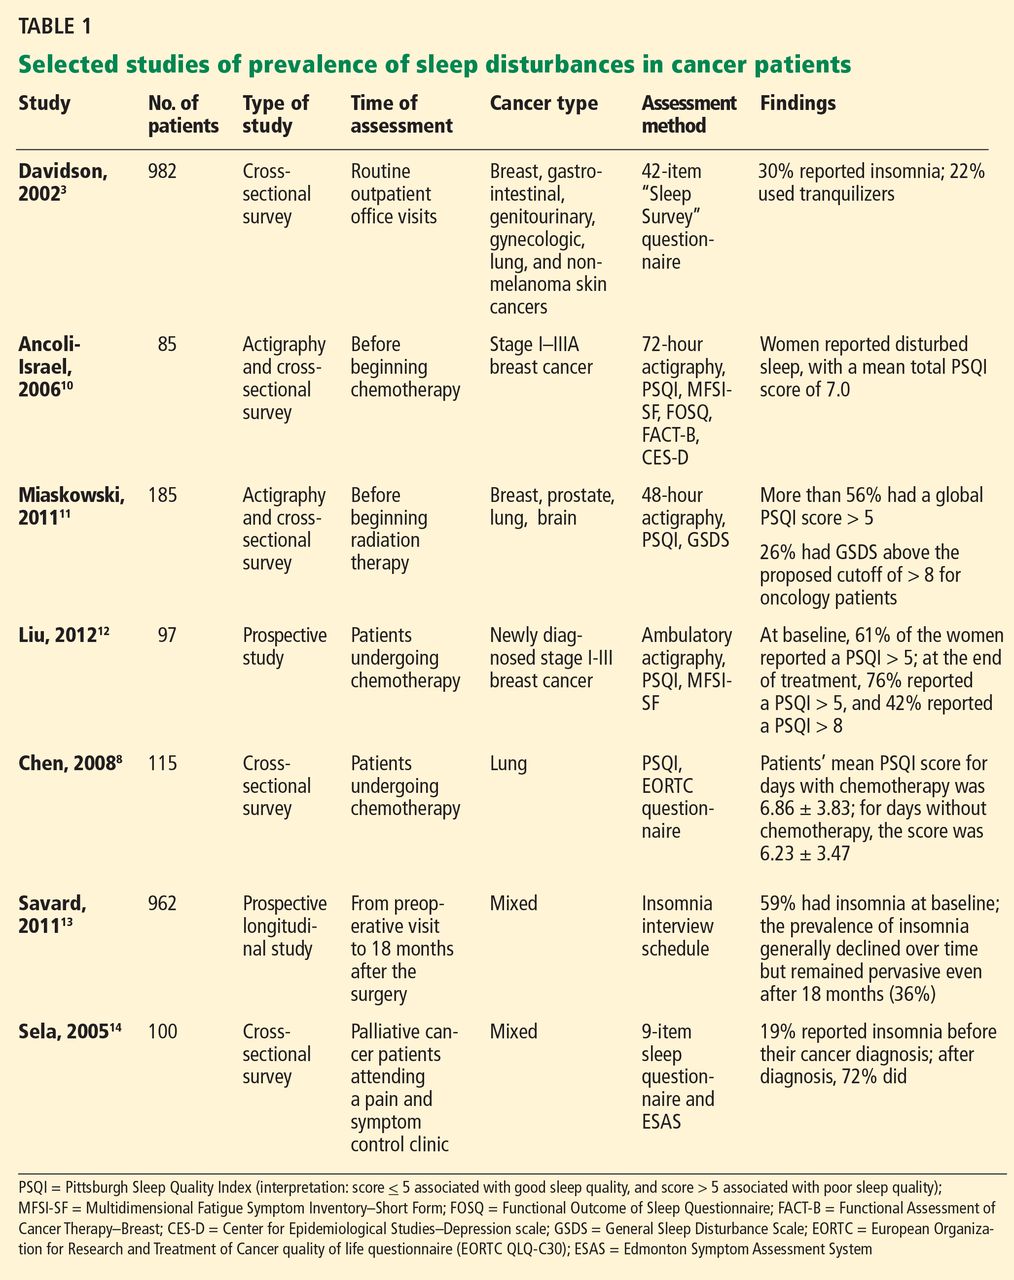
Depending on the methods used and populations studied, at least 30% and perhaps more than half of patients with cancer have insomnia (Table 1).3,4,8–14 It is one of the most commonly reported complaints in this group,15–17 and it occurs before, during, and after treatment of cancer.
Although the prevalence may differ in various cancers, it is still higher than in the general population. In a study of about 450 patients with cancer or depression and 300 healthy volunteers, 62% of the cancer patients reported moderate to severe sleep disturbance, compared with 52% of the depressed patients and 30% of the healthy volunteers.18
When Davidson et al3 surveyed nearly 1,000 cancer patients, one-third said they had insomnia. The problem was most prevalent in lung and breast cancer patients.
In a longitudinal study by Savard et al,13 the prevalence of insomnia declined over time but remained high even at the end of 18 months. It was more prevalent in patients with gynecologic and breast cancer than in those with prostate cancer.13,19
SLEEP PROBLEMS ARE UNDERREPORTED
Sleep problems in cancer patients often go unrecognized because patients do not report them. In a survey of 150 patients,20 44% reported having had sleep problems during the preceding month. However, only one-third of those with sleep problems told their health care providers. This highlights the need for physicians to address sleep complaints in cancer patients at every visit and, if needed, to refer them to a sleep specialist for further evaluation and management.
INSOMNIA IS OFTEN ASSOCIATED WITH OTHER PROBLEMS
Many things can interfere with sleep in cancer patients: the cancer itself (eg, pain due to tumor invasion), medical treatments (eg, narcotics, chemotherapy, neuroleptics, sympathomimetics, steroids, sedative hypnotics), psychosocial disturbances (eg, depression, anxiety, stress), and comorbid medical issues.
In this population, insomnia is often part of a cluster of symptoms that includes pain, fatigue, depression, and anxiety. These act synergistically, worsening quality of life.21–24
Cancer-related fatigue and insomnia
Cancer-related fatigue is a distressing, persistent, subjective sense of tiredness or exhaustion that is related to cancer or cancer treatment, that is not proportional to recent activity and that interferes with usual functioning.25 It has been reported by up to 90% of cancer patients in some studies.26–28
Cancer-related fatigue worsens quality of life and is one of the most distressing and persistent symptoms experienced before, during, and after cancer treatment.29,30 Furthermore, it can lead to sleep disturbances and daytime somnolence and further aggravate insomnia.31,32 The two conditions are often reported as part of a cluster of interrelated symptoms that include pain, depression, and loss of concentration and other cognitive functions, suggesting that they may share a common etiology.33–35
Åhsberg et al36 examined different aspects of perceived cancer-related fatigue in patients undergoing radiotherapy and found correlations between lack of energy, sleepiness, and cancer-related fatigue.
Current understanding of the possible link between cancer-related fatigue and insomnia suggests that interventions targeting the insomnia and daytime sleepiness could decrease the fatigue as well.31
Pain and insomnia in cancer patients
Pain is reported by 60% to 90% of patients with advanced cancer,37,38 its intensity usually varying with the extent of disease. Too often, it is inadequately controlled.39 Furthermore, it is thought to contribute to insomnia.40
In a study of more than 1,600 cancer patients, nearly 60% reported insomnia in addition to pain.41 The severity of pain directly correlated with the probability of insomnia.
Conversely, research suggests that sleep disturbances, primarily insomnia, can increase cancer patients’ sensitivity to pain.42 One hypothesis is that adequate sleep is needed to promote processes relevant to recovery from pain, both physiologic (ie, tissue repair) and psychological (ie, transient cessation of the perception of pain signals).43
Paradoxically, opioids can worsen insomnia
Cancer pain is often treated with opioids, which, paradoxically, can cause or worsen insomnia.
Although opioids induce sleep, they also depress respiration, and at night, they can cause or worsen sleep-disordered breathing (obstructive or central sleep apnea or ataxic breathing), leading to episodes of hypoxia, arousals, and fragmented sleep.44 Moreover, opioids can lead to daytime sedation. Further, psychostimulants such as methylphenidate, given to counteract opioid-induced sedation, can cause anxiety and insomnia. Thus, the interaction between cancer-related pain, insomnia, and pain management leads to a vicious cycle. Understanding this process, we can try to break the cycle and help patients with cancer sleep better.
However, how best to treat sleep-disordered breathing in patients taking opioids long-term is not well established.
In general, the primary intervention is to reduce the opioid dose. Practitioners should continually assess the need for these drugs and consider referral to a drug-behavior treatment center to help with discontinuation of opioid use when deemed medically appropriate.45 Other strategies include positive airway pressure ventilation including continuous positive airway pressure, bilevel pressure devices with backup rate, or adaptive servoventilators. In some cases oxygen supplementation may be required.
Sleep-disordered breathing, when recognized and diagnosed, should be managed in partnership with a sleep specialist.
Depression and insomnia in cancer patients
By some estimates, up to half of cancer patients suffer from depression at some point in their illness.28 And not without reason: these patients face uncertainty about their life, and this often results in depression or anxiety.46
Many cancer patients with depression also have insomnia.28 Indeed, patients with persistent insomnia are at greater risk of developing psychological disorders such as depression and anxiety.47
In a survey of cancer patients, insomnia symptoms were more often attributed to thoughts or concerns about health, family, friends, the cancer diagnosis, and finances than to the actual physical effects of cancer.48
CANCER TREATMENT AND INSOMNIA
Many cancer patients experience sleep disturbances even before starting treatment.49 Liu et al50 showed that, in 76 women about to undergo chemotherapy for breast cancer, those who already had sleep disturbances, fatigue, and depression had more problems, and more severe problems, during chemotherapy.
Radiation therapy and chemotherapy have been reported to cause or precipitate insomnia (Table 2).8,13
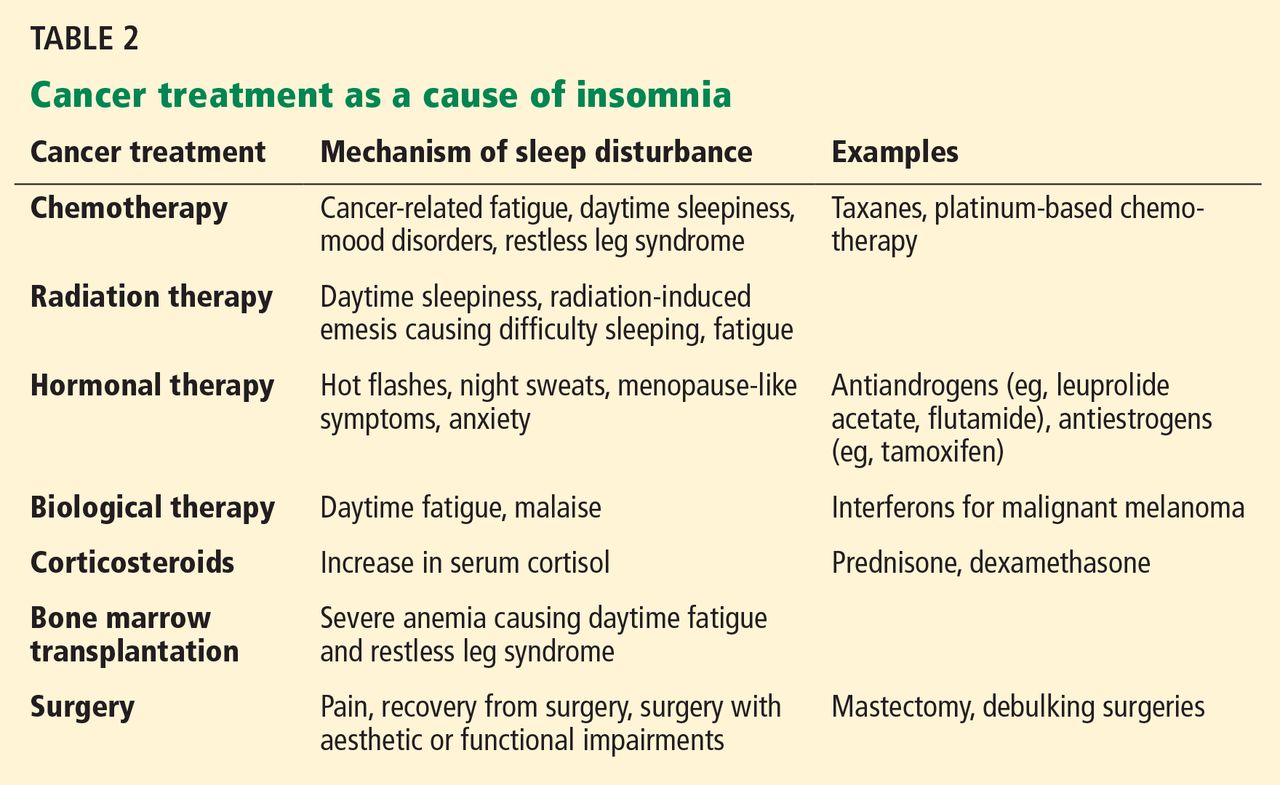
Hormonal therapy and biological therapy can also cause or worsen preexisting insomnia.51,52 For example, androgen deprivation therapy for prostate cancer and hormonal therapy for breast cancer are often associated with sleep problems.49,50 Possible mechanisms of insomnia include hot flashes, night sweats, and anxiety caused by such treatments. Biological agents such as interferons, interleukins, and tumor necrosis factor (TNF) alpha, which are often used to treat malignant melanoma, can affect the sleep-wake cycle, leading to insomnia.53
Corticosteroids sharply raise serum cortisol levels, which can lead to insomnia. Cancer patients receiving dexamethasone to prevent radiation-induced emesis experienced more insomnia than patients who did not receive dexamethasone.54
IMMUNOLOGIC BASIS OF INSOMNIA IN CANCER PATIENTS
Cancer cells produce inflammatory cytokines such as interleukin 1 (IL-1), interleukin 6 (IL-6), and TNF alpha, and inflammation plays a role in tumor progression and possibly tumorigenesis.55
Specific cytokines also help regulate the sleep-wake cycle. Levels of IL-6 and TNF alpha peak during sleep, and daytime IL-6 levels are inversely related to the amount of nocturnal sleep.56 Vgontzas et al57 showed that although mean levels of 24-hour IL-6 and TNF alpha secretion were not significantly different in patients with insomnia vs healthy controls, chronic insomnia was associated with a shift in IL-6 and TNF alpha secretion from nighttime to daytime.57
Cancer and its treatment can affect secretion of the cytokines that play a role in the sleep-wake cycle. Thus, the sleep disturbances associated with cancer may also be related to the abnormalities in cytokine levels caused by either cancer or its treatment.
Mills et al58 found that inflammatory markers such as vascular endothelial growth factor and soluble intercellular adhesion molecule-1 were significantly elevated during chemotherapy in breast cancer patients, and the elevated vascular endothelial growth factor levels were associated with poorer sleep during treatment.
Further research is warranted to establish causality, to help us understand the mechanisms of insomnia and other cancer symptoms, and to develop new treatments for these complaints.
POOR SLEEP AND CANCER RISK AND OUTCOMES
Sleep disturbances have negative health consequences in cancer. Their impact ranges from plausible carcinogenesis to affecting the course of the disease and cancer survival.
Poor sleep and risk of cancer
Epidemiologic studies have examined a possible link between circadian rhythm disruption and breast cancer risk, using both direct measures such as melatonin levels and indirect measures such as sleep duration and shift work. (Melatonin production is related to sleep duration, and night-shift work leads to disruption of sleep pattern and quality of sleep, thus lowering melatonin levels.59)
The findings were mixed. Breast cancer risk was significantly and inversely associated with urinary melatonin levels (6-sulfatoxymelatonin) in the Nurses’ Health Study II,60 but not in the Guernsey III study in the United Kingdom.61 Breast cancer risk was significantly lower with longer sleep duration in Finnish women62 and in Chinese women in Singapore,63 but not in American women.64,65 Results of three cohort studies66–68 and two case-control studies69,70 suggested a higher breast cancer risk in women who work evening or overnight shifts. Shorter sleep duration was associated with a higher risk of colorectal adenomas.71
These studies make a strong case for an association of cancer with circadian rhythm disruption and shorter sleep duration, possibly from an effect on melatonin levels. However, one should be cautious in interpreting epidemiologic studies: although they show sleep disturbances to be associated with cancer risk, they do not establish causality.
Insomnia and cancer outcomes
Evidence is growing that sleep disturbances may affect compliance with treatment, immune function, and outcomes—including survival—in cancer patients.23,24
In patients newly diagnosed with various types of cancer, Degner and Sloan72 showed that those who suffered from insomnia, nausea, poor appetite, and pain had a lower survival rate at 5 years, independent of the cancer stage. However, no separate analyses were performed to examine the specific influence of insomnia on cancer survival.
Thompson and Li73 analyzed data from 101 breast cancer patients with available Oncotype DX recurrence scores (a proprietary genetic test performed on tumor tissue that predicts the likelihood of recurrence). The scores were strongly correlated with average hours of sleep per night before breast cancer diagnosis, with fewer hours of sleep associated with a higher (worse) score.
Since these studies were retrospective and merely suggest associations, prospective studies, using more standardized questionnaires and objective measures, are needed to establish causality and to further our understanding of the mechanisms involved.
HELPING CANCER PATIENTS SLEEP BETTER
Insomnia is generally diagnosed with a thorough history that includes sleep, medical issues, substance use, and psychiatric issues. The sleep history should include specific insomniarelated complaints, presleep conditions and habits, sleep-wake habits, other sleep-related symptoms, and daytime consequences. To obtain the information, one can use questionnaires, sleep logs, psychological screening tests, and bed-partner interviews.74
Managing insomnia involves both pharmacologic and nonpharmacologic treatment. It is also important to treat the associated disorders such as depression and anxiety disorders that often accompany insomnia. Long-term management of cancer patients should not be limited to surveillance of cancer but should also involve aggressive treatment of clusters of symptoms such as insomnia, cancer-related fatigue, and pain to yield better long-term quality of life.75–77
Nonpharmacologic treatment: Cognitive-behavioral therapy
Nonpharmacologic interventions use psychological and behavioral therapies. The American Academy of Sleep Medicine guidelines recommend cognitive behavioral therapy for all patients with insomnia, either alone or in combination with hypnotic medications.
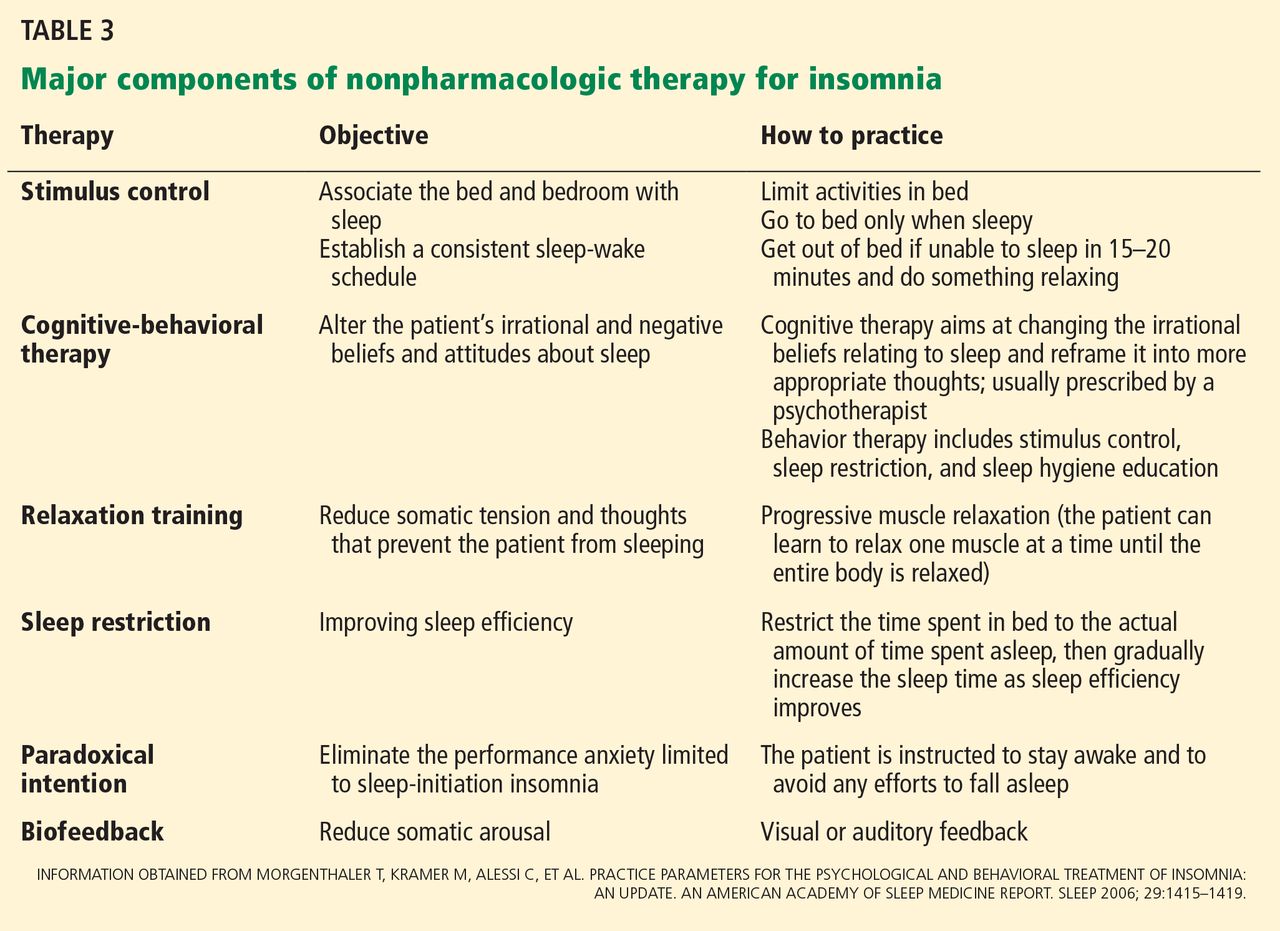
Cognitive-behavioral therapy for insomnia includes various components that help the patient learn coping skills and ways to prevent or mitigate the severity of future episodes (Table 3). Various randomized controlled trials found it to be effective for treating insomnia in the general population.77–79
Several studies found that cognitive-behavioral therapy for insomnia was effective in cancer patients, not only improving sleep quality but also decreasing psychological distress, resulting in better overall quality of life.80,81
Savard et al81 conducted a randomized controlled trial of cognitive-behavioral therapy for insomnia in 57 patients with breast cancer, examining subjective and objective sleep measures, psychological functioning, quality of life, and immunologic responses. They found significant improvements in sleep efficiency, mood, quality of life, depression, anxiety, and need for sleep medications. Improvements in subjective sleep measures persisted on 12-month follow-up.
Berger et al,82 in another randomized controlled trial, assessed behavioral therapy using stimulus control, modified sleep restriction, relaxation therapy, and sleep hygiene in breast cancer patients receiving adjuvant chemotherapy. Behavioral therapy improved sleep quality over time, as measured by the Pittsburgh Sleep Quality Index.
Espie et al83 evaluated the effect of cognitive-behavioral therapy on prostate, colorectal, gynecologic, and breast cancer patients, with similar results.83
Cognitive-behavioral therapy is at least as effective as drug therapy for insomnia in the general population. In the limited studies done in cancer patients, it has been shown to be effective irrespective of the type of cancer and is associated with better long-term outcomes. It diminishes the distress associated with early insomnia, can reduce anxiety, and can promote sleep.
A National Institutes of Health conference on insomnia concluded that cognitivebehavioral therapy is at least as effective as medications for brief treatment of chronic insomnia and that its beneficial effects, in contrast to those produced by medications, may last beyond the termination of treatment.84
It is important to think about numerous factors when considering options such as cognitive-behavioral therapy, as patients with cancer have different complications that may affect sleep quality, such as cancer-related fatigue, cancer-related depression, psychological reactions to the disease, side effects of treatment, and cancer-related pain. These need to be addressed as well.
If cognitive-behavioral therapy is not available, self-help interventions (eg, written material, videos, television and Internet resources) can be used. These have several advantages over professionally administered interventions, including greater accessibility, less burden for the patient, and lower cost. Research is under way evaluating this approach in cancer patients.85
Drug therapy
The focus of therapy should be to treat underlying disorders that may be causing or contributing to insomnia. However, a substantial number of patients may need to be assessed for pharmacotherapy for insomnia.
Sleep problems in the general population are commonly treated with drugs, and most of the recommendations in cancer patients are based on experience in the general population. However, sleep medications should be used cautiously in cancer patients, since to our knowledge there have been no studies of these agents in patients with cancer.
Side effects also need to be considered. For example, sleep medications can profoundly worsen cancer-related fatigue.
Hypnotics are often prescribed for cancer patients.86,87 A study in five major oncology centers showed that about half of the 1,500 patients were prescribed at least one psychotropic drug.86 In this study, hypnotics were the most frequently prescribed drugs, accounting for 48% of total prescriptions, and 44% of the psychotropic prescriptions were written for sleep.
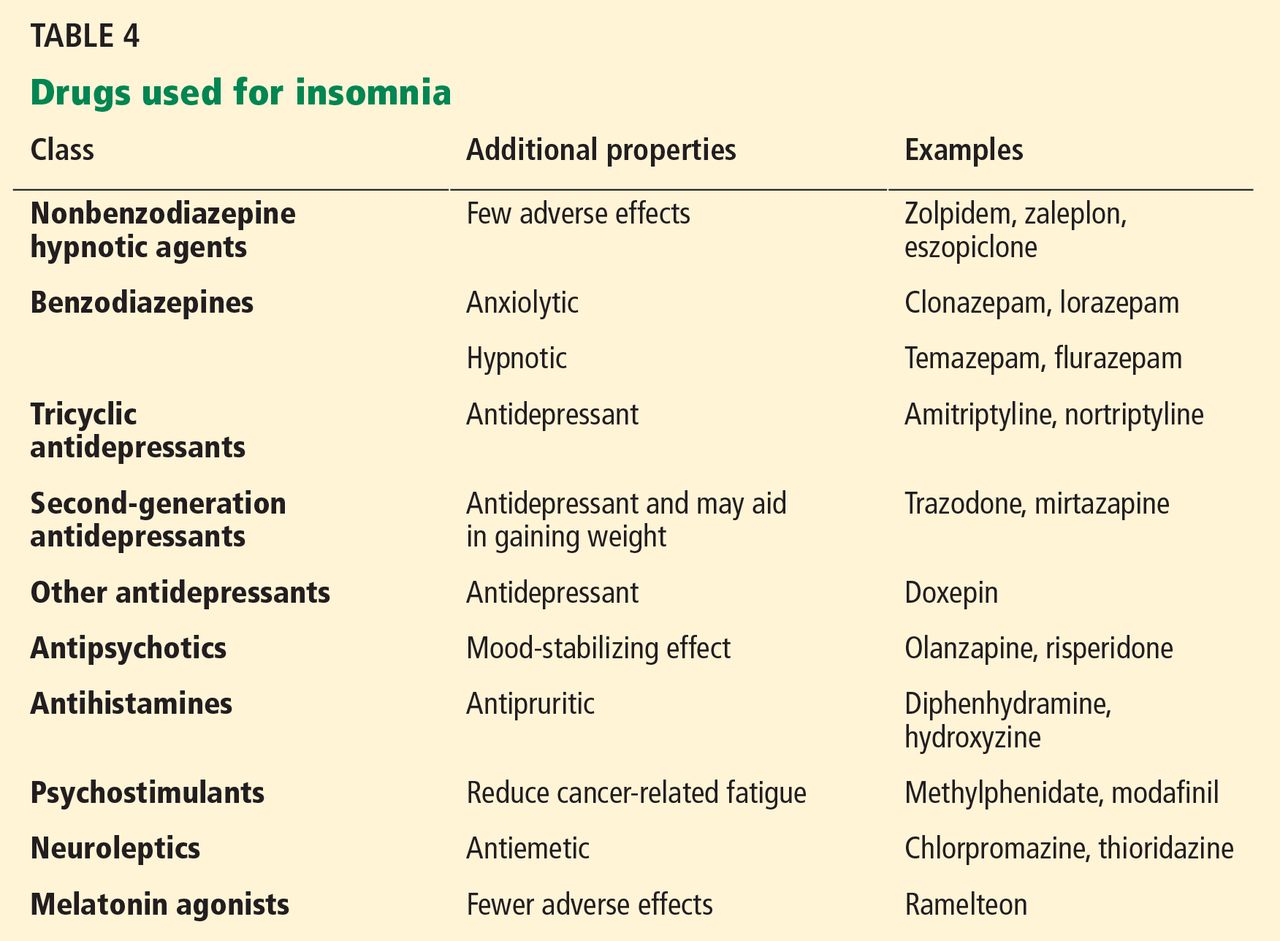
Benzodiazepine receptor agonists such as zaleplon, zolpidem, and eszopiclone can be used for problems with falling asleep and staying asleep.88,89 They are better tolerated than older, long-acting benzodiazepines,90 which can cause alterations in sleep-cycle architecture or rebound insomnia. The earlier agents can also cause adverse effects such as tolerance, drowsiness, and cognitive impairment.
A National Institutes of Health conference stated that benzodiazepine receptor agonists are efficacious in the short-term management of insomnia and that their adverse effects are much less frequent and severe than those of the benzodiazepines or other sedating drugs.84 It also stated that all antidepressants, antihistamines (H1 receptor antagonists), and anti-psychotics have potentially significant adverse effects that raise concerns about their risk-to-benefit ratio and their suitability as treatment for chronic insomnia.
Benzodiazepines are commonly prescribed for insomnia. They increase sleep efficiency, decrease arousals, and increase stage 2 sleep.
Melatonin receptor agonists have been approved by the US Food and Drug Administration for treating insomnia. A recent meta-analysis of eight studies in healthy patients showed improvements in subjective and objective sleep outcomes with the use of ramelteon.91 The dosages primarily used were 4 to 32 mg. However, most of the studies used a dosage of 4 to 8 mg.
Antidepressants. Some of the antidepressants are also used for insomnia, but they can cause daytime fatigue.
Mirtazapine was shown to be effective for insomnia and coexistent mood disorder in cancer patients, but larger trials are needed.92
A recent clinical trial with secondary data analyses evaluated the effect of paroxetine on insomnia, depression, and fatigue in patients with cancer. Paroxetine significantly reduced insomnia in both depressed and nondepressed patients after 2 to 3 weeks of treatment.93
Table 4 summarizes classes of drugs used for insomnia and their additional therapeutic properties.
- Ness KK, Wall MM, Oakes JM, Robison LL, Gurney JG. Physical performance limitations and participation restrictions among cancer survivors: a population-based study. Ann Epidemiol 2006; 16:197–205.
- Deimling GT, Bowman KF, Sterns S, Wagner LJ, Kahana B. Cancer-related health worries and psychological distress among older adult, long-term cancer survivors. Psychooncology 2006; 15:306–320.
- Davidson JR, MacLean AW, Brundage MD, Schulze K. Sleep disturbance in cancer patients. Soc Sci Med 2002; 54:1309–1321.
- Savard J, Morin CM. Insomnia in the context of cancer: a review of a neglected problem. J Clin Oncol 2001; 19:895–908.
- Payne RJ, Hier MP, Kost KM, et al. High prevalence of obstructive sleep apnea among patients with head and neck cancer. J Otolaryngol 2005; 34:304–311.
- American Academy of Sleep Medicine. International Classification of Sleep Disorders—Second Edition (ICSD-2); 2005.
- Fortner BV, Stepanski EJ, Wang SC, Kasprowicz S, Durrence HH. Sleep and quality of life in breast cancer patients. J Pain Symptom Manage 2002; 24:471–480.
- Chen ML, Yu CT, Yang CH. Sleep disturbances and quality of life in lung cancer patients undergoing chemotherapy. Lung Cancer 2008; 62:391–400.
- Liu L, Ancoli-Israel S. Sleep disturbances in cancer. Psychiatr Ann 2008; 38:627–634.
- Ancoli-Israel S, Liu L, Marler MR, et al. Fatigue, sleep, and circadian rhythms prior to chemotherapy for breast cancer. Support Care Cancer 2006; 14:201–209.
- Miaskowski C, Lee K, Dunn L, et al. Sleep-wake circadian activity rhythm parameters and fatigue in oncology patients before the initiation of radiation therapy. Cancer Nurs 2011; 34:255–268.
- Liu L, Rissling M, Natarajan L, et al. The longitudinal relationship between fatigue and sleep in breast cancer patients undergoing chemotherapy. Sleep 2012; 35:237–245.
- Savard J, Ivers H, Villa J, Caplette-Gingras A, Morin CM. Natural course of insomnia comorbid with cancer: an 18-month longitudinal study. J Clin Oncol 2011; 29:3580–3586.
- Sela RA, Watanabe S, Nekolaichuk CL. Sleep disturbances in palliative cancer patients attending a pain and symptom control clinic. Palliat Support Care 2005; 3:23–31.
- Mao JJ, Armstrong K, Bowman MA, Xie SX, Kadakia R, Farrar JT. Symptom burden among cancer survivors: impact of age and comorbidity. J Am Board Fam Med 2007; 20:434–443.
- Schroevers MJ, Ranchor AV, Sanderman R. The role of age at the onset of cancer in relation to survivors’ long-term adjustment: a controlled comparison over an eight-year period. Psychooncology 2004; 13:740–752.
- Stein KD, Syrjala KL, Andrykowski MA. Physical and psychological long-term and late effects of cancer. Cancer 2008; 112(suppl 11):2577–2592.
- Anderson KO, Getto CJ, Mendoza TR, et al. Fatigue and sleep disturbance in patients with cancer, patients with clinical depression, and community-dwelling adults. J Pain Symptom Manage 2003; 25:307–318.
- Savard J, Villa J, Ivers H, Simard S, Morin CM. Prevalence, natural course, and risk factors of insomnia comorbid with cancer over a 2-month period. J Clin Oncol 2009; 27:5233–5239.
- Engstrom CA, Strohl RA, Rose L, Lewandowski L, Stefanek ME. Sleep alterations in cancer patients. Cancer Nurs 1999; 22:143–148.
- Hoffman A, Given BA, von Eye A, Given CW, Gift AG. A study on the relationship between fatigue, pain, insomnia, and gender in persons with lung cancer. Oncol Nurs Forum 2006; 33:404.
- Hoffman AJ, Given BA, von Eye A, Gift AG, Given CW. Relationships among pain, fatigue, insomnia, and gender in persons with lung cancer. Oncol Nurs Forum 2007; 34:785–792.
- Shapiro SL, Bootzin RR, Figueredo AJ, Lopez AM, Schwartz GE. The efficacy of mindfulness-based stress reduction in the treatment of disturbance in women with breast cancer: an exploratory study. J Psychosom Res 2003; 54:85–91.
- Shapiro SL, Lopez AM, Schwartz GE, et al. Quality of life and breast cancer: relationship to psychosocial variables. J Clin Psychol 2001; 57:501–519.
- Mock V, Atkinson A, Barsevick A, et al; National Comprehensive Cancer Network. NCCN practice guidelines for cancer-related fatigue. Oncology (Williston Park) 2000; 14:151–161.
- Cella D, Davis K, Breitbart W, Curt G;Fatigue Coalition. Cancer-related fatigue: prevalence of proposed diagnostic criteria in a United States sample of cancer survivors. J Clin Oncol 2001; 19:3385–3391.
- Sateia MJ, Lang BJ. Sleep and cancer: recent developments. Curr Oncol Rep 2008; 10:309–318.
- Ahluwalia M. Fatigue, pain, and depression among older adults with cancer: still underrecognized and undertreated. Geriatrics and Aging 2008; 11:495–501.
- Enderlin CA, Coleman EA, Cole C, Richards KC, Hutchins LF, Sherman AC. Sleep across chemotherapy treatment: a growing concern for women older than 50 with breast cancer. Oncol Nurs Forum 2010; 37:461–A3.
- Winningham ML, Nail LM, Burke MB, et al. Fatigue and the cancer experience: the state of the knowledge. Oncol Nurs Forum 1994; 21:23–36.
- Berger AM, Mitchell SA. Modifying cancer-related fatigue by optimizing sleep quality. J Natl Compr Canc Netw 2008; 6:3–13.
- Anderson KO, Getto CJ, Mendoza TR, et al. Fatigue and sleep disturbance in patients with cancer, patients with clinical depression, and community-dwelling adults. J Pain Symptom Manage 2003; 25:307–318.
- Armstrong TS, Cohen MZ, Eriksen LR, Hickey JV. Symptom clusters in oncology patients and implications for symptom research in people with primary brain tumors. J Nurs Scholarsh 2004; 36:197–206.
- Dodd MJ, Miaskowski C, Lee KA. Occurrence of symptom clusters. J Natl Cancer Inst Monogr 2004;76–78.
- Paice JA. Assessment of symptom clusters in people with cancer. J Natl Cancer Inst Monogr 2004;98–102.
- Åhsberg E, Fürst CJ. Dimensions of fatigue during radiotherapy—an application of the Swedish Occupational Fatigue Inventory (SOFI) on cancer patients. Acta Oncol 2001; 40:37–43.
- Foley KM. The treatment of cancer pain. N Engl J Med 1985; 313:84–95.
- Twycross RG, Fairfield S. Pain in far-advanced cancer. Pain 1982; 14:303–310.
- Cleeland CS, Gonin R, Hatfield AK, et al. Pain and its treatment in outpatients with metastatic cancer. N Engl J Med 1994; 330:592–596.
- Fleming L, Gillespie S, Espie CA. The development and impact of insomnia on cancer survivors: Psychooncology 2010; 19:991–996.
- Grond S, Zech D, Diefenbach C, Bischoff A. Prevalence and pattern of symptoms in patients with cancer pain: a prospective evaluation of 1635 cancer patients referred to a pain clinic. J Pain Symptom Manage 1994; 9:372–382.
- Smith MT, Haythornthwaite JA. How do sleep disturbance and chronic pain inter-relate? Insights from the longitudinal and cognitive-behavioral clinical trials literature. Sleep Med Rev 2004; 8:119–132.
- Lewin DS, Dahl RE. Importance of sleep in the management of pediatric pain. J Dev Behav Pediatr 1999; 20:244–252.
- Yue HJ, Guilleminault C. Opioid medication and sleep-disordered breathing. Med Clin North Am 2010; 94:435–446.
- Teichtahl H, Wang D. Sleep-disordered breathing with chronic opioid use. Expert Opin Drug Saf 2007; 6:641–649.
- Ancoli-Israel S, Moore PJ, Jones V. The relationship between fatigue and sleep in cancer patients: a review. Eur J Cancer Care (Engl) 2001; 10:245–255.
- Perlis ML, Giles DE, Buysse DJ, Tu X, Kupfer DJ. Self-reported sleep disturbance as a prodromal symptom in recurrent depression. J Affect Disord 1997; 42:209–212.
- Stone P, Hardy J, Broadley K, Tookman AJ, Kurowska A, A’Hern R. Fatigue in advanced cancer: a prospective controlled cross-sectional study. Br J Cancer 1999; 79:1479–1486.
- Cimprich B. Pretreatment symptom distress in women newly diagnosed with breast cancer. Cancer Nurs 1999; 22:185–194.
- Liu L, Fiorentino L, Natarajan L, et al. Pre-treatment symptom cluster in breast cancer patients is associated with worse sleep, fatigue and depression during chemotherapy. Psychooncology 2009; 18:187–194.
- Savard J, Hervouet S, Ivers H. Prostate cancer treatments and their side effects are associated with increased insomnia. Psychooncology 2013; 22:1381–1388.
- Fenlon DR, Corner JL, Haviland J. Menopausal hot flushes after breast cancer. Eur J Cancer Care (Engl) 2009; 18:140–148.
- Miller AH, Ancoli-Israel S, Bower JE, Capuron L, Irwin MR. Neuroendocrine-immune mechanisms of behavioral comorbidities in patients with cancer. J Clin Oncol 2008; 26:971–982.
- Kirkbride P, Bezjak A, Pater J, et al. Dexamethasone for the prophylaxis of radiation-induced emesis: a National Cancer Institute of Canada Clinical Trials Group phase III study. J Clin Oncol 2000; 18:1960–1966.
- Coussens LM, Werb Z. Inflammation and cancer. Nature 2002; 420:860–867.
- Vgontzas AN, Chrousos GP. Sleep, the hypothalamic-pituitary-adrenal axis, and cytokines: multiple interactions and disturbances in sleep disorders. Endocrinol Metab Clin North Am 2002; 31:15–36.
- Vgontzas AN, Zoumakis M, Papanicolaou DA, et al. Chronic insomnia is associated with a shift of interleukin-6 and tumor necrosis factor secretion from nighttime to daytime. Metabolism 2002; 51:887–892.
- Mills PJ, Parker B, Jones V, et al. The effects of standard anthracycline-based chemotherapy on soluble ICAM-1 and vascular endothelial growth factor levels in breast cancer. Clin Cancer Res 2004; 10:4998–5003.
- Reiter RJ, Tan DX, Korkmaz A, et al. Light at night, chronodisruption, melatonin suppression, and cancer risk: a review. Crit Rev Oncog 2007; 13:303–328.
- Schernhammer ES, Hankinson SE. Urinary melatonin levels and breast cancer risk. J Natl Cancer Inst 2005; 97:1084–1087.
- Travis RC, Allen DS, Fentiman IS, Key TJ. Melatonin and breast cancer: a prospective study. J Natl Cancer Inst 2004; 96:475–482.
- Verkasalo PK, Lillberg K, Stevens RG, et al. Sleep duration and breast cancer: a prospective cohort study. Cancer Res 2005; 65:9595–9600.
- Wu AH, Wang R, Koh WP, Stanczyk FZ, Lee HP, Yu MC. Sleep duration, melatonin and breast cancer among Chinese women in Singapore. Carcinogenesis 2008; 29:1244–1248.
- McElroy JA, Newcomb PA, Titus-Ernstoff L, Trentham-Dietz A, Hampton JM, Egan KM. Duration of sleep and breast cancer risk in a large population-based case-control study. J Sleep Res 2006; 15:241–249.
- Pinheiro SP, Schernhammer ES, Tworoger SS, Michels KB. A prospective study on habitual duration of sleep and incidence of breast cancer in a large cohort of women. Cancer Res 2006; 66:5521–5525.
- Lie JA, Roessink J, Kjaerheim K. Breast cancer and night work among Norwegian nurses. Cancer Causes Control 2006; 17:39–44.
- Schernhammer ES, Kroenke CH, Laden F, Hankinson SE. Night work and risk of breast cancer. Epidemiology 2006; 17:108–111.
- Schernhammer ES, Laden F, Speizer FE, et al. Rotating night shifts and risk of breast cancer in women participating in the Nurses’ Health Study. J Natl Cancer Inst 2001; 93:1563–1568.
- Davis S, Mirick DK, Stevens RG. Night shift work, light at night, and risk of breast cancer. J Natl Cancer Inst 2001; 93:1557–1562.
- Hansen J. Light at night, shiftwork, and breast cancer risk. J Natl Cancer Inst 2001; 93:1513–1515.
- Thompson CL, Larkin EK, Patel S, Berger NA, Redline S, Li L. Short duration of sleep increases risk of colorectal adenoma. Cancer 2011; 117:841–847.
- Degner LF, Sloan JA. Symptom distress in newly diagnosed ambulatory cancer patients and as a predictor of survival in lung cancer. J Pain Symptom Manage 1995; 10:423–431.
- Thompson CL, Li L. Association of sleep duration and breast cancer OncotypeDX recurrence score. Breast Cancer Res Treat 2012; 134:1291–1295.
- Schutte-Rodin S, Broch L, Buysse D, Dorsey C, Sateia M. Clinical guideline for the evaluation and management of chronic insomnia in adults. J Clin Sleep Med 2008; 4:487–504.
- Fan HG, Houédé-Tchen N, Yi QL, et al. Fatigue, menopausal symptoms, and cognitive function in women after adjuvant chemotherapy for breast cancer: 1- and 2-year follow-up of a prospective controlled study. J Clin Oncol 2005; 23:8025–8032.
- Ganz PA. Late effects of cancer and its treatment. Semin Oncol Nurs 2001; 17:241–248.
- Lee TS, Kilbreath SL, Refshauge KM, Pendlebury SC, Beith JM, Lee MJ. Quality of life of women treated with radiotherapy for breast cancer. Support Care Cancer 2008; 16:399–405.
- National Institutes of Health. National Institutes of Health state of the science conference statement on manifestations and management of chronic insomnia in adults, June 13–15, 2005. Sleep 2005; 28:1049–1057.
- Smith MT, Huang MI, Manber R. Cognitive behavior therapy for chronic insomnia occurring within the context of medical and psychiatric disorders. Clin Psychol Rev 2005; 25:559–592.
- Quesnel C, Savard J, Simard S, Ivers H, Morin CM. Efficacy of cognitive-behavioral therapy for insomnia in women treated for nonmetastatic breast cancer. J Consult Clin Psychol 2003; 71:189–200.
- Savard J, Simard S, Ivers H, Morin CM. Randomized study on the efficacy of cognitive-behavioral therapy for insomnia secondary to breast cancer, part I: sleep and psychological effects. J Clin Oncol 2005; 23:6083–6096.
- Berger AM, Kuhn BR, Farr LA, et al. Behavioral therapy intervention trial to improve sleep quality and cancer-related fatigue. Psychooncology 2009; 18:634–646.
- Espie CA, Fleming L, Cassidy J, et al. Randomized controlled clinical effectiveness trial of cognitive behavior therapy compared with treatment as usual for persistent insomnia in patients with cancer. J Clin Oncol 2008; 26:4651–4658.
- National Institutes of Health. National Institutes of Health state of the science conference statement on manifestations and management of chronic insomnia in adults, June 13–15, 2005. Sleep 2005; 28:1049–1057.
- Savard J, Villa J, Simard S, Ivers H, Morin CM. Feasibility of a self-help treatment for insomnia comorbid with cancer. Psychooncology 2011; 20:1013–1019.
- Derogatis LR, Feldstein M, Morrow G, et al. A survey of psychotropic drug prescriptions in an oncology population. Cancer 1979; 44:1919–1929.
- Stiefel FC, Kornblith AB, Holland JC. Changes in the prescription patterns of psychotropic drugs for cancer patients during a 10-year period. Cancer 1990; 65:1048–1053.
- Minton O, Richardson A, Sharpe M, Hotopf M, Stone P. A systematic review and meta-analysis of the pharmacological treatment of cancer-related fatigue. J Natl Cancer Inst 2008; 100:1155–1166.
- Minton O, Stone P, Richardson A, Sharpe M, Hotopf M. Drug therapy for the management of cancer-related fatigue. Cochrane Database Syst Rev 2008;CD006704.
- Krystal AD, Walsh JK, Laska E, et al. Sustained efficacy of eszopiclone over 6 months of nightly treatment: results of a randomized, double-blind, placebo-controlled study in adults with chronic insomnia. Sleep 2003; 26:793–799.
- Liu J, Wang LN. Ramelteon in the treatment of chronic insomnia: systematic review and meta-analysis. Int J Clin Pract 2012; 66:867–873.
- Cankurtaran ES, Ozalp E, Soygur H, Akbiyik DI, Turhan L, Alkis N. Mirtazapine improves sleep and lowers anxiety and depression in cancer patients: superiority over imipramine. Support Care Cancer 2008; 16:1291–1298.
- Palesh OG, Mustian KM, Peppone LJ, et al. Impact of paroxetine on sleep problems in 426 cancer patients receiving chemotherapy: a trial from the University of Rochester Cancer Center Community Clinical Oncology Program. Sleep Med 2012; 13:1184–1190.
Many cancer patients don't sleep well, for a variety of reasons. It is an important problem: not only does poor sleep worsen quality of life, it may affect prognosis. Moreover, treatment is available.
Yet many physicians caring for cancer patients do not ask about sleep problems, underestimating their impact or focusing on more urgent problems. Also, patients may not want to bring up the topic because they consider poor sleep to be unavoidable and untreatable and because they fear that reporting it may shift the focus of their treatment from trying to cure the cancer to easing its symptoms.
This practical review will help health care professionals avoid the common barriers to diagnosis and treatment of poor sleep in cancer patients. Because there are few data on other sleep disorders such as sleep apnea and restless leg syndrome, we will focus on the most common one in cancer patients—insomnia—and its effects on other symptoms and quality of life.
MORE PATIENTS SURVIVE CANCER NOW
Today, more patients are surviving cancer, but cancer symptoms and the side effects of surgery, chemotherapy, and radiation therapy may persist for years.1,2 The most common complaints include cancer-related fatigue, leg restlessness, anxiety, insomnia, and excessive sleepiness.3
Sleep disturbances appear to contribute to the other problems and are relatively easier to quantify. Most studies of sleep disorders in cancer patients have looked specifically at insomnia,4 although a few have explored the prevalence of other sleep disorders, such as sleep-disordered breathing and limb movements during sleep.5
The International Classification of Sleep Disorders, 2nd edition,6 defines insomnia as difficulty going to sleep or staying asleep (the latter defined as waking up in the middle of the night, with wakeful episodes lasting more than 30 minutes), early-morning awakenings (waking 30 minutes or more before the intended time), or nonrestorative sleep, causing significant distress or impairment of day-time functioning.
INSOMNIA WORSENS QUALITY OF LIFE
Insomnia significantly worsens quality of life in cancer patients, and if it can be detected and effectively treated, quality of life is likely to improve. Studies in cancer patients have found that those with insomnia:
- Were less able to cope with stress and carry on their activities of daily living3
- Were much less able to function and reported more pain, less energy, and greater difficulty in dealing with emotional problems7
- Had poor quality of life, both physically and emotionally.3,8
PERHAPS MORE THAN HALF OF CANCER PATIENTS HAVE INSOMNIA
Depending on the methods used and populations studied, at least 30% and perhaps more than half of patients with cancer have insomnia (Table 1).3,4,8–14 It is one of the most commonly reported complaints in this group,15–17 and it occurs before, during, and after treatment of cancer.
Although the prevalence may differ in various cancers, it is still higher than in the general population. In a study of about 450 patients with cancer or depression and 300 healthy volunteers, 62% of the cancer patients reported moderate to severe sleep disturbance, compared with 52% of the depressed patients and 30% of the healthy volunteers.18
When Davidson et al3 surveyed nearly 1,000 cancer patients, one-third said they had insomnia. The problem was most prevalent in lung and breast cancer patients.
In a longitudinal study by Savard et al,13 the prevalence of insomnia declined over time but remained high even at the end of 18 months. It was more prevalent in patients with gynecologic and breast cancer than in those with prostate cancer.13,19
SLEEP PROBLEMS ARE UNDERREPORTED
Sleep problems in cancer patients often go unrecognized because patients do not report them. In a survey of 150 patients,20 44% reported having had sleep problems during the preceding month. However, only one-third of those with sleep problems told their health care providers. This highlights the need for physicians to address sleep complaints in cancer patients at every visit and, if needed, to refer them to a sleep specialist for further evaluation and management.
INSOMNIA IS OFTEN ASSOCIATED WITH OTHER PROBLEMS
Many things can interfere with sleep in cancer patients: the cancer itself (eg, pain due to tumor invasion), medical treatments (eg, narcotics, chemotherapy, neuroleptics, sympathomimetics, steroids, sedative hypnotics), psychosocial disturbances (eg, depression, anxiety, stress), and comorbid medical issues.
In this population, insomnia is often part of a cluster of symptoms that includes pain, fatigue, depression, and anxiety. These act synergistically, worsening quality of life.21–24
Cancer-related fatigue and insomnia
Cancer-related fatigue is a distressing, persistent, subjective sense of tiredness or exhaustion that is related to cancer or cancer treatment, that is not proportional to recent activity and that interferes with usual functioning.25 It has been reported by up to 90% of cancer patients in some studies.26–28
Cancer-related fatigue worsens quality of life and is one of the most distressing and persistent symptoms experienced before, during, and after cancer treatment.29,30 Furthermore, it can lead to sleep disturbances and daytime somnolence and further aggravate insomnia.31,32 The two conditions are often reported as part of a cluster of interrelated symptoms that include pain, depression, and loss of concentration and other cognitive functions, suggesting that they may share a common etiology.33–35
Åhsberg et al36 examined different aspects of perceived cancer-related fatigue in patients undergoing radiotherapy and found correlations between lack of energy, sleepiness, and cancer-related fatigue.
Current understanding of the possible link between cancer-related fatigue and insomnia suggests that interventions targeting the insomnia and daytime sleepiness could decrease the fatigue as well.31
Pain and insomnia in cancer patients
Pain is reported by 60% to 90% of patients with advanced cancer,37,38 its intensity usually varying with the extent of disease. Too often, it is inadequately controlled.39 Furthermore, it is thought to contribute to insomnia.40
In a study of more than 1,600 cancer patients, nearly 60% reported insomnia in addition to pain.41 The severity of pain directly correlated with the probability of insomnia.
Conversely, research suggests that sleep disturbances, primarily insomnia, can increase cancer patients’ sensitivity to pain.42 One hypothesis is that adequate sleep is needed to promote processes relevant to recovery from pain, both physiologic (ie, tissue repair) and psychological (ie, transient cessation of the perception of pain signals).43
Paradoxically, opioids can worsen insomnia
Cancer pain is often treated with opioids, which, paradoxically, can cause or worsen insomnia.
Although opioids induce sleep, they also depress respiration, and at night, they can cause or worsen sleep-disordered breathing (obstructive or central sleep apnea or ataxic breathing), leading to episodes of hypoxia, arousals, and fragmented sleep.44 Moreover, opioids can lead to daytime sedation. Further, psychostimulants such as methylphenidate, given to counteract opioid-induced sedation, can cause anxiety and insomnia. Thus, the interaction between cancer-related pain, insomnia, and pain management leads to a vicious cycle. Understanding this process, we can try to break the cycle and help patients with cancer sleep better.
However, how best to treat sleep-disordered breathing in patients taking opioids long-term is not well established.
In general, the primary intervention is to reduce the opioid dose. Practitioners should continually assess the need for these drugs and consider referral to a drug-behavior treatment center to help with discontinuation of opioid use when deemed medically appropriate.45 Other strategies include positive airway pressure ventilation including continuous positive airway pressure, bilevel pressure devices with backup rate, or adaptive servoventilators. In some cases oxygen supplementation may be required.
Sleep-disordered breathing, when recognized and diagnosed, should be managed in partnership with a sleep specialist.
Depression and insomnia in cancer patients
By some estimates, up to half of cancer patients suffer from depression at some point in their illness.28 And not without reason: these patients face uncertainty about their life, and this often results in depression or anxiety.46
Many cancer patients with depression also have insomnia.28 Indeed, patients with persistent insomnia are at greater risk of developing psychological disorders such as depression and anxiety.47
In a survey of cancer patients, insomnia symptoms were more often attributed to thoughts or concerns about health, family, friends, the cancer diagnosis, and finances than to the actual physical effects of cancer.48
CANCER TREATMENT AND INSOMNIA
Many cancer patients experience sleep disturbances even before starting treatment.49 Liu et al50 showed that, in 76 women about to undergo chemotherapy for breast cancer, those who already had sleep disturbances, fatigue, and depression had more problems, and more severe problems, during chemotherapy.
Radiation therapy and chemotherapy have been reported to cause or precipitate insomnia (Table 2).8,13
Hormonal therapy and biological therapy can also cause or worsen preexisting insomnia.51,52 For example, androgen deprivation therapy for prostate cancer and hormonal therapy for breast cancer are often associated with sleep problems.49,50 Possible mechanisms of insomnia include hot flashes, night sweats, and anxiety caused by such treatments. Biological agents such as interferons, interleukins, and tumor necrosis factor (TNF) alpha, which are often used to treat malignant melanoma, can affect the sleep-wake cycle, leading to insomnia.53
Corticosteroids sharply raise serum cortisol levels, which can lead to insomnia. Cancer patients receiving dexamethasone to prevent radiation-induced emesis experienced more insomnia than patients who did not receive dexamethasone.54
IMMUNOLOGIC BASIS OF INSOMNIA IN CANCER PATIENTS
Cancer cells produce inflammatory cytokines such as interleukin 1 (IL-1), interleukin 6 (IL-6), and TNF alpha, and inflammation plays a role in tumor progression and possibly tumorigenesis.55
Specific cytokines also help regulate the sleep-wake cycle. Levels of IL-6 and TNF alpha peak during sleep, and daytime IL-6 levels are inversely related to the amount of nocturnal sleep.56 Vgontzas et al57 showed that although mean levels of 24-hour IL-6 and TNF alpha secretion were not significantly different in patients with insomnia vs healthy controls, chronic insomnia was associated with a shift in IL-6 and TNF alpha secretion from nighttime to daytime.57
Cancer and its treatment can affect secretion of the cytokines that play a role in the sleep-wake cycle. Thus, the sleep disturbances associated with cancer may also be related to the abnormalities in cytokine levels caused by either cancer or its treatment.
Mills et al58 found that inflammatory markers such as vascular endothelial growth factor and soluble intercellular adhesion molecule-1 were significantly elevated during chemotherapy in breast cancer patients, and the elevated vascular endothelial growth factor levels were associated with poorer sleep during treatment.
Further research is warranted to establish causality, to help us understand the mechanisms of insomnia and other cancer symptoms, and to develop new treatments for these complaints.
POOR SLEEP AND CANCER RISK AND OUTCOMES
Sleep disturbances have negative health consequences in cancer. Their impact ranges from plausible carcinogenesis to affecting the course of the disease and cancer survival.
Poor sleep and risk of cancer
Epidemiologic studies have examined a possible link between circadian rhythm disruption and breast cancer risk, using both direct measures such as melatonin levels and indirect measures such as sleep duration and shift work. (Melatonin production is related to sleep duration, and night-shift work leads to disruption of sleep pattern and quality of sleep, thus lowering melatonin levels.59)
The findings were mixed. Breast cancer risk was significantly and inversely associated with urinary melatonin levels (6-sulfatoxymelatonin) in the Nurses’ Health Study II,60 but not in the Guernsey III study in the United Kingdom.61 Breast cancer risk was significantly lower with longer sleep duration in Finnish women62 and in Chinese women in Singapore,63 but not in American women.64,65 Results of three cohort studies66–68 and two case-control studies69,70 suggested a higher breast cancer risk in women who work evening or overnight shifts. Shorter sleep duration was associated with a higher risk of colorectal adenomas.71
These studies make a strong case for an association of cancer with circadian rhythm disruption and shorter sleep duration, possibly from an effect on melatonin levels. However, one should be cautious in interpreting epidemiologic studies: although they show sleep disturbances to be associated with cancer risk, they do not establish causality.
Insomnia and cancer outcomes
Evidence is growing that sleep disturbances may affect compliance with treatment, immune function, and outcomes—including survival—in cancer patients.23,24
In patients newly diagnosed with various types of cancer, Degner and Sloan72 showed that those who suffered from insomnia, nausea, poor appetite, and pain had a lower survival rate at 5 years, independent of the cancer stage. However, no separate analyses were performed to examine the specific influence of insomnia on cancer survival.
Thompson and Li73 analyzed data from 101 breast cancer patients with available Oncotype DX recurrence scores (a proprietary genetic test performed on tumor tissue that predicts the likelihood of recurrence). The scores were strongly correlated with average hours of sleep per night before breast cancer diagnosis, with fewer hours of sleep associated with a higher (worse) score.
Since these studies were retrospective and merely suggest associations, prospective studies, using more standardized questionnaires and objective measures, are needed to establish causality and to further our understanding of the mechanisms involved.
HELPING CANCER PATIENTS SLEEP BETTER
Insomnia is generally diagnosed with a thorough history that includes sleep, medical issues, substance use, and psychiatric issues. The sleep history should include specific insomniarelated complaints, presleep conditions and habits, sleep-wake habits, other sleep-related symptoms, and daytime consequences. To obtain the information, one can use questionnaires, sleep logs, psychological screening tests, and bed-partner interviews.74
Managing insomnia involves both pharmacologic and nonpharmacologic treatment. It is also important to treat the associated disorders such as depression and anxiety disorders that often accompany insomnia. Long-term management of cancer patients should not be limited to surveillance of cancer but should also involve aggressive treatment of clusters of symptoms such as insomnia, cancer-related fatigue, and pain to yield better long-term quality of life.75–77
Nonpharmacologic treatment: Cognitive-behavioral therapy
Nonpharmacologic interventions use psychological and behavioral therapies. The American Academy of Sleep Medicine guidelines recommend cognitive behavioral therapy for all patients with insomnia, either alone or in combination with hypnotic medications.
Cognitive-behavioral therapy for insomnia includes various components that help the patient learn coping skills and ways to prevent or mitigate the severity of future episodes (Table 3). Various randomized controlled trials found it to be effective for treating insomnia in the general population.77–79
Several studies found that cognitive-behavioral therapy for insomnia was effective in cancer patients, not only improving sleep quality but also decreasing psychological distress, resulting in better overall quality of life.80,81
Savard et al81 conducted a randomized controlled trial of cognitive-behavioral therapy for insomnia in 57 patients with breast cancer, examining subjective and objective sleep measures, psychological functioning, quality of life, and immunologic responses. They found significant improvements in sleep efficiency, mood, quality of life, depression, anxiety, and need for sleep medications. Improvements in subjective sleep measures persisted on 12-month follow-up.
Berger et al,82 in another randomized controlled trial, assessed behavioral therapy using stimulus control, modified sleep restriction, relaxation therapy, and sleep hygiene in breast cancer patients receiving adjuvant chemotherapy. Behavioral therapy improved sleep quality over time, as measured by the Pittsburgh Sleep Quality Index.
Espie et al83 evaluated the effect of cognitive-behavioral therapy on prostate, colorectal, gynecologic, and breast cancer patients, with similar results.83
Cognitive-behavioral therapy is at least as effective as drug therapy for insomnia in the general population. In the limited studies done in cancer patients, it has been shown to be effective irrespective of the type of cancer and is associated with better long-term outcomes. It diminishes the distress associated with early insomnia, can reduce anxiety, and can promote sleep.
A National Institutes of Health conference on insomnia concluded that cognitivebehavioral therapy is at least as effective as medications for brief treatment of chronic insomnia and that its beneficial effects, in contrast to those produced by medications, may last beyond the termination of treatment.84
It is important to think about numerous factors when considering options such as cognitive-behavioral therapy, as patients with cancer have different complications that may affect sleep quality, such as cancer-related fatigue, cancer-related depression, psychological reactions to the disease, side effects of treatment, and cancer-related pain. These need to be addressed as well.
If cognitive-behavioral therapy is not available, self-help interventions (eg, written material, videos, television and Internet resources) can be used. These have several advantages over professionally administered interventions, including greater accessibility, less burden for the patient, and lower cost. Research is under way evaluating this approach in cancer patients.85
Drug therapy
The focus of therapy should be to treat underlying disorders that may be causing or contributing to insomnia. However, a substantial number of patients may need to be assessed for pharmacotherapy for insomnia.
Sleep problems in the general population are commonly treated with drugs, and most of the recommendations in cancer patients are based on experience in the general population. However, sleep medications should be used cautiously in cancer patients, since to our knowledge there have been no studies of these agents in patients with cancer.
Side effects also need to be considered. For example, sleep medications can profoundly worsen cancer-related fatigue.
Hypnotics are often prescribed for cancer patients.86,87 A study in five major oncology centers showed that about half of the 1,500 patients were prescribed at least one psychotropic drug.86 In this study, hypnotics were the most frequently prescribed drugs, accounting for 48% of total prescriptions, and 44% of the psychotropic prescriptions were written for sleep.
Benzodiazepine receptor agonists such as zaleplon, zolpidem, and eszopiclone can be used for problems with falling asleep and staying asleep.88,89 They are better tolerated than older, long-acting benzodiazepines,90 which can cause alterations in sleep-cycle architecture or rebound insomnia. The earlier agents can also cause adverse effects such as tolerance, drowsiness, and cognitive impairment.
A National Institutes of Health conference stated that benzodiazepine receptor agonists are efficacious in the short-term management of insomnia and that their adverse effects are much less frequent and severe than those of the benzodiazepines or other sedating drugs.84 It also stated that all antidepressants, antihistamines (H1 receptor antagonists), and anti-psychotics have potentially significant adverse effects that raise concerns about their risk-to-benefit ratio and their suitability as treatment for chronic insomnia.
Benzodiazepines are commonly prescribed for insomnia. They increase sleep efficiency, decrease arousals, and increase stage 2 sleep.
Melatonin receptor agonists have been approved by the US Food and Drug Administration for treating insomnia. A recent meta-analysis of eight studies in healthy patients showed improvements in subjective and objective sleep outcomes with the use of ramelteon.91 The dosages primarily used were 4 to 32 mg. However, most of the studies used a dosage of 4 to 8 mg.
Antidepressants. Some of the antidepressants are also used for insomnia, but they can cause daytime fatigue.
Mirtazapine was shown to be effective for insomnia and coexistent mood disorder in cancer patients, but larger trials are needed.92
A recent clinical trial with secondary data analyses evaluated the effect of paroxetine on insomnia, depression, and fatigue in patients with cancer. Paroxetine significantly reduced insomnia in both depressed and nondepressed patients after 2 to 3 weeks of treatment.93
Table 4 summarizes classes of drugs used for insomnia and their additional therapeutic properties.
- Ness KK, Wall MM, Oakes JM, Robison LL, Gurney JG. Physical performance limitations and participation restrictions among cancer survivors: a population-based study. Ann Epidemiol 2006; 16:197–205.
- Deimling GT, Bowman KF, Sterns S, Wagner LJ, Kahana B. Cancer-related health worries and psychological distress among older adult, long-term cancer survivors. Psychooncology 2006; 15:306–320.
- Davidson JR, MacLean AW, Brundage MD, Schulze K. Sleep disturbance in cancer patients. Soc Sci Med 2002; 54:1309–1321.
- Savard J, Morin CM. Insomnia in the context of cancer: a review of a neglected problem. J Clin Oncol 2001; 19:895–908.
- Payne RJ, Hier MP, Kost KM, et al. High prevalence of obstructive sleep apnea among patients with head and neck cancer. J Otolaryngol 2005; 34:304–311.
- American Academy of Sleep Medicine. International Classification of Sleep Disorders—Second Edition (ICSD-2); 2005.
- Fortner BV, Stepanski EJ, Wang SC, Kasprowicz S, Durrence HH. Sleep and quality of life in breast cancer patients. J Pain Symptom Manage 2002; 24:471–480.
- Chen ML, Yu CT, Yang CH. Sleep disturbances and quality of life in lung cancer patients undergoing chemotherapy. Lung Cancer 2008; 62:391–400.
- Liu L, Ancoli-Israel S. Sleep disturbances in cancer. Psychiatr Ann 2008; 38:627–634.
- Ancoli-Israel S, Liu L, Marler MR, et al. Fatigue, sleep, and circadian rhythms prior to chemotherapy for breast cancer. Support Care Cancer 2006; 14:201–209.
- Miaskowski C, Lee K, Dunn L, et al. Sleep-wake circadian activity rhythm parameters and fatigue in oncology patients before the initiation of radiation therapy. Cancer Nurs 2011; 34:255–268.
- Liu L, Rissling M, Natarajan L, et al. The longitudinal relationship between fatigue and sleep in breast cancer patients undergoing chemotherapy. Sleep 2012; 35:237–245.
- Savard J, Ivers H, Villa J, Caplette-Gingras A, Morin CM. Natural course of insomnia comorbid with cancer: an 18-month longitudinal study. J Clin Oncol 2011; 29:3580–3586.
- Sela RA, Watanabe S, Nekolaichuk CL. Sleep disturbances in palliative cancer patients attending a pain and symptom control clinic. Palliat Support Care 2005; 3:23–31.
- Mao JJ, Armstrong K, Bowman MA, Xie SX, Kadakia R, Farrar JT. Symptom burden among cancer survivors: impact of age and comorbidity. J Am Board Fam Med 2007; 20:434–443.
- Schroevers MJ, Ranchor AV, Sanderman R. The role of age at the onset of cancer in relation to survivors’ long-term adjustment: a controlled comparison over an eight-year period. Psychooncology 2004; 13:740–752.
- Stein KD, Syrjala KL, Andrykowski MA. Physical and psychological long-term and late effects of cancer. Cancer 2008; 112(suppl 11):2577–2592.
- Anderson KO, Getto CJ, Mendoza TR, et al. Fatigue and sleep disturbance in patients with cancer, patients with clinical depression, and community-dwelling adults. J Pain Symptom Manage 2003; 25:307–318.
- Savard J, Villa J, Ivers H, Simard S, Morin CM. Prevalence, natural course, and risk factors of insomnia comorbid with cancer over a 2-month period. J Clin Oncol 2009; 27:5233–5239.
- Engstrom CA, Strohl RA, Rose L, Lewandowski L, Stefanek ME. Sleep alterations in cancer patients. Cancer Nurs 1999; 22:143–148.
- Hoffman A, Given BA, von Eye A, Given CW, Gift AG. A study on the relationship between fatigue, pain, insomnia, and gender in persons with lung cancer. Oncol Nurs Forum 2006; 33:404.
- Hoffman AJ, Given BA, von Eye A, Gift AG, Given CW. Relationships among pain, fatigue, insomnia, and gender in persons with lung cancer. Oncol Nurs Forum 2007; 34:785–792.
- Shapiro SL, Bootzin RR, Figueredo AJ, Lopez AM, Schwartz GE. The efficacy of mindfulness-based stress reduction in the treatment of disturbance in women with breast cancer: an exploratory study. J Psychosom Res 2003; 54:85–91.
- Shapiro SL, Lopez AM, Schwartz GE, et al. Quality of life and breast cancer: relationship to psychosocial variables. J Clin Psychol 2001; 57:501–519.
- Mock V, Atkinson A, Barsevick A, et al; National Comprehensive Cancer Network. NCCN practice guidelines for cancer-related fatigue. Oncology (Williston Park) 2000; 14:151–161.
- Cella D, Davis K, Breitbart W, Curt G;Fatigue Coalition. Cancer-related fatigue: prevalence of proposed diagnostic criteria in a United States sample of cancer survivors. J Clin Oncol 2001; 19:3385–3391.
- Sateia MJ, Lang BJ. Sleep and cancer: recent developments. Curr Oncol Rep 2008; 10:309–318.
- Ahluwalia M. Fatigue, pain, and depression among older adults with cancer: still underrecognized and undertreated. Geriatrics and Aging 2008; 11:495–501.
- Enderlin CA, Coleman EA, Cole C, Richards KC, Hutchins LF, Sherman AC. Sleep across chemotherapy treatment: a growing concern for women older than 50 with breast cancer. Oncol Nurs Forum 2010; 37:461–A3.
- Winningham ML, Nail LM, Burke MB, et al. Fatigue and the cancer experience: the state of the knowledge. Oncol Nurs Forum 1994; 21:23–36.
- Berger AM, Mitchell SA. Modifying cancer-related fatigue by optimizing sleep quality. J Natl Compr Canc Netw 2008; 6:3–13.
- Anderson KO, Getto CJ, Mendoza TR, et al. Fatigue and sleep disturbance in patients with cancer, patients with clinical depression, and community-dwelling adults. J Pain Symptom Manage 2003; 25:307–318.
- Armstrong TS, Cohen MZ, Eriksen LR, Hickey JV. Symptom clusters in oncology patients and implications for symptom research in people with primary brain tumors. J Nurs Scholarsh 2004; 36:197–206.
- Dodd MJ, Miaskowski C, Lee KA. Occurrence of symptom clusters. J Natl Cancer Inst Monogr 2004;76–78.
- Paice JA. Assessment of symptom clusters in people with cancer. J Natl Cancer Inst Monogr 2004;98–102.
- Åhsberg E, Fürst CJ. Dimensions of fatigue during radiotherapy—an application of the Swedish Occupational Fatigue Inventory (SOFI) on cancer patients. Acta Oncol 2001; 40:37–43.
- Foley KM. The treatment of cancer pain. N Engl J Med 1985; 313:84–95.
- Twycross RG, Fairfield S. Pain in far-advanced cancer. Pain 1982; 14:303–310.
- Cleeland CS, Gonin R, Hatfield AK, et al. Pain and its treatment in outpatients with metastatic cancer. N Engl J Med 1994; 330:592–596.
- Fleming L, Gillespie S, Espie CA. The development and impact of insomnia on cancer survivors: Psychooncology 2010; 19:991–996.
- Grond S, Zech D, Diefenbach C, Bischoff A. Prevalence and pattern of symptoms in patients with cancer pain: a prospective evaluation of 1635 cancer patients referred to a pain clinic. J Pain Symptom Manage 1994; 9:372–382.
- Smith MT, Haythornthwaite JA. How do sleep disturbance and chronic pain inter-relate? Insights from the longitudinal and cognitive-behavioral clinical trials literature. Sleep Med Rev 2004; 8:119–132.
- Lewin DS, Dahl RE. Importance of sleep in the management of pediatric pain. J Dev Behav Pediatr 1999; 20:244–252.
- Yue HJ, Guilleminault C. Opioid medication and sleep-disordered breathing. Med Clin North Am 2010; 94:435–446.
- Teichtahl H, Wang D. Sleep-disordered breathing with chronic opioid use. Expert Opin Drug Saf 2007; 6:641–649.
- Ancoli-Israel S, Moore PJ, Jones V. The relationship between fatigue and sleep in cancer patients: a review. Eur J Cancer Care (Engl) 2001; 10:245–255.
- Perlis ML, Giles DE, Buysse DJ, Tu X, Kupfer DJ. Self-reported sleep disturbance as a prodromal symptom in recurrent depression. J Affect Disord 1997; 42:209–212.
- Stone P, Hardy J, Broadley K, Tookman AJ, Kurowska A, A’Hern R. Fatigue in advanced cancer: a prospective controlled cross-sectional study. Br J Cancer 1999; 79:1479–1486.
- Cimprich B. Pretreatment symptom distress in women newly diagnosed with breast cancer. Cancer Nurs 1999; 22:185–194.
- Liu L, Fiorentino L, Natarajan L, et al. Pre-treatment symptom cluster in breast cancer patients is associated with worse sleep, fatigue and depression during chemotherapy. Psychooncology 2009; 18:187–194.
- Savard J, Hervouet S, Ivers H. Prostate cancer treatments and their side effects are associated with increased insomnia. Psychooncology 2013; 22:1381–1388.
- Fenlon DR, Corner JL, Haviland J. Menopausal hot flushes after breast cancer. Eur J Cancer Care (Engl) 2009; 18:140–148.
- Miller AH, Ancoli-Israel S, Bower JE, Capuron L, Irwin MR. Neuroendocrine-immune mechanisms of behavioral comorbidities in patients with cancer. J Clin Oncol 2008; 26:971–982.
- Kirkbride P, Bezjak A, Pater J, et al. Dexamethasone for the prophylaxis of radiation-induced emesis: a National Cancer Institute of Canada Clinical Trials Group phase III study. J Clin Oncol 2000; 18:1960–1966.
- Coussens LM, Werb Z. Inflammation and cancer. Nature 2002; 420:860–867.
- Vgontzas AN, Chrousos GP. Sleep, the hypothalamic-pituitary-adrenal axis, and cytokines: multiple interactions and disturbances in sleep disorders. Endocrinol Metab Clin North Am 2002; 31:15–36.
- Vgontzas AN, Zoumakis M, Papanicolaou DA, et al. Chronic insomnia is associated with a shift of interleukin-6 and tumor necrosis factor secretion from nighttime to daytime. Metabolism 2002; 51:887–892.
- Mills PJ, Parker B, Jones V, et al. The effects of standard anthracycline-based chemotherapy on soluble ICAM-1 and vascular endothelial growth factor levels in breast cancer. Clin Cancer Res 2004; 10:4998–5003.
- Reiter RJ, Tan DX, Korkmaz A, et al. Light at night, chronodisruption, melatonin suppression, and cancer risk: a review. Crit Rev Oncog 2007; 13:303–328.
- Schernhammer ES, Hankinson SE. Urinary melatonin levels and breast cancer risk. J Natl Cancer Inst 2005; 97:1084–1087.
- Travis RC, Allen DS, Fentiman IS, Key TJ. Melatonin and breast cancer: a prospective study. J Natl Cancer Inst 2004; 96:475–482.
- Verkasalo PK, Lillberg K, Stevens RG, et al. Sleep duration and breast cancer: a prospective cohort study. Cancer Res 2005; 65:9595–9600.
- Wu AH, Wang R, Koh WP, Stanczyk FZ, Lee HP, Yu MC. Sleep duration, melatonin and breast cancer among Chinese women in Singapore. Carcinogenesis 2008; 29:1244–1248.
- McElroy JA, Newcomb PA, Titus-Ernstoff L, Trentham-Dietz A, Hampton JM, Egan KM. Duration of sleep and breast cancer risk in a large population-based case-control study. J Sleep Res 2006; 15:241–249.
- Pinheiro SP, Schernhammer ES, Tworoger SS, Michels KB. A prospective study on habitual duration of sleep and incidence of breast cancer in a large cohort of women. Cancer Res 2006; 66:5521–5525.
- Lie JA, Roessink J, Kjaerheim K. Breast cancer and night work among Norwegian nurses. Cancer Causes Control 2006; 17:39–44.
- Schernhammer ES, Kroenke CH, Laden F, Hankinson SE. Night work and risk of breast cancer. Epidemiology 2006; 17:108–111.
- Schernhammer ES, Laden F, Speizer FE, et al. Rotating night shifts and risk of breast cancer in women participating in the Nurses’ Health Study. J Natl Cancer Inst 2001; 93:1563–1568.
- Davis S, Mirick DK, Stevens RG. Night shift work, light at night, and risk of breast cancer. J Natl Cancer Inst 2001; 93:1557–1562.
- Hansen J. Light at night, shiftwork, and breast cancer risk. J Natl Cancer Inst 2001; 93:1513–1515.
- Thompson CL, Larkin EK, Patel S, Berger NA, Redline S, Li L. Short duration of sleep increases risk of colorectal adenoma. Cancer 2011; 117:841–847.
- Degner LF, Sloan JA. Symptom distress in newly diagnosed ambulatory cancer patients and as a predictor of survival in lung cancer. J Pain Symptom Manage 1995; 10:423–431.
- Thompson CL, Li L. Association of sleep duration and breast cancer OncotypeDX recurrence score. Breast Cancer Res Treat 2012; 134:1291–1295.
- Schutte-Rodin S, Broch L, Buysse D, Dorsey C, Sateia M. Clinical guideline for the evaluation and management of chronic insomnia in adults. J Clin Sleep Med 2008; 4:487–504.
- Fan HG, Houédé-Tchen N, Yi QL, et al. Fatigue, menopausal symptoms, and cognitive function in women after adjuvant chemotherapy for breast cancer: 1- and 2-year follow-up of a prospective controlled study. J Clin Oncol 2005; 23:8025–8032.
- Ganz PA. Late effects of cancer and its treatment. Semin Oncol Nurs 2001; 17:241–248.
- Lee TS, Kilbreath SL, Refshauge KM, Pendlebury SC, Beith JM, Lee MJ. Quality of life of women treated with radiotherapy for breast cancer. Support Care Cancer 2008; 16:399–405.
- National Institutes of Health. National Institutes of Health state of the science conference statement on manifestations and management of chronic insomnia in adults, June 13–15, 2005. Sleep 2005; 28:1049–1057.
- Smith MT, Huang MI, Manber R. Cognitive behavior therapy for chronic insomnia occurring within the context of medical and psychiatric disorders. Clin Psychol Rev 2005; 25:559–592.
- Quesnel C, Savard J, Simard S, Ivers H, Morin CM. Efficacy of cognitive-behavioral therapy for insomnia in women treated for nonmetastatic breast cancer. J Consult Clin Psychol 2003; 71:189–200.
- Savard J, Simard S, Ivers H, Morin CM. Randomized study on the efficacy of cognitive-behavioral therapy for insomnia secondary to breast cancer, part I: sleep and psychological effects. J Clin Oncol 2005; 23:6083–6096.
- Berger AM, Kuhn BR, Farr LA, et al. Behavioral therapy intervention trial to improve sleep quality and cancer-related fatigue. Psychooncology 2009; 18:634–646.
- Espie CA, Fleming L, Cassidy J, et al. Randomized controlled clinical effectiveness trial of cognitive behavior therapy compared with treatment as usual for persistent insomnia in patients with cancer. J Clin Oncol 2008; 26:4651–4658.
- National Institutes of Health. National Institutes of Health state of the science conference statement on manifestations and management of chronic insomnia in adults, June 13–15, 2005. Sleep 2005; 28:1049–1057.
- Savard J, Villa J, Simard S, Ivers H, Morin CM. Feasibility of a self-help treatment for insomnia comorbid with cancer. Psychooncology 2011; 20:1013–1019.
- Derogatis LR, Feldstein M, Morrow G, et al. A survey of psychotropic drug prescriptions in an oncology population. Cancer 1979; 44:1919–1929.
- Stiefel FC, Kornblith AB, Holland JC. Changes in the prescription patterns of psychotropic drugs for cancer patients during a 10-year period. Cancer 1990; 65:1048–1053.
- Minton O, Richardson A, Sharpe M, Hotopf M, Stone P. A systematic review and meta-analysis of the pharmacological treatment of cancer-related fatigue. J Natl Cancer Inst 2008; 100:1155–1166.
- Minton O, Stone P, Richardson A, Sharpe M, Hotopf M. Drug therapy for the management of cancer-related fatigue. Cochrane Database Syst Rev 2008;CD006704.
- Krystal AD, Walsh JK, Laska E, et al. Sustained efficacy of eszopiclone over 6 months of nightly treatment: results of a randomized, double-blind, placebo-controlled study in adults with chronic insomnia. Sleep 2003; 26:793–799.
- Liu J, Wang LN. Ramelteon in the treatment of chronic insomnia: systematic review and meta-analysis. Int J Clin Pract 2012; 66:867–873.
- Cankurtaran ES, Ozalp E, Soygur H, Akbiyik DI, Turhan L, Alkis N. Mirtazapine improves sleep and lowers anxiety and depression in cancer patients: superiority over imipramine. Support Care Cancer 2008; 16:1291–1298.
- Palesh OG, Mustian KM, Peppone LJ, et al. Impact of paroxetine on sleep problems in 426 cancer patients receiving chemotherapy: a trial from the University of Rochester Cancer Center Community Clinical Oncology Program. Sleep Med 2012; 13:1184–1190.
KEY POINTS
- Sleep disturbances, primarily insomnia, profoundly affect all aspects of quality of life.
- Insomnia can be caused or worsened by a number of other conditions, such as pain, fatigue, depression, and anxiety, and these in turn can be worsened by insomnia.
- Cognitive-behavioral therapy is the treatment of choice for chronic insomnia. Underlying problems should be addressed.
- Drugs are often prescribed to help cancer patients sleep but should be used with caution, as there is limited information from clinical trials in this population.
Myasthenia gravis: Newer therapies offer sustained improvement
Current therapies for myasthenia gravis can help most patients achieve sustained improvement. The overall prognosis has dramatically improved over the last 4 decades: the mortality rate used to be 75%; now it is 4.5%.1
Myasthenia gravis is the most common disorder of neuromuscular junction transmission and is also one of the best characterized autoimmune diseases. However, its symptoms—primarily weakness—vary from patient to patient, and in the same patient, by time of day and over longer time periods. The variation in symptoms can be very confusing to undiagnosed patients and puzzling to unsuspecting physicians. Such diagnostic uncertainty can give the patient additional frustration and emotional stress, which in turn exacerbate his or her condition.
In this review, we will give an overview of the pathogenesis, clinical manifestations, diagnosis, and treatment of myasthenia gravis.
TWO PEAKS IN INCIDENCE BY AGE
The annual incidence of myasthenia gravis is approximately 10 to 20 new cases per million, with a prevalence of about 150 to 200 per million.2
The age of onset has a bimodal distribution, with an early incidence peak in the second to third decade with a female predominance and a late peak in the 6th to the 8th decade with a male predominance.2
Myasthenia gravis is commonly associated with several other autoimmune disorders, including hypothyroidism, hyperthyroidism, systemic lupus erythematosus, rheumatoid arthritis, vitiligo, diabetes, and, more recently recognized, neuromyelitis optica.3
ANTIBODIES AGAINST AChR AND MuSK
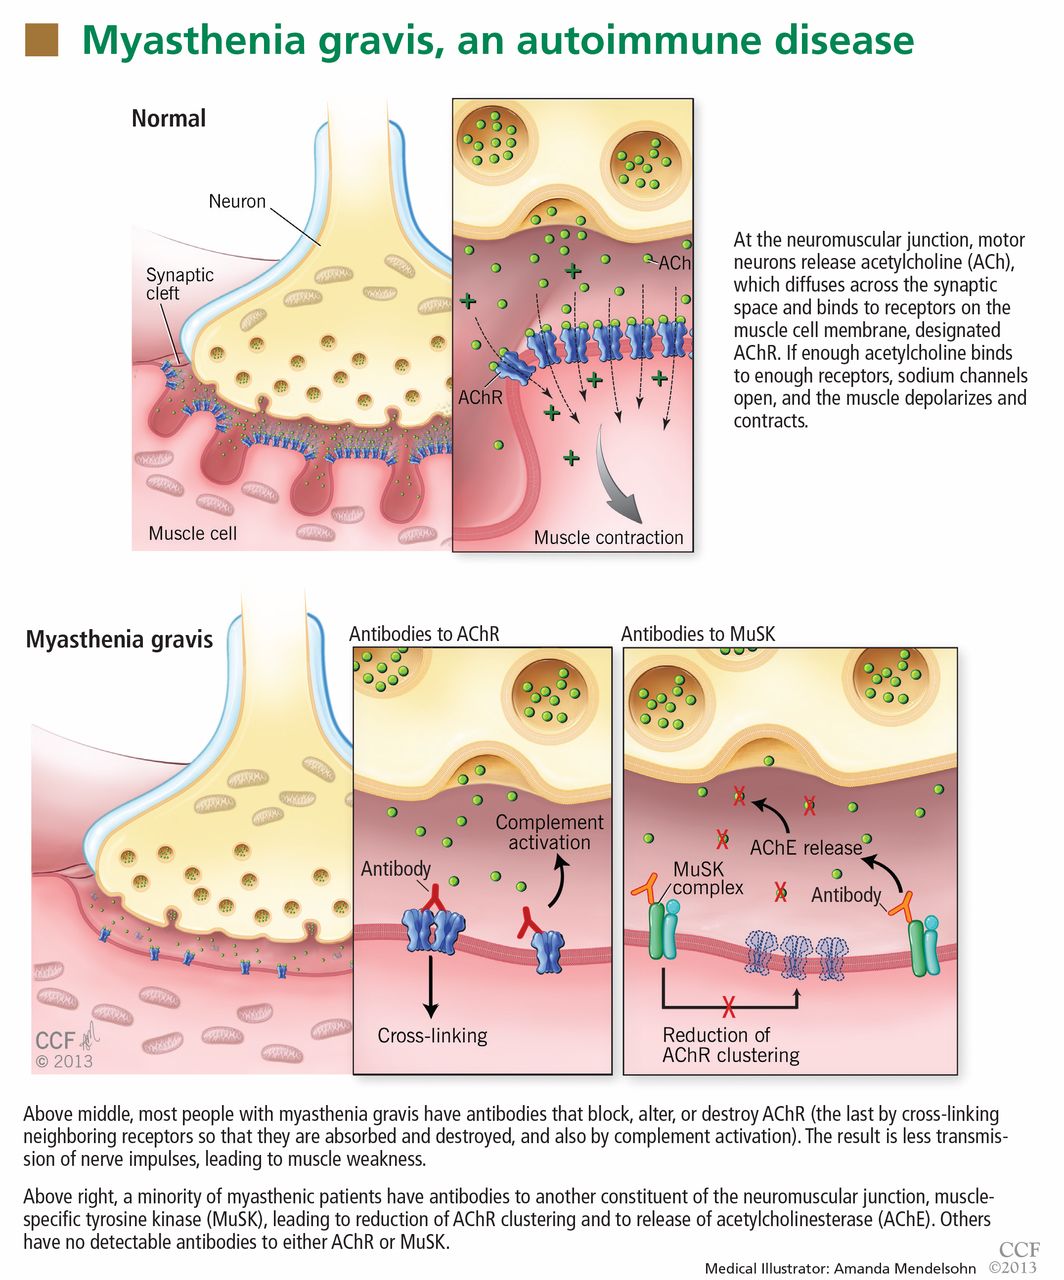
In most cases of myasthenia gravis the patient has autoimmune antibodies against constituents of the neuromuscular junction, specifically acetylcholine receptor (AChR) and muscle-specific tyrosine kinase (MuSK) (Figure 1).
AChR antibody-positive myasthenia gravis
When antibodies bind to AChR on the postsynaptic membrane, they cross-link neighboring AChR units, which are absorbed into the muscle fiber and are broken up.4 In addition, the complement system is activated to mediate further damage on the postsynaptic membrane.
AChR antibodies may come from germinal centers of the thymus, where clustered myoid cells express AChR on the plasma membrane surface.5 About 60% of AChR antibody-positive myasthenia gravis patients have an enlarged thymus, and 10% have a thymoma—a tumor of the epithelial cells of this organ. Conversely, about 15% of patients with a thymoma have clinical myasthenia gravis, and an additional 20% possess antibodies against AChR in the serum without myasthenic symptoms.5
MuSK antibody-positive myasthenia gravis
Like AChR, MuSK is a transmembrane component of the postsynaptic neuromuscular junction. During formation of the neuromuscular junction, MuSK is activated through the binding of agrin (a nerve-derived proteoglycan) to lipoprotein-related protein 4 (LRP4), after which complicated intracellular signaling promotes the assembly and stabilization of AChR.6
Unlike AChR antibodies, antibodies against MuSK do not activate the complement system, and complement fixation is not essential for clinical myasthenic symptoms to appear.7 Also, myasthenia gravis with MuSK antibodies is rarely associated with thymoma.8
The precise mechanism by which MuSK antibody impairs transmission at the neuromuscular junction has been a mystery until recently. Animal models, including MuSK-mutant mice and mice injected with MuSK protein or with purified immunoglobulin G from patients with this disease, have revealed a significant reduction of AChR clusters and destruction of neuromuscular junction structures.7,9–12
In addition, MuSK antibodies produce pre-synaptic dysfunction, manifesting as a reduction of acetylcholine content. This information is based on studies in mice and on in vitro electrophysiologic analyses of neuromuscular junctions from a patient with this disease.7,9–13
Finally, MuSK antibodies may indirectly affect the recycling of acetylcholine. After post-synaptic activation, acetylcholine is normally hydrolized by acetylcholinesterase, which is located in the synaptic cleft but anchored to MuSK on the postsynaptic membrane. MuSK antibodies block the binding of MuSK to acetylcholinesterase, possibly leading to less accumulation of acetylcholinesterase.14 This process may explain why patients with MuSK antibody-positive myasthenia gravis tend to respond poorly to acetylcholinesterase inhibitors (more about this below).
Seronegative myasthenia gravis
In a series of 562 consecutive patients with generalized weakness due to myasthenia gravis, 92% were positive for AChR antibody, 3% were positive for MuSK antibody, and 5% were seronegative (possessing neither antibody).15 In contrast, about 50% of patients with purely ocular myasthenia gravis (ie, with isolated weakness of the levator palpebrae superioris, orbicularis oculi, or oculomotor muscles) are seropositive for AChR antibody. Only a few ocular MuSK antibody-positive cases have been described, leaving the rest seronegative. Rarely, both antibodies can be detected in the same patient.16
In patients who are negative for AChR antibodies at the time of disease onset, sero-conversion may occur later during the course. Repeating serologic testing 6 to 12 months later may detect AChR antibodies in approximately 15% of patients who were initially seronegative.15,17
The clinical presentation, electrophysiologic findings, thymic pathologic findings, and treatment responses are similar in AChR antibody-positive and seronegative myasthenia gravis.17 Muscle biopsy study in seronegative cases demonstrates a loss of AChR as well.18
Based on these observations, it has been proposed that seronegative patients may have low-affinity antibodies that can bind to tightly clustered AChRs on the postsynaptic membrane but escape detection by routine radioimmunoassays in a solution phase. With a sensitive cell-based immunofluorescence assay, low-affinity antibodies to clustered AChRs were detected in 66% of patients with generalized myasthenia gravis and in 50% of those with ocular myasthenia gravis who were seronegative on standard assays.19,20 These low-affinity AChR antibodies can also activate complement in vitro, increasing the likelihood that they are pathogenic. However, assays to detect low-affinity AChR antibodies are not yet commercially available.
Within the past year, three research groups independently reported detecting antibodies to LRP4 in 2% to 50% of seronegative myasthenia gravis patients. This wide variation in the prevalence of LRP4 antibodies could be related to patient ethnicity and methods of detection.21–23 LRP4 is a receptor for agrin and is required for agrin-induced MuSK activation and AChR clustering. LRP antibodies can activate complement; therefore, it is plausible that LRP4 antibody binding leads to AChR loss on the postsynaptic membrane. However, additional study is needed to determine if LRP4 antibodies are truly pathogenic in myasthenia gravis.
A DISORDER OF FATIGABLE WEAKNESS
Myasthenia gravis is a disorder of fatigable weakness producing fluctuating symptoms. Symptoms related to the involvement of specific muscle groups are listed in Table 1. Muscle weakness is often worse later in the day or after exercise.
Ocular myasthenia gravis accounts for about 15% of all cases. Of patients initially presenting with ocular symptoms only, twothirds will ultimately develop generalized symptoms, most within the first 2 years.24 No factor has been identified that predicts conversion from an ocular to a generalized form.
Several clinical phenotypes of MuSK antibody-positive myasthenia gravis have been described. An oculobulbar form presents with diplopia, ptosis, dysarthria, and profound atrophy of the muscles of the tongue and face. A restricted myopathic form presents with prominent neck, shoulder, and respiratory weakness without ocular involvement. A third form is a combination of ocular and proximal limb weakness, indistinguishable from AChR antibody-positive disease.25
MuSK antibody-positive patients do not respond as well to acetylcholinesterase inhibitors as AChR antibody-positive patients do. In one study, nearly 70% of MuSK antibody-positive patients demonstrated no response, poor tolerance, or cholinergic hypersensitivity to these agents.25 Fortunately, most MuSK antibody-positive patients have a favorable response to immunosuppressive therapy—sometimes a dramatic improvement after plasmapheresis.8
DIAGNOSIS OF MYASTHENIA GRAVIS
The common differential diagnoses for myasthenia gravis are listed in Table 2.
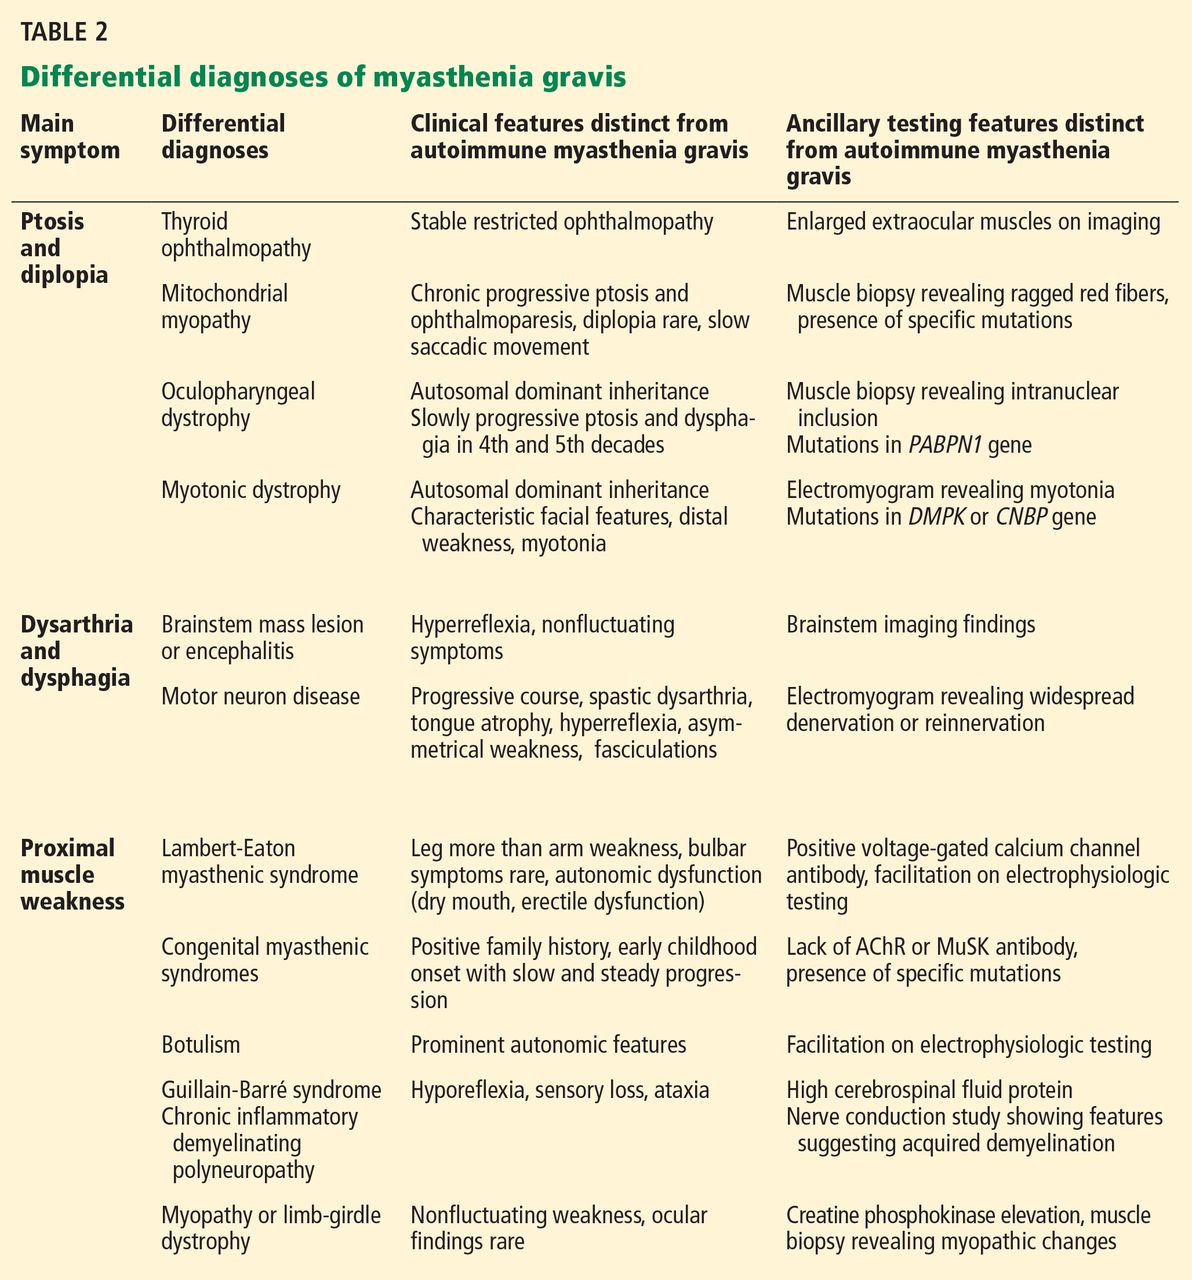
The essential feature of myasthenia gravis is fluctuating muscle weakness, often with fatigue. Many patients complain of weakness of specific muscle groups after their repeated usage. Pain is generally a less conspicuous symptom, and generalized fatigue without objective weakness is inconsistent with myasthenia gravis.
Signs of muscle weakness may include droopy eyelids, diplopia, inability to hold the head straight, difficulty swallowing or chewing, speech disturbances, difficulty breathing, and difficulty raising the arms or rising from the sitting position. A historical pattern of ptosis alternating from one eye to the other is fairly characteristic of myasthenia gravis.
The weakness of orbicularis oculi is easily identified on examination by prying open the eyes during forced eye closure. Limb weakness is usually more significant in the arms than in the legs. An often-neglected feature of myasthenia gravis is finger extensor weakness with a relative sparing of other distal hand muscles.2
The ice-pack test is performed by placing a small bag of ice over the ptotic eye for 2 to 5 minutes and assessing the degree of ptosis for any noticeable improvement. This test is not very helpful for assessing ocular motor weakness.
The edrophonium (Tensilon) test can be used for patients with ptosis or ophthalmoparesis. Edrophonium, a short-acting acetylcholinesterase inhibitor, is given intravenously while the patient is observed for objective improvement. The patient’s cardiovascular status should be monitored for arrhythmias and hypotension. Atropine should be immediately available in case severe bradycardia develops.
The ice-pack test and the edrophonium test can give false-negative and false-positive results, and the diagnosis of myasthenia gravis must be verified by other diagnostic tests.
Testing for antibodies
Testing for circulating AChR antibodies, MuSK antibodies, or both is the first step in the laboratory confirmation of myasthenia gravis.
There are three AChR antibody subtypes: binding, blocking, and modulating. Binding antibodies are present in 80% to 90% of patients with generalized myasthenia gravis and 50% of those with ocular myasthenia gravis. Testing for blocking and modulating AChR antibodies increases the sensitivity by less than 5% when added to testing for binding antibodies.
AChR antibody titers correlate poorly with disease severity between patients. However, in individual patients, antibody titers tend to go down in parallel with clinical improvement.
MuSK antibody is detected in nearly half of myasthenia gravis patients with generalized weakness who are negative for AChR antibody.
Electrophysiologic tests
Electrophysiologic tests can usually confirm the diagnosis of seronegative myasthenia gravis. They are also helpful in seropositive patients who have unusual clinical features or a poor response to treatment.
Repetitive nerve stimulation studies use a slow rate (2–5 Hz) of repetitive electrical stimulation. The study is positive if the motor response declines by more than 10%. However, a decremental response is not specific for myasthenia gravis, as it may be seen in other neuromuscular disorders such as motor neuron disease or Lambert-Eaton myasthenic syndrome.
This test is technically easier to do in distal muscles than in proximal muscles, but less sensitive. Therefore, proximal muscles such as the trapezius or facial muscles are usually also sampled to maximize the yield. To further maximize the sensitivity, muscles being tested should be warm, and acetylcholinesterase inhibitors should be withheld for 12 hours before.
Repetitive nerve stimulation studies in distal muscles are positive in approximately 75% of patients with generalized myasthenia gravis and in 30% with ocular myasthenia gravis.26
Single-fiber electromyography is more technically demanding than repetitive nerve stimulation and is less widely available. It is usually performed with a special needle electrode that can simultaneously identify action potentials arising from individual muscle fibers innervated by the same axon.
Variability in time of the second action potential relative to the first is called “jitter.” Abnormal jitter is seen in more than 95% of patients with generalized myasthenia gravis and in 85% to 90% of those with ocular myasthenia gravis.26,27 However, abnormal jitter can also be seen in other neuromuscular diseases such as motor neuron disease or in neuromuscular junctional disorders such as Lambert-Eaton myasthenic syndrome.
Imaging studies
Chest computed tomography or magnetic resonance imaging with contrast should be performed in all myasthenia gravis patients to look for a thymoma.
TREATMENT OF MYASTHENIA GRAVIS
Acetylcholinesterase inhibitors
As a reasonable first therapy in mild cases of myasthenia gravis, acetylcholinesterase inhibitors slow down the degradation of acetylcholine and prolong its effect in the neuromuscular junction, but they are not disease-modifying and their benefits are mild.
Pyridostigmine is the usual choice of acetylcholinesterase inhibitor. Its onset of action is rapid (15 to 30 minutes) and its action lasts for 3 to 4 hours. For most patients, the effective dosage range is 60 mg to 90 mg every 4 to 6 hours. A long-acting form is also available and can be given as a single nighttime dose.
Immunomodulating therapy
Patients who have moderate to severe symptoms require some form of immunomodulating therapy.
Plasmapheresis or intravenous immune globulin is reserved for patients with severe or rapidly worsening disease because their beneficial effects can be seen within the first week of treatment.
Longer-acting immunotherapies (corticosteroids, azathioprine, mycophenolate mofetil and others) have a slower onset of responses but provide sustained benefits. Which drug to use depends on factors such as comorbidity, side effects, and cost.
Drugs to avoid
A number of medications can exacerbate weakness in myasthenia gravis and should be avoided or used with caution. The list is long, but ones that deserve the most attention are penicillamine, interferons, procainamide, quinidine, and antibiotics, including quinolones and aminoglycosides. A more comprehensive list of medications that may exacerbate myasthenia gravis symptoms can be found in a review by Keesey.2
RAPID INDUCTION IMMUNOTHERAPIES : PLASMAPHERESIS, IMMUNE GLOBULIN
Both plasmapheresis and intravenous immune globulin act quickly over days, but in most patients their effects last only a few weeks. Both are used as rescue therapies for myasthenic crises, bridging therapy to slow-acting immunotherapeutic agents, or maintenance treatment for poorly controlled cases.
Several retrospective studies have confirmed the efficacy of plasmapheresis in more than 80% of patients with generalized symptoms.28,29
In a randomized trial in patients with generalized therapies, intravenous immune globulin improved muscle strength in the group of patients with severe symptoms.30 The effective dosage of intravenous immune globulin varies from 1 to 2 g/kg without observed difference between doses.31 Trials comparing the efficacy of intravenous immune globulin and plasmapheresis in acute and severe myasthenia gravis did not reveal a difference in efficacy.32,33 Intravenous immune globulin at a minimal dose of 0.4 g/kg every 3 months has been successfully used as a long-term maintenance monotherapy, and such a role could be expanded to more patients with further studies.34
The choice between plasmapheresis and intravenous immune globulin is often based on the ability of a patient to tolerate each treatment and on the availability of the plasmapheresis procedure. Intravenous immune globulin is easier to administer, is associated with fewer adverse events related to vascular access, and is therefore more appropriate than plasmapheresis in some centers.
CHRONIC MAINTENANCE IMMUNOMODULATING TREATMENT
Corticosteroids
Prednisone, the most commonly used agent, leads to remission or marked improvement in 70% to 80% of patients with ocular or generalized myasthenia gravis.35 It may also reduce the progression of ocular myasthenia gravis to the generalized form.36
The effective dose of prednisone depends on the severity and distribution of symptoms. Some patients may need up to 1.0 mg/kg/day (usually 50 to 80 mg per day). In patients with mild to moderate symptoms, a lower maximal dosage such as 20 to 40 mg per day can be sufficient.
Within 1 to 2 weeks after starting high-dose prednisone, up to 50% of patients may develop a transient deterioration, including possible precipitation of a myasthenic crisis.37 For this reason, high-dose prednisone is commonly started only in hospitalized patients who are also receiving plasmapheresis or intravenous immune globulin. Otherwise, an outpatient dose-escalation protocol can be used to achieve a target dose over several weeks.
Prednisone tapering can begin after the patient has been on the maximal dose for 1 to 2 months and significant improvement is evident. A monthly tapering of 5 to 10 mg is preferred, then more slowly after the daily dose reaches 30 mg. The usual maintenance dose averages about 5 mg daily.
Common side effects of prednisone include weight gain, cushingoid features, easy bruising, cataracts, glaucoma, hypertension, diabetes, dyslipidemia, and osteoporosis. Patients are advised to take supplemental calcium (1,500 mg per day) and vitamin D (400 to 800 IU per day). For those most at risk of osteoporosis, treatment with a bisphosphonate should be considered.
Other immunotherapeutic agents are often needed, either to replace the corticosteroid or to permit use of lower doses of it. Because of their delayed onset of action, starting such corticosteroid-sparing agents early in the course is often necessary. These agents are often initially combined with high-dose prednisone, with an eventual goal of weaning off prednisone entirely. This strategy offers the advantage of relatively rapid induction while avoiding the long-term adverse effects of corticosteroid treatment.
Azathioprine
Azathioprine doesn’t begin to show a beneficial effect in myasthenia gravis for 6 to 12 months, and it often reaches its maximal efficacy only after 1 to 2 years of treatment.38
In a study of 78 myasthenia gravis patients, 91% improved when treated with azathioprine alone or together with prednisone.39 In another study using azathioprine and prednisolone for generalized myasthenia gravis, nearly two-thirds of patients came off prednisolone while maintaining remission for 3 years.38
A typical maintenance dose is 2 to 3 mg/kg/day. Common side effects are nausea, vomiting, and malaise. Less frequent side effects include hematologic abnormalities, abnormal liver function, and pancreatitis. Monthly monitoring of complete blood cell counts and liver function tests is warranted for the first 6 months, then less often.
One in 300 people in the general population is homozygous for a mutant allele in the thiopurine methyltransferase (TPMT) gene. Patients with this genotype should not receive azathioprine because of the risk of life-threatening bone marrow suppression.40 A slightly increased risk of various forms of lymphoma has been documented.41
Mycophenolate mofetil
A well-tolerated medication with few side effects, mycophenolate mofetil is being used more in myasthenia gravis. The results of two recent randomized trials suggested that it is not effective in improving myasthenia gravis symptoms or sparing prednisone dosage when used for 90 days or 36 weeks.42,43 However, extensive clinical experience supports its longterm efficacy in myasthenia gravis.
In a retrospective study of 85 patients with generalized myasthenia gravis, mycophenolate at doses of 1 to 3 g daily improved symptoms in 73% and produced remission in 50%. Steroid dosage was reduced in 71% of patients.44
Another retrospective study, with 102 patients, verified a slow development of clinical benefit after months of mycophenolate therapy alone or in combination with prednisone. Approximately 50% of patients achieved a minimal manifestation status after 6 to 12 months of mycophenolate treatment. Eventually, at 24 months of treatment, 80% of patients had a desirable outcome of minimal clinical manifestation or better, 55% of patients were able to come off prednisone entirely, and 75% were taking less than 7.5 mg of prednisone per day.45
Common side effects of mycophenolate include nausea, diarrhea, and infections such as urinary tract infections and herpes reactivation. The complete blood cell count needs to be monitored frequently during the first 6 months of therapy. Leukopenia can occur but rarely necessitates stopping mycophenolate. Long-term safety data are lacking, but so far there has been no clearly increased risk of malignancy.
Mycophenolate exposure in pregnancy results in a high incidence of major fetal malformations. Therefore, its use in pregnant patients is discouraged, and women of child-bearing age should use effective contraception.46
Cyclosporine
A randomized trial in a small number of patients suggested that cyclosporine is fairly effective as monotherapy.47 Its onset of action in myasthenia gravis is faster than that of other corticosteroid-sparing agents, and clinical benefit can often be observed as early as 1 to 2 months. A dose of 5 mg/kg/day and a maintenance serum level of 100 to 150 ng/mL are generally recommended. However, renal, hepatic, and hematologic toxicities and interactions with other medications make cyclosporine a less attractive choice.
Methotrexate
A randomized trial evaluated the utility of methotrexate as a steroid-sparing agent compared with azathioprine.48 At 24 months, its steroid-sparing effect was similar to that of azathioprine, and the prednisone dosage had been reduced in more than 50% of patients.
Another phase II trial studying the efficacy of methotrexate in myasthenia gravis is under way.49
Rituximab
Rituximab is a monoclonal antibody against B-cell membrane marker CD20. A growing number of case series support its efficacy in patients with severe generalized myasthenia gravis refractory to multiple immunosuppressants.16,50 It seems particularly effective for MuSK antibody-positive disease, reducing MuSK antibody titers and having a treatment effect that lasts for years.
The standard dosage is 375 mg/m2 per week for 4 consecutive weeks. Peripheral B cells tend to be depleted within 2 weeks after the first infusion, while T-cell populations remain unchanged.50
A minimal infusion reaction such as flushing and chills can be seen with the first infusion. Patients may be more susceptible to certain infections such as reactivation of herpes zoster, but overall rituximab is well tolerated. Rare cases of progressive multifocal leukoencephalopathy have been reported in patients taking it, but none have occurred so far in myasthenia gravis treatment.
Cyclophosphamide
Cyclophosphamide is an alkylating agent that reduces proliferation of both B and T cells. It can be effective in myasthenia gravis, but potentially serious side effects limit its use. It should be reserved for the small percentage of cases that are refractory to other immunotherapies.
Thymectomy
Surgical treatment should be considered for patients with thymoma. If the tumor cannot be surgically resected, chemoradiotherapy can be considered for relief of myasthenic symptoms and for prevention of local invasion.
Thymomas recur in a minority of patients many years after the initial resection, sometimes without myasthenia gravis symptoms. A recurrence of symptoms does not necessarily indicate a recurrence of thymoma. The lack of correlation between myasthenia gravis symptoms and thymoma recurrence highlights the importance of radiologic follow-up in these patients.
For patients without thymoma, many experts believe that thymectomy is beneficial in patients under age 60 who have generalized myasthenia gravis. The likelihood of medication-free remission is about twice as high, and the likelihood of becoming asymptomatic is about one and a half times higher after thymectomy.51 However, it takes up to several years for the benefits of thymectomy to manifest, and thymectomy does not guarantee protection from developing AChR antibody-positive myasthenia gravis in the future.
The optimal timing of thymectomy is not well established; however, the procedure is usually recommended within the first 3 years of diagnosis.52 The response rates from thymectomy are similar for AChR antibody-positive and seronegative patients. In general, thymectomy for MuSK antibody-positive patients has not been effective, and its role in ocular myasthenia gravis is unclear.2,53
- Alshekhlee A, Miles JD, Katirji B, Preston DC, Kaminski HJ. Incidence and mortality rates of myasthenia gravis and myasthenic crisis in US hospitals. Neurology 2009; 72:1548–1554.
- Keesey JC. Clinical evaluation and management of myasthenia gravis. Muscle Nerve 2004; 29:484–505.
- Leite MI, Coutinho E, Lana-Peixoto M, et al. Myasthenia gravis and neuromyelitis optica spectrum disorder: a multicenter study of 16 patients. Neurology 2012; 78:1601–1607.
- Drachman DB, Angus CW, Adams RN, Michelson JD, Hoffman GJ. Myasthenic antibodies cross-link acetylcholine receptors to accelerate degradation. N Engl J Med 1978; 298:1116–1122.
- Fujii Y. The thymus, thymoma and myasthenia gravis. Surg Today 2013; 43:461–466.
- Evoli A, Lindstrom J. Myasthenia gravis with antibodies to MuSK: another step toward solving mystery? Neurology 2011; 77:1783–1784.
- Mori S, Kubo S, Akiyoshi T, et al. Antibodies against muscle-specific kinase impair both presynaptic and postsynaptic functions in a murine model of myasthenia gravis. Am J Pathol 2012; 180:798–810.
- Guptill JT, Sanders DB, Evoli A. Anti-MuSK antibody myasthenia gravis: clinical findings and response to treatment in two large cohorts. Muscle Nerve 2011; 44:36–40.
- Chevessier F, Girard E, Molgó J, et al. A mouse model for congenital myasthenic syndrome due to MuSK mutations reveals defects in structure and function of neuromuscular junctions. Hum Mol Genet 2008; 17:3577–3595.
- Richman DP, Nishi K, Morell SW, et al. Acute severe animal model of anti-muscle-specific kinase myasthenia: combined postsynaptic and presynaptic changes. Arch Neurol 2012; 69:453–460.
- Klooster R, Plomp JJ, Huijbers MG, et al. Muscle-specific kinase myasthenia gravis IgG4 autoantibodies cause severe neuromuscular junction dysfunction in mice. Brain 2012; 135:1081–1101.
- Viegas S, Jacobson L, Waters P, et al. Passive and active immunization models of MuSK-Ab positive myasthenia: electrophysiological evidence for pre and postsynaptic defects. Exp Neurol 2012; 234:506–512.
- Niks EH, Kuks JB, Wokke JH, et al. Pre- and postsynaptic neuromuscular junction abnormalities in musk myasthenia. Muscle Nerve 2010; 42:283–288.
- Kawakami Y, Ito M, Hirayama M, et al. Anti-MuSK autoantibodies block binding of collagen Q to MuSK. Neurology 2011; 77:1819–1826.
- Chan KH, Lachance DH, Harper CM, Lennon VA. Frequency of seronegativity in adult-acquired generalized myasthenia gravis. Muscle Nerve 2007; 36:651–658.
- Collongues N, Casez O, Lacour A, et al. Rituximab in refractory and non-refractory myasthenia: a retrospective multicenter study. Muscle Nerve 2012; 46:687–691.
- Sanders DB, Andrews PI, Howard JF, Massey JM. Seronegative myasthenia gravis. Neurology 1997; 48(suppl 5):40S–45S.
- Shiraishi H, Motomura M, Yoshimura T, et al. Acetylcholine receptors loss and postsynaptic damage in MuSK antibody-positive myasthenia gravis. Ann Neurol 2005; 57:289–293.
- Leite MI, Jacob S, Viegas S, et al. IgG1 antibodies to acetylcholine receptors in ‘seronegative’ myasthenia gravis. Brain 2008; 131:1940–1952.
- Jacob S, Viegas S, Leite MI, et al. Presence and pathogenic relevance of antibodies to clustered acetylcholine receptor in ocular and generalized myasthenia gravis. Arch Neurol 2012; 69:994–1001.
- Higuchi O, Hamuro J, Motomura M, Yamanashi Y. Autoantibodies to low-density lipoprotein receptor-related protein 4 in myasthenia gravis. Ann Neurol 2011; 69:418–422.
- Pevzner A, Schoser B, Peters K, et al. Anti-LRP4 autoantibodies in AChR- and MuSK-antibody-negative myasthenia gravis. J Neurol 2012; 259:427–435.
- Zhang B, Tzartos JS, Belimezi M, et al. Autoantibodies to lipoprotein-related protein 4 in patients with double-seronegative myasthenia gravis. Arch Neurol 2012; 69:445–451.
- Kupersmith MJ, Latkany R, Homel P. Development of generalized disease at 2 years in patients with ocular myasthenia gravis. Arch Neurol 2003; 60:243–248.
- Pasnoor M, Wolfe GI, Nations S, et al. Clinical findings in MuSK-antibody positive myasthenia gravis: a US experience. Muscle Nerve 2010; 41:370–374.
- Oh SJ, Kim DE, Kuruoglu R, Bradley RJ, Dwyer D. Diagnostic sensitivity of the laboratory tests in myasthenia gravis. Muscle Nerve 1992; 15:720–724.
- Sanders DB, Stålberg EV. AAEM minimonograph #25: single-fiber electromyography. Muscle Nerve 1996; 19:1069–1083.
- Lazo-Langner A, Espinosa-Poblano I, Tirado-Cárdenas N, et al. Therapeutic plasma exchange in Mexico: experience from a single institution. Am J Hematol 2002; 70:16–21.
- Carandina-Maffeis R, Nucci A, Marques JF, et al. Plasmapheresis in the treatment of myasthenia gravis: retrospective study of 26 patients. Arq Neuropsiquiatr 2004; 62:391–395.
- Zinman L, Ng E, Bril V. IV immunoglobulin in patients with myasthenia gravis: a randomized controlled trial. Neurology 2007; 68:837–841.
- Gajdos P, Tranchant C, Clair B, et al; Myasthenia Gravis Clinical Study Group. Treatment of myasthenia gravis exacerbation with intravenous immunoglobulin: a randomized double-blind clinical trial. Arch Neurol 2005; 62:1689–1693.
- Rønager J, Ravnborg M, Hermansen I, Vorstrup S. Immunoglobulin treatment versus plasma exchange in patients with chronic moderate to severe myasthenia gravis. Artif Organs 2001; 25:967–973.
- Barth D, Nabavi Nouri M, Ng E, Nwe P, Bril V. Comparison of IVIg and PLEX in patients with myasthenia gravis. Neurology 2011; 76:2017–2023.
- Wegner B, Ahmed I. Intravenous immunoglobulin monotherapy in long-term treatment of myasthenia gravis. Clin Neurol Neurosurg 2002; 105:3–8.
- Pascuzzi RM, Coslett HB, Johns TR. Long-term corticosteroid treatment of myasthenia gravis: report of 116 patients. Ann Neurol 1984; 15:291–298.
- Monsul NT, Patwa HS, Knorr AM, Lesser RL, Goldstein JM. The effect of prednisone on the progression from ocular to generalized myasthenia gravis. J Neurol Sci 2004; 217:131–133.
- Miller RG, Milner-Brown HS, Mirka A. Prednisone-induced worsening of neuromuscular function in myasthenia gravis. Neurology 1986; 36:729–732.
- Palace J, Newsom-Davis J, Lecky B. A randomized double-blind trial of prednisolone alone or with azathioprine in myasthenia gravis. Myasthenia Gravis Study Group. Neurology 1998; 50:1778–1783.
- Mertens HG, Hertel G, Reuther P, Ricker K. Effect of immunosuppressive drugs (azathioprine). Ann N Y Acad Sci 1981; 377:691–699.
- Relling MV, Gardner EE, Sandborn WJ, et al; Clinical Pharmacogenetics Implementation Consortium. Clinical Pharmacogenetics Implementation Consortium guidelines for thiopurine methyltransferase genotype and thiopurine dosing. Clin Pharmacol Ther 2011; 89:387–391.
- Finelli PF. Primary CNS lymphoma in myasthenic on long-term azathioprine. J Neurooncol 2005; 74:91–92.
- Sanders DB, Hart IK, Mantegazza R, et al. An international, phase III, randomized trial of mycophenolate mofetil in myasthenia gravis. Neurology 2008; 71:400–406.
- Muscle Study Group. A trial of mycophenolate mofetil with prednisone as initial immunotherapy in myasthenia gravis. Neurology 2008; 71:394–399.
- Meriggioli MN, Ciafaloni E, Al-Hayk KA, et al. Mycophenolate mofetil for myasthenia gravis: an analysis of efficacy, safety, and tolerability. Neurology 2003; 61:1438–1440.
- Hehir MK, Burns TM, Alpers J, Conaway MR, Sawa M, Sanders DB. Mycophenolate mofetil in AChR-antibody-positive myasthenia gravis: outcomes in 102 patients. Muscle Nerve 2010; 41:593–598.
- Merlob P, Stahl B, Klinger G. Tetrada of the possible mycophenolate mofetil embryopathy: a review. Reprod Toxicol 2009; 28:105–108.
- Tindall RS, Rollins JA, Phillips JT, Greenlee RG, Wells L, Belendiuk G. Preliminary results of a double-blind, randomized, placebo-controlled trial of cyclosporine in myasthenia gravis. N Engl J Med 1987; 316:719–724.
- Heckmann JM, Rawoot A, Bateman K, Renison R, Badri M. A single-blinded trial of methotrexate versus azathioprine as steroid-sparing agents in generalized myasthenia gravis. BMC Neurol 2011; 11:97.
- Pasnoor M, He J, Herbelin L, Dimachkie M, Barohn RJ; Muscle Study Group. Phase II trial of methotrexate in myasthenia gravis. Ann N Y Acad Sci 2012; 1275:23–28.
- Díaz-Manera J, Martínez-Hernández E, Querol L, et al. Long-lasting treatment effect of rituximab in MuSK myasthenia. Neurology 2012; 78:189–193.
- Gronseth GS, Barohn RJ. Practice parameter: thymectomy for autoimmune myasthenia gravis (an evidence-based review): Report of the Quality Standards Subcommittee of the American Academy of Neurology. Neurology 2000; 55:7–15.
- Kumar V, Kaminski HJ. Treatment of myasthenia gravis. Curr Neurol Neurosci Rep 2011; 11:89–96.
- Pompeo E, Tacconi F, Massa R, Mineo D, Nahmias S, Mineo TC. Long-term outcome of thoracoscopic extended thymectomy for nonthymomatous myasthenia gravis. Eur J Cardiothorac Surg 2009; 36:164–169.
Current therapies for myasthenia gravis can help most patients achieve sustained improvement. The overall prognosis has dramatically improved over the last 4 decades: the mortality rate used to be 75%; now it is 4.5%.1
Myasthenia gravis is the most common disorder of neuromuscular junction transmission and is also one of the best characterized autoimmune diseases. However, its symptoms—primarily weakness—vary from patient to patient, and in the same patient, by time of day and over longer time periods. The variation in symptoms can be very confusing to undiagnosed patients and puzzling to unsuspecting physicians. Such diagnostic uncertainty can give the patient additional frustration and emotional stress, which in turn exacerbate his or her condition.
In this review, we will give an overview of the pathogenesis, clinical manifestations, diagnosis, and treatment of myasthenia gravis.
TWO PEAKS IN INCIDENCE BY AGE
The annual incidence of myasthenia gravis is approximately 10 to 20 new cases per million, with a prevalence of about 150 to 200 per million.2
The age of onset has a bimodal distribution, with an early incidence peak in the second to third decade with a female predominance and a late peak in the 6th to the 8th decade with a male predominance.2
Myasthenia gravis is commonly associated with several other autoimmune disorders, including hypothyroidism, hyperthyroidism, systemic lupus erythematosus, rheumatoid arthritis, vitiligo, diabetes, and, more recently recognized, neuromyelitis optica.3
ANTIBODIES AGAINST AChR AND MuSK
In most cases of myasthenia gravis the patient has autoimmune antibodies against constituents of the neuromuscular junction, specifically acetylcholine receptor (AChR) and muscle-specific tyrosine kinase (MuSK) (Figure 1).
AChR antibody-positive myasthenia gravis
When antibodies bind to AChR on the postsynaptic membrane, they cross-link neighboring AChR units, which are absorbed into the muscle fiber and are broken up.4 In addition, the complement system is activated to mediate further damage on the postsynaptic membrane.
AChR antibodies may come from germinal centers of the thymus, where clustered myoid cells express AChR on the plasma membrane surface.5 About 60% of AChR antibody-positive myasthenia gravis patients have an enlarged thymus, and 10% have a thymoma—a tumor of the epithelial cells of this organ. Conversely, about 15% of patients with a thymoma have clinical myasthenia gravis, and an additional 20% possess antibodies against AChR in the serum without myasthenic symptoms.5
MuSK antibody-positive myasthenia gravis
Like AChR, MuSK is a transmembrane component of the postsynaptic neuromuscular junction. During formation of the neuromuscular junction, MuSK is activated through the binding of agrin (a nerve-derived proteoglycan) to lipoprotein-related protein 4 (LRP4), after which complicated intracellular signaling promotes the assembly and stabilization of AChR.6
Unlike AChR antibodies, antibodies against MuSK do not activate the complement system, and complement fixation is not essential for clinical myasthenic symptoms to appear.7 Also, myasthenia gravis with MuSK antibodies is rarely associated with thymoma.8
The precise mechanism by which MuSK antibody impairs transmission at the neuromuscular junction has been a mystery until recently. Animal models, including MuSK-mutant mice and mice injected with MuSK protein or with purified immunoglobulin G from patients with this disease, have revealed a significant reduction of AChR clusters and destruction of neuromuscular junction structures.7,9–12
In addition, MuSK antibodies produce pre-synaptic dysfunction, manifesting as a reduction of acetylcholine content. This information is based on studies in mice and on in vitro electrophysiologic analyses of neuromuscular junctions from a patient with this disease.7,9–13
Finally, MuSK antibodies may indirectly affect the recycling of acetylcholine. After post-synaptic activation, acetylcholine is normally hydrolized by acetylcholinesterase, which is located in the synaptic cleft but anchored to MuSK on the postsynaptic membrane. MuSK antibodies block the binding of MuSK to acetylcholinesterase, possibly leading to less accumulation of acetylcholinesterase.14 This process may explain why patients with MuSK antibody-positive myasthenia gravis tend to respond poorly to acetylcholinesterase inhibitors (more about this below).
Seronegative myasthenia gravis
In a series of 562 consecutive patients with generalized weakness due to myasthenia gravis, 92% were positive for AChR antibody, 3% were positive for MuSK antibody, and 5% were seronegative (possessing neither antibody).15 In contrast, about 50% of patients with purely ocular myasthenia gravis (ie, with isolated weakness of the levator palpebrae superioris, orbicularis oculi, or oculomotor muscles) are seropositive for AChR antibody. Only a few ocular MuSK antibody-positive cases have been described, leaving the rest seronegative. Rarely, both antibodies can be detected in the same patient.16
In patients who are negative for AChR antibodies at the time of disease onset, sero-conversion may occur later during the course. Repeating serologic testing 6 to 12 months later may detect AChR antibodies in approximately 15% of patients who were initially seronegative.15,17
The clinical presentation, electrophysiologic findings, thymic pathologic findings, and treatment responses are similar in AChR antibody-positive and seronegative myasthenia gravis.17 Muscle biopsy study in seronegative cases demonstrates a loss of AChR as well.18
Based on these observations, it has been proposed that seronegative patients may have low-affinity antibodies that can bind to tightly clustered AChRs on the postsynaptic membrane but escape detection by routine radioimmunoassays in a solution phase. With a sensitive cell-based immunofluorescence assay, low-affinity antibodies to clustered AChRs were detected in 66% of patients with generalized myasthenia gravis and in 50% of those with ocular myasthenia gravis who were seronegative on standard assays.19,20 These low-affinity AChR antibodies can also activate complement in vitro, increasing the likelihood that they are pathogenic. However, assays to detect low-affinity AChR antibodies are not yet commercially available.
Within the past year, three research groups independently reported detecting antibodies to LRP4 in 2% to 50% of seronegative myasthenia gravis patients. This wide variation in the prevalence of LRP4 antibodies could be related to patient ethnicity and methods of detection.21–23 LRP4 is a receptor for agrin and is required for agrin-induced MuSK activation and AChR clustering. LRP antibodies can activate complement; therefore, it is plausible that LRP4 antibody binding leads to AChR loss on the postsynaptic membrane. However, additional study is needed to determine if LRP4 antibodies are truly pathogenic in myasthenia gravis.
A DISORDER OF FATIGABLE WEAKNESS
Myasthenia gravis is a disorder of fatigable weakness producing fluctuating symptoms. Symptoms related to the involvement of specific muscle groups are listed in Table 1. Muscle weakness is often worse later in the day or after exercise.
Ocular myasthenia gravis accounts for about 15% of all cases. Of patients initially presenting with ocular symptoms only, twothirds will ultimately develop generalized symptoms, most within the first 2 years.24 No factor has been identified that predicts conversion from an ocular to a generalized form.
Several clinical phenotypes of MuSK antibody-positive myasthenia gravis have been described. An oculobulbar form presents with diplopia, ptosis, dysarthria, and profound atrophy of the muscles of the tongue and face. A restricted myopathic form presents with prominent neck, shoulder, and respiratory weakness without ocular involvement. A third form is a combination of ocular and proximal limb weakness, indistinguishable from AChR antibody-positive disease.25
MuSK antibody-positive patients do not respond as well to acetylcholinesterase inhibitors as AChR antibody-positive patients do. In one study, nearly 70% of MuSK antibody-positive patients demonstrated no response, poor tolerance, or cholinergic hypersensitivity to these agents.25 Fortunately, most MuSK antibody-positive patients have a favorable response to immunosuppressive therapy—sometimes a dramatic improvement after plasmapheresis.8
DIAGNOSIS OF MYASTHENIA GRAVIS
The common differential diagnoses for myasthenia gravis are listed in Table 2.
The essential feature of myasthenia gravis is fluctuating muscle weakness, often with fatigue. Many patients complain of weakness of specific muscle groups after their repeated usage. Pain is generally a less conspicuous symptom, and generalized fatigue without objective weakness is inconsistent with myasthenia gravis.
Signs of muscle weakness may include droopy eyelids, diplopia, inability to hold the head straight, difficulty swallowing or chewing, speech disturbances, difficulty breathing, and difficulty raising the arms or rising from the sitting position. A historical pattern of ptosis alternating from one eye to the other is fairly characteristic of myasthenia gravis.
The weakness of orbicularis oculi is easily identified on examination by prying open the eyes during forced eye closure. Limb weakness is usually more significant in the arms than in the legs. An often-neglected feature of myasthenia gravis is finger extensor weakness with a relative sparing of other distal hand muscles.2
The ice-pack test is performed by placing a small bag of ice over the ptotic eye for 2 to 5 minutes and assessing the degree of ptosis for any noticeable improvement. This test is not very helpful for assessing ocular motor weakness.
The edrophonium (Tensilon) test can be used for patients with ptosis or ophthalmoparesis. Edrophonium, a short-acting acetylcholinesterase inhibitor, is given intravenously while the patient is observed for objective improvement. The patient’s cardiovascular status should be monitored for arrhythmias and hypotension. Atropine should be immediately available in case severe bradycardia develops.
The ice-pack test and the edrophonium test can give false-negative and false-positive results, and the diagnosis of myasthenia gravis must be verified by other diagnostic tests.
Testing for antibodies
Testing for circulating AChR antibodies, MuSK antibodies, or both is the first step in the laboratory confirmation of myasthenia gravis.
There are three AChR antibody subtypes: binding, blocking, and modulating. Binding antibodies are present in 80% to 90% of patients with generalized myasthenia gravis and 50% of those with ocular myasthenia gravis. Testing for blocking and modulating AChR antibodies increases the sensitivity by less than 5% when added to testing for binding antibodies.
AChR antibody titers correlate poorly with disease severity between patients. However, in individual patients, antibody titers tend to go down in parallel with clinical improvement.
MuSK antibody is detected in nearly half of myasthenia gravis patients with generalized weakness who are negative for AChR antibody.
Electrophysiologic tests
Electrophysiologic tests can usually confirm the diagnosis of seronegative myasthenia gravis. They are also helpful in seropositive patients who have unusual clinical features or a poor response to treatment.
Repetitive nerve stimulation studies use a slow rate (2–5 Hz) of repetitive electrical stimulation. The study is positive if the motor response declines by more than 10%. However, a decremental response is not specific for myasthenia gravis, as it may be seen in other neuromuscular disorders such as motor neuron disease or Lambert-Eaton myasthenic syndrome.
This test is technically easier to do in distal muscles than in proximal muscles, but less sensitive. Therefore, proximal muscles such as the trapezius or facial muscles are usually also sampled to maximize the yield. To further maximize the sensitivity, muscles being tested should be warm, and acetylcholinesterase inhibitors should be withheld for 12 hours before.
Repetitive nerve stimulation studies in distal muscles are positive in approximately 75% of patients with generalized myasthenia gravis and in 30% with ocular myasthenia gravis.26
Single-fiber electromyography is more technically demanding than repetitive nerve stimulation and is less widely available. It is usually performed with a special needle electrode that can simultaneously identify action potentials arising from individual muscle fibers innervated by the same axon.
Variability in time of the second action potential relative to the first is called “jitter.” Abnormal jitter is seen in more than 95% of patients with generalized myasthenia gravis and in 85% to 90% of those with ocular myasthenia gravis.26,27 However, abnormal jitter can also be seen in other neuromuscular diseases such as motor neuron disease or in neuromuscular junctional disorders such as Lambert-Eaton myasthenic syndrome.
Imaging studies
Chest computed tomography or magnetic resonance imaging with contrast should be performed in all myasthenia gravis patients to look for a thymoma.
TREATMENT OF MYASTHENIA GRAVIS
Acetylcholinesterase inhibitors
As a reasonable first therapy in mild cases of myasthenia gravis, acetylcholinesterase inhibitors slow down the degradation of acetylcholine and prolong its effect in the neuromuscular junction, but they are not disease-modifying and their benefits are mild.
Pyridostigmine is the usual choice of acetylcholinesterase inhibitor. Its onset of action is rapid (15 to 30 minutes) and its action lasts for 3 to 4 hours. For most patients, the effective dosage range is 60 mg to 90 mg every 4 to 6 hours. A long-acting form is also available and can be given as a single nighttime dose.
Immunomodulating therapy
Patients who have moderate to severe symptoms require some form of immunomodulating therapy.
Plasmapheresis or intravenous immune globulin is reserved for patients with severe or rapidly worsening disease because their beneficial effects can be seen within the first week of treatment.
Longer-acting immunotherapies (corticosteroids, azathioprine, mycophenolate mofetil and others) have a slower onset of responses but provide sustained benefits. Which drug to use depends on factors such as comorbidity, side effects, and cost.
Drugs to avoid
A number of medications can exacerbate weakness in myasthenia gravis and should be avoided or used with caution. The list is long, but ones that deserve the most attention are penicillamine, interferons, procainamide, quinidine, and antibiotics, including quinolones and aminoglycosides. A more comprehensive list of medications that may exacerbate myasthenia gravis symptoms can be found in a review by Keesey.2
RAPID INDUCTION IMMUNOTHERAPIES : PLASMAPHERESIS, IMMUNE GLOBULIN
Both plasmapheresis and intravenous immune globulin act quickly over days, but in most patients their effects last only a few weeks. Both are used as rescue therapies for myasthenic crises, bridging therapy to slow-acting immunotherapeutic agents, or maintenance treatment for poorly controlled cases.
Several retrospective studies have confirmed the efficacy of plasmapheresis in more than 80% of patients with generalized symptoms.28,29
In a randomized trial in patients with generalized therapies, intravenous immune globulin improved muscle strength in the group of patients with severe symptoms.30 The effective dosage of intravenous immune globulin varies from 1 to 2 g/kg without observed difference between doses.31 Trials comparing the efficacy of intravenous immune globulin and plasmapheresis in acute and severe myasthenia gravis did not reveal a difference in efficacy.32,33 Intravenous immune globulin at a minimal dose of 0.4 g/kg every 3 months has been successfully used as a long-term maintenance monotherapy, and such a role could be expanded to more patients with further studies.34
The choice between plasmapheresis and intravenous immune globulin is often based on the ability of a patient to tolerate each treatment and on the availability of the plasmapheresis procedure. Intravenous immune globulin is easier to administer, is associated with fewer adverse events related to vascular access, and is therefore more appropriate than plasmapheresis in some centers.
CHRONIC MAINTENANCE IMMUNOMODULATING TREATMENT
Corticosteroids
Prednisone, the most commonly used agent, leads to remission or marked improvement in 70% to 80% of patients with ocular or generalized myasthenia gravis.35 It may also reduce the progression of ocular myasthenia gravis to the generalized form.36
The effective dose of prednisone depends on the severity and distribution of symptoms. Some patients may need up to 1.0 mg/kg/day (usually 50 to 80 mg per day). In patients with mild to moderate symptoms, a lower maximal dosage such as 20 to 40 mg per day can be sufficient.
Within 1 to 2 weeks after starting high-dose prednisone, up to 50% of patients may develop a transient deterioration, including possible precipitation of a myasthenic crisis.37 For this reason, high-dose prednisone is commonly started only in hospitalized patients who are also receiving plasmapheresis or intravenous immune globulin. Otherwise, an outpatient dose-escalation protocol can be used to achieve a target dose over several weeks.
Prednisone tapering can begin after the patient has been on the maximal dose for 1 to 2 months and significant improvement is evident. A monthly tapering of 5 to 10 mg is preferred, then more slowly after the daily dose reaches 30 mg. The usual maintenance dose averages about 5 mg daily.
Common side effects of prednisone include weight gain, cushingoid features, easy bruising, cataracts, glaucoma, hypertension, diabetes, dyslipidemia, and osteoporosis. Patients are advised to take supplemental calcium (1,500 mg per day) and vitamin D (400 to 800 IU per day). For those most at risk of osteoporosis, treatment with a bisphosphonate should be considered.
Other immunotherapeutic agents are often needed, either to replace the corticosteroid or to permit use of lower doses of it. Because of their delayed onset of action, starting such corticosteroid-sparing agents early in the course is often necessary. These agents are often initially combined with high-dose prednisone, with an eventual goal of weaning off prednisone entirely. This strategy offers the advantage of relatively rapid induction while avoiding the long-term adverse effects of corticosteroid treatment.
Azathioprine
Azathioprine doesn’t begin to show a beneficial effect in myasthenia gravis for 6 to 12 months, and it often reaches its maximal efficacy only after 1 to 2 years of treatment.38
In a study of 78 myasthenia gravis patients, 91% improved when treated with azathioprine alone or together with prednisone.39 In another study using azathioprine and prednisolone for generalized myasthenia gravis, nearly two-thirds of patients came off prednisolone while maintaining remission for 3 years.38
A typical maintenance dose is 2 to 3 mg/kg/day. Common side effects are nausea, vomiting, and malaise. Less frequent side effects include hematologic abnormalities, abnormal liver function, and pancreatitis. Monthly monitoring of complete blood cell counts and liver function tests is warranted for the first 6 months, then less often.
One in 300 people in the general population is homozygous for a mutant allele in the thiopurine methyltransferase (TPMT) gene. Patients with this genotype should not receive azathioprine because of the risk of life-threatening bone marrow suppression.40 A slightly increased risk of various forms of lymphoma has been documented.41
Mycophenolate mofetil
A well-tolerated medication with few side effects, mycophenolate mofetil is being used more in myasthenia gravis. The results of two recent randomized trials suggested that it is not effective in improving myasthenia gravis symptoms or sparing prednisone dosage when used for 90 days or 36 weeks.42,43 However, extensive clinical experience supports its longterm efficacy in myasthenia gravis.
In a retrospective study of 85 patients with generalized myasthenia gravis, mycophenolate at doses of 1 to 3 g daily improved symptoms in 73% and produced remission in 50%. Steroid dosage was reduced in 71% of patients.44
Another retrospective study, with 102 patients, verified a slow development of clinical benefit after months of mycophenolate therapy alone or in combination with prednisone. Approximately 50% of patients achieved a minimal manifestation status after 6 to 12 months of mycophenolate treatment. Eventually, at 24 months of treatment, 80% of patients had a desirable outcome of minimal clinical manifestation or better, 55% of patients were able to come off prednisone entirely, and 75% were taking less than 7.5 mg of prednisone per day.45
Common side effects of mycophenolate include nausea, diarrhea, and infections such as urinary tract infections and herpes reactivation. The complete blood cell count needs to be monitored frequently during the first 6 months of therapy. Leukopenia can occur but rarely necessitates stopping mycophenolate. Long-term safety data are lacking, but so far there has been no clearly increased risk of malignancy.
Mycophenolate exposure in pregnancy results in a high incidence of major fetal malformations. Therefore, its use in pregnant patients is discouraged, and women of child-bearing age should use effective contraception.46
Cyclosporine
A randomized trial in a small number of patients suggested that cyclosporine is fairly effective as monotherapy.47 Its onset of action in myasthenia gravis is faster than that of other corticosteroid-sparing agents, and clinical benefit can often be observed as early as 1 to 2 months. A dose of 5 mg/kg/day and a maintenance serum level of 100 to 150 ng/mL are generally recommended. However, renal, hepatic, and hematologic toxicities and interactions with other medications make cyclosporine a less attractive choice.
Methotrexate
A randomized trial evaluated the utility of methotrexate as a steroid-sparing agent compared with azathioprine.48 At 24 months, its steroid-sparing effect was similar to that of azathioprine, and the prednisone dosage had been reduced in more than 50% of patients.
Another phase II trial studying the efficacy of methotrexate in myasthenia gravis is under way.49
Rituximab
Rituximab is a monoclonal antibody against B-cell membrane marker CD20. A growing number of case series support its efficacy in patients with severe generalized myasthenia gravis refractory to multiple immunosuppressants.16,50 It seems particularly effective for MuSK antibody-positive disease, reducing MuSK antibody titers and having a treatment effect that lasts for years.
The standard dosage is 375 mg/m2 per week for 4 consecutive weeks. Peripheral B cells tend to be depleted within 2 weeks after the first infusion, while T-cell populations remain unchanged.50
A minimal infusion reaction such as flushing and chills can be seen with the first infusion. Patients may be more susceptible to certain infections such as reactivation of herpes zoster, but overall rituximab is well tolerated. Rare cases of progressive multifocal leukoencephalopathy have been reported in patients taking it, but none have occurred so far in myasthenia gravis treatment.
Cyclophosphamide
Cyclophosphamide is an alkylating agent that reduces proliferation of both B and T cells. It can be effective in myasthenia gravis, but potentially serious side effects limit its use. It should be reserved for the small percentage of cases that are refractory to other immunotherapies.
Thymectomy
Surgical treatment should be considered for patients with thymoma. If the tumor cannot be surgically resected, chemoradiotherapy can be considered for relief of myasthenic symptoms and for prevention of local invasion.
Thymomas recur in a minority of patients many years after the initial resection, sometimes without myasthenia gravis symptoms. A recurrence of symptoms does not necessarily indicate a recurrence of thymoma. The lack of correlation between myasthenia gravis symptoms and thymoma recurrence highlights the importance of radiologic follow-up in these patients.
For patients without thymoma, many experts believe that thymectomy is beneficial in patients under age 60 who have generalized myasthenia gravis. The likelihood of medication-free remission is about twice as high, and the likelihood of becoming asymptomatic is about one and a half times higher after thymectomy.51 However, it takes up to several years for the benefits of thymectomy to manifest, and thymectomy does not guarantee protection from developing AChR antibody-positive myasthenia gravis in the future.
The optimal timing of thymectomy is not well established; however, the procedure is usually recommended within the first 3 years of diagnosis.52 The response rates from thymectomy are similar for AChR antibody-positive and seronegative patients. In general, thymectomy for MuSK antibody-positive patients has not been effective, and its role in ocular myasthenia gravis is unclear.2,53
- Alshekhlee A, Miles JD, Katirji B, Preston DC, Kaminski HJ. Incidence and mortality rates of myasthenia gravis and myasthenic crisis in US hospitals. Neurology 2009; 72:1548–1554.
- Keesey JC. Clinical evaluation and management of myasthenia gravis. Muscle Nerve 2004; 29:484–505.
- Leite MI, Coutinho E, Lana-Peixoto M, et al. Myasthenia gravis and neuromyelitis optica spectrum disorder: a multicenter study of 16 patients. Neurology 2012; 78:1601–1607.
- Drachman DB, Angus CW, Adams RN, Michelson JD, Hoffman GJ. Myasthenic antibodies cross-link acetylcholine receptors to accelerate degradation. N Engl J Med 1978; 298:1116–1122.
- Fujii Y. The thymus, thymoma and myasthenia gravis. Surg Today 2013; 43:461–466.
- Evoli A, Lindstrom J. Myasthenia gravis with antibodies to MuSK: another step toward solving mystery? Neurology 2011; 77:1783–1784.
- Mori S, Kubo S, Akiyoshi T, et al. Antibodies against muscle-specific kinase impair both presynaptic and postsynaptic functions in a murine model of myasthenia gravis. Am J Pathol 2012; 180:798–810.
- Guptill JT, Sanders DB, Evoli A. Anti-MuSK antibody myasthenia gravis: clinical findings and response to treatment in two large cohorts. Muscle Nerve 2011; 44:36–40.
- Chevessier F, Girard E, Molgó J, et al. A mouse model for congenital myasthenic syndrome due to MuSK mutations reveals defects in structure and function of neuromuscular junctions. Hum Mol Genet 2008; 17:3577–3595.
- Richman DP, Nishi K, Morell SW, et al. Acute severe animal model of anti-muscle-specific kinase myasthenia: combined postsynaptic and presynaptic changes. Arch Neurol 2012; 69:453–460.
- Klooster R, Plomp JJ, Huijbers MG, et al. Muscle-specific kinase myasthenia gravis IgG4 autoantibodies cause severe neuromuscular junction dysfunction in mice. Brain 2012; 135:1081–1101.
- Viegas S, Jacobson L, Waters P, et al. Passive and active immunization models of MuSK-Ab positive myasthenia: electrophysiological evidence for pre and postsynaptic defects. Exp Neurol 2012; 234:506–512.
- Niks EH, Kuks JB, Wokke JH, et al. Pre- and postsynaptic neuromuscular junction abnormalities in musk myasthenia. Muscle Nerve 2010; 42:283–288.
- Kawakami Y, Ito M, Hirayama M, et al. Anti-MuSK autoantibodies block binding of collagen Q to MuSK. Neurology 2011; 77:1819–1826.
- Chan KH, Lachance DH, Harper CM, Lennon VA. Frequency of seronegativity in adult-acquired generalized myasthenia gravis. Muscle Nerve 2007; 36:651–658.
- Collongues N, Casez O, Lacour A, et al. Rituximab in refractory and non-refractory myasthenia: a retrospective multicenter study. Muscle Nerve 2012; 46:687–691.
- Sanders DB, Andrews PI, Howard JF, Massey JM. Seronegative myasthenia gravis. Neurology 1997; 48(suppl 5):40S–45S.
- Shiraishi H, Motomura M, Yoshimura T, et al. Acetylcholine receptors loss and postsynaptic damage in MuSK antibody-positive myasthenia gravis. Ann Neurol 2005; 57:289–293.
- Leite MI, Jacob S, Viegas S, et al. IgG1 antibodies to acetylcholine receptors in ‘seronegative’ myasthenia gravis. Brain 2008; 131:1940–1952.
- Jacob S, Viegas S, Leite MI, et al. Presence and pathogenic relevance of antibodies to clustered acetylcholine receptor in ocular and generalized myasthenia gravis. Arch Neurol 2012; 69:994–1001.
- Higuchi O, Hamuro J, Motomura M, Yamanashi Y. Autoantibodies to low-density lipoprotein receptor-related protein 4 in myasthenia gravis. Ann Neurol 2011; 69:418–422.
- Pevzner A, Schoser B, Peters K, et al. Anti-LRP4 autoantibodies in AChR- and MuSK-antibody-negative myasthenia gravis. J Neurol 2012; 259:427–435.
- Zhang B, Tzartos JS, Belimezi M, et al. Autoantibodies to lipoprotein-related protein 4 in patients with double-seronegative myasthenia gravis. Arch Neurol 2012; 69:445–451.
- Kupersmith MJ, Latkany R, Homel P. Development of generalized disease at 2 years in patients with ocular myasthenia gravis. Arch Neurol 2003; 60:243–248.
- Pasnoor M, Wolfe GI, Nations S, et al. Clinical findings in MuSK-antibody positive myasthenia gravis: a US experience. Muscle Nerve 2010; 41:370–374.
- Oh SJ, Kim DE, Kuruoglu R, Bradley RJ, Dwyer D. Diagnostic sensitivity of the laboratory tests in myasthenia gravis. Muscle Nerve 1992; 15:720–724.
- Sanders DB, Stålberg EV. AAEM minimonograph #25: single-fiber electromyography. Muscle Nerve 1996; 19:1069–1083.
- Lazo-Langner A, Espinosa-Poblano I, Tirado-Cárdenas N, et al. Therapeutic plasma exchange in Mexico: experience from a single institution. Am J Hematol 2002; 70:16–21.
- Carandina-Maffeis R, Nucci A, Marques JF, et al. Plasmapheresis in the treatment of myasthenia gravis: retrospective study of 26 patients. Arq Neuropsiquiatr 2004; 62:391–395.
- Zinman L, Ng E, Bril V. IV immunoglobulin in patients with myasthenia gravis: a randomized controlled trial. Neurology 2007; 68:837–841.
- Gajdos P, Tranchant C, Clair B, et al; Myasthenia Gravis Clinical Study Group. Treatment of myasthenia gravis exacerbation with intravenous immunoglobulin: a randomized double-blind clinical trial. Arch Neurol 2005; 62:1689–1693.
- Rønager J, Ravnborg M, Hermansen I, Vorstrup S. Immunoglobulin treatment versus plasma exchange in patients with chronic moderate to severe myasthenia gravis. Artif Organs 2001; 25:967–973.
- Barth D, Nabavi Nouri M, Ng E, Nwe P, Bril V. Comparison of IVIg and PLEX in patients with myasthenia gravis. Neurology 2011; 76:2017–2023.
- Wegner B, Ahmed I. Intravenous immunoglobulin monotherapy in long-term treatment of myasthenia gravis. Clin Neurol Neurosurg 2002; 105:3–8.
- Pascuzzi RM, Coslett HB, Johns TR. Long-term corticosteroid treatment of myasthenia gravis: report of 116 patients. Ann Neurol 1984; 15:291–298.
- Monsul NT, Patwa HS, Knorr AM, Lesser RL, Goldstein JM. The effect of prednisone on the progression from ocular to generalized myasthenia gravis. J Neurol Sci 2004; 217:131–133.
- Miller RG, Milner-Brown HS, Mirka A. Prednisone-induced worsening of neuromuscular function in myasthenia gravis. Neurology 1986; 36:729–732.
- Palace J, Newsom-Davis J, Lecky B. A randomized double-blind trial of prednisolone alone or with azathioprine in myasthenia gravis. Myasthenia Gravis Study Group. Neurology 1998; 50:1778–1783.
- Mertens HG, Hertel G, Reuther P, Ricker K. Effect of immunosuppressive drugs (azathioprine). Ann N Y Acad Sci 1981; 377:691–699.
- Relling MV, Gardner EE, Sandborn WJ, et al; Clinical Pharmacogenetics Implementation Consortium. Clinical Pharmacogenetics Implementation Consortium guidelines for thiopurine methyltransferase genotype and thiopurine dosing. Clin Pharmacol Ther 2011; 89:387–391.
- Finelli PF. Primary CNS lymphoma in myasthenic on long-term azathioprine. J Neurooncol 2005; 74:91–92.
- Sanders DB, Hart IK, Mantegazza R, et al. An international, phase III, randomized trial of mycophenolate mofetil in myasthenia gravis. Neurology 2008; 71:400–406.
- Muscle Study Group. A trial of mycophenolate mofetil with prednisone as initial immunotherapy in myasthenia gravis. Neurology 2008; 71:394–399.
- Meriggioli MN, Ciafaloni E, Al-Hayk KA, et al. Mycophenolate mofetil for myasthenia gravis: an analysis of efficacy, safety, and tolerability. Neurology 2003; 61:1438–1440.
- Hehir MK, Burns TM, Alpers J, Conaway MR, Sawa M, Sanders DB. Mycophenolate mofetil in AChR-antibody-positive myasthenia gravis: outcomes in 102 patients. Muscle Nerve 2010; 41:593–598.
- Merlob P, Stahl B, Klinger G. Tetrada of the possible mycophenolate mofetil embryopathy: a review. Reprod Toxicol 2009; 28:105–108.
- Tindall RS, Rollins JA, Phillips JT, Greenlee RG, Wells L, Belendiuk G. Preliminary results of a double-blind, randomized, placebo-controlled trial of cyclosporine in myasthenia gravis. N Engl J Med 1987; 316:719–724.
- Heckmann JM, Rawoot A, Bateman K, Renison R, Badri M. A single-blinded trial of methotrexate versus azathioprine as steroid-sparing agents in generalized myasthenia gravis. BMC Neurol 2011; 11:97.
- Pasnoor M, He J, Herbelin L, Dimachkie M, Barohn RJ; Muscle Study Group. Phase II trial of methotrexate in myasthenia gravis. Ann N Y Acad Sci 2012; 1275:23–28.
- Díaz-Manera J, Martínez-Hernández E, Querol L, et al. Long-lasting treatment effect of rituximab in MuSK myasthenia. Neurology 2012; 78:189–193.
- Gronseth GS, Barohn RJ. Practice parameter: thymectomy for autoimmune myasthenia gravis (an evidence-based review): Report of the Quality Standards Subcommittee of the American Academy of Neurology. Neurology 2000; 55:7–15.
- Kumar V, Kaminski HJ. Treatment of myasthenia gravis. Curr Neurol Neurosci Rep 2011; 11:89–96.
- Pompeo E, Tacconi F, Massa R, Mineo D, Nahmias S, Mineo TC. Long-term outcome of thoracoscopic extended thymectomy for nonthymomatous myasthenia gravis. Eur J Cardiothorac Surg 2009; 36:164–169.
KEY POINTS
- In most cases of myasthenia gravis, the patient has antibodies against acetylcholine receptor (AChR) or musclespecific tyrosine kinase (MuSK).
- Myasthenia gravis is diagnosed by clinical signs, bedside tests (the ice-pack test or the edrophonium test), serologic tests for AChR antibodies or MuSK antibodies, and electrophysiologic tests.
- Acetylcholinesterase inhibitors are the first-step therapy, but patients who have moderate to severe symptoms require some form of immunomodulating therapy.
- A number of drugs can exacerbate weakness in myasthenia gravis and should be avoided or used with caution. These include penicillamine, interferons, procainamide, quinidine, and antibiotics such as quinolones and aminoglycosides.
Did poor communication lead to her death?
A woman in her 50s underwent hysterectomy performed by a surgeon, who then assigned an ObGyn to her follow-up care. The day after surgery, the patient had severe abdominal pain with decreased blood pressure and increased heart and respiration rates. The ObGyn admitted the patient to the intensive care unit (ICU), and then designated Dr. A, the patient’s family practitioner to continue her care. Dr. A was not available, so his associate, Dr. B, took over. Over the phone, Dr. B requested pulmonary, cardiology, and infectious disease consults. In the ICU the next day, the patient suffered respiratory arrest and was intubated. When her abdomen became rigid and swollen, emergency surgery revealed that a colon perforation had allowed fecal matter to reach the abdominal cavity. The woman died the next day from complications of sepsis, peritonitis, and multiple organ failure.
ESTATE’S CLAIM None of the physicians assigned to her care ever saw the patient in the ICU. Earlier surgery could have prevented her death. The physicians involved in her care failed to communicate with each other properly.
DEFENDANTS’ DEFENSE The case was settled during the trial.
VERDICT A $3.2 million Illinois settlement was reached with the hospital.
BOTH PARENTS HAD PLATELET ANTIBODIES
When a 32-year-old woman became pregnant with her third child, she sought treatment at a clinic. The mother informed the nurse practi-tioner that her two other children had been diagnosed with low platelets at birth, but they were now healthy and had no further problems.
The woman gave birth vaginally to her third child at term. The newborn had Apgar scores of 8 and 8, at 1 and 5 minutes, respectively. However, the child’s platelet level was 26 x 103/µL. The baby was transferred to another hospital the next day, where he was diagnosed with hydrocephalus and neonatal alloimmune thrombocytopenia. He suffered a massive intracranial hemorrhage, which caused severe neurologic injuries and brain damage. A shunt was placed. The child has significant cognitive deficits as well as cerebral palsy with mild developmental delays. Testing showed that each parent had a different genotype for platelet antibodies.
PARENTS’ CLAIM The parents should have been tested for platelet antibodies prior to this birth due to the family’s history. A prenatal diagnosis of neonatal alloimmune thrombocytopenia would have allowed for treatment with gamma globulin, which could have avoided the intracranial hemorrhage.
DEFENDANTS’ DEFENSE The case was settled during the trial.
VERDICT A $4.8 million California settlement was reached.
CORD PROLAPSE NOT CARED FOR IN AMBULANCE
At 36 weeks’ gestation, a mother called an ambulance when her membranes ruptured and she noticed an umbilical cord prolapse.
The child was in a breech presentation, experienced oxygen deprivation, and sustained severe neurologic damage.
PARENTS’ CLAIM The ambulance service was negligent in its care. The ambulance service dispatcher advised the mother to stand, squat, and push before the ambulance arrived. The ambulance attendants failed to take basic actions to relieve pressure on the prolapsed umbilical cord. The ambulance did not stop at two closer hospitals, which delayed arrival for an additional 20 minutes.
DEFENDANTS’ DEFENSE The case was settled during the trial.
VERDICT A $2.7 million settlement was reached, but before it was submitted to the court for approval, the child died. The defendants then sought to revoke the settlement, but the parents claimed breach of contract. The defendants claimed that the agreement was orally negotiated independent of defense counsel and was unenforceable due to the child’s death and lack of court approval. A Texas judge issued summary judgment on breach of contract and awarded $2.7 million plus $40,000 in attorney fees to the parents.

SECOND- AND THIRD-DEGREE BURNS TO PERINEUM
A mother received an epidural injection during vaginal delivery. Six hours later, the patient asked a nurse for a warm compress to place on her perineum. The nurse heated the compress in a microwave and then applied it to the perineal area. The compress caused second- and third-degree burns to the patient’s labia and inner left thigh. She underwent surgical repair of the burned area, and, a year later, had plastic surgery.
PATIENT’S CLAIM The nurse was negligent in overheating the compress.
DEFENDANTS’ DEFENSE The hospital agreed that the nurse who heated and applied the compress had been negligent. The hospital paid all medical expenses relating to the burns, including follow-up surgeries.
VERDICT A $190,000 Utah verdict was returned for noneconomic damages.
DOCUMENTATION MAKES A DIFFERENCE FOR OBGYN AFTER CHILD DIES
A 30-year-old physician was pregnant with her first child. Due to a low amniotic fluid index and lagging fetal growth, she saw a maternal-fetal medicine specialist, who suggested labor induction at 39 weeks.
Labor progressed slowly. After three attempts at vacuum-assisted delivery, the ObGyn recommended cesarean delivery. The parents eventually consented to cesarean delivery after another failed vacuum-assisted attempt. Although the ObGyn had recommended cesarean 2 hours earlier, surgery was not ordered on an emergent basis.
At birth, the baby’s resuscitation took more than 20 minutes. The child lost nearly one-third of her blood volume; she had a subgaleal hemorrhage. Both parties agreed that the vacuum device probably caused the bleeding.
The child had hypoxic ischemic encephalopathy and disseminated intravascular coagulation. She suffered a myocardial infarction at 3 days of age. Without electrical brain activity, life support was removed, and the child died at 5 days of age. An autopsy found possible hypereosinophilic syndrome as the concurrent cause of death.
PARENTS’ CLAIM The mother claimed she was not informed of the risks, benefits, and alternatives to vacuum extraction; she would not have consented had she known the risks. The mother, her husband, and two family members maintained that the ObGyn offered the possibility of cesarean delivery as a question, but did not insist on it. The mother claimed she wanted what was best for the baby, and never refused a cesarean. The resuscitation efforts caused eosinophilic infiltration into several organs.
PHYSICIAN’S DEFENSE The ObGyn charted that the parents were “adamant about having a vaginal delivery,” and said she told the parents what she charted. The obstetric nurse testified that the mother delayed consent because she felt vaginal delivery was imminent. The ObGyn acted properly; eosinophilia caused the baby’s death.
VERDICT An Illinois defense verdict was returned.
HIGH BP TO BLAME FOR DEATHS OF BOTH MOTHER AND CHILD
A 23-year-old woman’s pregnancy was at high risk because of very high blood pressure (BP). At 34 weeks’ gestation, she went to a county hospital with symptoms of high BP; she was treated and discharged 3 days later. She returned to the hospital to be checked twice more within a month. The day after the third visit, she suffered a seizure and was taken to a university hospital, where emergency cesarean delivery was performed. The mother died from an aortic rupture during delivery.
The child was born with brain injuries and died at age 4 years due to neurologic complications.
ESTATE’S CLAIM The mother was not properly treated at the county hospital, resulting in both deaths; she should not have been discharged. Under monitoring, she would have undergone delivery before the aortic rupture occurred, avoiding the baby’s brain injury.
DEFENDANTS’ DEFENSE The mother was stable when released; aortic rupture is unpredictable and unpreventable, and would have occurred under any circumstances. It is highly unusual that a woman of her age would have an aortic rupture.
VERDICT A $3,062,803 California verdict was returned. The parties then settled for $1,782,000 (with the county assuming the medical lien).
NECROTIZING FASCIITIS FROM PERFORATED COLON
A woman underwent laparoscopic-assisted vaginal hysterectomy performed by her ObGyn, and was discharged after 3 days. The next day, she went to another hospital’s emergency department (ED) with abdominal distention and rigidity, severe abdominal pain, and vomiting. She had a toxic appearance, rapid pulse rate, and hypotension. In emergency surgery, several liters of dark brown, foul-smelling fluid were found in her abdomen, and feculent peritonitis and necrotizing fasciitis were diagnosed due to a perforated sigmoid colon. She required multiple hospitalizations and operations.
PATIENT’S CLAIM Perforation occurred during hysterectomy. The ObGyn failed to recognize the injury prior to discharge. The hospital staff did not properly assess her or communicate her symptoms to the ObGyn.
DEFENDANTS’ DEFENSE There was no negligence; proper care was given.
VERDICT A $2,922,503 Florida verdict was returned, with the jury finding the ObGyn 30% at fault and the hospital 70% at fault.
FAILURE TO REACT TO FETAL DISTRESS: $15.6M
After delivery at full term, a child suffered convulsions and seizures on her second day of life. A CT scan showed brain injuries. At age 11 years, she has severe learning and developmental delays, and requires 24-hour care.
PARENTS’ CLAIM Severe decelerations with slow return to baseline occurred several times during labor and delivery. The nurse midwife failed to recognize and react to fetal distress. A cesarean delivery should have been performed instead of a vaginal delivery. The delay in delivery caused the child’s injuries.
DEFENDANTS’ DEFENSE A prenatal neurogenetic disorder caused the child’s injuries.
VERDICT A $15.6 million Maryland verdict was returned. It will not be automatically reduced; the awarded noneconomic damages do not exceed the state cap.
LATE DELIVERY; SEVERE INJURY TO CHILD
At 40 weeks’ gestation, a woman was admitted to the hospital in labor. When the mother’s membranes were ruptured, a small amount of meconium was noted, but the fetal monitor strips were reassuring. Two hours later, the nurse and midwife noted a pattern of decelerations, but they felt the pattern was nonrepetitive and reactive. Thirty minutes later, the nurse and midwife noted decelerations to 90 bpm with pushing, but did not call a physician.
Another midwife arrived to assist the first midwife who was new to practice. The mother was given oxygen, her position was changed, and an IV fluid bolus was administered. Thirty minutes later, the nurses recognized late decelerations and called a Code White twice while the fetal heart rate continued to decelerate. After the attending physician unsuccessfully attempted vacuum extraction, an emergency cesarean delivery was performed.
The child’s Apgar scores were 2, 3, and 3, at 1, 5, and 10 minutes, respectively. The cord blood pH was 6.66, indicating severe metabolic acidosis. She developed seizures within the first few minutes of life. Imaging studies showed global hypoxic ischemic encephalopathy. The child cannot walk, talk, or sit up unsupported at age 8, and requires a G-tube. She is cortically blind and requires antiseizure medication.
PARENTS’ CLAIM The nurse, two midwives, and physician were negligent in their care of the mother and child.
DEFENDANTS’ DEFENSE The case was settled during the trial.
VERDICT A $5 million Massachusetts settlement was reached.
WHAT CAUSED INFECTION AFTER ABORTION?
A 20-year-old woman underwent a surgical termination of pregnancy performed by an ObGyn. After discharge, the patient developed pain and other complications requiring rehospitalization and additional surgery for a pelvic infection.
PATIENT’S CLAIM Complications were due to a uterine perforation that spontaneously sealed before it could be detected. The ObGyn was negligent in the performance of the elective abortion. The patient has a large scar on her abdomen because of the additional operation.
PHYSICIAN’S DEFENSE Perforation of the uterus is a known complication of the procedure. However, no perforation occurred; it was not found on imaging, and spontaneous sealing of a perforation cannot occur. The patient’s complications were due to a subclinical infection that was activated by the surgery.
VERDICT A New York defense verdict was returned.
We want to hear from you. Tell us what you think!
These cases were selected by the editors of OBG Management from Medical Malpractice Verdicts, Settlements & Experts, with permission of the editor, Lewis Laska (www.verdictslaska.com). The information available to the editors about the cases presented here is sometimes incomplete. Moreover, the cases may or may not have merit. Nevertheless, these cases represent the types of clinical situations that typically result in litigation and are meant to illustrate nationwide variation in jury verdicts and awards.
A woman in her 50s underwent hysterectomy performed by a surgeon, who then assigned an ObGyn to her follow-up care. The day after surgery, the patient had severe abdominal pain with decreased blood pressure and increased heart and respiration rates. The ObGyn admitted the patient to the intensive care unit (ICU), and then designated Dr. A, the patient’s family practitioner to continue her care. Dr. A was not available, so his associate, Dr. B, took over. Over the phone, Dr. B requested pulmonary, cardiology, and infectious disease consults. In the ICU the next day, the patient suffered respiratory arrest and was intubated. When her abdomen became rigid and swollen, emergency surgery revealed that a colon perforation had allowed fecal matter to reach the abdominal cavity. The woman died the next day from complications of sepsis, peritonitis, and multiple organ failure.
ESTATE’S CLAIM None of the physicians assigned to her care ever saw the patient in the ICU. Earlier surgery could have prevented her death. The physicians involved in her care failed to communicate with each other properly.
DEFENDANTS’ DEFENSE The case was settled during the trial.
VERDICT A $3.2 million Illinois settlement was reached with the hospital.
BOTH PARENTS HAD PLATELET ANTIBODIES
When a 32-year-old woman became pregnant with her third child, she sought treatment at a clinic. The mother informed the nurse practi-tioner that her two other children had been diagnosed with low platelets at birth, but they were now healthy and had no further problems.
The woman gave birth vaginally to her third child at term. The newborn had Apgar scores of 8 and 8, at 1 and 5 minutes, respectively. However, the child’s platelet level was 26 x 103/µL. The baby was transferred to another hospital the next day, where he was diagnosed with hydrocephalus and neonatal alloimmune thrombocytopenia. He suffered a massive intracranial hemorrhage, which caused severe neurologic injuries and brain damage. A shunt was placed. The child has significant cognitive deficits as well as cerebral palsy with mild developmental delays. Testing showed that each parent had a different genotype for platelet antibodies.
PARENTS’ CLAIM The parents should have been tested for platelet antibodies prior to this birth due to the family’s history. A prenatal diagnosis of neonatal alloimmune thrombocytopenia would have allowed for treatment with gamma globulin, which could have avoided the intracranial hemorrhage.
DEFENDANTS’ DEFENSE The case was settled during the trial.
VERDICT A $4.8 million California settlement was reached.
CORD PROLAPSE NOT CARED FOR IN AMBULANCE
At 36 weeks’ gestation, a mother called an ambulance when her membranes ruptured and she noticed an umbilical cord prolapse.
The child was in a breech presentation, experienced oxygen deprivation, and sustained severe neurologic damage.
PARENTS’ CLAIM The ambulance service was negligent in its care. The ambulance service dispatcher advised the mother to stand, squat, and push before the ambulance arrived. The ambulance attendants failed to take basic actions to relieve pressure on the prolapsed umbilical cord. The ambulance did not stop at two closer hospitals, which delayed arrival for an additional 20 minutes.
DEFENDANTS’ DEFENSE The case was settled during the trial.
VERDICT A $2.7 million settlement was reached, but before it was submitted to the court for approval, the child died. The defendants then sought to revoke the settlement, but the parents claimed breach of contract. The defendants claimed that the agreement was orally negotiated independent of defense counsel and was unenforceable due to the child’s death and lack of court approval. A Texas judge issued summary judgment on breach of contract and awarded $2.7 million plus $40,000 in attorney fees to the parents.
SECOND- AND THIRD-DEGREE BURNS TO PERINEUM
A mother received an epidural injection during vaginal delivery. Six hours later, the patient asked a nurse for a warm compress to place on her perineum. The nurse heated the compress in a microwave and then applied it to the perineal area. The compress caused second- and third-degree burns to the patient’s labia and inner left thigh. She underwent surgical repair of the burned area, and, a year later, had plastic surgery.
PATIENT’S CLAIM The nurse was negligent in overheating the compress.
DEFENDANTS’ DEFENSE The hospital agreed that the nurse who heated and applied the compress had been negligent. The hospital paid all medical expenses relating to the burns, including follow-up surgeries.
VERDICT A $190,000 Utah verdict was returned for noneconomic damages.
DOCUMENTATION MAKES A DIFFERENCE FOR OBGYN AFTER CHILD DIES
A 30-year-old physician was pregnant with her first child. Due to a low amniotic fluid index and lagging fetal growth, she saw a maternal-fetal medicine specialist, who suggested labor induction at 39 weeks.
Labor progressed slowly. After three attempts at vacuum-assisted delivery, the ObGyn recommended cesarean delivery. The parents eventually consented to cesarean delivery after another failed vacuum-assisted attempt. Although the ObGyn had recommended cesarean 2 hours earlier, surgery was not ordered on an emergent basis.
At birth, the baby’s resuscitation took more than 20 minutes. The child lost nearly one-third of her blood volume; she had a subgaleal hemorrhage. Both parties agreed that the vacuum device probably caused the bleeding.
The child had hypoxic ischemic encephalopathy and disseminated intravascular coagulation. She suffered a myocardial infarction at 3 days of age. Without electrical brain activity, life support was removed, and the child died at 5 days of age. An autopsy found possible hypereosinophilic syndrome as the concurrent cause of death.
PARENTS’ CLAIM The mother claimed she was not informed of the risks, benefits, and alternatives to vacuum extraction; she would not have consented had she known the risks. The mother, her husband, and two family members maintained that the ObGyn offered the possibility of cesarean delivery as a question, but did not insist on it. The mother claimed she wanted what was best for the baby, and never refused a cesarean. The resuscitation efforts caused eosinophilic infiltration into several organs.
PHYSICIAN’S DEFENSE The ObGyn charted that the parents were “adamant about having a vaginal delivery,” and said she told the parents what she charted. The obstetric nurse testified that the mother delayed consent because she felt vaginal delivery was imminent. The ObGyn acted properly; eosinophilia caused the baby’s death.
VERDICT An Illinois defense verdict was returned.
HIGH BP TO BLAME FOR DEATHS OF BOTH MOTHER AND CHILD
A 23-year-old woman’s pregnancy was at high risk because of very high blood pressure (BP). At 34 weeks’ gestation, she went to a county hospital with symptoms of high BP; she was treated and discharged 3 days later. She returned to the hospital to be checked twice more within a month. The day after the third visit, she suffered a seizure and was taken to a university hospital, where emergency cesarean delivery was performed. The mother died from an aortic rupture during delivery.
The child was born with brain injuries and died at age 4 years due to neurologic complications.
ESTATE’S CLAIM The mother was not properly treated at the county hospital, resulting in both deaths; she should not have been discharged. Under monitoring, she would have undergone delivery before the aortic rupture occurred, avoiding the baby’s brain injury.
DEFENDANTS’ DEFENSE The mother was stable when released; aortic rupture is unpredictable and unpreventable, and would have occurred under any circumstances. It is highly unusual that a woman of her age would have an aortic rupture.
VERDICT A $3,062,803 California verdict was returned. The parties then settled for $1,782,000 (with the county assuming the medical lien).
NECROTIZING FASCIITIS FROM PERFORATED COLON
A woman underwent laparoscopic-assisted vaginal hysterectomy performed by her ObGyn, and was discharged after 3 days. The next day, she went to another hospital’s emergency department (ED) with abdominal distention and rigidity, severe abdominal pain, and vomiting. She had a toxic appearance, rapid pulse rate, and hypotension. In emergency surgery, several liters of dark brown, foul-smelling fluid were found in her abdomen, and feculent peritonitis and necrotizing fasciitis were diagnosed due to a perforated sigmoid colon. She required multiple hospitalizations and operations.
PATIENT’S CLAIM Perforation occurred during hysterectomy. The ObGyn failed to recognize the injury prior to discharge. The hospital staff did not properly assess her or communicate her symptoms to the ObGyn.
DEFENDANTS’ DEFENSE There was no negligence; proper care was given.
VERDICT A $2,922,503 Florida verdict was returned, with the jury finding the ObGyn 30% at fault and the hospital 70% at fault.
FAILURE TO REACT TO FETAL DISTRESS: $15.6M
After delivery at full term, a child suffered convulsions and seizures on her second day of life. A CT scan showed brain injuries. At age 11 years, she has severe learning and developmental delays, and requires 24-hour care.
PARENTS’ CLAIM Severe decelerations with slow return to baseline occurred several times during labor and delivery. The nurse midwife failed to recognize and react to fetal distress. A cesarean delivery should have been performed instead of a vaginal delivery. The delay in delivery caused the child’s injuries.
DEFENDANTS’ DEFENSE A prenatal neurogenetic disorder caused the child’s injuries.
VERDICT A $15.6 million Maryland verdict was returned. It will not be automatically reduced; the awarded noneconomic damages do not exceed the state cap.
LATE DELIVERY; SEVERE INJURY TO CHILD
At 40 weeks’ gestation, a woman was admitted to the hospital in labor. When the mother’s membranes were ruptured, a small amount of meconium was noted, but the fetal monitor strips were reassuring. Two hours later, the nurse and midwife noted a pattern of decelerations, but they felt the pattern was nonrepetitive and reactive. Thirty minutes later, the nurse and midwife noted decelerations to 90 bpm with pushing, but did not call a physician.
Another midwife arrived to assist the first midwife who was new to practice. The mother was given oxygen, her position was changed, and an IV fluid bolus was administered. Thirty minutes later, the nurses recognized late decelerations and called a Code White twice while the fetal heart rate continued to decelerate. After the attending physician unsuccessfully attempted vacuum extraction, an emergency cesarean delivery was performed.
The child’s Apgar scores were 2, 3, and 3, at 1, 5, and 10 minutes, respectively. The cord blood pH was 6.66, indicating severe metabolic acidosis. She developed seizures within the first few minutes of life. Imaging studies showed global hypoxic ischemic encephalopathy. The child cannot walk, talk, or sit up unsupported at age 8, and requires a G-tube. She is cortically blind and requires antiseizure medication.
PARENTS’ CLAIM The nurse, two midwives, and physician were negligent in their care of the mother and child.
DEFENDANTS’ DEFENSE The case was settled during the trial.
VERDICT A $5 million Massachusetts settlement was reached.
WHAT CAUSED INFECTION AFTER ABORTION?
A 20-year-old woman underwent a surgical termination of pregnancy performed by an ObGyn. After discharge, the patient developed pain and other complications requiring rehospitalization and additional surgery for a pelvic infection.
PATIENT’S CLAIM Complications were due to a uterine perforation that spontaneously sealed before it could be detected. The ObGyn was negligent in the performance of the elective abortion. The patient has a large scar on her abdomen because of the additional operation.
PHYSICIAN’S DEFENSE Perforation of the uterus is a known complication of the procedure. However, no perforation occurred; it was not found on imaging, and spontaneous sealing of a perforation cannot occur. The patient’s complications were due to a subclinical infection that was activated by the surgery.
VERDICT A New York defense verdict was returned.
We want to hear from you. Tell us what you think!
These cases were selected by the editors of OBG Management from Medical Malpractice Verdicts, Settlements & Experts, with permission of the editor, Lewis Laska (www.verdictslaska.com). The information available to the editors about the cases presented here is sometimes incomplete. Moreover, the cases may or may not have merit. Nevertheless, these cases represent the types of clinical situations that typically result in litigation and are meant to illustrate nationwide variation in jury verdicts and awards.

Dos, don’ts, and dollars: Making the switch to an EHR
More and more ObGyns are adopting electronic health records (EHRs), not only to meet a government mandate but also with the hope of making their practice more efficient and productive. While it is likely that EHRs enhance qualitative benefits, such as safety, patient satisfaction, 24/7 availability of medical records, and patient access to medical data, it isn’t always clear how they boost the financial bottom line. For this reason, we recommend that every practice “run the numbers” before making the transition from paper to paperless records. That means estimating the cost, expenses, and potential for added income associated with the EHR before embarking on the change.
In this article, we explain five ways a switch to EHRs can reduce costs. We also offer strategies for choosing and implementing an EHR, from information gathering to motivating your staff.

Transcription costs are lower
The estimated cost of dictating a letter to a referring physician using conventional means is $12 to $15. That estimate includes the doctor’s time, the cost of the transcriptionist, the stationery, and the postage or cost of faxing the letter. An ObGyn may generate five to 10 letters per day. That’s $60 to $150 in expenses.
Most EHRs can generate a referral letter at no additional cost, provided the diagnosis, prescribed medications, and treatment plan have been entered in the system. Not only that, but each referral letter can be transmitted immediately to the recipient by email (or fax; the referring doctor’s preference). In the past, it may have taken as long as several weeks for the letter to be generated and make its way to the recipient by conventional means.
This use of the EHR can save a practice as much as $1,000 per physician every month.
Chart maintenance is no longer an issue
It sometimes can be a challenge for an ObGyn office to locate a paper chart. Any record lost in the “black hole” can wreak havoc with the schedule. It becomes even more problematic if the practice has multiple locations where charts are kept, delaying its recovery.
When a temporary chart must be created, it costs the practice time and dollars. It also becomes necessary to transfer the data into the permanent record, once it is located—another expense—not to mention the need to create a chart for every new patient.
It is not unusual for a busy practice to misplace as many as five charts a day, representing expenses of $25 to $50 per chart. With an EHR, this expense is reduced to $0, and the chart can be accessed 24/7 from multiple locations, including the physician’s home or mobile phone, provided the EHR is networked between practices and the data are secured on the cloud (with encryption to ensure patient confidentiality and compliance with the Health Insurance Portability and Accountability Act, or HIPAA).
Another expense with paper records: pulling charts for the day’s patients and returning them to the file rack at the conclusion of the day. These steps require additional employees and do nothing to improve patient care.
Coding is more accurate with an EHR
Prior to the development of EHRs, physicians had to guess the level of care that was provided and tended to “under-code” the visit, leading to a loss of income that the physician rightfully earned but didn’t document fully. As one coding expert has noted, if you didn’t document it, you didn’t do it, and if the record reflects that you didn’t do it, you can’t be paid for it.
In general, the higher the level of care and the higher the code used, the more extensive documentation should be. Today’s EHRs can automatically calculate the code best supported by the documentation entered at the time of the visit. After implementing an EHR, an ObGyn can ensure that accurate codes are submitted to payers, with higher levels of reimbursement honestly and ethically achieved.
A shift to EHRs frees up valuable square footage
It is not unusual for a practice to consume several hundred square feet of space for the storage of conventional medical records. Once a practice transitions to electronic records, however, these files are stored at a remote site or shredded once the entire paper record has been scanned into the EHR. The office space once required for paper record storage can then be converted into examination rooms or devoted to a laboratory, imaging center, or procedure room to generate ancillary income.
There’s an incentive involved
On February 17, 2009, the US government passed the Health Information Technology for Economic and Clinical Health (HITECH) Act in an effort to reduce the barriers to EHR implementation by outlining programs for standardization and funding of EHR programs.1,2 The HITECH Act contained meaningful-use incentives to reward participants for the adoption of EHRs, with payments disbursed through Medicare and Medicaid.2 By meeting several core objectives, individuals in private practice can earn as much as $44,000 over 5 years through the Medicare EHR incentive program and $63,750 over 6 years by participating in the Medicaid incentive program.3 Hospitals can earn more than $2 million over the same period. The objectives differ slightly for hospitals and individuals but are intended to improve quality, coordination, and safety of care while promoting patient involvement and public health.3
Related article: The Affordable Care Act and the drive for EHRs: Are small practices being squeezed? Lucia DiVenere, MD (July 2013)
The HITECH Act also sought to increase the security of EHRs to ensure patient privacy through standardization of EHR products. To become eligible for meaningful-use incentives, EHR software must meet government standards and specifications.3 Common requirements include the ability to document:
- vital signs
- test results
- all medications and allergies.
Another requirement is the ability to generate lists of patients with common conditions.3
By standardizing the EHR format, the HITECH Act improved networking by physicians by ensuring common capabilities among various EHR products.
The funding and standardization established by the HITECH Act increased the usage of EHRs among physicians to 57% by 2011.2
How did we get here? A history of the EHR
Computers and electronics originally were used for administrative purposes and did not offer meaningful clinical applications when they first were introduced to health care during the 1960s and 70s.8 These early machines were large, expensive, and slow and did not meet the practical needs of clinicians. During the 1980s and 90s, however, with networking capability and development of the World Wide Web, the potential for an electronic health record (EHR) became clearer. In 1991, an Institute of Medicine (IOM) report listed the “computer-based patient record” as “an essential technology for health care.”8 The authors of the IOM report envisioned a true network of practices and hospitals that seamlessly and efficiently share information and insight to increase quality of care, reduce medical errors, and improve patient safety.1
Despite advances in EHR technology, one major hurdle remained: cost. For many clinicians, the time and resources required for installation of the program, transfer of records to the electronic format, and training of staff was too high. By 2001, only 18% of physicians had incorporated the EHR.2 Today, nearly 60% of practices use an EHR.
Related article: EHRS and medicolegal risk: How they help, when they could hurt Martin Gimovsky, MD, and Baohuong N. Tran, DO (March 2013)
How to implement an EHR
The first step is to narrow your options to a few vendors that best suit the needs of your office. This process is beyond the scope of this article, but your ultimate objective should be to choose a user-friendly interface from a vendor that offers excellent document security, customer assistance, and support.4
Form an implementation team for your practice, and have it begin by consulting ObGyn practices of similar size that have recently installed one of the EHRs you are considering. By asking about other practices’ experiences and any pitfalls they encountered, you can greatly ease your transition to EHRs.
If possible, the physicians in your practice should visit the office of any colleagues who have implemented one of the EHRs you are considering to see how they like the product. Your office manager, nurses, and receptionist also should visit their counterparts in the other practice to ask about their experiences and opinions. The more information you glean from other ObGyn practices, the easier it will be to make your decision.
Be sure to check with your hospital to ensure compatibility with its system.
Ensure adequate technical support
One of the most important considerations in selecting a product is the availability and quality of tech support from the home office of the vendor. When you talk to other users of a product, ask how quickly tech support calls are returned and how efficiently problems are solved.
There will always be technical problems during the transition away from paper records. Ensuring their prompt resolution will be critical to your success.
Assign project management
After deciding on a particular product, create a project team to manage the complex, lengthy implementation process.4–6 This team should include a project manager who has the experience and skills to coordinate a complex plan, a well-respected product champion who can help maintain staff support for the change, and several information technology (IT) specialists who can manage the software and hardware challenges.4–6
Related article: What can "meaningful use" of an EHR mean for your bottom line? Robert L. Barbieri, MD (Editorial, February 2011)
Rally the troops
The most vital part of any implementation plan is staff “buy-in.”4–6 It is incumbent upon the project-management team to determine what effects EHR implementation will have on workflow and to explain to employees how the process ultimately will increase efficiency and reduce work time and cost. And the project champion must remind employees of these goals during the transition.4–6
Develop a backup system
Work with your IT staff to create a backup system for the EHR to protect against system malfunction.4 In the past, offices backed up their data to tapes or disks. Today, it probably is safer to back up to the cloud. Cloud computing, which allows for automatic back-up, is tightly regulated by HIPAA, so be sure to choose an approved vendor.7
Preload your data
Before going live with the EHR, data must be integrated and preloaded into the electronic format. This means integrating billing, lab results, orders, scheduling, and encounter templates into the EHR interface.4,6 When data are preloaded, employees can practice on the software before the launch date, ensuring a seamless transition.6
No “teeth-gnashing” necessary
The transition to an EHR system can be intimidating and may affect your staff’s productivity, efficiency, and morale. By following a few careful steps, the process can proceed without teeth-gnashing and loss of productivity. In fact, the suggestions offered here should improve productivity, office efficiency, and patient safety over the long term.
Who could ask for anything more?
We want to hear from you! Tell us what you think.
- Thakkar M, Davis DC. Risks, barriers, and benefits of EHR systems: a comparative study based on size of hospital. Perspect Health Inf Manag. 2006;3(5):1–19.
- Hsiao CJ, Hing E, Socey TC, et al. Electronic health record systems and intent to apply meaningful use incentives among office-based physician practices: United States, 2001–2011. NCHS Data Brief. 2011;(79):1–8.
- Terry NP. Anticipating stage two: assessing the development of meaningful use and EMR deployment. St. Louis University School of Law Legal Studies Research Paper Series. 2011;21.
- Keshavjee K, Bosomworth J, Copen J, et al. Best practices in EMR implementation: a systematic review. AMIA Annu Symp Proc. 2006;982.
- Lorenzi NM, Kouroubali A, Detmer DE, et al. How to successfully select and implement electronic health records (EHR) in small ambulatory practice settings. BMC Medical Informatics Decision Making. 2009;9(15):1–13.
- Smith PD. Implementing an EMR system: one clinic’s experience. Fam Pract Manag. 2003;10(5):37–42.
- Raheja D, Escano MC. Hazards in electronic medical records. J System Safety. 2010;46(4):1–4. http://system-safety.org/ejss/past/novdec2010ejss/pdf/health.pdf. Accessed October 8, 2013.
- Berner ES, Detmer DE, Simborg D. Will the wave finally break? A brief view of the adoption of electronic medical records in the United States. J Am Med Inform Assoc. 2005;12(1):3–7.

Neil H. Baum, MD, practices urology in New Orleans, Louisiana. He is Associate Clinical Professor of Urology at Tulane Medical School and Louisiana State University School of Medicine, both in New Orleans. He is also on the medical staff at Touro Infirmary in New Orleans, and East Jefferson General Hospital in Metairie, Louisiana. And he is the author of Marketing Your Clinical Practice: Ethically, Effectively, Economically (4th edition, 2009; Jones & Bartlett).

Paul Kepper has a Master’s of Science degree from Tulane University in New Orleans, Louisiana.
The authors report no financial relationships relevant to this article.
Neil H. Baum, MD, practices urology in New Orleans, Louisiana. He is Associate Clinical Professor of Urology at Tulane Medical School and Louisiana State University School of Medicine, both in New Orleans. He is also on the medical staff at Touro Infirmary in New Orleans, and East Jefferson General Hospital in Metairie, Louisiana. And he is the author of Marketing Your Clinical Practice: Ethically, Effectively, Economically (4th edition, 2009; Jones & Bartlett).
Paul Kepper has a Master’s of Science degree from Tulane University in New Orleans, Louisiana.
The authors report no financial relationships relevant to this article.
More and more ObGyns are adopting electronic health records (EHRs), not only to meet a government mandate but also with the hope of making their practice more efficient and productive. While it is likely that EHRs enhance qualitative benefits, such as safety, patient satisfaction, 24/7 availability of medical records, and patient access to medical data, it isn’t always clear how they boost the financial bottom line. For this reason, we recommend that every practice “run the numbers” before making the transition from paper to paperless records. That means estimating the cost, expenses, and potential for added income associated with the EHR before embarking on the change.
In this article, we explain five ways a switch to EHRs can reduce costs. We also offer strategies for choosing and implementing an EHR, from information gathering to motivating your staff.
Transcription costs are lower
The estimated cost of dictating a letter to a referring physician using conventional means is $12 to $15. That estimate includes the doctor’s time, the cost of the transcriptionist, the stationery, and the postage or cost of faxing the letter. An ObGyn may generate five to 10 letters per day. That’s $60 to $150 in expenses.
Most EHRs can generate a referral letter at no additional cost, provided the diagnosis, prescribed medications, and treatment plan have been entered in the system. Not only that, but each referral letter can be transmitted immediately to the recipient by email (or fax; the referring doctor’s preference). In the past, it may have taken as long as several weeks for the letter to be generated and make its way to the recipient by conventional means.
This use of the EHR can save a practice as much as $1,000 per physician every month.
Chart maintenance is no longer an issue
It sometimes can be a challenge for an ObGyn office to locate a paper chart. Any record lost in the “black hole” can wreak havoc with the schedule. It becomes even more problematic if the practice has multiple locations where charts are kept, delaying its recovery.
When a temporary chart must be created, it costs the practice time and dollars. It also becomes necessary to transfer the data into the permanent record, once it is located—another expense—not to mention the need to create a chart for every new patient.
It is not unusual for a busy practice to misplace as many as five charts a day, representing expenses of $25 to $50 per chart. With an EHR, this expense is reduced to $0, and the chart can be accessed 24/7 from multiple locations, including the physician’s home or mobile phone, provided the EHR is networked between practices and the data are secured on the cloud (with encryption to ensure patient confidentiality and compliance with the Health Insurance Portability and Accountability Act, or HIPAA).
Another expense with paper records: pulling charts for the day’s patients and returning them to the file rack at the conclusion of the day. These steps require additional employees and do nothing to improve patient care.
Coding is more accurate with an EHR
Prior to the development of EHRs, physicians had to guess the level of care that was provided and tended to “under-code” the visit, leading to a loss of income that the physician rightfully earned but didn’t document fully. As one coding expert has noted, if you didn’t document it, you didn’t do it, and if the record reflects that you didn’t do it, you can’t be paid for it.
In general, the higher the level of care and the higher the code used, the more extensive documentation should be. Today’s EHRs can automatically calculate the code best supported by the documentation entered at the time of the visit. After implementing an EHR, an ObGyn can ensure that accurate codes are submitted to payers, with higher levels of reimbursement honestly and ethically achieved.
A shift to EHRs frees up valuable square footage
It is not unusual for a practice to consume several hundred square feet of space for the storage of conventional medical records. Once a practice transitions to electronic records, however, these files are stored at a remote site or shredded once the entire paper record has been scanned into the EHR. The office space once required for paper record storage can then be converted into examination rooms or devoted to a laboratory, imaging center, or procedure room to generate ancillary income.
There’s an incentive involved
On February 17, 2009, the US government passed the Health Information Technology for Economic and Clinical Health (HITECH) Act in an effort to reduce the barriers to EHR implementation by outlining programs for standardization and funding of EHR programs.1,2 The HITECH Act contained meaningful-use incentives to reward participants for the adoption of EHRs, with payments disbursed through Medicare and Medicaid.2 By meeting several core objectives, individuals in private practice can earn as much as $44,000 over 5 years through the Medicare EHR incentive program and $63,750 over 6 years by participating in the Medicaid incentive program.3 Hospitals can earn more than $2 million over the same period. The objectives differ slightly for hospitals and individuals but are intended to improve quality, coordination, and safety of care while promoting patient involvement and public health.3
Related article: The Affordable Care Act and the drive for EHRs: Are small practices being squeezed? Lucia DiVenere, MD (July 2013)
The HITECH Act also sought to increase the security of EHRs to ensure patient privacy through standardization of EHR products. To become eligible for meaningful-use incentives, EHR software must meet government standards and specifications.3 Common requirements include the ability to document:
- vital signs
- test results
- all medications and allergies.
Another requirement is the ability to generate lists of patients with common conditions.3
By standardizing the EHR format, the HITECH Act improved networking by physicians by ensuring common capabilities among various EHR products.
The funding and standardization established by the HITECH Act increased the usage of EHRs among physicians to 57% by 2011.2
How did we get here? A history of the EHR
Computers and electronics originally were used for administrative purposes and did not offer meaningful clinical applications when they first were introduced to health care during the 1960s and 70s.8 These early machines were large, expensive, and slow and did not meet the practical needs of clinicians. During the 1980s and 90s, however, with networking capability and development of the World Wide Web, the potential for an electronic health record (EHR) became clearer. In 1991, an Institute of Medicine (IOM) report listed the “computer-based patient record” as “an essential technology for health care.”8 The authors of the IOM report envisioned a true network of practices and hospitals that seamlessly and efficiently share information and insight to increase quality of care, reduce medical errors, and improve patient safety.1
Despite advances in EHR technology, one major hurdle remained: cost. For many clinicians, the time and resources required for installation of the program, transfer of records to the electronic format, and training of staff was too high. By 2001, only 18% of physicians had incorporated the EHR.2 Today, nearly 60% of practices use an EHR.
Related article: EHRS and medicolegal risk: How they help, when they could hurt Martin Gimovsky, MD, and Baohuong N. Tran, DO (March 2013)
How to implement an EHR
The first step is to narrow your options to a few vendors that best suit the needs of your office. This process is beyond the scope of this article, but your ultimate objective should be to choose a user-friendly interface from a vendor that offers excellent document security, customer assistance, and support.4
Form an implementation team for your practice, and have it begin by consulting ObGyn practices of similar size that have recently installed one of the EHRs you are considering. By asking about other practices’ experiences and any pitfalls they encountered, you can greatly ease your transition to EHRs.
If possible, the physicians in your practice should visit the office of any colleagues who have implemented one of the EHRs you are considering to see how they like the product. Your office manager, nurses, and receptionist also should visit their counterparts in the other practice to ask about their experiences and opinions. The more information you glean from other ObGyn practices, the easier it will be to make your decision.
Be sure to check with your hospital to ensure compatibility with its system.
Ensure adequate technical support
One of the most important considerations in selecting a product is the availability and quality of tech support from the home office of the vendor. When you talk to other users of a product, ask how quickly tech support calls are returned and how efficiently problems are solved.
There will always be technical problems during the transition away from paper records. Ensuring their prompt resolution will be critical to your success.
Assign project management
After deciding on a particular product, create a project team to manage the complex, lengthy implementation process.4–6 This team should include a project manager who has the experience and skills to coordinate a complex plan, a well-respected product champion who can help maintain staff support for the change, and several information technology (IT) specialists who can manage the software and hardware challenges.4–6
Related article: What can "meaningful use" of an EHR mean for your bottom line? Robert L. Barbieri, MD (Editorial, February 2011)
Rally the troops
The most vital part of any implementation plan is staff “buy-in.”4–6 It is incumbent upon the project-management team to determine what effects EHR implementation will have on workflow and to explain to employees how the process ultimately will increase efficiency and reduce work time and cost. And the project champion must remind employees of these goals during the transition.4–6
Develop a backup system
Work with your IT staff to create a backup system for the EHR to protect against system malfunction.4 In the past, offices backed up their data to tapes or disks. Today, it probably is safer to back up to the cloud. Cloud computing, which allows for automatic back-up, is tightly regulated by HIPAA, so be sure to choose an approved vendor.7
Preload your data
Before going live with the EHR, data must be integrated and preloaded into the electronic format. This means integrating billing, lab results, orders, scheduling, and encounter templates into the EHR interface.4,6 When data are preloaded, employees can practice on the software before the launch date, ensuring a seamless transition.6
No “teeth-gnashing” necessary
The transition to an EHR system can be intimidating and may affect your staff’s productivity, efficiency, and morale. By following a few careful steps, the process can proceed without teeth-gnashing and loss of productivity. In fact, the suggestions offered here should improve productivity, office efficiency, and patient safety over the long term.
Who could ask for anything more?
We want to hear from you! Tell us what you think.
- Thakkar M, Davis DC. Risks, barriers, and benefits of EHR systems: a comparative study based on size of hospital. Perspect Health Inf Manag. 2006;3(5):1–19.
- Hsiao CJ, Hing E, Socey TC, et al. Electronic health record systems and intent to apply meaningful use incentives among office-based physician practices: United States, 2001–2011. NCHS Data Brief. 2011;(79):1–8.
- Terry NP. Anticipating stage two: assessing the development of meaningful use and EMR deployment. St. Louis University School of Law Legal Studies Research Paper Series. 2011;21.
- Keshavjee K, Bosomworth J, Copen J, et al. Best practices in EMR implementation: a systematic review. AMIA Annu Symp Proc. 2006;982.
- Lorenzi NM, Kouroubali A, Detmer DE, et al. How to successfully select and implement electronic health records (EHR) in small ambulatory practice settings. BMC Medical Informatics Decision Making. 2009;9(15):1–13.
- Smith PD. Implementing an EMR system: one clinic’s experience. Fam Pract Manag. 2003;10(5):37–42.
- Raheja D, Escano MC. Hazards in electronic medical records. J System Safety. 2010;46(4):1–4. http://system-safety.org/ejss/past/novdec2010ejss/pdf/health.pdf. Accessed October 8, 2013.
- Berner ES, Detmer DE, Simborg D. Will the wave finally break? A brief view of the adoption of electronic medical records in the United States. J Am Med Inform Assoc. 2005;12(1):3–7.

Physician Burnout Meta‐analysis
Hospital medicine is a rapidly growing field of US clinical practice.[1] Almost since its advent, concerns have been expressed about the potential for hospitalists to burn out.[2] Hospitalists are not unique in this; similar concerns heralded the arrival of other location‐defined specialties, including emergency medicine[3] and the full‐time intensivist model,[4] a fact that has not gone unnoted in the literature about hospitalists.[5]
The existing international literature on physician burnout provides good reason for this concern. Inpatient‐based physicians tend to work unpredictable schedules, with substantial impact on home life.[6] They tend to be young, and much burnout literature suggests a higher risk among younger, less‐experienced physicians.[7] When surveyed, hospitalists have expressed more concerns about their potential for burnout than their outpatient‐based colleagues.[8]
In fact, data suggesting a correlation between inpatient practice and burnout predate the advent of the US hospitalist movement. Increased hospital time was reported to correlate with higher rates of burnout in internists,[9] family practitioners,[10] palliative physicians,[11] junior doctors,[12] radiologists,[13] and cystic fibrosis caregivers.[14] In 1987, Keinan and Melamed[15] noted, Hospital work by its very nature, as compared to the work of a general practitioner, deals with the more severe and complicated illnesses, coupled with continuous daily contacts with patients and their anxious families. In addition, these physicians may find themselves embroiled in the power struggles and competition so common in their work environment.
There are other features, however, that may protect inpatient physicians from burnout. Hospital practice can facilitate favorable social relations involving colleagues, co‐workers, and patients,[16] a factor that may be protective.[17] A hospitalist schedule also can allow more focused time for continuing medical education, research, and teaching,[18] which have all been associated with reduced risk of burnout in some studies.[17] Studies of psychiatrists[19] and pediatricians[20] have shown a lower rate of burnout among physicians with more inpatient duties. Finally, a practice model involving a seemingly stable cadre of inpatient physicians has existed in Europe for decades,[2] indicating at least a degree of sustainability.
Information suggesting a higher rate of burnout among inpatient physicians could be used to target therapeutic interventions and to adjust schedules, whereas the opposite outcome could refute a pervasive myth. We therefore endeavored to summarize the literature on burnout among inpatient versus outpatient physicians in a systematic fashion, and to include data not only from the US hospitalist experience but also from other countries that have used a similar model for decades. Our primary hypothesis was that inpatient physicians experience more burnout than outpatient physicians.
It is important to distinguish burnout from depression, job dissatisfaction, and occupational stress, all of which have been studied extensively in physicians. Burnout, as introduced by Freudenberger[21] and further characterized by Maslach,[22] is a condition in which emotional exhaustion, depersonalization, and a low sense of personal accomplishment combine to negatively affect work life (as opposed to clinical depression, which affects all aspects of life). Job satisfaction can correlate inversely with burnout, but it is a separate process[23] and the subject of a recent systematic review.[24] The importance of distinguishing burnout from job dissatisfaction is illustrated by a survey of head and neck surgeons, in which 97% of those surveyed indicated satisfaction with their jobs and 34% of the same group answered in the affirmative when asked if they felt burned out.[25]
One obstacle to the meaningful comparison of burnout prevalence across time, geography, and specialty is the myriad ways in which burnout is measured and reported. The oldest and most commonly used instrument to measure burnout is the Maslach Burnout Inventory (MBI), which contains 22 items assessing 3 components of burnout (emotional exhaustion, depersonalization, and low personal accomplishment).[26] Other measures include the Copenhagen Burnout Inventory[27] (19 items with the components personal burnout, work‐related burnout, and client‐related burnout), Utrecht Burnout Inventory[28] (20‐item modification of the MBI), Boudreau Burnout Questionnaire[29] (30 items), Arbeitsbezogenes Verhaltens und Erlebensmuster[30] (66‐item questionnaire assessing professional commitment, resistance to stress, and emotional well‐being), Shirom‐Melamed Burnout Measure[31] (22 items with subscales for physical fatigue, cognitive weariness, tension, and listlessness), and a validated single‐item questionnaire.[32]
METHODS
Electronic searches of MEDLINE, EMBASE, PsycINFO, SCOPUS, and PubMed were undertaken for articles published from January 1, 1974 (the year in which burnout was first described by Freudenberger[21]) to 2012 (last accessed, September 12, 2012) using the Medical Subject Headings (MeSH) terms stress, psychological; burnout, professional; adaptation, psychological; and the keyword burnout. The same sources were searched to create another set for the MeSH terms hospitalists, physician's practice patterns, physicians/px, professional practice location, and the keyword hospitalist#. Where exact subject headings did not exist in databases, comparable subject headings or keywords were used. The 2 sets were then combined using the operator and. Abstracts from the Society of Hospital Medicine annual conferences were hand‐searched, as were reference lists from identified articles. To ensure that pertinent international literature was captured, there was no language restriction in the search.
A 2‐stage screening process was used. The titles and abstracts of all articles identified in the search were independently reviewed by 2 investigators (D.L.R. and K.J.C.) who had no knowledge of each other's results. An article was obtained when either reviewer deemed it worthy of full‐text review.
All full‐text articles were independently reviewed by the same 2 investigators. The inclusion criterion was the measurement of burnout in physicians who are stated to or can be reasonably assumed to spend the substantial majority of their clinical practice exclusively in either the inpatient or the outpatient setting. Studies of emergency department physicians or specialists who invariably spend substantial amounts of time in both settings (eg, surgeons, anesthesiologists) were excluded. Studies limited to trainees or nonphysicians were also excluded. For both stages of review, agreement between the 2 investigators was assessed by calculating the statistic. Disagreements about inclusion were adjudicated by a third investigator (A.I.B.).
Because our goal was to establish and compare the rate of burnout among US hospitalists and other inpatient physicians around the world, we included studies of hospitalists according to the definition in use at the time of the individual study, noting that the formal definition of a hospitalist has changed over the years.[33] Because practice patterns for physicians described as primary care physicians, family doctors, hospital doctors, and others differ substantially from country to country, we otherwise included only the studies where the practice location was stated explicitly or where the authors confirmed that their study participants either are known or can be reasonably assumed to spend more than 75% of their time caring for hospital inpatients, or are known or can be reasonably assumed to spend the vast majority of their time caring for outpatients.
Data were abstracted using a standardized form and included the measure of burnout used in the study, results, practice location of study subjects, and total number of study subjects. When data were not clear (eg, burnout measured but not reported by the authors, practice location of study subjects not clear), authors were contacted by email, or when no current email address could be located or no response was received, by telephone or letter. In instances where burnout was measured repeatedly over time or before and after a specific intervention, only the baseline measurement was recorded. Because all studies were expected to be nonrandomized, methodological quality was assessed using a version of the tool of Downs and Black,[34] adapted where necessary by omitting questions not applicable to the specific study type (eg randomization for survey studies)[35] and giving a maximum of 1 point for the inclusion of a power calculation.
Two a priori analyses were planned: (1) a statistical comparison of articles directly comparing burnout among inpatient and outpatient physicians, and (2) a statistical comparison of articles measuring burnout among inpatient physicians with articles measuring burnout among outpatient physicians by the most frequently reported measuremean subset scores for emotional exhaustion, depersonalization, and personal accomplishment on the MBI.
The primary outcome measures were the differences between mean subset scores for emotional exhaustion, depersonalization, and personal accomplishment on the MBI. All differences are expressed as (outpatient meaninpatient mean). The variance of each outcome was calculated with standard formulas.[36] To calculate the overall estimate, each study was weighted by the reciprocal of its variance. Studies with fewer than 10 subjects were excluded from statistical analysis but retained in the systematic review.
For studies that reported data for both inpatient and outpatient physicians (double‐armed studies), Cochran Q test and the I2 value were used to assess heterogeneity.[37, 38] Substantial heterogeneity was expected because these individual studies were conducted for different populations in different settings with different study designs, and this expectation was confirmed statistically. Therefore, we used a random effects model to estimate the overall effect, providing a conservative approach that accounted for heterogeneity among studies.[39]
To assess the durability of our findings, we performed separate multivariate meta‐regression analyses by including single‐armed studies only and including both single‐armed and double‐armed studies. For these meta‐regressions, means were again weighted by the reciprocal of their variances, and the arms of 2‐armed studies were considered separately. This approach allowed us to generate an estimate of the differences between MBI subset scores from studies that did not include such an estimate when analyzed separately.[40]
We examined the potential for publication bias in double‐armed studies by constructing a funnel plot, in which mean scores were plotted against their standard errors.[41] The trim‐and‐fill method was used to determine whether adjustment for publication bias was necessary. In addition, Begg's rank correlation test[42] was completed to test for statistically significant publication bias.
Stata 10.0 statistical software (StataCorp, College Station, TX) was used for data analyses. A P value of 0.05 or less was deemed statistically significant. The Preferred Reporting Items for Systematic Reviews and Meta‐analysis checklist was used for the design and execution of the systematic review and meta‐analysis.[43]
Subgroup analyses based on location were undertaken a posteriori. All data (double‐armed meta‐analysis, meta‐regression of single‐armed studies, and meta‐regression of single‐ and double‐armed studies) were analyzed by location (United States vs other; United States vs Europe vs other).
RESULTS
The search results are outlined in Figure 1. In total, 1704 articles met the criteria for full‐text review. A review of pertinent reference lists and author contacts led to the addition of 149 articles. Twenty‐nine references could not be located by any means, despite repeated attempts. Therefore, 1824 articles were subjected to full‐text review by the 2 investigators.

Initially, 57 articles were found that met criteria for inclusion. Of these, 2 articles reported data in formats that could not be interpreted.[44, 45] When efforts to clarify the data with the authors were unsuccessful, these studies were excluded. A study specifically designed to assess the response of physicians to a recent series of terrorist attacks[46] was excluded a posteriori because of lack of generalizability. Of the other 54 studies, 15 reported burnout data on both outpatient physicians and inpatient physicians, 22 reported data on outpatient physicians only, and 17 reported data on inpatient physicians only. Table 1 summarizes the results of the 37 studies involving outpatient physicians; Table 2 summarizes the 32 studies involving inpatient physicians.
| Lead Author, Publication Year | Study Population and Location | Instrument | No. of Participants | EE Score (SD)a | DP Score (SD) | PA Score (SD) | Other Results |
|---|---|---|---|---|---|---|---|
| |||||||
| Schweitzer, 1994[12] | Young physicians of various specialties in South Africa | Single‐item survey | 7 | 6 (83%) endorsed burnout | |||
| Aasland, 1997 [54]b | General practitioners in Norway | Modified MBI (22 items; scale, 15) | 298 | 2.65 (0.80) | 1.90 (0.59) | 3.45 (0.40) | |
| Grassi, 2000 [58] | General practitioners in Italy | MBI | 182 | 18.49 (11.49) | 6.11 (5.86) | 38.52 (7.60) | |
| McManus, 2000 [59]b | General practitioners in United Kingdom | Modified MBI (9 items; scale, 06) | 800 | 8.34 (4.39) | 3.18 (3.40) | 14.16 (2.95) | |
| Yaman, 2002 [60] | General practitioners in 8 European nations | MBI | 98 | 25.1 (8.50) | 7.3 (4.92) | 34.5 (7.67) | |
| Cathbras, 2004 [61] | General practitioners in France | MBI | 306 | 21.85 (12.4) | 9.13 (6.7) | 38.7 (7.1) | |
| Goehring, 2005 [63] | General practitioners, general internists, pediatricians in Switzerland | MBI | 1755 | 17.9 (9.8) | 6.5 (4.7) | 39.6 (6.5) | |
| Esteva, 2006 [64] | General practitioners, pediatricians in Spain | MBI | 261 | 27.4 (11.8) | 10.07 (6.4) | 35.9 (7.06) | |
| Gandini, 2006 [65]b | Physicians of various specialties in Argentina | MBI | 67 | 31.0 (13.8) | 10.2 (6.6) | 38.4 (6.8) | |
| Ozyurt, 2006 [66] | General practitioners in Turkey | Modified MBI (22 items; scale, 04) | 55 | 15.23 (5.80) | 4.47 (3.31) | 23.38 (4.29) | |
| Deighton, 2007 [67]b | Psychiatrists in several German‐speaking nations | MBI | 19 | 30.68 (9.92) | 13.42 (4.23) | 37.16 (3.39) | |
| Dunwoodie, 2007 [68]b | Palliative care physicians in Australia | MBI | 21 | 14.95 (9.14) | 3.95 (3.40) | 38.90 (2.88) | |
| Srgaard, 2007 [69]b | Psychiatrists in 5 European nations | MBI | 22 | 19.41 (8.08) | 6.68 (4.93) | 39.00 (4.40) | |
| Sosa Oberlin, 2007 [56]b | Physicians of various specialties in Argentina | Author‐designed instrument | 33 | 26 (78.8%) had 4 burnout symptoms, 6.15 symptoms per physician | |||
| Voltmer, 2007 [57]b | Physicians of various specialties in Germany | AVEM | 46 | 11 (23.9%) exhibited burnout (type B) pattern | |||
| dm, 2008 [70]b | Physicians of various specialties in Hungary | MBI | 163 | 17.45 (11.12) | 4.86 (4.91) | 36.56 (7.03) | |
| Di Iorio, 2008 [71]b | Dialysis physicians in Italy | Author‐designed instrument | 54 | Work: 2.6 (1.5), Material: 3.1 (2.1), Climate: 3.0 (1.1), Objectives: 3.4 (1.6), Quality: 2.2 (1.5), Justification: 3.2 (2.0) | |||
| Lee, 2008 [49]b | Family physicians in Canada | MBI | 123 | 26.26 (9.53) | 10.20 (5.22) | 38.43 (7.34) | |
| Truchot, 2008 [72] | General practitioners in France | MBI | 259 | 25.4 (11.7) | 7.5 (5.5) | 36.5 (7.1) | |
| Twellaar, 2008 [73]b | General practitioners in the Netherlands | Utrecht Burnout Inventory | 349 | 2.06 (1.11) | 1.71 (1.05) | 5.08 (0.77) | |
| Arigoni, 2009 [17] | General practitioners, pediatricians in Switzerland | MBI | 258 | 22.8 (12.0) | 6.9 (6.1) | 39.0 (7.2) | |
| Bernhardt, 2009 [75] | Clinical geneticists in United States | MBI | 72 | 25.8 (10.01)c | 10.9 (4.16)c | 34.8 (5.43)c | |
| Bressi, 2009 [76]b | Psychiatrists in Italy | MBI | 53 | 23.15 (11.99) | 7.02 (6.29) | 36.41 (7.54) | |
| Krasner, 2009 [77] | General practitioners in United States | MBI | 60 | 26.8 (10.9)d | 8.4 (5.1)d | 40.2 (5.3)d | |
| Lasalvia, 2009 [55]b | Psychiatrists in Italy | Modified MBI (16 items; scale, 06) | 38 | 2.37 (1.27) | 1.51 (1.15) | 4.46 (0.87) | |
| Peisah, 2009 [79]b | Physicians of various specialties in Australia | MBI | 28 | 13.92 (9.24) | 3.66 (3.95) | 39.34 (8.55) | |
| Shanafelt, 2009 [80]b | Physicians of various specialties in United States | MBI | 408 | 20.5 (11.10) | 4.3 (4.74) | 40.8 (6.26) | |
| Zantinge, 2009 [81] | General practitioners in the Netherlands | Utrecht Burnout Inventory | 126 | 1.58 (0.79) | 1.32 (0.72) | 4.27 (0.77) | |
| Voltmer, 2010 [83]b | Psychiatrists in Germany | AVEM | 526 | 114 (21.7%) exhibited burnout (type B) pattern | |||
| Maccacaro, 2011 [85]b | Physicians of various specialties in Italy | MBI | 42 | 14.31 (11.98) | 3.62 (4.95) | 38.24 (6.22) | |
| Lucas, 2011 [84]b | Outpatient physicians periodically staffing an academic hospital teaching service in United States | MBI (EE only) | 30 | 24.37 (14.95) | |||
| Shanafelt, 2012 [87]b | General internists in United States | MBI | 447 | 25.4 (14.0) | 7.5 (6.3) | 41.4 (6.0) | |
| Kushnir, 2004 [62] | General practitioners and pediatricians in Israel | MBI (DP only) and SMBM | 309 | 9.15 (3.95) | SMBM mean (SD), 2.73 per item (0.86) | ||
| Vela‐Bueno, 2008 [74]b | General practitioners in Spain | MBI | 240 | 26.91 (11.61) | 9.20 (6.35) | 35.92 (7.92) | |
| Lesic, 2009 [78]b | General practitioners in Serbia | MBI | 38 | 24.71 (10.81) | 7.47 (5.51) | 37.21 (7.44) | |
| Demirci, 2010 [82]b | Medical specialists related to oncology practice in Hungary | MBI | 26 | 23.31 (11.2) | 6.46 (5.7) | 37.7 (8.14) | |
| Putnik, 2011 [86]b | General practitioners in Hungary | MBI | 370 | 22.22 (11.75) | 3.66 (4.40) | 41.40 (6.85) | |
| Lead Author, Publication Year | Study Population and Location | Instrument | No. of Participants | EE Score (SD)a | DP Score (SD) | PA Score (SD) | Other Results |
|---|---|---|---|---|---|---|---|
| |||||||
| Varga, 1996 [88] | Hospital doctors in Spain | MBI | 179 | 21.61b | 7.33b | 35.28b | |
| Aasland, 1997 [54] | Hospital doctors in Norway | Modified MBI (22 items; scale, 15) | 582 | 2.39 (0.80) | 1.81 (0.65) | 3.51 (0.46) | |
| Bargellini, 2000 [89] | Hospital doctors in Italy | MBI | 51 | 17.45 (9.87) | 7.06 (5.54) | 35.33 (7.90) | |
| Grassi, 2000 [58] | Hospital doctors in Italy | MBI | 146 | 16.17 (9.64) | 5.32 (4.76) | 38.71 (7.28) | |
| Hoff, 2001 [33] | Hospitalists in United States | Single‐item surveyc | 393 | 12.9% burned out (>4/5), 24.9% at risk for burnout (34/5), 62.2% at no current risk (mean, 2.86 on 15 scale) | |||
| Trichard, 2005 [90] | Hospital doctors in France | MBI | 199 | 16 (10.7) | 6.6 (5.7) | 38.5 (6.5) | |
| Gandini, 2006 [65]d | Hospital doctors in Argentina | MBI | 290 | 25.0 (12.7) | 7.9 (6.2) | 40.1 (7.0) | |
| Dunwoodie, 2007 [68]d | Palliative care doctors in Australia | MBI | 14 | 18.29 (14.24) | 5.29 (5.89) | 38.86 (3.42) | |
| Srgaard, 2007 [69]d | Psychiatrists in 5 European nations | MBI | 18 | 18.56 (9.32) | 5.50 (3.79) | 39.08 (5.39) | |
| Sosa Oberlin, 2007 [56]d | Hospital doctors in Argentina | Author‐designed instrument | 3 | 3 (100%) had 4 burnout symptoms, 8.67 symptoms per physician | |||
| Voltmer, 2007 [57]d | Hospital doctors in Germany | AVEM | 271 | 77 (28.4%) exhibited burnout (type B) pattern | |||
| dm, 2008 [70]b | Physicians of various specialties in Hungary | MBI | 194 | 19.23 (10.79) | 4.88 (4.61) | 35.26 (8.42) | |
| Di Iorio, 2008 [71]d | Dialysis physicians in Italy | Author‐designed instrument | 62 | Work, mean (SD), 3.1 (1.4); Material, mean (SD), 3.3 (1.5); Climate, mean (SD), 2.9 (1.1); Objectives, mean (SD), 2.5 (1.5); Quality, mean (SD), 3.0 (1.1); Justification, mean (SD), 3.1 (2.1) | |||
| Fuss, 2008 [91]d | Hospital doctors in Germany | Copenhagen Burnout Inventory | 292 | Mean Copenhagen Burnout Inventory, mean (SD), 46.90 (18.45) | |||
| Marner, 2008 [92]d | Psychiatrists and 1 generalist in United States | MBI | 9 | 20.67 (9.75) | 7.78 (5.14) | 35.33 (6.44) | |
| Shehabi, 2008 [93]d | Intensivists in Australia | Modified MBI (6 items; scale, 15) | 86 | 2.85 (0.93) | 2.64 (0.85) | 2.58 (0.83) | |
| Bressi, 2009 [76]d | Psychiatrists in Italy | MBI | 28 | 17.89 (14.46) | 5.32 (7.01) | 34.57 (11.27) | |
| Brown, 2009 [94] | Hospital doctors in Australia | MBI | 12 | 22.25 (8.59) | 6.33 (2.71) | 39.83 (7.31) | |
| Lasalvia, 2009 [55]d | Psychiatrists in Italy | Modified MBI (16 items; scale, 06) | 21 | 1.95 (1.04) | 1.35 (0.85) | 4.46 (1.04) | |
| Peisah, 2009 [79]d | Hospital doctors in Australia | MBI | 62 | 20.09 (9.91) | 6.34 (4.90) | 35.06 (7.33) | |
| Shanafelt, 2009 [80]d | Hospitalists and intensivists in United States | MBI | 19 | 25.2 (11.59) | 4.4 (3.79) | 38.5 (8.04) | |
| Tunc, 2009 [95] | Hospital doctors in Turkey | Modified MBI (22 items; scale, 04) | 62 | 1.18 (0.78) | 0.81 (0.73) | 3.10 (0.59)e | |
| Cocco, 2010 [96]d | Hospital geriatricians in Italy | MBI | 38 | 16.21 (11.56) | 4.53 (4.63) | 39.13 (7.09) | |
| Doppia, 2011 [97]d | Hospital doctors in France | Copenhagen Burnout Inventory | 1,684 | Mean work‐related burnout score, 2.72 (0.75) | |||
| Glasheen, 2011 [98] | Hospitalists in United States | Single‐item survey | 265 | Mean, 2.08 on 15 scale 62 (23.4%) burned out | |||
| Lucas, 2011 [84]d | Academic hospitalists in United States | MBI (EE only) | 26 | 19.54 (12.85) | |||
| Thorsen, 2011 [99] | Hospital doctors in Malawi | MBI | 2 | 25.5 (4.95) | 8.5 (6.36) | 25.0 (5.66) | |
| Hinami, 2012 [50]d | Hospital doctors in United States | Single‐item survey | 793 | Mean, 2.24 on 15 scale 261 (27.2%) burned out | |||
| Quenot, 2012 [100]d | Intensivists in France | MBI | 4 | 33.25 (4.57) | 13.50 (5.45) | 35.25 (4.86) | |
| Ruitenburg, 2012 [101] | Hospital doctors in the Netherlands | MBI (EE and DP only) | 214 | 13.3 (8.0) | 4.5 (4.1) | ||
| Seibt, 2012 [102]d | Hospital doctors in Germany | Modified MBI (16 items; scale, 06, reported per item rather than totals) | 2,154 | 2.2 (1.4) | 1.4 (1.2) | 5.1 (0.9) | |
| Shanafelt, 2012 [87]d | Hospitalists in United States | MBI | 130 | 24.7 (12.5) | 9.1 (6.9) | 39.0 (7.6) | |
Table 3 summarizes the results of the 15 studies that reported burnout data for both inpatient and outpatient physicians, allowing direct comparisons to be made. Nine studies reported MBI subset totals with standard deviations, 2 used different modifications of the MBI, 2 used different author‐derived measures, 1 used only the emotional exhaustion subscale of the MBI, and 1 used the Arbeitsbezogenes Verhaltens und Erlebensmuster. Therefore, statistical comparison was attempted only for the 9 studies reporting comparable MBI data, comprising burnout data on 1390 outpatient physicians and 899 inpatient physicians.
| Lead Author, Publication Year | Location | Instrument | Inpatient‐Based Physicians | Outpatient‐Based Physicians | ||
|---|---|---|---|---|---|---|
| No. | Results, Score (SD)a | No. | Results, Score (SD)a | |||
| ||||||
| Aasland, 1997 [54]b | Norway | Modified MBI (22 items; scale, 15) | 582 | EE, 2.39 (0.80); DP, 1.81 (0.65); PA, 3.51 (0.46) | 298 | EE, 2.65 (0.80); DP, 1.90 (0.59); PA, 3.45 (0.40) |
| Grassi, 2000 [58] | Italy | MBI | 146 | EE, 16.17 (9.64); DP, 5.32 (4.76); PA, 38.71 (7.28) | 182 | EE, 18.49 (11.49); DP, 6.11 (5.86); PA, 38.52 (7.60) |
| Gandini, 2006 [65]b | Argentina | MBI | 290 | EE, 25.0 (12.7);DP, 7.9 (6.2); PA, 40.1 (7.0) | 67 | EE, 31.0 (13.8); DP, 10.2 (6.6); PA, 38.4 (6.8) |
| Dunwoodie, 2007 [68]b | Australia | MBI | 14 | EE, 18.29 (14.24); DP, 5.29 (5.89); PA, 38.86 (3.42) | 21 | EE, 14.95 (9.14); DP, 3.95 (3.40); PA, 38.90 (2.88) |
| Srgaard, 2007 [69]b | 5 European nations | MBI | 18 | EE, 18.56 (9.32); DP, 5.50 (3.79); PA, 39.08 (5.39) | 22 | EE, 19.41 (8.08); DP, 6.68 (4.93); PA, 39.00 (4.40) |
| Sosa Oberlin, 2007 [56]b | Argentina | Author‐designed instrument | 3 | 3 (100%) had 4 burnout symptoms, 8.67 symptoms per physician | 33 | 26 (78.8%) had 4 burnout symptoms, 6.15 symptoms per physician |
| Voltmer, 2007 [57]b | Germany | AVEM | 271 | 77 (28.4%) exhibited burnout (type B) pattern | 46 | 11 (23.9%) exhibited burnout (type B) pattern |
| dm, 2008 [70]b | Hungary | MBI | 194 | EE, 19.23 (10.79); DP, 4.88 (4.61); PA, 35.26 (8.42) | 163 | EE, 17.45 (11.12); DP, 4.86 (4.91); PA, 36.56 (7.03) |
| Di Iorio, 2008 [71]b | Italy | Author‐designed instrument | 62 | Work: 3.1 (1.4); material: 3.3 (1.5); climate: 2.9 (1.1); objectives: 2.5 (1.5); quality: 3.0 (1.1); justification: 3.1 (2.1) | 54 | Work: 2.6 (1.5); material: 3.1 (2.1); climate: 3.0 (1.1); objectives: 3.4 (1.6); quality: 2.2 (1.5); justification: 3.2 (2.0) |
| Bressi, 2009 [76]b | Italy | MBI | 28 | EE, 17.89 (14.46); DP, 5.32 (7.01); PA, 34.57 (11.27) | 53 | EE, 23.15 (11.99); DP, 7.02 (6.29); PA, 36.41 (7.54) |
| Lasalvia, 2009[55]b | Italy | Modified MBI (16 items; scale, 06) | 21 | EE, 1.95 (1.04); DP, 1.35 (0.85); PA, 4.46 (1.04) | 38 | EE, 2.37 (1.27); DP, 1.51 (1.15); PA, 4.46 (0.87) |
| Peisah, 2009 [79]b | Australia | MBI | 62 | EE, 20.09 (9.91); DP, 6.34 (4.90); PA, 35.06 (7.33) | 28 | EE, 13.92 (9.24); DP, 3.66 (3.95); PA, 39.34 (8.55) |
| Shanafelt, 2009 [80]b | United States | MBI | 19 | EE, 25.2 (11.59); DP, 4.4 (3.79); PA, 38.5 (8.04) | 408 | EE, 20.5 (11.10); DP, 4.3 (4.74); PA, 40.8 (6.26) |
| Lucas, 2011 [84]b | United States | MBI (EE only) | 26 | EE, 19.54 (12.85) | 30 | EE, 24.37 (14.95) |
| Shanafelt, 2012 [87]b | United States | MBI | 130 | EE, 24.7 (12.5); DP, 9.1 (6.9); PA, 39.0 (7.6) | 447 | EE, 25.4 (14.0); DP, 7.5 (6.3); PA, 41.4 (6.0) |
Figure 2 shows that no significant difference existed between the groups regarding emotional exhaustion (mean difference, 0.11 points on a 54‐point scale; 95% confidence interval [CI], 2.40 to 2.61; P=0.94). In addition, there was no significant difference between the groups regarding depersonalization (Figure 3; mean difference, 0.00 points on a 30‐point scale; 95% CI, 1.03 to 1.02; P=0.99) and personal accomplishment (Figure 4; mean difference, 0.93 points on a 48‐point scale; 95% CI, 0.23 to 2.09; P=0.11).
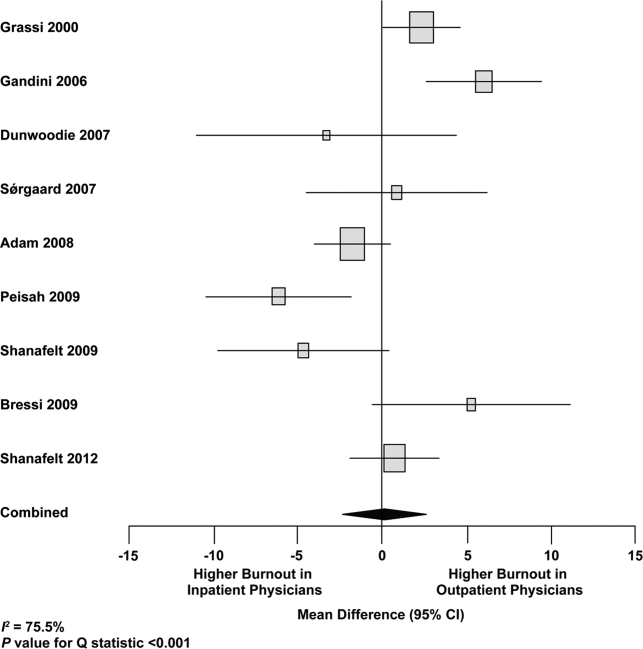

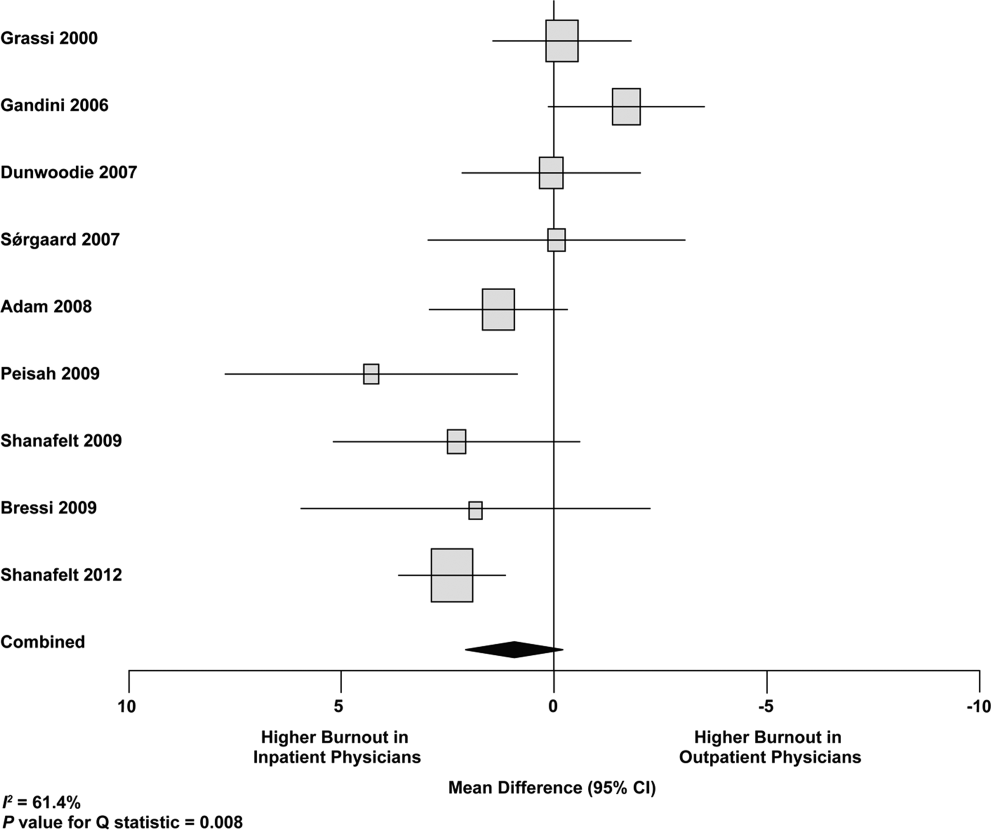
We used meta‐regression to allow the incorporation of single‐armed MBI studies. Whether single‐armed studies were analyzed separately (15 outpatient studies comprising 3927 physicians, 4 inpatient studies comprising 300 physicians) or analyzed with double‐armed studies (24 outpatient arms comprising 5318 physicians, 13 inpatient arms comprising 1301 physicians), the lack of a significant difference between the groups persisted for the depersonalization and personal accomplishment scales (Figure 5). Emotional exhaustion was significantly higher in outpatient physicians when single‐armed studies were considered separately (mean difference, 6.36 points; 95% CI, 2.24 to 10.48; P=0.002), and this difference persisted when all studies were combined (mean difference, 3.00 points; 95% CI, 0.05 to 5.94, P=0.046).
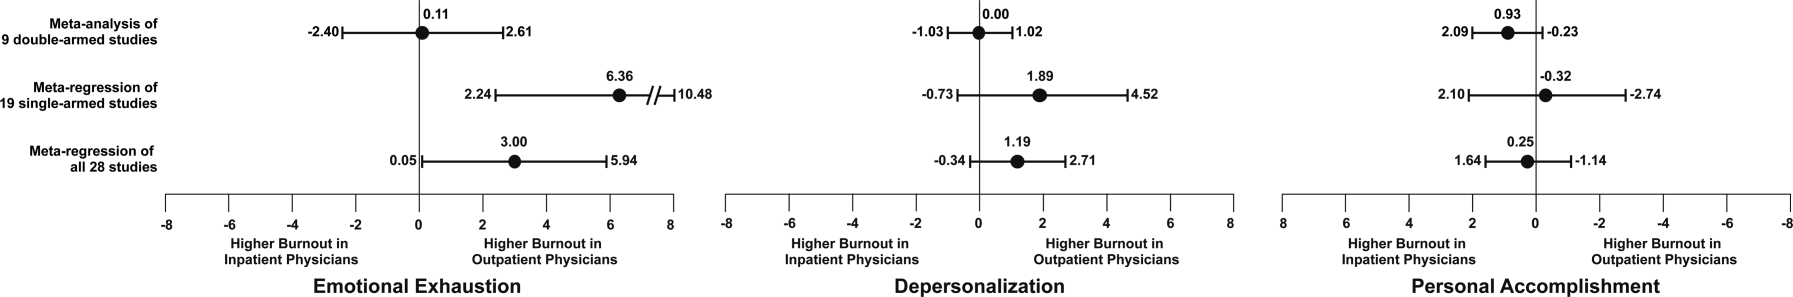
Subgroup analysis by geographic location showed US outpatient physicians had a significantly higher personal accomplishment score than US inpatient physicians (mean difference, 2.38 points; 95% CI, 1.22 to 3.55; P<0.001) in double‐armed studies. This difference did not persist when single‐armed studies were included through meta‐regression (mean difference, 0.55 points, 95% CI, 4.30 to 5.40, P=0.83).
Table 4 demonstrates that methodological quality was generally good from the standpoint of the reporting and bias subsections of the Downs and Black tool. External validity was scored lower for many studies due to the use of convenience samples and lack of information about physicians who declined to participate.
| Lead Author, Publication Year | Reporting | External Validity | Internal Validity: Bias | Internal Validity: Confounding | Power |
|---|---|---|---|---|---|
| Schweitzer, 1994 [12] | 5 of 6 points | 1 of 2 points | 3 of 4 points | 0 of 1 point | 0 of 1 point |
| Varga, 1996 [88] | 5 of 6 points | 1 of 2 points | 3 of 4 points | 1 of 1 point | 0 of 1 point |
| Aasland, 1997 [54] | 3 of 6 points | 2 of 2 points | 3 of 4 points | 1 of 1 point | 0 of 1 point |
| Bargellini, 2000 [89] | 5 of 6 points | 0 of 2 points | 4 of 4 points | 1 of 1 point | 0 of 1 point |
| Grassi, 2000 [58] | 6 of 6 points | 0 of 2 points | 3 of 4 points | 0 of 1 point | 0 of 1 point |
| McManus, 2000 [59] | 5 of 6 points | 2 of 2 points | 4 of 4 points | 1 of 1 point | 0 of 1 point |
| Hoff, 2001 [33] | 6 of 6 points | 2 of 2 points | 2 of 4 points | 1 of 1 point | 0 of 1 point |
| Yaman, 2002 [60] | 5 of 6 points | 0 of 2 points | 4 of 4 points | 0 of 1 point | 0 of 1 point |
| Cathbras, 2004 [61] | 6 of 6 points | 0 of 2 points | 4 of 4 points | 0 of 1 point | 0 of 1 point |
| Kushnir, 2004 [62] | 5 of 6 points | 0 of 2 points | 3 of 4 points | 0 of 1 point | 0 of 1 point |
| Goehring, 2005 [63] | 6 of 6 points | 1 of 2 points | 3 of 4 points | 1 of 1 point | 0 of 1 point |
| Trichard, 2005 [90] | 3 of 6 points | 1 of 2 points | 3 of 4 points | 0 of 1 point | 0 of 1 point |
| Esteva, 2006 [64] | 6 of 6 points | 2 of 2 points | 4 of 4 points | 1 of 1 point | 0 of 1 point |
| Gandini, 2006 [65] | 6 of 6 points | 1 of 2 points | 3 of 4 points | 1 of 1 point | 0 of 1 point |
| Ozyurt, 2006 [66] | 6 of 6 points | 2 of 2 points | 4 of 4 points | 1 of 1 point | 0 of 1 point |
| Deighton, 2007 [67] | 5 of 6 points | 0 of 2 points | 4 of 4 points | 0 of 1 point | 0 of 1 point |
| Dunwoodie, 2007 [68] | 5 of 6 points | 2 of 2 points | 4 of 4 points | 0 of 1 point | 0 of 1 point |
| Srgaard, 2007 [69] | 6 of 6 points | 0 of 2 points | 3 of 4 points | 1 of 1 point | 1 of 1 point |
| Sosa Oberlin, 2007 [56] | 4 of 6 points | 0 of 2 points | 3 of 4 points | 0 of 1 point | 0 of 1 point |
| Voltmer, 2007 [57] | 4 of 6 points | 0 of 2 points | 4 of 4 points | 0 of 1 point | 0 of 1 point |
| dm, 2008 [70] | 5 of 6 points | 2 of 2 points | 3 of 4 points | 1 of 1 point | 0 of 1 point |
| Di Iorio, 2008 [71] | 6 of 6 points | 0 of 2 points | 2 of 4 points | 0 of 1 point | 0 of 1 point |
| Fuss, 2008 [91] | 6 of 6 points | 0 of 2 points | 3 of 4 points | 0 of 1 point | 0 of 1 point |
| Lee, 2008 [49] | 4 of 6 points | 2 of 2 points | 4 of 4 points | 0 of 1 point | 1 of 1 point |
| Marner, 2008 [92] | 6 of 6 points | 0 of 2 points | 4 of 4 points | 0 of 1 point | 0 of 1 point |
| Shehabi, 2008 [93] | 3 of 6 points | 1 of 2 points | 3 of 4 points | 0 of 1 point | 0 of 1 point |
| Truchot, 2008 [72] | 5 of 6 points | 1 of 2 points | 3 of 4 points | 0 of 1 point | 0 of 1 point |
| Twellaar, 2008 [73] | 6 of 6 points | 2 of 2 points | 3 of 4 points | 0 of 1 point | 0 of 1 point |
| Vela‐Bueno, 2008 [74] | 5 of 6 points | 2 of 2 points | 4 of 4 points | 1 of 1 point | 0 of 1 point |
| Arigoni, 2009 [17] | 6 of 6 points | 2 of 2 points | 4 of 4 points | 1 of 1 point | 0 of 1 point |
| Bernhardt, 2009 [75] | 6 of 6 points | 2 of 2 points | 4 of 4 points | 1 of 1 point | 0 of 1 point |
| Bressi, 2009 [76] | 6 of 6 points | 0 of 2 points | 3 of 4 points | 1 of 1 point | 0 of 1 point |
| Brown, 2009 [94] | 6 of 6 points | 0 of 2 points | 4 of 4 points | 0 of 1 point | 0 of 1 point |
| Krasner, 2009 [77] | 9 of 11 points | 0 of 3 points | 6 of 7 points | 1 of 2 points | 1 of 1 point |
| Lasalvia, 2009 [55] | 6 of 6 points | 2 of 2 points | 4 of 4 points | 1 of 1 point | 0 of 1 point |
| Lesic, 2009 [78] | 5 of 6 points | 0 of 2 points | 4 of 4 points | 0 of 1 point | 0 of 1 point |
| Peisah, 2009 [79] | 6 of 6 points | 2 of 2 points | 3 of 4 points | 1 of 1 point | 0 of 1 point |
| Shanafelt, 2009 [80] | 6 of 6 points | 2 of 2 points | 4 of 4 points | 1 of 1 point | 0 of 1 point |
| Tunc, 2009 [95] | 6 of 6 points | 2 of 2 points | 4 of 4 points | 1 of 1 point | 0 of 1 point |
| Zantinge, 2009 [81] | 5 of 6 points | 0 of 2 points | 3 of 4 points | 1 of 1 point | 0 of 1 point |
| Cocco, 2010 [96] | 4 of 6 points | 0 of 2 points | 4 of 4 points | 0 of 1 point | 0 of 1 point |
| Demirci, 2010 [82] | 6 of 6 points | 0 of 2 points | 4 of 4 points | 0 of 1 point | 0 of 1 point |
| Voltmer, 2010 [83] | 6 of 6 points | 2 of 2 points | 4 of 4 points | 1 of 1 point | 0 of 1 point |
| Doppia, 2011 [97] | 5 of 6 points | 2 of 2 points | 4 of 4 points | 1 of 1 point | 0 of 1 point |
| Glasheen, 2011 [98] | 5 of 6 points | 0 of 2 points | 4 of 4 points | 1 of 1 point | 0 of 1 point |
| Lucas, 2011 [84] | 10 of 11 points | 2 of 3 points | 7 of 7 points | 5 of 6 points | 1 of 1 point |
| Maccacaro, 2011 [85] | 5 of 6 points | 0 of 2 points | 4 of 4 points | 1 of 1 point | 0 of 1 point |
| Putnik, 2011 [86] | 6 of 6 points | 1 of 2 points | 4 of 4 points | 0 of 1 point | 0 of 1 point |
| Thorsen, 2011 [99] | 6 of 6 points | 0 of 2 points | 4 of 4 points | 0 of 1 point | 0 of 1 point |
| Hinami, 2012 [50] | 6 of 6 points | 2 of 2 points | 4 of 4 points | 1 of 1 point | 1 of 1 point |
| Quenot, 2012 [100] | 8 of 11 points | 1 of 3 points | 6 of 7 points | 1 of 2 points | 0 of 1 point |
| Ruitenburg, 2012 [101] | 6 of 6 points | 2 of 2 points | 4 of 4 points | 0 of 1 point | 0 of 1 point |
| Seibt, 2012 [102] | 6 of 6 points | 0 of 2 points | 4 of 4 points | 1 of 1 point | 0 of 1 point |
| Shanafelt, 2012 [87] | 6 of 6 points | 2 of 2 points | 4 of 4 points | 1 of 1 point | 0 of 1 point |
Funnel plots were used to evaluate for publication bias in the meta‐analysis of the 8 double‐armed studies (Figure 6). We found no significant evidence of bias, which was supported by Begg's test P values of 0.90 for emotional exhaustion, >0.99 for depersonalization, and 0.54 for personal accomplishment. A trim‐and‐fill analysis determined that no adjustment was necessary.
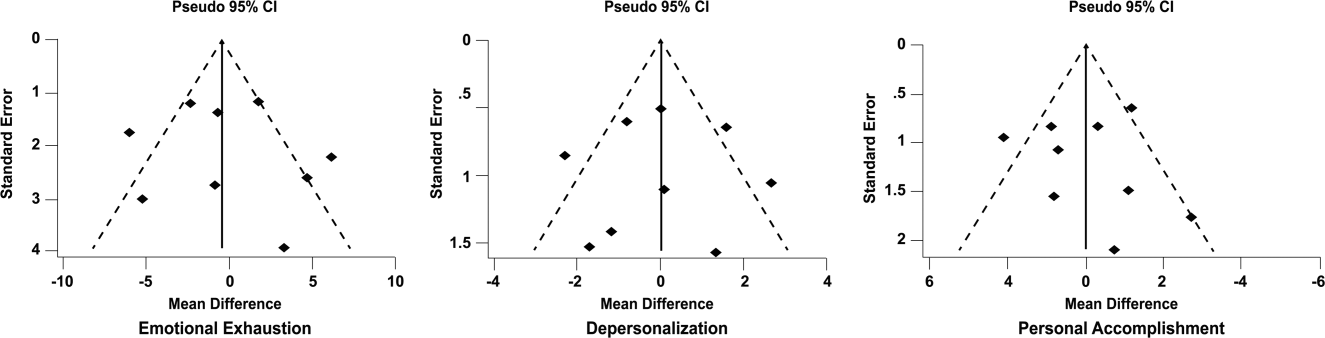
DISCUSSION
There appears to be no support for the long‐held belief that inpatient physicians are particularly prone to burnout. Among studies for which practice location was stated explicitly or could be obtained from the authors, and who used the MBI, no differences were found among inpatient and outpatient physicians with regard to depersonalization or personal accomplishment. This finding persisted whether double‐armed studies were compared directly, single‐armed studies were incorporated into this analysis, or single‐armed studies were analyzed separately. Outpatient physicians had a higher degree of emotional exhaustion when all studies were considered.
There are several reasons why outpatient physicians may be more prone to emotional exhaustion than their inpatient colleagues. Although it is by no means true that all inpatient physicians work in shifts, the increased availability of shift work may allow some inpatient physicians to better balance their professional and personal lives, a factor of work with which some outpatient physicians have struggled.[47] Inpatient practice may also afford more opportunity for teamwork, a factor that has been shown to correlate with reduced burnout.[48] When surveyed about burnout, outpatient physicians have cited patient volumes, paperwork, medicolegal concerns, and lack of community support as factors.[49] Inpatient physicians are not immune to these forces, but they arguably experience them to different degrees.
The absence of a higher rate of depersonalization among inpatient physicians is particularly reassuring in light of concerns expressed with the advent of US hospital medicinethat some hospitalists would be prone to viewing patients as an impediment to the efficient running of the hospital,[2] the very definition of depersonalization.
Although the difference in the whole sample was not statistically significant, the consistent tendency toward a greater sense of personal accomplishment among outpatient physicians is also noteworthy, particularly because post hoc subgroup analysis of US physicians did show statistical significance in both 2‐armed studies. Without detailed age data for the physicians in each study, we could not separate the possible impact of age on personal accomplishment; hospital medicine is a newer specialty staffed by generally younger physicians, and hospitalists may not have had time to develop a sense of accomplishment. When surveyed about job satisfaction, hospitalists have also reported the feeling that they were treated as glorified residents,[50] a factor that, if shared by other inpatient physicians, must surely affect their sense of personal accomplishment. The lack of longitudinal care for patients and the substantial provision of end‐of‐life care also may diminish the sense of personal accomplishment among inpatient physicians.
Another important finding from this systematic review is the marked heterogeneity of the instruments used to measure physician burnout. Many of the identified studies could not be subjected to meta‐analysis because of their use of differing burnout measures. Drawing more substantial conclusions about burnout and practice location is limited by the fact that, although the majority of studies used the full MBI, the largest study of European hospital doctors used the Copenhagen Burnout Inventory, and the studies thus far of US hospitalists have used single‐item surveys or portions of the MBI. Not reflected in this review is the fact that a large study of US burnout and job satisfaction[51] did not formally address practice location (M. Linzer, personal communication, August 2012). Similarly, a large study of British hospital doctors[52] is not included herein because many of the physicians involved had substantial outpatient duties (C. Taylor, personal communication, July 2012). Varying burnout measures have complicated a previous systematic review of burnout in oncologists.[53] Two studies that directly compared inpatient and outpatient physicians but that were excluded from our statistical analysis because of their modified versions of the MBI,[54, 55] showed higher burnout scores in outpatient physicians. Two other studies that provided direct inpatient versus outpatient comparisons but that used alternative burnout measures[56, 57] showed a greater frequency of burnout in inpatient physicians, but of these, 1 study[56] involved only 3 inpatient physicians.
Several limitations of our study should be considered. Although we endeavored to obtain information from authors (with some success) about specific local practice patterns and eliminated many studies because of incomplete data or mixed practice patterns (eg, general practitioners who take frequent hospital calls, hospital physicians with extensive outpatient duties in a clinic attached to their hospital), it remains likely that many physicians identified as outpatient provided some inpatient care (attending a few weeks per year on a teaching service, for example) and that some physicians identified as inpatient have minimal outpatient duties.
More importantly, the dataset analyzed is heterogeneous. Studies of the incidence of burnout are naturally observational and therefore not randomized. Inclusion of international studies is necessary to answer the research question (because published data on US hospitalists are sparse) but naturally introduces differences in practice settings, local factors, and other factors for which we cannot possibly account fully.
Our meta‐analysis therefore addressed a broad question about burnout among inpatient and outpatient physicians in various diverse settings. Applying it to any 1 population (including US hospitalists) is, by necessity, imprecise.
Post hoc analysis should be viewed with caution. For example, the finding of a statistical difference between US inpatient and outpatient physicians with regard to personal accomplishment score is compelling from the standpoint of hypothesis generation. However, it is worth bearing in mind that this analysis contained only 2 studies, both by the same primary author, and compared 855 outpatient physicians to only 149 hospitalists. This difference was no longer significant when 2 outpatient studies were added through meta‐regression.
Finally, the specific focus of this study on practice location precluded comparison with emergency physicians and anesthesiologists, 2 specialist types that have been the subject of particularly robust burnout literature. As the literature on hospitalist burnout becomes more extensive, comparative studies with these groups and with intensivists might prove instructive.
In summary, analysis of 24 studies comprising data on 5318 outpatient physicians and 1301 inpatient physicians provides no support for the commonly held belief that hospital‐based physicians are particularly prone to burnout. Outpatient physicians reported higher emotional exhaustion. Further studies of the incidence and severity of burnout according to practice location are indicated. We propose that in future studies, to avoid the difficulties with statistical analysis summarized herein, investigators ask about and explicitly report practice location (inpatient vs outpatient vs both) and report mean MBI subset data and standard deviations. Such information about US hospitalists would allow comparison with a robust (if heterogeneous) international literature on burnout.
Acknowledgments
The authors gratefully acknowledge all of the study authors who contributed clarification and guidance for this project, particularly the following authors who provided unpublished data for further analysis: Olaf Aasland, MD; Szilvia dm, PhD; Annalisa Bargellini, PhD; Cinzia Bressi, MD, PhD; Darrell Campbell Jr, MD; Ennio Cocco, MD; Russell Deighton, PhD; Senem Demirci Alanyali, MD; Biagio Di Iorio, MD, PhD; David Dunwoodie, MBBS; Sharon Einav, MD; Madeleine Estryn‐Behar, PhD; Bernardo Gandini, MD; Keiki Hinami, MD; Antonio Lasalvia, MD, PhD; Joseph Lee, MD; Guido Maccacaro, MD; Swati Marner, EdD; Chris McManus, MD, PhD; Carmelle Peisah, MBBS, MD; Katarina Putnik, MSc; Alfredo Rodrguez‐Muoz, PhD; Yahya Shehabi, MD; Evelyn Sosa Oberlin, MD; Jean Karl Soler, MD, MSc; Knut Srgaard, PhD; Cath Taylor; Viva Thorsen, MPH; Mascha Twellaar, MD; Edgar Voltmer, MD; Colin West, MD, PhD; and Deborah Whippen. The authors also thank the following colleagues for their help with translation: Dusanka Anastasijevic (Norwegian); Joyce Cheung‐Flynn, PhD (simplified Chinese); Ales Hlubocky, MD (Czech); Lena Jungheim, RN (Swedish); Erez Kessler (Hebrew); Kanae Mukai, MD (Japanese); Eliane Purchase (French); Aaron Shmookler, MD (Russian); Jan Stepanek, MD (German); Fernando Tondato, MD (Portuguese); Laszlo Vaszar, MD (Hungarian); and Joseph Verheidje, PhD (Dutch). Finally, the authors thank Cynthia Heltne and Diana Rogers for their expert and tireless library assistance, Bonnie Schimek for her help with figures, and Cindy Laureano and Elizabeth Jones for their help with author contact.
- . Just because you can, doesn't mean that you should: a call for the rational application of hospitalist comanagement. J Hosp Med. 2008;3(5):398–402.
- . Hospitalists. Hospitalist. 1998;1(4):5–6.
- , . The occupational hazards of emergency physicians. Am J Emerg Med. 2000;18(3):300–311.
- , , , et al. Physician burnout in pediatric critical care medicine. Crit Care Med. 1995;23(8):1425–1429.
- , . The hospitalist: new boon for internal medicine or retreat from primary care? Ann Intern Med. 1999;130(4 pt 2): 382–387.
- , , , et al. Enquete sur les horaires et la charge de travail des medecins dans un establissement de l'Assitance Publique‐Hopitaux de Paris. Arch Mal Prof. 1996;57:438–444.
- , , , , . Burn‐out of urologists in the county of Schleswig‐Holstein, Germany: a comparison of hospital and private practice urologists. J Urol. 2001;165(4): 1158–1161.
- , , , et al. Satisfaction and worklife of academic hospitalist and non‐hospitalist attendings on general medical inpatient rotations. J Gen Internal Med. 2006;21(S4):128.
- , , , , , ; SGIM Career Satisfaction Group. What effect does increasing inpatient time have on outpatient‐oriented internist satisfaction? J Gen Intern Med. 2003;18(9):725–729.
- , , . Burnout and career‐choice regret among family practice physicians in early practice. Fam Pract Res J. 1994;14(3):213–222.
- , , , , , . Job stress and satisfaction among palliative physicians. Palliat Med. 1996; 10(3):185–194.
- . Stress and burnout in junior doctors. S Afr Med J. 1994; 84(6):352–354.
- , . Work stress, satisfaction and burnout in New Zealand radiologists: comparison of public hospital and private practice in New Zealand. J Med Imaging Radiat Oncol. 2009;53(2):194–199.
- , , . Measurement of hypothetical burnout in cystic fibrosis caregivers. Acta Paediatr Scand. 1981; 70(6):935–939.
- , . Personality characteristics and proneness to burnout: a study among internists. Stress Med. 1987;3(4):307–315.
- , , . Thriving and surviving in a new medical career: the case of hospitalist physicians. J Health Soc Behav. 2002;43(1):72–91.
- , , , , . Prevalence of burnout among Swiss cancer clinicians, paediatricians and general practitioners: who are most at risk? Support Care Cancer. 2009;17(1): 75–81.
- , , , . Preparing for “diastole”: advanced training opportunities for academic hospitalists. J Hosp Med. 2006;1(6):368–377.
- , , , , , . Mental health, “burnout” and job satisfaction among hospital and community‐based mental health staff. Br J Psychiatry. 1996;169(3):334–337.
- , , , . Role of a pediatric department chair: factors leading to satisfaction and burnout. J Pediatr. 2007;151(4):425–430.
- . Staff burn‐out. J Soc Iss. 1974;30(1):159–165.
- . Burned‐out. Hum Behav. 1976;5(9):16–22.
- . Underpaid women, stressed out men, satisfied emergency physicians. Ann Emerg Med. 2008;51(6):729–731.
- , , , . U.S. physician satisfaction: a systematic review. J Hosp Med. 2009;4(9):560–568.
- , , , . Professional burnout among head and neck surgeons: results of a survey. Head Neck. 1993;15(6):557–560.
- , . The measurement of experienced burnout. J Occup Behav. 1981;2(2):99–113.
- , , , . The Copenhagen Burnout Inventory: a new tool for the assessment of burnout. Work Stress. 2005;19(3):192–207.
- , . Handleiding van de Utrechtse Burnout Schaal (UBOS). Lisse, the Netherlands: Swets Test Services; 2000.
- . Alberta Physician Burnout [master's thesis]. Alberta, Canada: The University of Lethbridge; 2003.
- , . Arbeitsbezogenes Verhaltensund Erlebensmuster AVEM. Frankfurt, Germany: Swets Test Services; 2003.
- , , , . Internal construct validity of the Shirom‐Melamed Burnout Questionnaire (SMBQ). BMC Public Health. 2012;12:1.
- , , . Validation of a single‐item measure of burnout against the Maslach Burnout Inventory among physicians. Stress Health. 2004;20(2):75–79.
- , , , , . Characteristics and work experiences of hospitalists in the United States. Arch Intern Med. 2001;161(6):851–858.
- , . The feasibility of creating a checklist for the assessment of the methodological quality both of randomised and non‐randomised studies of health care interventions. J Epidemiol Community Health. 1998;52(6):377–384.
- , , , . Including nonrandomized studies. In: Higgins JPT, Green S, eds. Cochrane Handbook for Systematic Reviews of Interventions. Version 5.0.1. The Cochrane Collaboration; 2008. Available at: www.cochrane‐handbook. org. Accessed July 24, 2013.
- , . Statistical Methods in Epidemiology. New York, NY: Oxford University Press; 1989.
- , . Quantifying heterogeneity in a meta‐analysis. Stat Med. 2002;21(11):1539–1558.
- , , , . Measuring inconsistency in meta‐analyses. BMJ. 2003;327(7414):557–560.
- , , . Can we individualize the “number needed to treat”? An empirical study of summary effect measures in meta‐analyses. Int J Epidemiol. 2002;31(1):72–76.
- , . Applications of estimating treatment effects in metaanalyses with missing data. Technical Report No. 2000‐25, 2000. Available at: http://statistics.stanford.edu/_ckirby/techreports/GEN/2000/2000‐25.pdf. Accessed July 22, 2013.
- , , . Publication and related bias in meta‐analysis: power of statistical tests and prevalence in the literature. J Clin Epidemiol. 2000;53(11):1119–1129.
- , . Operating characteristics of a rank correlation test for publication bias. Biometrics. 1994;50(4):1088–1101.
- , , , et al. The PRISMA statement for reporting systematic reviews and meta‐analyses of studies that evaluate healthcare interventions: explanation and elaboration. BMJ. 2009; 339:b2700.
- , , , , , . Job satisfaction and burnout in general practitioners [in Spanish]. Aten Primaria. 2003;31(4):227–233.
- , , . Burnout syndrome among health staff [in Spanish]. Rev Med Inst Mex Seguro Soc. 2006;44(3):221–226.
- , , , , , . Differences in psychological effects in hospital doctors with and without post‐traumatic stress disorder. Br J Psychiatry. 2008;193(2):165–166.
- , , , , . Crossing boundaries: family physicians' struggles to protect their private lives. Can Fam Physician. 2009;55(3):286–287.e5.
- , , , , , , et al. Emergency physicians accumulate more stress factors than other physicians: results from the French SESMAT study. Emerg Med J. 2011 May;28(5):397–410. Epub 2010 Dec 1.
- , , . Stress, burnout, and strategies for reducing them: what's the situation among Canadian family physicians? Can Fam Physician. 2008;54(2):234–235.
- , , , , . Worklife and satisfaction of hospitalists: toward flourishing careers. J Gen Intern Med. 2012;27(1):28–36.
- , , , , , , et al; MEMO (Minimizing Error, Maximizing Outcome) Investigators. Working conditions in primary care: physician reactions and care quality. Ann Intern Med. 2009 Jul 7;151(1):28–36.
- , , , , . Mental health of hospital consultants: the effects of stress and satisfaction at work. Lancet. 1996 Mar 16;347(9003):724–8.
- , , , . Burnout, psychiatric morbidity, and work‐related sources of stress in paediatric oncology staff: a review of the literature. Psycho‐Oncology. 2009 Oct;18(10):1019–28.
- , , , , . Health complaints and job stress in Norwegian physicians: the use of an overlapping questionnaire design. Soc Sci Med. 1997;45(11):1615–1629.
- , , , et al. Influence of perceived organisational factors on job burnout: survey of community mental health staff. Br J Psychiatry. 2009;195(6):537–544.
- . Frecuencia de los sintomas del syndrome de burnout en profesionales medicos. Rev Med Rosario. 2007;73:12–20.
- , , . Work‐related behaviour and experience patterns of physicians compared to other professions. Swiss Med Wkly. 2007;137(31‐32):448–453.
- , . Psychiatric morbidity and burnout in the medical profession: an Italian study of general practitioners and hospital physicians. Psychother Psychosom. 2000;69(6):329–334.
- , , . Duties of a doctor: UK doctors and good medical practice. Qual Health Care. 2000;9(1):14–22.
- , . The job related burnout questionnaire: a multinational pilot study. Aust Fam Physician. 2002;31(11):1055–1056.
- , , , , . Burn out among French general practitioners [in French]. Presse Med. 2004;33(22): 1569–1574.
- , , . Are burnout levels increasing? The experience of Israeli primary care physicians. Isr Med Assoc J. 2004; 6(8):451–455.
- , , , . Psychosocial and professional characteristics of burnout in Swiss primary care practitioners: a cross‐sectional survey. Swiss Med Wkly. 2005;135(7‐8):101–108.
- , , . Mental health in family doctors: effects of satisfaction and stress at work [in Spanish]. Rev Clin Esp. 2006;206(2):77–83.
- , , , , . The professional wearing down or syndrome of welfare labor stress (“burnout”) among health professionals in the city of Cordoba [in Spanish]. Rev Fac Cien Med Univ Nac Cordoba. 2006;63(1):18–25.
- , , . Predictors of burnout and job satisfaction among Turkish physicians. QJM. 2006;99(3):161–169.
- , , . Factors affecting burnout and compassion fatigue in psychotherapists treating torture survivors: is the therapist's attitude to working through trauma relevant? J Trauma Stress. 2007;20(1):63–75.
- , . Psychological morbidity and burnout in palliative care doctors in Western Australia. Intern Med J. 2007;37(10): 693–698.
- , , , ; OSCAR Group. Sources of stress and burnout in acute psychiatric care: inpatient vs. community staff. Soc Psychiatry Psychiatr Epidemiol. 2007;42(10):794–802.
- , , . Physician burnout in Hungary: a potential role for work‐family conflict. J Health Psychol. 2008;13:847–856.
- , , , . Burn‐out in the dialysis unit. J Nephrol. 2008;21(suppl 13):S158–S162.
- . Career orientation and burnout in French general practitioners. Psychol Rep. 2008;103(3):875–881.
- , , . How healthy are Dutch general practitioners? Self‐reported (mental) health among Dutch general practitioners. Eur J Gen Pract. 2008;14(1):4–9.
- , , , et al. Insomnia and sleep quality among primary care physicians with low and high burnout levels. J Psychosom Res. 2008;64(4):435–442.
- , , , , , . Distress and burnout among genetic service providers. Genet Med. 2009;11(7):527–535.
- , , , et al. Burnout among psychiatrists in Milan: a multicenter survey. Psychiatr Serv. 2009;60(7):985–988.
- , , , et al. Association of an educational program in mindful communication with burnout, empathy, and attitudes among primary care physicians. JAMA. 2009;302(12): 1284–1293.
- , , , , , . Burnout in Belgrade orthopaedic surgeons and general practitioners, a preliminary report. Acta Chir Iugosl. 2009; 56(2):53–59.
- , , , . Secrets to psychological success: why older doctors might have lower psychological distress and burnout than younger doctors. Aging Ment Health. 2009;13(2):300–307.
- , , , et al. Career fit and burnout among academic faculty. Arch Intern Med. 2009;169(10):990–995.
- , , , , . Does burnout among doctors affect their involvement in patients' mental health problems? A study of videotaped consultations. BMC Fam Pract. 2009;10:60.
- , , , , , . Evaluation of burnout syndrome in oncology employees. Med Oncol. 2010;27(3):968–974.
- , , , , . Workrelated behavior and experience patterns and predictors of mental health in German physicians in medical practice. Fam Med. 2010; 42(6):433–439.
- , , , et al. Emotional exhaustion, life stress, and perceived control among medicine ward attending physicians: a randomized trial of 2‐ versus 4‐week ward rotations [abstract]. J Hosp Med. 2011; 6(4 suppl 2):S43–S44.
- , , , , , . The effort of being male: a survey on gender and burnout [in Italian]. Med Lav. 2011;102(3):286–296.
- , . Word related characteristics, work‐home and home‐work interference and burnout among primary healthcare physicians: a gender perspective in a Serbian context. BMC Public Health. 2011;11:716.
- , , , et al. Burnout and satisfaction with work‐life balance among US physicians relative to the general US population. Arch Intern Med. 2012;172(18):1377–1385.
- , , . Burnout syndrome in general hospital doctors. Eur J Psychiat. 1996;10:207–213.
- , , , , , . Relation between immune variables and burnout in a sample of physicians. Occup Environ Med. 2000;57(7):453–457.
- , , . Epuisement professionnel et consummation de psychotropes chez les medecins hospitaliers. Alcoologie et Addictologie. 2005;27(4):303–308.
- , , , , . Working conditions and Work‐Family Conflict in German hospital physicians: psychosocial and organisational predictors and consequences. BMC Public Health. 2008;8:353.
- . The Role of Empathy and Witnessed Aggression in Stress Reactions Among Staff Working in a Psychiatric Hospital [dissertation]. New Brunswick, NJ: Rutgers University; 2008.
- , , , , , . Burnout syndrome among Australian intensivists: a survey. Crit Care Resusc. 2008;10(4):312–315.
- , , , , , . Doctors' stress responses and poor communication performance in simulated bad‐news consultations. Acad Med. 2009;84(11):1595–1602.
- , . Role conflict, role ambiguity, and burnout in nurses and physicians at a university hospital in Turkey. Nurs Health Sci. 2009;11(4):410–416.
- . How much is geriatric caregivers burnout caring‐specific? Questions from a questionnaire survey. Clin Pract Epidemiol Ment Health. 2010;6:66–71.
- , , , , ; comite de pilotage de l'enquete SESMAT. Burnout in French doctors: a comparative study among anaesthesiologists and other specialists in French hospitals (SESMAT study) [in French]. Ann Fr Anesth Reanim. 2011;30(11):782–794.
- , , , , , . Career satisfaction and burnout in academic hospital medicine. Arch Intern Med. 2011;171(8):782–785.
- , , . High rates of burnout among maternal health staff at a referral hospital in Malawi: a cross‐sectional study. BMC Nurs. 2011;10:9.
- , , , et al. Suffering among careers working in critical care can be reduced by an intensive communication strategy on end‐of‐life practices. Intensive Care Med. 2012;38:55–61.
- , , . The prevalence of common mental disorders among hospital physicians and their association with self‐reported work ability: a cross‐sectional study. BMC Health Serv Res. 2012;12:292–298.
- , , , . Effort‐reward‐ratio and burnout risk among female teachers and hospital‐employed female physicians: a comparison between professions [in German]. Arbeitsmed Sozialmed Umweltmed. 2012;47:396–406.
Hospital medicine is a rapidly growing field of US clinical practice.[1] Almost since its advent, concerns have been expressed about the potential for hospitalists to burn out.[2] Hospitalists are not unique in this; similar concerns heralded the arrival of other location‐defined specialties, including emergency medicine[3] and the full‐time intensivist model,[4] a fact that has not gone unnoted in the literature about hospitalists.[5]
The existing international literature on physician burnout provides good reason for this concern. Inpatient‐based physicians tend to work unpredictable schedules, with substantial impact on home life.[6] They tend to be young, and much burnout literature suggests a higher risk among younger, less‐experienced physicians.[7] When surveyed, hospitalists have expressed more concerns about their potential for burnout than their outpatient‐based colleagues.[8]
In fact, data suggesting a correlation between inpatient practice and burnout predate the advent of the US hospitalist movement. Increased hospital time was reported to correlate with higher rates of burnout in internists,[9] family practitioners,[10] palliative physicians,[11] junior doctors,[12] radiologists,[13] and cystic fibrosis caregivers.[14] In 1987, Keinan and Melamed[15] noted, Hospital work by its very nature, as compared to the work of a general practitioner, deals with the more severe and complicated illnesses, coupled with continuous daily contacts with patients and their anxious families. In addition, these physicians may find themselves embroiled in the power struggles and competition so common in their work environment.
There are other features, however, that may protect inpatient physicians from burnout. Hospital practice can facilitate favorable social relations involving colleagues, co‐workers, and patients,[16] a factor that may be protective.[17] A hospitalist schedule also can allow more focused time for continuing medical education, research, and teaching,[18] which have all been associated with reduced risk of burnout in some studies.[17] Studies of psychiatrists[19] and pediatricians[20] have shown a lower rate of burnout among physicians with more inpatient duties. Finally, a practice model involving a seemingly stable cadre of inpatient physicians has existed in Europe for decades,[2] indicating at least a degree of sustainability.
Information suggesting a higher rate of burnout among inpatient physicians could be used to target therapeutic interventions and to adjust schedules, whereas the opposite outcome could refute a pervasive myth. We therefore endeavored to summarize the literature on burnout among inpatient versus outpatient physicians in a systematic fashion, and to include data not only from the US hospitalist experience but also from other countries that have used a similar model for decades. Our primary hypothesis was that inpatient physicians experience more burnout than outpatient physicians.
It is important to distinguish burnout from depression, job dissatisfaction, and occupational stress, all of which have been studied extensively in physicians. Burnout, as introduced by Freudenberger[21] and further characterized by Maslach,[22] is a condition in which emotional exhaustion, depersonalization, and a low sense of personal accomplishment combine to negatively affect work life (as opposed to clinical depression, which affects all aspects of life). Job satisfaction can correlate inversely with burnout, but it is a separate process[23] and the subject of a recent systematic review.[24] The importance of distinguishing burnout from job dissatisfaction is illustrated by a survey of head and neck surgeons, in which 97% of those surveyed indicated satisfaction with their jobs and 34% of the same group answered in the affirmative when asked if they felt burned out.[25]
One obstacle to the meaningful comparison of burnout prevalence across time, geography, and specialty is the myriad ways in which burnout is measured and reported. The oldest and most commonly used instrument to measure burnout is the Maslach Burnout Inventory (MBI), which contains 22 items assessing 3 components of burnout (emotional exhaustion, depersonalization, and low personal accomplishment).[26] Other measures include the Copenhagen Burnout Inventory[27] (19 items with the components personal burnout, work‐related burnout, and client‐related burnout), Utrecht Burnout Inventory[28] (20‐item modification of the MBI), Boudreau Burnout Questionnaire[29] (30 items), Arbeitsbezogenes Verhaltens und Erlebensmuster[30] (66‐item questionnaire assessing professional commitment, resistance to stress, and emotional well‐being), Shirom‐Melamed Burnout Measure[31] (22 items with subscales for physical fatigue, cognitive weariness, tension, and listlessness), and a validated single‐item questionnaire.[32]
METHODS
Electronic searches of MEDLINE, EMBASE, PsycINFO, SCOPUS, and PubMed were undertaken for articles published from January 1, 1974 (the year in which burnout was first described by Freudenberger[21]) to 2012 (last accessed, September 12, 2012) using the Medical Subject Headings (MeSH) terms stress, psychological; burnout, professional; adaptation, psychological; and the keyword burnout. The same sources were searched to create another set for the MeSH terms hospitalists, physician's practice patterns, physicians/px, professional practice location, and the keyword hospitalist#. Where exact subject headings did not exist in databases, comparable subject headings or keywords were used. The 2 sets were then combined using the operator and. Abstracts from the Society of Hospital Medicine annual conferences were hand‐searched, as were reference lists from identified articles. To ensure that pertinent international literature was captured, there was no language restriction in the search.
A 2‐stage screening process was used. The titles and abstracts of all articles identified in the search were independently reviewed by 2 investigators (D.L.R. and K.J.C.) who had no knowledge of each other's results. An article was obtained when either reviewer deemed it worthy of full‐text review.
All full‐text articles were independently reviewed by the same 2 investigators. The inclusion criterion was the measurement of burnout in physicians who are stated to or can be reasonably assumed to spend the substantial majority of their clinical practice exclusively in either the inpatient or the outpatient setting. Studies of emergency department physicians or specialists who invariably spend substantial amounts of time in both settings (eg, surgeons, anesthesiologists) were excluded. Studies limited to trainees or nonphysicians were also excluded. For both stages of review, agreement between the 2 investigators was assessed by calculating the statistic. Disagreements about inclusion were adjudicated by a third investigator (A.I.B.).
Because our goal was to establish and compare the rate of burnout among US hospitalists and other inpatient physicians around the world, we included studies of hospitalists according to the definition in use at the time of the individual study, noting that the formal definition of a hospitalist has changed over the years.[33] Because practice patterns for physicians described as primary care physicians, family doctors, hospital doctors, and others differ substantially from country to country, we otherwise included only the studies where the practice location was stated explicitly or where the authors confirmed that their study participants either are known or can be reasonably assumed to spend more than 75% of their time caring for hospital inpatients, or are known or can be reasonably assumed to spend the vast majority of their time caring for outpatients.
Data were abstracted using a standardized form and included the measure of burnout used in the study, results, practice location of study subjects, and total number of study subjects. When data were not clear (eg, burnout measured but not reported by the authors, practice location of study subjects not clear), authors were contacted by email, or when no current email address could be located or no response was received, by telephone or letter. In instances where burnout was measured repeatedly over time or before and after a specific intervention, only the baseline measurement was recorded. Because all studies were expected to be nonrandomized, methodological quality was assessed using a version of the tool of Downs and Black,[34] adapted where necessary by omitting questions not applicable to the specific study type (eg randomization for survey studies)[35] and giving a maximum of 1 point for the inclusion of a power calculation.
Two a priori analyses were planned: (1) a statistical comparison of articles directly comparing burnout among inpatient and outpatient physicians, and (2) a statistical comparison of articles measuring burnout among inpatient physicians with articles measuring burnout among outpatient physicians by the most frequently reported measuremean subset scores for emotional exhaustion, depersonalization, and personal accomplishment on the MBI.
The primary outcome measures were the differences between mean subset scores for emotional exhaustion, depersonalization, and personal accomplishment on the MBI. All differences are expressed as (outpatient meaninpatient mean). The variance of each outcome was calculated with standard formulas.[36] To calculate the overall estimate, each study was weighted by the reciprocal of its variance. Studies with fewer than 10 subjects were excluded from statistical analysis but retained in the systematic review.
For studies that reported data for both inpatient and outpatient physicians (double‐armed studies), Cochran Q test and the I2 value were used to assess heterogeneity.[37, 38] Substantial heterogeneity was expected because these individual studies were conducted for different populations in different settings with different study designs, and this expectation was confirmed statistically. Therefore, we used a random effects model to estimate the overall effect, providing a conservative approach that accounted for heterogeneity among studies.[39]
To assess the durability of our findings, we performed separate multivariate meta‐regression analyses by including single‐armed studies only and including both single‐armed and double‐armed studies. For these meta‐regressions, means were again weighted by the reciprocal of their variances, and the arms of 2‐armed studies were considered separately. This approach allowed us to generate an estimate of the differences between MBI subset scores from studies that did not include such an estimate when analyzed separately.[40]
We examined the potential for publication bias in double‐armed studies by constructing a funnel plot, in which mean scores were plotted against their standard errors.[41] The trim‐and‐fill method was used to determine whether adjustment for publication bias was necessary. In addition, Begg's rank correlation test[42] was completed to test for statistically significant publication bias.
Stata 10.0 statistical software (StataCorp, College Station, TX) was used for data analyses. A P value of 0.05 or less was deemed statistically significant. The Preferred Reporting Items for Systematic Reviews and Meta‐analysis checklist was used for the design and execution of the systematic review and meta‐analysis.[43]
Subgroup analyses based on location were undertaken a posteriori. All data (double‐armed meta‐analysis, meta‐regression of single‐armed studies, and meta‐regression of single‐ and double‐armed studies) were analyzed by location (United States vs other; United States vs Europe vs other).
RESULTS
The search results are outlined in Figure 1. In total, 1704 articles met the criteria for full‐text review. A review of pertinent reference lists and author contacts led to the addition of 149 articles. Twenty‐nine references could not be located by any means, despite repeated attempts. Therefore, 1824 articles were subjected to full‐text review by the 2 investigators.
Initially, 57 articles were found that met criteria for inclusion. Of these, 2 articles reported data in formats that could not be interpreted.[44, 45] When efforts to clarify the data with the authors were unsuccessful, these studies were excluded. A study specifically designed to assess the response of physicians to a recent series of terrorist attacks[46] was excluded a posteriori because of lack of generalizability. Of the other 54 studies, 15 reported burnout data on both outpatient physicians and inpatient physicians, 22 reported data on outpatient physicians only, and 17 reported data on inpatient physicians only. Table 1 summarizes the results of the 37 studies involving outpatient physicians; Table 2 summarizes the 32 studies involving inpatient physicians.
| Lead Author, Publication Year | Study Population and Location | Instrument | No. of Participants | EE Score (SD)a | DP Score (SD) | PA Score (SD) | Other Results |
|---|---|---|---|---|---|---|---|
| |||||||
| Schweitzer, 1994[12] | Young physicians of various specialties in South Africa | Single‐item survey | 7 | 6 (83%) endorsed burnout | |||
| Aasland, 1997 [54]b | General practitioners in Norway | Modified MBI (22 items; scale, 15) | 298 | 2.65 (0.80) | 1.90 (0.59) | 3.45 (0.40) | |
| Grassi, 2000 [58] | General practitioners in Italy | MBI | 182 | 18.49 (11.49) | 6.11 (5.86) | 38.52 (7.60) | |
| McManus, 2000 [59]b | General practitioners in United Kingdom | Modified MBI (9 items; scale, 06) | 800 | 8.34 (4.39) | 3.18 (3.40) | 14.16 (2.95) | |
| Yaman, 2002 [60] | General practitioners in 8 European nations | MBI | 98 | 25.1 (8.50) | 7.3 (4.92) | 34.5 (7.67) | |
| Cathbras, 2004 [61] | General practitioners in France | MBI | 306 | 21.85 (12.4) | 9.13 (6.7) | 38.7 (7.1) | |
| Goehring, 2005 [63] | General practitioners, general internists, pediatricians in Switzerland | MBI | 1755 | 17.9 (9.8) | 6.5 (4.7) | 39.6 (6.5) | |
| Esteva, 2006 [64] | General practitioners, pediatricians in Spain | MBI | 261 | 27.4 (11.8) | 10.07 (6.4) | 35.9 (7.06) | |
| Gandini, 2006 [65]b | Physicians of various specialties in Argentina | MBI | 67 | 31.0 (13.8) | 10.2 (6.6) | 38.4 (6.8) | |
| Ozyurt, 2006 [66] | General practitioners in Turkey | Modified MBI (22 items; scale, 04) | 55 | 15.23 (5.80) | 4.47 (3.31) | 23.38 (4.29) | |
| Deighton, 2007 [67]b | Psychiatrists in several German‐speaking nations | MBI | 19 | 30.68 (9.92) | 13.42 (4.23) | 37.16 (3.39) | |
| Dunwoodie, 2007 [68]b | Palliative care physicians in Australia | MBI | 21 | 14.95 (9.14) | 3.95 (3.40) | 38.90 (2.88) | |
| Srgaard, 2007 [69]b | Psychiatrists in 5 European nations | MBI | 22 | 19.41 (8.08) | 6.68 (4.93) | 39.00 (4.40) | |
| Sosa Oberlin, 2007 [56]b | Physicians of various specialties in Argentina | Author‐designed instrument | 33 | 26 (78.8%) had 4 burnout symptoms, 6.15 symptoms per physician | |||
| Voltmer, 2007 [57]b | Physicians of various specialties in Germany | AVEM | 46 | 11 (23.9%) exhibited burnout (type B) pattern | |||
| dm, 2008 [70]b | Physicians of various specialties in Hungary | MBI | 163 | 17.45 (11.12) | 4.86 (4.91) | 36.56 (7.03) | |
| Di Iorio, 2008 [71]b | Dialysis physicians in Italy | Author‐designed instrument | 54 | Work: 2.6 (1.5), Material: 3.1 (2.1), Climate: 3.0 (1.1), Objectives: 3.4 (1.6), Quality: 2.2 (1.5), Justification: 3.2 (2.0) | |||
| Lee, 2008 [49]b | Family physicians in Canada | MBI | 123 | 26.26 (9.53) | 10.20 (5.22) | 38.43 (7.34) | |
| Truchot, 2008 [72] | General practitioners in France | MBI | 259 | 25.4 (11.7) | 7.5 (5.5) | 36.5 (7.1) | |
| Twellaar, 2008 [73]b | General practitioners in the Netherlands | Utrecht Burnout Inventory | 349 | 2.06 (1.11) | 1.71 (1.05) | 5.08 (0.77) | |
| Arigoni, 2009 [17] | General practitioners, pediatricians in Switzerland | MBI | 258 | 22.8 (12.0) | 6.9 (6.1) | 39.0 (7.2) | |
| Bernhardt, 2009 [75] | Clinical geneticists in United States | MBI | 72 | 25.8 (10.01)c | 10.9 (4.16)c | 34.8 (5.43)c | |
| Bressi, 2009 [76]b | Psychiatrists in Italy | MBI | 53 | 23.15 (11.99) | 7.02 (6.29) | 36.41 (7.54) | |
| Krasner, 2009 [77] | General practitioners in United States | MBI | 60 | 26.8 (10.9)d | 8.4 (5.1)d | 40.2 (5.3)d | |
| Lasalvia, 2009 [55]b | Psychiatrists in Italy | Modified MBI (16 items; scale, 06) | 38 | 2.37 (1.27) | 1.51 (1.15) | 4.46 (0.87) | |
| Peisah, 2009 [79]b | Physicians of various specialties in Australia | MBI | 28 | 13.92 (9.24) | 3.66 (3.95) | 39.34 (8.55) | |
| Shanafelt, 2009 [80]b | Physicians of various specialties in United States | MBI | 408 | 20.5 (11.10) | 4.3 (4.74) | 40.8 (6.26) | |
| Zantinge, 2009 [81] | General practitioners in the Netherlands | Utrecht Burnout Inventory | 126 | 1.58 (0.79) | 1.32 (0.72) | 4.27 (0.77) | |
| Voltmer, 2010 [83]b | Psychiatrists in Germany | AVEM | 526 | 114 (21.7%) exhibited burnout (type B) pattern | |||
| Maccacaro, 2011 [85]b | Physicians of various specialties in Italy | MBI | 42 | 14.31 (11.98) | 3.62 (4.95) | 38.24 (6.22) | |
| Lucas, 2011 [84]b | Outpatient physicians periodically staffing an academic hospital teaching service in United States | MBI (EE only) | 30 | 24.37 (14.95) | |||
| Shanafelt, 2012 [87]b | General internists in United States | MBI | 447 | 25.4 (14.0) | 7.5 (6.3) | 41.4 (6.0) | |
| Kushnir, 2004 [62] | General practitioners and pediatricians in Israel | MBI (DP only) and SMBM | 309 | 9.15 (3.95) | SMBM mean (SD), 2.73 per item (0.86) | ||
| Vela‐Bueno, 2008 [74]b | General practitioners in Spain | MBI | 240 | 26.91 (11.61) | 9.20 (6.35) | 35.92 (7.92) | |
| Lesic, 2009 [78]b | General practitioners in Serbia | MBI | 38 | 24.71 (10.81) | 7.47 (5.51) | 37.21 (7.44) | |
| Demirci, 2010 [82]b | Medical specialists related to oncology practice in Hungary | MBI | 26 | 23.31 (11.2) | 6.46 (5.7) | 37.7 (8.14) | |
| Putnik, 2011 [86]b | General practitioners in Hungary | MBI | 370 | 22.22 (11.75) | 3.66 (4.40) | 41.40 (6.85) | |
| Lead Author, Publication Year | Study Population and Location | Instrument | No. of Participants | EE Score (SD)a | DP Score (SD) | PA Score (SD) | Other Results |
|---|---|---|---|---|---|---|---|
| |||||||
| Varga, 1996 [88] | Hospital doctors in Spain | MBI | 179 | 21.61b | 7.33b | 35.28b | |
| Aasland, 1997 [54] | Hospital doctors in Norway | Modified MBI (22 items; scale, 15) | 582 | 2.39 (0.80) | 1.81 (0.65) | 3.51 (0.46) | |
| Bargellini, 2000 [89] | Hospital doctors in Italy | MBI | 51 | 17.45 (9.87) | 7.06 (5.54) | 35.33 (7.90) | |
| Grassi, 2000 [58] | Hospital doctors in Italy | MBI | 146 | 16.17 (9.64) | 5.32 (4.76) | 38.71 (7.28) | |
| Hoff, 2001 [33] | Hospitalists in United States | Single‐item surveyc | 393 | 12.9% burned out (>4/5), 24.9% at risk for burnout (34/5), 62.2% at no current risk (mean, 2.86 on 15 scale) | |||
| Trichard, 2005 [90] | Hospital doctors in France | MBI | 199 | 16 (10.7) | 6.6 (5.7) | 38.5 (6.5) | |
| Gandini, 2006 [65]d | Hospital doctors in Argentina | MBI | 290 | 25.0 (12.7) | 7.9 (6.2) | 40.1 (7.0) | |
| Dunwoodie, 2007 [68]d | Palliative care doctors in Australia | MBI | 14 | 18.29 (14.24) | 5.29 (5.89) | 38.86 (3.42) | |
| Srgaard, 2007 [69]d | Psychiatrists in 5 European nations | MBI | 18 | 18.56 (9.32) | 5.50 (3.79) | 39.08 (5.39) | |
| Sosa Oberlin, 2007 [56]d | Hospital doctors in Argentina | Author‐designed instrument | 3 | 3 (100%) had 4 burnout symptoms, 8.67 symptoms per physician | |||
| Voltmer, 2007 [57]d | Hospital doctors in Germany | AVEM | 271 | 77 (28.4%) exhibited burnout (type B) pattern | |||
| dm, 2008 [70]b | Physicians of various specialties in Hungary | MBI | 194 | 19.23 (10.79) | 4.88 (4.61) | 35.26 (8.42) | |
| Di Iorio, 2008 [71]d | Dialysis physicians in Italy | Author‐designed instrument | 62 | Work, mean (SD), 3.1 (1.4); Material, mean (SD), 3.3 (1.5); Climate, mean (SD), 2.9 (1.1); Objectives, mean (SD), 2.5 (1.5); Quality, mean (SD), 3.0 (1.1); Justification, mean (SD), 3.1 (2.1) | |||
| Fuss, 2008 [91]d | Hospital doctors in Germany | Copenhagen Burnout Inventory | 292 | Mean Copenhagen Burnout Inventory, mean (SD), 46.90 (18.45) | |||
| Marner, 2008 [92]d | Psychiatrists and 1 generalist in United States | MBI | 9 | 20.67 (9.75) | 7.78 (5.14) | 35.33 (6.44) | |
| Shehabi, 2008 [93]d | Intensivists in Australia | Modified MBI (6 items; scale, 15) | 86 | 2.85 (0.93) | 2.64 (0.85) | 2.58 (0.83) | |
| Bressi, 2009 [76]d | Psychiatrists in Italy | MBI | 28 | 17.89 (14.46) | 5.32 (7.01) | 34.57 (11.27) | |
| Brown, 2009 [94] | Hospital doctors in Australia | MBI | 12 | 22.25 (8.59) | 6.33 (2.71) | 39.83 (7.31) | |
| Lasalvia, 2009 [55]d | Psychiatrists in Italy | Modified MBI (16 items; scale, 06) | 21 | 1.95 (1.04) | 1.35 (0.85) | 4.46 (1.04) | |
| Peisah, 2009 [79]d | Hospital doctors in Australia | MBI | 62 | 20.09 (9.91) | 6.34 (4.90) | 35.06 (7.33) | |
| Shanafelt, 2009 [80]d | Hospitalists and intensivists in United States | MBI | 19 | 25.2 (11.59) | 4.4 (3.79) | 38.5 (8.04) | |
| Tunc, 2009 [95] | Hospital doctors in Turkey | Modified MBI (22 items; scale, 04) | 62 | 1.18 (0.78) | 0.81 (0.73) | 3.10 (0.59)e | |
| Cocco, 2010 [96]d | Hospital geriatricians in Italy | MBI | 38 | 16.21 (11.56) | 4.53 (4.63) | 39.13 (7.09) | |
| Doppia, 2011 [97]d | Hospital doctors in France | Copenhagen Burnout Inventory | 1,684 | Mean work‐related burnout score, 2.72 (0.75) | |||
| Glasheen, 2011 [98] | Hospitalists in United States | Single‐item survey | 265 | Mean, 2.08 on 15 scale 62 (23.4%) burned out | |||
| Lucas, 2011 [84]d | Academic hospitalists in United States | MBI (EE only) | 26 | 19.54 (12.85) | |||
| Thorsen, 2011 [99] | Hospital doctors in Malawi | MBI | 2 | 25.5 (4.95) | 8.5 (6.36) | 25.0 (5.66) | |
| Hinami, 2012 [50]d | Hospital doctors in United States | Single‐item survey | 793 | Mean, 2.24 on 15 scale 261 (27.2%) burned out | |||
| Quenot, 2012 [100]d | Intensivists in France | MBI | 4 | 33.25 (4.57) | 13.50 (5.45) | 35.25 (4.86) | |
| Ruitenburg, 2012 [101] | Hospital doctors in the Netherlands | MBI (EE and DP only) | 214 | 13.3 (8.0) | 4.5 (4.1) | ||
| Seibt, 2012 [102]d | Hospital doctors in Germany | Modified MBI (16 items; scale, 06, reported per item rather than totals) | 2,154 | 2.2 (1.4) | 1.4 (1.2) | 5.1 (0.9) | |
| Shanafelt, 2012 [87]d | Hospitalists in United States | MBI | 130 | 24.7 (12.5) | 9.1 (6.9) | 39.0 (7.6) | |
Table 3 summarizes the results of the 15 studies that reported burnout data for both inpatient and outpatient physicians, allowing direct comparisons to be made. Nine studies reported MBI subset totals with standard deviations, 2 used different modifications of the MBI, 2 used different author‐derived measures, 1 used only the emotional exhaustion subscale of the MBI, and 1 used the Arbeitsbezogenes Verhaltens und Erlebensmuster. Therefore, statistical comparison was attempted only for the 9 studies reporting comparable MBI data, comprising burnout data on 1390 outpatient physicians and 899 inpatient physicians.
| Lead Author, Publication Year | Location | Instrument | Inpatient‐Based Physicians | Outpatient‐Based Physicians | ||
|---|---|---|---|---|---|---|
| No. | Results, Score (SD)a | No. | Results, Score (SD)a | |||
| ||||||
| Aasland, 1997 [54]b | Norway | Modified MBI (22 items; scale, 15) | 582 | EE, 2.39 (0.80); DP, 1.81 (0.65); PA, 3.51 (0.46) | 298 | EE, 2.65 (0.80); DP, 1.90 (0.59); PA, 3.45 (0.40) |
| Grassi, 2000 [58] | Italy | MBI | 146 | EE, 16.17 (9.64); DP, 5.32 (4.76); PA, 38.71 (7.28) | 182 | EE, 18.49 (11.49); DP, 6.11 (5.86); PA, 38.52 (7.60) |
| Gandini, 2006 [65]b | Argentina | MBI | 290 | EE, 25.0 (12.7);DP, 7.9 (6.2); PA, 40.1 (7.0) | 67 | EE, 31.0 (13.8); DP, 10.2 (6.6); PA, 38.4 (6.8) |
| Dunwoodie, 2007 [68]b | Australia | MBI | 14 | EE, 18.29 (14.24); DP, 5.29 (5.89); PA, 38.86 (3.42) | 21 | EE, 14.95 (9.14); DP, 3.95 (3.40); PA, 38.90 (2.88) |
| Srgaard, 2007 [69]b | 5 European nations | MBI | 18 | EE, 18.56 (9.32); DP, 5.50 (3.79); PA, 39.08 (5.39) | 22 | EE, 19.41 (8.08); DP, 6.68 (4.93); PA, 39.00 (4.40) |
| Sosa Oberlin, 2007 [56]b | Argentina | Author‐designed instrument | 3 | 3 (100%) had 4 burnout symptoms, 8.67 symptoms per physician | 33 | 26 (78.8%) had 4 burnout symptoms, 6.15 symptoms per physician |
| Voltmer, 2007 [57]b | Germany | AVEM | 271 | 77 (28.4%) exhibited burnout (type B) pattern | 46 | 11 (23.9%) exhibited burnout (type B) pattern |
| dm, 2008 [70]b | Hungary | MBI | 194 | EE, 19.23 (10.79); DP, 4.88 (4.61); PA, 35.26 (8.42) | 163 | EE, 17.45 (11.12); DP, 4.86 (4.91); PA, 36.56 (7.03) |
| Di Iorio, 2008 [71]b | Italy | Author‐designed instrument | 62 | Work: 3.1 (1.4); material: 3.3 (1.5); climate: 2.9 (1.1); objectives: 2.5 (1.5); quality: 3.0 (1.1); justification: 3.1 (2.1) | 54 | Work: 2.6 (1.5); material: 3.1 (2.1); climate: 3.0 (1.1); objectives: 3.4 (1.6); quality: 2.2 (1.5); justification: 3.2 (2.0) |
| Bressi, 2009 [76]b | Italy | MBI | 28 | EE, 17.89 (14.46); DP, 5.32 (7.01); PA, 34.57 (11.27) | 53 | EE, 23.15 (11.99); DP, 7.02 (6.29); PA, 36.41 (7.54) |
| Lasalvia, 2009[55]b | Italy | Modified MBI (16 items; scale, 06) | 21 | EE, 1.95 (1.04); DP, 1.35 (0.85); PA, 4.46 (1.04) | 38 | EE, 2.37 (1.27); DP, 1.51 (1.15); PA, 4.46 (0.87) |
| Peisah, 2009 [79]b | Australia | MBI | 62 | EE, 20.09 (9.91); DP, 6.34 (4.90); PA, 35.06 (7.33) | 28 | EE, 13.92 (9.24); DP, 3.66 (3.95); PA, 39.34 (8.55) |
| Shanafelt, 2009 [80]b | United States | MBI | 19 | EE, 25.2 (11.59); DP, 4.4 (3.79); PA, 38.5 (8.04) | 408 | EE, 20.5 (11.10); DP, 4.3 (4.74); PA, 40.8 (6.26) |
| Lucas, 2011 [84]b | United States | MBI (EE only) | 26 | EE, 19.54 (12.85) | 30 | EE, 24.37 (14.95) |
| Shanafelt, 2012 [87]b | United States | MBI | 130 | EE, 24.7 (12.5); DP, 9.1 (6.9); PA, 39.0 (7.6) | 447 | EE, 25.4 (14.0); DP, 7.5 (6.3); PA, 41.4 (6.0) |
Figure 2 shows that no significant difference existed between the groups regarding emotional exhaustion (mean difference, 0.11 points on a 54‐point scale; 95% confidence interval [CI], 2.40 to 2.61; P=0.94). In addition, there was no significant difference between the groups regarding depersonalization (Figure 3; mean difference, 0.00 points on a 30‐point scale; 95% CI, 1.03 to 1.02; P=0.99) and personal accomplishment (Figure 4; mean difference, 0.93 points on a 48‐point scale; 95% CI, 0.23 to 2.09; P=0.11).
We used meta‐regression to allow the incorporation of single‐armed MBI studies. Whether single‐armed studies were analyzed separately (15 outpatient studies comprising 3927 physicians, 4 inpatient studies comprising 300 physicians) or analyzed with double‐armed studies (24 outpatient arms comprising 5318 physicians, 13 inpatient arms comprising 1301 physicians), the lack of a significant difference between the groups persisted for the depersonalization and personal accomplishment scales (Figure 5). Emotional exhaustion was significantly higher in outpatient physicians when single‐armed studies were considered separately (mean difference, 6.36 points; 95% CI, 2.24 to 10.48; P=0.002), and this difference persisted when all studies were combined (mean difference, 3.00 points; 95% CI, 0.05 to 5.94, P=0.046).
Subgroup analysis by geographic location showed US outpatient physicians had a significantly higher personal accomplishment score than US inpatient physicians (mean difference, 2.38 points; 95% CI, 1.22 to 3.55; P<0.001) in double‐armed studies. This difference did not persist when single‐armed studies were included through meta‐regression (mean difference, 0.55 points, 95% CI, 4.30 to 5.40, P=0.83).
Table 4 demonstrates that methodological quality was generally good from the standpoint of the reporting and bias subsections of the Downs and Black tool. External validity was scored lower for many studies due to the use of convenience samples and lack of information about physicians who declined to participate.
| Lead Author, Publication Year | Reporting | External Validity | Internal Validity: Bias | Internal Validity: Confounding | Power |
|---|---|---|---|---|---|
| Schweitzer, 1994 [12] | 5 of 6 points | 1 of 2 points | 3 of 4 points | 0 of 1 point | 0 of 1 point |
| Varga, 1996 [88] | 5 of 6 points | 1 of 2 points | 3 of 4 points | 1 of 1 point | 0 of 1 point |
| Aasland, 1997 [54] | 3 of 6 points | 2 of 2 points | 3 of 4 points | 1 of 1 point | 0 of 1 point |
| Bargellini, 2000 [89] | 5 of 6 points | 0 of 2 points | 4 of 4 points | 1 of 1 point | 0 of 1 point |
| Grassi, 2000 [58] | 6 of 6 points | 0 of 2 points | 3 of 4 points | 0 of 1 point | 0 of 1 point |
| McManus, 2000 [59] | 5 of 6 points | 2 of 2 points | 4 of 4 points | 1 of 1 point | 0 of 1 point |
| Hoff, 2001 [33] | 6 of 6 points | 2 of 2 points | 2 of 4 points | 1 of 1 point | 0 of 1 point |
| Yaman, 2002 [60] | 5 of 6 points | 0 of 2 points | 4 of 4 points | 0 of 1 point | 0 of 1 point |
| Cathbras, 2004 [61] | 6 of 6 points | 0 of 2 points | 4 of 4 points | 0 of 1 point | 0 of 1 point |
| Kushnir, 2004 [62] | 5 of 6 points | 0 of 2 points | 3 of 4 points | 0 of 1 point | 0 of 1 point |
| Goehring, 2005 [63] | 6 of 6 points | 1 of 2 points | 3 of 4 points | 1 of 1 point | 0 of 1 point |
| Trichard, 2005 [90] | 3 of 6 points | 1 of 2 points | 3 of 4 points | 0 of 1 point | 0 of 1 point |
| Esteva, 2006 [64] | 6 of 6 points | 2 of 2 points | 4 of 4 points | 1 of 1 point | 0 of 1 point |
| Gandini, 2006 [65] | 6 of 6 points | 1 of 2 points | 3 of 4 points | 1 of 1 point | 0 of 1 point |
| Ozyurt, 2006 [66] | 6 of 6 points | 2 of 2 points | 4 of 4 points | 1 of 1 point | 0 of 1 point |
| Deighton, 2007 [67] | 5 of 6 points | 0 of 2 points | 4 of 4 points | 0 of 1 point | 0 of 1 point |
| Dunwoodie, 2007 [68] | 5 of 6 points | 2 of 2 points | 4 of 4 points | 0 of 1 point | 0 of 1 point |
| Srgaard, 2007 [69] | 6 of 6 points | 0 of 2 points | 3 of 4 points | 1 of 1 point | 1 of 1 point |
| Sosa Oberlin, 2007 [56] | 4 of 6 points | 0 of 2 points | 3 of 4 points | 0 of 1 point | 0 of 1 point |
| Voltmer, 2007 [57] | 4 of 6 points | 0 of 2 points | 4 of 4 points | 0 of 1 point | 0 of 1 point |
| dm, 2008 [70] | 5 of 6 points | 2 of 2 points | 3 of 4 points | 1 of 1 point | 0 of 1 point |
| Di Iorio, 2008 [71] | 6 of 6 points | 0 of 2 points | 2 of 4 points | 0 of 1 point | 0 of 1 point |
| Fuss, 2008 [91] | 6 of 6 points | 0 of 2 points | 3 of 4 points | 0 of 1 point | 0 of 1 point |
| Lee, 2008 [49] | 4 of 6 points | 2 of 2 points | 4 of 4 points | 0 of 1 point | 1 of 1 point |
| Marner, 2008 [92] | 6 of 6 points | 0 of 2 points | 4 of 4 points | 0 of 1 point | 0 of 1 point |
| Shehabi, 2008 [93] | 3 of 6 points | 1 of 2 points | 3 of 4 points | 0 of 1 point | 0 of 1 point |
| Truchot, 2008 [72] | 5 of 6 points | 1 of 2 points | 3 of 4 points | 0 of 1 point | 0 of 1 point |
| Twellaar, 2008 [73] | 6 of 6 points | 2 of 2 points | 3 of 4 points | 0 of 1 point | 0 of 1 point |
| Vela‐Bueno, 2008 [74] | 5 of 6 points | 2 of 2 points | 4 of 4 points | 1 of 1 point | 0 of 1 point |
| Arigoni, 2009 [17] | 6 of 6 points | 2 of 2 points | 4 of 4 points | 1 of 1 point | 0 of 1 point |
| Bernhardt, 2009 [75] | 6 of 6 points | 2 of 2 points | 4 of 4 points | 1 of 1 point | 0 of 1 point |
| Bressi, 2009 [76] | 6 of 6 points | 0 of 2 points | 3 of 4 points | 1 of 1 point | 0 of 1 point |
| Brown, 2009 [94] | 6 of 6 points | 0 of 2 points | 4 of 4 points | 0 of 1 point | 0 of 1 point |
| Krasner, 2009 [77] | 9 of 11 points | 0 of 3 points | 6 of 7 points | 1 of 2 points | 1 of 1 point |
| Lasalvia, 2009 [55] | 6 of 6 points | 2 of 2 points | 4 of 4 points | 1 of 1 point | 0 of 1 point |
| Lesic, 2009 [78] | 5 of 6 points | 0 of 2 points | 4 of 4 points | 0 of 1 point | 0 of 1 point |
| Peisah, 2009 [79] | 6 of 6 points | 2 of 2 points | 3 of 4 points | 1 of 1 point | 0 of 1 point |
| Shanafelt, 2009 [80] | 6 of 6 points | 2 of 2 points | 4 of 4 points | 1 of 1 point | 0 of 1 point |
| Tunc, 2009 [95] | 6 of 6 points | 2 of 2 points | 4 of 4 points | 1 of 1 point | 0 of 1 point |
| Zantinge, 2009 [81] | 5 of 6 points | 0 of 2 points | 3 of 4 points | 1 of 1 point | 0 of 1 point |
| Cocco, 2010 [96] | 4 of 6 points | 0 of 2 points | 4 of 4 points | 0 of 1 point | 0 of 1 point |
| Demirci, 2010 [82] | 6 of 6 points | 0 of 2 points | 4 of 4 points | 0 of 1 point | 0 of 1 point |
| Voltmer, 2010 [83] | 6 of 6 points | 2 of 2 points | 4 of 4 points | 1 of 1 point | 0 of 1 point |
| Doppia, 2011 [97] | 5 of 6 points | 2 of 2 points | 4 of 4 points | 1 of 1 point | 0 of 1 point |
| Glasheen, 2011 [98] | 5 of 6 points | 0 of 2 points | 4 of 4 points | 1 of 1 point | 0 of 1 point |
| Lucas, 2011 [84] | 10 of 11 points | 2 of 3 points | 7 of 7 points | 5 of 6 points | 1 of 1 point |
| Maccacaro, 2011 [85] | 5 of 6 points | 0 of 2 points | 4 of 4 points | 1 of 1 point | 0 of 1 point |
| Putnik, 2011 [86] | 6 of 6 points | 1 of 2 points | 4 of 4 points | 0 of 1 point | 0 of 1 point |
| Thorsen, 2011 [99] | 6 of 6 points | 0 of 2 points | 4 of 4 points | 0 of 1 point | 0 of 1 point |
| Hinami, 2012 [50] | 6 of 6 points | 2 of 2 points | 4 of 4 points | 1 of 1 point | 1 of 1 point |
| Quenot, 2012 [100] | 8 of 11 points | 1 of 3 points | 6 of 7 points | 1 of 2 points | 0 of 1 point |
| Ruitenburg, 2012 [101] | 6 of 6 points | 2 of 2 points | 4 of 4 points | 0 of 1 point | 0 of 1 point |
| Seibt, 2012 [102] | 6 of 6 points | 0 of 2 points | 4 of 4 points | 1 of 1 point | 0 of 1 point |
| Shanafelt, 2012 [87] | 6 of 6 points | 2 of 2 points | 4 of 4 points | 1 of 1 point | 0 of 1 point |
Funnel plots were used to evaluate for publication bias in the meta‐analysis of the 8 double‐armed studies (Figure 6). We found no significant evidence of bias, which was supported by Begg's test P values of 0.90 for emotional exhaustion, >0.99 for depersonalization, and 0.54 for personal accomplishment. A trim‐and‐fill analysis determined that no adjustment was necessary.
DISCUSSION
There appears to be no support for the long‐held belief that inpatient physicians are particularly prone to burnout. Among studies for which practice location was stated explicitly or could be obtained from the authors, and who used the MBI, no differences were found among inpatient and outpatient physicians with regard to depersonalization or personal accomplishment. This finding persisted whether double‐armed studies were compared directly, single‐armed studies were incorporated into this analysis, or single‐armed studies were analyzed separately. Outpatient physicians had a higher degree of emotional exhaustion when all studies were considered.
There are several reasons why outpatient physicians may be more prone to emotional exhaustion than their inpatient colleagues. Although it is by no means true that all inpatient physicians work in shifts, the increased availability of shift work may allow some inpatient physicians to better balance their professional and personal lives, a factor of work with which some outpatient physicians have struggled.[47] Inpatient practice may also afford more opportunity for teamwork, a factor that has been shown to correlate with reduced burnout.[48] When surveyed about burnout, outpatient physicians have cited patient volumes, paperwork, medicolegal concerns, and lack of community support as factors.[49] Inpatient physicians are not immune to these forces, but they arguably experience them to different degrees.
The absence of a higher rate of depersonalization among inpatient physicians is particularly reassuring in light of concerns expressed with the advent of US hospital medicinethat some hospitalists would be prone to viewing patients as an impediment to the efficient running of the hospital,[2] the very definition of depersonalization.
Although the difference in the whole sample was not statistically significant, the consistent tendency toward a greater sense of personal accomplishment among outpatient physicians is also noteworthy, particularly because post hoc subgroup analysis of US physicians did show statistical significance in both 2‐armed studies. Without detailed age data for the physicians in each study, we could not separate the possible impact of age on personal accomplishment; hospital medicine is a newer specialty staffed by generally younger physicians, and hospitalists may not have had time to develop a sense of accomplishment. When surveyed about job satisfaction, hospitalists have also reported the feeling that they were treated as glorified residents,[50] a factor that, if shared by other inpatient physicians, must surely affect their sense of personal accomplishment. The lack of longitudinal care for patients and the substantial provision of end‐of‐life care also may diminish the sense of personal accomplishment among inpatient physicians.
Another important finding from this systematic review is the marked heterogeneity of the instruments used to measure physician burnout. Many of the identified studies could not be subjected to meta‐analysis because of their use of differing burnout measures. Drawing more substantial conclusions about burnout and practice location is limited by the fact that, although the majority of studies used the full MBI, the largest study of European hospital doctors used the Copenhagen Burnout Inventory, and the studies thus far of US hospitalists have used single‐item surveys or portions of the MBI. Not reflected in this review is the fact that a large study of US burnout and job satisfaction[51] did not formally address practice location (M. Linzer, personal communication, August 2012). Similarly, a large study of British hospital doctors[52] is not included herein because many of the physicians involved had substantial outpatient duties (C. Taylor, personal communication, July 2012). Varying burnout measures have complicated a previous systematic review of burnout in oncologists.[53] Two studies that directly compared inpatient and outpatient physicians but that were excluded from our statistical analysis because of their modified versions of the MBI,[54, 55] showed higher burnout scores in outpatient physicians. Two other studies that provided direct inpatient versus outpatient comparisons but that used alternative burnout measures[56, 57] showed a greater frequency of burnout in inpatient physicians, but of these, 1 study[56] involved only 3 inpatient physicians.
Several limitations of our study should be considered. Although we endeavored to obtain information from authors (with some success) about specific local practice patterns and eliminated many studies because of incomplete data or mixed practice patterns (eg, general practitioners who take frequent hospital calls, hospital physicians with extensive outpatient duties in a clinic attached to their hospital), it remains likely that many physicians identified as outpatient provided some inpatient care (attending a few weeks per year on a teaching service, for example) and that some physicians identified as inpatient have minimal outpatient duties.
More importantly, the dataset analyzed is heterogeneous. Studies of the incidence of burnout are naturally observational and therefore not randomized. Inclusion of international studies is necessary to answer the research question (because published data on US hospitalists are sparse) but naturally introduces differences in practice settings, local factors, and other factors for which we cannot possibly account fully.
Our meta‐analysis therefore addressed a broad question about burnout among inpatient and outpatient physicians in various diverse settings. Applying it to any 1 population (including US hospitalists) is, by necessity, imprecise.
Post hoc analysis should be viewed with caution. For example, the finding of a statistical difference between US inpatient and outpatient physicians with regard to personal accomplishment score is compelling from the standpoint of hypothesis generation. However, it is worth bearing in mind that this analysis contained only 2 studies, both by the same primary author, and compared 855 outpatient physicians to only 149 hospitalists. This difference was no longer significant when 2 outpatient studies were added through meta‐regression.
Finally, the specific focus of this study on practice location precluded comparison with emergency physicians and anesthesiologists, 2 specialist types that have been the subject of particularly robust burnout literature. As the literature on hospitalist burnout becomes more extensive, comparative studies with these groups and with intensivists might prove instructive.
In summary, analysis of 24 studies comprising data on 5318 outpatient physicians and 1301 inpatient physicians provides no support for the commonly held belief that hospital‐based physicians are particularly prone to burnout. Outpatient physicians reported higher emotional exhaustion. Further studies of the incidence and severity of burnout according to practice location are indicated. We propose that in future studies, to avoid the difficulties with statistical analysis summarized herein, investigators ask about and explicitly report practice location (inpatient vs outpatient vs both) and report mean MBI subset data and standard deviations. Such information about US hospitalists would allow comparison with a robust (if heterogeneous) international literature on burnout.
Acknowledgments
The authors gratefully acknowledge all of the study authors who contributed clarification and guidance for this project, particularly the following authors who provided unpublished data for further analysis: Olaf Aasland, MD; Szilvia dm, PhD; Annalisa Bargellini, PhD; Cinzia Bressi, MD, PhD; Darrell Campbell Jr, MD; Ennio Cocco, MD; Russell Deighton, PhD; Senem Demirci Alanyali, MD; Biagio Di Iorio, MD, PhD; David Dunwoodie, MBBS; Sharon Einav, MD; Madeleine Estryn‐Behar, PhD; Bernardo Gandini, MD; Keiki Hinami, MD; Antonio Lasalvia, MD, PhD; Joseph Lee, MD; Guido Maccacaro, MD; Swati Marner, EdD; Chris McManus, MD, PhD; Carmelle Peisah, MBBS, MD; Katarina Putnik, MSc; Alfredo Rodrguez‐Muoz, PhD; Yahya Shehabi, MD; Evelyn Sosa Oberlin, MD; Jean Karl Soler, MD, MSc; Knut Srgaard, PhD; Cath Taylor; Viva Thorsen, MPH; Mascha Twellaar, MD; Edgar Voltmer, MD; Colin West, MD, PhD; and Deborah Whippen. The authors also thank the following colleagues for their help with translation: Dusanka Anastasijevic (Norwegian); Joyce Cheung‐Flynn, PhD (simplified Chinese); Ales Hlubocky, MD (Czech); Lena Jungheim, RN (Swedish); Erez Kessler (Hebrew); Kanae Mukai, MD (Japanese); Eliane Purchase (French); Aaron Shmookler, MD (Russian); Jan Stepanek, MD (German); Fernando Tondato, MD (Portuguese); Laszlo Vaszar, MD (Hungarian); and Joseph Verheidje, PhD (Dutch). Finally, the authors thank Cynthia Heltne and Diana Rogers for their expert and tireless library assistance, Bonnie Schimek for her help with figures, and Cindy Laureano and Elizabeth Jones for their help with author contact.
- . Just because you can, doesn't mean that you should: a call for the rational application of hospitalist comanagement. J Hosp Med. 2008;3(5):398–402.
- . Hospitalists. Hospitalist. 1998;1(4):5–6.
- , . The occupational hazards of emergency physicians. Am J Emerg Med. 2000;18(3):300–311.
- , , , et al. Physician burnout in pediatric critical care medicine. Crit Care Med. 1995;23(8):1425–1429.
- , . The hospitalist: new boon for internal medicine or retreat from primary care? Ann Intern Med. 1999;130(4 pt 2): 382–387.
- , , , et al. Enquete sur les horaires et la charge de travail des medecins dans un establissement de l'Assitance Publique‐Hopitaux de Paris. Arch Mal Prof. 1996;57:438–444.
- , , , , . Burn‐out of urologists in the county of Schleswig‐Holstein, Germany: a comparison of hospital and private practice urologists. J Urol. 2001;165(4): 1158–1161.
- , , , et al. Satisfaction and worklife of academic hospitalist and non‐hospitalist attendings on general medical inpatient rotations. J Gen Internal Med. 2006;21(S4):128.
- , , , , , ; SGIM Career Satisfaction Group. What effect does increasing inpatient time have on outpatient‐oriented internist satisfaction? J Gen Intern Med. 2003;18(9):725–729.
- , , . Burnout and career‐choice regret among family practice physicians in early practice. Fam Pract Res J. 1994;14(3):213–222.
- , , , , , . Job stress and satisfaction among palliative physicians. Palliat Med. 1996; 10(3):185–194.
- . Stress and burnout in junior doctors. S Afr Med J. 1994; 84(6):352–354.
- , . Work stress, satisfaction and burnout in New Zealand radiologists: comparison of public hospital and private practice in New Zealand. J Med Imaging Radiat Oncol. 2009;53(2):194–199.
- , , . Measurement of hypothetical burnout in cystic fibrosis caregivers. Acta Paediatr Scand. 1981; 70(6):935–939.
- , . Personality characteristics and proneness to burnout: a study among internists. Stress Med. 1987;3(4):307–315.
- , , . Thriving and surviving in a new medical career: the case of hospitalist physicians. J Health Soc Behav. 2002;43(1):72–91.
- , , , , . Prevalence of burnout among Swiss cancer clinicians, paediatricians and general practitioners: who are most at risk? Support Care Cancer. 2009;17(1): 75–81.
- , , , . Preparing for “diastole”: advanced training opportunities for academic hospitalists. J Hosp Med. 2006;1(6):368–377.
- , , , , , . Mental health, “burnout” and job satisfaction among hospital and community‐based mental health staff. Br J Psychiatry. 1996;169(3):334–337.
- , , , . Role of a pediatric department chair: factors leading to satisfaction and burnout. J Pediatr. 2007;151(4):425–430.
- . Staff burn‐out. J Soc Iss. 1974;30(1):159–165.
- . Burned‐out. Hum Behav. 1976;5(9):16–22.
- . Underpaid women, stressed out men, satisfied emergency physicians. Ann Emerg Med. 2008;51(6):729–731.
- , , , . U.S. physician satisfaction: a systematic review. J Hosp Med. 2009;4(9):560–568.
- , , , . Professional burnout among head and neck surgeons: results of a survey. Head Neck. 1993;15(6):557–560.
- , . The measurement of experienced burnout. J Occup Behav. 1981;2(2):99–113.
- , , , . The Copenhagen Burnout Inventory: a new tool for the assessment of burnout. Work Stress. 2005;19(3):192–207.
- , . Handleiding van de Utrechtse Burnout Schaal (UBOS). Lisse, the Netherlands: Swets Test Services; 2000.
- . Alberta Physician Burnout [master's thesis]. Alberta, Canada: The University of Lethbridge; 2003.
- , . Arbeitsbezogenes Verhaltensund Erlebensmuster AVEM. Frankfurt, Germany: Swets Test Services; 2003.
- , , , . Internal construct validity of the Shirom‐Melamed Burnout Questionnaire (SMBQ). BMC Public Health. 2012;12:1.
- , , . Validation of a single‐item measure of burnout against the Maslach Burnout Inventory among physicians. Stress Health. 2004;20(2):75–79.
- , , , , . Characteristics and work experiences of hospitalists in the United States. Arch Intern Med. 2001;161(6):851–858.
- , . The feasibility of creating a checklist for the assessment of the methodological quality both of randomised and non‐randomised studies of health care interventions. J Epidemiol Community Health. 1998;52(6):377–384.
- , , , . Including nonrandomized studies. In: Higgins JPT, Green S, eds. Cochrane Handbook for Systematic Reviews of Interventions. Version 5.0.1. The Cochrane Collaboration; 2008. Available at: www.cochrane‐handbook. org. Accessed July 24, 2013.
- , . Statistical Methods in Epidemiology. New York, NY: Oxford University Press; 1989.
- , . Quantifying heterogeneity in a meta‐analysis. Stat Med. 2002;21(11):1539–1558.
- , , , . Measuring inconsistency in meta‐analyses. BMJ. 2003;327(7414):557–560.
- , , . Can we individualize the “number needed to treat”? An empirical study of summary effect measures in meta‐analyses. Int J Epidemiol. 2002;31(1):72–76.
- , . Applications of estimating treatment effects in metaanalyses with missing data. Technical Report No. 2000‐25, 2000. Available at: http://statistics.stanford.edu/_ckirby/techreports/GEN/2000/2000‐25.pdf. Accessed July 22, 2013.
- , , . Publication and related bias in meta‐analysis: power of statistical tests and prevalence in the literature. J Clin Epidemiol. 2000;53(11):1119–1129.
- , . Operating characteristics of a rank correlation test for publication bias. Biometrics. 1994;50(4):1088–1101.
- , , , et al. The PRISMA statement for reporting systematic reviews and meta‐analyses of studies that evaluate healthcare interventions: explanation and elaboration. BMJ. 2009; 339:b2700.
- , , , , , . Job satisfaction and burnout in general practitioners [in Spanish]. Aten Primaria. 2003;31(4):227–233.
- , , . Burnout syndrome among health staff [in Spanish]. Rev Med Inst Mex Seguro Soc. 2006;44(3):221–226.
- , , , , , . Differences in psychological effects in hospital doctors with and without post‐traumatic stress disorder. Br J Psychiatry. 2008;193(2):165–166.
- , , , , . Crossing boundaries: family physicians' struggles to protect their private lives. Can Fam Physician. 2009;55(3):286–287.e5.
- , , , , , , et al. Emergency physicians accumulate more stress factors than other physicians: results from the French SESMAT study. Emerg Med J. 2011 May;28(5):397–410. Epub 2010 Dec 1.
- , , . Stress, burnout, and strategies for reducing them: what's the situation among Canadian family physicians? Can Fam Physician. 2008;54(2):234–235.
- , , , , . Worklife and satisfaction of hospitalists: toward flourishing careers. J Gen Intern Med. 2012;27(1):28–36.
- , , , , , , et al; MEMO (Minimizing Error, Maximizing Outcome) Investigators. Working conditions in primary care: physician reactions and care quality. Ann Intern Med. 2009 Jul 7;151(1):28–36.
- , , , , . Mental health of hospital consultants: the effects of stress and satisfaction at work. Lancet. 1996 Mar 16;347(9003):724–8.
- , , , . Burnout, psychiatric morbidity, and work‐related sources of stress in paediatric oncology staff: a review of the literature. Psycho‐Oncology. 2009 Oct;18(10):1019–28.
- , , , , . Health complaints and job stress in Norwegian physicians: the use of an overlapping questionnaire design. Soc Sci Med. 1997;45(11):1615–1629.
- , , , et al. Influence of perceived organisational factors on job burnout: survey of community mental health staff. Br J Psychiatry. 2009;195(6):537–544.
- . Frecuencia de los sintomas del syndrome de burnout en profesionales medicos. Rev Med Rosario. 2007;73:12–20.
- , , . Work‐related behaviour and experience patterns of physicians compared to other professions. Swiss Med Wkly. 2007;137(31‐32):448–453.
- , . Psychiatric morbidity and burnout in the medical profession: an Italian study of general practitioners and hospital physicians. Psychother Psychosom. 2000;69(6):329–334.
- , , . Duties of a doctor: UK doctors and good medical practice. Qual Health Care. 2000;9(1):14–22.
- , . The job related burnout questionnaire: a multinational pilot study. Aust Fam Physician. 2002;31(11):1055–1056.
- , , , , . Burn out among French general practitioners [in French]. Presse Med. 2004;33(22): 1569–1574.
- , , . Are burnout levels increasing? The experience of Israeli primary care physicians. Isr Med Assoc J. 2004; 6(8):451–455.
- , , , . Psychosocial and professional characteristics of burnout in Swiss primary care practitioners: a cross‐sectional survey. Swiss Med Wkly. 2005;135(7‐8):101–108.
- , , . Mental health in family doctors: effects of satisfaction and stress at work [in Spanish]. Rev Clin Esp. 2006;206(2):77–83.
- , , , , . The professional wearing down or syndrome of welfare labor stress (“burnout”) among health professionals in the city of Cordoba [in Spanish]. Rev Fac Cien Med Univ Nac Cordoba. 2006;63(1):18–25.
- , , . Predictors of burnout and job satisfaction among Turkish physicians. QJM. 2006;99(3):161–169.
- , , . Factors affecting burnout and compassion fatigue in psychotherapists treating torture survivors: is the therapist's attitude to working through trauma relevant? J Trauma Stress. 2007;20(1):63–75.
- , . Psychological morbidity and burnout in palliative care doctors in Western Australia. Intern Med J. 2007;37(10): 693–698.
- , , , ; OSCAR Group. Sources of stress and burnout in acute psychiatric care: inpatient vs. community staff. Soc Psychiatry Psychiatr Epidemiol. 2007;42(10):794–802.
- , , . Physician burnout in Hungary: a potential role for work‐family conflict. J Health Psychol. 2008;13:847–856.
- , , , . Burn‐out in the dialysis unit. J Nephrol. 2008;21(suppl 13):S158–S162.
- . Career orientation and burnout in French general practitioners. Psychol Rep. 2008;103(3):875–881.
- , , . How healthy are Dutch general practitioners? Self‐reported (mental) health among Dutch general practitioners. Eur J Gen Pract. 2008;14(1):4–9.
- , , , et al. Insomnia and sleep quality among primary care physicians with low and high burnout levels. J Psychosom Res. 2008;64(4):435–442.
- , , , , , . Distress and burnout among genetic service providers. Genet Med. 2009;11(7):527–535.
- , , , et al. Burnout among psychiatrists in Milan: a multicenter survey. Psychiatr Serv. 2009;60(7):985–988.
- , , , et al. Association of an educational program in mindful communication with burnout, empathy, and attitudes among primary care physicians. JAMA. 2009;302(12): 1284–1293.
- , , , , , . Burnout in Belgrade orthopaedic surgeons and general practitioners, a preliminary report. Acta Chir Iugosl. 2009; 56(2):53–59.
- , , , . Secrets to psychological success: why older doctors might have lower psychological distress and burnout than younger doctors. Aging Ment Health. 2009;13(2):300–307.
- , , , et al. Career fit and burnout among academic faculty. Arch Intern Med. 2009;169(10):990–995.
- , , , , . Does burnout among doctors affect their involvement in patients' mental health problems? A study of videotaped consultations. BMC Fam Pract. 2009;10:60.
- , , , , , . Evaluation of burnout syndrome in oncology employees. Med Oncol. 2010;27(3):968–974.
- , , , , . Workrelated behavior and experience patterns and predictors of mental health in German physicians in medical practice. Fam Med. 2010; 42(6):433–439.
- , , , et al. Emotional exhaustion, life stress, and perceived control among medicine ward attending physicians: a randomized trial of 2‐ versus 4‐week ward rotations [abstract]. J Hosp Med. 2011; 6(4 suppl 2):S43–S44.
- , , , , , . The effort of being male: a survey on gender and burnout [in Italian]. Med Lav. 2011;102(3):286–296.
- , . Word related characteristics, work‐home and home‐work interference and burnout among primary healthcare physicians: a gender perspective in a Serbian context. BMC Public Health. 2011;11:716.
- , , , et al. Burnout and satisfaction with work‐life balance among US physicians relative to the general US population. Arch Intern Med. 2012;172(18):1377–1385.
- , , . Burnout syndrome in general hospital doctors. Eur J Psychiat. 1996;10:207–213.
- , , , , , . Relation between immune variables and burnout in a sample of physicians. Occup Environ Med. 2000;57(7):453–457.
- , , . Epuisement professionnel et consummation de psychotropes chez les medecins hospitaliers. Alcoologie et Addictologie. 2005;27(4):303–308.
- , , , , . Working conditions and Work‐Family Conflict in German hospital physicians: psychosocial and organisational predictors and consequences. BMC Public Health. 2008;8:353.
- . The Role of Empathy and Witnessed Aggression in Stress Reactions Among Staff Working in a Psychiatric Hospital [dissertation]. New Brunswick, NJ: Rutgers University; 2008.
- , , , , , . Burnout syndrome among Australian intensivists: a survey. Crit Care Resusc. 2008;10(4):312–315.
- , , , , , . Doctors' stress responses and poor communication performance in simulated bad‐news consultations. Acad Med. 2009;84(11):1595–1602.
- , . Role conflict, role ambiguity, and burnout in nurses and physicians at a university hospital in Turkey. Nurs Health Sci. 2009;11(4):410–416.
- . How much is geriatric caregivers burnout caring‐specific? Questions from a questionnaire survey. Clin Pract Epidemiol Ment Health. 2010;6:66–71.
- , , , , ; comite de pilotage de l'enquete SESMAT. Burnout in French doctors: a comparative study among anaesthesiologists and other specialists in French hospitals (SESMAT study) [in French]. Ann Fr Anesth Reanim. 2011;30(11):782–794.
- , , , , , . Career satisfaction and burnout in academic hospital medicine. Arch Intern Med. 2011;171(8):782–785.
- , , . High rates of burnout among maternal health staff at a referral hospital in Malawi: a cross‐sectional study. BMC Nurs. 2011;10:9.
- , , , et al. Suffering among careers working in critical care can be reduced by an intensive communication strategy on end‐of‐life practices. Intensive Care Med. 2012;38:55–61.
- , , . The prevalence of common mental disorders among hospital physicians and their association with self‐reported work ability: a cross‐sectional study. BMC Health Serv Res. 2012;12:292–298.
- , , , . Effort‐reward‐ratio and burnout risk among female teachers and hospital‐employed female physicians: a comparison between professions [in German]. Arbeitsmed Sozialmed Umweltmed. 2012;47:396–406.
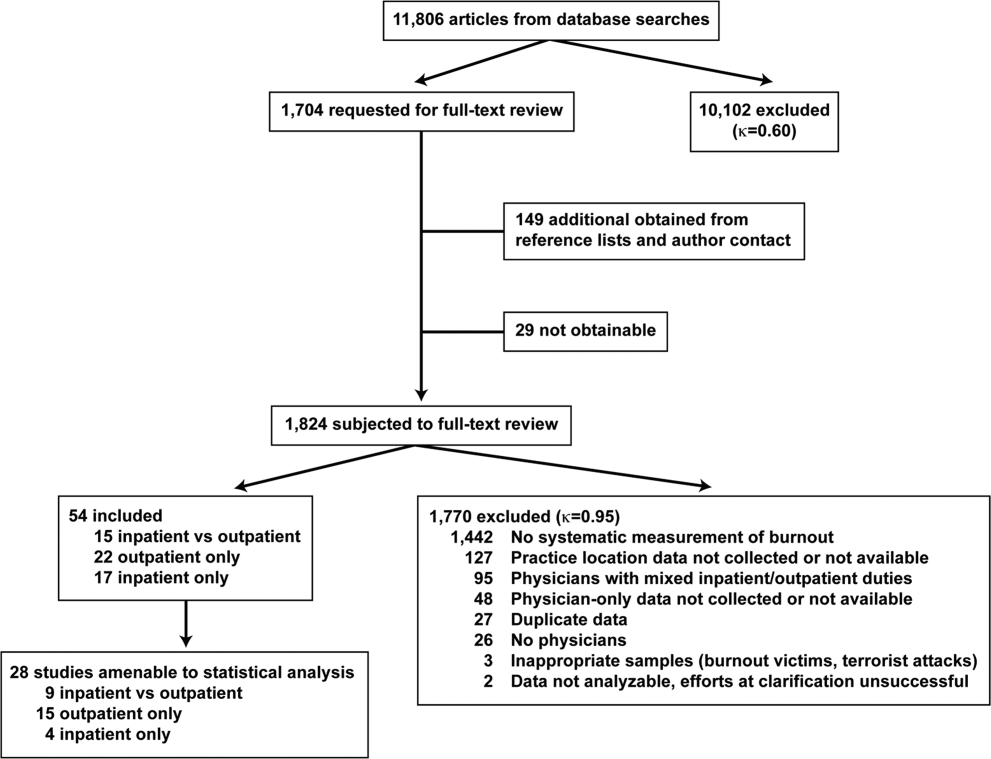
Sprout Pregnancy Essentials
An app to help your patient with chronic pelvic pain (February 2013)
An app to help your patient remember to take her OC (July 2012)
An app to help your patient lose weight (May 2012)
This handy toolkit helps mothers-to-be record important details like weight gain, kicks, and contraction times, with personalized timelines, checklists, comprehensive information about fetal development, and a journaling option.
In this series, I review what I call prescription apps—apps that you might consider recommending to your patient to enhance her medical care. Many patients are already looking at medical apps and want to hear your opinion. Often the free apps I recommend to patients are downloaded before they leave my office. When recommending apps, their cost (not necessarily a measure of quality or utility) and platform (device that the app has been designed for) should be taken into account. It is important to know whether the app you are recommending is supported by your patient’s smartphone.

For moms-to-be: quality information and a tracking tool
When I practiced obstetrics, my group provided patients with a pocket-sized, trifold pregnancy tracker at their first prenatal visit for them to bring to each subsequent appointment. In addition to data such as Rh status and estimated due date, blood pressure, weight, and fundal height were also recorded. The pregnancy tracker served two purposes: 1) a backup mini medical record in case their chart didn’t make it from the medical records department to the clinic on a particular day and 2) a keepsake.
Pregnancy apps take the concept of that little piece of cardboard to a whole new level. One highly rated pregnancy app is Sprout™ Pregnancy Essentials (recommended by Consumer Reports2 and named one of the 50 Best iPhone Apps in 2012 by Time magazine3) from Med ART Studios.4
With Sprout, the user enters her due date and the app automatically tracks the pregnancy week by week. Each time the app is accessed, the screen shows a realistic image of a developing fetus at the appropriate gestational age along with a pregnancy timeline. Tools allow the user to track her weight at each Ob visit. There is also a kick counter as well as a contraction timer for when the time comes.
Each week of the pregnancy is linked to medical information appropriate for the gestational age, such as second trimester screening at week 15 and group B streptococcus testing at week 35. The information is brief, but high-quality, and covers everything from prenatal testing and screening for gestational diabetes to stretch marks and carpal tunnel syndrome. From each topic, the user seamlessly can add preloaded questions to an “M.D. visit planner” or pregnancy-related tasks (such as making an appointment for a glucose challenge test) to a “to do” list.
A free version called Sprout Lite comes in English and Japanese. The premium version for $3.99 is available in English, Spanish, Chinese, German, Italian, Japanese, and Portuguese. The premium version is free of ads; has more advanced images of a developing fetus, with striking graphics; allows the user to share information via Facebook and e-mail; and has a timeline that adjusts to the baby’s gestational age. Both Sprout apps are currently only available for the iPhone and iPad.
Pros. Sprout is easy to use, has beautiful graphics, and the medical information is accurate and accessible. Sprout Lite contains the same high-quality information.
Cons. There is no way to track other medical data in addition to weight, such as fundal height, Rh status, or vaccinations. There is also a price tag to have the app be free of advertisements, get the best graphics, and have a more interactive user experience.
Verdict. It is always nice to be able to recommend a product with high-quality medical information. Sprout Lite always can be road tested first, but for those who live on Facebook, enjoy a more interactive product, hate advertisements, or love impressive graphics, the $3.99 may very well be worth it.
Keep a journal and create a book
While leaving the app with its data on the iPhone or iPad may be enough of a keepsake for some women, those who want to create a pregnancy book can obtain a separate Sprout Pregnancy Journal app-to-book™.5
This app allows the user to write journal entries, upload photos, and then, if desired, download a PDF of the journal or incorporate the beautiful images from the Sprout app to create a bound pregnancy journal (softcover: $19.95 for the first 40 pages; hardcover: $34.95 for the first 40 pages; additional charge for added pages).
The journal app is free to download for a 2-week trial. At the end of 2 weeks there is a choice:
- $4.99 to continue to use the app; includes cloud backup of data
- $7.99 to get cloud backup plus the PDF download (includes a discount for prepaying for the PDF plus $7.99 discount for a print book)
- If the $7.99 prepaid option isn’t chosen at the end of the 2-week trial, the PDF is $9.95.
The Sprout Pregnancy Journal app is available for iPhone, iPad Touch, and iPad.
We want to hear from you! Tell us what you think.
Why (and how) you should encourage your patients’ search for health information on the Web
(December 2011)
To blog or not to blog? What’s the answer for you and your practice?
(August 2011)
For better or, maybe worse, patients are judging your care online
(March 2011)
Twitter 101 for ObGyns: Pearls, pitfalls, and potential
(September 2010)
1. Smith A. Nearly half of American adults are Smartphone owners. Pew Internet & American Life Project. http://pewinternet.org/Reports/2012/Smartphone-Update-2012/Findings.aspx. Published March 1, 2012. Accessed August 14, 2012.
2. Morris N. App review: Sprout for iPad and iPhone. Consumer Reports Web site. http://news.consumerreports.org/baby/2011/10/app-review-sprout-for-ipad-and-iphone.html. Published October 10, 2011. Accessed August 13, 2012.
3. Peckham M. 50 best iPhone apps 2012: Pregnancy (Sprout). http://techland.time.com/2012/02/15/50-best-iphone-apps-2012/?iid=tl-article-mostpop1#all. Published February 15, 2012. Accessed August 13, 2012.
4. Sprout Pregnancy Essentials. Med ART Studios Web site. http://medart-studios.com/sprout-pregnancy-iphone-app/. Accessed August 13, 2012.
5. Sprout Pregnancy Journal. Med ART Studios Web site. http://medart-studios.com/sprout-pregnancy-journal-iphone-app/. Accessed August 13, 2012.

Jennifer Gunter, MD
Dr. Gunter is an ObGyn in San Francisco. She is the author of The Preemie Primer: A Complete Guide for Parents of Premature Babies–from Birth through the Toddler Years and Beyond (Da Capo Press, 2010). Dr. Gunter blogs at http://www.drjengunter.com/. Find her on Twitter at @DrJenGunter.
Dr. Gunter reports no financial relationships relevant to this article.
An app to help your patient with chronic pelvic pain (February 2013)
An app to help your patient remember to take her OC (July 2012)
An app to help your patient lose weight (May 2012)
This handy toolkit helps mothers-to-be record important details like weight gain, kicks, and contraction times, with personalized timelines, checklists, comprehensive information about fetal development, and a journaling option.
In this series, I review what I call prescription apps—apps that you might consider recommending to your patient to enhance her medical care. Many patients are already looking at medical apps and want to hear your opinion. Often the free apps I recommend to patients are downloaded before they leave my office. When recommending apps, their cost (not necessarily a measure of quality or utility) and platform (device that the app has been designed for) should be taken into account. It is important to know whether the app you are recommending is supported by your patient’s smartphone.
For moms-to-be: quality information and a tracking tool
When I practiced obstetrics, my group provided patients with a pocket-sized, trifold pregnancy tracker at their first prenatal visit for them to bring to each subsequent appointment. In addition to data such as Rh status and estimated due date, blood pressure, weight, and fundal height were also recorded. The pregnancy tracker served two purposes: 1) a backup mini medical record in case their chart didn’t make it from the medical records department to the clinic on a particular day and 2) a keepsake.
Pregnancy apps take the concept of that little piece of cardboard to a whole new level. One highly rated pregnancy app is Sprout™ Pregnancy Essentials (recommended by Consumer Reports2 and named one of the 50 Best iPhone Apps in 2012 by Time magazine3) from Med ART Studios.4
With Sprout, the user enters her due date and the app automatically tracks the pregnancy week by week. Each time the app is accessed, the screen shows a realistic image of a developing fetus at the appropriate gestational age along with a pregnancy timeline. Tools allow the user to track her weight at each Ob visit. There is also a kick counter as well as a contraction timer for when the time comes.
Each week of the pregnancy is linked to medical information appropriate for the gestational age, such as second trimester screening at week 15 and group B streptococcus testing at week 35. The information is brief, but high-quality, and covers everything from prenatal testing and screening for gestational diabetes to stretch marks and carpal tunnel syndrome. From each topic, the user seamlessly can add preloaded questions to an “M.D. visit planner” or pregnancy-related tasks (such as making an appointment for a glucose challenge test) to a “to do” list.
A free version called Sprout Lite comes in English and Japanese. The premium version for $3.99 is available in English, Spanish, Chinese, German, Italian, Japanese, and Portuguese. The premium version is free of ads; has more advanced images of a developing fetus, with striking graphics; allows the user to share information via Facebook and e-mail; and has a timeline that adjusts to the baby’s gestational age. Both Sprout apps are currently only available for the iPhone and iPad.
Pros. Sprout is easy to use, has beautiful graphics, and the medical information is accurate and accessible. Sprout Lite contains the same high-quality information.
Cons. There is no way to track other medical data in addition to weight, such as fundal height, Rh status, or vaccinations. There is also a price tag to have the app be free of advertisements, get the best graphics, and have a more interactive user experience.
Verdict. It is always nice to be able to recommend a product with high-quality medical information. Sprout Lite always can be road tested first, but for those who live on Facebook, enjoy a more interactive product, hate advertisements, or love impressive graphics, the $3.99 may very well be worth it.
Keep a journal and create a book
While leaving the app with its data on the iPhone or iPad may be enough of a keepsake for some women, those who want to create a pregnancy book can obtain a separate Sprout Pregnancy Journal app-to-book™.5
This app allows the user to write journal entries, upload photos, and then, if desired, download a PDF of the journal or incorporate the beautiful images from the Sprout app to create a bound pregnancy journal (softcover: $19.95 for the first 40 pages; hardcover: $34.95 for the first 40 pages; additional charge for added pages).
The journal app is free to download for a 2-week trial. At the end of 2 weeks there is a choice:
- $4.99 to continue to use the app; includes cloud backup of data
- $7.99 to get cloud backup plus the PDF download (includes a discount for prepaying for the PDF plus $7.99 discount for a print book)
- If the $7.99 prepaid option isn’t chosen at the end of the 2-week trial, the PDF is $9.95.
The Sprout Pregnancy Journal app is available for iPhone, iPad Touch, and iPad.
We want to hear from you! Tell us what you think.
Why (and how) you should encourage your patients’ search for health information on the Web
(December 2011)
To blog or not to blog? What’s the answer for you and your practice?
(August 2011)
For better or, maybe worse, patients are judging your care online
(March 2011)
Twitter 101 for ObGyns: Pearls, pitfalls, and potential
(September 2010)
1. Smith A. Nearly half of American adults are Smartphone owners. Pew Internet & American Life Project. http://pewinternet.org/Reports/2012/Smartphone-Update-2012/Findings.aspx. Published March 1, 2012. Accessed August 14, 2012.
2. Morris N. App review: Sprout for iPad and iPhone. Consumer Reports Web site. http://news.consumerreports.org/baby/2011/10/app-review-sprout-for-ipad-and-iphone.html. Published October 10, 2011. Accessed August 13, 2012.
3. Peckham M. 50 best iPhone apps 2012: Pregnancy (Sprout). http://techland.time.com/2012/02/15/50-best-iphone-apps-2012/?iid=tl-article-mostpop1#all. Published February 15, 2012. Accessed August 13, 2012.
4. Sprout Pregnancy Essentials. Med ART Studios Web site. http://medart-studios.com/sprout-pregnancy-iphone-app/. Accessed August 13, 2012.
5. Sprout Pregnancy Journal. Med ART Studios Web site. http://medart-studios.com/sprout-pregnancy-journal-iphone-app/. Accessed August 13, 2012.
Periprocedural Use of Blood Products
Although inpatient blood product transfusion is common, many uses have not been subject to rigorous clinical study, and great practice variations exist. Of particular interest to the hospitalist is the use of red blood cells (RBCs), plasma, and platelets prior to an invasive procedure to correct anemia or a perceived bleeding risk. When considering blood product use in this context, the hospitalist faces 2 questions. First, what are the risks of anemia, thrombocytopenia, or abnormal coagulation tests? Second, what is the evidence that administration of the blood product in question improves outcomes such as bleeding and mortality? We address these questions in this review of the data supporting the use of RBCs, platelets, and plasma prior to invasive procedures.
RED BLOOD CELLS
Anemia is the most common hematologic concern in the perioperative setting. In 2009, approximately 15 million units of RBCs were transfused in the United States, 40% to 70% of which were given in the perioperative setting.[1, 2]
Risks of Periprocedural Anemia
The best evidence regarding the risks of perioperative anemia comes from studies in patients who declined blood transfusions. A retrospective cohort study of 1958 consecutive surgical patients who refused transfusions due to religious reasons showed an increase in 30‐day mortality as preoperative hemoglobin values fell, especially for those with preoperative hemoglobin concentrations <6 g/dL.[3] For patients with underlying cardiovascular disease, the risk of death was greatest when the preoperative hemoglobin value was <10 g/dL. Subsequent analysis showed that mortality rose with postoperative hemoglobin levels <7 g/dL, with a sharp rise in morbidity (myocardial infarction [MI], congestive heart failure [CHF], arrhythmia, and infection) and mortality in those with postoperative hemoglobin of <5 to 6 g/dL.[4] These results are consistent with studies of healthy volunteers who underwent acute isovolumic hemoglobin reduction, demonstrating clinical changes when hemoglobin values fell to 5 to 7 g/dL.[5, 6, 7, 8]
Several large, retrospective cohort studies have evaluated anemia and perioperative morbidity and mortality. A 2007 study analyzed data from over 310,000 predominantly male patients over age 65 years undergoing major noncardiac surgery.[9] Even mild degrees of preoperative anemia were associated with increased 30‐day mortality and cardiovascular morbidity (cardiac arrest or Q‐wave MI), with a monotonic rise in mortality (3.5%35.4%) and cardiac events (1.8%14.6%) when the hematocrit was <39%. Utilizing data from the American College of Surgeons' National Surgical Quality Improvement Program database, a 2011 study evaluated over 227,000 patients who underwent major noncardiac surgery.[10] Again, even mild anemia (hematocrit 29%39%) was independently associated with an increase in 30‐day composite morbidity, including MI, stroke, pneumonia, acute renal failure, wound infection, sepsis (13.27%), and mortality (3.52%).
Does RBC Transfusion Improve Outcomes?
Although the evidence argues that perioperative anemia is associated with poor surgical outcomes, it is not clear whether RBC transfusion in the perioperative setting improves these outcomes. Furthermore, the optimal perioperative hemoglobin level remains controversial. Importantly, most periprocedural trials were not sufficiently powered to assess differences in clinical outcomes.[11]
Several noteworthy randomized controlled trials (RCTs) comprise the bulk of the evidence regarding transfusion thresholds and are summarized in Table 1. The Transfusion Requirements in Critical Care (TRICC) was a landmark trial that randomized patients to a restrictive or a liberal transfusion strategy and demonstrated a trend toward lower 30‐day mortality in the restrictive group.[12] In addition, the restrictive transfusion group had lower rates of myocardial infarction and pulmonary edema. A subsequent subanalysis found no difference in mortality in patients with underlying cardiovascular disease.[13]
| Study/Year | No. of Patients | Brief Description | Transfusion Strategy | Outcomes (Restrictive Versus Liberal) |
|---|---|---|---|---|
| ||||
| Herbert et al. (TRICC)/1999[12] | 838 | Normovolemic patients admitted to ICU with Hg <9 g/dL within 72 hours of admission. | Restrictive: Hg maintained 79 g/dL. Liberal: Hg maintained 1012 g/dL. | 30‐day mortality (18.7% vs 23.3%, P=0.11). Pulmonary edema (5.3% vs 10.7%, P<0.01) and MI (0.7% vs 2.9%, P=0.02) rates while in the ICU. |
| Carson et al. (FOCUS)/2011[14] | 2016 | Patients undergoing surgery for hip fracture with a history of cardiovascular disease or cardiovascular risk factors. | Restrictive: transfused for Hg <8 g/dL or symptomatic anemia. Liberal: transfused to maintain Hg >10 g/dL. | Primary outcome of death or the inability to walk 10 feet across the room without human assistance at 60 days (34.7% vs 35.2%, P=0.9). Composite of in‐hospital ACS or death (5.2% vs. 4.3%). The frequencies of in‐hospital clinical events and adverse events did not differ significantly between groups. |
| Hajjar et al. (TRACS)/2010[15] | 502 | Patients admitted to ICU for elective cardiac surgery with cardiopulmonary bypass. | Restrictive: transfused to maintain Hct 24%. Liberal: transfused to maintain Hct 30%. | Composite end point of 30‐day all‐cause mortality+severe in‐hospital morbidity (cardiogenic shock, ARDS, or AKI requiring renal replacement therapy) (11% vs 10%, P=0.85). |
| Bracey et al./1999[16] | 428 | Patients undergoing first‐time elective coronary surgical revascularization. | Restrictive: postoperative transfusion for Hg <8 g/dL or predetermined clinical conditions requiring RBC transfusion (ie, hemodynamic instability). | Hospital mortality (1.4% vs 2.7%, P=0.3). |
| Liberal: transfusion at discretion of physician with institutional guidelines recommending postoperative transfusion for Hg <9 g/dL. | No differences in morbidity (including pulmonary complications, renal failure, and MI), duration of mechanical ventilation, and length of hospital stay (7.52.9 days vs 7.94.9 days). | |||
| Villanueva et al./2013[17] | 921 | Severe upper GI bleeding, gastroscopy within 6 hours. | Restrictive: transfused if Hg <7 g/dL. Liberal: transfused if Hg <9 g/dL. | Survival at 6 weeks (95% vs 91%, P=0.02). |
| Rebleeding (10% vs 16%, P=0.01). Adverse event rate including transfusion reactions, ACS, AKI, pulmonary complications, infection, and stroke or TIA (40% vs 48%, P=0.02). | ||||
| Carson et al. (MINT)/2013[18] | 110 | Pilot study in patients with Hg <10 g/dL and either ACS or stable angina undergoing cardiac catheterization. | Restrictive: transfused if Hg <8 g/dL or symptomatic anemia. Liberal: transfused to raise Hg 10 g/dL. | Composite primary outcome of all cause mortality+MI+unscheduled coronary revascularization within 30 days (25.5% vs 10.9%, P=0.054). Death at 30 days (13% vs 1.8%, P=0.032). |
| Cooper et al. (CRIT)/2011[19] | 45 | Pilot study in patients with acute MI (chest pain and positive cardiac biomarker) and Hct 30% within 72 hours of symptom onset. | Restrictive: transfused to maintain Hct 24%27%. | The primary composite outcome (in‐hospital death, recurrent MI, or new or worsening CHF) (13% vs 38%, P=0.046). |
| Liberal: transfused to maintain Hct 30% to 33%. | ||||
The largest RCT of transfusion thresholds, the Transfusion Trigger Trial for Functional Outcomes in Cardiovascular Patients Undergoing Surgical Hip Fracture Repair (FOCUS), randomized patients undergoing surgery for hip fracture with a history of cardiovascular disease or cardiovascular risk factors to a restrictive or liberal transfusion strategy.[14] The primary outcome of death or the inability to walk 10 feet across the room without human assistance at 60 days was similar in both the liberal and restrictive group, and the composite rate of acute coronary syndrome and in‐hospital death, stroke, CHF, venous thromboembolism, and the frequencies of other in‐hospital events or lengths of stay did not differ between the groups.
Several RCTs have examined the effect of transfusion practice on patients undergoing elective cardiac surgery. The Transfusion Requirements After Cardiac Surgery (TRACS) study did not show a difference in the primary composite outcome of 30‐day all‐cause mortality and in‐hospital morbidity between the restrictive and liberal transfusion groups.[15] A second cardiac surgery trial also found no difference in mortality or morbidity outcomes when comparing a restrictive versus liberal transfusion threshold.[16]
A recent RBC transfusion trial evaluated transfusion thresholds in patients with severe upper gastrointestinal bleeding.[17] All patients underwent gastroscopy within 6 hours of hospital admission and were randomly allocated to a restrictive or liberal transfusion threshold. The restrictive group had a significantly higher survival at 6 weeks when compared to the liberal group, as well as lower rates of adverse events such as further bleeding, acute coronary syndrome, transfusion reactions, and pulmonary edema.
Finally, the Myocardial Ischemia and Transfusion (MINT) pilot trial evaluated 110 patients with hemoglobin concentration l<10 g/dL admitted for ST‐segment elevation MI, nonST‐segment elevation MI, unstable angina, or stable coronary disease undergoing a cardiac catheterization.[18] The composite end point of death, MI, and unscheduled revascularizations within 30 days was higher in the restrictive group when compared to the liberal group, and 30‐day mortality was less frequent in liberal strategy compared to restrictive strategy. Given the small study size and the fact that patients in the restrictive group were significantly older than those in the liberal group, the results of this study must be interpreted carefully. The results of this trial contrast an earlier RCT of 45 patients admitted with acute MI, which showed higher rates of in‐hospital death, recurrent MI, or CHF in the liberal transfusion group versus the restrictive group.[19] Clearly, there is insufficient evidence to define transfusion threshold in acute coronary syndrome, and further study is needed in this area.
A recent meta‐analysis of 19 RCTs through February 2011 compared restrictive versus liberal transfusion strategies.[11] Although not all of these studies looked at periprocedural RBC transfusion, employment of a restrictive strategy saved an average of 1.19 units of blood per patient transfused without a difference in 30‐day mortality. This meta‐analysis also showed that in‐hospital mortality was 23% lower in patients assigned to a restrictive strategy, and there were no differences in cardiac events or strokes between restrictive and liberal strategies.
Encompassing the latest evidence, the AABB (formerly, the American Association of Blood Banks) guidelines recommend a restrictive transfusion strategy utilizing a transfusion threshold of 7 to 8 g/dL in stable hospitalized patients.[20] The AABB also recommends a restrictive strategy for patients with underlying cardiovascular disease, advocating for a transfusion threshold of 8 g/dL or less, or for symptoms of anemia. No transfusion recommendations were provided for acute coronary syndrome.
PLASMA
In the United States, approximately 4 million units of frozen plasma (FP) were transfused in 2006, and recent data demonstrate that relative to RBCs, the number of FP units transfused in the United States is higher than in other countries with advanced medical care.[1, 21, 22] Many transfusions are given prior to a procedure to correct perceived bleeding risk.
Risks of Periprocedural Coagulopathy
Laboratory measures of coagulation such as prothrombin time (PT)/emnternational normalized ratio (INR) are frequently used to guide transfusion of FP. A 3‐month audit at Massachusetts General Hospital found approximately one‐third of all FP units used outside of the operating room were requested before a procedure because of an elevated INR.[23] However, PT and activated partial thromboplastin time were never validated in nonbleeding patients, and INR was never validated for use in non‐vitamin K antagonist settings.[24, 25]
A recent systematic review assessed whether abnormalities in preprocedure coagulation tests correlate with increased risk of bleeding.[26] Analysis of 24 observational studies and 1 RCT included nearly 2000 procedures performed on patients with abnormal coagulation studies and concluded that there is not sufficient data to support PT and INR as predictors of bleeding risk. One study examining how well INR can be used to predict the degree of deficiency of a given factor found that blood samples with an INR as high as 1.9 contained factor levels adequate to support hemostasis.[27]
Furthermore, there is surprisingly little evidence to support the ability of FP to correct an abnormal INR. Given that the INR of FP can be as high as 1.3, transfusion will have little effect on minimally elevated INRs. This point is highlighted by a prospective study evaluating the effectiveness of transfusing FP to correct an increased INR in patients with a mildly prolonged PT (13.1 to 17 seconds). Of 121 patients studied, <1% normalized their INR, and only 15% demonstrated improvement at least halfway to normal.[28] There was no correlation between plasma dose and change in INR. Additionally, a study attempting to quantify the relationship between change in INR and the pretransfusion INR observed that a reliable significant change in INR is only likely when the INR is >1.7.[29]
Does FP Transfusion Improve Outcomes?
Most clinical uses of FP are not supported by evidence from RCTs. A 2012 systematic review examining the clinical effectiveness of FP included RCT data from 1964 to 2011.[30] In terms of periprocedural FP administration, this review included studies of FP in cardiac surgery and revealed a lack of evidence to support the effectiveness of FP to prevent bleeding. Notably, this review did not examine the use of FP prior to percutaneous procedures.
Despite the paucity of evidence to guide FP transfusions, in 2010 the AABB published practice guidelines to assist practitioners in the use of FP.[22, 31] In terms of periprocedural FP administration, these practice guidelines questioned the use of FP in surgical or trauma patients without massive bleeding, as only 6 studies were available for analysis. The panel could not recommend for or against the use of FP in surgical patients, although meta‐analysis showed that FP transfusion was associated with a trend toward increased risk of death. No studies of nonsurgical invasive procedures met review inclusion criteria. Given the potential for harm and the lack of data with regard to use of FP prior to nonsurgical invasive procedures, hospitalists should view the use of FP prior to a procedure with caution.
The Society of Interventional Radiology (SIR) recently published consensus guidelines for periprocedural management of coagulation status and hemostasis risk in percutaneous‐guided interventions.[32] Acknowledging the lack of data regarding periprocedural management of patients with abnormal coagulation parameters, this society's Standards of Practice Committee recommends that in the absence of warfarin treatment or liver disease, preprocedure INR testing should be conducted only prior to procedures with moderate to high bleeding risk.[32] Notably, low bleeding risk procedures include thoracentesis, paracentesis, drainage catheter exchange, and dialysis access interventions. This recommendation is consistent with observational studies of paracentesis and thoracentesis, which have failed to show increased bleeding risk in patients with an elevated INR. The largest of these studies retrospectively examined 608 patient procedures and found no significant difference in hemoglobin drop or average hemoglobin among patients with normal PT compared to patients with prolonged PT who underwent either a paracentesis or thoracentesis.[33]
In patients scheduled to undergo moderate or high bleeding risk procedures, these guidelines recommend that the INR be corrected to <1.5, although this recommendation was derived by Delphi consensus of expert practitioners due to lack of available data.[32] Central venous catheter insertion highlights the discrepancy between SIR recommendations and review of the available, albeit limited, data. A study of 580 patients with an INR >1.5 found that only 1 patient had a major bleeding event due to accidental puncture of the carotid artery.[34] Along with several others, this study is cited as evidence that central venous catheterization can be performed safely in patients with coagulation abnormalities.[32] However, because of the observational nature of these data, SIR guidelines categorize central venous catheterization as a moderate risk procedure, and as such recommend a preprocedure INR check and correction of INR to 1.5.[32] There are no prospective studies looking at what INR it is safe to perform endoscopic interventions.[35] Additionally, there are no studies looking at the effect of preprocedure FP administration on endoscopic outcomes.
PLATELETS
Over 10 million units of platelets are transfused in the United States annually.[1] Severe thrombocytopenia is thought to confer increased bleeding risk, and allogenic platelet transfusions are commonly given to thrombocytopenic patients as supportive care.[36] Given that recommendations on platelet transfusion thresholds are largely derived from studies looking at patients with hematological malignancies, there is concern about using these data to inform transfusion thresholds in other patient populations. Despite this limitation, we examine the evidence for an optimum platelet transfusion threshold and review available practice guidelines for the perioperative setting.
Risks of Thrombocytopenia and When to Transfuse
Hemostasis depends on an adequate number of functional platelets along with an intact coagulation system. Circulating platelets likely contribute to hemostasis via an endothelial supportive function by plugging gaps in the endothelium of blood vessels.[36] Early observational studies of clinically stable patients with chronic thrombocytopenia showed that significant spontaneous bleeding through an intact vascular system typically occurred with a platelet count below 5,000 platelets/L.[37, 38] Despite this, a platelet count of 20,000/L was adopted as a transfusion threshold and used for over 25 years.[36]
Beginning in the late 1990s, RCTs comparing a prophylactic transfusion trigger of 10,000 platelets/L to 20,000 platelets/L showed no difference in hemorrhagic risks or RBC transfusion requirements.[39, 40, 41, 42] The American Society of Clinical Oncology and the British Committee for Standards in Haematology (BCSH) now recommend a prophylactic platelet transfusion trigger of 10,000/L for all patients with chronic thrombocytopenia due to hypoproliferative causes.[43] A 2012 Cochrane review of 13 RCTs examining prophylactic platelet transfusion for prevention of bleeding in patients with hematological disorders did not find evidence to change this recommendation, but did question the strength of the data showing bleeding risk equivalency between 10,000/L and 20,000/L.[44]
In addition to studies examining platelet transfusion thresholds, various studies have questioned whether platelet transfusions should be given prophylactically before bleeding onset or as treatment afterward. Two early small RCTs and several observational studies examining prophylactic versus therapeutic platelet transfusion failed to show increased risk of bleeding or mortality in patients with leukemia who were transfused only after bleeding had begun.[45, 46] However, a recent RCT of 600 patients undergoing chemotherapy or stem cell transplantation showed that patients who were not given prophylactic platelet transfusions had more days with bleeding and shorter time to first bleeding episode compared to patients given prophylactic platelet transfusion for a platelet count below 10,000/L.[47] This study supports continued use of prophylactic platelet transfusions to prevent bleeding. Based on this recent trial and the 2012 Cochrane review, prophylactic platelet transfusion for a platelet count lower than 10,000/L is currently the standard of care for patients with chronic thrombocytopenia due to a hypoproliferative cause.
Perioperative Platelet Transfusion Practice Guidelines
It is unknown at what platelet count the risk of surgical bleeding increases, and there are no definitive studies to guide the use of prophylactic platelet transfusions for patients prior to procedures. Given this paucity of data, we are left to review consensus expert opinion and the nonrandomized studies that inform them.
Prior to surgical procedures, prophylactic platelet transfusion is rarely required for platelet counts >100,000/L and is usually required for a platelet count <50,000/L.[48] For platelet counts in the range of 50,000/L to 100,000/L, guidelines from the American Society of Anesthesiologists and the Royal College of Physicians state that platelet transfusion should be based on the extent of surgery, the risk and ability to control bleeding, the rate of bleeding with regard to trauma, the presence of platelet dysfunction, and other coagulation abnormalities.[48] Recognizing the inability to easily control bleeding during neurosurgical procedures and the potential for significant adverse outcomes with intracranial bleeding, experts recommend that neurosurgical patients have platelet counts maintained >100,000/L.[43]
For bedside and minimally invasive procedures, various thresholds are considered standard of care without rigorous supporting data. For example, based solely on interpretation of case reports, a platelet count of 80,000/L has been proposed by the American Red Cross, the French Society of Anesthesiology, and the BCSH for epidural anesthesia in patients with thrombocytopenia due to idiopathic thrombocytopenia.[49] For endoscopic procedures, the American Society for Gastrointestinal Endoscopy recommends a platelet count of 50,000/L for therapeutic procedures and 20,000/L for low‐risk diagnostic procedures.[35]
Procedures such as lumbar puncture, central venous catheterization, paracentesis, and thoracentesis have also not been well studied in the setting of thrombocytopenia. Based on case reports and case series, lumbar puncture is thought to require a platelet count of 10,000 to 20,000/L in patients with marrow failure but 50,000/L in patients without hematologic malignancies.[49, 50, 51] In terms of central venous catheter placement, a recent retrospective analysis included 193 adult leukemic patients who received 604 central venous catheter placements at 1 institution.[52] This study showed that only platelet counts below 20,000/L were associated with a higher risk of nonsevere bleeding. These results are consistent with several earlier observational studies reporting a very low risk of bleeding in patients with thrombocytopenia requiring central venous catheterization.[53, 54] With regard to paracentesis and thoracentesis, a study of 391 patients who underwent paracentesis and 207 patients who underwent thoracentesis did not demonstrate bleeding with platelet counts of 50,000/L to 100,000/L.[33] However, no specific platelet transfusion threshold was identified by this retrospective single‐institution study.
SUMMARY
We summarize our recommendations in Table 2, recognizing that evidence is limited and many of these recommendations are based on expert opinion. The limited evidence highlights opportunity for hospitalist‐driven research in periprocedural blood product transfusion.
|
| RBC transfusion |
| Transfusion threshold of Hg <78 g/dL or symptomatic anemia in most hemodynamically stable hospitalized patients. |
| Transfusion threshold of Hg <8 g/dL or for symptomatic anemia in patients with underlying CV disease. |
| Optimal transfusion threshold is unknown in patients with acute coronary syndrome. |
| Frozen plasma transfusion |
| Insufficient evidence to support routine INR testing for low‐risk procedures in the absence of warfarin treatment or liver disease. |
| Transfusion may be considered prior to procedures with moderate to high bleeding risk when INR >1.5. |
| Insufficient evidence to guide transfusion practice prior to endoscopic procedures. |
| Platelet transfusion |
| Transfusion threshold of <20,000/L for low bleeding risk procedures, including central venous catheters. |
| Transfusion threshold of <50,000100,000/L for moderate bleeding risk procedures. |
| Transfusion threshold of <100,000/L for neurosurgical procedures. |
| Transfusion threshold of <50,000/L for therapeutic endoscopy and <20,000/L for low‐risk diagnostic endoscopy. |
ACKNOWLEDGEMENTS
Disclosures: Dr. Carson reports grants from the National Institutes of Health (NIH) during the conduct of the study, personal fees from Cerus Corporation, grants from Amgen, and grants from the NIH outside the submitted work.
- , , , . Report of the US Department of Health and Human Services. The 2009 national blood collection and utilization survey report. Washington, DC: US Department of Health and Human Services, Office of the Assistant Secretary for Health; 2011.
- , , , , . Where does blood go? Prospective observational study of red cell transfusion in north England. BMJ. 2002;325(7368):803.
- , , , et al. Effect of anaemia and cardiovascular disease on surgical mortality and morbidity. Lancet. 1996;348(9034):1055–1060.
- , , , . Mortality and morbidity in patients with very low postoperative Hb levels who decline blood transfusion. Transfusion. 2002;42(7):812–818.
- , , , et al. Human cardiovascular and metabolic response to acute, severe isovolemic anemia. JAMA. 1998;279(3):217–221.
- , , , et al. Electrocardiographic ST‐segment changes during acute, severe isovolemic hemodilution in humans. Anesthesiology. 2000;93(4):1004–1010.
- , , , et al. Acute severe isovolemic anemia impairs cognitive function and memory in humans. Anesthesiology. 2000;92(6):1646–1652.
- , , , , , . Fatigue during acute isovolemic anemia in healthy, resting humans. Transfusion. 2000;40(4):457–460.
- , , , et al. Preoperative hematocrit levels and postoperative outcomes in older patients undergoing noncardiac surgery. JAMA. 2007;297(22):2481–2488.
- , , , et al. Preoperative anaemia and postoperative outcomes in non‐cardiac surgery: a retrospective cohort study. Lancet. 2011;378(9800):1396–1407.
- , , . Transfusion thresholds and other strategies for guiding allogeneic red blood cell transfusion. Cochrane Database Syst Rev. 2012;4:CD002042.
- , , , et al. A multicenter, randomized, controlled clinical trial of transfusion requirements in critical care. Transfusion Requirements in Critical Care Investigators, Canadian Critical Care Trials Group. N Engl J Med. 1999;340(6):409–417.
- , , , et al. Is a low transfusion threshold safe in critically ill patients with cardiovascular diseases? Crit Care Med. 2001;29(2):227–234.
- , , , et al. Liberal or restrictive transfusion in high‐risk patients after hip surgery. N Engl J Med. 2011;365(26):2453–2462.
- , , , et al. Transfusion requirements after cardiac surgery: the TRACS randomized controlled trial. JAMA. 2010;304(14):1559–1567.
- , , , et al. Lowering the hemoglobin threshold for transfusion in coronary artery bypass procedures: effect on patient outcome. Transfusion. 1999;39(10):1070–1077.
- , , , et al. Transfusion strategies for acute upper gastrointestinal bleeding. N Engl J Med. 2013;368(1):11–21.
- , , , et al. Liberal versus restrictive transfusion thresholds for patients with symptomatic coronary artery disease. Am Heart J. 2013;165(6):964–971.
- , , , et al. Conservative versus liberal red cell transfusion in acute myocardial infarction (the CRIT Randomized Pilot Study). Am J Cardiol. 2011;108(8):1108–1111.
- , , , et al. Red blood cell transfusion: a clinical practice guideline from the AABB. Ann Intern Med. 2012;157(1):49–58.
- , . Is fresh frozen plasma overtransfused in the United States? Transfusion. 2004;44(11):1674–1675.
- , , , et al. The effect of plasma transfusion on morbidity and mortality: a systematic review and meta‐analysis. Transfusion. 2010;50(6):1370–1383.
- , . Why do physicians request fresh frozen plasma? Transfusion. 2004;44(9):1393–1394.
- . Predicting hemorrhage using preoperative coagulation screening assays. Curr Hematol Rep. 2004;3(5):324–330.
- , . Plasma transfusion for bedside, radiologically guided, and operating room invasive procedures. Transfusion. 2012;52(suppl 1):20S–29S.
- , ; Transfusion Medicine/Hemostasis Clinical Trials Network. Paucity of studies to support that abnormal coagulation test results predict bleeding in the setting of invasive procedures: an evidence‐based review. Transfusion. 2005;45(9):1413–1425.
- . Interpretation of the international normalised ratio in patients with liver disease. Lancet. 2002;359(9300):47–48.
- , , . Effect of fresh‐frozen plasma transfusion on prothrombin time and bleeding in patients with mild coagulation abnormalities. Transfusion. 2006;46(8):1279–1285.
- , . Toward rational fresh frozen plasma transfusion: The effect of plasma transfusion on coagulation test results. Am J Clin Pathol. 2006;126(1):133–139.
- , , , , . Is fresh‐frozen plasma clinically effective? An update of a systematic review of randomized controlled trials. Transfusion. 2012;52(8):1673–1686; quiz 1673.
- , , , et al. Evidence‐based practice guidelines for plasma transfusion. Transfusion. 2010;50(6):1227–1239.
- , , , et al. Consensus guidelines for periprocedural management of coagulation status and hemostasis risk in percutaneous image‐guided interventions. J Vasc Interv Radiol. 2012;23(6):727–736.
- , . Lack of increased bleeding after paracentesis and thoracentesis in patients with mild coagulation abnormalities. Transfusion. 1991;31(2):164–171.
- , . Central venous cannulation in patients with liver disease and coagulopathy—a prospective audit. Intensive Care Med. 1999;25(5):481–485.
- ASGE Standards of Practice Committee; , , , et al. Management of antithrombotic agents for endoscopic procedures. Gastrointest Endosc. 2009;70(6):1060–1070.
- , , , . New strategies for the optimal use of platelet transfusions. Hematology Am Soc Hematol Educ Program. 2008:198–204.
- , . Thrombocytopenia: mechanisms and management of defects in platelet production. Clin Haematol. 1978;7(3):523–539.
- , , . The quantitative relation between platelet count and hemorrhage in patients with acute leukemia. N Engl J Med. 1962;266:905–909.
- , , , et al. The threshold for prophylactic platelet transfusions in adults with acute myeloid leukemia. Gruppo Italiano Malattie Ematologiche Maligne dell'Adulto. N Engl J Med. 1997;337(26):1870–1875.
- , , , , , . Randomized study of prophylactic platelet transfusion threshold during induction therapy for adult acute leukemia: 10,000/microL versus 20,000/microL. J Clin Oncol. 1997;15(3):1143–1149.
- , , , et al. Safety and cost effectiveness of a 10 x 10(9)/L trigger for prophylactic platelet transfusions compared with the traditional 20 x 10(9)/L trigger: a prospective comparative trial in 105 patients with acute myeloid leukemia. Blood. 1998;91(10):3601–3606.
- , , , et al. A prospective randomized trial of prophylactic platelet transfusion and bleeding incidence in hematopoietic stem cell transplant recipients: 10,000/L versus 20,000/microL trigger. Biol Blood Marrow Transplant. 2002;8(10):569–576.
- . Evidence‐based platelet transfusion guidelines. Hematology Am Soc Hematol Educ Program. 2007:172–178.
- , , , et al. Prophylactic platelet transfusion for prevention of bleeding in patients with haematological disorders after chemotherapy and stem cell transplantation. Cochrane Database Syst Rev. 2012;5:CD004269.
- , , , et al. Indications for platelet transfusion in children with acute leukemia. Am J Hematol. 1982;12(4):347–356.
- , , , , . Platelet prophylaxis in acute non‐lymphoblastic leukaemia. Lancet. 1978;1(8058):267.
- , , , et al. A no‐prophylaxis platelet‐transfusion strategy for hematologic cancers. N Engl J Med. 2013;368(19):1771–1780.
- , . Transfusion in the operating room and the intensive care unit: current practice and future directions. Int Anesthesiol Clin. 2000;38(4):149–169.
- , , . The risk of spinal haematoma following neuraxial anaesthesia or lumbar puncture in thrombocytopenic individuals. Br J Haematol. 2010;148(1):15–25.
- , . Personal practice: how we manage the risk of bleeding and thrombosis in children and young adults with acute lymphoblastic leukaemia. Br J Haematol. 2011;152(5):505–511.
- , , , , . Safety of lumbar puncture for adults with acute leukemia and restrictive prophylactic platelet transfusion. Ann Hematol. 2003;82(9):570–573.
- , , , , . Optimal preprocedural platelet transfusion threshold for central venous catheter insertions in patients with thrombocytopenia. Transfusion. 2011;51(11):2269–2276.
- , , . Central venous catheter placement in patients with disorders of hemostasis. Chest. 1996;110(1):185–188.
- , , , , , . Central venous catheterization in patients with coagulopathy. Arch Surg. 1992;127(3):273–275.
Although inpatient blood product transfusion is common, many uses have not been subject to rigorous clinical study, and great practice variations exist. Of particular interest to the hospitalist is the use of red blood cells (RBCs), plasma, and platelets prior to an invasive procedure to correct anemia or a perceived bleeding risk. When considering blood product use in this context, the hospitalist faces 2 questions. First, what are the risks of anemia, thrombocytopenia, or abnormal coagulation tests? Second, what is the evidence that administration of the blood product in question improves outcomes such as bleeding and mortality? We address these questions in this review of the data supporting the use of RBCs, platelets, and plasma prior to invasive procedures.
RED BLOOD CELLS
Anemia is the most common hematologic concern in the perioperative setting. In 2009, approximately 15 million units of RBCs were transfused in the United States, 40% to 70% of which were given in the perioperative setting.[1, 2]
Risks of Periprocedural Anemia
The best evidence regarding the risks of perioperative anemia comes from studies in patients who declined blood transfusions. A retrospective cohort study of 1958 consecutive surgical patients who refused transfusions due to religious reasons showed an increase in 30‐day mortality as preoperative hemoglobin values fell, especially for those with preoperative hemoglobin concentrations <6 g/dL.[3] For patients with underlying cardiovascular disease, the risk of death was greatest when the preoperative hemoglobin value was <10 g/dL. Subsequent analysis showed that mortality rose with postoperative hemoglobin levels <7 g/dL, with a sharp rise in morbidity (myocardial infarction [MI], congestive heart failure [CHF], arrhythmia, and infection) and mortality in those with postoperative hemoglobin of <5 to 6 g/dL.[4] These results are consistent with studies of healthy volunteers who underwent acute isovolumic hemoglobin reduction, demonstrating clinical changes when hemoglobin values fell to 5 to 7 g/dL.[5, 6, 7, 8]
Several large, retrospective cohort studies have evaluated anemia and perioperative morbidity and mortality. A 2007 study analyzed data from over 310,000 predominantly male patients over age 65 years undergoing major noncardiac surgery.[9] Even mild degrees of preoperative anemia were associated with increased 30‐day mortality and cardiovascular morbidity (cardiac arrest or Q‐wave MI), with a monotonic rise in mortality (3.5%35.4%) and cardiac events (1.8%14.6%) when the hematocrit was <39%. Utilizing data from the American College of Surgeons' National Surgical Quality Improvement Program database, a 2011 study evaluated over 227,000 patients who underwent major noncardiac surgery.[10] Again, even mild anemia (hematocrit 29%39%) was independently associated with an increase in 30‐day composite morbidity, including MI, stroke, pneumonia, acute renal failure, wound infection, sepsis (13.27%), and mortality (3.52%).
Does RBC Transfusion Improve Outcomes?
Although the evidence argues that perioperative anemia is associated with poor surgical outcomes, it is not clear whether RBC transfusion in the perioperative setting improves these outcomes. Furthermore, the optimal perioperative hemoglobin level remains controversial. Importantly, most periprocedural trials were not sufficiently powered to assess differences in clinical outcomes.[11]
Several noteworthy randomized controlled trials (RCTs) comprise the bulk of the evidence regarding transfusion thresholds and are summarized in Table 1. The Transfusion Requirements in Critical Care (TRICC) was a landmark trial that randomized patients to a restrictive or a liberal transfusion strategy and demonstrated a trend toward lower 30‐day mortality in the restrictive group.[12] In addition, the restrictive transfusion group had lower rates of myocardial infarction and pulmonary edema. A subsequent subanalysis found no difference in mortality in patients with underlying cardiovascular disease.[13]
| Study/Year | No. of Patients | Brief Description | Transfusion Strategy | Outcomes (Restrictive Versus Liberal) |
|---|---|---|---|---|
| ||||
| Herbert et al. (TRICC)/1999[12] | 838 | Normovolemic patients admitted to ICU with Hg <9 g/dL within 72 hours of admission. | Restrictive: Hg maintained 79 g/dL. Liberal: Hg maintained 1012 g/dL. | 30‐day mortality (18.7% vs 23.3%, P=0.11). Pulmonary edema (5.3% vs 10.7%, P<0.01) and MI (0.7% vs 2.9%, P=0.02) rates while in the ICU. |
| Carson et al. (FOCUS)/2011[14] | 2016 | Patients undergoing surgery for hip fracture with a history of cardiovascular disease or cardiovascular risk factors. | Restrictive: transfused for Hg <8 g/dL or symptomatic anemia. Liberal: transfused to maintain Hg >10 g/dL. | Primary outcome of death or the inability to walk 10 feet across the room without human assistance at 60 days (34.7% vs 35.2%, P=0.9). Composite of in‐hospital ACS or death (5.2% vs. 4.3%). The frequencies of in‐hospital clinical events and adverse events did not differ significantly between groups. |
| Hajjar et al. (TRACS)/2010[15] | 502 | Patients admitted to ICU for elective cardiac surgery with cardiopulmonary bypass. | Restrictive: transfused to maintain Hct 24%. Liberal: transfused to maintain Hct 30%. | Composite end point of 30‐day all‐cause mortality+severe in‐hospital morbidity (cardiogenic shock, ARDS, or AKI requiring renal replacement therapy) (11% vs 10%, P=0.85). |
| Bracey et al./1999[16] | 428 | Patients undergoing first‐time elective coronary surgical revascularization. | Restrictive: postoperative transfusion for Hg <8 g/dL or predetermined clinical conditions requiring RBC transfusion (ie, hemodynamic instability). | Hospital mortality (1.4% vs 2.7%, P=0.3). |
| Liberal: transfusion at discretion of physician with institutional guidelines recommending postoperative transfusion for Hg <9 g/dL. | No differences in morbidity (including pulmonary complications, renal failure, and MI), duration of mechanical ventilation, and length of hospital stay (7.52.9 days vs 7.94.9 days). | |||
| Villanueva et al./2013[17] | 921 | Severe upper GI bleeding, gastroscopy within 6 hours. | Restrictive: transfused if Hg <7 g/dL. Liberal: transfused if Hg <9 g/dL. | Survival at 6 weeks (95% vs 91%, P=0.02). |
| Rebleeding (10% vs 16%, P=0.01). Adverse event rate including transfusion reactions, ACS, AKI, pulmonary complications, infection, and stroke or TIA (40% vs 48%, P=0.02). | ||||
| Carson et al. (MINT)/2013[18] | 110 | Pilot study in patients with Hg <10 g/dL and either ACS or stable angina undergoing cardiac catheterization. | Restrictive: transfused if Hg <8 g/dL or symptomatic anemia. Liberal: transfused to raise Hg 10 g/dL. | Composite primary outcome of all cause mortality+MI+unscheduled coronary revascularization within 30 days (25.5% vs 10.9%, P=0.054). Death at 30 days (13% vs 1.8%, P=0.032). |
| Cooper et al. (CRIT)/2011[19] | 45 | Pilot study in patients with acute MI (chest pain and positive cardiac biomarker) and Hct 30% within 72 hours of symptom onset. | Restrictive: transfused to maintain Hct 24%27%. | The primary composite outcome (in‐hospital death, recurrent MI, or new or worsening CHF) (13% vs 38%, P=0.046). |
| Liberal: transfused to maintain Hct 30% to 33%. | ||||
The largest RCT of transfusion thresholds, the Transfusion Trigger Trial for Functional Outcomes in Cardiovascular Patients Undergoing Surgical Hip Fracture Repair (FOCUS), randomized patients undergoing surgery for hip fracture with a history of cardiovascular disease or cardiovascular risk factors to a restrictive or liberal transfusion strategy.[14] The primary outcome of death or the inability to walk 10 feet across the room without human assistance at 60 days was similar in both the liberal and restrictive group, and the composite rate of acute coronary syndrome and in‐hospital death, stroke, CHF, venous thromboembolism, and the frequencies of other in‐hospital events or lengths of stay did not differ between the groups.
Several RCTs have examined the effect of transfusion practice on patients undergoing elective cardiac surgery. The Transfusion Requirements After Cardiac Surgery (TRACS) study did not show a difference in the primary composite outcome of 30‐day all‐cause mortality and in‐hospital morbidity between the restrictive and liberal transfusion groups.[15] A second cardiac surgery trial also found no difference in mortality or morbidity outcomes when comparing a restrictive versus liberal transfusion threshold.[16]
A recent RBC transfusion trial evaluated transfusion thresholds in patients with severe upper gastrointestinal bleeding.[17] All patients underwent gastroscopy within 6 hours of hospital admission and were randomly allocated to a restrictive or liberal transfusion threshold. The restrictive group had a significantly higher survival at 6 weeks when compared to the liberal group, as well as lower rates of adverse events such as further bleeding, acute coronary syndrome, transfusion reactions, and pulmonary edema.
Finally, the Myocardial Ischemia and Transfusion (MINT) pilot trial evaluated 110 patients with hemoglobin concentration l<10 g/dL admitted for ST‐segment elevation MI, nonST‐segment elevation MI, unstable angina, or stable coronary disease undergoing a cardiac catheterization.[18] The composite end point of death, MI, and unscheduled revascularizations within 30 days was higher in the restrictive group when compared to the liberal group, and 30‐day mortality was less frequent in liberal strategy compared to restrictive strategy. Given the small study size and the fact that patients in the restrictive group were significantly older than those in the liberal group, the results of this study must be interpreted carefully. The results of this trial contrast an earlier RCT of 45 patients admitted with acute MI, which showed higher rates of in‐hospital death, recurrent MI, or CHF in the liberal transfusion group versus the restrictive group.[19] Clearly, there is insufficient evidence to define transfusion threshold in acute coronary syndrome, and further study is needed in this area.
A recent meta‐analysis of 19 RCTs through February 2011 compared restrictive versus liberal transfusion strategies.[11] Although not all of these studies looked at periprocedural RBC transfusion, employment of a restrictive strategy saved an average of 1.19 units of blood per patient transfused without a difference in 30‐day mortality. This meta‐analysis also showed that in‐hospital mortality was 23% lower in patients assigned to a restrictive strategy, and there were no differences in cardiac events or strokes between restrictive and liberal strategies.
Encompassing the latest evidence, the AABB (formerly, the American Association of Blood Banks) guidelines recommend a restrictive transfusion strategy utilizing a transfusion threshold of 7 to 8 g/dL in stable hospitalized patients.[20] The AABB also recommends a restrictive strategy for patients with underlying cardiovascular disease, advocating for a transfusion threshold of 8 g/dL or less, or for symptoms of anemia. No transfusion recommendations were provided for acute coronary syndrome.
PLASMA
In the United States, approximately 4 million units of frozen plasma (FP) were transfused in 2006, and recent data demonstrate that relative to RBCs, the number of FP units transfused in the United States is higher than in other countries with advanced medical care.[1, 21, 22] Many transfusions are given prior to a procedure to correct perceived bleeding risk.
Risks of Periprocedural Coagulopathy
Laboratory measures of coagulation such as prothrombin time (PT)/emnternational normalized ratio (INR) are frequently used to guide transfusion of FP. A 3‐month audit at Massachusetts General Hospital found approximately one‐third of all FP units used outside of the operating room were requested before a procedure because of an elevated INR.[23] However, PT and activated partial thromboplastin time were never validated in nonbleeding patients, and INR was never validated for use in non‐vitamin K antagonist settings.[24, 25]
A recent systematic review assessed whether abnormalities in preprocedure coagulation tests correlate with increased risk of bleeding.[26] Analysis of 24 observational studies and 1 RCT included nearly 2000 procedures performed on patients with abnormal coagulation studies and concluded that there is not sufficient data to support PT and INR as predictors of bleeding risk. One study examining how well INR can be used to predict the degree of deficiency of a given factor found that blood samples with an INR as high as 1.9 contained factor levels adequate to support hemostasis.[27]
Furthermore, there is surprisingly little evidence to support the ability of FP to correct an abnormal INR. Given that the INR of FP can be as high as 1.3, transfusion will have little effect on minimally elevated INRs. This point is highlighted by a prospective study evaluating the effectiveness of transfusing FP to correct an increased INR in patients with a mildly prolonged PT (13.1 to 17 seconds). Of 121 patients studied, <1% normalized their INR, and only 15% demonstrated improvement at least halfway to normal.[28] There was no correlation between plasma dose and change in INR. Additionally, a study attempting to quantify the relationship between change in INR and the pretransfusion INR observed that a reliable significant change in INR is only likely when the INR is >1.7.[29]
Does FP Transfusion Improve Outcomes?
Most clinical uses of FP are not supported by evidence from RCTs. A 2012 systematic review examining the clinical effectiveness of FP included RCT data from 1964 to 2011.[30] In terms of periprocedural FP administration, this review included studies of FP in cardiac surgery and revealed a lack of evidence to support the effectiveness of FP to prevent bleeding. Notably, this review did not examine the use of FP prior to percutaneous procedures.
Despite the paucity of evidence to guide FP transfusions, in 2010 the AABB published practice guidelines to assist practitioners in the use of FP.[22, 31] In terms of periprocedural FP administration, these practice guidelines questioned the use of FP in surgical or trauma patients without massive bleeding, as only 6 studies were available for analysis. The panel could not recommend for or against the use of FP in surgical patients, although meta‐analysis showed that FP transfusion was associated with a trend toward increased risk of death. No studies of nonsurgical invasive procedures met review inclusion criteria. Given the potential for harm and the lack of data with regard to use of FP prior to nonsurgical invasive procedures, hospitalists should view the use of FP prior to a procedure with caution.
The Society of Interventional Radiology (SIR) recently published consensus guidelines for periprocedural management of coagulation status and hemostasis risk in percutaneous‐guided interventions.[32] Acknowledging the lack of data regarding periprocedural management of patients with abnormal coagulation parameters, this society's Standards of Practice Committee recommends that in the absence of warfarin treatment or liver disease, preprocedure INR testing should be conducted only prior to procedures with moderate to high bleeding risk.[32] Notably, low bleeding risk procedures include thoracentesis, paracentesis, drainage catheter exchange, and dialysis access interventions. This recommendation is consistent with observational studies of paracentesis and thoracentesis, which have failed to show increased bleeding risk in patients with an elevated INR. The largest of these studies retrospectively examined 608 patient procedures and found no significant difference in hemoglobin drop or average hemoglobin among patients with normal PT compared to patients with prolonged PT who underwent either a paracentesis or thoracentesis.[33]
In patients scheduled to undergo moderate or high bleeding risk procedures, these guidelines recommend that the INR be corrected to <1.5, although this recommendation was derived by Delphi consensus of expert practitioners due to lack of available data.[32] Central venous catheter insertion highlights the discrepancy between SIR recommendations and review of the available, albeit limited, data. A study of 580 patients with an INR >1.5 found that only 1 patient had a major bleeding event due to accidental puncture of the carotid artery.[34] Along with several others, this study is cited as evidence that central venous catheterization can be performed safely in patients with coagulation abnormalities.[32] However, because of the observational nature of these data, SIR guidelines categorize central venous catheterization as a moderate risk procedure, and as such recommend a preprocedure INR check and correction of INR to 1.5.[32] There are no prospective studies looking at what INR it is safe to perform endoscopic interventions.[35] Additionally, there are no studies looking at the effect of preprocedure FP administration on endoscopic outcomes.
PLATELETS
Over 10 million units of platelets are transfused in the United States annually.[1] Severe thrombocytopenia is thought to confer increased bleeding risk, and allogenic platelet transfusions are commonly given to thrombocytopenic patients as supportive care.[36] Given that recommendations on platelet transfusion thresholds are largely derived from studies looking at patients with hematological malignancies, there is concern about using these data to inform transfusion thresholds in other patient populations. Despite this limitation, we examine the evidence for an optimum platelet transfusion threshold and review available practice guidelines for the perioperative setting.
Risks of Thrombocytopenia and When to Transfuse
Hemostasis depends on an adequate number of functional platelets along with an intact coagulation system. Circulating platelets likely contribute to hemostasis via an endothelial supportive function by plugging gaps in the endothelium of blood vessels.[36] Early observational studies of clinically stable patients with chronic thrombocytopenia showed that significant spontaneous bleeding through an intact vascular system typically occurred with a platelet count below 5,000 platelets/L.[37, 38] Despite this, a platelet count of 20,000/L was adopted as a transfusion threshold and used for over 25 years.[36]
Beginning in the late 1990s, RCTs comparing a prophylactic transfusion trigger of 10,000 platelets/L to 20,000 platelets/L showed no difference in hemorrhagic risks or RBC transfusion requirements.[39, 40, 41, 42] The American Society of Clinical Oncology and the British Committee for Standards in Haematology (BCSH) now recommend a prophylactic platelet transfusion trigger of 10,000/L for all patients with chronic thrombocytopenia due to hypoproliferative causes.[43] A 2012 Cochrane review of 13 RCTs examining prophylactic platelet transfusion for prevention of bleeding in patients with hematological disorders did not find evidence to change this recommendation, but did question the strength of the data showing bleeding risk equivalency between 10,000/L and 20,000/L.[44]
In addition to studies examining platelet transfusion thresholds, various studies have questioned whether platelet transfusions should be given prophylactically before bleeding onset or as treatment afterward. Two early small RCTs and several observational studies examining prophylactic versus therapeutic platelet transfusion failed to show increased risk of bleeding or mortality in patients with leukemia who were transfused only after bleeding had begun.[45, 46] However, a recent RCT of 600 patients undergoing chemotherapy or stem cell transplantation showed that patients who were not given prophylactic platelet transfusions had more days with bleeding and shorter time to first bleeding episode compared to patients given prophylactic platelet transfusion for a platelet count below 10,000/L.[47] This study supports continued use of prophylactic platelet transfusions to prevent bleeding. Based on this recent trial and the 2012 Cochrane review, prophylactic platelet transfusion for a platelet count lower than 10,000/L is currently the standard of care for patients with chronic thrombocytopenia due to a hypoproliferative cause.
Perioperative Platelet Transfusion Practice Guidelines
It is unknown at what platelet count the risk of surgical bleeding increases, and there are no definitive studies to guide the use of prophylactic platelet transfusions for patients prior to procedures. Given this paucity of data, we are left to review consensus expert opinion and the nonrandomized studies that inform them.
Prior to surgical procedures, prophylactic platelet transfusion is rarely required for platelet counts >100,000/L and is usually required for a platelet count <50,000/L.[48] For platelet counts in the range of 50,000/L to 100,000/L, guidelines from the American Society of Anesthesiologists and the Royal College of Physicians state that platelet transfusion should be based on the extent of surgery, the risk and ability to control bleeding, the rate of bleeding with regard to trauma, the presence of platelet dysfunction, and other coagulation abnormalities.[48] Recognizing the inability to easily control bleeding during neurosurgical procedures and the potential for significant adverse outcomes with intracranial bleeding, experts recommend that neurosurgical patients have platelet counts maintained >100,000/L.[43]
For bedside and minimally invasive procedures, various thresholds are considered standard of care without rigorous supporting data. For example, based solely on interpretation of case reports, a platelet count of 80,000/L has been proposed by the American Red Cross, the French Society of Anesthesiology, and the BCSH for epidural anesthesia in patients with thrombocytopenia due to idiopathic thrombocytopenia.[49] For endoscopic procedures, the American Society for Gastrointestinal Endoscopy recommends a platelet count of 50,000/L for therapeutic procedures and 20,000/L for low‐risk diagnostic procedures.[35]
Procedures such as lumbar puncture, central venous catheterization, paracentesis, and thoracentesis have also not been well studied in the setting of thrombocytopenia. Based on case reports and case series, lumbar puncture is thought to require a platelet count of 10,000 to 20,000/L in patients with marrow failure but 50,000/L in patients without hematologic malignancies.[49, 50, 51] In terms of central venous catheter placement, a recent retrospective analysis included 193 adult leukemic patients who received 604 central venous catheter placements at 1 institution.[52] This study showed that only platelet counts below 20,000/L were associated with a higher risk of nonsevere bleeding. These results are consistent with several earlier observational studies reporting a very low risk of bleeding in patients with thrombocytopenia requiring central venous catheterization.[53, 54] With regard to paracentesis and thoracentesis, a study of 391 patients who underwent paracentesis and 207 patients who underwent thoracentesis did not demonstrate bleeding with platelet counts of 50,000/L to 100,000/L.[33] However, no specific platelet transfusion threshold was identified by this retrospective single‐institution study.
SUMMARY
We summarize our recommendations in Table 2, recognizing that evidence is limited and many of these recommendations are based on expert opinion. The limited evidence highlights opportunity for hospitalist‐driven research in periprocedural blood product transfusion.
|
| RBC transfusion |
| Transfusion threshold of Hg <78 g/dL or symptomatic anemia in most hemodynamically stable hospitalized patients. |
| Transfusion threshold of Hg <8 g/dL or for symptomatic anemia in patients with underlying CV disease. |
| Optimal transfusion threshold is unknown in patients with acute coronary syndrome. |
| Frozen plasma transfusion |
| Insufficient evidence to support routine INR testing for low‐risk procedures in the absence of warfarin treatment or liver disease. |
| Transfusion may be considered prior to procedures with moderate to high bleeding risk when INR >1.5. |
| Insufficient evidence to guide transfusion practice prior to endoscopic procedures. |
| Platelet transfusion |
| Transfusion threshold of <20,000/L for low bleeding risk procedures, including central venous catheters. |
| Transfusion threshold of <50,000100,000/L for moderate bleeding risk procedures. |
| Transfusion threshold of <100,000/L for neurosurgical procedures. |
| Transfusion threshold of <50,000/L for therapeutic endoscopy and <20,000/L for low‐risk diagnostic endoscopy. |
ACKNOWLEDGEMENTS
Disclosures: Dr. Carson reports grants from the National Institutes of Health (NIH) during the conduct of the study, personal fees from Cerus Corporation, grants from Amgen, and grants from the NIH outside the submitted work.
- , , , . Report of the US Department of Health and Human Services. The 2009 national blood collection and utilization survey report. Washington, DC: US Department of Health and Human Services, Office of the Assistant Secretary for Health; 2011.
- , , , , . Where does blood go? Prospective observational study of red cell transfusion in north England. BMJ. 2002;325(7368):803.
- , , , et al. Effect of anaemia and cardiovascular disease on surgical mortality and morbidity. Lancet. 1996;348(9034):1055–1060.
- , , , . Mortality and morbidity in patients with very low postoperative Hb levels who decline blood transfusion. Transfusion. 2002;42(7):812–818.
- , , , et al. Human cardiovascular and metabolic response to acute, severe isovolemic anemia. JAMA. 1998;279(3):217–221.
- , , , et al. Electrocardiographic ST‐segment changes during acute, severe isovolemic hemodilution in humans. Anesthesiology. 2000;93(4):1004–1010.
- , , , et al. Acute severe isovolemic anemia impairs cognitive function and memory in humans. Anesthesiology. 2000;92(6):1646–1652.
- , , , , , . Fatigue during acute isovolemic anemia in healthy, resting humans. Transfusion. 2000;40(4):457–460.
- , , , et al. Preoperative hematocrit levels and postoperative outcomes in older patients undergoing noncardiac surgery. JAMA. 2007;297(22):2481–2488.
- , , , et al. Preoperative anaemia and postoperative outcomes in non‐cardiac surgery: a retrospective cohort study. Lancet. 2011;378(9800):1396–1407.
- , , . Transfusion thresholds and other strategies for guiding allogeneic red blood cell transfusion. Cochrane Database Syst Rev. 2012;4:CD002042.
- , , , et al. A multicenter, randomized, controlled clinical trial of transfusion requirements in critical care. Transfusion Requirements in Critical Care Investigators, Canadian Critical Care Trials Group. N Engl J Med. 1999;340(6):409–417.
- , , , et al. Is a low transfusion threshold safe in critically ill patients with cardiovascular diseases? Crit Care Med. 2001;29(2):227–234.
- , , , et al. Liberal or restrictive transfusion in high‐risk patients after hip surgery. N Engl J Med. 2011;365(26):2453–2462.
- , , , et al. Transfusion requirements after cardiac surgery: the TRACS randomized controlled trial. JAMA. 2010;304(14):1559–1567.
- , , , et al. Lowering the hemoglobin threshold for transfusion in coronary artery bypass procedures: effect on patient outcome. Transfusion. 1999;39(10):1070–1077.
- , , , et al. Transfusion strategies for acute upper gastrointestinal bleeding. N Engl J Med. 2013;368(1):11–21.
- , , , et al. Liberal versus restrictive transfusion thresholds for patients with symptomatic coronary artery disease. Am Heart J. 2013;165(6):964–971.
- , , , et al. Conservative versus liberal red cell transfusion in acute myocardial infarction (the CRIT Randomized Pilot Study). Am J Cardiol. 2011;108(8):1108–1111.
- , , , et al. Red blood cell transfusion: a clinical practice guideline from the AABB. Ann Intern Med. 2012;157(1):49–58.
- , . Is fresh frozen plasma overtransfused in the United States? Transfusion. 2004;44(11):1674–1675.
- , , , et al. The effect of plasma transfusion on morbidity and mortality: a systematic review and meta‐analysis. Transfusion. 2010;50(6):1370–1383.
- , . Why do physicians request fresh frozen plasma? Transfusion. 2004;44(9):1393–1394.
- . Predicting hemorrhage using preoperative coagulation screening assays. Curr Hematol Rep. 2004;3(5):324–330.
- , . Plasma transfusion for bedside, radiologically guided, and operating room invasive procedures. Transfusion. 2012;52(suppl 1):20S–29S.
- , ; Transfusion Medicine/Hemostasis Clinical Trials Network. Paucity of studies to support that abnormal coagulation test results predict bleeding in the setting of invasive procedures: an evidence‐based review. Transfusion. 2005;45(9):1413–1425.
- . Interpretation of the international normalised ratio in patients with liver disease. Lancet. 2002;359(9300):47–48.
- , , . Effect of fresh‐frozen plasma transfusion on prothrombin time and bleeding in patients with mild coagulation abnormalities. Transfusion. 2006;46(8):1279–1285.
- , . Toward rational fresh frozen plasma transfusion: The effect of plasma transfusion on coagulation test results. Am J Clin Pathol. 2006;126(1):133–139.
- , , , , . Is fresh‐frozen plasma clinically effective? An update of a systematic review of randomized controlled trials. Transfusion. 2012;52(8):1673–1686; quiz 1673.
- , , , et al. Evidence‐based practice guidelines for plasma transfusion. Transfusion. 2010;50(6):1227–1239.
- , , , et al. Consensus guidelines for periprocedural management of coagulation status and hemostasis risk in percutaneous image‐guided interventions. J Vasc Interv Radiol. 2012;23(6):727–736.
- , . Lack of increased bleeding after paracentesis and thoracentesis in patients with mild coagulation abnormalities. Transfusion. 1991;31(2):164–171.
- , . Central venous cannulation in patients with liver disease and coagulopathy—a prospective audit. Intensive Care Med. 1999;25(5):481–485.
- ASGE Standards of Practice Committee; , , , et al. Management of antithrombotic agents for endoscopic procedures. Gastrointest Endosc. 2009;70(6):1060–1070.
- , , , . New strategies for the optimal use of platelet transfusions. Hematology Am Soc Hematol Educ Program. 2008:198–204.
- , . Thrombocytopenia: mechanisms and management of defects in platelet production. Clin Haematol. 1978;7(3):523–539.
- , , . The quantitative relation between platelet count and hemorrhage in patients with acute leukemia. N Engl J Med. 1962;266:905–909.
- , , , et al. The threshold for prophylactic platelet transfusions in adults with acute myeloid leukemia. Gruppo Italiano Malattie Ematologiche Maligne dell'Adulto. N Engl J Med. 1997;337(26):1870–1875.
- , , , , , . Randomized study of prophylactic platelet transfusion threshold during induction therapy for adult acute leukemia: 10,000/microL versus 20,000/microL. J Clin Oncol. 1997;15(3):1143–1149.
- , , , et al. Safety and cost effectiveness of a 10 x 10(9)/L trigger for prophylactic platelet transfusions compared with the traditional 20 x 10(9)/L trigger: a prospective comparative trial in 105 patients with acute myeloid leukemia. Blood. 1998;91(10):3601–3606.
- , , , et al. A prospective randomized trial of prophylactic platelet transfusion and bleeding incidence in hematopoietic stem cell transplant recipients: 10,000/L versus 20,000/microL trigger. Biol Blood Marrow Transplant. 2002;8(10):569–576.
- . Evidence‐based platelet transfusion guidelines. Hematology Am Soc Hematol Educ Program. 2007:172–178.
- , , , et al. Prophylactic platelet transfusion for prevention of bleeding in patients with haematological disorders after chemotherapy and stem cell transplantation. Cochrane Database Syst Rev. 2012;5:CD004269.
- , , , et al. Indications for platelet transfusion in children with acute leukemia. Am J Hematol. 1982;12(4):347–356.
- , , , , . Platelet prophylaxis in acute non‐lymphoblastic leukaemia. Lancet. 1978;1(8058):267.
- , , , et al. A no‐prophylaxis platelet‐transfusion strategy for hematologic cancers. N Engl J Med. 2013;368(19):1771–1780.
- , . Transfusion in the operating room and the intensive care unit: current practice and future directions. Int Anesthesiol Clin. 2000;38(4):149–169.
- , , . The risk of spinal haematoma following neuraxial anaesthesia or lumbar puncture in thrombocytopenic individuals. Br J Haematol. 2010;148(1):15–25.
- , . Personal practice: how we manage the risk of bleeding and thrombosis in children and young adults with acute lymphoblastic leukaemia. Br J Haematol. 2011;152(5):505–511.
- , , , , . Safety of lumbar puncture for adults with acute leukemia and restrictive prophylactic platelet transfusion. Ann Hematol. 2003;82(9):570–573.
- , , , , . Optimal preprocedural platelet transfusion threshold for central venous catheter insertions in patients with thrombocytopenia. Transfusion. 2011;51(11):2269–2276.
- , , . Central venous catheter placement in patients with disorders of hemostasis. Chest. 1996;110(1):185–188.
- , , , , , . Central venous catheterization in patients with coagulopathy. Arch Surg. 1992;127(3):273–275.
When does benign shyness become social anxiety, a treatable disorder?
Since the appearance of social anxiety disorder (SAD) in the DSM-III in 1980, research on its prevalence, characteristics, and treatment have grown (Box 11,2). In addition to the name, the definition of SAD has changed over the years; as a result, its prevalence has increased in recent cohort studies. This has led to debate over whether the experience of shyness is being over-pathologized, or whether SAD has been underdiagnosed in earlier decades. Those who argue that shyness is being over-pathologized note that it is a normal human experience that has evolutionary functions (eg, preventing engagement in harmful social relationships3). Others argue that a high degree of shyness is not beneficial in terms of evolution because it causes the individual to be shunned, so to speak, by society.4
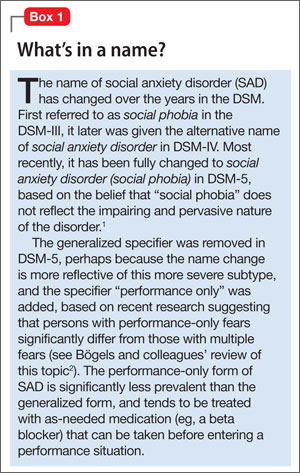
Why worry about ‘over-pathologizing’?
The medicalization of shyness might be a reflection of Western societal values of assertiveness and gregariousness; other societies that value modesty and reticence do not over-pathologize shyness.5 It is important not to assume that someone who is shy necessarily has a “pathologic” level of social anxiety, especially because some people who are shy view that condition as a positive quality, much like sensitivity and conscientiousness.5
The broader issue of what constitutes a mental disorder arises in this debate. A “disorder” is a socially constructed label that describes a set of symptoms occurring together and its associated behaviors, not a real entity with etiological homogeneity.6 Labeling emotional problems “disordered” assumes that happiness is the natural homeostatic state, and distressing emotional states are abnormal and need to be changed.7 A diagnostic label can help improve communication and understand maladaptive behaviors; if that label is reified, however, it can lead to assumptions that the etiology, course, and treatment response are known. Proponents of the diagnostic psychiatric nomenclature have acknowledged the dangers of over-pathologizing normal experiences of living (such as fear) by way of diagnostic labeling.8
Determining when shyness becomes a clinically significant problem—what we call SAD here—demands a delicate distinction that has important implications for treatment. On one hand, if shyness is over-pathologized, persons who neither desire nor need treatment might be subjected to unnecessary and costly intervention. On the other hand, if SAD is underdiagnosed, some persons will not receive treatment that might be beneficial to them.
In this article, we review the similarities and differences between shyness and SAD, and provide recommendations for determining when shyness becomes a more clinically significant problem. We also highlight the importance of this distinction as it pertains to management, and provide suggestions for treatment approaches.
SAD: Definition, prevalence
SAD is defined as a significant fear of embarrassment or humiliation in social or performance-based situations, to a point at which the affected person often avoids these situations or endures them only with a high level of distress9 (Table 1, and Box 2). SAD can be distinguished from other anxiety disorders based on the source and content of the fear (ie, the source being social interaction or performance situations, and the content being a fear that one will show a behavior that will cause embarrassment). SAD also should be distinguished from autism spectrum disorders, in which persons have limited social communication capabilities and inadequate age-appropriate social relationships.
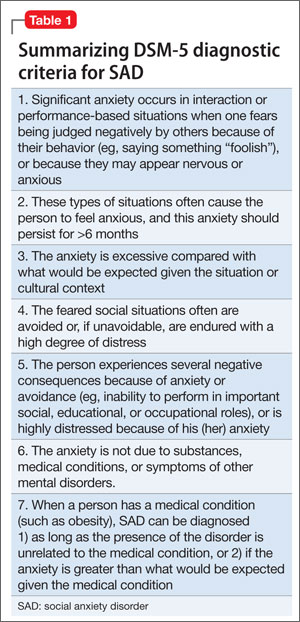
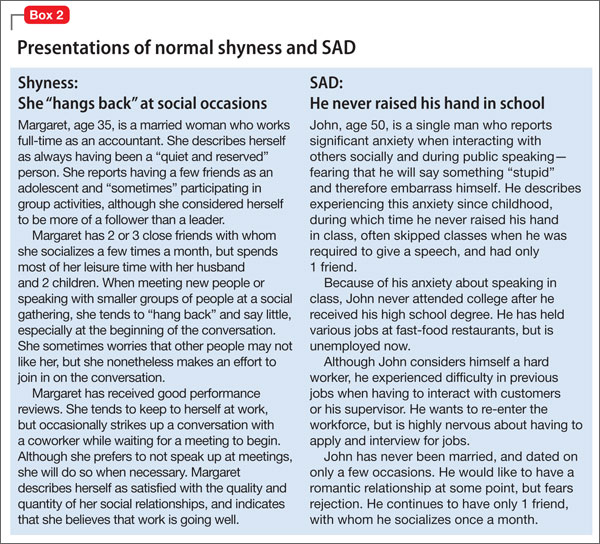
SAD is most highly comorbid with mood and anxiety disorders, with rates of at least 30% in clinical samples.10 The disorder also is highly comorbid with avoidant personality disorder—to a point at which it is argued that they are one and the same disorder.11
As with other psychiatric disorders, anxiety must cause significant impairment or distress. What constitutes significant impairment or distress is subjective, and the arbitrary nature of this criterion can influence estimates of the prevalence of SAD. For example, prevalence ranges as widely as 1.9% to 20.4% when different cut-offs are used for distress ratings and the number of impaired domains.12
The prevalence of SAD varies from 1 epidemiological study to another (ie, the Epidemiological Catchment Area [ECA] Study and the National Comorbidity Survey [NCS])—in part, a consequence of the differing definitions of significant impairment or distress. The ECA study assessed the clinical significance of each symptom in anxiety disorders; the NCS assessed overall clinical significance of the disorder. When the clinical significance criterion was applied at the symptom level to the NCS dataset (as was done in the ECA study), 1-year prevalence decreased by 50% (from 7.4% to 3.7%).13 The manner in which significant impairment or distress is defined (ie, conservatively or liberally) impacts whether social anxiety symptoms are classified as disordered or non-disordered.
Shyness: Definition, prevalence
Shyness often refers to 1) anxiety, inhibition, reticence, or a combination of these findings, in social and interpersonal situations, and 2) a fear of negative evaluation by others.14 It is a normal facet of personality that combines the experience of social anxiety and inhibited behavior,15 and also has been described as a stable temperament.16 Shyness is common; in the NCS study,17 26% of women and 19% of men characterized themselves as “very shy”; in the NCS Adolescent study,18 nearly 50% of adolescents self-identified as shy.
Persons who are shy tend to self-report greater social anxiety and embarrassment in social situations than non-shy persons do; they also might experience greater autonomic reactivity—especially blushing—in social or performance situations.15 Furthermore, shy persons are more likely to have axis I comorbidity and traits of introversion and neuroticism, compared with non-shy persons.14
Research suggests that temperament and behavioral inhibition are risk factors for mood and anxiety disorders, and appear to have a particularly strong relationship with SAD.19 A recent prospective study showed that shyness tends to increase steeply in toddlerhood, then stabilizes in childhood. Shyness in childhood—but not toddlerhood—is predictive of anxiety, depression, and poorer social skills in adolescence.20
A qualitative, or just quantitative, difference?
It is clear that SAD and shyness share several features—including anxiety and embarrassment—in social interactions. This raises a question: Are SAD and shyness distinct qualitatively, or do they represent points along a continuum, with SAD being an extreme form of shyness?
Continuum hypothesis. Support for the continuum hypothesis includes evidence that SAD and shyness share several features, including autonomic arousal, deficits in social skills (eg, aversion of gaze, difficulty initiating and maintaining conversation), avoidance of social situations, and fear of negative evaluation.21,22 In addition, both shyness and SAD are highly heritable,23 and mothers of shy children have a significantly higher rate of SAD than non-shy children do.24 No familial or genetic studies have compared heritability and familial aggregation in shyness and SAD.
According to the continuum hypothesis, if SAD is an extreme form of shyness, all (or nearly all) persons who have a diagnosis of SAD also would be characterized as shy. However, only approximately one-half of such persons report having been shy in childhood.17 Less than one-quarter of shy persons meet criteria for SAD.14,18 Because many persons who are shy do not meet criteria for SAD, and many who have SAD were not considered shy earlier in life, it has been suggested that this supports a qualitative distinction.
Qualitative distinctiveness. Despite having similarities, several features distinguish the experience of SAD from that of shyness. Compared with shyness, a SAD diagnosis is associated with:
- greater comorbidity
- greater severity of avoidance and impairment
- poorer quality of life.18,21,25
Studies that compared SAD, shyness without SAD, and non-shyness have shown that the shyness without SAD group more closely resembles the non-shy group than the SAD group—particularly with regard to impairment, presence of substance use, and other behavioral problems.18,25
Given the evidence, experts have concluded that shyness and a SAD diagnosis are overlapping yet different constructs that encapsulate qualitative and quantitative differences.25 There is a spectrum of shyness that ranges from a normative level to a higher level that overlaps the experience of SAD, but the 2 states represent different constructs.25
Guidance for making an assessment. Because of similarities in anxiety, embarrassment, and other symptoms in social situations, the best way to determine whether shyness crosses the line into a clinically significant problem is to assess the severity of the anxiety and associated degree of impairment and distress. More severe anxiety paired with distress about having anxiety and significant impairment in multiple areas of functioning might indicate more problematic social anxiety—a diagnosis of SAD—not just “normal” shyness.
It is important to take into account the environmental and cultural context of a patient’s distress and impairment because these features might fall within a normal range, given immediate circumstances (such as speaking in front of a large audience when one is not normally called on to do so, to a degree that does not interfere with general social functioning6).
What is considered a normative range depends on the developmental stage:
- Among children, a greater level of shyness might be considered more normative when it manifests during developmental stages in which separation anxiety appears.
- Among adolescents, a greater level of shyness might be considered normative especially during early adolescence (when social relationships become more important), and during times of transition (ie, entering high school).
- In adulthood, a greater level of normative shyness or social anxiety might be present during a major life change (eg, beginning to date again after the loss of a lengthy marriage or romantic relationship).
Assessment tools
Assessment tools can help you differentiate normal shyness from SAD. Several empirically-validated rating scales exist, including clinician-rated and self-report scales.
Liebowitz Social Anxiety Scale26 rates the severity of fear and avoidance in a variety of social interaction and performance-based situations. However, it was developed primarily as a clinician-rated scale and might be more burdensome to complete in practice. In addition, it does not provide cut-offs to indicate when more clinically significant anxiety might be likely.
Clinically Useful Social Anxiety Disorder Outcome Scale (CUSADOS)27 and Mini-Social Phobia Inventory (Mini-SPIN)28 are brief self-report scales that provide cut-offs to suggest further assessment is warranted. A cut-off score of 16 on the CUSADOS suggests the presence of SAD with 73% diagnostic efficiency.
One disadvantage to relying on a rating scale alone is the narrow focus on symptoms. Given that shyness and SAD share similar symptoms, it is necessary to assess the degree of impairment related to these symptoms to determine whether the problem is clinically significant. The overly narrow focus on symptoms utilized by the biomedical approach has been criticized for contributing to the medicalization of normal shyness.5
Diagnostic interviews, such as the Structured Clinical Interview for DSM-IV Axis I Disorders29 include sections on SAD that assess avoidance and impairment/distress associated with anxiety. Because these interviews may increase the time burden during an office visit, there are several general questions outside of a structured interview that you can ask, such as: “Has this anxiety interfered with your ability to initiate or maintain friendships? If so, how?” (Table 2). Persons with clinically significant social anxiety, rather than shyness, tend to report greater effects on their relationships and on work or school performance, as well as greater distress about having that anxiety.
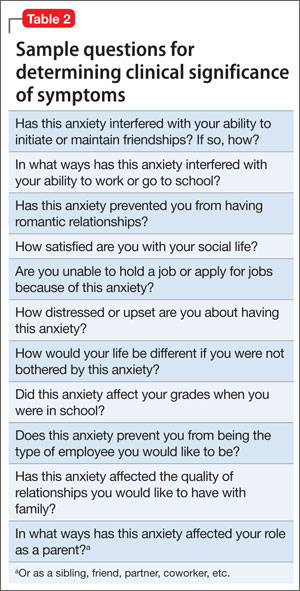
Treatment approaches based on distinctions
Exercise care in making the distinction between normal shyness and dysfunctional and impairing levels of anxiety characteristic of SAD, because persons who display normal shyness but who are overdiagnosed might feel stigmatized by a diagnostic label.5 Also, overpathologizing shyness takes what is a social problem out of context, and could promote treatment strategies that might not be helpful or effective.30
Unnecessary diagnosis might lead to unnecessary treatment, such as prescribing an antidepressant or benzodiazepine. Avoiding such a situation is important, because of the side effects associated with medication and the potential for dependence and withdrawal effects with benzodiazepines.
Persons who exhibit normal shyness do not require medical treatment and, often, do not want it. However, some people may be interested in improving their ability to function in social interactions. Self-help approaches or brief psychotherapy (eg, cognitive-behavioral therapy [CBT]) should be the first step—and might be all that is necessary.
The opposite side of the problem. Under-recognition of clinically significant social anxiety can lead to under-treatment, which is common even in patients with a SAD diagnosis.31 Treatment options include CBT, medication, and CBT combined with medication (Table 3):
- several studies have demonstrated the short- and long-term efficacy of CBT alone for SAD
- medication alone has been efficacious in the short-term, but less efficacious than CBT in the long-term
- combined treatment also has been shown to be more efficacious than CBT or medication alone in the short-term
- there is evidence to suggest that CBT alone is more efficacious in the long-term compared with combined treatment.a
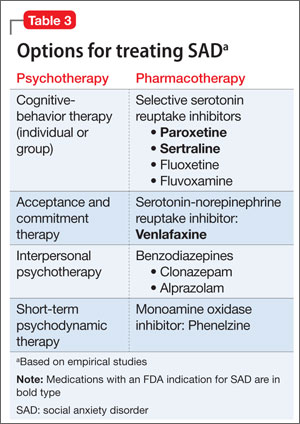
CBT is recommended as an appropriate first-line option, especially for mild and moderate SAD; it is the preferred initial treatment option of the United Kingdom’s National Institute for Health and Care Excellence (NICE). For more severe presentations (such as the presence of comorbidity) or when a patient did not respond to an adequate course of CBT, combined treatment might be an option—the goal being to taper the medication and continue CBT as a longer-term treatment. Research has shown that continuing CBT while discontinuing medication helps prevent relapse.32,33
Appropriate pharmacotherapy options include selective serotonin reuptake inhibitors and serotonin-norepinephrine reuptake inhibitors.34 Increasingly, benzodiazepines are considered less desirable; they are not recommended for routine use in SAD in the NICE guidelines. Those guidelines call for continuing pharmacotherapy for 6 months when a patient responds to treatment within 3 months, then discontinuing medication with the aid of CBT.
Bottom Line
The severity of anxiety and associated impairment and distress are the main variables that differentiate normal shyness and clinically significant social anxiety. Taking care not to over-pathologize normal shyness and common social anxiety concerns or underdiagnose severe, impairing social anxiety disorder has important implications for treatment—and for whether a patient needs treatment at all.
Related Resources
National Institute for Health and Care Excellence. Social anxiety disorder: recognition, assessment, and treatment of social anxiety disorder. http://guidance.nice.org.uk/cg159.
• Hofmann SG, DiBartolo PM, eds. Social anxiety: clinical, developmental, and social perspectives, 2nd ed. London, United Kingdom: Academic Press; 2010.
• The Shyness Institute. www.shyness.com.
Drug Brand Names
Alprazolam • Xanax Clonazepam • Klonopin Fluoxetine • Prozac
Fluvoxamine • Luvox Paroxetine • Paxil Phenelzine • Nardil
Sertraline • Zoloft Venlafaxine • Effexor
Disclosure
The authors report no financial relationships with any company whose products are mentioned in this article or with manufacturers of competing products.
Featured Audio
Kristy L. Dalrymple, PhD, discusses, treating social anxiety disorder. Dr. Dalrymple is Staff Psychologist, Department of Psychiatry, Rhode Island Hospital, and Assistant Professor of Psychiatry and Human Behavior, Alpert Medical School of Brown University, Providence, Rhode Island.
1. Bruce LC, Coles ME, Heimberg RG. Social phobia and social anxiety disorder: effect of disorder name on recommendation for treatment. Am J Psychiatry. 2012;169(5):538.
2. Bögels SM, Alden L, Beidel DC, et al. Social anxiety disorder: questions and answers for the DSM-V. Depress Anxiety. 2010;27:168-189.
3. Wakefield JC, Horwitz AV, Schmitz MF. Are we overpathologizing the socially anxious? Social phobia from a harmful dysfunction perspective. Can J Psychiatry. 2005;50(6):317-319.
4. Campbell-Sills L, Stein MB. Justifying the diagnostic status of social phobia: a reply to Wakefield, Horwitz, and Schmitz. Can J Psychiatry. 2005;50(6):320-323.
5. Scott S. The medicalisation of shyness: from social misfits to social fitness. Sociology of Health and Illness. 2006;28(2):133-153.
6. Wakefield JC. The DSM-5 debate over the bereavement exclusion: psychiatric diagnosis and the future of empirically supported treatment. Clin Psychol Rev. 2013; 33(7):825-845.
7. Hayes SC, Strosahl KD, Wilson KG. Acceptance and commitment therapy: the process and practice of mindful change. New York, NY: Guilford Press; 2012.
8. Kupfer DJ, First MB, Regier DA, eds. A research agenda for DSM-V. Washington, DC: American Psychiatric Association; 2002.
9. Diagnostic and statistical manual of mental disorders, 5th ed. Washington, DC: American Psychiatric Association; 2013.
10. Dalrymple KL, Zimmerman M. Does comorbid social anxiety disorder impact the clinical presentation of principal major depressive disorder? J Affect Disord. 2007;100:241-247.
11. Dalrymple KL. Issues and controversies surrounding the diagnosis and treatment of social anxiety disorder. Expert Rev Neurother. 2012;12(8):993-1008.
12. Furmark T, Tillfors M, Everz PO, et al. Social phobia in the general population: prevalence and sociodemographic profile. Soc Psychiatry Psychiatr Epidemiol. 1999;34:416-424.
13. Narrow WE, Rae DS, Robins LN, et al. Revised prevalence estimates of mental disorders in the United States: using a clinical significance criterion to reconcile 2 surveys’ estimates. Arch Gen Psychiatry. 2002;59:115-123.
14. Heiser NA, Turner SM, Beidel DC. Shyness: relationship to social phobia and other psychiatric disorders. Behav Res Ther. 2003;41:209-221.
15. Hofmann SG, Moscovitch DA, Hyo-Jin K. Autonomic correlates of social anxiety and embarrassment in shy and non-shy individuals. Int J Psychophysiology. 2006;61:134-142.
16. Kagan J. Temperamental contributions to affective and behavioral profiles in childhood. In: Hofmann SG, DiBartolo PM, eds. From social anxiety to social phobia: multiple perspectives. Needham Heights, MA: Allyn & Bacon; 2001:216-234.
17. Cox BJ, MacPherson PS, Enns MW. Psychiatric correlates of childhood shyness in a nationally representative sample. Behav Res Ther. 2005;43:1019-1027.
18. Burstein M, Ameli-Grillon L, Merikangas KR. Shyness versus social phobia in US youth. Pediatrics. 2011;128:917-925.
19. Hirshfeld-Becker DR, Micco J, Henin A, et al. Behavioral inhibition. Depress Anxiety. 2008;25:357-367.
20. Karevold E, Ystrom E, Coplan RJ, et al. A prospective longitudinal study of shyness from infancy to adolescence: stability, age-related changes, and prediction of socio-emotional functioning. J Abnorm Child Psychol. 2012; 40:1167-1177.
21. Chavira DA, Stein MB, Malcarne VL. Scrutinizing the relationship between shyness and social phobia. J Anxiety Disord. 2002;16:585-598.
22. Schneier FR, Blanco C, Antia SX, et al. The social anxiety spectrum. Psychiatr Clin N Am. 2002;25:757-774.
23. Stein MB, Chavira DA, Jang KL. Bringing up bashful baby: developmental pathways to social phobia. Psychiatr Clin N Am. 2001;24:797-818.
24. Cooper PJ, Eke M. Childhood shyness and maternal social phobia: a community study. Br J Psychiatry. 1999;174:439-443.
25. Heiser NA, Turner SM, Beidel DC, et al. Differentiating social phobia from shyness. J Anxiety Disord. 2009;23:469-476.
26. Liebowitz MR. Social phobia. Mod Probl Pharmacopsychiatry. 1987;22:141-173.
27. Dalrymple, KL, Martinez J, Tepe E, et al. A clinically useful social anxiety disorder outcome scale. Compr Psychiatry. 2013;54(7):758-765.
28. Connor KM, Kobak KA, Churchill LE, et al. Mini-SPIN: a brief screening assessment for generalized social anxiety disorder. Depress Anxiety. 2001;14(2):137-140.
29. First MB, Gibbon M, Spitzer RL, et al. Structured Clinical Interview for DSM-IV Axis II personality disorders (SCID-II). Washington, DC: American Psychiatric Press, Inc; 1997.
30. Conrad P. Medicalization and social control. Ann Rev Sociology. 1992;18:209-232.
31. Zimmerman M, Chelminski I. Clinician recognition of anxiety disorders in depressed outpatients. J Psychiatr Res. 2003;37:325-333.
32. Gelernter CS, Uhde TW, Cimbolic P, et al. Cognitive-behavioral and pharmacological treatments of social phobia: a controlled study. Arch Gen Psychiatry. 1991;48:938-945.
33. Otto MW, Smits JA, Reese HE. Cognitive-behavioral therapy for the treatment of anxiety disorders. J Clin Psychiatry. 2004;65(suppl 5):34-41.
34. Blanco C, Bragdon LB, Schneier FR, et al. The evidence-based pharmacotherapy of social anxiety disorder. Int J Neuropsychopharmacol. 2013;16:235-249.
Since the appearance of social anxiety disorder (SAD) in the DSM-III in 1980, research on its prevalence, characteristics, and treatment have grown (Box 11,2). In addition to the name, the definition of SAD has changed over the years; as a result, its prevalence has increased in recent cohort studies. This has led to debate over whether the experience of shyness is being over-pathologized, or whether SAD has been underdiagnosed in earlier decades. Those who argue that shyness is being over-pathologized note that it is a normal human experience that has evolutionary functions (eg, preventing engagement in harmful social relationships3). Others argue that a high degree of shyness is not beneficial in terms of evolution because it causes the individual to be shunned, so to speak, by society.4
Why worry about ‘over-pathologizing’?
The medicalization of shyness might be a reflection of Western societal values of assertiveness and gregariousness; other societies that value modesty and reticence do not over-pathologize shyness.5 It is important not to assume that someone who is shy necessarily has a “pathologic” level of social anxiety, especially because some people who are shy view that condition as a positive quality, much like sensitivity and conscientiousness.5
The broader issue of what constitutes a mental disorder arises in this debate. A “disorder” is a socially constructed label that describes a set of symptoms occurring together and its associated behaviors, not a real entity with etiological homogeneity.6 Labeling emotional problems “disordered” assumes that happiness is the natural homeostatic state, and distressing emotional states are abnormal and need to be changed.7 A diagnostic label can help improve communication and understand maladaptive behaviors; if that label is reified, however, it can lead to assumptions that the etiology, course, and treatment response are known. Proponents of the diagnostic psychiatric nomenclature have acknowledged the dangers of over-pathologizing normal experiences of living (such as fear) by way of diagnostic labeling.8
Determining when shyness becomes a clinically significant problem—what we call SAD here—demands a delicate distinction that has important implications for treatment. On one hand, if shyness is over-pathologized, persons who neither desire nor need treatment might be subjected to unnecessary and costly intervention. On the other hand, if SAD is underdiagnosed, some persons will not receive treatment that might be beneficial to them.
In this article, we review the similarities and differences between shyness and SAD, and provide recommendations for determining when shyness becomes a more clinically significant problem. We also highlight the importance of this distinction as it pertains to management, and provide suggestions for treatment approaches.
SAD: Definition, prevalence
SAD is defined as a significant fear of embarrassment or humiliation in social or performance-based situations, to a point at which the affected person often avoids these situations or endures them only with a high level of distress9 (Table 1, and Box 2). SAD can be distinguished from other anxiety disorders based on the source and content of the fear (ie, the source being social interaction or performance situations, and the content being a fear that one will show a behavior that will cause embarrassment). SAD also should be distinguished from autism spectrum disorders, in which persons have limited social communication capabilities and inadequate age-appropriate social relationships.
SAD is most highly comorbid with mood and anxiety disorders, with rates of at least 30% in clinical samples.10 The disorder also is highly comorbid with avoidant personality disorder—to a point at which it is argued that they are one and the same disorder.11
As with other psychiatric disorders, anxiety must cause significant impairment or distress. What constitutes significant impairment or distress is subjective, and the arbitrary nature of this criterion can influence estimates of the prevalence of SAD. For example, prevalence ranges as widely as 1.9% to 20.4% when different cut-offs are used for distress ratings and the number of impaired domains.12
The prevalence of SAD varies from 1 epidemiological study to another (ie, the Epidemiological Catchment Area [ECA] Study and the National Comorbidity Survey [NCS])—in part, a consequence of the differing definitions of significant impairment or distress. The ECA study assessed the clinical significance of each symptom in anxiety disorders; the NCS assessed overall clinical significance of the disorder. When the clinical significance criterion was applied at the symptom level to the NCS dataset (as was done in the ECA study), 1-year prevalence decreased by 50% (from 7.4% to 3.7%).13 The manner in which significant impairment or distress is defined (ie, conservatively or liberally) impacts whether social anxiety symptoms are classified as disordered or non-disordered.
Shyness: Definition, prevalence
Shyness often refers to 1) anxiety, inhibition, reticence, or a combination of these findings, in social and interpersonal situations, and 2) a fear of negative evaluation by others.14 It is a normal facet of personality that combines the experience of social anxiety and inhibited behavior,15 and also has been described as a stable temperament.16 Shyness is common; in the NCS study,17 26% of women and 19% of men characterized themselves as “very shy”; in the NCS Adolescent study,18 nearly 50% of adolescents self-identified as shy.
Persons who are shy tend to self-report greater social anxiety and embarrassment in social situations than non-shy persons do; they also might experience greater autonomic reactivity—especially blushing—in social or performance situations.15 Furthermore, shy persons are more likely to have axis I comorbidity and traits of introversion and neuroticism, compared with non-shy persons.14
Research suggests that temperament and behavioral inhibition are risk factors for mood and anxiety disorders, and appear to have a particularly strong relationship with SAD.19 A recent prospective study showed that shyness tends to increase steeply in toddlerhood, then stabilizes in childhood. Shyness in childhood—but not toddlerhood—is predictive of anxiety, depression, and poorer social skills in adolescence.20
A qualitative, or just quantitative, difference?
It is clear that SAD and shyness share several features—including anxiety and embarrassment—in social interactions. This raises a question: Are SAD and shyness distinct qualitatively, or do they represent points along a continuum, with SAD being an extreme form of shyness?
Continuum hypothesis. Support for the continuum hypothesis includes evidence that SAD and shyness share several features, including autonomic arousal, deficits in social skills (eg, aversion of gaze, difficulty initiating and maintaining conversation), avoidance of social situations, and fear of negative evaluation.21,22 In addition, both shyness and SAD are highly heritable,23 and mothers of shy children have a significantly higher rate of SAD than non-shy children do.24 No familial or genetic studies have compared heritability and familial aggregation in shyness and SAD.
According to the continuum hypothesis, if SAD is an extreme form of shyness, all (or nearly all) persons who have a diagnosis of SAD also would be characterized as shy. However, only approximately one-half of such persons report having been shy in childhood.17 Less than one-quarter of shy persons meet criteria for SAD.14,18 Because many persons who are shy do not meet criteria for SAD, and many who have SAD were not considered shy earlier in life, it has been suggested that this supports a qualitative distinction.
Qualitative distinctiveness. Despite having similarities, several features distinguish the experience of SAD from that of shyness. Compared with shyness, a SAD diagnosis is associated with:
- greater comorbidity
- greater severity of avoidance and impairment
- poorer quality of life.18,21,25
Studies that compared SAD, shyness without SAD, and non-shyness have shown that the shyness without SAD group more closely resembles the non-shy group than the SAD group—particularly with regard to impairment, presence of substance use, and other behavioral problems.18,25
Given the evidence, experts have concluded that shyness and a SAD diagnosis are overlapping yet different constructs that encapsulate qualitative and quantitative differences.25 There is a spectrum of shyness that ranges from a normative level to a higher level that overlaps the experience of SAD, but the 2 states represent different constructs.25
Guidance for making an assessment. Because of similarities in anxiety, embarrassment, and other symptoms in social situations, the best way to determine whether shyness crosses the line into a clinically significant problem is to assess the severity of the anxiety and associated degree of impairment and distress. More severe anxiety paired with distress about having anxiety and significant impairment in multiple areas of functioning might indicate more problematic social anxiety—a diagnosis of SAD—not just “normal” shyness.
It is important to take into account the environmental and cultural context of a patient’s distress and impairment because these features might fall within a normal range, given immediate circumstances (such as speaking in front of a large audience when one is not normally called on to do so, to a degree that does not interfere with general social functioning6).
What is considered a normative range depends on the developmental stage:
- Among children, a greater level of shyness might be considered more normative when it manifests during developmental stages in which separation anxiety appears.
- Among adolescents, a greater level of shyness might be considered normative especially during early adolescence (when social relationships become more important), and during times of transition (ie, entering high school).
- In adulthood, a greater level of normative shyness or social anxiety might be present during a major life change (eg, beginning to date again after the loss of a lengthy marriage or romantic relationship).
Assessment tools
Assessment tools can help you differentiate normal shyness from SAD. Several empirically-validated rating scales exist, including clinician-rated and self-report scales.
Liebowitz Social Anxiety Scale26 rates the severity of fear and avoidance in a variety of social interaction and performance-based situations. However, it was developed primarily as a clinician-rated scale and might be more burdensome to complete in practice. In addition, it does not provide cut-offs to indicate when more clinically significant anxiety might be likely.
Clinically Useful Social Anxiety Disorder Outcome Scale (CUSADOS)27 and Mini-Social Phobia Inventory (Mini-SPIN)28 are brief self-report scales that provide cut-offs to suggest further assessment is warranted. A cut-off score of 16 on the CUSADOS suggests the presence of SAD with 73% diagnostic efficiency.
One disadvantage to relying on a rating scale alone is the narrow focus on symptoms. Given that shyness and SAD share similar symptoms, it is necessary to assess the degree of impairment related to these symptoms to determine whether the problem is clinically significant. The overly narrow focus on symptoms utilized by the biomedical approach has been criticized for contributing to the medicalization of normal shyness.5
Diagnostic interviews, such as the Structured Clinical Interview for DSM-IV Axis I Disorders29 include sections on SAD that assess avoidance and impairment/distress associated with anxiety. Because these interviews may increase the time burden during an office visit, there are several general questions outside of a structured interview that you can ask, such as: “Has this anxiety interfered with your ability to initiate or maintain friendships? If so, how?” (Table 2). Persons with clinically significant social anxiety, rather than shyness, tend to report greater effects on their relationships and on work or school performance, as well as greater distress about having that anxiety.
Treatment approaches based on distinctions
Exercise care in making the distinction between normal shyness and dysfunctional and impairing levels of anxiety characteristic of SAD, because persons who display normal shyness but who are overdiagnosed might feel stigmatized by a diagnostic label.5 Also, overpathologizing shyness takes what is a social problem out of context, and could promote treatment strategies that might not be helpful or effective.30
Unnecessary diagnosis might lead to unnecessary treatment, such as prescribing an antidepressant or benzodiazepine. Avoiding such a situation is important, because of the side effects associated with medication and the potential for dependence and withdrawal effects with benzodiazepines.
Persons who exhibit normal shyness do not require medical treatment and, often, do not want it. However, some people may be interested in improving their ability to function in social interactions. Self-help approaches or brief psychotherapy (eg, cognitive-behavioral therapy [CBT]) should be the first step—and might be all that is necessary.
The opposite side of the problem. Under-recognition of clinically significant social anxiety can lead to under-treatment, which is common even in patients with a SAD diagnosis.31 Treatment options include CBT, medication, and CBT combined with medication (Table 3):
- several studies have demonstrated the short- and long-term efficacy of CBT alone for SAD
- medication alone has been efficacious in the short-term, but less efficacious than CBT in the long-term
- combined treatment also has been shown to be more efficacious than CBT or medication alone in the short-term
- there is evidence to suggest that CBT alone is more efficacious in the long-term compared with combined treatment.a
CBT is recommended as an appropriate first-line option, especially for mild and moderate SAD; it is the preferred initial treatment option of the United Kingdom’s National Institute for Health and Care Excellence (NICE). For more severe presentations (such as the presence of comorbidity) or when a patient did not respond to an adequate course of CBT, combined treatment might be an option—the goal being to taper the medication and continue CBT as a longer-term treatment. Research has shown that continuing CBT while discontinuing medication helps prevent relapse.32,33
Appropriate pharmacotherapy options include selective serotonin reuptake inhibitors and serotonin-norepinephrine reuptake inhibitors.34 Increasingly, benzodiazepines are considered less desirable; they are not recommended for routine use in SAD in the NICE guidelines. Those guidelines call for continuing pharmacotherapy for 6 months when a patient responds to treatment within 3 months, then discontinuing medication with the aid of CBT.
Bottom Line
The severity of anxiety and associated impairment and distress are the main variables that differentiate normal shyness and clinically significant social anxiety. Taking care not to over-pathologize normal shyness and common social anxiety concerns or underdiagnose severe, impairing social anxiety disorder has important implications for treatment—and for whether a patient needs treatment at all.
Related Resources
National Institute for Health and Care Excellence. Social anxiety disorder: recognition, assessment, and treatment of social anxiety disorder. http://guidance.nice.org.uk/cg159.
• Hofmann SG, DiBartolo PM, eds. Social anxiety: clinical, developmental, and social perspectives, 2nd ed. London, United Kingdom: Academic Press; 2010.
• The Shyness Institute. www.shyness.com.
Drug Brand Names
Alprazolam • Xanax Clonazepam • Klonopin Fluoxetine • Prozac
Fluvoxamine • Luvox Paroxetine • Paxil Phenelzine • Nardil
Sertraline • Zoloft Venlafaxine • Effexor
Disclosure
The authors report no financial relationships with any company whose products are mentioned in this article or with manufacturers of competing products.
Featured Audio
Kristy L. Dalrymple, PhD, discusses, treating social anxiety disorder. Dr. Dalrymple is Staff Psychologist, Department of Psychiatry, Rhode Island Hospital, and Assistant Professor of Psychiatry and Human Behavior, Alpert Medical School of Brown University, Providence, Rhode Island.
1. Bruce LC, Coles ME, Heimberg RG. Social phobia and social anxiety disorder: effect of disorder name on recommendation for treatment. Am J Psychiatry. 2012;169(5):538.
2. Bögels SM, Alden L, Beidel DC, et al. Social anxiety disorder: questions and answers for the DSM-V. Depress Anxiety. 2010;27:168-189.
3. Wakefield JC, Horwitz AV, Schmitz MF. Are we overpathologizing the socially anxious? Social phobia from a harmful dysfunction perspective. Can J Psychiatry. 2005;50(6):317-319.
4. Campbell-Sills L, Stein MB. Justifying the diagnostic status of social phobia: a reply to Wakefield, Horwitz, and Schmitz. Can J Psychiatry. 2005;50(6):320-323.
5. Scott S. The medicalisation of shyness: from social misfits to social fitness. Sociology of Health and Illness. 2006;28(2):133-153.
6. Wakefield JC. The DSM-5 debate over the bereavement exclusion: psychiatric diagnosis and the future of empirically supported treatment. Clin Psychol Rev. 2013; 33(7):825-845.
7. Hayes SC, Strosahl KD, Wilson KG. Acceptance and commitment therapy: the process and practice of mindful change. New York, NY: Guilford Press; 2012.
8. Kupfer DJ, First MB, Regier DA, eds. A research agenda for DSM-V. Washington, DC: American Psychiatric Association; 2002.
9. Diagnostic and statistical manual of mental disorders, 5th ed. Washington, DC: American Psychiatric Association; 2013.
10. Dalrymple KL, Zimmerman M. Does comorbid social anxiety disorder impact the clinical presentation of principal major depressive disorder? J Affect Disord. 2007;100:241-247.
11. Dalrymple KL. Issues and controversies surrounding the diagnosis and treatment of social anxiety disorder. Expert Rev Neurother. 2012;12(8):993-1008.
12. Furmark T, Tillfors M, Everz PO, et al. Social phobia in the general population: prevalence and sociodemographic profile. Soc Psychiatry Psychiatr Epidemiol. 1999;34:416-424.
13. Narrow WE, Rae DS, Robins LN, et al. Revised prevalence estimates of mental disorders in the United States: using a clinical significance criterion to reconcile 2 surveys’ estimates. Arch Gen Psychiatry. 2002;59:115-123.
14. Heiser NA, Turner SM, Beidel DC. Shyness: relationship to social phobia and other psychiatric disorders. Behav Res Ther. 2003;41:209-221.
15. Hofmann SG, Moscovitch DA, Hyo-Jin K. Autonomic correlates of social anxiety and embarrassment in shy and non-shy individuals. Int J Psychophysiology. 2006;61:134-142.
16. Kagan J. Temperamental contributions to affective and behavioral profiles in childhood. In: Hofmann SG, DiBartolo PM, eds. From social anxiety to social phobia: multiple perspectives. Needham Heights, MA: Allyn & Bacon; 2001:216-234.
17. Cox BJ, MacPherson PS, Enns MW. Psychiatric correlates of childhood shyness in a nationally representative sample. Behav Res Ther. 2005;43:1019-1027.
18. Burstein M, Ameli-Grillon L, Merikangas KR. Shyness versus social phobia in US youth. Pediatrics. 2011;128:917-925.
19. Hirshfeld-Becker DR, Micco J, Henin A, et al. Behavioral inhibition. Depress Anxiety. 2008;25:357-367.
20. Karevold E, Ystrom E, Coplan RJ, et al. A prospective longitudinal study of shyness from infancy to adolescence: stability, age-related changes, and prediction of socio-emotional functioning. J Abnorm Child Psychol. 2012; 40:1167-1177.
21. Chavira DA, Stein MB, Malcarne VL. Scrutinizing the relationship between shyness and social phobia. J Anxiety Disord. 2002;16:585-598.
22. Schneier FR, Blanco C, Antia SX, et al. The social anxiety spectrum. Psychiatr Clin N Am. 2002;25:757-774.
23. Stein MB, Chavira DA, Jang KL. Bringing up bashful baby: developmental pathways to social phobia. Psychiatr Clin N Am. 2001;24:797-818.
24. Cooper PJ, Eke M. Childhood shyness and maternal social phobia: a community study. Br J Psychiatry. 1999;174:439-443.
25. Heiser NA, Turner SM, Beidel DC, et al. Differentiating social phobia from shyness. J Anxiety Disord. 2009;23:469-476.
26. Liebowitz MR. Social phobia. Mod Probl Pharmacopsychiatry. 1987;22:141-173.
27. Dalrymple, KL, Martinez J, Tepe E, et al. A clinically useful social anxiety disorder outcome scale. Compr Psychiatry. 2013;54(7):758-765.
28. Connor KM, Kobak KA, Churchill LE, et al. Mini-SPIN: a brief screening assessment for generalized social anxiety disorder. Depress Anxiety. 2001;14(2):137-140.
29. First MB, Gibbon M, Spitzer RL, et al. Structured Clinical Interview for DSM-IV Axis II personality disorders (SCID-II). Washington, DC: American Psychiatric Press, Inc; 1997.
30. Conrad P. Medicalization and social control. Ann Rev Sociology. 1992;18:209-232.
31. Zimmerman M, Chelminski I. Clinician recognition of anxiety disorders in depressed outpatients. J Psychiatr Res. 2003;37:325-333.
32. Gelernter CS, Uhde TW, Cimbolic P, et al. Cognitive-behavioral and pharmacological treatments of social phobia: a controlled study. Arch Gen Psychiatry. 1991;48:938-945.
33. Otto MW, Smits JA, Reese HE. Cognitive-behavioral therapy for the treatment of anxiety disorders. J Clin Psychiatry. 2004;65(suppl 5):34-41.
34. Blanco C, Bragdon LB, Schneier FR, et al. The evidence-based pharmacotherapy of social anxiety disorder. Int J Neuropsychopharmacol. 2013;16:235-249.

Overcoming medication nonadherence in schizophrenia: Strategies that can reduce harm
Medication nonadherence is a common problem when treating patients with schizophrenia that can worsen prognosis and lead to sub-optimal treatment outcomes. In this article, we discuss common reasons for nonadherence and describe evidence-based treatments intended to increase adherence and improve outcomes (Box).1-6
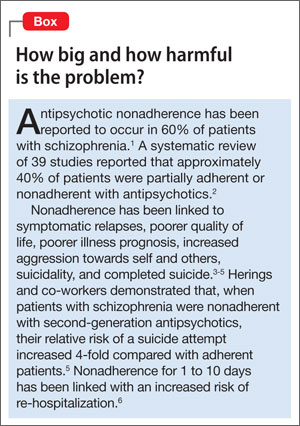
Common reasons for nonadherence
The primary predictor of future nonadherence is a history of nonadherence. It is important to understand patients’ reasons for nonadherence so that practical and evidence-based solutions can be implemented into the treatment plans of individual patients.
The 2009 Expert Consensus Guidelines on Adherence Problems in Patients with Serious and Persistent Mental Illness divided variables related to nonadherence into 3 categories:
- those that lie within the patient (intrinsic)
- those that are related to the patient’s relationship with healthcare providers, family, or caregivers (extrinsic)
- those that are related to the healthcare delivery system (extrinsic).7
Among intrinsic variables, studies have shown a correlation between nonadherence and education level, lower socioeconomic status, homelessness, and male sex.7 (The Expert Consensus Guidelines considered homelessness to be an intrinsic factor because it was used as a demographic variable in the studies.)
Cognitive and negative symptoms associated with schizophrenia are an intrinsic risk factor for nonadherence because patients might not remember when or how to take medication.7 In a study by Freudenreich and co-workers8 of 81 outpatients who had a diagnosis of schizophrenia, the presence of negative symptoms predicted a negative attitude toward psychotropic medications. Poor insight might be the result of cognitive dysfunction associated with schizophrenia, and often is due to a lack of awareness of the importance of taking medications.
Limited insight into the need for treatment can be problematic early in the course of the illness when it may be directly related to positive symptoms. Perkins and colleagues9 demonstrated that patients recovering from a first psychotic episode who had limited insight into their illness and lacked desire to seek treatment were less adherent with medication. In another study, 5% of psychiatrists surveyed thought that many of their patients with schizophrenia were nonadherent because those patients did not believe that medications were effective or useful.10
Comorbid substance abuse disorders can contribute to medication nonadherence. In an analysis of 6,731 patients with schizophrenia, Novick and co-workers reported that alcohol dependence and substance abuse in the previous month predicted medication nonadherence.11 Hunt and colleagues demonstrated that, among 99 nonadherent patients with schizophrenia, time to first readmission was shorter for patients with comorbid substance abuse disorders compared with patients who had a diagnosis of schizophrenia only. Over the 4-year study period, the 28 patients who had a dual diagnosis (schizophrenia and substance abuse) accounted for 57% of all hospital readmissions.12
Several variables that affect medication adherence are related to the patient’s relationship with healthcare providers, family, caregivers, and the service delivery system.7 These include:
- the perceived stigma of being given a diagnosis of a serious mental illness
- adverse effects related to medications
- poor social and family support
- difficulty gaining access to mental health services.7,10
Societal stigma associated with seeking treatment from a mental health professional may contribute to nonadherence in some patients. In 1 study,13 36% of people surveyed would not want to work closely with a person who has a serious mental illness.
Adverse effects contribute significantly to nonadherence
Limited treatment options (which may be expensive) can make it difficult to manage the adverse effects of antipsychotics. In a cross-sectional survey of 876 patients, investigators reported that: 1) <50% of patients were adherent with medication, and 2) 80% experienced ≥1 side effect that was reported to be “somewhat bothersome” in self-ratings (Table 1).14 Extrapyramidal symptoms (EPS) and agitation were most strongly associated with nonadherence; weight gain, akathisia, and sexual dysfunction also were associated with nonadherence.14 This study did not distinguish adverse effects associated with first-generation antipsychotics (FGAs) from those associated with second-generation antipsychotics (SGAs), even though 71.7% of patients studied were taking an SGA.
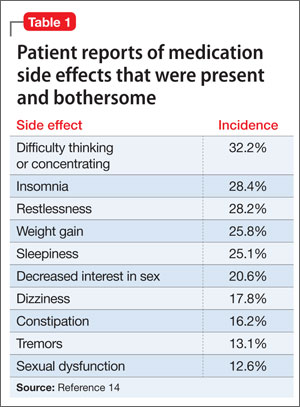
A meta-analysis by Leucht and co-workers15 compared 15 antipsychotics (the FGAs haloperidol and chlorpromazine and 13 SGAs) for efficacy and tolerability in schizophrenia. Haloperidol had the highest rate of discontinuation for any 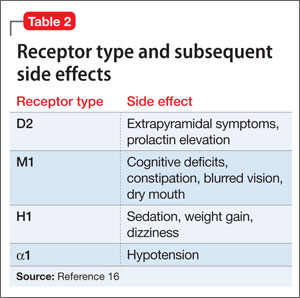
Antipsychotic binding affinities to dopamine 2 (D2), serotonin 2A (5-HT2A), histamine (H1), and other receptors have an impact on a medication’s side-effect profile. Because of individual patient characteristics, you might be faced with choosing a medication that has a lower risk of EPS but a higher risk of weight gain and metabolic complications—or the inverse. Understanding binding affinities, side-effect profiles, and how to minimize or utilize adverse effects (ie, giving a drug that is approved to treat schizophrenia and is associated with weight gain to a patient with schizophrenia who has lost weight) may lead to greater adherence (Table 216 and Table 317).
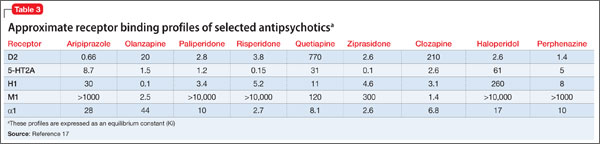
Adequate support is essential
The therapeutic alliance plays a key role in patients’ attitudes toward taking medication. Magura and colleagues18 found that one-third of psychiatric patients (13% of whom had a diagnosis of schizophrenia) reported that their psychiatrist did not spend enough time with them explaining side effects, and felt “rushed.”
Patients with schizophrenia often require access to social support systems provided by family members, friends, and community agencies that provide case management and attendant care services. Patients who are adherent to medication tend to have greater perceived family involvement in medication treatment, and tend to have been raised in a family that had more of a positive attitude toward medication.19
In our practice, we have observed that recent state and federal budget cuts have resulted in patients having greater difficulty gaining access to case management and attendant care services, which then leads to increased rates of medication nonadherence. Be aware that variables such as limited office hours, financial hardship, and cultural and language barriers can compromise a patient’s ability to seek and continue care.
In the following section, we lay out techniques for improving adherence in patients with schizophrenia.
Employ general and specific strategies to boost adherence
How can you raise medication adherence concerns with patients, keeping in mind that they often overestimate their adherence?
Ask. Some clinicians ask questions such as “Are you taking your medication?”, although a more effective approach might be to ask how the patient is taking his (her) medication. Asking questions such as “When do you take your medication?” and “In the past week, how many doses do you think you missed?” might be more effective ways to inquire about adherence.7
The Expert Consensus Guidelines recommend asking patients about medication adherence monthly for those who are stable, doing well, and believed to be adherent. For those who are new to a practice or who are not doing well, inquire about medication adherence at least weekly.7
In our practice, patients who are unstable but do not require inpatient hospitalization typically are seen more often in the clinic, or are referred to intensive outpatient or partial hospitalization programs. If an unstable patient is unable to come in for more frequent appointments, we arrange phone conferences between her and her provider. If a patient is not doing well and has a case manager, we often ask that case manager to visit the patient, in person, more often than he (she) would otherwise.
Take a nonjudgmental approach when raising these issues with patients. Questions such as “We all forget to take our medication sometimes; do you?” help to normalize nonadherence, and improve the therapeutic alliance, and might result in the patient being more honest with the clinician.7 Because patients may be apprehensive about discussing adverse events, clinicians must be proactive about improving the therapeutic alliance and making patients feel comfortable when discussing sensitive topics. Clinicians should try to convey the idea that, although adherence is a concern, so is quality of life. A clinicians’ willingness to take a flexible approach that is nonpunitive nor authoritarian can aid the therapeutic alliance and improve overall adherence.
Be sensitive to financial, cultural, and language variables that can affect access to care. The Expert Consensus Guidelines recommend asking patients if they can afford their medication. In our practice, we have seen patients with schizophrenia discharged from the hospital only to be readmitted 1 month later because they could not afford to fill their prescriptions.
It is important to have translation services available, in person or by phone, for patients who do not speak English. Furthermore, it is important to understand the limitations that your practice might place on access to care. Ask patients if they have ever had trouble making an appointment when they needed to be seen, or if they called the office with a question and did not receive an answer in a timely fashion; doing so allows you to assess the practice’s ability to meet patients’ needs and helps you build a therapeutic alliance.
Make objective assessments. It is important for practitioners to not base their assessment of medication adherence solely on subjective findings. Asking patients to bring in their medication bottles for pill counts and checking with the patients’ pharmacies for information about refill frequency can provide some objective data. Electronic monitoring systems use microprocessors inserted into bottle caps to record the occurrence and timing of each bottle opening. Studies show that these electronic monitoring systems are the gold standard for determining medication adherence and could be used in cases where it is unclear if the patient is taking his (her) medication.7,20 Such systems have successfully monitored medication adherence in clinical trials, but their use in clinical practice is complicated by ethical and legal considerations and cost issues.
Simplify the regimen. Using medications with once-daily dosing, for example, can help improve adherence. Pfeiffer and co-workers21 found that patients whose medication regimens were changed from once daily to more than once daily experienced a decrease in medication adherence. Conversely, a decrease in dosing frequency was significantly associated with improved adherence. More than once-daily dosing was only weakly associated with poorer adherence among patients already on a stable regimen.
Discussing positive and negative aspects of past medication trials with a patient and inquiring if she prefers a specific medication can be an effective way to build the therapeutic relationship and help with adherence.
Direct patients to psychosocial interventions. These can be broadly classified as:
- educational approaches
- group therapy approaches
- family interventions
- cognitive treatments
- combination approaches.
Psychoeducational approaches have limited effect on improving adherence when delivered to individual patients. However, 1 study showed that psychoeducation was effective at improving adherence when extended to include the patient’s family.22
Motivational interviewing techniques, behavioral approaches, and family interventions are effective at increasing medication adherence. One study looked at the value of training a patient-identified informant to supervise and administer medication. This person, usually a family member or close support, was responsible for obtaining medication from the pharmacy, administering the medication, and recording adherence. After 1 year, 67% of patients who used an informant were adherent, compared with only 45% in the group that did not have informant support.22 Case managers, attendant care workers, home health nurses, and assertive community treatment (ACT) teams also can participate in this manner; it is important, therefore, for you to be aware of the resources available in your community and to understand your role as patient advocate.
Substance abuse is a strong risk factor for nonadherence among patients with schizophrenia,18 which makes it important to assess patients for substance use and encourage those who do abuse to seek treatment. Although 1 study showed no correlation between Alcoholics Anonymous (AA) attendance and medication adherence,12 many AA and Narcotics Anonymous groups do not discuss psychiatric medications during group meetings. Magura and colleagues encouraged the use of “dual focus” groups that involve mental health professionals and addiction treatment specialists discussing mental health and substance abuse issues at the same setting.18
Prescribe long-acting injectable antipsychotics. Typically, long-acting injectable antipsychotics (LAIs) are reserved for patients who have a history of nonadherence. In a small study (N = 97) comparing LAI risperidone and oral risperidone or oral haloperidol, patients treated with an LAI had significantly fewer all-cause discontinuations (26.0%, compared with 70.2%) at 24 months.23 The Adherence to Treatment and Therapeutic Strategies in Schizophrenic Patients study examined 1,848 patients with schizophrenia and reached similar findings regarding LAI antipsychotics.24 (Note: Aripiprazole, fluphenazine, haloperidol, olanzapine, and paliperidone also are available in an LAI formulation.)
Bottom Line
Antipsychotic nonadherence in schizophrenia is a major problem for patients, families, and society. Being able to identify patients at risk for nonadherence, understanding the reasons for their nonadherence, and seeking practical solutions to the problem are all the responsibility of the treating physician. Psychoeducation, addressing substance abuse, modifying dosing, and using long-acting injectable antipsychotics may help improve adherence.
Related Resources
- Velligan DI, Weiden PJ, Sajatovic M, et al; Expert Consensus Panel on Adherence Problems in Serious and Persistent Mental Illness. Assessment of adherence problems in patients with serious and persistent mental illness: recommendations from the Expert Consensus Guidelines. J Clin Psychiatry. 2009;70(suppl 4):1-46.
- National Alliance on Mental Illness. www.nami.org.
- Assertive Community Treatment (ACT) Organization. www.actassociation.org.
Drug Brand Names
Aripiprazole • Abilify Chlorpromazine • Thorazine Clozapine • Clozaril Fluphenazine • Permitil Haloperidol • Haldol Iloperidone • Fanapt Olanzapine • Zyprexa Paliperidone • Invega Perphenazine • Trilafon Quetiapine • Seroquel Risperidone • Risperdal Ziprasidone • Geodon
Disclosures
Dr. Macaluso has been the principal investigator for clinical trials for AbbVie, Eisai, Envivo, Janssen, Naurex, and Pfizer. All clinical trial and study contracts and payments were made through the Kansas University Medical Center Research Institute. Dr. McKnight reports no financial relationship with any company whose products are mentioned in this article or with manufacturers of competing products.
1. Sun SX, Liu GG, Christensen DB, et al. Review and analysis of hospitalization costs associated with antipsychotic nonadherence in the treatment of schizophrenia in the United States. Curr Med Res Opin. 2007;23:2305-2312.
2. Lacro JP, Dunn LB, Dolder CR, et al. Prevalence of and risk factors for medication nonadherence in patients with schizophrenia: a comprehensive review of recent literature. J Clin Psychiatry. 2002;63:892-909.
3. Fenton WS, Blyler CR, Heinssen RK. Determinants of medication compliance in schizophrenia: empirical and clinical findings. Schizophr Bull. 1997;23(4):637-651.
4. Olfson M, Mechanic D, Hansell S, et al. Predicting medication noncompliance after hospital discharge among patients with schizophrenia. Psychiatr Serv. 2000;51(2):216-222.
5. Herings RM, Erkens JA. Increased suicide attempt rate among patients interrupting use of atypical antipsychotics. Pharmacoepidemial Drug Saf. 2003;12(5):423-424.
6. Weiden PJ, Kozma C, Grogg A, et al. Partial compliance and risk of rehospitalization among California Medicaid patients with schizophrenia. Psychiatr Serv. 2004;55(8):886-891.
7. Velligan D, Weiden P, Sajatovic M, et al. Assessment of adherence problems in patients with serious and persistent mental illness. J Psychiatr Pract. 2010;16(1):34-45.
8. Freudenreich O, Cather C, Evins A, et al. Attitudes of schizophrenia outpatients toward psychiatric medications: relationship to clinical variables and insight. J Clin Psychiatry. 2004;65(10):1372-1376.
9. Perkins DO, Johnson JL, Hamer RM, et al. Predictors of antipsychotic medication adherence in patients recovering from a first psychotic episode. Schizophr Res. 2006;83(1):53-63.
10. Olivares JM, Alptekin K, Azorin JM, et al. Psychiatrists’ awareness of adherence to antipsychotic medication in patients with schizophrenia: results from a survey conducted across Europe, the Middle East, and Africa. Patient Prefer Adherence. 2013;7:121-132.
11. Novick D, Haro J, Suarez D, et al. Predictors and clinical consequences of nonadherence with antipsychotic medication in the outpatient treatment of schizophrenia. Psychiatry Res. 2010;176(2-3):109-113.
12. Hunt GE, Bergen J, Bashir M, et al. Medication compliance and comorbid substance abuse in schizophrenia: impact on community survival four years after a relapse. Schizophr Res. 2002;54(3):253-264.
13. McGinty EE, Webster DW, Barry CL. Effects of news media messages about mass shootings on attitudes toward persons with serious mental illness and public support for gun control policies. Am J Psychiatry. 2013;170(5):494-501.
14. DiBonaventura M, Gabriel S, Dupclay L, et al. A patient perspective of the impact of medication side effects on adherence: results of a cross-sectional nationwide survey of patients with schizophrenia. BMC Psychiatry. 2012;12:20.
15. Leucht S, Cipriani A, Spineli L, et al. Comparative efficacy and tolerability of 15 antipsychotic drugs in schizophrenia: a multiple-treatments meta-analysis. Lancet. 2013;1382(9896): 951-962.
16. Robinson DS. Antipsychotics: pharmacology and clinical decision making. Primary Psychiatry. 2007;14(10):23-25.
17. Robinson D, Correll CU, Kane JM, et al. Practical dosing strategies in the treatment of schizophrenia. CNS Spectr. 2010;15:4(suppl 6):1-16.
18. Magura S, Rosenblum A, Fong C. Factors associated with medication adherence among psychiatric outpatients at substance abuse risk. Open Addict J. 2011;4:58-64.
19. Baloush-Kleinman V, Levine SZ, Roe D, et al. Adherence to antipsychotic drug treatment in early-episode schizophrenia: a six-month naturalistic follow-up study. Schizophr Res. 2011;130(1-3):176-181.
20. Byerly M, Nakonezny P, Lescouflair E. Antipsychotic medication adherence in schizophrenia. Psychiatr Clin North Am. 2007;30:437-452.
21. Pfeiffer PN, Ganoczy D, Valenstein M. Dosing frequency and adherence to antipsychotic medications. Psychiatr Serv. 2008;59(10):1207-1210.
22. Farooq S, Nazar Z, Irfan M, et al. Schizophrenia medication adherence in a resource-poor setting: randomized controlled trial of supervised treatment in out-patients for schizophrenia (STOPS). Br J Psychiatry. 2011;199(6):467-472.
23. Emsley R, Oosthuizen P, Koen L, et al. Oral vs injectable antipsychotic treatment in early psychosis: post hoc comparison of two studies. Clin Ther. 2008;30(12):2378-2386.
24. Gutierrez-Casares JR, Canãs F, Rodriguez-Morales A, et al. Adherence to treatment and therapeutic strategies in schizophrenic patients: the ADHERE study. CNS Spectr. 2010;15(5):327-337.
Medication nonadherence is a common problem when treating patients with schizophrenia that can worsen prognosis and lead to sub-optimal treatment outcomes. In this article, we discuss common reasons for nonadherence and describe evidence-based treatments intended to increase adherence and improve outcomes (Box).1-6
Common reasons for nonadherence
The primary predictor of future nonadherence is a history of nonadherence. It is important to understand patients’ reasons for nonadherence so that practical and evidence-based solutions can be implemented into the treatment plans of individual patients.
The 2009 Expert Consensus Guidelines on Adherence Problems in Patients with Serious and Persistent Mental Illness divided variables related to nonadherence into 3 categories:
- those that lie within the patient (intrinsic)
- those that are related to the patient’s relationship with healthcare providers, family, or caregivers (extrinsic)
- those that are related to the healthcare delivery system (extrinsic).7
Among intrinsic variables, studies have shown a correlation between nonadherence and education level, lower socioeconomic status, homelessness, and male sex.7 (The Expert Consensus Guidelines considered homelessness to be an intrinsic factor because it was used as a demographic variable in the studies.)
Cognitive and negative symptoms associated with schizophrenia are an intrinsic risk factor for nonadherence because patients might not remember when or how to take medication.7 In a study by Freudenreich and co-workers8 of 81 outpatients who had a diagnosis of schizophrenia, the presence of negative symptoms predicted a negative attitude toward psychotropic medications. Poor insight might be the result of cognitive dysfunction associated with schizophrenia, and often is due to a lack of awareness of the importance of taking medications.
Limited insight into the need for treatment can be problematic early in the course of the illness when it may be directly related to positive symptoms. Perkins and colleagues9 demonstrated that patients recovering from a first psychotic episode who had limited insight into their illness and lacked desire to seek treatment were less adherent with medication. In another study, 5% of psychiatrists surveyed thought that many of their patients with schizophrenia were nonadherent because those patients did not believe that medications were effective or useful.10
Comorbid substance abuse disorders can contribute to medication nonadherence. In an analysis of 6,731 patients with schizophrenia, Novick and co-workers reported that alcohol dependence and substance abuse in the previous month predicted medication nonadherence.11 Hunt and colleagues demonstrated that, among 99 nonadherent patients with schizophrenia, time to first readmission was shorter for patients with comorbid substance abuse disorders compared with patients who had a diagnosis of schizophrenia only. Over the 4-year study period, the 28 patients who had a dual diagnosis (schizophrenia and substance abuse) accounted for 57% of all hospital readmissions.12
Several variables that affect medication adherence are related to the patient’s relationship with healthcare providers, family, caregivers, and the service delivery system.7 These include:
- the perceived stigma of being given a diagnosis of a serious mental illness
- adverse effects related to medications
- poor social and family support
- difficulty gaining access to mental health services.7,10
Societal stigma associated with seeking treatment from a mental health professional may contribute to nonadherence in some patients. In 1 study,13 36% of people surveyed would not want to work closely with a person who has a serious mental illness.
Adverse effects contribute significantly to nonadherence
Limited treatment options (which may be expensive) can make it difficult to manage the adverse effects of antipsychotics. In a cross-sectional survey of 876 patients, investigators reported that: 1) <50% of patients were adherent with medication, and 2) 80% experienced ≥1 side effect that was reported to be “somewhat bothersome” in self-ratings (Table 1).14 Extrapyramidal symptoms (EPS) and agitation were most strongly associated with nonadherence; weight gain, akathisia, and sexual dysfunction also were associated with nonadherence.14 This study did not distinguish adverse effects associated with first-generation antipsychotics (FGAs) from those associated with second-generation antipsychotics (SGAs), even though 71.7% of patients studied were taking an SGA.
A meta-analysis by Leucht and co-workers15 compared 15 antipsychotics (the FGAs haloperidol and chlorpromazine and 13 SGAs) for efficacy and tolerability in schizophrenia. Haloperidol had the highest rate of discontinuation for any
Antipsychotic binding affinities to dopamine 2 (D2), serotonin 2A (5-HT2A), histamine (H1), and other receptors have an impact on a medication’s side-effect profile. Because of individual patient characteristics, you might be faced with choosing a medication that has a lower risk of EPS but a higher risk of weight gain and metabolic complications—or the inverse. Understanding binding affinities, side-effect profiles, and how to minimize or utilize adverse effects (ie, giving a drug that is approved to treat schizophrenia and is associated with weight gain to a patient with schizophrenia who has lost weight) may lead to greater adherence (Table 216 and Table 317).
Adequate support is essential
The therapeutic alliance plays a key role in patients’ attitudes toward taking medication. Magura and colleagues18 found that one-third of psychiatric patients (13% of whom had a diagnosis of schizophrenia) reported that their psychiatrist did not spend enough time with them explaining side effects, and felt “rushed.”
Patients with schizophrenia often require access to social support systems provided by family members, friends, and community agencies that provide case management and attendant care services. Patients who are adherent to medication tend to have greater perceived family involvement in medication treatment, and tend to have been raised in a family that had more of a positive attitude toward medication.19
In our practice, we have observed that recent state and federal budget cuts have resulted in patients having greater difficulty gaining access to case management and attendant care services, which then leads to increased rates of medication nonadherence. Be aware that variables such as limited office hours, financial hardship, and cultural and language barriers can compromise a patient’s ability to seek and continue care.
In the following section, we lay out techniques for improving adherence in patients with schizophrenia.
Employ general and specific strategies to boost adherence
How can you raise medication adherence concerns with patients, keeping in mind that they often overestimate their adherence?
Ask. Some clinicians ask questions such as “Are you taking your medication?”, although a more effective approach might be to ask how the patient is taking his (her) medication. Asking questions such as “When do you take your medication?” and “In the past week, how many doses do you think you missed?” might be more effective ways to inquire about adherence.7
The Expert Consensus Guidelines recommend asking patients about medication adherence monthly for those who are stable, doing well, and believed to be adherent. For those who are new to a practice or who are not doing well, inquire about medication adherence at least weekly.7
In our practice, patients who are unstable but do not require inpatient hospitalization typically are seen more often in the clinic, or are referred to intensive outpatient or partial hospitalization programs. If an unstable patient is unable to come in for more frequent appointments, we arrange phone conferences between her and her provider. If a patient is not doing well and has a case manager, we often ask that case manager to visit the patient, in person, more often than he (she) would otherwise.
Take a nonjudgmental approach when raising these issues with patients. Questions such as “We all forget to take our medication sometimes; do you?” help to normalize nonadherence, and improve the therapeutic alliance, and might result in the patient being more honest with the clinician.7 Because patients may be apprehensive about discussing adverse events, clinicians must be proactive about improving the therapeutic alliance and making patients feel comfortable when discussing sensitive topics. Clinicians should try to convey the idea that, although adherence is a concern, so is quality of life. A clinicians’ willingness to take a flexible approach that is nonpunitive nor authoritarian can aid the therapeutic alliance and improve overall adherence.
Be sensitive to financial, cultural, and language variables that can affect access to care. The Expert Consensus Guidelines recommend asking patients if they can afford their medication. In our practice, we have seen patients with schizophrenia discharged from the hospital only to be readmitted 1 month later because they could not afford to fill their prescriptions.
It is important to have translation services available, in person or by phone, for patients who do not speak English. Furthermore, it is important to understand the limitations that your practice might place on access to care. Ask patients if they have ever had trouble making an appointment when they needed to be seen, or if they called the office with a question and did not receive an answer in a timely fashion; doing so allows you to assess the practice’s ability to meet patients’ needs and helps you build a therapeutic alliance.
Make objective assessments. It is important for practitioners to not base their assessment of medication adherence solely on subjective findings. Asking patients to bring in their medication bottles for pill counts and checking with the patients’ pharmacies for information about refill frequency can provide some objective data. Electronic monitoring systems use microprocessors inserted into bottle caps to record the occurrence and timing of each bottle opening. Studies show that these electronic monitoring systems are the gold standard for determining medication adherence and could be used in cases where it is unclear if the patient is taking his (her) medication.7,20 Such systems have successfully monitored medication adherence in clinical trials, but their use in clinical practice is complicated by ethical and legal considerations and cost issues.
Simplify the regimen. Using medications with once-daily dosing, for example, can help improve adherence. Pfeiffer and co-workers21 found that patients whose medication regimens were changed from once daily to more than once daily experienced a decrease in medication adherence. Conversely, a decrease in dosing frequency was significantly associated with improved adherence. More than once-daily dosing was only weakly associated with poorer adherence among patients already on a stable regimen.
Discussing positive and negative aspects of past medication trials with a patient and inquiring if she prefers a specific medication can be an effective way to build the therapeutic relationship and help with adherence.
Direct patients to psychosocial interventions. These can be broadly classified as:
- educational approaches
- group therapy approaches
- family interventions
- cognitive treatments
- combination approaches.
Psychoeducational approaches have limited effect on improving adherence when delivered to individual patients. However, 1 study showed that psychoeducation was effective at improving adherence when extended to include the patient’s family.22
Motivational interviewing techniques, behavioral approaches, and family interventions are effective at increasing medication adherence. One study looked at the value of training a patient-identified informant to supervise and administer medication. This person, usually a family member or close support, was responsible for obtaining medication from the pharmacy, administering the medication, and recording adherence. After 1 year, 67% of patients who used an informant were adherent, compared with only 45% in the group that did not have informant support.22 Case managers, attendant care workers, home health nurses, and assertive community treatment (ACT) teams also can participate in this manner; it is important, therefore, for you to be aware of the resources available in your community and to understand your role as patient advocate.
Substance abuse is a strong risk factor for nonadherence among patients with schizophrenia,18 which makes it important to assess patients for substance use and encourage those who do abuse to seek treatment. Although 1 study showed no correlation between Alcoholics Anonymous (AA) attendance and medication adherence,12 many AA and Narcotics Anonymous groups do not discuss psychiatric medications during group meetings. Magura and colleagues encouraged the use of “dual focus” groups that involve mental health professionals and addiction treatment specialists discussing mental health and substance abuse issues at the same setting.18
Prescribe long-acting injectable antipsychotics. Typically, long-acting injectable antipsychotics (LAIs) are reserved for patients who have a history of nonadherence. In a small study (N = 97) comparing LAI risperidone and oral risperidone or oral haloperidol, patients treated with an LAI had significantly fewer all-cause discontinuations (26.0%, compared with 70.2%) at 24 months.23 The Adherence to Treatment and Therapeutic Strategies in Schizophrenic Patients study examined 1,848 patients with schizophrenia and reached similar findings regarding LAI antipsychotics.24 (Note: Aripiprazole, fluphenazine, haloperidol, olanzapine, and paliperidone also are available in an LAI formulation.)
Bottom Line
Antipsychotic nonadherence in schizophrenia is a major problem for patients, families, and society. Being able to identify patients at risk for nonadherence, understanding the reasons for their nonadherence, and seeking practical solutions to the problem are all the responsibility of the treating physician. Psychoeducation, addressing substance abuse, modifying dosing, and using long-acting injectable antipsychotics may help improve adherence.
Related Resources
- Velligan DI, Weiden PJ, Sajatovic M, et al; Expert Consensus Panel on Adherence Problems in Serious and Persistent Mental Illness. Assessment of adherence problems in patients with serious and persistent mental illness: recommendations from the Expert Consensus Guidelines. J Clin Psychiatry. 2009;70(suppl 4):1-46.
- National Alliance on Mental Illness. www.nami.org.
- Assertive Community Treatment (ACT) Organization. www.actassociation.org.
Drug Brand Names
Aripiprazole • Abilify Chlorpromazine • Thorazine Clozapine • Clozaril Fluphenazine • Permitil Haloperidol • Haldol Iloperidone • Fanapt Olanzapine • Zyprexa Paliperidone • Invega Perphenazine • Trilafon Quetiapine • Seroquel Risperidone • Risperdal Ziprasidone • Geodon
Disclosures
Dr. Macaluso has been the principal investigator for clinical trials for AbbVie, Eisai, Envivo, Janssen, Naurex, and Pfizer. All clinical trial and study contracts and payments were made through the Kansas University Medical Center Research Institute. Dr. McKnight reports no financial relationship with any company whose products are mentioned in this article or with manufacturers of competing products.
1. Sun SX, Liu GG, Christensen DB, et al. Review and analysis of hospitalization costs associated with antipsychotic nonadherence in the treatment of schizophrenia in the United States. Curr Med Res Opin. 2007;23:2305-2312.
2. Lacro JP, Dunn LB, Dolder CR, et al. Prevalence of and risk factors for medication nonadherence in patients with schizophrenia: a comprehensive review of recent literature. J Clin Psychiatry. 2002;63:892-909.
3. Fenton WS, Blyler CR, Heinssen RK. Determinants of medication compliance in schizophrenia: empirical and clinical findings. Schizophr Bull. 1997;23(4):637-651.
4. Olfson M, Mechanic D, Hansell S, et al. Predicting medication noncompliance after hospital discharge among patients with schizophrenia. Psychiatr Serv. 2000;51(2):216-222.
5. Herings RM, Erkens JA. Increased suicide attempt rate among patients interrupting use of atypical antipsychotics. Pharmacoepidemial Drug Saf. 2003;12(5):423-424.
6. Weiden PJ, Kozma C, Grogg A, et al. Partial compliance and risk of rehospitalization among California Medicaid patients with schizophrenia. Psychiatr Serv. 2004;55(8):886-891.
7. Velligan D, Weiden P, Sajatovic M, et al. Assessment of adherence problems in patients with serious and persistent mental illness. J Psychiatr Pract. 2010;16(1):34-45.
8. Freudenreich O, Cather C, Evins A, et al. Attitudes of schizophrenia outpatients toward psychiatric medications: relationship to clinical variables and insight. J Clin Psychiatry. 2004;65(10):1372-1376.
9. Perkins DO, Johnson JL, Hamer RM, et al. Predictors of antipsychotic medication adherence in patients recovering from a first psychotic episode. Schizophr Res. 2006;83(1):53-63.
10. Olivares JM, Alptekin K, Azorin JM, et al. Psychiatrists’ awareness of adherence to antipsychotic medication in patients with schizophrenia: results from a survey conducted across Europe, the Middle East, and Africa. Patient Prefer Adherence. 2013;7:121-132.
11. Novick D, Haro J, Suarez D, et al. Predictors and clinical consequences of nonadherence with antipsychotic medication in the outpatient treatment of schizophrenia. Psychiatry Res. 2010;176(2-3):109-113.
12. Hunt GE, Bergen J, Bashir M, et al. Medication compliance and comorbid substance abuse in schizophrenia: impact on community survival four years after a relapse. Schizophr Res. 2002;54(3):253-264.
13. McGinty EE, Webster DW, Barry CL. Effects of news media messages about mass shootings on attitudes toward persons with serious mental illness and public support for gun control policies. Am J Psychiatry. 2013;170(5):494-501.
14. DiBonaventura M, Gabriel S, Dupclay L, et al. A patient perspective of the impact of medication side effects on adherence: results of a cross-sectional nationwide survey of patients with schizophrenia. BMC Psychiatry. 2012;12:20.
15. Leucht S, Cipriani A, Spineli L, et al. Comparative efficacy and tolerability of 15 antipsychotic drugs in schizophrenia: a multiple-treatments meta-analysis. Lancet. 2013;1382(9896): 951-962.
16. Robinson DS. Antipsychotics: pharmacology and clinical decision making. Primary Psychiatry. 2007;14(10):23-25.
17. Robinson D, Correll CU, Kane JM, et al. Practical dosing strategies in the treatment of schizophrenia. CNS Spectr. 2010;15:4(suppl 6):1-16.
18. Magura S, Rosenblum A, Fong C. Factors associated with medication adherence among psychiatric outpatients at substance abuse risk. Open Addict J. 2011;4:58-64.
19. Baloush-Kleinman V, Levine SZ, Roe D, et al. Adherence to antipsychotic drug treatment in early-episode schizophrenia: a six-month naturalistic follow-up study. Schizophr Res. 2011;130(1-3):176-181.
20. Byerly M, Nakonezny P, Lescouflair E. Antipsychotic medication adherence in schizophrenia. Psychiatr Clin North Am. 2007;30:437-452.
21. Pfeiffer PN, Ganoczy D, Valenstein M. Dosing frequency and adherence to antipsychotic medications. Psychiatr Serv. 2008;59(10):1207-1210.
22. Farooq S, Nazar Z, Irfan M, et al. Schizophrenia medication adherence in a resource-poor setting: randomized controlled trial of supervised treatment in out-patients for schizophrenia (STOPS). Br J Psychiatry. 2011;199(6):467-472.
23. Emsley R, Oosthuizen P, Koen L, et al. Oral vs injectable antipsychotic treatment in early psychosis: post hoc comparison of two studies. Clin Ther. 2008;30(12):2378-2386.
24. Gutierrez-Casares JR, Canãs F, Rodriguez-Morales A, et al. Adherence to treatment and therapeutic strategies in schizophrenic patients: the ADHERE study. CNS Spectr. 2010;15(5):327-337.