User login
MDedge latest news is breaking news from medical conferences, journals, guidelines, the FDA and CDC.
Sleep Apnea Linked to Heightened Mortality in Epilepsy
LOS ANGELES — according to a new analysis of over 2 million patient-years drawn from the Komodo Health Claims Database.
“A 10-year-old with uncontrolled epilepsy and central sleep apnea is about 200 times more likely to die than a general population 10-year-old. That’s comparable to a 10-year-old with {epilepsy and} congestive heart failure. Noncentral sleep apnea is comparable to being paralyzed. It’s a huge risk factor,” said poster presenter Dan Lloyd, advanced analytics lead at UCB, which sponsored the research.
The ordering of sleep apnea tests for patients with epilepsy is widely variable, according to Stefanie Dedeurwaerdere, PhD, who is the innovation and value creation lead at UCB. “Some doctors do that as a general practice, and some don’t. There’s no coherency in the way these studies are requested for epilepsy patients. We want to create some awareness around this topic,” she said, and added that treatment of sleep apnea may improve epileptic seizures.
The findings were presented at the American Epilepsy Society (AES) 78th Annual Meeting 2024.
The study included mortality rates between January 2018 and December 2022, with a total of 2,355,410 patient-years and 968,993 patients, with an age distribution of 19.1% age 1 to less than 18 years, 23.7% age 18-35 years, and 57.2% age 36 years or older. Sleep apnea prevalences were 0.7% for central sleep apnea (CSA), 14.0% for obstructive sleep apnea (OSA), and 85.3% with no sleep apnea.
Among those aged 1-18 years, the standardized mortality ratio (SMR) for those with uncontrolled epilepsy was 27.7. For those with comorbid OSA, the SMR was 74.2, and for comorbid CSA, the SMR was 135.9. The association was less pronounced in older groups, dipping to 7.0, 11.3, and 19.5 in those aged 18-35 years, and 3.3, 3.1, and 2.8 among those aged 36 years or older.
Among the 1-18 age group, SMRs for other comorbidities included 132.3 for heart failure, 74.9 for hemiplegia/paraplegia, 55.3 for cerebrovascular disease, and 44.6 for chronic pulmonary disease.
Asked for comment, Gordon Buchanan, MD, PhD, welcomed the new work. “The results did not surprise me. I study sleep, epilepsy, and [sudden unexplained death in epilepsy (SUDEP)] in particular ... and every time I speak on these topics, someone asks me about risk of SUDEP in patients with sleep apnea. It’s great to finally have some data,” said Buchanan, a professor of neurology at the University of Iowa, Iowa City.
The authors found that patients undergoing continuous positive airway pressure (CPAP)/bi-level positive airway pressure therapy had a higher mortality risk than those not undergoing CPAP therapy but cautioned that uncontrolled confounders may be contributing to the effect.
Buchanan wondered if treatment with CPAP would be associated with a decreased mortality risk. “I think that would be interesting, but I know that, especially in children, it can be difficult to get them to remain compliant with CPAP. I think that would be interesting to know, if pushing harder to get the kids to comply with CPAP would reduce mortality,” he said.
The specific finding of heightened mortality associated with CSA is interesting, according to Buchanan. “We think of seizures propagating through the brain, maybe through direct synaptic connections or through spreading depolarization. So I think it would make sense that it would hit central regions that would then lead to sleep apnea.”
The relationship between OSA and epilepsy is likely complex. Epilepsy medications and special diets may influence body composition, which could in turn affect the risk for OSA, as could medications associated with psychiatric comorbidities, according to Buchanan.
The study is retrospective and based on claims data. It does not prove causation, and claims data do not fully capture mortality, which may lead to conservative SMR estimates. The researchers did not control for socioeconomic status, treatment status, and other comorbidities or conditions.
Lloyd and Dedeurwaerdere are employees of UCB, which sponsored the study. Buchanan had no relevant financial disclosures.
A version of this article appeared on Medscape.com.
FROM AES 2024
Rise in Psychotherapy Use Exposes Access Inequities
Outpatient psychotherapy use in the United States rose sharply between 2018 and 2021, an increase that was driven primarily by young, urban professionals with higher family incomes, new data exposed significant disparities in access to this treatment type.
Results of a large population-based repeated cross-sectional study revealed that psychotherapy use increased significantly faster for women vs men, younger individuals vs their older counterparts, college graduates than those without a high school diploma, and privately insured vs publicly insured individuals.
Overall, psychotherapy use increased significantly faster among several socioeconomically advantaged groups, and inequalities were evident in teletherapy access. These trends and patterns highlight a need for clinical interventions and healthcare policies to broaden access to psychotherapy, including teletherapy, the authors noted.
“While psychotherapy access has expanded in the US, there’s concern that recent gains may not be equally distributed, despite or maybe because of the growth of teletherapy,” study author Mark Olfson, MD, MPH, Department of Psychiatry, Mailman School of Public Health, Columbia University, New York City, said in a press release.
“This increase in psychotherapy use, driven by the rise of teletherapy, has largely benefited socioeconomically advantaged adults with mild to moderate distress,” he added.
The findings were published online in JAMA Psychiatry.
Psychotherapy Uptick
Psychotherapy is among the most widely used methods for delivering mental health care in the United States. A recent study conducted by Olfson and colleagues showed that the percentage of US adults receiving psychotherapy increased from 6.5% in 2018 to 8.5% in 2021. However, it was unclear how this overall increase varied across different sociodemographic groups or levels of psychological distress.
Analyzing population-level trends in psychotherapy use can identify sociodemographic groups with declining access to services, providing valuable insights for developing initiatives to improve accessibility, the investigators noted.
To evaluate national trends in psychotherapy use, the researchers analyzed data from the 2018-2021 Medical Expenditure Panel Survey (MEPS). These are yearly surveys representing noninstitutionalized adults across the United States.
The study included 89,619 adults. Of these, 51.5% were women, nearly half were aged 35-64 years, and 62.2% were White individuals. The study used a repeated cross-sectional design with new, nationally representative samples of about 22,000 participants each year.
The investigators tracked the overall increase in psychotherapy use, especially among groups at higher risk for untreated mental health conditions. They also examined how video-based therapy (teletherapy) was being used, paying particular attention to differences in access among various demographic groups and levels of psychological distress, given ongoing concerns about equity in telehealth access.
Psychological distress was measured using the Kessler-6 scale, with scores ≥ 13 defining serious psychological distress, 1-12 defining mild to moderate distress, and 0 defining no distress.
Psychotherapy use increased across all racial and ethnic groups, with rates rising among Black (5.4% to 7.1%), Hispanic (4.1% to 5.8%), White (7.5% to 9.8%), and other, non-Hispanic (4.8% to 6.6%) individuals.
Participants with mild to moderate distress experienced the greatest increases in psychotherapy use (8.6% to 11.2%, respectively).
After adjusting for age, sex, and level of psychological distress, investigators found that psychotherapy use increased to a greater degree among women (7.7% to 10.5%) vs men (5.2% to 6.3%), younger adults aged 18-34 years (8% to 11.9%) vs adults aged 65 years or older (3.6% to 4.6%), and college graduates (7.6% to 11.4%) than those without a high school diploma (5.5% to 7%).
A National Priority
Adults with higher incomes — defined as two to four times the federal poverty level — had greater increases in psychotherapy use (5.7% to 8.2%) than those below the poverty level (9.7% to 10%).
Unsurprisingly, privately insured individuals saw more significant increases (6.1% to 8.9%) than publicly insured individuals (8.8% to 8.8%). Also, there was a larger increase in psychotherapy use among employed individuals (5.7% to 8.9%) than among unemployed individuals (10.8% to 10.5%).
In addition, there was a significantly greater increase in psychotherapy use among urban residents (6.5% to 8.7%), whereas it declined among rural residents (6.4% to 5.9%).
Data on teletherapy use from 2021 revealed that 39.9% of adults receiving psychotherapy had one or more teletherapy visits.
Teletherapy use was higher among younger adults, women, college-educated individuals, those with higher incomes, those with private insurance, and those who lived in urban areas.
The authors noted that while teletherapy is intended to remove transportation and time barriers and was widely adopted during the pandemic, the findings show that those who were older, less educated, and with lower incomes were less likely to use it.
Notably, urban residents were more than twice as likely to use teletherapy than rural residents. Prior to the COVID-19 pandemic, teletherapy was viewed as a potential solution for individuals living in rural areas facing a shortage of mental health professionals, but study results showed that “teletherapy does not appear to have addressed this public health challenge,” the investigators wrote.
“The trends we are seeing underscore the need for targeted interventions and health policies that expand psychotherapy access to underserved groups,” said Olfson.
“Ensuring that individuals in psychological distress can access care is a national priority. Addressing technical and financial barriers to teletherapy could help bridge the gap in access and promote equity in mental health care,” he added.
Study limitations included a possible underreporting of psychotherapy use by participants. In addition, MEPS does not include nursing home residents, incarcerated, and unhoused individuals.
Study funding was not disclosed. Olfson reported no relevant disclosures.
A version of this article first appeared on Medscape.com.
FROM JAMA PSYCHIATRY
Skin Stress Biomarker May Predict Nerve Damage in Early T2D
TOPLINE:
Increased cutaneous carbonyl stress is linked to slower nerve conduction in patients with metabolically well-controlled, recent-onset type 2 diabetes (T2D) and can predict the development of neuropathic deficits over 5 years.
METHODOLOGY:
- Accumulation of advanced glycation end products (AGEs), which results from endogenous carbonyl stress, may be a potential target for preventing and treating the diabetic sensorimotor polyneuropathy (DSPN) that is a common complication of T2D.
- Researchers investigated novel cutaneous biomarkers for the development and progression of DSPN in 160 individuals with recent-onset T2D (diagnosed within 12 months or less) and 144 individuals with normal glucose tolerance, all recruited consecutively from the German Diabetes Study baseline cohort.
- Peripheral nerve function was assessed through nerve conduction studies, quantitative sensory testing, and clinical neuropathy scores.
- Skin biopsies were used to analyze intraepidermal nerve fiber density, endothelial integrity, cutaneous oxidative stress markers, and cutaneous carbonyl stress markers, including AGE autofluorescence and argpyrimidine area.
- Skin autofluorescence was measured noninvasively using an AGE reader device.
- A subgroup of 80 patients with T2D were reassessed after 5 years to evaluate the progression of neurophysiological deficits.
TAKEAWAY:
- Patients with recent-onset T2D had greater AGE autofluorescence and argpyrimidine area (P ≤ .05 for both) and lower nerve fiber density (P ≤ .05) than individuals with normal glucose tolerance.
- In patients with T2D, AGE autofluorescence was inversely associated with nerve conduction (P = .0002, P = .002, and P = .001 for peroneal motor, median motor, and sural sensory nerve conduction velocity, respectively) and positively associated with AGE reader measurements (P < .05); no such associations were observed in those with normal glucose tolerance.
- In the prospective T2D cohort, associations were noted between cutaneous markers for AGEs and endothelial cells at baseline and changes in nerve function indices over a 5-year period.
IN PRACTICE:
“Prospective analyses revealed some predictive value of cutaneous AGEs and lower endothelial integrity for declining nerve function, supporting the role of carbonyl stress in the development and progression of DSPN, representing a potential therapeutic target,” the authors wrote.
SOURCE:
The study was led by Gidon J. Bönhof, Department of Endocrinology and Diabetology, Medical Faculty, University Hospital Düsseldorf, Heinrich Heine University Düsseldorf, Düsseldorf, Germany. It was published online in Diabetes Care.
LIMITATIONS:
The observational design of the study limited the ability to draw causal conclusions. The groups were not matched for age or body mass index. Various mechanisms related to DSPN were analyzed; however, specific pathways of AGEs were not studied in detail. The relatively low number of individuals with clinically manifested DSPN limited the exploration of different stages of the condition.
DISCLOSURES:
The study was supported by a German Center for Diabetes Research grant. The German Diabetes Study was supported by the German Diabetes Center funded by the German Federal Ministry of Health (Berlin), the Ministry of Innovation, Science, Research and Technology of North Rhine-Westphalia (Düsseldorf, Germany), and grants from the German Federal Ministry of Education and Research to the German Center for Diabetes Research e.V. No relevant conflicts of interest were reported.
This article was created using several editorial tools, including AI, as part of the process. Human editors reviewed this content before publication.
A version of this article first appeared on Medscape.com.
Untreated Infertility Linked to Higher Risk for Systemic Autoimmune Rheumatic Disease After Childbirth
TOPLINE:
The association persists even after accounting for adverse pregnancy outcomes. Women who have experienced infertility without fertility treatment show a 25% higher risk for systemic autoimmune rheumatic disease (SARD) up to 9 years after delivery, compared with those without infertility.
METHODOLOGY:
- Population-based cohort study analyzed 568,053 singleton births among 465,078 women aged 18-50 years without pre-existing SARD in Ontario, Canada, from 2012 to 2021.
- Participants were categorized into four groups: No infertility with unassisted conception (88.0%), infertility without fertility treatment (9.2%), infertility with noninvasive fertility treatment (1.4%), and infertility with invasive fertility treatment (1.4%).
- Researchers used marginal structural Cox proportional hazards models to generate hazard ratios and 95% CIs, adjusting for sociodemographic characteristics, comorbidities, smoking, and adverse pregnancy outcomes.
- Analysis included a median follow-up duration of 6.5 years (interquartile range: 4-9 years) from delivery date until SARD diagnosis, death, loss of health insurance, or study end.
TAKEAWAY:
- The incidence rate of SARD was 12.5 per 10,000 person-years in women with untreated infertility, compared with 9.3 per 10,000 person-years in women without infertility.
- Women with untreated infertility showed an elevated risk for SARD (controlled direct effect hazard ratio [HR], 1.25; 95% CI, 1.12-1.40) even after accounting for adverse pregnancy outcomes.
- Neither noninvasive fertility treatment (total effect HR, 1.06; 95% CI, 0.79-1.42) nor invasive fertility treatment (total effect HR, 0.97; 95% CI, 0.69-1.36) were associated with increased SARD risk.
- The association between untreated infertility and SARD persisted in analyses restricted to women aged < 38 years and in those without endometriosis or other autoimmune diseases.
IN PRACTICE:
“Future research efforts should seek to corroborate this association by infertility cause, with a focus on possible mechanisms related to ovulatory, ovarian, and sexual dysfunction. Greater health provider awareness of SARD symptoms and related gynecological issues that may present in women with infertility could facilitate earlier detection and treatment of SARD during the reproductive years,” wrote the authors of the study.
SOURCE:
The study was led by Natalie V. Scime of the Department of Health and Society, University of Toronto Scarborough in Ontario, Canada. It was published online in Human Reproduction.
LIMITATIONS:
Exposure and outcome misclassification was possible due to the use of published algorithms in health administrative data with unknown or imperfect sensitivity and specificity. The researchers noted that individual-level social and lifestyle factors and underlying causes of infertility were not available, and thus, were not included in the analysis.
DISCLOSURES:
This research received funding through a Banting Postdoctoral Fellowship to Scime and Canada Research Chair to Hilary K. Brown (2019-00158), with support from ICES, funded by an annual grant from the Ontario Ministry of Health and the Ministry of Long-Term Care. One coauthor disclosed consulting for Celltrion, Werfen, Organon, MitogenDx, AstraZeneca, Mallinckrodt Canada, and GlaxoSmithKline. All other authors reported no conflicts of interest.
This article was created using several editorial tools, including AI, as part of the process. Human editors reviewed this content before publication.
A version of this article first appeared on Medscape.com.
When Is the Best Time to Deliver for Pregnant Patients With Chronic Hypertension?
TOPLINE:
Among pregnant patients with chronic hypertension, delivery at 39 weeks of gestation provides an optimal balance between stillbirth risk and neonatal outcomes. Analysis of 227,977 term singleton deliveries shows consistent findings across different patient subgroups.
METHODOLOGY:
- A population-based retrospective cohort study analyzed 227,977 nonanomalous singleton term births in the United States from 2014 to 2018 among patients with chronic hypertension.
- Researchers excluded pregnancies with superimposed preeclampsia, eclampsia, pregestational diabetes, and deliveries occurring before 37 weeks or at 43 or more weeks of gestation.
- Analysis compared rates of stillbirth, infant death within 1 year of life, and neonatal morbidity at each week of term pregnancy.
- Neonatal morbidity was defined as a composite of neonatal intensive care unit admission, ventilation for 6 hours or longer, a low 5-minute Apgar score (≤ 3), and seizures.
TAKEAWAY:
- The rate of stillbirth per 10,000 ongoing pregnancies increased with gestational age and was lowest at 38 weeks (6.5; 95% CI, 5.4-7.7).
- Rates of infant death and neonatal morbidity were lowest at 40 weeks (18.0/10,000 live births; 95% CI, 13.7-23.6) and 39 weeks (637/10,000 live births; 95% CI, 619-654), respectively.
- At 39 weeks of gestation, the risk for delivery was lower (651/10,000; 95% CI, 633-670) than the composite risk for expectant management (750/10,000; 95% CI, 720-781).
- According to the authors, findings were consistent for non-Hispanic Black patients and pregnancies complicated by fetal growth restriction.
IN PRACTICE:
“To prevent one case of stillbirth, infant death, or neonatal morbidity, an estimated 101 patients with chronic hypertension would need to deliver at 39 weeks of gestation as opposed to 40 weeks. Given the approximately 45,000 patients with chronic hypertension who deliver at term each year in the United States, a policy of delivery at 39 weeks of gestation theoretically would prevent 450 adverse perinatal events per year,” wrote the authors of the study.
SOURCE:
The study was led by Ira Hamilton, James Liu, Labeena Wajahat, and Robert Rossi, University of Cincinnati College of Medicine in Cincinnati. It was published online in O&G Open.
LIMITATIONS:
According to the authors, the study could not stratify chronic hypertension based on medication use, number of medications, or degree of control. The researchers note that exact timing of delivery in weeks and days was not reported, limiting precise understanding of optimal delivery timing. Additionally, the study could not examine rates of neonatal morbidity and mortality in patients who developed superimposed preeclampsia during expectant management.
DISCLOSURES:
The authors did not report any potential conflicts of interest.
This article was created using several editorial tools, including AI, as part of the process. Human editors reviewed this content before publication. A version of this article first appeared on Medscape.com.
Noise and Artificial Light
If you’ve ever taken a red-eye flight you have probably received a little packet of items the airline hopes will make your night flight more comfortable. If you had shelled out for “extra leg room” or “more comfort” seating, your little kit may have included some one-size-never-fits-all socks, a toothbrush large enough to brush one tooth at a time, and a miniature tube of toothpaste the GEICO gecko would laugh at. I have no personal knowledge what the folks in first class are getting, but I suspect it comes in a calf skin Gucci pouch. But, regardless of where you are sitting, at a minimum your night comfort kit will come with an eye mask and ear plugs. Unfortunately, these freebies are wasted on me because I already use a sleep mask every night and simply turn off my hearing aids to mute the noise. But I appreciate their effort.
Light and sound are well-known sleep disruptors. Temperature gets less attention, but is nonetheless a potent contributor to a poor night’s sleep in my experience. Just by chance while I was recovering from my most recent jet lag, I encountered two papers from investigators who were curious about the association between healthy sleep and ambient light and noise.

The first paper looked at the relationship between artificial light at night (ALAN) and the incidence of insomnia. Looking at more than 300 Chinese cities, the investigators measured ALAN using satellite images and correlated the data with insomnia-related posts on social media. The researchers found when ALAN increased insomnia, related posts also increased. Not surprisingly, this relationship was greater in less populated cities during extreme temperatures and when air quality was poor.
The second paper came from University of Texas at Houston. Using Fitbit data from more than 3000 adolescents, the researchers looked for correlations between blood pressure, sleep health, and “median nighttime anthropogenic noise levels by ZIP code.” Turns out the Federal Highway Administration has a readily available map of these noise levels.
What the investigators found was that adequate sleep significantly reduces the risk of hypertension in adolescents. Not an unexpected finding to an ex-pediatrician like myself who is obsessed with the importance of sleep deprivation. However, the investigators and I were surprised that they had found no association between neighborhood noise alone or in combination with sleep health. I still suspect there is an association lurking there in the weeds of their data, but obviously it is not robust enough to float to the surface. It may be that in an acute situation noise can contribute to hypertension, but over time individuals adjust to the new sound level and their blood pressure settles down. Sleep is such a critical factor that it is not something our cardiovascular system can adapt to so easily. For various reasons most of us may already be functioning at the margins of sleep deprivation.
How then do we respond to observations by these two research teams? Do we take an approach similar to that the airlines have taken and prescribe, hand out, or sell ear plugs and sleep masks to every patient, or at least those with hypertension? This is what we could call the put-the-onus-on-the-patient approach, which seems to be the default when we lack the political will to take a bolder step.
The other path we could call the socio-environmental approach. The airlines have made a passing attempt at this by turning the cabin lights down on red-eye flights. I recently wrote about the “exposome,” which some investigators define as the total non-genetic exposures an individual endures during a lifetime and which in many situations has a negative effect on the individual’s health. These two papers clearly demonstrate that noise and nighttime artificial light are potent features of an uncountable number of individuals’ exposomes.
Unfortunately, it is going to require something far beyond these two relatively obscure studies to move the needle in the direction of a healthier population. It’s is not a stretch to put obesity and the attention deficit phenomenon under this same umbrella where our society needs to look at itself for the answers.
Dr. Wilkoff practiced primary care pediatrics in Brunswick, Maine, for nearly 40 years. He has authored several books on behavioral pediatrics, including “How to Say No to Your Toddler.” Other than a Littman stethoscope he accepted as a first-year medical student in 1966, Dr. Wilkoff reports having nothing to disclose. Email him at [email protected].
If you’ve ever taken a red-eye flight you have probably received a little packet of items the airline hopes will make your night flight more comfortable. If you had shelled out for “extra leg room” or “more comfort” seating, your little kit may have included some one-size-never-fits-all socks, a toothbrush large enough to brush one tooth at a time, and a miniature tube of toothpaste the GEICO gecko would laugh at. I have no personal knowledge what the folks in first class are getting, but I suspect it comes in a calf skin Gucci pouch. But, regardless of where you are sitting, at a minimum your night comfort kit will come with an eye mask and ear plugs. Unfortunately, these freebies are wasted on me because I already use a sleep mask every night and simply turn off my hearing aids to mute the noise. But I appreciate their effort.
Light and sound are well-known sleep disruptors. Temperature gets less attention, but is nonetheless a potent contributor to a poor night’s sleep in my experience. Just by chance while I was recovering from my most recent jet lag, I encountered two papers from investigators who were curious about the association between healthy sleep and ambient light and noise.
The first paper looked at the relationship between artificial light at night (ALAN) and the incidence of insomnia. Looking at more than 300 Chinese cities, the investigators measured ALAN using satellite images and correlated the data with insomnia-related posts on social media. The researchers found when ALAN increased insomnia, related posts also increased. Not surprisingly, this relationship was greater in less populated cities during extreme temperatures and when air quality was poor.
The second paper came from University of Texas at Houston. Using Fitbit data from more than 3000 adolescents, the researchers looked for correlations between blood pressure, sleep health, and “median nighttime anthropogenic noise levels by ZIP code.” Turns out the Federal Highway Administration has a readily available map of these noise levels.
What the investigators found was that adequate sleep significantly reduces the risk of hypertension in adolescents. Not an unexpected finding to an ex-pediatrician like myself who is obsessed with the importance of sleep deprivation. However, the investigators and I were surprised that they had found no association between neighborhood noise alone or in combination with sleep health. I still suspect there is an association lurking there in the weeds of their data, but obviously it is not robust enough to float to the surface. It may be that in an acute situation noise can contribute to hypertension, but over time individuals adjust to the new sound level and their blood pressure settles down. Sleep is such a critical factor that it is not something our cardiovascular system can adapt to so easily. For various reasons most of us may already be functioning at the margins of sleep deprivation.
How then do we respond to observations by these two research teams? Do we take an approach similar to that the airlines have taken and prescribe, hand out, or sell ear plugs and sleep masks to every patient, or at least those with hypertension? This is what we could call the put-the-onus-on-the-patient approach, which seems to be the default when we lack the political will to take a bolder step.
The other path we could call the socio-environmental approach. The airlines have made a passing attempt at this by turning the cabin lights down on red-eye flights. I recently wrote about the “exposome,” which some investigators define as the total non-genetic exposures an individual endures during a lifetime and which in many situations has a negative effect on the individual’s health. These two papers clearly demonstrate that noise and nighttime artificial light are potent features of an uncountable number of individuals’ exposomes.
Unfortunately, it is going to require something far beyond these two relatively obscure studies to move the needle in the direction of a healthier population. It’s is not a stretch to put obesity and the attention deficit phenomenon under this same umbrella where our society needs to look at itself for the answers.
Dr. Wilkoff practiced primary care pediatrics in Brunswick, Maine, for nearly 40 years. He has authored several books on behavioral pediatrics, including “How to Say No to Your Toddler.” Other than a Littman stethoscope he accepted as a first-year medical student in 1966, Dr. Wilkoff reports having nothing to disclose. Email him at [email protected].
The Cause of All That Stress: Tonsillectomy?
This transcript has been edited for clarity.
You know those times in your life when you’re just feeling ... stressed? You’re on the edge; you have no chill; everything just sort of gets to you. If you can step away from the anxiety for a moment, you might ask yourself where it’s all coming from. Is it really the stuff in your inbox at work or is it money issues at home? Is it something with your relationship, or maybe it’s your sleep quality or your diet? One thing you probably won’t blame for those acute stress reactions is the tonsillectomy you had as a kid. But according to new research, maybe you should.
Tonsillectomy and adenoidectomy are among the most common surgical procedures young people in the United States undergo, with about 300,000 cases a year, according to recent numbers. That’s down a bit from numbers a decade or so ago, but suffice it to say, a good chunk of the population is walking around right now without their tonsils.
The data supporting tonsillectomy have never been great. The two big indications for the surgery are recurrent sore throat — data show that tonsillectomy reduces this by about 0.7 sore throats per year— and obstructive sleep apnea (OSA). The data for improvement of OSA are a bit better than the data for sore throats.
Also, tonsillectomy is a relatively quick, relatively well-reimbursed surgery with indications that are — let’s be honest — somewhat subjective, and so variation is high. One study found that in a single Vermont town, nearly 60% of the population had had their tonsils removed by the time they turned 18. A few towns over, the rate was 20%.
A few factors have led to the decline of tonsillectomy in recent years. Reimbursement rates have gone down a bit. Additionally, better data collection and statistical analysis have shown that the benefits of the procedure are relatively modest.
And then there is a body of medical literature that at first struck me as surprising and almost bizarre: data linking tonsillectomy to subsequent physical and psychiatric disorders.
I teach a course on interpretation of the medical literature, and one of the first things I teach my students is to check their gut when they see the conclusion of a study.
Basically, even before you read the data, have a sense in your own mind if the hypothesis seems reasonable. If a paper is going to conclude that smoking leads to increased risk for bone cancer, I’d say that seems like a reasonable thing to study. If a paper purports to show a link between eating poultry and bone cancer, I’m going to be reading it with quite a bit more skepticism.
The technical term for that process is assessing “biologic plausibility.” If we’re talking tonsils, we have to ask ourselves: Is it plausible that removing someone’s tonsils when they are young should lead to major problems in the future?
At first blush, it didn’t seem very plausible to me.
But the truth is, there are quite a few studies out there demonstrating links like this: links between tonsillectomy and irritable bowel syndrome; links between tonsillectomy and cancer; links between tonsillectomy and depression.
And this week, appearing in JAMA Network Open, is a study linking tonsillectomy with stress disorders.
Researchers leveraged Sweden’s health database, which contains longitudinal data on basically every person who has lived in Sweden since 1981. This database let them know who had a tonsillectomy or adenoidectomy, and when, and what happened to them later in life.
I think the best way to present these data is to show you what they found, and then challenge that finding, and then show you what they did in anticipation of the challenges we would have to their findings. It’s a pretty thorough study.
So, topline results here. The researchers first identified 83,957 individuals who had their tonsils removed. They matched each of them with 10 controls who did not have their tonsils removed but were the same age and sex.
Over around 30 years of follow-up, those people who had their tonsils removed were 43% more likely to develop a stress-related disorder. Among the specific disorders, the risk for PTSD was substantially higher: 55% higher in the tonsillectomy group.
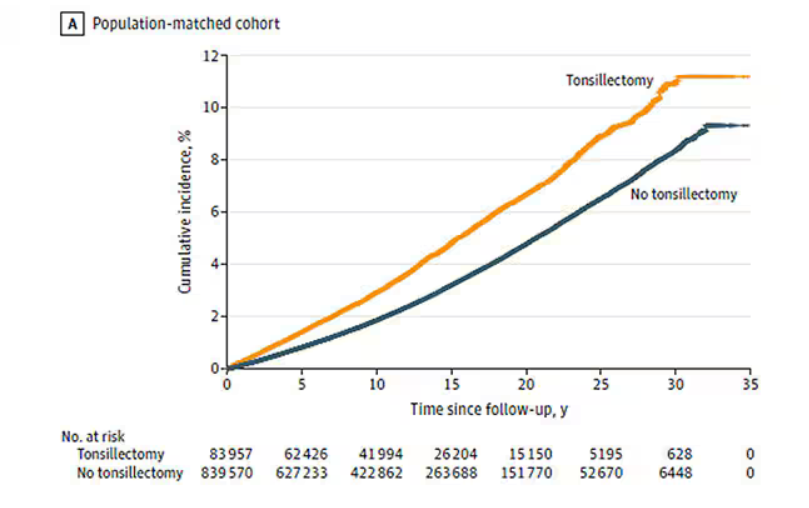
That’s pretty surprising, but I bet you already want to push back against this. Sure, the control group was the same age and sex, but other factors might be different between the two groups. You’d be right to think so. People who got their tonsils out were more likely to have parents with a history of stress-related disorders and who had lower educational attainment. But the primary results were adjusted for those factors.
There’s more to a family than parental educational attainment, of course. To account for household factors that might be harder to measure, the researchers created a second control group, this one comprising the siblings of people who had their tonsils removed but who hadn’t themselves had their tonsils removed.
The relationship between tonsillectomy and stress disorders in this population was not quite as robust but still present: a 34% increase in any stress disorder and a 41% increase in the risk for PTSD.
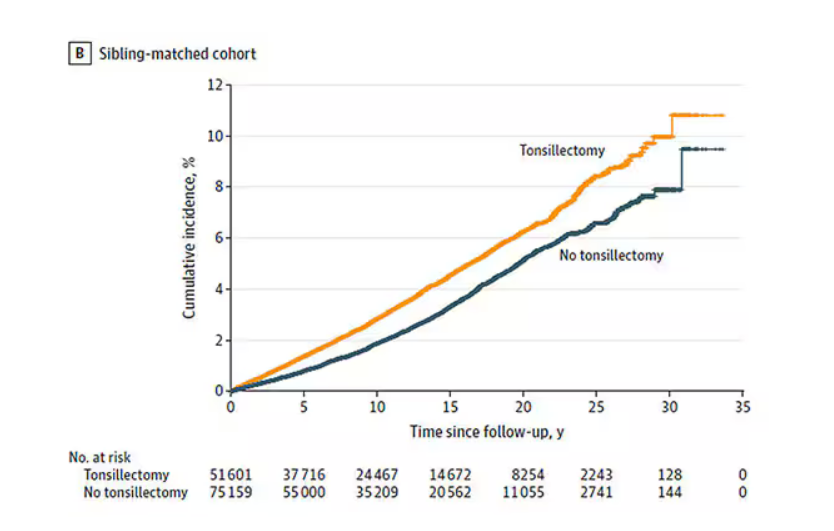
Maybe kids who get their tonsils out are just followed more closely thereafter, so doctors might notice a stress disorder and document it in the medical record; whereas with other kids it might go unnoticed. This is known as ascertainment bias. The researchers addressed this in a sensitivity analysis where they excluded new diagnoses of stress disorders that occurred in the first 3 years after tonsillectomy. The results were largely unchanged.
So how do we explain these data? We observe a correlation between tonsillectomy in youth and stress disorders in later life. But correlation is not causation. One possibility, perhaps even the most likely possibility, is that tonsillectomy is a marker of some other problem. Maybe these kids are more prone to infections and are therefore more likely to need their tonsils removed. Then, after a lifetime of more infections than average, their stress responses are higher. Or maybe kids with a higher BMI are more likely to have their tonsils removed due to sleep apnea concerns, and it’s that elevated BMI that leads to higher stress in later life.
Or maybe this is causal. Maybe there actually is biological plausibility here. The authors suggest that removal of tonsils might lead to broader changes in the immune system; after all, tonsillar tissue is on the front line of our defense against pathogens that might enter our bodies through our mouths or noses. Immunologic changes lead to greater inflammation over time, and there is decent evidence to link chronic inflammation to a variety of physical and psychological disorders.
In support of this, the authors show that the kids with tonsillectomy were more likely to be hospitalized for an infectious disease in the future as well, in magnitudes similar to the increased risk for stress. But they don’t actually show that the relationship between tonsillectomy and stress is mediated by that increased risk for infectious disease.
In the end, I find these data really intriguing. Before I dug into the literature, it seemed highly unlikely that removal of these small lumps of tissue would have much of an effect on anything. Now I’m not so sure. A few things can be removed from the human body without any consequences, but it can be hard to know exactly what those consequences are.
That said, given the rather marginal benefits of tonsillectomy and the growing number of studies expanding on the risks, I expect that we’ll see the rates of the surgery decline even further in the future.
F. Perry Wilson, MD, MSCE, is an associate professor of medicine and public health and director of Yale’s Clinical and Translational Research Accelerator in New Haven, Connecticut. He reported no relevant conflicts of interest.
A version of this article first appeared on Medscape.com.
This transcript has been edited for clarity.
You know those times in your life when you’re just feeling ... stressed? You’re on the edge; you have no chill; everything just sort of gets to you. If you can step away from the anxiety for a moment, you might ask yourself where it’s all coming from. Is it really the stuff in your inbox at work or is it money issues at home? Is it something with your relationship, or maybe it’s your sleep quality or your diet? One thing you probably won’t blame for those acute stress reactions is the tonsillectomy you had as a kid. But according to new research, maybe you should.
Tonsillectomy and adenoidectomy are among the most common surgical procedures young people in the United States undergo, with about 300,000 cases a year, according to recent numbers. That’s down a bit from numbers a decade or so ago, but suffice it to say, a good chunk of the population is walking around right now without their tonsils.
The data supporting tonsillectomy have never been great. The two big indications for the surgery are recurrent sore throat — data show that tonsillectomy reduces this by about 0.7 sore throats per year— and obstructive sleep apnea (OSA). The data for improvement of OSA are a bit better than the data for sore throats.
Also, tonsillectomy is a relatively quick, relatively well-reimbursed surgery with indications that are — let’s be honest — somewhat subjective, and so variation is high. One study found that in a single Vermont town, nearly 60% of the population had had their tonsils removed by the time they turned 18. A few towns over, the rate was 20%.
A few factors have led to the decline of tonsillectomy in recent years. Reimbursement rates have gone down a bit. Additionally, better data collection and statistical analysis have shown that the benefits of the procedure are relatively modest.
And then there is a body of medical literature that at first struck me as surprising and almost bizarre: data linking tonsillectomy to subsequent physical and psychiatric disorders.
I teach a course on interpretation of the medical literature, and one of the first things I teach my students is to check their gut when they see the conclusion of a study.
Basically, even before you read the data, have a sense in your own mind if the hypothesis seems reasonable. If a paper is going to conclude that smoking leads to increased risk for bone cancer, I’d say that seems like a reasonable thing to study. If a paper purports to show a link between eating poultry and bone cancer, I’m going to be reading it with quite a bit more skepticism.
The technical term for that process is assessing “biologic plausibility.” If we’re talking tonsils, we have to ask ourselves: Is it plausible that removing someone’s tonsils when they are young should lead to major problems in the future?
At first blush, it didn’t seem very plausible to me.
But the truth is, there are quite a few studies out there demonstrating links like this: links between tonsillectomy and irritable bowel syndrome; links between tonsillectomy and cancer; links between tonsillectomy and depression.
And this week, appearing in JAMA Network Open, is a study linking tonsillectomy with stress disorders.
Researchers leveraged Sweden’s health database, which contains longitudinal data on basically every person who has lived in Sweden since 1981. This database let them know who had a tonsillectomy or adenoidectomy, and when, and what happened to them later in life.
I think the best way to present these data is to show you what they found, and then challenge that finding, and then show you what they did in anticipation of the challenges we would have to their findings. It’s a pretty thorough study.
So, topline results here. The researchers first identified 83,957 individuals who had their tonsils removed. They matched each of them with 10 controls who did not have their tonsils removed but were the same age and sex.
Over around 30 years of follow-up, those people who had their tonsils removed were 43% more likely to develop a stress-related disorder. Among the specific disorders, the risk for PTSD was substantially higher: 55% higher in the tonsillectomy group.
That’s pretty surprising, but I bet you already want to push back against this. Sure, the control group was the same age and sex, but other factors might be different between the two groups. You’d be right to think so. People who got their tonsils out were more likely to have parents with a history of stress-related disorders and who had lower educational attainment. But the primary results were adjusted for those factors.
There’s more to a family than parental educational attainment, of course. To account for household factors that might be harder to measure, the researchers created a second control group, this one comprising the siblings of people who had their tonsils removed but who hadn’t themselves had their tonsils removed.
The relationship between tonsillectomy and stress disorders in this population was not quite as robust but still present: a 34% increase in any stress disorder and a 41% increase in the risk for PTSD.
Maybe kids who get their tonsils out are just followed more closely thereafter, so doctors might notice a stress disorder and document it in the medical record; whereas with other kids it might go unnoticed. This is known as ascertainment bias. The researchers addressed this in a sensitivity analysis where they excluded new diagnoses of stress disorders that occurred in the first 3 years after tonsillectomy. The results were largely unchanged.
So how do we explain these data? We observe a correlation between tonsillectomy in youth and stress disorders in later life. But correlation is not causation. One possibility, perhaps even the most likely possibility, is that tonsillectomy is a marker of some other problem. Maybe these kids are more prone to infections and are therefore more likely to need their tonsils removed. Then, after a lifetime of more infections than average, their stress responses are higher. Or maybe kids with a higher BMI are more likely to have their tonsils removed due to sleep apnea concerns, and it’s that elevated BMI that leads to higher stress in later life.
Or maybe this is causal. Maybe there actually is biological plausibility here. The authors suggest that removal of tonsils might lead to broader changes in the immune system; after all, tonsillar tissue is on the front line of our defense against pathogens that might enter our bodies through our mouths or noses. Immunologic changes lead to greater inflammation over time, and there is decent evidence to link chronic inflammation to a variety of physical and psychological disorders.
In support of this, the authors show that the kids with tonsillectomy were more likely to be hospitalized for an infectious disease in the future as well, in magnitudes similar to the increased risk for stress. But they don’t actually show that the relationship between tonsillectomy and stress is mediated by that increased risk for infectious disease.
In the end, I find these data really intriguing. Before I dug into the literature, it seemed highly unlikely that removal of these small lumps of tissue would have much of an effect on anything. Now I’m not so sure. A few things can be removed from the human body without any consequences, but it can be hard to know exactly what those consequences are.
That said, given the rather marginal benefits of tonsillectomy and the growing number of studies expanding on the risks, I expect that we’ll see the rates of the surgery decline even further in the future.
F. Perry Wilson, MD, MSCE, is an associate professor of medicine and public health and director of Yale’s Clinical and Translational Research Accelerator in New Haven, Connecticut. He reported no relevant conflicts of interest.
A version of this article first appeared on Medscape.com.
Is Vitamin E Beneficial for Bone Health?
Vitamin E may be best known for boosting skin and eye health as well as immune function. In recent years, researchers have explored the potential benefits of vitamin E on bone loss, especially in women with menopause-related osteoporosis. While data are beginning to roll in from these studies, evidence supporting a positive impact of vitamin E on osteoporosis and hip fracture risk in perimenopausal women remains elusive.
For osteoporosis, the rationale for using vitamin E is based on its antioxidant activity, which can scavenge potentially damaging free radicals. Researchers have asked whether vitamin E can help maintain the integrity of bone matrix and stimulate bone formation while minimizing bone resorption, particularly in trabecular (spongy) bone, the bone compartment preferentially affected in perimenopausal bone loss.
Vitamin E mostly consists of two isomers: alpha-tocopherol and gamma-tocopherol. Alpha-tocopherol has higher antioxidant activity and is found in nuts, seeds, vegetable oils, green leafy vegetables, fortified cereals, and vitamin E supplements. Gamma-tocopherol is known for its superior anti-inflammatory properties and accounts for about 70% of the total vitamin E intake in a typical American diet, largely sourced from soybean and other vegetable oils.
Benefits and Risks in Bone Loss Studies
Perimenopausal bone loss is caused, to a great extent, by the decrease in sex hormones. Studies of vitamin E in ovariectomized rats have yielded mixed results. This animal model lacks sex hormones and has similar bone changes to those of postmenopausal women. Some animal studies have suggested a positive effect of vitamin E on bone while others have reported no effect.
Studies in humans also have produced conflicting reports of positive, neutral, and negative associations of vitamin E with bone health. For example, the Women’s Health Initiative examined the relationship between vitamin and mineral antioxidants and bone health in postmenopausal women and found no significant association between antioxidants and bone mineral density.
Another study examining data from children and adolescents enrolled in the National Health and Nutrition Examination Survey (NHANES) database found an inverse association between alpha-tocopherol and lumbar spine bone density, suggesting a deleterious effect on bone. Inverse associations also have been reported in certain studies of postmenopausal women.
High doses of alpha-tocopherol have been linked to a risk for impaired bone health through a variety of mechanisms, such as interference with vitamin K metabolism; competitive binding for alpha-tocopherol transfer protein, inhibiting the entry of beneficial vitamin E isomers, including gamma-tocopherol; and pro-oxidant effects that harm bone. Thus, postmenopausal women taking vitamin E supplements primarily as high doses of alpha-tocopherol might be hindering their bone health.
Data for gamma-tocopherol are more promising. Some studies hypothesize that gamma-tocopherol might uncouple bone turnover, leading to increased bone formation without affecting bone resorption. Further, a randomized controlled study of mixed tocopherols (rather than alpha-tocopherol) vs placebo reported a protective effect of this preparation on bone outcomes by suppressing bone resorption. This raises the importance of considering the specific forms of vitamin E when evaluating its role in bone health.
Limitations of Current Studies
Researchers acknowledge several limitations in studies to date. For example, there are very few randomized controlled trials assessing the impact of vitamin E on bone health. Most studies are cross-sectional or observational, even when longitudinal. Cross-sectional and observational designs prevent us from establishing a causal relationship between vitamin E and bone endpoints.
Such designs also run the risk of additional confounders that may affect associations between vitamin E and bone, or the lack thereof. These could include both known and unknown confounders. Of note, gamma-tocopherol intake data were not available for certain NHANES studies.
Further, people often consume multiple nutrients and supplements, complicating the identification of specific nutrient-disease associations. Most human studies estimate tocopherol intake by dietary questionnaires or measure serum tocopherol levels, which reflect short-term dietary intake, while bone mineral density is probably influenced by long-term dietary patterns.
Too Soon to Prescribe Vitamin E for Bone Health
Some nutrition experts advocate for vitamin E supplements containing mixed tocopherols, specifically suggesting a ratio of 50-100 IU of gamma-tocopherol per 400 IU of D-alpha-tocopherol. Additional research is essential to confirm and further clarify the role of gamma-tocopherol in bone formation and resorption. In fact, it is also important to explore the influence of other compounds in the vitamin E family on skeletal health.
Until more data are available, we would recommend following the Institute of Medicine’s guidelines for the recommended daily allowance (RDA) of vitamin E. This is age dependent, ranging from 4 to 11 mg/d between the ages of 0 and 13 years, and 15 mg/d thereafter.
Overall, evidence of vitamin E’s impact on osteoporosis and hip fracture risk in perimenopausal women remains inconclusive. Although some observational and interventional studies suggest potential benefits, more interventional studies, particularly randomized controlled trials, are necessary to explore the risks and benefits of vitamin E supplementation and serum vitamin E levels on bone density and fracture risk more thoroughly.
Dr. Pani, Assistant Professor, Department of Internal Medicine, UVA School of Medicine; Medical Director, Department of General Medicine, Same Day Care Clinic, both in Charlottesville, has disclosed no relevant financial relationships. Dr. Misra, Professor, Chair, Physician-in-Chief, Department of Pediatrics, University of Virginia, and UVA Health Children’s, Charlottesville, has disclosed being a key opinion leader for Lumos Pharma.
A version of this article appeared on Medscape.com.
Acne Outcome Measures: Do they Incorporate LGBTQ+ Inclusive Language?
TOPLINE:
with heteronormative terms used in three of six measures addressing intimate relationships.
METHODOLOGY:
- Researchers conducted an inductive thematic analysis of 22 PROMs for acne, identified through a PubMed search.
- LGBTQ+-inclusive language was defined per the National Institutes of Health style guide.
- The analysis included 16 PROMs: Nine were acne-specific with 56 relevant items, 4 were dermatology-specific with 28 items, and 4 were health-related with 43 items.
TAKEAWAY:
- LGBTQ+-noninclusive language was identified in four of nine acne-specific PROMs — the Acne Disability Index (ADI), Acne Quality of Life Scale (AQOL), Acne-Quality of Life (Acne-QoL), and Cardiff Acne Disability Index (CADI) — but not in health-related or dermatology-specific PROMs.
- Among PROMs addressing intimate relationships, three of six acne-specific measures (CADI, ADI, and Acne-QoL) used heteronormative language, while three acne-specific PROMs, three dermatology-specific PROMs, and one health-related PROM used nonheteronormative terminology (such as “partner”).
- All PROMs contained items with nongendered pronouns (such as “I” or “you” instead of “he” or “she”). However, the AQOL included gendered language (“brothers” and “sisters,” rather than “siblings”).
- Two acne-specific PROMs demonstrated partial LGBTQ+ inclusivity, incorporating some but not all LGBTQ+ identities.
IN PRACTICE:
“Using LGBTQ+-inclusive language may promote the acquisition of accurate and relevant data for patient care and clinical trials and even enhance patient-clinician relationships,” the authors of the study wrote. “While demographics such as sex, age, race, and ethnicity are commonly considered during patient-reported outcome development and validation,” wrote the authors of an accompanying editorial, the study highlights that “sexual orientation and gender identity should also be considered to ensure these measures have similar performance across diverse populations.”
SOURCE:
The study was led by Twan Sia, BA, Department of Dermatology, Stanford University School of Medicine in California. The authors of the editorial were John S. Barbieri, MD, MBA, Department of Dermatology, Brigham and Women’s Hospital, Boston, Massachusetts, and Mya L. Roberson, MSPH, PhD, University of North Carolina at Chapel Hill.
LIMITATIONS:
The study was limited to the analysis of only English-language PROMs.
DISCLOSURES:
Two study authors disclosed receiving grants or personal fees from various sources, including pharmaceutical companies outside the submitted work. Barbieri disclosed receiving consulting fees from Dexcel Pharma and Honeydew Care; Roberson disclosed receiving consulting fees from the National Committee for Quality Assurance.
This article was created using several editorial tools, including AI, as part of the process. Human editors reviewed this content before publication. A version of this article first appeared on Medscape.com.
Cutaneous Lupus Associated with Greater Risk for Atherosclerotic Cardiovascular Disease
TOPLINE:
than with psoriasis.
METHODOLOGY:
- A retrospective matched longitudinal study compared the incidence and prevalence of ASCVD of 8138 individuals with CLE; 24,675 with SLE; 192,577 with psoriasis; and 81,380 control individuals.
- The disease-free control population was matched in a 10:1 ratio to the CLE population on the basis of age, sex, insurance type, and enrollment duration.
- Prevalent ASCVD was defined as coronary artery disease, prior myocardial infarction, or cerebrovascular accident, with ASCVD incidence assessed by number of hospitalizations over 3 years.
TAKEAWAY:
- Persons with CLE had higher ASCVD risk than control individuals (odds ratio [OR], 1.72; P < .001), similar to those with SLE (OR, 2.41; P < .001) but unlike those with psoriasis (OR, 1.03; P = .48).
- ASCVD incidence at 3 years was 24.8 per 1000 person-years for SLE, 15.2 per 1000 person-years for CLE, 14.0 per 1000 person-years for psoriasis, and 10.3 per 1000 person-years for controls.
- Multivariable Cox proportional regression modeling showed ASCVD risk was highest in those with SLE (hazard ratio [HR], 2.23; P < .001) vs CLE (HR, 1.32; P < .001) and psoriasis (HR, 1.06; P = .09).
- ASCVD prevalence was higher in individuals with CLE receiving systemic therapy (2.7%) than in those receiving no therapy (1.6%), suggesting a potential link between disease severity and CVD risk.
IN PRACTICE:
“Persons with CLE are at higher risk for ASCVD, and guidelines for the evaluation and management of ASCVD may improve their quality of care,” the authors wrote.
SOURCE:
The study was led by Henry W. Chen, MD, Department of Dermatology, University of Texas Southwestern Medical Center, Dallas. It was published online on December 4, 2024, in JAMA Dermatology.
LIMITATIONS:
The study was limited by its relatively young population (median age, 49 years) and the exclusion of adults aged > 65 years on Medicare insurance plans. The database lacked race and ethnicity data, and the analysis was restricted to a shorter 3-year period. The study could not fully evaluate detailed risk factors such as blood pressure levels, cholesterol measurements, or glycemic control, nor could it accurately assess smoking status.
DISCLOSURES:
The research was supported by the Department of Dermatology at the University of Texas Southwestern Medical Center and a grant from the National Institutes of Health. Several authors reported receiving grants or personal fees from various pharmaceutical companies. One author reported being a deputy editor for diversity, equity, and inclusion at JAMA Cardiology. Additional disclosures are noted in the original article.
This article was created using several editorial tools, including AI, as part of the process. Human editors reviewed this content before publication. A version of this article first appeared on Medscape.com.