User login
Bundled payments reduce costs in joint patients
Clinical question: Does bundled payment for lower extremity joint replacement (LEJR) reduce cost without compromising the quality of care?
Study design: Observational study.
Setting: BPCI-participating hospitals.
Synopsis: At BPCI-participating hospitals, there were 29,441 LEJR episodes in the baseline period and 31,700 episodes in the intervention period; these were compared with a control group of 29,440 episodes in the baseline period and 31,696 episodes in the intervention period. The BPCI initiative was associated with a significant reduction in Medicare per-episode payments, which declined by an estimated $1,166 more (95% confidence interval, –$1634 to –$699; P less than .001) for the BPCI group than for the comparison group (between baseline and intervention periods).
There were no statistical differences in claims-based quality measures between the BPCI and comparison populations, which included 30- and 90-day unplanned readmissions, ED visits, and postdischarge mortality.
Bottom line: Bundled payments for joint replacements may have the potential to decrease cost while maintaining quality of care.
Citation: Dummit L, Kahvecioglu D, Marrufo G, et al. Association between hospital participation in a Medicare bundled payment initiative and payments and quality outcomes for lower extremity joint e replacement episodes. JAMA. 2016;316(12):1267-1278.
Dr. Briones is an assistant professor at the University of Miami Miller School of Medicine and medical director of the hospitalist service at the University of Miami Hospital.
Pleth Variability Index shows promise for asthma assessments
Clinical question: Does pulse variability on plethysmography, or the Pleth Variability Index (PVI), correlate with disease severity in obstructive airway disease in children?
Background: Asthma is the most common reason for hospitalization in the United S. for children 3-12 years old. Asthma accounts for a quarter of ED visits for children aged 1-9 years old.1 Although systems have been developed to assess asthma exacerbation severity and the need for hospitalization, many of these depend on reassessments over time or have been proven to be invalid in larger studies.2,3,4 Pulsus paradoxus (PP), which is defined as a drop in systolic blood pressure greater than 10 mm Hg, correlates with the severity of obstruction in asthma exacerbations, but it is not practical in the children being evaluated in the ED or hospital.5,6 PP measurement using plethysmography has been found to correlate with measurement by sphygmomanometry.7 Furthermore, PVI, which is derived from amplitude variability in the pulse oximeter waveform, has been found to correlate with fluid responsiveness in mechanically ventilated patients. To this date, no study has assessed the correlation between PVI and exacerbation severity in asthma.

Setting: A 137-bed, tertiary-care children’s hospital.
Synopsis: Over a 6-month period on weekdays, researchers enrolled patients aged 1-18 years evaluated in the ED for asthma exacerbations or reactive airway disease. ED staff diagnosed patients clinically, and other patients with conditions known to affect PP – such as dehydration, croup, and cardiac disease – were excluded. PVI was calculated by measuring the minimum perfusion index (PImin) and the maximum perfusion index (PImax) using the following formula:

A printout of the first ED pulse oximetry reading was used to obtain the PImax and PImin as below:
Researchers followed patients after the initial evaluation to determine disposition from the ED, which included either discharge to home, admission to a general pediatrics floor, or admission to the PICU. The hospital utilized specific criteria for disposition from the ED (see Table 1).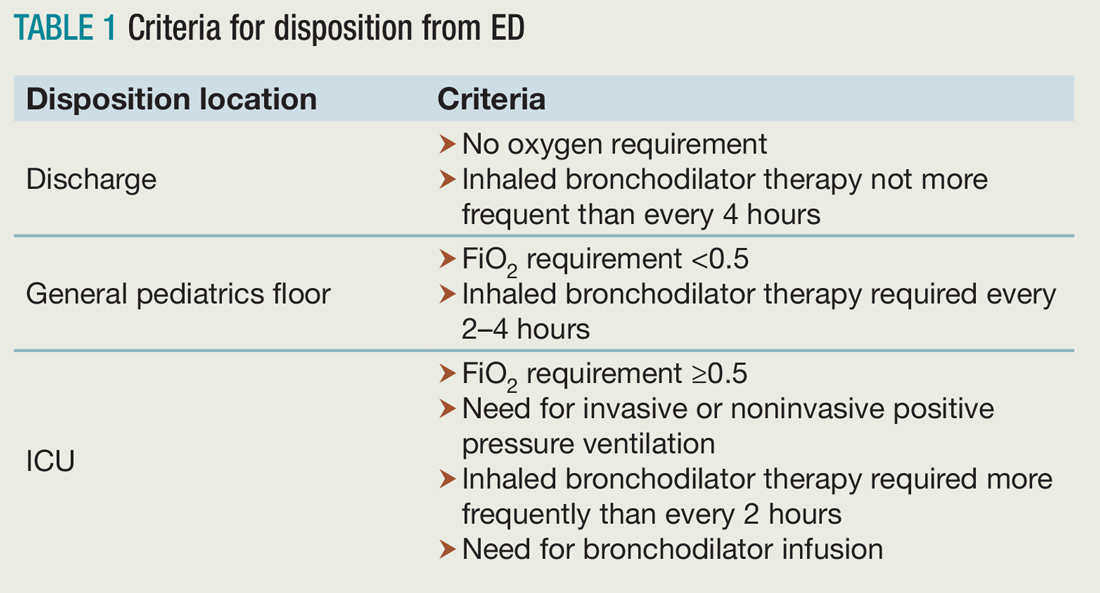
Of the 117 patients who were analyzed after application of exclusion criteria, 48 were discharged to home, 61 were admitted to a general pediatrics floor, and eight were admitted to the PICU. The three groups were found to be demographically similar. Researchers found a significant difference between the PVI of the three groups, but pairwise analysis showed no significant difference between the PVI of patients admitted to the general pediatrics floor versus discharged to home (see Table 2).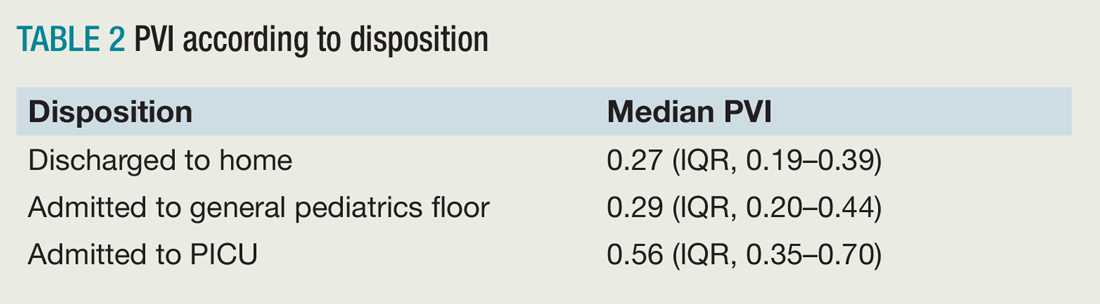
Bottom line: PVI shows promise as a tool to rapidly assess disease severity in pediatric patients being evaluated and treated for asthma, but further studies are needed to validate this in the ED and hospital setting.
Citation: Brandwein A, Patel K, Kline M, Silver P, Gangadharan S. Using pleth variability as a triage tool for children with obstructive airway disease in a pediatric emergency department [published online ahead of print Oct. 6, 2016]. Pediatr Emerg Care. doi: 10.1097/PEC.0000000000000887.
References
1. Care of children and adolescents in U.S. hospitals. Agency for Healthcare Research and Quality website. Available at: https://archive.ahrq.gov/data/hcup/factbk4/factbk4.htm. Accessed Nov. 18, 2016.
2. Kelly AM, Kerr D, Powell C. Is severity assessment after one hour of treatment better for predicting the need for admission in acute asthma? Respir Med. 2004;98(8):777-781.
3. Keogh KA, Macarthur C, Parkin PC, et al. Predictors of hospitalization in children with acute asthma. J Pediatr. 2001;139(2):273-277.
4. Keahey L, Bulloch B, Becker AB, et al. Initial oxygen saturation as a predictor of admission in children presenting to the emergency department with acute asthma. Ann Emerg Med. 2002;40(3):300-307.
5. Guntheroth WG, Morgan BC, Mullins GL. Effect of respiration on venous return and stroke volume in cardiac tamponade. Mechanism of pulsus paradoxus. Circ Res. 1967;20(4):381-390.
6. Frey B, Freezer N. Diagnostic value and pathophysiologic basis of pulsus paradoxus in infants and children with respiratory disease. Pediatr Pulmonol. 2001;31(2):138-143.
7. Clark JA, Lieh-Lai M, Thomas R, Raghavan K, Sarnaik AP. Comparison of traditional and plethysmographic methods for measuring pulsus paradoxus. Arch Pediatr Adolesc Med. 2004;158(1):48-51.
Clinical question: Does pulse variability on plethysmography, or the Pleth Variability Index (PVI), correlate with disease severity in obstructive airway disease in children?
Background: Asthma is the most common reason for hospitalization in the United S. for children 3-12 years old. Asthma accounts for a quarter of ED visits for children aged 1-9 years old.1 Although systems have been developed to assess asthma exacerbation severity and the need for hospitalization, many of these depend on reassessments over time or have been proven to be invalid in larger studies.2,3,4 Pulsus paradoxus (PP), which is defined as a drop in systolic blood pressure greater than 10 mm Hg, correlates with the severity of obstruction in asthma exacerbations, but it is not practical in the children being evaluated in the ED or hospital.5,6 PP measurement using plethysmography has been found to correlate with measurement by sphygmomanometry.7 Furthermore, PVI, which is derived from amplitude variability in the pulse oximeter waveform, has been found to correlate with fluid responsiveness in mechanically ventilated patients. To this date, no study has assessed the correlation between PVI and exacerbation severity in asthma.
Setting: A 137-bed, tertiary-care children’s hospital.
Synopsis: Over a 6-month period on weekdays, researchers enrolled patients aged 1-18 years evaluated in the ED for asthma exacerbations or reactive airway disease. ED staff diagnosed patients clinically, and other patients with conditions known to affect PP – such as dehydration, croup, and cardiac disease – were excluded. PVI was calculated by measuring the minimum perfusion index (PImin) and the maximum perfusion index (PImax) using the following formula:
A printout of the first ED pulse oximetry reading was used to obtain the PImax and PImin as below:
Researchers followed patients after the initial evaluation to determine disposition from the ED, which included either discharge to home, admission to a general pediatrics floor, or admission to the PICU. The hospital utilized specific criteria for disposition from the ED (see Table 1).
Of the 117 patients who were analyzed after application of exclusion criteria, 48 were discharged to home, 61 were admitted to a general pediatrics floor, and eight were admitted to the PICU. The three groups were found to be demographically similar. Researchers found a significant difference between the PVI of the three groups, but pairwise analysis showed no significant difference between the PVI of patients admitted to the general pediatrics floor versus discharged to home (see Table 2).
Bottom line: PVI shows promise as a tool to rapidly assess disease severity in pediatric patients being evaluated and treated for asthma, but further studies are needed to validate this in the ED and hospital setting.
Citation: Brandwein A, Patel K, Kline M, Silver P, Gangadharan S. Using pleth variability as a triage tool for children with obstructive airway disease in a pediatric emergency department [published online ahead of print Oct. 6, 2016]. Pediatr Emerg Care. doi: 10.1097/PEC.0000000000000887.
References
1. Care of children and adolescents in U.S. hospitals. Agency for Healthcare Research and Quality website. Available at: https://archive.ahrq.gov/data/hcup/factbk4/factbk4.htm. Accessed Nov. 18, 2016.
2. Kelly AM, Kerr D, Powell C. Is severity assessment after one hour of treatment better for predicting the need for admission in acute asthma? Respir Med. 2004;98(8):777-781.
3. Keogh KA, Macarthur C, Parkin PC, et al. Predictors of hospitalization in children with acute asthma. J Pediatr. 2001;139(2):273-277.
4. Keahey L, Bulloch B, Becker AB, et al. Initial oxygen saturation as a predictor of admission in children presenting to the emergency department with acute asthma. Ann Emerg Med. 2002;40(3):300-307.
5. Guntheroth WG, Morgan BC, Mullins GL. Effect of respiration on venous return and stroke volume in cardiac tamponade. Mechanism of pulsus paradoxus. Circ Res. 1967;20(4):381-390.
6. Frey B, Freezer N. Diagnostic value and pathophysiologic basis of pulsus paradoxus in infants and children with respiratory disease. Pediatr Pulmonol. 2001;31(2):138-143.
7. Clark JA, Lieh-Lai M, Thomas R, Raghavan K, Sarnaik AP. Comparison of traditional and plethysmographic methods for measuring pulsus paradoxus. Arch Pediatr Adolesc Med. 2004;158(1):48-51.
Physicians and EHR time
Clinical question: How much time do ambulatory-care physicians spend on electronic health records (EHRs)?
Background: There is growing concern about physicians’ increased time and effort allocated to the EHR and decreased clinical face time and meaningful interaction with patients. Prior studies have shown that increased physician EHR task load is associated with increased physician stress and dissatisfaction.
Setting: Ambulatory-care practices.
Synopsis: Fifty-seven physicians from 16 practices in four U.S. states participated and were observed for more than 430 office hours. Additionally, 21 physicians completed a self-reported after-hours diary. During office hours, physicians spent 49.2% of their total time on the EHR and desk work and only 27% on face time with patients. While in the exam room, physicians spent 52.9% of the time on direct clinical face time and 37% on the EHR and desk work. Self-reported diaries showed an additional 1-2 hours of follow-up work on the EHR. These observations might not be generalizable to other practices. No formal statistical comparisons by physicians, practice, or EHR characteristics were done.
Bottom line: Ambulatory-care physicians appear to spend more time with EHR tasks and desk work than clinical face time with patients.
Citation: Sinsky C, Colligan L, Li L, et al. Allocation of physician time in ambulatory practice: a time and motion studies in 4 specialties [published online ahead of print Sept. 6, 2016]. Ann Intern Med. 165(11):753-760.
Dr. Briones is an assistant professor at the University of Miami Miller School of Medicine and medical director of the hospitalist service at the University of Miami Hospital.
Idle intravenous catheters are associated with preventable complications
Intravenous catheters (ICs) are common and necessary for inpatient care. However, peripheral and especially central venous catheters (CVCs) are associated with increased risk for local and systemic complications, including bloodstream infections and endocarditis.

Prevention of these complications is important and should be a major focus of infection control and patient safety practices. There are three main points of focus on infection prevention with regard to ICs – proper insertion techniques, proper care of the catheter, and prompt removal when it is no longer necessary.
We focused our review, published in the American Journal of Infection Control (2016 Oct. doi: 10.1016/j.ajic.2016.03.073), on the final point – determining the prevalence, risk factors, and outcomes related to idle intravenous catheters. To accomplish this, we conducted an integrative review of published studies related to idle catheters, excluding reviews, abstracts, and commentaries. Thirteen studies met the inclusion criteria and four of these focused on CVCs.
Generally, an idle catheter is one that remains in place even though it is not being used for patient care. However, the definition of an “idle” catheter varied amongst the reviewed studies, as did the unit of measure, especially for peripheral catheters. Central venous catheter-focused studies were more consistent in using “idle catheter days” and “catheter days.”
Studies of peripheral catheters revealed that 16%-50% of patients had an idle catheter of some type. For the studies focused on CVCs, the percentage of patients with idle catheters ranged from 2.7% in one intensive care unit to 26.2% in a different study. Interestingly, in the study with 2.7% idle CVCs in the ICU, there was a higher percentage of idle CVCs outside of the ICU in the same hospital.
The major reasons for leaving catheters in place in studies where reasons were noted were convenience, future intention to use intravenous medication, and inappropriate use of intravenous medications when oral could be used.
Although data are scarce, complications in the reviewed studies were relatively common with idle peripheral catheters, where 9%-12% suffered thrombophlebitis. Obviously, the risk for catheter-related bloodstream infection increases as the number of catheter days increases – this is especially important with regard to idle CVCs.
Decreasing the prevalence of idle catheters is likely to decrease the risk for infection and improve patient safety. Based on our review of the data, a standardized definition of an “idle catheter” is needed. At the very least, a standard definition should be developed at each institution. This would allow an individual hospital the ability to identify and track the presence of these lines, and implement targeted interventions to decrease the proportion of idle lines. Ideally, a common definition would be created and validated so that data and interventions could be comparable across institutions and guidelines could be developed.
The goal of targeted interventions should be zero idle lines. Prevention of idle peripheral catheters should also be pursued, but because CVC-related complications are often more serious, these lines are often the focus of efforts. Use of peripherally inserted central catheters (PICCs) has increased and while these catheters in some settings may have decreased complication risk, compared with femoral/internal jugular/subclavian CVCs, prevention of idle catheter days is paramount for these catheters as well.
Many ICUs, including at our own institution, have instituted programs to closely monitor for ongoing need for CVCs. This increased focus on the CVC likely explains the lower rates of idle catheters in ICUs noted in the reviewed studies. This close surveillance can be done outside of the ICU as well, and could include peripheral catheters.
At our own institution, the need for catheters is reviewed on some units as part of formalized patient safety rounds. Another potential group of interventions could focus on electronic medical record (EMR)-based changes such as limits on the duration of the order, requirement for renewal of the order, or on-screen reminders of the presence of a catheter. This sort of intervention could possibly be expanded as EMR use becomes more common and robust. For instance, if intravenous medications have not been ordered or given in a certain amount of time, an alert might be triggered. Another EMR-based mechanism could be to require an indication for ongoing catheter use.
Education about the potential adverse outcomes of idle catheters is important. Promoting a team-based approach to interventions, where all involved team members can discuss patient safety issues on equal ground is paramount to successfully decreasing idle catheters and improving patient care and safety in general. As with other hospital-wide initiatives, engagement of hospital administration is important to decrease barriers to implementation.
Intravenous catheter use will remain an integral part of patient care, but efforts should be made to create standardization around the definition of an idle catheter, standardize units of measure, and institute programs to prevent idle catheters.
Daniel Shirley, MD, MS, is assistant professor in the division of infectious disease at the University of Wisconsin–Madison School of Medicine and Public Health and the William S. Middleton Memorial Veterans Hospital. Nasia Safdar, MD, PhD, is associate professor in the division of infectious disease at the University of Wisconsin–Madison School of Medicine and Public Health and the William S. Middleton Memorial Veterans Hospital.
Intravenous catheters (ICs) are common and necessary for inpatient care. However, peripheral and especially central venous catheters (CVCs) are associated with increased risk for local and systemic complications, including bloodstream infections and endocarditis.
Prevention of these complications is important and should be a major focus of infection control and patient safety practices. There are three main points of focus on infection prevention with regard to ICs – proper insertion techniques, proper care of the catheter, and prompt removal when it is no longer necessary.
We focused our review, published in the American Journal of Infection Control (2016 Oct. doi: 10.1016/j.ajic.2016.03.073), on the final point – determining the prevalence, risk factors, and outcomes related to idle intravenous catheters. To accomplish this, we conducted an integrative review of published studies related to idle catheters, excluding reviews, abstracts, and commentaries. Thirteen studies met the inclusion criteria and four of these focused on CVCs.
Generally, an idle catheter is one that remains in place even though it is not being used for patient care. However, the definition of an “idle” catheter varied amongst the reviewed studies, as did the unit of measure, especially for peripheral catheters. Central venous catheter-focused studies were more consistent in using “idle catheter days” and “catheter days.”
Studies of peripheral catheters revealed that 16%-50% of patients had an idle catheter of some type. For the studies focused on CVCs, the percentage of patients with idle catheters ranged from 2.7% in one intensive care unit to 26.2% in a different study. Interestingly, in the study with 2.7% idle CVCs in the ICU, there was a higher percentage of idle CVCs outside of the ICU in the same hospital.
The major reasons for leaving catheters in place in studies where reasons were noted were convenience, future intention to use intravenous medication, and inappropriate use of intravenous medications when oral could be used.
Although data are scarce, complications in the reviewed studies were relatively common with idle peripheral catheters, where 9%-12% suffered thrombophlebitis. Obviously, the risk for catheter-related bloodstream infection increases as the number of catheter days increases – this is especially important with regard to idle CVCs.
Decreasing the prevalence of idle catheters is likely to decrease the risk for infection and improve patient safety. Based on our review of the data, a standardized definition of an “idle catheter” is needed. At the very least, a standard definition should be developed at each institution. This would allow an individual hospital the ability to identify and track the presence of these lines, and implement targeted interventions to decrease the proportion of idle lines. Ideally, a common definition would be created and validated so that data and interventions could be comparable across institutions and guidelines could be developed.
The goal of targeted interventions should be zero idle lines. Prevention of idle peripheral catheters should also be pursued, but because CVC-related complications are often more serious, these lines are often the focus of efforts. Use of peripherally inserted central catheters (PICCs) has increased and while these catheters in some settings may have decreased complication risk, compared with femoral/internal jugular/subclavian CVCs, prevention of idle catheter days is paramount for these catheters as well.
Many ICUs, including at our own institution, have instituted programs to closely monitor for ongoing need for CVCs. This increased focus on the CVC likely explains the lower rates of idle catheters in ICUs noted in the reviewed studies. This close surveillance can be done outside of the ICU as well, and could include peripheral catheters.
At our own institution, the need for catheters is reviewed on some units as part of formalized patient safety rounds. Another potential group of interventions could focus on electronic medical record (EMR)-based changes such as limits on the duration of the order, requirement for renewal of the order, or on-screen reminders of the presence of a catheter. This sort of intervention could possibly be expanded as EMR use becomes more common and robust. For instance, if intravenous medications have not been ordered or given in a certain amount of time, an alert might be triggered. Another EMR-based mechanism could be to require an indication for ongoing catheter use.
Education about the potential adverse outcomes of idle catheters is important. Promoting a team-based approach to interventions, where all involved team members can discuss patient safety issues on equal ground is paramount to successfully decreasing idle catheters and improving patient care and safety in general. As with other hospital-wide initiatives, engagement of hospital administration is important to decrease barriers to implementation.
Intravenous catheter use will remain an integral part of patient care, but efforts should be made to create standardization around the definition of an idle catheter, standardize units of measure, and institute programs to prevent idle catheters.
Daniel Shirley, MD, MS, is assistant professor in the division of infectious disease at the University of Wisconsin–Madison School of Medicine and Public Health and the William S. Middleton Memorial Veterans Hospital. Nasia Safdar, MD, PhD, is associate professor in the division of infectious disease at the University of Wisconsin–Madison School of Medicine and Public Health and the William S. Middleton Memorial Veterans Hospital.
Hospitalists See Benefit from Working with ‘Surgicalists’

Time was critical. He needed surgery right away to remove his gallbladder. But for that, he needed a surgeon.
“There was a surgeon on call, but the surgeon was not picking up the phone,” Dr. Singh says. “I’m scratching my head. Why is the surgeon not calling back? Where is the surgeon? Did the pager get lost? What if the patient has a bad outcome?”
Eventually, Dr. Singh had to give up on the on-call surgeon, and the patient was flown to a hospital 45 miles away in downtown Sacramento. His surgery had been delayed for almost 12 hours.
The man lived largely due to good luck, Dr. Singh says. The unresponsive surgeon had disciplinary proceedings started against his license but retired rather than face the consequences.
Today, hospitalists at Sutter Amador no longer have to anxiously wait for those responses to emergency pages. It’s one of many hospitals that have turned to a “surgicalist” model, with a surgeon always on hand at the hospital. Surgicalists perform both emergency procedures and procedures that are tied to a hospital admission, without which a patient can’t be discharged. Although it is growing in popularity, the model is still only seen in a small fraction of hospitals.
The model is widely supported by hospitalists because it brings several advantages, mainly a greater availability of the surgeon for consult.
“We don’t have to hunt them down, trying to call their office, trying to see if they’re available to call back,” says Dr. Singh, who is now also the chair of medical staff performance at Sutter Amador and adds that the change has helped with his job satisfaction.
A Clear Delineation
Arrangements between hospitalists and surgicalists vary depending on the hospital, but there typically are clearly delineated criteria on who cares for whom, with the more urgent surgical cases tending to fall under the surgicalists’ care and those with less urgent problems, even though surgery might be involved, tending to go to hospitalists.
When a surgery-related question or the need for actual surgery arises, the model calls for a quick response time from the surgicalist. Hospitalists and surgicalists collaborate on ways to reduce length of stay and prevent readmissions since they share the same institutional goals. Hospitalists are also more in tune with the needs of the surgeons, for instance, not feeding a patient who is going to need quick surgery and not administering blood thinners when a surgery is imminent unless there’s an overriding reason not to do so.
One advantage of this collaboration is that a hospitalist working alongside a surgicalist can get extra surgery-related guidance even when surgery probably isn’t needed, says John Nelson, MD, MHM, a hospitalist at Overlake Medical Center in Bellevue, Wash., a hospitalist management consultant, and a past president of SHM.
“Maybe the opinion of a general surgeon could be useful, but maybe I can get along without it because the general surgeons are busy. It’s going to be hard for them to find time to see this patient, and they’re not going to be very interested in it,” he says. “But if instead I have a surgical hospitalist who’s there all day, it’s much less of a bother for them to come by and take a look at my patient.”
Remaining Challenges
The model is not without its hurdles. When surgicalists are on a 24-hour shift, the patients will see a new one each day, sometimes prompting them to ask, “Who’s my doctor?” Also, complex cases can pose a challenge as they move from one surgicalist to another day to day.
John Maa, MD, who wrote a seminal paper on surgicalists in 2007 based on an early surgicalist model he started at San Mateo Medical Center in California,1 says he is now concerned that the principles he helped make popular—the absorption of surgeons into a system as they work hand in hand with other hospital staff all the time—might be eroding. Some small staffing companies are calling themselves surgicalists, promising fast response times, but are actually locum tenens surgeons under a surgicalist guise, he says.
Properly rolled out, surgicalist programs mean a much better working relationship between hospitalists and surgeons, says Lynette Scherer, MD, FACS, chief medical officer at Surgical Affiliates Management Group in Sacramento. The company, founded in 1996, employs about 200 surgeons, twice as many as three years ago, Dr. Scherer says, but the company declined to share what that amounts to in full-time equivalent positions.
“The hospitalists know all of our algorithms, and they know when to call us,” Dr. Scherer says. “We share the patients on the inpatient side as we need to. We keep the ones that are appropriate for us, and they keep the ones that are appropriate for them.”
The details depend on the hospital, she says.
“Whenever we go to a new site, we sit down with the hospitalist team and say, ‘What do you need here?’ And our admitting grids are different based on what the different needs of the hospitals are.”
To stay on top of complex cases with very sick patients, the medical director rounds with the team nearly every day to help guide that care, Dr. Scherer says.
At Sutter Amador, the arrival of the surgicalist model has helped shorten the length of stay by almost one day for surgery admissions, Dr. Singh says.
Reported outcomes, however, seem to be mixed.
In 2008, Sutter Medical Center in Sacramento switched from a nine-surgeon call panel to four surgeons who covered the acute-care surgery service in 24-hour shifts. Researchers looked at outcomes from 2007, before the new model was adopted, and from the four subsequent years. The results were published in 2014 in the Journal of the American College of Surgeons.2
The total number of operations rose significantly, with 497 performed in 2007 and 640 in 2011. The percentage of cases with complications also fell significantly, from 21% in 2007 to 12% in 2011, with a low of 11% in 2010.
But the mortality rate rose significantly, from 1.4% in 2007 to 2.2% in 2011, with a high of 4.1% in 2008. The study authors note that the mortality rate ultimately fell back to levels not statistically significantly higher than the rate before the service. They suggested the spike could have been due to a greater willingness by the service to treat severely ill patients and due to the “immaturity” of the service in its earlier years. The percentage of cases with a readmission fell from 6.4% in 2007 to 4.7% in 2011, with a low of 3% in 2009, but that change wasn’t quite statistically significant.
“The data’s really bearing out that emergency patients are different in terms of the care they demand,” Dr. Scherer says. “So the patient with alcoholic cirrhosis who presents with a hole in his colon is very different than somebody who presents for an elective colon resection. And you can really reduce complications when you have a team of educated people taking care of these patients.”
Dr. Nelson says adopting the model “just means you’re a smoother operator and you can provide better service to people.” He adds that for any hospital that is getting poor surgical coverage and is paying for it, “it might make sense to consider it.”
Thomas R. Collins is a freelance medical writer based in Florida.
References
- Maa J, Carter JT, Gosnell JE, Wachter R, Harris HW. The surgical hospitalist: a new model for emergency surgical care. J Am Coll Surg. 2007;205(5):704-711.
- O’Mara MS, Scherer L, Wisner D, Owens LJ. Sustainability and success of the acute care surgery model in the nontrauma setting. J Am Coll Surg. 2014;219(1):90-98.
For a Model That Many Say Makes Sense, Why Not More Growth?

So why hasn’t the surgicalist field exploded? About 10 years ago, that’s what was predicted. In 2007, John Nelson, MD, MHM, a hospitalist at Overlake Medical Center in Bellevue, Wash., a hospitalist management consultant, and a past president of SHM, wrote an article saying the field could be close to a “surge” similar to the medical hospitalist explosion.1
It’s not known how many of the nation’s roughly 5,600 hospitals use a surgicalist model. There is no association for surgicalists, who are also sometimes called “surgical hospitalists.”
But according to Dr. Nelson’s anecdotal impressions, the number could range from 300 to 800 hospitals, he says. That would mean it is in place only in roughly 10% of U.S. hospitals.
Expansion of the field has been slowed by cost and politics.
Most hospitals don’t have enough surgeons to pull off a surgicalist program, and adding the right number of surgeons costs money, Dr. Nelson says.
And at smaller community hospitals that have used on-call surgeons for years, it’s a thorny issue. Those surgeons often get a call stipend for being on call. If surgeons don’t have a full slate of elective surgeries, they could rely on that on-call pay and resist the adoption of the surgicalist model, which would mean losing that pay, Dr. Nelson says.
“Some of the surgeons in the community might say, ‘I don’t really like ED call, but I have to keep doing it because of the stipend. I depend on it for my income,’” he says.
Even those who wouldn’t mind losing that on-call pay might not be enthusiastic about a move to a surgicalist model because it would bring more general surgeons into the region.
Some, Dr. Nelson says, might say, “How do I know that in two years they aren’t stealing my referrals? The new surgical hospitalist is also a potential competitor for referrals I depend on.”
And other surgeons might resist simply because they like the professional gratification of emergency surgery work, he says.
According to John Maa, MD, who wrote a seminal paper on surgicalists in 2007 based on an early surgicalist model he started at San Mateo Medical Center in California,2 “In a lot of academic centers that didn’t pay call stipend, this was just very simple for them to implement some model of this. … Once you try to send someone to an established group where there was already someone taking call, that became very controversial, and I’ve seen litigation result from that.”
Trauma surgeons resisted the model, at least in part, because of semantics: The term “surgical hospitalist” was too similar to “medical hospitalist,” and they worried it might imply a lack of surgical training, says Dr. Maa.
For now, the typical assessment of the model that Dr. Nelson hears is: “They’ve thought about it, they may in the future, but no, they don’t have one.”
“It’s not growing as fast as the medical hospitalist idea did,” he says. “But it is growing. It’s not going to go away, but it’s still relatively small.”
—Thomas R. Collins
References
- Nelson J. The surgical surge. The Hospitalist website. Accessed October 25, 2016.
- Maa J, Carter JT, Gosnell JE, Wachter R, Harris HW. The surgical hospitalist: a new model for emergency surgical care. J Am Coll Surg. 2007 ;205(5):704-711.
Time was critical. He needed surgery right away to remove his gallbladder. But for that, he needed a surgeon.
“There was a surgeon on call, but the surgeon was not picking up the phone,” Dr. Singh says. “I’m scratching my head. Why is the surgeon not calling back? Where is the surgeon? Did the pager get lost? What if the patient has a bad outcome?”
Eventually, Dr. Singh had to give up on the on-call surgeon, and the patient was flown to a hospital 45 miles away in downtown Sacramento. His surgery had been delayed for almost 12 hours.
The man lived largely due to good luck, Dr. Singh says. The unresponsive surgeon had disciplinary proceedings started against his license but retired rather than face the consequences.
Today, hospitalists at Sutter Amador no longer have to anxiously wait for those responses to emergency pages. It’s one of many hospitals that have turned to a “surgicalist” model, with a surgeon always on hand at the hospital. Surgicalists perform both emergency procedures and procedures that are tied to a hospital admission, without which a patient can’t be discharged. Although it is growing in popularity, the model is still only seen in a small fraction of hospitals.
The model is widely supported by hospitalists because it brings several advantages, mainly a greater availability of the surgeon for consult.
“We don’t have to hunt them down, trying to call their office, trying to see if they’re available to call back,” says Dr. Singh, who is now also the chair of medical staff performance at Sutter Amador and adds that the change has helped with his job satisfaction.
A Clear Delineation
Arrangements between hospitalists and surgicalists vary depending on the hospital, but there typically are clearly delineated criteria on who cares for whom, with the more urgent surgical cases tending to fall under the surgicalists’ care and those with less urgent problems, even though surgery might be involved, tending to go to hospitalists.
When a surgery-related question or the need for actual surgery arises, the model calls for a quick response time from the surgicalist. Hospitalists and surgicalists collaborate on ways to reduce length of stay and prevent readmissions since they share the same institutional goals. Hospitalists are also more in tune with the needs of the surgeons, for instance, not feeding a patient who is going to need quick surgery and not administering blood thinners when a surgery is imminent unless there’s an overriding reason not to do so.
One advantage of this collaboration is that a hospitalist working alongside a surgicalist can get extra surgery-related guidance even when surgery probably isn’t needed, says John Nelson, MD, MHM, a hospitalist at Overlake Medical Center in Bellevue, Wash., a hospitalist management consultant, and a past president of SHM.
“Maybe the opinion of a general surgeon could be useful, but maybe I can get along without it because the general surgeons are busy. It’s going to be hard for them to find time to see this patient, and they’re not going to be very interested in it,” he says. “But if instead I have a surgical hospitalist who’s there all day, it’s much less of a bother for them to come by and take a look at my patient.”
Remaining Challenges
The model is not without its hurdles. When surgicalists are on a 24-hour shift, the patients will see a new one each day, sometimes prompting them to ask, “Who’s my doctor?” Also, complex cases can pose a challenge as they move from one surgicalist to another day to day.
John Maa, MD, who wrote a seminal paper on surgicalists in 2007 based on an early surgicalist model he started at San Mateo Medical Center in California,1 says he is now concerned that the principles he helped make popular—the absorption of surgeons into a system as they work hand in hand with other hospital staff all the time—might be eroding. Some small staffing companies are calling themselves surgicalists, promising fast response times, but are actually locum tenens surgeons under a surgicalist guise, he says.
Properly rolled out, surgicalist programs mean a much better working relationship between hospitalists and surgeons, says Lynette Scherer, MD, FACS, chief medical officer at Surgical Affiliates Management Group in Sacramento. The company, founded in 1996, employs about 200 surgeons, twice as many as three years ago, Dr. Scherer says, but the company declined to share what that amounts to in full-time equivalent positions.
“The hospitalists know all of our algorithms, and they know when to call us,” Dr. Scherer says. “We share the patients on the inpatient side as we need to. We keep the ones that are appropriate for us, and they keep the ones that are appropriate for them.”
The details depend on the hospital, she says.
“Whenever we go to a new site, we sit down with the hospitalist team and say, ‘What do you need here?’ And our admitting grids are different based on what the different needs of the hospitals are.”
To stay on top of complex cases with very sick patients, the medical director rounds with the team nearly every day to help guide that care, Dr. Scherer says.
At Sutter Amador, the arrival of the surgicalist model has helped shorten the length of stay by almost one day for surgery admissions, Dr. Singh says.
Reported outcomes, however, seem to be mixed.
In 2008, Sutter Medical Center in Sacramento switched from a nine-surgeon call panel to four surgeons who covered the acute-care surgery service in 24-hour shifts. Researchers looked at outcomes from 2007, before the new model was adopted, and from the four subsequent years. The results were published in 2014 in the Journal of the American College of Surgeons.2
The total number of operations rose significantly, with 497 performed in 2007 and 640 in 2011. The percentage of cases with complications also fell significantly, from 21% in 2007 to 12% in 2011, with a low of 11% in 2010.
But the mortality rate rose significantly, from 1.4% in 2007 to 2.2% in 2011, with a high of 4.1% in 2008. The study authors note that the mortality rate ultimately fell back to levels not statistically significantly higher than the rate before the service. They suggested the spike could have been due to a greater willingness by the service to treat severely ill patients and due to the “immaturity” of the service in its earlier years. The percentage of cases with a readmission fell from 6.4% in 2007 to 4.7% in 2011, with a low of 3% in 2009, but that change wasn’t quite statistically significant.
“The data’s really bearing out that emergency patients are different in terms of the care they demand,” Dr. Scherer says. “So the patient with alcoholic cirrhosis who presents with a hole in his colon is very different than somebody who presents for an elective colon resection. And you can really reduce complications when you have a team of educated people taking care of these patients.”
Dr. Nelson says adopting the model “just means you’re a smoother operator and you can provide better service to people.” He adds that for any hospital that is getting poor surgical coverage and is paying for it, “it might make sense to consider it.”
Thomas R. Collins is a freelance medical writer based in Florida.
References
- Maa J, Carter JT, Gosnell JE, Wachter R, Harris HW. The surgical hospitalist: a new model for emergency surgical care. J Am Coll Surg. 2007;205(5):704-711.
- O’Mara MS, Scherer L, Wisner D, Owens LJ. Sustainability and success of the acute care surgery model in the nontrauma setting. J Am Coll Surg. 2014;219(1):90-98.
For a Model That Many Say Makes Sense, Why Not More Growth?
So why hasn’t the surgicalist field exploded? About 10 years ago, that’s what was predicted. In 2007, John Nelson, MD, MHM, a hospitalist at Overlake Medical Center in Bellevue, Wash., a hospitalist management consultant, and a past president of SHM, wrote an article saying the field could be close to a “surge” similar to the medical hospitalist explosion.1
It’s not known how many of the nation’s roughly 5,600 hospitals use a surgicalist model. There is no association for surgicalists, who are also sometimes called “surgical hospitalists.”
But according to Dr. Nelson’s anecdotal impressions, the number could range from 300 to 800 hospitals, he says. That would mean it is in place only in roughly 10% of U.S. hospitals.
Expansion of the field has been slowed by cost and politics.
Most hospitals don’t have enough surgeons to pull off a surgicalist program, and adding the right number of surgeons costs money, Dr. Nelson says.
And at smaller community hospitals that have used on-call surgeons for years, it’s a thorny issue. Those surgeons often get a call stipend for being on call. If surgeons don’t have a full slate of elective surgeries, they could rely on that on-call pay and resist the adoption of the surgicalist model, which would mean losing that pay, Dr. Nelson says.
“Some of the surgeons in the community might say, ‘I don’t really like ED call, but I have to keep doing it because of the stipend. I depend on it for my income,’” he says.
Even those who wouldn’t mind losing that on-call pay might not be enthusiastic about a move to a surgicalist model because it would bring more general surgeons into the region.
Some, Dr. Nelson says, might say, “How do I know that in two years they aren’t stealing my referrals? The new surgical hospitalist is also a potential competitor for referrals I depend on.”
And other surgeons might resist simply because they like the professional gratification of emergency surgery work, he says.
According to John Maa, MD, who wrote a seminal paper on surgicalists in 2007 based on an early surgicalist model he started at San Mateo Medical Center in California,2 “In a lot of academic centers that didn’t pay call stipend, this was just very simple for them to implement some model of this. … Once you try to send someone to an established group where there was already someone taking call, that became very controversial, and I’ve seen litigation result from that.”
Trauma surgeons resisted the model, at least in part, because of semantics: The term “surgical hospitalist” was too similar to “medical hospitalist,” and they worried it might imply a lack of surgical training, says Dr. Maa.
For now, the typical assessment of the model that Dr. Nelson hears is: “They’ve thought about it, they may in the future, but no, they don’t have one.”
“It’s not growing as fast as the medical hospitalist idea did,” he says. “But it is growing. It’s not going to go away, but it’s still relatively small.”
—Thomas R. Collins
References
- Nelson J. The surgical surge. The Hospitalist website. Accessed October 25, 2016.
- Maa J, Carter JT, Gosnell JE, Wachter R, Harris HW. The surgical hospitalist: a new model for emergency surgical care. J Am Coll Surg. 2007 ;205(5):704-711.

Selected elderly trauma patients do well in non–ICU wards
CORONADO, CALIF. – When elderly patients are appropriately triaged, they can be selectively admitted to non–intensive care wards with acceptable outcomes, results from a single-center study showed.
“Trauma centers across the United States are caring for elderly trauma patients with greater frequency,” researchers led by Marc D. Trust, MD, wrote in an abstract presented during a poster session at the annual meeting of the Western Surgical Association.
“Previous literature showed improved outcomes in this population from aggressive care and invasive monitoring. This may have led to an increased utilization of intensive care resources for these patients,” they noted.
In an effort to assess the safety of admitting this population of patients to non–intensive care units, Dr. Trust, a surgery resident at the University of Texas at Austin, and his associates retrospectively reviewed the medical records of 3,682 trauma patients aged 65 and older who were admitted from 2006 to 2015. They compared demographic data and outcomes between patients admitted to the ICU and those admitted to the surgical ward. The primary endpoint was mortality, while secondary endpoints were transfer to higher level of care and hospital length of stay. Patients admitted only for comfort care and those with injuries thought to be terminal and irreversible were excluded from the analysis.
The mean age of the 3,682 patients was 76 years and 1,838 (50%) were admitted to the ICU, while the remaining 1,844 (50%) were admitted to the surgical ward. When the researchers compared patients admitted to the ICU with those admitted to the surgical ward, they observed significant differences in mortality (7% vs. 0.82%, respectively; P less than .001), as well as systolic blood pressure on admission (146 vs. 149 mm Hg, respectively; P = .0002), pulse (85 vs. 81 beats per minute; P less than .0001), Glasgow Coma Scale (14 vs. 15; P less than .001), Injury Severity Score (16 vs. 8; P less than .001), and hospital stay (a mean of 8 vs. 4 days; P less than .0001). In addition, fewer than 1% of patients admitted to the surgical ward required transfer to a higher level of care (P less than .0001).
Next, Dr. Trust and his associates conducted a subgroup analysis of 300 patients admitted to the ICU (28%) and 766 (72%) admitted to the surgical ward who had all-system Abbreviated Injury Scale scores of less than 3, no hypotension on admission, and a Glasgow Coma Scale of 14 or greater. Compared with those admitted to the surgical ward, those admitted to the ICU were older (77 vs. 76 years old, respectively; P = .003), more likely to be male (54% vs. 45%; P = .007), more tachycardic (HR 84 vs. 81; P = .004), more severely injured (ISS score of 5 vs. 4; P less than .0001), and more likely to have a longer hospital stay (a mean of 6 vs. 4 days; P less than .0001). Two patients admitted to the surgical ward died (0.26%; P = .0009) and none required transfer to a higher level of care.
The researchers reported having no financial disclosures.
AT WSA 2016
Key clinical point:
Major finding: Mortality rates were significantly higher among elderly trauma patients admitted to the ICU, compared with those admitted to the surgical ward (7% vs. 0.82%, respectively; P less than .001).
Data source: A retrospective review of 3,682 trauma patients aged 65 and older who were admitted from 2006 to 2015.
Disclosures: The researchers reported having no financial disclosures.
First-in-kind study parsed risks of central lines in children
SAN DIEGO – Rising rates of pediatric venous thromboembolism in the United States underscore the need to carefully weigh the risks and benefits of placing central lines, Julie Jaffray, MD, said at the annual meeting of the American Society of Hematology.
Peripherally inserted central catheters (PICCs) are especially likely to lead to deep vein thrombosis in children, said Dr. Jaffray of Children’s Hospital Los Angeles, University of Southern California. Children and adolescents who received PICCs had about fourfold the rate of this outcome in the next 6 months as did those who received tunneled lines, based on interim results from her first-in-kind, prospective multicenter observational study.
Earlier research has shown that the placement of PICCs approximately doubled at Children’s Hospital Los Angeles between 2005 and 2012, while the use of tunneled lines remained constant at a much-lower rate, Dr. Jaffray noted.
To better understand how central lines contribute to pediatric thrombotic events, she and her associates at the Children’s Hospital of Philadelphia and Texas Children’s Hospital in Houston are studying patients aged 6 months to 18 years who had these devices placed at their centers starting in 2013. To parse out risk factors, the investigators are analyzing numerous relevant keywords from nursing notes and other parts of electronic health records.
As of October 2016, the study included 1,096 patients who received a total of 1,233 central lines related to the treatment of cancer, infection, and other serious conditions. Among 827 PICC recipients, the 6-month cumulative rate of venous thromboembolism was 7.5%. In contrast, only 406 patients received tunneled lines, and only 2% developed venous thromboembolism (P = .004).
But tunneled lines had their own risks. About 16% of recipients developed CLABSI within 6 months, compared with 9% of children who received PICCs (P = .005). The overall rate of CLABSI was 12%, Dr. Jaffray noted.
Thromboses were identified a median of 15 days after PICC placement and 40 days after tunneled line placement, she said. Children with leukemia, other cancers, and congenital heart disease were at significantly increased risk of venous thromboembolism, as were children who received multilumen catheters, she noted.
Ongoing analyses should lead to new guidelines on pediatric catheter selection, insertion techniques, and the prophylactic use of anticoagulation or antiseptics, Dr. Jaffray said. She also is planning a separate study of children younger than 6 months, to examine their unique coagulation systems, she added.
The conclusion at this point is that two-thirds of this cohort received PICCs instead of tunneled lines, and 85% of venous thromboembolism episodes occurred in PICC recipients, Dr. Jaffray emphasized. “Due to their ease of insertion, PICCs are being placed at increasing rates in some pediatric centers, [and] this may be the leading factor for the increasing incidence of pediatric venous thromboembolism,” she commented. “A lot of us pediatric treaters aren’t necessarily giving anticoagulation for an incidental clot, but I think this is something we certainly need to look at. And maybe if we can choose the patients who are at highest risk of VTE, we can consider prophylactic anticoagulation in those kids.”
Dr. Jaffray did not report funding sources and had no relevant financial disclosures.
AT ASH 2016
Key clinical point: Children who received peripherally inserted central catheters were at greatest risk of venous thromboembolism, while those who received tunneled lines were more likely to develop bloodstream infections.
Major finding: Venous thromboembolism occurred in 7.5% of PICC recipients and 2% of tunneled line recipients (P = .004) within 6 months after placement. CLABSI occurred in 16% of tunneled line recipients and 9% of PICC recipients (P = .005).
Data source: An observational study of 1,096 children and adolescents who received central venous catheters at three nationally recognized pediatric hospitals.
Disclosures: Dr. Jaffray did not report funding sources and had no relevant financial disclosures.
Observational hospital stays for HF linked to worse outcomes
NEW ORLEANS – The Centers for Medicare & Medicaid Services policy providing financial incentives for hospitals to readmit patients for heart failure for an observational stay rather than as an inpatient is antithetical to the patients’ best interests, according to data presented at the American Heart Association scientific sessions.
“We showed that if you get admitted under observation, the risk of you coming back is much higher than if you’re under an inpatient stay,” said Ahmad Masri, MBBS, of the University of Pittsburgh.

“Since CMS instituted this rule in 2013, there has been a surge in utilization of observational status versus inpatient status,” Dr. Masri noted.
That might make sense if the patients selected for in-hospital observation were less ill at the time than the heart failure patients admitted as inpatients, but that wasn’t the case in his large, retrospective study.
Dr. Masri reported on 21,339 patients with a total of 52,493 admissions for a primary diagnosis of heart failure during 2008-2015 in an 18-hospital health care system. After excluding admissions which involved cardiac surgery or in-hospital mortality, the total was 50,654 admissions.
Of these admissions, 5% were for in-hospital observation; 17% were inpatient admissions with discharge in less than 2 days. The two groups were similar in terms of age, comorbid conditions, and use of guideline-directed medications, although 36% of patients admitted under observation had a left ventricular ejection fraction below 40%, compared with 30% of those with an inpatient admission for less than 2 days.
The majority of patients in both groups were readmitted for heart failure within 1 year; however, the readmission rate was 23% lower in the group with an inpatient stay of less than 2 days, in an analysis adjusted for age, sex, ejection fraction, hypertension, diabetes, pneumonia, chronic obstructive pulmonary disease, liver disease, and renal failure.
Similarly, the group with an inpatient stay of less than 2 days’ duration was 24% less likely to have a cardiac readmission within 1 year than the group admitted for a penalty-free observational stay. The short inpatient stay group’s 1-year all-cause readmission rate was also 24% lower. All of these differences were statistically significant and clinically meaningful.
Yet 1-year all-cause mortality in the two groups was no different.
“This suggests that the difference between these two groups is more of an administrative distinction than a reflection of patient status at time of admission. It looks like it’s just random,” according to Dr. Masri. “There is a real need for a patient-centered, streamlined approach in evaluating and treating patients with heart failure, with a revised treatment-based algorithm and admission rules that guide physicians and shape health care policy.”
He reported having no financial conflicts of interest regarding this study.
NEW ORLEANS – The Centers for Medicare & Medicaid Services policy providing financial incentives for hospitals to readmit patients for heart failure for an observational stay rather than as an inpatient is antithetical to the patients’ best interests, according to data presented at the American Heart Association scientific sessions.
“We showed that if you get admitted under observation, the risk of you coming back is much higher than if you’re under an inpatient stay,” said Ahmad Masri, MBBS, of the University of Pittsburgh.
“Since CMS instituted this rule in 2013, there has been a surge in utilization of observational status versus inpatient status,” Dr. Masri noted.
That might make sense if the patients selected for in-hospital observation were less ill at the time than the heart failure patients admitted as inpatients, but that wasn’t the case in his large, retrospective study.
Dr. Masri reported on 21,339 patients with a total of 52,493 admissions for a primary diagnosis of heart failure during 2008-2015 in an 18-hospital health care system. After excluding admissions which involved cardiac surgery or in-hospital mortality, the total was 50,654 admissions.
Of these admissions, 5% were for in-hospital observation; 17% were inpatient admissions with discharge in less than 2 days. The two groups were similar in terms of age, comorbid conditions, and use of guideline-directed medications, although 36% of patients admitted under observation had a left ventricular ejection fraction below 40%, compared with 30% of those with an inpatient admission for less than 2 days.
The majority of patients in both groups were readmitted for heart failure within 1 year; however, the readmission rate was 23% lower in the group with an inpatient stay of less than 2 days, in an analysis adjusted for age, sex, ejection fraction, hypertension, diabetes, pneumonia, chronic obstructive pulmonary disease, liver disease, and renal failure.
Similarly, the group with an inpatient stay of less than 2 days’ duration was 24% less likely to have a cardiac readmission within 1 year than the group admitted for a penalty-free observational stay. The short inpatient stay group’s 1-year all-cause readmission rate was also 24% lower. All of these differences were statistically significant and clinically meaningful.
Yet 1-year all-cause mortality in the two groups was no different.
“This suggests that the difference between these two groups is more of an administrative distinction than a reflection of patient status at time of admission. It looks like it’s just random,” according to Dr. Masri. “There is a real need for a patient-centered, streamlined approach in evaluating and treating patients with heart failure, with a revised treatment-based algorithm and admission rules that guide physicians and shape health care policy.”
He reported having no financial conflicts of interest regarding this study.
AT THE AHA SCIENTIFIC SESSIONS
Key clinical point:
Major finding: The 1-year rates of readmission for heart failure, cardiac readmission, and all-cause readmission were each 23%-24% lower in heart failure patients admitted for an inpatient stay of less than 2 days’ duration than if they were designated as being admitted under observation.
Data source: A retrospective analysis of more than 50,000 hospital admissions with a primary diagnosis of heart failure in 21,339 patients during 2008-2015.
Disclosures: The presenter reported having no financial conflicts of interest regarding the study.
Increased death rate with platelets for aspirin/clopidogrel GI bleed
Patients with normal platelet counts who have a GI bleed while on antiplatelets were almost six times more likely to die in the hospital if they had a platelet transfusion in a retrospective cohort study from the Yale University in New Haven, Conn.
Ten of the 14 deaths in the 204 transfused patients – versus none of the 3 deaths in the 204 nontransfused patients - were due to bleeding, so it’s possible that the mortality difference was simply because patients with worse bleeding were more likely to get transfused. “On the other hand, the adjusted [odds ratios] for mortality (4.5-6.8 with different sensitivity analyses) [were] large, increasing the likelihood of a cause-and-effect relationship,” said investigators led by gastroenterologist Liam Zakko, MD, now at the Mayo Clinic in Rochester, Minn. (Clin Gastroenterol Hepatol. 2016 Jul 25. doi: 10.1016/j.cgh.2016.07.017).
Current guidelines suggest platelet transfusions are an option for antiplatelet patients with serious GI bleeds, but the Yale team found that they did not reduce rebleeding. “The observation of increased mortality without documentation of clinical benefit suggests a very cautious approach to the use of platelet transfusion. ... We do not support the use of platelet transfusions in patients with GI [bleeds] who are taking antiplatelet agents,” the investigators wrote.
Subjects in the two groups were matched for sex, age, and GI bleed location, and all had platelet counts above 100 × 109/L. Almost everyone was on aspirin for cardiovascular protection, and 30% were on also on clopidogrel.
Just over half in both groups had upper GI bleeds, and about 40% in each group had colonic bleeds. Transfused patients had more-severe bleeding, with overall lower blood pressure and lower hemoglobin; a larger proportion was admitted to the ICU.
On univariate analyses, platelet patients had more cardiovascular events (23% vs. 13%) while in the hospital. They were also more likely to stay in the hospital for more than 4 days (47% vs. 33%) and more likely to die while there (7% vs. 1%). On multivariable analysis, only the greater risk for death during admission remained statistically significant (odds ratio, 5.57; 95% confidence interval, 1.52-27.1). The adjusted odds ratio for recurrent bleeding was not significant.
Four patients in the platelet group died from cardiovascular causes. One patient in the control group had a fatal cardiovascular event.
Although counterintuitive, the authors said that it’s possible that platelet transfusions might actually increase the risk of severe and fatal GI bleeding. “Mechanisms by which platelet transfusion would increase mortality or [GI bleeding]–related mortality are not clear,” but “platelet transfusions are reported to be proinflammatory and alter recipient immunity,” they said.
At least for now, “the most prudent way to manage patients on antiplatelet agents with [GI bleeding] is to follow current evidence-based recommendations,” including early endoscopy, endoscopic hemostatic therapy for high-risk lesions, and intensive proton pump inhibitor therapy in patients with ulcers and high-risk endoscopic features.
“Although not based on high-quality evidence, we believe that hemostatic techniques that do not cause significant tissue damage (e.g., clips rather than thermal devices or sclerosants) should be used in patients on antiplatelet agents, especially if patients are expected to remain on these agents in the future,” they said.
The mean age in the study was 74 years, and about two-thirds of the subjects were men.
The authors had no disclosures.
The management of patients with gastrointestinal bleeding on antithrombotic drugs is a major challenge for gastroenterologists. Unfortunately, the use of aspirin alone has been shown to increase the risk of GI bleed twofold, and the addition of a thienopyridine additionally increases the risk of bleeding twofold. Furthermore, there is no available agent to reverse antiplatelet affects of these drugs, which irreversibly block platelet function for the life of the platelet (8-10 days). Current recommendations for the management of severe GI bleeding in patients receiving antithrombotic therapy include platelet transfusion, including those with a normal platelet count. However, this comes with a price as reversal of platelet function may increase the rate of cardiovascular events.
Zakko et al. performed a retrospective case-control study evaluating the role of platelet transfusion in patients presenting with GI bleeding. Patients were matched by age, sex, and the location of the GI bleed. Most patients included in the study were on low-dose aspirin and almost a third of the patients were taking both aspirin and a thienopyridine. Patients receiving platelet transfusions appeared to have more severe GI bleeding compared with matched controls, as patients receiving transfusion were more likely to have been hypotensive, tachycardic, have a low hemoglobin level, and require treatment in the intensive care unit (72% vs. 28%, P less than .0001). Patients receiving platelet transfusions were also more likely than matched controls to have recurrent GI bleeding as well as major cardiovascular adverse events, including myocardial infarction and inpatient death. After adjusting for patient characteristics, patients receiving platelet transfusions were more likely to have an increased risk of death (adjusted OR, 5.57; 95% CI, 1.52-27.1). The authors conclude that “the use of platelet transfusions in patients with GI bleeding who are taking antiplatelet agents without thrombocytopenia did not reduce rebleeding but was associated with higher mortality.”
Currently, there is no convincing evidence to support platelet transfusion in patients with bleeding on aspirin and/or a thienopyridine. Because the majority of the deaths were due to GI bleeding and not cardiovascular events, the observed increase in adverse events in patients receiving platelet transfusions likely reflects more severe GI bleeding in patients receiving platelet transfusions than in controls. We should avoid platelet transfusions and focus our management on achieving adequate resuscitation, use of proton pump inhibitors for patients with high-risk ulcers, and early endoscopy with endoscopic therapy for high-risk lesions.
John R. Saltzman, MD, AGAF, is director of endoscopy, Brigham and Women’s Hospital, professor of medicine, Harvard Medical School, Boston. He has no conflicts of interest.
Patients with normal platelet counts who have a GI bleed while on antiplatelets were almost six times more likely to die in the hospital if they had a platelet transfusion in a retrospective cohort study from the Yale University in New Haven, Conn.
Ten of the 14 deaths in the 204 transfused patients – versus none of the 3 deaths in the 204 nontransfused patients - were due to bleeding, so it’s possible that the mortality difference was simply because patients with worse bleeding were more likely to get transfused. “On the other hand, the adjusted [odds ratios] for mortality (4.5-6.8 with different sensitivity analyses) [were] large, increasing the likelihood of a cause-and-effect relationship,” said investigators led by gastroenterologist Liam Zakko, MD, now at the Mayo Clinic in Rochester, Minn. (Clin Gastroenterol Hepatol. 2016 Jul 25. doi: 10.1016/j.cgh.2016.07.017).
Current guidelines suggest platelet transfusions are an option for antiplatelet patients with serious GI bleeds, but the Yale team found that they did not reduce rebleeding. “The observation of increased mortality without documentation of clinical benefit suggests a very cautious approach to the use of platelet transfusion. ... We do not support the use of platelet transfusions in patients with GI [bleeds] who are taking antiplatelet agents,” the investigators wrote.
Subjects in the two groups were matched for sex, age, and GI bleed location, and all had platelet counts above 100 × 109/L. Almost everyone was on aspirin for cardiovascular protection, and 30% were on also on clopidogrel.
Just over half in both groups had upper GI bleeds, and about 40% in each group had colonic bleeds. Transfused patients had more-severe bleeding, with overall lower blood pressure and lower hemoglobin; a larger proportion was admitted to the ICU.
On univariate analyses, platelet patients had more cardiovascular events (23% vs. 13%) while in the hospital. They were also more likely to stay in the hospital for more than 4 days (47% vs. 33%) and more likely to die while there (7% vs. 1%). On multivariable analysis, only the greater risk for death during admission remained statistically significant (odds ratio, 5.57; 95% confidence interval, 1.52-27.1). The adjusted odds ratio for recurrent bleeding was not significant.
Four patients in the platelet group died from cardiovascular causes. One patient in the control group had a fatal cardiovascular event.
Although counterintuitive, the authors said that it’s possible that platelet transfusions might actually increase the risk of severe and fatal GI bleeding. “Mechanisms by which platelet transfusion would increase mortality or [GI bleeding]–related mortality are not clear,” but “platelet transfusions are reported to be proinflammatory and alter recipient immunity,” they said.
At least for now, “the most prudent way to manage patients on antiplatelet agents with [GI bleeding] is to follow current evidence-based recommendations,” including early endoscopy, endoscopic hemostatic therapy for high-risk lesions, and intensive proton pump inhibitor therapy in patients with ulcers and high-risk endoscopic features.
“Although not based on high-quality evidence, we believe that hemostatic techniques that do not cause significant tissue damage (e.g., clips rather than thermal devices or sclerosants) should be used in patients on antiplatelet agents, especially if patients are expected to remain on these agents in the future,” they said.
The mean age in the study was 74 years, and about two-thirds of the subjects were men.
The authors had no disclosures.
FROM CLINICAL GASTROENTEROLOGY AND HEPATOLOGY
Key clinical point:
Major finding: Compared with those not transfused, the risk for death during admission remained statistically significant on multivariate analysis (OR, 5.57; 95% CI, 1.52-27.1).
Data source: Retrospective cohort study of 408 GI bleed patients
Disclosures: The authors had no disclosures.
Hospital factors play key role in readmission risk after surgery
CORONADO, CALIF. – Variation in readmission risk across hospitals following certain surgical procedures is more attributable to hospital factors than to patient characteristics, results from a large analysis demonstrated.
Such is the impact of the care delivery macro environment (CDM), which Sarah A. Brownlee and coauthors defined as a series of complex interactions between patient characteristics and imposed hospital attributes than can impact patient outcomes postoperatively.

The purpose of the current study was to determine the relative contribution of various aspects of the CDM to 1-year readmission risk after surgery. Working with colleagues Anai Kothari, MD, and Paul Kuo MD, in the One:MAP Section of Clinical informatics and Analytics in the department of surgery at Loyola University Medical Center, Ms. Brownlee analyzed the Healthcare Cost and Utilization Project State Inpatient Databases from Florida, New York, and Washington between 2009 and 2013, which were linked to the American Hospital Association Annual Survey from that same time period.
The researchers used smoothed hazard estimates to determine all-cause readmission in the year after surgery, and multilevel survival models with shared frailty to determine the relative impact of hospital versus patient characteristics on the heterogeneity of readmission risk between hospitals. They limited the analysis to patients aged 18 years and older who underwent one the following procedures: abdominal aortic aneurysm repair, pancreatectomy, colectomy, coronary artery bypass graft, and total hip arthroplasty.
Ms. Brownlee reported results from 502,157 patients who underwent surgical procedures at 347 hospitals. The 1-year readmission rate was 23.5%, and ranged from 12% to 36% across procedures. After controlling for procedure, the researchers observed a 7.9% variation in readmission risk between hospitals. Staffing accounted for 9.8% of variance, followed by hospital structural characteristics such as teaching status and clinical programs (7.5%), patient ZIP code (3.8%), hospital perioperative resources such as inpatient rehab (2.9%), hospital volume (2.8%), and patient clinical characteristics (2.1%). The following hospital characteristics were significantly associated with a lower risk of 1-year readmission: high physician/bed ratio (hazard ratio 0.85; P = .00017); transplant status (HR 0.87; P = .022); high-income ZIP code (HR 0.89; P less than .001); high nurse bed/bed ratio (HR 0.90; P = .047), and cancer center designation (HR 0.93; P = .021).
“Compared to patient clinical characteristics, hospital factors such as staffing ratios, perioperative resources, and structural elements account for more variation in postoperative outcomes,” Ms. Brownlee concluded. “However, it’s important to note that in the present study, over 70% of variation in readmission rates is not explained by the covariates that we analyzed. It’s possible that there are other factors we need to consider. That’s where the direction of this research is going. Much of the variation in readmission risk across hospitals cannot be characterized with currently utilized administrative data.”
The National Institutes of Health provided funding for the study. Ms. Brownlee reported having no financial disclosures.
CORONADO, CALIF. – Variation in readmission risk across hospitals following certain surgical procedures is more attributable to hospital factors than to patient characteristics, results from a large analysis demonstrated.
Such is the impact of the care delivery macro environment (CDM), which Sarah A. Brownlee and coauthors defined as a series of complex interactions between patient characteristics and imposed hospital attributes than can impact patient outcomes postoperatively.
The purpose of the current study was to determine the relative contribution of various aspects of the CDM to 1-year readmission risk after surgery. Working with colleagues Anai Kothari, MD, and Paul Kuo MD, in the One:MAP Section of Clinical informatics and Analytics in the department of surgery at Loyola University Medical Center, Ms. Brownlee analyzed the Healthcare Cost and Utilization Project State Inpatient Databases from Florida, New York, and Washington between 2009 and 2013, which were linked to the American Hospital Association Annual Survey from that same time period.
The researchers used smoothed hazard estimates to determine all-cause readmission in the year after surgery, and multilevel survival models with shared frailty to determine the relative impact of hospital versus patient characteristics on the heterogeneity of readmission risk between hospitals. They limited the analysis to patients aged 18 years and older who underwent one the following procedures: abdominal aortic aneurysm repair, pancreatectomy, colectomy, coronary artery bypass graft, and total hip arthroplasty.
Ms. Brownlee reported results from 502,157 patients who underwent surgical procedures at 347 hospitals. The 1-year readmission rate was 23.5%, and ranged from 12% to 36% across procedures. After controlling for procedure, the researchers observed a 7.9% variation in readmission risk between hospitals. Staffing accounted for 9.8% of variance, followed by hospital structural characteristics such as teaching status and clinical programs (7.5%), patient ZIP code (3.8%), hospital perioperative resources such as inpatient rehab (2.9%), hospital volume (2.8%), and patient clinical characteristics (2.1%). The following hospital characteristics were significantly associated with a lower risk of 1-year readmission: high physician/bed ratio (hazard ratio 0.85; P = .00017); transplant status (HR 0.87; P = .022); high-income ZIP code (HR 0.89; P less than .001); high nurse bed/bed ratio (HR 0.90; P = .047), and cancer center designation (HR 0.93; P = .021).
“Compared to patient clinical characteristics, hospital factors such as staffing ratios, perioperative resources, and structural elements account for more variation in postoperative outcomes,” Ms. Brownlee concluded. “However, it’s important to note that in the present study, over 70% of variation in readmission rates is not explained by the covariates that we analyzed. It’s possible that there are other factors we need to consider. That’s where the direction of this research is going. Much of the variation in readmission risk across hospitals cannot be characterized with currently utilized administrative data.”
The National Institutes of Health provided funding for the study. Ms. Brownlee reported having no financial disclosures.
AT WSA 2016
Key clinical point:
Major finding: Staffing accounted for 9.8% of variance in readmission risk between hospitals, followed by hospital structural characteristics such as teaching status and clinical programs (7.5%).
Data source: Results from 502,157 patients who underwent surgical procedures at 347 hospitals in three states.
Disclosures: The National Institutes of Health provided funding for the study. Ms. Brownlee reported having no financial disclosures.