User login
Childhood obesity linked to severe dental infections
ATLANTA – Childhood obesity increases the risk of severe dental infections, according to a review presented at the Pediatric Hospital Medicine meeting.
Among 171 children admitted to Rady Children’s Hospital, San Diego, for infected cavities, obese children were almost four times more likely than others to require surgery, and five times more likely to have a tooth pulled.
The average cost for obese children was $13,000/day, versus $10,000/day for nonobese children, probably because of the greater need for surgery. Average length of stay was the same between the two groups, just under 2 days. The findings were statistically significant.
Obesity turns out to be “an important risk factor for invasive interventions for pediatric dental infections,” concluded study leader Michelle Edmunds, MD, a pediatric hospital medicine fellow at Rady.
Childhood obesity has been associated with cavities before, but it’s new information that it increases the severity of dental infections. The finding is something for pediatricians to be aware of and to use to encourage regular dental care. “Even if you are obese, if you are getting routine care, you should be able to have cavities fixed” before they get out of hand. “Unfortunately, a lot of the kids we see don’t get routine care,” Dr. Edmunds said.
The investigators couldn’t assess the role of diet because there wasn’t enough information about it in the medical records. It certainly must play a role, because soda and other junk foods increase the risk of both obesity and cavities.
Other factors also are likely at play. Obesity might affect the oral flora, and perhaps the balance of pathogens. It also seems to reduce healing and infection-fighting ability, so “there might be some immunocompromise that’s playing a role here,” Dr. Edmunds said.
The team compared 25 children up to 18 years old who were at or above the 95th percentile for body mass index – the study definition of obesity – to 146 children who were below that mark. They had all been admitted through the ED between July 2011 and June 2016 with dental abscesses, facial cellulitis, or other dental-associated infections. Eighty percent of the children were on Medicaid, which has, itself, been associated with less frequent visits to the dentist.
About 50% of the children were discharged home without a dental procedure. Among the rest, a quarter had incision and drainage, and a quarter had tooth extractions. Overall 72% (18) of obese children had surgery, usually extractions, versus 43% (62) of nonobese children.
There’s perhaps around 200,000 pediatric ED visits a year in the United States for dental problems. “We’ve had toddlers and kids who have never seen a dentist before; all of their teeth were rotten and had to be pulled out, every single tooth,” Dr. Edmunds said at the meeting sponsored by the Society of Hospital Medicine, the American Academy of Pediatrics, and the Academic Pediatric Association.
The mean age in the study was about 8 years. Nearly 60% of the subjects were boys, and a bit over 60% Hispanic. There were no statistical difference in demographics, prior antibiotic use, or cavity history between obese and nonobese children. Obese children were more likely to be on Medicaid, but not significantly so.
There was no industry funding for the work, and Dr. Edmunds didn’t have any disclosures.
REPORTING FROM PHM 2018
Key clinical point: Childhood obesity increases the risk of severe dental infections.
Major finding:
Study details: Review of 171 children admitted to Rady Children’s Hospital, San Diego, for infected cavities
Disclosures: There was no industry funding, and the presenter had no disclosures.

Hospitalists target inpatient glycemic control
SHM benchmarks provide ‘objective format’ for improving outcomes
Physicians are trained to manage their patients’ diabetes and often do a meticulous job – one on one. But in order to maximize glycemic control outcomes throughout the hospital, you need a kind of diabetic epidemiology team to focus on the data, said Andjela Drincic, MD, an endocrinologist at Nebraska Medicine, the clinical partner of the University of Nebraska Medical Center in Omaha.

As medical director for diabetes stewardship, Dr. Drincic serves as the epidemiologic lead for her hospital, which has worked systematically to improve inpatient glycemic control since 2012 – with help from the Society of Hospital Medicine.
“You need a team and to set up a system that works, with protocols and some way of knowing if the protocols are succeeding,” Dr. Drincic said. “Quality improvement targets are never static.” She credited SHM’s glycemic control eQUIPS (Electronic Quality Improvement Program), an online quality improvement resource and collaborative of 104 participating hospitals, for providing the support and the data needed to drive glycemic QI efforts at Nebraska Medicine. SHM provided reporting metrics, quarterly benchmarking reports, a library of tools and resources, an implementation guide, educational webinars on demand and, for some participants, mentored implementation with the advice of a leading expert in the field.
One big reason for giving more attention to glycemic control in the hospital is patient safety, said Gregory Maynard, MD, MHM, clinical professor and chief quality officer at the University of California–Davis Medical Center and SHM’s project team leader for eQUIPS.
“Hyperglycemia in hospitalized patients is an extraordinarily common and growing problem, affecting up to 40%-50% of patients in the hospital,” he said. In 2012, 7.7 million hospital stays involved patients with diabetes, the seventh leading cause of death in the United States.1
Hyperglycemia is linked to elevated rates of medical complications, infections, wound complications, hospital mortality, length of stay, readmissions, and ICU admissions, along with other outcomes not directly related to diabetes. Hyperglycemia in hospitalized patients who have not been given a diagnosis of diabetes is, if anything, more dangerous. Add the related risk for hypoglycemia, and clinicians are challenged to keep their patients controlled within the zone between the extremes of hyper- and hypoglycemia. The American Diabetes Association recently issued recommendations with more relaxed glucose targets between 140 and 180 mg/dL for most patients in non–intensive care settings.2
“To not have a standardized way of managing hyperglycemia for your hospital seems like an enormous missed opportunity,” Dr. Maynard said. “If someone comes into the hospital with a chronic condition of diabetes that you ignore, just maintaining them in the hospital and sending them back out into the world without addressing the underlying condition is not good care. You have missed an important opportunity to alter the course of a serious chronic condition.”
Dr. Maynard said SHM recognized this opportunity when it established eQUIPS. “Hospitalists are often tasked with taking care of patients with glycemic issues because there may not be an endocrinologist readily accessible in the hospital,” he said. “We have seen through our benchmarking in eQUIPS incredible variability – with 10-fold differences in hyperglycemia and hypoglycemia rates between the best- and worst-performing sites. The biggest variable is whether the hospital systematically manages glycemic control. We have also shown that achieving high levels of glycemic control and low hypoglycemia rates concurrently is very possible.”
Reliable benchmarks
Nebraska Medicine enrolled in eQUIPS in 2012.
“We utilize SHM’s glucometrics (standardized analyses of inpatient glycemic control data).”3 said Dr. Drincic. “I was looking for a reliable glucometric system and some way to make comparisons with other hospitals when I came across the data Dr. Maynard published about SHM via a PubMed search. We needed outcomes that are validated in the literature and comparison groups.”
Nebraska Medicine has also received a certificate of distinction for inpatient diabetes care from the Joint Commission, and Dr. Drincic is active in PRIDE (Planning Research in Inpatient Diabetes), a national consortium of leading investigators in inpatient diabetes care formed to promote collaborative research. The PRIDE group meets yearly at the ADA conference, communicates regularly by email, and publishes articles.
“Once a year I present our glycemic control data to our administration and to the quality and safety committees at the hospital. I have been pleased with the level of support we have received,” Dr. Drincic said. “We needed a mandate to do this, but when I reported the impact on readmissions and other outcomes, I got the full support of administration. This would have been a lot harder without SHM.”
Engagement with hospitalists is another key to the glucose management project’s success, Dr. Drincic said. “We as endocrinologists think we know how to manage diabetes, but hospitalists have the daunting task of dealing with all of the patient’s medical issues. If we don’t have a strong collaboration, how can we change practice hospitalwide?” Rachel Thompson, MD, SFHM, Nebraska Medicine’s chief of hospital medicine, participates in the glucose management project, Dr. Drincic said.
“We occasionally are guests at hospitalist meetings to share new glucose treatment algorithms,” she said. “We’re also looking at collaborating on other quality initiatives, for example, studying how perioperative dexamethasone affects glycemic control. We built this relationship with hospitalists by establishing trust while trying to shed a reputation as ‘sugar police.’ I don’t want hospitalists saying ‘There she goes again’ whenever I come on the unit. We have tried to establish personal relationships and figure out what the hospitalists need, especially relative to EPIC (the hospital’s electronic medical record software).”
Dr. Thompson said her group’s recent growth to nearly 70 clinicians has increased its footprint hospitalwide and given hospitalists a greater opportunity to influence glycemic control. “We see up to a third of the patients in the hospital outside of the ICU. Glycemic control is something you learn as a hospitalist – It’s a very important frontline quality issue. In the patient list on EPIC every morning we have a field highlighting all patients with glycemic control issues,” she said.
“Poor glucose control is associated with poor outcomes for our patients. We need the right systems in place for patient safety. Moreover, if we are ignoring glycemic control when the patient is in the hospital, we’re sending the wrong message and setting a bad example for our patients when they return home.”
Lack of clear metrics
A significant defect in the infrastructure of many glucose management programs is the lack of clear metrics for outcomes, Dr. Maynard said. Nearly one-third of hospitals in the United States have no standardized metric to track the quality of their inpatient glycemic management, a sobering statistic considering that the first step in any QI initiative is to define and measure the problem at hand.
“I believe the main reason that glycemic control has been left off hospitals’ radar screens is that we still have not adopted national, publicly reported quality measures for glycemic control, although those were proposed recently by a government interagency work group,” Dr. Maynard said. “Until that happens, we’ll continue to see uneven response.”
The first step for frontline hospitalists is to learn and understand the basics of glucose control, for example, basal bolus insulin administration, and to stop writing orders for sliding scale insulin as the sole means of controlling hyperglycemia.
“Develop and adopt standards of practice for insulin administration in your hospital,” Dr. Maynard said. “Be part of the solution, not the problem. Once you get into the weeds – patients on steroids or on total parenteral nutrition – it can get tricky. But it’s important to get the basics right and move beyond inertia on this topic.”
The glycemic team at Nebraska Medicine includes, in addition to Dr. Drincic and Dr. Thompson, an endocrinology fellow, diabetes case managers, resource nurses, nurse leadership, pharmacists, inpatient care transitions coordinators, and representatives from pediatrics and critical care, all working to impact the overall quality of glycemic management in the hospital. Jon Knezevich, PharmD is diabetes stewardship pharmacy coordinator, and Shelly Lautenbaugh, RN, CDE, is diabetes lead care manager and diabetes coordinator for the Joint Commission certificate program. Diabetes stewardship also includes online and live training courses and a class in acute glucose management for the diabetes resource nurses, who bring the knowledge back to their units.
The glucose team’s job is to make sure patients are cared for safely, using appropriate policies and procedures, education, and training, Ms. Lautenbaugh said. “We have a mission as a hospital to transform people’s lives. We try to live our values, and everything follows from the focus on patient safety,” she added. “If our patients can receive extraordinary care and leave better informed about their condition than when they came in, and then we don’t see them again, we’ve achieved our ultimate goal.”
Hyperglycemia is most often not the primary reason why patients are hospitalized, Ms. Lautenbaugh said. “But we need to give them appropriate glucose management regardless. We’ve worked with bedside staff, nurse leadership, and teams to develop plans to raise our outcome scores. We have a lot of different outcomes we examine, and it’s always evolving.”
Quality metrics are incorporated into the electronic medical record, but those reports are not timely enough for day-to-day management, Dr. Knezevich said. “So we created a diabetes dashboard, constantly updated in real time to identify patients who are out of glycemic control.” The measures tracked include a mean patient day glucose score, percentage of readings within recommended limits, mean time between measured low readings and next documented reading or resolution of hypoglycemia, readmission rates, and diabetes nutrition assessments.
For hospitals with diabetes certificates, the Joint Commission also requires that every patient with hyperglycemia receives a clinic visit 30 days after discharge to make sure they are receiving appropriate follow-up care. Other facets of the Nebraska glycemic initiative include utilizing the hospital’s voluntary “Meds to Beds” program, which brings prescribed medications to the patient’s room at discharge. “We offer a diabetes discharge kit for patients who are self-pay, with all of the insulin and medical supplies they will need to get to the 30-day follow-up visit,” Dr. Knezevich said. “We can dream up amazing treatment regimens, but if they can’t afford the medications, what have we accomplished?”
SHM’s external benchmarks have provided an objective format for comparing and improving outcomes, Ms. Lautenbaugh said. “We like to see where we are and use the data to make significant improvements, but we’re also focused on internal assessments. If we make changes for a given metric, how does it affect performance in other areas?” One important metric is percentage of glucose readings within target range hospitalwide. “Our overall goal is 75%. It was 72% in April 2018, and we’ve raised it to 74.4%. It’s a small gain but it shows steady progress. Little steps make small but steady improvement,” she said.
“One area where we were not pleased was the occurrence of hypoglycemia,” Ms. Lautenbaugh said. “We did a root cause analysis of every hypoglycemic event, including several reports for patients who didn’t have diabetes at all. We had to weed out some that weren’t pertinent to our quality questions, but for those that are, the diabetes case manager calls the provider to make sure they were aware of the incident. We were able to identify the outliers in noncritical care, which we’re now able to tackle using a systematic approach.”
Get on the bus
Hospitalists are also integrally involved in a hospital glycemic improvement initiative at Orange Regional Medical Center (ORMC) in Middletown, N.Y.

The Glycemic Improvement Team (GIT) was formed in 2012 when a new hospital campus opened and EPIC was implemented as the hospital’s EMR. But glycemic control has taken on greater focus since 2015, when ORMC enrolled in eQUIPS, said Lorraine Porcaro, RN, the hospital’s diabetes clinical manager. The glycemic control team includes representatives from medicine, nursing, case management, laboratory, nutrition, pharmacy, wound care, and quality improvement.
Implementing the new EMR offered the opportunity to track a number of medical values in real time, Ms. Porcaro said. ORMC has focused its glycemic quality improvement efforts on hypoglycemia and hyperglycemia, with a recent emphasis on the need for improvements related to glucose reassessment 15 minutes post hypoglycemia treatment. More than a hundred “Diabetes Champions” have completed 16 hours of advanced training in diabetes and provide in-unit mentorship for other staff.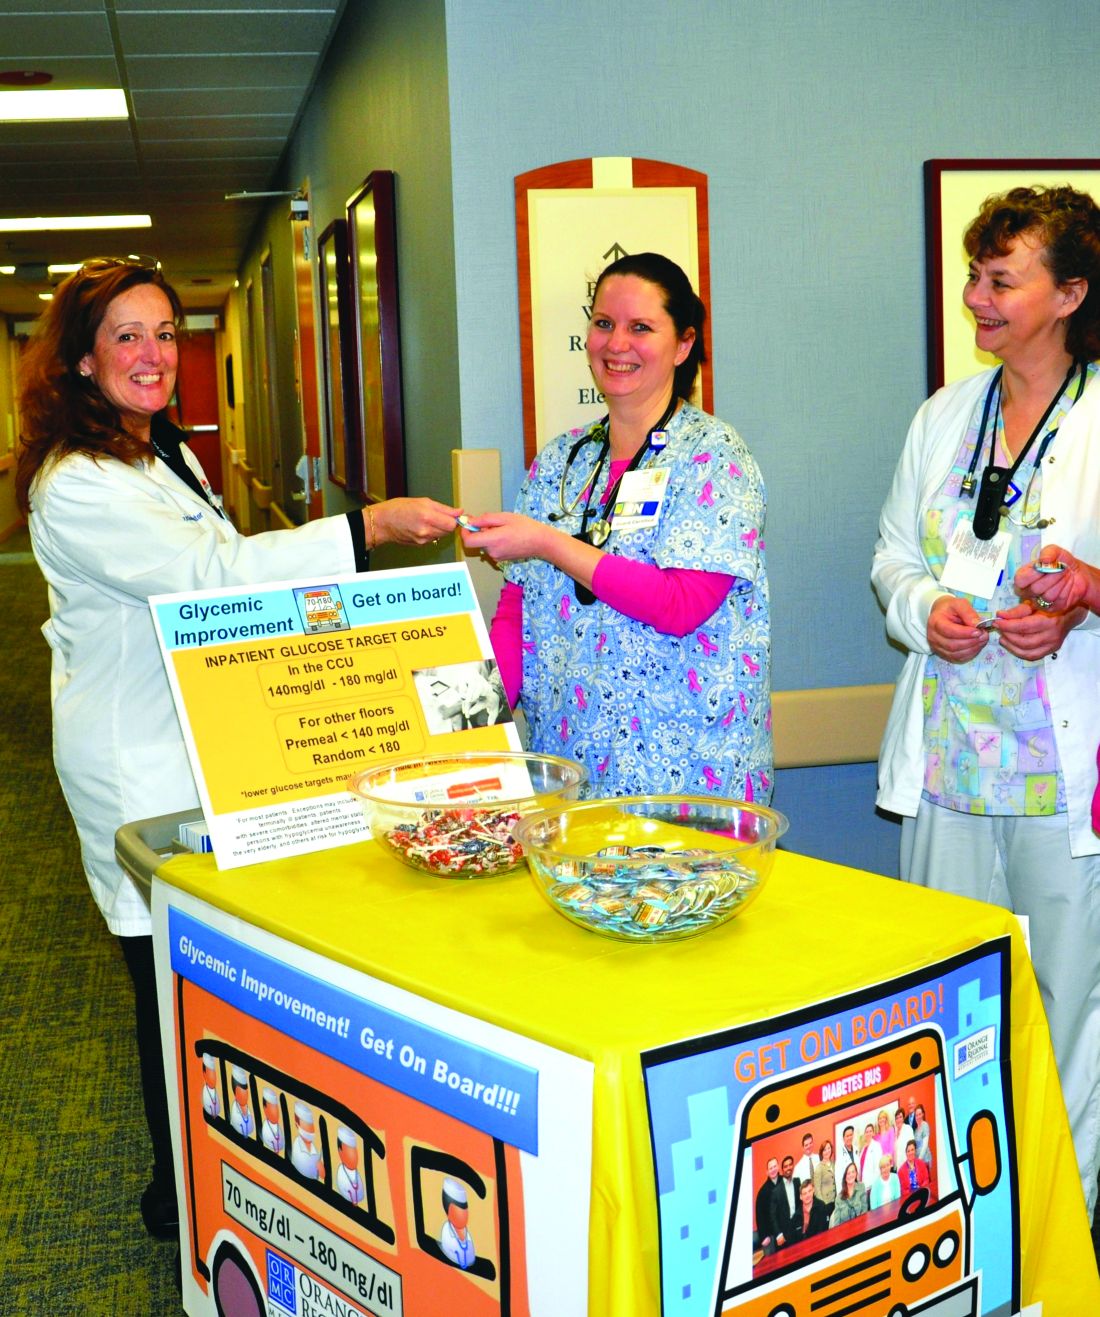
The ORMC team’s glycemic improvement “bus” is a rolling cart that goes from unit to unit supplying nurse education, reminders, copies of department-specific policies and protocols, and treats for staff. “It’s what we’re known for,” Ms. Porcaro said. Pens with the motto: “Don’t Miss the Bus! Retest in 15!” summarize the GIT’s current focus on post–hypoglycemia treatment retesting.
Hospitalists were part of the glycemic improvement process at ORMC from the beginning and are still involved, said Adrian Paraschiv, MD, FHM, a hospitalist and assistant director of the medical center, as well as the ORMC director of clinical information technology. ORMC initiated hospitalist coverage in 1998 and now has three HM groups, two of them represented on the glycemic improvement team.
“Like any hospital, we feel we should minimize hypoglycemic events,” Dr. Paraschiv explained. “This became important for other hospital departments, and we recognized we needed a major QI initiative to improve our outcomes hospitalwide. In the process, we noticed what other people were saying: Results from improving glycemic control included reduced length of stay, cost, and infections. That provided motivation for the hospital to support our initiative.”
Glucose management isn’t only about blood sugar, but whether the patient ate or not, their other blood work, the level of education for patient and staff, and a variety of other inputs, Dr. Paraschiv said. “All of these things were in the EMR but all over the place. EPIC had an incipient structure for pulling the data together, and we modified it to show everything that’s going on with the patient’s glycemic control on a single screen. We can build order sets and issue different reports.”
Today at ORMC, hypoglycemia is reassessed within 30 minutes more than 50% of the time. “It will never be at 100%, but we wanted to at least be at the national mean for eQUIPS hospitals. Our stretch goal was to be in the top quartile, and by the end of 2017, we realized that goal,” Ms. Porcaro said. Sometimes, because of changes in patients and staff, the GIT needs to repeat the education and review policies. “Since then, it’s been a matter of continuing staff education; sharing glucose data with stakeholders; talking about goals for ICU and non-ICU units; and, when needed, rolling out the bus.”
Participation in eQUIPS has made it possible to gather this information in one place and present it in a way that makes sense to physicians, Dr. Paraschiv said. “Dr. Maynard and SHM showed us how to put the data together to add value. Using these tools, we started looking at our processes, what needed to change, and what we are able to change. Now we’re examining what happens afterward. Can we use the electronic system to automatically alert physicians to make changes to the treatment regimen in real time? We continue to improve using upgrades to our EMR, such as an alert system with best practice advisories for the clinician. We now think we can actually achieve what we set out to achieve,” he said.
“Our idea was that we needed to market this program throughout the hospital – starting from the kitchen, meal delivery staff, IT, laboratory, medical and nursing staff,” Ms. Porcaro said. “The issue is multifactorial – it’s for the entire hospital. My heart is warmed when I see the woman who delivers the meals asking the patient: ‘Have you gotten your insulin shot?’ ”
References
1. Corvino L et al. “Management of diabetes and hyperglycemia in hospitalized patients.” Updated 2017 Oct 1 in De Groot LJ et al. editors. Endotext. South Dartmouth (MA): MDText.com 2000.
2. American Diabetes Association. Glycemic targets. Diabetes Care 2017 Jan;40(Suppl 1):S48-56.
3. Maynard G et al. “Design and implementation of a web-based reporting and benchmarking center for inpatient glucometrics.” J Diabetes Sci Technol. 2014 May 12;8(4):630-40.
SHM benchmarks provide ‘objective format’ for improving outcomes
SHM benchmarks provide ‘objective format’ for improving outcomes
Physicians are trained to manage their patients’ diabetes and often do a meticulous job – one on one. But in order to maximize glycemic control outcomes throughout the hospital, you need a kind of diabetic epidemiology team to focus on the data, said Andjela Drincic, MD, an endocrinologist at Nebraska Medicine, the clinical partner of the University of Nebraska Medical Center in Omaha.
As medical director for diabetes stewardship, Dr. Drincic serves as the epidemiologic lead for her hospital, which has worked systematically to improve inpatient glycemic control since 2012 – with help from the Society of Hospital Medicine.
“You need a team and to set up a system that works, with protocols and some way of knowing if the protocols are succeeding,” Dr. Drincic said. “Quality improvement targets are never static.” She credited SHM’s glycemic control eQUIPS (Electronic Quality Improvement Program), an online quality improvement resource and collaborative of 104 participating hospitals, for providing the support and the data needed to drive glycemic QI efforts at Nebraska Medicine. SHM provided reporting metrics, quarterly benchmarking reports, a library of tools and resources, an implementation guide, educational webinars on demand and, for some participants, mentored implementation with the advice of a leading expert in the field.
One big reason for giving more attention to glycemic control in the hospital is patient safety, said Gregory Maynard, MD, MHM, clinical professor and chief quality officer at the University of California–Davis Medical Center and SHM’s project team leader for eQUIPS.
“Hyperglycemia in hospitalized patients is an extraordinarily common and growing problem, affecting up to 40%-50% of patients in the hospital,” he said. In 2012, 7.7 million hospital stays involved patients with diabetes, the seventh leading cause of death in the United States.1
Hyperglycemia is linked to elevated rates of medical complications, infections, wound complications, hospital mortality, length of stay, readmissions, and ICU admissions, along with other outcomes not directly related to diabetes. Hyperglycemia in hospitalized patients who have not been given a diagnosis of diabetes is, if anything, more dangerous. Add the related risk for hypoglycemia, and clinicians are challenged to keep their patients controlled within the zone between the extremes of hyper- and hypoglycemia. The American Diabetes Association recently issued recommendations with more relaxed glucose targets between 140 and 180 mg/dL for most patients in non–intensive care settings.2
“To not have a standardized way of managing hyperglycemia for your hospital seems like an enormous missed opportunity,” Dr. Maynard said. “If someone comes into the hospital with a chronic condition of diabetes that you ignore, just maintaining them in the hospital and sending them back out into the world without addressing the underlying condition is not good care. You have missed an important opportunity to alter the course of a serious chronic condition.”
Dr. Maynard said SHM recognized this opportunity when it established eQUIPS. “Hospitalists are often tasked with taking care of patients with glycemic issues because there may not be an endocrinologist readily accessible in the hospital,” he said. “We have seen through our benchmarking in eQUIPS incredible variability – with 10-fold differences in hyperglycemia and hypoglycemia rates between the best- and worst-performing sites. The biggest variable is whether the hospital systematically manages glycemic control. We have also shown that achieving high levels of glycemic control and low hypoglycemia rates concurrently is very possible.”
Reliable benchmarks
Nebraska Medicine enrolled in eQUIPS in 2012.
“We utilize SHM’s glucometrics (standardized analyses of inpatient glycemic control data).”3 said Dr. Drincic. “I was looking for a reliable glucometric system and some way to make comparisons with other hospitals when I came across the data Dr. Maynard published about SHM via a PubMed search. We needed outcomes that are validated in the literature and comparison groups.”
Nebraska Medicine has also received a certificate of distinction for inpatient diabetes care from the Joint Commission, and Dr. Drincic is active in PRIDE (Planning Research in Inpatient Diabetes), a national consortium of leading investigators in inpatient diabetes care formed to promote collaborative research. The PRIDE group meets yearly at the ADA conference, communicates regularly by email, and publishes articles.
“Once a year I present our glycemic control data to our administration and to the quality and safety committees at the hospital. I have been pleased with the level of support we have received,” Dr. Drincic said. “We needed a mandate to do this, but when I reported the impact on readmissions and other outcomes, I got the full support of administration. This would have been a lot harder without SHM.”
Engagement with hospitalists is another key to the glucose management project’s success, Dr. Drincic said. “We as endocrinologists think we know how to manage diabetes, but hospitalists have the daunting task of dealing with all of the patient’s medical issues. If we don’t have a strong collaboration, how can we change practice hospitalwide?” Rachel Thompson, MD, SFHM, Nebraska Medicine’s chief of hospital medicine, participates in the glucose management project, Dr. Drincic said.
“We occasionally are guests at hospitalist meetings to share new glucose treatment algorithms,” she said. “We’re also looking at collaborating on other quality initiatives, for example, studying how perioperative dexamethasone affects glycemic control. We built this relationship with hospitalists by establishing trust while trying to shed a reputation as ‘sugar police.’ I don’t want hospitalists saying ‘There she goes again’ whenever I come on the unit. We have tried to establish personal relationships and figure out what the hospitalists need, especially relative to EPIC (the hospital’s electronic medical record software).”
Dr. Thompson said her group’s recent growth to nearly 70 clinicians has increased its footprint hospitalwide and given hospitalists a greater opportunity to influence glycemic control. “We see up to a third of the patients in the hospital outside of the ICU. Glycemic control is something you learn as a hospitalist – It’s a very important frontline quality issue. In the patient list on EPIC every morning we have a field highlighting all patients with glycemic control issues,” she said.
“Poor glucose control is associated with poor outcomes for our patients. We need the right systems in place for patient safety. Moreover, if we are ignoring glycemic control when the patient is in the hospital, we’re sending the wrong message and setting a bad example for our patients when they return home.”
Lack of clear metrics
A significant defect in the infrastructure of many glucose management programs is the lack of clear metrics for outcomes, Dr. Maynard said. Nearly one-third of hospitals in the United States have no standardized metric to track the quality of their inpatient glycemic management, a sobering statistic considering that the first step in any QI initiative is to define and measure the problem at hand.
“I believe the main reason that glycemic control has been left off hospitals’ radar screens is that we still have not adopted national, publicly reported quality measures for glycemic control, although those were proposed recently by a government interagency work group,” Dr. Maynard said. “Until that happens, we’ll continue to see uneven response.”
The first step for frontline hospitalists is to learn and understand the basics of glucose control, for example, basal bolus insulin administration, and to stop writing orders for sliding scale insulin as the sole means of controlling hyperglycemia.
“Develop and adopt standards of practice for insulin administration in your hospital,” Dr. Maynard said. “Be part of the solution, not the problem. Once you get into the weeds – patients on steroids or on total parenteral nutrition – it can get tricky. But it’s important to get the basics right and move beyond inertia on this topic.”
The glycemic team at Nebraska Medicine includes, in addition to Dr. Drincic and Dr. Thompson, an endocrinology fellow, diabetes case managers, resource nurses, nurse leadership, pharmacists, inpatient care transitions coordinators, and representatives from pediatrics and critical care, all working to impact the overall quality of glycemic management in the hospital. Jon Knezevich, PharmD is diabetes stewardship pharmacy coordinator, and Shelly Lautenbaugh, RN, CDE, is diabetes lead care manager and diabetes coordinator for the Joint Commission certificate program. Diabetes stewardship also includes online and live training courses and a class in acute glucose management for the diabetes resource nurses, who bring the knowledge back to their units.
The glucose team’s job is to make sure patients are cared for safely, using appropriate policies and procedures, education, and training, Ms. Lautenbaugh said. “We have a mission as a hospital to transform people’s lives. We try to live our values, and everything follows from the focus on patient safety,” she added. “If our patients can receive extraordinary care and leave better informed about their condition than when they came in, and then we don’t see them again, we’ve achieved our ultimate goal.”
Hyperglycemia is most often not the primary reason why patients are hospitalized, Ms. Lautenbaugh said. “But we need to give them appropriate glucose management regardless. We’ve worked with bedside staff, nurse leadership, and teams to develop plans to raise our outcome scores. We have a lot of different outcomes we examine, and it’s always evolving.”
Quality metrics are incorporated into the electronic medical record, but those reports are not timely enough for day-to-day management, Dr. Knezevich said. “So we created a diabetes dashboard, constantly updated in real time to identify patients who are out of glycemic control.” The measures tracked include a mean patient day glucose score, percentage of readings within recommended limits, mean time between measured low readings and next documented reading or resolution of hypoglycemia, readmission rates, and diabetes nutrition assessments.
For hospitals with diabetes certificates, the Joint Commission also requires that every patient with hyperglycemia receives a clinic visit 30 days after discharge to make sure they are receiving appropriate follow-up care. Other facets of the Nebraska glycemic initiative include utilizing the hospital’s voluntary “Meds to Beds” program, which brings prescribed medications to the patient’s room at discharge. “We offer a diabetes discharge kit for patients who are self-pay, with all of the insulin and medical supplies they will need to get to the 30-day follow-up visit,” Dr. Knezevich said. “We can dream up amazing treatment regimens, but if they can’t afford the medications, what have we accomplished?”
SHM’s external benchmarks have provided an objective format for comparing and improving outcomes, Ms. Lautenbaugh said. “We like to see where we are and use the data to make significant improvements, but we’re also focused on internal assessments. If we make changes for a given metric, how does it affect performance in other areas?” One important metric is percentage of glucose readings within target range hospitalwide. “Our overall goal is 75%. It was 72% in April 2018, and we’ve raised it to 74.4%. It’s a small gain but it shows steady progress. Little steps make small but steady improvement,” she said.
“One area where we were not pleased was the occurrence of hypoglycemia,” Ms. Lautenbaugh said. “We did a root cause analysis of every hypoglycemic event, including several reports for patients who didn’t have diabetes at all. We had to weed out some that weren’t pertinent to our quality questions, but for those that are, the diabetes case manager calls the provider to make sure they were aware of the incident. We were able to identify the outliers in noncritical care, which we’re now able to tackle using a systematic approach.”
Get on the bus
Hospitalists are also integrally involved in a hospital glycemic improvement initiative at Orange Regional Medical Center (ORMC) in Middletown, N.Y.
The Glycemic Improvement Team (GIT) was formed in 2012 when a new hospital campus opened and EPIC was implemented as the hospital’s EMR. But glycemic control has taken on greater focus since 2015, when ORMC enrolled in eQUIPS, said Lorraine Porcaro, RN, the hospital’s diabetes clinical manager. The glycemic control team includes representatives from medicine, nursing, case management, laboratory, nutrition, pharmacy, wound care, and quality improvement.
Implementing the new EMR offered the opportunity to track a number of medical values in real time, Ms. Porcaro said. ORMC has focused its glycemic quality improvement efforts on hypoglycemia and hyperglycemia, with a recent emphasis on the need for improvements related to glucose reassessment 15 minutes post hypoglycemia treatment. More than a hundred “Diabetes Champions” have completed 16 hours of advanced training in diabetes and provide in-unit mentorship for other staff.
The ORMC team’s glycemic improvement “bus” is a rolling cart that goes from unit to unit supplying nurse education, reminders, copies of department-specific policies and protocols, and treats for staff. “It’s what we’re known for,” Ms. Porcaro said. Pens with the motto: “Don’t Miss the Bus! Retest in 15!” summarize the GIT’s current focus on post–hypoglycemia treatment retesting.
Hospitalists were part of the glycemic improvement process at ORMC from the beginning and are still involved, said Adrian Paraschiv, MD, FHM, a hospitalist and assistant director of the medical center, as well as the ORMC director of clinical information technology. ORMC initiated hospitalist coverage in 1998 and now has three HM groups, two of them represented on the glycemic improvement team.
“Like any hospital, we feel we should minimize hypoglycemic events,” Dr. Paraschiv explained. “This became important for other hospital departments, and we recognized we needed a major QI initiative to improve our outcomes hospitalwide. In the process, we noticed what other people were saying: Results from improving glycemic control included reduced length of stay, cost, and infections. That provided motivation for the hospital to support our initiative.”
Glucose management isn’t only about blood sugar, but whether the patient ate or not, their other blood work, the level of education for patient and staff, and a variety of other inputs, Dr. Paraschiv said. “All of these things were in the EMR but all over the place. EPIC had an incipient structure for pulling the data together, and we modified it to show everything that’s going on with the patient’s glycemic control on a single screen. We can build order sets and issue different reports.”
Today at ORMC, hypoglycemia is reassessed within 30 minutes more than 50% of the time. “It will never be at 100%, but we wanted to at least be at the national mean for eQUIPS hospitals. Our stretch goal was to be in the top quartile, and by the end of 2017, we realized that goal,” Ms. Porcaro said. Sometimes, because of changes in patients and staff, the GIT needs to repeat the education and review policies. “Since then, it’s been a matter of continuing staff education; sharing glucose data with stakeholders; talking about goals for ICU and non-ICU units; and, when needed, rolling out the bus.”
Participation in eQUIPS has made it possible to gather this information in one place and present it in a way that makes sense to physicians, Dr. Paraschiv said. “Dr. Maynard and SHM showed us how to put the data together to add value. Using these tools, we started looking at our processes, what needed to change, and what we are able to change. Now we’re examining what happens afterward. Can we use the electronic system to automatically alert physicians to make changes to the treatment regimen in real time? We continue to improve using upgrades to our EMR, such as an alert system with best practice advisories for the clinician. We now think we can actually achieve what we set out to achieve,” he said.
“Our idea was that we needed to market this program throughout the hospital – starting from the kitchen, meal delivery staff, IT, laboratory, medical and nursing staff,” Ms. Porcaro said. “The issue is multifactorial – it’s for the entire hospital. My heart is warmed when I see the woman who delivers the meals asking the patient: ‘Have you gotten your insulin shot?’ ”
References
1. Corvino L et al. “Management of diabetes and hyperglycemia in hospitalized patients.” Updated 2017 Oct 1 in De Groot LJ et al. editors. Endotext. South Dartmouth (MA): MDText.com 2000.
2. American Diabetes Association. Glycemic targets. Diabetes Care 2017 Jan;40(Suppl 1):S48-56.
3. Maynard G et al. “Design and implementation of a web-based reporting and benchmarking center for inpatient glucometrics.” J Diabetes Sci Technol. 2014 May 12;8(4):630-40.
Novel cEEG-based scoring system predicts inpatient seizure risk
LOS ANGELES – A novel scoring system based on six readily available seizure risk factors from a patient’s history and continuous electroencephalogram (cEEG) monitoring appears to accurately predict seizures in acutely ill hospitalized patients.

The final model of the system, dubbed the 2HELPS2B score, has an area under the curve (AUC) of 0.821, suggesting a “good overall fit,” Aaron Struck, MD, reported at the annual meeting of the American Academy of Neurology.
However, more relevant than the AUC and suggestive of high classification accuracy is the low calibration error of 2.7%, which shows that the actual incidence of seizures within a particular risk group is, on average, within 2.7% of predicted incidence, Dr. Struck of the University of Wisconsin, Madison, explained in an interview.
The use of cEEG has expanded, largely because of a high incidence of subclinical seizures in hospitalized patients with encephalopathy; EEG features believed to predict seizures include epileptiform discharges and periodic discharges, but the ways in which these variables may jointly affect seizure risk have not been studied, he said.
He and his colleagues used a prospective database to derive a dataset containing 24 clinical and electroencephalographic variables for 5,427 cEEG sessions of at least 24 hours each, and then, using a machine-learning method known as RiskSLIM, created a scoring system model to estimate seizure risk in patients undergoing cEEG.
The name of the scoring system – 2HELPS2B – represents the six variables included in the final model:
- 2 H is for frequency greater than 2.0 Hz for any periodic rhythmic pattern (1 point).
- E is for sporadic epileptiform discharges (1 point).
- L is for the presence of lateralized periodic discharges, lateralized rhythmic delta activity, or bilateral independent periodic discharges (1 point).
- P is for the presence of “plus” features, including superimposed, rhythmic, sharp, or fast activity (1 point).
- S is for prior seizure (1 point).
- 2B is for brief, potentially ictal, rhythmic discharges (2 points).
The predicted seizure risk rose with score, such that the seizure risk was less than 5% for a score of 0, 12% for 1, 27% for 2, 50% for 3, 73% for 4, 88% for 5, and greater than 95% for 6-7, Dr. Struck said. “Really, anything over 2 points, you’re at substantial risk for having seizures.”
Limitations of the study, which are being addressed in an ongoing, multicenter, prospective validation trial through the Critical Care EEG Monitoring Research Consortium, are mainly related to the constraints of the database; the duration of EEG needed to accurately calculate the 2HELPS2B score wasn’t defined, and cEEGs were of varying length.
“So in our validation study moving forward, these are two things we will address,” he said. “We also want to show that this is something that’s useful on a day-to-day basis – that it accurately gauges the degree of variability or potential severity of the ictal-interictal continuum pattern.”
With validation, Dr. Struck said that the 2HELPS2B score could ultimately be used to rapidly communicate seizure potential based on EEG severity and to guide decision making with respect to initiation of empiric antiseizure medication.
Findings from the validation study are “trending in the right direction,” but the confidence intervals are wide, as only 404 patients have been included at this point, Dr. Struck said.
This study was supported by a research infrastructure award from the American Epilepsy Society and the Epilepsy Foundation.
SOURCE: Struck A et al. Neurology. 2018 Apr 90(15 Suppl.):S11.002.
LOS ANGELES – A novel scoring system based on six readily available seizure risk factors from a patient’s history and continuous electroencephalogram (cEEG) monitoring appears to accurately predict seizures in acutely ill hospitalized patients.
The final model of the system, dubbed the 2HELPS2B score, has an area under the curve (AUC) of 0.821, suggesting a “good overall fit,” Aaron Struck, MD, reported at the annual meeting of the American Academy of Neurology.
However, more relevant than the AUC and suggestive of high classification accuracy is the low calibration error of 2.7%, which shows that the actual incidence of seizures within a particular risk group is, on average, within 2.7% of predicted incidence, Dr. Struck of the University of Wisconsin, Madison, explained in an interview.
The use of cEEG has expanded, largely because of a high incidence of subclinical seizures in hospitalized patients with encephalopathy; EEG features believed to predict seizures include epileptiform discharges and periodic discharges, but the ways in which these variables may jointly affect seizure risk have not been studied, he said.
He and his colleagues used a prospective database to derive a dataset containing 24 clinical and electroencephalographic variables for 5,427 cEEG sessions of at least 24 hours each, and then, using a machine-learning method known as RiskSLIM, created a scoring system model to estimate seizure risk in patients undergoing cEEG.
The name of the scoring system – 2HELPS2B – represents the six variables included in the final model:
- 2 H is for frequency greater than 2.0 Hz for any periodic rhythmic pattern (1 point).
- E is for sporadic epileptiform discharges (1 point).
- L is for the presence of lateralized periodic discharges, lateralized rhythmic delta activity, or bilateral independent periodic discharges (1 point).
- P is for the presence of “plus” features, including superimposed, rhythmic, sharp, or fast activity (1 point).
- S is for prior seizure (1 point).
- 2B is for brief, potentially ictal, rhythmic discharges (2 points).
The predicted seizure risk rose with score, such that the seizure risk was less than 5% for a score of 0, 12% for 1, 27% for 2, 50% for 3, 73% for 4, 88% for 5, and greater than 95% for 6-7, Dr. Struck said. “Really, anything over 2 points, you’re at substantial risk for having seizures.”
Limitations of the study, which are being addressed in an ongoing, multicenter, prospective validation trial through the Critical Care EEG Monitoring Research Consortium, are mainly related to the constraints of the database; the duration of EEG needed to accurately calculate the 2HELPS2B score wasn’t defined, and cEEGs were of varying length.
“So in our validation study moving forward, these are two things we will address,” he said. “We also want to show that this is something that’s useful on a day-to-day basis – that it accurately gauges the degree of variability or potential severity of the ictal-interictal continuum pattern.”
With validation, Dr. Struck said that the 2HELPS2B score could ultimately be used to rapidly communicate seizure potential based on EEG severity and to guide decision making with respect to initiation of empiric antiseizure medication.
Findings from the validation study are “trending in the right direction,” but the confidence intervals are wide, as only 404 patients have been included at this point, Dr. Struck said.
This study was supported by a research infrastructure award from the American Epilepsy Society and the Epilepsy Foundation.
SOURCE: Struck A et al. Neurology. 2018 Apr 90(15 Suppl.):S11.002.
REPORTING FROM AAN 2018
Key clinical point:
Major finding: The 2HELPS2B score has an AUC of 0.821 and calibration error of 2.7%.
Study details: An analysis of 5,427 cEEG sessions to develop a risk scoring system model.
Disclosures: This study was supported by a research infrastructure award from the American Epilepsy Society and the Epilepsy Foundation.
Source: Struck A et al. Neurology. 2018 Apr 90(15 Suppl.):S11.002.
Next-gen sputum PCR panel boosts CAP diagnostics
NEW ORLEANS – A next-generation lower respiratory tract sputum polymerase chain reaction (PCR) film array panel identified etiologic pathogens in 100% of a group of patients hospitalized for community-acquired pneumonia, Kathryn Hendrickson, MD, reported at the annual meeting of the American College of Physicians.

The investigational new diagnostic assay, the BioFire Pneumonia Panel, is now under Food and Drug Administration review for marketing clearance. (CAP), observed Dr. Hendrickson, an internal medicine resident at Providence Portland (Ore.) Medical Center. The new product is designed to complement the currently available respiratory panels from BioFire.
“Rapid-detection results in less empiric antibiotic use in hospitalized patients. When it’s FDA approved, this investigational sputum PCR panel will simplify the diagnostic bundle while improving antibiotic stewardship,” she observed.
She presented a prospective study of 63 patients with CAP hospitalized at the medical center, all of whom were evaluated by two laboratory methods: the hospital’s standard bundle of diagnostic tests and the new BioFire film array panel. The purpose was to determine if there was a difference between the two tests in the detection rate of viral and/or bacterial pathogens as well as the clinical significance of any such differences; that is, was there an impact on days of treatment and length of hospital stay?
Traditional diagnostic methods detect an etiologic pathogen in at best half of hospitalized CAP patients, and the results take too much time. So Providence Portland Medical Center adopted as its standard diagnostic bundle a nasopharyngeal swab and a BioFire film array PCR that’s currently on the market and can detect nine viruses and three bacteria, along with urine antigens for Legionella sp. and Streptococcus pneumoniae, nucleic acid amplification testing for S. pneumoniae and Staphylococcus aureus, and blood and sputum cultures. In contrast, the investigational panel probes for 17 viruses, 18 bacterial pathogens, and seven antibiotic-resistant genes; it also measures procalcitonin levels in order to distinguish between bacterial colonization and invasion.
The new BioFire Pneumonia Panel detected a mean of 1.4 species of pathogenic bacteria in 79% of patients, while the standard diagnostic bundle detected 0.7 species in 59% of patients. The investigational panel identified a mean of 1.0 species of viral pathogens in 86% of the CAP patients; the standard bundle detected a mean of 0.6 species in 56%.
All told, any CAP pathogen was detected in 100% of patients using the new panel, with a mean of 2.5 different pathogens identified. The standard bundle detected any pathogen in 84% of patients, with half as many different pathogens found, according to Dr. Hendrickson.
A peak procalcitonin level of 0.25 ng/mL or less, which was defined as bacterial colonization, was associated with a mean 7 days of treatment, while a level above that threshold was associated with 11.3 days of treatment. Patients with a peak procalcitonin of 0.25 ng/mL or less had an average hospital length of stay of 5.9 days, versus 7.8 days for those with a higher procalcitonin indicative of bacterial invasion.
The new biofilm assay reports information about the abundance of 15 of the 18 bacterial targets in the sample. However, in contrast to peak procalcitonin, Dr. Hendrickson and her coinvestigators didn’t find this bacterial quantitation feature to be substantially more useful than a coin flip in distinguishing bacterial colonization from invasion.
She reported having no financial conflicts regarding the head-to-head comparative study, which was supported by BioFire Diagnostics.
NEW ORLEANS – A next-generation lower respiratory tract sputum polymerase chain reaction (PCR) film array panel identified etiologic pathogens in 100% of a group of patients hospitalized for community-acquired pneumonia, Kathryn Hendrickson, MD, reported at the annual meeting of the American College of Physicians.
The investigational new diagnostic assay, the BioFire Pneumonia Panel, is now under Food and Drug Administration review for marketing clearance. (CAP), observed Dr. Hendrickson, an internal medicine resident at Providence Portland (Ore.) Medical Center. The new product is designed to complement the currently available respiratory panels from BioFire.
“Rapid-detection results in less empiric antibiotic use in hospitalized patients. When it’s FDA approved, this investigational sputum PCR panel will simplify the diagnostic bundle while improving antibiotic stewardship,” she observed.
She presented a prospective study of 63 patients with CAP hospitalized at the medical center, all of whom were evaluated by two laboratory methods: the hospital’s standard bundle of diagnostic tests and the new BioFire film array panel. The purpose was to determine if there was a difference between the two tests in the detection rate of viral and/or bacterial pathogens as well as the clinical significance of any such differences; that is, was there an impact on days of treatment and length of hospital stay?
Traditional diagnostic methods detect an etiologic pathogen in at best half of hospitalized CAP patients, and the results take too much time. So Providence Portland Medical Center adopted as its standard diagnostic bundle a nasopharyngeal swab and a BioFire film array PCR that’s currently on the market and can detect nine viruses and three bacteria, along with urine antigens for Legionella sp. and Streptococcus pneumoniae, nucleic acid amplification testing for S. pneumoniae and Staphylococcus aureus, and blood and sputum cultures. In contrast, the investigational panel probes for 17 viruses, 18 bacterial pathogens, and seven antibiotic-resistant genes; it also measures procalcitonin levels in order to distinguish between bacterial colonization and invasion.
The new BioFire Pneumonia Panel detected a mean of 1.4 species of pathogenic bacteria in 79% of patients, while the standard diagnostic bundle detected 0.7 species in 59% of patients. The investigational panel identified a mean of 1.0 species of viral pathogens in 86% of the CAP patients; the standard bundle detected a mean of 0.6 species in 56%.
All told, any CAP pathogen was detected in 100% of patients using the new panel, with a mean of 2.5 different pathogens identified. The standard bundle detected any pathogen in 84% of patients, with half as many different pathogens found, according to Dr. Hendrickson.
A peak procalcitonin level of 0.25 ng/mL or less, which was defined as bacterial colonization, was associated with a mean 7 days of treatment, while a level above that threshold was associated with 11.3 days of treatment. Patients with a peak procalcitonin of 0.25 ng/mL or less had an average hospital length of stay of 5.9 days, versus 7.8 days for those with a higher procalcitonin indicative of bacterial invasion.
The new biofilm assay reports information about the abundance of 15 of the 18 bacterial targets in the sample. However, in contrast to peak procalcitonin, Dr. Hendrickson and her coinvestigators didn’t find this bacterial quantitation feature to be substantially more useful than a coin flip in distinguishing bacterial colonization from invasion.
She reported having no financial conflicts regarding the head-to-head comparative study, which was supported by BioFire Diagnostics.
REPORTING FROM ACP INTERNAL MEDICINE
Key clinical point: A new CAP diagnostic panel represents a significant advance in clinical care.
Major finding: The investigational BioFire Pneumonia Panel identified specific pathogens in 100% of patients hospitalized for CAP, compared with 84% using the hospital’s standard test bundle.
Study details: This was a prospective head-to-head study comparing two approaches to identification of specific pathogens in 63 patients hospitalized for CAP.
Disclosures: The study was supported by BioFire Diagnostics. The presenter reported having no financial conflicts.
Larger vegetation size associated with increased risk of embolism and mortality in infective endocarditis
Clinical question: In patients with infective endocarditis, does a vegetation size greater than 10 mm impart a greater embolic risk?
Background: A vegetation size greater than 10 mm has historically been used as the cutoff for increased risk of embolization in infective endocarditis, and this cutoff forms a key part of the American Heart Association guidelines for early surgical intervention. However, this cutoff is derived primarily from observational data from small studies.
Study design: Meta-analysis of observational studies and randomized clinical trials.
Setting: An English-language literature search from PubMed and EMBASE performed May 2017.
Synopsis: The authors identified 21 unique studies evaluating the association of vegetation size greater than 10 mm with embolic events in adult patients with infective endocarditis. This accounted for a total of 6,646 unique patients and 5,116 vegetations. Analysis of these data found that patients with a vegetation size greater than 10 mm had significantly increased odds of embolic events (odds ratio, 2.28; P less than .001) and mortality (OR, 1.63; P = .009), compared with those with a vegetation size less than 10 mm.
Limitations of this research include the potential for selection bias in the original studies, and the inability to incorporate information relating to microbiologic results, antibiotic use, and the location of systemic embolization. Interestingly, as vegetations with a size of exactly 10 mm were variably categorized in the original studies, this meta-analysis was unable to reach a conclusion on the risk of embolic events for instances when vegetation size is equal to 10 mm.
Bottom line: Patients with infective endocarditis and a vegetation size greater than 10 mm may have significantly increased odds of embolic events and mortality, compared with those with vegetation size less than 10 mm.
Citation: Mohananey D et al. Association of vegetation size with embolic risk in patients with infective endocarditis: A systematic review and meta-analysis. JAMA Intern Med. Apr 1;178(4):502-10.
Dr. Winters is a hospitalist at Beth Israel Deaconess Medical Center, and instructor in medicine, Harvard Medical School, Boston.
Prophylactic haloperidol does not improve survival in critically ill patients
Clinical question: Does prophylactic use of haloperidol in critically ill patients at high risk of delirium improve survival at 28 days?
Background: Delirium occurs frequently in critically ill patients and can lead to increased ICU length of stay, hospital length of stay, duration of mechanical ventilation, and mortality. Prior research into the use of prophylactic antipsychotic administration has yielded inconsistent results.
Study design: Double-blind, randomized, controlled trial.
Setting: 21 ICUs in the Netherlands, from July 2013 to March 2017. 
Synopsis: A total of 1,789 critically ill adults with an anticipated ICU stay of at least 2 days were randomized to receive 1 mg of haloperidol, 2 mg of haloperidol, or a placebo three times daily. All study sites used “best practice” delirium prevention (for example, early mobilization, noise reduction, protocols aiming to prevent oversedation). The primary outcome was defined as the number of days patients survived in the 28 days following inclusion, and secondary outcome measures included number of days survived in 90 days, delirium incidence, number of delirium-free and coma-free days, duration of mechanical ventilation, and length of ICU and hospital stay. The 1-mg haloperidol group was stopped early because of futility. There was no significant difference between the 2-mg haloperidol group and the placebo group for the primary outcome (P = .93), or any of the secondary outcomes.Bottom line: In a population of critically ill patients at high risk of delirium, prophylactic haloperidol did not significantly improve 28-day survival, nor did it significantly reduce the incidence of delirium or length of stay.
Citation: van den Boogaard M et al. Effect of haloperidol on survival among critically ill adults with a high risk of delirium: The REDUCE randomized clinical trial. JAMA. 2018 Feb 20;319(7):680-90.
Dr. Winters is a hospitalist at Beth Israel Deaconess Medical Center, and instructor in medicine, Harvard Medical School, Boston.
Clinical question: Does prophylactic use of haloperidol in critically ill patients at high risk of delirium improve survival at 28 days?
Background: Delirium occurs frequently in critically ill patients and can lead to increased ICU length of stay, hospital length of stay, duration of mechanical ventilation, and mortality. Prior research into the use of prophylactic antipsychotic administration has yielded inconsistent results.
Study design: Double-blind, randomized, controlled trial.
Setting: 21 ICUs in the Netherlands, from July 2013 to March 2017.
Synopsis: A total of 1,789 critically ill adults with an anticipated ICU stay of at least 2 days were randomized to receive 1 mg of haloperidol, 2 mg of haloperidol, or a placebo three times daily. All study sites used “best practice” delirium prevention (for example, early mobilization, noise reduction, protocols aiming to prevent oversedation). The primary outcome was defined as the number of days patients survived in the 28 days following inclusion, and secondary outcome measures included number of days survived in 90 days, delirium incidence, number of delirium-free and coma-free days, duration of mechanical ventilation, and length of ICU and hospital stay. The 1-mg haloperidol group was stopped early because of futility. There was no significant difference between the 2-mg haloperidol group and the placebo group for the primary outcome (P = .93), or any of the secondary outcomes.Bottom line: In a population of critically ill patients at high risk of delirium, prophylactic haloperidol did not significantly improve 28-day survival, nor did it significantly reduce the incidence of delirium or length of stay.
Citation: van den Boogaard M et al. Effect of haloperidol on survival among critically ill adults with a high risk of delirium: The REDUCE randomized clinical trial. JAMA. 2018 Feb 20;319(7):680-90.
Dr. Winters is a hospitalist at Beth Israel Deaconess Medical Center, and instructor in medicine, Harvard Medical School, Boston.
Discharge opioid prescriptions for many surgical hospitalizations may be unnecessary
Background: Prescription opioids play a significant role in the current opioid epidemic. Opioids used for nonmedical purposes often are obtained from the prescription of friends and family members, and a majority of heroin users report that their first opioid exposure was via a prescription opioid. Prescription of opioids following low-risk surgical procedures has increased over the past decade.
Study design: Cross-sectional study.
Setting: Two Boston-area acute care hospitals from May 2014 to September 2016.
Synopsis: The authors identified 6,548 inpatient surgical hospitalizations lasting longer than 1 day with a discharge to home in which the patient used no opioid medications in the final 24 hours prior to discharge. Of these, 43.7% received an opioid prescription at discharge. The mean prescription morphine milligram equivalents (MME) provided to this group was 343. The authors identified these cases as instances in which overprescription of opiates may have occurred. Surgical services that tended to have more patients still using opioids at the time of discharge had a higher likelihood of potential overprescription. For patients who used opioids during the final 24 hours of their hospitalization and received an opioid prescription at discharge, inpatient MME use and prescription MME were only weakly correlated (R2 = 0.112). The retrospective two-site design of this study may limit its generalizability.
Bottom line: In postoperative surgical patients, overprescription of opioid medications may occur frequently.
Citation: Chen EY et al. Correlation between 24-hour predischarge opioid use and amount of opioids prescribed at hospital discharge. JAMA Surg. 2018;153(2):e174859.
Dr. Salber is a hospitalist at Beth Israel Deaconess Medical Center, and instructor in medicine, Harvard Medical School, Boston.
Making the referral and navigating care
Be familiar with local post-acute care resources
Presenter
Elisabeth Schainker, MD, MSc
Session title
Making the referral and navigating “A Whole New World” of care
Session summary
By describing different types of post-acute care clinical services, Dr. Schainker empowered the HM18 audience to rethink how to best identify patients and conditions appropriate for transitions of care, from short-term acute care environments to long-term acute care places, inpatient rehabs, or skilled nursing facilities.
With increasing numbers of pediatric patients with medical complexity, who are dependent on technology devices and complicated care needs, hospitalists need to be knowledgeable about the rules of engagement for prolonged or enhanced recoveries, families’ needs, and insurance qualifications. The role of the hospitalist is to make sure that things are in place for safe and successful discharges, keeping in mind patients’ complexity, resources available within family and community, and fair assessments of readmission risks.
Whether rehab needs pertain to pulmonary, medical, or post NICU stays – length of stay averaging 70-80 days – hospitalists still need to ensure that patients have a clear potential to do better and transition to home eventually. There are inadequate numbers of such pediatric post-acute care facilities, 36 hospitals to be precise. Franciscan Children’s, where Dr. Schainker practices, was beautifully represented in a short movie played during the session at the annual meeting of the Society of Hospital Medicine. The protagonists in the movie were children: Mae and Luke.
Key takeaways for HM
1. Knowledge: Post-acute care services facilitate safe discharges of complex medical patients that eventually get home.
2. Attitude: Hospitalists need to identify what would benefit their patients and counsel families, as well as make proper and timely referrals.
3. Behavior: Hospitalists should be familiar with local resources and engage with available providers of post-acute care services.
Dr. Giordano is a pediatric neurosurgery hospitalist at Columbia University Medical Center in New York.
Be familiar with local post-acute care resources
Be familiar with local post-acute care resources
Presenter
Elisabeth Schainker, MD, MSc
Session title
Making the referral and navigating “A Whole New World” of care
Session summary
By describing different types of post-acute care clinical services, Dr. Schainker empowered the HM18 audience to rethink how to best identify patients and conditions appropriate for transitions of care, from short-term acute care environments to long-term acute care places, inpatient rehabs, or skilled nursing facilities.
With increasing numbers of pediatric patients with medical complexity, who are dependent on technology devices and complicated care needs, hospitalists need to be knowledgeable about the rules of engagement for prolonged or enhanced recoveries, families’ needs, and insurance qualifications. The role of the hospitalist is to make sure that things are in place for safe and successful discharges, keeping in mind patients’ complexity, resources available within family and community, and fair assessments of readmission risks.
Whether rehab needs pertain to pulmonary, medical, or post NICU stays – length of stay averaging 70-80 days – hospitalists still need to ensure that patients have a clear potential to do better and transition to home eventually. There are inadequate numbers of such pediatric post-acute care facilities, 36 hospitals to be precise. Franciscan Children’s, where Dr. Schainker practices, was beautifully represented in a short movie played during the session at the annual meeting of the Society of Hospital Medicine. The protagonists in the movie were children: Mae and Luke.
Key takeaways for HM
1. Knowledge: Post-acute care services facilitate safe discharges of complex medical patients that eventually get home.
2. Attitude: Hospitalists need to identify what would benefit their patients and counsel families, as well as make proper and timely referrals.
3. Behavior: Hospitalists should be familiar with local resources and engage with available providers of post-acute care services.
Dr. Giordano is a pediatric neurosurgery hospitalist at Columbia University Medical Center in New York.
Catheter ablation of AF in patients with heart failure decreases mortality and HF admissions
Background: Rhythm control with medical therapy has been shown to not be superior to rate control for patients with both heart failure and AF. Rhythm control by ablation has been associated with positive outcomes in this same population, but its effectiveness, compared with medical therapy for patient-centered outcomes, has not been demonstrated.
Study design: Multicenter, open-label, randomized, controlled superiority trial.
Setting: 33 hospitals from Europe, Australia, and the United States during 2008-2016.
Synopsis: A total of 363 patients with HF with LVEF less than 35%, New York Heart Association II-IV symptoms, and permanent or paroxysmal AF who had previously failed or declined antiarrhythmic medications were randomly assigned to undergo ablation by pulmonary vein isolation or to medical therapy. The primary outcome – a composite of death or hospitalization for heart failure – was significantly lower in the ablation group, compared with the medical therapy group (28.5% vs. 44.6%; P = .006) with a number needed to treat of 8.3. The secondary outcomes of all-cause mortality and heart failure admissions were also significantly lower in the ablation group (13.4% vs. 25%; P = .01 and 20.7% vs. 35.9%; P = .004 respectively). The burden of AF, as identified by patient implantable devices was significantly lower in the ablation group, suggesting the likely mechanism of ablation benefit. Limitations of this study include its small sample size and lack of physician or patient blinding to treatment assignment.
Bottom line: Compared with medical therapy, catheter ablation of atrial fibrillation for patients with symptomatic heart failure with LVEF less than 35% was associated with significantly decreased mortality and heart failure admissions.
Citation: Marrouche N et al. Catheter ablation for atrial fibrillation with heart failure. N Eng J Med. 2018 Feb 1; 378:417-27.
Dr. Salber is a hospitalist at Beth Israel Deaconess Medical Center, and instructor in medicine, Harvard Medical School, Boston.
Patent foramen ovale may be associated with increased risk of perioperative ischemic stroke
Clinical question: Are patients with patent foramen ovale (PFO) at increased risk of perioperative ischemic stroke?
Background: Prior research has identified an association between PFO and risk of stroke. However, little is known about the effect of a preoperatively diagnosed PFO on perioperative stroke risk.
Study design: Retrospective cohort study.
Setting: Three Massachusetts hospitals, from January 2007 to December 2015.
Synopsis: The charts of 150,198 adult patients who underwent noncardiac surgery were reviewed for ICD codes for PFO. The primary outcome was perioperative ischemic stroke within 30 days of surgery, as identified via ICD code and subsequent chart review. After they adjusted for confounding variables, the study authors found that patients with PFO had an increased risk of perioperative ischemic stroke (odds ratio, 2.66; 95% confidence interval, 1.96-3.63; P less than .001) compared with patients without PFO. These findings were replicated in a propensity score–matched cohort to adjust for baseline differences between PFO and non-PFO groups. Patients with PFO also had a significantly increased risk of large-vessel territory ischemia and more severe neurologic deficits.
Given the observational design, this study could not establish a causal relationship between presence of a PFO and perioperative stroke. While the results support the consideration of PFO as a risk factor for perioperative stroke, research into whether this risk can be mitigated is needed.
Bottom line: Patients with PFO undergoing noncardiac surgery may be at increased risk of perioperative ischemic stroke.
Citation: Ng PY et al. Association of preoperatively diagnosed patent foramen ovale with perioperative ischemic stroke. JAMA. 2018 Feb 6;319(5):452-62.
Dr. Roy is a hospitalist at Beth Israel Deaconess Medical Center, and instructor in medicine, Harvard Medical School, Boston.