User login
Bringing you the latest news, research and reviews, exclusive interviews, podcasts, quizzes, and more.
Powered by CHEST Physician, Clinician Reviews, MDedge Family Medicine, Internal Medicine News, and The Journal of Clinical Outcomes Management.
Normal and Abnormal Vocal Cord Movement
The video associated with this article is no longer available on this site. Please view all of our videos on the MDedge YouTube channel
[Courtesy of Arizona Asthma & Allergy Institute]
Click Here for Free CE/CME on Vocal Cord Dysfunction: Unmasking the Asthma Pretender
The video associated with this article is no longer available on this site. Please view all of our videos on the MDedge YouTube channel
[Courtesy of Arizona Asthma & Allergy Institute]
Click Here for Free CE/CME on Vocal Cord Dysfunction: Unmasking the Asthma Pretender
The video associated with this article is no longer available on this site. Please view all of our videos on the MDedge YouTube channel
[Courtesy of Arizona Asthma & Allergy Institute]
Click Here for Free CE/CME on Vocal Cord Dysfunction: Unmasking the Asthma Pretender
Sexsomnia may gain more awareness after DSM-5 inclusion
The inclusion of a new sleep disorder in the DSM-5 might raise awareness of the underreported diagnosis and help physicians better identify the condition.
Sexsomnia can present in different forms but is generally described as engaging in sexual activity while asleep.

“Classification of sexsomnia in DSM-5 adds legitimacy to the diagnosis as it takes it out of the proposed diagnosis or research diagnosis realm and places it into a formally accepted classification manual,” said Dr. Brandon G. Moore, a psychiatry resident at Western Michigan University School of Medicine in Kalamazoo. “The classification of the diagnosis helps patients in that it opens up the topic for further discussion and education of providers so that they may more readily recognize the disorder and offer appropriate treatment.”
Sexsomnia can involve varying degrees of sexual activity while unconscious, including masturbation, fondling, groping, and intercourse. Patients often are unaware they have the condition, and signs of the disorder frequently are reported by a partner, roommate, or spouse, Dr. Moore said in an interview. The condition is not well known to many doctors, which can lead to misdiagnoses and underdiagnoses, added Dr. Kannan Ramar, an internist who practices in the division of pulmonary and critical care medicine, and the Center for Sleep Medicine at the Mayo Clinic, Rochester, Minn.

“Awareness of this condition is not there among the medical community,” Dr. Ramar said in an interview. “More educational awareness needs to happen, and having this diagnosis listed in the DSM-5 is one right step in that direction.”
Dr. Moore recently treated a 44-year-old patient with sexsomnia referred by his neurologist. The patient originally presented for presumed restless legs syndrome but had a history of sleep-related sexual behavior. The neurologist instructed the patient and his wife to keep a sleep diary, which revealed sexual behavior by the patient during sleep, including intercourse, that had been occurring for the last 20 years, according to a case study poster by Dr. Moore presented at the American Academy of Psychiatry and the Law meeting.
Polysomnography indicated no significant sleep-disordered breathing or limb movements but did reveal episodes during non-REM sleep consistent with confusional arousal. After a diagnosis of parasomnia associated with sexual behavior, the patient was referred for psychiatric evaluation because his behavior, exacerbated by stress, was becoming increasingly aggressive and adversely affecting his marriage. The patient has since improved with the addition of paroxetine, an increase of his clonazepam dosage, as well as with psychotherapy, Dr. Moore reported.
Collecting collateral information about sleep habits from partners or roommates can help doctors pinpoint the possibility of sexsomnia, Dr. Moore said.
“Any sleepwalking disorder or history should at least raise some suspicion, but a bed partner who reports (any) physical or sexual contact that is unwanted should be explored,” he said.
Family physicians, internists, and other specialists also play a primary role in identifying sexsomnia in patients and conferring with sleep specialists.
“Knowing when to refer and/or when to call to get more information or help is needed to help manage patients with sleep disorders,” Dr. Ramar said. “Family physicians play a key role, as they are usually the first physician that a patient might see with a sleep disorder. If the treatment plan that is established for the patient does not work, then a referral to a sleep specialist is needed.”
Sexsomnia might be included as a diagnostic specifier when criteria for non-REM sleep arousal disorder, sleepwalking type, are met and accompanied by evidence of sleep-related sexual behavior.
On Twitter @legal_med
*This article was updated November 24, 2014.
The inclusion of a new sleep disorder in the DSM-5 might raise awareness of the underreported diagnosis and help physicians better identify the condition.
Sexsomnia can present in different forms but is generally described as engaging in sexual activity while asleep.
“Classification of sexsomnia in DSM-5 adds legitimacy to the diagnosis as it takes it out of the proposed diagnosis or research diagnosis realm and places it into a formally accepted classification manual,” said Dr. Brandon G. Moore, a psychiatry resident at Western Michigan University School of Medicine in Kalamazoo. “The classification of the diagnosis helps patients in that it opens up the topic for further discussion and education of providers so that they may more readily recognize the disorder and offer appropriate treatment.”
Sexsomnia can involve varying degrees of sexual activity while unconscious, including masturbation, fondling, groping, and intercourse. Patients often are unaware they have the condition, and signs of the disorder frequently are reported by a partner, roommate, or spouse, Dr. Moore said in an interview. The condition is not well known to many doctors, which can lead to misdiagnoses and underdiagnoses, added Dr. Kannan Ramar, an internist who practices in the division of pulmonary and critical care medicine, and the Center for Sleep Medicine at the Mayo Clinic, Rochester, Minn.
“Awareness of this condition is not there among the medical community,” Dr. Ramar said in an interview. “More educational awareness needs to happen, and having this diagnosis listed in the DSM-5 is one right step in that direction.”
Dr. Moore recently treated a 44-year-old patient with sexsomnia referred by his neurologist. The patient originally presented for presumed restless legs syndrome but had a history of sleep-related sexual behavior. The neurologist instructed the patient and his wife to keep a sleep diary, which revealed sexual behavior by the patient during sleep, including intercourse, that had been occurring for the last 20 years, according to a case study poster by Dr. Moore presented at the American Academy of Psychiatry and the Law meeting.
Polysomnography indicated no significant sleep-disordered breathing or limb movements but did reveal episodes during non-REM sleep consistent with confusional arousal. After a diagnosis of parasomnia associated with sexual behavior, the patient was referred for psychiatric evaluation because his behavior, exacerbated by stress, was becoming increasingly aggressive and adversely affecting his marriage. The patient has since improved with the addition of paroxetine, an increase of his clonazepam dosage, as well as with psychotherapy, Dr. Moore reported.
Collecting collateral information about sleep habits from partners or roommates can help doctors pinpoint the possibility of sexsomnia, Dr. Moore said.
“Any sleepwalking disorder or history should at least raise some suspicion, but a bed partner who reports (any) physical or sexual contact that is unwanted should be explored,” he said.
Family physicians, internists, and other specialists also play a primary role in identifying sexsomnia in patients and conferring with sleep specialists.
“Knowing when to refer and/or when to call to get more information or help is needed to help manage patients with sleep disorders,” Dr. Ramar said. “Family physicians play a key role, as they are usually the first physician that a patient might see with a sleep disorder. If the treatment plan that is established for the patient does not work, then a referral to a sleep specialist is needed.”
Sexsomnia might be included as a diagnostic specifier when criteria for non-REM sleep arousal disorder, sleepwalking type, are met and accompanied by evidence of sleep-related sexual behavior.
On Twitter @legal_med
*This article was updated November 24, 2014.
Participatory surveillance gains ground in U.S., Brazil
VIENNA – Participatory surveillance has begun to enter mainstream public health.
The Brazilian Ministry of Health arranged for distribution of a participatory surveillance app for monitoring 10 symptoms in people attending or working at 2014 FIFA World Cup events. The smart phone app had 9,434 downloads, 7,155 registered users, and 4,706 active users who sent a message about their symptom status at least three times during the World Cup last June and July in Brazil, Dr. Marlo Libel said at the International Meeting on Emerging Diseases and Surveillance. “Healthy Cup 2014” became the first participatory surveillance tool ever used at a mass gathering event, he said.
“We demonstrated that direct self-reporting during a short period of time could be an excellent tool to complement other surveillance activities,” said Dr. Libel, a medical epidemiology consultant who worked with the Skoll Global Threats Fund on the Brazilian project. Officials at the Brazilian Ministry of Health were so pleased with the program that they are planning with Skoll to release similar apps for Carnival in Feb. 2015 and then for the 2016 Summer Olympics, Dr. Libel said.
Flu Near You shows U.S. growth
Longer-term participatory surveillance of U.S. residents began with the launch of the Flu Near You program in 2012, and by October 2014 it had roughly 100,000 U.S. participants, said John S. Brownstein, Ph.D., an epidemiologist at Harvard Medical School in Boston and cofounder of Flu Near You.
That level is large enough to provide meaningful information, according to Matthew Biggerstaff, an epidemiologist at the Centers for Disease Control and Prevention in Atlanta, as well as other public health officials.
“We’ve been really excited at CDC about Flu Near You because it gives us a view of influenza illness that goes beyond the medically attended cases we base our usual surveillance on,” said Matthew Biggerstaff, an epidemiologist in the CDC’s influenza division. “It adds timeliness because we usually have a 1-week lag” in reporting data from outpatient physician visits and hospitalizations. Flu Near You, which asks participants to report weekly on whether they have any of 10 symptoms gives information that goes beyond the flu-like illness tallied by standard CDC surveillance. “We do not think that it will replace our traditional health care–based surveillance, but it gives us another set of data to look at,” Mr. Biggerstaff said in an interview.
The 10 symptoms that Flu Near You prompts users to report on each week are fever, cough, sore throat, shortness of breath, chills or night sweats, fatigue, nausea and vomiting, diarrhea, body ache, and headache. New participants are also asked whether they received a flu shot during the prior season, Aug. 1-July 31, as well as during the current season since the most recent July 31.
Flu Near You and other participatory surveillance tools also offer epidemiologists a way to track the participating cohort over time. That allows assessment of individual attack rates of influenza-like illness and other syndromes and also vaccine efficacy, Mr. Biggerstaff noted.
“It helps give us a feel for what is happening” with influenza. “We have worked with Flu Near You in the past and we continue to think about ways to work together on digital disease surveillance. We promote it to our state and local colleagues. We think it is a good resource for states to have,” he sad. The CDC’s influenza division is also assessing and using other novel forms of surveillance data, such as influenza and flu mentions on Twitter and searches on Google as well as a statistic Google maintains as Flu Trends.

Participatory surveillance is “very exciting” but is also “new and unproven and remains an experiment,” said Dr. Lawrence C. Madoff, director of the division of epidemiology and immunization at the Massachusetts Department of Public Health in Boston. But while participatory surveillance must still prove its role, U.S. public health officials “increasingly” accept the value of data from tools like Flu Near You, Dr. Madoff said in an interview. He cited the endorsement that participatory surveillance received in recent surveillance and early-detection recommendations from the World Health Organization. The 100,000 participants in Flu Near You give it a “critical mass that will become even more robust as it continues to grow,” Dr. Madoff said.

Further growth is clearly a priority for Flu Near You. “We’re now very excited to promote Flu Near You in a big way to try to get more numbers there and see if we can have a faster system for picking up influenza,” said Dr. Mark S. Smolinski, director of global health at Skoll.
“We are still trying to think through how do we get [Flu Near You] into the general consciousness” of more Americans, said Dr. Brownstein. While participants, not all of whom are active every week, provide enough data to show good correlation with the CDC’s routine surveillance on a national scale, if Flu Near You “had enough numbers we could drill down into subpopulations,” he noted. For now, the volume of participation makes subgroups too scanty in size for meaningful analysis, Dr. Brownstein conceded.
Mass gathering surveillance in Brazil
The Brazilian surveillance program at the World Cup was modeled on Flu Near You, but Dr. Libel, Dr. Smolinski, and their collaborators produced the app in about 8 weeks after receiving very short notice of the Brazilians’ interest. The weekly, symptom surveillance questions posed by the app replicated seven symptoms from Flu Near You – fever, cough, sore throat, shortness of breath, nausea and vomiting, diarrhea, and headache – and added three new symptoms to the survey: joint pain, bleeding, and red spots on body. This allowed the Health Ministry to also monitor for outbreaks of other infections including measles, cholera, dengue, and chikungunya, Dr. Libel said. The Brazilian app also asked participants each week whether they had been in contact with anyone who had any of the 10 listed symptoms, and whether they had looked for health care services. No outbreaks of any type occurred in Brazil during the World Cup, but during the period it was actively used 27% of the frequent respondents reported experiencing at least one symptom.
The first Brazilian effort “was basically a pilot program,” with little advance promotion, Dr. Smolinksi said in an interview. Officials of the Brazilian Ministry of Health were “impressed” with the data collected. They also liked the ability of the system to push out information on health care access to registered users, and the potential the app offered to send out urgent public health messages. “What the Health Ministry loved the most was that if there had been an outbreak they could have immediately reached out to fans,” Dr. Smolinski said.
The Ministry has interest in expanded surveillance and outreach programs for Carnival and the 2016 Summer Olympics, and Dr. Smolinski and his associates are hopeful that the International Olympics Committee will be receptive to the program and aid in its promotion during 2016. They are also planning to expand beyond smart phones and include the capability to interact with users via text and voice messages.
“We hope we will have huge numbers at the Olympics,” to better document the role participatory surveillance can play at mass gatherings, Dr. Smolinski said.
Dr. Libel, Dr. Brownstein, Mr. Biggerstaff, Dr. Smolinski, and Dr. Madoff had no disclosures.
On Twitter @mitchelzoler
VIENNA – Participatory surveillance has begun to enter mainstream public health.
The Brazilian Ministry of Health arranged for distribution of a participatory surveillance app for monitoring 10 symptoms in people attending or working at 2014 FIFA World Cup events. The smart phone app had 9,434 downloads, 7,155 registered users, and 4,706 active users who sent a message about their symptom status at least three times during the World Cup last June and July in Brazil, Dr. Marlo Libel said at the International Meeting on Emerging Diseases and Surveillance. “Healthy Cup 2014” became the first participatory surveillance tool ever used at a mass gathering event, he said.
“We demonstrated that direct self-reporting during a short period of time could be an excellent tool to complement other surveillance activities,” said Dr. Libel, a medical epidemiology consultant who worked with the Skoll Global Threats Fund on the Brazilian project. Officials at the Brazilian Ministry of Health were so pleased with the program that they are planning with Skoll to release similar apps for Carnival in Feb. 2015 and then for the 2016 Summer Olympics, Dr. Libel said.
Flu Near You shows U.S. growth
Longer-term participatory surveillance of U.S. residents began with the launch of the Flu Near You program in 2012, and by October 2014 it had roughly 100,000 U.S. participants, said John S. Brownstein, Ph.D., an epidemiologist at Harvard Medical School in Boston and cofounder of Flu Near You.
That level is large enough to provide meaningful information, according to Matthew Biggerstaff, an epidemiologist at the Centers for Disease Control and Prevention in Atlanta, as well as other public health officials.
“We’ve been really excited at CDC about Flu Near You because it gives us a view of influenza illness that goes beyond the medically attended cases we base our usual surveillance on,” said Matthew Biggerstaff, an epidemiologist in the CDC’s influenza division. “It adds timeliness because we usually have a 1-week lag” in reporting data from outpatient physician visits and hospitalizations. Flu Near You, which asks participants to report weekly on whether they have any of 10 symptoms gives information that goes beyond the flu-like illness tallied by standard CDC surveillance. “We do not think that it will replace our traditional health care–based surveillance, but it gives us another set of data to look at,” Mr. Biggerstaff said in an interview.
The 10 symptoms that Flu Near You prompts users to report on each week are fever, cough, sore throat, shortness of breath, chills or night sweats, fatigue, nausea and vomiting, diarrhea, body ache, and headache. New participants are also asked whether they received a flu shot during the prior season, Aug. 1-July 31, as well as during the current season since the most recent July 31.
Flu Near You and other participatory surveillance tools also offer epidemiologists a way to track the participating cohort over time. That allows assessment of individual attack rates of influenza-like illness and other syndromes and also vaccine efficacy, Mr. Biggerstaff noted.
“It helps give us a feel for what is happening” with influenza. “We have worked with Flu Near You in the past and we continue to think about ways to work together on digital disease surveillance. We promote it to our state and local colleagues. We think it is a good resource for states to have,” he sad. The CDC’s influenza division is also assessing and using other novel forms of surveillance data, such as influenza and flu mentions on Twitter and searches on Google as well as a statistic Google maintains as Flu Trends.
Participatory surveillance is “very exciting” but is also “new and unproven and remains an experiment,” said Dr. Lawrence C. Madoff, director of the division of epidemiology and immunization at the Massachusetts Department of Public Health in Boston. But while participatory surveillance must still prove its role, U.S. public health officials “increasingly” accept the value of data from tools like Flu Near You, Dr. Madoff said in an interview. He cited the endorsement that participatory surveillance received in recent surveillance and early-detection recommendations from the World Health Organization. The 100,000 participants in Flu Near You give it a “critical mass that will become even more robust as it continues to grow,” Dr. Madoff said.
Further growth is clearly a priority for Flu Near You. “We’re now very excited to promote Flu Near You in a big way to try to get more numbers there and see if we can have a faster system for picking up influenza,” said Dr. Mark S. Smolinski, director of global health at Skoll.
“We are still trying to think through how do we get [Flu Near You] into the general consciousness” of more Americans, said Dr. Brownstein. While participants, not all of whom are active every week, provide enough data to show good correlation with the CDC’s routine surveillance on a national scale, if Flu Near You “had enough numbers we could drill down into subpopulations,” he noted. For now, the volume of participation makes subgroups too scanty in size for meaningful analysis, Dr. Brownstein conceded.
Mass gathering surveillance in Brazil
The Brazilian surveillance program at the World Cup was modeled on Flu Near You, but Dr. Libel, Dr. Smolinski, and their collaborators produced the app in about 8 weeks after receiving very short notice of the Brazilians’ interest. The weekly, symptom surveillance questions posed by the app replicated seven symptoms from Flu Near You – fever, cough, sore throat, shortness of breath, nausea and vomiting, diarrhea, and headache – and added three new symptoms to the survey: joint pain, bleeding, and red spots on body. This allowed the Health Ministry to also monitor for outbreaks of other infections including measles, cholera, dengue, and chikungunya, Dr. Libel said. The Brazilian app also asked participants each week whether they had been in contact with anyone who had any of the 10 listed symptoms, and whether they had looked for health care services. No outbreaks of any type occurred in Brazil during the World Cup, but during the period it was actively used 27% of the frequent respondents reported experiencing at least one symptom.
The first Brazilian effort “was basically a pilot program,” with little advance promotion, Dr. Smolinksi said in an interview. Officials of the Brazilian Ministry of Health were “impressed” with the data collected. They also liked the ability of the system to push out information on health care access to registered users, and the potential the app offered to send out urgent public health messages. “What the Health Ministry loved the most was that if there had been an outbreak they could have immediately reached out to fans,” Dr. Smolinski said.
The Ministry has interest in expanded surveillance and outreach programs for Carnival and the 2016 Summer Olympics, and Dr. Smolinski and his associates are hopeful that the International Olympics Committee will be receptive to the program and aid in its promotion during 2016. They are also planning to expand beyond smart phones and include the capability to interact with users via text and voice messages.
“We hope we will have huge numbers at the Olympics,” to better document the role participatory surveillance can play at mass gatherings, Dr. Smolinski said.
Dr. Libel, Dr. Brownstein, Mr. Biggerstaff, Dr. Smolinski, and Dr. Madoff had no disclosures.
On Twitter @mitchelzoler
EXPERT ANALYSIS FROM IMED 2014

CLINICAL GUIDELINES: Primary care bronchiolitis guidelines
Bronchiolitis is the most common cause of hospitalization among infants during the first 12 months of life. Approximately 100,000 bronchiolitis admissions occur annually in children in the United States, at an estimated cost of $1.73 billion. The American Academy of Pediatrics recently published new guidelines for the diagnosis, management, and prevention of bronchiolitis in children younger than 2 years.

Diagnosis
Diagnosis is based on patient history and physical examination. The course and severity of bronchiolitis vary, ranging from mild disease with simple runny nose and cough, to transient apneic events, and on to progressive respiratory distress secondary to airway obstruction. Management of bronchiolitis must be determined in the context of increased risk factors for severe disease, including age less than 12 weeks, history of prematurity, underlying cardiopulmonary disease, and immunodeficiency. Current evidence does not support routine labs or diagnostic imaging as helping with risk assessment. Abnormalities on chest x-ray, which are common in children with bronchiolitis, do reliably predict severity of disease, so chest x-rays are only indicated when another etiology of respiratory distress such as pneumothorax or pneumonia is a concern. Routine virologic testing is not recommended, as it does not appear to aid in guiding the treatment of the child with bronchiolitis.
Management
Randomized trials have not shown any benefit from alpha- or beta-adrenergic agonist administration. Bronchodilators can lessen symptoms scores, but their use does not speed disease resolution or decrease the length of stay or need for hospitalization. A Cochrane analysis concluded that there was no benefit to giving bronchodilators to infants with bronchiolitis. Adverse effects included tachycardia, tremors, and cost, all of which outweigh potential benefits. While previous versions of the AAP guidelines recommended bronchodilators as an option, the 2014 guidelines state, “Clinicians should not administer albuterol (or salbutamol) to infants and children with a diagnosis of bronchiolitis (Evidence Quality: B; Recommendation Strength: Strong).” It is noted that there may be some children who have reversible airway obstruction, but it is impossible to tell ahead of time who they are; and due to the variability of the disease, it is even hard to tell in whom the medication is effective. It is acknowledged that children with severe disease were usually excluded from the studies of bronchodilators. Epinephrine should also not be used except potentially as a rescue agent in severe disease.
Nebulized hypertonic saline appears to increase mucociliary clearance. Nebulized 3% saline is safe and effective in improving symptoms of mild to moderate bronchiolitis when measured after 24 hours of use, and it possibly decreases the length of hospital stay in studies where the length of stay exceeded 3 days. The guidelines conclude that hypertonic saline may be helpful to infants who are hospitalized with bronchiolitis, but probably is of very little benefit when administered in an emergency department setting.
Although there is strong evidence of benefit of systemic corticosteroids in asthma and croup, there is no evidence that systemic corticosteroids provide benefit in bronchiolitis. In addition, there is some evidence that corticosteroids may prolong viral shedding. For these reasons, the 2014 guidelines state, “Clinicians should not administer systemic corticosteroids to infants with a diagnosis of bronchiolitis in any setting (Evidence Quality: A; Recommendation Strength: Strong Recommendation).”
Physicians may choose not to give supplemental oxygen if oxyhemoglobin saturation is more than 90%, and also not to use continuous pulse oximetry given that it is prone to errors of measurement. Chest physiotherapy is not recommended. Antibiotics use is not recommended unless there is a concomitant bacterial infection or strong suspicion of one.
Prevention
The guidelines advise that palivizumab (Synagis) should not be given to otherwise healthy infants with a gestational age of 29 weeks or greater. Palivizumab should be given in the first year of life to infants with hemodynamically significant heart disease or chronic lung disease of prematurity (defined as infants of less than 32 weeks’ gestation who required more than 21% oxygen for at least the first 28 days of life). Infants who qualify for palivizumab at the start of respiratory syncytial virus season should receive a maximum of five monthly doses (15 mg/kg per dose) of palivizumab or until the end of RSV season, whichever comes first. Because of the low risk of RSV hospitalization in the second year of life, palivizumab prophylaxis is not recommended for children in the second year of life, unless the child meets the criteria for chronic lung disease and continues to require supplemental oxygen or is on chronic corticosteroids or diuretic therapy within 6 months of the onset of the second RSV season.
Reference
Ralston S.L. "Clinical Practice Guideline: The Diagnosis, Management, and Prevention of Bronchiolitis." Pediatrics 2014;134:e1474-502).
Dr. Skolnik is associate director of the family medicine residency program at Abington (Pa.) Memorial Hospital and professor of family and community medicine at Temple University in Philadelphia. Dr. Rastogi is a third-year resident in the family medicine residency program at Abington Memorial Hospital.
Ralston S.L. “Clinical Practice Guideline: The Diagnosis, Management, and Prevention of Bronchiolitis.” Pediatrics 2014;134:e1474-502).
Bronchiolitis is the most common cause of hospitalization among infants during the first 12 months of life. Approximately 100,000 bronchiolitis admissions occur annually in children in the United States, at an estimated cost of $1.73 billion. The American Academy of Pediatrics recently published new guidelines for the diagnosis, management, and prevention of bronchiolitis in children younger than 2 years.
Diagnosis
Diagnosis is based on patient history and physical examination. The course and severity of bronchiolitis vary, ranging from mild disease with simple runny nose and cough, to transient apneic events, and on to progressive respiratory distress secondary to airway obstruction. Management of bronchiolitis must be determined in the context of increased risk factors for severe disease, including age less than 12 weeks, history of prematurity, underlying cardiopulmonary disease, and immunodeficiency. Current evidence does not support routine labs or diagnostic imaging as helping with risk assessment. Abnormalities on chest x-ray, which are common in children with bronchiolitis, do reliably predict severity of disease, so chest x-rays are only indicated when another etiology of respiratory distress such as pneumothorax or pneumonia is a concern. Routine virologic testing is not recommended, as it does not appear to aid in guiding the treatment of the child with bronchiolitis.
Management
Randomized trials have not shown any benefit from alpha- or beta-adrenergic agonist administration. Bronchodilators can lessen symptoms scores, but their use does not speed disease resolution or decrease the length of stay or need for hospitalization. A Cochrane analysis concluded that there was no benefit to giving bronchodilators to infants with bronchiolitis. Adverse effects included tachycardia, tremors, and cost, all of which outweigh potential benefits. While previous versions of the AAP guidelines recommended bronchodilators as an option, the 2014 guidelines state, “Clinicians should not administer albuterol (or salbutamol) to infants and children with a diagnosis of bronchiolitis (Evidence Quality: B; Recommendation Strength: Strong).” It is noted that there may be some children who have reversible airway obstruction, but it is impossible to tell ahead of time who they are; and due to the variability of the disease, it is even hard to tell in whom the medication is effective. It is acknowledged that children with severe disease were usually excluded from the studies of bronchodilators. Epinephrine should also not be used except potentially as a rescue agent in severe disease.
Nebulized hypertonic saline appears to increase mucociliary clearance. Nebulized 3% saline is safe and effective in improving symptoms of mild to moderate bronchiolitis when measured after 24 hours of use, and it possibly decreases the length of hospital stay in studies where the length of stay exceeded 3 days. The guidelines conclude that hypertonic saline may be helpful to infants who are hospitalized with bronchiolitis, but probably is of very little benefit when administered in an emergency department setting.
Although there is strong evidence of benefit of systemic corticosteroids in asthma and croup, there is no evidence that systemic corticosteroids provide benefit in bronchiolitis. In addition, there is some evidence that corticosteroids may prolong viral shedding. For these reasons, the 2014 guidelines state, “Clinicians should not administer systemic corticosteroids to infants with a diagnosis of bronchiolitis in any setting (Evidence Quality: A; Recommendation Strength: Strong Recommendation).”
Physicians may choose not to give supplemental oxygen if oxyhemoglobin saturation is more than 90%, and also not to use continuous pulse oximetry given that it is prone to errors of measurement. Chest physiotherapy is not recommended. Antibiotics use is not recommended unless there is a concomitant bacterial infection or strong suspicion of one.
Prevention
The guidelines advise that palivizumab (Synagis) should not be given to otherwise healthy infants with a gestational age of 29 weeks or greater. Palivizumab should be given in the first year of life to infants with hemodynamically significant heart disease or chronic lung disease of prematurity (defined as infants of less than 32 weeks’ gestation who required more than 21% oxygen for at least the first 28 days of life). Infants who qualify for palivizumab at the start of respiratory syncytial virus season should receive a maximum of five monthly doses (15 mg/kg per dose) of palivizumab or until the end of RSV season, whichever comes first. Because of the low risk of RSV hospitalization in the second year of life, palivizumab prophylaxis is not recommended for children in the second year of life, unless the child meets the criteria for chronic lung disease and continues to require supplemental oxygen or is on chronic corticosteroids or diuretic therapy within 6 months of the onset of the second RSV season.
Reference
Ralston S.L. "Clinical Practice Guideline: The Diagnosis, Management, and Prevention of Bronchiolitis." Pediatrics 2014;134:e1474-502).
Dr. Skolnik is associate director of the family medicine residency program at Abington (Pa.) Memorial Hospital and professor of family and community medicine at Temple University in Philadelphia. Dr. Rastogi is a third-year resident in the family medicine residency program at Abington Memorial Hospital.
Ralston S.L. “Clinical Practice Guideline: The Diagnosis, Management, and Prevention of Bronchiolitis.” Pediatrics 2014;134:e1474-502).
Ralston S.L. “Clinical Practice Guideline: The Diagnosis, Management, and Prevention of Bronchiolitis.” Pediatrics 2014;134:e1474-502).

Vocal Cord Dysfunction: Unmasking the Asthma Pretender
CE/CME No: CR-1412
PROGRAM OVERVIEW
Earn credit by reading this article and successfully completing the posttest and evaluation. Successful completion is defined as a cumulative score of at least 70% correct.
EDUCATIONAL OBJECTIVES
• Discuss the evolution in thinking about the pathogenesis of and treatment for vocal cord dysfunction (VCD).
• Describe the three primary functions of the healthy vocal cords.
• List the conditions or factors that may trigger VCD.
• Explain how to differentiate VCD from asthma.
• Develop a treatment plan for VCD that addresses both patient-specific VCD triggers and management of symptomatic episodes.
FACULTY
Linda S. MacConnell is an Assistant Professor in the Department of Physician Assistant Studies and Randy D. Danielsen is a Professor and Dean at the Arizona School of Health Sciences, AT Still University, Mesa. Ms. MacConnell is also a clinical PA affiliated with Enticare, an otolaryngology practice in Chandler, Arizona. Susan Symington is a clinical PA with the Arizona Asthma & Allergy Institute, with which Dr. Danielsen is also affiliated.
Linda MacConnell and Randy Danielsen have no significant financial relationships to disclose. Susan Symington is a member of the speaker’s bureau for Teva Respiratory and Thermo Fisher Scientific, Inc.
ACCREDITATION STATEMENT
![]()
This program has been reviewed and is approved for a maximum of 1.0 hour of American Academy of Physician Assistants (AAPA) Category 1 CME credit by the Physician Assistant Review Panel. [NPs: Both ANCC and the AANP Certification Program recognize AAPA as an approved provider of Category 1 credit.] Approval is valid for one year from the issue date of December 2014.
Article begins on next page >>
The symptoms of vocal cord dysfunction (VCD) can be mistaken for those
of asthma or other respiratory illnesses. As a result, VCD is often misdiagnosed,
leading to unnecessary, ineffective, costly, or even dangerous treatment. Here are
the facts that will enable you to avoid making an erroneous diagnosis, choosing
potentially harmful treatment, and delaying effective treatment.
A 33-year-old oncology nurse, JD, had moved from Seattle to Phoenix about six months earlier for a job opportunity. Shortly after starting her new job, she had developed intermittent dyspnea on exertion, with a cough lasting several minutes at a time, along with a sensation of heaviness over the larynx and a choking sensation. These symptoms were precipitated by gastroesophageal reflux disease (GERD), postnasal drainage, stress, and significant environmental change (ie, Seattle to Phoenix). She noticed that, since moving to Phoenix, she frequently cleared her throat but denied any hoarseness, dysphagia, chest tightness, chest pain, or wheezing. She noted nasal congestion and clear nasal discharge on exposure to inhaled irritants (eg, woodstove smoke) and strong fragrances (eg, perfume or cologne).
On physical examination, the patient was alert, oriented, and in no acute distress. She was coughing intermittently but was able to speak in complete sentences. No stridor or dyspnea was noted, either on exertion (jogging in place) or at rest.
HEENT examination was normal, with no scalp lesions or tenderness; face, symmetric; light reflex, symmetric; conjunctivae, clear; sclera white, without lesions or redness; pupils, equal, reactive to light and accommodation; tympanic membranes and canals, clear with intact landmarks; no nasal deformities; nasal mucosa, mildly erythematous with mild engorgement of the turbinates; no nasal polyps seen; nasal septum midline without perforation; no sinus tenderness on percussion; pharynx, clear without exudate; uvula rises on phonation; and oral mucosa and gingivae, pink without lesions. Neck was supple without masses or thyromegaly, and trachea was midline. Lungs were clear to auscultation with normal respiratory movement and no accessory muscle use, with normal anteroposterior diameter. Heart examination revealed regular rate and rhythm, without murmur, clicks, or gallops.
Examination of the skin was normal, without rashes, hives, swelling, petechiae, or significant ecchymosis. There was no palpable cervical, supraclavicular, or axillary adenopathy.
Results of laboratory studies included a normal complete blood count with differential and a normal IgE level of 46.3 IU/mL. Spirometry testing revealed normal values without obstruction; however, there was a flattening of the inspiratory flow loop, with no reversibility after bronchodilator, which was highly suggestive of vocal cord dysfunction (VCD). Perennial nonallergic rhinitis (formerly called vasomotor rhinitis) was confirmed because the patient experienced fewer symptoms to perfume after nasal corticosteroid use. The patient’s GERD was generally well controlled with esomeprazole but was likely a contributing factor to her vocal cord symptoms.
On laryngoscopy, abnormal vocal cord movement toward the midline during both inspiration and expiration was visualized, confirming the diagnosis of VCD.
BACKGROUND
VCD is a partial upper airway obstruction caused by paradoxical adduction (medial movement) of the vocal cords.1 Although it is primarily associated with inspiration, it sometimes manifests during expiration as well.
The true incidence of VCD is uncertain; different studies have found incidence rates varying from 2% to 27%, with higher rates in patients with asthma.1,2 However, highlighting the risk for misdiagnosis, some 10% of patients evaluated for asthma unresponsive to aggressive treatment were found, in fact, to have VCD alone.2

Similarly, although VCD is generally more common in women than in men, the reported female-to-male ratio has varied from 2:1 to 4:1.1,2,4 Some reports suggest that VCD is seen more frequently in younger women, with average ages at diagnosis of 14.5 in adolescents and 33 in adults.2,3 Others identify a broader age range, with most patients older than 50.4
Historically, VCD has been known by a variety of names and has been observed clinically since 1842. In that year, Dunglison referred to it as hysteric croup, describing a disorder of the laryngeal muscles brought on by “hysteria.”5 Later, Mackenzie was able to visualize adduction of the vocal cords during inspiration in patients with stridor by using a laryngoscope.6 Osler demonstrated his understanding of the condition in 1902, stating, “Spasm of muscles may occur with violent inspiratory effort and great distress, and may even lead to cyanosis. Extraordinary cries may be produced either inspiratory or expiratory.”7
More recently, in 1974, Patterson et al reported finding laryngoscopic evidence of VCD, which they termed Munchausen’s stridor.8 They used this descriptor to report on the case of a young woman with 15 hospital admissions for this condition. At the time, the etiology of the condition was believed to be largely psychologic, and its evaluation was consigned to psychiatrists and other mental health practitioners.
As laryngoscopy became more widely available in the 1970s and 1980s, diagnosis of VCD increased, although the condition remains underrecognized.9 Ibrahim et al suggest that primary care clinicians may not be as aware of VCD as they should be and may not consider laryngoscopy for possible VCD in patients whose asthma is poorly controlled.2
Disagreement persists with regard to the preferred name for the condition. Because numerous disorders involve abnormal vocal cord function, Christopher proposed moving away from the broad term VCD and toward a more descriptive term: paradoxical vocal fold motion (PVFM) disorder.10 Interestingly, use of the two terms seems to be divided along specialty lines: VCD is preferred by allergy, pulmonology, and mental health specialists, while PVFM is favored by otolaryngology specialists and speech-language pathologists.11
Further complicating awareness and recognition of VCD is its longstanding reputation as a psychologic disorder. In fact, the paradigm has shifted away from defining VCD as a purely psychopathologic entity to the identification of numerous functional etiologies for the disorder. This, however, has resulted in many new terms to describe the condition, including nonorganic upper airway obstruction, pseudoasthma, irritable larynx syndrome, factitious asthma, spasmodic croup, functional upper airway obstruction, episodic laryngeal dyskinesia, functional laryngeal obstruction, functional laryngeal stridor, and episodic paroxysmal laryngospasm.1
Regardless of its name, an understanding of VCD is essential for both primary care and specialty clinicians because of its frequent misdiagnosis as asthma, allergies, or severe upper airway obstruction. When it is misdiagnosed as asthma, aggressive asthma treatments—to which VCD does not respond—may be prescribed, including high-dose inhaled and systemic corticosteroids and bronchodilators. Patients may experience multiple emergency department (ED) visits and hospitalizations and, in some cases, may be subjected to tracheostomies and intubation.
Continue for vocal cord physiology and functions >>
VOCAL CORD PHYSIOLOGY AND FUNCTIONS
The vocal cords are located within the larynx. Abduction, or opening, of the cords is controlled by the posterior cricoarytenoid muscle; adduction, or closing, occurs via contraction of the lateral cricoarytenoid muscle. These muscles are innervated by the recurrent laryngeal nerve to control the width of the space—the rima glottidis—between the cords. During inspiration, the glottis opens; during expiration, it narrows but remains open.12
The vocal cords are involved in three main functions: protection of the airway, respiration, and phonation (vocal production). These functions are at least partially controlled involuntarily by brain stem reflexes; however, only airway protection—the most important of these functions—is reflexive and involuntary.12 Respiration may be controlled voluntarily, and phonation is primarily voluntary. Closure of the vocal cords is under the control of the laryngeal nerve branches of the vagal nerve.12,13
The vocal cords normally abduct during inspiration to allow air to pass through them into the trachea and the lungs. Sniffing, puffing, snuffling, and panting also cause the vocal cords to abduct. The vocal cords adduct with phonation (talking, singing), coughing, clearing the throat, performing the Valsalva maneuver, and swallowing. During expiration, 10% to 40% adduction is considered normal.14
VOCAL CORD DYSFUNCTION
Pathogenesis and etiology
VCD is a nonspecific term, and a number of factors may be involved in its development.15 Although the precise cause of VCD is unknown, it is believed to result from laryngeal hyperresponsiveness. This exaggerated responsiveness may be prompted by irritant and nonirritant triggers of the sensory receptors in the larynx, trachea, and large airways that mediate cough and glottis closure reflexes.16
VCD may be among a group of airway disorders triggered by occupational exposures, including irritants and psychologic stressors. For example, occupationally triggered VCD was diagnosed in rescue, recovery, and cleanup workers at the World Trade Center disaster site.4
A history of childhood sexual abuse has also been associated by some researchers with the development of VCD. For example, Freedman et al reported that, of 47 patients with VCD, 14 identified such a history and five were suspected of having been sexually abused as children.17
Paradoxical movement of the vocal cords causes them to close when they should open. (Click here for a video on normal and abnormal vocal cord movement.) VCD generally occurs during inspiration, causing obstruction of the incoming air through the larynx. Symptoms of VCD frequently include dyspnea, coughing, wheezing, hoarseness, and tightness or pain in the throat.
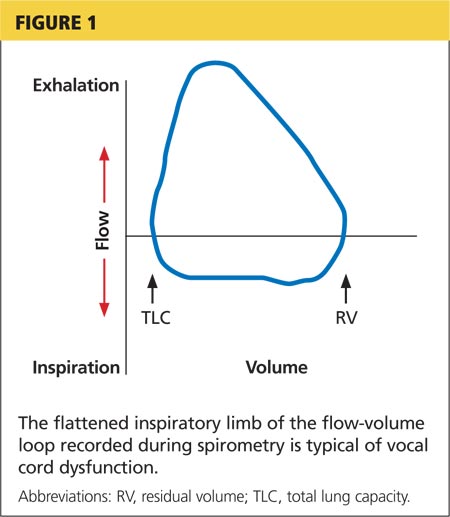
Examination of the flow-volume loops recorded when a patient experiences “wheezing” during spirometry testing reveals a flattened inspiratory loop, indicating a decrease of airflow into the lungs (see Figure 1).13,16 “Wheezing” is actually a misnomer in this situation because the term typically refers to sounds that occur during expiration.
Triggers
Physiologic, psychologic, and neurologic factors may all contribute to VCD.1,15 Conditions that can trigger VCD include
• Asthma
• Postnasal drip
• Recent upper respiratory illness (URI)
• Talking, singing
• Exercise
• Cough
• Voice strain
• Stress, anxiety, tension, elevated emotions
• Common irritants (eg, strong smells)
• Airborne irritants
• Rhinosinusitis
• GERD
• Use of certain medications
Identification of a particular patient’s triggers is key to successful management of VCD.
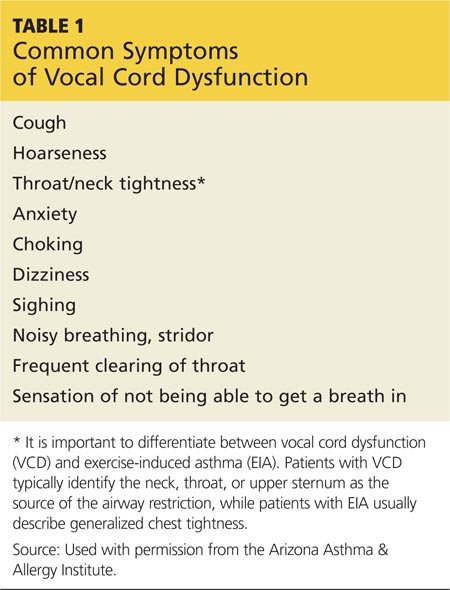
PATIENT PRESENTATION
Although there is no “typical” patient with VCD, the condition occurs more frequently in women, with the most common age at onset between 20 and 40 years. However, VCD has been seen in very young children and in adults as old as 83, and its diagnosis in the pediatric population is increasing.18
The patient may present with complaints of atypical chest pain, throat tightness, stridor, choking, difficult vocalization, cough and sometimes dysphagia, GERD, or rhinosinusitis (see Table 1). These signs and symptoms may occur without provocation, or patients may relate a history of triggers such as anxiety, irritant exposure, or exercise. In fact, about 14% of VCD is associated with exercise, particularly in young female athletes who experience shortness of breath and even stridor with exercise.19
A characteristic finding on physical examination is inspiratory stridor, along with respiratory distress.20 The stridor is best auscultated not over the anterior chest wall but over the tracheal area of the anterior neck.
Continue for differential diagnosis >>
DIFFERENTIAL DIAGNOSIS
Distinguishing VCD from other disorders can be challenging. Differential diagnosis should include
• Non–vocal cord adduction disorders, such as thyroid goiter, upper airway hemorrhage, caustic ingestion, neoplastic disorders, rheumatoid cricoarytenoid arthritis, pharyngeal abscess, angioedema, pulmonary embolus21
• Anatomic defects (eg, laryngomalacia, subglottic stenosis)
• Tracheal masses (eg, enlarged thyroid gland)
• Vocal cord polyps
• Laryngospasm
• Vocal cord paresis
• Neurologic causes (eg, brain stem compression, severe cortical injury, nuclear or lower motor neuron injury, movement disorders)
• Nonorganic causes (eg, factitious symptoms or malingering; conversion disorder)22
• Reactive airway disease.
Some disorders are easier to distinguish from VCD than others. For example, although laryngospasm may produce similar symptoms, episodes are brief, lasting seconds to minutes; VCD episodes may last hours to days.
Asthma
Even the most astute clinician will be unable to obtain adequate information from the patient history to differentiate VCD from asthma. There is a significant overlap of symptoms—shortness of breath, cough, wheezing—and frequently, the diseases coexist. History is often negative for chest pain, but it is common for patients with VCD, when asked to describe their symptoms, to report chest tightness. The clinician therefore needs to ask the patient to point to where the tightness is felt—in the chest or in the neck over the laryngeal area—to distinguish the source.
Asthma symptoms usually increase over a few hours, days, or weeks but respond to medications that open the airway and reduce inflammation (inhaled β-agonists and corticosteroids). VCD symptoms usually occur or decrease suddenly and do not respond well to traditional asthma treatments.
Other differences between asthma and VCD symptoms include voice changes and time of day when symptoms occur. The person with VCD will experience voice changes, such as hoarseness, as well as prolonged coughing episodes. Patients with asthma may awaken at night because of breathlessness, while most patients with VCD experience symptoms only during the day.
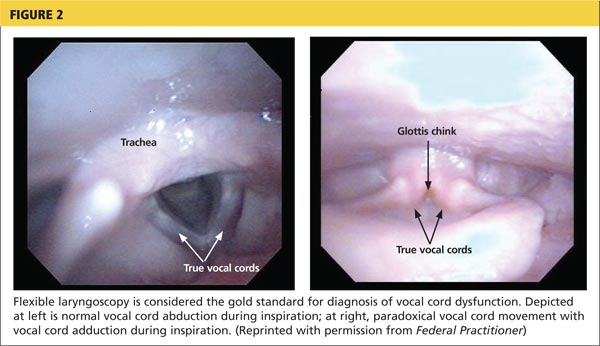
The diagnosis is generally confirmed if VCD is seen on direct laryngoscopic visualization during a symptomatic episode. In terms of adduction, the anterior cords will appear normal, but the posterior portion of the cords will display the classic “glottis chink” (see Figure 2).9
If the diagnosis is in question, videostroboscopy, a technique that provides a magnified slow-motion view of vocal cord vibration, can help identify or exclude pathologic conditions of the vocal cords.23
Convincing the patient of the validity of the diagnosis may be problematic if the patient has been previously diagnosed with and treated for another condition. The diagnosis should be explained and the patient counseled what appropriate care for VCD entails (see discussion under “Patient education and self-care”).
TREATMENT
Acute episode
During an acute VCD episode, offering the patient calm reassurance can be effective in resolving the episode. Simple breathing guidance may also be beneficial; instructing the patient to breathe rapidly and shallowly (ie, pant) can result in immediate resolution of symptoms.24 The patient can be advised to utilize other techniques, such as diaphragmatic breathing, breathing through the nose, breathing through a straw, pursed-lip breathing, and exhaling with a hissing sound.25
Long-term management
Although various strategies are employed in the management of VCD, well-designed studies on which to base treatment decisions have not been performed. Of course, control and management of possible underlying triggers or disorders should be implemented. Because etiology is rarely known, treatment for VCD is generally empiric.
Evidence does exist, however, to suggest that voice therapy, the treatment of choice for muscle tension dysphonia, is also effective for VCD. Speech therapy with specific voice and breathing exercises can enable the patient to manage the condition, thereby reducing ED visits, hospitalizations, and treatment costs.26
Patient education and self-care
Patient education is a critical component of VCD management. The clinician should explain the functions of the larynx to the patient, including the normal functioning of the vocal cords during respiration, speaking, swallowing, coughing, throat clearing, and breath holding. It may also enhance patients’ understanding of VCD to view their diagnostic laryngoscopy or videostroboscopy films.21
The patient should be advised to rest the voice, hydrate, utilize sialagogues (lozenges, gum) to stimulate salivation, reduce exposure to triggers when possible, and decrease stress. She should be encouraged to track VCD triggers by documenting what she is doing, where, and when, at the time of a VCD episode.
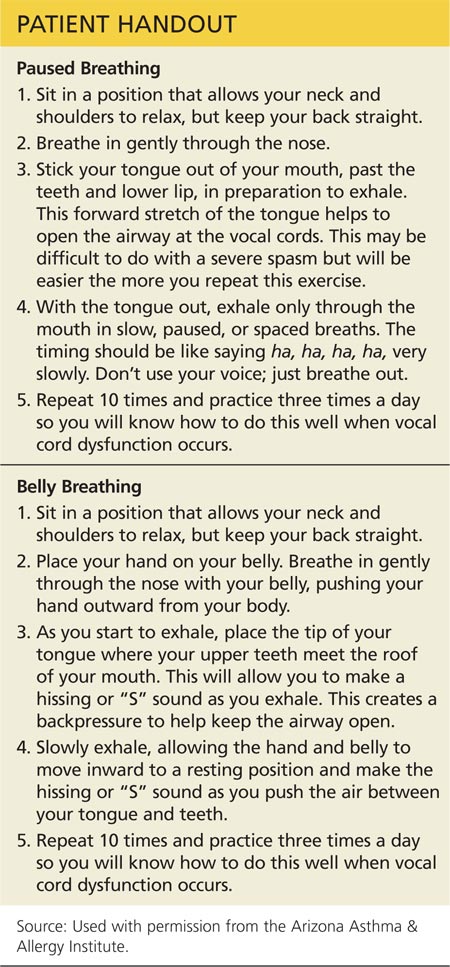
Two exercises—“paused breathing” and “belly breathing”—can be used by patients to learn how to relax the vocal cords (see “Patient Handout”). Patients should practice these exercises three times a day so that they can be easily recalled and performed during VCD episodes.
Continue for outcomes >>
OUTCOMES
Little is known about long-term outcomes for patients with VCD. The current literature consists of poorly described and conflicting case reports and results of small trials. Although documentation is lacking, the authors agree that, by educating the patient about the diagnosis, teaching effective VCD management strategies, and referring patients for voice therapy, clinicians can help patients achieve signicant improvement. Further investigation is needed to enhance our knowledge of the causes of VCD and to research additional diagnostic modalities and treatments.2
CASE PATIENT
After diagnosing VCD, the clinician explained the normal functioning of the vocal cords and how certain factors may cause them to close during inspiration. The patient then understood why bronchodilator therapy had failed to relieve her symptoms. She was counseled to continue her inhaled nasal steroid and proton pump inhibitor for her perennial nonallergic rhinitis and GERD, respectively, because these conditions may trigger her VCD, and to take steps to manage her stress. She learned breathing techniques to alleviate acute episodes of VCD and was informed of the option of voice therapy with a speech therapist if needed.
At six-week follow-up, the patient reported that she was complying with her medication regimen, had made an effort to relax more, and had experienced no acute attacks of VCD since her last visit.
CONCLUSION
Patients with symptoms suggestive of VCD require a thorough evaluation, including laryngoscopic examination, to ensure accurate diagnosis and avoid a too-common misdiagnosis. Primary care clinicians should know about VCD and, if not trained in the performance of flexible laryngoscopy, should refer the symptomatic patient to a specialist for appropriate work-up.
1. Hoyte FCL. Vocal cord dysfunction. Immunol Allergy Clin N Am. 2013;33:1-22.
2. Ibrahim WH, Gheriani HA, Almohamed AA, Raza T. Paradoxical vocal cord motion disorder: past, present and future. Postgrad Med J. 2007;83:164-172.
3. Powell DM, Karanfilov BI, Beechler KB, et al. Paradoxical vocal cord dysfunction in juveniles. Arch Otolaryngol Head Neck Surg. 2000;126(1):29-34.
4. Husein OF, Husein TN, Gardner R, et al. Formal psychological testing in patients with paradoxical vocal fold dysfunction. Laryngoscope. 2008; 118(4):740-747.
5. Dunglison RD. The Practice of Medicine. Philadelphia, PA: Lea and Blanchard; 1842:257-258.
6. MacKenzie M. Use of Laryngoscopy in Diseases of the Throat. Philadelphia, PA: Lindsey and Blackeston; 1869:246-250.
7. Osler W. Hysteria. In: The Principles and Practice of Medicine. 4th ed. New York, NY: Appleton; 1902:1111-1112.
8. Patterson R, Schatz M, Horton M. Munchausen’s stridor: non-organic laryngeal obstruction. Clin Allergy. 1974;4:307-310.
9. Christopher KL, Wood RP 2nd, Eckert RC, et al. Vocal cord dysfunction presenting as asthma. N Engl J Med. 1983;308(26):1566-1570.
10. Christopher KL. Understanding vocal cord dysfunction: a step in the right direction with a long road ahead. Chest. 2006;129(4):842-843.
11. Christopher KL, Morris MJ. Vocal cord dysfunction, paradoxic vocal fold motion, or laryngomalacia? Our understanding requires an interdisciplinary approach. Otolaryngol Clin N Am. 2010;43:43-66.
12. Sasaki CT, Weaver EM. Physiology of the larynx. Am J Med. 1997;103:9S-18S.
13. Balkissoon R. Occupational upper airway disease. Clin Chest Med. 2002;23:717-725.
14. Murakami Y, Kirschner JA. Mechanical and physiological properties of reflex laryngeal closure. Ann Otol Rhinol Laryngol. 1972;81(1):59-71.
15. Forrest LA, Husein T, Husein O. Paradoxical vocal cord motion disorder: classification and treatment. Laryngoscope. 2012;122:844-853.
16. Altman KW, Simpson CB, Amin MR, et al. Cough and paradoxical vocal fold motion. Otolaryngol Head Neck Surg. 2002;127(6):501-511.
17. Freedman MR, Rosenberg SJ, Schmaling KB. Childhood sexual abuse in patients with paradoxical vocal cord dysfunction. J Nerv Ment Dis. 1991;179(5):295-298.
18. Buddiga P. Vocal cord dysfunction. Medscape. http://emedicine.medscape.com/article/137782-overview. Accessed November 12, 2014.
19. Chiang T, Marcinow AM, deSilva BW, et al. Exercise-induced paradoxical vocal fold motion disorder: diagnosis and management. Laryngoscope. 2013;123:727-731.
20. Morris MJ, Deal LE, Bean DR, et al. Vocal cord dysfunction in patients with exertional dyspnea. Chest. 1999;116(6):1676-1682.
21. Hicks M, Brugman SM, Katial R. Vocal cord dysfunction/paradoxical vocal fold motion. Prim Care. 2008;35(1):81-103.
22. Maschka DA, Bauman NM, McCray PB, et al. A classification scheme for paradoxical vocal fold motion. Laryngoscope. 1997;107(11):1429-1435.
23. Uloza V, Vegiene A, Pribuisiene R, Saferis V. Quantitative evaluation of video laryngostroboscopy: reliability of the basic parameters. J Voice. 2013;27(3):361-368.
24. Pitchenik AF. Functional laryngeal obstruction relieved by panting. Chest. 1991;100(5):1465-1467.
25. Deckert J, Deckert L. Vocal cord dysfunction. Am Fam Physician. 2010;81(2):156-160.
26. Carding PN, Horsley IA, Docherty GJ. A study of the effectiveness of voice therapy in the treatment of 45 patients with nonorganic dysphonia. J Voice. 1999;13(1):72-104.
CE/CME No: CR-1412
PROGRAM OVERVIEW
Earn credit by reading this article and successfully completing the posttest and evaluation. Successful completion is defined as a cumulative score of at least 70% correct.
EDUCATIONAL OBJECTIVES
• Discuss the evolution in thinking about the pathogenesis of and treatment for vocal cord dysfunction (VCD).
• Describe the three primary functions of the healthy vocal cords.
• List the conditions or factors that may trigger VCD.
• Explain how to differentiate VCD from asthma.
• Develop a treatment plan for VCD that addresses both patient-specific VCD triggers and management of symptomatic episodes.
FACULTY
Linda S. MacConnell is an Assistant Professor in the Department of Physician Assistant Studies and Randy D. Danielsen is a Professor and Dean at the Arizona School of Health Sciences, AT Still University, Mesa. Ms. MacConnell is also a clinical PA affiliated with Enticare, an otolaryngology practice in Chandler, Arizona. Susan Symington is a clinical PA with the Arizona Asthma & Allergy Institute, with which Dr. Danielsen is also affiliated.
Linda MacConnell and Randy Danielsen have no significant financial relationships to disclose. Susan Symington is a member of the speaker’s bureau for Teva Respiratory and Thermo Fisher Scientific, Inc.
ACCREDITATION STATEMENT
![]()
This program has been reviewed and is approved for a maximum of 1.0 hour of American Academy of Physician Assistants (AAPA) Category 1 CME credit by the Physician Assistant Review Panel. [NPs: Both ANCC and the AANP Certification Program recognize AAPA as an approved provider of Category 1 credit.] Approval is valid for one year from the issue date of December 2014.
Article begins on next page >>
The symptoms of vocal cord dysfunction (VCD) can be mistaken for those
of asthma or other respiratory illnesses. As a result, VCD is often misdiagnosed,
leading to unnecessary, ineffective, costly, or even dangerous treatment. Here are
the facts that will enable you to avoid making an erroneous diagnosis, choosing
potentially harmful treatment, and delaying effective treatment.
A 33-year-old oncology nurse, JD, had moved from Seattle to Phoenix about six months earlier for a job opportunity. Shortly after starting her new job, she had developed intermittent dyspnea on exertion, with a cough lasting several minutes at a time, along with a sensation of heaviness over the larynx and a choking sensation. These symptoms were precipitated by gastroesophageal reflux disease (GERD), postnasal drainage, stress, and significant environmental change (ie, Seattle to Phoenix). She noticed that, since moving to Phoenix, she frequently cleared her throat but denied any hoarseness, dysphagia, chest tightness, chest pain, or wheezing. She noted nasal congestion and clear nasal discharge on exposure to inhaled irritants (eg, woodstove smoke) and strong fragrances (eg, perfume or cologne).
On physical examination, the patient was alert, oriented, and in no acute distress. She was coughing intermittently but was able to speak in complete sentences. No stridor or dyspnea was noted, either on exertion (jogging in place) or at rest.
HEENT examination was normal, with no scalp lesions or tenderness; face, symmetric; light reflex, symmetric; conjunctivae, clear; sclera white, without lesions or redness; pupils, equal, reactive to light and accommodation; tympanic membranes and canals, clear with intact landmarks; no nasal deformities; nasal mucosa, mildly erythematous with mild engorgement of the turbinates; no nasal polyps seen; nasal septum midline without perforation; no sinus tenderness on percussion; pharynx, clear without exudate; uvula rises on phonation; and oral mucosa and gingivae, pink without lesions. Neck was supple without masses or thyromegaly, and trachea was midline. Lungs were clear to auscultation with normal respiratory movement and no accessory muscle use, with normal anteroposterior diameter. Heart examination revealed regular rate and rhythm, without murmur, clicks, or gallops.
Examination of the skin was normal, without rashes, hives, swelling, petechiae, or significant ecchymosis. There was no palpable cervical, supraclavicular, or axillary adenopathy.
Results of laboratory studies included a normal complete blood count with differential and a normal IgE level of 46.3 IU/mL. Spirometry testing revealed normal values without obstruction; however, there was a flattening of the inspiratory flow loop, with no reversibility after bronchodilator, which was highly suggestive of vocal cord dysfunction (VCD). Perennial nonallergic rhinitis (formerly called vasomotor rhinitis) was confirmed because the patient experienced fewer symptoms to perfume after nasal corticosteroid use. The patient’s GERD was generally well controlled with esomeprazole but was likely a contributing factor to her vocal cord symptoms.
On laryngoscopy, abnormal vocal cord movement toward the midline during both inspiration and expiration was visualized, confirming the diagnosis of VCD.
BACKGROUND
VCD is a partial upper airway obstruction caused by paradoxical adduction (medial movement) of the vocal cords.1 Although it is primarily associated with inspiration, it sometimes manifests during expiration as well.
The true incidence of VCD is uncertain; different studies have found incidence rates varying from 2% to 27%, with higher rates in patients with asthma.1,2 However, highlighting the risk for misdiagnosis, some 10% of patients evaluated for asthma unresponsive to aggressive treatment were found, in fact, to have VCD alone.2
Similarly, although VCD is generally more common in women than in men, the reported female-to-male ratio has varied from 2:1 to 4:1.1,2,4 Some reports suggest that VCD is seen more frequently in younger women, with average ages at diagnosis of 14.5 in adolescents and 33 in adults.2,3 Others identify a broader age range, with most patients older than 50.4
Historically, VCD has been known by a variety of names and has been observed clinically since 1842. In that year, Dunglison referred to it as hysteric croup, describing a disorder of the laryngeal muscles brought on by “hysteria.”5 Later, Mackenzie was able to visualize adduction of the vocal cords during inspiration in patients with stridor by using a laryngoscope.6 Osler demonstrated his understanding of the condition in 1902, stating, “Spasm of muscles may occur with violent inspiratory effort and great distress, and may even lead to cyanosis. Extraordinary cries may be produced either inspiratory or expiratory.”7
More recently, in 1974, Patterson et al reported finding laryngoscopic evidence of VCD, which they termed Munchausen’s stridor.8 They used this descriptor to report on the case of a young woman with 15 hospital admissions for this condition. At the time, the etiology of the condition was believed to be largely psychologic, and its evaluation was consigned to psychiatrists and other mental health practitioners.
As laryngoscopy became more widely available in the 1970s and 1980s, diagnosis of VCD increased, although the condition remains underrecognized.9 Ibrahim et al suggest that primary care clinicians may not be as aware of VCD as they should be and may not consider laryngoscopy for possible VCD in patients whose asthma is poorly controlled.2
Disagreement persists with regard to the preferred name for the condition. Because numerous disorders involve abnormal vocal cord function, Christopher proposed moving away from the broad term VCD and toward a more descriptive term: paradoxical vocal fold motion (PVFM) disorder.10 Interestingly, use of the two terms seems to be divided along specialty lines: VCD is preferred by allergy, pulmonology, and mental health specialists, while PVFM is favored by otolaryngology specialists and speech-language pathologists.11
Further complicating awareness and recognition of VCD is its longstanding reputation as a psychologic disorder. In fact, the paradigm has shifted away from defining VCD as a purely psychopathologic entity to the identification of numerous functional etiologies for the disorder. This, however, has resulted in many new terms to describe the condition, including nonorganic upper airway obstruction, pseudoasthma, irritable larynx syndrome, factitious asthma, spasmodic croup, functional upper airway obstruction, episodic laryngeal dyskinesia, functional laryngeal obstruction, functional laryngeal stridor, and episodic paroxysmal laryngospasm.1
Regardless of its name, an understanding of VCD is essential for both primary care and specialty clinicians because of its frequent misdiagnosis as asthma, allergies, or severe upper airway obstruction. When it is misdiagnosed as asthma, aggressive asthma treatments—to which VCD does not respond—may be prescribed, including high-dose inhaled and systemic corticosteroids and bronchodilators. Patients may experience multiple emergency department (ED) visits and hospitalizations and, in some cases, may be subjected to tracheostomies and intubation.
Continue for vocal cord physiology and functions >>
VOCAL CORD PHYSIOLOGY AND FUNCTIONS
The vocal cords are located within the larynx. Abduction, or opening, of the cords is controlled by the posterior cricoarytenoid muscle; adduction, or closing, occurs via contraction of the lateral cricoarytenoid muscle. These muscles are innervated by the recurrent laryngeal nerve to control the width of the space—the rima glottidis—between the cords. During inspiration, the glottis opens; during expiration, it narrows but remains open.12
The vocal cords are involved in three main functions: protection of the airway, respiration, and phonation (vocal production). These functions are at least partially controlled involuntarily by brain stem reflexes; however, only airway protection—the most important of these functions—is reflexive and involuntary.12 Respiration may be controlled voluntarily, and phonation is primarily voluntary. Closure of the vocal cords is under the control of the laryngeal nerve branches of the vagal nerve.12,13
The vocal cords normally abduct during inspiration to allow air to pass through them into the trachea and the lungs. Sniffing, puffing, snuffling, and panting also cause the vocal cords to abduct. The vocal cords adduct with phonation (talking, singing), coughing, clearing the throat, performing the Valsalva maneuver, and swallowing. During expiration, 10% to 40% adduction is considered normal.14
VOCAL CORD DYSFUNCTION
Pathogenesis and etiology
VCD is a nonspecific term, and a number of factors may be involved in its development.15 Although the precise cause of VCD is unknown, it is believed to result from laryngeal hyperresponsiveness. This exaggerated responsiveness may be prompted by irritant and nonirritant triggers of the sensory receptors in the larynx, trachea, and large airways that mediate cough and glottis closure reflexes.16
VCD may be among a group of airway disorders triggered by occupational exposures, including irritants and psychologic stressors. For example, occupationally triggered VCD was diagnosed in rescue, recovery, and cleanup workers at the World Trade Center disaster site.4
A history of childhood sexual abuse has also been associated by some researchers with the development of VCD. For example, Freedman et al reported that, of 47 patients with VCD, 14 identified such a history and five were suspected of having been sexually abused as children.17
Paradoxical movement of the vocal cords causes them to close when they should open. (Click here for a video on normal and abnormal vocal cord movement.) VCD generally occurs during inspiration, causing obstruction of the incoming air through the larynx. Symptoms of VCD frequently include dyspnea, coughing, wheezing, hoarseness, and tightness or pain in the throat.
Examination of the flow-volume loops recorded when a patient experiences “wheezing” during spirometry testing reveals a flattened inspiratory loop, indicating a decrease of airflow into the lungs (see Figure 1).13,16 “Wheezing” is actually a misnomer in this situation because the term typically refers to sounds that occur during expiration.
Triggers
Physiologic, psychologic, and neurologic factors may all contribute to VCD.1,15 Conditions that can trigger VCD include
• Asthma
• Postnasal drip
• Recent upper respiratory illness (URI)
• Talking, singing
• Exercise
• Cough
• Voice strain
• Stress, anxiety, tension, elevated emotions
• Common irritants (eg, strong smells)
• Airborne irritants
• Rhinosinusitis
• GERD
• Use of certain medications
Identification of a particular patient’s triggers is key to successful management of VCD.
PATIENT PRESENTATION
Although there is no “typical” patient with VCD, the condition occurs more frequently in women, with the most common age at onset between 20 and 40 years. However, VCD has been seen in very young children and in adults as old as 83, and its diagnosis in the pediatric population is increasing.18
The patient may present with complaints of atypical chest pain, throat tightness, stridor, choking, difficult vocalization, cough and sometimes dysphagia, GERD, or rhinosinusitis (see Table 1). These signs and symptoms may occur without provocation, or patients may relate a history of triggers such as anxiety, irritant exposure, or exercise. In fact, about 14% of VCD is associated with exercise, particularly in young female athletes who experience shortness of breath and even stridor with exercise.19
A characteristic finding on physical examination is inspiratory stridor, along with respiratory distress.20 The stridor is best auscultated not over the anterior chest wall but over the tracheal area of the anterior neck.
Continue for differential diagnosis >>
DIFFERENTIAL DIAGNOSIS
Distinguishing VCD from other disorders can be challenging. Differential diagnosis should include
• Non–vocal cord adduction disorders, such as thyroid goiter, upper airway hemorrhage, caustic ingestion, neoplastic disorders, rheumatoid cricoarytenoid arthritis, pharyngeal abscess, angioedema, pulmonary embolus21
• Anatomic defects (eg, laryngomalacia, subglottic stenosis)
• Tracheal masses (eg, enlarged thyroid gland)
• Vocal cord polyps
• Laryngospasm
• Vocal cord paresis
• Neurologic causes (eg, brain stem compression, severe cortical injury, nuclear or lower motor neuron injury, movement disorders)
• Nonorganic causes (eg, factitious symptoms or malingering; conversion disorder)22
• Reactive airway disease.
Some disorders are easier to distinguish from VCD than others. For example, although laryngospasm may produce similar symptoms, episodes are brief, lasting seconds to minutes; VCD episodes may last hours to days.
Asthma
Even the most astute clinician will be unable to obtain adequate information from the patient history to differentiate VCD from asthma. There is a significant overlap of symptoms—shortness of breath, cough, wheezing—and frequently, the diseases coexist. History is often negative for chest pain, but it is common for patients with VCD, when asked to describe their symptoms, to report chest tightness. The clinician therefore needs to ask the patient to point to where the tightness is felt—in the chest or in the neck over the laryngeal area—to distinguish the source.
Asthma symptoms usually increase over a few hours, days, or weeks but respond to medications that open the airway and reduce inflammation (inhaled β-agonists and corticosteroids). VCD symptoms usually occur or decrease suddenly and do not respond well to traditional asthma treatments.
Other differences between asthma and VCD symptoms include voice changes and time of day when symptoms occur. The person with VCD will experience voice changes, such as hoarseness, as well as prolonged coughing episodes. Patients with asthma may awaken at night because of breathlessness, while most patients with VCD experience symptoms only during the day.
The diagnosis is generally confirmed if VCD is seen on direct laryngoscopic visualization during a symptomatic episode. In terms of adduction, the anterior cords will appear normal, but the posterior portion of the cords will display the classic “glottis chink” (see Figure 2).9
If the diagnosis is in question, videostroboscopy, a technique that provides a magnified slow-motion view of vocal cord vibration, can help identify or exclude pathologic conditions of the vocal cords.23
Convincing the patient of the validity of the diagnosis may be problematic if the patient has been previously diagnosed with and treated for another condition. The diagnosis should be explained and the patient counseled what appropriate care for VCD entails (see discussion under “Patient education and self-care”).
TREATMENT
Acute episode
During an acute VCD episode, offering the patient calm reassurance can be effective in resolving the episode. Simple breathing guidance may also be beneficial; instructing the patient to breathe rapidly and shallowly (ie, pant) can result in immediate resolution of symptoms.24 The patient can be advised to utilize other techniques, such as diaphragmatic breathing, breathing through the nose, breathing through a straw, pursed-lip breathing, and exhaling with a hissing sound.25
Long-term management
Although various strategies are employed in the management of VCD, well-designed studies on which to base treatment decisions have not been performed. Of course, control and management of possible underlying triggers or disorders should be implemented. Because etiology is rarely known, treatment for VCD is generally empiric.
Evidence does exist, however, to suggest that voice therapy, the treatment of choice for muscle tension dysphonia, is also effective for VCD. Speech therapy with specific voice and breathing exercises can enable the patient to manage the condition, thereby reducing ED visits, hospitalizations, and treatment costs.26
Patient education and self-care
Patient education is a critical component of VCD management. The clinician should explain the functions of the larynx to the patient, including the normal functioning of the vocal cords during respiration, speaking, swallowing, coughing, throat clearing, and breath holding. It may also enhance patients’ understanding of VCD to view their diagnostic laryngoscopy or videostroboscopy films.21
The patient should be advised to rest the voice, hydrate, utilize sialagogues (lozenges, gum) to stimulate salivation, reduce exposure to triggers when possible, and decrease stress. She should be encouraged to track VCD triggers by documenting what she is doing, where, and when, at the time of a VCD episode.
Two exercises—“paused breathing” and “belly breathing”—can be used by patients to learn how to relax the vocal cords (see “Patient Handout”). Patients should practice these exercises three times a day so that they can be easily recalled and performed during VCD episodes.
Continue for outcomes >>
OUTCOMES
Little is known about long-term outcomes for patients with VCD. The current literature consists of poorly described and conflicting case reports and results of small trials. Although documentation is lacking, the authors agree that, by educating the patient about the diagnosis, teaching effective VCD management strategies, and referring patients for voice therapy, clinicians can help patients achieve signicant improvement. Further investigation is needed to enhance our knowledge of the causes of VCD and to research additional diagnostic modalities and treatments.2
CASE PATIENT
After diagnosing VCD, the clinician explained the normal functioning of the vocal cords and how certain factors may cause them to close during inspiration. The patient then understood why bronchodilator therapy had failed to relieve her symptoms. She was counseled to continue her inhaled nasal steroid and proton pump inhibitor for her perennial nonallergic rhinitis and GERD, respectively, because these conditions may trigger her VCD, and to take steps to manage her stress. She learned breathing techniques to alleviate acute episodes of VCD and was informed of the option of voice therapy with a speech therapist if needed.
At six-week follow-up, the patient reported that she was complying with her medication regimen, had made an effort to relax more, and had experienced no acute attacks of VCD since her last visit.
CONCLUSION
Patients with symptoms suggestive of VCD require a thorough evaluation, including laryngoscopic examination, to ensure accurate diagnosis and avoid a too-common misdiagnosis. Primary care clinicians should know about VCD and, if not trained in the performance of flexible laryngoscopy, should refer the symptomatic patient to a specialist for appropriate work-up.
1. Hoyte FCL. Vocal cord dysfunction. Immunol Allergy Clin N Am. 2013;33:1-22.
2. Ibrahim WH, Gheriani HA, Almohamed AA, Raza T. Paradoxical vocal cord motion disorder: past, present and future. Postgrad Med J. 2007;83:164-172.
3. Powell DM, Karanfilov BI, Beechler KB, et al. Paradoxical vocal cord dysfunction in juveniles. Arch Otolaryngol Head Neck Surg. 2000;126(1):29-34.
4. Husein OF, Husein TN, Gardner R, et al. Formal psychological testing in patients with paradoxical vocal fold dysfunction. Laryngoscope. 2008; 118(4):740-747.
5. Dunglison RD. The Practice of Medicine. Philadelphia, PA: Lea and Blanchard; 1842:257-258.
6. MacKenzie M. Use of Laryngoscopy in Diseases of the Throat. Philadelphia, PA: Lindsey and Blackeston; 1869:246-250.
7. Osler W. Hysteria. In: The Principles and Practice of Medicine. 4th ed. New York, NY: Appleton; 1902:1111-1112.
8. Patterson R, Schatz M, Horton M. Munchausen’s stridor: non-organic laryngeal obstruction. Clin Allergy. 1974;4:307-310.
9. Christopher KL, Wood RP 2nd, Eckert RC, et al. Vocal cord dysfunction presenting as asthma. N Engl J Med. 1983;308(26):1566-1570.
10. Christopher KL. Understanding vocal cord dysfunction: a step in the right direction with a long road ahead. Chest. 2006;129(4):842-843.
11. Christopher KL, Morris MJ. Vocal cord dysfunction, paradoxic vocal fold motion, or laryngomalacia? Our understanding requires an interdisciplinary approach. Otolaryngol Clin N Am. 2010;43:43-66.
12. Sasaki CT, Weaver EM. Physiology of the larynx. Am J Med. 1997;103:9S-18S.
13. Balkissoon R. Occupational upper airway disease. Clin Chest Med. 2002;23:717-725.
14. Murakami Y, Kirschner JA. Mechanical and physiological properties of reflex laryngeal closure. Ann Otol Rhinol Laryngol. 1972;81(1):59-71.
15. Forrest LA, Husein T, Husein O. Paradoxical vocal cord motion disorder: classification and treatment. Laryngoscope. 2012;122:844-853.
16. Altman KW, Simpson CB, Amin MR, et al. Cough and paradoxical vocal fold motion. Otolaryngol Head Neck Surg. 2002;127(6):501-511.
17. Freedman MR, Rosenberg SJ, Schmaling KB. Childhood sexual abuse in patients with paradoxical vocal cord dysfunction. J Nerv Ment Dis. 1991;179(5):295-298.
18. Buddiga P. Vocal cord dysfunction. Medscape. http://emedicine.medscape.com/article/137782-overview. Accessed November 12, 2014.
19. Chiang T, Marcinow AM, deSilva BW, et al. Exercise-induced paradoxical vocal fold motion disorder: diagnosis and management. Laryngoscope. 2013;123:727-731.
20. Morris MJ, Deal LE, Bean DR, et al. Vocal cord dysfunction in patients with exertional dyspnea. Chest. 1999;116(6):1676-1682.
21. Hicks M, Brugman SM, Katial R. Vocal cord dysfunction/paradoxical vocal fold motion. Prim Care. 2008;35(1):81-103.
22. Maschka DA, Bauman NM, McCray PB, et al. A classification scheme for paradoxical vocal fold motion. Laryngoscope. 1997;107(11):1429-1435.
23. Uloza V, Vegiene A, Pribuisiene R, Saferis V. Quantitative evaluation of video laryngostroboscopy: reliability of the basic parameters. J Voice. 2013;27(3):361-368.
24. Pitchenik AF. Functional laryngeal obstruction relieved by panting. Chest. 1991;100(5):1465-1467.
25. Deckert J, Deckert L. Vocal cord dysfunction. Am Fam Physician. 2010;81(2):156-160.
26. Carding PN, Horsley IA, Docherty GJ. A study of the effectiveness of voice therapy in the treatment of 45 patients with nonorganic dysphonia. J Voice. 1999;13(1):72-104.

Guideline: Bi-level positive airway pressure (BPAP) devices
Recommendations
- Appropriate for patients with obstructive sleep apnea (OSA) who have failed continuous positive airway pressure (CPAP)/auto-titrating positive airway pressure (APAP) or require supplemental ventilatory support due to a hypoventilation syndrome
BPAP (with back-up rate feature)
- Appropriate for patients with established central sleep apnea (CSA) diagnosed by an in-lab sleep study demonstrating all of the following:
- OSA has been excluded or treated
- Oxygen saturation level is 88% or less for at least five (5) continuous minutes while the patient breathes his/her usual fraction of inspired oxygen (FiO2) OR the patient demonstrates Cheyne-Stokes respiration for five (5) continuous minutes with oxygen saturation falling to 88% or less at least once during that 5 minute interval
- A titration study (split-night or whole-night) has demonstrated significant improvement of sleep-related hypoventilation adjusted to the settings that will be prescribed for home use (while breathing the individual's usual FiO2)
BPAP (with or without back-up rate feature)
- Appropriate in the management of patients with severe chronic obstructive pulmonary disease (COPD) demonstrating either of the following:
- Partial pressure of arterial carbon dioxide (PaCO2) measured by arterial blood gas drawn while the patient is awake and breathing his/her usual FiO2 is 45 mmHg or greater; OR
- Sleep oximetry demonstrates oxygen saturation of 88% or less for at least five continuous minutes while the patient breathes oxygen at 2 L per minute or his/her usual FiO2 (whichever is higher)
BPAP (with or without back-up rate feature)
- Appropriate in the management of patients with certain restrictive thoracic disorders when both a and b below are true:
- The patient has an established diagnosis of a progressive neuromuscular disease (e.g., amyotrophic lateral sclerosis [ALS]) OR a severe thoracic cage abnormality; AND
- One of the following statements is true:
- PaCO2 measured by arterial blood gas drawn while the patient is awake and breathing his/her usual FiO2 is 45 mmHg or greater.
- Sleep oximetry demonstrates oxygen saturation of 88% or less for at least five continuous minutes while the patient breathes his/her usual FiO2
- Maximal inspiratory pressure is less than 60 cm H2O or forced vital capacity is less than 50% of predicted (applies to patients with progressive neuromuscular disease only)
Ongoing Treatment with BPAP
Ongoing treatment is indicated for patients who demonstrate compliance with therapy. Demonstration of compliance is required every 90 days for the first year of treatment and annually thereafter. Compliance is defined as:
- Use of the BPAP device for greater than or equal to four (4) hours per night on 70% of nights during a consecutive thirty (30) day period within the preceding 90 days; OR
- There is clinical evidence submitted by the treating provider that demonstrates continued clinical benefit from use of the positive airway pressure device.
PC providers have knowledge gaps in lung cancer screening
CHICAGO – Nearly one-fourth of primary care providers were unaware of current lung cancer screening guidelines in a survey of 212 PC providers in North Carolina, a state with one of the nation’s highest lung cancer death rates.
Only 12% of respondents ordered low-dose computed tomography (LDCT) in the past year to screen their patients at high risk for lung cancer, while 21% ordered a chest x-ray, a nonrecommended screening test, said Dr. Jennifer Lewis of Wake Forest University, Winston-Salem, N.C.

The use of LDCT screening for high-risk patients has been recommended by multiple health care organizations including the American College of Chest Physicians, American Lung Association, and U.S. Preventative Services Task Force. The 2013 USPSTF recommendations call for annual LDCT screening for adults aged 55-80 years who have a 30–pack-year smoking history and currently smoke or have quit within the past 15 years.
The survey found that 67% of providers knew screening was recommended for current and former smokers, but less than half knew the eligible age to initiate screening in any guideline is 50-55 years (35%), the eligible age to stop screening is 75-80 years (29%), and that a 1-year screening interval is recommended (25%).
Only 47% of respondents knew three or more of the guideline components and 24% knew no components.
Providers who knew three or more guideline components, however, were significantly more likely to use LDCT screening (P = .0002), Dr. Lewis said during a briefing at the 2014 Chicago Multidisciplinary Symposium in Thoracic Oncology.
The online survey was sent to 488 primary care providers, including physicians, physician assistants, and nurse practitioners, affiliated with Wake Forest Baptist Health. Of the 293 respondents (60%), 212 providers cared for patients older than age 40 years in the past year and were eligible for the study.
Less than half of respondents (42%) perceived of LDCT as “very” or even moderately effective in reducing cancer-specific mortality.

“In actuality, if you look at the number needed to screen to prevent one lung cancer death, low-dose CT is more effective than mammography or even flexible sigmoidoscopy,” she observed.
The major perceived barrier to LDCT screening was financial cost to patients. Other barriers were false positives, patient awareness of screening, incidental finding, and insurance coverage.
To put the study in perspective, 12,000 lives could be saved each year if low-dose CT screening were fully implemented, Dr. Lewis said. Before this can happen, providers need education. The good news is that 80% of respondents said they want more education.
“This education should focus on the effectiveness of low-dose CT screening in saving lives from cancer, the guideline recommendations (meaning who to screen, when to screen, and how often), as well as the correct lung cancer screening test,” she said. “This is all needed before providers can have those shared decision-making conversations with their patients.”
Although the survey was conducted at Wake Forest, the “results and conclusions can likely be extrapolated to much of the primary care population in the United States,” session moderator Dr. Laurie E. Gaspar, professor and chair of radiation oncology at the University of Colorado at Denver, Aurora, said.
CHICAGO – Nearly one-fourth of primary care providers were unaware of current lung cancer screening guidelines in a survey of 212 PC providers in North Carolina, a state with one of the nation’s highest lung cancer death rates.
Only 12% of respondents ordered low-dose computed tomography (LDCT) in the past year to screen their patients at high risk for lung cancer, while 21% ordered a chest x-ray, a nonrecommended screening test, said Dr. Jennifer Lewis of Wake Forest University, Winston-Salem, N.C.
The use of LDCT screening for high-risk patients has been recommended by multiple health care organizations including the American College of Chest Physicians, American Lung Association, and U.S. Preventative Services Task Force. The 2013 USPSTF recommendations call for annual LDCT screening for adults aged 55-80 years who have a 30–pack-year smoking history and currently smoke or have quit within the past 15 years.
The survey found that 67% of providers knew screening was recommended for current and former smokers, but less than half knew the eligible age to initiate screening in any guideline is 50-55 years (35%), the eligible age to stop screening is 75-80 years (29%), and that a 1-year screening interval is recommended (25%).
Only 47% of respondents knew three or more of the guideline components and 24% knew no components.
Providers who knew three or more guideline components, however, were significantly more likely to use LDCT screening (P = .0002), Dr. Lewis said during a briefing at the 2014 Chicago Multidisciplinary Symposium in Thoracic Oncology.
The online survey was sent to 488 primary care providers, including physicians, physician assistants, and nurse practitioners, affiliated with Wake Forest Baptist Health. Of the 293 respondents (60%), 212 providers cared for patients older than age 40 years in the past year and were eligible for the study.
Less than half of respondents (42%) perceived of LDCT as “very” or even moderately effective in reducing cancer-specific mortality.
“In actuality, if you look at the number needed to screen to prevent one lung cancer death, low-dose CT is more effective than mammography or even flexible sigmoidoscopy,” she observed.
The major perceived barrier to LDCT screening was financial cost to patients. Other barriers were false positives, patient awareness of screening, incidental finding, and insurance coverage.
To put the study in perspective, 12,000 lives could be saved each year if low-dose CT screening were fully implemented, Dr. Lewis said. Before this can happen, providers need education. The good news is that 80% of respondents said they want more education.
“This education should focus on the effectiveness of low-dose CT screening in saving lives from cancer, the guideline recommendations (meaning who to screen, when to screen, and how often), as well as the correct lung cancer screening test,” she said. “This is all needed before providers can have those shared decision-making conversations with their patients.”
Although the survey was conducted at Wake Forest, the “results and conclusions can likely be extrapolated to much of the primary care population in the United States,” session moderator Dr. Laurie E. Gaspar, professor and chair of radiation oncology at the University of Colorado at Denver, Aurora, said.
FROM A THORACIC ONCOLOGY SYMPOSIUM
Key clinical point: Patients at high risk for lung cancer are more likely to receive screening when their primary care provider is familiar with lung cancer screening guidelines.
Major finding: 47% of respondents knew three or more guideline components and 24% knew none.
Data source: Online survey of 212 primary care providers.
Disclosures: Dr. Lewis and her coauthors reported having no financial disclosures.

Acid suppression results in more severe CAP, poorer outcomes
AUSTIN, TEX. – Use of acid-suppressing drugs was associated with more severe presentation, longer hospital stay, and increased mortality among patients with community-acquired pneumonia presenting to an inner city community hospital, according to a retrospective analysis.
Of 866 patients admitted with community-acquired pneumonia (CAP) between 2010 and 2013, 468 (54%) were on acid suppression, and those patients were significantly more likely than those not on acid suppression to present with positive blood cultures (12% vs. 5.5%) and thrombocytopenia (22% vs. 17%). The difference between the groups in length of stay (10.51 days vs. 8.96 days, respectively), and mortality (15.1% vs. 11.5%, respectively) trended toward significance, Dr. Bikash Bhattarai reported at the annual meeting of the American College of Chest Physicians.
Study subjects included 419 men and 447 women, most of whom (86%) were African American. About half (53%) were smokers. The study excluded patients with suspected aspiration pneumonia and those who were immunosuppressed.
The groups were similar with respect to demographic characteristics, but patients with comorbidities, including chronic obstructive pulmonary disease, diabetes, previous stroke, or neoplastic diseases, were more likely to be on acid suppression, said Dr. Bhattarai of the Interfaith Medical Center in Brooklyn, N.Y.
Gastrointestinal symptoms are very common in the general population – as is the use of either prescribed or over-the-counter medication for acid suppression to treat them, he said, adding that it has been shown that reduction of gastric acid secretion permits colonization of the upper gastrointestinal tract with oral bacteria and is therefore considered a risk factor for CAP.
The findings of this analysis are limited by the retrospective, observational nature of the study, and additional subgroup analyses – including an analysis based on whether patients in the acid suppression group were being treated with proton pump inhibitors or histamine2 blockers could be useful, he said, acknowledging that some data suggest that proton pump inhibitor use is associated with greater risk.
“Acid-suppressing drugs should be used with caution, and we strongly encourage using those medications only when indicated,” he said.
Dr. Bhattarai reported having no disclosures.
Key clinical point: Acid suppression worsens CAP outcomes and should be used only when indicated.
Major finding: Patients on acid suppression were more likely to have positive blood cultures (12% vs. 5.5%) and thrombocytopenia (22% vs. 17%).
Data source: A retrospective cohort study of 866 patients.
Disclosures: Dr. Bhattarai reported having no disclosures.
Otitis media prescribing patterns differ by race
Black children were less likely to be diagnosed with otitis media and more likely to be prescribed narrow-spectrum, rather than broad-spectrum, antibiotics compared with nonblack children, according to a recent study.
“These findings raise concerns that differences in care for otitis media based on race may reflect inappropriate treatment of otitis media with the use of broad-spectrum antibiotics in a majority of U.S. children,” wrote Dr. Katherine E. Fleming-Dutra of Emory University, Atlanta (Pediatrics 2014 [doi:10.1542/peds.2014-1781]).
After a study in the Philadelphia area showed lower otitis media diagnosis rates and less use of

broad-spectrum antibiotics for blacks compared with nonblacks, these researchers investigated race, diagnosis, and prescribing patterns nationwide.
They analyzed visits for children 14 years old and younger between 2008 and 2010 using data from the National Ambulatory Medical Care Survey and the National Hospital Ambulatory Medical Care Survey, both data sets from the National Center for Health Statistics at the Centers for Disease Control and Prevention.
Based on 4,178 visits in the database, the researchers estimated that 19.2 million visits for otitis media occurred from 2008 to 2010 in the United States. However, only 7% of black children’s visits included an otitis media diagnosis, compared with 10% of nonblack children’s visits (P = .004).
While black and nonblack children with otitis media were prescribed antibiotics at similar rates (81% vs. 76%, respectively, P = .30), black children were prescribed broad-spectrum antibiotics 42% of the time, compared with 52% for nonblack children (P = .01). Broad-spectrum cephalosporins were prescribed for otitis media for 12% of black children and 21% of nonblack children; broad-spectrum penicillins were prescribed for 10% of black children and 16% of nonblack children with otitis media.
After adjustment for age, gender, region, insurance, care setting, metropolitan area, and year, black children had 41% lower odds than did nonblack children of receiving a broad-spectrum antibiotic prescription for otitis media.
The study was funded by the CDC. Dr. Gerber and Dr. Hersh received a Pfizer research grant to implement antibiotic stewardship in children’s hospitals. The remaining authors had no relevant financial disclosures.
“At face value, these data could indicate a ‘reversal’ in direction of the health care disparity usually identified in the United States. Fleming-Dutra et al. found no differences in care-seeking by black children versus nonblack children for upper respiratory tract conditions, suggesting that the difference in prescribing for acute otitis media was not due to differences in care-seeking behaviors among the families of black and nonblack children.
“We as physicians may enter the patient-provider relationship with our own set of biases, stereotypes, and expectations. We may subconsciously use the strategy of socialization to put people into categories (i.e., race) to use cognitive shortcuts that have been previously created in decision-making.
“We develop our own perceptions of what our patients and their families may want or need and form images related to their understanding of medical information and whether a particular family can participate in a shared-decision model. These shortcuts in imagery may act as facilitators or could have the opposite effect for minority populations, resulting in disparities of care.
“What is the true basis for the observed ‘reverse’ guideline-adherent disparity reported by Fleming-Dutra et al.? We hope it is due at least in part to conscious application of guideline recommendations among the practitioners caring for black children. We suspect it is partially due to perceptions of parent expectations or other influences on overprescribing of broad-spectrum antimicrobial agents for nonblack children.
“Regardless, these data provide an opportunity for all of us to reflect upon the beliefs and practices regarding race/ethnicity that may consciously or unconsciously influence clinical decision-making within ourselves and the institutional cultures in which we practice.”
Charles R. Woods, M.D., and V. Faye Jones, M.D., are in the department of pediatrics at the University of Louisville (Ky.). These comments are taken from an accompanying editorial (Pediatrics 2014 [doi:10.1542/peds.2014-3056]). The authors reported no disclosures or external funding.
Black children were less likely to be diagnosed with otitis media and more likely to be prescribed narrow-spectrum, rather than broad-spectrum, antibiotics compared with nonblack children, according to a recent study.
“These findings raise concerns that differences in care for otitis media based on race may reflect inappropriate treatment of otitis media with the use of broad-spectrum antibiotics in a majority of U.S. children,” wrote Dr. Katherine E. Fleming-Dutra of Emory University, Atlanta (Pediatrics 2014 [doi:10.1542/peds.2014-1781]).
After a study in the Philadelphia area showed lower otitis media diagnosis rates and less use of
broad-spectrum antibiotics for blacks compared with nonblacks, these researchers investigated race, diagnosis, and prescribing patterns nationwide.
They analyzed visits for children 14 years old and younger between 2008 and 2010 using data from the National Ambulatory Medical Care Survey and the National Hospital Ambulatory Medical Care Survey, both data sets from the National Center for Health Statistics at the Centers for Disease Control and Prevention.
Based on 4,178 visits in the database, the researchers estimated that 19.2 million visits for otitis media occurred from 2008 to 2010 in the United States. However, only 7% of black children’s visits included an otitis media diagnosis, compared with 10% of nonblack children’s visits (P = .004).
While black and nonblack children with otitis media were prescribed antibiotics at similar rates (81% vs. 76%, respectively, P = .30), black children were prescribed broad-spectrum antibiotics 42% of the time, compared with 52% for nonblack children (P = .01). Broad-spectrum cephalosporins were prescribed for otitis media for 12% of black children and 21% of nonblack children; broad-spectrum penicillins were prescribed for 10% of black children and 16% of nonblack children with otitis media.
After adjustment for age, gender, region, insurance, care setting, metropolitan area, and year, black children had 41% lower odds than did nonblack children of receiving a broad-spectrum antibiotic prescription for otitis media.
The study was funded by the CDC. Dr. Gerber and Dr. Hersh received a Pfizer research grant to implement antibiotic stewardship in children’s hospitals. The remaining authors had no relevant financial disclosures.
FROM PEDIATRICS
Key clinical point: Black children are less likely than nonblack children to receive otitis media diagnosis and broad-spectrum antibiotics.
Major finding: Black children are 30% less likely to be diagnosed with otitis media (P = .004) and 41% less likely to be prescribed broad-spectrum antibiotics.
Data source: Analysis of 4,178 visits for children aged 14 years and younger between 2008 and 2010 in two Centers for Disease Control and Prevention database sets.
Disclosures: The study was funded by the CDC. Dr. Gerber and Dr. Hersh received a Pfizer research grant to implement antibiotic stewardship in children’s hospitals. The remaining authors had no relevant financial disclosures.
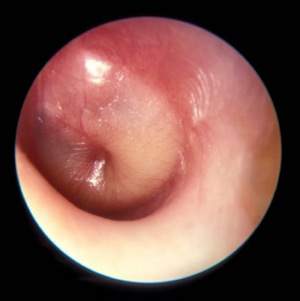
Time to Change How We Test for TB?
Public health officials in El Paso, Texas, reported in September 2014 that more than 850 infants and 43 health care workers (HCW) at Providence Memorial Hospital may have been exposed to tuberculosis (TB) by a nurse with active infection. In collaboration with the CDC, the hospital administrators and local and state health officials advised potentially exposed individuals and their families to be screened for TB. According to press reports, five infants tested positive for TB and were to be treated.1,2 This news report highlights the importance of maintaining infection control protocols in health care facilities throughout the United States to reduce the risk for TB transmission.
SCREENING HEALTH CARE WORKERS
In the US, reported cases of TB, a treatable and curable disease, have declined since 1993. A total of 9,582 cases were reported in 2013, with 536 deaths due to TB reported in 2011 (the most recent year for which this data is available).3
Even though TB is on the decline worldwide,4 HCWs remain at increased risk for infection, confirming that TB is an occupational disease.5 It is imperative that health care facilities have effective infection control plans in place, primarily to reduce the risk for transmission of TB to HCWs.
This article reviews the available TB screening tests, CDC recommendations, parameters for evaluating test performance, and recent studies that lend support to the superiority of interferon-γ (IFN-γ) release assays (IGRAs) over tuberculin skin tests (TSTs) as part of HCW screening and infection control for TB. Primary care clinicians need to know about the status of these tests not only because we are HCWs ourselves, but because we are often responsible for the safety of other HCWs in our workplaces.
TB SCREENING TESTS
Diagnosing latent tuberculosis infection (LTBI) is key to overall control of the disease, since treatment decreases risk for conversion to active disease. Until recently, the diagnosis of LTBI relied on the TST, despite its limitations (see discussion under “Accuracy”). Now, immune-based blood tests hold promise for improving LTBI diagnosis.
Tuberculin skin test
In 1934, Florence Seibert developed what is known today as the purified protein derivative (PPD) test, which was adopted as the standard in the US in 1941.6 For 60 years, the PPD TST was the only screening method for Mycobacterium tuberculosis infection. It involves the intradermal injection of PPD; a hypersensitivity response leads to a cutaneous induration at the injection site after 48 to 72 hours.7Hence, the TST is a two-step test, requiring a follow-up visit for the result to be read.
Although strongly predictive of TB, the TST may result in false-positive test results in those previously immunized with the Bacille Calmette-Guerin (BCG) vaccine (a WHO-recommended childhood vaccination against TB, widely used outside the US),8 and in those exposed to certain nontuberculous mycobacteria such as M bovis and M africana.9 Test results may also be false negative in immunocompromised patients.9
Interferon-γ release assays
With the goal of developing a more specific and sensitive test for TB infection, IGRAs were developed in the mid-1990s as a new tool to detect active and latent TB infection.10 The first IGRA test for TB received FDA approval in 2001.11 There are currently two FDA-approved IGRAs—QuantiFERON-TB Gold In-Tube (QFT-GIT) and T-SPOT.TB—in use.
QuantiFERON-TB Gold In-Tube test. The QFT-GIT measures cell-mediated immune responses to antigens that simulate mycobacterial proteins. Requiring only one patient visit, whole blood is collected in three different tubes (negative control, TB antigen, and mitogen [positive] control), each containing a single antigen.12 After 16 to 24 hours in a temperature-controlled environment, the tubes are centrifuged to separate the plasma. IFN-γ levels are measured in each tube to calculate the test result.
T-SPOT.TB test. Using one blood sample, the T-SPOT.TB test captures IFN-γ produced by activated T-cells in response to stimulation by two M tuberculosis antigens. Addition of a substrate produces dark blue spots; the number of spots indicates the quantity of M tuberculosis-sensitive effector T-cells in the peripheral blood. A positive result is eight or more spots; a negative result is fewer than four spots, and a borderline result is five to seven spots.13 Unlike the QFT-GIT, the T-SPOT.TB has a “borderline” interpretation category.
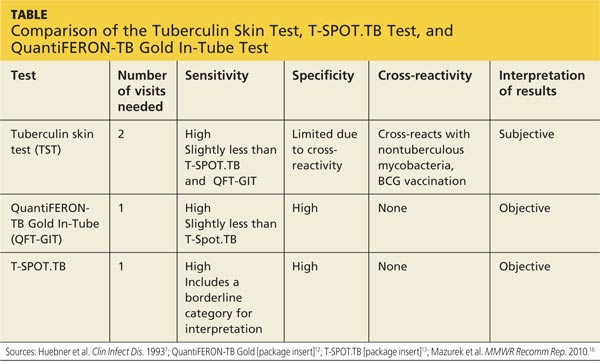
See the Table for a comparison of the TST, QFT-GIT, and T-SPOT.TB tests for TB screening.
Continue for CDC guidelines >>
CDC GUIDELINES
Subject to state and federal regulations and Occupational Safety and Health Administration (OSHA) directives, the CDC states that the goals of a TB infection control plan are
• Prompt detection of suspected or confirmed TB infection
• Airborne precautions implemented to reduce risk for TB transmission in areas in which exposure can occur
• Treatment of persons with suspected or confirmed TB.14
TB screening for HCWs has historically been a challenge in that, for new hires, the CDC recommends a baseline two-step process (meaning up to four visits) when TST is used.15 This is because TST-tested individuals may test false negative, even if they have LTBI, if many years have passed since their infection was acquired. As a result, guidelines for baseline testing are that, if the initial TST is negative, TST should be repeated one to three weeks later. If the person is in fact infected with TB, the first TST may stimulate the immune system’s ability to react to the TB antigens and elicit a positive or “boosted” response to the second test.
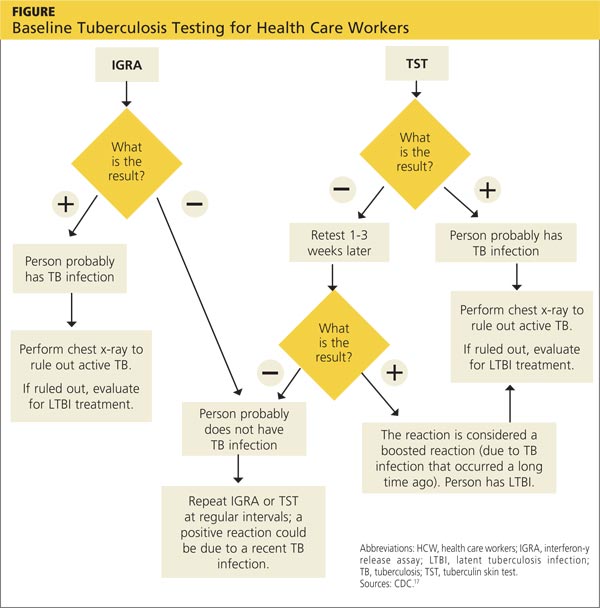
The above figure has been corrected from the print version as of December 16, 2014.
The 2005 guidelines recommended screening new-hire HCWs with either a baseline two-step TST or with one blood assay for M tuberculosis. After the introduction of the QFT-GIT and T-SPOT.TB tests, the CDC included them in its updated 2010 guidelines and indicated that either IGRAs or TSTs may be used in HCW surveillance programs for occupational exposure to M tuberculosis (see Figure).15,16 The algorithm clearly illustrates how the use of IGRAs in place of TSTs streamlines the process of HCW TB screening.17
EVALUATION OF TESTS
Given the stringent nature of the CDC’s TB infection control goals, it is essential that health care facilities use the most effective and efficient means for timely and thorough screening of HCWs for TB. When evaluating the available tests, the following factors must be considered: accuracy and reproducibility of test results; impact on results when testing is repeated frequently; interpretation of discordant test results; and specificity, sensitivity, and identification of appropriate test cutoff values so that a positive result signifies a new TB infection (ie, conversion, a change from a documented negative to positive test result within a two-year period) rather than a false positive; and costs.18,19
Accuracy
Unlike TSTs, IGRAs do not produce false-positive results in individuals vaccinated with BCG or in those infected with most nontuberculous mycobacteria.9,16 Neither TSTs nor IGRAs, however, can distinguish between active and latent TB infection.19 If either test is positive, a chest radiograph is indicated. If the x-ray reveals abnormalities in the lungs, a sputum smear to detect acid-fast-bacilli (AFB), of which M tuberculosis is one, is indicative of TB. Nuclear acid amplification testing of a respiratory specimen provides rapid laboratory confirmation, but a positive culture for M tuberculosis confirms the diagnosis.22
Specificity and sensitivity
Pai, Zwerling, and Menzies conducted a meta-analysis of 38 studies of TB testing. Most of the studies were small and had limitations, such as the lack of a gold standard test for the diagnosis of LTBI and variable TST methods and cutoff values. Nevertheless, the researchers were able to conclude that IGRAs are significantly more specific than TST and are unaffected by BCG vaccination. Although the sensitivity of IGRAs and TST is inconsistent across test populations, T-SPOT.TB appears to have greater sensitivity than QFT-GIT or TST.23
Further, TST is subject to variability in administration and interpretation, and cut points for TST positivity vary internationally.9 In contrast, the T-SPOT.TB test specifies a borderline result zone. According to the CDC, this increases test accuracy by classifying results near the cut point, making a subsequent test conversion from negative to positive more likely to represent newly acquired infection.16
On the other hand, some studies of IGRAs have found unexpectedly high rates of initial positive results and conversions among HCWs in low-risk settings that are later determined to be false positives.24 However, as noted previously, TSTs are also subject to false-positive results. In addition, the definition of an IGRA conversion is less stringent than the TST conversion definition, which may result in more IGRA conversions.16
Discordant results
Zwerling et al conducted a systematic review of all studies in which IGRAs were used for HCW screening to summarize their performance in cross-sectional and serial testing settings. The prevalence of positive IGRAs was found to be lower than that of positive TSTs. This difference was significant in low- and moderate-TB incidence settings but not in high-incidence settings. A positive association was reported between positive IGRA test results and occupational risk factors, including work in high-risk wards, TB clinics, and geriatric care, as well as length of employment.18
According to Mancuso et al, discordance of results between the TST and IGRAs in populations with low LTBI prevalence suggests that most positive test results are in fact false positives in these populations.25 Although IGRAs were designed to increase specificity, the authors found that IGRA specificity was no better than the specificity of TST. Without a gold standard for detecting M tuberculosis infection, assessing the true significance of discordance between TST and IGRAs is difficult. Further research is needed to determine the significance of test discordance, to obtain data on progression to active TB, and to better define appropriate cut points for interpreting IGRA results.25
Costs
The primary impediment to the widespread use of IGRAs has been cost, which is approximately three times that of a TST.24
Eralp et al studied the cost-effectiveness of IGRAs versus TST for screening for active LTBI in HCWs by using healthy life-years gained—defined as the number of TB cases avoided, yielding an increase in life expectancy—as the benefit metric rather than quality-adjusted life-years. Because testing is completed with a single visit, use of IGRAs increases compliance while minimizing resources needed for a second visit and eliminating loss to follow-up. Also notable is that IGRA testing takes place in a laboratory, where costs can be held in check with focused expertise and optimized staffing structures. The authors concluded that incremental IGRA costs per healthy life-year gained were justified.19
Until publication of the SWITCH (Screening health care Workers with IGRA vs. TST: impact on Costs and adHerence to testing) study in 2012, cost-effectiveness studies had shown inconsistent results. This study, conducted by The Johns Hopkins University (JHU) employee health department, was the first of its kind in the US to systematically analyze test performance and labor costs for TB screening of HCWs. The results showed that the time required to administer a TST is one of the costliest elements. For a sizeable institution such as JHU, TST screening cost more than $1.3 million annually, equivalent to approximately $73 per person; in contrast, IGRA screening amounted to less than $55 per person.26
Further research
The association between IGRA test conversion in HCWs and the risk for active TB disease has not been demonstrated.16 However, this is also true of TSTs27 and further research is needed in this area. Research is also needed to determine the significance of TSA-IGRA results discordance and to better define cut points for IGRA interpretation.25 In addition, more study of factors related to serial (periodic or ongoing) TB testing—which are very important within the context of HCW screening—is needed. As an example, serial TB testing may reveal trends in test conversions and can identify areas of concern within a health care facility. Unfortunately, current CDC recommendations do not provide specific guidelines for serial IGRA testing, such as guidance for accurate interpretation of IGRA results within a serial testing context.16 These areas should be addressed in future CDC updates.
Continue for conclusion >>
CONCLUSION
Occupational health professionals are continuously evaluating how to improve surveillance programs and reduce HCWs’ time away from work. Within this context, four advantages IGRAs offer include
• Elimination of a two-step TST for new hires (which requires up to four separate visits)
• No false-positive results caused by previous BCG vaccination or exposure to most nontuberculous mycobacteria
• Significantly improved HCW compliance because screening requires only one visit
• Cost effectiveness.
From an occupational health perspective, these are significant advantages that support the use of IGRAs to screen HCW for TB.
REFERENCES
1. Wilson J. Five babies test positive for TB in Texas. CNN. September 30, 2014. www.cnn.com/2014/09/29/health/babies-test-positive-tb/index.html. Accessed November 12, 2014.
2. Bailey J. 700 babies exposed to TB at Texas Hospital. Atlanta Journal Constitution. September 22, 2014. www.ajc.com/news/lifestyles/health/700-babies-exposed-TB-texas-hospital/nhRmC/. Accessed November 12, 2014.
3. CDC. Reported tuberculosis in the United States, 2013. www.cdc.gov/tb/statistics/reports/2013/pdf/report2013.pdf. Accessed October 23, 2014.
4. World Health Organization. Global tuberculosis report 2014. www.who.int/tb/publications/global_report/en/. Accessed November 12, 2014.
5. Baussano I, Nunn P, Williams B, et al. Tuberculosis among health care workers. Emerg Infect Dis. 2011;17(3):488-494.
6. Yang H, Kruh-Garcia NA, Dobos KM. Purified protein derivatives of tuberculin: past, present, and future. FEMS Immunol Med Microbiol. 2012;66(3):273-280.
7. Huebner RE, Schein MF, Bass JB Jr. The tuberculin skin test. Clin Infect Dis. 1993;17(6):968-975.
8. World Health Organization. Recommendations for vaccine administration. www.who.int/immunization/policy/Immunization_routine_table1.pdf. Accessed November 12, 2014.
9. Al-Orainey IO. Diagnosis of latent tuberculosis: can we do better? Ann Thorac Med. 2009;4(1):5-9.
10. Desem N, Jones SL. Development of a human gamma interferon enzyme immunoassay and comparison with tuberculin skin testing for detection of Mycobacterium tuberculosis infection. Clin Diagn Lab Immunol. 1998;5(4): 531-536.
11. FDA. QuantiFERON-TB - P010033. www.fda.gov/MedicalDevices/Products andMedicalProcedures/DeviceApprovalsandClearances/Recently-Approved Devices/ucm084025.htm. Accessed November 12, 2014.
12. QuantiFERON-TB Gold In-Tube Test [package insert]. www.quantiferon.com/irm/content/PI/QFT/2PK/US.pdf. Accessed November 12, 2014.
13. T-SPOT.TB [package insert]. Marlborough, MA. Oxford Immunotec, Inc. www.tspot.com/wp-content/uploads/2012/01/PI-TB-US-v4.pdf. Accessed November 12, 2014.
14. CDC. Fact sheet: infection control in health-care settings. www.cdc.gov/tb/publications/factsheets/prevention/ichcs.htm. Accessed November 12, 2014.
15. Jensen PA, Lambert LA, Iademarco MF, Ridzon R; CDC. Guidelines for preventing the transmission of Mycobacterium TB in health-care settings, 2005. MMWR Recomm Rep. 2005;54(RR-17):1-141.
16. Mazurek GH, Jereb J, Vernon A, et al; IGRA Expert Committee, CDC. Updated guidelines for using interferon γ release assays to detect Mycobacterium TB infection: United States, 2010. MMWR Recomm Rep. 2010;59(RR-5):1-25.
17. CDC. Latent tuberculosis infection: a guide for primary health care providers. www.cdc.gov/tb/publications/ltbi/diagnosis.htm. Accessed November 3, 2014.
18. Zwerling A, van den Hof S, Scholten J, et al. Interferon-γ release assays for TB screening of healthcare workers: a systematic review. Thorax. 2012;67(1): 62-70.
19. Eralp MN, Scholtes S, Martell G, et al. Screening of healthcare workers for TB: development and validation of a new health economic model to inform practice. BMJ Open. 2012;2:e000630.
20. FDA. FDA permits marketing of first US test labeled for simultaneous detection of tuberculosis bacteria and resistance to the antibiotic rifampin [press release]. July 25, 2013.
21. CDC. Availability of an assay for detecting Mycobacterium TB, including rifampin-resistant strains, and considerations for its use: United States, 2013 [published correction appears in MMWR Morb Mortal Wkly Rep. 2013;62(45):906]. MMWR Morb Mortal Wkly Rep. 2013;62(41):821-827.
22. CDC. Fact sheet: diagnosis of tuberculosis disease. www.cdc.gov/tb/publica tions/factsheets/testing/diagnosis.htm. Accessed November 12, 2014.
23. Pai M, Zwerling A, Menzies D. Systematic review: T-cell–based assays for the diagnosis of latent TB infection: an update. Ann Intern Med. 2008;149(3): 177-184.
24. LoBue PA, Castro KG. Is it time to replace the tuberculin skin test with a blood test? JAMA. 2012;308(3):241-242.
25. Mancuso JD, Mazurek GH, Tribble D, et al. Discordance among commercially available diagnostics for latent TB infection. Am J Respir Crit Care Med. 2012;185(4):427-434.
26. Wrighton-Smith P, Sneed L, Humphrey F, et al. Screening health care workers with interferon-γ release assay versus tuberculin skin test: impact on costs and adherence to testing (the SWITCH study). J Occup Environ Med. 2012;54(7):806-815.
27. World Health Organization. Use of tuberculosis interferon-gamma release assays (IGRAs) in low- and middle-income countries. www.who.int/tb/
features_archive/policy_statement_igra_oct2011.pdf. Accessed November 12, 2014.
Public health officials in El Paso, Texas, reported in September 2014 that more than 850 infants and 43 health care workers (HCW) at Providence Memorial Hospital may have been exposed to tuberculosis (TB) by a nurse with active infection. In collaboration with the CDC, the hospital administrators and local and state health officials advised potentially exposed individuals and their families to be screened for TB. According to press reports, five infants tested positive for TB and were to be treated.1,2 This news report highlights the importance of maintaining infection control protocols in health care facilities throughout the United States to reduce the risk for TB transmission.
SCREENING HEALTH CARE WORKERS
In the US, reported cases of TB, a treatable and curable disease, have declined since 1993. A total of 9,582 cases were reported in 2013, with 536 deaths due to TB reported in 2011 (the most recent year for which this data is available).3
Even though TB is on the decline worldwide,4 HCWs remain at increased risk for infection, confirming that TB is an occupational disease.5 It is imperative that health care facilities have effective infection control plans in place, primarily to reduce the risk for transmission of TB to HCWs.
This article reviews the available TB screening tests, CDC recommendations, parameters for evaluating test performance, and recent studies that lend support to the superiority of interferon-γ (IFN-γ) release assays (IGRAs) over tuberculin skin tests (TSTs) as part of HCW screening and infection control for TB. Primary care clinicians need to know about the status of these tests not only because we are HCWs ourselves, but because we are often responsible for the safety of other HCWs in our workplaces.
TB SCREENING TESTS
Diagnosing latent tuberculosis infection (LTBI) is key to overall control of the disease, since treatment decreases risk for conversion to active disease. Until recently, the diagnosis of LTBI relied on the TST, despite its limitations (see discussion under “Accuracy”). Now, immune-based blood tests hold promise for improving LTBI diagnosis.
Tuberculin skin test
In 1934, Florence Seibert developed what is known today as the purified protein derivative (PPD) test, which was adopted as the standard in the US in 1941.6 For 60 years, the PPD TST was the only screening method for Mycobacterium tuberculosis infection. It involves the intradermal injection of PPD; a hypersensitivity response leads to a cutaneous induration at the injection site after 48 to 72 hours.7Hence, the TST is a two-step test, requiring a follow-up visit for the result to be read.
Although strongly predictive of TB, the TST may result in false-positive test results in those previously immunized with the Bacille Calmette-Guerin (BCG) vaccine (a WHO-recommended childhood vaccination against TB, widely used outside the US),8 and in those exposed to certain nontuberculous mycobacteria such as M bovis and M africana.9 Test results may also be false negative in immunocompromised patients.9
Interferon-γ release assays
With the goal of developing a more specific and sensitive test for TB infection, IGRAs were developed in the mid-1990s as a new tool to detect active and latent TB infection.10 The first IGRA test for TB received FDA approval in 2001.11 There are currently two FDA-approved IGRAs—QuantiFERON-TB Gold In-Tube (QFT-GIT) and T-SPOT.TB—in use.
QuantiFERON-TB Gold In-Tube test. The QFT-GIT measures cell-mediated immune responses to antigens that simulate mycobacterial proteins. Requiring only one patient visit, whole blood is collected in three different tubes (negative control, TB antigen, and mitogen [positive] control), each containing a single antigen.12 After 16 to 24 hours in a temperature-controlled environment, the tubes are centrifuged to separate the plasma. IFN-γ levels are measured in each tube to calculate the test result.
T-SPOT.TB test. Using one blood sample, the T-SPOT.TB test captures IFN-γ produced by activated T-cells in response to stimulation by two M tuberculosis antigens. Addition of a substrate produces dark blue spots; the number of spots indicates the quantity of M tuberculosis-sensitive effector T-cells in the peripheral blood. A positive result is eight or more spots; a negative result is fewer than four spots, and a borderline result is five to seven spots.13 Unlike the QFT-GIT, the T-SPOT.TB has a “borderline” interpretation category.
See the Table for a comparison of the TST, QFT-GIT, and T-SPOT.TB tests for TB screening.
Continue for CDC guidelines >>
CDC GUIDELINES
Subject to state and federal regulations and Occupational Safety and Health Administration (OSHA) directives, the CDC states that the goals of a TB infection control plan are
• Prompt detection of suspected or confirmed TB infection
• Airborne precautions implemented to reduce risk for TB transmission in areas in which exposure can occur
• Treatment of persons with suspected or confirmed TB.14
TB screening for HCWs has historically been a challenge in that, for new hires, the CDC recommends a baseline two-step process (meaning up to four visits) when TST is used.15 This is because TST-tested individuals may test false negative, even if they have LTBI, if many years have passed since their infection was acquired. As a result, guidelines for baseline testing are that, if the initial TST is negative, TST should be repeated one to three weeks later. If the person is in fact infected with TB, the first TST may stimulate the immune system’s ability to react to the TB antigens and elicit a positive or “boosted” response to the second test.
The above figure has been corrected from the print version as of December 16, 2014.
The 2005 guidelines recommended screening new-hire HCWs with either a baseline two-step TST or with one blood assay for M tuberculosis. After the introduction of the QFT-GIT and T-SPOT.TB tests, the CDC included them in its updated 2010 guidelines and indicated that either IGRAs or TSTs may be used in HCW surveillance programs for occupational exposure to M tuberculosis (see Figure).15,16 The algorithm clearly illustrates how the use of IGRAs in place of TSTs streamlines the process of HCW TB screening.17
EVALUATION OF TESTS
Given the stringent nature of the CDC’s TB infection control goals, it is essential that health care facilities use the most effective and efficient means for timely and thorough screening of HCWs for TB. When evaluating the available tests, the following factors must be considered: accuracy and reproducibility of test results; impact on results when testing is repeated frequently; interpretation of discordant test results; and specificity, sensitivity, and identification of appropriate test cutoff values so that a positive result signifies a new TB infection (ie, conversion, a change from a documented negative to positive test result within a two-year period) rather than a false positive; and costs.18,19
Accuracy
Unlike TSTs, IGRAs do not produce false-positive results in individuals vaccinated with BCG or in those infected with most nontuberculous mycobacteria.9,16 Neither TSTs nor IGRAs, however, can distinguish between active and latent TB infection.19 If either test is positive, a chest radiograph is indicated. If the x-ray reveals abnormalities in the lungs, a sputum smear to detect acid-fast-bacilli (AFB), of which M tuberculosis is one, is indicative of TB. Nuclear acid amplification testing of a respiratory specimen provides rapid laboratory confirmation, but a positive culture for M tuberculosis confirms the diagnosis.22
Specificity and sensitivity
Pai, Zwerling, and Menzies conducted a meta-analysis of 38 studies of TB testing. Most of the studies were small and had limitations, such as the lack of a gold standard test for the diagnosis of LTBI and variable TST methods and cutoff values. Nevertheless, the researchers were able to conclude that IGRAs are significantly more specific than TST and are unaffected by BCG vaccination. Although the sensitivity of IGRAs and TST is inconsistent across test populations, T-SPOT.TB appears to have greater sensitivity than QFT-GIT or TST.23
Further, TST is subject to variability in administration and interpretation, and cut points for TST positivity vary internationally.9 In contrast, the T-SPOT.TB test specifies a borderline result zone. According to the CDC, this increases test accuracy by classifying results near the cut point, making a subsequent test conversion from negative to positive more likely to represent newly acquired infection.16
On the other hand, some studies of IGRAs have found unexpectedly high rates of initial positive results and conversions among HCWs in low-risk settings that are later determined to be false positives.24 However, as noted previously, TSTs are also subject to false-positive results. In addition, the definition of an IGRA conversion is less stringent than the TST conversion definition, which may result in more IGRA conversions.16
Discordant results
Zwerling et al conducted a systematic review of all studies in which IGRAs were used for HCW screening to summarize their performance in cross-sectional and serial testing settings. The prevalence of positive IGRAs was found to be lower than that of positive TSTs. This difference was significant in low- and moderate-TB incidence settings but not in high-incidence settings. A positive association was reported between positive IGRA test results and occupational risk factors, including work in high-risk wards, TB clinics, and geriatric care, as well as length of employment.18
According to Mancuso et al, discordance of results between the TST and IGRAs in populations with low LTBI prevalence suggests that most positive test results are in fact false positives in these populations.25 Although IGRAs were designed to increase specificity, the authors found that IGRA specificity was no better than the specificity of TST. Without a gold standard for detecting M tuberculosis infection, assessing the true significance of discordance between TST and IGRAs is difficult. Further research is needed to determine the significance of test discordance, to obtain data on progression to active TB, and to better define appropriate cut points for interpreting IGRA results.25
Costs
The primary impediment to the widespread use of IGRAs has been cost, which is approximately three times that of a TST.24
Eralp et al studied the cost-effectiveness of IGRAs versus TST for screening for active LTBI in HCWs by using healthy life-years gained—defined as the number of TB cases avoided, yielding an increase in life expectancy—as the benefit metric rather than quality-adjusted life-years. Because testing is completed with a single visit, use of IGRAs increases compliance while minimizing resources needed for a second visit and eliminating loss to follow-up. Also notable is that IGRA testing takes place in a laboratory, where costs can be held in check with focused expertise and optimized staffing structures. The authors concluded that incremental IGRA costs per healthy life-year gained were justified.19
Until publication of the SWITCH (Screening health care Workers with IGRA vs. TST: impact on Costs and adHerence to testing) study in 2012, cost-effectiveness studies had shown inconsistent results. This study, conducted by The Johns Hopkins University (JHU) employee health department, was the first of its kind in the US to systematically analyze test performance and labor costs for TB screening of HCWs. The results showed that the time required to administer a TST is one of the costliest elements. For a sizeable institution such as JHU, TST screening cost more than $1.3 million annually, equivalent to approximately $73 per person; in contrast, IGRA screening amounted to less than $55 per person.26
Further research
The association between IGRA test conversion in HCWs and the risk for active TB disease has not been demonstrated.16 However, this is also true of TSTs27 and further research is needed in this area. Research is also needed to determine the significance of TSA-IGRA results discordance and to better define cut points for IGRA interpretation.25 In addition, more study of factors related to serial (periodic or ongoing) TB testing—which are very important within the context of HCW screening—is needed. As an example, serial TB testing may reveal trends in test conversions and can identify areas of concern within a health care facility. Unfortunately, current CDC recommendations do not provide specific guidelines for serial IGRA testing, such as guidance for accurate interpretation of IGRA results within a serial testing context.16 These areas should be addressed in future CDC updates.
Continue for conclusion >>
CONCLUSION
Occupational health professionals are continuously evaluating how to improve surveillance programs and reduce HCWs’ time away from work. Within this context, four advantages IGRAs offer include
• Elimination of a two-step TST for new hires (which requires up to four separate visits)
• No false-positive results caused by previous BCG vaccination or exposure to most nontuberculous mycobacteria
• Significantly improved HCW compliance because screening requires only one visit
• Cost effectiveness.
From an occupational health perspective, these are significant advantages that support the use of IGRAs to screen HCW for TB.
REFERENCES
1. Wilson J. Five babies test positive for TB in Texas. CNN. September 30, 2014. www.cnn.com/2014/09/29/health/babies-test-positive-tb/index.html. Accessed November 12, 2014.
2. Bailey J. 700 babies exposed to TB at Texas Hospital. Atlanta Journal Constitution. September 22, 2014. www.ajc.com/news/lifestyles/health/700-babies-exposed-TB-texas-hospital/nhRmC/. Accessed November 12, 2014.
3. CDC. Reported tuberculosis in the United States, 2013. www.cdc.gov/tb/statistics/reports/2013/pdf/report2013.pdf. Accessed October 23, 2014.
4. World Health Organization. Global tuberculosis report 2014. www.who.int/tb/publications/global_report/en/. Accessed November 12, 2014.
5. Baussano I, Nunn P, Williams B, et al. Tuberculosis among health care workers. Emerg Infect Dis. 2011;17(3):488-494.
6. Yang H, Kruh-Garcia NA, Dobos KM. Purified protein derivatives of tuberculin: past, present, and future. FEMS Immunol Med Microbiol. 2012;66(3):273-280.
7. Huebner RE, Schein MF, Bass JB Jr. The tuberculin skin test. Clin Infect Dis. 1993;17(6):968-975.
8. World Health Organization. Recommendations for vaccine administration. www.who.int/immunization/policy/Immunization_routine_table1.pdf. Accessed November 12, 2014.
9. Al-Orainey IO. Diagnosis of latent tuberculosis: can we do better? Ann Thorac Med. 2009;4(1):5-9.
10. Desem N, Jones SL. Development of a human gamma interferon enzyme immunoassay and comparison with tuberculin skin testing for detection of Mycobacterium tuberculosis infection. Clin Diagn Lab Immunol. 1998;5(4): 531-536.
11. FDA. QuantiFERON-TB - P010033. www.fda.gov/MedicalDevices/Products andMedicalProcedures/DeviceApprovalsandClearances/Recently-Approved Devices/ucm084025.htm. Accessed November 12, 2014.
12. QuantiFERON-TB Gold In-Tube Test [package insert]. www.quantiferon.com/irm/content/PI/QFT/2PK/US.pdf. Accessed November 12, 2014.
13. T-SPOT.TB [package insert]. Marlborough, MA. Oxford Immunotec, Inc. www.tspot.com/wp-content/uploads/2012/01/PI-TB-US-v4.pdf. Accessed November 12, 2014.
14. CDC. Fact sheet: infection control in health-care settings. www.cdc.gov/tb/publications/factsheets/prevention/ichcs.htm. Accessed November 12, 2014.
15. Jensen PA, Lambert LA, Iademarco MF, Ridzon R; CDC. Guidelines for preventing the transmission of Mycobacterium TB in health-care settings, 2005. MMWR Recomm Rep. 2005;54(RR-17):1-141.
16. Mazurek GH, Jereb J, Vernon A, et al; IGRA Expert Committee, CDC. Updated guidelines for using interferon γ release assays to detect Mycobacterium TB infection: United States, 2010. MMWR Recomm Rep. 2010;59(RR-5):1-25.
17. CDC. Latent tuberculosis infection: a guide for primary health care providers. www.cdc.gov/tb/publications/ltbi/diagnosis.htm. Accessed November 3, 2014.
18. Zwerling A, van den Hof S, Scholten J, et al. Interferon-γ release assays for TB screening of healthcare workers: a systematic review. Thorax. 2012;67(1): 62-70.
19. Eralp MN, Scholtes S, Martell G, et al. Screening of healthcare workers for TB: development and validation of a new health economic model to inform practice. BMJ Open. 2012;2:e000630.
20. FDA. FDA permits marketing of first US test labeled for simultaneous detection of tuberculosis bacteria and resistance to the antibiotic rifampin [press release]. July 25, 2013.
21. CDC. Availability of an assay for detecting Mycobacterium TB, including rifampin-resistant strains, and considerations for its use: United States, 2013 [published correction appears in MMWR Morb Mortal Wkly Rep. 2013;62(45):906]. MMWR Morb Mortal Wkly Rep. 2013;62(41):821-827.
22. CDC. Fact sheet: diagnosis of tuberculosis disease. www.cdc.gov/tb/publica tions/factsheets/testing/diagnosis.htm. Accessed November 12, 2014.
23. Pai M, Zwerling A, Menzies D. Systematic review: T-cell–based assays for the diagnosis of latent TB infection: an update. Ann Intern Med. 2008;149(3): 177-184.
24. LoBue PA, Castro KG. Is it time to replace the tuberculin skin test with a blood test? JAMA. 2012;308(3):241-242.
25. Mancuso JD, Mazurek GH, Tribble D, et al. Discordance among commercially available diagnostics for latent TB infection. Am J Respir Crit Care Med. 2012;185(4):427-434.
26. Wrighton-Smith P, Sneed L, Humphrey F, et al. Screening health care workers with interferon-γ release assay versus tuberculin skin test: impact on costs and adherence to testing (the SWITCH study). J Occup Environ Med. 2012;54(7):806-815.
27. World Health Organization. Use of tuberculosis interferon-gamma release assays (IGRAs) in low- and middle-income countries. www.who.int/tb/
features_archive/policy_statement_igra_oct2011.pdf. Accessed November 12, 2014.