User login
Bringing you the latest news, research and reviews, exclusive interviews, podcasts, quizzes, and more.
div[contains(@class, 'read-next-article')]
div[contains(@class, 'nav-primary')]
nav[contains(@class, 'nav-primary')]
section[contains(@class, 'footer-nav-section-wrapper')]
nav[contains(@class, 'nav-ce-stack nav-ce-stack__large-screen')]
header[@id='header']
div[contains(@class, 'header__large-screen')]
div[contains(@class, 'read-next-article')]
div[contains(@class, 'main-prefix')]
div[contains(@class, 'nav-primary')]
nav[contains(@class, 'nav-primary')]
section[contains(@class, 'footer-nav-section-wrapper')]
footer[@id='footer']
section[contains(@class, 'nav-hidden')]
div[contains(@class, 'ce-card-content')]
nav[contains(@class, 'nav-ce-stack')]
div[contains(@class, 'view-medstat-quiz-listing-panes')]
div[contains(@class, 'pane-article-sidebar-latest-news')]
Postpartum HCV treatment rare in infected mothers with opioid use disorder
Despite the availability of effective direct-acting antivirals, very few a mothers with opioid use disorder (OUD) and hepatitis C virus (HCV) during pregnancy received follow-up care or treatment for the infection within 6 months of giving birth, a retrospective study of Medicaid maternity patients found.
The study pooled data on 23,780 Medicaid-enrolled pregnant women with OUD who had a live or stillbirth during 2016-2019 and were followed for 6 months after delivery. Among these women – drawn from six states in the Medicaid Outcomes Distributed Research Network – the pooled average probability of HCV testing during pregnancy was 70.3% (95% confidence interval, 61.5%-79.1%). Of these, 30.9% (95% CI, 23.8%-38%) tested positive. At 60 days postpartum, just 3.2% (95% CI, 2.6%-3.8%) had a follow-up visit or treatment for HCV. In a subset of patients followed for 6 months, only 5.9% (95% CI, 4.9%-6.9%) had any HCV follow-up visit or medication within 6 months of delivery.

While HCV screening and diagnosis rates varied across states, postpartum follow-up rates were universally low. The results suggest a need to improve the cascade of postpartum care for HCV and, ultimately perhaps, introduce antenatal HCV treatment, as is currently given safely for HIV, if current clinical research establishes safety, according to Marian P. Jarlenski, PhD, MPH, an associate professor of public health policy and management at the University of Pittsburgh. The study was published in Obstetrics & Gynecology.
HCV infection has risen substantially in people of reproductive age in tandem with an increase in OUDs. HCV is transmitted from an infected mother to her baby in about 6% of cases, according to the Centers for Disease Control and Prevention, which in 2020 expanded its HCV screening recommendations to include all pregnant women. Currently no treatment for HCV during pregnancy has been approved.
In light of those recent recommendations, Dr. Jarlenski said in an interview that her group was “interested in looking at high-risk screened people and estimating what proportion received follow-up care and treatment for HCV. What is the promise of screening? The promise is that you can treat. Otherwise why screen?”
She acknowledged, however, that the postpartum period is a challenging time for a mother to seek health information or care for herself, whether she’s a new parent or has other children in the home. Nevertheless, the low rate of follow-up and treatment was unexpected. “Even the 70% rate of screening was low – we felt it should have been closer to 100% – but the follow-up rate was surprisingly low,” Dr. Jarlenski said.

Mishka Terplan, MD, MPH, medical director of Friends Research Institute in Baltimore, was not surprised at the low follow-up rate. “The cascade of care for hep C is demoralizing,” said Dr. Terplan, who was not involved in the study. “We know that hep C is syndemic with OUD and other opioid crises and we know that screening is effective for identifying hep C and that antiviral medications are now more effective and less toxic than ever before. But despite this, we’re failing pregnant women and their kids at every step along the cascade. We do a better job with initial testing than with the follow-up testing. We do a horrible job with postpartum medication initiation.”
He pointed to the systemic challenges mothers face in getting postpartum HCV care. “They may be transferred to a subspecialist for treatment, and this transfer is compounded by issues of insurance coverage and eligibility.” With the onus on new mothers to submit the paperwork, “the idea that mothers would be able to initiate much less continue postpartum treatment is absurd,” Dr. Terplan said.
He added that the children born to HCV-positive mothers need surveillance as well, but data suggest that the rates of newborn testing are also low. “There’s a preventable public health burden in all of this.”
The obvious way to increase eradicative therapy would be to treat women while they are getting antenatal care. A small phase 1 trial found that all pregnant participants who were HCV positive and given antivirals in their second trimester were safely treated and gave birth to healthy babies.
“If larger trials prove this treatment is safe and effective, then these results should be communicated to care providers and pregnant patients,” Dr. Jarlenski said. Otherwise, the public health potential of universal screening in pregnancy will not be realized.
This research was supported by the National Institute of Drug Abuse and by the Delaware Division of Medicaid and Medical Assistance and the University of Delaware, Center for Community Research & Service. Dr. Jarlenski disclosed no competing interests. One coauthor disclosed grant funding through her institution from Gilead Sciences and Organon unrelated to this work. Dr. Terplan reported no relevant competing interests.
Despite the availability of effective direct-acting antivirals, very few a mothers with opioid use disorder (OUD) and hepatitis C virus (HCV) during pregnancy received follow-up care or treatment for the infection within 6 months of giving birth, a retrospective study of Medicaid maternity patients found.
The study pooled data on 23,780 Medicaid-enrolled pregnant women with OUD who had a live or stillbirth during 2016-2019 and were followed for 6 months after delivery. Among these women – drawn from six states in the Medicaid Outcomes Distributed Research Network – the pooled average probability of HCV testing during pregnancy was 70.3% (95% confidence interval, 61.5%-79.1%). Of these, 30.9% (95% CI, 23.8%-38%) tested positive. At 60 days postpartum, just 3.2% (95% CI, 2.6%-3.8%) had a follow-up visit or treatment for HCV. In a subset of patients followed for 6 months, only 5.9% (95% CI, 4.9%-6.9%) had any HCV follow-up visit or medication within 6 months of delivery.
While HCV screening and diagnosis rates varied across states, postpartum follow-up rates were universally low. The results suggest a need to improve the cascade of postpartum care for HCV and, ultimately perhaps, introduce antenatal HCV treatment, as is currently given safely for HIV, if current clinical research establishes safety, according to Marian P. Jarlenski, PhD, MPH, an associate professor of public health policy and management at the University of Pittsburgh. The study was published in Obstetrics & Gynecology.
HCV infection has risen substantially in people of reproductive age in tandem with an increase in OUDs. HCV is transmitted from an infected mother to her baby in about 6% of cases, according to the Centers for Disease Control and Prevention, which in 2020 expanded its HCV screening recommendations to include all pregnant women. Currently no treatment for HCV during pregnancy has been approved.
In light of those recent recommendations, Dr. Jarlenski said in an interview that her group was “interested in looking at high-risk screened people and estimating what proportion received follow-up care and treatment for HCV. What is the promise of screening? The promise is that you can treat. Otherwise why screen?”
She acknowledged, however, that the postpartum period is a challenging time for a mother to seek health information or care for herself, whether she’s a new parent or has other children in the home. Nevertheless, the low rate of follow-up and treatment was unexpected. “Even the 70% rate of screening was low – we felt it should have been closer to 100% – but the follow-up rate was surprisingly low,” Dr. Jarlenski said.
Mishka Terplan, MD, MPH, medical director of Friends Research Institute in Baltimore, was not surprised at the low follow-up rate. “The cascade of care for hep C is demoralizing,” said Dr. Terplan, who was not involved in the study. “We know that hep C is syndemic with OUD and other opioid crises and we know that screening is effective for identifying hep C and that antiviral medications are now more effective and less toxic than ever before. But despite this, we’re failing pregnant women and their kids at every step along the cascade. We do a better job with initial testing than with the follow-up testing. We do a horrible job with postpartum medication initiation.”
He pointed to the systemic challenges mothers face in getting postpartum HCV care. “They may be transferred to a subspecialist for treatment, and this transfer is compounded by issues of insurance coverage and eligibility.” With the onus on new mothers to submit the paperwork, “the idea that mothers would be able to initiate much less continue postpartum treatment is absurd,” Dr. Terplan said.
He added that the children born to HCV-positive mothers need surveillance as well, but data suggest that the rates of newborn testing are also low. “There’s a preventable public health burden in all of this.”
The obvious way to increase eradicative therapy would be to treat women while they are getting antenatal care. A small phase 1 trial found that all pregnant participants who were HCV positive and given antivirals in their second trimester were safely treated and gave birth to healthy babies.
“If larger trials prove this treatment is safe and effective, then these results should be communicated to care providers and pregnant patients,” Dr. Jarlenski said. Otherwise, the public health potential of universal screening in pregnancy will not be realized.
This research was supported by the National Institute of Drug Abuse and by the Delaware Division of Medicaid and Medical Assistance and the University of Delaware, Center for Community Research & Service. Dr. Jarlenski disclosed no competing interests. One coauthor disclosed grant funding through her institution from Gilead Sciences and Organon unrelated to this work. Dr. Terplan reported no relevant competing interests.
FROM OBSTETRICS & GYNECOLOGY
How common is IUD perforation, expulsion, and malposition?
The medicated intrauterine devices (IUDs), including the levonorgestrel-releasing IUD (LNG-IUD) (Mirena, Kyleena, Skyla, and Liletta) and the copper IUD (Cu-IUD; Paragard), are remarkably effective contraceptives. For the 52-mg LNG-IUD (Mirena, Liletta) the pregnancy rate over 6 years of use averaged less than 0.2% per year.1,2 For the Cu-IUD, the pregnancy rate over 10 years of use averaged 0.5% per year for the first 3 years of use and 0.2% per year over the following 7 years of use.3 IUD perforation of the uterus, expulsion, and malposition are recognized complications of IUD use. Our understanding of the prevalence and management of malpositioned IUDs is evolving and the main focus of this editorial.
Complete and partial uterus perforation
A complete uterine perforation occurs when the entire IUD is outside the walls of the uterus. A partial uterine perforation occurs when the IUD is outside the uterine cavity, but a portion of the IUD remains in the myometrium. When uterine perforation is suspected, ultrasound can determine if the IUD is properly sited within the uterus. If ultrasonography does not detect the IUD within the uterus, an x-ray of the pelvis and abdomen should be obtained to determine if the IUD is in the peritoneal cavity. If both an ultrasound and a pelvic-abdominal x-ray do not detect the IUD, the IUD was probably expelled from the patient.
Uterine perforation is uncommon and occurs once in every 500 to 1,000 insertions in non-breastfeeding women.4-8 The most common symptoms reported by patients with a perforated IUD are pain and/or bleeding.8 Investigators in the European Active Surveillance Study on Intrauterine Devices (EURAS) enrolled more than 60,000 patients who had an IUD insertion and followed them for 12 months with more than 39,000 followed for up to 60 months.7,8 The uterine perforation rate per 1,000 IUD insertions in non-breastfeeding women with 60 months of follow-up was 1.6 for the LNG-IUD and 0.8 for the Cu-IUD.8 The rate of uterine perforation was much higher in women who are breastfeeding or recently postpartum. In the EURAS study after 60 months of follow-up, the perforation rate per 1,000 insertions among breastfeeding women was 7.9 for the LNG-IUS and 4.7 for the Cu-IUD.8
Remarkably very few IUD perforations were detected at the time of insertion, including only 2% of the LNG-IUD insertions and 17% of the Cu-IUD insertions.8 Many perforations were not detected until more than 12 months following insertion, including 32% of the LNG-IUD insertions and 22% of the Cu-IUD insertions.8 Obviously, an IUD that has completely perforated the uterus and resides in the peritoneal cavity is not an effective contraceptive. For some patients, the IUD perforation was initially diagnosed after they became pregnant, and imaging studies to locate the IUD and assess the pregnancy were initiated. Complete perforation is usually treated with laparoscopy to remove the IUD and reduce the risk of injury to intra-abdominal organs.
Patients with an IUD partial perforation may present with pelvic pain or abnormal uterine bleeding.9 An ultrasound study to explore the cause of the presenting symptom may detect the partial perforation. It is estimated that approximately 20% of cases of IUD perforation are partial perforation.9 Over time, a partial perforation may progress to a complete perforation. In some cases of partial perforation, the IUD string may still be visible in the cervix, and the IUD may be removed by pulling on the strings.8 Hysteroscopy and/or laparoscopy may be needed to remove a partially perforated IUD. Following a partial or complete IUD perforation, if the patient desires to continue with IUD contraception, it would be wise to insert a new IUD under ultrasound guidance or assess proper placement with a postplacement ultrasound.
Continue to: Expulsion...
Expulsion
IUD expulsion occurs in approximately 3% to 11% of patients.10-13 The age of the patient influences the rate of expulsion. In a study of 2,748 patients with a Cu-IUD, the rate of expulsion by age for patients <20 years, 20–24 years, 25–29 years, 30–34 years, and ≥35 years was 8.2%, 3.2%, 3.0%, 2.3%, and 1.8%, respectively.10 In this study, age did not influence the rate of IUD removal for pelvic pain or abnormal bleeding, which was 4% to 5% across all age groups.10 In a study of 5,403 patients with an IUD, the rate of IUD expulsion by age for patients <20 years, 20–29 years, and 30–45 years was 14.6%, 7.3%, and 7.2%, respectively.12 In this study, the 3-year cumulative rate of expulsion was 10.2%.12 There was no statistically significant difference in the 3-year cumulative rate of expulsion for the 52-mg LNG-IUD (10.1%) and Cu-IUD (10.7%).12
The majority of patients who have an IUD expulsion recognize the event and seek additional contraception care. A few patients first recognize the IUD expulsion when they become pregnant, and imaging studies detect no IUD in the uterus or the peritoneal cavity. In a study of more than 17,000 patients using an LNG-IUD, 108 pregnancies were reported. Seven pregnancies occurred in patients who did not realize their IUD was expelled.14 Patients who have had an IUD expulsion and receive a new IUD are at increased risk for re-expulsion. For these patients, reinsertion of an IUD could be performed under ultrasound guidance to ensure and document optimal initial IUD position within the uterus, or ultrasound can be obtained postinsertion to document appropriate IUD position.
Malposition—prevalence and management
Our understanding of the prevalence and management of a malpositioned IUD is evolving. For the purposes of this discussion a malpositioned IUD is defined as being in the uterus, but not properly positioned within the uterine cavity. Perforation into the peritoneal cavity and complete expulsion of an IUD are considered separate entities. However, a malpositioned IUD within the uterus may eventually perforate the uterus or be expelled from the body. For example, an IUD embedded in the uterine wall may eventually work its way through the wall and become perforated, residing in the peritoneal cavity. An IUD with the stem in the cervix below the internal os may eventually be expelled from the uterus and leave the body through the vagina.
High-quality ultrasonography, including 2-dimensional (2-D) ultrasound with videoclips or 3-dimensional (3-D) ultrasound with coronal views, has greatly advanced our understanding of the prevalence and characteristics of a malpositioned IUD.15-18 Ultrasound features of an IUD correctly placed within the uterus include:
- the IUD is in the uterus
- the shaft is in the midline of the uterine cavity
- the shaft of the IUD is not in the endocervix
- the IUD arms are at a 90-degree angle from the shaft
- the top of the IUD is within 2 cm of the fundus
- the IUD is not rotated outside of the cornual plane, inverted or transverse.
Ultrasound imaging has identified multiple types of malpositioned IUDs, including:
- IUD embedded in the myometrium—a portion of the IUD is embedded in the uterine wall
- low-lying IUD—the IUD is low in the uterine cavity but not in the endocervix
- IUD in the endocervix—the stem is in the endocervical canal
- rotated—the IUD is rotated outside the cornual plane
- malpositioned arms—the arms are not at a 90-degree angle to the stem
- the IUD is inverted, transverse, or laterally displaced.
IUD malposition is highly prevalent and has been identified in 10% to 20% of convenience cohorts in which an ultrasound study was performed.15-18
Benacerraf, Shipp, and Bromley were among the first experts to use ultrasound to detect the high prevalence of malpositioned IUDs among a convenience sample of 167 patients with an IUD undergoing ultrasound for a variety of indications. Using 3-D ultrasound, including reconstructed coronal views, they identified 28 patients (17%) with a malpositioned IUD based on the detection of the IUD “poking into the substance of the uterus or cervix.” Among the patients with a malpositioned IUD, the principal indication for the ultrasound study was pelvic pain (39%) or abnormal uterine bleeding (36%). Among women with a normally sited IUD, pelvic pain (19%) or abnormal uterine bleeding (15%) were less often the principal indication for the ultrasound.15 The malpositioned IUD was removed in 21 of the 28 cases and the symptoms of pelvic pain or abnormal bleeding resolved in 20 of the 21 patients.15
Other investigators have confirmed the observation that IUD malposition is common.16-18 In a retrospective study of 1,748 pelvic ultrasounds performed for any indication where an IUD was present, after excluding 13 patients who were determined to have expelled their IUD (13) and 13 patients with a perforated IUD, 156 patients (8.9%) were diagnosed as having a malpositioned IUD.16 IUD malposition was diagnosed when the IUD was in the uterus but positioned in the lower uterine segment, cervix, rotated or embedded in the uterus. An IUD in the lower uterine segment or cervix was detected in 133 patients, representing 85% of cases. Among these cases, 29 IUDs were also embedded and/or rotated, indicating that some IUDs have multiple causes of the malposition. Twenty-one IUDs were near the fundus but embedded and/or rotated. Controls with a normally-sited IUD were selected for comparison to the case group. Among IUD users, the identification of suspected adenomyosis on the ultrasound was associated with an increased risk of IUD malposition (odds ratio [OR], 3.04; 95% confidence interval [CI], 1.08-8.52).16 In this study, removal of a malpositioned LNG-IUD, without initiating a highly reliable contraceptive was associated with an increased risk of pregnancy. It is important to initiate a highly reliable form of contraception if the plan is to remove a malpositioned IUD.16,19
In a study of 1,253 pelvic ultrasounds performed for any indication where an IUD was identified in the uterus, 263 IUDs (19%) were determined to be malpositioned.17 In this study the location of the malpositioned IUDs included17:
- the lower uterine segment not extending into the cervix (38%)
- in the lower uterine segment extending into the cervix (22%)
- in the cervix (26%)
- rotated axis of the IUD (12%)
- other (2%).
Among the 236 malpositioned IUDs, 24% appeared to be embedded in the uterine wall.17 Compared with patients with a normally-sited IUD on ultrasound, patients with a malpositioned IUD more frequently reported vaginal bleeding (30% vs 19%; P<.005) and pelvic pain (43% vs 30%; P<.002), similar to the findings in the Benacerraf et al. study.14
Connolly and Fox18 designed an innovative study to determine the rate of malpositioned IUDs using 2-D ultrasound to ensure proper IUD placement at the time of insertion with a follow-up 3-D ultrasound 8 weeks after insertion to assess IUD position within the uterus. At the 8-week 3-D ultrasound, among 763 women, 16.6% of the IUDs were malpositioned.18 In this study, IUD position was determined to be correct if all the following features were identified:
- the IUD shaft was in the midline of the uterine cavity
- the IUD arms were at 90 degrees from the stem
- the top of the IUD was within 3 to 4 mm of the fundus
- the IUD was not rotated, inverted or transverse.
IUD malpositions were categorized as:
- embedded in the uterine wall
- low in the uterine cavity
- in the endocervical canal
- misaligned
- perforated
- expulsed.
At the 8-week follow-up, 636 patients (83.4%) had an IUD that was correctly positioned.18 In 127 patients (16.6%) IUD malposition was identified, with some patients having more than one type of malposition. The types of malposition identified were:
- embedded in the myometrium (54%)
- misaligned, including rotated, laterally displaced, inverted, transverse or arms not deployed (47%)
- low in the uterine cavity (39%)
- in the endocervical canal (14%)
- perforated (3%)
- expulsion (0%).
Recall that all of these patients had a 2-D ultrasound at the time of insertion that identified the IUD as correctly placed. This suggests that during the 8 weeks following IUD placement there were changes in the location of the IUD or that 2-D ultrasound has lower sensitivity than 3-D ultrasound to detect malposition. Of note, at the 8-week follow-up, bleeding or pain was reported by 36% of the patients with a malpositioned IUD and 20% of patients with a correctly positioned IUD.17 Sixty-seven of the 127 malpositioned IUDs “required” removal, but the precise reasons for the removals were not delineated. The investigators concluded that 3-D ultrasonography is useful for the detection of IUD malposition and could be considered as part of ongoing IUD care, if symptoms of pain or bleeding occur.18
Continue to: IUD malposition following postplacental insertion...
IUD malposition following postplacental insertion
IUD malposition is common in patients who have had a postplacental insertion. Ultrasound imaging plays an important role in detecting IUD expulsion and malposition in these cases. Postplacental IUD insertion is defined as the placement of an IUD within 10 minutes following delivery of the placenta. Postplacental IUD insertion can be performed following a vaginal or cesarean birth and with a Cu-IUD or LNG-IUD. The good news is that postplacental IUD insertion reduces the risk of unplanned pregnancy in the years following birth. However, postplacental IUD insertion is associated with a high rate of IUD malposition.
In a study of 162 patients who had postplacental insertion of a Cu-IUD following a vaginal birth, ultrasound and physical examination at 6 months demonstrated complete IUD expulsion in 8%, partial expulsion in 16%, and malposition in 15%.20 The IUD was correctly sited in 56% of patients. Seven patients (4%) had the IUD removed, and 1 patient had a perforated IUD. Among the 25 malpositioned IUDs, 14 were not within 1 cm of the fundus, and 11 were rotated outside of the axis of the cornuas. In this study partial expulsion was defined as an IUD protruding from the external cervical os on physical exam or demonstration of the distal tip of the IUD below the internal os of the cervix on ultrasound. Malposition was defined as an IUD that was >1 cm from the fundus or in an abnormal location or axis, but not partially expelled.
In a study of 69 patients who had postplacental insertion of a Cu-IUD following a cesarean birth, ultrasound and physical examination at 6 months demonstrated complete IUD expulsion in 3%, partial expulsion (stem in the cervix below the internal os) in 4% and malposition in 30%.20 The IUD was correctly positioned in 59% of the patients.21 The IUD had been electively removed in 3%. Among the 21 patients with a malpositioned IUD, 10 were rotated within the uterine cavity, 6 were inverted (upside down), 3 were low-lying, and 2 were transverse.21 Given the relatively high rate of IUD malposition following postplacental insertion, it may be useful to perform a pelvic ultrasound at a postpartum visit to assess the location of the IUD, if ultrasonography is available.
Management of the malpositioned IUD
There are no consensus guidelines on how to care for a patient with a malpositioned IUD. Clinicians need to use their best judgment and engage the patient in joint decision making when managing a malpositioned IUD. When an IUD is malpositioned and the patient has bothersome symptoms of pelvic pain or abnormal bleeding that have not responded to standard interventions, consideration may be given to a remove and replace strategy. When the stem of the IUD is below the level of the internal os on ultrasound or visible at the external os on physical examination, consideration should be given to removing and replacing the IUD. However, if the IUD is removed without replacement or the initiation of a highly reliable contraceptive, the risk of unplanned pregnancy is considerable.16,19
IUD totally or partially within the cervix or low-lying. When an IUD is in the cervix, the contraceptive efficacy of the IUD may be diminished, especially with a Cu-IUD.22 In these cases, removing and replacing the IUD is an option. In a survey of 20 expert clinicians, >80% recommended replacing an IUD that was totally or partially in the cervical canal.23 But most of the experts would not replace an IUD that was incidentally noted on ultrasound to be low-lying, being positioned more than 2 cm below the fundus, with no portion of the IUD in the cervical canal. In the same survey, for patients with a low-lying IUD and pelvic pain or bleeding, the majority of experts reported that they would explore other causes of bleeding and pelvic pain not related to the IUD itself and not replace the IUD, but 30% of the experts reported that they would remove and replace the device.23
IUD embedded in the myometrium with pelvic pain. Based on my clinical experience, when a patient has persistent pelvic pain following the insertion of an IUD and the pain does not resolve with standard measures including medication, an ultrasound study is warranted to assess the position of the IUD. If the ultrasound demonstrates that an arm of the IUD is embedded in the myometrium, removal of the IUD may be associated with resolution of the pain. Reinsertion of an IUD under ultrasound guidance may result in a correctly-sited IUD with no recurrence of pelvic pain.
IUD rotated within the uterus with no pain or abnormal bleeding. For an IUD that is near the fundus and rotated on its axis within the uterus, if the patient has no symptoms of pain or abnormal bleeding, my recommendation to the patient would be to leave the device in situ.
Without available guidelines, engage in clinician-patient discussion
It is clear that IUD malposition is common, occurring in 10% to 20% of patients with an IUD. High-quality ultrasound imaging is helpful in detecting IUD malposition, including 2-D ultrasound with videoclips and/or 3-D ultrasound with coronal reconstruction. More data are needed to identify the best options for managing various types of malpositioned IUDs in patients with and without bothersome symptoms such as pain and bleeding. Until consensus guidelines are developed, clinicians need to engage the patient in a discussion of how to best manage the malpositioned IUD. Medicated IUDs and progestin subdermal implants are our two most effective reversible contraceptives. They are among the most important advances in health care over the past half-century. ●
- Mirena FDA approval. , 2022.
- Liletta [package insert]. Allergan USA: Irvine, California; 2019. .
- Paragard [package insert]. CooperSurgical Inc: Trumbull, Connecticut; 2019. .
- Harrison-Woolrych M, Ashton J, Coulter D. Uterine perforation on intrauterine device insertion: is the incidence higher than previously reported? Contraception. 2003;67:53-56.
- Van Houdenhoven K, van Kaam KJAF, van Grootheest AC, et al. Uterine perforation in women using a levonorgestrel-releasing intrauterine system. Contraception. 2006;73:257-260.
- van Grootheest K, Sachs B, Harrison-Woolrych M, et al. Uterine perforation with the levonorgestrel-releasing intrauterine device. Analysis of reports from four national pharmacovigilance centres. Drug Saf. 2011;34:83-88.
- Heinemann K, Reed S, Moehner S, et al. Risk of uterine perforation with levonorgestrel-releasing and copper intrauterine devices in the European Active Surveillance Study on Intrauterine Devices. Contraception. 2015;91:274-279.
- Barnett C, Moehner S, Do Minh T, et al. Perforation risk and intra-uterine devices: results of the EURAS-IUD 5-year extension study. Eur J Contracept Reprod Health Care. 2017;22:424-428.
- Zakin D, Stern WZ, Rosenblatt R. Complete and partial uterine perforation and embedding following insertion of intrauterine devices. I. Classification, complications, mechanism, incidence and missing string. Obstet Gynecol Surv. 1981;36:335-353.
- Rivera R, Chen-Mok M, McMullen S. Analysis of client characteristics that may affect early discontinuation of the TCu-380A IUD. Contraception. 1999;60:155-160.
- Aoun J, Dines VA, Stovall DW, et al. Effects of age, parity and device type on complications and discontinuation of intrauterine devices. Obstet Gynecol. 2014;123:585-592.
- Madden T, McNichols, Zhao Q, et al. Association of age and parity with intrauterine device expulsion. Obstet Gynecol. 2014;124:718-726.
- Keenahan L, Bercaw-Pratt JL, Adeyemi O, et al. Rates of intrauterine device expulsion among adolescents and young women. J Pediatr Adolesc Gynecol. 2021;34:362-365.
- Backman T, Rauramo I, Huhtala S, et al. Pregnancy during the use of levonorgestrel intrauterine system. Am J Obstet Gynecol. 2004;190:50-54.
- Benacerraf BR, Shipp TD, Bromley B. Three-dimensional ultrasound detection of abnormally located intrauterine contraceptive devices which are a source of pelvic pain and abnormal bleeding. Ultrasound Obstet Gynecol. 2009;34:110-115.
- Braaten KP, Benson CB, Maurer R, et al. Malpositioned intrauterine contraceptive devices: risk factors, outcomes and future pregnancies. Obstet Gynecol. 2011;118:1014-1020.
- Gerkowicz SA, Fiorentino DG, Kovacs AP, et al. Uterine structural abnormality and intrauterine device malposition: analysis of ultrasonographic and demographic variables of 517 patients. Am J Obstet Gynecol. 2019;220:183.e1-e8.
- Connolly CT, Fox NS. Incidence and risk factors for a malpositioned intrauterine device detected on three-dimensional ultrasound within eight weeks of placement. J Ultrasound Med. 2021 ePub Sept 27 2021.
- Golightly E, Gebbie AE. Low-lying or malpositioned intrauterine devices and systems. J Fam Plann Reprod health Care. 2014;40:108-112.
- Gurney EP, Sonalkar S, McAllister A, et al. Six-month expulsion of postplacental copper intrauterine devices placed after vaginal delivery. Am J Obstet Gynecol. 2018;219:183.e1-e9.
- Gurney EP, McAllister A, Lang B, et al. Ultrasound assessment of postplacental copper intrauterine device position 6 months after placement during cesarean delivery. Contraception. 2020;2:100040.
- Anteby E, Revel A, Ben-Chetrit A, et al. Intrauterine device failure: relation to its location with the uterine cavity. Obstet Gynecol. 1993;81:112-114.
- Golightly E, Gebbie AE. Clinicians’ views on low-lying intrauterine devices or systems. J Fam Plann Reprod Health Care. 2014;40:113-116.

Robert L. Barbieri, MD
Editor in Chief, OBG Management
Chair Emeritus, Department of Obstetrics and Gynecology
Brigham and Women’s Hospital
Kate Macy Ladd Distinguished Professor of Obstetrics,
Gynecology and Reproductive Biology
Harvard Medical School
Boston, Massachusetts
Dr. Barbieri reports no financial relationships relevant to this article.
The medicated intrauterine devices (IUDs), including the levonorgestrel-releasing IUD (LNG-IUD) (Mirena, Kyleena, Skyla, and Liletta) and the copper IUD (Cu-IUD; Paragard), are remarkably effective contraceptives. For the 52-mg LNG-IUD (Mirena, Liletta) the pregnancy rate over 6 years of use averaged less than 0.2% per year.1,2 For the Cu-IUD, the pregnancy rate over 10 years of use averaged 0.5% per year for the first 3 years of use and 0.2% per year over the following 7 years of use.3 IUD perforation of the uterus, expulsion, and malposition are recognized complications of IUD use. Our understanding of the prevalence and management of malpositioned IUDs is evolving and the main focus of this editorial.
Complete and partial uterus perforation
A complete uterine perforation occurs when the entire IUD is outside the walls of the uterus. A partial uterine perforation occurs when the IUD is outside the uterine cavity, but a portion of the IUD remains in the myometrium. When uterine perforation is suspected, ultrasound can determine if the IUD is properly sited within the uterus. If ultrasonography does not detect the IUD within the uterus, an x-ray of the pelvis and abdomen should be obtained to determine if the IUD is in the peritoneal cavity. If both an ultrasound and a pelvic-abdominal x-ray do not detect the IUD, the IUD was probably expelled from the patient.
Uterine perforation is uncommon and occurs once in every 500 to 1,000 insertions in non-breastfeeding women.4-8 The most common symptoms reported by patients with a perforated IUD are pain and/or bleeding.8 Investigators in the European Active Surveillance Study on Intrauterine Devices (EURAS) enrolled more than 60,000 patients who had an IUD insertion and followed them for 12 months with more than 39,000 followed for up to 60 months.7,8 The uterine perforation rate per 1,000 IUD insertions in non-breastfeeding women with 60 months of follow-up was 1.6 for the LNG-IUD and 0.8 for the Cu-IUD.8 The rate of uterine perforation was much higher in women who are breastfeeding or recently postpartum. In the EURAS study after 60 months of follow-up, the perforation rate per 1,000 insertions among breastfeeding women was 7.9 for the LNG-IUS and 4.7 for the Cu-IUD.8
Remarkably very few IUD perforations were detected at the time of insertion, including only 2% of the LNG-IUD insertions and 17% of the Cu-IUD insertions.8 Many perforations were not detected until more than 12 months following insertion, including 32% of the LNG-IUD insertions and 22% of the Cu-IUD insertions.8 Obviously, an IUD that has completely perforated the uterus and resides in the peritoneal cavity is not an effective contraceptive. For some patients, the IUD perforation was initially diagnosed after they became pregnant, and imaging studies to locate the IUD and assess the pregnancy were initiated. Complete perforation is usually treated with laparoscopy to remove the IUD and reduce the risk of injury to intra-abdominal organs.
Patients with an IUD partial perforation may present with pelvic pain or abnormal uterine bleeding.9 An ultrasound study to explore the cause of the presenting symptom may detect the partial perforation. It is estimated that approximately 20% of cases of IUD perforation are partial perforation.9 Over time, a partial perforation may progress to a complete perforation. In some cases of partial perforation, the IUD string may still be visible in the cervix, and the IUD may be removed by pulling on the strings.8 Hysteroscopy and/or laparoscopy may be needed to remove a partially perforated IUD. Following a partial or complete IUD perforation, if the patient desires to continue with IUD contraception, it would be wise to insert a new IUD under ultrasound guidance or assess proper placement with a postplacement ultrasound.
Continue to: Expulsion...
Expulsion
IUD expulsion occurs in approximately 3% to 11% of patients.10-13 The age of the patient influences the rate of expulsion. In a study of 2,748 patients with a Cu-IUD, the rate of expulsion by age for patients <20 years, 20–24 years, 25–29 years, 30–34 years, and ≥35 years was 8.2%, 3.2%, 3.0%, 2.3%, and 1.8%, respectively.10 In this study, age did not influence the rate of IUD removal for pelvic pain or abnormal bleeding, which was 4% to 5% across all age groups.10 In a study of 5,403 patients with an IUD, the rate of IUD expulsion by age for patients <20 years, 20–29 years, and 30–45 years was 14.6%, 7.3%, and 7.2%, respectively.12 In this study, the 3-year cumulative rate of expulsion was 10.2%.12 There was no statistically significant difference in the 3-year cumulative rate of expulsion for the 52-mg LNG-IUD (10.1%) and Cu-IUD (10.7%).12
The majority of patients who have an IUD expulsion recognize the event and seek additional contraception care. A few patients first recognize the IUD expulsion when they become pregnant, and imaging studies detect no IUD in the uterus or the peritoneal cavity. In a study of more than 17,000 patients using an LNG-IUD, 108 pregnancies were reported. Seven pregnancies occurred in patients who did not realize their IUD was expelled.14 Patients who have had an IUD expulsion and receive a new IUD are at increased risk for re-expulsion. For these patients, reinsertion of an IUD could be performed under ultrasound guidance to ensure and document optimal initial IUD position within the uterus, or ultrasound can be obtained postinsertion to document appropriate IUD position.
Malposition—prevalence and management
Our understanding of the prevalence and management of a malpositioned IUD is evolving. For the purposes of this discussion a malpositioned IUD is defined as being in the uterus, but not properly positioned within the uterine cavity. Perforation into the peritoneal cavity and complete expulsion of an IUD are considered separate entities. However, a malpositioned IUD within the uterus may eventually perforate the uterus or be expelled from the body. For example, an IUD embedded in the uterine wall may eventually work its way through the wall and become perforated, residing in the peritoneal cavity. An IUD with the stem in the cervix below the internal os may eventually be expelled from the uterus and leave the body through the vagina.
High-quality ultrasonography, including 2-dimensional (2-D) ultrasound with videoclips or 3-dimensional (3-D) ultrasound with coronal views, has greatly advanced our understanding of the prevalence and characteristics of a malpositioned IUD.15-18 Ultrasound features of an IUD correctly placed within the uterus include:
- the IUD is in the uterus
- the shaft is in the midline of the uterine cavity
- the shaft of the IUD is not in the endocervix
- the IUD arms are at a 90-degree angle from the shaft
- the top of the IUD is within 2 cm of the fundus
- the IUD is not rotated outside of the cornual plane, inverted or transverse.
Ultrasound imaging has identified multiple types of malpositioned IUDs, including:
- IUD embedded in the myometrium—a portion of the IUD is embedded in the uterine wall
- low-lying IUD—the IUD is low in the uterine cavity but not in the endocervix
- IUD in the endocervix—the stem is in the endocervical canal
- rotated—the IUD is rotated outside the cornual plane
- malpositioned arms—the arms are not at a 90-degree angle to the stem
- the IUD is inverted, transverse, or laterally displaced.
IUD malposition is highly prevalent and has been identified in 10% to 20% of convenience cohorts in which an ultrasound study was performed.15-18
Benacerraf, Shipp, and Bromley were among the first experts to use ultrasound to detect the high prevalence of malpositioned IUDs among a convenience sample of 167 patients with an IUD undergoing ultrasound for a variety of indications. Using 3-D ultrasound, including reconstructed coronal views, they identified 28 patients (17%) with a malpositioned IUD based on the detection of the IUD “poking into the substance of the uterus or cervix.” Among the patients with a malpositioned IUD, the principal indication for the ultrasound study was pelvic pain (39%) or abnormal uterine bleeding (36%). Among women with a normally sited IUD, pelvic pain (19%) or abnormal uterine bleeding (15%) were less often the principal indication for the ultrasound.15 The malpositioned IUD was removed in 21 of the 28 cases and the symptoms of pelvic pain or abnormal bleeding resolved in 20 of the 21 patients.15
Other investigators have confirmed the observation that IUD malposition is common.16-18 In a retrospective study of 1,748 pelvic ultrasounds performed for any indication where an IUD was present, after excluding 13 patients who were determined to have expelled their IUD (13) and 13 patients with a perforated IUD, 156 patients (8.9%) were diagnosed as having a malpositioned IUD.16 IUD malposition was diagnosed when the IUD was in the uterus but positioned in the lower uterine segment, cervix, rotated or embedded in the uterus. An IUD in the lower uterine segment or cervix was detected in 133 patients, representing 85% of cases. Among these cases, 29 IUDs were also embedded and/or rotated, indicating that some IUDs have multiple causes of the malposition. Twenty-one IUDs were near the fundus but embedded and/or rotated. Controls with a normally-sited IUD were selected for comparison to the case group. Among IUD users, the identification of suspected adenomyosis on the ultrasound was associated with an increased risk of IUD malposition (odds ratio [OR], 3.04; 95% confidence interval [CI], 1.08-8.52).16 In this study, removal of a malpositioned LNG-IUD, without initiating a highly reliable contraceptive was associated with an increased risk of pregnancy. It is important to initiate a highly reliable form of contraception if the plan is to remove a malpositioned IUD.16,19
In a study of 1,253 pelvic ultrasounds performed for any indication where an IUD was identified in the uterus, 263 IUDs (19%) were determined to be malpositioned.17 In this study the location of the malpositioned IUDs included17:
- the lower uterine segment not extending into the cervix (38%)
- in the lower uterine segment extending into the cervix (22%)
- in the cervix (26%)
- rotated axis of the IUD (12%)
- other (2%).
Among the 236 malpositioned IUDs, 24% appeared to be embedded in the uterine wall.17 Compared with patients with a normally-sited IUD on ultrasound, patients with a malpositioned IUD more frequently reported vaginal bleeding (30% vs 19%; P<.005) and pelvic pain (43% vs 30%; P<.002), similar to the findings in the Benacerraf et al. study.14
Connolly and Fox18 designed an innovative study to determine the rate of malpositioned IUDs using 2-D ultrasound to ensure proper IUD placement at the time of insertion with a follow-up 3-D ultrasound 8 weeks after insertion to assess IUD position within the uterus. At the 8-week 3-D ultrasound, among 763 women, 16.6% of the IUDs were malpositioned.18 In this study, IUD position was determined to be correct if all the following features were identified:
- the IUD shaft was in the midline of the uterine cavity
- the IUD arms were at 90 degrees from the stem
- the top of the IUD was within 3 to 4 mm of the fundus
- the IUD was not rotated, inverted or transverse.
IUD malpositions were categorized as:
- embedded in the uterine wall
- low in the uterine cavity
- in the endocervical canal
- misaligned
- perforated
- expulsed.
At the 8-week follow-up, 636 patients (83.4%) had an IUD that was correctly positioned.18 In 127 patients (16.6%) IUD malposition was identified, with some patients having more than one type of malposition. The types of malposition identified were:
- embedded in the myometrium (54%)
- misaligned, including rotated, laterally displaced, inverted, transverse or arms not deployed (47%)
- low in the uterine cavity (39%)
- in the endocervical canal (14%)
- perforated (3%)
- expulsion (0%).
Recall that all of these patients had a 2-D ultrasound at the time of insertion that identified the IUD as correctly placed. This suggests that during the 8 weeks following IUD placement there were changes in the location of the IUD or that 2-D ultrasound has lower sensitivity than 3-D ultrasound to detect malposition. Of note, at the 8-week follow-up, bleeding or pain was reported by 36% of the patients with a malpositioned IUD and 20% of patients with a correctly positioned IUD.17 Sixty-seven of the 127 malpositioned IUDs “required” removal, but the precise reasons for the removals were not delineated. The investigators concluded that 3-D ultrasonography is useful for the detection of IUD malposition and could be considered as part of ongoing IUD care, if symptoms of pain or bleeding occur.18
Continue to: IUD malposition following postplacental insertion...
IUD malposition following postplacental insertion
IUD malposition is common in patients who have had a postplacental insertion. Ultrasound imaging plays an important role in detecting IUD expulsion and malposition in these cases. Postplacental IUD insertion is defined as the placement of an IUD within 10 minutes following delivery of the placenta. Postplacental IUD insertion can be performed following a vaginal or cesarean birth and with a Cu-IUD or LNG-IUD. The good news is that postplacental IUD insertion reduces the risk of unplanned pregnancy in the years following birth. However, postplacental IUD insertion is associated with a high rate of IUD malposition.
In a study of 162 patients who had postplacental insertion of a Cu-IUD following a vaginal birth, ultrasound and physical examination at 6 months demonstrated complete IUD expulsion in 8%, partial expulsion in 16%, and malposition in 15%.20 The IUD was correctly sited in 56% of patients. Seven patients (4%) had the IUD removed, and 1 patient had a perforated IUD. Among the 25 malpositioned IUDs, 14 were not within 1 cm of the fundus, and 11 were rotated outside of the axis of the cornuas. In this study partial expulsion was defined as an IUD protruding from the external cervical os on physical exam or demonstration of the distal tip of the IUD below the internal os of the cervix on ultrasound. Malposition was defined as an IUD that was >1 cm from the fundus or in an abnormal location or axis, but not partially expelled.
In a study of 69 patients who had postplacental insertion of a Cu-IUD following a cesarean birth, ultrasound and physical examination at 6 months demonstrated complete IUD expulsion in 3%, partial expulsion (stem in the cervix below the internal os) in 4% and malposition in 30%.20 The IUD was correctly positioned in 59% of the patients.21 The IUD had been electively removed in 3%. Among the 21 patients with a malpositioned IUD, 10 were rotated within the uterine cavity, 6 were inverted (upside down), 3 were low-lying, and 2 were transverse.21 Given the relatively high rate of IUD malposition following postplacental insertion, it may be useful to perform a pelvic ultrasound at a postpartum visit to assess the location of the IUD, if ultrasonography is available.
Management of the malpositioned IUD
There are no consensus guidelines on how to care for a patient with a malpositioned IUD. Clinicians need to use their best judgment and engage the patient in joint decision making when managing a malpositioned IUD. When an IUD is malpositioned and the patient has bothersome symptoms of pelvic pain or abnormal bleeding that have not responded to standard interventions, consideration may be given to a remove and replace strategy. When the stem of the IUD is below the level of the internal os on ultrasound or visible at the external os on physical examination, consideration should be given to removing and replacing the IUD. However, if the IUD is removed without replacement or the initiation of a highly reliable contraceptive, the risk of unplanned pregnancy is considerable.16,19
IUD totally or partially within the cervix or low-lying. When an IUD is in the cervix, the contraceptive efficacy of the IUD may be diminished, especially with a Cu-IUD.22 In these cases, removing and replacing the IUD is an option. In a survey of 20 expert clinicians, >80% recommended replacing an IUD that was totally or partially in the cervical canal.23 But most of the experts would not replace an IUD that was incidentally noted on ultrasound to be low-lying, being positioned more than 2 cm below the fundus, with no portion of the IUD in the cervical canal. In the same survey, for patients with a low-lying IUD and pelvic pain or bleeding, the majority of experts reported that they would explore other causes of bleeding and pelvic pain not related to the IUD itself and not replace the IUD, but 30% of the experts reported that they would remove and replace the device.23
IUD embedded in the myometrium with pelvic pain. Based on my clinical experience, when a patient has persistent pelvic pain following the insertion of an IUD and the pain does not resolve with standard measures including medication, an ultrasound study is warranted to assess the position of the IUD. If the ultrasound demonstrates that an arm of the IUD is embedded in the myometrium, removal of the IUD may be associated with resolution of the pain. Reinsertion of an IUD under ultrasound guidance may result in a correctly-sited IUD with no recurrence of pelvic pain.
IUD rotated within the uterus with no pain or abnormal bleeding. For an IUD that is near the fundus and rotated on its axis within the uterus, if the patient has no symptoms of pain or abnormal bleeding, my recommendation to the patient would be to leave the device in situ.
Without available guidelines, engage in clinician-patient discussion
It is clear that IUD malposition is common, occurring in 10% to 20% of patients with an IUD. High-quality ultrasound imaging is helpful in detecting IUD malposition, including 2-D ultrasound with videoclips and/or 3-D ultrasound with coronal reconstruction. More data are needed to identify the best options for managing various types of malpositioned IUDs in patients with and without bothersome symptoms such as pain and bleeding. Until consensus guidelines are developed, clinicians need to engage the patient in a discussion of how to best manage the malpositioned IUD. Medicated IUDs and progestin subdermal implants are our two most effective reversible contraceptives. They are among the most important advances in health care over the past half-century. ●
- Mirena FDA approval. , 2022.
- Liletta [package insert]. Allergan USA: Irvine, California; 2019. .
- Paragard [package insert]. CooperSurgical Inc: Trumbull, Connecticut; 2019. .
- Harrison-Woolrych M, Ashton J, Coulter D. Uterine perforation on intrauterine device insertion: is the incidence higher than previously reported? Contraception. 2003;67:53-56.
- Van Houdenhoven K, van Kaam KJAF, van Grootheest AC, et al. Uterine perforation in women using a levonorgestrel-releasing intrauterine system. Contraception. 2006;73:257-260.
- van Grootheest K, Sachs B, Harrison-Woolrych M, et al. Uterine perforation with the levonorgestrel-releasing intrauterine device. Analysis of reports from four national pharmacovigilance centres. Drug Saf. 2011;34:83-88.
- Heinemann K, Reed S, Moehner S, et al. Risk of uterine perforation with levonorgestrel-releasing and copper intrauterine devices in the European Active Surveillance Study on Intrauterine Devices. Contraception. 2015;91:274-279.
- Barnett C, Moehner S, Do Minh T, et al. Perforation risk and intra-uterine devices: results of the EURAS-IUD 5-year extension study. Eur J Contracept Reprod Health Care. 2017;22:424-428.
- Zakin D, Stern WZ, Rosenblatt R. Complete and partial uterine perforation and embedding following insertion of intrauterine devices. I. Classification, complications, mechanism, incidence and missing string. Obstet Gynecol Surv. 1981;36:335-353.
- Rivera R, Chen-Mok M, McMullen S. Analysis of client characteristics that may affect early discontinuation of the TCu-380A IUD. Contraception. 1999;60:155-160.
- Aoun J, Dines VA, Stovall DW, et al. Effects of age, parity and device type on complications and discontinuation of intrauterine devices. Obstet Gynecol. 2014;123:585-592.
- Madden T, McNichols, Zhao Q, et al. Association of age and parity with intrauterine device expulsion. Obstet Gynecol. 2014;124:718-726.
- Keenahan L, Bercaw-Pratt JL, Adeyemi O, et al. Rates of intrauterine device expulsion among adolescents and young women. J Pediatr Adolesc Gynecol. 2021;34:362-365.
- Backman T, Rauramo I, Huhtala S, et al. Pregnancy during the use of levonorgestrel intrauterine system. Am J Obstet Gynecol. 2004;190:50-54.
- Benacerraf BR, Shipp TD, Bromley B. Three-dimensional ultrasound detection of abnormally located intrauterine contraceptive devices which are a source of pelvic pain and abnormal bleeding. Ultrasound Obstet Gynecol. 2009;34:110-115.
- Braaten KP, Benson CB, Maurer R, et al. Malpositioned intrauterine contraceptive devices: risk factors, outcomes and future pregnancies. Obstet Gynecol. 2011;118:1014-1020.
- Gerkowicz SA, Fiorentino DG, Kovacs AP, et al. Uterine structural abnormality and intrauterine device malposition: analysis of ultrasonographic and demographic variables of 517 patients. Am J Obstet Gynecol. 2019;220:183.e1-e8.
- Connolly CT, Fox NS. Incidence and risk factors for a malpositioned intrauterine device detected on three-dimensional ultrasound within eight weeks of placement. J Ultrasound Med. 2021 ePub Sept 27 2021.
- Golightly E, Gebbie AE. Low-lying or malpositioned intrauterine devices and systems. J Fam Plann Reprod health Care. 2014;40:108-112.
- Gurney EP, Sonalkar S, McAllister A, et al. Six-month expulsion of postplacental copper intrauterine devices placed after vaginal delivery. Am J Obstet Gynecol. 2018;219:183.e1-e9.
- Gurney EP, McAllister A, Lang B, et al. Ultrasound assessment of postplacental copper intrauterine device position 6 months after placement during cesarean delivery. Contraception. 2020;2:100040.
- Anteby E, Revel A, Ben-Chetrit A, et al. Intrauterine device failure: relation to its location with the uterine cavity. Obstet Gynecol. 1993;81:112-114.
- Golightly E, Gebbie AE. Clinicians’ views on low-lying intrauterine devices or systems. J Fam Plann Reprod Health Care. 2014;40:113-116.
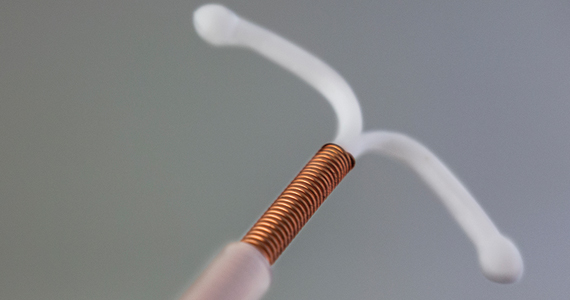
COMMENT & CONTROVERSY
UTIs IN PREGNANCY: MANAGING URETHRITIS, ASYMPTOMATIC BACTERIURIA, CYSTITIS, AND PYELONEPHRITIS
PATRICK DUFF, MD (JANUARY 2022)
Clarification on UTI issues
Regarding the article on urinary tract infections (UTIs) in pregnancy, I have 3 points of clarification. First, in 27 years of practice in which I universally performed screening urine cultures on prenatal patients plus all of those with symptoms, I have seen a total of 2 cultures with Staphylococcus saprophyticus. I see this organism listed in references as a major UTI causative, but is that the case? Second, the clinical case and symptoms discussed are accurate, but costovertebral angle tenderness or fever of 101 °F or higher indicate pyelonephritis and should be treated aggressively. Many of these patients will have nausea and vomiting and will be dehydrated. This decreases urine flow, allowing progressive bacterial growth in renal parenchyma. An initial bolus of intravenous fluids, at least 2 L wide open through a large-bore catheter, rapidly decreases fever, flushes the urinary tract, and improves nausea, headaches, and malaise. Finally, nitrofurantoin is excreted in the urine so rapidly that it does not achieve adequate tissue levels, and it should never be used to treat pyelonephritis or, for that matter, any infection other than uncomplicated cystitis/urethritis.
David Janowitz, MD
Houston, Texas
Dr. Duff responds
I appreciate Dr. Janowitz’s interest and thoughtful comments. The patient presented in the case study has acute cystitis, characterized by a low-grade fever, suprapubic pain, dysuria, frequency, and hesitancy. Patients with pyelonephritis typically have a higher fever and significant costovertebral angle pain and tenderness. I agree completely with Dr. Janowitz’s observations about the seriousness of pyelonephritis in pregnancy. Pyelonephritis is an important cause of preterm labor, bacteremia, and even septic shock. As I point out in the article, women with moderate to severe kidney infections should be hospitalized and treated with intravenous fluids, antipyretics, antiemetics, and intravenous antibiotics. My usual recommendation is ceftriaxone. Intravenous antibiotics should be continued until the patient has been afebrile and asymptomatic for 24 to 48 hours. Once patients improve, they can be transitioned to oral antibiotics to complete a 10-day course of therapy. Again, I agree with Dr. Janowitz’s statement that nitrofurantoin is not an appropriate drug for treatment of pyelonephritis because it does not reach acceptable concentrations in either the blood or the renal parenchyma. Rather, amoxicillin-clavulanate and trimethoprim-sulfamethoxazole are much better choices for oral therapy. However, once the infection is cleared, nitrofurantoin is an excellent agent for suppression of recurrent infection.
Finally, there is no doubt that the principal pathogens that cause UTIs in pregnant women are Escherichia coli, Klebsiella pneumoniae, and Proteus species. However, 3 aerobic Gram-positive cocci do, in fact, cause a small percentage of infections: group B streptococci, enterococci, and Staphylococcus saprophyticus. When the latter bacterium is identified as a single organism in high colony count, particularly in a catheterized urine specimen, it should be considered a true pathogen and not simply a contaminant.
CAN WE RETURN TO THE ABCs OF CRAFTING A MEDICAL RECORD NOTE?
ROBERT L. BARBIERI, MD (OCTOBER 2021)
Another suggestion for reducing note bloat in the EMR
Thank you for picking up a topic that is important for all physicians and one that has been annoying me since the introduction of electronic medical records (EMRs). I like the APSO approach, that works well. My idea for reducing “note bloat” is to eliminate all normal and routine findings and to hide them behind a hyperlink or behind a QR code. This would give you a truly short note and, should you need or want more details, you could always scan the QR code for access to the complete (and bloated) note. I would also recommend hiding all details that do not contribute to the immediate pressing issue at hand (for example, routine depression screening) behind a hyperlink or QR code. The same principle should apply to sending faxes to other physicians’ offices. I “love” receiving a chart an inch thick, only to discover that the whole pile of paper could be reduced to a single page of true information. Too few people speak up about this major time and productivity thief. Thank you!
Matthias Muenzer, MD
Rochester, New Hampshire
Dr. Barbieri responds
I thank Dr. Muenzer for his innovative suggestions for improving medical record notes. We spend many hours per week crafting notes in the medical record. Yet, very little attention is given to the development of best practices for improving the value and effectiveness of our notes for our patients and colleagues.
Uterine incision closure: Is it the culprit in the cesarean scar niche and related complications?

While its etiology remains uncertain, cesarean scar niche (CSN) is well publicized, as are its pathological clinical manifestations. In a future pregnancy, they include cesarean scar pregnancy (CSP), which in turn can lead to placenta accreta spectrum, and possible uterine rupture/dehiscence of a residual thin myometrial layer. CSP refers to the implantation of an early pregnancy on the scar or in the niche at the site of a prior cesarean delivery (CD); it has an incidence of 1 per 1,000 pregnancies. An estimated 52% of CSPs occur after even just one CD.1 CSP has been linked to placenta accreta spectrum and has been shown to be its precursor.2 Both CSP and placenta accreta spectrum can be consequences of CD and share a common histology of villous or placental attachment/invasion into the cesarean scar.3 The incidence of placenta accreta spectrum has risen from about 1 in 4,000 live births in the 1970s to 1 in 2,500 in the 1980s; in 2016, the incidence of placenta accreta spectrum was reported as 1 per 272 live births.4
Placenta accreta spectrum denotes the attachment of the placenta into and through the myometrium,5 and it can result in severe complications, including hemorrhage, hysterectomy, and intensive care treatment. The increasing rate of placenta accreta spectrum parallels the increasing CD rate, which rose from 5.8% in 1970 to 31.9% in 2016.6 Multiple repeat CDs are increasing in frequency as well. At the beginning of the century, placenta accreta spectrum mainly occurred after manual removal of the placenta, uterine curettage, or endometritis. Recently, experts are in agreement that the main determinant of placenta accreta spectrum is the uterine scar and niche formation after a previous CD.5 Larger niches are associated with an increased incidence of uterine rupture or dehiscence in a subsequent pregnancy.7
In the nonpregnant state, such niches are associated with intermenstrual bleeding, pelvic pain, painful intercourse, painful menses, and subfertility, becoming increasingly more severe in women with greater numbers of CDs.8-10 Conception rate with assisted reproductive treatment is notably reduced.11
Understanding its etiology
Monteagudo and colleagues first described a “niche” in 100% of 44 women evaluated for postmenopausal bleeding who had a prior CD.12 CSN has been the subject of well over 3,000 publications over the past 30 years. While the topic generates much interest among researchers, it is garnering little traction among practicing obstetricians. Such “niches,” also referred to as isthmocele, cesarean scar defect, or a diverticulum, was first described in 196113 and later defined on ultrasonography as a hypoechoic triangular-shaped uterine defect outlined by saline instillation sonohysterogram (SIS), reflecting a discontinuation of the myometrium at the site of a previous CD.12 In 2019, a European task force further defined a CSN as an “indentation at the site in the cesarean section scar with a depth of at least 2 mm” and extended the classification to include branches as extensions toward the anterior uterine serosa.14 Using this criterion, sonographic postoperative evaluation after one CD revealed a CSN in 68.9% of women with one single-layer uterine closure and in 73.6% of women after a double-layer closure.15 Larger niche sizes with thinner residual myometrial thickness appeared more frequently when a single-layer closure technique was used, without closure of the peritoneum. Its prevalence varies from 56% to 84%.16,17
Etiology of CSN formation: Our hypotheses
The precise pathophysiology of CSN remains elusive. Speculations attributed niche formation to numerous factors: timing of surgery, cervical incision, incomplete closure of the uterine incision, adhesion formation between the CD scar and the abdominal wall, and inherent maternal conditions which may impair healing, such as smoking, obesity, diabetes, maternal age, and labor status.18-20 Retroflexion of the uterus is reportedly associated with increased incidence and size of the niche, with CSN 50% more likely to develop in women with a retroflexed versus an anteverted uterus.21 We demonstrated the origin of niche formation in real-time from the start to the completion of uterine closure by a video capture of a single-layer closure followed by an immediate SIS of the ex vivo hysterectomized uterus, and histopathologic proof of the presence of endometrial cells defining the “niche.”22 This case exposes the misalignment of the uterine wall, while including the endometrium in the closure (FIGURE 1). Similarly, pathologic studies of hysteroscopy-resected isthmocele ridges of symptomatic women with niche-related subfertility revealed the tissue edges lined by endocervical, endometrial, or isthmic mucosa either combined or isolated in the scar.23 The presence of endometrial/cervical tissue in the myometrial closure has been debated for over a century.24,25
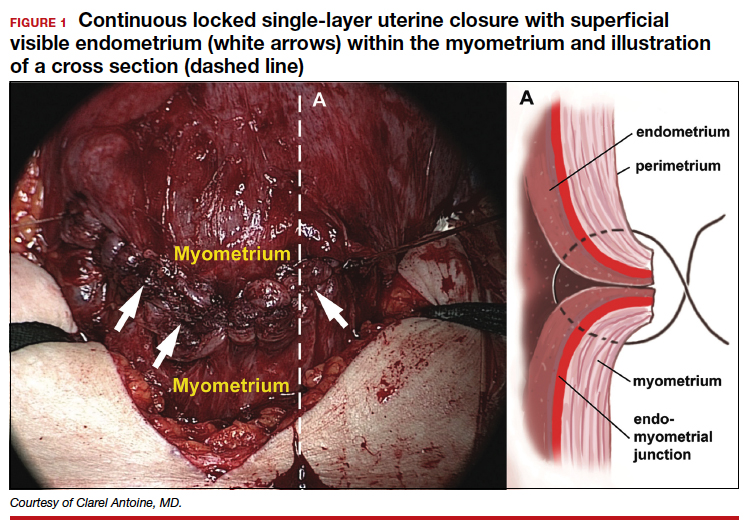
Continue to: Uterine closure techniques...
Uterine closure techniques: Historical perspective
In 1882, Max Sanger introduced a vertical uterine closure of a classical cesarean operation in response to hysterectomy as the contemporaneous alternative to prevent infection, bleeding, and death.24 Dr. Sanger emphasized layer approximation, suturing, and the avoidance of decidua in the first layer (FIGURE 2). This became the teaching of the classical CD until the 1970s. In 1926, Munro Kerr addressed uterine rupture with labor after a classical CD by introducing the lower uterine segment transverse incision. He cautioned to maintain the decidua inside the uterine 2-layer closure of the cavity.25 These pioneers were joined by others to rally for endometrium exclusion while promoting layer approximation. These techniques became universally standard and were taught across teaching medical centers in the United States and abroad until about 50 years ago.
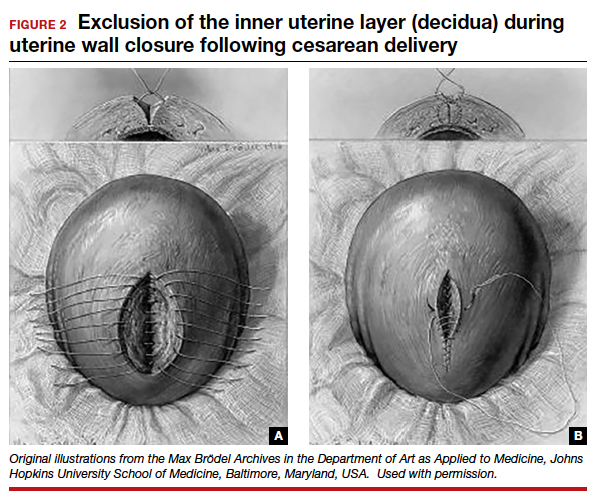
In the 1970s, newer developments brought significant changes to uterine closure techniques. Initiated by Joel-Cohen,26 blunt dissection of the abdominal incision was adapted by Michael Stark, creating what came to be known as the Misgav-Ladach cesarean technique.27 Stark emphasized blunt dissection and introduced single-layer closure. Thereby the exclusion of the endometrium, used for more than 70 years, was abandoned by the present-day single- or double-layer uterine closure in favor of cost and time savings. Systematic reviews and meta-analyses comparing the two contrasting techniques were inconclusive, noting that the niche prevalence and size were similar in both groups. These studies did not take into account the variety of individual techniques or the position of the endometrium in the final closures.28
Endometrium and uterine closure
Our recent study examining uterine scar defect in women after one primary CD by SIS concluded that a specific endometrium-free closure technique (EFCT) (FIGURE 3) is associated with fewer and less severe defects and a thicker residual myometrial thickness when compared with closures with unknown or endometrium inclusion.29 The study found non-specific closure techniques to be 6 times more likely to form a niche of 2-mm deep or greater than the EFCT.

Furthermore, we surveyed the diversity of uterine closures and the location of the endometrium among obstetricians in one institution.30 Presence of endometrium on the surface of the final uterine closure was reported by 20% of respondents (see Figure 1). When asked for their opinion on the impact of CD techniques on placenta accreta spectrum, without available evidence 80% of the survey respondents reported no relationship to techniques, and only 20% suggested an association. This particular study demonstrates that the surgical techniques just described are random, unfettered, and applied without consideration of clinical outcomes.
Our recent retrospective study that spanned 30 years and examined the EFCT—performed anywhere between 3 to 9 consecutive CDs—revealed no abnormal placentation in any subsequent pregnancies.31 This was one of the few clinical studies of the long-term consequences of a uterine closure technique. In this study, the endometrium was excluded during the uterine closure, allowing its free edges to abut and heal. This step avoids scarring the endometrial-myometrial (EM) interface and unintentional inclusion of endometrium in the closed uterine wall. In this context, Jauniaux and colleagues cited the destruction of the EM interface as the main factor for placenta-adherent disorders.32 Sholapurkar and others highlight the need to further examine intrinsic details of uterine closure beyond single- and double-layer techniques to better understand the etiology of cesarean scar formation.19 The search for the pathophysiology of CSN continues to present significant challenges imposed by the variety of currently practiced uterine closures.
Continue to: Focus on prevention...
Research: Focus on prevention
Our research aims to address the endometrium, a specific layer that was the topic of concern in nascent CD techniques, as a renewed and contemporary one. The presence of the endometrium in ectopic locations or its destruction from intrauterine surgeries or infections has been implicated in abnormal placentation.13,24 Our approach, in theory, is to limit the position of the endometrium to its innermost location and avoid its iatrogenic suturing and inclusion into the uterine wall closure. The rationale of sparing the endometrium in a layer-by-layer approximation is to allow for a closer restoration to normal anatomy and physiology than a random “en masse” uterine wall closure would permit. For this reason, the EM junction, the perimetrium, and the serosa must be identified and realigned for a more effective closure that incorporates the entire myometrial thickness. As evidence supports technical impact on the development of uterine scar defect in women after one CD, future studies are needed to evaluate uterine integrity by saline infusion sonohysterography in multiparous women with a prior random closure technique or a prior EFCT.
The potential long-term risks of blunt dissection for opening the uterus have not been studied. There are no physiologic lines in the uterine wall to facilitate a regular-bordered uterine stretch. The tissue stretch, which depends on the individual surgeon’s strength applied during the procedure and patient’s labor status, may result in an irregular tear and a difficult repair. The EFCT technique shows a more optimized risk-benefit ratio for an anatomical repair and is replicable. The safety of uterine layer re-approximation has been demonstrated and can be studied in large populations using strict uniform criteria.
Current and future challenges
Residency training
Most recently, teachers of resident trainees are mostly familiar with blunt dissection, techniques of which are passed on unchallenged from resident to resident. The endometrium and peritoneum are neither identified nor treated as separate layers, thus becoming obsolete as surgical and anatomical landmarks.
Standardization of CD techniques
Front-line obstetricians are persuaded to practice a standardized approach that relies on the benefits of cost related to operating room turnover as well as surgeons’ time savings without consideration of outcomes in subsequent pregnancies. Sholapurkar has warned that “wrong standardization” is far worse than no standardization, worse for the training of junior obstetricians, as it can inhibit critical reasoning about safe surgical techniques that can optimize outcomes of the condition of the lower uterine segment.33
Emergence of cost and time savings in clinical practice
A time-cost savings argument is relatively negligeable in an estimated 40-minute CD. By contrast, deliberate surgical technique and carrying out the appropriate steps for the particular condition at hand to achieve the best outcomes assume more weight.32 Furthermore, this short-term cost benefit is challenged by the comparatively larger costs associated with the diagnosis, the treatment of post-CD adverse consequences (outlined above), as well as the emotional impact on women and their families. Additionally, the emphasis on time savings creates a generation of surgeons fixated with total operative time without consideration of long-term risks and adverse maternal outcomes.
Physician autonomy has led to the unmonitored freedom of obstetricians to choose their own technique for a CD, with some employing the commonly practiced culture of fastest turnaround even in nonurgent circumstances.
Documentation and terminology
Current documenting systems are not detail-oriented enough to assist in a thorough correlation between surgical techniques and outcomes. The use of single- or double-layer closure terminology is insufficient and has proven to be flawed, without describing the handling of the endometrium in terms of its inclusion or exclusion in the closure.
Quality improvement feedback
Long-term post-CD complications are often not reported to the physician or institution involved in the prior CD. In our opinion, some sort of registry would be of value. Perhaps then subsequent CD outcomes could be traced back and reported to the prior institution and surgeon. Feedback is critical to understanding the correlation between techniques and outcomes and more specifically to gathering learning points and using data for quality improvement of future cases.
Patient education
While women continue to have complications following the presently used surgical techniques, they often have expectations not discussed with their obstetricians. Women should be educated and empowered to realize the different approaches to all aspects and consequences of CDs.
Conclusion
The technique of excluding the endometrium in closing the uterine incision appears to reduce subsequent abnormal placentation and diminish the frequency and size of post-CD scar defect. The revival of the endometrium-free closure technique may allow significant change in the postoperative results. Currently, standardization of CD technique is being promoted on the basis of time- and cost-savings rather than clinical outcomes. Simultaneously, inroads are being made to better understand the risks and consequences of CD.
Emerging evidence suggests that a post-CD niche is the result of poor layer approximation as well as inclusion of the endometrium, which prevent healing of the uterine wall and often enables faulty implantation of the fertilized oocyte in the next pregnancy, potentially giving rise to placenta accreta spectrum. The prevalence and size of the defect can be minimized by techniques aimed at restoring the anatomy of the uterine wall and the physiology of the endometrium. Specialized training and education are necessary to stress the importance of anatomical assessment and decision making at the time of uterine closure. ●
- Rotas MA, Haberman S, Levgur M. Cesarean scar ectopic pregnancies: etiology, diagnosis, and management. Obstet Gynecol. 2006;107:1373-1381.
- Timor-Tritsch IE, Monteagudo A, Calì G, et al. Cesarean scar pregnancy is a precursor of morbidly adherent placenta. Ultrasound Obstet Gynecol. 2014;44:346-353. doi:10.1002/ uog.13426.
- Timor-Tritsch IE, Monteagudo A, Cali G, et al. Cesarean scar pregnancy and early placenta accreta share common histology. Ultrasound Obstet Gynecol. 2014;43:383-395. doi: 10.1002/uog.13282.
- Mogos MF, Salemi JL, Ashley M, et al. Recent trends in placenta accreta in the United States and its impact on maternal-fetal morbidity and healthcare-associated costs, 1998-2011. J Matern Fetal Neonatal Med. 2016;29:1077-1082.
- Jauniaux E, Collins S, Burton GJ. Placenta accreta spectrum: pathophysiology and evidence-based anatomy for prenatal ultrasound imaging. Am J Obstet Gynecol. 2018;218:75-87.
- Martin JA, Hamilton BE, Osterman MJK. Births in the United States, 2016. NCHS Data Brief. 2017(287):1-8.
- Vikhareva Osser O, Valentin L. Clinical importance of appearance of cesarean hysterotomy scar at transvaginal ultrasonography in nonpregnant women. Obstet Gynecol. 2011;117:525-532.
- Chen YY, Tsai CC, Kung FT, et al. Association between hysteroscopic findings of previous cesarean delivery scar defects and abnormal uterine bleeding. Taiwanese J Obstet Gynecol. 2019;58:541-544.
- Stegwee SI, Beij A, de Leeuw RA, et al. Niche-related outcomes after caesarean section and quality of life: a focus group study and review of literature. Qual Life Res. 2020;29:1013-1025.
- Vissers J, Hehenkamp W, Lambalk CB, et al. Post-caesarean section niche-related impaired fertility: hypothetical mechanisms. Hum Reprod. 2020;35:1484-1494.
- Vissers J, Sluckin TC, van Driel-Delprat CCR, et al. Reduced pregnancy and live birth rates after in vitro fertilization in women with previous caesarean section: a retrospective cohort study. Hum Reprod. 2020;35:595-604.
- Monteagudo A, Carreno C, Timor-Tritsch IE. Saline infusion sonohysterography in nonpregnant women with previous cesarean delivery: the “niche” in the scar. J Ultrasound Med. 2001;20:1105-1115.
- Poidevin LO. The value of hysterography in the prediction of cesarean section wound defects. Am J Obstet Gynecol. 1961;81:67-71.
- Jordans IPM, de Leeuw RA, Stegwee SI, et al. Sonographic examination of uterine niche in non-pregnant women: a modified Delphi procedure. Ultrasound Obstet Gynecol. 2019;53:107-115.
- Stegwee SI, van der Voet LF, Ben AJ, et al. Effect of single- versus double-layer uterine closure during caesarean section on postmenstrual spotting (2Close): multicentre, double-blind, randomised controlled superiority trial. BJOG. 2021;128:866-878.
- Bij de Vaate AJ, van der Voet LF, Naji O, et al. Prevalence, potential risk factors for development and symptoms related to the presence of uterine niches following cesarean section: systematic review. Ultrasound Obstet Gynecol. 2014;43:372-382.
- van der Voet LF, Bij de Vaate AM, Veersema S, et al. Long-term complications of caesarean section. The niche in the scar: a prospective cohort study on niche prevalence and its relation to abnormal uterine bleeding. BJOG. 2014;121:236-244.
- Vervoort AJ, Uittenbogaard LB, Hehenkamp WJ, et al. Why do niches develop in caesarean uterine scars? Hypotheses on the aetiology of niche development. Hum Reprod. 2015;30:2695-2702.
- Sholapurkar SL. Etiology of cesarean uterine scar defect (niche): detailed critical analysis of hypotheses and prevention strategies and peritoneal closure debate. J Clin Med Res. 2018;10:166-173.
- Kamel R, Eissa T, Sharaf M, et al. Position and integrity of uterine scar are determined by degree of cervical dilatation at time of cesarean section. Ultrasound Obstet Gynecol. 2021;57:466-470.
- Sanders RC, Parsons AK. Anteverted retroflexed uterus: a common consequence of cesarean delivery. AJR Am J Roentgenol. 2014;203:W117-124.
- Antoine C, Pimentel RN, Timor-Tritsch IE, et al. Origin of a post-cesarean delivery niche: diagnosis, pathophysiologic characteristics, and video documentation. J Ultrasound Med. 2021;40:205-208.
- AbdullGaffar B, Almulla A. A histopathologic approach to uterine niche: what to expect and to report in hysteroscopy-resected isthmocele specimens. Int J Surg Pathol. 2021:10668969211039415. doi: 10.1177/10668969211039415.
- Nagy S, Papp Z. Global approach of the cesarean section rates. J Perinatal Med. 2020;49:1-4.
- Kerr JM. The technic of cesarean section, with special reference to the lower uterine segment incision. Am J Obstet Gynecol. 1926;12:729-734.
- Joel-Cohen S. Abdominal and vaginal hysterectomy: new techniques based on time and motion studies. Lippincott Williams & Wilkins; 1977.
- Holmgren G, Sjoholm L, Stark M. The Misgav Ladach method for cesarean section: method description. Acta Obstet Gynecol Scand. 1999;78:615-621.
- Abalos E, Addo V, Brocklehurst P, et al. Caesarean section surgical techniques: 3-year follow-up of the CORONIS fractional, factorial, unmasked, randomised controlled trial. Lancet. 2016;388:62-72.
- Antoine C, Meyer JA, Silverstein JS, et al. The impact of uterine incision closure techniques on post-cesarean delivery niche formation and size: sonohysterographic examination of nonpregnant women. J Ultrasound Med. 2021. doi: 10.1002/ jum.15859.
- Antoine C AJ, Yaghoubian Y, Harary J. Variations in uterine closure technique: an institutional survey of obstetricians and implications for patient counseling and prevention of adverse sequelae [Abstract]. 2021.
- Antoine C, Pimentel RN, Reece EA, et al. Endometrium-free uterine closure technique and abnormal placental implantation in subsequent pregnancies. J Matern-Fetal Neonatal Med. 2019:1-9.
- Jauniaux E, Jurkovic D. Placenta accreta: pathogenesis of a 20th century iatrogenic uterine disease. Placenta. 2012;33:244-251.
- Sholapurkar S. Review of unsafe changes in the practice of cesarean section with analysis of flaws in the interpretation of statistics and the evidence. Surgical Case Reports. 2021;4:2-6.
While its etiology remains uncertain, cesarean scar niche (CSN) is well publicized, as are its pathological clinical manifestations. In a future pregnancy, they include cesarean scar pregnancy (CSP), which in turn can lead to placenta accreta spectrum, and possible uterine rupture/dehiscence of a residual thin myometrial layer. CSP refers to the implantation of an early pregnancy on the scar or in the niche at the site of a prior cesarean delivery (CD); it has an incidence of 1 per 1,000 pregnancies. An estimated 52% of CSPs occur after even just one CD.1 CSP has been linked to placenta accreta spectrum and has been shown to be its precursor.2 Both CSP and placenta accreta spectrum can be consequences of CD and share a common histology of villous or placental attachment/invasion into the cesarean scar.3 The incidence of placenta accreta spectrum has risen from about 1 in 4,000 live births in the 1970s to 1 in 2,500 in the 1980s; in 2016, the incidence of placenta accreta spectrum was reported as 1 per 272 live births.4
Placenta accreta spectrum denotes the attachment of the placenta into and through the myometrium,5 and it can result in severe complications, including hemorrhage, hysterectomy, and intensive care treatment. The increasing rate of placenta accreta spectrum parallels the increasing CD rate, which rose from 5.8% in 1970 to 31.9% in 2016.6 Multiple repeat CDs are increasing in frequency as well. At the beginning of the century, placenta accreta spectrum mainly occurred after manual removal of the placenta, uterine curettage, or endometritis. Recently, experts are in agreement that the main determinant of placenta accreta spectrum is the uterine scar and niche formation after a previous CD.5 Larger niches are associated with an increased incidence of uterine rupture or dehiscence in a subsequent pregnancy.7
In the nonpregnant state, such niches are associated with intermenstrual bleeding, pelvic pain, painful intercourse, painful menses, and subfertility, becoming increasingly more severe in women with greater numbers of CDs.8-10 Conception rate with assisted reproductive treatment is notably reduced.11
Understanding its etiology
Monteagudo and colleagues first described a “niche” in 100% of 44 women evaluated for postmenopausal bleeding who had a prior CD.12 CSN has been the subject of well over 3,000 publications over the past 30 years. While the topic generates much interest among researchers, it is garnering little traction among practicing obstetricians. Such “niches,” also referred to as isthmocele, cesarean scar defect, or a diverticulum, was first described in 196113 and later defined on ultrasonography as a hypoechoic triangular-shaped uterine defect outlined by saline instillation sonohysterogram (SIS), reflecting a discontinuation of the myometrium at the site of a previous CD.12 In 2019, a European task force further defined a CSN as an “indentation at the site in the cesarean section scar with a depth of at least 2 mm” and extended the classification to include branches as extensions toward the anterior uterine serosa.14 Using this criterion, sonographic postoperative evaluation after one CD revealed a CSN in 68.9% of women with one single-layer uterine closure and in 73.6% of women after a double-layer closure.15 Larger niche sizes with thinner residual myometrial thickness appeared more frequently when a single-layer closure technique was used, without closure of the peritoneum. Its prevalence varies from 56% to 84%.16,17
Etiology of CSN formation: Our hypotheses
The precise pathophysiology of CSN remains elusive. Speculations attributed niche formation to numerous factors: timing of surgery, cervical incision, incomplete closure of the uterine incision, adhesion formation between the CD scar and the abdominal wall, and inherent maternal conditions which may impair healing, such as smoking, obesity, diabetes, maternal age, and labor status.18-20 Retroflexion of the uterus is reportedly associated with increased incidence and size of the niche, with CSN 50% more likely to develop in women with a retroflexed versus an anteverted uterus.21 We demonstrated the origin of niche formation in real-time from the start to the completion of uterine closure by a video capture of a single-layer closure followed by an immediate SIS of the ex vivo hysterectomized uterus, and histopathologic proof of the presence of endometrial cells defining the “niche.”22 This case exposes the misalignment of the uterine wall, while including the endometrium in the closure (FIGURE 1). Similarly, pathologic studies of hysteroscopy-resected isthmocele ridges of symptomatic women with niche-related subfertility revealed the tissue edges lined by endocervical, endometrial, or isthmic mucosa either combined or isolated in the scar.23 The presence of endometrial/cervical tissue in the myometrial closure has been debated for over a century.24,25
Continue to: Uterine closure techniques...
Uterine closure techniques: Historical perspective
In 1882, Max Sanger introduced a vertical uterine closure of a classical cesarean operation in response to hysterectomy as the contemporaneous alternative to prevent infection, bleeding, and death.24 Dr. Sanger emphasized layer approximation, suturing, and the avoidance of decidua in the first layer (FIGURE 2). This became the teaching of the classical CD until the 1970s. In 1926, Munro Kerr addressed uterine rupture with labor after a classical CD by introducing the lower uterine segment transverse incision. He cautioned to maintain the decidua inside the uterine 2-layer closure of the cavity.25 These pioneers were joined by others to rally for endometrium exclusion while promoting layer approximation. These techniques became universally standard and were taught across teaching medical centers in the United States and abroad until about 50 years ago.
In the 1970s, newer developments brought significant changes to uterine closure techniques. Initiated by Joel-Cohen,26 blunt dissection of the abdominal incision was adapted by Michael Stark, creating what came to be known as the Misgav-Ladach cesarean technique.27 Stark emphasized blunt dissection and introduced single-layer closure. Thereby the exclusion of the endometrium, used for more than 70 years, was abandoned by the present-day single- or double-layer uterine closure in favor of cost and time savings. Systematic reviews and meta-analyses comparing the two contrasting techniques were inconclusive, noting that the niche prevalence and size were similar in both groups. These studies did not take into account the variety of individual techniques or the position of the endometrium in the final closures.28
Endometrium and uterine closure
Our recent study examining uterine scar defect in women after one primary CD by SIS concluded that a specific endometrium-free closure technique (EFCT) (FIGURE 3) is associated with fewer and less severe defects and a thicker residual myometrial thickness when compared with closures with unknown or endometrium inclusion.29 The study found non-specific closure techniques to be 6 times more likely to form a niche of 2-mm deep or greater than the EFCT.
Furthermore, we surveyed the diversity of uterine closures and the location of the endometrium among obstetricians in one institution.30 Presence of endometrium on the surface of the final uterine closure was reported by 20% of respondents (see Figure 1). When asked for their opinion on the impact of CD techniques on placenta accreta spectrum, without available evidence 80% of the survey respondents reported no relationship to techniques, and only 20% suggested an association. This particular study demonstrates that the surgical techniques just described are random, unfettered, and applied without consideration of clinical outcomes.
Our recent retrospective study that spanned 30 years and examined the EFCT—performed anywhere between 3 to 9 consecutive CDs—revealed no abnormal placentation in any subsequent pregnancies.31 This was one of the few clinical studies of the long-term consequences of a uterine closure technique. In this study, the endometrium was excluded during the uterine closure, allowing its free edges to abut and heal. This step avoids scarring the endometrial-myometrial (EM) interface and unintentional inclusion of endometrium in the closed uterine wall. In this context, Jauniaux and colleagues cited the destruction of the EM interface as the main factor for placenta-adherent disorders.32 Sholapurkar and others highlight the need to further examine intrinsic details of uterine closure beyond single- and double-layer techniques to better understand the etiology of cesarean scar formation.19 The search for the pathophysiology of CSN continues to present significant challenges imposed by the variety of currently practiced uterine closures.
Continue to: Focus on prevention...
Research: Focus on prevention
Our research aims to address the endometrium, a specific layer that was the topic of concern in nascent CD techniques, as a renewed and contemporary one. The presence of the endometrium in ectopic locations or its destruction from intrauterine surgeries or infections has been implicated in abnormal placentation.13,24 Our approach, in theory, is to limit the position of the endometrium to its innermost location and avoid its iatrogenic suturing and inclusion into the uterine wall closure. The rationale of sparing the endometrium in a layer-by-layer approximation is to allow for a closer restoration to normal anatomy and physiology than a random “en masse” uterine wall closure would permit. For this reason, the EM junction, the perimetrium, and the serosa must be identified and realigned for a more effective closure that incorporates the entire myometrial thickness. As evidence supports technical impact on the development of uterine scar defect in women after one CD, future studies are needed to evaluate uterine integrity by saline infusion sonohysterography in multiparous women with a prior random closure technique or a prior EFCT.
The potential long-term risks of blunt dissection for opening the uterus have not been studied. There are no physiologic lines in the uterine wall to facilitate a regular-bordered uterine stretch. The tissue stretch, which depends on the individual surgeon’s strength applied during the procedure and patient’s labor status, may result in an irregular tear and a difficult repair. The EFCT technique shows a more optimized risk-benefit ratio for an anatomical repair and is replicable. The safety of uterine layer re-approximation has been demonstrated and can be studied in large populations using strict uniform criteria.
Current and future challenges
Residency training
Most recently, teachers of resident trainees are mostly familiar with blunt dissection, techniques of which are passed on unchallenged from resident to resident. The endometrium and peritoneum are neither identified nor treated as separate layers, thus becoming obsolete as surgical and anatomical landmarks.
Standardization of CD techniques
Front-line obstetricians are persuaded to practice a standardized approach that relies on the benefits of cost related to operating room turnover as well as surgeons’ time savings without consideration of outcomes in subsequent pregnancies. Sholapurkar has warned that “wrong standardization” is far worse than no standardization, worse for the training of junior obstetricians, as it can inhibit critical reasoning about safe surgical techniques that can optimize outcomes of the condition of the lower uterine segment.33
Emergence of cost and time savings in clinical practice
A time-cost savings argument is relatively negligeable in an estimated 40-minute CD. By contrast, deliberate surgical technique and carrying out the appropriate steps for the particular condition at hand to achieve the best outcomes assume more weight.32 Furthermore, this short-term cost benefit is challenged by the comparatively larger costs associated with the diagnosis, the treatment of post-CD adverse consequences (outlined above), as well as the emotional impact on women and their families. Additionally, the emphasis on time savings creates a generation of surgeons fixated with total operative time without consideration of long-term risks and adverse maternal outcomes.
Physician autonomy has led to the unmonitored freedom of obstetricians to choose their own technique for a CD, with some employing the commonly practiced culture of fastest turnaround even in nonurgent circumstances.
Documentation and terminology
Current documenting systems are not detail-oriented enough to assist in a thorough correlation between surgical techniques and outcomes. The use of single- or double-layer closure terminology is insufficient and has proven to be flawed, without describing the handling of the endometrium in terms of its inclusion or exclusion in the closure.
Quality improvement feedback
Long-term post-CD complications are often not reported to the physician or institution involved in the prior CD. In our opinion, some sort of registry would be of value. Perhaps then subsequent CD outcomes could be traced back and reported to the prior institution and surgeon. Feedback is critical to understanding the correlation between techniques and outcomes and more specifically to gathering learning points and using data for quality improvement of future cases.
Patient education
While women continue to have complications following the presently used surgical techniques, they often have expectations not discussed with their obstetricians. Women should be educated and empowered to realize the different approaches to all aspects and consequences of CDs.
Conclusion
The technique of excluding the endometrium in closing the uterine incision appears to reduce subsequent abnormal placentation and diminish the frequency and size of post-CD scar defect. The revival of the endometrium-free closure technique may allow significant change in the postoperative results. Currently, standardization of CD technique is being promoted on the basis of time- and cost-savings rather than clinical outcomes. Simultaneously, inroads are being made to better understand the risks and consequences of CD.
Emerging evidence suggests that a post-CD niche is the result of poor layer approximation as well as inclusion of the endometrium, which prevent healing of the uterine wall and often enables faulty implantation of the fertilized oocyte in the next pregnancy, potentially giving rise to placenta accreta spectrum. The prevalence and size of the defect can be minimized by techniques aimed at restoring the anatomy of the uterine wall and the physiology of the endometrium. Specialized training and education are necessary to stress the importance of anatomical assessment and decision making at the time of uterine closure. ●
- Rotas MA, Haberman S, Levgur M. Cesarean scar ectopic pregnancies: etiology, diagnosis, and management. Obstet Gynecol. 2006;107:1373-1381.
- Timor-Tritsch IE, Monteagudo A, Calì G, et al. Cesarean scar pregnancy is a precursor of morbidly adherent placenta. Ultrasound Obstet Gynecol. 2014;44:346-353. doi:10.1002/ uog.13426.
- Timor-Tritsch IE, Monteagudo A, Cali G, et al. Cesarean scar pregnancy and early placenta accreta share common histology. Ultrasound Obstet Gynecol. 2014;43:383-395. doi: 10.1002/uog.13282.
- Mogos MF, Salemi JL, Ashley M, et al. Recent trends in placenta accreta in the United States and its impact on maternal-fetal morbidity and healthcare-associated costs, 1998-2011. J Matern Fetal Neonatal Med. 2016;29:1077-1082.
- Jauniaux E, Collins S, Burton GJ. Placenta accreta spectrum: pathophysiology and evidence-based anatomy for prenatal ultrasound imaging. Am J Obstet Gynecol. 2018;218:75-87.
- Martin JA, Hamilton BE, Osterman MJK. Births in the United States, 2016. NCHS Data Brief. 2017(287):1-8.
- Vikhareva Osser O, Valentin L. Clinical importance of appearance of cesarean hysterotomy scar at transvaginal ultrasonography in nonpregnant women. Obstet Gynecol. 2011;117:525-532.
- Chen YY, Tsai CC, Kung FT, et al. Association between hysteroscopic findings of previous cesarean delivery scar defects and abnormal uterine bleeding. Taiwanese J Obstet Gynecol. 2019;58:541-544.
- Stegwee SI, Beij A, de Leeuw RA, et al. Niche-related outcomes after caesarean section and quality of life: a focus group study and review of literature. Qual Life Res. 2020;29:1013-1025.
- Vissers J, Hehenkamp W, Lambalk CB, et al. Post-caesarean section niche-related impaired fertility: hypothetical mechanisms. Hum Reprod. 2020;35:1484-1494.
- Vissers J, Sluckin TC, van Driel-Delprat CCR, et al. Reduced pregnancy and live birth rates after in vitro fertilization in women with previous caesarean section: a retrospective cohort study. Hum Reprod. 2020;35:595-604.
- Monteagudo A, Carreno C, Timor-Tritsch IE. Saline infusion sonohysterography in nonpregnant women with previous cesarean delivery: the “niche” in the scar. J Ultrasound Med. 2001;20:1105-1115.
- Poidevin LO. The value of hysterography in the prediction of cesarean section wound defects. Am J Obstet Gynecol. 1961;81:67-71.
- Jordans IPM, de Leeuw RA, Stegwee SI, et al. Sonographic examination of uterine niche in non-pregnant women: a modified Delphi procedure. Ultrasound Obstet Gynecol. 2019;53:107-115.
- Stegwee SI, van der Voet LF, Ben AJ, et al. Effect of single- versus double-layer uterine closure during caesarean section on postmenstrual spotting (2Close): multicentre, double-blind, randomised controlled superiority trial. BJOG. 2021;128:866-878.
- Bij de Vaate AJ, van der Voet LF, Naji O, et al. Prevalence, potential risk factors for development and symptoms related to the presence of uterine niches following cesarean section: systematic review. Ultrasound Obstet Gynecol. 2014;43:372-382.
- van der Voet LF, Bij de Vaate AM, Veersema S, et al. Long-term complications of caesarean section. The niche in the scar: a prospective cohort study on niche prevalence and its relation to abnormal uterine bleeding. BJOG. 2014;121:236-244.
- Vervoort AJ, Uittenbogaard LB, Hehenkamp WJ, et al. Why do niches develop in caesarean uterine scars? Hypotheses on the aetiology of niche development. Hum Reprod. 2015;30:2695-2702.
- Sholapurkar SL. Etiology of cesarean uterine scar defect (niche): detailed critical analysis of hypotheses and prevention strategies and peritoneal closure debate. J Clin Med Res. 2018;10:166-173.
- Kamel R, Eissa T, Sharaf M, et al. Position and integrity of uterine scar are determined by degree of cervical dilatation at time of cesarean section. Ultrasound Obstet Gynecol. 2021;57:466-470.
- Sanders RC, Parsons AK. Anteverted retroflexed uterus: a common consequence of cesarean delivery. AJR Am J Roentgenol. 2014;203:W117-124.
- Antoine C, Pimentel RN, Timor-Tritsch IE, et al. Origin of a post-cesarean delivery niche: diagnosis, pathophysiologic characteristics, and video documentation. J Ultrasound Med. 2021;40:205-208.
- AbdullGaffar B, Almulla A. A histopathologic approach to uterine niche: what to expect and to report in hysteroscopy-resected isthmocele specimens. Int J Surg Pathol. 2021:10668969211039415. doi: 10.1177/10668969211039415.
- Nagy S, Papp Z. Global approach of the cesarean section rates. J Perinatal Med. 2020;49:1-4.
- Kerr JM. The technic of cesarean section, with special reference to the lower uterine segment incision. Am J Obstet Gynecol. 1926;12:729-734.
- Joel-Cohen S. Abdominal and vaginal hysterectomy: new techniques based on time and motion studies. Lippincott Williams & Wilkins; 1977.
- Holmgren G, Sjoholm L, Stark M. The Misgav Ladach method for cesarean section: method description. Acta Obstet Gynecol Scand. 1999;78:615-621.
- Abalos E, Addo V, Brocklehurst P, et al. Caesarean section surgical techniques: 3-year follow-up of the CORONIS fractional, factorial, unmasked, randomised controlled trial. Lancet. 2016;388:62-72.
- Antoine C, Meyer JA, Silverstein JS, et al. The impact of uterine incision closure techniques on post-cesarean delivery niche formation and size: sonohysterographic examination of nonpregnant women. J Ultrasound Med. 2021. doi: 10.1002/ jum.15859.
- Antoine C AJ, Yaghoubian Y, Harary J. Variations in uterine closure technique: an institutional survey of obstetricians and implications for patient counseling and prevention of adverse sequelae [Abstract]. 2021.
- Antoine C, Pimentel RN, Reece EA, et al. Endometrium-free uterine closure technique and abnormal placental implantation in subsequent pregnancies. J Matern-Fetal Neonatal Med. 2019:1-9.
- Jauniaux E, Jurkovic D. Placenta accreta: pathogenesis of a 20th century iatrogenic uterine disease. Placenta. 2012;33:244-251.
- Sholapurkar S. Review of unsafe changes in the practice of cesarean section with analysis of flaws in the interpretation of statistics and the evidence. Surgical Case Reports. 2021;4:2-6.
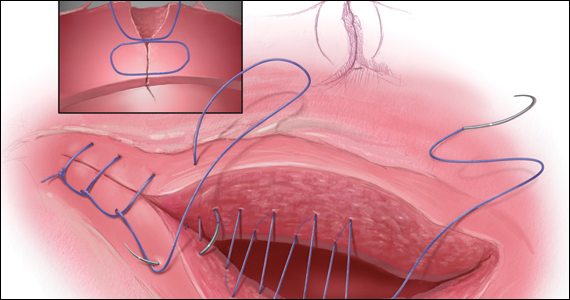
About 19% of COVID-19 headaches become chronic
Approximately one in five patients who presented with headache during the acute phase of COVID-19 developed chronic daily headache, according to a study published in Cephalalgia. The greater the headache’s intensity during the acute phase, the greater the likelihood that it would persist.
The research, carried out by members of the Headache Study Group of the Spanish Society of Neurology, evaluated the evolution of headache in more than 900 Spanish patients. Because they found that headache intensity during the acute phase was associated with a more prolonged duration of headache, the team stressed the importance of promptly evaluating patients who have had COVID-19 and who then experience persistent headache.
Long-term evolution unknown
Headache is a common symptom of COVID-19, but its long-term evolution remains unknown. The objective of this study was to evaluate the long-term duration of headache in patients who presented with this symptom during the acute phase of the disease.
Recruitment for this multicenter study took place in March and April 2020. The 905 patients who were enrolled came from six level 3 hospitals in Spain. All completed 9 months of neurologic follow-up.
Their median age was 51 years, 66.5% were women, and more than half (52.7%) had a history of primary headache. About half of the patients required hospitalization (50.5%); the rest were treated as outpatients. The most common headache phenotype was holocranial (67.8%) of severe intensity (50.6%).
Persistent headache common
In the 96.6% cases for which data were available, the median duration of headache was 14 days. The headache persisted at 1 month in 31.1% of patients, at 2 months in 21.5%, at 3 months in 19%, at 6 months in 16.8%, and at 9 months in 16.0%.
“The median duration of COVID-19 headache is around 2 weeks,” David García Azorín, MD, PhD, a member of the Spanish Society of Neurology and one of the coauthors of the study, said in an interview. “However, almost 20% of patients experience it for longer than that. When still present at 2 months, the headache is more likely to follow a chronic daily pattern.” Dr. García Azorín is a neurologist and clinical researcher at the headache unit of the Hospital Clínico Universitario in Valladolid, Spain.
“So, if the headache isn’t letting up, it’s important to make the most of that window of opportunity and provide treatment in that period of 6-12 weeks,” he continued. “To do this, the best option is to carry out preventive treatment so that the patient will have a better chance of recovering.”
Study participants whose headache persisted at 9 months were older and were mostly women. They were less likely to have had pneumonia or to have experienced stabbing pain, photophobia, or phonophobia. They reported that the headache got worse when they engaged in physical activity but less frequently manifested as a throbbing headache.
Secondary tension headaches
On the other hand, Jaime Rodríguez Vico, MD, head of the headache unit at the Jiménez Díaz Foundation Hospital in Madrid, said in an interview that, according to his case studies, the most striking characteristics of post–COVID-19 headaches “in general are secondary, with similarities to tension headaches that patients are able to differentiate from other clinical types of headache. In patients with migraine, very often we see that we’re dealing with a trigger. In other words, more migraines – and more intense ones at that – are brought about.”
He added: “Generally, post–COVID-19 headache usually lasts 1-2 weeks, but we have cases of it lasting several months and even over a year with persistent daily headache. These more persistent cases are probably connected to another type of pathology that makes them more susceptible to becoming chronic, something that occurs in another type of primary headache known as new daily persistent headache.”
Primary headache exacerbation
Dr. García Azorín pointed out that it’s not uncommon that among people who already have primary headache, their condition worsens after they become infected with SARS-CoV-2. However, many people differentiate the headache associated with the infection from their usual headache because after becoming infected, their headache is predominantly frontal, oppressive, and chronic.
“Having a prior history of headache is one of the factors that can increase the likelihood that a headache experienced while suffering from COVID-19 will become chronic,” he noted.
This study also found that, more often than not, patients with persistent headache at 9 months had migraine-like pain.
As for headaches in these patients beyond 9 months, “based on our research, the evolution is quite variable,” said Dr. Rodríguez Vico. “Our unit’s numbers are skewed due to the high number of migraine cases that we follow, and therefore our high volume of migraine patients who’ve gotten worse. The same thing happens with COVID-19 vaccines. Migraine is a polygenic disorder with multiple variants and a pathophysiology that we are just beginning to describe. This is why one patient is completely different from another. It’s a real challenge.”
Infections are a common cause of acute and chronic headache. The persistence of a headache after an infection may be caused by the infection becoming chronic, as happens in some types of chronic meningitis, such as tuberculous meningitis. It may also be caused by the persistence of a certain response and activation of the immune system or to the uncovering or worsening of a primary headache coincident with the infection, added Dr. García Azorín.
“Likewise, there are other people who have a biological predisposition to headache as a multifactorial disorder and polygenic disorder, such that a particular stimulus – from trauma or an infection to alcohol consumption – can cause them to develop a headache very similar to a migraine,” he said.
Providing prognosis and treatment
Certain factors can give an idea of how long the headache might last. The study’s univariate analysis showed that age, female sex, headache intensity, pressure-like quality, the presence of photophobia/phonophobia, and worsening with physical activity were associated with headache of longer duration. But in the multivariate analysis, only headache intensity during the acute phase remained statistically significant (hazard ratio, 0.655; 95% confidence interval, 0.582-0.737; P < .001).
When asked whether they planned to continue the study, Dr. García Azorín commented, “The main questions that have arisen from this study have been, above all: ‘Why does this headache happen?’ and ‘How can it be treated or avoided?’ To answer them, we’re looking into pain: which factors could predispose a person to it and which changes may be associated with its presence.”
In addition, different treatments that may improve patient outcomes are being evaluated, because to date, treatment has been empirical and based on the predominant pain phenotype.
In any case, most doctors currently treat post–COVID-19 headache on the basis of how similar the symptoms are to those of other primary headaches. “Given the impact that headache has on patients’ quality of life, there’s a pressing need for controlled studies on possible treatments and their effectiveness,” noted Patricia Pozo Rosich, MD, PhD, one of the coauthors of the study.
“We at the Spanish Society of Neurology truly believe that if these patients were to have this symptom correctly addressed from the start, they could avoid many of the problems that arise in the situation becoming chronic,” she concluded.
Dr. García Azorín and Dr. Rodríguez Vico disclosed no relevant financial relationships.
A version of this article first appeared on Medscape.com.
FROM CEPHALALGIA
FDA to decide by June on future of COVID vaccines
April 6.
But members of the panel also acknowledged that it will be an uphill battle to reach that goal, especially given how quickly the virus continues to change.
The members of the Vaccines and Related Biological Products Advisory Committee said they want to find the balance that makes sure Americans are protected against severe illness and death but doesn’t wear them out with constant recommendations for boosters.
“We don’t feel comfortable with multiple boosters every 8 weeks,” said committee chairman Arnold Monto, MD, professor emeritus of public health at the University of Michigan, Ann Arbor. “We’d love to see an annual vaccination similar to influenza but realize that the evolution of the virus will dictate how we respond in terms of additional vaccine doses.”
The virus itself will dictate vaccination plans, he said.
The government must also keep its focus on convincing Americans who haven’t been vaccinated to join the club, said committee member Henry H. Bernstein, DO, given that “it seems quite obvious that those who are vaccinated do better than those who aren’t vaccinated.”
The government should clearly communicate to the public the goals of vaccination, he said.
“I would suggest that our overall aim is to prevent severe disease, hospitalization, and death more than just infection prevention,” said Dr. Bernstein, professor of pediatrics at Hofstra University, Hempstead, N.Y.
The FDA called the meeting of its advisers to discuss overall booster and vaccine strategy, even though it already authorized a fourth dose of the Pfizer and Moderna vaccines for certain immune compromised adults and for everyone over age 50.
Early in the all-day meeting, temporary committee member James Hildreth, MD, the president of Meharry Medical College, Nashville, Tenn., asked why that authorization was given without the panel’s input. Peter Marks, MD, the director of FDA’s Center for Biologics Evaluation and Research, said the decision was based on data from the United Kingdom and Israel that suggested immunity from a third shot was already waning.
Dr. Marks later said the fourth dose was “authorized as a stopgap measure until we could get something else in place,” because the aim was to protect older Americans who had died at a higher rate than younger individuals.
“I think we’re very much on board that we simply can’t be boosting people as frequently as we are,” said Dr. Marks.
Not enough information to make broader plan
The meeting was meant to be a larger conversation about how to keep pace with the evolving virus and to set up a vaccine selection and development process to better and more quickly respond to changes, such as new variants.
But committee members said they felt stymied by a lack of information. They wanted more data from vaccine manufacturers’ clinical trials. And they noted that so far, there’s no objective, reliable lab-based measurement of COVID-19 vaccine effectiveness – known as a correlate of immunity. Instead, public health officials have looked at rates of hospitalizations and deaths to measure whether the vaccine is still offering protection.
“The question is, what is insufficient protection?” asked H. Cody Meissner, MD, director of pediatric infectious disease at Tufts Medical Center in Boston. “At what point will we say the vaccine isn’t working well enough?”
Centers for Disease Control and Prevention officials presented data showing that a third shot has been more effective than a two-shot regimen in preventing serious disease and death, and that the three shots were significantly more protective than being unvaccinated.
In February, as the Omicron variant continued to rage, unvaccinated Americans aged 5 years and older had an almost three times higher risk of testing positive, and nine times higher risk of dying, compared with those who were considered fully vaccinated, said Heather Scobie, PhD, MPH, a member of the CDC’s COVID-19 Emergency Response team.
But only 98 million Americans – about half of those aged 12 years or older – have received a third dose, Dr. Scobie said.
It’s also still not clear how much more protection a fourth shot adds, or how long it will last. The committee heard data on a just-published study of a fourth dose of the Pfizer vaccine given to some 600,000 Israelis during the Omicron wave from January to March. The rate of severe COVID-19 was 3.5 times lower in the group that received a fourth dose, compared with those who had gotten only three shots, and protection lasted for at least 12 weeks.
Still, study authors said, any protection against infection itself was “short lived.”
More like flu vaccine?
The advisers discussed the possibility of making COVID-19 vaccine development similar to the process for the flu vaccine but acknowledged many difficulties.
The flu predictably hits during the winter in each hemisphere and a global surveillance network helps the World Health Organization decide on the vaccine strains each year. Then each nation’s regulatory and public health officials choose the strains for their shot and vaccine makers begin what is typically a 6-month-long manufacturing process.
COVID outbreaks have happened during all seasons and new variants haven’t always hit every country in a similar fashion. The COVID virus has mutated at five times the speed of the flu virus – producing a new dominant strain in a year, compared with the 3-5 years it takes for the flu virus to do so, said Trevor Bedford, PhD, a professor in the vaccine and infectious disease division at the Fred Hutchinson Cancer Research Center in Seattle.
Global COVID surveillance is patchy and the WHO has not yet created a program to help select strains for a COVID-19 vaccine but is working on a process. Currently, vaccine makers seem to be driving vaccine strain selection, said panelist Paul Offit, MD, professor of paediatrics at Children’s Hospital of Philadelphia. “I feel like to some extent the companies dictate the conversation. It shouldn’t come from them. It should come from us.”
“The important thing is that the public understands how complex this is,” said temporary committee member Oveta A. Fuller, PhD, associate professor of microbiology and immunology at the University of Michigan. “We didn’t get to understand influenza in 2 years. It’s taken years to get an imperfect but useful process to deal with flu.”
A version of this article first appeared on WebMD.com.
Preterm C-sections, induced deliveries dropped during COVID-19 pandemic
Premature births from cesarean (C-section) and induced deliveries dropped abruptly by 6.5% from the projected number in the first month of the COVID-19 pandemic and stayed at the lower rate consistently throughout the year, researchers have found.
Results of the study, led by Daniel Dench, PhD, assistant professor at the Georgia Institute of Technology School of Economics in Atlanta, were published online in Pediatrics.

The authors say their findings help answer the question of whether numbers of preterm (less than 37 weeks gestation) C-sections and induced deliveries would change if women didn’t see their physicians during pregnancy as often, especially in person, and raise the question of whether some birth interventions by physicians may not be necessary. The pandemic gave researchers a natural, ethical way to study the question.
The researchers found that in March 2020 – the start of business closures and stay-at-home orders around the country – preterm births from C-sections or induced deliveries immediately fell from the forecast number for the month by 0.4 percentage points. For the rest of 2020, the number remained on average 0.35 percentage points below the numbers predicted.
That means 350 fewer preterm C-sections and induced deliveries per 100,000 live births, or 10,000 fewer overall, the authors said.
Dr. Dench told this publication the numbers for those births had been steady from January 2010 to February 2020, but the pattern “diverges from this trend very clearly beginning exactly in March 2020 and does not return to trend by December 2020.”
Meanwhile, during the study period, the number of full-term cesarean and induced deliveries stayed steady and started to increase slightly in 2020. Researchers also adjusted for seasonality as, for example, preterm births are higher on average in February than in March.
So far, Dr. Dench said in a press release, it’s not clear whether the lower numbers mean physicians didn’t deliver babies that ended up surviving in the womb anyway or if they missed some that would die in the womb without intervention.
To better understand those implications, Dr. Dench says he is turning to fetal death records for March-December 2020 and he said he expects to have those results analyzed by the end of the year.
If there was no change in fetal deaths at the same time as the drop in preterm births, Dr. Dench said, that could point to physician interventions that may not have been necessary.
Mya R. Zapata, MD, an obstetrician-gynecologist with UCLA Health, who was not involved with the study, told this publication that checking the fetal deaths is a good start and an objective outcome in answering the question, but she points out there are other outcomes that will take a deeper analysis, such as whether there are differences later in developmental outcomes after fewer physician visits.
“It’s always a good question for health care,” she said, “are we doing more than we need to?”
Dr. Zapata is the obstetrics service chief for UCLA’s labor and delivery unit and was an integral part of decision-making as to what services were essential and for which patients. She said the fewer visits and fewer ultrasounds the researchers describe fit with what ob.gyns. at UCLA experienced as the pandemic hit.
“We really tried to hone in on people who were at highest risk for an adverse outcome,” she said. “I still have the question of whether there were things we missed in low-risk people. It will take time to get the entire answer. But it does make us reflect that perhaps less intervention could be better for patients and easier. It’s our job in medicine to keep asking the question of what is essential and safe and not just continue with current practice because that’s what we’ve always done.”
The amount of data gave the researchers an unusual view. They studied 38,891,271 singleton births in the United States from 2010 to 2020 with data from the National Center for Health Statistics.
“If you look at 1,000 births in a single hospital, or even at 30,000 births across a hospital system, you wouldn’t be able to see the drop as clearly,” Dr. Dench said. “The drop we detected is a huge change, but you might miss it in a small sample.”
The researchers acknowledge a limitation of the study is that half of all preterm C-sections and induced deliveries happen because of a ruptured membrane, a spontaneous cause. Those instances can’t be distinguished from the ones caused by doctors’ interventions in this study.
“Still, these findings are significant because the causes for preterm births are not always known,” the authors wrote in the press release.
The study authors and Dr. Zapata reported no relevant financial relationships.
Premature births from cesarean (C-section) and induced deliveries dropped abruptly by 6.5% from the projected number in the first month of the COVID-19 pandemic and stayed at the lower rate consistently throughout the year, researchers have found.
Results of the study, led by Daniel Dench, PhD, assistant professor at the Georgia Institute of Technology School of Economics in Atlanta, were published online in Pediatrics.
The authors say their findings help answer the question of whether numbers of preterm (less than 37 weeks gestation) C-sections and induced deliveries would change if women didn’t see their physicians during pregnancy as often, especially in person, and raise the question of whether some birth interventions by physicians may not be necessary. The pandemic gave researchers a natural, ethical way to study the question.
The researchers found that in March 2020 – the start of business closures and stay-at-home orders around the country – preterm births from C-sections or induced deliveries immediately fell from the forecast number for the month by 0.4 percentage points. For the rest of 2020, the number remained on average 0.35 percentage points below the numbers predicted.
That means 350 fewer preterm C-sections and induced deliveries per 100,000 live births, or 10,000 fewer overall, the authors said.
Dr. Dench told this publication the numbers for those births had been steady from January 2010 to February 2020, but the pattern “diverges from this trend very clearly beginning exactly in March 2020 and does not return to trend by December 2020.”
Meanwhile, during the study period, the number of full-term cesarean and induced deliveries stayed steady and started to increase slightly in 2020. Researchers also adjusted for seasonality as, for example, preterm births are higher on average in February than in March.
So far, Dr. Dench said in a press release, it’s not clear whether the lower numbers mean physicians didn’t deliver babies that ended up surviving in the womb anyway or if they missed some that would die in the womb without intervention.
To better understand those implications, Dr. Dench says he is turning to fetal death records for March-December 2020 and he said he expects to have those results analyzed by the end of the year.
If there was no change in fetal deaths at the same time as the drop in preterm births, Dr. Dench said, that could point to physician interventions that may not have been necessary.
Mya R. Zapata, MD, an obstetrician-gynecologist with UCLA Health, who was not involved with the study, told this publication that checking the fetal deaths is a good start and an objective outcome in answering the question, but she points out there are other outcomes that will take a deeper analysis, such as whether there are differences later in developmental outcomes after fewer physician visits.
“It’s always a good question for health care,” she said, “are we doing more than we need to?”
Dr. Zapata is the obstetrics service chief for UCLA’s labor and delivery unit and was an integral part of decision-making as to what services were essential and for which patients. She said the fewer visits and fewer ultrasounds the researchers describe fit with what ob.gyns. at UCLA experienced as the pandemic hit.
“We really tried to hone in on people who were at highest risk for an adverse outcome,” she said. “I still have the question of whether there were things we missed in low-risk people. It will take time to get the entire answer. But it does make us reflect that perhaps less intervention could be better for patients and easier. It’s our job in medicine to keep asking the question of what is essential and safe and not just continue with current practice because that’s what we’ve always done.”
The amount of data gave the researchers an unusual view. They studied 38,891,271 singleton births in the United States from 2010 to 2020 with data from the National Center for Health Statistics.
“If you look at 1,000 births in a single hospital, or even at 30,000 births across a hospital system, you wouldn’t be able to see the drop as clearly,” Dr. Dench said. “The drop we detected is a huge change, but you might miss it in a small sample.”
The researchers acknowledge a limitation of the study is that half of all preterm C-sections and induced deliveries happen because of a ruptured membrane, a spontaneous cause. Those instances can’t be distinguished from the ones caused by doctors’ interventions in this study.
“Still, these findings are significant because the causes for preterm births are not always known,” the authors wrote in the press release.
The study authors and Dr. Zapata reported no relevant financial relationships.
FROM PEDIATRICS
‘Outbid on three houses!’ Doc frustrated by crazy market
After more than a decade of moving because of medical school, residencies, and international fellowships, Abhi Kole, MD, PhD, is ready to put down roots. But he’s learning that buying a house in today’s housing market is easier said than done.
In the past 6 months, Dr. Kole, an internist at Grady Hospital in Atlanta, put in offers on three houses. None resulted in a purchase. Dr. Kole says he’s learned how to be more competitive with each subsequent offer, starting out with a bid significantly above the asking price and waiving his right to an appraisal or financing contingencies.
The experience has been surprising and disappointing.
“I knew the market was bad when I started looking and that home prices had gone up,” Dr. Kole says. “What I didn’t realize was that it would still be so hard for me. I have a good job, no debt, and great credit.”
Another frustration for Dr. Kole: He’s been approved for a physician’s loan (a type of mortgage that requires a lower down payment and does not count student loans in debt-to-income calculations) from a national bank, but sellers seem to prefer buyers who work with local lenders. Dr. Kole has been willing to waive the appraisal and mortgage contingency on the right home, but he draws the line at waiving the inspection, a trend that some other buyers in his area are going along with.
“With each house, I learn more about how this works and what amount of risk I can safely assume,” Dr. Kobe says. “There are certain things I definitely wouldn’t give up.”
“Potential homebuyers are really facing a triple threat right now,” says Clare Losey, an assistant research economist with the Texas Real Estate Research Center. “There’s high home appreciation, high mortgage rates, and low inventory of homes for sale.”
It’s still possible to find — and buy — your dream home, even in today’s market with all its challenges. Here are some important steps that can help you.
1. Do not low ball.
There may be some cases in which you can save money by making an offer significantly below the asking price on a property. However, with most housing areas across the country experiencing a seller’s market, you run the risk of offending the buyer or being dismissed as not having a serious offer.
In today’s market, a better strategy is to go in with close to your best and final offer from the start, realtors say. It can help to waive the appraisal or financing contingency as well, although it’s important to understand the risk associated with doing so. Last month, the average home sold for 103% of the list price, according to data compiled from Statista.
2. Get credit ready.
The better your credit, the easier time you’ll have getting a mortgage — and the lower the rate you’ll pay for the loan. The average first-time homebuyer has a credit score of 746, according to a recent paper by Fannie Mae. If you know you’re going to buy a home in the next few months, you can improve your credit by making sure to pay all your bills on time and by avoiding taking on any new debt.
This is also a good opportunity to check your credit report (get all three reports for free from AnnualCreditReport.com) to see whether there are any mistakes or other problems that you’ll need to clear up before applying for a loan. Also, take a look at your credit-utilization ratio (the amount of credit you use compared to the amount available to you). Experts recommend keeping this number below 30%.
3. Prepare to move quickly.
Among homes that closed in March, the average number of days on the market (the amount of time between listing and closing) was just 38 days, according to Realtor.com. In busy markets, homes are moving even faster, realtors say, with sellers commonly accepting offers within days of listing their house for sale.
“It’s crazy,” says Sarah Scattini, president of the Reno/Sparks Association of Realtors. “The market is moving extremely fast here. If you list your home, your sale is pending within 5 days.”
In addition to moving quickly to make your initial offer, do the same if a buyer counters with a negotiation. A speedy response will show the buyer that you’re very interested — and to beat out any other bidders who may have also received a counteroffer.
4. Shop around for mortgages.
Especially for first-time homebuyers, the process will go much more smoothly if you’ve got a team of professionals to help you. Look for a realtor and a mortgage lender who have experience working with first-time homebuyers and with physicians, if possible.
Since mortgage rates can vary wildly, you’ll want to shop around a bit before settling on a lender. Get quotes from a local lender, an online lender, and, potentially, a credit union or a mortgage broker to get a sense of the types of mortgages and rates available to you.
“With multiple offers on every single listing, you really want to align yourself with a great realtor who can negotiate for you on your behalf and navigate you through this very tricky market,” says Ms. Scattini.
For both your realtor and your lender, you’ll want to know up front how they get paid and how they calculate their fees. Typically, the real estate agents for buyers and sellers split a 6% commission on home sales, meaning that your realtor will likely take home 3% of the purchase price.
5. Get preapproved.
Once you’ve settled on a lender, getting preapproved for a mortgage can make your offer more appealing to potential buyers. Preapproval is an in-depth process in which lenders pull your credit and look at other financial factors, such as your income and assets, to tell you ahead of time how much you could borrow under their standards and how much that might cost you.
These days, a large number of buyers are coming in with a cash offer, which in former times was considered very appealing to sellers. However, preapproval helps equalize buyers, and as one seller noted, “I don’t care if it’s cash or mortgage, as long as I get the money.”
If, like most homebuyers, you need a mortgage to finance the purchase, having preapproval can provide some assurance to sellers that your offer won’t fall through because you can’t qualify for the mortgage you expected. Once you’ve received preapproval, don’t open any new credit accounts. If your credit score goes down, the amount you can borrow could decline as well.
6. Firm up your budget.
While the preapproval process will tell you how much a lender thinks you can afford, it typically makes sense to come up with your own budget as well. That’s because banks and other mortgage lenders may approve you for much more than you want or are able to pay for a home.
You’ll want to factor in future costs of homeowners as well as any other (current or future) expenses for which the lender may not have accounted. For example, if you’re planning to have children soon, you may want to lower your budget to factor in the cost of childcare.
Knowing your budget ahead of time, and looking only at houses that fall within it, will prevent you from falling in love with a house that you really can’t afford.
7. Stick with it.
Buying a house in today’s market is no easy task. The first part of the process requires simply looking at multiple houses to get a sense of how far your budget will go and whether there are homes that meet your requirements.
If you’re sure that purchasing a home is the best financial move for you, don’t give up. Instead, consider whether you can make adjustments that could widen your pool of potential homes. That may mean changing your budget, moving a little further out geographically, or opting for a house that needs a little more work than you expected.
That said, while the pace of price increases will likely moderate, it’s unlikely prices will go down significantly in the future.
“We might see home price appreciation subside to levels close to 10% to 15% [from 20% last year] or even just 5% to 10%,” Ms. Losey says. “When you do the math, home prices just can’t continue to go up 20% year over year.”
Dr. Kobe is planning to keep looking for his home for at least the next several months.
“Prices are still going up, but we are hearing that the inventory will increase over the summer,” he says. “I’m still out looking for the right house, and I’m ready to make an offer.”
A version of this article first appeared on Medscape.com.
Tebipenem pivoxil hydrobromide offers oral option for complex UTIs
“No new oral antibiotic alternative has emerged to treat these conditions in more than 25 years,” corresponding author Angela K. Talley, MD, said in an interview. The new research was published in the New England Journal of Medicine.

Patients with complicated urinary tract infection (cUTI), including acute pyelonephritis (AP), are often hospitalized and treated with intravenous therapy because of the lack of oral options, especially in cases of antibiotic-resistant pathogens, explained Dr. Talley, of Spero Therapeutics.
In their new phase 3, double-blind randomized trial, the researchers evaluated the safety and effectiveness of oral TBP-PI-HBr, compared with intravenous ertapenem in hospitalized patients with cUTIs or AP. Oral tebipenem is an investigational carbapenem with demonstrated activity against uropathogenic Enterobacterales, and it has shown effectiveness in animal models, the researchers noted in their paper.
Methods and results
The researchers randomized 1,372 adult patients. The microbiologic intent-to-treat population included 449 patients who received TBP-PI-HBr (600 mg every 8 hours) and 419 who received ertapenem (1 g every 24 hours) for 7-10 days or up to 14 days for patients with bacteremia.
The primary endpoint was a composite of clinical cure and favorable microbiologic response, assessed at a test-of-cure visit on day 19. Clinical cure was defined as “complete resolution or clinically significant alleviation of baseline signs and symptoms of complicated urinary tract infection or acute pyelonephritis and no new symptoms, such that no further antimicrobial therapy was warranted,” the researchers wrote. Microbiologic response was defined as a reduction to less than 103 CFU per milliliter in uropathogen levels from baseline at day 19.
Overall, the clinical response occurred in 58.8% of patients who received TBP-PI-HBr and 61.6% of those who received ertapenem at the test-of-cure visit.
Clinical cure rates were similar in the TBP-PI-HBr and ertapenem groups (93.1% vs. 93.6%) at the test-of-cure visit.
Both treatment groups showed similar responses to Enterobacterales pathogens at the test-of-cure visit (62.7% for TBP-PI-HBr and 65.2% for ertapenem).
Among patients with bacteremia at baseline, overall response rates were 72.3% and 66.0% for TBP-PI-HBr and ertapenem, respectively, at the test-of-cure visit, and 93.6% and 96.2%, respectively, at the end-of-treatment visit on or around day 25.
The overall incidence of adverse events was approximately 26% in both treatment groups. Most adverse events were mild or moderate in severity and did not limit treatment, the researchers wrote.
The mean age of the patients was 58.1 years; 46.1% were aged 65 and older, and 11.5% had bacteremia at baseline.
The study findings were limited by several factors, including the mandated 7- to 10-day course of antibiotics, which may not reflect the standard of care in other settings in the United States. The study’s trial sites were located in the United States, South Africa, and Europe. The study population was primarily White and from Central and Eastern Europe. Other limitations included the randomization of patients before confirming the baseline pathogen, although this was done to limit potential confounding from previous antibiotics, the researchers noted.
Safety and efficacy support application for approval
“To our knowledge, this is the first head-to-head evaluation of an IV vs. an oral drug for the treatment of cUTI and acute pyelonephritis,” Dr. Talley said in an interview.
“The findings demonstrate that almost all patients in the study achieved complete resolution of the signs and symptoms of their infection,” she said.
TBP-PI-HBr has not been approved by the Food and Drug Administration, but a new drug application that included data from the current study was submitted to the FDA and is currently under review, Dr. Talley noted.
As for additional research, the current study was conducted in hospitalized patients, and the use of TBP-PI-HBr in the outpatient setting has not yet been evaluated, she said.
Approval and use of oral carbapenem will change practice
The current study is very important because it provides a viable and effective alternative form of antibiotic delivery for the patients with complicated UTI, Noel N. Deep, MD, emphasized in an interview.

“Currently these patients have to be treated with IV carbapenem antibiotics either in a hospital or through a home health nurse,” Dr. Deep, a general internist in group practice in Antigo, Wisc., explained.
Current IV strategies also carry the inherent risk associated with the insertion of an IV catheter that is left in place for several days or replaced periodically. “The oral antibiotic eliminates these risks and higher health care costs and provides a safer and equally efficacious option,” Dr. Deep said.
In the current study, “I was definitely surprised at the effectiveness of the oral carbapenem,” Dr. Deep said. “I am absolutely delighted with this new treatment option that physicians can now add to their armamentarium [assuming FDA approval] as we provide care to our patients,” he said.
If approved, TBP-PI-HBr will definitely change the treatment spectrum for the multidrug-resistant bacterial UTIs, said Dr. Deep. “Carbapenems have continued to be effective and low antibiotic resistance to carbapenems has been recorded.”
As for additional research, “I would like to see studies done in other ethnicities and different countries to ascertain the effectiveness of this antibiotic in those populations and against other bacterial strains with potentially different resistance mechanisms,” Dr. Deep said.
The study was supported by Spero Therapeutics and the Department of Health and Human Services. Lead author Paul B. Eckburg, MD, of Stanford (Calif.) University, and Dr. Talley are employees of Spero Therapeutics. Dr. Deep had no financial conflicts to disclose, but serves on the editorial advisory board of Internal Medicine News.
“No new oral antibiotic alternative has emerged to treat these conditions in more than 25 years,” corresponding author Angela K. Talley, MD, said in an interview. The new research was published in the New England Journal of Medicine.
Patients with complicated urinary tract infection (cUTI), including acute pyelonephritis (AP), are often hospitalized and treated with intravenous therapy because of the lack of oral options, especially in cases of antibiotic-resistant pathogens, explained Dr. Talley, of Spero Therapeutics.
In their new phase 3, double-blind randomized trial, the researchers evaluated the safety and effectiveness of oral TBP-PI-HBr, compared with intravenous ertapenem in hospitalized patients with cUTIs or AP. Oral tebipenem is an investigational carbapenem with demonstrated activity against uropathogenic Enterobacterales, and it has shown effectiveness in animal models, the researchers noted in their paper.
Methods and results
The researchers randomized 1,372 adult patients. The microbiologic intent-to-treat population included 449 patients who received TBP-PI-HBr (600 mg every 8 hours) and 419 who received ertapenem (1 g every 24 hours) for 7-10 days or up to 14 days for patients with bacteremia.
The primary endpoint was a composite of clinical cure and favorable microbiologic response, assessed at a test-of-cure visit on day 19. Clinical cure was defined as “complete resolution or clinically significant alleviation of baseline signs and symptoms of complicated urinary tract infection or acute pyelonephritis and no new symptoms, such that no further antimicrobial therapy was warranted,” the researchers wrote. Microbiologic response was defined as a reduction to less than 103 CFU per milliliter in uropathogen levels from baseline at day 19.
Overall, the clinical response occurred in 58.8% of patients who received TBP-PI-HBr and 61.6% of those who received ertapenem at the test-of-cure visit.
Clinical cure rates were similar in the TBP-PI-HBr and ertapenem groups (93.1% vs. 93.6%) at the test-of-cure visit.
Both treatment groups showed similar responses to Enterobacterales pathogens at the test-of-cure visit (62.7% for TBP-PI-HBr and 65.2% for ertapenem).
Among patients with bacteremia at baseline, overall response rates were 72.3% and 66.0% for TBP-PI-HBr and ertapenem, respectively, at the test-of-cure visit, and 93.6% and 96.2%, respectively, at the end-of-treatment visit on or around day 25.
The overall incidence of adverse events was approximately 26% in both treatment groups. Most adverse events were mild or moderate in severity and did not limit treatment, the researchers wrote.
The mean age of the patients was 58.1 years; 46.1% were aged 65 and older, and 11.5% had bacteremia at baseline.
The study findings were limited by several factors, including the mandated 7- to 10-day course of antibiotics, which may not reflect the standard of care in other settings in the United States. The study’s trial sites were located in the United States, South Africa, and Europe. The study population was primarily White and from Central and Eastern Europe. Other limitations included the randomization of patients before confirming the baseline pathogen, although this was done to limit potential confounding from previous antibiotics, the researchers noted.
Safety and efficacy support application for approval
“To our knowledge, this is the first head-to-head evaluation of an IV vs. an oral drug for the treatment of cUTI and acute pyelonephritis,” Dr. Talley said in an interview.
“The findings demonstrate that almost all patients in the study achieved complete resolution of the signs and symptoms of their infection,” she said.
TBP-PI-HBr has not been approved by the Food and Drug Administration, but a new drug application that included data from the current study was submitted to the FDA and is currently under review, Dr. Talley noted.
As for additional research, the current study was conducted in hospitalized patients, and the use of TBP-PI-HBr in the outpatient setting has not yet been evaluated, she said.
Approval and use of oral carbapenem will change practice
The current study is very important because it provides a viable and effective alternative form of antibiotic delivery for the patients with complicated UTI, Noel N. Deep, MD, emphasized in an interview.
“Currently these patients have to be treated with IV carbapenem antibiotics either in a hospital or through a home health nurse,” Dr. Deep, a general internist in group practice in Antigo, Wisc., explained.
Current IV strategies also carry the inherent risk associated with the insertion of an IV catheter that is left in place for several days or replaced periodically. “The oral antibiotic eliminates these risks and higher health care costs and provides a safer and equally efficacious option,” Dr. Deep said.
In the current study, “I was definitely surprised at the effectiveness of the oral carbapenem,” Dr. Deep said. “I am absolutely delighted with this new treatment option that physicians can now add to their armamentarium [assuming FDA approval] as we provide care to our patients,” he said.
If approved, TBP-PI-HBr will definitely change the treatment spectrum for the multidrug-resistant bacterial UTIs, said Dr. Deep. “Carbapenems have continued to be effective and low antibiotic resistance to carbapenems has been recorded.”
As for additional research, “I would like to see studies done in other ethnicities and different countries to ascertain the effectiveness of this antibiotic in those populations and against other bacterial strains with potentially different resistance mechanisms,” Dr. Deep said.
The study was supported by Spero Therapeutics and the Department of Health and Human Services. Lead author Paul B. Eckburg, MD, of Stanford (Calif.) University, and Dr. Talley are employees of Spero Therapeutics. Dr. Deep had no financial conflicts to disclose, but serves on the editorial advisory board of Internal Medicine News.
FROM THE NEW ENGLAND JOURNAL OF MEDICINE
Bellies up to the bar, the weight gain is on us
I’d do anything for weight loss (but I won’t do that)
Weight loss isn’t a multibillion-dollar industry for nothing. How many people step onto the scale in the morning and sigh, wishing they could lose that last 10 pounds?
Alcohol also isn’t a multibillion-dollar industry for nothing. If there’s one thing more universal than wishing you could lose weight, it’s drinking to forget your woes about being unable to lose weight.
Naturally, and unfortunately for those of us who rather enjoy a good beer, one of the best ways to lose weight is to stop drinking. Alcohol is almost the definition of empty calories. So, which wins out: The unstoppable force of wanting to lose weight, or the immovable object of alcohol? According to a survey from DrugAbuse.com, it’s alcohol, and it’s not even close.
Even in a state with as health conscious a reputation as California, not only are people not willing to give up alcohol to lose weight, they’re willing to gain a noticeable amount of weight in order to continue drinking. It’s 14 pounds for Californians, which is in the middle of the road for America, which overall averaged 13 pounds to keep drinking. Hawaiians, South Dakotans, Utahns, and Vermonters were at the bottom, willing to add only 8 pounds to keep booze in their diet. At the other end of the scale, willing to add 28 whole pounds to keep the beer flowing, is humble little Rhode Island, followed by Wyoming at 23 pounds, Maryland at 22, and Tennessee at 21.
Obviously, that’s a lot of weight to gain, but to drive home the exact quantity of just how much weight, KRON-TV noted that adding the U.S. average of 13 pounds to your body is the equivalent of strapping 224 slices of bacon to yourself, which, to us, is just the poorest choice of comparison. If there’s one thing we’re less willing to give up than alcohol, it’s probably bacon. Or if you’re feeling especially ambitious, you could go for bacon-scented beer from the Waffle House. Now that’s a drink.
This looks like a job for the ‘magnetic slime robot’
What’s that? While you were in the process of gaining 14 pounds so you could keep drinking alcohol you swallowed something that you shouldn’t have? Did you swallow a lot of aggression?

You swallowed a what? An ear bud? But how did you manage that? No, never mind, we don’t really want to hear about your personal life. Lucky for you, though, today’s LOTME phrase that pays is “magnetic turd” and it’s just the thing for the busy executive/child with a foreign object stuck in their … whatever.
Yes, we said magnetic turd. Or, if you prefer, a “magnetic slime robot.” The black-brown–colored blob/robot/turd in question is an investigational substance that can be controlled magnetically to move through very narrow spaces and encircle small objects that have been accidentally swallowed, its cocreator, Li Zhang of the Chinese University of Hong Kong, told the Guardian.
It’s made by combining the polymer polyvinyl alcohol with borax and particles of neodymium magnet. And since those neodymium particles are not particularly friendly to humans, Dr. Zhang and the research team coated the slime with silica to seal in the toxicity. The slime has the consistency of custard and exhibits “visco-elastic properties,” Dr. Zhang said, meaning that “sometimes it behaves like a solid, sometimes it behaves like a liquid.”
We could go on, telling you about the substance’s self-healing ability and electrical conductivity and how it does look very, very turd-like. Instead, we offer this link to the team’s really freaky video.
We’re going to be seeing that in our nightmares.
Fish: More than meets the fry?
When you think of fish, intelligence isn’t usually the first thing to pop into your head. Their short memory spans, which can be as little as 3 seconds, probably don’t help their cause.

Recently, though, it has become apparent that fish can be trained to do simple math problems like adding and subtracting. Research conducted in Germany has shown that cichlids – tropical fish often found in home aquariums – and stingrays can observe small quantities and know how many things are there without actually counting, kind of like how a human can look at a bowl of apples and know about how many are in it.
Fish, once thought to be not very smart, may be on the same level of intelligence as birds, suggested Vera Schluessel, PhD, of the University of Bonn’s Institute of Zoology, and associates.
“Successful fish showed abilities far above chance level, specifically in the stingrays. Again, this raises the question of what abilities fish may be capable of if being asked the ‘right’ question,” the researchers said in Scientific Reports.
They tried to teach the cichlids and stingrays how to add and subtract by recognizing colors: Blue meant to add one and yellow meant to subtract one. Gates were set up and when the fish chose a correct answer, they were rewarded with food. Although it took many sessions for the fish to completely catch on, they did figure it out eventually.
If fish are smarter than we thought, maybe we can stop paying for math tutors for our kids and just have the family goldfish do it.
For earthworms, not all plastics are created equal
Everything living on the earth has to deal with pollution in some way, including earthworms. Not only have they have adapted to eating plastics found in soil, they have preferences.

The earthworm is a little creature with a big job. The materials and minerals they munch on as they go through the earth get recycled through their tiny bodies to create more fertile soil for things to grow – making them the hidden heroes of every garden. But what about soil that’s full of microscopic plastic pieces? Well, turns out earthworms will eat that too, investigators from Nankai University in Tianjin, China, reported in Environmental Science & Technology.
The researchers looked at how these eating machines were digesting the plastic and found that they actually have preferences. Soils with bio-based polylactic acid (PLA) or petroleum-derived polyethylene terephthalate (PET) particles were a hit. Another test showed that the worms broke the PLA particles down into smaller fragments than the PET ones. So at least the “healthier” option agreed with them more. More work is needed, however, to determine if the worms are being harmed by all the waste they’re digesting.
So what does this mean for the evolution or even survival of this unsung hero of the planet? Scientists still need to dig into that question. No pun intended.
I’d do anything for weight loss (but I won’t do that)
Weight loss isn’t a multibillion-dollar industry for nothing. How many people step onto the scale in the morning and sigh, wishing they could lose that last 10 pounds?
Alcohol also isn’t a multibillion-dollar industry for nothing. If there’s one thing more universal than wishing you could lose weight, it’s drinking to forget your woes about being unable to lose weight.
Naturally, and unfortunately for those of us who rather enjoy a good beer, one of the best ways to lose weight is to stop drinking. Alcohol is almost the definition of empty calories. So, which wins out: The unstoppable force of wanting to lose weight, or the immovable object of alcohol? According to a survey from DrugAbuse.com, it’s alcohol, and it’s not even close.
Even in a state with as health conscious a reputation as California, not only are people not willing to give up alcohol to lose weight, they’re willing to gain a noticeable amount of weight in order to continue drinking. It’s 14 pounds for Californians, which is in the middle of the road for America, which overall averaged 13 pounds to keep drinking. Hawaiians, South Dakotans, Utahns, and Vermonters were at the bottom, willing to add only 8 pounds to keep booze in their diet. At the other end of the scale, willing to add 28 whole pounds to keep the beer flowing, is humble little Rhode Island, followed by Wyoming at 23 pounds, Maryland at 22, and Tennessee at 21.
Obviously, that’s a lot of weight to gain, but to drive home the exact quantity of just how much weight, KRON-TV noted that adding the U.S. average of 13 pounds to your body is the equivalent of strapping 224 slices of bacon to yourself, which, to us, is just the poorest choice of comparison. If there’s one thing we’re less willing to give up than alcohol, it’s probably bacon. Or if you’re feeling especially ambitious, you could go for bacon-scented beer from the Waffle House. Now that’s a drink.
This looks like a job for the ‘magnetic slime robot’
What’s that? While you were in the process of gaining 14 pounds so you could keep drinking alcohol you swallowed something that you shouldn’t have? Did you swallow a lot of aggression?
You swallowed a what? An ear bud? But how did you manage that? No, never mind, we don’t really want to hear about your personal life. Lucky for you, though, today’s LOTME phrase that pays is “magnetic turd” and it’s just the thing for the busy executive/child with a foreign object stuck in their … whatever.
Yes, we said magnetic turd. Or, if you prefer, a “magnetic slime robot.” The black-brown–colored blob/robot/turd in question is an investigational substance that can be controlled magnetically to move through very narrow spaces and encircle small objects that have been accidentally swallowed, its cocreator, Li Zhang of the Chinese University of Hong Kong, told the Guardian.
It’s made by combining the polymer polyvinyl alcohol with borax and particles of neodymium magnet. And since those neodymium particles are not particularly friendly to humans, Dr. Zhang and the research team coated the slime with silica to seal in the toxicity. The slime has the consistency of custard and exhibits “visco-elastic properties,” Dr. Zhang said, meaning that “sometimes it behaves like a solid, sometimes it behaves like a liquid.”
We could go on, telling you about the substance’s self-healing ability and electrical conductivity and how it does look very, very turd-like. Instead, we offer this link to the team’s really freaky video.
We’re going to be seeing that in our nightmares.
Fish: More than meets the fry?
When you think of fish, intelligence isn’t usually the first thing to pop into your head. Their short memory spans, which can be as little as 3 seconds, probably don’t help their cause.
Recently, though, it has become apparent that fish can be trained to do simple math problems like adding and subtracting. Research conducted in Germany has shown that cichlids – tropical fish often found in home aquariums – and stingrays can observe small quantities and know how many things are there without actually counting, kind of like how a human can look at a bowl of apples and know about how many are in it.
Fish, once thought to be not very smart, may be on the same level of intelligence as birds, suggested Vera Schluessel, PhD, of the University of Bonn’s Institute of Zoology, and associates.
“Successful fish showed abilities far above chance level, specifically in the stingrays. Again, this raises the question of what abilities fish may be capable of if being asked the ‘right’ question,” the researchers said in Scientific Reports.
They tried to teach the cichlids and stingrays how to add and subtract by recognizing colors: Blue meant to add one and yellow meant to subtract one. Gates were set up and when the fish chose a correct answer, they were rewarded with food. Although it took many sessions for the fish to completely catch on, they did figure it out eventually.
If fish are smarter than we thought, maybe we can stop paying for math tutors for our kids and just have the family goldfish do it.
For earthworms, not all plastics are created equal
Everything living on the earth has to deal with pollution in some way, including earthworms. Not only have they have adapted to eating plastics found in soil, they have preferences.
The earthworm is a little creature with a big job. The materials and minerals they munch on as they go through the earth get recycled through their tiny bodies to create more fertile soil for things to grow – making them the hidden heroes of every garden. But what about soil that’s full of microscopic plastic pieces? Well, turns out earthworms will eat that too, investigators from Nankai University in Tianjin, China, reported in Environmental Science & Technology.
The researchers looked at how these eating machines were digesting the plastic and found that they actually have preferences. Soils with bio-based polylactic acid (PLA) or petroleum-derived polyethylene terephthalate (PET) particles were a hit. Another test showed that the worms broke the PLA particles down into smaller fragments than the PET ones. So at least the “healthier” option agreed with them more. More work is needed, however, to determine if the worms are being harmed by all the waste they’re digesting.
So what does this mean for the evolution or even survival of this unsung hero of the planet? Scientists still need to dig into that question. No pun intended.