User login
Nature retracts STAP cell papers

Credit: Haruko Obokata
The journal Nature has retracted the papers it published several months ago on stimulus-triggered acquisition of pluripotency (STAP) cells.
In January, Nature published an article and a letter in which researchers claimed they could create STAP cells—ie, induce pluripotency in somatic cells by exposing them to a low-pH environment.
Not long after the papers were published, however, members of the scientific community began to question the validity of the research.
They voiced concerns about published images, possible plagiarism, and an inability to replicate the experiments described.
So the Japanese institute RIKEN, where most of the study’s investigators are employed, launched an investigation.
In April, RIKEN’s investigative committee concluded that lead study author Haruko Obokata, PhD, and some of her colleagues were guilty of misconduct and/or negligence.
Dr Obokata appealed the findings, saying the acts of misconduct were simply mistakes and that STAP cells do exist.
But the committee decided another investigation is not warranted, and RIKEN called for a retraction of the Nature papers.
Today, Nature published the retractions, which can be viewed here and here. An editorial on the subject is available here.
As for the future of STAP cells, RIKEN is currently attempting to recreate Dr Obokata’s experiments and determine if the cells do exist. The organization plans to release an interim report on this attempt in late July or early August.
Other researchers said they have tried and failed to replicate Dr Obokata’s experiments. One group detailed their failed attempt in F1000Research. ![]()
Company recalls lots of warfarin

Bristol-Myers Squibb has announced a recall of 6 lots of the anticoagulant warfarin, sold as Coumadin for Injection in 5 mg single-use vials, in the US.
The company is recalling these lots after discovering visible particulate matter in unreleased samples of the drug.
The company said the safety risk to patients is likely low and is further mitigated by the product’s prescribing information, which advises that intravenous products be inspected visually before administration.
However, injected particulate metallic and non-metallic cellulose material can cause serious and potentially fatal adverse reactions, such as embolization. Allergic reactions to the foreign material could also occur.
To date, there have been no product complaints or adverse events reported to Bristol-Myers Squibb related to particulate matter in Coumadin for Injection.
Coumadin for Injection was discontinued in early April 2014. The oral formulation of Coumadin is not impacted by this recall.
Coumadin for Injection is packaged in cartons of six 5-mg single-use vials. The affected product includes the following 6 lots distributed to hospitals and pharmacies from November 2011 through January 2014:
Lot # Description NDC Expiration
201125 COUMADIN LINJ 5MG (6VL) US 0590-0324-35 Sept. 2014
201126 COUMADIN LINJ 5MG (6VL) US 0590-0324-35 Nov. 2014
201127 COUMADIN LINJ 5MG (6VL) US 0590-0324-35 Dec. 2014
201228 COUMADIN LINJ 5MG (6VL) US 0590-0324-35 June 2015
201229 COUMADIN LINJ 5MG (6VL) US 0590-0324-35 July 2015
201230 COUMADIN LINJ 5MG (6VL) US 0590-0324-35 Sept. 2015
Anyone with the aforementioned lots of Coumadin for Injection should stop using or distributing the product and contact Bristol-Myers Squibb’s recall vendor, GENCO, at 1-855-838-5784 to arrange for the return of remaining stock.
Customers with questions about the recall may contact the Bristol-Myers Squibb Customer Information Center at 1-800-332-2056.
Adverse reactions or quality problems associated with the use of this product can be reported to the FDA’s MedWatch Adverse Event Reporting Program. ![]()
Phase 2 results lead to breakthrough designation
The US Food and Drug Administration (FDA) has granted the bispecific antibody blinatumomab breakthrough designation for the treatment of adults with relapsed or refractory B-precursor acute lymphoblastic leukemia (B-ALL).
The decision was based on promising results of a phase 2 trial, which were presented at the 50th Annual Meeting of the American Society of Clinical Oncology (ASCO) and the 19th Congress of the European Hematology Association (EHA).
According to the FDA, breakthrough designation is intended to expedite the development and review of drugs for serious or life-threatening conditions.
For a treatment to receive this designation, there must be preliminary clinical evidence suggesting the drug may offer substantial improvement over currently available therapy on at least one clinically significant endpoint.
Trial results
Nicola Gökbuget, MD, of Goethe University in Frankfurt, Germany, and Max Topp, MD, of the University of Wuerzberg in Germany, presented phase 2 results with blinatumomab at the EHA Congress as abstracts S1314 and S722. The trial was sponsored by Amgen, the company developing blinatumomab.
“Blinatumomab is a bispecific antibody which has two parts,” Dr Gökbuget noted. “With one part—the CD3 part—it attracts T cells, and with the other part, it binds to CD19. And CD19 is a target available on the vast majority of B-precursor ALL blast cells.”
To test this mechanism, Dr Gökbuget and her colleagues evaluated blinatumomab monotherapy in 189 patients with relapsed or refractory B-ALL and a median age of 39 (range, 18-79).
The patients received blinatumomab by continuous intravenous infusion—4 weeks on and 2 weeks off—for up to 5 cycles.
Safety
Dr Gökbuget noted that major toxicities were related to cytokine release syndrome—for example, fever and headache—but cytopenias were also common.
“Another side effect observed with this compound—and this is something seen often with other T-cell therapies—was [central nervous system] events,” she added.
The most frequent adverse events (AEs) were pyrexia (59%), headache (35%) and febrile neutropenia (29%). The most frequent grade 3 or higher AEs were febrile neutropenia (26%), anemia (15%), and neutropenia (15%). Two percent of patients had grade 3 or higher cytokine release syndrome.
The most common grade 3 or higher nervous system AEs were headache (4%), encephalopathy (3%), and ataxia (2%). Three patients (2%) had grade 5 AEs considered treatment-related—2 with sepsis and 1 with Candida infection.
Efficacy
The study’s primary endpoint was complete remission (CR) or CR with partial hematologic recovery (CRh) within the first 2 cycles.
An exploratory endpoint was minimal residual disease (MRD) response (<10-4) within the first 2 cycles. If a patient was MRD-negative, he was classified as having a complete MRD response.
In all, 43% (81/189) of patients achieved a CR/CRh within 2 cycles of therapy. Thirty-three percent (63/189) achieved a CR, and 9% (18/189) achieved a CRh.
Eighty-two percent (60/73) of patients with a CR/CRh who were evaluable for an MRD assessment achieved an MRD response. This included 86% (50/58) of CR patients and 67% (10/15) of CRh patients. Seventy-one percent (51/73) of patients with CR/CRh had a complete MRD response.
The median relapse-free survival was 5.9 months.
“So to conclude, we have observed considerable antileukemic activity for this single-drug therapy,” Dr Gökbuget said. “We have to keep in mind this is a single drug, and, usually, these patients receive many different chemotherapy compounds.”
“Also, although these patients were poorly selected, this is, so far, the largest trial in adult ALL where standardized PCR-based MRD detection was tested in the relapsed setting. So these data will be very important.” ![]()
LISTEN NOW: Highlights of the July 2014 issue of The Hospitalist newsmagazine
Highlights from The Hospitalist this month include hospitalist reactions to the once-again delayed implementation of the coding classification system ICD-10. Robert Tennant, senior policy advisor at Medical Group Management Association, shares his organization’s perspective on the postponement. Dr. Amy Boutwell, a hospitalist at Newton-Wellesley Hospital and president of Collaborative Healthcare Strategies, discusses Medicare’s new hospital discharge rules and the opportunity they hold for hospitalists. Elsewhere in this issue, we have an update on SHM’s Leadership Academy scheduled for November 3–6 in Honolulu, Hawaii, and the latest in clinical research, including a review of best practices for end-of-life care and when to suspect Kawasaki disease in infants.
Highlights from The Hospitalist this month include hospitalist reactions to the once-again delayed implementation of the coding classification system ICD-10. Robert Tennant, senior policy advisor at Medical Group Management Association, shares his organization’s perspective on the postponement. Dr. Amy Boutwell, a hospitalist at Newton-Wellesley Hospital and president of Collaborative Healthcare Strategies, discusses Medicare’s new hospital discharge rules and the opportunity they hold for hospitalists. Elsewhere in this issue, we have an update on SHM’s Leadership Academy scheduled for November 3–6 in Honolulu, Hawaii, and the latest in clinical research, including a review of best practices for end-of-life care and when to suspect Kawasaki disease in infants.
Highlights from The Hospitalist this month include hospitalist reactions to the once-again delayed implementation of the coding classification system ICD-10. Robert Tennant, senior policy advisor at Medical Group Management Association, shares his organization’s perspective on the postponement. Dr. Amy Boutwell, a hospitalist at Newton-Wellesley Hospital and president of Collaborative Healthcare Strategies, discusses Medicare’s new hospital discharge rules and the opportunity they hold for hospitalists. Elsewhere in this issue, we have an update on SHM’s Leadership Academy scheduled for November 3–6 in Honolulu, Hawaii, and the latest in clinical research, including a review of best practices for end-of-life care and when to suspect Kawasaki disease in infants.
SHM Fellow in Hospital Medicine Spotlight: Rachel George MD, MBA, SFHM

Dr. George is president of the central business unit for Brentwood, Tenn.-based Cogent Healthcare, the largest privately held hospital medicine company in the United States. She oversees multiple HM programs in the north central region of the U.S. Previously, she was medical director of hospitalist services for OSF St. Anthony Medical Center in Rockford, Ill.
Undergraduate education: Dr. George went straight from high school to a direct medical program and earned her MBA at the University of Tennessee in Knoxville.
Medical school: JJM Medical College in India.
Notable: She began her MBA at the University of Tennessee when she was 34 weeks pregnant, proving wrong the professors who thought she would not be able to finish the program. Actively involved in the SHM Leadership, RIV, and Annual Meeting committees, Dr. George is a frequent annual meeting presenter on women’s workforce issues.
FYI: Dr. George keeps busy with her two children, ages 15 and 9, supporting them in such extra-curricular pursuits as marching band, music lessons, tae kwon do, and chess. In her downtime, she likes to relax by watching movies and spending time with friends.
Quotable: “It is a tremendous honor to be a Fellow in Hospital Medicine; it demonstrates clearly to everyone my accomplishments as a hospitalist, and I am proud to have been a member of the inaugural class of fellows.”
Professional Dress Code Helps Physicians Earn Patient Confidence, Trust

Our large hospitalist group (22 FTEs) just implemented a dress code that requires the men to wear a tie at all times while seeing patients, even on weekends. In this era of many businesses allowing their workers to dress more casually, do you think it is necessary for doctors to always dress so formally?
—Samir in Seattle
Dr. Hospitalist responds:
You bring up an interesting topic, one that causes dissention in most large HM groups and has many roots: age, gender, professionalism, cleanliness, and culture are just a few. After all, it was Hippocrates who said a physician should be “clean in person, well-dressed, and anointed with sweet-smelling unguents.” Of course, Mrs. Smith’s allergies have forced us to get rid of the “unguents.”
Since the late 19th century, traditional (predominantly male) physician attire has been a white coat with formal suit or shirt and tie. The major push for a more professional look was medicine’s movement out of the realm of quackery and into the theatre of science. Once germs were found to be the cause of many of the illnesses responsible for killing people, the white coat and professional look came to represent cleanliness and authority. Who can forget the famous paintings of the late 19th century, such as “The Agnew Clinic,” which depicted surgeons operating with white smocks and the amphitheater full of medical students in three-piece suits?
Still, the physician most people picture (especially in the U.S.) wears the white coat with a shirt and tie if male, or a dress if she is female. More recently, television has anointed scrubs as the official attire of all hospital-based physicians, even though many institutions outlaw them outside of the operating room.
Many businesses in the U.S. allow less formal dress at work (i.e., casual Fridays). And the chorus sings: We are not in business; we are members of a profession! We take an oath to distinguish ourselves and espouse a standard of professionalism that is necessary to earn the trust of patients. As hospitalists, we typically don’t have established relationships with our patients, and those first impressions are priceless.
The U.K. prohibited wristwatches, long sleeves (including white coats), and dangling ties in 2007. Even though there was no epidemiological evidence to support such a move, the public saw physicians as carriers of infectious bugs. As international travel makes our world smaller, vancomycin-resistant enterococci, methicillin-resistant Staphylococcus aureus, Klebsiella pneumoniae Carbapenemase, and Clostridium difficile are increasingly prevalent and virulent in the hospital. Who can blame a suspicious public? I can’t.
Many of our patients grew up in an era when anyone flying by commercial air dressed in their Sunday best. It meant you were important or doing something important, and physicians have traditionally dressed the part. Most of our hospitalized patients today are older and more likely to prefer a physician in professional attire.
But who can forget the uproar in 2004, when an Israeli medical student tested the neckties of doctors and clinical staff at the New York Hospital Medical Center of Queens and found that nearly 50% were infested with potentially pathogenic bacteria. Most of organized medicine didn’t give the study much credence, because there was no evidence that the ties were directly tied to disease and most of the organisms were fairly ubiquitous.
Authors of a study published in The American Journal of Medicine in 2005 explored the impact of physician attire on patient confidence. Four hundred patients and visitors to a VA clinic were shown four sets of photos of doctors in different forms of attire (i.e., business attire, professional attire, scrubs, and T-shirts with jeans). Across all respondents, 76% of people chose the doctor in professional attire, followed by scrubs (10%), and business dress (9%).
I’m historically a very conservative dresser, and my bowties allow me the luxury of being “above” the tie fracas; however, I do like scrubs on the weekends, attire that is allowed in our system-wide dress code. I don’t think jeans and T-shirts are ever appropriate for seeing patients in the hospital.
The most important consideration, one that will evolve with the ages, is how our attire influences patient confidence and trust.
Proper Inpatient Documentation, Coding Essential to Avoid a Medicare Audit

Several years ago we sent a CPT coding auditor 15 chart notes generated by each doctor in our group. Among each doctors’ 15 notes were at least one or two billed as initial hospital care, follow up, discharge, critical care, and so on. This coding expert returned a report showing that, out of all the notes reviewed, a significant portion were not billed at the correct level. Most of the incorrectly billed notes were judged to reflect “up-coding,” and a few were seen as “down-coded.”
This was distressing and hard to believe.
So I took the same set of notes and paid a second coding expert for an independent review. She didn’t know about the first audit but returned a report that showed a nearly identical portion of incorrectly coded notes.
Two independent audits showing nearly the same portion of notes coded incorrectly was alarming. But it was difficult for my partners and me to address, because the auditors didn’t agree on the correct code for many of the notes. In some cases, both flagged a note as incorrectly coded but didn’t agree on the correct code. For a number of the notes, one auditor said the visit was “up-coded,” while the other said it was “down-coded.” There was so little agreement between the two of them that we had a hard time coming up with any firm conclusions about what we should do to improve our performance.
If experts who think about coding all the time can’t agree on the right code for a given note, how can hospitalists be expected to code nearly all of our visits accurately?
RAC: Recovery Audit Contractor
Despite what I believe is poor inter-rater reliability among coding auditors, we need to work diligently to comply with coding guidelines. A 2003 Federal law mandated a program of Recovery Audit Contractors, or RAC for short, to find cases of “up-coding” or other overbilling and require the provider to repay any resulting loss.
A number of companies are in the business of conducting RAC audits (one of them, CGI, is the Canadian company blamed for the failed “Obamacare” exchange websites), and there is a reasonable chance one of these companies has reviewed some of your charges—or those of your hospitalist colleagues.
The RAC auditors review information about your charges, and if they determine that you up-coded or overbilled, they send a “demand letter” summarizing their findings, along with the amount of money they have determined you should pay back. (Theoretically, they could notify you of “under-coding,” so that you can be paid more for past work, but I haven’t yet come across an example of that.)
It is common to appeal the RAC findings, but that can be a long process, and many organizations decide to pay back all the money requested by the RAC as quickly as possible to avoid paying interest on a delayed payment if the appeal is unsuccessful. In the case of a successful appeal, the money previously refunded by the doctor would be returned.
Page 338 of the CMS Fiscal Year 2015 “Justification of Estimates for Appropriations Committees” says that “…about 50 percent of the estimated 43,000 appeals [of adverse RAC audit findings] were fully or partially overturned…” This could mean the RACs are a sort of loose cannon, accusing many providers of overbilling while knowing that some won’t bother to appeal because they don’t understand the process or because the dollar amount involved for a single provider is too small to justify the time and expense of conducting the appeal. In this way, a RAC audit is like the $15 rebate on the last electronic gadget you bought. The seller knows that many people, including me, will fail to do the work required to claim the rebate.
Accuracy Strategies
There are a number of ways to help your group ensure appropriate CPT coding and reduce the chance a RAC will ask for money back.
Education. There are many ways to help providers in your practice understand the elements of documentation and coding. Periodic training classes (e.g. during orientation and annually thereafter) are useful but may not be enough. For me, this is a little like learning a foreign language by going to a couple of classes. Instead, I think “immersion training” is more effective. That might mean a doctor spends a few minutes with a certified coder on most working days for a few weeks. For example, they could meet for 15 minutes near lunchtime and review how the doctor plans to bill visits made that morning. Lastly, consider targeted education for each doctor, based on any problems found in an audit of his/her coding.
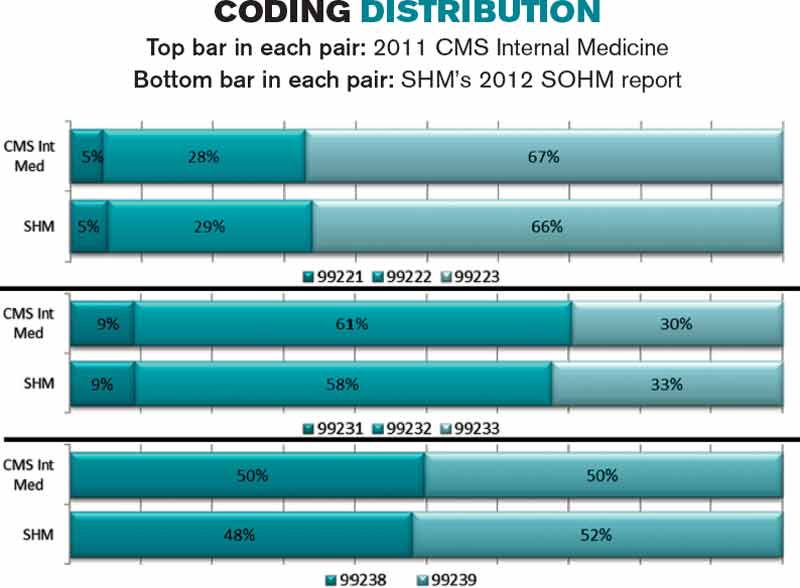
Review coding patterns. As I wrote in my August 2007 column, there is value in ensuring that each doctor in the group can see how her coding pattern differs from the group as a whole or any individual in the group. That is, what portion of follow-up visits was billed at the lowest, middle, and highest levels? What about admissions, discharges, and so on? I provided a sample report in that same column.
It also is worth taking the time to compare each doctor’s coding pattern to both the CMS Internal Medicine data and SHM’s State of Hospital Medicine report. The accompanying figure shows the most current data sets available.
Keep in mind that the goal is not to simply ensure that your coding pattern matches these external data sets; knowing where yours differs from these sets can suggest where you might want to investigate further or seek additional education.
Coding audits. Having a certified coder audit your performance at least annually is a good idea. It can help uncover areas in which you’d benefit from further review and training, and if, heaven forbid, questions are ever raised about whether you’re intentionally up-coding (fraud), showing that you’re audited regularly could help demonstrate your efforts to code correctly. In the latter case, it is probably more valuable if the audit is done independently of your employer.
Dr. Nelson has been a practicing hospitalist since 1988. He is co-founder and past president of SHM, and principal in Nelson Flores Hospital Medicine Consultants. He is co-director for SHM’s “Best Practices in Managing a Hospital Medicine Program” course. Write to him at [email protected].
Several years ago we sent a CPT coding auditor 15 chart notes generated by each doctor in our group. Among each doctors’ 15 notes were at least one or two billed as initial hospital care, follow up, discharge, critical care, and so on. This coding expert returned a report showing that, out of all the notes reviewed, a significant portion were not billed at the correct level. Most of the incorrectly billed notes were judged to reflect “up-coding,” and a few were seen as “down-coded.”
This was distressing and hard to believe.
So I took the same set of notes and paid a second coding expert for an independent review. She didn’t know about the first audit but returned a report that showed a nearly identical portion of incorrectly coded notes.
Two independent audits showing nearly the same portion of notes coded incorrectly was alarming. But it was difficult for my partners and me to address, because the auditors didn’t agree on the correct code for many of the notes. In some cases, both flagged a note as incorrectly coded but didn’t agree on the correct code. For a number of the notes, one auditor said the visit was “up-coded,” while the other said it was “down-coded.” There was so little agreement between the two of them that we had a hard time coming up with any firm conclusions about what we should do to improve our performance.
If experts who think about coding all the time can’t agree on the right code for a given note, how can hospitalists be expected to code nearly all of our visits accurately?
RAC: Recovery Audit Contractor
Despite what I believe is poor inter-rater reliability among coding auditors, we need to work diligently to comply with coding guidelines. A 2003 Federal law mandated a program of Recovery Audit Contractors, or RAC for short, to find cases of “up-coding” or other overbilling and require the provider to repay any resulting loss.
A number of companies are in the business of conducting RAC audits (one of them, CGI, is the Canadian company blamed for the failed “Obamacare” exchange websites), and there is a reasonable chance one of these companies has reviewed some of your charges—or those of your hospitalist colleagues.
The RAC auditors review information about your charges, and if they determine that you up-coded or overbilled, they send a “demand letter” summarizing their findings, along with the amount of money they have determined you should pay back. (Theoretically, they could notify you of “under-coding,” so that you can be paid more for past work, but I haven’t yet come across an example of that.)
It is common to appeal the RAC findings, but that can be a long process, and many organizations decide to pay back all the money requested by the RAC as quickly as possible to avoid paying interest on a delayed payment if the appeal is unsuccessful. In the case of a successful appeal, the money previously refunded by the doctor would be returned.
Page 338 of the CMS Fiscal Year 2015 “Justification of Estimates for Appropriations Committees” says that “…about 50 percent of the estimated 43,000 appeals [of adverse RAC audit findings] were fully or partially overturned…” This could mean the RACs are a sort of loose cannon, accusing many providers of overbilling while knowing that some won’t bother to appeal because they don’t understand the process or because the dollar amount involved for a single provider is too small to justify the time and expense of conducting the appeal. In this way, a RAC audit is like the $15 rebate on the last electronic gadget you bought. The seller knows that many people, including me, will fail to do the work required to claim the rebate.
Accuracy Strategies
There are a number of ways to help your group ensure appropriate CPT coding and reduce the chance a RAC will ask for money back.
Education. There are many ways to help providers in your practice understand the elements of documentation and coding. Periodic training classes (e.g. during orientation and annually thereafter) are useful but may not be enough. For me, this is a little like learning a foreign language by going to a couple of classes. Instead, I think “immersion training” is more effective. That might mean a doctor spends a few minutes with a certified coder on most working days for a few weeks. For example, they could meet for 15 minutes near lunchtime and review how the doctor plans to bill visits made that morning. Lastly, consider targeted education for each doctor, based on any problems found in an audit of his/her coding.
Review coding patterns. As I wrote in my August 2007 column, there is value in ensuring that each doctor in the group can see how her coding pattern differs from the group as a whole or any individual in the group. That is, what portion of follow-up visits was billed at the lowest, middle, and highest levels? What about admissions, discharges, and so on? I provided a sample report in that same column.
It also is worth taking the time to compare each doctor’s coding pattern to both the CMS Internal Medicine data and SHM’s State of Hospital Medicine report. The accompanying figure shows the most current data sets available.
Keep in mind that the goal is not to simply ensure that your coding pattern matches these external data sets; knowing where yours differs from these sets can suggest where you might want to investigate further or seek additional education.
Coding audits. Having a certified coder audit your performance at least annually is a good idea. It can help uncover areas in which you’d benefit from further review and training, and if, heaven forbid, questions are ever raised about whether you’re intentionally up-coding (fraud), showing that you’re audited regularly could help demonstrate your efforts to code correctly. In the latter case, it is probably more valuable if the audit is done independently of your employer.
Dr. Nelson has been a practicing hospitalist since 1988. He is co-founder and past president of SHM, and principal in Nelson Flores Hospital Medicine Consultants. He is co-director for SHM’s “Best Practices in Managing a Hospital Medicine Program” course. Write to him at [email protected].
Community Service Helps Hospitalists Build Connections, Earn Credibility


Hospitalist Brian Bossard, MD, FACP, FHM, founder and medical director of Inpatient Physician Associates, which serves Bryan Health Medical Center in Lincoln, Neb., as well as Columbus (Neb.) Community Hospital and Great Plains Regional Medical Center in North Platte, recalls a time when the suggestion of community involvement was a non-starter for physicians. Twenty years ago, he says, “the idea was that physicians work so many hours that there wasn’t time for community involvement.” In the ensuing years, the advent of shift-based work has created an opportunity for hospitalists to connect to community.
Learning the ropes takes the majority of a physician’s time in the first year or two on a new assignment right after residency, Dr. Bossard says. But after initial orientation, young hospitalists in their group are encouraged to become “joiners.”
“We identify activities that the physicians can participate in—many of them medically related, such as sitting on the board of a local blood bank,” he says. “Feeling a part of something bigger, and participating in areas outside of your direct control, can add to satisfaction.”
And that, in turn, can lead to engaged, satisfied, happy, and retained physicians.
Closing the Credibility Gap
David Grace, MD, FHM, SFHM area medical officer for The Schumacher Group’s Hospital Medicine Division in Lafayette, La., agrees that community involvement can lead to improved engagement, as well as a better sense of belonging and job satisfaction. He also encourages younger hospitalists to become engaged in their local communities. Participating in volunteer activities can lead to:
- Better public understanding of what hospitalists do;
- Better relationships with key hospital and community stakeholders; and
- Better use of down time for long-distance hospitalist commuters.
Regarding his first point, Dr. Grace finds that despite the growth of the hospitalist movement, many consumers still do not understand the role hospitalists play in patient care. Encountering hospitalists in the community helps patients put a public and familiar face on the concept. Community involvement can function as “direct-to-consumer advertising,” he says, when patients express a preference for hospitals based on their interface with hospitalists in the community. He notes that “the smaller the town, the more likely there will be a dividing line between the community and ‘outsiders.’ The chance to go from being an outsider to an insider can have a profound effect on your success, your future, and your happiness.”
Because the business of healthcare is based on relationships, interacting with hospital stakeholders at youth sporting events and other gatherings gives hospitalists a chance to build relationships away from the pressures of the work environment. At the core of community involvement, Dr. Grace says, is the reality that “we are social creatures. There’s something about developing a bond away from the hospital that provides a unique strength, compared to a bond formed solely in the hospital environment.”
Manikandan Nagendran, MD, medical director of the hospital medicine program at Dauterive Hospital in New Iberia, La., has strengthened his professional relationships through community participation. After completing his residency, he joined the Schumacher hospitalist program at Dauterive Hospital. Burt Bujard, MD, who had begun the HM program just two years prior, took Dr. Nagendran under his wing. Not only did he introduce Dr. Nagendran to community primary care providers and specialists, he also fostered his involvement with some of the hospital’s traditions, such as the Gumbo Cook-Off and annual Berry Ball. Organized by all the physicians and their spouses, “the Berry Ball is a great social event to meet lots of nurses, doctors, and administrative people,” Dr. Nagendran says.
During last year’s cook-off, he volunteered to help his group’s nurse practitioner and her husband, both New Iberia residents, set up their booth and serve gumbo to the public.
“When you encounter another physician or hospital administrator at an event, you always get to know something different about that person,” he says. “When you meet people on a different level at a social event, and exchange phone numbers, your relationship changes in many ways.”
Since he maintains his home in Lafayette, a 30-minute commute away, he wanted to invest time in New Iberia community activities. “One of the reasons I go to these events,” he says, “is so they understand that I’m part of their community here.
“When you meet these people in the hospital after an event, you are seen as more approachable. Especially for hospitalists, we need to build relationships.”
Six years ago, the Dauterive hospital medicine program had 15 contracts with community PCPs. That number is now up to 58.
And when Dr. Bujard retired in 2011, Dr. Nagendran became medical director.
Dr. Grace notes that community involvement can also serve to keep one’s life in balance. Referring to the “systolic/diastolic lifestyle” of hospitalist shifts, he says that “introducing a little bit of community and enjoyment into your down time can also increase job satisfaction during your work time.”
Gretchen Henkel is a freelance writer in San Luis Obispo, Calif.
Delay in ICD-10 Implementation to Impact Hospitalists, Physicians, Payers
On April 1, President Obama signed into law a bill that again delays a permanent fix of the sustainable growth rate formula, or SGR, the so-called “doc fix.” The bill also contained a surprise provision added by Congress to delay implementation of the switch from ICD-9 to ICD-10. The mandated conversion was supposed to take place by October 1 of this year; its delay will have a range of impacts on everyone from physicians to payers.
Hospitalists and others must weigh their options going forward, as many health systems and groups are already well on their way toward compliance with the 2014 deadline.
At this point, prevailing wisdom is that Congress added the delay as an appeasement to physician groups that would be unhappy about its failure to pass an SGR replacement, says Jeffrey Smith, senior director of federal affairs for CHIME, the College of Healthcare Information Management Executives.
“The appeasement, if in fact that was the motivation, was too little too late,” Smith says, adding Congress “caused a lot of unnecessary chaos.”
For instance, according to Modern Healthcare, executives at Catholic Health Initiatives had already invested millions of dollars updating software programs to handle the coding switch ahead of a new electronic health record system roll-out in 89 of its hospitals, which would not have been ready by the ICD-10 deadline.
“Anyone in the process has to circle the wagons again and reconsider their timelines,” Smith says. “The legislation has punished people trying to do the right thing.”
The transition to ICD-10 is a massive update to the 30-year-old ICD-9 codes, which no longer adequately reflect medical diagnoses, procedures, technology, and knowledge. There are five times more diagnosis codes and 21 times more procedural codes in ICD-10. It’s been on the table for at least a decade, and this was not the first delay.
In 2012, when fewer groups were on their way to compliance, CMS estimated that a one-year push-back of ICD-10 conversion could cost up to $306 million. With the latest delay, the American Health Information Management Association says CMS now estimates those costs between $1 billion and $6.6 billion.
However, according to the American Medical Association, which has actively lobbied to stop ICD-10 altogether, the costs of implementing ICD-10 range from $57,000 for small physician practices to as high as $8 million for large practices.
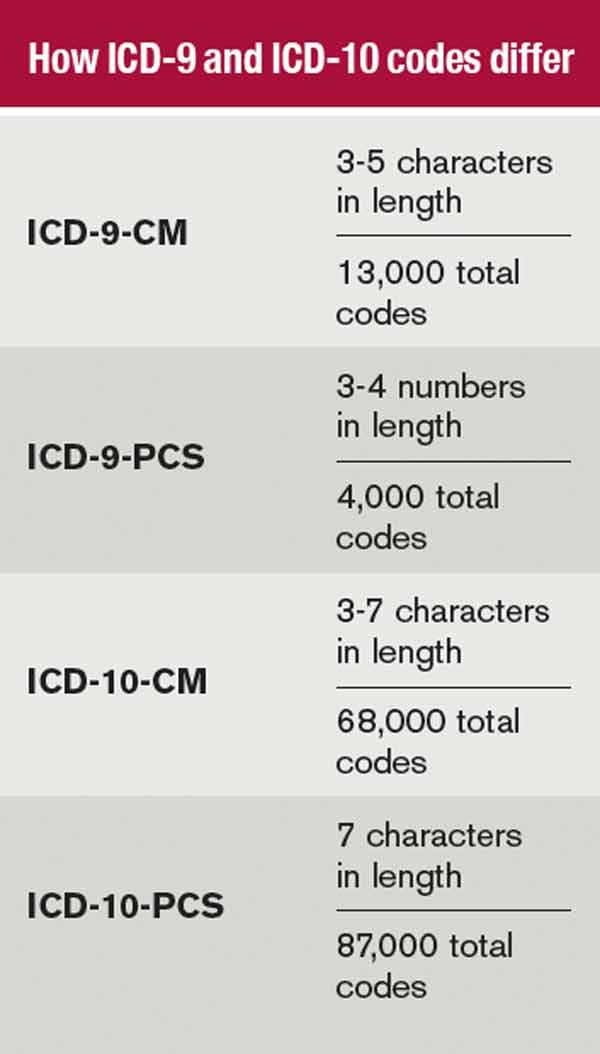
The increased number of codes, the increased number of characters per code, and the increased specificity require significant planning, training, software updates, and financial investments.
The Medical Group Management Association (MGMA) also pushed for ICD-10 delay, concerned that many groups would not be ready by Oct. 1. MGMA surveys showed as much, says Robert Tennant, senior policy advisor for MGMA.“We were concerned that if everyone has to flip the switch at the same time, there will be huge problems, as there were for healthcare.gov,” Tennant explains.
What MGMA would like to see is more thorough end-to-end testing and staggered roll-outs. Hospitals and health plans should be permitted to start using ICD-10 coding when they're ready, even if ahead of the next deadline, Tennant said. MGMA would also like to see a period of dual coding built in.
The ball is now in CMS' court.
“I think that CMS has within its power … the ability to embolden the industry to be more confident,” Smith says. “Even if it’s not going to require ICD-10 codes [by October 2014], hopefully they are still doing testing, still doing benchmarking, and by the time the deadline rolls around, it will touch every sector of the healthcare economy.”
Hospitalists, Smith says, should be more involved in the conversation going forward, to help maintain the momentum and preserve the investments made by their groups and institutions. Those not ready should push for compliance, rather than finding themselves in the same position a year from now.
Many of the hospital CIOs (chief information officers) he has talked to say that while they are stopping the car, they are keeping the engine running. Some will push for dual coding, even if only internally, because it’s proving to be a valuable tool in understanding their patient populations.
“It’s a frustrating time any time you have to kind of stop something with so much momentum, with hundreds of millions, if not billions, spent in advance of the conversion,” Smith says. “It does nothing to help care in this country to stay on ICD-9. Everybody understands those codes are completely exhausted, and the data we are getting out of it, while workable, is certainly not going to get us where we need to be in terms of transforming healthcare.”
Kelly April Tyrrell is a freelance writer in Madison, Wis.
On April 1, President Obama signed into law a bill that again delays a permanent fix of the sustainable growth rate formula, or SGR, the so-called “doc fix.” The bill also contained a surprise provision added by Congress to delay implementation of the switch from ICD-9 to ICD-10. The mandated conversion was supposed to take place by October 1 of this year; its delay will have a range of impacts on everyone from physicians to payers.
Hospitalists and others must weigh their options going forward, as many health systems and groups are already well on their way toward compliance with the 2014 deadline.
At this point, prevailing wisdom is that Congress added the delay as an appeasement to physician groups that would be unhappy about its failure to pass an SGR replacement, says Jeffrey Smith, senior director of federal affairs for CHIME, the College of Healthcare Information Management Executives.
“The appeasement, if in fact that was the motivation, was too little too late,” Smith says, adding Congress “caused a lot of unnecessary chaos.”
For instance, according to Modern Healthcare, executives at Catholic Health Initiatives had already invested millions of dollars updating software programs to handle the coding switch ahead of a new electronic health record system roll-out in 89 of its hospitals, which would not have been ready by the ICD-10 deadline.
“Anyone in the process has to circle the wagons again and reconsider their timelines,” Smith says. “The legislation has punished people trying to do the right thing.”
The transition to ICD-10 is a massive update to the 30-year-old ICD-9 codes, which no longer adequately reflect medical diagnoses, procedures, technology, and knowledge. There are five times more diagnosis codes and 21 times more procedural codes in ICD-10. It’s been on the table for at least a decade, and this was not the first delay.
In 2012, when fewer groups were on their way to compliance, CMS estimated that a one-year push-back of ICD-10 conversion could cost up to $306 million. With the latest delay, the American Health Information Management Association says CMS now estimates those costs between $1 billion and $6.6 billion.
However, according to the American Medical Association, which has actively lobbied to stop ICD-10 altogether, the costs of implementing ICD-10 range from $57,000 for small physician practices to as high as $8 million for large practices.
The increased number of codes, the increased number of characters per code, and the increased specificity require significant planning, training, software updates, and financial investments.
The Medical Group Management Association (MGMA) also pushed for ICD-10 delay, concerned that many groups would not be ready by Oct. 1. MGMA surveys showed as much, says Robert Tennant, senior policy advisor for MGMA.“We were concerned that if everyone has to flip the switch at the same time, there will be huge problems, as there were for healthcare.gov,” Tennant explains.
What MGMA would like to see is more thorough end-to-end testing and staggered roll-outs. Hospitals and health plans should be permitted to start using ICD-10 coding when they're ready, even if ahead of the next deadline, Tennant said. MGMA would also like to see a period of dual coding built in.
The ball is now in CMS' court.
“I think that CMS has within its power … the ability to embolden the industry to be more confident,” Smith says. “Even if it’s not going to require ICD-10 codes [by October 2014], hopefully they are still doing testing, still doing benchmarking, and by the time the deadline rolls around, it will touch every sector of the healthcare economy.”
Hospitalists, Smith says, should be more involved in the conversation going forward, to help maintain the momentum and preserve the investments made by their groups and institutions. Those not ready should push for compliance, rather than finding themselves in the same position a year from now.
Many of the hospital CIOs (chief information officers) he has talked to say that while they are stopping the car, they are keeping the engine running. Some will push for dual coding, even if only internally, because it’s proving to be a valuable tool in understanding their patient populations.
“It’s a frustrating time any time you have to kind of stop something with so much momentum, with hundreds of millions, if not billions, spent in advance of the conversion,” Smith says. “It does nothing to help care in this country to stay on ICD-9. Everybody understands those codes are completely exhausted, and the data we are getting out of it, while workable, is certainly not going to get us where we need to be in terms of transforming healthcare.”
Kelly April Tyrrell is a freelance writer in Madison, Wis.
Hospitals Lose $45.9 Billion in Uncompensated Care in 2012
Dollar value of uncompensated care provided by U.S. hospitals in 2012, expressed in terms of actual costs, according to data from the American Hospital Association’s Annual Survey of Hospitals.6 This figure represents 6.1% of total costs, an increase of 11.7% from 2011. The total includes both bad debt and charity care provided to patients unable to pay for their care, AHA says, but does not include underpayments by Medicare and Medicaid.
Larry Beresford is a freelance writer in Alameda, Calif.
References
- Bailey FA, Williams BR, Woodby LL, et al. Intervention to improve care at life's end in inpatient settings: The BEACON trial. J Gen Intern Med. 2014;29(6):836-843.
- Burling S. Yogurt a solution to hospital infection? Philadelphia Inquirer website. December 10, 2013. Available at: http://articles.philly.com/2013-12-10/news/44946926_1_holy-redeemer-probiotics-yogurt. Accessed June 5, 2014.
- Landelle C, Verachten M, Legrand P, Girou E, Barbut F, Buisson CB. Contamination of healthcare workers’ hands with Clostridium difficile spores after caring for patients with C. difficile infection. Infect Control Hosp Epidemiol. 2014;35(1):10-15.
- Lewis K, Walker C. Development and application of information technology solutions to improve the quality and availability of discharge summaries. Journal of Hospital Medicine RIV abstracts website. Available at: http://www.shmabstracts.com/abstract.asp?MeetingID=793&id=104276&meeting=JHM201305. Published May 2013. Accessed June 14, 2014.
- Snow V, Beck D, Budnitz T, et al. Transitions of Care Consensus Policy Statement. American College of Physicians; Society of General Internal Medicine; Society of Hospital Medicine; American Geriatrics Society; American College of Emergency Physicians; Society of Academic Emergency Medicine. J Gen Intern Med. 2009;24(8):971-976.
- American Hospital Association: Uncompensated hospital care cost fact sheet. January 2014. Available at: http://www.aha.org/content/14/14uncompensatedcare.pdf. Accessed June 5, 2014.