User login
Transforming vaginal hysterectomy: 7 solutions to the most daunting challenges
Vaginal hysterectomy is the preferred route to benign hysterectomy because it is associated with better outcomes and fewer complications than the laparoscopic and open abdominal approaches.1,2 Yet, despite superior patient outcomes and cost benefits, the rate of vaginal hysterectomy is declining.
According to the Nationwide Inpatient Sample, the use of vaginal hysterectomy declined from 24.8% in 1998 to 16.7% in 2010.3 In fact, more than 80% of surgeons in the United States now perform fewer than five vaginal procedures in a year.4
The increasing use of other minimally invasive routes, such as laparoscopy and robotics, indicates that most practicing surgeons and recent graduates are choosing these approaches over the vaginal route. In only 3 years, the rate of laparoscopy increased by 6% and robotics increased by almost 10%.3
Many surgeons assume that vaginal hysterectomy exists in a state of suspended animation, with nothing much changed in the way it has been performed over the past few decades. Further, vaginal surgery is difficult to teach and learn, given limitations in exposure and visualization, difficulty in securing hemostasis, and challenges in the removal of the large uterus and adnexae. As a result, vaginal hysterectomy often is thought, erroneously, to be indicated only in procedures involving a small and prolapsing uterus.
To increase the rate of vaginal hysterectomy, we can benefit from experience gained in laparoscopy and robotics—whether we are teachers or learners—while maintaining patient safety and containing costs.
In this article, I describe common challenges in vaginal hysterectomy and offer tools and techniques to overcome them:
- achieving and enhancing ergonomics, exposure, and visualization
- the need to work in a long vaginal vault
- the task of securing vascular and thick tissue pedicles when the introitus and vaginal vault are narrow.
The vaginal approach is less costly
Vaginal hysterectomy costs significantly less to perform than other approaches. At a tertiary referral center, vaginal hysterectomy costs approximately $7,000 to $18,000 per case less than laparoscopic, abdominal, and robotic hysterectomy.5 With declining use of vaginal hysterectomy and increasing use of more costly approaches, we face a health-care crisis.
Residents are inadequately trained to perform vaginal hysterectomy
Data reveal that not only are our recent graduates inadequately prepared to perform vaginal hysterectomy, but national health-care dollars and resources are depleted when surgeons choose to perform more costly approaches. As a result, many eligible patients end up deprived of the benefits of a single, concealed, and minimally invasive procedure.
The increase in laparoscopic and robotic approaches to hysterectomy has affected residency training. National case log reports from the Accreditation Council of Graduate Medical Education show that the number of vaginal hysterectomies performed by residents as “primary surgeons” decreased by 40%, from a mean of 35 cases in 2002 to 19 cases in 2012.6 A recent survey found that only 28% of graduating residents were “completely prepared” to perform a vaginal hysterectomy, compared with 58% for abdominal hysterectomy, 22% for laparoscopic hysterectomy, and 3% for the robotic approach.7
The rate of vaginal hysterectomy will continue to decline if we perform it in the same manner it was done 30 years ago. The current generation of practicing gynecologists and graduates is choosing to perform the procedure laparoscopically or robotically because of the advantages these technologies provide. It is time that we incorporate features from these minimally invasive approaches to streamline vaginal hysterectomy while maintaining patient safety and containing costs.
Challenges: Ergonomics, exposure, and visualization
In conventional vaginal surgery, the surgeon often is the person who has the best and, sometimes, the sole view. Two bedside assistants are required to hold retractors during the entire case, which can lead to fatigue and muscle strain. Poor lighting also can greatly limit visualization into the pelvic cavity.
Both laparoscopy and robotics provide a well-illuminated and magnified view, with three-dimensional images now available in both platforms. This view is projected to overhead monitors for the entire surgical team to see. Magnification of the pelvic anatomic structures and projection to an external monitor facilitate teaching and learning, better anticipation of the surgical and procedural needs, and overall patient safety.
From robotics, where ergonomics is exemplified, we also learn the importance of surgeon comfort during the procedure.
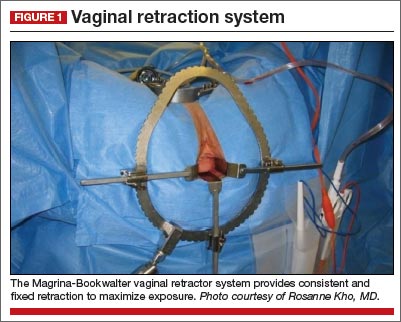
Solution #1: A self-retaining retractor
A self-retaining system such as the Magrina-Bookwalter vaginal retractor (Symmetry Surgical, Nashville, Tennessee) (FIGURE 1)
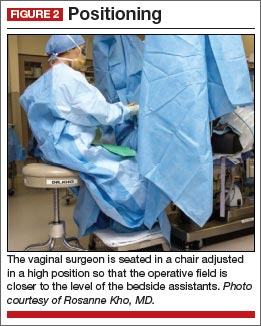
Solution #2: Seat the surgeon for an optimal view
With the patient in the lithotomy position and her legs in candy cane stirrups, the surgeon can be seated on a high chair so that the operative field is at the approximate level of the assistants’ view (FIGURE 2)
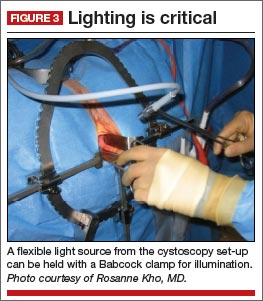
Solution #3: Illuminate the cavity
The deep pelvic cavity can be easily illuminated using a lighted suction tip, a flexible light source (as part of the cystoscopy set) held with a Babcock clamp (FIGURE 3), or a malleable illuminating mat taped to the retractor blades (such as Lightmat surgical illuminator, Lumitex, Inc., Strongsville, Ohio).
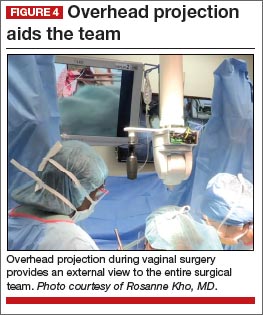
Solution #4: Project the image
Cameras attached to an overhead boom or operating room light handles (FIGURE 4) and an external telescope with integrated illumination, such as a standard cystoscope or VITOM Exoscope (Karl Storz, El Segundo, California) (FIGURE 5) provide both magnification and projection of the procedure to an overhead monitor.

Glass technology (Google, Mountain View, California) also has been utilized in surgery and can be a good application of simultaneous projection and recording of the procedure to an external monitor (FIGURE 6). Google Glass is a wearable computer with an optical head-mounted display. The device, similar to eyeglasses, is voice-activated, thereby allowing the surgeon to record the procedure hands-free. Simultaneous projection to an external monitor allows the entire team in the operating room to be aware of the flow of the procedure.

Challenge: Working in a narrow vaginal vault
Without correct instrumentation, this challenge can be especially daunting. Laparoscopy and robotics have changed the way we perform pelvic surgery by providing advanced instrumentation.
Solution #5: Adapt your instruments
Modified vaginal instruments can be used to facilitate a case. Watch the accompanying VIDEO on the use of improved vaginal instruments during morcellation.
The video associated with this article is no longer available on this site. Please view all of our videos on the MDedge YouTube channel |
| Click to enlarge >>> |
Among the instruments adaptable for vaginal surgery:
- curving, articulating instruments
- long, curved, and rounded knife handles, which allow for better ergonomics during prolonged morcellation
- modified long retractors and use of a single long vaginal pack provide retraction of loops of bowel and easy access to secure pedicles deep in the pelvis.
All of these instruments are available through Marina Medical in Sunrise, Florida.
Challenge: Securing vascular and thick tissue pediclesA narrow introitus and vaginal vault can be difficult to manage during vaginal surgery. Another challenge is a uterus that is large or deformed by multiple fibroids.
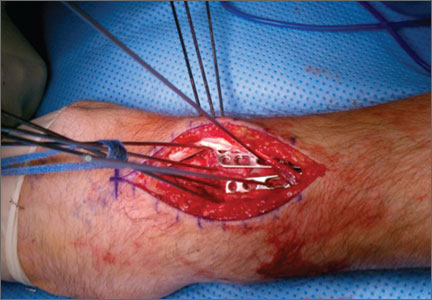
Solution #6: Vaginal incision
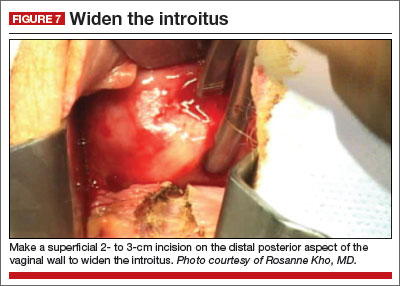
A simple superficial 2- to 3-cm incision on the distal posterior aspect of the vaginal wall can widen the introitus and vault to facilitate the procedure (FIGURE 7)
Solution #7: Vessel-sealing tools
The use of energy is integral to laparoscopy and robotics for dissection and securing vessels. In a meta-analysis that included seven randomized controlled trials, advanced vessel-sealing devices proved useful in vaginal surgery by decreasing blood loss and operative time.8
In the setting of a difficult vaginal hysterectomy with a narrow introitus and large uterus, the use of vessel-sealing technology allows the surgeon to skeletonize the uterine arteries while allowing progressive descensus to secure the upper pedicles.
In my experience, the use of an advanced vessel-sealing device, compared with traditional clamp-cut-tying technique, facilitated successful completion of vaginal hysterectomy in 650 patients with relative contraindications to the vaginal approach, such as nulliparity, a uterus weighing more than 250 g, and a history of cesarean delivery (Mayo Clinic data; yet unpublished).
We must change with the times
The rate of vaginal hysterectomy will continue to decline unless we modify our technique to incorporate new technology. The current generation of practicing gynecologists and recent graduates are choosing the laparoscopic and robotic approaches because of the advantages these technologies offer. It is time we incorporate relevant features from these minimally invasive approaches while maintaining patient safety and containing costs by performing vaginal hysterectomy whenever possible. A willingness to change and ability to think outside the usual box will help us train new generations of vaginal surgeons who can bring back vaginal hysterectomy as the preferred route to the benign hysterectomy.
WE WANT TO HEAR FROM YOU! Share your thoughts on this article. Send your Letter to the Editor to: [email protected]
1. Nieboer TE, Johnson N, Lethaby A, et al. Surgical approach to hysterectomy for benign gynaecological disease. Cochrane Database Syst Rev. 2009;(3):CD003677.
2. American College of Obstetricians and Gynecologists. ACOG Committee Opinion No. 444: Choosing the route of hysterectomy for benign disease. Obstet Gynecol. 2009;114(5):1156–1158.
3. Wright T, Herzog T, Tsul J, et al. Nationwide trends in inpatient hysterectomy in the United States. Obstet Gynecol. 2013:122(2):233–241.
4. Rogo-Gupta L, Lewyn S, Jum JH, et al. Effect of surgeon volume on outcomes and resource use for vaginal hysterectomy. Obstet Gynecol. 2010;116(6):1341–1347.
5. Wright KN, Jonsdottir GM, Jorgensen S, Shah N, Einarsson JI. Costs and outcomes of abdominal, vaginal, laparoscopic and robotic hysterectomies. JSLS. 2012;16(4):519–524.
6. Washburn EE, Cohen SL, Manoucherie E, Zurawin, RJ, Einarsson JI. Trends in reported residency surgical experience in hysterectomy [published online ahead of print June 4, 2014]. J Minim Invasive Gynecol. doi:10.1016/j.jmig.2014.05.005.
7. Burkett D, Horwitz J, Kennedy V, et al. Assessing current trends in resident hysterectomy training. Female Pelvic Med Reconstr Surg. 2011;17(5):210–214.
8. Kroft J, Selk K. Energy-based vessel sealing in vaginal hysterectomy. A systematic review and meta-analysis. Obstet Gynecol. 2011;118(5):1127–1136.

Rosanne M. Kho, MD
Dr. Kho is Assistant Professor, Director of the Urogynecology Program, and Co-Director of the MIGS Fellowship Program at Columbia University Medical Center in New York, New York.
The author reports that she is a consultant to Marina Medical and Symmetry Surgical.
Rosanne M. Kho, MD
Dr. Kho is Assistant Professor, Director of the Urogynecology Program, and Co-Director of the MIGS Fellowship Program at Columbia University Medical Center in New York, New York.
The author reports that she is a consultant to Marina Medical and Symmetry Surgical.
Rosanne M. Kho, MD
Dr. Kho is Assistant Professor, Director of the Urogynecology Program, and Co-Director of the MIGS Fellowship Program at Columbia University Medical Center in New York, New York.
The author reports that she is a consultant to Marina Medical and Symmetry Surgical.
Vaginal hysterectomy is the preferred route to benign hysterectomy because it is associated with better outcomes and fewer complications than the laparoscopic and open abdominal approaches.1,2 Yet, despite superior patient outcomes and cost benefits, the rate of vaginal hysterectomy is declining.
According to the Nationwide Inpatient Sample, the use of vaginal hysterectomy declined from 24.8% in 1998 to 16.7% in 2010.3 In fact, more than 80% of surgeons in the United States now perform fewer than five vaginal procedures in a year.4
The increasing use of other minimally invasive routes, such as laparoscopy and robotics, indicates that most practicing surgeons and recent graduates are choosing these approaches over the vaginal route. In only 3 years, the rate of laparoscopy increased by 6% and robotics increased by almost 10%.3
Many surgeons assume that vaginal hysterectomy exists in a state of suspended animation, with nothing much changed in the way it has been performed over the past few decades. Further, vaginal surgery is difficult to teach and learn, given limitations in exposure and visualization, difficulty in securing hemostasis, and challenges in the removal of the large uterus and adnexae. As a result, vaginal hysterectomy often is thought, erroneously, to be indicated only in procedures involving a small and prolapsing uterus.
To increase the rate of vaginal hysterectomy, we can benefit from experience gained in laparoscopy and robotics—whether we are teachers or learners—while maintaining patient safety and containing costs.
In this article, I describe common challenges in vaginal hysterectomy and offer tools and techniques to overcome them:
- achieving and enhancing ergonomics, exposure, and visualization
- the need to work in a long vaginal vault
- the task of securing vascular and thick tissue pedicles when the introitus and vaginal vault are narrow.
The vaginal approach is less costly
Vaginal hysterectomy costs significantly less to perform than other approaches. At a tertiary referral center, vaginal hysterectomy costs approximately $7,000 to $18,000 per case less than laparoscopic, abdominal, and robotic hysterectomy.5 With declining use of vaginal hysterectomy and increasing use of more costly approaches, we face a health-care crisis.
Residents are inadequately trained to perform vaginal hysterectomy
Data reveal that not only are our recent graduates inadequately prepared to perform vaginal hysterectomy, but national health-care dollars and resources are depleted when surgeons choose to perform more costly approaches. As a result, many eligible patients end up deprived of the benefits of a single, concealed, and minimally invasive procedure.
The increase in laparoscopic and robotic approaches to hysterectomy has affected residency training. National case log reports from the Accreditation Council of Graduate Medical Education show that the number of vaginal hysterectomies performed by residents as “primary surgeons” decreased by 40%, from a mean of 35 cases in 2002 to 19 cases in 2012.6 A recent survey found that only 28% of graduating residents were “completely prepared” to perform a vaginal hysterectomy, compared with 58% for abdominal hysterectomy, 22% for laparoscopic hysterectomy, and 3% for the robotic approach.7
The rate of vaginal hysterectomy will continue to decline if we perform it in the same manner it was done 30 years ago. The current generation of practicing gynecologists and graduates is choosing to perform the procedure laparoscopically or robotically because of the advantages these technologies provide. It is time that we incorporate features from these minimally invasive approaches to streamline vaginal hysterectomy while maintaining patient safety and containing costs.
Challenges: Ergonomics, exposure, and visualization
In conventional vaginal surgery, the surgeon often is the person who has the best and, sometimes, the sole view. Two bedside assistants are required to hold retractors during the entire case, which can lead to fatigue and muscle strain. Poor lighting also can greatly limit visualization into the pelvic cavity.
Both laparoscopy and robotics provide a well-illuminated and magnified view, with three-dimensional images now available in both platforms. This view is projected to overhead monitors for the entire surgical team to see. Magnification of the pelvic anatomic structures and projection to an external monitor facilitate teaching and learning, better anticipation of the surgical and procedural needs, and overall patient safety.
From robotics, where ergonomics is exemplified, we also learn the importance of surgeon comfort during the procedure.
Solution #1: A self-retaining retractor
A self-retaining system such as the Magrina-Bookwalter vaginal retractor (Symmetry Surgical, Nashville, Tennessee) (FIGURE 1)
Solution #2: Seat the surgeon for an optimal view
With the patient in the lithotomy position and her legs in candy cane stirrups, the surgeon can be seated on a high chair so that the operative field is at the approximate level of the assistants’ view (FIGURE 2)
Solution #3: Illuminate the cavity
The deep pelvic cavity can be easily illuminated using a lighted suction tip, a flexible light source (as part of the cystoscopy set) held with a Babcock clamp (FIGURE 3), or a malleable illuminating mat taped to the retractor blades (such as Lightmat surgical illuminator, Lumitex, Inc., Strongsville, Ohio).
Solution #4: Project the image
Cameras attached to an overhead boom or operating room light handles (FIGURE 4) and an external telescope with integrated illumination, such as a standard cystoscope or VITOM Exoscope (Karl Storz, El Segundo, California) (FIGURE 5) provide both magnification and projection of the procedure to an overhead monitor.
Glass technology (Google, Mountain View, California) also has been utilized in surgery and can be a good application of simultaneous projection and recording of the procedure to an external monitor (FIGURE 6). Google Glass is a wearable computer with an optical head-mounted display. The device, similar to eyeglasses, is voice-activated, thereby allowing the surgeon to record the procedure hands-free. Simultaneous projection to an external monitor allows the entire team in the operating room to be aware of the flow of the procedure.
Challenge: Working in a narrow vaginal vault
Without correct instrumentation, this challenge can be especially daunting. Laparoscopy and robotics have changed the way we perform pelvic surgery by providing advanced instrumentation.
Solution #5: Adapt your instruments
Modified vaginal instruments can be used to facilitate a case. Watch the accompanying VIDEO on the use of improved vaginal instruments during morcellation.
The video associated with this article is no longer available on this site. Please view all of our videos on the MDedge YouTube channel |
| Click to enlarge >>> |
Among the instruments adaptable for vaginal surgery:
- curving, articulating instruments
- long, curved, and rounded knife handles, which allow for better ergonomics during prolonged morcellation
- modified long retractors and use of a single long vaginal pack provide retraction of loops of bowel and easy access to secure pedicles deep in the pelvis.
All of these instruments are available through Marina Medical in Sunrise, Florida.
Challenge: Securing vascular and thick tissue pediclesA narrow introitus and vaginal vault can be difficult to manage during vaginal surgery. Another challenge is a uterus that is large or deformed by multiple fibroids.
Solution #6: Vaginal incision
A simple superficial 2- to 3-cm incision on the distal posterior aspect of the vaginal wall can widen the introitus and vault to facilitate the procedure (FIGURE 7)
Solution #7: Vessel-sealing tools
The use of energy is integral to laparoscopy and robotics for dissection and securing vessels. In a meta-analysis that included seven randomized controlled trials, advanced vessel-sealing devices proved useful in vaginal surgery by decreasing blood loss and operative time.8
In the setting of a difficult vaginal hysterectomy with a narrow introitus and large uterus, the use of vessel-sealing technology allows the surgeon to skeletonize the uterine arteries while allowing progressive descensus to secure the upper pedicles.
In my experience, the use of an advanced vessel-sealing device, compared with traditional clamp-cut-tying technique, facilitated successful completion of vaginal hysterectomy in 650 patients with relative contraindications to the vaginal approach, such as nulliparity, a uterus weighing more than 250 g, and a history of cesarean delivery (Mayo Clinic data; yet unpublished).
We must change with the times
The rate of vaginal hysterectomy will continue to decline unless we modify our technique to incorporate new technology. The current generation of practicing gynecologists and recent graduates are choosing the laparoscopic and robotic approaches because of the advantages these technologies offer. It is time we incorporate relevant features from these minimally invasive approaches while maintaining patient safety and containing costs by performing vaginal hysterectomy whenever possible. A willingness to change and ability to think outside the usual box will help us train new generations of vaginal surgeons who can bring back vaginal hysterectomy as the preferred route to the benign hysterectomy.
WE WANT TO HEAR FROM YOU! Share your thoughts on this article. Send your Letter to the Editor to: [email protected]
1. Nieboer TE, Johnson N, Lethaby A, et al. Surgical approach to hysterectomy for benign gynaecological disease. Cochrane Database Syst Rev. 2009;(3):CD003677.
2. American College of Obstetricians and Gynecologists. ACOG Committee Opinion No. 444: Choosing the route of hysterectomy for benign disease. Obstet Gynecol. 2009;114(5):1156–1158.
3. Wright T, Herzog T, Tsul J, et al. Nationwide trends in inpatient hysterectomy in the United States. Obstet Gynecol. 2013:122(2):233–241.
4. Rogo-Gupta L, Lewyn S, Jum JH, et al. Effect of surgeon volume on outcomes and resource use for vaginal hysterectomy. Obstet Gynecol. 2010;116(6):1341–1347.
5. Wright KN, Jonsdottir GM, Jorgensen S, Shah N, Einarsson JI. Costs and outcomes of abdominal, vaginal, laparoscopic and robotic hysterectomies. JSLS. 2012;16(4):519–524.
6. Washburn EE, Cohen SL, Manoucherie E, Zurawin, RJ, Einarsson JI. Trends in reported residency surgical experience in hysterectomy [published online ahead of print June 4, 2014]. J Minim Invasive Gynecol. doi:10.1016/j.jmig.2014.05.005.
7. Burkett D, Horwitz J, Kennedy V, et al. Assessing current trends in resident hysterectomy training. Female Pelvic Med Reconstr Surg. 2011;17(5):210–214.
8. Kroft J, Selk K. Energy-based vessel sealing in vaginal hysterectomy. A systematic review and meta-analysis. Obstet Gynecol. 2011;118(5):1127–1136.
![]()
Dr. Kho presents vaginal morcellation by hand, using advanced instrumentation
Key ways to differentiate a benign from a malignant adnexal mass
Click here to register for PAGS 2014 December 4 to 6 at the Bellagio in Las Vegas
More from PAGS 2013:
Lichen sclerosis: My approach to treatment
Michael Baggish, MD
Click here to register for PAGS 2014 December 4 to 6 at the Bellagio in Las Vegas
More from PAGS 2013:
Lichen sclerosis: My approach to treatment
Michael Baggish, MD
Click here to register for PAGS 2014 December 4 to 6 at the Bellagio in Las Vegas
More from PAGS 2013:
Lichen sclerosis: My approach to treatment
Michael Baggish, MD
Arthroscopic Anterior Shoulder Stabilization With Percutaneous Assistance and Posteroinferior Capsular Plication
Volar Plate Capsulodesis for Metacarpophalangeal Hyperextension With Basal Joint Arthritis
En Bloc Joystick Reduction of a Comminuted Intra-articular Distal Radius Fracture: A Technical Trick
A Perspective on the Evolution of Distal Radius Fracture Treatment
The treatment for distal radius fractures has changed significantly over time. Initially, distal radius fractures were treated as relatively innocuous injuries that befell the elderly and the comparatively inactive, and casts were the mainstay of treatment. However, closer scrutiny of the clinical results revealed a myriad of problems with these treatments, including “cast disease,” stiffness, inability to hold skeletal position, and soft-tissue compromise that affected the overall function of the wrist and hand.
Additional techniques to improve results included the “pins and plaster” technique, with the introduction of 2 pins in the radius and metacarpals to retard collapse of the fracture while in the cast. This was in some sense an early version of external fixation, with pins giving support to the unstable wrist and the body of the cast serving as the external support. There was further evolution of the adaptation of early versions of external fixation used for the lower extremity towards the treatment of the distal radius. For example, when I was a resident at Massachusetts General Hospital, we routinely applied femoral distractors as external fixation devices for selected distal radius fractures. This was a time when more specific anatomic devices and implants were not yet available.
External fixation evolved,1 and distal radius–specific systems, with enhanced ability to adjust and achieve reduction, became available in the late 1980s. At the same time, distal radius fracture plating evolved from simple “stamped metal” plates with screws that merely fit in the screw holes, to more highly engineered implants with screws that engaged the plate at a fixed angle, much like the blade plate
technology used for lower extremity fractures.2 Over time, the volar fixed-angle plating system supplanted the other treatments and emerged as a popular treatment method.
Use of Kirschner wires or simple pins has been promoted in the past for treatment of distal radius fractures. In France, Kapandji3 described the use of “intra-focal
pinning.” In this technique, smooth Kirschner wires are introduced in the fracture site itself, and then using leverage so that the pins act like “crowbars,” the distal fragment that is malpositioned becomes adjusted into a more anatomic position.3 Kapandji’s treatment can be very effective in achieving reduction; however, as there is no fixation into the distal fragment, this technique has limitations in maintaining the reduction until healing has occurred. Interfragmentary pinning from the dorsal radial and dorsal ulnar aspects were nicely described by Clancey.4 I have found great utility in combining the Kapandji intra-focal techniques to achieve reduction with Clancey pin fixation or distal radius plating to maintain reduction.
I was intrigued with the article by Drs. Siegall and Ziran, “En Bloc Joystick Reduction of a Comminuted Intraarticular Distal Radius Fracture: A Technical Trick,” in this month’s issue of The American Journal of Orthopedics. In their technique, the authors introduced a series of parallel pins or screws below the articular surface from radius to ulna in parallel fashion to provide provisional fixation for the intra-articular components of their complex fracture. Once having done so, they felt more secure in manipulating the distal radius component en bloc; in fact, they used strapping to provide distal traction on the external protruding portion of the pins to help achieve and maintain reduction for their definitive fixation. Drs. Siegall and Ziran describe the use of either Kirschner wires or plating to provide definitive fixation. In the example cited, they performed (via an open method) both the scaffolding and plating without the need of an assistant to hold or maintain the reduction during the osteosynthesis. I can envision adapting the technique they describe to percutaneous treatments for placement of the scaffolding pins, and even the Kapandji/Clancey pins under fluoroscopic guidance or arthroscopeassisted placement.
Despite the popularity and utility of volar fixed-angle plating techniques to treat distal radius fractures, there remain certain situations in which these techniques are faced with challenges. Certainly one of them is the more complex intra-articular fracture with multiple components, or in the very distal fracture patterns in which there is limited bone for the surgeon to use in providing distal screw fixation in the plating systems. Additionally, the nascent malunion presents some challenges as well in terms of performing a “takedown” of the partially healed fracture without destroying the soft, partially healed distal bone that contains the all-important articular component. These are the instances where supplemental techniques such as the one described by Drs. Siegall and Ziran, as well as the
Kapandji and Clancey techniques, have their greatest utility and appeal. Despite one’s wishes and best efforts, some distal radius fractures are not easily reconstructable. In these cases, use of external fixation or temporary arthrodesis
dorsal plating with subsequent plate removal5,6 can be the best reconstructive option and a great “bailout.” The prepared surgeon should have these supplemental techniques in their armamentarium to be able to adapt to the conditions that present themselves in the operating room and to do the best job they can for the patient.
References
1. Agee JM. External fixation. Technical advances based upon multiplanar
ligamentotaxis. Orthop Clin North Am. 1993;24(2):265-274.
2. Orbay JL, Fernandez DL. Volar fixed-angle plate fixation for unstable
distal radius fractures in the elderly patient. J Hand Surg Am. 2004;29(1):96-102.
3. Kapandji A. Internal fixation by double intrafocal plate. Functional treatment
of non articular fractures of the lower end of the radius (author’s transl) [in French]. Ann Chir. 1976;30(11-12):903-908.
4. Clancey GJ. Percutaneous Kirschner-wire fixation of Colles fractures. A prospective study of thirty cases. J Bone Joint Surg Am. 1984;66(7):1008-1014.
5. Burke EF, Singer RM. Treatment of comminuted distal radius with the use of an internal distraction plate. Tech Hand Up Extrem Surg. 1998;2(4):248-252.
6. Ruch DS, Ginn TA, Yang CC, Smith BP, Rushing J, Hanel DP. Use of a distraction plate for distal radial fractures with metaphyseal and diaphyseal comminution. J Bone Joint Surg Am. 2005;87(5):945-954.

Drug could prevent thrombocytopenia in MM

in the bone marrow
Researchers say they’ve identified a previously unknown but crucial component of the platelet production process.
And this discovery could help spare multiple myeloma (MM) patients from thrombocytopenia induced by the proteasome inhibitor bortezomib.
The researchers found that proteasome inhibition blocked platelet production in vitro and in vivo.
But fasudil, a Rho kinase inhibitor that is approved for use outside the US, restored platelet counts.
The researchers believe these findings, published in The Journal of Clinical Investigation, could translate to MM patients.
“A low platelet count is a big issue for people who receive bortezomib for this cancer,” said study author Andrew S. Weyrich, PhD, of the University of Utah in Salt Lake City.
“When platelet levels drop too low, it can mean interrupting treatment to allow the platelet count to recover. Fasudil potentially could help keep platelet counts normal while multiple myeloma patients receive bortezomib.”
Dr Weyrich and his colleagues found that bortezomib-induced proteasome inhibition prevented the production of proplatelets in both human and mouse megakaryocytes.
Megakaryocytes isolated from mice lacking PSMC1, an essential subunit of the 26S proteasome, also failed to produce proplatelets.
Further study revealed that the megakaryocytes’ inability to generate platelets was caused by the hyperactivation of RhoA, a protein that helps megakaryocytes maintain the proper shape to produce platelets.
When the researchers inhibited RhoA or its downstream target, Rho-associated protein kinase, in vitro, they were able to restore megakaryocyte proplatelet formation in the setting of proteasome inhibition.
Likewise, the Rho kinase inhibitor fasudil restored platelet counts in adult mice that had thrombocytopenia induced by proteasome inhibition.
Fasudil is approved in Japan and elsewhere to treat cerebral vasospasms, or constricted arteries that arise as a complication of brain aneurysms.
The drug is under investigation in US clinical trials for treating high blood pressure, diabetic macular edema, and other health issues.
There are no trials investigating fasudil’s effects on thrombocytopenia, but Dr Weyrich and his colleagues hope their study might change that. And if clinical trials produce favorable results, fasudil might be made available for MM patients much faster than a new drug.
“If the Food and Drug Administration did approve fasudil for use by multiple myeloma patients, it could, in principle, be moved to the clinic relatively fast in the United States,” Dr Weyrich said. ![]()
Healthy habits can cut risk of metabolic syndrome in childhood cancer survivors

patient and her father
Credit: Rhoda Baer
Following a healthy lifestyle can decrease the risk of metabolic syndrome in childhood cancer survivors, according to a study published in Cancer.
Unfortunately, only about a quarter of the survivors studied actually practiced healthy lifestyle habits, such as engaging in moderate physical activity; eating the recommended daily serving of fruits, vegetables, and complex carbohydrates; and consuming red meat, alcohol, and sodium in moderation.
Childhood cancer survivors are known to have an increased risk of developing metabolic syndrome.
The syndrome is actually a number of conditions—high blood pressure, increased body fat, and abnormal cholesterol and glucose levels—that, when they occur together, increase a person’s risk of heart disease, stroke, and diabetes.
Kirsten Ness, PhD, of St Jude Children’s Research Hospital in Memphis, Tennessee, and her colleagues wanted to determine if lifestyle habits might affect the risk of metabolic syndrome among childhood cancer survivors.
So the team analyzed 1598 survivors who were cancer-free for at least 10 years. They had a median age of 32.7 years (range, 18.9 to 60).
The analysis showed that failure to follow healthy lifestyle guidelines roughly doubled the survivors’ risk of developing metabolic syndrome. Women had a 2.4-times greater risk, and men had a 2.2-times greater risk of the syndrome if they did not follow the guidelines.
Metabolic syndrome was present in 31.8% of the participants—32.5% of males and 31% of females.
The researchers considered a subject to have metabolic syndrome if he had or received treatment for 3 or more of the following:
- Abdominal obesity (waist circumference of > 102 cm in males and > 88 cm in females)
- Triglycerides ≥ 150 mg/dL
- High-density lipoprotein cholesterol (< 40 mg/dL in males and < 50 mg/dL in females)
- Hypertension (systolic pressure ≥ 130 mm Hg or diastolic pressure ≥ 85 mm Hg)
- Fasting plasma glucose ≥ 100 mg/dL.
Questionnaires and tests helped the researchers assess whether participants followed healthy lifestyle recommendations issued by the World Cancer Research Fund and American Institute for Cancer Research.
The recommendations include:
- Having a body mass index of 25 or lower
- Engaging in moderate physical activity for 150 minutes each week
- Eating 5 or more servings of fruits and vegetables each day
- Consuming 400 g or more of complex carbohydrates daily
- Eating less than 80 g of red meat each day
- Consuming less than 2400 mg of sodium each day
- Low daily alcohol consumption (less than 14 g for females and less than 28 g for males).
Subjects who met at least 4 of these 7 criteria were classified as following the guidelines. And 27% of the participants—25.2% of males and 28.8% of females—were classified as such.
“These findings are important because they indicate that adults who were treated for cancer as children have the opportunity to influence their own health outcomes,” Dr Ness said.
“[A]dopting a lifestyle that includes maintaining a healthy body weight, regular physical activity, and a diet that includes fruits and vegetables and that limits refined sugars, excessive alcohol, red meat, and salt has potential to prevent development of metabolic syndrome.” ![]()
Malaria infection trial a game-changer, group says

Credit: Ute Frevert
and Margaret Shear
Investigators have reported success in the first clinical trial demonstrating controlled malaria infection in an African nation.
The study established that a product containing Plasmodium falciparum sporozoites can be used to safely infect volunteers with malaria in controlled lab conditions in a malaria-endemic country.
This represents a significant milestone in the search for new malaria drugs and vaccines, according to the investigators.
“We are extremely excited by the good results of this malaria challenge test, which opens up unprecedented opportunity for evaluation of new malaria drugs and vaccines in Africa,” said Salim Abdullah, PhD, of the Ifakara Health Institute Bagamoyo Research and Training Centre in Tanzania, where the study took place.
Dr Abdullah and his colleagues reported the results in the American Journal of Tropical Medicine and Hygiene. A related editorial is also available.
The researchers tested sporozoites that were grown in mosquitoes in the lab and then packaged in a purified, aseptic form acceptable for clinical trials. The product is known as PfSPZ Challenge and is owned by Sanaria, Inc., a privately held company in Rockville, Maryland.
Prior to this innovation, the ability to challenge a vaccine’s effectiveness required deliberately infecting vaccinated volunteers with malaria by exposing them to mosquito bites in an insectary.
Few such malaria insectaries exist, and due to the resources needed, these are limited to a handful in the US and Europe, far from the countries where malaria takes its toll.
This clinical trial established that injecting volunteers with cryopreserved, aseptic parasites can safely and effectively infect adult volunteers with P falciparum malaria in a malaria-endemic country.
“This innovation is a game-changer for malaria research and development in Africa,” said study author Stephen L. Hoffman, MD, of Sanaria, Inc. “This is about making available within Africa the same research tools to study malaria that we have in the USA and Europe.”
To test PfSPZ Challenge, the investigators recruited a group of 30 Tanzanian men, residents of Dar es Salaam, who had minimal exposure to malaria during the previous 5 years.
The volunteers were injected intradermally with 10,000 sporozoites (n=12), 25,000 sporozoites (n=11), or normal saline (n=6). Investigators and subjects were blinded to the intervention.
The investigators then compared the infection rate to that of volunteers who participated in a similar study in The Netherlands a few years ago.
After about 2 weeks, all but 2 of the 23 Tanzanian volunteers injected with sporozoites developed active infections, a rate similar to the Dutch volunteers.
Once active infection was established, the volunteers were immediately treated for malaria and cleared of parasites.
None of the volunteers developed serious side effects related to the study. Mild side effects included low-grade fever, headaches, and fatigue.
“This is a real step forward for developing a vaccine against malaria, which has killed more human beings throughout history than any other single cause,” said study author Christopher Plowe, MD, MPH, of the University of Maryland in Baltimore.
“The ability to safely administer malaria parasites by injection rather than by mosquito bite makes it possible to test new malaria vaccines, as well as drugs, anywhere in the world.” ![]()
FDA expands approved use of ibrutinib in CLL

Credit: Steven Harbour
The US Food and Drug Administration (FDA) has expanded the approved use of ibrutinib (Imbruvica) in patients with chronic lymphocytic leukemia (CLL).
The agency previously granted the drug accelerated approval to treat CLL patients who had received at least 1 prior therapy.
Now, the FDA has granted ibrutinib full approval for that indication and expanded the drug’s approved use to include previously treated and untreated CLL patients with 17p deletion.
The FDA’s decision to grant ibrutinib accelerated approval in CLL was based on the drug’s ability to elicit responses in previously treated patients.
Recent trial results have shown the drug can improve survival rates in CLL, which signifies a clinical benefit and allows the FDA to grant ibrutinib full approval.
Ibrutinib in CLL: Trial results
The expanded approval for ibrutinib is based on results of the phase 3 RESONATE trial, which were presented at this year’s ASCO and EHA meetings.
The trial included 391 previously treated patients, 127 of whom had 17p deletion. Patients were randomized to receive ibrutinib or the anti-CD20 monoclonal antibody ofatumumab until disease progression or unacceptable toxicity.
The trial was stopped early after a pre-planned interim analysis showed that ibrutinib-treated patients experienced a 78% reduction in the risk of disease progression or death.
At the time of interim analysis, the patients’ median time on study was 9.4 months. The best overall response among evaluable patients was 78% in the ibrutinib arm and 11% in the ofatumumab arm.
Ibrutinib significantly prolonged progression-free and overall survival. The median progression-free survival was 8.1 months in the ofatumumab arm and was not reached in the ibrutinib arm (P<0.0001). The median overall survival was not reached in either arm, but the hazard ratio was 0.434 (P=0.0049).
Of the 127 patients with 17p deletion, those treated with ibrutinib experienced a 75% reduction in the risk of disease progression or death.
Adverse events occurred in 99% of patients in the ibrutinib arm and 98% of those in the ofatumumab arm. Grade 3/4 events occurred in 51% and 39%, respectively.
Atrial fibrillation, bleeding-related events, diarrhea, and arthralgia were more common in the ibrutinib arm. Infusion-related reactions, peripheral sensory neuropathy, urticaria, night sweats, and pruritus were more common in the ofatumumab arm.
Ibrutinib in development
Ibrutinib is being studied alone and in combination with other treatments in several hematologic malignancies, including CLL, mantle cell lymphoma (MCL), Waldenstrom’s macroglobulinemia, diffuse large B-cell lymphoma, follicular lymphoma, and multiple myeloma.
Before the FDA granted ibrutinib accelerated approval in CLL, the agency granted the drug accelerated approval for use in previously treated MCL patients. Studies to verify ibrutinib’s clinical benefit in MCL are ongoing.
The European Medicines Agency’s Committee for Medicinal Products for Human Use has recommended marketing authorization for ibrutinib to treat adults with relapsed or refractory MCL.
The committee has also recommended the drug for adults with CLL who have received at least 1 prior therapy and CLL patients with 17p deletion or TP53 mutation who cannot receive chemo-immunotherapy.
Ibrutinib is already approved in Israel for the treatment of adults with MCL who have received at least 1 prior therapy.
Ibrutinib is under development by Janssen Biotech and Pharmacyclics, Inc. The companies co-market ibrutinib in the US, but Janssen markets (or will market) ibrutinib in the rest of the world. ![]()