User login
Beta-blockers cut CAS stroke, deaths
CHICAGO – Carotid artery stenting is safer if patients have been on beta-blockers for at least a month beforehand, according to a review of 5,248 stent cases during 2005-2014.
“Compared to nonusers, patients on long-term beta-blockers are at 34% less risk of stroke and death after carotid artery stenting [odds ratio, 0.66; 95% confidence interval, 0.46-0.95; P = .025], and this risk reduction is amplified to 65% in patients with postop hypertension [OR, 0.35; 95% CI, 0.17-0.73; P = .005].
“Beta-blockers significantly reduce the stroke and death risk ... and should be investigated prospectively for potential use during” carotid artery stenting (CAS), said senior investigator Dr. Mahmoud Malas, director of endovascular surgery and associate professor of surgery at Johns Hopkins Bayview Medical Center in Baltimore.
In the study, long-term beta-blocker use was not associated with postprocedure hypotension in the study. Among patients who developed it, however, beta-blockers were associated with a 48% reduction in the risk of stroke or death at 30 days (OR, 0.52; 95% CI, 0.28-0.98; P = .43).

“We think [the benefits are due to] up-regulation of adrenergic receptors. We think also there is better baroreceptor reflex sensitivity.” Long-term use of beta-blockers reduces heart rate variability, as well, and decreases the risk of hyperperfusion fourfold, Dr. Malas said at the meeting hosted by the Society for Vascular Surgery.
The researchers looked into the issue because they are trying to find a way to make CAS safer in the wake of the Carotid Revascularization Endarterectomy versus Stent Trial (CREST) and others that have shown increased risk compared with carotid endarterectomy.
The subjects were all captured in SVS’s Vascular Quality Initiative database; 2,152 were not on beta-blockers before CAS, 259 were on them for less than 30 days, and 2,837 were on them for more than 30 days.
There were no statistical between-group differences in lesion sites, approach (femoral in almost all the cases), or contrast volume used in surgery, a marker of case complexity.
Long-term users had more diabetes, hypertension, coronary artery disease, and congestive heart failure, whereas short-term users were more symptomatic; those and other differences were controlled for on multivariate analysis.
Aspirin, clopidogrel, and statin use were similar between the groups. About two-thirds of the subjects were men, and the average patientage in the study was about 70 years old.
Overall, the 30-day stroke and death rate was 3.4% (minor stroke 1.5%, major 0.9%, and death 1.2%).
Predictors of postoperative stroke or death at 30 days included symptomatic status, age, diabetes, and perioperative hypotension and hypertension. Prior carotid endarterectomy and distal embolic protection were both protective.
The investigators reported that they had no disclosures.
This retrospective study by Malas et al. showed a 34% significant reduction of stroke and death in patients undergoing carotid artery stenting (CAS) who had been on beta-blockade (BB) for at least 1 month beforehand. Presumably, most of these patients were already on longstanding BB. Current cardiology guidelines recommend the continuation of established BB for surgical patients, and this may also mitigate the cardiac risk in CAS patients. The short-term use of BB has been shown to have risk during and after noncardiac surgery and, intuitively, could lead to severe hypotension during CAS. The reason for the stroke reduction seen with well-established BB is not clearly understood.
This study begs the question: Should every patient being considered for CAS be on BB at least 1 month before the intervention, even those with few or no cardiac risk factors? If so, then it would be difficult to advocate for CAS in acutely symptomatic patients not already on a BB, thus further limiting the usefulness of this procedure.
Dr. Mark L. Friedell is chairman of the department of Surgery, University of Missouri Kansas City School of Medicine.
CHICAGO – Carotid artery stenting is safer if patients have been on beta-blockers for at least a month beforehand, according to a review of 5,248 stent cases during 2005-2014.
“Compared to nonusers, patients on long-term beta-blockers are at 34% less risk of stroke and death after carotid artery stenting [odds ratio, 0.66; 95% confidence interval, 0.46-0.95; P = .025], and this risk reduction is amplified to 65% in patients with postop hypertension [OR, 0.35; 95% CI, 0.17-0.73; P = .005].
“Beta-blockers significantly reduce the stroke and death risk ... and should be investigated prospectively for potential use during” carotid artery stenting (CAS), said senior investigator Dr. Mahmoud Malas, director of endovascular surgery and associate professor of surgery at Johns Hopkins Bayview Medical Center in Baltimore.
In the study, long-term beta-blocker use was not associated with postprocedure hypotension in the study. Among patients who developed it, however, beta-blockers were associated with a 48% reduction in the risk of stroke or death at 30 days (OR, 0.52; 95% CI, 0.28-0.98; P = .43).
“We think [the benefits are due to] up-regulation of adrenergic receptors. We think also there is better baroreceptor reflex sensitivity.” Long-term use of beta-blockers reduces heart rate variability, as well, and decreases the risk of hyperperfusion fourfold, Dr. Malas said at the meeting hosted by the Society for Vascular Surgery.
The researchers looked into the issue because they are trying to find a way to make CAS safer in the wake of the Carotid Revascularization Endarterectomy versus Stent Trial (CREST) and others that have shown increased risk compared with carotid endarterectomy.
The subjects were all captured in SVS’s Vascular Quality Initiative database; 2,152 were not on beta-blockers before CAS, 259 were on them for less than 30 days, and 2,837 were on them for more than 30 days.
There were no statistical between-group differences in lesion sites, approach (femoral in almost all the cases), or contrast volume used in surgery, a marker of case complexity.
Long-term users had more diabetes, hypertension, coronary artery disease, and congestive heart failure, whereas short-term users were more symptomatic; those and other differences were controlled for on multivariate analysis.
Aspirin, clopidogrel, and statin use were similar between the groups. About two-thirds of the subjects were men, and the average patientage in the study was about 70 years old.
Overall, the 30-day stroke and death rate was 3.4% (minor stroke 1.5%, major 0.9%, and death 1.2%).
Predictors of postoperative stroke or death at 30 days included symptomatic status, age, diabetes, and perioperative hypotension and hypertension. Prior carotid endarterectomy and distal embolic protection were both protective.
The investigators reported that they had no disclosures.

Big declines seen in aspergillosis mortality
SAN DIEGO – In-hospital mortality in patients with aspergillosis plummeted nationally, according to data from 2001-2011, with the biggest improvement seen in immunocompromised patients traditionally considered at high mortality risk, Dr. Masako Mizusawa reported at the annual Interscience Conference on Antimicrobial Agents and Chemotherapy.
The decline in in-hospital mortality wasn’t linear. Rather, it followed a stepwise pattern, and those steps occurred in association with three major advances during the study years: Food and Drug Administration approval of voriconazole in 2002, the FDA’s 2003 approval of the galactomannan serologic assay allowing for speedier diagnosis of aspergillosis, and the 2008 Infectious Diseases Society of America clinical practice guidelines on the treatment of aspergillosis (Clin Infect Dis. 2008 Feb 1;46[3]:327-60).

“This was an observational study and we can’t actually say that these events are causative. But just looking at the time relationship, it certainly looks plausible,” Dr. Mizusawa said.
In addition, the median hospital length of stay decreased from 9 to 7 days in patients with this potentially life-threatening infection, noted Dr. Mizusawa of Tufts Medical Center, Boston.
She presented what she believes is the largest U.S. longitudinal study of hospital care for aspergillosis. The retrospective study used nationally representative data from the Agency for Healthcare Research and Quality’s Healthcare Utilization and Cost Project–Nationwide Inpatient Sample.
Dr. Mizusawa and coinvestigators defined aspergillosis patients as being at high mortality risk if they had established risk factors indicative of immunocompromise, including hematologic malignancy, neutropenia, recent stem cell or solid organ transplantation, HIV, or rheumatologic disease. Patients at lower mortality risk included those with asthma, COPD, diabetes, malnutrition, pulmonary tuberculosis, or non-TB mycobacterial infection.
The proportion of patients who were high risk climbed over the years, from 41% among the 892 patients with aspergillosis-related hospitalization in the 2001 sample to 50% among 1,420 patients in 2011. Yet in-hospital mortality in high-risk patients fell from 26.4% in 2001 to 9.1% in 2011. Meanwhile, the mortality rate in lower-risk patients improved from 14.6% to 6.6%. The overall in-hospital mortality rate went from 18.8% to 7.7%.
Of note, the proportion of aspergillosis patients with renal failure jumped from 9.8% in 2001 to 21.5% in 2011, even though the treatments for aspergillosis are relatively non-nephrotoxic, with the exception of amphotericin B. The outlook for these patients has improved greatly: In-hospital mortality for aspergillosis patients in renal failure went from 40.2% in 2001 to 16.1% in 2011.
While in-hospital mortality and length of stay were decreasing during the study years, total hospital charges for patients with aspergillosis were going up: from a median of $29,998 in 2001 to $44,888 in 2001 dollars a decade later. This cost-of-care increase was confined to patients at lower baseline risk or with no risk factors. Somewhat surprisingly, the high-risk group didn’t have a significant increase in hospital charges over the 10-year period.
“Maybe we’re just doing a better job of treating them, so they may not necessarily have to use a lot of resources,” Dr. Mizusawa offered as explanation.
She reported having no financial conflicts regarding this unfunded study.
SAN DIEGO – In-hospital mortality in patients with aspergillosis plummeted nationally, according to data from 2001-2011, with the biggest improvement seen in immunocompromised patients traditionally considered at high mortality risk, Dr. Masako Mizusawa reported at the annual Interscience Conference on Antimicrobial Agents and Chemotherapy.
The decline in in-hospital mortality wasn’t linear. Rather, it followed a stepwise pattern, and those steps occurred in association with three major advances during the study years: Food and Drug Administration approval of voriconazole in 2002, the FDA’s 2003 approval of the galactomannan serologic assay allowing for speedier diagnosis of aspergillosis, and the 2008 Infectious Diseases Society of America clinical practice guidelines on the treatment of aspergillosis (Clin Infect Dis. 2008 Feb 1;46[3]:327-60).
“This was an observational study and we can’t actually say that these events are causative. But just looking at the time relationship, it certainly looks plausible,” Dr. Mizusawa said.
In addition, the median hospital length of stay decreased from 9 to 7 days in patients with this potentially life-threatening infection, noted Dr. Mizusawa of Tufts Medical Center, Boston.
She presented what she believes is the largest U.S. longitudinal study of hospital care for aspergillosis. The retrospective study used nationally representative data from the Agency for Healthcare Research and Quality’s Healthcare Utilization and Cost Project–Nationwide Inpatient Sample.
Dr. Mizusawa and coinvestigators defined aspergillosis patients as being at high mortality risk if they had established risk factors indicative of immunocompromise, including hematologic malignancy, neutropenia, recent stem cell or solid organ transplantation, HIV, or rheumatologic disease. Patients at lower mortality risk included those with asthma, COPD, diabetes, malnutrition, pulmonary tuberculosis, or non-TB mycobacterial infection.
The proportion of patients who were high risk climbed over the years, from 41% among the 892 patients with aspergillosis-related hospitalization in the 2001 sample to 50% among 1,420 patients in 2011. Yet in-hospital mortality in high-risk patients fell from 26.4% in 2001 to 9.1% in 2011. Meanwhile, the mortality rate in lower-risk patients improved from 14.6% to 6.6%. The overall in-hospital mortality rate went from 18.8% to 7.7%.
Of note, the proportion of aspergillosis patients with renal failure jumped from 9.8% in 2001 to 21.5% in 2011, even though the treatments for aspergillosis are relatively non-nephrotoxic, with the exception of amphotericin B. The outlook for these patients has improved greatly: In-hospital mortality for aspergillosis patients in renal failure went from 40.2% in 2001 to 16.1% in 2011.
While in-hospital mortality and length of stay were decreasing during the study years, total hospital charges for patients with aspergillosis were going up: from a median of $29,998 in 2001 to $44,888 in 2001 dollars a decade later. This cost-of-care increase was confined to patients at lower baseline risk or with no risk factors. Somewhat surprisingly, the high-risk group didn’t have a significant increase in hospital charges over the 10-year period.
“Maybe we’re just doing a better job of treating them, so they may not necessarily have to use a lot of resources,” Dr. Mizusawa offered as explanation.
She reported having no financial conflicts regarding this unfunded study.
AT ICAAC 2015
Key clinical point: In-hospital mortality has more than halved for patients with aspergillosis-related hospitalization during a recent 10-year period.
Major finding: In-hospital mortality among patients with an aspergillosis-related hospitalization fell nationally from 18.8% in 2001 to 7.7% in 2011, with the biggest drop occurring in those at high risk.
Data source: A retrospective study of nationally representative data from the Healthcare Utilization and Cost Project–Nationwide Inpatient Sample for 2001-2011.
Disclosures: The presenter reported having no financial conflicts regarding this unfunded study.
Haplo-HSCT appears comparable to fully matched HSCT
![]()
Photo by Chad McNeeley
A retrospective study suggests that, for patients with hematologic disorders, a haploidentical hematopoietic stem cell transplant (HSCT)
can be roughly as safe and effective as a fully matched HSCT.
The study showed that, when patients received an identical conditioning regimen, graft T-cell dose, and graft-vs-host disease (GVHD) prophylaxis, haploidentical and fully matched HSCTs produced comparable results.
Patients had similar rates of overall and progression-free survival, relapse, non-relapse mortality, and chronic GVHD.
However, patients who received haploidentical transplants had higher rates of grade 2-4 acute GVHD and cytomegalovirus reactivation.
Researchers reported these results in Biology of Blood and Marrow Transplantation.
“This is the first study to compare the gold standard to a half-match using an identical protocol,” said Neal Flomenberg, MD, of Thomas Jefferson University in Philadelphia, Pennsylvania.
“The field has debated whether the differences in outcomes between full and partial matches were caused by the quality of the match or by all the procedures the patient goes through before and after the donor cells are administered. We haven’t had a clear answer.”
With that in mind, Dr Flomenberg and his colleagues compared 3-year outcome data from patients who received haploidentical HSCTs (n=50) or fully matched HSCTs (n=27), when both groups of patients were treated with a 2-step protocol.
The patients had acute myeloid leukemia (n=38), acute lymphoblastic leukemia (n=20), myelodysplastic syndromes/myeloproliferative neoplasms (n=7), non-Hodgkin lymphoma (n=11), and aplastic anemia (n=1).
The 2-step protocol
All patients received a myeloablative conditioning regimen consisting of 12 Gy of total body irradiation administered in 8 fractions over 4 days. After the last fraction, they received a fixed T-cell dose (2 x 10⁸ cells/kg), which was followed, 2 days later, by cyclophosphamide at 60 mg/kg/day for 2 days.
Twenty-four hours after they completed cyclophosphamide, patients received CD34-selected peripheral blood stem cells from a half-matched or fully matched donor.
On day -1, patients began taking tacrolimus and mycophenolate mofetil as GVHD prophylaxis. They also received growth factor support (granulocyte-macrophage colony-stimulating factor at 250 μg/m2) starting on day +1.
In the absence of GVHD, mycophenolate mofetil was discontinued on day 28 and tacrolimus was tapered, starting on day +60 after HSCT.
Results
The researchers said that early immune recovery was comparable between the patient groups in nearly all assessed T-cell subsets. The exception was the median CD3/CD8 cell count, which was significantly higher at day 28 in the fully matched group than the haploidentical group (P=0.029).
Survival rates were comparable between the groups. The estimated 3-year overall survival was 70% in the haploidentical group and 71% in the fully matched group (P=0.81). The 3-year progression-free survival was 68% and 70%, respectively (P=0.97).
The 3-year cumulative incidence of non-relapse mortality was 10% in the haploidentical group and 4% in the fully matched group (P=0.34). The 3-year cumulative incidence of relapse was 21% and 27%, respectively (P=0.93).
The 100-day cumulative incidence of grade 2-4 acute GVHD was significantly higher in the haploidentical group than the fully matched group—40% and 8%, respectively (P<0.001). But there was no significant difference in the incidence of grade 3-4 acute GVHD—6% and 4%, respectively (P=0.49).
The cumulative incidence of chronic GVHD at 2 years was not significantly different between the haploidentical and fully matched groups—19% and 12%, respectively (P=0.47). The same was true for severe chronic GVHD—4% and 8%, respectively (P=0.49).
The cumulative incidence of cytomegalovirus reactivation was significantly higher in the haploidentical group than the fully matched group—68% and 19%, respectively (P<0.001).
There were no deaths from infections or GVHD in either group.
“The results of the current study are certainly encouraging and suggest that outcomes from a half-matched, related donor are similar to fully matched donors,” said study author Sameh Gaballa, MD, also of Thomas Jefferson University.
“It might be time to reassess whether half-matched, related transplants can be considered the best alternative donor source for patients lacking a fully matched family member donor. For that, we’ll need more evidence from a randomly controlled, prospective trial, rather than studies that look at patient data retrospectively, to help solidify our findings here.” ![]()
Method can identify CTCL quickly, study suggests
High-throughput sequencing (HTS) may enable earlier diagnosis of cutaneous T-cell lymphoma (CTCL), according to a study published in Science Translational Medicine.
Researchers said HTS, which provided new insights into the biology of CTCL, accurately diagnosed 100% of patients with the disease, including those with early stage and recurrent CTCL.
HTS exhibited greater sensitivity and specificity than polymerase chain reaction.
The researchers noted that, in CTCL, cancerous T cells accumulate in the skin, causing skin tumors but also rashes that are often mistaken for benign inflammatory skin conditions. And this delays diagnosis.
“Using current methods, it takes, on average, 6 years for patients to receive a definitive CTCL diagnosis,” said Rachael Clark, MD, PhD, of Brigham and Women’s Hospital in Boston, Massachusetts.
“As a result, appropriate therapy is delayed, often until the disease worsens to the point where diagnosis is clear, but effective treatment is more difficult.”
In search of a new diagnostic approach, Dr Clark and her colleagues used HTS to analyze T-cell receptor genes from blood and skin tissue samples. The team compared samples from 46 CTCL patients to samples from healthy individuals and patients with psoriasis, eczema, and other non-cancerous, inflammatory skin diseases.
By identifying and quantifying malignant T cells, HTS accurately distinguished CTCL from other skin diseases in all 46 patients. In contrast, polymerase chain reaction correctly identified 70% of the CTCL samples, often missing earlier-stage tumors.
For a subset of patients, the researchers used HTS to track malignant T cells over time, allowing them to detect early recurrence and monitor patient response to treatment.
HTS also revealed new insights into the cell of origin for CTCL, which has remained unresolved. The researchers found that CTCL arises from mature T cells, a discovery that may aid the development of more effective therapy.
The team said that, altogether, their findings suggest HTS is a promising tool for guiding earlier diagnosis and, thus, treatment of CTCL patients.
HTS was performed using ImmunoSEQ, an assay developed by Adaptive Biotechnologies. The company did not sponsor the study, but company employees were involved in the research. ![]()
Findings may inform design of new treatments for JMML

Image from the Salk Institute
Researchers have used induced pluripotent stem cells (iPSCs) to model juvenile myelomonocytic leukemia (JMML) and gain new insight into the disease.
The team noted that somatic PTPN11 mutations are known to cause JMML, germline PTPN11 defects cause Noonan syndrome (NS), and specific inherited mutations cause NS/JMML.
With their work, the researchers found that hematopoietic cells differentiated from iPSCs harboring NS/JMML-causing PTPN11 mutations recapitulate the features of JMML.
They described this work in Cell Reports.
“By studying an inherited human cancer syndrome, our study clarified early events in the development of [JMML],” said Bruce D. Gelb, MD, of the Icahn School of Medicine at Mount Sinai in New York, New York.
“More than just creating a model of a disease, we were able to prove that mechanisms seen in our model also happen in the bone marrow of people with this kind of leukemia.”
Specifically, the team found that NS/JMML myeloid cells derived from iPSCs demonstrated increased signaling through STAT5 and upregulation of 2 microRNAs—miR-223 and miR-15a.
Likewise, miR-223 and miR-15a were upregulated in 11 of 19 bone marrow samples from patients with JMML harboring PTPN11 mutations.
However, the microRNAs were not upregulated in patients without PTPN11 mutations. And when the researchers reduced miR-223’s function in NS/JMML iPSCs, they observed a normalization of myelogenesis.
“Going into the current study, experts in the field had tended to lump all forms of JMML together, but the new study was able to isolate biological changes specific to hematopoietic cells with PTPN11 mutations, which causes more severe JMML,” Dr Gelb said.
He and his colleagues also found that microRNA target gene expression levels were reduced in the iPSC-derived myeloid cells and in cells from JMML patients with PTPN11 mutations.
“Our results provide further evidence that the severity of this form of leukemia arises from the degree of changes in the gene PTPN11, altering the protein it codes for, SHP-2, and biologic pathways related to it,” Dr Gelb said. “These proteins promise to become a focus of future drug design efforts.” ![]()
Smartphone use may put patient data at risk

Photo by Daniel Sone
A new survey suggests that doctors and nurses in London are routinely using their own smartphones for patient care.
Investigators say the current lack of data encryption on these devices could result in the inadvertent disclosure of “highly sensitive and confidential data” in the absence of an active organizational strategy on digital security.
The team raised this issue and reported results of the survey in BMJ Innovations.
Mohammad H. Mobasheri, MBBS, of Imperial College London in the UK, and his colleagues wanted to determine how healthcare professionals are using digital technology on the frontline.
So the investigators invited more than 6000 clinical staff at 5 London hospitals of varying sizes to complete a questionnaire on ownership and use of portable devices and mobile health apps in the workplace.
The results are based on the responses of 287 doctors and 564 nurses from different specialties.
About 99% of doctors said they owned a smartphone, and 73.5% owned a tablet. The equivalent figures for nurses were 95.1% and 64.7%, respectively.
When asked about the usefulness of smartphones for carrying out clinical duties, 92.6% of doctors and 53.2% of nurses said these devices were “very useful” or “useful.”
Most doctors (93.8%) used their smartphone while at work to communicate with their colleagues, compared with 28.5% of nurses. About half of the doctors (50.2%) used their smartphone instead of a traditional bleep (page).
About 78% of doctors and 34.8% of nurses said they had downloaded a medical app to their device, with 89.6% of doctors and 67.1% of nurses saying they used these apps as part of their clinical work.
Of those who owned a medical app and used it at work, 41.3% of doctors reported using such an app weekly, and 33% said they used one daily. The equivalent figures for nurses were 42% and 22.3%, respectively.
The apps included drug formularies, medical calculators, and those for disease diagnosis and treatment, reference and education, documentation and drug preparation.
When asked if they had ever sent patient data over their smartphones using SMS, app-based messaging (such as WhatsApp), and picture messaging using their smartphone camera, many respondents said they had done so.
About 65% of doctors had used SMS, 33.1% had used app-based messaging, and 46% had used their phone’s camera and picture messaging to send a photo of a wound or X-ray to a colleague. The corresponding figures for nurses were much lower—13.8%, 5.7%, and 7.4%, respectively.
About 28% of doctors and 3.6% of nurses said they still retained clinical information on their smartphones.
A substantial proportion of respondents said they wanted to be able to use their own devices at work. About 72% of doctors and 37.2% of nurses wanted a secure means of sending patient data to colleagues using their own smartphone.
Fully secure messaging services for smartphones are not yet available in the UK, and the data are unlikely to be encrypted, according to investigators. They therefore urged National Health Service organizations to make sure their staff understands the potential risks of sharing patient information via their unsecured smartphones.
The team said the results of this survey provide strong evidence that healthcare organizations need to develop policies to support the safe and secure use of digital technologies in the workplace. ![]()
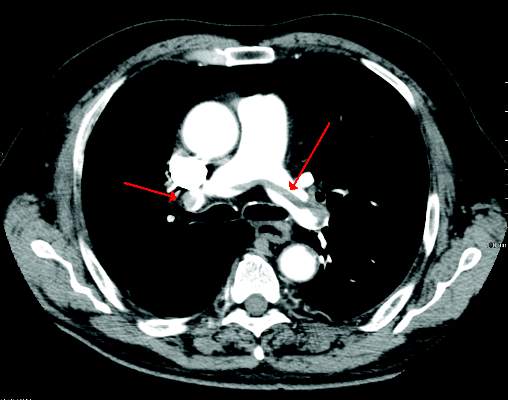
Endovascular treatment of acute IVC thrombosis found effective
Endovascular treatment of acute thrombosis of the inferior vena cava is safe and effective with excellent short-term results, according to the results of a 10-year retrospective review reported by Dr. Khanjan H. Nagarsheth and his colleagues at the Staten Island University (N.Y.) Hospital.
Dr. Nagarsheth and his colleagues assessed 25 patients (44% men) with a mean age of 50.3 years, who underwent catheter-directed treatment in either the operating room or the angiography suite for acute (existing for less than 2 weeks) symptomatic IVC thrombosis (Annals Vasc Surg. 2015; 29:1373-9).
All patients had a prior history of deep vein thrombosis; 21 patients had an IVC filter at presentation.
Endovascular treatment was successful in all 25 patients. The greater majority of patients (22, 88%) received both catheter-directed thrombolysis (CDT) and pharmacomechanical thrombectomy; the remaining 3 patients received CDT alone.
Significant (greater than 50% luminal gain) angiographic resolution of the venous thromboembolism was achieved in all patients, with 23 (92%) reporting moderate to complete symptomatic improvement immediately after the procedure. At the median follow-up of 54.3 weeks, symptomatic improvement was noted in all patients, and complete symptom resolution was seen in 16 (89%). None of the IVC filters were removed and 67% of patients had a patent IVC at last follow-up.
“An aggressive endovascular approach to treatment of [acute thrombosis of the] IVC is warranted even in the presence of a thrombosed caval filter,” the authors concluded.
The authors did not indicate the existence of any conflicts.
Read the full study online in the Annals of Vascular Surgery.
FROM THE ANNALS OF VASCULAR SURGERY
PDT with daylight effective in clearing AKs of the face, scalp
Photodynamic therapy (PDT) using daylight was as effective as PDT with an artificial light source in clearing grade I actinic keratoses (AKs) of the face and scalp after 3 months, but was associated with less pain and less severe side effects in a small Italian study.
In addition, most of the patients preferred the treatment with daylight photodynamic therapy (DL-PDT), reported Dr. Maria Concetta Fargnoli of the University of L’Aquila (Italy) and her associates (J Eur Acad Dermatol Venereol. 2015 Oct;29[10]:1926-32).
The prospective intrapatient study compared the effects of DL-PDT with conventional PDT (c-PDT) at 3 months in 35 patients with multiple grade I AKs of the face and scalp in September and October 2013. Patients were treated with c-PDT on one side of the face and DL-PDT on the other side. For c-PDT, light therapy was administered after methyl aminolevulinate (MAL) cream was applied to the treatment area and occluded. For DL-PDT, MAL cream was applied to the treatment area, left uncovered for 30 minutes in the dark; patients then exposed these areas to daylight for 2 hours, between 11 a.m. and 3 p.m., after which the cream was wiped off.
At 3 months, the complete response rate of grade I AKs was 87% for DL-PDT and 91% for c-PDT, which was not a significant difference. It was less effective for grade II and III AKs in the study, though, and at 6 months, the recurrence rate for grade I AKs treated with DL-PDT was higher (17%) than for those treated with c-PDT (12%), with a P value less than .05.
Treatment with DL-PDT was associated with significantly less pain and less severe adverse events, with less erythema, crusting, and pustular eruption 2 days after treatment. In addition, 88% of the patients were more satisfied with DL-PDT, the authors said.
“Our study confirms that DL-PDT using MAL is an effective, safe, and convenient alternative for the treatment of grade I AKs ,” they concluded. “Interestingly, clinical response for AK I was significantly moderated by outdoor temperature, increasing at higher temperatures.”
The authors had no conflicts of interest. Dr. Fargnoli received a research grant from Galderma, Italy, but Galderma played no role in the study, according to the study’s disclosure statement. Galderma manufactures the MAL cream product used in the study.
FROM THE JOURNAL OF THE EUROPEAN ACADEMY OF DERMATOLOGY AND VENEREOLOGY
Key clinical point: Photodynamic therapy using daylight was as effective as PDT with an artificial light source in clearing grade I actinic keratoses of the face and scalp after 3 months, but was associated with less pain and less severe side effects, and was more acceptable to patients.
Major finding: At 3 months, the complete response rate of grade I AKs treated with daylight photodynamic therapy was 87% vs. 91% among those treated with conventional PDT (P = .16).
Data source: A prospective intrapatient, left-right study compared the effects of daylight PDT with methyl aminolevulinate cream and conventional PDT at 3 months in 35 patients with grade I AKs. c-PDT was also combined with application of the MAL cream.
Disclosures: The authors had no financial conflicts of interest. Dr. Fargnoli received a research grant from Galderma, Italy, but Galderma played no role in the study, according to the study’s disclosure statement. Galderma manufactures the MAL cream product used in the study.
Does psychiatric treatment prevent suicide?
Over the past 2 decades, more and more people have been treated with antidepressant medications. In the same period of time, suicide rates have gone up – not down. To those of us who treat patients, this fact is both surprising and perplexing. It seems that suicidal thoughts are a common feature of major depression, and when the depressive symptoms abate with treatment, the suicidal thoughts dissipate. Intuitively, it seems that treating depression on a larger scale should prevent suicides, but we still don’t know that conclusively.
According to the National Health and Nutrition Examination Survey (NHANES), 11% percent of Americans over the age of 12 are taking an antidepressant medication. In women aged 40-59, this number is 23%. Of those taking antidepressants, only one-third have seen a mental health professional in the past 12 months. What also is striking is that for people surveyed with symptoms of severe depression, only one-third were on medication.

In 2013, just over 40,000 Americans died of suicide. From 2000 to 2013, the suicide rate per 100,000 Americans has steadily increased from 10.4 to 12.6 per 100,000 people. While we know that people with psychiatric illnesses have higher rates of suicide compared with the general population, what we don’t know is whether the people dying are the same people who are getting treatment.
Thinking about this gets very difficult. It has been estimated that 90% of those who die of suicide have suffered from a mental illness. This figure includes those who were treated, untreated, and previously treated, but the studies have methodologic inconsistencies and that 90% estimate may not be accurate. Certainly, however, people die of suicide for reasons that have nothing to do with psychiatric illness, and we do know that impulsive responses to distressing circumstances are a factor, especially when a lethal method is easily available.
Several studies have shown that antidepressant use, particularly in older adults, may be associated with a decrease in suicidality. The studies often combine suicide attempts and completions. The issues with younger patients are more complicated, and in recent weeks, the reanalysis of the 2001 Paxil 329 study has again raised issues about the safety of certain antidepressants in children and adolescents. The data for all these studies are both confusing and contradictory, and are not easy to examine or interpret.
We also don’t know what role psychotherapy plays. A study done at Johns Hopkins Bloomberg School of Public Health looked at the follow-up for 65,000 people in Denmark who had attempted suicide and found that the rates for completed suicide dropped if the patient received a short course of psychosocial therapy at a suicide prevention center. But again, this study looked at a select group of people who had already attempted suicide.
I began to think it might help to ask these questions in a closed system where patients could be tallied with regard to requests for treatment, what type of treatment was provided, and even access to autopsy results. The U.S. Department of Veterans Affairs seemed to be a source where such answers might be found. It has been reported that 22 veterans a day die by suicide, and many veterans get their care in VA facilities, with VA pharmacy benefits, and treatment effects can, in theory, be studied.
Hoping to get a better sense of the relationship between treatment and suicide, I met with Robert Bossarte, Ph.D., director of the Epidemiology Program in the VA’s Office of Public Health. His career has been focused on suicide prevention.
The first thing Dr. Bossarte did was dissuade me of the idea that the VA is a closed system. Not all veterans receive lifelong benefits from the VA, and the formulas for determining who is entitled to what benefits, and for how long, is rather complicated. Dr. Bossarte also noted that some patients go outside of the system for their care.
“What we do know is that among those who have used VA services in the previous year, about 2,000 veterans a year die from suicide. It’s been hovering around that for the past decade,” Dr. Bossarte explained, again emphasizing that many veterans do not receive care at VA facilities. “We published a report in 2012 where we estimated 22 veterans a day die by suicide and that caught fire, but it is purely an estimate. The truth is we have no idea what the real count is, because until we began working on the Suicide Data Repository there was no national register of veteran mortality and there has been no way for us to know.”
Dr. Bossarte anticipates that the VA will have the data necessary to calculate more accurate statistics by the end of the year. “More than 70% of veteran suicide are in people over age 50; but the rates are going up most among the youngest.”
A notable drop in veteran suicide rates for those who used services occurred between 2001 and 2003, and that decrease remains unexplained; it preceded later changes in mental health services and enhanced suicide prevention programs. Dr. Bossarte also pointed out that just under half of veterans who die from suicide have no mental health diagnosis, despite yearly screening to identify people who may be suffering from posttraumatic stress disorder, alcohol-related disorders, and depression.
“The attention on veteran suicide started around 2007,” Dr. Bossarte explained. “Mark Kaplan published a study using publicly available mortality data; those who reported they were veterans were twice as likely to die of suicide as those who were not.”
While this sparked interest in veteran suicide, it’s important to note that a replication of that study in 2012 by Matthew Miller did not have the same findings.
“Then, in 2008, for the first time in recent history,” Dr. Bossarte continued, “the suicide rate among active duty military personnel exceeded that of the general population. Traditionally, rates of suicide in this population have been 40%-50% lower than in the general population. The increased rate was seen primarily in the Army and Marines. Serious mental illness may make people ineligible for military service, as can violent and disruptive behavior – things that are associated with suicide – so you tended to get a healthier population in the military.”
Dr. Bossarte noted that there was conjecture that increased suicide rates among active military might be related to more waivers that allowed people to enlist who would not ordinarily be eligible, and/or to higher rates of deployment. He went on to talk about Army STARRS (Army Study to Assess Risk and Resilience in Servicemembers).
“STARRS devoted $50 million over 5 years to the largest suicide study and did not find an effect of waivers. They did report a higher suicide rate among those who were deployed, however. But then Tim Bullman in my office looked at suicide rates 7 years after separation from service, and he reported a higher suicide rate among those who were never deployed.” The VA studies, I quickly realized, were also confusing and contradictory.
The VA has greatly expanded its mental health and suicide prevention services. For veterans overall, suicide rates have stabilized, but they have not decreased. For those veterans with psychiatric disorders, however, the suicide rates have gone down.
“When you ask ‘does treatment matter?’ it’s so hard to disentangle psychotherapy from pharmacotherapy. Over the past decade, we’ve seen a significant decrease in the suicide rate among those veterans with mental health disorders. We’ve looked at suicide rates every way you can think of. One thing we do know is that the better the relationship with the clinician, the lower the suicide risk.”
We talked about the role of hospitalization in preventing suicide, and Dr. Bossarte noted that the highest risk for suicide is immediately following hospital discharge.
“We are looking at people hospitalized after their first-ever suicide attempts and rates of mortality, including suicidal behavior, for 1 year after discharge. In very preliminary findings, we didn’t see any difference in the outcome for either all-cause mortality or repeat suicide attempts in those who were hospitalized, compared to those who were not. We don’t yet know about completed suicide.”
I left my discussion with Dr. Bossarte with more questions than answers. We have reason to believe that treatment helps, but we still don’t know which treatments help which people, and we do know that treatment doesn’t prevent suicide in every patient. In a culture where “treatment” has come to be equated with “prescribing” and is often based on a checklist of symptoms done by a primary care clinician, one might wonder if combining psychotherapy and medication – an increasingly rare offering – might have a better outcome. Simply put, for a problem that prematurely takes more than 40,000 lives a year, we know much too little.
Dr. Miller is a coauthor of “Shrink Rap: Three Psychiatrists Explain Their Work” (Baltimore: Johns Hopkins University Press, 2011).
Over the past 2 decades, more and more people have been treated with antidepressant medications. In the same period of time, suicide rates have gone up – not down. To those of us who treat patients, this fact is both surprising and perplexing. It seems that suicidal thoughts are a common feature of major depression, and when the depressive symptoms abate with treatment, the suicidal thoughts dissipate. Intuitively, it seems that treating depression on a larger scale should prevent suicides, but we still don’t know that conclusively.
According to the National Health and Nutrition Examination Survey (NHANES), 11% percent of Americans over the age of 12 are taking an antidepressant medication. In women aged 40-59, this number is 23%. Of those taking antidepressants, only one-third have seen a mental health professional in the past 12 months. What also is striking is that for people surveyed with symptoms of severe depression, only one-third were on medication.
In 2013, just over 40,000 Americans died of suicide. From 2000 to 2013, the suicide rate per 100,000 Americans has steadily increased from 10.4 to 12.6 per 100,000 people. While we know that people with psychiatric illnesses have higher rates of suicide compared with the general population, what we don’t know is whether the people dying are the same people who are getting treatment.
Thinking about this gets very difficult. It has been estimated that 90% of those who die of suicide have suffered from a mental illness. This figure includes those who were treated, untreated, and previously treated, but the studies have methodologic inconsistencies and that 90% estimate may not be accurate. Certainly, however, people die of suicide for reasons that have nothing to do with psychiatric illness, and we do know that impulsive responses to distressing circumstances are a factor, especially when a lethal method is easily available.
Several studies have shown that antidepressant use, particularly in older adults, may be associated with a decrease in suicidality. The studies often combine suicide attempts and completions. The issues with younger patients are more complicated, and in recent weeks, the reanalysis of the 2001 Paxil 329 study has again raised issues about the safety of certain antidepressants in children and adolescents. The data for all these studies are both confusing and contradictory, and are not easy to examine or interpret.
We also don’t know what role psychotherapy plays. A study done at Johns Hopkins Bloomberg School of Public Health looked at the follow-up for 65,000 people in Denmark who had attempted suicide and found that the rates for completed suicide dropped if the patient received a short course of psychosocial therapy at a suicide prevention center. But again, this study looked at a select group of people who had already attempted suicide.
I began to think it might help to ask these questions in a closed system where patients could be tallied with regard to requests for treatment, what type of treatment was provided, and even access to autopsy results. The U.S. Department of Veterans Affairs seemed to be a source where such answers might be found. It has been reported that 22 veterans a day die by suicide, and many veterans get their care in VA facilities, with VA pharmacy benefits, and treatment effects can, in theory, be studied.
Hoping to get a better sense of the relationship between treatment and suicide, I met with Robert Bossarte, Ph.D., director of the Epidemiology Program in the VA’s Office of Public Health. His career has been focused on suicide prevention.
The first thing Dr. Bossarte did was dissuade me of the idea that the VA is a closed system. Not all veterans receive lifelong benefits from the VA, and the formulas for determining who is entitled to what benefits, and for how long, is rather complicated. Dr. Bossarte also noted that some patients go outside of the system for their care.
“What we do know is that among those who have used VA services in the previous year, about 2,000 veterans a year die from suicide. It’s been hovering around that for the past decade,” Dr. Bossarte explained, again emphasizing that many veterans do not receive care at VA facilities. “We published a report in 2012 where we estimated 22 veterans a day die by suicide and that caught fire, but it is purely an estimate. The truth is we have no idea what the real count is, because until we began working on the Suicide Data Repository there was no national register of veteran mortality and there has been no way for us to know.”
Dr. Bossarte anticipates that the VA will have the data necessary to calculate more accurate statistics by the end of the year. “More than 70% of veteran suicide are in people over age 50; but the rates are going up most among the youngest.”
A notable drop in veteran suicide rates for those who used services occurred between 2001 and 2003, and that decrease remains unexplained; it preceded later changes in mental health services and enhanced suicide prevention programs. Dr. Bossarte also pointed out that just under half of veterans who die from suicide have no mental health diagnosis, despite yearly screening to identify people who may be suffering from posttraumatic stress disorder, alcohol-related disorders, and depression.
“The attention on veteran suicide started around 2007,” Dr. Bossarte explained. “Mark Kaplan published a study using publicly available mortality data; those who reported they were veterans were twice as likely to die of suicide as those who were not.”
While this sparked interest in veteran suicide, it’s important to note that a replication of that study in 2012 by Matthew Miller did not have the same findings.
“Then, in 2008, for the first time in recent history,” Dr. Bossarte continued, “the suicide rate among active duty military personnel exceeded that of the general population. Traditionally, rates of suicide in this population have been 40%-50% lower than in the general population. The increased rate was seen primarily in the Army and Marines. Serious mental illness may make people ineligible for military service, as can violent and disruptive behavior – things that are associated with suicide – so you tended to get a healthier population in the military.”
Dr. Bossarte noted that there was conjecture that increased suicide rates among active military might be related to more waivers that allowed people to enlist who would not ordinarily be eligible, and/or to higher rates of deployment. He went on to talk about Army STARRS (Army Study to Assess Risk and Resilience in Servicemembers).
“STARRS devoted $50 million over 5 years to the largest suicide study and did not find an effect of waivers. They did report a higher suicide rate among those who were deployed, however. But then Tim Bullman in my office looked at suicide rates 7 years after separation from service, and he reported a higher suicide rate among those who were never deployed.” The VA studies, I quickly realized, were also confusing and contradictory.
The VA has greatly expanded its mental health and suicide prevention services. For veterans overall, suicide rates have stabilized, but they have not decreased. For those veterans with psychiatric disorders, however, the suicide rates have gone down.
“When you ask ‘does treatment matter?’ it’s so hard to disentangle psychotherapy from pharmacotherapy. Over the past decade, we’ve seen a significant decrease in the suicide rate among those veterans with mental health disorders. We’ve looked at suicide rates every way you can think of. One thing we do know is that the better the relationship with the clinician, the lower the suicide risk.”
We talked about the role of hospitalization in preventing suicide, and Dr. Bossarte noted that the highest risk for suicide is immediately following hospital discharge.
“We are looking at people hospitalized after their first-ever suicide attempts and rates of mortality, including suicidal behavior, for 1 year after discharge. In very preliminary findings, we didn’t see any difference in the outcome for either all-cause mortality or repeat suicide attempts in those who were hospitalized, compared to those who were not. We don’t yet know about completed suicide.”
I left my discussion with Dr. Bossarte with more questions than answers. We have reason to believe that treatment helps, but we still don’t know which treatments help which people, and we do know that treatment doesn’t prevent suicide in every patient. In a culture where “treatment” has come to be equated with “prescribing” and is often based on a checklist of symptoms done by a primary care clinician, one might wonder if combining psychotherapy and medication – an increasingly rare offering – might have a better outcome. Simply put, for a problem that prematurely takes more than 40,000 lives a year, we know much too little.
Dr. Miller is a coauthor of “Shrink Rap: Three Psychiatrists Explain Their Work” (Baltimore: Johns Hopkins University Press, 2011).

ESC model predicts recurrent VTE risk
Recurrent venous thromboembolism was significantly associated with a higher European Society of Cardiology (ESC) pulmonary embolism score. This association was independent of other factors such as age, sex, and body mass index, according to a long-term, prospective follow-up study of 627 patients with a first episode of pulmonary embolism.
In addition, unprovoked PE and varicose veins of the lower limbs also increased recurrence risk, while longer anticoagulation treatment reduced it (Intnl J Cardiol. 2016;202:275-81).

Dr. Shuai Zhang of the Beijing Institute of Respiratory Medicine and coauthors categorized their patients into three groups according to the ESC risk stratification model (Eur Heart J. 2008;29:2276-315). These were low-, intermediate-, and high-risk groups. Of the 627 patients, 84 had suspected VTE recurrence, 68 of whom had this confirmed by imaging diagnosis and were designated as the recurrent group. The 1-, 2-, and 5-year cumulative incidences of recurrent VTE were 4.5%. 7.3%, and 13.9%, respectively.
The researchers compared the 68 recurrent to the 559 nonrecurrent patients; all patients had had a first episode of PE.
Compared with nonrecurrent VTE patients, the recurrent group had significantly more high-risk and intermediate-risk patients, and the high-risk and intermediate-risk patients overall had significantly more cumulative recurrent events than the low-risk group. Multivariate analysis confirmed the association between higher risk in ESC stratification and VTE recurrence independent of age, sex, and body mass index.
Based on these results, the authors stated that, “The severity of disease should be considered in determining the initial treatment and duration of follow-up anticoagulation.”
“These finding support the notion that optimized therapy based on risk stratification is valuable while treating PE patients,” they concluded.
The authors reported having no conflicts of interest.
Read the full study online in the International Journal of Cardiology.
Recurrent venous thromboembolism was significantly associated with a higher European Society of Cardiology (ESC) pulmonary embolism score. This association was independent of other factors such as age, sex, and body mass index, according to a long-term, prospective follow-up study of 627 patients with a first episode of pulmonary embolism.
In addition, unprovoked PE and varicose veins of the lower limbs also increased recurrence risk, while longer anticoagulation treatment reduced it (Intnl J Cardiol. 2016;202:275-81).
Dr. Shuai Zhang of the Beijing Institute of Respiratory Medicine and coauthors categorized their patients into three groups according to the ESC risk stratification model (Eur Heart J. 2008;29:2276-315). These were low-, intermediate-, and high-risk groups. Of the 627 patients, 84 had suspected VTE recurrence, 68 of whom had this confirmed by imaging diagnosis and were designated as the recurrent group. The 1-, 2-, and 5-year cumulative incidences of recurrent VTE were 4.5%. 7.3%, and 13.9%, respectively.
The researchers compared the 68 recurrent to the 559 nonrecurrent patients; all patients had had a first episode of PE.
Compared with nonrecurrent VTE patients, the recurrent group had significantly more high-risk and intermediate-risk patients, and the high-risk and intermediate-risk patients overall had significantly more cumulative recurrent events than the low-risk group. Multivariate analysis confirmed the association between higher risk in ESC stratification and VTE recurrence independent of age, sex, and body mass index.
Based on these results, the authors stated that, “The severity of disease should be considered in determining the initial treatment and duration of follow-up anticoagulation.”
“These finding support the notion that optimized therapy based on risk stratification is valuable while treating PE patients,” they concluded.
The authors reported having no conflicts of interest.
Read the full study online in the International Journal of Cardiology.
FROM THE INTERNATIONAL JOURNAL OF CARDIOLOGY