User login
Frailty is a state of vulnerability that encompasses a heterogeneous group of people.[1] Because it lacks a precise definition, multiple tools have been developed to identify frailty in both clinical and research settings.[2, 3, 4] Prevalence of frailty depends on the frailty assessment tool used and the population studied, ranging from 4% to 17% when the Fried score[5, 6, 7] is used and from 5% to 44%[5, 7, 8] when cumulative deficit models like the Frailty Index are utilized, with the lower prevalences being in younger community‐dwelling elderly populations and the higher proportions being in older institutionalized populations.
The Frailty Index, also called the Burden or Cumulative Deficit Model, comprises 70 domains that include mobility, mood, function, cognitive impairment, and disease states. It is multidimensional and allows for patients to be categorized on a continuum of frailty, but it is extremely difficult to apply in clinical practice. Recognizing this, Rockwood et al.[9] developed and validated the Clinical Frailty Scale (CFS) in the Canadian Study of Health and Aging. The CFS classifies patients into 1 of 9 categories: very fit, well, managing well, vulnerable, mildly frail (needs help with at least 1 instrumental activity of daily living such as shopping, finances, meal preparation, or housework), moderately frail (needs help with 1 or 2 activities of daily living such as bathing and dressing), severely frail (dependent for personal care), very severely frail (bedbound), and terminally ill. Although this tool is easy to use in clinical practice, it reflects a gestalt impression and requires some clinical judgement.
The Fried score[6] is a prototypical phenotype tool based on 5 criteria that include weight loss, self‐reported exhaustion, low energy expenditure, slowness of gait, and weakness. Recent evidence has suggested that slow gait (or dysmobility) alone may also be a potential screening test for frailty.[10] A recent systematic review[11] demonstrated an association between slow gait (dysmobility) and increased mortality. Dysmobility negatively impacts quality of life and has a strong association with disability resulting in the need for an increased level of care.[12] The Timed Up and Go Test (TUGT) is one method of assessing mobility which is relatively easy to perform, does not require special equipment, and is feasible to use in clinical settings.[13] However, whether impaired mobility predicts outcomes within the first 30 days after hospital discharge (a timeframe highlighted in the Affordable Care Act and used by the Centers for Medicare and Medicaid Services as an important hospital quality indicator) is still uncertain.
The aim of this study was to compare frailty assessments using the CFS and 2 of the most commonly used phenotypic tools (a modified Fried score and the TUGT as a proxy for mobility assessment) to determine which tools best predict postdischarge outcomes.
METHODS
Study Design and Population
As described in detail elsewhere,[14] this was a prospective cohort study that enrolled adult patients (any age older than 18 years) at the time of discharge back to the community from 7 general internal medicine wards in 2 teaching hospitals in Edmonton, Alberta between October 2013 and November 2014. We excluded patients admitted from, or being discharged back to, long‐term care facilities or other acute care hospitals, or from out of the province; patients who were unable to communicate in English; patients with moderate or severe cognitive impairment (scoring 5 or more on the Short Portable Mental Status Questionnaire); or patients with projected life expectancy of less than 3 months. All patients provided written consent, and the study was approved by the Health Research Ethics board of the University of Alberta (project ID Pro00036880).
We assessed the degree of frailty within 24 hours of discharge in 3 ways. First, we used the CFS[9, 15] with patients being asked to rate their best functional status in the week prior to admission. As per the CFS validations studies, scores 5 were defined as frail.[9, 15] Second, we used the TUGT as a proxy for slow gait speed/dysmobility (with >20 seconds defined as abnormal).[13] The TUGT was recorded as the shortest recorded time of the 2 timed trials to get up from a seated position, walk 10 feet and back, and then sit in the chair again. Third, we also determined their Fried score[6] (using the modifications outlined below) and categorized the patients as frail if they scored 3 or more. Of the 5 Fried categories, we assessed weakness by grip strength in their dominant hand using a Jamar handheld dynamometer and weight loss of 10 lb or more in the past year based on patient self‐report; these are identical to the original Fried scale description. Grip strength in the lowest quintile for sex and body mass index was defined as weak grip strength as per convention in the literature, which corresponded to less than 28.5 kg for men and less than 18.5 kg for women.[16, 17] We assessed the other 3 Fried categories in modified fashion as follows. For slow gait, rather than assessing time to walk 15 feet as in the original study and assigning a point to those testing in the lowest quintile for their age/sex, we used the TUGT, because our research personnel were already trained in this test, and we were doing it already as part of the discharge package for all patients.[13] For the Fried category of low activity, we based this on patient self‐report using the relevant questions in the EuroQoL Questionnaire (EQ‐5D); the Fried score used self‐report with a different questionnaire. Finally, for self‐reported exhaustion we used the questions in the Patient Health Questionnaire 9 (PHQ‐9)[18] analogous to those used from the Center for Epidemiological Studies depression scale in the original Fried description. We did this as we were evaluating the PHQ‐9 in our cohort already, and did not want to increase responder burden by presenting them with 2 depression questionnaires.
We followed all patients until 30 days after discharge, and outcome data (all‐cause mortality or all‐cause readmission) were collected by research personnel blinded to the patient's frailty status at discharge using patient/caregiver self‐report and analysis of the provincial electronic health record. We included deaths in or out of the hospital, and all readmissions were unplanned.
We examined the correlation between the CFS score (5 vs 5) and (1) the modified Fried score (3 vs 3) and (2) TUGT (20 seconds vs >20 seconds) using chance corrected kappa coefficients. In our previous article[14] we reported the association between the CFS and readmissions/hospitalizations within 30 days of discharge. In this article we examine whether either the Fried score or TUGT accurately and independently predict postdischarge readmissions/deaths, and whether they add additional prognostic information to the CFS assessment by comparing models with/without each definition using the C statistic and the Integrated Discrimination Improvement index. All analyses were performed using SAS version 9.4 (SAS Institute, Cary, NC), with P values of 0.05 considered statistically significant. Subgroup analysis was done in patients older than 65 years.
RESULTS
Of 1124 potentially eligible patients, 626 were excluded because of patient refusal (n = 227); transfer to/from another hospital, long‐term care facility, or out of province (n = 189); moderate to severe cognitive impairment (n = 88); language barriers (n = 71); or foreshortened life expectancy (n = 51). Another 3 patients withdrew consent prior to outcome assessment. The 495 patients we recruited and had outcome data for had a mean age of 64 years, 19.6% were older than 80 years, 50% were women, and the patients had a mean of 4.2 comorbidities and mean Charlson score of 2.4. The 4 most common reasons for hospital admission were heart failure, pneumonia, chronic obstructive pulmonary disease, and urinary tract infection, and the median length of stay was 5 days (interquartile range: 49 days).
Prevalence of Frailty According to Different Definitions
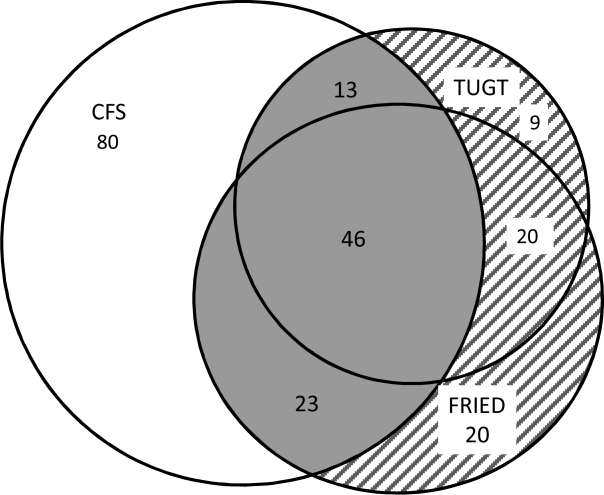
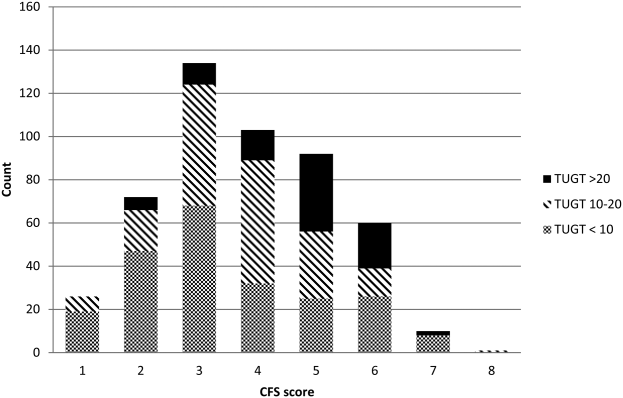
Although the CFS assessment resulted in 162 (33%) patients being deemed frail, only 82 (51%) of those patients also met the phenotype frailty definition using either the Fried model or the TUGT, and 49 (10%) patients who were not classified as frail on the CFS met either of the phenotypic definitions of frailty (Figure 1). Overall, 211 (43%) patients were frail according to at least 1 assessment, and 46 (9%) met all 3 frailty definitions. In the subgroup of 245 patients older than 65 years, 137 (56%) were frail according to at least 1 assessment, 38 (16%) met all 3 frailty definitions, and 27 (11%) of those patients classified as not frail on the CFS met either phenotypic definition of frailty. Agreement between TUGT and CFS or CFS and Fried was relatively poor with kappas of 0.31 (95% confidence interval [CI]: 0.23‐0.40) and 0.33 (95% CI: 0.25‐0.42), respectively. It is noteworthy that some patients deemed nonfrail on the CFS had slow gait speeds, and most CFS‐frail patients had gait speeds in the nonfrail range (Figure 2).

Characteristics According to Frailty Status
Although frail patients were generally similar across definitions (Table 1) in that they were older, had more comorbidities, more hospitalizations in the prior year, and longer index hospitalization lengths of stay than nonfrail patients, patients meeting phenotypic definitions of frailty but not classified as frail on the CFS were younger, had lower Charlson scores, higher EQ‐5D scores, and were discharged with less medications (Table 1).
| Not Frail on Any of the 3 Models, n = 284 | Frail on the CFS Only, n = 80 | Frail on the Fried and/or TUGT but Not the CFS, n = 49 | Frail on CFS and Either Phenotype Model, n = 82 | P Value Comparing the 3 Frailty Columns | |
|---|---|---|---|---|---|
| |||||
| Age, y, mean (95% CI) | 57.3 (55.259.5) | 69.1 (65.872.3) | 63.1 (57.968.3) | 75.8 (72.679.0) | 0.001 |
| Sex, female, no (%) | 118 (41.6) | 49 (61.3) | 27 (55.1) | 56 (68.3) | 0.3 |
| No. of comorbidities, mean (95% CI) | 4.2 (3.84.5) | 6.0 (5.56.6) | 4.0 (3.14.9) | 6.5 (5.87.2) | 0.001 |
| Charlson comorbidity score, mean (95% CI) | 2.4 (2.12.6) | 3.4 (3.03.9) | 2.6 (2.03.2) | 3.8 (3.34.2) | 0.01 |
| No. of patients hospitalized in prior 12 months, no (%) | 93 (32.8) | 44 (55.0) | 27 (55.1) | 54 (65.9) | 0.3 |
| Preadmission living situation, no (%) | 0.01 | ||||
| Living at home independently | 221 (77.8) | 26 (32.5) | 25 (51.0) | 17 (20.7) | |
| Living at home with help | 59 (20.8) | 43 (53.8) | 19 (38.8) | 48 (58.5) | |
| Assisted living or lodge | 4 (1.4) | 11 (13.8) | 5 (10.2) | 17 (20.7) | |
| EQ‐5D overall score, /100, mean (95% CI) | 66.9 (65.068.9) | 62.0 (57.666.4) | 56.6 (51.361.8) | 58.3 (53.962.7) | 0.28 |
| Goals of care in the hospital, no (%) | 0.0001 | ||||
| Resuscitation/ICU | 228 (83.5) | 41 (54.7) | 39 (84.8) | 29 (39.7) | |
| ICU but no resuscitation | 21(7.7) | 17 (22.7) | 1 (2.2) | 16 (21.9) | |
| No ICU, no resuscitation | 23 (8.4) | 17(22.7) | 6 (13.0) | 28 (37.8) | |
| Comfort care | 1 (0.4) | 0 | 0 | 0 | |
| Timed Up and Go Test, s, mean (95% CI) | 10.9 (10.411.3) | 13.9 (12.914.9) | 26.3 (19.033.6) | 30.3 (26.833.7) | 0.0001 |
| Grip strength, kg, mean (95% CI) | 32.1 (30.733.5) | 24.3 (22.3‐ 26.3) | 22.1 (19.924.2) | 17.7 (16.219.1) | 0.0001 |
| Serum albumin, g/L, mean (95% CI) | 34.2 (32.835.5) | 35.0 (33.037.0) | 31.1 (27.934.4) | 33.1 (31.434.9) | 0.07 |
| No. of prescription medications at discharge, mean (95% CI) | 5.2 (4.85.6) | 8.8 (7.99.6) | 6.1 (5.17.1) | 8.2 (7.58.9) | 0.0001 |
| Length of stay, d, median, [IQR] | 5 [37] | 6 [411] | 7 [3.512] | 7 [59] | 0.02 |
Outcomes According to Frailty Status
The overall rate of 30‐day death or hospital readmission was 17.1% (85 patients), primarily as a result of hospital readmissions (81, 16.4%) (Table 2). Although patients classified as frail on the CFS exhibited significantly higher 30‐day readmission/death rates (24.1% vs 13.8% for not frail, P = 0.005) even after adjusting for age and sex (adjusted odds ratio [aOR]: 2.02, 95% CI: 1.19‐3.41) (Table 3), patients meeting either of the phenotypic definitions for frailty but not the CFS definition were not at higher risk for 30‐day readmission/death (aOR: 0.87, 95% CI: 0.34‐2.19) (Table 3). The group at highest risk for 30‐day readmissions/death were those meeting both the CFS and either phenotypic definition of frailty (25.6% vs 13.8% for those not frail, aOR: 2.15, 95% CI: 1.10‐4.19) (Tables 2 and 3). None of the Integrated Discrimination Improvement indices (for modified Fried added to CFS or TUGT added to CFS) were statistically significant, suggesting no net new information was added to predictive models, and there were no appreciable changes in C statistics (Table 3). Neither the modified Fried score nor the TUGT on their own added independent prognostic information to age/sex alone as predictors of postdischarge outcomes. It is noteworthy that the areas under the curve for models using any combination of the frailty definitions plus age and sex were not high (all ranged between 0.55 and 0.60 for the overall cohort and from 0.52 and 0.65 in the elderly). If the frailty definitions were examined as continuous variables rather than dichotomized into frail/not frail, the C statistics were not appreciably better: 0.65 for CFS, 0.58 for TUGT, and 0.60 for modified Fried. Of note, the CFS score with the published cutoff of 5 demonstrated the highest kappa, sensitivity, specificity, and positive predictive value in relation to outcomes.
| Outcomes (Not Mutually Exclusive) | Not Frail on Any of the 3 Models | Frail on the CFS Only | Frail on the Fried and/or TUGT | Frail on CFS and Either Phenotype Model | P Value Comparing the 3 Frailty Columns |
|---|---|---|---|---|---|
| |||||
| Entire cohort | n = 284 | n = 80 | n = 49 | n = 82 | |
| Discharge disposition | 0.002 | ||||
| Live at home independently | 203 (71.5) | 16 (20.0) | 19 (38.8) | 10 (12.2) | |
| Live at home with help | 77 (27.1) | 52 (65.0) | 25 (51.0) | 50 (61.0) | |
| Assisted living or lodge | 4 (9.3) | 12 (15.0) | 5 (10.2) | 22 (26.8) | |
| 30‐day readmission or death | 40 (14.1) | 18 (22.5) | 6 (12.2) | 21 (25.6) | 0.2 |
| 30‐day hospital readmission | 39 (13.8) | 18 (22.5) | 6 (12.2) | 18 (22.0) | 0.31 |
| Death | 5 (1.8) | 3 (3.8) | 1 (2.0) | 4 (4.9) | 0.9 |
| 30‐day ER visit | 66 (23.2) | 30 (37.5) | 12 (24.5) | 23 (17.6) | 0.25 |
| Patients aged 65 years or older | n = 108 | n = 47 | n = 27 | n = 63 | |
| Discharge disposition | 0.03 | ||||
| Live at home independently | 69 (63.9) | 9 (19.2) | 10 (37.0) | 6 (9.5) | |
| Live at home with help | 36 (33.3) | 30 (63.8) | 13 (48.2) | 39(61.9) | |
| Assisted living or lodge | 3 (3.8) | 8 (17.0) | 4 (14.8) | 18 (28.6) | |
| 30‐day readmission or death | 13 (12.0) | 13 (27.7) | 3 (11.1) | 17 (27.0) | 0.22 |
| 30‐day hospital readmission | 12 (11.1) | 13 (27.7) | 3 (11.1) | 14 (22.2) | 0.26 |
| Death | 2 (1.9) | 3 (6.4) | 1 (3.7) | 3 (4.8) | 0.87 |
| 30‐day ER visit | 20 (18.5) | 17 (36.2) | 6 (22.2) | 18 (28.6) | 0.45 |
| Frailty Definition | Adjusted Odds Ratio for 30‐Day Readmission/Death | 95% CI | C Statistic for Model Predicting 30‐Day Readmission/Death Including Age, Sex, and Frailty Definition (95% CI) |
|---|---|---|---|
| |||
| Entire cohort | |||
| CFS (overall) | 2.02 | 1.193.41 | 0.60 (0.530.65) |
| CFS (plus either phenotype model) | 2.15 | 1.104.19 | 0.60 (0.520.64) |
| CFS (but neither phenotype model) | 1.81 | 0.943.48 | 0.60 (0.520.64) |
| Fried | 1.32 | 0.752.30 | 0.55 (0.560.58) |
| TUGT | 1.34 | 0.732.44 | 0.55 (0.460.58) |
| Fried and/or TUGT | 0.87 | 0.342.19 | 0.55 (0.470.58) |
| Patients aged 65 years or older | |||
| CFS (overall) | 3.20 | 1.556.60 | 0.65 (0.560.73) |
| CFS (plus either phenotype model) | 3.20 | 1.337.68 | 0.65 (0.550.72) |
| CFS (but neither phenotype model) | 3.08 | 1.267.47 | 0.65 (0.550.72) |
| Fried | 1.28 | 0.642.56 | 0.52 (0.390.53) |
| TUGT | 1.44 | 0.702.97 | 0.52 (0.390.53) |
| Fried and/or TUGT | 1.41 | 0.722.78 | 0.54 (0.420.56) |
Outcomes According to Frailty Status in the Elderly Subgroup
Although absolute risks of readmission or death were higher in elderly patients than younger patients, the excess risk was largely seen in those elderly patients classified as frail on the CFS. In fact, all of the associations reported above for the entire cohort were in the same direction in the elderly subgroup (Tables 2 and 3).
DISCUSSION
In summary, we found that of patients being discharged from general medical wards who were frail according to at least 1 of the 3 tools we used, only 22% met all 3 frailty case definitions (including only 28% of elderly patients deemed frail by at least 1 definition). There was surprisingly poor correlation between phenotypic markers of frailty such as poor mobility (slow TUGT) or the modified Fried Index and the CFS, even amongt elderly patients. The most clinically useful of the frailty assessment tools (both overall and in those patients who are elderly) appears to be the CFS, because it more accurately identifies those at higher risk of adverse outcomes after discharge, does not require special equipment to conduct, and is faster to do than the phenotypic assessment models we tested. We have also previously demonstrated that the CFS, after a brief training period identical to that used in this study, is reproducible between observers[19] and remains an independent predictor of adverse 30‐day outcomes even after adjusting for age, sex, comorbidities, and the LACE (length of stay, acuity of the admission, comorbidity, emergency room visits during the previous 6 months) score.[14]
Although some[10] have advocated for the use of mobility assessments (such as gait speed) as a frailty marker due to its ease of measurement and objectivity, we found that slow TUGT (which is a marker for mobility and not just slow gait speed) was not an independent prognostic marker for postdischarge outcomes. We hypothesize that the phenotypic models of frailty performed less well than the CFS as they focus on the measurement of particular physical attributes and do not take into account cognitive or psychosocial characteristics or comorbidity burden that also influence postdischarge outcomes. As well, the CFS captures the patients' baseline status prior to acute illness, whereas the phenotypic measures were assessed just prior to discharge and thus may provide less information about eventual recovery potential. Some have suggested that repeating phenotype measures postdischarge might be more informative,[20] but this would reduce clinical applicability a great deal. Certainly, an analysis[21] of the Cardiovascular Health Study cohort demonstrated that cumulative deficit models of frailty (for which the CFS is an accurate proxy[9, 15]) better predicted risk of death than phenotypic models.
Although a number of published studies have shown similar results to ours in that frail patients are at greater risk for death and/or hospitalization,[22, 23, 24] there is surprisingly little literature on the comparative predictive performance of the different frailty instruments and the extent to which they overlap. Cigolle et al.[25] compared 3 frailty scales (the Functional Domain Model, the Burden Model, and the Fried score) in the Health and Retirement Study and, similarly to us, found that although 30.2% were frail on at least 1 of these scales, only 3.1% were deemed frail by all 3. The Conselice Study of Brain Aging[5] also reported that a deficit accumulation model defined a much higher prevalence of frailty (37.6%) than the 11.6% identified using the phenotypic Study of Osteoporotic Fractures (SOF) index based on weight loss, mobility, and level of energy. Another study[26] reported that risk models incorporating either the SOF index or the Fried score exhibited C statistics of only 0.61 for predicting falls in elderly females. A cohort study[27] from 2 English general medical units also found that none of the 5 frailty models was particularly accurate at predicting risk of readmission at 3 months, with C statistics ranging between 0.52 and 0.57. Although frailty assessment at time of hospital admission predicted in‐hospital mortality and length of stay in another English study, it was not independently associated with 30‐day outcomes after adjusting for age, sex, and comorbidities including dementia.[27] To our knowledge, these latter 2 are the only other studies reported to date performed in hospitalized patients to assess whether frailty assessment helps predict postdischarge outcomes. Thus, the poor C statistics we found for all of our frailty tools confirms prior literature that frailty assessment alone is inadequate to accurately identify those patients at highest risk for poor outcomes in the first 30 days after discharge. However, frailty assessment together with consideration of each individual's comorbidities, cognitive status, psychosocial circumstances, and environment can be useful to flag those individuals who may need extra attention postdischarge to optimize outcomes.
Strengths and Limitations
Although this was a prospective cohort study with blinded ascertainment of endpoints (30‐day outcome data were collected by observers who were unaware of the patients' CFS or phenotypic model scores), it is not without limitations. First, the only postdischarge outcomes we assessed were readmission and death, and it would be interesting to evaluate which frailty tools best predict those who are most likely to benefit from home‐care services in the community. Second, as we were interested in 30‐day readmission rates, we excluded long‐term care residents from our study and patients who had foreshortened life expectancy, in essence, the frailest of the frail. Although this reduced the size of any association between frailty and adverse outcomes, we focused this study on the situations where there is clinical equipoise and there is rarely a diagnostic dilemma around the identification of frailty and need for increased services in palliative or long‐term care patients. Third, we did not use exactly the same questionnaires or gait speed assessments as used in the original Fried score description, but as outlined in the Methods section, we used analogous questions on closely related questionnaires to extract the same information. Fourth, some might consider our comparisons biased toward the CFS, as it reflects gestalt clinical impressions (informed by patients and proxies) of frailty status before hospital admission while the Fried score and TUGT were based on patient status just prior to discharge, it may be that the former is a better measure of eventual recovery (and ongoing risk) than the latter measures. If this is the case, for the purposes of targeting interventions to prevent postdischarge complications, it would suggest to us that the CFS is better suited, whereas phenotype tools can be reserved for the postdischarge phase of recovery. By the same token, perhaps serial measures of the CFS and phenotypic tools are more important, as the trajectory of recovery may be most informative for risk prediction.[7] Certainly, if one were interested in changes in functional status during hospitalization,[29] then objective phenotypic measures such as grip strength or TUGT times would seem more appropriate choices. Fifth, some may perceive it as a weakness that we did not restrict our cohort to elderly patients; however, we actually view this as a strength, because frailty is not exclusive to older patients. Sixth, although we restricted this study to patients being discharged from general internal medicine wards, it is worth mentioning that previous studies have shown similar associations between frailty and outcomes in nonmedical hospitalized patients.[19, 22, 23, 24]
In conclusion, we looked at 3 different ways of screening for frailty, 1 being a subjective but well‐validated tool (the CFS) and the other 2 being objective assessments that look at specific phenotypic characteristics. There is a compelling need to find a standardized assessment to determine frailty in both research and clinical settings, and our study provides support for use of the CFS over the Fried or TUGT as screening tools. Standardized frailty assessments should be part of the discharge planning for all medical patients so that extra resources can be properly targeted at those patients at greatest risk for suboptimal transition back to community living.
Acknowledgements
The authors acknowledge Miriam Fradette and Debbie Boyko for their important contributions in data acquisition, as well as all the physicians rotating through the general internal medicine wards for their help in identifying the patients.
Disclosures: Author contributions are as follows: study concept and design: Finlay A. McAlister, Sumit R. Majumdar, and Raj Padwal; acquisition of patients and data: Sara Belga, Darren Lau, Jenelle Pederson, and Sharry Kahlon; analysis of data: Jeff Bakal, Sara Belga, Finlay A. McAlister; first draft of manuscript: Sara Belga and Finlay A. McAlister; critical revision of manuscript: all authors. Funding for this study was provided by an operating grant from Alberta InnovatesHealth Solutions. Alberta InnovatesHealth Solutions had no role in role in the design, methods, subject recruitment, data collections, analysis, or preparation of the article. Finlay A. McAlister and Sumit R. Majumdar hold career salary support from Alberta InnovatesHealth Solutions. Finlay A. McAlister holds the Chair in Cardiovascular Outcomes Research at the Mazankowski Heart Institute, University of Alberta. Sumit R. Majumdar holds the Endowed Chair in Patient Health Management from the Faculty of Medicine and Dentistry, and the Faculty of Pharmacy and Pharmaceutical Sciences, University of Alberta. The authors have no affiliations or financial interests with any organization or entity with a financial interest in the contents of this article. All authors had access to the data and played a role in writing and revising this article. The authors declare no conflicts of interest.
- , , , , . Untangling the concepts of disability, frailty, and comorbidity: implications for improved targeting and care. J Gerontol A Biol Sci Med Sci. 2004;59:255–263.
- , , , , . The identification of frailty: a systematic literature review. J Am Geriatr Soc. 2011;59:2129–2138.
- , , , , . Frailty in elderly people. Lancet. 2013;381:752–762.
- , , , , , . Outcome instruments to measure frailty: a systematic review. Ageing Res Rev. 2011;10:104–114.
- , , , , , . A comparison of frailty indexes for prediction of adverse health outcomes in a elderly cohort. Arch Gerontol Geriatr. 2012;54:16–20.
- , , , et al. Frailty in older adults: evidence for a phenotype. J Gerontol A Biol Sci Med Sci. 2001;56:M146–M156.
- , , , . Prevalence of frailty in community‐dwelling older persons: a systematic review. J Am Geriatr Soc. 2012;60:1487–1492.
- , , . Sex differences in the risk of frailty for mortality independent of disability of chronic diseases. J Am Geriatr Soc. 2005;53:40–47.
- , , . A comparison of two approaches to measuring frailty in elderly people. J Gerontol. 2007;62:738–743.
- , , . A diagnosis of dismobility—giving mobility clinical visibility: a mobility working group recommendation. JAMA. 2014;311:2061–2062.
- , , , et al. Gait speed and survival in older adults. JAMA. 2011;301:50–58.
- , , , et al. Frailty assessment in the cardiovascular care of older adults. J Am Coll Cardiol. 2014;63:747–762.
- , . The timed “Up and Go” test: a test of basic functional mobility for frail elderly persons. J Am Geriatr Soc. 1991;39:142–148.
- , , , et al. Association between frailty and 30‐day outcomes after discharge from hospital. CMAJ. 2015;187:799–804.
- , , , et al. A global clinical measure of fitness and frailty in elderly people. CMAJ. 2005;173:489–495.
- , , , et al. Do muscle mass, muscle density, strength, and physical function similarly influence risk of hospitalization in older adults? J Am Geriatr Soc. 2009;57:1411–1419.
- , . Grip strength in older adults: test‐retest reliability and cutoff for subjective weakness of using the hands in heavy tasks. Arch Phys Med Rehabil. 2010;91:1747–1751.
- , . The PHQ‐9: a new depression measure. Psychiatr Ann. 2002;32:509–515.
- , , , et al. Association between frailty and short‐ and long‐term outcomes among critically ill patients: a multicenter prospective cohort study. CMAJ. 2013;186:e95–e102.
- , . Risk after hospitalization: we have a lot to learn. J Hosp Med. 2015;10:135–136.
- , , , , , . Cumulative deficits better characterize susceptibility to death in elderly people than phenotypic frailty: lessons from the Cardiovascular Health Study. J Am Geriatr Soc. 2008;56:898–903.
- , , . Unplanned hospital readmission and its predictors in patients with chronic conditions. J Formos Med Assoc. 2002;101:779–785.
- , , , et al. Frailty and early hospital readmission after kidney transplant. Am J Transplant. 2013;13:2091–2095.
- , , , , , . Simple frailty score predicts postoperative complications across surgical specialities. Am J Surg. 2013;206:544–550.
- , , , . Comparing models of frailty: the Health and Retirement Study. J Am Geriatr Soc. 2009;57:830–839.
- , , , et al. Comparison of 2 frailty indexes for prediction of falls, disability, fractures, and death in older women. Arch Int Med. 2008;168:382–389.
- , , , , , . The predictive properties of frailty‐rating scales in the acute medical unit. Age Ageing. 2013;42:776–781.
- , , , . Association of the clinical frailty scale with hospital outcomes. QJM. 2015;108:943–949.
- , , . Hospitalization‐associated disability: she was probably able to ambulate, but I'm not sure. JAMA. 2011;306:1782–1793.
Frailty is a state of vulnerability that encompasses a heterogeneous group of people.[1] Because it lacks a precise definition, multiple tools have been developed to identify frailty in both clinical and research settings.[2, 3, 4] Prevalence of frailty depends on the frailty assessment tool used and the population studied, ranging from 4% to 17% when the Fried score[5, 6, 7] is used and from 5% to 44%[5, 7, 8] when cumulative deficit models like the Frailty Index are utilized, with the lower prevalences being in younger community‐dwelling elderly populations and the higher proportions being in older institutionalized populations.
The Frailty Index, also called the Burden or Cumulative Deficit Model, comprises 70 domains that include mobility, mood, function, cognitive impairment, and disease states. It is multidimensional and allows for patients to be categorized on a continuum of frailty, but it is extremely difficult to apply in clinical practice. Recognizing this, Rockwood et al.[9] developed and validated the Clinical Frailty Scale (CFS) in the Canadian Study of Health and Aging. The CFS classifies patients into 1 of 9 categories: very fit, well, managing well, vulnerable, mildly frail (needs help with at least 1 instrumental activity of daily living such as shopping, finances, meal preparation, or housework), moderately frail (needs help with 1 or 2 activities of daily living such as bathing and dressing), severely frail (dependent for personal care), very severely frail (bedbound), and terminally ill. Although this tool is easy to use in clinical practice, it reflects a gestalt impression and requires some clinical judgement.
The Fried score[6] is a prototypical phenotype tool based on 5 criteria that include weight loss, self‐reported exhaustion, low energy expenditure, slowness of gait, and weakness. Recent evidence has suggested that slow gait (or dysmobility) alone may also be a potential screening test for frailty.[10] A recent systematic review[11] demonstrated an association between slow gait (dysmobility) and increased mortality. Dysmobility negatively impacts quality of life and has a strong association with disability resulting in the need for an increased level of care.[12] The Timed Up and Go Test (TUGT) is one method of assessing mobility which is relatively easy to perform, does not require special equipment, and is feasible to use in clinical settings.[13] However, whether impaired mobility predicts outcomes within the first 30 days after hospital discharge (a timeframe highlighted in the Affordable Care Act and used by the Centers for Medicare and Medicaid Services as an important hospital quality indicator) is still uncertain.
The aim of this study was to compare frailty assessments using the CFS and 2 of the most commonly used phenotypic tools (a modified Fried score and the TUGT as a proxy for mobility assessment) to determine which tools best predict postdischarge outcomes.
METHODS
Study Design and Population
As described in detail elsewhere,[14] this was a prospective cohort study that enrolled adult patients (any age older than 18 years) at the time of discharge back to the community from 7 general internal medicine wards in 2 teaching hospitals in Edmonton, Alberta between October 2013 and November 2014. We excluded patients admitted from, or being discharged back to, long‐term care facilities or other acute care hospitals, or from out of the province; patients who were unable to communicate in English; patients with moderate or severe cognitive impairment (scoring 5 or more on the Short Portable Mental Status Questionnaire); or patients with projected life expectancy of less than 3 months. All patients provided written consent, and the study was approved by the Health Research Ethics board of the University of Alberta (project ID Pro00036880).
We assessed the degree of frailty within 24 hours of discharge in 3 ways. First, we used the CFS[9, 15] with patients being asked to rate their best functional status in the week prior to admission. As per the CFS validations studies, scores 5 were defined as frail.[9, 15] Second, we used the TUGT as a proxy for slow gait speed/dysmobility (with >20 seconds defined as abnormal).[13] The TUGT was recorded as the shortest recorded time of the 2 timed trials to get up from a seated position, walk 10 feet and back, and then sit in the chair again. Third, we also determined their Fried score[6] (using the modifications outlined below) and categorized the patients as frail if they scored 3 or more. Of the 5 Fried categories, we assessed weakness by grip strength in their dominant hand using a Jamar handheld dynamometer and weight loss of 10 lb or more in the past year based on patient self‐report; these are identical to the original Fried scale description. Grip strength in the lowest quintile for sex and body mass index was defined as weak grip strength as per convention in the literature, which corresponded to less than 28.5 kg for men and less than 18.5 kg for women.[16, 17] We assessed the other 3 Fried categories in modified fashion as follows. For slow gait, rather than assessing time to walk 15 feet as in the original study and assigning a point to those testing in the lowest quintile for their age/sex, we used the TUGT, because our research personnel were already trained in this test, and we were doing it already as part of the discharge package for all patients.[13] For the Fried category of low activity, we based this on patient self‐report using the relevant questions in the EuroQoL Questionnaire (EQ‐5D); the Fried score used self‐report with a different questionnaire. Finally, for self‐reported exhaustion we used the questions in the Patient Health Questionnaire 9 (PHQ‐9)[18] analogous to those used from the Center for Epidemiological Studies depression scale in the original Fried description. We did this as we were evaluating the PHQ‐9 in our cohort already, and did not want to increase responder burden by presenting them with 2 depression questionnaires.
We followed all patients until 30 days after discharge, and outcome data (all‐cause mortality or all‐cause readmission) were collected by research personnel blinded to the patient's frailty status at discharge using patient/caregiver self‐report and analysis of the provincial electronic health record. We included deaths in or out of the hospital, and all readmissions were unplanned.
We examined the correlation between the CFS score (5 vs 5) and (1) the modified Fried score (3 vs 3) and (2) TUGT (20 seconds vs >20 seconds) using chance corrected kappa coefficients. In our previous article[14] we reported the association between the CFS and readmissions/hospitalizations within 30 days of discharge. In this article we examine whether either the Fried score or TUGT accurately and independently predict postdischarge readmissions/deaths, and whether they add additional prognostic information to the CFS assessment by comparing models with/without each definition using the C statistic and the Integrated Discrimination Improvement index. All analyses were performed using SAS version 9.4 (SAS Institute, Cary, NC), with P values of 0.05 considered statistically significant. Subgroup analysis was done in patients older than 65 years.
RESULTS
Of 1124 potentially eligible patients, 626 were excluded because of patient refusal (n = 227); transfer to/from another hospital, long‐term care facility, or out of province (n = 189); moderate to severe cognitive impairment (n = 88); language barriers (n = 71); or foreshortened life expectancy (n = 51). Another 3 patients withdrew consent prior to outcome assessment. The 495 patients we recruited and had outcome data for had a mean age of 64 years, 19.6% were older than 80 years, 50% were women, and the patients had a mean of 4.2 comorbidities and mean Charlson score of 2.4. The 4 most common reasons for hospital admission were heart failure, pneumonia, chronic obstructive pulmonary disease, and urinary tract infection, and the median length of stay was 5 days (interquartile range: 49 days).
Prevalence of Frailty According to Different Definitions
Although the CFS assessment resulted in 162 (33%) patients being deemed frail, only 82 (51%) of those patients also met the phenotype frailty definition using either the Fried model or the TUGT, and 49 (10%) patients who were not classified as frail on the CFS met either of the phenotypic definitions of frailty (Figure 1). Overall, 211 (43%) patients were frail according to at least 1 assessment, and 46 (9%) met all 3 frailty definitions. In the subgroup of 245 patients older than 65 years, 137 (56%) were frail according to at least 1 assessment, 38 (16%) met all 3 frailty definitions, and 27 (11%) of those patients classified as not frail on the CFS met either phenotypic definition of frailty. Agreement between TUGT and CFS or CFS and Fried was relatively poor with kappas of 0.31 (95% confidence interval [CI]: 0.23‐0.40) and 0.33 (95% CI: 0.25‐0.42), respectively. It is noteworthy that some patients deemed nonfrail on the CFS had slow gait speeds, and most CFS‐frail patients had gait speeds in the nonfrail range (Figure 2).
Characteristics According to Frailty Status
Although frail patients were generally similar across definitions (Table 1) in that they were older, had more comorbidities, more hospitalizations in the prior year, and longer index hospitalization lengths of stay than nonfrail patients, patients meeting phenotypic definitions of frailty but not classified as frail on the CFS were younger, had lower Charlson scores, higher EQ‐5D scores, and were discharged with less medications (Table 1).
| Not Frail on Any of the 3 Models, n = 284 | Frail on the CFS Only, n = 80 | Frail on the Fried and/or TUGT but Not the CFS, n = 49 | Frail on CFS and Either Phenotype Model, n = 82 | P Value Comparing the 3 Frailty Columns | |
|---|---|---|---|---|---|
| |||||
| Age, y, mean (95% CI) | 57.3 (55.259.5) | 69.1 (65.872.3) | 63.1 (57.968.3) | 75.8 (72.679.0) | 0.001 |
| Sex, female, no (%) | 118 (41.6) | 49 (61.3) | 27 (55.1) | 56 (68.3) | 0.3 |
| No. of comorbidities, mean (95% CI) | 4.2 (3.84.5) | 6.0 (5.56.6) | 4.0 (3.14.9) | 6.5 (5.87.2) | 0.001 |
| Charlson comorbidity score, mean (95% CI) | 2.4 (2.12.6) | 3.4 (3.03.9) | 2.6 (2.03.2) | 3.8 (3.34.2) | 0.01 |
| No. of patients hospitalized in prior 12 months, no (%) | 93 (32.8) | 44 (55.0) | 27 (55.1) | 54 (65.9) | 0.3 |
| Preadmission living situation, no (%) | 0.01 | ||||
| Living at home independently | 221 (77.8) | 26 (32.5) | 25 (51.0) | 17 (20.7) | |
| Living at home with help | 59 (20.8) | 43 (53.8) | 19 (38.8) | 48 (58.5) | |
| Assisted living or lodge | 4 (1.4) | 11 (13.8) | 5 (10.2) | 17 (20.7) | |
| EQ‐5D overall score, /100, mean (95% CI) | 66.9 (65.068.9) | 62.0 (57.666.4) | 56.6 (51.361.8) | 58.3 (53.962.7) | 0.28 |
| Goals of care in the hospital, no (%) | 0.0001 | ||||
| Resuscitation/ICU | 228 (83.5) | 41 (54.7) | 39 (84.8) | 29 (39.7) | |
| ICU but no resuscitation | 21(7.7) | 17 (22.7) | 1 (2.2) | 16 (21.9) | |
| No ICU, no resuscitation | 23 (8.4) | 17(22.7) | 6 (13.0) | 28 (37.8) | |
| Comfort care | 1 (0.4) | 0 | 0 | 0 | |
| Timed Up and Go Test, s, mean (95% CI) | 10.9 (10.411.3) | 13.9 (12.914.9) | 26.3 (19.033.6) | 30.3 (26.833.7) | 0.0001 |
| Grip strength, kg, mean (95% CI) | 32.1 (30.733.5) | 24.3 (22.3‐ 26.3) | 22.1 (19.924.2) | 17.7 (16.219.1) | 0.0001 |
| Serum albumin, g/L, mean (95% CI) | 34.2 (32.835.5) | 35.0 (33.037.0) | 31.1 (27.934.4) | 33.1 (31.434.9) | 0.07 |
| No. of prescription medications at discharge, mean (95% CI) | 5.2 (4.85.6) | 8.8 (7.99.6) | 6.1 (5.17.1) | 8.2 (7.58.9) | 0.0001 |
| Length of stay, d, median, [IQR] | 5 [37] | 6 [411] | 7 [3.512] | 7 [59] | 0.02 |
Outcomes According to Frailty Status
The overall rate of 30‐day death or hospital readmission was 17.1% (85 patients), primarily as a result of hospital readmissions (81, 16.4%) (Table 2). Although patients classified as frail on the CFS exhibited significantly higher 30‐day readmission/death rates (24.1% vs 13.8% for not frail, P = 0.005) even after adjusting for age and sex (adjusted odds ratio [aOR]: 2.02, 95% CI: 1.19‐3.41) (Table 3), patients meeting either of the phenotypic definitions for frailty but not the CFS definition were not at higher risk for 30‐day readmission/death (aOR: 0.87, 95% CI: 0.34‐2.19) (Table 3). The group at highest risk for 30‐day readmissions/death were those meeting both the CFS and either phenotypic definition of frailty (25.6% vs 13.8% for those not frail, aOR: 2.15, 95% CI: 1.10‐4.19) (Tables 2 and 3). None of the Integrated Discrimination Improvement indices (for modified Fried added to CFS or TUGT added to CFS) were statistically significant, suggesting no net new information was added to predictive models, and there were no appreciable changes in C statistics (Table 3). Neither the modified Fried score nor the TUGT on their own added independent prognostic information to age/sex alone as predictors of postdischarge outcomes. It is noteworthy that the areas under the curve for models using any combination of the frailty definitions plus age and sex were not high (all ranged between 0.55 and 0.60 for the overall cohort and from 0.52 and 0.65 in the elderly). If the frailty definitions were examined as continuous variables rather than dichotomized into frail/not frail, the C statistics were not appreciably better: 0.65 for CFS, 0.58 for TUGT, and 0.60 for modified Fried. Of note, the CFS score with the published cutoff of 5 demonstrated the highest kappa, sensitivity, specificity, and positive predictive value in relation to outcomes.
| Outcomes (Not Mutually Exclusive) | Not Frail on Any of the 3 Models | Frail on the CFS Only | Frail on the Fried and/or TUGT | Frail on CFS and Either Phenotype Model | P Value Comparing the 3 Frailty Columns |
|---|---|---|---|---|---|
| |||||
| Entire cohort | n = 284 | n = 80 | n = 49 | n = 82 | |
| Discharge disposition | 0.002 | ||||
| Live at home independently | 203 (71.5) | 16 (20.0) | 19 (38.8) | 10 (12.2) | |
| Live at home with help | 77 (27.1) | 52 (65.0) | 25 (51.0) | 50 (61.0) | |
| Assisted living or lodge | 4 (9.3) | 12 (15.0) | 5 (10.2) | 22 (26.8) | |
| 30‐day readmission or death | 40 (14.1) | 18 (22.5) | 6 (12.2) | 21 (25.6) | 0.2 |
| 30‐day hospital readmission | 39 (13.8) | 18 (22.5) | 6 (12.2) | 18 (22.0) | 0.31 |
| Death | 5 (1.8) | 3 (3.8) | 1 (2.0) | 4 (4.9) | 0.9 |
| 30‐day ER visit | 66 (23.2) | 30 (37.5) | 12 (24.5) | 23 (17.6) | 0.25 |
| Patients aged 65 years or older | n = 108 | n = 47 | n = 27 | n = 63 | |
| Discharge disposition | 0.03 | ||||
| Live at home independently | 69 (63.9) | 9 (19.2) | 10 (37.0) | 6 (9.5) | |
| Live at home with help | 36 (33.3) | 30 (63.8) | 13 (48.2) | 39(61.9) | |
| Assisted living or lodge | 3 (3.8) | 8 (17.0) | 4 (14.8) | 18 (28.6) | |
| 30‐day readmission or death | 13 (12.0) | 13 (27.7) | 3 (11.1) | 17 (27.0) | 0.22 |
| 30‐day hospital readmission | 12 (11.1) | 13 (27.7) | 3 (11.1) | 14 (22.2) | 0.26 |
| Death | 2 (1.9) | 3 (6.4) | 1 (3.7) | 3 (4.8) | 0.87 |
| 30‐day ER visit | 20 (18.5) | 17 (36.2) | 6 (22.2) | 18 (28.6) | 0.45 |
| Frailty Definition | Adjusted Odds Ratio for 30‐Day Readmission/Death | 95% CI | C Statistic for Model Predicting 30‐Day Readmission/Death Including Age, Sex, and Frailty Definition (95% CI) |
|---|---|---|---|
| |||
| Entire cohort | |||
| CFS (overall) | 2.02 | 1.193.41 | 0.60 (0.530.65) |
| CFS (plus either phenotype model) | 2.15 | 1.104.19 | 0.60 (0.520.64) |
| CFS (but neither phenotype model) | 1.81 | 0.943.48 | 0.60 (0.520.64) |
| Fried | 1.32 | 0.752.30 | 0.55 (0.560.58) |
| TUGT | 1.34 | 0.732.44 | 0.55 (0.460.58) |
| Fried and/or TUGT | 0.87 | 0.342.19 | 0.55 (0.470.58) |
| Patients aged 65 years or older | |||
| CFS (overall) | 3.20 | 1.556.60 | 0.65 (0.560.73) |
| CFS (plus either phenotype model) | 3.20 | 1.337.68 | 0.65 (0.550.72) |
| CFS (but neither phenotype model) | 3.08 | 1.267.47 | 0.65 (0.550.72) |
| Fried | 1.28 | 0.642.56 | 0.52 (0.390.53) |
| TUGT | 1.44 | 0.702.97 | 0.52 (0.390.53) |
| Fried and/or TUGT | 1.41 | 0.722.78 | 0.54 (0.420.56) |
Outcomes According to Frailty Status in the Elderly Subgroup
Although absolute risks of readmission or death were higher in elderly patients than younger patients, the excess risk was largely seen in those elderly patients classified as frail on the CFS. In fact, all of the associations reported above for the entire cohort were in the same direction in the elderly subgroup (Tables 2 and 3).
DISCUSSION
In summary, we found that of patients being discharged from general medical wards who were frail according to at least 1 of the 3 tools we used, only 22% met all 3 frailty case definitions (including only 28% of elderly patients deemed frail by at least 1 definition). There was surprisingly poor correlation between phenotypic markers of frailty such as poor mobility (slow TUGT) or the modified Fried Index and the CFS, even amongt elderly patients. The most clinically useful of the frailty assessment tools (both overall and in those patients who are elderly) appears to be the CFS, because it more accurately identifies those at higher risk of adverse outcomes after discharge, does not require special equipment to conduct, and is faster to do than the phenotypic assessment models we tested. We have also previously demonstrated that the CFS, after a brief training period identical to that used in this study, is reproducible between observers[19] and remains an independent predictor of adverse 30‐day outcomes even after adjusting for age, sex, comorbidities, and the LACE (length of stay, acuity of the admission, comorbidity, emergency room visits during the previous 6 months) score.[14]
Although some[10] have advocated for the use of mobility assessments (such as gait speed) as a frailty marker due to its ease of measurement and objectivity, we found that slow TUGT (which is a marker for mobility and not just slow gait speed) was not an independent prognostic marker for postdischarge outcomes. We hypothesize that the phenotypic models of frailty performed less well than the CFS as they focus on the measurement of particular physical attributes and do not take into account cognitive or psychosocial characteristics or comorbidity burden that also influence postdischarge outcomes. As well, the CFS captures the patients' baseline status prior to acute illness, whereas the phenotypic measures were assessed just prior to discharge and thus may provide less information about eventual recovery potential. Some have suggested that repeating phenotype measures postdischarge might be more informative,[20] but this would reduce clinical applicability a great deal. Certainly, an analysis[21] of the Cardiovascular Health Study cohort demonstrated that cumulative deficit models of frailty (for which the CFS is an accurate proxy[9, 15]) better predicted risk of death than phenotypic models.
Although a number of published studies have shown similar results to ours in that frail patients are at greater risk for death and/or hospitalization,[22, 23, 24] there is surprisingly little literature on the comparative predictive performance of the different frailty instruments and the extent to which they overlap. Cigolle et al.[25] compared 3 frailty scales (the Functional Domain Model, the Burden Model, and the Fried score) in the Health and Retirement Study and, similarly to us, found that although 30.2% were frail on at least 1 of these scales, only 3.1% were deemed frail by all 3. The Conselice Study of Brain Aging[5] also reported that a deficit accumulation model defined a much higher prevalence of frailty (37.6%) than the 11.6% identified using the phenotypic Study of Osteoporotic Fractures (SOF) index based on weight loss, mobility, and level of energy. Another study[26] reported that risk models incorporating either the SOF index or the Fried score exhibited C statistics of only 0.61 for predicting falls in elderly females. A cohort study[27] from 2 English general medical units also found that none of the 5 frailty models was particularly accurate at predicting risk of readmission at 3 months, with C statistics ranging between 0.52 and 0.57. Although frailty assessment at time of hospital admission predicted in‐hospital mortality and length of stay in another English study, it was not independently associated with 30‐day outcomes after adjusting for age, sex, and comorbidities including dementia.[27] To our knowledge, these latter 2 are the only other studies reported to date performed in hospitalized patients to assess whether frailty assessment helps predict postdischarge outcomes. Thus, the poor C statistics we found for all of our frailty tools confirms prior literature that frailty assessment alone is inadequate to accurately identify those patients at highest risk for poor outcomes in the first 30 days after discharge. However, frailty assessment together with consideration of each individual's comorbidities, cognitive status, psychosocial circumstances, and environment can be useful to flag those individuals who may need extra attention postdischarge to optimize outcomes.
Strengths and Limitations
Although this was a prospective cohort study with blinded ascertainment of endpoints (30‐day outcome data were collected by observers who were unaware of the patients' CFS or phenotypic model scores), it is not without limitations. First, the only postdischarge outcomes we assessed were readmission and death, and it would be interesting to evaluate which frailty tools best predict those who are most likely to benefit from home‐care services in the community. Second, as we were interested in 30‐day readmission rates, we excluded long‐term care residents from our study and patients who had foreshortened life expectancy, in essence, the frailest of the frail. Although this reduced the size of any association between frailty and adverse outcomes, we focused this study on the situations where there is clinical equipoise and there is rarely a diagnostic dilemma around the identification of frailty and need for increased services in palliative or long‐term care patients. Third, we did not use exactly the same questionnaires or gait speed assessments as used in the original Fried score description, but as outlined in the Methods section, we used analogous questions on closely related questionnaires to extract the same information. Fourth, some might consider our comparisons biased toward the CFS, as it reflects gestalt clinical impressions (informed by patients and proxies) of frailty status before hospital admission while the Fried score and TUGT were based on patient status just prior to discharge, it may be that the former is a better measure of eventual recovery (and ongoing risk) than the latter measures. If this is the case, for the purposes of targeting interventions to prevent postdischarge complications, it would suggest to us that the CFS is better suited, whereas phenotype tools can be reserved for the postdischarge phase of recovery. By the same token, perhaps serial measures of the CFS and phenotypic tools are more important, as the trajectory of recovery may be most informative for risk prediction.[7] Certainly, if one were interested in changes in functional status during hospitalization,[29] then objective phenotypic measures such as grip strength or TUGT times would seem more appropriate choices. Fifth, some may perceive it as a weakness that we did not restrict our cohort to elderly patients; however, we actually view this as a strength, because frailty is not exclusive to older patients. Sixth, although we restricted this study to patients being discharged from general internal medicine wards, it is worth mentioning that previous studies have shown similar associations between frailty and outcomes in nonmedical hospitalized patients.[19, 22, 23, 24]
In conclusion, we looked at 3 different ways of screening for frailty, 1 being a subjective but well‐validated tool (the CFS) and the other 2 being objective assessments that look at specific phenotypic characteristics. There is a compelling need to find a standardized assessment to determine frailty in both research and clinical settings, and our study provides support for use of the CFS over the Fried or TUGT as screening tools. Standardized frailty assessments should be part of the discharge planning for all medical patients so that extra resources can be properly targeted at those patients at greatest risk for suboptimal transition back to community living.
Acknowledgements
The authors acknowledge Miriam Fradette and Debbie Boyko for their important contributions in data acquisition, as well as all the physicians rotating through the general internal medicine wards for their help in identifying the patients.
Disclosures: Author contributions are as follows: study concept and design: Finlay A. McAlister, Sumit R. Majumdar, and Raj Padwal; acquisition of patients and data: Sara Belga, Darren Lau, Jenelle Pederson, and Sharry Kahlon; analysis of data: Jeff Bakal, Sara Belga, Finlay A. McAlister; first draft of manuscript: Sara Belga and Finlay A. McAlister; critical revision of manuscript: all authors. Funding for this study was provided by an operating grant from Alberta InnovatesHealth Solutions. Alberta InnovatesHealth Solutions had no role in role in the design, methods, subject recruitment, data collections, analysis, or preparation of the article. Finlay A. McAlister and Sumit R. Majumdar hold career salary support from Alberta InnovatesHealth Solutions. Finlay A. McAlister holds the Chair in Cardiovascular Outcomes Research at the Mazankowski Heart Institute, University of Alberta. Sumit R. Majumdar holds the Endowed Chair in Patient Health Management from the Faculty of Medicine and Dentistry, and the Faculty of Pharmacy and Pharmaceutical Sciences, University of Alberta. The authors have no affiliations or financial interests with any organization or entity with a financial interest in the contents of this article. All authors had access to the data and played a role in writing and revising this article. The authors declare no conflicts of interest.
- , , , , . Untangling the concepts of disability, frailty, and comorbidity: implications for improved targeting and care. J Gerontol A Biol Sci Med Sci. 2004;59:255–263.
- , , , , . The identification of frailty: a systematic literature review. J Am Geriatr Soc. 2011;59:2129–2138.
- , , , , . Frailty in elderly people. Lancet. 2013;381:752–762.
- , , , , , . Outcome instruments to measure frailty: a systematic review. Ageing Res Rev. 2011;10:104–114.
- , , , , , . A comparison of frailty indexes for prediction of adverse health outcomes in a elderly cohort. Arch Gerontol Geriatr. 2012;54:16–20.
- , , , et al. Frailty in older adults: evidence for a phenotype. J Gerontol A Biol Sci Med Sci. 2001;56:M146–M156.
- , , , . Prevalence of frailty in community‐dwelling older persons: a systematic review. J Am Geriatr Soc. 2012;60:1487–1492.
- , , . Sex differences in the risk of frailty for mortality independent of disability of chronic diseases. J Am Geriatr Soc. 2005;53:40–47.
- , , . A comparison of two approaches to measuring frailty in elderly people. J Gerontol. 2007;62:738–743.
- , , . A diagnosis of dismobility—giving mobility clinical visibility: a mobility working group recommendation. JAMA. 2014;311:2061–2062.
- , , , et al. Gait speed and survival in older adults. JAMA. 2011;301:50–58.
- , , , et al. Frailty assessment in the cardiovascular care of older adults. J Am Coll Cardiol. 2014;63:747–762.
- , . The timed “Up and Go” test: a test of basic functional mobility for frail elderly persons. J Am Geriatr Soc. 1991;39:142–148.
- , , , et al. Association between frailty and 30‐day outcomes after discharge from hospital. CMAJ. 2015;187:799–804.
- , , , et al. A global clinical measure of fitness and frailty in elderly people. CMAJ. 2005;173:489–495.
- , , , et al. Do muscle mass, muscle density, strength, and physical function similarly influence risk of hospitalization in older adults? J Am Geriatr Soc. 2009;57:1411–1419.
- , . Grip strength in older adults: test‐retest reliability and cutoff for subjective weakness of using the hands in heavy tasks. Arch Phys Med Rehabil. 2010;91:1747–1751.
- , . The PHQ‐9: a new depression measure. Psychiatr Ann. 2002;32:509–515.
- , , , et al. Association between frailty and short‐ and long‐term outcomes among critically ill patients: a multicenter prospective cohort study. CMAJ. 2013;186:e95–e102.
- , . Risk after hospitalization: we have a lot to learn. J Hosp Med. 2015;10:135–136.
- , , , , , . Cumulative deficits better characterize susceptibility to death in elderly people than phenotypic frailty: lessons from the Cardiovascular Health Study. J Am Geriatr Soc. 2008;56:898–903.
- , , . Unplanned hospital readmission and its predictors in patients with chronic conditions. J Formos Med Assoc. 2002;101:779–785.
- , , , et al. Frailty and early hospital readmission after kidney transplant. Am J Transplant. 2013;13:2091–2095.
- , , , , , . Simple frailty score predicts postoperative complications across surgical specialities. Am J Surg. 2013;206:544–550.
- , , , . Comparing models of frailty: the Health and Retirement Study. J Am Geriatr Soc. 2009;57:830–839.
- , , , et al. Comparison of 2 frailty indexes for prediction of falls, disability, fractures, and death in older women. Arch Int Med. 2008;168:382–389.
- , , , , , . The predictive properties of frailty‐rating scales in the acute medical unit. Age Ageing. 2013;42:776–781.
- , , , . Association of the clinical frailty scale with hospital outcomes. QJM. 2015;108:943–949.
- , , . Hospitalization‐associated disability: she was probably able to ambulate, but I'm not sure. JAMA. 2011;306:1782–1793.