User login
Clinical Endocrinology News is an independent news source that provides endocrinologists with timely and relevant news and commentary about clinical developments and the impact of health care policy on the endocrinologist's practice. Specialty topics include Diabetes, Lipid & Metabolic Disorders Menopause, Obesity, Osteoporosis, Pediatric Endocrinology, Pituitary, Thyroid & Adrenal Disorders, and Reproductive Endocrinology. Featured content includes Commentaries, Implementin Health Reform, Law & Medicine, and In the Loop, the blog of Clinical Endocrinology News. Clinical Endocrinology News is owned by Frontline Medical Communications.
addict
addicted
addicting
addiction
adult sites
alcohol
antibody
ass
attorney
audit
auditor
babies
babpa
baby
ban
banned
banning
best
bisexual
bitch
bleach
blog
blow job
bondage
boobs
booty
buy
cannabis
certificate
certification
certified
cheap
cheapest
class action
cocaine
cock
counterfeit drug
crack
crap
crime
criminal
cunt
curable
cure
dangerous
dangers
dead
deadly
death
defend
defended
depedent
dependence
dependent
detergent
dick
die
dildo
drug abuse
drug recall
dying
fag
fake
fatal
fatalities
fatality
free
fuck
gangs
gingivitis
guns
hardcore
herbal
herbs
heroin
herpes
home remedies
homo
horny
hypersensitivity
hypoglycemia treatment
illegal drug use
illegal use of prescription
incest
infant
infants
job
ketoacidosis
kill
killer
killing
kinky
law suit
lawsuit
lawyer
lesbian
marijuana
medicine for hypoglycemia
murder
naked
natural
newborn
nigger
noise
nude
nudity
orgy
over the counter
overdosage
overdose
overdosed
overdosing
penis
pimp
pistol
porn
porno
pornographic
pornography
prison
profanity
purchase
purchasing
pussy
queer
rape
rapist
recall
recreational drug
rob
robberies
sale
sales
sex
sexual
shit
shoot
slut
slutty
stole
stolen
store
sue
suicidal
suicide
supplements
supply company
theft
thief
thieves
tit
toddler
toddlers
toxic
toxin
tragedy
treating dka
treating hypoglycemia
treatment for hypoglycemia
vagina
violence
whore
withdrawal
without prescription
section[contains(@class, 'nav-hidden')]
footer[@id='footer']
div[contains(@class, 'pane-pub-article-imn')]
div[contains(@class, 'pane-pub-home-imn')]
div[contains(@class, 'pane-pub-topic-imn')]
div[contains(@class, 'panel-panel-inner')]
div[contains(@class, 'pane-node-field-article-topics')]
section[contains(@class, 'footer-nav-section-wrapper')]
Subclinical CAD by CT predicts MI risk, with or without stenoses
About half of middle-aged adults in the community without cardiovascular (CV) symptoms have coronary atherosclerosis by CT angiography (CTA) that puts them at substantial risk for myocardial infarction (MI), suggests a prospective cohort study.
The 10% of participants who had subclinical disease considered obstructive at CTA showed a ninefold increased risk for MI over several years. Obstructive disease seemed to elevate risk more than subclinical disease that wasn’t obstructive but still considered extensive within the coronary arteries.
The findings, based on a Copenhagen General Population Study cohort, are new for CTA but consistent with research based on coronary artery calcium (CAC) scores and other ways to assess CV risk, say researchers.
Although all participants underwent CTA, such imaging isn’t used in the general population for atherosclerosis screening. But the findings may have implications for “opportunistic screening” for subclinical coronary disease at CTA conducted for other reasons, notes the study’s report, published online in the Annals of Internal Medicine.
“Identification of luminal obstructive or extensive subclinical coronary atherosclerosis” could potentially provide “clinically relevant, incremental risk assessment” in nonischemic patients who undergo cardiac CT or electrocardiogram-gated chest CT before procedures such as arrhythmia ablation or valve repair, it states.
Such patients found with subclinical coronary atherosclerosis might potentially “benefit from referral to intensified cardiovascular primary prevention therapy,” write the authors, led by Andreas Fuchs, MD, PhD, Copenhagen University Hospital-Rigshospitalet.
The group acknowledges the findings may not entirely apply to a non-Danish population.
A screening role for CTA?
Whether CTA has a role to play in adults without symptoms “is a big, open question in the field right now,” observed Ron Blankstein, MD, not associated with the current analysis, for this news organization.
Most population studies of CV risk prediction, such as MESA, have looked at CAC scores, not CTA, and have shown that “the more plaque individuals have, the higher the risk.” The current findings are similar but novel in coming from coronary CTA in a large asymptomatic community population, said Dr. Blankstein, who is director of cardiac CT at Brigham and Women’s Hospital, Boston.
“It’s possible that patients who have obstructive plaque in general tend to have a larger amount of plaque as well,” he said. So, while the study suggests that “the more plaque individuals have, the worse their overall risk,” it also shows that the risk “is enhanced even more if they have obstructive disease.”
The Danish cohort analysis “provides a unique opportunity to study the contemporary natural history of coronary artery disease in the absence of intervention,” notes an accompanying editorial.
For example, both patients and clinicians were blinded to CTA results, and CV preventive therapies weren’t common, observe Michael McDermott, MBChB, and David E. Newby, DM, PhD, of the BHF Centre for Cardiovascular Science, University of Edinburgh.
The analysis suggests that subclinical coronary disease that is obstructive predicts MI risk more strongly than extensive coronary disease, they note, and may be present in two-thirds of MI patients. “This contrasts with symptomatic populations, where nonobstructive disease accounts for most future myocardial infarctions, presumably from plaque rupture.”
It also points to “strong associations between nonobstructive extensive disease and adverse plaque characteristics,” write Dr. McDermott and Dr. Newby. “This underscores the major importance of plaque burden” for the prediction of coronary events.
Graded risk
The analysis included 9,533 persons aged 40 and older without known ischemic heart disease or symptoms with available CTA assessments.
Obstructive disease, defined as presence of a luminal stenosis of at least 50%, was seen in 10% and nonobstructive disease in 36% of the total cohort, the report states.
Disease occupying more than one-third of the coronary tree was considered extensive and less than one-third of the coronaries nonextensive, occurring in 10.5% and 35.8% of the cohort, respectively.
There were 71 MIs and 193 deaths over a median of 3.5 years. The adjusted relative risk for MI, compared with those without coronary atherosclerosis, was:
- 7.65 (95% confidence interval, 3.53-16.57) overall in patients with extensive disease.
- 8.28 (95% CI, 3.75-18.32) in those with obstructive but nonextensive disease.
- 9.19 (95% CI, 4.49-18.82) overall in those with obstructive disease.
- 12.48 (95% CI, 5.50-28.12) in those with or obstructive and extensive disease.
The adjusted RR for the composite of death or MI was also elevated in persons with extensive disease:
- 2.70 (95% CI, 1.72-4.25) in those with extensive but nonobstructive disease.
- 3.15 (95% CI, 2.05-4.83) in those with extensive and obstructive disease.
“It’s one thing to show that the more plaque, the higher the risk,” Dr. Blankstein said. But “does the information ultimately lead to better outcomes? Do patients have fewer MIs or fewer deaths?” Several ongoing randomized trials are exploring these questions.
They include DANE-HEART (Computed Tomography Coronary Angiography for Primary Prevention), projected to enroll about 6,000 participants from the Copenhagen General Population Study cohort who have at least one CV risk factor, and SCOT-HEART 2 (second Computed Tomography Coronary Angiography for the Prevention of Myocardial Infarction), enrolling a similar cohort in Scotland.
The study was supported by grants from AP Møller og Hustru Chastine Mc-Kinney Møllers Fond, the Research Council of Rigshospitalet, and Danish Heart Foundation. Dr. Fuchs reports no relevant financial relationships. Disclosures for the other authors can be found here. Dr. Blankstein recently disclosed serving as a consultant to Amgen, Caristo Diagnostics, Novartis, and Silence Therapeutics. Disclosures for Dr. McDermott and Dr. Newby, who are SCOT-HEART 2 investigators, can be found here.
A version of this article originally appeared on Medscape.com.
‘Excess’ deaths surging, but why?
This transcript has been edited for clarity.
“Excess deaths.” You’ve heard the phrase countless times by now. It is one of the myriad of previously esoteric epidemiology terms that the pandemic brought squarely into the zeitgeist.
As a sort of standard candle of the performance of a state or a region or a country in terms of health care, it has a lot of utility – if for nothing more than Monday-morning quarterbacking. But this week, I want to dig in on the concept a bit because, according to a new study, the excess death gap between the United States and Western Europe has never been higher.
You might imagine that the best way to figure this out is for some group of intelligent people to review each death and decide, somehow, whether it was expected or not. But aside from being impractical, this would end up being somewhat subjective. That older person who died from pneumonia – was that an expected death? Could it have been avoided?
Rather, the calculation of excess mortality relies on large numbers and statistical inference to compare an expected number of deaths with those that are observed.
The difference is excess mortality, even if you can never be sure whether any particular death was expected or not.
As always, however, the devil is in the details. What data do you use to define the expected number of deaths?
There are options here. Probably the most straightforward analysis uses past data from the country of interest. You look at annual deaths over some historical period of time and compare those numbers with the rates today. Two issues need to be accounted for here: population growth – a larger population will have more deaths, so you need to adjust the historical population with current levels, and demographic shifts – an older or more male population will have more deaths, so you need to adjust for that as well.
But provided you take care of those factors, you can estimate fairly well how many deaths you can expect to see in any given period of time.
Still, you should see right away that excess mortality is a relative concept. If you think that, just perhaps, the United States has some systematic failure to deliver care that has been stable and persistent over time, you wouldn’t capture that failing in an excess mortality calculation that uses U.S. historical data as the baseline.
The best way to get around that is to use data from other countries, and that’s just what this article – a rare single-author piece by Patrick Heuveline – does, calculating excess deaths in the United States by standardizing our mortality rates to the five largest Western European countries: the United Kingdom, France, Germany, Italy, and Spain.
Controlling for the differences in the demographics of that European population, here is the expected number of deaths in the United States over the past 5 years.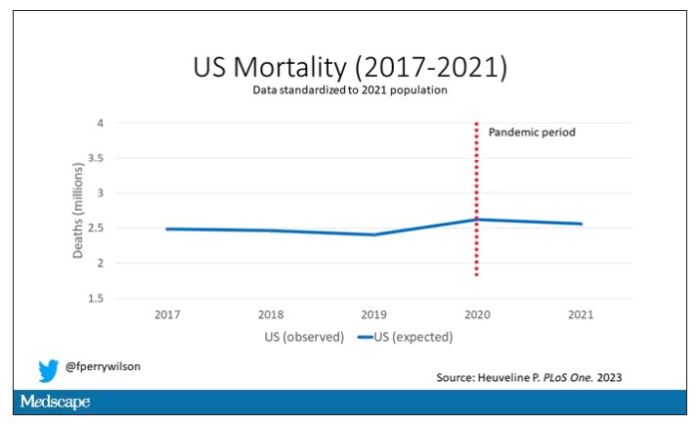
Note that there is a small uptick in expected deaths in 2020, reflecting the pandemic, which returns to baseline levels by 2021. This is because that’s what happened in Europe; by 2021, the excess mortality due to COVID-19 was quite low.
Here are the actual deaths in the US during that time.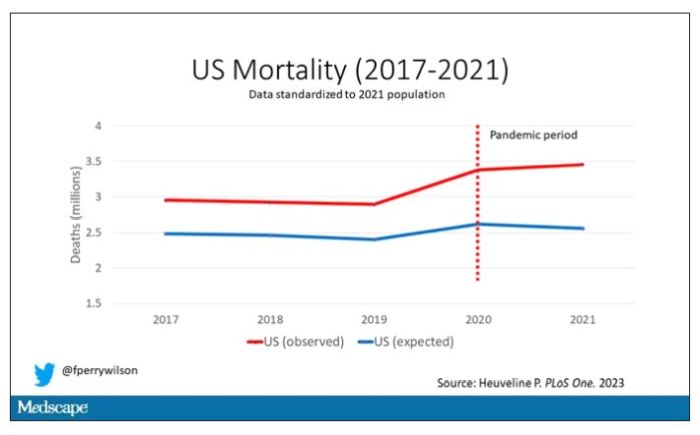
Highlighted here in green, then, is the excess mortality over time in the United States.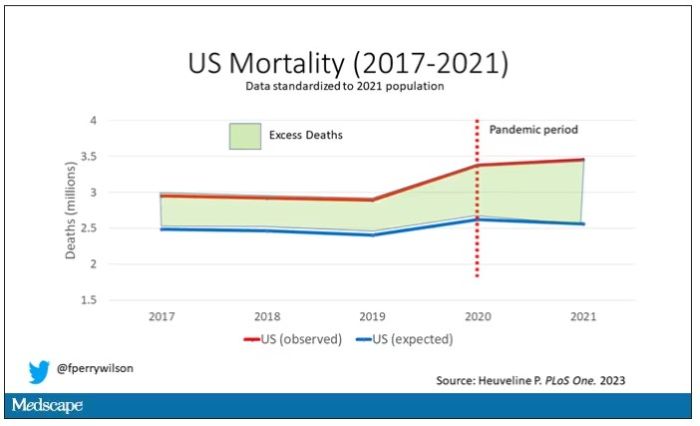
There are some fascinating and concerning findings here.
First of all, you can see that even before the pandemic, the United States has an excess mortality problem. This is not entirely a surprise; we’ve known that so-called “deaths of despair,” those due to alcohol abuse, drug overdoses, and suicide, are at an all-time high and tend to affect a “prime of life” population that would not otherwise be expected to die. In fact, fully 50% of the excess deaths in the United States occur in those between ages 15 and 64.
Excess deaths are also a concerning percentage of total deaths. In 2017, 17% of total deaths in the United States could be considered “excess.” In 2021, that number had doubled to 35%. Nearly 900,000 individuals in the United States died in 2021 who perhaps didn’t need to.
The obvious culprit to blame here is COVID, but COVID-associated excess deaths only explain about 50% of the excess we see in 2021. The rest reflect something even more concerning: a worsening of the failures of the past, perhaps exacerbated by the pandemic but not due to the virus itself.
Of course, we started this discussion acknowledging that the calculation of excess mortality is exquisitely dependent on how you model the expected number of deaths, and I’m sure some will take issue with the use of European numbers when applied to Americans. After all, Europe has, by and large, a robust public health service, socialized medicine, and healthcare that does not run the risk of bankrupting its citizens. How can we compare our outcomes to a place like that?
How indeed.
F. Perry Wilson, MD, MSCE, is an associate professor of medicine and director of Yale University’s Clinical and Translational Research Accelerator in New Haven,Conn. He reported no relevant conflicts of interest.
A version of this article originally appeared on Medscape.com.
Could a baby’s gut health be an early predictor of future type 1 diabetes?
Microbial biomarkers for type 1 diabetes may be present in infants as young as 12 months old, suggesting the potential to mitigate disease onset by nurturing a healthy gut microbiome early, show data from the Swedish general population.
“Our findings indicate that the gut of infants who go on to develop type 1 diabetes is notably different from healthy babies,” said Malin Bélteky, MD, from the Crown Princess Victoria’s Children’s Hospital, Linköping, Sweden, who jointly led the work, which was recently published in Diabetologia, alongside Patricia L. Milletich, PhD candidate, from the University of Florida, Gainesville.
“This discovery could be used to help identity infants at [the] highest risk of developing type 1 diabetes before or during the first stage of disease and could offer the opportunity to bolster a healthy gut microbiome to prevent the disease from becoming established,” added Dr. Bélteky.
Currently, beta-cell autoantibodies are used to predict disease, which are usually only identifiable between 9 and 36 months of age.
Marian Rewers, MD, PhD, professor of pediatrics & medicine, University of Colorado, Denver, and principal investigator of The Environmental Determinants of Diabetes in the Young (TEDDY) study, welcomed the findings, saying it is a well-designed study from a strong group of investigators.
“While the effective number of cases was very small [n = 16], the results were apparently adjusted for multiple comparisons, and significant differences were noted in the microbiome of cases versus controls at 1 year of age. This was 12 years prior to the average age of type 1 diabetes diagnosis in the cases,” he said.
“The differences in diversity and abundances of specific bacteria need to be interpreted with caution; however, the study results are consistent with several previous reports,” he noted.
Differences in microbial diversity and function
Data were drawn from children participating in the longitudinal, general population All Babies In Southeast Sweden (ABIS) study. Microbiota from stool samples, taken at age 1 year, were sequenced and analyzed to establish diversity, abundance, and functional status of the component bacteria. Questionnaires were completed at birth and at 1 year of age, allowing for the study of environmental factors that might influence the microbiota or type 1 diabetes risk independently. Parent diaries provided information on pregnancy, nutrition, and lifestyle factors.
Of the cohort of 167 children who developed type 1 diabetes by 2020, stool samples were available for 16 of these participants, which were compared with 268 healthy controls. The microbiomes of the 16 infants who later developed type 1 diabetes were compared with 100 iterations of 32 matched control infants (matched by geographical region, siblings at birth, residence type, duration of breastfeeding, and month of stool collection) who didn’t develop type 1 diabetes by the age of 20.
Specific bacteria found in greater abundance in children who later developed type 1 diabetes, compared with those who didn’t, included Firmicutes (Enterococcus, Gemella, and Hungatella), as well as Bacteroides (Bacteroides and Porphyromonas), known to promote inflammation and be involved in the immune response.
Bacteria with greater abundance in children who didn’t develop type 1 diabetes, compared with those who did, were Firmicutes (Anaerostipes, Flavonifractor, and Ruminococcaceae UBA1819, and Eubacterium). These species help maintain metabolic and immune health and produce butyrate, an important short-chain fatty acid that helps prevent inflammation and fuels the cells of the gut lining.
Alistipes were more abundant in infants who didn’t develop type 1 diabetes, and various abundances of Fusicatenibacter were the strongest factors for differentiating future type 1 diabetes, reported the researchers.
“Gut microbial biomarkers at 12 months would benefit the prediction opportunity well before the onset of multiple autoantibodies,” write the authors.
The youngest age at type 1 diabetes diagnosis was aged 1 year, 4 months, and the oldest was aged 21 years, 4 months. The mean age at diagnosis was 13.3 years.
The microbial differences found between infants who go on to develop type 1 diabetes and those who don’t also shed light on interactions between the developing immune system and short-chain fatty acid production and metabolism in childhood autoimmunity, write the authors.
Prior studies have found fewer short-chain fatty acid–producing microbiota in the gut of children with early-onset autoantibody development. This study confirmed these data, finding a decrease in butyrate-producing bacteria (Anaerostipes, Flavonifractor, Ruminococcaceae UBA1819, and Eubacterium) in infants who went on to develop type 1 diabetes. Likewise, a reduction in pyruvate fermentation was found in those infants with future disease.
According to coauthor Eric Triplett, PhD, from the University of Florida, Gainesville: “The autoimmune processes usually begin long before any clinical signs of disease appear, highlighting how differences in the makeup of the infant gut microbiome could shed important light on the complex interaction between the developing immune system, environmental exposures in childhood, and autoimmunity. Studies with much larger cohorts of prospectively traced individuals will be required to establish which are the strongest biomarkers and how effectively they can predict disease.”
The authors and Dr. Rewers have reported no relevant financial relationships.
A version of this article first appeared on Medscape.com.
Sweaty treatment for social anxiety could pass the sniff test
Getting sweet on sweat
Are you the sort of person who struggles in social situations? Have the past 3 years been a secret respite from the terror and exhaustion of meeting new people? We understand your plight. People kind of suck. And you don’t have to look far to be reminded of it.
Unfortunately, on occasion we all have to interact with other human beings. If you suffer from social anxiety, this is not a fun thing to do. But new research indicates that there may be a way to alleviate the stress for those with social anxiety: armpits.
Specifically, sweat from the armpits of other people. Yes, this means a group of scientists gathered up some volunteers and collected their armpit sweat while the volunteers watched a variety of movies (horror, comedy, romance, etc.). Our condolences to the poor unpaid interns tasked with gathering the sweat.
Once they had their precious new medicine, the researchers took a group of women and administered a round of mindfulness therapy. Some of the participants then received the various sweats, while the rest were forced to smell only clean air. (The horror!) Lo and behold, the sweat groups had their anxiety scores reduced by about 40% after their therapy, compared with just 17% in the control group.
The researchers also found that the source of the sweat didn’t matter. Their study subjects responded the same to sweat excreted during a scary movie as they did to sweat from a comedy, a result that surprised the researchers. They suggested chemosignals in the sweat may affect the treatment response and advised further research. Which means more sweat collection! They plan on testing emotionally neutral movies next time, and if we can make a humble suggestion, they also should try the sweatiest movies.
Before the Food and Drug Administration can approve armpit sweat as a treatment for social anxiety, we have some advice for those shut-in introverts out there. Next time you have to interact with rabid extroverts, instead of shaking their hands, walk up to them and take a deep whiff of their armpits. Establish dominance. Someone will feel awkward, and science has proved it won’t be you.
The puff that vaccinates
Ever been shot with a Nerf gun or hit with a foam pool tube? More annoying than painful, right? If we asked if you’d rather get pelted with one of those than receive a traditional vaccine injection, you would choose the former. Maybe someday you actually will.

During the boredom of the early pandemic lockdown, Jeremiah Gassensmith, PhD, of the department of chemistry and biochemistry at the University of Texas, Dallas, ordered a compressed gas–powered jet injection system to fool around with at home. Hey, who didn’t? Anyway, when it was time to go back to the lab he handed it over to one of his grad students, Yalini Wijesundara, and asked her to see what could be done with it.
In her tinkering she found that the jet injector could deliver metal-organic frameworks (MOFs) that can hold a bunch of different materials, like proteins and nucleic acids, through the skin.
Thus the “MOF-Jet” was born!
Jet injectors are nothing new, but they hurt. The MOF-Jet, however, is practically painless and cheaper than the gene guns that veterinarians use to inject biological cargo attached to the surface of a metal microparticle.
Changing the carrier gas also changes the time needed to break down the MOF and thus alters delivery of the drug inside. “If you shoot it with carbon dioxide, it will release its cargo faster within cells; if you use regular air, it will take 4 or 5 days,” Ms. Wijesundara explained in a written statement. That means the same drug could be released over different timescales without changing its formulation.
While testing on onion cells and mice, Ms. Wijesundara noted that it was as easy as “pointing and shooting” to distribute the puff of gas into the cells. A saving grace to those with needle anxiety. Not that we would know anything about needle anxiety.
More testing needs to be done before bringing this technology to human use, obviously, but we’re looking forward to saying goodbye to that dreaded prick and hello to a puff.
Your hippocampus is showing
Brain anatomy is one of the many, many things that’s not really our thing, but we do know a cool picture when we see one. Case in point: The image just below, which happens to be a full-scale, single-cell resolution model of the CA1 region of the hippocampus that “replicates the structure and architecture of the area, along with the position and relative connectivity of the neurons,” according to a statement from the Human Brain Project.

“We have performed a data mining operation on high resolution images of the human hippocampus, obtained from the BigBrain database. The position of individual neurons has been derived from a detailed analysis of these images,” said senior author Michele Migliore, PhD, of the Italian National Research Council’s Institute of Biophysics in Palermo.
Yes, he did say BigBrain database. BigBrain is – we checked and it’s definitely not this – a 3D model of a brain that was sectioned into 7,404 slices just 20 micrometers thick and then scanned by MRI. Digital reconstruction of those slices was done by supercomputer and the results are now available for analysis.
Dr. Migliore and his associates developed an image-processing algorithm to obtain neuronal positioning distribution and an algorithm to generate neuronal connectivity by approximating the shapes of dendrites and axons. (Our brains are starting to hurt just trying to write this.) “Some fit into narrow cones, others have a broad complex extension that can be approximated by dedicated geometrical volumes, and the connectivity to nearby neurons changes accordingly,” explained lead author Daniela Gandolfi of the University of Modena (Italy) and Reggio Emilia.
The investigators have made their dataset and the extraction methodology available on the EBRAINS platform and through the Human Brain Project and are moving on to other brain regions. And then, once everyone can find their way in and around the old gray matter, it should bring an end to conversations like this, which no doubt occur between male and female neuroscientists every day:
“Arnold, I think we’re lost.”
“Don’t worry, Bev, I know where I’m going.”
“Stop and ask this lady for directions.”
“I said I can find it.”
“Just ask her.”
“Fine. Excuse me, ma’am, can you tell us how to get to the corpora quadrigemina from here?
Getting sweet on sweat
Are you the sort of person who struggles in social situations? Have the past 3 years been a secret respite from the terror and exhaustion of meeting new people? We understand your plight. People kind of suck. And you don’t have to look far to be reminded of it.
Unfortunately, on occasion we all have to interact with other human beings. If you suffer from social anxiety, this is not a fun thing to do. But new research indicates that there may be a way to alleviate the stress for those with social anxiety: armpits.
Specifically, sweat from the armpits of other people. Yes, this means a group of scientists gathered up some volunteers and collected their armpit sweat while the volunteers watched a variety of movies (horror, comedy, romance, etc.). Our condolences to the poor unpaid interns tasked with gathering the sweat.
Once they had their precious new medicine, the researchers took a group of women and administered a round of mindfulness therapy. Some of the participants then received the various sweats, while the rest were forced to smell only clean air. (The horror!) Lo and behold, the sweat groups had their anxiety scores reduced by about 40% after their therapy, compared with just 17% in the control group.
The researchers also found that the source of the sweat didn’t matter. Their study subjects responded the same to sweat excreted during a scary movie as they did to sweat from a comedy, a result that surprised the researchers. They suggested chemosignals in the sweat may affect the treatment response and advised further research. Which means more sweat collection! They plan on testing emotionally neutral movies next time, and if we can make a humble suggestion, they also should try the sweatiest movies.
Before the Food and Drug Administration can approve armpit sweat as a treatment for social anxiety, we have some advice for those shut-in introverts out there. Next time you have to interact with rabid extroverts, instead of shaking their hands, walk up to them and take a deep whiff of their armpits. Establish dominance. Someone will feel awkward, and science has proved it won’t be you.
The puff that vaccinates
Ever been shot with a Nerf gun or hit with a foam pool tube? More annoying than painful, right? If we asked if you’d rather get pelted with one of those than receive a traditional vaccine injection, you would choose the former. Maybe someday you actually will.
During the boredom of the early pandemic lockdown, Jeremiah Gassensmith, PhD, of the department of chemistry and biochemistry at the University of Texas, Dallas, ordered a compressed gas–powered jet injection system to fool around with at home. Hey, who didn’t? Anyway, when it was time to go back to the lab he handed it over to one of his grad students, Yalini Wijesundara, and asked her to see what could be done with it.
In her tinkering she found that the jet injector could deliver metal-organic frameworks (MOFs) that can hold a bunch of different materials, like proteins and nucleic acids, through the skin.
Thus the “MOF-Jet” was born!
Jet injectors are nothing new, but they hurt. The MOF-Jet, however, is practically painless and cheaper than the gene guns that veterinarians use to inject biological cargo attached to the surface of a metal microparticle.
Changing the carrier gas also changes the time needed to break down the MOF and thus alters delivery of the drug inside. “If you shoot it with carbon dioxide, it will release its cargo faster within cells; if you use regular air, it will take 4 or 5 days,” Ms. Wijesundara explained in a written statement. That means the same drug could be released over different timescales without changing its formulation.
While testing on onion cells and mice, Ms. Wijesundara noted that it was as easy as “pointing and shooting” to distribute the puff of gas into the cells. A saving grace to those with needle anxiety. Not that we would know anything about needle anxiety.
More testing needs to be done before bringing this technology to human use, obviously, but we’re looking forward to saying goodbye to that dreaded prick and hello to a puff.
Your hippocampus is showing
Brain anatomy is one of the many, many things that’s not really our thing, but we do know a cool picture when we see one. Case in point: The image just below, which happens to be a full-scale, single-cell resolution model of the CA1 region of the hippocampus that “replicates the structure and architecture of the area, along with the position and relative connectivity of the neurons,” according to a statement from the Human Brain Project.
“We have performed a data mining operation on high resolution images of the human hippocampus, obtained from the BigBrain database. The position of individual neurons has been derived from a detailed analysis of these images,” said senior author Michele Migliore, PhD, of the Italian National Research Council’s Institute of Biophysics in Palermo.
Yes, he did say BigBrain database. BigBrain is – we checked and it’s definitely not this – a 3D model of a brain that was sectioned into 7,404 slices just 20 micrometers thick and then scanned by MRI. Digital reconstruction of those slices was done by supercomputer and the results are now available for analysis.
Dr. Migliore and his associates developed an image-processing algorithm to obtain neuronal positioning distribution and an algorithm to generate neuronal connectivity by approximating the shapes of dendrites and axons. (Our brains are starting to hurt just trying to write this.) “Some fit into narrow cones, others have a broad complex extension that can be approximated by dedicated geometrical volumes, and the connectivity to nearby neurons changes accordingly,” explained lead author Daniela Gandolfi of the University of Modena (Italy) and Reggio Emilia.
The investigators have made their dataset and the extraction methodology available on the EBRAINS platform and through the Human Brain Project and are moving on to other brain regions. And then, once everyone can find their way in and around the old gray matter, it should bring an end to conversations like this, which no doubt occur between male and female neuroscientists every day:
“Arnold, I think we’re lost.”
“Don’t worry, Bev, I know where I’m going.”
“Stop and ask this lady for directions.”
“I said I can find it.”
“Just ask her.”
“Fine. Excuse me, ma’am, can you tell us how to get to the corpora quadrigemina from here?
Plant-based diets not always healthy; quality is key
The prospective cohort study used data from more than 120,000 middle-aged adults followed for over 10 years in the UK Biobank. Those who consumed a healthful plant-based diet – with higher amounts of foods such as fruits, vegetables, legumes, whole grains, and nuts – and lower intakes of animal products, sugary drinks, and refined grains had a 16% lower risk of dying during follow-up, compared with those with the lowest intakes of the healthful plant-based foods.
By contrast, an unhealthy plant-based diet was associated with a 23% higher total mortality risk.
“Not all plant-based diets are created equally. Our data provide evidence to support the notion that for health benefits the plant-based sources need to be whole grains, fruits and vegetables, legumes, nuts, etc., rather than processed plant-based foods,” study coauthor Aedín Cassidy, PhD, of Queen’s University, Belfast, Northern Ireland, said in an interview.
She added: “We do not necessarily need to radically shift diets to vegan or vegetarian regimens, but rather to switch proportions on the plate to incorporate more healthful plant-based foods, fish, and leaner cuts of meat into our habitual diet. This would have benefits for both individual health and planetary health.”
The findings were published online in JAMA Network Open by Alysha S. Thompson, MSc, also at Queen’s University, and colleagues.
High- vs. low-quality plant-based diets linked to better outcomes
The UK Biobank is a population-based, prospective study that included more than 500,000 participants aged 40-69 years at the time of recruitment between 2006 and 2010 at 22 centers in England, Scotland, and Wales. The current study included 126,395 individuals; slightly over half (55.9%) are women.
Food intake data were collected for at least two 24-hour periods to create both “healthful” and “unhealthful” plant-based diet indexes (PDIs). These included 17 food groups: whole grains, fruits, vegetables, nuts, legumes and vegetarian protein alternatives, tea and coffee, fruit juices, refined grains, potatoes, sugar-sweetened beverages, sweets and desserts, animal fat, dairy, eggs, fish or seafood, meat, and miscellaneous animal-derived foods. Data on oils weren’t available.
Higher scores on the healthful PDI and unhealthful PDI were scored positively or negatively based on quantities of those foods consumed.
Participants were then ranked in quartiles for portions of each food group and assigned scores between 2 (lowest-intake category) and 5 (highest).
During a follow-up of 10.6-12.2 years, there were 698 deaths attributed to cardiovascular disease, 3,275 deaths caused by cancer, 6,890 individuals who experienced a cardiovascular incident, and 8,939 with incident cancer.
Another 4,751 experienced an incident fracture, which was evaluated because of the concern that diets low in animal protein might lead to insufficient vitamin B and calcium intake.
After adjustment for confounding factors, the hazard ratio for all-cause mortality in individuals with the highest healthful PDI score quartile compared with the lowest quartile was 0.84.
At the same time, the HR for all-cause mortality for those with the highest versus lowest unhealthful PDI scores was 1.23, and for cancer-related mortality was 1.19. All were statistically significant (P = .004).
Similarly, greater healthy plant-based diet adherence was associated with a significantly lower risk of being diagnosed with any cancer (HR, 0.93; P = .03), while higher unhealthful PDI scores yielded a higher risk (HR, 1.10; P = .004).
Moreover, higher healthy PDI scores were associated with lower risks for total cardiovascular incident risks (HR, 0.92; P = .007), as well as for the individual events of ischemic stroke (HR, 0.84; P = .08) and MI (HR, 0.86; P = .004). Higher unhealthy PDI scores were similarly associated with greater risks for those outcomes, with an overall HR of 1.21 (P = .004).
No associations were found between either healthful PDI or unhealthful PDI and total or site-specific fracture risk.
And because 91.3% of the UK Biobank study population was White, “future studies among more racially, ethnically, and culturally diverse populations are needed to assess the risk of major chronic disease in relation to [plant-based diets],” the authors wrote.
Dr. Cassidy and Ms. Thompson reported no relevant financial relationships.
A version of this article first appeared on Medscape.com.
FROM JAMA NETWORK OPEN
One or two high-step days may reduce mortality risks
Taking 8,000 steps or more for just 1 or 2 days a week was linked to a significant reduction in all-cause and cardiovascular mortality, according to a study of about 3,000 adults.
Previous research has shown lower mortality rates among individuals who walk consistently, especially those who log at least 8,000 steps daily, but the benefit of intense walking just once or twice a week on long-term health outcomes has not been examined, wrote Kosuke Inoue, MD, of Kyoto University, Japan, and colleagues.
In a study published in JAMA Network Open, the researchers reviewed 10-year follow-up data for 3,101 adults aged 20 years and older who were part of the 2005 and 2006 National Health and Nutrition Examination Survey (NHANES).
The participants were asked to wear accelerometers to track their steps for 7 consecutive days. The researchers assessed the dose-response relationship between days of taking 8,000 steps or more (about 4 miles) during 1 week, and the primary outcome of all-cause mortality risk after 10 years. Cardiovascular mortality risk after 10 years was a secondary outcome.
The mean age of the participants was 50.5 years and 51% were women. The breakdown by ethnicity was 51% White, 21% Black, 24% Hispanic, and 4% other races/ethnicities. A total of 632 individuals took 8,000 steps or more 0 days a week, 532 took at least 8,000 steps 1-2 days per week, and 1,937 took at least 8,000 steps 3-7 days a week.
During the 10-year follow-up period, overall all-cause mortality was 14.2% and cardiovascular mortality was 5.3% across all step groups.
In an adjusted analysis, individuals who took at least 8,000 steps 1-2 days a week had a 14.9% lower all-cause mortality risk compared with those who never reached 8,000 daily steps. This difference was similar to the 16.5% reduced mortality risk for those who took at least 8,000 steps 3-7 days a week.
Similarly, compared with the group with no days of at least 8,000 steps, cardiovascular mortality risk was 8.1% lower for those who took 8,000 steps 1-2 days per week and 8.4% lower for those who took at least 8,000 steps 3-7 days per week. The decreased mortality risk plateaued at 3-4 days.
These patterns in reduced all-cause mortality risk persisted in a stratified analysis by age (younger than 65 years and 65 years and older) and sex. Similar patterns in reduced mortality also emerged when the researchers used different thresholds of daily steps, such as a minimum of 10,000 steps instead of 8,000. The adjusted all-cause mortality for groups who took at least 10,000 steps 1-2 days a week, 3-7 days a week, and no days a week were 8.1%, 7.3%, and 16.7%, respectively, with corresponding cardiovascular mortality risks of 2.4%, 2.3%, and 7.0%, respectively.
“Given the simplicity and ease of counting daily steps, our findings indicate that the recommended number of steps taken on as few as 1 to 2 days per week may be a feasible option for individuals who are striving to achieve some health benefits through adhering to a recommended daily step count but are unable to accomplish this on a daily basis,” the researchers wrote in their discussion.
The findings were limited by several factors including the use daily step measures for 1 week only at baseline, with no data on how physical activity changes might impact mortality risk, the researchers noted. Other limitations included possible accelerometer error and misclassification of activity, possible selection bias, and lack of data on cause-specific mortality outside of cardiovascular death, they said.
However, the results were strengthened by the use of accelerometers as objective measures of activity and by the availability of 10-year follow-up data for nearly 100% of the participants, they said.
“Although our findings might suffer from residual confounding that should be addressed in future research, they suggest that people may receive substantial health benefits even if a sufficient number of steps are taken on only a couple days of the week,” they concluded.
Proceed with caution
The current study findings should be interpreted cautiously in light of the potential unmeasured confounding factors and selection bias that often occur in studies of physical activity, James Sawalla Guseh, MD, of Massachusetts General Hospital, and Jose F. Figueroa, MD, of Harvard T.H. Chan School of Public Health, Boston, wrote in an accompanying editorial.
The results support previous studies showing some longevity benefits with “weekend warrior” patterns of intense physical activity for only a couple of days; however, “the body of evidence for sporadic activity is not as robust as the evidence for sustained and regular aerobic activity,” the authors emphasized.
The editorial authors also highlighted the limitations of the current study, including the observational design and significant differences in demographics and comorbidities between the 1- to 2-days of 8,000 steps exercise group and the 0-day group, as well as the reliance on only a week’s worth of data to infer 10 years’ mortality.
Although the data are consistent with previous observations that increased exercise volume reduces mortality, more research is needed, as the current study findings may not reflect other dimensions of health, including neurological health, they said.
Despite the need for cautious interpretation of the results, the current study “supports the emerging and popular idea that step counting, which does not require consideration of exercise duration or intensity, can offer guidance toward robust and favorable health outcomes,” and may inform step-based activity goals to improve public health, the editorialists wrote.
The study was supported by the Japan Agency for Medical Research and Development, the Japan Society for the Promotion of Science, the Japan Endocrine Society, and the Meiji Yasuda Life Foundation of Health and Welfare. Dr. Inoue also was supported by the Program for the Development of Next-Generation Leading Scientists With Global Insight sponsored by the Ministry of Education, Culture, Sports, Science and Technology, Japan. The other researchers had no relevant financial conflicts to disclose. The editorial authors had no financial conflicts to disclose.
FROM JAMA NETWORK OPEN
Retinopathy ‘emerging decades earlier’ in kids with type 2 diabetes than in adults
Nearly one in four children diagnosed with type 2 diabetes for 5 years or more develop diabetic retinopathy, according to a new report.
The global prevalence of diabetic retinopathy in pediatric patients with type 2 diabetes is about 7%, which appears to increase with age.
“In our clinical practice, we have seen an increase in children presenting with type 2 diabetes over the past few years. These patients present with multiple simultaneous comorbidities and complications like hypertension, fatty liver, and other conditions,” senior author M. Constantine Samaan, MD, told this news organization.
“The exact scale of diabetes-related eye disease was not clear, and we decided to quantify it,” said Dr. Samaan, associate professor of pediatrics at McMaster University and pediatric endocrinologist at McMaster Children’s Hospital in Hamilton, Ont.
“What we found was that in pediatric patients with type 2 diabetes, diabetic retinopathy is present in 1 in 14 youth. The risk of retinopathy increased significantly 5 years after diagnosis to almost one in four,” he noted.
“While we acknowledged that the number of diabetic retinopathy cases was relatively small and there was heterogeneity in studies, we were surprised that retinopathy rates rose so fast in the first few years after diabetes diagnosis,” Dr. Samaan indicated.
The findings signal that the increase in the prevalence of diabetic retinopathy is emerging decades earlier among children compared with adults with type 2 diabetes, the authors wrote in their article published online in JAMA Network Open.
“While the guidelines for eye care in children with type 2 diabetes recommend screening at diagnosis and annually afterward, these recommendations are not followed in almost half of these patients,” Dr. Samaan said. “There is a need to ensure that patients get screened to try and prevent or delay retinopathy onset and progression.”
Analyzing prevalence rates
Diabetic retinopathy is the leading cause of blindness in patients with type 2 diabetes. Between 21% and 39% of adults have diabetic retinopathy at diagnosis, with rates subsequently increasing, the authors wrote.
Dr. Samaan and colleagues conducted a systematic review and meta-analysis to estimate the global prevalence of diabetic retinopathy in pediatric patients with type 2 diabetes. They included studies that had a study population of at least 10 participants diagnosed at age 21 and younger, an observational study design, and prevalence data on diabetic retinopathy.
Among the 29 studies included, 6 were cross-sectional, 13 had a retrospective cohort design, and 10 had a prospective cohort design. Patients were diagnosed between age 6.5 and 21 years, and the diabetes duration ranged from 0 to 15 years after diagnosis.
The overall global prevalence of diabetic retinopathy in 5,924 pediatric patients was 7.0%. Prevalence varied by study design, ranging from 1.1% in cross-sectional studies to 6.5% in prospective cohort studies and 11.3% in retrospective cohort studies.
In the nine studies that reported diabetic retinopathy classification based on criteria, the prevalence of minimal-to-moderate nonproliferative diabetic retinopathy was 11.2%, the prevalence of severe nonproliferative diabetic retinopathy was 2.6%, the prevalence of proliferative diabetic retinopathy was 2.4%, and the prevalence of macular edema was 3.1%.
In the five studies that reported diabetic retinopathy diagnosis using fundoscopy, the prevalence was 0.5%. In the four studies that used 7-field stereoscopic fundus photography, the prevalence was 13.6%.
In the pooled analysis of 27 studies, the prevalence of diabetic retinopathy was 1.8% less than 2.5 years after diabetes diagnosis but more than doubled to 5.1% in years 2.5 to 5 and jumped to 28.8% more than 5 years after diagnosis.
Differences by sex, ethnicity
“We were also surprised that there was very limited evidence to understand the sex and race differences in retinopathy risk,” said Dr. Samaan. “Further research is warranted, considering that more girls develop type 2 diabetes than boys, and the risk of type 2 diabetes is higher in some racial groups.”
In addition, older age, longer diabetes duration, and higher hypertension prevalence were associated with diabetic retinopathy prevalence. There were no associations with obesity prevalence or mean age at diabetes diagnosis. However, patients who developed diabetic retinopathy had a higher mean A1c level of 1.4% compared to those without retinopathy.
Dr. Samaan and colleagues are continuing to research the comorbidities and complications that children with type 2 diabetes face as well as mechanisms that drive diabetes outcomes among children and adolescents.
For now, the findings highlight the importance of retinopathy screening and personalized diabetes treatment to protect vision, Dr. Samaan reiterated.
No funding source for the study was reported. The authors have reported no relevant financial relationships.
A version of this article originally appeared on Medscape.com.
Disparities in statin use persist in high-risk Americans
Disparities in statin use in minority populations persist regardless of insurance status and 10-year atherosclerotic cardiovascular disease risk.
Those are among the findings of a study that sampled a national population database and has provided robust data and granular details on those disparities.
The researchers reported in JAMA Cardiology that the overall prevalence of statin use was 25.5%, and that it varied significantly between defined ethnic groups: 20% for Blacks, 15.4% for Hispanics, and 27.9% for Whites (P < .001). Statin use rates by Asian participants, at 25.5%, didn’t differ significantly from use by Whites.

“We know that there are racial and ethnic disparities in the use of guideline-indicated statins after having established heart disease, but it was unknown if these disparities existed in the use of guideline-indicated statins for prevention of heart disease in those who just have risk factors,” lead author Joshua Jacobs, PharmD, a clinical pharmacist of cardiovascular medicine at University of Utah Intermountain Healthcare, said in written comments. “Additionally, race is included in the guideline-recommended risk factor calculation in an effort to reduce these disparities.”
Dr. Jacobs and colleagues evaluated statins for use in primary prevention, building upon previous single-center or diabetes-only cohort studies. What makes their study different from previous studies evaluating disparities in statin use is its use of temporal trends or current 10-year predicted ASCVD risk categorization, he said.
Using data from the National Health and Nutrition Examination Survey (NHANES), the researchers performed a serial, cross-sectional analysis of 3,417 participants that they said represented 39.4 million U.S. adults after applying sampling weights for age, gender, and race and ethnicity. In the weighted sample, 62.2% were men. In terms of self-reported race and ethnicity, 4.2% were of Asian descent, 12.7% were Black, 10.1% were Hispanic, and 73% were White.
Study participants completed a standardized questionnaire given by trained interviewers and also went to mobile examination centers where physical, anthropomorphic, and laboratory measurements, including height, weight, LDL cholesterol, and fasting blood glucose were collected. Pill bottle review also verified participants’ self-reported medication use.
The study noted that for primary prevention of atherosclerotic cardiovascular disease (ASCVD), the 2018 American College of Cardiology/American Heart Association Guideline recommends statins for, among other patient factors, elevated 10-year predicted ASCVD risk. The study divided ASCVD risk strata into three groups – 5% to less than 7.5%, 7.5% to less than 20%, and more than 20% – based on the 2018 ACC/AHA guideline and used pooled cohort equation to calculate 10-year ASCVD risk, which the guideline endorses.
Gaps persist despite ASCVD risk
The analysis found no statistically significant difference within each ASCVD risk strata between the White and Asian groups. But although statin use increased proportionately across each higher risk group, the gap widened noticeably in the highest risk group (more than 20% 10-year risk) between Whites, used as the reference at 37.6%, and Blacks (23.8%; prevalence ratio, .90; 95% confidence interval, .82-.98) and Hispanics (23.9%; PR, .90; 95% CI, .81-.99).
The study also evaluated a number of social determinants of health factors. Health insurance and access to routine health care were significantly associated with greater statin use in Black, Hispanic, and White participants; marital status and food insecurity were not. However, even when variables such as education, household income, and health insurance were applied, statin use was still significantly higher in Whites than in Blacks and Hispanics. For those with health insurance, statin use was 28.6% (95% CI, 25-32), 21.1% (95% CI, 17.3-25.4) and 19.9% (95% CI, 15.9-24.5), respectively.
The study noted that the pooled cohort equation-guided approach to statins for primary prevention, which the 2018 ACC/AHA guideline endorsed, should promote greater use of statins among Black patients. “Equitable use of statin therapy for prevention of heart disease is needed for Black and Hispanic adults,” Dr. Jacobs said. “Improvements in access to care, such as having a routine primary care clinician and health insurance, may decrease these health disparities.”

A goal of the study was to identify if disparities in statin use held up across different risk groups, senior author Ambarish Pandey, MD, said in an interview. Use of the NHANES data makes this study unique among analyses of statin use disparities, he said.
“A lot of the work that has been done previously has focused on secondary prevention among patients who have atherosclerotic cardiovascular disease or have focused on single-center or hospital-based cohorts and have not really focused on a national representative cohort like NHANES,” said Dr. Pandey, of the UT Southwestern Medical Center, Dallas.
The next step is to do community-based participatory research focusing on different implementation strategies to increase the uptake of preventive statin use among Black and Hispanic communities, Dr. Jacobs said.
Dr. Jacobs has no relevant relationships to disclose. Dr. Pandey disclosed relationships with Gilead Sciences, Applied Therapeutics, Myovista, Tricog Health, Eli Lilly, Cytokinetics, Rivus, Roche Diagnostics, Pieces Technologies, Palomarin, Emmi Solutions, and Axon.
Disparities in statin use in minority populations persist regardless of insurance status and 10-year atherosclerotic cardiovascular disease risk.
Those are among the findings of a study that sampled a national population database and has provided robust data and granular details on those disparities.
The researchers reported in JAMA Cardiology that the overall prevalence of statin use was 25.5%, and that it varied significantly between defined ethnic groups: 20% for Blacks, 15.4% for Hispanics, and 27.9% for Whites (P < .001). Statin use rates by Asian participants, at 25.5%, didn’t differ significantly from use by Whites.
“We know that there are racial and ethnic disparities in the use of guideline-indicated statins after having established heart disease, but it was unknown if these disparities existed in the use of guideline-indicated statins for prevention of heart disease in those who just have risk factors,” lead author Joshua Jacobs, PharmD, a clinical pharmacist of cardiovascular medicine at University of Utah Intermountain Healthcare, said in written comments. “Additionally, race is included in the guideline-recommended risk factor calculation in an effort to reduce these disparities.”
Dr. Jacobs and colleagues evaluated statins for use in primary prevention, building upon previous single-center or diabetes-only cohort studies. What makes their study different from previous studies evaluating disparities in statin use is its use of temporal trends or current 10-year predicted ASCVD risk categorization, he said.
Using data from the National Health and Nutrition Examination Survey (NHANES), the researchers performed a serial, cross-sectional analysis of 3,417 participants that they said represented 39.4 million U.S. adults after applying sampling weights for age, gender, and race and ethnicity. In the weighted sample, 62.2% were men. In terms of self-reported race and ethnicity, 4.2% were of Asian descent, 12.7% were Black, 10.1% were Hispanic, and 73% were White.
Study participants completed a standardized questionnaire given by trained interviewers and also went to mobile examination centers where physical, anthropomorphic, and laboratory measurements, including height, weight, LDL cholesterol, and fasting blood glucose were collected. Pill bottle review also verified participants’ self-reported medication use.
The study noted that for primary prevention of atherosclerotic cardiovascular disease (ASCVD), the 2018 American College of Cardiology/American Heart Association Guideline recommends statins for, among other patient factors, elevated 10-year predicted ASCVD risk. The study divided ASCVD risk strata into three groups – 5% to less than 7.5%, 7.5% to less than 20%, and more than 20% – based on the 2018 ACC/AHA guideline and used pooled cohort equation to calculate 10-year ASCVD risk, which the guideline endorses.
Gaps persist despite ASCVD risk
The analysis found no statistically significant difference within each ASCVD risk strata between the White and Asian groups. But although statin use increased proportionately across each higher risk group, the gap widened noticeably in the highest risk group (more than 20% 10-year risk) between Whites, used as the reference at 37.6%, and Blacks (23.8%; prevalence ratio, .90; 95% confidence interval, .82-.98) and Hispanics (23.9%; PR, .90; 95% CI, .81-.99).
The study also evaluated a number of social determinants of health factors. Health insurance and access to routine health care were significantly associated with greater statin use in Black, Hispanic, and White participants; marital status and food insecurity were not. However, even when variables such as education, household income, and health insurance were applied, statin use was still significantly higher in Whites than in Blacks and Hispanics. For those with health insurance, statin use was 28.6% (95% CI, 25-32), 21.1% (95% CI, 17.3-25.4) and 19.9% (95% CI, 15.9-24.5), respectively.
The study noted that the pooled cohort equation-guided approach to statins for primary prevention, which the 2018 ACC/AHA guideline endorsed, should promote greater use of statins among Black patients. “Equitable use of statin therapy for prevention of heart disease is needed for Black and Hispanic adults,” Dr. Jacobs said. “Improvements in access to care, such as having a routine primary care clinician and health insurance, may decrease these health disparities.”
A goal of the study was to identify if disparities in statin use held up across different risk groups, senior author Ambarish Pandey, MD, said in an interview. Use of the NHANES data makes this study unique among analyses of statin use disparities, he said.
“A lot of the work that has been done previously has focused on secondary prevention among patients who have atherosclerotic cardiovascular disease or have focused on single-center or hospital-based cohorts and have not really focused on a national representative cohort like NHANES,” said Dr. Pandey, of the UT Southwestern Medical Center, Dallas.
The next step is to do community-based participatory research focusing on different implementation strategies to increase the uptake of preventive statin use among Black and Hispanic communities, Dr. Jacobs said.
Dr. Jacobs has no relevant relationships to disclose. Dr. Pandey disclosed relationships with Gilead Sciences, Applied Therapeutics, Myovista, Tricog Health, Eli Lilly, Cytokinetics, Rivus, Roche Diagnostics, Pieces Technologies, Palomarin, Emmi Solutions, and Axon.
FROM JAMA CARDIOLOGY
Luxe vacations, private jets: Medical device maker, surgeon to pay $46 million penalty in kickback scheme
according to experts familiar with the federal Anti-Kickback Statute.
Historically, enforcement actions have primarily focused on the person or organization offering the perks – and not necessarily the physicians accepting it, Steven W. Ortquist, founder and principal of Arete Compliance Solutions, LLC, in Phoenix, told this news organization.
But that’s changing.
“In recent years, we are seeing a trend toward holding physicians and others on the receiving end of the inducement accountable as well,” said Mr. Ortquist, who is a past board member and president of the Health Care Compliance Association. He noted that authorities usually pursue the inducing company first before moving on to individual clinicians or practices.
The Department of Justice followed a similar pattern in a recently announced kickback settlement that ensnared an intraocular lens distributor, an ophthalmology equipment supplier, two CEOs, and a surgeon. Precision Lens must pay more than $43 million for offering high-end vacations and other expensive perks to surgeons who used its cataract products.
The verdict marks the end of a 6-week civil jury trial, where evidence emerged that Paul Ehlen, owner of Precision Lens and its parent company, Cameron-Ehlen Group, maintained a secret “slush fund” for paying kickbacks to ophthalmic surgeons. The inducement scheme netted the Minnesota-based company millions in sales and led to the submission of 64,575 false Medicare claims from 2006 to 2015, a violation of the Anti-Kickback Statute and the False Claims Act.
According to court documents, physicians received luxury travel and entertainment packages, including skiing, fishing, and golfing excursions at exclusive destinations, often traveling via private jet to attend Broadway musicals and major sporting events. Mr. Ehlen and company representatives also sold frequent flyer miles to physicians at a steep discount, allowing them to take personal and business trips below fair market value.
Federal authorities initially announced an investigation into the business practices of Precision Lens in 2017 after receiving a whistleblower complaint from Kipp Fesenmaier, a former executive at Sightpath Medical, an ophthalmology supplier and “corporate partner” of Precision Lens. Mr. Fesenmaier alleged that both companies were involved in an inducement scheme.
Sightpath Medical and its CEO, James Tiffany, agreed to a $12 million settlement to resolve the kickback allegations.
The Department of Justice subsequently investigated Jitendra Swarup, MD, an ophthalmologist and cataract surgeon who allegedly received “unlawful remuneration from Sightpath, Precision, and Ehlen” and filed false insurance claims. In addition to accepting expensive hunting and fishing trips from the medical device companies, Dr. Swarup was paid more than $100,000 per year for consulting services he did not fully render.
Dr. Swarup agreed to a nearly $3 million settlement and participation in a 3-year corporate integrity agreement with the Office of Inspector General. In exchange for compliance with such contracts, the OIG permits physicians to continue participating in Medicare, Medicaid, and other federal health care programs.
In a statement from attorneys, Precision Lens and Mr. Ehlen pledged to appeal the verdict and “defend ... our wholly appropriate actions” while remaining focused on their commitment to health care clinicians and manufacturers.
‘Endless’ opportunities for inducement
Unfortunately, opportunities for inducement are “endless,” experts say. Extravagant trips, dinners, and gifts can trigger a violation, but so can nearly anything of value.
Just last year, Biotronik reached a $12.95 million settlement amid allegations that company representatives wined and dined physicians to induce their use of its pacemakers and defibrillators. To date, no physicians have been charged.
But after a record-breaking number of whistleblower judgments last fiscal year totaling more than $2 billion, physicians should take note, Radha Bhatnagar, Esq, director of compliance at The CM Group, told the news organization.
“When manufacturers offer physicians kickbacks with the added element of fraudulent Medicare or Medicaid reimbursements, that is typically when manufacturers and individuals face civil and criminal liability,” said Ms. Bhatnagar, something the Department of Justice alluded to when announcing a settlement involving 15 Texas physicians last year.
In another case, Kingsley R. Chin, an orthopedic surgeon and designer of a spinal implant, was indicted in 2021 for paying millions of dollars in sham consulting fees to physicians who used his products. At least six surgeons who accepted money from Dr. Chin were later named in a civil case and ordered to pay $3.3 million in penalties.
Jason Montone, DO, an orthopedic surgeon who accepted the illicit payments, agreed to a plea deal with a reduced prison sentence, 1 year of supervised release, and a fine of $379,000.
Although Dr. Chin’s sentencing hasn’t been announced, violating kickback laws can result in a sentence of up to 10 years.
A version of this article originally appeared on Medscape.com.
What happens when newer weight loss meds are stopped?
Some of these medicines are approved for treating obesity (Wegovy), whereas others are approved for type 2 diabetes (Ozempic and Mounjaro). Tirzepatide (Mounjaro) has been fast-tracked for approval for weight loss by the U.S. Food and Drug Administration this year, and in the first of the series of studies looking at its effect on obesity, the SURMOUNT-1 trial, tirzepatide demonstrated a mean weight loss of around 22% in people without diabetes, spurring significant off-label use.
Our offices are full of patients who have taken these medications, with unprecedented improvements in their weight, cardiometabolic health, and quality of life. What happens when patients stop taking these medications? Or more importantly, why stop them?
Although these drugs are very effective for weight loss and treating diabetes, there can be adverse effects, primarily gastrointestinal, that limit treatment continuation. Nausea is the most common side effect and usually diminishes over time. Slow dose titration and dietary modification can minimize unwanted gastrointestinal side effects.
Drug-induced acute pancreatitis, a rare adverse event requiring patients to stop therapy, was seen in approximately 0.2% of people in clinical trials.
Medications effective but cost prohibitive?
Beyond adverse effects, patients may be forced to stop treatment because of medication cost, changes in insurance coverage, or issues with drug availability.
Two incretin therapies currently approved for treating obesity – liraglutide (Saxenda) and semaglutide (Wegovy) – cost around $1,400 per month. Insurance coverage and manufacturer discounts can make treatment affordable, but anti-obesity medicines aren’t covered by Medicare or by many employer-sponsored commercial plans.
Changes in employment or insurance coverage, or expiration of manufacturer copay cards, may require patients to stop or change therapies. The increased prescribing and overall expense of these drugs have prompted insurance plans and self-insured groups to consider whether providing coverage for these medications is sustainable.
Limited coverage has led to significant off-label prescribing of incretin therapies that aren’t approved for treating obesity (for instance, Ozempic and Mounjaro) and compounding pharmacies selling peptides that allegedly contain the active pharmaceutical ingredients. High demand for these medications has created significant supply shortages over the past year, causing many people to be without treatment for significant periods of time, as reported by this news organization.
Recently, I saw a patient who lost more than 30 pounds with semaglutide (Wegovy). She then changed employers and the medication was no longer covered. She gained back almost 10 pounds over 3 months and was prescribed tirzepatide (Mounjaro) off-label for weight loss by another provider, using a manufacturer discount card to make the medication affordable. The patient did well with the new regimen and lost about 20 pounds, but the pharmacy stopped filling the prescription when changes were made to the discount card. Afraid of regaining the weight, she came to see us as a new patient to discuss her options with her lack of coverage for anti-obesity medications.
Stopping equals weight regain
Obesity is a chronic disease like hypertension. It responds to treatment and when people stop taking these anti-obesity medications, this is generally associated with increased appetite and less satiety, and there is subsequent weight regain and a recurrence in excess weight-related complications.
The STEP-1 trial extension showed an initial mean body weight reduction of 17.3% with weekly semaglutide 2.4 mg over 1 year. On average, two-thirds of the weight lost was regained by participants within 1 year of stopping semaglutide and the study’s lifestyle intervention. Many of the improvements seen in cardiometabolic variables, like blood glucose and blood pressure, similarly reverted to baseline.
There are also 2-year data from the STEP-5 trial with semaglutide; 3-year data from the SCALE trial with liraglutide; and 5-year nonrandomized data with multiple agents that show durable, clinically significant weight loss from medical therapies for obesity.
These data together demonstrate that medications are effective for durable weight loss if they are continued. However, this is not how obesity is currently treated. Anti-obesity medications are prescribed to less than 3% of eligible people in the United States, and the average duration of therapy is less than 90 days. This treatment length isn’t sufficient to see the full benefits most medications offer and certainly doesn’t support long-term weight maintenance.
A recent study showed that, in addition to maintaining weight loss from medical therapies, incretin-containing anti-obesity medication regimens were effective for treating weight regain and facilitating healthier weight after bariatric surgery.
Chronic therapy is needed for weight maintenance because several neurohormonal changes occur owing to weight loss. Metabolic adaptation is the relative reduction in energy expenditure, below what would be expected, in people after weight loss. When this is combined with physiologic changes that increase appetite and decrease satiety, many people create a positive energy balance that results in weight regain. This has been observed in reality TV shows such as “The Biggest Loser”: It’s biology, not willpower.
Unfortunately, many people – including health care providers – don’t understand how these changes promote weight regain and patients are too often blamed when their weight goes back up after medications are stopped. This blame is greatly misinformed by weight-biased beliefs that people with obesity are lazy and lack self-control for weight loss or maintenance. Nobody would be surprised if someone’s blood pressure went up if their antihypertensive medications were stopped. Why do we think so differently when treating obesity?
The prevalence of obesity in the United States is over 40% and growing. We are fortunate to have new medications that on average lead to 15% or greater weight loss when combined with lifestyle modification.
However, these medications are expensive and the limited insurance coverage currently available may not improve. From a patient experience perspective, it’s distressing to have to discontinue treatments that have helped to achieve a healthier weight and then experience regain.
People need better access to evidence-based treatments for obesity, which include lifestyle interventions, anti-obesity medications, and bariatric procedures. Successful treatment of obesity should include a personalized, patient-centered approach that may require a combination of therapies, such as medications and surgery, for lasting weight control.
Dr. Almandoz is associate professor, department of internal medicine, division of endocrinology; medical director, weight wellness program, University of Texas Southwestern, Dallas. He disclosed ties with Novo Nordisk and Eli Lilly. Follow Dr. Almandoz on Twitter: @JaimeAlmandoz.
A version of this article originally appeared on Medscape.com.