User login
-
div[contains(@class, 'header__large-screen')]
div[contains(@class, 'read-next-article')]
div[contains(@class, 'main-prefix')]
div[contains(@class, 'nav-primary')]
nav[contains(@class, 'nav-primary')]
section[contains(@class, 'footer-nav-section-wrapper')]
footer[@id='footer']
section[contains(@class, 'nav-hidden')]
div[contains(@class, 'ce-card-content')]
nav[contains(@class, 'nav-ce-stack')]
div[contains(@class, 'view-medstat-quiz-listing-panes')]
div[contains(@class, 'pane-article-sidebar-latest-news')]
First drug for MET+ NSCLC shows high response rates
conclude investigators of the pivotal trial that led to the drug’s approval.
Responses were seen in all patients regardless of how many previous drugs they had been treated with, although responses were particularly pronounced among patients who were treatment naive.
Capmatinib and a companion assay received FDA approval in May 2020 for the treatment of adults with metastatic NSCLC harboring MET exon 14–skipping mutations.
These MET mutations occur in 3%-4% of NSCLC patients. MET amplifications occur in 1%-6% of NSCLC patients. They have been associated with poor response to chemotherapy and immunotherapy.
“Prior to this approval, there weren’t any approved therapies for this group of patients,” noted Edward Garon, MD, associate professor of hematology and oncology at the University of California, Los Angeles, who led the pivotal trial.
“There are several drugs that have been used off label for MET exon 14 skipping mutations, but none with an indication for it,” he said in an interview.
Garon emphasized that capmatinib was particularly robust for patients who had not received prior therapy, although he added that it was also very effective for those who had been previously treated.
“The drug has been approved and it is available, and we have already written prescriptions for it at our clinic,” said Dr. Garon, “although, at our clinic, the majority of patients using it were part of the [pivotal] clinical trial.”
That trial is the phase 2 GEOMETRY mono-1 study. Results from the study were presented at a meeting earlier this year and have now been published in the New England Journal of Medicine.
It was conducted in a cohort of 364 patients with advanced NSCLC. Patients were stratified into five cohorts and two expansion cohorts, which were assigned according to MET status and previous lines of therapy. Across cohorts 1 through 5, a total of 97 patients had a MET exon 14–skipping mutation, and 210 had MET amplification. All patients were treated with capmatinib 400 mg twice daily.
Among patients with a MET exon 14 skipping mutation, an overall response was observed in 41% of previously treated patients and in 68% of those who had not previously been treated.
“That is a very high response rate, and clearly this drug is targeting this mutation,” said Fred Hirsch, MD, PhD, executive director, Center for Thoracic Oncology, Mount Sinai Health System, New York, who was approached for comment. “It’s very active, and you don’t get those responses with chemotherapy.”
The median duration of response was 9.7 months among previously treated patients and 12.6 months among those who were treatment naive. Median progression-free survival (PFS) was 5.4 months and 12.4 months, respectively.
In the cohort of patients with MET amplification, the overall response was 12% among those whose tumor tissue had a gene copy number of 6-9. The overall response rate was 9% among those with a gene copy number of 4 or 5, and it was 7% among those with a gene copy number of less than 4.
Median PFS was 2.7 months for patients whose tumor tissue had a gene copy number of 6-9 and in those with a gene copy number of 4 or 5. PFS rose to 3.6 months for patients with a gene copy number of less than 4.
The most frequently reported adverse events were peripheral edema (in 51%) and nausea (in 45%). These events were mostly of grade 1 or 2. Treatment-related serious adverse events occurred in 13% of patients. The incidence was lower in the groups with shorter duration of exposure. Treatment was discontinued in 11% of patients (consistent across cohorts) because of adverse events.
Dr. Hirsch commented that the results for patients with NSCLC and brain metastases were particularly noteworthy. “Brain metastases are, unfortunately, a common problem in patients with lung cancer,” he said. “Now, we have a drug that is effective for MET mutation and CNS involvement and can penetrate the blood-brain barrier, and this is a very encouraging situation.”
He pointed out that 7 of 13 patients with brain metastases responded to treatment with capmatinib. “Four patients have a complete response, and that is very encouraging,” said Dr. Hirsch. “This is clearly a deal-breaker in my opinion.”
The future is bright
Dr. Hirsch noted that the evidence supporting capmatinib is strong, even though a larger prospective study with a control group is lacking. “If we have a patient with this mutation, and knowing that there is a drug with a response rate of 68%, that is a good reason to try the drug up front. The data are sufficient that it should be offered to the patient, even without a control group.”
Capmatinib is the latest of many targeted drugs that have been launched in recent years, and several immunotherapies are also now available for treatment of this disease. These new therapies are making this a “very encouraging time in lung cancer,” Dr. Hirsch commented.
“We are seeing long-term survival, and, eventually, we may start seeing potential cures for some patients,” he said. “But at the very least, we are seeing very good long-term results with many of these targeted therapies, and we are continuing to learn more about resistant mechanisms. I can’t wait to see future in the field.”
The study was funded by Novartis Pharmaceuticals. Dr. Garon reports consulting or advisory roles with Dracen and research funding (institutional) from Merck, Genentech, AstraZeneca, Novartis, Lilly, Bristol-Myers Squibb, Mirati Therapeutics, Dynavax, Iovance Biotherapeutics, and Neon Therapeutics. His coauthors have disclosed numerous relationships with industry, as listed in the original article. Dr. Hirsch has disclosed no relevant financial relationships.
This article first appeared on Medscape.com.
Asymptomatic children may transmit COVID-19 in communities
About 22% of children with COVID-19 infections were asymptomatic, and 66% of the symptomatic children had unrecognized symptoms at the time of diagnosis, based on data from a case series of 91 confirmed cases.

Although recent reports suggest that COVID-19 infections in children are generally mild, data on the full spectrum of illness and duration of viral RNA in children are limited, wrote Mi Seon Han, MD, PhD, of Seoul (South Korea) Metropolitan Government–Seoul National University Boramae Medical Center, and colleagues.
To examine the full clinical course and duration of COVID-19 RNA detectability in children with confirmed infections, the researchers reviewed data from 91 individuals with confirmed infections. The children ranged in age from 27 days to 18 years, and 58% were male. The children were monitored at 20 hospitals and 2 isolation facilities for a mean 21.9 days. The findings were published in JAMA Pediatrics.
Overall, COVID-19 viral RNA was present in the study population for a mean 17.6 days, with testing done at a median interval of 3 days. A total of 20 children (22%) were asymptomatic throughout the study period. In these children, viral RNA was detected for a mean 14 days.
“The major hurdle implicated in this study in diagnosing and treating children with COVID-19 is that the researchers noted.
Of the 71 symptomatic children, 47 (66%) had unrecognized symptoms prior to diagnosis, 18 (25%) developed symptoms after diagnosis, and 6 (9%) were diagnosed at the time of symptom onset. The symptomatic children were symptomatic for a median of 11 days; 43 (61%) remained symptomatic at 7 days’ follow-up after the study period, 27 (38%) were symptomatic at 14 days, and 7 (10%) were symptomatic at 21 days.
A total of 41 children had upper respiratory infections (58%) and 22 children (24%) had lower respiratory tract infections. No difference in the duration of virus RNA was detected between children with upper respiratory tract infections and lower respiratory tract infections (average, 18.7 days vs. 19.9 days).
Among the symptomatic children, 46 (65%) had mild cases and 20 (28%) had moderate cases.
For treatment, 14 children (15%) received lopinavir-ritonavir and/or hydroxychloroquine. Two patients had severe illness and received oxygen via nasal prong, without the need for mechanical ventilation. All the children in the case series recovered from their infections with no fatalities.
The study’s main limitation was the inability to analyze the transmission potential of the children because of the quarantine and isolation policies in Korea, the researchers noted. In addition, the researchers did not perform follow-up testing at consistent intervals, so the duration of COVID-19 RNA detection may be inexact.
However, the results suggest “that suspecting and diagnosing COVID-19 in children based on their symptoms without epidemiologic information and virus testing is very challenging,” the researchers emphasized.
“Most of the children with COVID-19 have silent disease, but SARS-CoV-2 RNA can still be detected in the respiratory tract for a prolonged period,” they wrote. More research is needed to explore the potential for disease transmission by children in the community, and increased surveillance with laboratory screening can help identify children with unrecognized infections.
The study is the first known to focus on the frequency of asymptomatic infection in children and the duration of symptoms in both asymptomatic and symptomatic children, Roberta L. DeBiasi, MD, and Meghan Delaney, DO, both affiliated with Children’s National Hospital and Research Institute, Washington, and George Washington University, Washington, wrote in an accompanying editorial. The structure of the Korean public health system “allowed for the sequential observation, testing (median testing interval of every 3 days), and comparison of 91 asymptomatic, presymptomatic, and symptomatic children with mild to moderate upper and lower respiratory tract infection, identified primarily by contact tracing from laboratory-proven cases.”
Two take-home points from the study are that not all infected children are symptomatic, and the duration of symptoms in those who are varies widely, they noted. “Interestingly, this study aligns with adult data in which up to 40% of adults may remain asymptomatic in the face of infection.”
However, “The third and most important take-home point from this study relates to the duration of viral shedding in infected pediatric patients,” Dr. DeBiasi and Dr. Delaney said (JAMA Pediatr. 2020 Aug 28. doi: 10.1001/jamapediatrics.2020.3996).
“Fully half of symptomatic children with both upper and lower tract disease were still shedding virus at 21 days. These are striking data, particularly since 86 of 88 diagnosed children (98%) either had no symptoms or mild or moderate disease,” they explained. The results highlight the need for improvements in qualitative molecular testing and formal studies to identify differences in results from different testing scenarios, such as hospital entry, preprocedure screening, and symptomatic testing. In addition, “these findings are highly relevant to the development of public health strategies to mitigate and contain spread within communities, particularly as affected communities begin their recovery phases.”

The study is important because “schools are opening, and we don’t know what is going to happen,” Michael E. Pichichero, MD, of Rochester General Hospital, N.Y., said in an interview.
“Clinicians, parents, students, school administrators and politicians are worried,” he said. “This study adds to others recently published, bringing into focus the challenges to several suppositions that existed when the COVID-19 pandemic began and over the summer.”
“This study of 91 Korean children tells us that taking a child’s temperature as a screening tool to decide if they may enter school will not be a highly successful strategy,” he said. “Many children are without fever and asymptomatic when infected and contagious. The notion that children shed less virus or shed it for shorter lengths of time we keep learning from this type of research is not true. In another recent study the authors found that children shed as much of the SARS-CoV-2 virus as an adult in the ICU on a ventilator.”
Dr. Pichichero said he was not surprised by the study findings. “A similar paper was published last week in the Journal of Pediatrics from Massachusetts General Hospital, so the findings in the JAMA paper are similar to what has been reported in the United States.”
“Availability of testing will continue to be a challenge in some communities,” said Dr. Pichichero. “Here in the Rochester, New York, area we will use a screening questionnaire based on the CDC [Centers for Disease Control and Prevention] symptom criteria of SARS-CoV-2 infections to decide whom to test.”
As for additional research, “We have so much more to learn about SARS-CoV-2 in children,” he emphasized. “The focus has been on adults because the morbidity and mortality has been greatest in adults, especially the elderly and those with compromised health.”
“The National Institutes of Health has issued a call for more research in children to characterize the spectrum of SARS-CoV-2 illness, including the multisystem inflammatory syndrome in children [MIS-C] and try to identify biomarkers and/or biosignatures for a prognostic algorithm to predict the longitudinal risk of disease severity after a child is exposed to and may be infected with SARS-CoV-2,” said Dr. Pichichero. “NIH has asked researchers to answer the following questions.”
- Why do children have milder illness?
- Are there differences in childhood biology (e.g., gender, puberty, etc.) that contribute to illness severity?
- Are there genetic host differences associated with different disease severity phenotypes, including MIS-C?
- Are there innate mucosal, humoral, cellular and other adaptive immune profiles that are associated with reduced or increased risk of progressive disease, including previous coronavirus infections?
- Will SARS-CoV-2 reinfection cause worse disease as seen with antibody-dependent enhancement (ADE) in other viral infections (e.g., dengue)? Will future vaccines carry a risk of the ADE phenomenon?
- Does substance use (e.g., nicotine, marijuana) exacerbate or trigger MIS-C through immune activation?
“We have no knowledge yet about SARS-CoV-2 vaccination of children, especially young children,” Dr. Pichichero emphasized. “There are different types of vaccines – messenger RNA, adenovirus vector and purified spike proteins of the virus – among others, but questions remain: Will the vaccines work in children? What about side effects? Will the antibodies and cellular immunity protect partially or completely?”
The researchers and editorialists had no financial conflicts to disclose. Dr. Pichichero had no financial conflicts to disclose.
SOURCE: Han MS et al. JAMA Pediatr. 2020 Aug 28. doi:10.1001/jamapediatrics.2020.3988.
About 22% of children with COVID-19 infections were asymptomatic, and 66% of the symptomatic children had unrecognized symptoms at the time of diagnosis, based on data from a case series of 91 confirmed cases.
Although recent reports suggest that COVID-19 infections in children are generally mild, data on the full spectrum of illness and duration of viral RNA in children are limited, wrote Mi Seon Han, MD, PhD, of Seoul (South Korea) Metropolitan Government–Seoul National University Boramae Medical Center, and colleagues.
To examine the full clinical course and duration of COVID-19 RNA detectability in children with confirmed infections, the researchers reviewed data from 91 individuals with confirmed infections. The children ranged in age from 27 days to 18 years, and 58% were male. The children were monitored at 20 hospitals and 2 isolation facilities for a mean 21.9 days. The findings were published in JAMA Pediatrics.
Overall, COVID-19 viral RNA was present in the study population for a mean 17.6 days, with testing done at a median interval of 3 days. A total of 20 children (22%) were asymptomatic throughout the study period. In these children, viral RNA was detected for a mean 14 days.
“The major hurdle implicated in this study in diagnosing and treating children with COVID-19 is that the researchers noted.
Of the 71 symptomatic children, 47 (66%) had unrecognized symptoms prior to diagnosis, 18 (25%) developed symptoms after diagnosis, and 6 (9%) were diagnosed at the time of symptom onset. The symptomatic children were symptomatic for a median of 11 days; 43 (61%) remained symptomatic at 7 days’ follow-up after the study period, 27 (38%) were symptomatic at 14 days, and 7 (10%) were symptomatic at 21 days.
A total of 41 children had upper respiratory infections (58%) and 22 children (24%) had lower respiratory tract infections. No difference in the duration of virus RNA was detected between children with upper respiratory tract infections and lower respiratory tract infections (average, 18.7 days vs. 19.9 days).
Among the symptomatic children, 46 (65%) had mild cases and 20 (28%) had moderate cases.
For treatment, 14 children (15%) received lopinavir-ritonavir and/or hydroxychloroquine. Two patients had severe illness and received oxygen via nasal prong, without the need for mechanical ventilation. All the children in the case series recovered from their infections with no fatalities.
The study’s main limitation was the inability to analyze the transmission potential of the children because of the quarantine and isolation policies in Korea, the researchers noted. In addition, the researchers did not perform follow-up testing at consistent intervals, so the duration of COVID-19 RNA detection may be inexact.
However, the results suggest “that suspecting and diagnosing COVID-19 in children based on their symptoms without epidemiologic information and virus testing is very challenging,” the researchers emphasized.
“Most of the children with COVID-19 have silent disease, but SARS-CoV-2 RNA can still be detected in the respiratory tract for a prolonged period,” they wrote. More research is needed to explore the potential for disease transmission by children in the community, and increased surveillance with laboratory screening can help identify children with unrecognized infections.
The study is the first known to focus on the frequency of asymptomatic infection in children and the duration of symptoms in both asymptomatic and symptomatic children, Roberta L. DeBiasi, MD, and Meghan Delaney, DO, both affiliated with Children’s National Hospital and Research Institute, Washington, and George Washington University, Washington, wrote in an accompanying editorial. The structure of the Korean public health system “allowed for the sequential observation, testing (median testing interval of every 3 days), and comparison of 91 asymptomatic, presymptomatic, and symptomatic children with mild to moderate upper and lower respiratory tract infection, identified primarily by contact tracing from laboratory-proven cases.”
Two take-home points from the study are that not all infected children are symptomatic, and the duration of symptoms in those who are varies widely, they noted. “Interestingly, this study aligns with adult data in which up to 40% of adults may remain asymptomatic in the face of infection.”
However, “The third and most important take-home point from this study relates to the duration of viral shedding in infected pediatric patients,” Dr. DeBiasi and Dr. Delaney said (JAMA Pediatr. 2020 Aug 28. doi: 10.1001/jamapediatrics.2020.3996).
“Fully half of symptomatic children with both upper and lower tract disease were still shedding virus at 21 days. These are striking data, particularly since 86 of 88 diagnosed children (98%) either had no symptoms or mild or moderate disease,” they explained. The results highlight the need for improvements in qualitative molecular testing and formal studies to identify differences in results from different testing scenarios, such as hospital entry, preprocedure screening, and symptomatic testing. In addition, “these findings are highly relevant to the development of public health strategies to mitigate and contain spread within communities, particularly as affected communities begin their recovery phases.”
The study is important because “schools are opening, and we don’t know what is going to happen,” Michael E. Pichichero, MD, of Rochester General Hospital, N.Y., said in an interview.
“Clinicians, parents, students, school administrators and politicians are worried,” he said. “This study adds to others recently published, bringing into focus the challenges to several suppositions that existed when the COVID-19 pandemic began and over the summer.”
“This study of 91 Korean children tells us that taking a child’s temperature as a screening tool to decide if they may enter school will not be a highly successful strategy,” he said. “Many children are without fever and asymptomatic when infected and contagious. The notion that children shed less virus or shed it for shorter lengths of time we keep learning from this type of research is not true. In another recent study the authors found that children shed as much of the SARS-CoV-2 virus as an adult in the ICU on a ventilator.”
Dr. Pichichero said he was not surprised by the study findings. “A similar paper was published last week in the Journal of Pediatrics from Massachusetts General Hospital, so the findings in the JAMA paper are similar to what has been reported in the United States.”
“Availability of testing will continue to be a challenge in some communities,” said Dr. Pichichero. “Here in the Rochester, New York, area we will use a screening questionnaire based on the CDC [Centers for Disease Control and Prevention] symptom criteria of SARS-CoV-2 infections to decide whom to test.”
As for additional research, “We have so much more to learn about SARS-CoV-2 in children,” he emphasized. “The focus has been on adults because the morbidity and mortality has been greatest in adults, especially the elderly and those with compromised health.”
“The National Institutes of Health has issued a call for more research in children to characterize the spectrum of SARS-CoV-2 illness, including the multisystem inflammatory syndrome in children [MIS-C] and try to identify biomarkers and/or biosignatures for a prognostic algorithm to predict the longitudinal risk of disease severity after a child is exposed to and may be infected with SARS-CoV-2,” said Dr. Pichichero. “NIH has asked researchers to answer the following questions.”
- Why do children have milder illness?
- Are there differences in childhood biology (e.g., gender, puberty, etc.) that contribute to illness severity?
- Are there genetic host differences associated with different disease severity phenotypes, including MIS-C?
- Are there innate mucosal, humoral, cellular and other adaptive immune profiles that are associated with reduced or increased risk of progressive disease, including previous coronavirus infections?
- Will SARS-CoV-2 reinfection cause worse disease as seen with antibody-dependent enhancement (ADE) in other viral infections (e.g., dengue)? Will future vaccines carry a risk of the ADE phenomenon?
- Does substance use (e.g., nicotine, marijuana) exacerbate or trigger MIS-C through immune activation?
“We have no knowledge yet about SARS-CoV-2 vaccination of children, especially young children,” Dr. Pichichero emphasized. “There are different types of vaccines – messenger RNA, adenovirus vector and purified spike proteins of the virus – among others, but questions remain: Will the vaccines work in children? What about side effects? Will the antibodies and cellular immunity protect partially or completely?”
The researchers and editorialists had no financial conflicts to disclose. Dr. Pichichero had no financial conflicts to disclose.
SOURCE: Han MS et al. JAMA Pediatr. 2020 Aug 28. doi:10.1001/jamapediatrics.2020.3988.
FROM JAMA PEDIATRICS
Sleep disorders may be undetected precursors for cardiometabolic disease in U.S. Latinos
Sleep disorders may be silent precursors of cardiometabolic disease among U.S. Latinos, said authors of a newly published study.

Xiaoyu Li, ScD, and Susan Redline, MD, MPH, of Harvard Medical School and Brigham and Women’s Hospital, Boston, and coauthors conducted a study of people who self-identified as Latino, who had baseline sleeping disorders, and who developed hypertension and diabetes over time. The study was published in the American Journal of Respiratory and Critical Care Medicine.
The findings suggested that sleep disorders preceded the development of hypertension and diabetes. Examining records from a major multiyear federal project, the Hispanic Community Health Study/Study of Latinos, Dr. Li, Dr. Redline, and coauthors found sleep-disordered breathing (SDB) was associated with a 1.54 higher adjusted odds of incident hypertension (95% confidence interval [CI], 1.18-2.00) and 1.33 higher odds of incident diabetes (95% CI, 1.05-1.67), compared with no SDB. Insomnia was associated with incident hypertension (odds ratio, 1.37; 95% CI, 1.11-1.69), but not diabetes. The association between insomnia and incident hypertension was stronger among men than women, they reported.
“We now need large-scale rigorous trials to evaluate the impact of early treatment of sleep disordered breathing and insomnia on preventing the development of hypertension and diabetes,” Dr. Redline said in an interview. “Clinicians should consider screening their patients at risk for hypertension and diabetes for both sleep-disordered breathing and insomnia.”
Implications for public health strategies
The study results may have implications for health strategies and policies aimed at addressing health differentials among ethnic and economic groups in the United States.

Suboptimal sleep health may be an important fundamental but understudied contributor to health disparities, Chandra L. Jackson, PhD, MS, of the National Institute of Environmental Health Sciences, Research Triangle, N.C., said in an interview. Dr. Jackson is the lead author for a report published in August on a 2018 National Institutes of Health workshop regarding the importance of studying sleep health disparities (Sleep 2020 Mar 10. doi: 10.1093/sleep/zsaa037). The NIH workshop emphasized how little research has been done on the prevalence, incidence, morbidity, or mortality of sleep deficiencies of racial and ethnic minority populations, even though members of these groups are generally more likely to experience sleep disorders. The report urged “a nuanced integration between health disparity causal pathways and sleep and circadian-related mechanisms” tailored for these groups, with attention paid to sociocultural context.
Dr. Jackson said the study by Dr. Li and colleagues fits nicely with the strategies recommended in this report. She added: “Prospective design is particularly important for establishing temporality or that the SDB and insomnia symptoms occurred before the outcomes of hypertension and diabetes.”
In commenting on the Xi/Redline paper, Krishna M. Sundar, MD, FCCP, medical director of the Sleep-Wake Center at the University of Utah, Salt Lake City, commended the study and noted that one of the challenges in sleep research is the long time period over which the effects of disordered breathing become clear, he said.

“Things don’t happen immediately. It takes months, years for the effects to develop,” Dr. Sundar said. “To try to piece together the relationships, you need very well planned studies.”
Study design: Participants and exclusions
Latinos currently make up 17.8%, or 57.5 million, of the U.S. population, and this group is expected to double within the next 4 decades, the investigators wrote. A few prior studies on the roles of sleep disorders in the cardiometabolic health of Latinos, though suggestive, were limited by cross-sectional designs, relatively small samples, and underrepresentation of various Latino heritage groups.
The investigators on this new study worked with data from the federal Hispanic Community Health Study/Study of Latinos (HCHS/SOL) in which more than 16,000 people participated.
This multiyear federal study drew people who self-identified with different heritage groups, including Cuban, Dominican, Mexican, Central American, South American, and Puerto Rican. Participants initially aged 18-74 years underwent a first round of exams and assessments between 2008 and 2011 to determine what risk factors they had at the start of the study. In the second phase, which took place from 2013 to 2018, participants had a second set of exams. The National Heart, Lung, and Blood Institute and the National Institute of Diabetes and Digestive and Kidney Diseases funded the HCHS/SOL.
The investigators initially had a potential data pool of 11,623 participants in the HCHS/SOL. About 1 of 8 in this group, or 1,424 participants (12.3%), did not undergo a sleep study or did not have sufficient sleep data for analyses. Another 93 (0.8%) participants were excluded for missing data on covariates.
For incident hypertension analyses, participants who had prevalent hypertension at the first screening in the HCHS/SOL (n = 3,139) or had missing data on hypertension (n = 2) were excluded. That resulted in an analytic sample of 6,965 for hypertension questions.
For incident diabetes analyses, participants who had prevalent diabetes at the first screening (n = 2,062) or had missing data on diabetes (n = 21) were excluded, yielding an analytic sample of 8,023.
Incident hypertension was defined as participants not having hypertension at baseline and having hypertension, defined as a systolic blood pressure 140 mm Hg or greater, diastolic blood pressure 90 mm Hg or greater, or receiving antihypertensive medication within 4 weeks, at the second round of screening.
Cardiometabolic disease definitions
The researchers did not discriminate between type 1 and type 2 diabetes. They used the American Diabetes Association definition as a fasting plasma glucose 126 mg/dL or greater, 2-hour, postload plasma glucose 200 mg/dL or greater, or hemoglobin A1c 6.5% or greater, with an additional criterion on self-reported use of antidiabetic medication within 4 weeks before the visit.
In line with previous research, the investigators controlled for potential confounders measured at baseline including sociodemographic factors, health behaviors, and adiposity, which are considered important risk factors for both sleep disorders and incident metabolic diseases. These factors include education level, age, gender, and body mass index and whether participants had ever been smokers or users of alcohol.
Study limitations
Limitations of the study include use of a home sleep apnea test device that did not allow evaluation of arousal or sleep architecture. The researchers said this may have led to an underestimation of disease severity both due to overestimation of sleep time and underrecognition of hypopneas unassociated with desaturation. In addition, prior research has suggested that minority populations might underreport sleep disturbances, possibly “due to social desirability (a tendency not to encode a negative event), stress, stereotype threat, acculturation, attitudes, etc.” The participants were recruited mostly from urban areas, and the results might not be generalized to rural populations. In addition, 41% of study participants were of Mexican heritage, compared with 63% of the Hispanic population being of Mexican heritage in the United States.
Another researcher in the field of health disparities, Julia Roncoroni, PhD, assistant professor of psychology at the University of Denver, also noted this slight underrepresentation of Hispanics of Mexican origin and an overrepresentation of urban individuals in the HCHS/SOL.
“However, using data from HCHS/SOL, which is the largest multicenter epidemiological study of cardiovascular risk factors and sleep traits in U.S. Hispanics/Latinx, allows researchers to answer a high-impact question that would otherwise be prohibitively expensive and time consuming,” wrote Dr. Roncoroni.
Conclusions
The study offers “the first prospective evidence on the associations between SDB and insomnia with incident hypertension and diabetes in US Hispanics/Latinos.” The investigators concluded: “Given the fact that sleep disorders are largely undiagnosed and undertreated, they might represent modifiable targets for disease prevention and reduction among US Hispanics/Latinos. Culturally informed interventions focusing on detecting and treating sleep disorders might improve cardiometabolic health among US Hispanics/Latinos.”
Dr. Redline was partially supported by NIH grant R35 HL135818. This study drew from the Hispanic Community Health Study/Study of Latinos, which has been supported by contracts from the National Heart, Lung, and Blood Institute.
SOURCE: Li X et al. Am J Respir Crit Care Med. 2020 Aug 6. doi: 10.1164/rccm.201912-2330OC.
Sleep disorders may be silent precursors of cardiometabolic disease among U.S. Latinos, said authors of a newly published study.
Xiaoyu Li, ScD, and Susan Redline, MD, MPH, of Harvard Medical School and Brigham and Women’s Hospital, Boston, and coauthors conducted a study of people who self-identified as Latino, who had baseline sleeping disorders, and who developed hypertension and diabetes over time. The study was published in the American Journal of Respiratory and Critical Care Medicine.
The findings suggested that sleep disorders preceded the development of hypertension and diabetes. Examining records from a major multiyear federal project, the Hispanic Community Health Study/Study of Latinos, Dr. Li, Dr. Redline, and coauthors found sleep-disordered breathing (SDB) was associated with a 1.54 higher adjusted odds of incident hypertension (95% confidence interval [CI], 1.18-2.00) and 1.33 higher odds of incident diabetes (95% CI, 1.05-1.67), compared with no SDB. Insomnia was associated with incident hypertension (odds ratio, 1.37; 95% CI, 1.11-1.69), but not diabetes. The association between insomnia and incident hypertension was stronger among men than women, they reported.
“We now need large-scale rigorous trials to evaluate the impact of early treatment of sleep disordered breathing and insomnia on preventing the development of hypertension and diabetes,” Dr. Redline said in an interview. “Clinicians should consider screening their patients at risk for hypertension and diabetes for both sleep-disordered breathing and insomnia.”
Implications for public health strategies
The study results may have implications for health strategies and policies aimed at addressing health differentials among ethnic and economic groups in the United States.
Suboptimal sleep health may be an important fundamental but understudied contributor to health disparities, Chandra L. Jackson, PhD, MS, of the National Institute of Environmental Health Sciences, Research Triangle, N.C., said in an interview. Dr. Jackson is the lead author for a report published in August on a 2018 National Institutes of Health workshop regarding the importance of studying sleep health disparities (Sleep 2020 Mar 10. doi: 10.1093/sleep/zsaa037). The NIH workshop emphasized how little research has been done on the prevalence, incidence, morbidity, or mortality of sleep deficiencies of racial and ethnic minority populations, even though members of these groups are generally more likely to experience sleep disorders. The report urged “a nuanced integration between health disparity causal pathways and sleep and circadian-related mechanisms” tailored for these groups, with attention paid to sociocultural context.
Dr. Jackson said the study by Dr. Li and colleagues fits nicely with the strategies recommended in this report. She added: “Prospective design is particularly important for establishing temporality or that the SDB and insomnia symptoms occurred before the outcomes of hypertension and diabetes.”
In commenting on the Xi/Redline paper, Krishna M. Sundar, MD, FCCP, medical director of the Sleep-Wake Center at the University of Utah, Salt Lake City, commended the study and noted that one of the challenges in sleep research is the long time period over which the effects of disordered breathing become clear, he said.
“Things don’t happen immediately. It takes months, years for the effects to develop,” Dr. Sundar said. “To try to piece together the relationships, you need very well planned studies.”
Study design: Participants and exclusions
Latinos currently make up 17.8%, or 57.5 million, of the U.S. population, and this group is expected to double within the next 4 decades, the investigators wrote. A few prior studies on the roles of sleep disorders in the cardiometabolic health of Latinos, though suggestive, were limited by cross-sectional designs, relatively small samples, and underrepresentation of various Latino heritage groups.
The investigators on this new study worked with data from the federal Hispanic Community Health Study/Study of Latinos (HCHS/SOL) in which more than 16,000 people participated.
This multiyear federal study drew people who self-identified with different heritage groups, including Cuban, Dominican, Mexican, Central American, South American, and Puerto Rican. Participants initially aged 18-74 years underwent a first round of exams and assessments between 2008 and 2011 to determine what risk factors they had at the start of the study. In the second phase, which took place from 2013 to 2018, participants had a second set of exams. The National Heart, Lung, and Blood Institute and the National Institute of Diabetes and Digestive and Kidney Diseases funded the HCHS/SOL.
The investigators initially had a potential data pool of 11,623 participants in the HCHS/SOL. About 1 of 8 in this group, or 1,424 participants (12.3%), did not undergo a sleep study or did not have sufficient sleep data for analyses. Another 93 (0.8%) participants were excluded for missing data on covariates.
For incident hypertension analyses, participants who had prevalent hypertension at the first screening in the HCHS/SOL (n = 3,139) or had missing data on hypertension (n = 2) were excluded. That resulted in an analytic sample of 6,965 for hypertension questions.
For incident diabetes analyses, participants who had prevalent diabetes at the first screening (n = 2,062) or had missing data on diabetes (n = 21) were excluded, yielding an analytic sample of 8,023.
Incident hypertension was defined as participants not having hypertension at baseline and having hypertension, defined as a systolic blood pressure 140 mm Hg or greater, diastolic blood pressure 90 mm Hg or greater, or receiving antihypertensive medication within 4 weeks, at the second round of screening.
Cardiometabolic disease definitions
The researchers did not discriminate between type 1 and type 2 diabetes. They used the American Diabetes Association definition as a fasting plasma glucose 126 mg/dL or greater, 2-hour, postload plasma glucose 200 mg/dL or greater, or hemoglobin A1c 6.5% or greater, with an additional criterion on self-reported use of antidiabetic medication within 4 weeks before the visit.
In line with previous research, the investigators controlled for potential confounders measured at baseline including sociodemographic factors, health behaviors, and adiposity, which are considered important risk factors for both sleep disorders and incident metabolic diseases. These factors include education level, age, gender, and body mass index and whether participants had ever been smokers or users of alcohol.
Study limitations
Limitations of the study include use of a home sleep apnea test device that did not allow evaluation of arousal or sleep architecture. The researchers said this may have led to an underestimation of disease severity both due to overestimation of sleep time and underrecognition of hypopneas unassociated with desaturation. In addition, prior research has suggested that minority populations might underreport sleep disturbances, possibly “due to social desirability (a tendency not to encode a negative event), stress, stereotype threat, acculturation, attitudes, etc.” The participants were recruited mostly from urban areas, and the results might not be generalized to rural populations. In addition, 41% of study participants were of Mexican heritage, compared with 63% of the Hispanic population being of Mexican heritage in the United States.
Another researcher in the field of health disparities, Julia Roncoroni, PhD, assistant professor of psychology at the University of Denver, also noted this slight underrepresentation of Hispanics of Mexican origin and an overrepresentation of urban individuals in the HCHS/SOL.
“However, using data from HCHS/SOL, which is the largest multicenter epidemiological study of cardiovascular risk factors and sleep traits in U.S. Hispanics/Latinx, allows researchers to answer a high-impact question that would otherwise be prohibitively expensive and time consuming,” wrote Dr. Roncoroni.
Conclusions
The study offers “the first prospective evidence on the associations between SDB and insomnia with incident hypertension and diabetes in US Hispanics/Latinos.” The investigators concluded: “Given the fact that sleep disorders are largely undiagnosed and undertreated, they might represent modifiable targets for disease prevention and reduction among US Hispanics/Latinos. Culturally informed interventions focusing on detecting and treating sleep disorders might improve cardiometabolic health among US Hispanics/Latinos.”
Dr. Redline was partially supported by NIH grant R35 HL135818. This study drew from the Hispanic Community Health Study/Study of Latinos, which has been supported by contracts from the National Heart, Lung, and Blood Institute.
SOURCE: Li X et al. Am J Respir Crit Care Med. 2020 Aug 6. doi: 10.1164/rccm.201912-2330OC.
FROM THE AMERICAN JOURNAL OF RESPIRATORY AND CRITICAL CARE MEDICINE
It’s tough to get a good night’s sleep in outer space
Shorter sleep duration, more wakefulness, and changes in the sleep cycle brought on by microgravity make it tough for astronauts to get a good night’s sleep while they’re in outer space, a new study shows. In research that has implications for earthlings as well as astronauts, scientists found that the “
“Our results support other studies indicating that sleep architecture can adapt to different environments. Also, the sleep deficits that our subjects were facing while working around the clock in a high-pressure environment provide further evidence for the danger of stress and shift-work schedules for humans anywhere,” study investigator Oliver Piltch, of Harvard University, Cambridge, Mass., said in a release.
The findings were presented at the virtual annual meeting of the Associated Professional Sleep Societies.
Sleep architecture affected
The researchers studied sleep architecture in four cosmonauts and one astronaut before, during, and after missions to the Mir space station. Using the NightCap sleep monitor, they recorded a total of 324 nights of sleep – 112 preflight nights, 83 in-flight nights, and 61 postflight nights.
Despite having the same “sleep opportunity” in space as on earth, the astronauts were on average sleeping an hour less each night during the space mission compared with when on earth before or after their mission (5.7 vs. 6.7 hours; P < .0001). In space, the astronauts also spent significantly more time awake in bed, leading to a 17.7% reduction in sleep efficiency.
Sleep architecture was also affected by spaceflight. In space, the time in non–rapid eye movement (non–REM) and REM sleep decreased by 14.1% and 25.8%, respectively. On average, it took about 90 minutes after falling asleep for astronauts to reach their first episode of REM sleep in space – nearly 1.5 times longer than on earth. “There were marked shifts in sleep architecture compared to baseline, and some of these evolved over the course of the mission,” said Mr. Piltch.
“Our findings were consistent with previous studies that focus on the issue of sleep continuity. We found significant decreases in sleep efficiency during spaceflight despite similar times in bed,” he noted.
Mr. Piltch said it’s important to understand how sleep is affected by spaceflight in order to better equip astronauts for success on long-duration flights, such as a trip to Mars or the Moon. He also pointed to a recent study in the Lancet Neurology that showed that 78% of the international space station crew take hypnotics on 52% of nights in space. “So it doesn’t look like they sleep very well in space,” he said.
High-stakes environment
Reached for comment, Camilo A. Ruiz, DO, medical director, Choice Physicians Sleep Center, Fort Lauderdale, Fla., said the findings add to the “limited” data currently available on sleep in space and microgravity. “To a certain point, the results of this study could have been expected since sleep continuity and sleep architecture disruption is present during stressful periods of human life or in changes to the sleep rituals we hold dear, such as our beds and quiet bedrooms,” said Dr. Ruiz, who was not involved in the study.
“The potential harm to astronauts from their sleep continuity and deranged sleep architecture is that the decreased alertness, performance, vigilance, and psychomotor skills they exhibit in that high-stakes environment such as space flight can lead to serious accidents that can jeopardize the safety of the crew and vessel,” Dr. Ruiz noted.
“These research areas are on the forefront of space medicine that will allow mankind to lead successful interplanetary missions and colonization of these planets with long-term resident astronauts,” he added.
The study was supported by funding from the Mary Gordon Roberts Fellowship, the National Academy of Sciences, the National Institute of Mental Health, the MacArthur Foundation Mind-Body Network, and Healthdyne Technologies. Mr. Piltch and Dr. Ruiz have no disclosed no relevant financial relationships.
A version of this article originally appeared on Medscape.com.
FROM SLEEP 2020
Statins linked to reduced mortality in COVID-19
Treatment with statins was associated with a reduced risk of a severe or fatal course of COVID-19 by 30%, a meta-analysis of four published studies has shown.

In the analysis that included almost 9,000 COVID-19 patients, there was a significantly reduced risk for fatal or severe COVID-19 among patients who were users of statins, compared with nonusers (pooled hazard ratio, 0.70; 95% confidence interval, 0.53-0.94).
Based on the findings, “it may be time we shift our focus to statins as the potential therapeutic options in COVID-19 patients,” authors Syed Shahzad Hasan, PhD, University of Huddersfield (England), and Chia Siang Kow, MPharm, International Medical University, Kuala Lumpur, Malaysia, said in an interview.
The study was published online August 11 in The American Journal of Cardiology.
Moderate- to good-quality data
The analysis included four studies published up to July 27 of this year. Eligible studies included those with a cohort or case-control designs, enrolled patients with confirmed COVID-19, and had data available allowing comparison of the risk of severe illness and/or mortality among statin users versus nonusers in adjusted analyses, the authors noted.
The four studies – one of “moderate” quality and three of “good” quality – included a total of 8,990 COVID-19 patients.
In the pooled analysis, there was a significantly reduced risk for fatal or severe COVID-19 with use of statins, compared with non-use of statins (pooled HR, 0.70; 95% CI, 0.53-0.94).
Their findings also “discredited the suggestion of harms with the use of statins in COVID-19 patients,” the authors concluded.
“Since our meta-analysis included a fairly large total number of COVID-19 patients from four studies in which three are large-scale studies that adjusted extensively for multiple potential confounding factors, the findings can be considered reliable,” Dr. Hasan and Mr. Kow wrote in their article.
Based on the results, “moderate- to high-intensity statin therapy is likely to be beneficial” in patients with COVID-19, they said.
However, they cautioned that more data from prospective studies are needed to substantiate the findings and to determine the appropriate regimen for a statin in COVID-19 patients.
Yibin Wang, PhD, of the University of California, Los Angeles, said that “this is a very simple meta-analysis from four published studies which consistently reported a protective or neutral effect of statin usage on mortality or severe complications in COVID-19 patients.”
Although the scope of this meta-analysis was “quite limited, the conclusion was not unexpected, as most of the clinical analysis so far reported supports the benefits or safety of statin usage in COVID-19 patients,” Dr. Wang said in an interview.
Nonetheless, questions remain
While there is “almost no dispute” about the safety of continuing statin therapy in COVID-19 patients, it remains to be determined if statin therapy can be implemented as an adjuvant or independent therapy and a part of the standard care for COVID-19 patients regardless of their hyperlipidemia status, said Dr. Wang, who was not associated with Dr. Hasan’s and Mr. Kow’s research.
“While statin usage is associated with several beneficial effects such as anti-inflammation and cytoprotection, these effects are usually observed from long-term usage rather than short-term/acute administration. Therefore, prospective studies and randomized trials should be conducted to test the efficacy of stain usage for COVID-19 patients with mild to severe symptoms,” he noted.
“Considering the excellent record of statins as a safe and cheap drug, it is certainly a worthwhile effort to consider its broad-based usage for COVID-19 in order to lower the overall death and severe complications,” Dr. Wang concluded.
Guillermo Rodriguez-Nava, MD, department of internal medicine, AMITA Health Saint Francis Hospital, Evanston, Ill., is first author on one of the studies included in this meta-analysis.
The retrospective, single-center study found slower progression to death associated with atorvastatin in older patients with COVID-19 admitted to the ICU.
“Currently, there are hundreds of clinical trials evaluating a wide variety of pharmacological therapies for COVID-19. Unfortunately, these trials take time, and we are getting results in dribs and drabs,” Dr. Rodriguez-Nava said in an interview.
“In the meantime, the best available evidence is observational, and COVID-19 treatment regiments will continue to evolve. Whether atorvastatin is effective against COVID-19 is still under investigation. Nevertheless, clinicians should consider at least continuing them in patients with COVID-19,” he advised.
The study had no specific funding. Dr. Hasan, Mr. Kow, Dr. Wang, and Dr. Rodriguez-Nava disclosed no relationships relevant to this research.
A version of this article originally appeared on Medscape.com.
Treatment with statins was associated with a reduced risk of a severe or fatal course of COVID-19 by 30%, a meta-analysis of four published studies has shown.
In the analysis that included almost 9,000 COVID-19 patients, there was a significantly reduced risk for fatal or severe COVID-19 among patients who were users of statins, compared with nonusers (pooled hazard ratio, 0.70; 95% confidence interval, 0.53-0.94).
Based on the findings, “it may be time we shift our focus to statins as the potential therapeutic options in COVID-19 patients,” authors Syed Shahzad Hasan, PhD, University of Huddersfield (England), and Chia Siang Kow, MPharm, International Medical University, Kuala Lumpur, Malaysia, said in an interview.
The study was published online August 11 in The American Journal of Cardiology.
Moderate- to good-quality data
The analysis included four studies published up to July 27 of this year. Eligible studies included those with a cohort or case-control designs, enrolled patients with confirmed COVID-19, and had data available allowing comparison of the risk of severe illness and/or mortality among statin users versus nonusers in adjusted analyses, the authors noted.
The four studies – one of “moderate” quality and three of “good” quality – included a total of 8,990 COVID-19 patients.
In the pooled analysis, there was a significantly reduced risk for fatal or severe COVID-19 with use of statins, compared with non-use of statins (pooled HR, 0.70; 95% CI, 0.53-0.94).
Their findings also “discredited the suggestion of harms with the use of statins in COVID-19 patients,” the authors concluded.
“Since our meta-analysis included a fairly large total number of COVID-19 patients from four studies in which three are large-scale studies that adjusted extensively for multiple potential confounding factors, the findings can be considered reliable,” Dr. Hasan and Mr. Kow wrote in their article.
Based on the results, “moderate- to high-intensity statin therapy is likely to be beneficial” in patients with COVID-19, they said.
However, they cautioned that more data from prospective studies are needed to substantiate the findings and to determine the appropriate regimen for a statin in COVID-19 patients.
Yibin Wang, PhD, of the University of California, Los Angeles, said that “this is a very simple meta-analysis from four published studies which consistently reported a protective or neutral effect of statin usage on mortality or severe complications in COVID-19 patients.”
Although the scope of this meta-analysis was “quite limited, the conclusion was not unexpected, as most of the clinical analysis so far reported supports the benefits or safety of statin usage in COVID-19 patients,” Dr. Wang said in an interview.
Nonetheless, questions remain
While there is “almost no dispute” about the safety of continuing statin therapy in COVID-19 patients, it remains to be determined if statin therapy can be implemented as an adjuvant or independent therapy and a part of the standard care for COVID-19 patients regardless of their hyperlipidemia status, said Dr. Wang, who was not associated with Dr. Hasan’s and Mr. Kow’s research.
“While statin usage is associated with several beneficial effects such as anti-inflammation and cytoprotection, these effects are usually observed from long-term usage rather than short-term/acute administration. Therefore, prospective studies and randomized trials should be conducted to test the efficacy of stain usage for COVID-19 patients with mild to severe symptoms,” he noted.
“Considering the excellent record of statins as a safe and cheap drug, it is certainly a worthwhile effort to consider its broad-based usage for COVID-19 in order to lower the overall death and severe complications,” Dr. Wang concluded.
Guillermo Rodriguez-Nava, MD, department of internal medicine, AMITA Health Saint Francis Hospital, Evanston, Ill., is first author on one of the studies included in this meta-analysis.
The retrospective, single-center study found slower progression to death associated with atorvastatin in older patients with COVID-19 admitted to the ICU.
“Currently, there are hundreds of clinical trials evaluating a wide variety of pharmacological therapies for COVID-19. Unfortunately, these trials take time, and we are getting results in dribs and drabs,” Dr. Rodriguez-Nava said in an interview.
“In the meantime, the best available evidence is observational, and COVID-19 treatment regiments will continue to evolve. Whether atorvastatin is effective against COVID-19 is still under investigation. Nevertheless, clinicians should consider at least continuing them in patients with COVID-19,” he advised.
The study had no specific funding. Dr. Hasan, Mr. Kow, Dr. Wang, and Dr. Rodriguez-Nava disclosed no relationships relevant to this research.
A version of this article originally appeared on Medscape.com.

Who’s better off: Employed or self-employed physicians?
Self-employed physicians have the highest salaries, largest homes, and greatest wealth – yet they feel the least fairly compensated, according to an analysis of data from over 17,000 physicians.
A new examination of survey responses from the Medscape Physician Compensation Report 2020, which included information about income, job satisfaction, and more, compared responses from self-employed physicians, independent contractors, and employed physicians.
Income and wealth, benefits, and job satisfaction were compared. From the results of the questionnaire, self-employed physicians stand out among their peers across all categories: They enjoy greater income, wealth, and benefits and appear to be more satisfied by their choice of practice.
“The survey confirms that self-employed is the most satisfying, although the trend in health care is to take employed positions,” said Robert Scroggins, JD, CPA, certified health care business consultant with ScrogginsGreer, Cincinnati. “Doctors who become employees primarily do that to escape the management responsibilities for the practice. It seems to be more a decision to get away from something than to go toward something.”
The financial and work picture for self-employed physicians
Self-employed physicians reported the largest salaries for 2019 (average, $360,752), followed by independent contractors ($336,005). Employees reported the lowest average salary ($297,332).
The largest percentage of self-employed physicians (46%) work in an office-based group practice, followed by those in office-based solo practices (30%). Almost two-thirds of self-employed respondents are owners and 37% are partners.
Self-employed physicians are more likely to be older than 45 years; 79% fall into that age bracket, compared with 57% of employees and 70% of independent contractors.
Self-employed physicians reported the highest levels of wealth among their peers. About 44% of self-employed respondents declared a net wealth of over $2 million, compared with 25% of employees. Only 6% of contractors and employed physicians reported a net wealth of over $5 million, compared with 13% of self-employed physicians.
Self-employed physicians also managed their personal expenses slightly differently. They were more likely to pool their income with their spouse in a common account used for bills and expenses, regardless of how much they each earned (63% of self-employed respondents, compared with 58% of employees and 50% of independent contractors).
Perhaps unsurprisingly, self-employed physicians also reported having the largest homes, with an average square footage of 3,629 square feet, compared with 3,023 square feet for employees and 2,984 square feet for independent contractors. Self-employed physicians’ mortgages (average, $240,389) were similar to those of employed physicians’ mortgages but were higher than those of independent contractors’ mortgages (average, $213,740).
Self-employed physicians were also most likely to highly appraise their own performance: Half of all self-employed respondents felt “very satisfied” with their job performance, compared with 40% of employees and 44% of independent contractors.
When asked what they consider to be the most rewarding aspect of their job, self-employed physicians were more likely to choose gratitude and patient relationships than their peers (32%, compared with 26% of employees and 19% of independent contractors).
Despite their higher net wealth and larger salaries, self-employed physicians were least likely to feel fairly compensated; 49% of self-employed physicians said they did not feel fairly compensated for their work, compared with 40% of employees and 40% of independent contractors.
“Self-employed physicians may be better compensated than others of the same specialty who are employees, so some of that may be perception,” said Mr. Scroggins. “Or they feel they should be compensated to a far greater degree than those who are employed.”
Self-employed physicians were also more likely to respond that they would choose the same practice setting again, though across all three categories, fewer than 50% of respondents would do so: 34% of self-employed physicians, compared with 29% of employees and 28% of independent contractors.
The financial and work picture for employed physicians
About a third (32%) of employed physician respondents work in hospitals; 28% work in private practices.
Employed physicians were most likely to report a salary increase from 2018 to 2019: 74%, compared with 45% of self-employed and 52% of independent contractors.
As for declines in income, self-employed physicians and independent contractors suffered a comparable loss, with 13% and 12% of them, respectively, reporting salary cuts greater than 10%. Decreases of up to 10% were felt mostly by the self-employed, with 17% experiencing such cuts, compared with 7% of employees and 10% of independent contractors.
In contrast, employees were the least likely of the three categories to have incurred large financial losses over the past year: 77% of employed respondents indicated that they had not experienced any significant financial losses in the past year, compared with 63% of self-employed physicians and 63% of independent contractors. They were also least likely to have made any investments at all over the past year – 21% of employees reported having made none at all in 2019, compared to 11% of self-employed physicians and 16% of independent contractors.
The financial and work picture for independent contractors
Just over half (52%) of all independent contractors who responded to our questionnaire work in hospitals, 15% work in group practices, 9% work in outpatient clinics, and just 2% work in solo practices.
Independent contractors were less likely than their peers to have received employment benefits such as health insurance, malpractice coverage, and paid time off. They were also less likely to be saving for retirement. Almost half (45%) of independent contractors said they received no employment benefits at all, compared to 20% of self-employed physicians and just 8% of employees.
What’s more, 27% of independent contractors do not currently put money into a 401(k) retirement account or tax-deferred college savings account on a regular basis, compared with 16% of self-employed physicians and 8% of employees. Similarly, they were less likely to put money into a taxable savings account (39% responded that they do not, compared with 32% of self-employed physicians and 27% of employees).
“Net worth and retirement funding findings do line up with what I’ve observed,” said Mr. Scroggins. “Those who have independent practices as opposed to working for a hospital do tend to more heavily fund retirement plan accounts, which is typically the biggest driver of building net worth.”
Despite the lack of retirement planning, independent contractors were more likely than their peers to derive satisfaction from making money at a job they like (18%, compared with 12% of employees and 11% of self-employed physicians). They’re also far more likely to be in emergency medicine (22% of independent contractors, compared with 3% of self-employed and 5% of employees) or psychiatry (11% of independent contractors, compared with 5% of self-employed and 6% of employees).
Among the three categories of physicians, independent contractors were least likely to say that they would choose the same practice setting again. Across all three categories, fewer than 50% of respondents would do so: 34% of self-employed physicians, compared with 29% of employees and 28% of independent contractors.
Physicians who are considering leaving their own practice for a hospital setting should do so with caution and fully understand what they are getting into, said Mr. Scroggins. “If they’re just looking at compensation, they also should be looking very carefully at retirement plan benefits. If that’s their main method of saving and building net worth, then that’s a dramatic difference.”
And of course, there’s always the intangible value of feeling connected to a practice and its patients: “Physicians got into this line of work to treat patients and help people become healthier, and in hospitals they end up being more disconnected from their patients,” Mr. Scroggins said. “That’s a big factor as well.”
Editor’s note: Only differences that are statistically significant at a 95% confidence level between categories of employment have been included. Of the 13,893 responses included in this analysis, 3,860 physicians identified as self-employed, 9,262 as employees, and 772 as independent contractors.
A version of this article originally appeared on Medscape.com.
High schoolers prefer tobacco as vapor, not smoke
according to the Centers for Disease Control and Prevention.
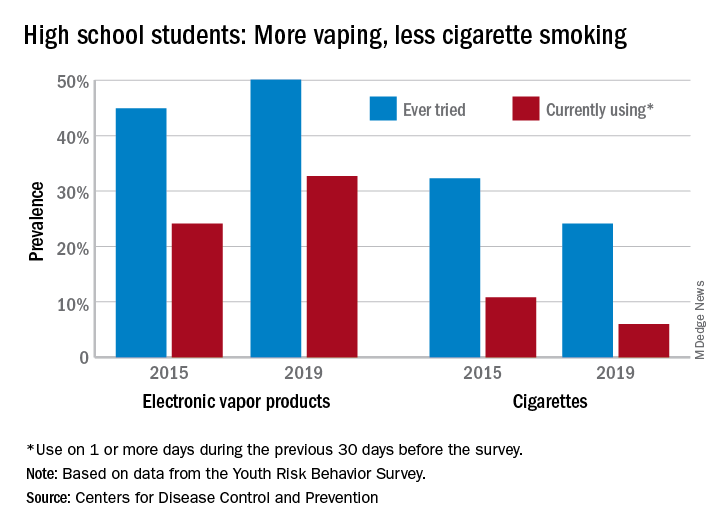
From 2015 to 2019, current use of electronic vapor products among students in grades 9-12 rose from 24.1% to 32.7%, while the same level of cigarette use – on 1 or more days in the previous 30 – dropped from 10.8% to 6.0%, based on data from the Youth Risk Behavior Survey.
Among the survey respondents, 50.1% had at least tried an electronic vapor product by 2019, up from 44.9% in 2015. Cigarettes again showed a decline, as ever use fell from 32.3% to 24.1%, or less than half of the e-product prevalence. Everyday use of vaping products was 7.2% in 2019 (up from 2.0% in 2015), compared with 1.1% for cigarettes (down from 2.3%), the YRBS data show.
“The dramatic increase in electronic vapor product use among high school students has led to increases in overall tobacco product use among U.S. youths, erasing gains made in previous years and leading the U.S. Surgeon General to declare youth e-cigarette use an epidemic in the United States,” MeLisa R. Creamer, PhD, and associates at the CDC wrote in the MMWR.
Electronic vapor products, as defined by the survey, “include e-cigarettes, vapes, vape pens, e-cigars, e-hookahs, hookah pens, and mods.”
Current use of cigarettes among high school students, as measured by the YRBS, has been declining since reaching a high of 36.4% in 1997; the prevalence of everyday use peaked at 12.8% in 1999. Current use of cigars declined as well, falling from 17.7% in 1999 to 5.7% in 2019, according to YRBS data.
“In 2019, a total of 36.5% of high school students currently used any tobacco product, with electronic vapor products being the most commonly used product,” Dr. Creamer and associates wrote in their recent analysis of the YRBS data (MMWR Supp. 2020 Aug 21;69[1]:56-63).
For the first time since the use of electronic vapor products was included in the every-other-year survey in 2015, females were more likely than males to be current users of vaping products last year, 33.5% to 32.0%. Males were heavier users of cigarettes by a margin of 6.9% to 4.9%, the CDC reported.
Geographically speaking, use of both electronic vapor products and cigarettes varied considerably among the 43 states with available data. Current use of electronic products ranged from a low of 9.7% in Utah to a high of 35.7% in West Virginia, with the two states in the same positions regarding current cigarette use: Utah (2.2%) lowest and West Virginia (13.5%) highest, based on the 2019 YRBS data.
“Tobacco product usage has evolved, and the increasing prevalence of electronic vapor product use among youths during recent years is concerning,” Dr. Creamer and associates wrote.
according to the Centers for Disease Control and Prevention.
From 2015 to 2019, current use of electronic vapor products among students in grades 9-12 rose from 24.1% to 32.7%, while the same level of cigarette use – on 1 or more days in the previous 30 – dropped from 10.8% to 6.0%, based on data from the Youth Risk Behavior Survey.
Among the survey respondents, 50.1% had at least tried an electronic vapor product by 2019, up from 44.9% in 2015. Cigarettes again showed a decline, as ever use fell from 32.3% to 24.1%, or less than half of the e-product prevalence. Everyday use of vaping products was 7.2% in 2019 (up from 2.0% in 2015), compared with 1.1% for cigarettes (down from 2.3%), the YRBS data show.
“The dramatic increase in electronic vapor product use among high school students has led to increases in overall tobacco product use among U.S. youths, erasing gains made in previous years and leading the U.S. Surgeon General to declare youth e-cigarette use an epidemic in the United States,” MeLisa R. Creamer, PhD, and associates at the CDC wrote in the MMWR.
Electronic vapor products, as defined by the survey, “include e-cigarettes, vapes, vape pens, e-cigars, e-hookahs, hookah pens, and mods.”
Current use of cigarettes among high school students, as measured by the YRBS, has been declining since reaching a high of 36.4% in 1997; the prevalence of everyday use peaked at 12.8% in 1999. Current use of cigars declined as well, falling from 17.7% in 1999 to 5.7% in 2019, according to YRBS data.
“In 2019, a total of 36.5% of high school students currently used any tobacco product, with electronic vapor products being the most commonly used product,” Dr. Creamer and associates wrote in their recent analysis of the YRBS data (MMWR Supp. 2020 Aug 21;69[1]:56-63).
For the first time since the use of electronic vapor products was included in the every-other-year survey in 2015, females were more likely than males to be current users of vaping products last year, 33.5% to 32.0%. Males were heavier users of cigarettes by a margin of 6.9% to 4.9%, the CDC reported.
Geographically speaking, use of both electronic vapor products and cigarettes varied considerably among the 43 states with available data. Current use of electronic products ranged from a low of 9.7% in Utah to a high of 35.7% in West Virginia, with the two states in the same positions regarding current cigarette use: Utah (2.2%) lowest and West Virginia (13.5%) highest, based on the 2019 YRBS data.
“Tobacco product usage has evolved, and the increasing prevalence of electronic vapor product use among youths during recent years is concerning,” Dr. Creamer and associates wrote.
High mortality rates reported in large COVID-19 study
Factors including older age and certain comorbidities have been linked to more serious COVID-19 outcomes in previous research, and now a large dataset collected from hundreds of hospitals nationwide provides more detailed data regarding risk for mechanical ventilation and death.
History of pulmonary disease or smoking, interestingly, were not.
One expert urges caution when interpreting the results, however. Although the study found a number of risk factors for ventilation and mortality, she says the dataset lacks information on race and disease severity, and the sample may not be nationally representative.
The investigators hope their level of granularity will further assist researchers searching for effective treatments and clinicians seeking to triage patients during the COVID-19 pandemic.
The study was published online August 28 in Clinical Infectious Diseases.
COVID-19 and comorbidities
“What I found most illuminating was this whole concept of comorbid conditions. This provides suggestive data about who we need to worry about most and who we may need to worry about less,” study author Robert S. Brown Jr, MD, MPH, told Medscape Medical News.
Comorbid conditions included hypertension in 47% of patients, diabetes in 28%, and cardiovascular disease in 19%. Another 16% were obese and 12% had chronic kidney disease. People with comorbid obesity, chronic kidney disease, and cardiovascular disease were more likely to receive mechanical ventilation compared to those without a history of these conditions in an adjusted, multivariable logistic analysis.
With the exception of obesity, the same factors were associated with risk for death during hospitalization.
In contrast, hypertension, history of smoking, and history of pulmonary disease were associated with a lower risk of needing mechanical ventilation and/or lower risk for mortality.
Furthermore, people with liver disease, gastrointestinal diseases, and even autoimmune diseases – which are likely associated with immunosuppression – “are not at that much of an increased risk that we noticed it in our data,” Brown said.
“As I tell many of my patients who have mild liver disease, for example, I would rather have mild liver disease and be on immunosuppressant therapy than be an older, obese male,” he added.
Assessing data for people in 38 U.S. states, and not limiting outcomes to patients in a particular COVID-19 hot spot, was a unique aspect of the research, said Brown, clinical chief of the Division of Gastroenterology and Hepatology at Weill Cornell Medicine in New York City.
Brown, lead author Michael W. Fried, MD, from TARGET PharmaSolutions in Durham, North Carolina, and colleagues studied adults from a commercially available Target Real-World Evidence (RWE) dataset of nearly 70,000 patients. They examined hospital chargemaster data and ICD-10 codes for COVID-19 inpatients between February 15 and April 20.
This population tended to be older, with 60% older than 60 years. A little more than half of participants, 53%, were men.
Key findings
A total of 21% of patients died after a median hospital length of stay of 8 days.
Older patients were significantly more likely to die, particularly those older than 60 years (P < .0001).
“This confirms some of the things we know about age and its impact on outcome,” Brown said.
The risk for mortality among patients older than 60 years was 7.2 times that of patients between 18 and 40 years in an adjusted multivariate analysis. The risk for death for those between 41 and 60 years of age was lower (odds ratio [OR], 2.6), compared with the youngest cohort.
Men were more likely to die than women (OR, 1.5).
When asked if he was surprised by the high mortality rates, Brown said, “Having worked here in New York? No, I was not.”
Mechanical ventilation and mortality
Male sex, age older than 40 years, obesity, and presence of cardiovascular or chronic kidney disease were risk factors for mechanical ventilation.
Among the nearly 2,000 hospitalized adults requiring mechanical ventilation in the current report, only 27% were discharged alive. “The outcomes of people who are mechanically ventilated are really quite sobering,” Brown said.
People who ever required mechanical ventilation were 32 times more likely to die compared with others whose highest level of oxygenation was low-flow, high-flow, or no-oxygen therapy in an analysis that controlled for demographics and comorbidities.
Furthermore, patients placed on mechanical ventilation earlier – within 24 hours of admission – tended to experience better outcomes.
COVID-19 therapies?
Brown and colleagues also evaluated outcomes in patients who were taking either remdesivir or hydroxychloroquine. A total of 48 people were treated with remdesivir.
The four individuals receiving remdesivir who died were among 11 who were taking remdesivir and also on mechanical ventilation.
“The data for remdesivir is very encouraging,” Brown said.
Many more participants were treated with hydroxychloroquine, more than 4,200 or 36% of the total study population.
A higher proportion of people treated with hydroxychloroquine received mechanical ventilation, at 25%, versus 12% not treated with hydroxychloroquine.
The unadjusted mortality rate was also higher among those treated with the agent, at 25%, compared to 20% not receiving hydroxychloroquine.
The data with hydroxychloroquine can lead to two conclusions, Brown said: “One, it doesn’t work. Or two, it doesn’t work in the way that we use it.”
The researchers cautioned that their hydroxychloroquine findings must be interpreted carefully because those treated with the agent were also more likely to have comorbidities and greater COVID-19 disease severity.
“This study greatly contributes to understanding the natural course of COVID-19 infection by describing characteristics and outcomes of patients with COVID-19 hospitalized throughout the US,” the investigators note. “It identified categories of patients at greatest risk for poor outcomes, which should be used to prioritize prevention and treatment strategies in the future.”
Some limitations
“The findings that patients with hypertension and who were smokers had lower ventilation rates, and patients with hypertension, pulmonary disease, who were smokers had lower mortality risks was very surprising,” Ninez A. Ponce, PhD, MPP, told Medscape Medical News when asked to comment on the study.
Although the study identified multiple risk factors for ventilation and mortality, “unfortunately the dataset did not have race available or disease severity,” said Ponce, director of the UCLA Center for Health Policy Research and professor in the Department of Health Policy and Management at the UCLA Fielding School of Public Health.
“These omitted variables could have a considerable effect on the significance, magnitude, and direction of point estimates provided, so I would be cautious in interpreting the results as a picture of a nationally representative sample,” she said.
On a positive note, the study and dataset could illuminate the utility of medications used to treat COVID-19, Ponce said. In addition, as the authors note, “the data will expand over time.”
Brown has reported receiving grants and consulting for Gilead. Ponce has disclosed no relevant financial relationships.
This article first appeared on Medscape.com.
Nightmares: An independent risk factor for heart disease?
, new research shows. In what researchers describe as “surprising” findings, results from a large study of relatively young military veterans showed those who had nightmares two or more times per week had significantly increased risks for hypertension, myocardial infarction, or other heart problems.
“A diagnosis of PTSD incorporates sleep disturbance as a symptom. Thus, we were surprised to find that nightmares continued to be associated with CVD after controlling not only for PTSD and demographic factors, but also smoking and depression diagnosis,” said Christi Ulmer, PhD, of the department of psychiatry and behavioral sciences, Duke University Medical Center, Durham, N.C.
The findings were presented at the virtual annual meeting of the Associated Professional Sleep Societies.
Unclear mechanism
The study included 3,468 veterans (77% male) with a mean age of 38 years who had served one or two tours of duty since Sept. 11, 2001. Nearly one-third (31%) met criteria for PTSD, and 33% self-reported having at least one cardiovascular condition, such as heart problems, hypertension, stroke, and MI.
Nightmare frequency and severity was assessed using the Davidson Trauma Scale. Nightmares were considered frequent if they occurred two or more times per week and moderate to severe if they were at least moderately distressing. About 31% of veterans reported having frequent nightmares, and 35% reported moderately distressing nightmares over the past week.
After adjusting for age, race, and sex, frequent nightmares were associated with hypertension (odds ratio, 1.51; 95% confidence interval, 1.28-1.78), heart problems (OR, 1.50; 95% CI, 1.11-2.02), and MI (OR, 2.32; 95% CI, 1.18-4.54).
Associations between frequent nightmares and hypertension (OR, 1.43; 95% CI, 1.17-1.73) and heart problems (OR, 1.43; 95% CI, 1.00-2.05) remained significant after further adjusting for smoking, depression, and PTSD.
“Our cross-sectional findings set the stage for future research examining the possibility that nightmares may confer cardiovascular disease risks beyond those conferred by PTSD diagnosis alone,” Dr. Ulmer said in a news release.
Dr. Ulmer also said that, because the study was based on self-reported data, the findings are “very preliminary.” Before doctors adjust clinical practices, it’s important that our findings be replicated using longitudinal studies, clinically diagnosed medical conditions, and objectively assessed sleep,” she said.
She added that more research is needed to uncover mechanisms explaining these associations and determine if reducing the frequency and severity of nightmares can lead to improved cardiovascular health.
Timely research
Reached for comment, Rajkumar (Raj) Dasgupta, MD, of the University of Southern California, Los Angeles, noted “the correlation between nightmares and heart disease is a timely topic right now with COVID-19 as more people may be having nightmares.”
“If a patient mentions nightmares, I do think it’s important not to just glaze over it, but to talk more about it and document it in the patient record, especially in patients with cardiovascular disease, atrial fibrillation, diabetes, and hypertension,” said Dr. Dasgupta, who wasn’t involved in the study.
The research was supported by the Veterans Integrated Service Network 6 Mental Illness Research, Education and Clinical Center and the Department of Veterans Affairs HSR&D ADAPT Center at the Durham VA Health Care System. Dr. Ulmer and Dr. Dasgupta have disclosed no relevant financial relationships.
A version of this article originally appeared on Medscape.com.
FROM SLEEP 2020
Interstitial lung abnormalities linked to COPD exacerbations
Patients with chronic obstructive pulmonary disease who also had certain interstitial lung abnormalities experienced more exacerbations and reduced lung function than those without such abnormalities, findings from a retrospective study has shown.
Interstitial lung abnormalities (ILA) are considered precursor lesions of interstitial lung disease and previous studies suggested an association with poor outcomes among chronic obstructive pulmonary disease (COPD) patients, but data on long-term clinical relevance are limited, wrote Tae Seung Lee, MD, of Seoul (South Korea) National University Hospital, and colleagues.
In a study published in Chest, the researchers reviewed data from 363 COPD patients including 44 with equivocal ILA and 103 with definite ILA. Overall, the ILA patients were older and had poorer lung function than non-ILA patients. Patients received chest CT scan and longitudinal pulmonary function tests between January 2013 and December 2018.
Over an average follow-up period of 5.4 years, patients with ILA experienced significantly more acute COPD exacerbations than did those without ILA (adjusted odds ratio, 2.03). The percentages of frequent exacerbators among patients with no ILA, equivocal ILA, and definite ILA were 8.3%, 15.9%, and 20.4%, respectively.
“Acute exacerbation is an important event during the clinical course of COPD, because it is associated with temporary or persistent reductions in lung function, lower quality of life, hospitalization, and mortality,” the researchers noted.
In a multivariate analysis, the annual decline in lung function (FEV1) was –35.7 in patients with equivocal ILA, compared with –28.0 in patients with no ILA and –15.9 in those with definite ILA.
“This may be due to the distribution of the spirometric stages in each group, and to the resulting changes in lung function,” the researchers wrote. In this study, “the equivocal ILA group had a significantly lower baseline FEV1 than the other groups. In our study population, the lower the spirometric stage, the faster the annual decline in FEV1, consistent with the results of a prior prospective study of a COPD cohort.”
The findings were limited by several factors including the retrospective design and relatively small number of ILA patients, as well as the limited evaluation of ILA and potential for selection bias, the researchers noted. However, the result support the impact of ILA on exacerbations and accelerated decline in lung function in COPD patients.
The study received no outside funding. The researchers had no financial conflicts to disclose.
SOURCE: Lee TS et al. Chest. 2020 Aug 13. doi: 10.1016/j.chest.2020.08.017.
FROM CHEST