CCJM delivers practical clinical articles relevant to internists, cardiologists, endocrinologists, and other specialists, all written by known experts.
A 32-year-old woman presented to our emergency department with chest pain and painful ulcerations on her arms, abdomen, back, groin, axillae, and in her mouth. She first noticed the ulcers 7 days earlier.
She also reported bloody diarrhea, which had started 2 years earlier, with 10 or more bowel movements daily. She described her stools as semiformed and associated with urgency and painful abdominal cramps.
Medical history
Her medical history included obstructive sleep apnea and morbid obesity. She had first presented 2 years earlier to another hospital with diarrhea, abdominal pain, and rectal bleeding. At that time, results of esophagogastroduodenoscopy and colonoscopy were reported as normal. Later, she became pregnant, and her symptoms went away. She had a normal pregnancy and delivery.
About 1 year postpartum, her abdominal pain and bloody diarrhea recurred. Colonoscopy showed severe sigmoid inflammation with small, shallow ulcerations and friable mucosa interrupted by areas of normal mucosa. Histopathologic study of the colonic mucosa indicated mild to moderate chronic active colitis consisting of focal areas of cryptitis with occasional crypt abscess formation. She was diagnosed with Crohn colitis based on the endoscopic appearance, histopathology, and clinical presentation. The endoscope, however, could not be advanced beyond the sigmoid colon, which suggested stenosis. She was started on 5-aminosalicylic acid (5-ASA) but developed visual hallucinations, and the medication was stopped.
Her symptoms continued, and she developed worsening rectal bleeding and anemia that required hospitalization and blood transfusions. Another colonoscopy performed 1 month before this emergency department visit had shown multiple mucosal ulcerations, but again, the colonoscope could not be advanced beyond the sigmoid colon. She was started on oral corticosteroids, which provided only minimal clinical improvement.
Her current medications included atenolol (for sinus tachycardia), prednisone (initial dose 60 mg/day tapered to 20 mg/day at presentation), and ciprofloxacin.
Her family history was unknown because she had been adopted.
About 1 week before presentation, she had noticed ulcers developing on her arms, abdomen, back, groin, oral mucosa, and axillae. The ulcers were large and painful, with occasional spontaneous bleeding. She also reported pustules and ulcerations at sites of previous skin punctures, consistent with pathergy.
Findings on presentation
Temperature 99.5°F (37.5°C)
Heart rate 124 beats per minute
Respiratory rate 22 breaths per minute
Oxygen saturation 100% on room air
Blood pressure 128/81 mm Hg
Body mass index 67 kg/m2 (morbidly obese).
She had multiple greyish-white patches and erosions over the soft palate, tongue, and upper and lower lip mucosa, erythematous pustules in the axillae bilaterally, and large erythematous, sharply demarcated ulcerations with a fibrinous base bilaterally covering her arms, thighs, groin, and abdomen.
Blood testing showed multiple abnormal results (Table 1). Urinalysis revealed a urine protein concentration of 100 mg/dL (reference range 0), more than 25 white blood cells per high-power field (reference range < 5), 6 to 10 red blood cells per high-power field (0–3), and more than 10 casts per low-power field (0), which suggested a urinary tract infection with hematuria.
Computed tomography (CT) of the abdomen and pelvis with intravenous and oral contrast showed diffuse fatty infiltration of the liver and wall thickening of the rectum and sigmoid colon.
She was admitted to the medical intensive care unit for potential septic shock. Intravenous vancomycin and ciprofloxacin were started (the latter owing to penicillin allergy).
CAUSES OF DIARRHEA AND SKIN CHANGES
1. What is the most likely diagnosis in our patient?
Ulcerative colitis
Crohn disease
Behçet disease
Intestinal tuberculosis
Herpes simplex virus infection
Cytomegalovirus infection
All of the above can cause diarrhea in combination with mucocutaneous lesions and other manifestations.
Ulcerative colitis and Crohn disease: Mucocutaneous findings
Extraintestinal manifestations of inflammatory bowel diseases (Crohn disease, ulcerative colitis, and Behçet disease) include arthritis, ocular involvement, mucocutaneous manifestations, and liver involvement in the form of primary sclerosing cholangitis. Less common extraintestinal manifestations include vascular, renal, pulmonary, cardiac, and neurologic involvement.
Mucocutaneous findings are observed in 5% to 10% of patients with ulcerative colitis and 20% to 75% of patients with Crohn disease.1–3 The most common are erythema nodosum and pyoderma gangrenosum.4
Yüksel et al5 reported that of 352 patients with inflammatory bowel disease, 7.4% had erythema nodosum and 2.3% had pyoderma gangrenosum. Erythema nodosum was significantly more common in patients with Crohn disease than in those with ulcerative colitis, and its severity was linked with higher disease activity. Lesions frequently resolved when bowel disease subsided.
Lebwohl and Lebwohl6 reported that pyoderma gangrenosum occurred in up to 20% of patients with Crohn disease and up to 10% of those with ulcerative colitis. It is not known whether pyoderma gangrenosum correlates with intestinal disease severity.
Other mucocutaneous manifestations of inflammatory bowel disease include oral aphthous ulcers, acute febrile neutrophilic dermatosis (Sweet syndrome), and metastatic Crohn disease. Aphthous ulcers in the oral cavity, often observed in both Crohn disease and ulcerative colitis, cannot be differentiated on clinical examination from herpes simplex virus (HSV) type 1-induced or idiopathic mucous membrane ulcers. The most common ulcer locations are the lips and buccal mucosa. If biopsied (seldom required), noncaseating granulomas can be identified that are comparable with intestinal mucosal granulomas found in Crohn disease.7
Behçet disease has similar signs
Oral aphthous ulcers are also the most frequent symptom in Behçet disease, occurring in 97% to 100% of cases.8 They most commonly affect the tongue, lips, buccal mucosa, and gingiva.
Cutaneous manifestations include erythema nodosum-like lesions, which present as erythematous painful nodules over pretibial surfaces of the lower limbs but can also affect the arms and thighs; they can also present as papulopustular rosacea eruptions composed of papules, pustules, and noninflammatory comedones, most commonly on the chest, back, and shoulders.8,9
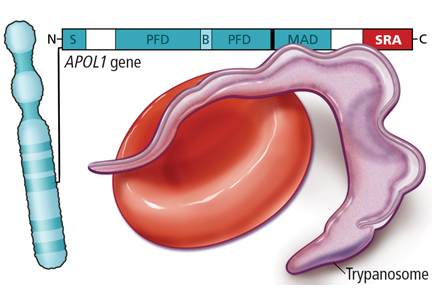
Pathergy, ie, skin hyperresponse to minor trauma such as a bump or bruise, is a typical trait of Behçet disease. A positive pathergy test (ie, skin hyperreactivity to a needlestick or intracutaneous injection) has a specificity of 98.4% in patients with Behçet disease.10
Interestingly, there appears to be a regional difference in the susceptibility to pathergy. While a pathergy response in patients with Behçet disease is rare in the United States and the United Kingdom, it is very common in Japan, Turkey, and Israel.11
Patient demographics also distinguish Behçet disease from Crohn disease. The prevalence of Behçet disease is highest along the Silk Road from the Mediterranean Basin to East Asia and lowest in North America and Northern Europe.12 The mean age at onset is around the third and fourth decades. In males, the prevalence is highest in Mediterranean, Middle Eastern, and Asian countries. In females, the prevalence is highest in the United States, Northern Europe, and East Asia.10
Tuberculosis
Tubercular skin lesions can present in different forms.13 Lupus vulgaris, the most common, occurs after primary infection and presents as translucent brown nodules, mainly over the face and neck. So-called scrofuloderma is common at the site of a lymph node. It appears as a gradually enlarging subcutaneous nodule followed by skin breaks and ulcerations. Tuberculosis verrucosa cutis, also known as warty tuberculosis, is common in developing countries and presents as warty plaque over the hands, knees, and buttocks.14 Tuberculids are skin reactions to systemic tuberculosis infection.
Herpes simplex virus
Mucocutaneous manifestations of herpes simplex virus affect the oral cavity (gingivostomatitis, pharyngitis, and lip border lesions), the entire integumentary system, the eyes (HSV-1), and the genital region (HSV-2). The classic presentation is systemic symptoms (fever and malaise) associated with multiple vesicles on an erythematous base in a distinct region of skin. The virus can remain latent with reactivation occurring because of illness, immunosuppression, or stress. Pruritus and pain precede the appearance of these lesions.
Cytomegalovirus
Primary cytomegalovirus infection is subclinical in almost all cases unless the patient is immunocompromised, and it presents similarly to mononucleosis induced by Epstein-Barr virus. The skin manifestations are nonspecific and can include macular, maculopapular, morbilliform, and urticarial rashes, but usually not ulcerations.15
OUR PATIENT: BEHÇET DISEASE OR CROHN DISEASE?
In our patient, oral mucosal aphthous ulcers and the location of pustular skin lesions, in addition to pathergy, were highly suggestive of Behçet disease. However, Crohn disease with mucocutaneous manifestations remained in the differential diagnosis.
Because there is significant overlap between these diseases, it is important to know the key distinguishing features. Oral aphthous ulcers, pathergy, uveitis, skin and genital lesions, and neurologic involvement are much more common in Behçet disease than in Crohn disease.16,17 Demographic information was not helpful in this case, given that the patient was adopted.
FURTHER WORKUP
2. What should be the next step in the work-up?
CT enterography
Skin biopsy
Colonoscopy with biopsy
C-reactive protein, erythrocyte sedimentation rate, and fecal calprotecting testing
The endoscopic appearance and histopathology of the affected tissues are crucial for the diagnosis. Differentiating between Crohn disease and Behçet disease can be particularly challenging because of significant overlap between the intestinal and extraintestinal manifestations of the two diseases, especially the oral lesions and arthralgias. Thus, both colonoscopy with biopsy of the intestinal lesions and biopsy of a cutaneous ulceration should be pursued.
No single test or feature is pathognomonic for Behçet disease. Although many diagnostic criteria have been established, those of the International Study Group (Table 2) are the most widely used.18 Their sensitivity for Behçet disease has been found to be 92%, and their specificity 97%.19
Both CT enterography and inflammatory markers would depict inflammation, but since this is present in both Crohn disease and Behçet disease, these tests would not be helpful in this situation.
Endoscopic appearance of Crohn disease and Behçet disease
Intestinal Behçet disease, like Crohn disease, is an inflammatory bowel disease occurring throughout the gastrointestinal tract (small and large bowel). Both are chronic diseases with a waxing and waning course and have similar extraintestinal manifestations. Typical endoscopic lesions are deep, sharply demarcated (“punched-out”), round ulcers. The intestinal Behçet disease and Crohn disease ulcer phenotype and distribution can look the same, and in both entities, rectal sparing and “skip lesions” have been described.20–22
Nevertheless, findings on endoscopy have been analyzed to try to differentiate between Crohn disease and Behçet disease.
In 2009, Lee et al23 published a simple and accurate strategy for distinguishing the two diseases endoscopically. The authors reviewed 250 patients (115 with Behçet disease, 135 with Crohn disease) with ulcers on colonoscopy and identified 5 endoscopic findings indicative of intestinal Behçet disease:
Round ulcers
Focal single or focal multiple distribution of ulcers
Fewer than 6 ulcers
Absence of a “cobblestone” appearance
Absence of aphthous lesions.
The two most accurate factors were absence of a cobblestone appearance (sensitivity 100%) and round ulcer shape (specificity 97.5 %). When more than one factor was present, specificity increased but sensitivity decreased.
From Lee SK, Kim BK, Kim TI, Kim WH. Differential diagnosis of intestinal Behçet’s disease and Crohn’s disease by colonoscopic findings. Endoscopy 2009; 41:9–16; copyright Georg Thieme Verlag KG.
Figure 1.
Using a classification and regression tree analysis, the investigators created an algorithm that endoscopically differentiates between Crohn disease and Behçet disease (Figure 1) with an accuracy of 92 %.23
Histopathologic analysis of both colonic and skin lesions can provide additional clues to the correct diagnosis. Vasculitis suggests Behçet disease, whereas granulomas suggest Crohn disease.
CASE CONTINUED: SKIN BIOPSY AND COLONOSCOPY
Punch biopsy of the skin was performed on the right anterior thigh. Histopathologic analysis revealed acanthotic epidermis, a discrete full-thickness necrotic ulcer with a neutrophilic base, granulation tissue, and vasculitic changes. There were no vasculitic changes or granulomas outside the ulcer base. Cytomegalovirus staining was negative. An interferon-gamma release assay for tuberculosis was negative. Eye examination results were normal.
Figure 2. Colonoscopy revealed multiple deep, round, confluent ulcers with a “punched-out” appearance, as well as fissures in the entire colon with normal intervening mucosa and normal terminal ileum.
Colonoscopy showed multiple deep, round, and confluent ulcers with a punched-out appearance and fissures with normal intervening mucosa in the entire examined colon (Figure 2). The terminal ileal mucosa was normal. Colonic biopsies were consistent with cryptitis and rare crypt abscesses. Vasculitis was not identified.
Although the histologic changes were nonspecific, at this point we considered Behçet disease to be more likely than Crohn disease, given the typical endoscopic appearance and skin changes.
TREATING INTESTINAL BEHÇET DISEASE
3. Which is not considered a standard treatment for intestinal Behçet disease?
Mesalamine (5-ASA)
Corticosteroids
Immunosuppressants
Mycophenolate mofetil
Surgery
Overall, data on the management of intestinal Behçet disease are limited. The data that do exist have shown that 5-ASA, corticosteroids, immunosuppressants, and surgery are options, but not mycophenolate mofetil.
Consensus recommendations from the Japanese IBD Research Group,24 published in 2007, included 5-ASA, corticosteroids, immunosuppressants, enteral and total parenteral nutrition, and surgical resection. In 2014, the group published a second consensus statement, adding anti-tumor necrosis factor (TNF) agents as standard therapy for this disease.22
Mycophenolate mofetil has not been shown to be effective in the treatment of mucocutaneous Behçet disease,25 although it may be effective in the treatment of its neurologic manifestations.26 Data regarding its efficacy in intestinal Behçet disease are sparse.
Differences in treatment for Crohn and Behçet disease
Although the treatment options are comparable for Behçet disease and Crohn disease, certain features differ.
Doses of 5-ASA and immunnosuppressive agents are typically higher in Crohn disease. For example, the optimal dose of 5-ASA is up to 3 g/day for Behçet disease but up to 4.8 g/day for Crohn disease.
Standard dosing for azathioprine is 50 to 100 mg/day for Behçet disease but 2 to 2.5 mg/kg/day (eg, 168 to 210 mg/day for a 185-lb patient) for Crohn disease.
In addition, evidence supporting the use of biologic agents such as anti-TNF agents or vedolizumab is more abundant in Crohn disease.
Finally, data on monitoring drug levels of immunomodulators or biologics are available only for patients with Crohn disease, not Behçet disease. Thus, an accurate diagnosis is important.
CASE CONTINUED: EMERGENCY LAPAROTOMY
Our patient continued to experience abdominal pain and bloody diarrhea despite receiving corticosteroids intravenously in high doses. We were also considering anti-TNF therapy.
At this point, CT of her abdomen and pelvis was repeated and showed free intraperitoneal air consistent with a perforation of the transverse colon.
She underwent emergency exploratory laparotomy. Intraoperative findings included pneumoperitoneum but no gross peritoneal contamination, extensive colitis with a contained splenic flexure perforation, and normal small-bowel features without evidence of enteritis. Subtotal colectomy, implantation of the rectal stump into the subcutaneous tissue, and end-ileostomy were performed.
After 23 days of recovery in the hospital, she was discharged on oral antibiotics and 4 weeks of steroid taper.
PROGNOSIS OF INTESTINAL BEHÇET DISEASE
4. What can the patient expect from her intestinal Behçet disease in the future?
The disease is cured after resection of the diseased segments
Behçet disease is a progressive lifelong disorder that can recur after surgery
Like Crohn disease, Behçet disease should be considered a lifelong progressive disorder, even after surgical resection of diseased segments.
It is unclear which patients will have a complicated disease course and need treatment with stronger immunosuppression. In patients with intestinal Behçet disease whose disease is in remission on thiopurine therapy, the 1-year relapse rate has been reported as 5.8%, and the 5-year relapse rate 51.7%.27,28 After surgical resection, the 5-year recurrence rate was 47.2%, and 30.6% of patients needed repeat surgery.29 Predictors of poor prognosis were younger age, higher erythrocyte sedimentation rate, higher C-reactive protein level, low albumin level at diagnosis, and a high disease-activity index for intestinal Behçet disease.30
The Korean IBD Study Group has developed and validated a disease activity index for intestinal Behçet disease.28 The index has a list of weighted scores for 8 symptoms, which provides for a more objective assessment of disease activity for determining the best treatment approach.
CASE CONTINUED
The patient has continued with her follow-up care and appointments in gastroenterology, rheumatology, and dermatology clinics. She still complains of intermittent abdominal pain, occasional bleeding at the rectal stump, intermittent skin lesions mainly in the form of pustular lesions, and intermittent joint pain. If symptoms persist, anti-TNF therapy is an option.
References
Burgdorf W. Cutaneous manifestations of Crohn’s disease. J Am Acad Dermatol 1981; 5:689–695.
Palamaras I, El-Jabbour J, Pietropaolo N, et al. Metastatic Crohn’s disease: a review. J Eur Acad Dermatol Venereol 2008; 22:1033–1043.
Tavarela Veloso F. Skin complications associated with inflammatory bowel disease. Aliment Pharmacol Ther 2004; 20(suppl 4):50–53.
Yüksel I, Basar O, Ataseven H, et al. Mucocutaneous manifestations in inflammatory bowel disease. Inflamm Bowel Dis 2009; 15:546–550.
Lebwohl M, Lebwohl O. Cutaneous manifestations of inflammatory bowel disease. Inflamm Bowel Dis 1998; 4:142–148.
Levine JS, Burakoff R. Extraintestinal manifestations of inflammatory bowel disease. Gastroenterol Hepatol (NY) 2011; 7:235–241.
Mat C, Yurdakul S, Sevim A, Özyazgan Y, Tüzün Y. Behçet’s syndrome: facts and controversies. Clin Dermatol 2013; 31:352–361.
Lee ES, Bangz D, Lee S. Dermatologic manifestation of Behçet’s disease. Yonsei Med J 1997; 38:380–389.
Davatchi F, Chams-Davatchi C, Ghodsi Z, et al. Diagnostic value of pathergy test in Behçet’s disease according to the change of incidence over the time. Clin Rheumatol 2011; 30:1151–1155.
Friedman-Birnbaum R, Bergman R, Aizen E. Sensitivity and specificity of pathergy test results in Israeli patients with Behçet’s disease. Cutis 1990; 45:261–264.
Mahr A, Maldini C. Epidemiology of Behçet’s disease. Rev Med Interne 2014; 35:81–89. French.
Barbagallo J, Tager P, Ingleton R, Hirsch RJ, Weinberg JM. Cutaneous tuberculosis. Am J Clin Dermatol 2002; 3:319–328.
Padmavathy L, Lakshmana Rao L, Ethirajan N, Ramakrishna Rao M, Subrahmanyan EN, Manohar U. Tuberculosis verrucosa cutis (TBVC)—foot with miliary tuberculosis. Indian J Tuberc 2007; 54:145–148.
Drago F, Aragone MG, Lugani C, Rebora A. Cytomegalovirus infection in normal and immunocompromised humans. A review. Dermatology 2000; 200:189–195.
Yazısız V. Similarities and differences between Behçet’s disease and Crohn’s disease. World J Gastrointest Pathophysiol 2014; 5:228–238.
International Study Group for Behçet’s Disease. Criteria for diagnosis of Behçet’s disease. Lancet 1990; 335:1078–1080.
Davatchi F. Diagnosis/classification criteria for Behcet’s disease. Patholog Res Int 2012; 2012:607921.
Chang DK, Kim JJ, Choi H, et al. Double balloon endoscopy in small intestinal Crohn’s disease and other inflammatory diseases such as cryptogenic multifocal ulcerous stenosing enteritis (CMUSE). Gastrointest Endosc 2007; 66(suppl):S96–S98.
Hamdulay SS, Cheent K, Ghosh C, Stocks J, Ghosh S, Haskard DO. Wireless capsule endoscopy in the investigation of intestinal Behçet’s syndrome. Rheumatology (Oxford) 2008; 47:1231–1234.
Hisamatsu T, Ueno F, Matsumoto T, et al. The 2nd edition of consensus statements for the diagnosis and management of intestinal Behçet’s disease: indication of anti-TNFa monoclonal antibodies. J Gastroenterol 2014; 49:156–162.
Lee SK, Kim BK, Kim TI, Kim WH. Differential diagnosis of intestinal Behçet’s disease and Crohn’s disease by colonoscopic findings. Endoscopy 2009; 41:9–16.
Kobayashi K, Ueno F, Bito S, et al. Development of consensus statements for the diagnosis and management of intestinal Behçet’s disease using a modified Delphi approach. J Gastroenterol 2007; 42:737–745.
Adler YD, Mansmann U, Zouboulis CC. Mycophenolate mofetil is ineffective in the treatment of mucocutaneous Adamantiades-Behçet’s disease. Dermatology 2001; 203:322–324.
Shugaiv E, Tüzün E, Mutlu M, Kiyat-Atamer A, Kurtuncu M, Akman-Demir G. Mycophenolate mofetil as a novel immunosuppressant in the treatment of neuro-Behçet’s disease with parenchymal involvement: presentation of four cases. Clin Exp Rheumatol 2011; 29(suppl 67):S64–S67.
Jung YS, Cheon JH, Hong SP, Kim TI, Kim WH. Clinical outcomes and prognostic factors for thiopurine maintenance therapy in patients with intestinal Behçet’s disease. Inflamm Bowel Dis 2012; 18:750–757.
Cheon JH, Han DS, Park JY, et al; Korean IBD Study Group. Development, validation, and responsiveness of a novel disease activity index for intestinal Behçet’s disease. Inflamm Bowel Dis 2011; 17:605–613.
Jung YS, Yoon JY, Lee JH, et al. Prognostic factors and long-term clinical outcomes for surgical patients with intestinal Behçet’s disease. Inflamm Bowel Dis 2011; 17:1594–1602.
Jung YS, Cheon JH, Park SJ, Hong SP, Kim TI, Kim WH. Clinical course of intestinal Behçet’s disease during the first five years. Dig Dis Sci 2013; 58:496–503.
Neha Agrawal, MD Hepatology Fellow, Temple Digestive Disease Center, Temple University Hospital, Philadelphia, PA
Amandeep Singh, MD Clinical Associate, Department of Hospital Medicine, Medicine Institute, Cleveland Clinic
Thomas Plesec, MD Department of Anatomic Pathology, Cleveland Clinic; Assistant Professor, Cleveland Clinic Lerner College of Medicine of Case Western Reserve University, Cleveland, OH
David Liska, MD Departments of Colorectal Surgery and Stem Cell Biology and Regenerative Medicine, Cleveland Clinic; Assistant Professor, Cleveland Clinic Lerner College of Medicine of Case Western Reserve University, Cleveland, OH
Bradley Confer, DO Geisinger Gastroenterology, Geisinger Medical Center, Danville, PA
Jessica Philpott, MD, PhD Associate Staff, Department of Gastroenterology and Hepatology, Cleveland Clinic; Clinical Assistant Professor, Cleveland Clinic Lerner College of Medicine of Case Western Reserve University, Cleveland, OH
Florian Rieder, MD Associate Staff, Department of Gastroenterology, Hepatology, and Nutrition, and Investigator, Department of Pathobiology, Lerner Research Institute, Cleveland Clinic
Address: Neha Agrawal, MD, Temple Digestive Disease Center, Temple University Hospital, 3401 North Broad Street, Philadelphia, PA 19140; [email protected]
Dr. Rieder has disclosed board membership for AbbVie and UCB and consulting for Celgene, Roche, and United BioSource Corporation (UBC).
Author and Disclosure Information
Neha Agrawal, MD Hepatology Fellow, Temple Digestive Disease Center, Temple University Hospital, Philadelphia, PA
Amandeep Singh, MD Clinical Associate, Department of Hospital Medicine, Medicine Institute, Cleveland Clinic
Thomas Plesec, MD Department of Anatomic Pathology, Cleveland Clinic; Assistant Professor, Cleveland Clinic Lerner College of Medicine of Case Western Reserve University, Cleveland, OH
David Liska, MD Departments of Colorectal Surgery and Stem Cell Biology and Regenerative Medicine, Cleveland Clinic; Assistant Professor, Cleveland Clinic Lerner College of Medicine of Case Western Reserve University, Cleveland, OH
Bradley Confer, DO Geisinger Gastroenterology, Geisinger Medical Center, Danville, PA
Jessica Philpott, MD, PhD Associate Staff, Department of Gastroenterology and Hepatology, Cleveland Clinic; Clinical Assistant Professor, Cleveland Clinic Lerner College of Medicine of Case Western Reserve University, Cleveland, OH
Florian Rieder, MD Associate Staff, Department of Gastroenterology, Hepatology, and Nutrition, and Investigator, Department of Pathobiology, Lerner Research Institute, Cleveland Clinic
Address: Neha Agrawal, MD, Temple Digestive Disease Center, Temple University Hospital, 3401 North Broad Street, Philadelphia, PA 19140; [email protected]
Dr. Rieder has disclosed board membership for AbbVie and UCB and consulting for Celgene, Roche, and United BioSource Corporation (UBC).
A 32-year-old woman presented to our emergency department with chest pain and painful ulcerations on her arms, abdomen, back, groin, axillae, and in her mouth. She first noticed the ulcers 7 days earlier.
She also reported bloody diarrhea, which had started 2 years earlier, with 10 or more bowel movements daily. She described her stools as semiformed and associated with urgency and painful abdominal cramps.
Medical history
Her medical history included obstructive sleep apnea and morbid obesity. She had first presented 2 years earlier to another hospital with diarrhea, abdominal pain, and rectal bleeding. At that time, results of esophagogastroduodenoscopy and colonoscopy were reported as normal. Later, she became pregnant, and her symptoms went away. She had a normal pregnancy and delivery.
About 1 year postpartum, her abdominal pain and bloody diarrhea recurred. Colonoscopy showed severe sigmoid inflammation with small, shallow ulcerations and friable mucosa interrupted by areas of normal mucosa. Histopathologic study of the colonic mucosa indicated mild to moderate chronic active colitis consisting of focal areas of cryptitis with occasional crypt abscess formation. She was diagnosed with Crohn colitis based on the endoscopic appearance, histopathology, and clinical presentation. The endoscope, however, could not be advanced beyond the sigmoid colon, which suggested stenosis. She was started on 5-aminosalicylic acid (5-ASA) but developed visual hallucinations, and the medication was stopped.
Her symptoms continued, and she developed worsening rectal bleeding and anemia that required hospitalization and blood transfusions. Another colonoscopy performed 1 month before this emergency department visit had shown multiple mucosal ulcerations, but again, the colonoscope could not be advanced beyond the sigmoid colon. She was started on oral corticosteroids, which provided only minimal clinical improvement.
Her current medications included atenolol (for sinus tachycardia), prednisone (initial dose 60 mg/day tapered to 20 mg/day at presentation), and ciprofloxacin.
Her family history was unknown because she had been adopted.
About 1 week before presentation, she had noticed ulcers developing on her arms, abdomen, back, groin, oral mucosa, and axillae. The ulcers were large and painful, with occasional spontaneous bleeding. She also reported pustules and ulcerations at sites of previous skin punctures, consistent with pathergy.
Findings on presentation
Temperature 99.5°F (37.5°C)
Heart rate 124 beats per minute
Respiratory rate 22 breaths per minute
Oxygen saturation 100% on room air
Blood pressure 128/81 mm Hg
Body mass index 67 kg/m2 (morbidly obese).
She had multiple greyish-white patches and erosions over the soft palate, tongue, and upper and lower lip mucosa, erythematous pustules in the axillae bilaterally, and large erythematous, sharply demarcated ulcerations with a fibrinous base bilaterally covering her arms, thighs, groin, and abdomen.
Blood testing showed multiple abnormal results (Table 1). Urinalysis revealed a urine protein concentration of 100 mg/dL (reference range 0), more than 25 white blood cells per high-power field (reference range < 5), 6 to 10 red blood cells per high-power field (0–3), and more than 10 casts per low-power field (0), which suggested a urinary tract infection with hematuria.
Computed tomography (CT) of the abdomen and pelvis with intravenous and oral contrast showed diffuse fatty infiltration of the liver and wall thickening of the rectum and sigmoid colon.
She was admitted to the medical intensive care unit for potential septic shock. Intravenous vancomycin and ciprofloxacin were started (the latter owing to penicillin allergy).
CAUSES OF DIARRHEA AND SKIN CHANGES
1. What is the most likely diagnosis in our patient?
Ulcerative colitis
Crohn disease
Behçet disease
Intestinal tuberculosis
Herpes simplex virus infection
Cytomegalovirus infection
All of the above can cause diarrhea in combination with mucocutaneous lesions and other manifestations.
Ulcerative colitis and Crohn disease: Mucocutaneous findings
Extraintestinal manifestations of inflammatory bowel diseases (Crohn disease, ulcerative colitis, and Behçet disease) include arthritis, ocular involvement, mucocutaneous manifestations, and liver involvement in the form of primary sclerosing cholangitis. Less common extraintestinal manifestations include vascular, renal, pulmonary, cardiac, and neurologic involvement.
Mucocutaneous findings are observed in 5% to 10% of patients with ulcerative colitis and 20% to 75% of patients with Crohn disease.1–3 The most common are erythema nodosum and pyoderma gangrenosum.4
Yüksel et al5 reported that of 352 patients with inflammatory bowel disease, 7.4% had erythema nodosum and 2.3% had pyoderma gangrenosum. Erythema nodosum was significantly more common in patients with Crohn disease than in those with ulcerative colitis, and its severity was linked with higher disease activity. Lesions frequently resolved when bowel disease subsided.
Lebwohl and Lebwohl6 reported that pyoderma gangrenosum occurred in up to 20% of patients with Crohn disease and up to 10% of those with ulcerative colitis. It is not known whether pyoderma gangrenosum correlates with intestinal disease severity.
Other mucocutaneous manifestations of inflammatory bowel disease include oral aphthous ulcers, acute febrile neutrophilic dermatosis (Sweet syndrome), and metastatic Crohn disease. Aphthous ulcers in the oral cavity, often observed in both Crohn disease and ulcerative colitis, cannot be differentiated on clinical examination from herpes simplex virus (HSV) type 1-induced or idiopathic mucous membrane ulcers. The most common ulcer locations are the lips and buccal mucosa. If biopsied (seldom required), noncaseating granulomas can be identified that are comparable with intestinal mucosal granulomas found in Crohn disease.7
Behçet disease has similar signs
Oral aphthous ulcers are also the most frequent symptom in Behçet disease, occurring in 97% to 100% of cases.8 They most commonly affect the tongue, lips, buccal mucosa, and gingiva.
Cutaneous manifestations include erythema nodosum-like lesions, which present as erythematous painful nodules over pretibial surfaces of the lower limbs but can also affect the arms and thighs; they can also present as papulopustular rosacea eruptions composed of papules, pustules, and noninflammatory comedones, most commonly on the chest, back, and shoulders.8,9
Pathergy, ie, skin hyperresponse to minor trauma such as a bump or bruise, is a typical trait of Behçet disease. A positive pathergy test (ie, skin hyperreactivity to a needlestick or intracutaneous injection) has a specificity of 98.4% in patients with Behçet disease.10
Interestingly, there appears to be a regional difference in the susceptibility to pathergy. While a pathergy response in patients with Behçet disease is rare in the United States and the United Kingdom, it is very common in Japan, Turkey, and Israel.11
Patient demographics also distinguish Behçet disease from Crohn disease. The prevalence of Behçet disease is highest along the Silk Road from the Mediterranean Basin to East Asia and lowest in North America and Northern Europe.12 The mean age at onset is around the third and fourth decades. In males, the prevalence is highest in Mediterranean, Middle Eastern, and Asian countries. In females, the prevalence is highest in the United States, Northern Europe, and East Asia.10
Tuberculosis
Tubercular skin lesions can present in different forms.13 Lupus vulgaris, the most common, occurs after primary infection and presents as translucent brown nodules, mainly over the face and neck. So-called scrofuloderma is common at the site of a lymph node. It appears as a gradually enlarging subcutaneous nodule followed by skin breaks and ulcerations. Tuberculosis verrucosa cutis, also known as warty tuberculosis, is common in developing countries and presents as warty plaque over the hands, knees, and buttocks.14 Tuberculids are skin reactions to systemic tuberculosis infection.
Herpes simplex virus
Mucocutaneous manifestations of herpes simplex virus affect the oral cavity (gingivostomatitis, pharyngitis, and lip border lesions), the entire integumentary system, the eyes (HSV-1), and the genital region (HSV-2). The classic presentation is systemic symptoms (fever and malaise) associated with multiple vesicles on an erythematous base in a distinct region of skin. The virus can remain latent with reactivation occurring because of illness, immunosuppression, or stress. Pruritus and pain precede the appearance of these lesions.
Cytomegalovirus
Primary cytomegalovirus infection is subclinical in almost all cases unless the patient is immunocompromised, and it presents similarly to mononucleosis induced by Epstein-Barr virus. The skin manifestations are nonspecific and can include macular, maculopapular, morbilliform, and urticarial rashes, but usually not ulcerations.15
OUR PATIENT: BEHÇET DISEASE OR CROHN DISEASE?
In our patient, oral mucosal aphthous ulcers and the location of pustular skin lesions, in addition to pathergy, were highly suggestive of Behçet disease. However, Crohn disease with mucocutaneous manifestations remained in the differential diagnosis.
Because there is significant overlap between these diseases, it is important to know the key distinguishing features. Oral aphthous ulcers, pathergy, uveitis, skin and genital lesions, and neurologic involvement are much more common in Behçet disease than in Crohn disease.16,17 Demographic information was not helpful in this case, given that the patient was adopted.
FURTHER WORKUP
2. What should be the next step in the work-up?
CT enterography
Skin biopsy
Colonoscopy with biopsy
C-reactive protein, erythrocyte sedimentation rate, and fecal calprotecting testing
The endoscopic appearance and histopathology of the affected tissues are crucial for the diagnosis. Differentiating between Crohn disease and Behçet disease can be particularly challenging because of significant overlap between the intestinal and extraintestinal manifestations of the two diseases, especially the oral lesions and arthralgias. Thus, both colonoscopy with biopsy of the intestinal lesions and biopsy of a cutaneous ulceration should be pursued.
No single test or feature is pathognomonic for Behçet disease. Although many diagnostic criteria have been established, those of the International Study Group (Table 2) are the most widely used.18 Their sensitivity for Behçet disease has been found to be 92%, and their specificity 97%.19
Both CT enterography and inflammatory markers would depict inflammation, but since this is present in both Crohn disease and Behçet disease, these tests would not be helpful in this situation.
Endoscopic appearance of Crohn disease and Behçet disease
Intestinal Behçet disease, like Crohn disease, is an inflammatory bowel disease occurring throughout the gastrointestinal tract (small and large bowel). Both are chronic diseases with a waxing and waning course and have similar extraintestinal manifestations. Typical endoscopic lesions are deep, sharply demarcated (“punched-out”), round ulcers. The intestinal Behçet disease and Crohn disease ulcer phenotype and distribution can look the same, and in both entities, rectal sparing and “skip lesions” have been described.20–22
Nevertheless, findings on endoscopy have been analyzed to try to differentiate between Crohn disease and Behçet disease.
In 2009, Lee et al23 published a simple and accurate strategy for distinguishing the two diseases endoscopically. The authors reviewed 250 patients (115 with Behçet disease, 135 with Crohn disease) with ulcers on colonoscopy and identified 5 endoscopic findings indicative of intestinal Behçet disease:
Round ulcers
Focal single or focal multiple distribution of ulcers
Fewer than 6 ulcers
Absence of a “cobblestone” appearance
Absence of aphthous lesions.
The two most accurate factors were absence of a cobblestone appearance (sensitivity 100%) and round ulcer shape (specificity 97.5 %). When more than one factor was present, specificity increased but sensitivity decreased.
From Lee SK, Kim BK, Kim TI, Kim WH. Differential diagnosis of intestinal Behçet’s disease and Crohn’s disease by colonoscopic findings. Endoscopy 2009; 41:9–16; copyright Georg Thieme Verlag KG.
Figure 1.
Using a classification and regression tree analysis, the investigators created an algorithm that endoscopically differentiates between Crohn disease and Behçet disease (Figure 1) with an accuracy of 92 %.23
Histopathologic analysis of both colonic and skin lesions can provide additional clues to the correct diagnosis. Vasculitis suggests Behçet disease, whereas granulomas suggest Crohn disease.
CASE CONTINUED: SKIN BIOPSY AND COLONOSCOPY
Punch biopsy of the skin was performed on the right anterior thigh. Histopathologic analysis revealed acanthotic epidermis, a discrete full-thickness necrotic ulcer with a neutrophilic base, granulation tissue, and vasculitic changes. There were no vasculitic changes or granulomas outside the ulcer base. Cytomegalovirus staining was negative. An interferon-gamma release assay for tuberculosis was negative. Eye examination results were normal.
Figure 2. Colonoscopy revealed multiple deep, round, confluent ulcers with a “punched-out” appearance, as well as fissures in the entire colon with normal intervening mucosa and normal terminal ileum.
Colonoscopy showed multiple deep, round, and confluent ulcers with a punched-out appearance and fissures with normal intervening mucosa in the entire examined colon (Figure 2). The terminal ileal mucosa was normal. Colonic biopsies were consistent with cryptitis and rare crypt abscesses. Vasculitis was not identified.
Although the histologic changes were nonspecific, at this point we considered Behçet disease to be more likely than Crohn disease, given the typical endoscopic appearance and skin changes.
TREATING INTESTINAL BEHÇET DISEASE
3. Which is not considered a standard treatment for intestinal Behçet disease?
Mesalamine (5-ASA)
Corticosteroids
Immunosuppressants
Mycophenolate mofetil
Surgery
Overall, data on the management of intestinal Behçet disease are limited. The data that do exist have shown that 5-ASA, corticosteroids, immunosuppressants, and surgery are options, but not mycophenolate mofetil.
Consensus recommendations from the Japanese IBD Research Group,24 published in 2007, included 5-ASA, corticosteroids, immunosuppressants, enteral and total parenteral nutrition, and surgical resection. In 2014, the group published a second consensus statement, adding anti-tumor necrosis factor (TNF) agents as standard therapy for this disease.22
Mycophenolate mofetil has not been shown to be effective in the treatment of mucocutaneous Behçet disease,25 although it may be effective in the treatment of its neurologic manifestations.26 Data regarding its efficacy in intestinal Behçet disease are sparse.
Differences in treatment for Crohn and Behçet disease
Although the treatment options are comparable for Behçet disease and Crohn disease, certain features differ.
Doses of 5-ASA and immunnosuppressive agents are typically higher in Crohn disease. For example, the optimal dose of 5-ASA is up to 3 g/day for Behçet disease but up to 4.8 g/day for Crohn disease.
Standard dosing for azathioprine is 50 to 100 mg/day for Behçet disease but 2 to 2.5 mg/kg/day (eg, 168 to 210 mg/day for a 185-lb patient) for Crohn disease.
In addition, evidence supporting the use of biologic agents such as anti-TNF agents or vedolizumab is more abundant in Crohn disease.
Finally, data on monitoring drug levels of immunomodulators or biologics are available only for patients with Crohn disease, not Behçet disease. Thus, an accurate diagnosis is important.
CASE CONTINUED: EMERGENCY LAPAROTOMY
Our patient continued to experience abdominal pain and bloody diarrhea despite receiving corticosteroids intravenously in high doses. We were also considering anti-TNF therapy.
At this point, CT of her abdomen and pelvis was repeated and showed free intraperitoneal air consistent with a perforation of the transverse colon.
She underwent emergency exploratory laparotomy. Intraoperative findings included pneumoperitoneum but no gross peritoneal contamination, extensive colitis with a contained splenic flexure perforation, and normal small-bowel features without evidence of enteritis. Subtotal colectomy, implantation of the rectal stump into the subcutaneous tissue, and end-ileostomy were performed.
After 23 days of recovery in the hospital, she was discharged on oral antibiotics and 4 weeks of steroid taper.
PROGNOSIS OF INTESTINAL BEHÇET DISEASE
4. What can the patient expect from her intestinal Behçet disease in the future?
The disease is cured after resection of the diseased segments
Behçet disease is a progressive lifelong disorder that can recur after surgery
Like Crohn disease, Behçet disease should be considered a lifelong progressive disorder, even after surgical resection of diseased segments.
It is unclear which patients will have a complicated disease course and need treatment with stronger immunosuppression. In patients with intestinal Behçet disease whose disease is in remission on thiopurine therapy, the 1-year relapse rate has been reported as 5.8%, and the 5-year relapse rate 51.7%.27,28 After surgical resection, the 5-year recurrence rate was 47.2%, and 30.6% of patients needed repeat surgery.29 Predictors of poor prognosis were younger age, higher erythrocyte sedimentation rate, higher C-reactive protein level, low albumin level at diagnosis, and a high disease-activity index for intestinal Behçet disease.30
The Korean IBD Study Group has developed and validated a disease activity index for intestinal Behçet disease.28 The index has a list of weighted scores for 8 symptoms, which provides for a more objective assessment of disease activity for determining the best treatment approach.
CASE CONTINUED
The patient has continued with her follow-up care and appointments in gastroenterology, rheumatology, and dermatology clinics. She still complains of intermittent abdominal pain, occasional bleeding at the rectal stump, intermittent skin lesions mainly in the form of pustular lesions, and intermittent joint pain. If symptoms persist, anti-TNF therapy is an option.
References
Burgdorf W. Cutaneous manifestations of Crohn’s disease. J Am Acad Dermatol 1981; 5:689–695.
Palamaras I, El-Jabbour J, Pietropaolo N, et al. Metastatic Crohn’s disease: a review. J Eur Acad Dermatol Venereol 2008; 22:1033–1043.
Tavarela Veloso F. Skin complications associated with inflammatory bowel disease. Aliment Pharmacol Ther 2004; 20(suppl 4):50–53.
Yüksel I, Basar O, Ataseven H, et al. Mucocutaneous manifestations in inflammatory bowel disease. Inflamm Bowel Dis 2009; 15:546–550.
Lebwohl M, Lebwohl O. Cutaneous manifestations of inflammatory bowel disease. Inflamm Bowel Dis 1998; 4:142–148.
Levine JS, Burakoff R. Extraintestinal manifestations of inflammatory bowel disease. Gastroenterol Hepatol (NY) 2011; 7:235–241.
Mat C, Yurdakul S, Sevim A, Özyazgan Y, Tüzün Y. Behçet’s syndrome: facts and controversies. Clin Dermatol 2013; 31:352–361.
Lee ES, Bangz D, Lee S. Dermatologic manifestation of Behçet’s disease. Yonsei Med J 1997; 38:380–389.
Davatchi F, Chams-Davatchi C, Ghodsi Z, et al. Diagnostic value of pathergy test in Behçet’s disease according to the change of incidence over the time. Clin Rheumatol 2011; 30:1151–1155.
Friedman-Birnbaum R, Bergman R, Aizen E. Sensitivity and specificity of pathergy test results in Israeli patients with Behçet’s disease. Cutis 1990; 45:261–264.
Mahr A, Maldini C. Epidemiology of Behçet’s disease. Rev Med Interne 2014; 35:81–89. French.
Barbagallo J, Tager P, Ingleton R, Hirsch RJ, Weinberg JM. Cutaneous tuberculosis. Am J Clin Dermatol 2002; 3:319–328.
Padmavathy L, Lakshmana Rao L, Ethirajan N, Ramakrishna Rao M, Subrahmanyan EN, Manohar U. Tuberculosis verrucosa cutis (TBVC)—foot with miliary tuberculosis. Indian J Tuberc 2007; 54:145–148.
Drago F, Aragone MG, Lugani C, Rebora A. Cytomegalovirus infection in normal and immunocompromised humans. A review. Dermatology 2000; 200:189–195.
Yazısız V. Similarities and differences between Behçet’s disease and Crohn’s disease. World J Gastrointest Pathophysiol 2014; 5:228–238.
International Study Group for Behçet’s Disease. Criteria for diagnosis of Behçet’s disease. Lancet 1990; 335:1078–1080.
Davatchi F. Diagnosis/classification criteria for Behcet’s disease. Patholog Res Int 2012; 2012:607921.
Chang DK, Kim JJ, Choi H, et al. Double balloon endoscopy in small intestinal Crohn’s disease and other inflammatory diseases such as cryptogenic multifocal ulcerous stenosing enteritis (CMUSE). Gastrointest Endosc 2007; 66(suppl):S96–S98.
Hamdulay SS, Cheent K, Ghosh C, Stocks J, Ghosh S, Haskard DO. Wireless capsule endoscopy in the investigation of intestinal Behçet’s syndrome. Rheumatology (Oxford) 2008; 47:1231–1234.
Hisamatsu T, Ueno F, Matsumoto T, et al. The 2nd edition of consensus statements for the diagnosis and management of intestinal Behçet’s disease: indication of anti-TNFa monoclonal antibodies. J Gastroenterol 2014; 49:156–162.
Lee SK, Kim BK, Kim TI, Kim WH. Differential diagnosis of intestinal Behçet’s disease and Crohn’s disease by colonoscopic findings. Endoscopy 2009; 41:9–16.
Kobayashi K, Ueno F, Bito S, et al. Development of consensus statements for the diagnosis and management of intestinal Behçet’s disease using a modified Delphi approach. J Gastroenterol 2007; 42:737–745.
Adler YD, Mansmann U, Zouboulis CC. Mycophenolate mofetil is ineffective in the treatment of mucocutaneous Adamantiades-Behçet’s disease. Dermatology 2001; 203:322–324.
Shugaiv E, Tüzün E, Mutlu M, Kiyat-Atamer A, Kurtuncu M, Akman-Demir G. Mycophenolate mofetil as a novel immunosuppressant in the treatment of neuro-Behçet’s disease with parenchymal involvement: presentation of four cases. Clin Exp Rheumatol 2011; 29(suppl 67):S64–S67.
Jung YS, Cheon JH, Hong SP, Kim TI, Kim WH. Clinical outcomes and prognostic factors for thiopurine maintenance therapy in patients with intestinal Behçet’s disease. Inflamm Bowel Dis 2012; 18:750–757.
Cheon JH, Han DS, Park JY, et al; Korean IBD Study Group. Development, validation, and responsiveness of a novel disease activity index for intestinal Behçet’s disease. Inflamm Bowel Dis 2011; 17:605–613.
Jung YS, Yoon JY, Lee JH, et al. Prognostic factors and long-term clinical outcomes for surgical patients with intestinal Behçet’s disease. Inflamm Bowel Dis 2011; 17:1594–1602.
Jung YS, Cheon JH, Park SJ, Hong SP, Kim TI, Kim WH. Clinical course of intestinal Behçet’s disease during the first five years. Dig Dis Sci 2013; 58:496–503.
A 52-year-old woman with diabetes mellitus presented with a 1-month history of pain in the right lower abdomen and right back. Although she had a fever when the pain started and her pain was aggravated by walking, her pain and fever had gotten better after taking antibiotics prescribed earlier.
Figure 1. Computed tomography (horizontal plane) showed a low-density area 7 × 4 cm in the right psoas muscle (arrow) and a low-density area 16 × 6 cm in subcutaneous tissue connected to the psoas muscle (arrowheads).
Figure 2. Computed tomography (coronal section) showed a low-density area 16 × 4 cm in the right psoas muscle (arrow), and a low-density area 11 × 7 cm in subcutaneous tissue connected to the psoas muscle (arrowheads).On physical examination, a tender mass with slight warmth was felt in the right lower quadrant. Laboratory testing revealed an active inflammatory reaction: the white blood cell count was 54.8 × 10⁹/L (reference range 4.5–11.0), and the C-reactive protein level was 35.40 mg/dL (reference range < 0.9). Computed tomography showed an abscess in the iliopsoas muscle (Figures 1 and 2), with no evidence of pyogenic spondylitis or other vertebral involvement.
The patient was admitted to the hospital for percutaneous drainage, which produced 26 mL of pus on the first day and 320 mL on the next day; culture was positive for Escherichia coli. Urine culture was also positive for E coli; blood culture was not. We concluded that these results were secondary to pyelonephritis.
We started intravenous piperacillin-tazobactam 2.25 g every 8 hours for empiric therapy. We changed this to oral ampicillin-cloxacillin 2 g/day after E coli was cultured and pyelonephritis was suspected. The patient was discharged after a 2-week hospital stay, with no significant complications.
ILIOPSOAS ABSCESS: DIAGNOSTIC CLUES
Iliopsoas abscess can occur at any age.1–3 Pain is the most common symptom, occurring in more than 90% of patients.1 Fever with temperatures over 38°C is less common at first, found in less than half of patients.1,2
Only 13% of patients with iliopsoas abscess may have a palpable mass on physical examination.1 The psoas sign—a worsening of lower abdominal pain on the affected side with passive extension of the thigh while supine—has a sensitivity of only 24% for iliopsoas abscess; it can also indicate inflammation to the iliopsoas muscle in other conditions such as retrocecal appendicitis.3
Hip flexion deformity can be a helpful diagnostic feature, as 96% of patients with iliopsoas abscess hold the hip in flexion to relieve pain.4 But pain on hip flexion can also occur in conditions such as septic arthritis.4
Inflammatory markers such as erythrocyte sedimentation rate and C-reactive protein may be elevated in all patients with iliopsoas abscess, so if those markers are not elevated, we may have to consider other conditions such as cancer.1 Computed tomography is nearly 100% sensitive for iliopsoas abscess and is the gold standard for diagnosis.3
TREATMENT
Inadequate treatment of iliopsoas abscess raises the risk of relapse and death.3 Drainage and appropriate antibiotic therapy have been shown to be effective.1,3
Iliopsoas abscess can also be secondary to a number of conditions, eg, Crohn disease, appendicitis, intra-abdominal infection, and cancer,5 and the primary condition needs to be addressed. In addition, culture of a secondary abscess is more likely to grow mixed organisms.5
The average size of the abscess is 6 cm. Percutaneous drainage is required if the mass is larger than 3.5 cm.1
TAKE-HOME MESSAGES
Iliopsoas abscess is difficult to diagnose because patients have few specific complaints. Checking for hip flexion deformity and inflammatory markers may help rule out the disease. When iliopsoas abscess is suspected, computed tomography is necessary to confirm the diagnosis. Drainage and appropriate antibiotics are effective treatment.
References
Tabrizian P, Nguyen SQ, Greenstein A, Rajhbeharrysingh U, Divino CM. Management and treatment of iliopsoas abscess. Arch Surg 2009; 144:946–949.
Shields D, Robinson P, Crowley TP. Iliopsoas abscess—a review and update on the literature. Int J Surg 2012; 10:466–469.
Huang JJ, Ruaan MK, Lan RR, Wang MC. Acute pyogenic iliopsoas abscess in Taiwan: clinical features, diagnosis, treatments and outcome. J Infect 2000; 40:248–255.
Stefanich RJ, Moskowitz A. Hip flexion deformity secondary to acute pyogenic psoas abscess. Orthop Rev 1987; 16:67–77.
Ricci MA, Rose FB, Meyer KK. Pyogenic psoas abscess: worldwide variations in etiology. World J Surg 1986; 10:834–843.
Yu Li, MD Department of Emergency and Critical Care Medicine, Tokyo Bay Urayasu Ichikawa Medical Center, Chiba, Japan
Hiraku Funakoshi, MD, MPH, PhD Department of Emergency and Critical Care Medicine, Tokyo Bay Urayasu Ichikawa Medical Center, Chiba, Japan
Takashi Shiga, MD, MPH Department of Emergency and Critical Care Medicine, Tokyo Bay Urayasu Ichikawa Medical Center, Chiba, Japan
Shigeki Fujitani, MD, PhD Department of Emergency and Critical Care Medicine, Tokyo Bay Urayasu Ichikawa Medical Center, Chiba, Japan
Address: Yu Li, MD, Department of Emergency and Critical Care Medicine, Tokyo Bay Urayasu Ichikawa Medical Center, 3-4-32, Todaijima Urayasu, Chiba, Japan; [email protected]
Author and Disclosure Information
Yu Li, MD Department of Emergency and Critical Care Medicine, Tokyo Bay Urayasu Ichikawa Medical Center, Chiba, Japan
Hiraku Funakoshi, MD, MPH, PhD Department of Emergency and Critical Care Medicine, Tokyo Bay Urayasu Ichikawa Medical Center, Chiba, Japan
Takashi Shiga, MD, MPH Department of Emergency and Critical Care Medicine, Tokyo Bay Urayasu Ichikawa Medical Center, Chiba, Japan
Shigeki Fujitani, MD, PhD Department of Emergency and Critical Care Medicine, Tokyo Bay Urayasu Ichikawa Medical Center, Chiba, Japan
Address: Yu Li, MD, Department of Emergency and Critical Care Medicine, Tokyo Bay Urayasu Ichikawa Medical Center, 3-4-32, Todaijima Urayasu, Chiba, Japan; [email protected]
A 52-year-old woman with diabetes mellitus presented with a 1-month history of pain in the right lower abdomen and right back. Although she had a fever when the pain started and her pain was aggravated by walking, her pain and fever had gotten better after taking antibiotics prescribed earlier.
Figure 1. Computed tomography (horizontal plane) showed a low-density area 7 × 4 cm in the right psoas muscle (arrow) and a low-density area 16 × 6 cm in subcutaneous tissue connected to the psoas muscle (arrowheads).
Figure 2. Computed tomography (coronal section) showed a low-density area 16 × 4 cm in the right psoas muscle (arrow), and a low-density area 11 × 7 cm in subcutaneous tissue connected to the psoas muscle (arrowheads).On physical examination, a tender mass with slight warmth was felt in the right lower quadrant. Laboratory testing revealed an active inflammatory reaction: the white blood cell count was 54.8 × 10⁹/L (reference range 4.5–11.0), and the C-reactive protein level was 35.40 mg/dL (reference range < 0.9). Computed tomography showed an abscess in the iliopsoas muscle (Figures 1 and 2), with no evidence of pyogenic spondylitis or other vertebral involvement.
The patient was admitted to the hospital for percutaneous drainage, which produced 26 mL of pus on the first day and 320 mL on the next day; culture was positive for Escherichia coli. Urine culture was also positive for E coli; blood culture was not. We concluded that these results were secondary to pyelonephritis.
We started intravenous piperacillin-tazobactam 2.25 g every 8 hours for empiric therapy. We changed this to oral ampicillin-cloxacillin 2 g/day after E coli was cultured and pyelonephritis was suspected. The patient was discharged after a 2-week hospital stay, with no significant complications.
ILIOPSOAS ABSCESS: DIAGNOSTIC CLUES
Iliopsoas abscess can occur at any age.1–3 Pain is the most common symptom, occurring in more than 90% of patients.1 Fever with temperatures over 38°C is less common at first, found in less than half of patients.1,2
Only 13% of patients with iliopsoas abscess may have a palpable mass on physical examination.1 The psoas sign—a worsening of lower abdominal pain on the affected side with passive extension of the thigh while supine—has a sensitivity of only 24% for iliopsoas abscess; it can also indicate inflammation to the iliopsoas muscle in other conditions such as retrocecal appendicitis.3
Hip flexion deformity can be a helpful diagnostic feature, as 96% of patients with iliopsoas abscess hold the hip in flexion to relieve pain.4 But pain on hip flexion can also occur in conditions such as septic arthritis.4
Inflammatory markers such as erythrocyte sedimentation rate and C-reactive protein may be elevated in all patients with iliopsoas abscess, so if those markers are not elevated, we may have to consider other conditions such as cancer.1 Computed tomography is nearly 100% sensitive for iliopsoas abscess and is the gold standard for diagnosis.3
TREATMENT
Inadequate treatment of iliopsoas abscess raises the risk of relapse and death.3 Drainage and appropriate antibiotic therapy have been shown to be effective.1,3
Iliopsoas abscess can also be secondary to a number of conditions, eg, Crohn disease, appendicitis, intra-abdominal infection, and cancer,5 and the primary condition needs to be addressed. In addition, culture of a secondary abscess is more likely to grow mixed organisms.5
The average size of the abscess is 6 cm. Percutaneous drainage is required if the mass is larger than 3.5 cm.1
TAKE-HOME MESSAGES
Iliopsoas abscess is difficult to diagnose because patients have few specific complaints. Checking for hip flexion deformity and inflammatory markers may help rule out the disease. When iliopsoas abscess is suspected, computed tomography is necessary to confirm the diagnosis. Drainage and appropriate antibiotics are effective treatment.
References
Tabrizian P, Nguyen SQ, Greenstein A, Rajhbeharrysingh U, Divino CM. Management and treatment of iliopsoas abscess. Arch Surg 2009; 144:946–949.
Shields D, Robinson P, Crowley TP. Iliopsoas abscess—a review and update on the literature. Int J Surg 2012; 10:466–469.
Huang JJ, Ruaan MK, Lan RR, Wang MC. Acute pyogenic iliopsoas abscess in Taiwan: clinical features, diagnosis, treatments and outcome. J Infect 2000; 40:248–255.
Stefanich RJ, Moskowitz A. Hip flexion deformity secondary to acute pyogenic psoas abscess. Orthop Rev 1987; 16:67–77.
Ricci MA, Rose FB, Meyer KK. Pyogenic psoas abscess: worldwide variations in etiology. World J Surg 1986; 10:834–843.
Pharmacotherapy and behavioral therapy are currently used with success in treating attention-deficit/hyperactivity disorder (ADHD) in children, adolescents, and adults. Ongoing changes in healthcare require physicians to improve the quality of care, reduce costs of treatment, and manage their patients’ health, not just their illnesses. Behavioral and pharmacologic studies provide us with an opportunity to maximize treatment of ADHD and adapt it to the needs of individuals.
This article identifies common problems in treating ADHD, discusses limits of care in pharmacotherapy and behavioral intervention, and offers practical recommendations for treating ADHD in the changing world of healthcare.
A CHANGING MEDICAL CLIMATE
The Affordable Care Act of 2010 sought to transform medical care in the United States from procedures to performance, from acute episodes of illness to integrated care across the lifespan, and from inefficient care to efficient and affordable care with measurable outcomes. At the time of this writing, nobody knows whether the Affordable Care Act will survive, but these are still good goals. Because ADHD is the most common behavioral disorder of childhood, value-based care is essential.1
ADHD ON THE RISE—WHY?
The prevalence of ADHD increased 42% from 2003 to 2011,2 with increases in nearly all demographic groups in the United States regardless of race, sex, and socioeconomic status. More than 1 in 10 school-age children (11%) in the United States now meet the criteria for the diagnosis of ADHD; among adolescents, 1 in 5 high school boys and 1 in 11 high school girls meet the criteria.2
Rates vary among states, from a low of 4.2% for children ages 4 to 17 in Nevada to a high of 14.6% in Arkansas.3 Worldwide estimates of ADHD prevalence range from 2.2% to 17.8%,4 with the most recent meta-analysis for North America and Europe indicating a 7.2% worldwide prevalence in people age 18 and younger.5
Such data have sparked criticism, with some saying that ADHD is overdiagnosed, others saying it is underdiagnosed, and most agreeing that it is misdiagnosed.
Changing definitions of ADHD may have had a small effect on the increase in prevalence,6 but the change is more likely a result of heightened awareness and recognition of symptoms. Even so, guidelines for diagnosing ADHD are still not rigorously applied, contributing to misdiagnosis. For example, in a study of 50 pediatric practices, only half of clinicians said they followed diagnostic guidelines to determine symptom criteria from at least 2 sources and across 2 settings, yet nearly all (93%) reported immediately prescribing medications for treatment.7
The Diagnostic and Statistical Manual of Mental Disorders, Fifth Edition,8 requires evidence of a persistent pattern of inattention or hyperactivity/impulsivity, or both, with a severity that interferes with developmental functioning in 2 or more settings; was present before age 12; and cannot be accounted for by another behavioral health disorder such as depression, anxiety, or trauma. The diagnosis should document the presence of at least 6 of 9 symptoms of inattention (or 5 symptoms for teens age 17 or older), or at least 6 of 9 symptoms of hyperactive/impulsive behavior (5 symptoms for teens age 17 and older). Symptoms are best documented when reported by at least 2 observers.
COSTS OF ADHD
ADHD is expensive to society. National yearly healthcare costs have ranged from $143 billion to $266 billion,9 with over half this amount assumed directly by families.10 Even in previous decades when prevalence rates hovered around 5%, the cost of workday loss in the United States was high for adult patients and for parents of young children with ADHD needing to take time off from work for doctors’ visits.11 Projections across 10 countries indicated that adults with ADHD lost more workdays than did workers without ADHD.12
There is also a trend toward visits that are more expensive. Between 2000 and 2010, the number of visits for ADHD to psychiatrists rose from 24% to 36%, while the number of less-costly visits to pediatricians decreased from 54% to 47%.13
Thus, over the past 15 years, symptoms of ADHD have become more readily recognized, prevalence rates in the population have increased significantly, and associated costs have increased dramatically, with costs extending beyond individual impairment to a loss of productivity at the workplace. And treatment, typically with drugs, has been used without sufficient application of current diagnostic criteria. What impact does this have on the practicing physician?
DRUG TREATMENT: GOLD STANDARD OR NATIONAL DISASTER?
Stimulants are considered the standard of medical care for the symptoms of ADHD, according to the 2011 practice guidelines of the American Academy of Pediatrics.14 They are efficacious and cost-effective when optimal dosing is achieved, since the patient usually manages treatment independently, requiring minimal physician input in the months and years after successful titration.
For these reasons, the use of stimulants to treat ADHD has increased dramatically in the last decade. According to the National Survey of Children’s Health, as a result of an increase in parent-reported ADHD, more US children were receiving medical treatment for the disorder in 2011 than in any previous year reported, and the prevalence of pharmacotherapy in children ages 14 to 17 increased 28% over the 4 years from 2007 to 2011.2
Dr. Keith Conners, an early advocate for recognition of ADHD, has called the staggering increase in the rates of diagnosis and drug treatment a “national disaster of dangerous proportions.”15 Nevertheless, many children and families have benefited in a cost-effective manner.
STRATEGIES FOR TITRATION
Physicians typically rely on 4 strategies to titrate stimulants,16 presented below in order of increasing complexity.
Prescribe-and-wait
Often, physicians write a prescription and direct the parent to call back or visit the office to relay the child’s response after a specified period, typically 1 week to 1 month.
This method is convenient in a busy practice and is informative to the physician in a general way. The drawback to this method is that it seldom results in optimal treatment. If the parent does not call back, the physician may assume the treatment was successful without being certain.
Dose-to-improvement
In this approach, the physician monitors titration more closely and increases the dose until a positive response is achieved, after which the dose is maintained. This method reduces symptoms but does not ensure optimal treatment, as there still may be room for improvement.
Forced-dose titration
This method is often used in clinical trials. The dose is ramped up until side effects occur and is then reduced until the side effects go away.
This method often results in optimal dosing, as a forced dose yields a greater reduction in symptoms. But it requires close monitoring by the physician, with multiple reports from parents and teachers after each dose increase to determine whether benefit at the higher dose outweighs the side effects and whether side effects can be managed.
Blinded placebo trial
Also often used in research, this method typically requires a research pharmacy to prepare capsules of stimulant medicine in low, moderate, high, and placebo doses.17 All doses are blinded and given over 4 weeks in a forced-dose titration—a placebo capsule with 3 active medication doses in escalating order, which is typical of outpatient pediatric practice. Placebo capsules are randomly assigned to 1 of the 4 weeks, and behavior is monitored over the 7 days of administration by teachers and parents.
This strategy has benefits similar to those of forced-dose titration, and it further delineates medicine response—both side effects and behavior change—by adding a no-medicine placebo condition. It is a systematic, monitored “experiment” for parents who are wary or distrustful of ADHD pharmacotherapy, and it has notable benefits.18 It is also useful for teenagers who are reluctant to use medicine to treat symptoms. It arrives at optimal treatment in a timely manner, usually about 4 to 5 weeks.
On the other hand, this approach requires diligence from families, teachers, and caregivers during the initiation phase, and it requires consistent engagement of the physician team.
Some pediatricians designate a caregiver to monitor titration with the parent; with each new weekly dose, the caregiver reports the child’s progress to the physician.
ENSURING ADHERENCE
Essential to effective stimulant treatment for ADHD is not whether the medicine works (it does),19 but whether the patient continues to use it.
In treatment studies and pharmacy database analyses, rates of inconsistent use or discontinuation of medication (both considered nonadherence) were 13.2% to 64% within the first year,20 and more than 95% of teenagers discontinue pharmacotherapy before age 21.21
Clinician engagement at the onset of stimulant titration is instrumental to treatment adherence.22,23 When pharmacotherapy is loosely monitored during initiation, adherence is highly inconsistent. Some physicians wait as long as 72 days after first prescribing a medication to contact the patient or family,7 and most children with ADHD who discontinue their medications do so within the first year.24
FACTORS THAT INHIBIT ADHERENCE
What factors inhibit adherence to successful pharmacotherapy for ADHD?
Treatment nonadherence is often associated with a parent’s perception that the medication is not working.25 Physicians can often overcome this perception by speaking with the parent, conveying that at the start of treatment titrating to the optimal dose takes time, and that it does not mean “something is wrong.” But without physician contact, parents do not have the occasion to discuss side effects and benefits and tend not to voice fears such as whether the medicine will affect the child’s physical development or result in drug abuse later in life.26
At the beginning of treatment, a child may become too focused, alarming the parent. This overfocused effect is often misunderstood and does not always persist. In addition, when a child better manages his or her own behavior, the contrast to previous behavior may look like something is wrong, when instead the child’s behavior is actually normalizing. Medicine-induced anxiety—in the child or, by association, in the parent—may be misunderstood, and subsequently the parent just stops the child’s treatment rather than seek physician guidance.
Nonadherence is also more prevalent with immediate-release than with extended-release formulations.27,28
Problems can be summarized as follows7:
Systematic physician observation of response to stimulant titration is often missing at the onset of treatment
“Best dose” is inconsistently achieved
Patient adherence to treatment is inconsistently monitored.
The long-term consequences of nonadherence to therapy for ADHD have not been sufficiently examined,20 but some groups, especially adolescents, show problematic outcomes when treatment is not applied. For example, in one longitudinal study, substance use disorder was significantly higher in youths with ADHD who were never treated with medicine than in “neurotypical” youths and those with ADHD who were treated pharmacologically.29
BEHAVIORAL INTERVENTION
Although opinions vary as to the advantages of drug therapy vs behavioral intervention in ADHD, there is evidence that a combined approach is best.30–33 Pharmacotherapy works inside the skin to reduce symptoms of inattention and overactivity, and behavioral therapy works outside the skin to teach new skills.
Based on outcomes data from the Center for Pediatric Behavioral Health, Cleveland Clinic Children’s.
Figure 1. Points earned represent positive behaviors exhibited during 7-week summer treatment programs held from 2000 to 2013. Data are aggregated to show the positive behavior change for boys and girls across cohorts.Studies have shown evidence of benefits of behavioral therapy distinct from those of pharmacotherapy.34,35 Results of summer treatment programs in the United States and Japan for children ages 6 to 14 have replicated the findings of a US National Institute of Mental Health study that showed that the programs improved performance and resulted in positive behavior changes (Figure 1).
A report from the US Centers for Disease Control and Prevention in 2016 stated that behavioral therapy should be the first treatment for young children with ADHD (ages 2 to 5), but noted that only 40% to 50% of young children with ADHD receive psychological services.36 At the same time, the use of pharmacotherapy has increased tremendously.
Beginning treatment with behavioral therapy rather than medicine has been found to be more cost-effective over time. For children ages 4 to 5, behavioral therapy is recommended as the first line by the clinical practice guidelines of the American Academy of Pediatrics.14 Beginning treatment with behavioral intervention has been shown to produce better outcomes overall than beginning with medication and indicates that lower doses may be used compared with pharmacotherapy that is not preceded by behavioral therapy.37 Findings also indicate that starting with behavioral therapy increases the cost-effectiveness of treatment for children with ADHD.38
Figure 2. In 2 dose-ranging studies of combined drug and behavioral therapy, low- to high-intensity behavioral therapy reduced targeted behaviors at lower drug dosages. Behaviors measured were noncompliance with directives and violations of classroom rules during daily activity in a summer camp.In the long term, combination therapy leads to better outcomes38 and enables the use of lower medication dosages to achieve results similar to those with drug therapy alone (Figure 2).39–41
Behavioral intervention has modest advantages over medicine for non-ADHD symptoms,42 as the practice satisfies the adage “pills don’t teach skills.”26 One advantage is that caregivers take an active role in managing child compliance, social interactions, and classroom deportment, as opposed to the relatively passive role of prescribing medicine only. Parents and teachers form collaborative partnerships to increase consistency and extend the reach of change. In the National Institute of Mental Health multimodal treatment study, the only children whose behavior normalized were those who used medicine and whose caregivers gave up negative, harsh, inconsistent, and ineffective discipline43; that is, parents changed their own behavior.
Parent training is important, as parents must often manage their children’s behavior on their own the best they can, with little coaching and assistance. Primary care physicians may often refer parents to established local programs for training, and ongoing coaching can ensure that skills acquired in such training programs continue to be systematically applied. Pharmacotherapy is focused almost solely on reducing symptoms, but reducing symptoms does not necessarily lead to improved functioning. A multimodal approach helps individuals adapt to demanding settings, achieve personal goals, and contribute to social relationships. Outcomes depend on teaching what to do as well as reducing what not to do. Behavioral therapy44 shaped by peers, caregivers, teachers, and other factors can be effectively remediate the difficulties of children with ADHD.
The disadvantages of behavioral therapy are that it is not readily available, adds initial cost to treatment, and requires parents to invest more time at the beginning of intervention. But behavioral therapy reduces costs over time, enhances ADHD pharmacotherapy, often reduces the need for higher dosing, reduces visits to the doctor’s office, maintains behavior improvement and symptom reduction in the long term, and significantly increases quality of care.42
A RECOMMENDED ADHD CARE PATH
How do we increase quality of care, reduce costs, and improve value of care for patients with ADHD? The treatment of ADHD as a chronic condition is collaborative. Several practices may be combined in a quality care path.
Follow up more frequently at the start of drug treatment
Physicians may give more frequent attention to the process of pharmacotherapy at the start of treatment. Pharmacotherapy is typically introduced by the prescribe-and-wait method, which often produces less than optimal dosing, limited treatment adherence, and inconsistent outcomes.45,46 Though the cost of giving a prescription is low, the cost for unsustained treatment is high, and this undermines the usefulness of medical therapy. The simple solution is systematic titration through frequent contact between the prescribing physician and the parents in the first few weeks of pharmacotherapy. Subsequent ongoing monitoring of adherence in the first year is likely to reduce costs over time.47
Achieve optimal dosing
Pharmacotherapy should be applied with a plan in mind to produce evidence that optimal dosing has been achieved, ie, improvement is consistently observed in school and home.48
If side effects occur, parents and physician must determine whether they outweigh the benefits. If the benefits outweigh the side effects, then the physician and parents should maintain treatment and manage side effects accordingly. If the side effects outweigh the benefits, the titration process should continue with different dosing or delivery until optimal dosing is achieved or until the physician determines that pharmacotherapy is no longer appropriate.
Though different procedures to measure optimal dosing are available, medication effectiveness can be determined in 7-day-per-dose exposure during a period when the child’s schedule is consistent. A consistent schedule is important, as medicine effects are difficult to determine during loosely defined schedules such as during school vacations or holidays. Involving multiple observers is important as well. Teachers, for example, are rarely consulted during titration49 though they are excellent observers and are with the child daily when medication is most effective.
Integrate behavioral therapy
Given the evidence that behavioral intervention enhances drug therapy,50 behavioral therapy should be integrated with drug therapy to create an inclusive context for change. Behavioral therapy is delivered in a variety of ways including individual and group parent training, home management consultation, daily school report cards, behavioral coaching, classroom behavior management, and peer interventions. Behavioral intervention enhances stimulant effectiveness51 to improve compliance, on-task behavior, academic performance, social relationships and family functioning.52
Behavioral therapy is now generally included in health insurance coverage. In addition, many clinics now offer shared medical appointments that combine close monitoring of drug therapy with behavioral coaching to small groups of parents in order to manage symptoms of ADHD at a minimal cost.
Measure outcomes
Measuring outcomes of ADHD treatment over time improves care. The primary care physician may use electronic medical record data management to track a patient’s progress related to ADHD features. The Clinical Global Improvement scale is a 7-point assessment that is easily done by parents and the physician at well visits and is ubiquitous in ADHD clinical trials.53 Change over time indicates when to suggest changes in treatment.
Finally, clinicians can demonstrate that appropriate, comprehensive care does not simply relieve ADHD symptoms, but also promotes quality of life. Healthcare providers can guide parents to improve existing abilities in children rather than leave parents with the notion that something is wrong with their child.
For example, research suggests that some patients with ADHD show enhanced creativity54,55; cognitive profiles with abilities in logical thinking, reasoning, and common sense56; and the capacity for intense focus in areas of interest.57 Some authors have even speculated that historical figures such as Thomas Edison and Albert Einstein would have been diagnosed with ADHD by today’s standards.58
MEETING THE DEMANDS OF AFFORDABLE CARE
Many children and youth diagnosed with ADHD still receive no or insufficient pharmacotherapy and behavioral therapy. More than one-third of children reported by their parents as not receiving treatment were also reported to have moderate or severe ADHD.59,60
At the same time, though more children today are being prescribed pharmacotherapy when ADHD is diagnosed, physician involvement is often limited during titration,7 and treatment usually consists of reducing symptoms without increasing adaptive behaviors with behavioral therapy.45 In addition, even though ADHD symptoms initially improve with pharmacotherapy, improvement is not sustained because of poor adherence.
The healthcare costs of ADHD are high because impairment extends beyond the patient to disrupt family life and even the workplace, as parents take time off to manage children. Because of uncertain costs of quality treatment, the best-practice treatment option for ADHD—ie, combined behavioral therapy and medicine—is increasingly accessible but still not as widely accessible as medication treatment. The value of care improves slowly while the number of patients continues to increase. However, caregivers have the opportunity to add value to the treatment of ADHD.
When we improve medication management, improve adherence to treatment, combine behavioral therapy and pharmacotherapy, consistently measure outcomes, and recognize positive traits of ADHD in our patients, we may turn the demands of affordable care into a breakthrough for many who live with the condition.
Acknowledgment: The authors wish to thank Ralph D’Alessio, BA, for his services in reference review and for his conscientious participation in the Cleveland Clinic Medication Monitoring Clinic, ADHD Center for Evaluation and Treatment.
References
Rostain A, Jensen PS, Connor DF, Miesle LM, Faraone SV. Toward quality care in ADHD: defining the goals of treatment. J Atten Disord 2015; 19:99–117.
Visser SN, Danielson ML, Bitsko RH, et al. Trends in the parent-report of health care provider-diagnosed and medicated attention-deficit/hyperactivity disorder: United States, 2003-2011. J Am Acad Child Adolesc Psychiatry 2014; 53:34–46.e2.
Visser SN, Blumberg SJ, Danielson ML, Bitsko RH, Kogan MD. State-based and demographic variation in parent-reported medication rates for attention-deficit/hyperactivity disorder, 2007–2008. Prev Chronic Dis 2013; 10:E09.
Skounti M, Philalithis A, Galanakis E. Variations in prevalence of attention deficit hyperactivity disorder worldwide. Eur J Pediatr 2007; 166:117–123.
Thomas R, Sanders S, Doust J, Beller E, Glasziou P. Prevalence of attention-deficit/hyperactivity disorder: a systematic review and meta-analysis. Pediatrics 2015; 135:e994–1001.
McKeown RE, Holbrook JR, Danielson ML, Cuffe SP, Wolraich ML, Visser SN. The impact of case definition on attention-deficit/hyperactivity disorder prevalence estimates in community-based samples of school-aged children. J Am Acad Child Adolesc Psychiatry 2015; 54:53–61.
Epstein JN, Kelleher KJ, Baum R, et al. Variability in ADHD care in community-based pediatrics. Pediatrics 2014; 134:1136–1143.
American Psychiatric Association. Diagnostic and Statistical Manual of Mental Disorders, Fifth Edition. Arlington VA: American Psychiatric Association Publishing, 2013.
Doshi JA, Hodgkins P, Kahle J, et al. Economic impact of childhood and adult attention-deficit/hyperactivity disorder in the United States. J Am Acad Child Adolesc Psychiatry 2012; 51:990–1002.e2.
Abright AR. Estimating the costs of attention-deficit/hyperactivity disorder. J Am Acad Child Adolesc Psychiatry 2012; 51:987–989.
Birnbaum HG, Kessler RC, Lowe SW, et al. Costs of attention deficit-hyperactivity disorder (ADHD) in the US: excess costs of persons with ADHD and their family members in 2000. Curr Med Res Opin 2005; 21:195–206.
de Graaf R, Kessler RC, Fayyad J, et al. The prevalence and effects of adult attention-deficit/hyperactivity disorder (ADHD) on the performance of workers: results from the WHO World Mental Health Survey Initiative. Occup Environ Med 2008; 65:835–842.
Garfield CF, Dorsey ER, Zhu S, et al. Trends in attention deficit hyperactivity disorder ambulatory diagnosis and medical treatment in the United States, 2000–2010. Acad Pediatr 2012; 12:110–116.
Subcommittee on Attention-Deficit/Hyperactivity Disorder, Steering Committee on Quality Improvement and Management, Wolraich M, Brown L, Brown RT, et al. ADHD: clinical practice guideline for the diagnosis, evaluation, and treatment of attention-deficit/hyperactivity disorder in children and adolescents. Pediatrics 2011; 128:1007–1022.
Schwarz A. The selling of attention deficit disorder. New York Times December 14, 2013:A1.
Manos MJ, Tom-Revzon C, Bukstein OG, Crismon ML. Changes and challenges: managing ADHD in a fast-paced world. J Manag Care Pharm 2007; 13(suppl B):S2–S16.
Rapport MD, Denney C. Titrating methylphenidate in children with attention-deficit/hyperactivity disorder: is body mass predictive of clinical response? J Am Acad Child Adolesc Psychiatry 1997; 36:523–530.
Sandler A, Glesne C, Geller G. Children’s and parents’ perspectives on open-label use of placebos in the treatment of ADHD. Child Care Health Dev 2008; 34:111–120.
Faraone SV, Buitelaar J. Comparing the efficacy of stimulants for ADHD in children and adolescents using meta-analysis. Eur Child Adolesc Psychiatry 2010; 19:353–364.
Adler LD, Nierenberg AA. Review of medication adherence in children and adults with ADHD. Postgrad Med 2010; 122:184–191.
McCarthy S, Asherson P, Coghill D, et al. Attention-deficit hyperactivity disorder: treatment discontinuation in adolescents and young adults. Br J Psychiatry 2009; 194:273–277.
Bussing R, Narwaney KJ, Winterstein AG, et al. Pharmacotherapy for incident attention-deficit/hyperactivity disorder: practice patterns and quality metrics. Curr Med Res Opin 2014; 30:1687–1699.
O’Callaghan P. Adherence to stimulants in adult ADHD. Atten Defic Hyperact Disord 2014; 6:111–120.
Toomey SL, Sox CM, Rusinak D, Finkelstein JA. Why do children with ADHD discontinue their medication? Clin Pediatr (Phila) 2012; 51:763–769.
Bussing R, Koro-Ljungberg M, Noguchi K, Mason D, Mayerson G, Garvan CW. Willingness to use ADHD treatments: a mixed methods study of perceptions by adolescents, parents, health professionals and teachers. Soc Sci Med 2012; 74:92–100.
Schoenfelder EN, Sasser T. Skills versus pills: psychosocial treatments for ADHD in childhood and adolescence. Pediatr Ann 2016; 45:e367–e372.
López FA, Leroux JR. Long-acting stimulants for treatment of attention-deficit/hyperactivity disorder: a focus on extended-release formulations and the prodrug lisdexamfetamine dimesylate to address continuing clinical challenges. Atten Defic Hyperact Disord 2013; 5:249–265.
Atzori P, Usala T, Carucci S, Danjou F, Zuddas A. Predictive factors for persistent use and compliance of immediate-release methylphenidate: a 36-month naturalistic study. J Child Adolesc Psychopharmacol 2009; 19:673–681.
Yule AM, Martelon M, Faraone SV, Carrellas N, Wilens TE, Bierderman J. Examining the association between attention deficit hyperactivity disorder and substance use disorders: a familial risk analysis. J Psychiatr Res 2017; 85:49–55.
Hauk L. AAP releases guideline on diagnosis, evaluation, and treatment of ADHD. Am Fam Physician 2013; 87:61–62.
Arnold LE, Abikoff HB, Cantwell DP, et al. National Institute of Mental Health collaborative multimodal treatment study of children with ADHD (the MTA). Design challenges and choices. Arch Gen Psychiatry 1997; 54:865–870.
Greenhill LL, Abikoff HB, Arnold LE, et al. Medication treatment strategies in the MTA study: relevance to clinicians and researchers. J Am Acad Child Adolesc Psychiatry 1996; 35:1304–1313.
Richters JE, Arnold LE, Jensen PS, et al. NIMH collaborative multisite multimodal treatment study of children with ADHD: I. Background and rationale. J Am Acad Child Adolesc Psychiatry 1995; 34:987–1000.
Manos MJ, Caserta DA, Short EJ, et al. Evaluation of the duration of action and comparative effectiveness of lisdexamfetamine dimesylate and behavioral treatment in youth with ADHD in a quasi-naturalistic setting. J Atten Disord 2015; 19:578–590.
Evans SW, Owens JS, Bunford N. Evidence-based psychosocial treatments for children and adolescents with attention-deficit/hyperactivity disorder. J Clin Child Adolesc Psychol 2014; 43:527–551.
Visser SN, Danielson ML, Wolraich ML, et al. Vital signs: national and state-specific patterns of attention deficit/hyperactivity disorder treatment among insured children aged 2–5 years—United States, 2008-2014. MMWR Morb Mortal Wkly Rep 2016; 65:443–450.
Pelham WE Jr, Fabiano GA, Waxmonsky JG, et al. Treatment sequencing for childhood ADHD: a multiple-randomization study of adaptive medication and behavioral interventions. J Clin Child Adolesc Psychol 2016; 45:396–415.
Page TF, Pelham WE 3rd, Fabiano GA, et al. Comparative cost analysis of sequential, adaptive, behavioral, pharmacological, and combined treatments for childhood ADHD. J Clin Child Adolesc Psychol 2016; 45:416–427.
Fabiano GA, Schatz NK, Pelham WE Jr. Summer treatment programs for youth with ADHD. Child Adolesc Psychiatr Clin N Am 2014; 23:757–773.
Pelham WE, Burrows-MacLean L, Gnagy EM, et al. A dose-ranging study of behavioral and pharmacological treatment in social settings for children with ADHD. J Abnorm Child Psychol 2014; 42:1019–1031.
Fabiano GA, Pelham WE Jr, Gnagy EM, et al. The single and combined effects of multiple intensities of behavior modification and methylphenidate for children with attention deficit hyperactivity disorder in a classroom setting. School Psychology Rev 2007; 36:195–216.
Reeves G, Anthony B. Multimodal treatments versus pharmacotherapy alone in children with psychiatric disorders: implications of access, effectiveness, and contextual treatment. Paediatr Drugs 2009; 11:165–169.
Hinshaw SP. Moderators and mediators of treatment outcome for youth with ADHD: understanding for whom and how interventions work. J Pediatr Psychol 2007; 32:664–675.
Hayes SC, Villatte M, Levin M, Hildebrandt M. Open, aware, and active: contextual approaches as an emerging trend in the behavioral and cognitive therapies. Annu Rev Clin Psychol 2011; 7:141–168.
Epstein JN, Langberg JM, Lichtenstein PK, et al. Attention-deficit/hyperactivity disorder outcomes for children treated in community-based pediatric settings. Arch Pediatr Adolesc Med 2010; 164:160–165.
Manos MJ. Pharmacologic treatment of ADHD: road conditions in driving patients to successful outcomes. Medscape J Med 2008; 10:5.
Braun S, Russo L, Zeidler J, Linder R, Hodgkins P. Descriptive comparison of drug treatment-persistent, -nonpersistent, and nondrug treatment patients with newly diagnosed attention deficit/hyperactivity disorder in Germany. Clin Ther 2013; 35:673–685.
Pliszka SR, Crismon ML, Hughes CW, et al; Texas Consensus Conference Panel on Pharmacotherapy of Childhood Attention Deficit Hyperactivity Disorder. The Texas Children’s Medication Algorithm Project: revision of the algorithm for pharmacotherapy of attention-deficit/hyperactivity disorder. J Am Acad Child Adolesc Psychiatry 2006; 45:642–657.
Pelham WE Jr, Fabiano GA, Massetti GM. Evidence-based assessment of attention deficit hyperactivity disorder in children and adolescents. J Clin Child Adolesc Psychol 2005; 34:449–476.
Fabiano GA, Pelham WE Jr, Coles EK, Gnagy EM, Chronis-Tuscano A, O’Connor BC. A meta-analysis of behavioral treatments for attention-deficit/hyperactivity disorder. Clin Psychol Rev 2009; 29:129–140.
Pelham WE Jr, Fabiano GA. Evidence-based psychosocial treatments for attention-deficit/hyperactivity disorder. J Clin Child Adolesc Psychol 2008; 37:184–214.
Knight LA, Rooney M, Chronis-Tuscano A. Psychosocial treatments for attention-deficit/hyperactivity disorder. Curr Psychiatry Rep 2008; 10:412–418.
Reimherr FW, Williams ED, Strong RE, Mestas R, Soni P, Marchant BK. A double-blind, placebo-controlled, crossover study of osmotic release oral system methylphenidate in adults with ADHD with assessment of oppositional and emotional dimensions of the disorder. J Clin Psychiatry 2007; 68:93–101.
Healey D, Rucklidge JJ. An investigation into the relationship among ADHD symptomatology, creativity, and neuropsychological functioning in children. Child Neuropsychol 2006; 12:421–438.
Abraham A, Windmann S, Siefen R, Daum I, Güntürkün O. Creative thinking in adolescents with attention deficit hyperactivity disorder (ADHD). Child Neuropsychol 2006; 12:111–123.
Ek U, Fernell E, Westerlund J, Holmberg K, Olsson PO, Gillberg C. Cognitive strengths and deficits in schoolchildren with ADHD. Acta Paediatr 2007; 96:756–761.
Ozel-Kizil ET, Kokurcan A, Aksoy UM, et al. Hyperfocusing as a dimension of adult attention deficit hyperactivity disorder. Res Dev Disabil 2016; 59:351–358.
Hartmann T. ADD Success Stories: A Guide to Fulfillment for Families With Attention Deficit Disorder. Nevada City, CA: Underwood Books, 1995.
Visser SN, Lesesne CA, Perou R. National estimates and factors associated with medication treatment for childhood attention-deficit/hyperactivity disorder. Pediatrics 2007; 119(suppl 1):S99–S106.
Michael J. Manos, PhD Head, Center for Pediatric Behavioral Health, Cleveland Clinic Children’s; Assistant Professor, Cleveland Clinic Lerner College of Medicine of Case Western Reserve University, Cleveland, OH
Kimberly Giuliano, MD General Pediatrics, Cleveland Clinic Children’s; Clinical Assistant Professor, Cleveland Clinic Lerner College of Medicine of Case Western Reserve University, Cleveland, OH
Eric Geyer, BA Center for Pediatric Behavioral Health, Cleveland Clinic Children’s
Address: Michael J. Manos, PhD, Center for Pediatric Behavioral Health, Cleveland Clinic Children’s, CR11, 2801 MLK Jr. Drive, Cleveland, OH 44104; [email protected]
Author and Disclosure Information
Michael J. Manos, PhD Head, Center for Pediatric Behavioral Health, Cleveland Clinic Children’s; Assistant Professor, Cleveland Clinic Lerner College of Medicine of Case Western Reserve University, Cleveland, OH
Kimberly Giuliano, MD General Pediatrics, Cleveland Clinic Children’s; Clinical Assistant Professor, Cleveland Clinic Lerner College of Medicine of Case Western Reserve University, Cleveland, OH
Eric Geyer, BA Center for Pediatric Behavioral Health, Cleveland Clinic Children’s
Address: Michael J. Manos, PhD, Center for Pediatric Behavioral Health, Cleveland Clinic Children’s, CR11, 2801 MLK Jr. Drive, Cleveland, OH 44104; [email protected]
Pharmacotherapy and behavioral therapy are currently used with success in treating attention-deficit/hyperactivity disorder (ADHD) in children, adolescents, and adults. Ongoing changes in healthcare require physicians to improve the quality of care, reduce costs of treatment, and manage their patients’ health, not just their illnesses. Behavioral and pharmacologic studies provide us with an opportunity to maximize treatment of ADHD and adapt it to the needs of individuals.
This article identifies common problems in treating ADHD, discusses limits of care in pharmacotherapy and behavioral intervention, and offers practical recommendations for treating ADHD in the changing world of healthcare.
A CHANGING MEDICAL CLIMATE
The Affordable Care Act of 2010 sought to transform medical care in the United States from procedures to performance, from acute episodes of illness to integrated care across the lifespan, and from inefficient care to efficient and affordable care with measurable outcomes. At the time of this writing, nobody knows whether the Affordable Care Act will survive, but these are still good goals. Because ADHD is the most common behavioral disorder of childhood, value-based care is essential.1
ADHD ON THE RISE—WHY?
The prevalence of ADHD increased 42% from 2003 to 2011,2 with increases in nearly all demographic groups in the United States regardless of race, sex, and socioeconomic status. More than 1 in 10 school-age children (11%) in the United States now meet the criteria for the diagnosis of ADHD; among adolescents, 1 in 5 high school boys and 1 in 11 high school girls meet the criteria.2
Rates vary among states, from a low of 4.2% for children ages 4 to 17 in Nevada to a high of 14.6% in Arkansas.3 Worldwide estimates of ADHD prevalence range from 2.2% to 17.8%,4 with the most recent meta-analysis for North America and Europe indicating a 7.2% worldwide prevalence in people age 18 and younger.5
Such data have sparked criticism, with some saying that ADHD is overdiagnosed, others saying it is underdiagnosed, and most agreeing that it is misdiagnosed.
Changing definitions of ADHD may have had a small effect on the increase in prevalence,6 but the change is more likely a result of heightened awareness and recognition of symptoms. Even so, guidelines for diagnosing ADHD are still not rigorously applied, contributing to misdiagnosis. For example, in a study of 50 pediatric practices, only half of clinicians said they followed diagnostic guidelines to determine symptom criteria from at least 2 sources and across 2 settings, yet nearly all (93%) reported immediately prescribing medications for treatment.7
The Diagnostic and Statistical Manual of Mental Disorders, Fifth Edition,8 requires evidence of a persistent pattern of inattention or hyperactivity/impulsivity, or both, with a severity that interferes with developmental functioning in 2 or more settings; was present before age 12; and cannot be accounted for by another behavioral health disorder such as depression, anxiety, or trauma. The diagnosis should document the presence of at least 6 of 9 symptoms of inattention (or 5 symptoms for teens age 17 or older), or at least 6 of 9 symptoms of hyperactive/impulsive behavior (5 symptoms for teens age 17 and older). Symptoms are best documented when reported by at least 2 observers.
COSTS OF ADHD
ADHD is expensive to society. National yearly healthcare costs have ranged from $143 billion to $266 billion,9 with over half this amount assumed directly by families.10 Even in previous decades when prevalence rates hovered around 5%, the cost of workday loss in the United States was high for adult patients and for parents of young children with ADHD needing to take time off from work for doctors’ visits.11 Projections across 10 countries indicated that adults with ADHD lost more workdays than did workers without ADHD.12
There is also a trend toward visits that are more expensive. Between 2000 and 2010, the number of visits for ADHD to psychiatrists rose from 24% to 36%, while the number of less-costly visits to pediatricians decreased from 54% to 47%.13
Thus, over the past 15 years, symptoms of ADHD have become more readily recognized, prevalence rates in the population have increased significantly, and associated costs have increased dramatically, with costs extending beyond individual impairment to a loss of productivity at the workplace. And treatment, typically with drugs, has been used without sufficient application of current diagnostic criteria. What impact does this have on the practicing physician?
DRUG TREATMENT: GOLD STANDARD OR NATIONAL DISASTER?
Stimulants are considered the standard of medical care for the symptoms of ADHD, according to the 2011 practice guidelines of the American Academy of Pediatrics.14 They are efficacious and cost-effective when optimal dosing is achieved, since the patient usually manages treatment independently, requiring minimal physician input in the months and years after successful titration.
For these reasons, the use of stimulants to treat ADHD has increased dramatically in the last decade. According to the National Survey of Children’s Health, as a result of an increase in parent-reported ADHD, more US children were receiving medical treatment for the disorder in 2011 than in any previous year reported, and the prevalence of pharmacotherapy in children ages 14 to 17 increased 28% over the 4 years from 2007 to 2011.2
Dr. Keith Conners, an early advocate for recognition of ADHD, has called the staggering increase in the rates of diagnosis and drug treatment a “national disaster of dangerous proportions.”15 Nevertheless, many children and families have benefited in a cost-effective manner.
STRATEGIES FOR TITRATION
Physicians typically rely on 4 strategies to titrate stimulants,16 presented below in order of increasing complexity.
Prescribe-and-wait
Often, physicians write a prescription and direct the parent to call back or visit the office to relay the child’s response after a specified period, typically 1 week to 1 month.
This method is convenient in a busy practice and is informative to the physician in a general way. The drawback to this method is that it seldom results in optimal treatment. If the parent does not call back, the physician may assume the treatment was successful without being certain.
Dose-to-improvement
In this approach, the physician monitors titration more closely and increases the dose until a positive response is achieved, after which the dose is maintained. This method reduces symptoms but does not ensure optimal treatment, as there still may be room for improvement.
Forced-dose titration
This method is often used in clinical trials. The dose is ramped up until side effects occur and is then reduced until the side effects go away.
This method often results in optimal dosing, as a forced dose yields a greater reduction in symptoms. But it requires close monitoring by the physician, with multiple reports from parents and teachers after each dose increase to determine whether benefit at the higher dose outweighs the side effects and whether side effects can be managed.
Blinded placebo trial
Also often used in research, this method typically requires a research pharmacy to prepare capsules of stimulant medicine in low, moderate, high, and placebo doses.17 All doses are blinded and given over 4 weeks in a forced-dose titration—a placebo capsule with 3 active medication doses in escalating order, which is typical of outpatient pediatric practice. Placebo capsules are randomly assigned to 1 of the 4 weeks, and behavior is monitored over the 7 days of administration by teachers and parents.
This strategy has benefits similar to those of forced-dose titration, and it further delineates medicine response—both side effects and behavior change—by adding a no-medicine placebo condition. It is a systematic, monitored “experiment” for parents who are wary or distrustful of ADHD pharmacotherapy, and it has notable benefits.18 It is also useful for teenagers who are reluctant to use medicine to treat symptoms. It arrives at optimal treatment in a timely manner, usually about 4 to 5 weeks.
On the other hand, this approach requires diligence from families, teachers, and caregivers during the initiation phase, and it requires consistent engagement of the physician team.
Some pediatricians designate a caregiver to monitor titration with the parent; with each new weekly dose, the caregiver reports the child’s progress to the physician.
ENSURING ADHERENCE
Essential to effective stimulant treatment for ADHD is not whether the medicine works (it does),19 but whether the patient continues to use it.
In treatment studies and pharmacy database analyses, rates of inconsistent use or discontinuation of medication (both considered nonadherence) were 13.2% to 64% within the first year,20 and more than 95% of teenagers discontinue pharmacotherapy before age 21.21
Clinician engagement at the onset of stimulant titration is instrumental to treatment adherence.22,23 When pharmacotherapy is loosely monitored during initiation, adherence is highly inconsistent. Some physicians wait as long as 72 days after first prescribing a medication to contact the patient or family,7 and most children with ADHD who discontinue their medications do so within the first year.24
FACTORS THAT INHIBIT ADHERENCE
What factors inhibit adherence to successful pharmacotherapy for ADHD?
Treatment nonadherence is often associated with a parent’s perception that the medication is not working.25 Physicians can often overcome this perception by speaking with the parent, conveying that at the start of treatment titrating to the optimal dose takes time, and that it does not mean “something is wrong.” But without physician contact, parents do not have the occasion to discuss side effects and benefits and tend not to voice fears such as whether the medicine will affect the child’s physical development or result in drug abuse later in life.26
At the beginning of treatment, a child may become too focused, alarming the parent. This overfocused effect is often misunderstood and does not always persist. In addition, when a child better manages his or her own behavior, the contrast to previous behavior may look like something is wrong, when instead the child’s behavior is actually normalizing. Medicine-induced anxiety—in the child or, by association, in the parent—may be misunderstood, and subsequently the parent just stops the child’s treatment rather than seek physician guidance.
Nonadherence is also more prevalent with immediate-release than with extended-release formulations.27,28
Problems can be summarized as follows7:
Systematic physician observation of response to stimulant titration is often missing at the onset of treatment
“Best dose” is inconsistently achieved
Patient adherence to treatment is inconsistently monitored.
The long-term consequences of nonadherence to therapy for ADHD have not been sufficiently examined,20 but some groups, especially adolescents, show problematic outcomes when treatment is not applied. For example, in one longitudinal study, substance use disorder was significantly higher in youths with ADHD who were never treated with medicine than in “neurotypical” youths and those with ADHD who were treated pharmacologically.29
BEHAVIORAL INTERVENTION
Although opinions vary as to the advantages of drug therapy vs behavioral intervention in ADHD, there is evidence that a combined approach is best.30–33 Pharmacotherapy works inside the skin to reduce symptoms of inattention and overactivity, and behavioral therapy works outside the skin to teach new skills.
Based on outcomes data from the Center for Pediatric Behavioral Health, Cleveland Clinic Children’s.
Figure 1. Points earned represent positive behaviors exhibited during 7-week summer treatment programs held from 2000 to 2013. Data are aggregated to show the positive behavior change for boys and girls across cohorts.Studies have shown evidence of benefits of behavioral therapy distinct from those of pharmacotherapy.34,35 Results of summer treatment programs in the United States and Japan for children ages 6 to 14 have replicated the findings of a US National Institute of Mental Health study that showed that the programs improved performance and resulted in positive behavior changes (Figure 1).
A report from the US Centers for Disease Control and Prevention in 2016 stated that behavioral therapy should be the first treatment for young children with ADHD (ages 2 to 5), but noted that only 40% to 50% of young children with ADHD receive psychological services.36 At the same time, the use of pharmacotherapy has increased tremendously.
Beginning treatment with behavioral therapy rather than medicine has been found to be more cost-effective over time. For children ages 4 to 5, behavioral therapy is recommended as the first line by the clinical practice guidelines of the American Academy of Pediatrics.14 Beginning treatment with behavioral intervention has been shown to produce better outcomes overall than beginning with medication and indicates that lower doses may be used compared with pharmacotherapy that is not preceded by behavioral therapy.37 Findings also indicate that starting with behavioral therapy increases the cost-effectiveness of treatment for children with ADHD.38
Figure 2. In 2 dose-ranging studies of combined drug and behavioral therapy, low- to high-intensity behavioral therapy reduced targeted behaviors at lower drug dosages. Behaviors measured were noncompliance with directives and violations of classroom rules during daily activity in a summer camp.In the long term, combination therapy leads to better outcomes38 and enables the use of lower medication dosages to achieve results similar to those with drug therapy alone (Figure 2).39–41
Behavioral intervention has modest advantages over medicine for non-ADHD symptoms,42 as the practice satisfies the adage “pills don’t teach skills.”26 One advantage is that caregivers take an active role in managing child compliance, social interactions, and classroom deportment, as opposed to the relatively passive role of prescribing medicine only. Parents and teachers form collaborative partnerships to increase consistency and extend the reach of change. In the National Institute of Mental Health multimodal treatment study, the only children whose behavior normalized were those who used medicine and whose caregivers gave up negative, harsh, inconsistent, and ineffective discipline43; that is, parents changed their own behavior.
Parent training is important, as parents must often manage their children’s behavior on their own the best they can, with little coaching and assistance. Primary care physicians may often refer parents to established local programs for training, and ongoing coaching can ensure that skills acquired in such training programs continue to be systematically applied. Pharmacotherapy is focused almost solely on reducing symptoms, but reducing symptoms does not necessarily lead to improved functioning. A multimodal approach helps individuals adapt to demanding settings, achieve personal goals, and contribute to social relationships. Outcomes depend on teaching what to do as well as reducing what not to do. Behavioral therapy44 shaped by peers, caregivers, teachers, and other factors can be effectively remediate the difficulties of children with ADHD.
The disadvantages of behavioral therapy are that it is not readily available, adds initial cost to treatment, and requires parents to invest more time at the beginning of intervention. But behavioral therapy reduces costs over time, enhances ADHD pharmacotherapy, often reduces the need for higher dosing, reduces visits to the doctor’s office, maintains behavior improvement and symptom reduction in the long term, and significantly increases quality of care.42
A RECOMMENDED ADHD CARE PATH
How do we increase quality of care, reduce costs, and improve value of care for patients with ADHD? The treatment of ADHD as a chronic condition is collaborative. Several practices may be combined in a quality care path.
Follow up more frequently at the start of drug treatment
Physicians may give more frequent attention to the process of pharmacotherapy at the start of treatment. Pharmacotherapy is typically introduced by the prescribe-and-wait method, which often produces less than optimal dosing, limited treatment adherence, and inconsistent outcomes.45,46 Though the cost of giving a prescription is low, the cost for unsustained treatment is high, and this undermines the usefulness of medical therapy. The simple solution is systematic titration through frequent contact between the prescribing physician and the parents in the first few weeks of pharmacotherapy. Subsequent ongoing monitoring of adherence in the first year is likely to reduce costs over time.47
Achieve optimal dosing
Pharmacotherapy should be applied with a plan in mind to produce evidence that optimal dosing has been achieved, ie, improvement is consistently observed in school and home.48
If side effects occur, parents and physician must determine whether they outweigh the benefits. If the benefits outweigh the side effects, then the physician and parents should maintain treatment and manage side effects accordingly. If the side effects outweigh the benefits, the titration process should continue with different dosing or delivery until optimal dosing is achieved or until the physician determines that pharmacotherapy is no longer appropriate.
Though different procedures to measure optimal dosing are available, medication effectiveness can be determined in 7-day-per-dose exposure during a period when the child’s schedule is consistent. A consistent schedule is important, as medicine effects are difficult to determine during loosely defined schedules such as during school vacations or holidays. Involving multiple observers is important as well. Teachers, for example, are rarely consulted during titration49 though they are excellent observers and are with the child daily when medication is most effective.
Integrate behavioral therapy
Given the evidence that behavioral intervention enhances drug therapy,50 behavioral therapy should be integrated with drug therapy to create an inclusive context for change. Behavioral therapy is delivered in a variety of ways including individual and group parent training, home management consultation, daily school report cards, behavioral coaching, classroom behavior management, and peer interventions. Behavioral intervention enhances stimulant effectiveness51 to improve compliance, on-task behavior, academic performance, social relationships and family functioning.52
Behavioral therapy is now generally included in health insurance coverage. In addition, many clinics now offer shared medical appointments that combine close monitoring of drug therapy with behavioral coaching to small groups of parents in order to manage symptoms of ADHD at a minimal cost.
Measure outcomes
Measuring outcomes of ADHD treatment over time improves care. The primary care physician may use electronic medical record data management to track a patient’s progress related to ADHD features. The Clinical Global Improvement scale is a 7-point assessment that is easily done by parents and the physician at well visits and is ubiquitous in ADHD clinical trials.53 Change over time indicates when to suggest changes in treatment.
Finally, clinicians can demonstrate that appropriate, comprehensive care does not simply relieve ADHD symptoms, but also promotes quality of life. Healthcare providers can guide parents to improve existing abilities in children rather than leave parents with the notion that something is wrong with their child.
For example, research suggests that some patients with ADHD show enhanced creativity54,55; cognitive profiles with abilities in logical thinking, reasoning, and common sense56; and the capacity for intense focus in areas of interest.57 Some authors have even speculated that historical figures such as Thomas Edison and Albert Einstein would have been diagnosed with ADHD by today’s standards.58
MEETING THE DEMANDS OF AFFORDABLE CARE
Many children and youth diagnosed with ADHD still receive no or insufficient pharmacotherapy and behavioral therapy. More than one-third of children reported by their parents as not receiving treatment were also reported to have moderate or severe ADHD.59,60
At the same time, though more children today are being prescribed pharmacotherapy when ADHD is diagnosed, physician involvement is often limited during titration,7 and treatment usually consists of reducing symptoms without increasing adaptive behaviors with behavioral therapy.45 In addition, even though ADHD symptoms initially improve with pharmacotherapy, improvement is not sustained because of poor adherence.
The healthcare costs of ADHD are high because impairment extends beyond the patient to disrupt family life and even the workplace, as parents take time off to manage children. Because of uncertain costs of quality treatment, the best-practice treatment option for ADHD—ie, combined behavioral therapy and medicine—is increasingly accessible but still not as widely accessible as medication treatment. The value of care improves slowly while the number of patients continues to increase. However, caregivers have the opportunity to add value to the treatment of ADHD.
When we improve medication management, improve adherence to treatment, combine behavioral therapy and pharmacotherapy, consistently measure outcomes, and recognize positive traits of ADHD in our patients, we may turn the demands of affordable care into a breakthrough for many who live with the condition.
Acknowledgment: The authors wish to thank Ralph D’Alessio, BA, for his services in reference review and for his conscientious participation in the Cleveland Clinic Medication Monitoring Clinic, ADHD Center for Evaluation and Treatment.
References
Rostain A, Jensen PS, Connor DF, Miesle LM, Faraone SV. Toward quality care in ADHD: defining the goals of treatment. J Atten Disord 2015; 19:99–117.
Visser SN, Danielson ML, Bitsko RH, et al. Trends in the parent-report of health care provider-diagnosed and medicated attention-deficit/hyperactivity disorder: United States, 2003-2011. J Am Acad Child Adolesc Psychiatry 2014; 53:34–46.e2.
Visser SN, Blumberg SJ, Danielson ML, Bitsko RH, Kogan MD. State-based and demographic variation in parent-reported medication rates for attention-deficit/hyperactivity disorder, 2007–2008. Prev Chronic Dis 2013; 10:E09.
Skounti M, Philalithis A, Galanakis E. Variations in prevalence of attention deficit hyperactivity disorder worldwide. Eur J Pediatr 2007; 166:117–123.
Thomas R, Sanders S, Doust J, Beller E, Glasziou P. Prevalence of attention-deficit/hyperactivity disorder: a systematic review and meta-analysis. Pediatrics 2015; 135:e994–1001.
McKeown RE, Holbrook JR, Danielson ML, Cuffe SP, Wolraich ML, Visser SN. The impact of case definition on attention-deficit/hyperactivity disorder prevalence estimates in community-based samples of school-aged children. J Am Acad Child Adolesc Psychiatry 2015; 54:53–61.
Epstein JN, Kelleher KJ, Baum R, et al. Variability in ADHD care in community-based pediatrics. Pediatrics 2014; 134:1136–1143.
American Psychiatric Association. Diagnostic and Statistical Manual of Mental Disorders, Fifth Edition. Arlington VA: American Psychiatric Association Publishing, 2013.
Doshi JA, Hodgkins P, Kahle J, et al. Economic impact of childhood and adult attention-deficit/hyperactivity disorder in the United States. J Am Acad Child Adolesc Psychiatry 2012; 51:990–1002.e2.
Abright AR. Estimating the costs of attention-deficit/hyperactivity disorder. J Am Acad Child Adolesc Psychiatry 2012; 51:987–989.
Birnbaum HG, Kessler RC, Lowe SW, et al. Costs of attention deficit-hyperactivity disorder (ADHD) in the US: excess costs of persons with ADHD and their family members in 2000. Curr Med Res Opin 2005; 21:195–206.
de Graaf R, Kessler RC, Fayyad J, et al. The prevalence and effects of adult attention-deficit/hyperactivity disorder (ADHD) on the performance of workers: results from the WHO World Mental Health Survey Initiative. Occup Environ Med 2008; 65:835–842.
Garfield CF, Dorsey ER, Zhu S, et al. Trends in attention deficit hyperactivity disorder ambulatory diagnosis and medical treatment in the United States, 2000–2010. Acad Pediatr 2012; 12:110–116.
Subcommittee on Attention-Deficit/Hyperactivity Disorder, Steering Committee on Quality Improvement and Management, Wolraich M, Brown L, Brown RT, et al. ADHD: clinical practice guideline for the diagnosis, evaluation, and treatment of attention-deficit/hyperactivity disorder in children and adolescents. Pediatrics 2011; 128:1007–1022.
Schwarz A. The selling of attention deficit disorder. New York Times December 14, 2013:A1.
Manos MJ, Tom-Revzon C, Bukstein OG, Crismon ML. Changes and challenges: managing ADHD in a fast-paced world. J Manag Care Pharm 2007; 13(suppl B):S2–S16.
Rapport MD, Denney C. Titrating methylphenidate in children with attention-deficit/hyperactivity disorder: is body mass predictive of clinical response? J Am Acad Child Adolesc Psychiatry 1997; 36:523–530.
Sandler A, Glesne C, Geller G. Children’s and parents’ perspectives on open-label use of placebos in the treatment of ADHD. Child Care Health Dev 2008; 34:111–120.
Faraone SV, Buitelaar J. Comparing the efficacy of stimulants for ADHD in children and adolescents using meta-analysis. Eur Child Adolesc Psychiatry 2010; 19:353–364.
Adler LD, Nierenberg AA. Review of medication adherence in children and adults with ADHD. Postgrad Med 2010; 122:184–191.
McCarthy S, Asherson P, Coghill D, et al. Attention-deficit hyperactivity disorder: treatment discontinuation in adolescents and young adults. Br J Psychiatry 2009; 194:273–277.
Bussing R, Narwaney KJ, Winterstein AG, et al. Pharmacotherapy for incident attention-deficit/hyperactivity disorder: practice patterns and quality metrics. Curr Med Res Opin 2014; 30:1687–1699.
O’Callaghan P. Adherence to stimulants in adult ADHD. Atten Defic Hyperact Disord 2014; 6:111–120.
Toomey SL, Sox CM, Rusinak D, Finkelstein JA. Why do children with ADHD discontinue their medication? Clin Pediatr (Phila) 2012; 51:763–769.
Bussing R, Koro-Ljungberg M, Noguchi K, Mason D, Mayerson G, Garvan CW. Willingness to use ADHD treatments: a mixed methods study of perceptions by adolescents, parents, health professionals and teachers. Soc Sci Med 2012; 74:92–100.
Schoenfelder EN, Sasser T. Skills versus pills: psychosocial treatments for ADHD in childhood and adolescence. Pediatr Ann 2016; 45:e367–e372.
López FA, Leroux JR. Long-acting stimulants for treatment of attention-deficit/hyperactivity disorder: a focus on extended-release formulations and the prodrug lisdexamfetamine dimesylate to address continuing clinical challenges. Atten Defic Hyperact Disord 2013; 5:249–265.
Atzori P, Usala T, Carucci S, Danjou F, Zuddas A. Predictive factors for persistent use and compliance of immediate-release methylphenidate: a 36-month naturalistic study. J Child Adolesc Psychopharmacol 2009; 19:673–681.
Yule AM, Martelon M, Faraone SV, Carrellas N, Wilens TE, Bierderman J. Examining the association between attention deficit hyperactivity disorder and substance use disorders: a familial risk analysis. J Psychiatr Res 2017; 85:49–55.
Hauk L. AAP releases guideline on diagnosis, evaluation, and treatment of ADHD. Am Fam Physician 2013; 87:61–62.
Arnold LE, Abikoff HB, Cantwell DP, et al. National Institute of Mental Health collaborative multimodal treatment study of children with ADHD (the MTA). Design challenges and choices. Arch Gen Psychiatry 1997; 54:865–870.
Greenhill LL, Abikoff HB, Arnold LE, et al. Medication treatment strategies in the MTA study: relevance to clinicians and researchers. J Am Acad Child Adolesc Psychiatry 1996; 35:1304–1313.
Richters JE, Arnold LE, Jensen PS, et al. NIMH collaborative multisite multimodal treatment study of children with ADHD: I. Background and rationale. J Am Acad Child Adolesc Psychiatry 1995; 34:987–1000.
Manos MJ, Caserta DA, Short EJ, et al. Evaluation of the duration of action and comparative effectiveness of lisdexamfetamine dimesylate and behavioral treatment in youth with ADHD in a quasi-naturalistic setting. J Atten Disord 2015; 19:578–590.
Evans SW, Owens JS, Bunford N. Evidence-based psychosocial treatments for children and adolescents with attention-deficit/hyperactivity disorder. J Clin Child Adolesc Psychol 2014; 43:527–551.
Visser SN, Danielson ML, Wolraich ML, et al. Vital signs: national and state-specific patterns of attention deficit/hyperactivity disorder treatment among insured children aged 2–5 years—United States, 2008-2014. MMWR Morb Mortal Wkly Rep 2016; 65:443–450.
Pelham WE Jr, Fabiano GA, Waxmonsky JG, et al. Treatment sequencing for childhood ADHD: a multiple-randomization study of adaptive medication and behavioral interventions. J Clin Child Adolesc Psychol 2016; 45:396–415.
Page TF, Pelham WE 3rd, Fabiano GA, et al. Comparative cost analysis of sequential, adaptive, behavioral, pharmacological, and combined treatments for childhood ADHD. J Clin Child Adolesc Psychol 2016; 45:416–427.
Fabiano GA, Schatz NK, Pelham WE Jr. Summer treatment programs for youth with ADHD. Child Adolesc Psychiatr Clin N Am 2014; 23:757–773.
Pelham WE, Burrows-MacLean L, Gnagy EM, et al. A dose-ranging study of behavioral and pharmacological treatment in social settings for children with ADHD. J Abnorm Child Psychol 2014; 42:1019–1031.
Fabiano GA, Pelham WE Jr, Gnagy EM, et al. The single and combined effects of multiple intensities of behavior modification and methylphenidate for children with attention deficit hyperactivity disorder in a classroom setting. School Psychology Rev 2007; 36:195–216.
Reeves G, Anthony B. Multimodal treatments versus pharmacotherapy alone in children with psychiatric disorders: implications of access, effectiveness, and contextual treatment. Paediatr Drugs 2009; 11:165–169.
Hinshaw SP. Moderators and mediators of treatment outcome for youth with ADHD: understanding for whom and how interventions work. J Pediatr Psychol 2007; 32:664–675.
Hayes SC, Villatte M, Levin M, Hildebrandt M. Open, aware, and active: contextual approaches as an emerging trend in the behavioral and cognitive therapies. Annu Rev Clin Psychol 2011; 7:141–168.
Epstein JN, Langberg JM, Lichtenstein PK, et al. Attention-deficit/hyperactivity disorder outcomes for children treated in community-based pediatric settings. Arch Pediatr Adolesc Med 2010; 164:160–165.
Manos MJ. Pharmacologic treatment of ADHD: road conditions in driving patients to successful outcomes. Medscape J Med 2008; 10:5.
Braun S, Russo L, Zeidler J, Linder R, Hodgkins P. Descriptive comparison of drug treatment-persistent, -nonpersistent, and nondrug treatment patients with newly diagnosed attention deficit/hyperactivity disorder in Germany. Clin Ther 2013; 35:673–685.
Pliszka SR, Crismon ML, Hughes CW, et al; Texas Consensus Conference Panel on Pharmacotherapy of Childhood Attention Deficit Hyperactivity Disorder. The Texas Children’s Medication Algorithm Project: revision of the algorithm for pharmacotherapy of attention-deficit/hyperactivity disorder. J Am Acad Child Adolesc Psychiatry 2006; 45:642–657.
Pelham WE Jr, Fabiano GA, Massetti GM. Evidence-based assessment of attention deficit hyperactivity disorder in children and adolescents. J Clin Child Adolesc Psychol 2005; 34:449–476.
Fabiano GA, Pelham WE Jr, Coles EK, Gnagy EM, Chronis-Tuscano A, O’Connor BC. A meta-analysis of behavioral treatments for attention-deficit/hyperactivity disorder. Clin Psychol Rev 2009; 29:129–140.
Pelham WE Jr, Fabiano GA. Evidence-based psychosocial treatments for attention-deficit/hyperactivity disorder. J Clin Child Adolesc Psychol 2008; 37:184–214.
Knight LA, Rooney M, Chronis-Tuscano A. Psychosocial treatments for attention-deficit/hyperactivity disorder. Curr Psychiatry Rep 2008; 10:412–418.
Reimherr FW, Williams ED, Strong RE, Mestas R, Soni P, Marchant BK. A double-blind, placebo-controlled, crossover study of osmotic release oral system methylphenidate in adults with ADHD with assessment of oppositional and emotional dimensions of the disorder. J Clin Psychiatry 2007; 68:93–101.
Healey D, Rucklidge JJ. An investigation into the relationship among ADHD symptomatology, creativity, and neuropsychological functioning in children. Child Neuropsychol 2006; 12:421–438.
Abraham A, Windmann S, Siefen R, Daum I, Güntürkün O. Creative thinking in adolescents with attention deficit hyperactivity disorder (ADHD). Child Neuropsychol 2006; 12:111–123.
Ek U, Fernell E, Westerlund J, Holmberg K, Olsson PO, Gillberg C. Cognitive strengths and deficits in schoolchildren with ADHD. Acta Paediatr 2007; 96:756–761.
Ozel-Kizil ET, Kokurcan A, Aksoy UM, et al. Hyperfocusing as a dimension of adult attention deficit hyperactivity disorder. Res Dev Disabil 2016; 59:351–358.
Hartmann T. ADD Success Stories: A Guide to Fulfillment for Families With Attention Deficit Disorder. Nevada City, CA: Underwood Books, 1995.
Visser SN, Lesesne CA, Perou R. National estimates and factors associated with medication treatment for childhood attention-deficit/hyperactivity disorder. Pediatrics 2007; 119(suppl 1):S99–S106.
Despite concerns about overdiagnosis and overtreatment, many children and youth diagnosed with ADHD still receive no treatment or insufficient treatment.
Today, more children are prescribed drug therapy when ADHD is diagnosed, but the initial titration of medication is often done without sufficient physician supervision.
ADHD symptoms improve with drug therapy, but improvement is inconsistently sustained due to poor treatment adherence.
Drug therapy and behavioral therapy work together. Outcomes can be determined by measuring both improved behaviors and reduced symptoms.
Editor’s note: This Medical Grand Rounds was presented as the 14th Annual Lawrence “Chris” Crain Memorial Lecture, a series that has been dedicated to discussing kidney disease, hypertension, and health care disparities in the African American community. In 1997, Dr. Crain became the first African American chief medical resident at Cleveland Clinic, and was a nephrology fellow in 1998–1999. Dr. Nally was his teacher and mentor.
African Americans have a greater burden of chronic kidney disease than whites. They are more than 3 times as likely as whites to develop end-stage renal disease, even after adjusting for age, disease stage, smoking, medications, and comorbidities. Why this is so has been the focus of much speculation and research.
This article reviews recent advances in the understanding of the progression of chronic kidney disease, with particular scrutiny of the disease in African Americans. Breakthroughs in genetics that help explain the greater disease burden in African Americans are also discussed, as well as implications for organ transplant screening.
ADVANCING UNDERSTANDING OF CHRONIC KIDNEY DISEASE
In the 1990s, dialysis rolls grew by 8% to 10% annually. Unfortunately, many patients first met with a nephrologist on the eve of their first dialysis treatment; there was not yet an adequate way to recognize the disease earlier and slow its progression. And disease definitions were not yet standardized, which led to inadequate metrics and hampered the ability to move disease management forward.
Standardizing definitions
The situation improved in 2002, when the National Kidney Foundation published clinical practice guidelines for chronic kidney disease that included disease definitions and staging.1 Chronic kidney disease was defined as a structural or functional abnormality of the kidney lasting at least 3 months, as manifested by either of the following:
Kidney damage, with or without decreased glomerular filtration rate (GFR), as defined by pathologic abnormalities or markers of kidney damage in the blood, urine, or on imaging tests
Figure 1. Prognosis of chronic kidney disease (CKD) by glomerular filtration rate (GFR) and albuminuria.GFR less than 60 mL/min/1.73 m2, with or without kidney damage.
A subsequent major advance was the recognition that not only GFR but also albuminuria was important for staging of chronic kidney disease (Figure 1).2
Developing large databases
Surveillance and monitoring of chronic kidney disease have generated large databases that enable researchers to detect trends in disease progression.
US Renal Data System. The US Renal Data System has collected and reported on data for more than 20 years from the National Health and Nutrition Examination Survey and the Centers for Medicare and Medicaid Services about chronic and end-stage kidney disease in the United States.
Cleveland Clinic database. Cleveland Clinic has developed a validated chronic kidney disease registry based on its electronic health record.3 The data include demographics (age, sex, ethnic group), comorbidities, medications, and complete laboratory data.4
Alberta Kidney Disease Network. This Canadian research consortium links large laboratory and demographic databases to facilitate defining patient populations, such as those with kidney disease and other comorbidities.
Kaiser Permanente Renal Registry. Kaiser Permanente of Northern California insures more than one-third of adults in the San Francisco Bay Area. The renal registry includes all adults whose kidney function is known. Data on age, sex, and racial or ethnic group are available from the health-plan databases.
DEATHS FROM KIDNEY DISEASE
The mortality rate in patients with end-stage renal disease who are on dialysis has steadily fallen over the past 20 years, from an annual rate of about 25% in 1996 to 17% in 2014, suggesting that care improved during that time. Patients with transplants have a much lower mortality rate: less than 5% annually.5 But these data also highlight the persistent risk faced by patients with chronic kidney disease; even those with transplants have death rates comparable to those of patients with cancer, diabetes, or heart failure.
Death rates correlate with GFR
After the publication of definitions and staging by the National Kidney Foundation in 2002, Go et al6 studied more than 1 million patients with chronic kidney disease from the Kaiser Permanente Renal Registry and found that the rates of cardiovascular events and death from any cause increased with decreasing estimated GFR. These findings were confirmed in a later meta-analysis, which also found that an elevated urinary albumin-to-creatinine ratio (> 1.1 mg/mmol) is an independent predictor of all-cause mortality and cardiovascular mortality.7
Keith et al8 followed nearly 28,000 patients with chronic kidney disease (with an estimated GFR of less than 90 mL/min/1.73 m2) over 5 years. Patients with stage 3 disease (moderate disease, GFR = 30–59 mL/min/1.73 m2) were 20 times more likely to die than to progress to end-stage renal disease (24.3% vs 1.2%). Even those with stage 4 disease (severe disease, GFR = 15–29 mL/min/1.73 m2) were more than twice as likely to die as to progress to dialysis (45.7% vs 19.9%).
Heart disease risk increases with declining kidney function
Navaneethan et al9 examined the leading causes of death between 2005 and 2009 in patients with chronic kidney disease in the Cleveland Clinic database, which included more than 33,000 whites and 5,000 African Americans. During a median follow-up of 2.3 years, 17% of patients died, with the 2 major causes being cardiovascular disease (35%) and cancer (32%) (Table 1). Interestingly, patients with fairly well-preserved kidney function (stage 3A) were more likely to die of cancer than heart disease. As kidney function declined, whether measured by estimated GFR or urine albumin-to-creatinine ratio, the chance of dying of cardiovascular disease increased.
Similar observations were made by Thompson et al10 based on the Alberta Kidney Disease Network database. They tracked cardiovascular causes of death and found that regardless of estimated GFR, cardiovascular deaths were most often attributed to ischemic heart disease (about 55%). Other trends were also apparent: as the GFR fell, the incidence of stroke decreased, and heart failure and valvular heart disease increased.
AFRICAN AMERICANS WITH KIDNEY DISEASE: A DISTINCT GROUP
African Americans constitute about 12% of the US population but account for:
31% of end-stage renal disease
34% of the kidney transplant waiting list
28% of kidney transplants in 2015 (12% of living donor transplants, 35% of deceased donor transplants).
In addition, African Americans with chronic kidney disease tend to be:
Younger and have more advanced kidney disease than whites11
Much more likely than whites to have diabetes, and somewhat more likely to have hypertension
Adapted from Navaneethan SD, Schold JD, Arrigain S, Jolly SE, Nally JV Jr. Cause-specific deaths in non-dialysis-dependent CKD. J Am Soc Nephrol 2015; 26:2512–2520.
Figure 2. Risk for all-cause and major cause-specific death in black vs white patients.More likely than whites to die of cardiovascular disease (37.4% vs 34.2%) (Figure 2).9
Overall, the prevalence of chronic kidney disease is slightly higher in African Americans than in whites. Interestingly, African Americans are slightly less likely than whites to have low estimated GFR values (6.2% vs 7.6% incidence of < 60 mL/min/1.73 m2) but are about 50% more likely to have proteinuria (12.3% vs 8.4% incidence of urine albumin-to-creatinine ratio ≥ 30 mg/g).
More likely to be on dialysis, but less likely to die
Although African Americans have only a slightly higher prevalence of chronic kidney disease (about 15% increased prevalence) than whites,12 they are 3 times more likely to be on dialysis.
Nevertheless, for unknown reasons, African American adults on dialysis have about a 26% lower all-cause mortality rate than whites.5 One proposed explanation for this survival advantage has been that the mortality rate in African Americans with chronic kidney disease before entering dialysis is higher than in whites, leading to a “healthier population” on dialysis.13 However, this theory is based on a small study from more than a decade ago and has not been borne out by subsequent investigation.
African Americans with chronic kidney disease: Death rates not increased
African Americans over age 65 with chronic kidney disease have all-cause mortality rates similar to those of whites: about 11% annually. Breaking it down by disease severity, death rates in stage 3 disease are about 10% and jump to more than 15% in higher stages in both African Americans and whites.5
However, African Americans with chronic kidney disease have more heart disease and much more end-stage renal disease than whites.
Disease advances faster despite care
The incidence of end-stage renal disease is consistently more than 3 times higher in African Americans than in whites in the United States.5,14
Multiple investigations have tried to determine why African Americans are disproportionately affected by progression of chronic kidney disease to end-stage renal disease. We recently examined this question in our Cleveland Clinic registry data. Even after adjusting for 17 variables (including demographics, comorbidities, insurance, medications, smoking, and chronic kidney disease stage), African Americans with chronic kidney disease were found to have an increased risk of progressing to end-stage renal disease compared with whites (subhazard ratio 1.38, 95% confidence interval 1.19–1.60).
We examined care measures from the Cleveland Clinic database. In terms of the number of laboratory tests ordered, clinic visits, and nephrology referrals, African Americans had at least as much care as whites, if not more. Similarly, African Americans’ access to renoprotective medicines (angiotensin-converting enzyme inhibitors, angiotensin II receptor blockers, statins, beta-blockers) was the same as or more than for whites.
Although the frequently attributed reasons surrounding compliance and socioeconomic issues are worthy of examination, they do not appear to completely explain the differences in incidence and outcomes. This dichotomy of a marginally increased prevalence of chronic kidney disease in African Americans with mortality rates similar to those of whites, yet with a 3 times higher incidence of end-stage renal disease in African Americans, suggests a faster progression of the disease in African Americans, which may be genetically based.
GENETIC VARIANTS FOUND
In 2010, two variant alleles of the APOL1 gene on chromosome 22 were found to be associated with nondiabetic kidney disease.15 Three nephropathies are associated with being homozygous for these alleles:
Focal segmental glomerulosclerosis, the leading cause of nephrotic syndrome in African Americans
Hypertension-associated kidney disease with scarring of glomeruli in vessels, the primary cause of end-stage renal disease in African Americans
Human immunodeficiency virus (HIV)- associated nephropathy, usually a focal segmental glomerulosclerosis type of lesion.
The first two conditions are about 3 to 5 times more prevalent in African Americans than in whites, and HIV-associated nephropathy is about 20 to 30 times more common.
African sleeping sickness and chronic kidney disease
Figure 3. Variants in the APOL1 gene that are common in sub-Saharan Africa protect against African sleeping sickness, but homozygosity for these variants increases the risk of chronic kidney disease.The APOL1 variants have been linked to protection from African sleeping sickness caused by Trypanosoma brucei, transmitted by the tsetse fly (Figure 3).16 The pathogen can infect people with normal APOL1 using a serum resistance-associated protein, while the mutant variants prevent or reduce protein binding. Having one variant allele confers protection against trypanosomiasis without leading to kidney disease; having both alleles with the variants protects against sleeping sickness but increases the risk of chronic kidney disease. About 15% of African Americans are homozygous for a variant.17
Retrospective analysis of biologic samples from trials of kidney disease in African Americans has revealed interesting results.
From Parsa A, Kao WH, Xie D, et al; AASK Study Investigators; CRIC Study Investigators. APOL1 risk variants, race, and progression of chronic kidney disease. N Engl J Med 2013; 369:2183–2196. Reprinted with permission from Massachusetts Medical Society.
Figure 4. Proportion of patients free from progression of chronic kidney disease, according to APOL1 genotype, in the African American Study of Kidney Disease and Hypertension. The primary outcome was reduction in the glomerular filtration rate (as measured by iothalamate clearance) or incident end-stage renal disease.The African American Study of Kidney Disease and Hypertension (AASK) trial18 evaluated whether tighter blood pressure control would improve outcomes. Biologic samples were available for DNA testing for 693 of the 1,094 trial participants. Of these, 23% of African Americans were found to be homozygous for a high-risk allele, and they had dramatically worse outcomes with greater loss of GFR than those with one or no variant allele (Figure 4). However, the impact of therapy (meeting blood pressure targets, treatment with different medications) did not differ between the groups.
The Chronic Renal Insufficiency Cohort (CRIC) observation study18 enrolled patients with an estimated GFR of 20 to 70 mL/min/1.73 m2, with a preference for African Americans and patients with diabetes. Nearly 3,000 participants had adequate samples for DNA testing. They found that African Americans with the double variant allele had worse outcomes, whether or not they had diabetes, compared with whites and African Americans without the homozygous gene variant.
Mechanism not well understood
The mechanism of renal injury is not well understood. Apolipoprotein L1, the protein coded for by APOL1, is a component of high-density lipoprotein. It is found in a different distribution pattern in people with normal kidneys vs those with nondiabetic kidney disease, especially in the arteries, arterioles, and podocytes.19,20 It can be detected in blood plasma, but levels do not correlate with kidney disease.21 Not all patients with the high-risk variant develop chronic kidney disease; a “second hit” such as infection with HIV may be required.
Investigators have recently developed knockout mouse models of APOL1-associated kidney diseases that are helping to elucidate mechanisms.22,23
EFFECT OF GENOTYPE ON KIDNEY TRANSPLANTS IN AFRICAN AMERICANS
African Americans receive about 30% of kidney transplants in the United States and represent about 15% to 20% of all donors.
Lee et al24 reviewed 119 African American recipients of kidney transplants, about half of whom were homozygous for an APOL1 variant. After 5 years, no differences were found in allograft survival between recipients with 0, 1, or 2 risk alleles.
However, looking at the issue from the other side, Reeves-Daniel et al25 studied the fate of more than 100 kidneys that were transplanted from African American donors, 16% of whom had the high-risk, homozygous genotype. In this case, graft failure was much likelier to occur with the high-risk donor kidneys (hazard ratio 3.84, P = .008). Similar outcomes were shown in a study of 2 centers26 involving 675 transplants from deceased donors, 15% of which involved the high-risk genotype. The hazard ratio for graft failure was found to be 2.26 (P = .001) with high-risk donor kidneys.
These studies, which examined data from about 5 years after transplant, found that kidney failure does not tend to occur immediately in all cases, but gradually over time. Most high-risk kidneys were not lost within the 5 years of the studies.
The fact that the high-risk kidneys do not all fail immediately also suggests that a second hit is required for failure. Culprits postulated include a bacterial or viral infection (eg, BK virus, cytomegalovirus), ischemia or reperfusion injury, drug toxicity, and immune-mediated allograft injury (ie, rejection).
Genetic testing advisable?
Genetic testing for APOL1 risk variants is on the horizon for kidney transplant. But at this point, providing guidance for patients can be tricky. Two case studies27,28 and epidemiologic data suggest that donors homozygous for an APOL1 variant and those with a family history of end-stage kidney disease are at increased risk of chronic kidney disease. Even so, most recipients even of these high-risk organs have good outcomes. If an African American patient needs a kidney and his or her sibling offers one, it is difficult to advise against it when the evidence is weak for immediate risk and when other options may not be readily available. Further investigation is clearly needed into whether APOL1 variants and other biomarkers can predict an organ’s success as a transplant.
The National Institutes of Health are currently funding prospective longitudinal studies with the APOL1 Long-term Kidney Transplantation Outcomes Network (APOLLO) to determine the impact of APOL1 genetic factors on transplant recipients as well as on living donors. Possible second hits will also be studied, as will other markers of renal dysfunction or disease in donors. Researchers are actively investigating these important questions.
KEEPING SCIENCE RELEVANT
In a recent commentary related to the murine knockout model of APOL1-associated kidney disease, O’Toole et al offered insightful observations regarding the potential clinical impact of these new genetic discoveries.23
As we study the genetics of kidney disease in African American patients, we should keep in mind 3 critical questions of clinical importance:
Will findings identify better treatments for chronic kidney disease? The AASK trial found that knowing the genetics did not affect outcomes of routine therapy. However, basic science investigations are currently underway targeting APOL1 variants which might reduce the increased kidney disease risk among people of African descent.
Should patients be genotyped for APOL1 risk variants? For patients with chronic kidney disease, it does not seem useful at this time. But for renal transplant donors, the answer is probably yes.
How does this discovery help us to understand our patients better? The implications are enormous for combatting the assumptions that rapid chronic kidney disease progression reflects poor patient compliance or other socioeconomic factors. We now understand that genetics, at least in part, drives renal disease outcomes in African American patients.
References
National Kidney Foundation. K/DOQI clinical practice guidelines for chronic kidney disease: evaluation, classification, and stratification. Am J Kidney Dis 2002; 39(suppl 1):S1–S266.
Levey AS, de Jong PE, Coresh J, et al. The definition, classification, and prognosis of chronic kidney disease: a KDIGO Controversies Conference report. Kidney Int 2011; 80:17–28.
Navaneethan SD, Jolly SE, Schold JD, et al. Development and validation of an electronic health record-based chronic kidney disease registry. Clin J Am Soc Nephrol 2011; 6:40–49.
Glickman Urological and Kidney Institute, Cleveland Clinic. 2015 Outcomes. P11.
United States Renal Data System. 2016 USRDS annual data report: Epidemiology of kidney disease in the United States. National Institutes of Health, National Institute of Diabetes and Digestive and Kidney Diseases, Bethesda, MD, 2016.
Go AS, Chertow GM, Fan D, McCulloch CE, Hsu CY. Chronic kidney disease and the risks of death, cardiovascular events, and hospitalization. N Engl J Med 2004; 351:1296–1305.
Chronic Kidney Disease Prognosis Consortium, Matsushita K, van der Velde M, Astor BC, et al. Association of estimated glomerular filtration rate and albuminuria with all-cause and cardiovascular mortality in general population cohorts: a collaborative meta-analysis. Lancet 2010; 375:2073–2081.
Keith D, Nichols GA, Gullion CM, Brown JB, Smith DH. Longitudinal follow-up and outcomes among a population with chronic kidney disease in a large managed care organization. Arch Intern Med 2004; 164:659–663.
Navaneethan SD, Schold JD, Arrigain S, Jolly SE, Nally JV Jr. Cause-specific deaths in non-dialysis-dependent CKD. J Am Soc Nephrol 2015; 26:2512–2520.
Thompson S, James M, Wiebe N, et al; Alberta Kidney Disease Network. Cause of death in patients with reduced kidney function. J Am Soc Nephrol 2015; 26:2504–2511.
Tarver-Carr ME, Powe NR, Eberhardt MS, et al. Excess risk of chronic kidney disease among African-American versus white subjects in the United States: a population-based study of potential explanatory factors. J Am Soc Nephrol 2002; 13:2363–2370
United States Renal Data System. 2015 USRDS annual data report: epidemiology of kidney disease in the United States. National Institutes of Health, National Institute of Diabetes and Digestive and Kidney Diseases, Bethesda, MD, 2015; 1:17.
Mailloux LU, Henrich WL. Patient survival and maintenance dialysis. UpToDate 2017.
Burrows NR, Li Y, Williams DE. Racial and ethnic differences in trends of end-stage renal disease: United States, 1995 to 2005. Adv Chronic Kidney Dis 2008; 15:147–152.
Genovese G, Friedman DJ, Ross MD, et al. Association of trypanolytic ApoL1 variants with kidney disease in African Americans. Science 2010; 329:841–845.
Lecordier L, Vanhollebeke B, Poelvoorde P, et al. C-terminal mutants of apolipoprotein L-1 efficiently kill both Trypanosoma brucei brucei and Trypanosoma brucei rhodesiense. PLoS Pathogens 2009; 5:e1000685.
Thomson R, Genovese G, Canon C, et al. Evolution of the primate trypanolytic factor APOL1. Proc Natl Acad Sci USA 2014; 111:E2130–E2139.
Parsa A, Kao WH, Xie D, et al; AASK Study Investigators; CRIC Study Investigators. APOL1 risk variants, race, and progression of chronic kidney disease. N Engl J Med 2013; 369:2183–2196.
Madhavan SM, O’Toole JF, Konieczkowski M, Ganesan S, Bruggeman LA, Sedor JR. APOL1 localization in normal kidney and nondiabetic kidney disease. J Am Soc Nephrol 2011; 22:2119–2128.
Hoy WE, Hughson MD, Kopp JB, Mott SA, Bertram JF, Winkler CA. APOL1 risk alleles are associated with exaggerated age-related changes in glomerular number and volume in African-American adults: an autopsy study. J Am Soc Nephrol 2015; 26:3179–3189.
Bruggeman LA, O’Toole JF, Ross MD, et al. Plasma apolipoprotein L1 levels do not correlate with CKD. J Am Soc Nephrol 2014; 25:634–644
Beckerman P, Bi-Karchin J, Park AS, et al. Transgenic expression of human APOL1 risk variants in podocytes induces kidney disease in mice. Nat Med 2017; 23: 429–438.
O’Toole JF, Bruggeman LA, Sedor JR. A new mouse model of APOL1-associated kidney diseases: when traffic gets snarled the podocyte suffers. Am J Kidney Dis 2017; pii: S0272-6386(17)30808-9. doi: 10.1053/j.ajkd.2017.07.002. [Epub ahead of print]
Lee BT, Kumar V, Williams TA, et al. The APOL1 genotype of African American kidney transplant recipients does not impact 5-year allograft survival. Am J Transplant 2012; 12:1924–1928.
Reeves-Daniel AM, DePalma JA, Bleyer AJ, et al. The APOL1 gene and allograft survival after kidney transplantation. Am J Transplant 2011; 11:1025–1030.
Freedman BI, Julian BA, Pastan SO, et al. Apolipoprotein L1 gene variants in deceased organ donors are associated with renal allograft failure. Am J Transplant 2015; 15:1615–1622.
Kofman T, Audard V, Narjoz C, et al. APOL1 polymorphisms and development of CKD in an identical twin donor and recipient pair. Am J Kidney Dis 2014; 63:816–819.
Zwang NA, Shetty A, Sustento-Reodica N, et al. APOL1-associated end-stage renal disease in a living kidney transplant donor. Am J Transplant 2016; 16:3568–3572.
Joseph V. Nally, Jr., MD Former Director, Center for Chronic Kidney Disease; Clinical Professor of Medicine, Cleveland Clinic Lerner College of Medicine of Case Western Reserve University
Address: Joseph V. Nally, Jr., MD, Glickman Urological and Kidney Institute, Q7, Cleveland Clinic, 9500 Euclid Avenue, Cleveland, OH 44195; [email protected]
Medical Grand Rounds articles are based on edited transcripts from Medicine Grand Rounds presentations at Cleveland Clinic. They are approved by the authors but are not peer-reviewed.
Author and Disclosure Information
Joseph V. Nally, Jr., MD Former Director, Center for Chronic Kidney Disease; Clinical Professor of Medicine, Cleveland Clinic Lerner College of Medicine of Case Western Reserve University
Address: Joseph V. Nally, Jr., MD, Glickman Urological and Kidney Institute, Q7, Cleveland Clinic, 9500 Euclid Avenue, Cleveland, OH 44195; [email protected]
Medical Grand Rounds articles are based on edited transcripts from Medicine Grand Rounds presentations at Cleveland Clinic. They are approved by the authors but are not peer-reviewed.
Editor’s note: This Medical Grand Rounds was presented as the 14th Annual Lawrence “Chris” Crain Memorial Lecture, a series that has been dedicated to discussing kidney disease, hypertension, and health care disparities in the African American community. In 1997, Dr. Crain became the first African American chief medical resident at Cleveland Clinic, and was a nephrology fellow in 1998–1999. Dr. Nally was his teacher and mentor.
African Americans have a greater burden of chronic kidney disease than whites. They are more than 3 times as likely as whites to develop end-stage renal disease, even after adjusting for age, disease stage, smoking, medications, and comorbidities. Why this is so has been the focus of much speculation and research.
This article reviews recent advances in the understanding of the progression of chronic kidney disease, with particular scrutiny of the disease in African Americans. Breakthroughs in genetics that help explain the greater disease burden in African Americans are also discussed, as well as implications for organ transplant screening.
ADVANCING UNDERSTANDING OF CHRONIC KIDNEY DISEASE
In the 1990s, dialysis rolls grew by 8% to 10% annually. Unfortunately, many patients first met with a nephrologist on the eve of their first dialysis treatment; there was not yet an adequate way to recognize the disease earlier and slow its progression. And disease definitions were not yet standardized, which led to inadequate metrics and hampered the ability to move disease management forward.
Standardizing definitions
The situation improved in 2002, when the National Kidney Foundation published clinical practice guidelines for chronic kidney disease that included disease definitions and staging.1 Chronic kidney disease was defined as a structural or functional abnormality of the kidney lasting at least 3 months, as manifested by either of the following:
Kidney damage, with or without decreased glomerular filtration rate (GFR), as defined by pathologic abnormalities or markers of kidney damage in the blood, urine, or on imaging tests
Figure 1. Prognosis of chronic kidney disease (CKD) by glomerular filtration rate (GFR) and albuminuria.GFR less than 60 mL/min/1.73 m2, with or without kidney damage.
A subsequent major advance was the recognition that not only GFR but also albuminuria was important for staging of chronic kidney disease (Figure 1).2
Developing large databases
Surveillance and monitoring of chronic kidney disease have generated large databases that enable researchers to detect trends in disease progression.
US Renal Data System. The US Renal Data System has collected and reported on data for more than 20 years from the National Health and Nutrition Examination Survey and the Centers for Medicare and Medicaid Services about chronic and end-stage kidney disease in the United States.
Cleveland Clinic database. Cleveland Clinic has developed a validated chronic kidney disease registry based on its electronic health record.3 The data include demographics (age, sex, ethnic group), comorbidities, medications, and complete laboratory data.4
Alberta Kidney Disease Network. This Canadian research consortium links large laboratory and demographic databases to facilitate defining patient populations, such as those with kidney disease and other comorbidities.
Kaiser Permanente Renal Registry. Kaiser Permanente of Northern California insures more than one-third of adults in the San Francisco Bay Area. The renal registry includes all adults whose kidney function is known. Data on age, sex, and racial or ethnic group are available from the health-plan databases.
DEATHS FROM KIDNEY DISEASE
The mortality rate in patients with end-stage renal disease who are on dialysis has steadily fallen over the past 20 years, from an annual rate of about 25% in 1996 to 17% in 2014, suggesting that care improved during that time. Patients with transplants have a much lower mortality rate: less than 5% annually.5 But these data also highlight the persistent risk faced by patients with chronic kidney disease; even those with transplants have death rates comparable to those of patients with cancer, diabetes, or heart failure.
Death rates correlate with GFR
After the publication of definitions and staging by the National Kidney Foundation in 2002, Go et al6 studied more than 1 million patients with chronic kidney disease from the Kaiser Permanente Renal Registry and found that the rates of cardiovascular events and death from any cause increased with decreasing estimated GFR. These findings were confirmed in a later meta-analysis, which also found that an elevated urinary albumin-to-creatinine ratio (> 1.1 mg/mmol) is an independent predictor of all-cause mortality and cardiovascular mortality.7
Keith et al8 followed nearly 28,000 patients with chronic kidney disease (with an estimated GFR of less than 90 mL/min/1.73 m2) over 5 years. Patients with stage 3 disease (moderate disease, GFR = 30–59 mL/min/1.73 m2) were 20 times more likely to die than to progress to end-stage renal disease (24.3% vs 1.2%). Even those with stage 4 disease (severe disease, GFR = 15–29 mL/min/1.73 m2) were more than twice as likely to die as to progress to dialysis (45.7% vs 19.9%).
Heart disease risk increases with declining kidney function
Navaneethan et al9 examined the leading causes of death between 2005 and 2009 in patients with chronic kidney disease in the Cleveland Clinic database, which included more than 33,000 whites and 5,000 African Americans. During a median follow-up of 2.3 years, 17% of patients died, with the 2 major causes being cardiovascular disease (35%) and cancer (32%) (Table 1). Interestingly, patients with fairly well-preserved kidney function (stage 3A) were more likely to die of cancer than heart disease. As kidney function declined, whether measured by estimated GFR or urine albumin-to-creatinine ratio, the chance of dying of cardiovascular disease increased.
Similar observations were made by Thompson et al10 based on the Alberta Kidney Disease Network database. They tracked cardiovascular causes of death and found that regardless of estimated GFR, cardiovascular deaths were most often attributed to ischemic heart disease (about 55%). Other trends were also apparent: as the GFR fell, the incidence of stroke decreased, and heart failure and valvular heart disease increased.
AFRICAN AMERICANS WITH KIDNEY DISEASE: A DISTINCT GROUP
African Americans constitute about 12% of the US population but account for:
31% of end-stage renal disease
34% of the kidney transplant waiting list
28% of kidney transplants in 2015 (12% of living donor transplants, 35% of deceased donor transplants).
In addition, African Americans with chronic kidney disease tend to be:
Younger and have more advanced kidney disease than whites11
Much more likely than whites to have diabetes, and somewhat more likely to have hypertension
Adapted from Navaneethan SD, Schold JD, Arrigain S, Jolly SE, Nally JV Jr. Cause-specific deaths in non-dialysis-dependent CKD. J Am Soc Nephrol 2015; 26:2512–2520.
Figure 2. Risk for all-cause and major cause-specific death in black vs white patients.More likely than whites to die of cardiovascular disease (37.4% vs 34.2%) (Figure 2).9
Overall, the prevalence of chronic kidney disease is slightly higher in African Americans than in whites. Interestingly, African Americans are slightly less likely than whites to have low estimated GFR values (6.2% vs 7.6% incidence of < 60 mL/min/1.73 m2) but are about 50% more likely to have proteinuria (12.3% vs 8.4% incidence of urine albumin-to-creatinine ratio ≥ 30 mg/g).
More likely to be on dialysis, but less likely to die
Although African Americans have only a slightly higher prevalence of chronic kidney disease (about 15% increased prevalence) than whites,12 they are 3 times more likely to be on dialysis.
Nevertheless, for unknown reasons, African American adults on dialysis have about a 26% lower all-cause mortality rate than whites.5 One proposed explanation for this survival advantage has been that the mortality rate in African Americans with chronic kidney disease before entering dialysis is higher than in whites, leading to a “healthier population” on dialysis.13 However, this theory is based on a small study from more than a decade ago and has not been borne out by subsequent investigation.
African Americans with chronic kidney disease: Death rates not increased
African Americans over age 65 with chronic kidney disease have all-cause mortality rates similar to those of whites: about 11% annually. Breaking it down by disease severity, death rates in stage 3 disease are about 10% and jump to more than 15% in higher stages in both African Americans and whites.5
However, African Americans with chronic kidney disease have more heart disease and much more end-stage renal disease than whites.
Disease advances faster despite care
The incidence of end-stage renal disease is consistently more than 3 times higher in African Americans than in whites in the United States.5,14
Multiple investigations have tried to determine why African Americans are disproportionately affected by progression of chronic kidney disease to end-stage renal disease. We recently examined this question in our Cleveland Clinic registry data. Even after adjusting for 17 variables (including demographics, comorbidities, insurance, medications, smoking, and chronic kidney disease stage), African Americans with chronic kidney disease were found to have an increased risk of progressing to end-stage renal disease compared with whites (subhazard ratio 1.38, 95% confidence interval 1.19–1.60).
We examined care measures from the Cleveland Clinic database. In terms of the number of laboratory tests ordered, clinic visits, and nephrology referrals, African Americans had at least as much care as whites, if not more. Similarly, African Americans’ access to renoprotective medicines (angiotensin-converting enzyme inhibitors, angiotensin II receptor blockers, statins, beta-blockers) was the same as or more than for whites.
Although the frequently attributed reasons surrounding compliance and socioeconomic issues are worthy of examination, they do not appear to completely explain the differences in incidence and outcomes. This dichotomy of a marginally increased prevalence of chronic kidney disease in African Americans with mortality rates similar to those of whites, yet with a 3 times higher incidence of end-stage renal disease in African Americans, suggests a faster progression of the disease in African Americans, which may be genetically based.
GENETIC VARIANTS FOUND
In 2010, two variant alleles of the APOL1 gene on chromosome 22 were found to be associated with nondiabetic kidney disease.15 Three nephropathies are associated with being homozygous for these alleles:
Focal segmental glomerulosclerosis, the leading cause of nephrotic syndrome in African Americans
Hypertension-associated kidney disease with scarring of glomeruli in vessels, the primary cause of end-stage renal disease in African Americans
Human immunodeficiency virus (HIV)- associated nephropathy, usually a focal segmental glomerulosclerosis type of lesion.
The first two conditions are about 3 to 5 times more prevalent in African Americans than in whites, and HIV-associated nephropathy is about 20 to 30 times more common.
African sleeping sickness and chronic kidney disease
Figure 3. Variants in the APOL1 gene that are common in sub-Saharan Africa protect against African sleeping sickness, but homozygosity for these variants increases the risk of chronic kidney disease.The APOL1 variants have been linked to protection from African sleeping sickness caused by Trypanosoma brucei, transmitted by the tsetse fly (Figure 3).16 The pathogen can infect people with normal APOL1 using a serum resistance-associated protein, while the mutant variants prevent or reduce protein binding. Having one variant allele confers protection against trypanosomiasis without leading to kidney disease; having both alleles with the variants protects against sleeping sickness but increases the risk of chronic kidney disease. About 15% of African Americans are homozygous for a variant.17
Retrospective analysis of biologic samples from trials of kidney disease in African Americans has revealed interesting results.
From Parsa A, Kao WH, Xie D, et al; AASK Study Investigators; CRIC Study Investigators. APOL1 risk variants, race, and progression of chronic kidney disease. N Engl J Med 2013; 369:2183–2196. Reprinted with permission from Massachusetts Medical Society.
Figure 4. Proportion of patients free from progression of chronic kidney disease, according to APOL1 genotype, in the African American Study of Kidney Disease and Hypertension. The primary outcome was reduction in the glomerular filtration rate (as measured by iothalamate clearance) or incident end-stage renal disease.The African American Study of Kidney Disease and Hypertension (AASK) trial18 evaluated whether tighter blood pressure control would improve outcomes. Biologic samples were available for DNA testing for 693 of the 1,094 trial participants. Of these, 23% of African Americans were found to be homozygous for a high-risk allele, and they had dramatically worse outcomes with greater loss of GFR than those with one or no variant allele (Figure 4). However, the impact of therapy (meeting blood pressure targets, treatment with different medications) did not differ between the groups.
The Chronic Renal Insufficiency Cohort (CRIC) observation study18 enrolled patients with an estimated GFR of 20 to 70 mL/min/1.73 m2, with a preference for African Americans and patients with diabetes. Nearly 3,000 participants had adequate samples for DNA testing. They found that African Americans with the double variant allele had worse outcomes, whether or not they had diabetes, compared with whites and African Americans without the homozygous gene variant.
Mechanism not well understood
The mechanism of renal injury is not well understood. Apolipoprotein L1, the protein coded for by APOL1, is a component of high-density lipoprotein. It is found in a different distribution pattern in people with normal kidneys vs those with nondiabetic kidney disease, especially in the arteries, arterioles, and podocytes.19,20 It can be detected in blood plasma, but levels do not correlate with kidney disease.21 Not all patients with the high-risk variant develop chronic kidney disease; a “second hit” such as infection with HIV may be required.
Investigators have recently developed knockout mouse models of APOL1-associated kidney diseases that are helping to elucidate mechanisms.22,23
EFFECT OF GENOTYPE ON KIDNEY TRANSPLANTS IN AFRICAN AMERICANS
African Americans receive about 30% of kidney transplants in the United States and represent about 15% to 20% of all donors.
Lee et al24 reviewed 119 African American recipients of kidney transplants, about half of whom were homozygous for an APOL1 variant. After 5 years, no differences were found in allograft survival between recipients with 0, 1, or 2 risk alleles.
However, looking at the issue from the other side, Reeves-Daniel et al25 studied the fate of more than 100 kidneys that were transplanted from African American donors, 16% of whom had the high-risk, homozygous genotype. In this case, graft failure was much likelier to occur with the high-risk donor kidneys (hazard ratio 3.84, P = .008). Similar outcomes were shown in a study of 2 centers26 involving 675 transplants from deceased donors, 15% of which involved the high-risk genotype. The hazard ratio for graft failure was found to be 2.26 (P = .001) with high-risk donor kidneys.
These studies, which examined data from about 5 years after transplant, found that kidney failure does not tend to occur immediately in all cases, but gradually over time. Most high-risk kidneys were not lost within the 5 years of the studies.
The fact that the high-risk kidneys do not all fail immediately also suggests that a second hit is required for failure. Culprits postulated include a bacterial or viral infection (eg, BK virus, cytomegalovirus), ischemia or reperfusion injury, drug toxicity, and immune-mediated allograft injury (ie, rejection).
Genetic testing advisable?
Genetic testing for APOL1 risk variants is on the horizon for kidney transplant. But at this point, providing guidance for patients can be tricky. Two case studies27,28 and epidemiologic data suggest that donors homozygous for an APOL1 variant and those with a family history of end-stage kidney disease are at increased risk of chronic kidney disease. Even so, most recipients even of these high-risk organs have good outcomes. If an African American patient needs a kidney and his or her sibling offers one, it is difficult to advise against it when the evidence is weak for immediate risk and when other options may not be readily available. Further investigation is clearly needed into whether APOL1 variants and other biomarkers can predict an organ’s success as a transplant.
The National Institutes of Health are currently funding prospective longitudinal studies with the APOL1 Long-term Kidney Transplantation Outcomes Network (APOLLO) to determine the impact of APOL1 genetic factors on transplant recipients as well as on living donors. Possible second hits will also be studied, as will other markers of renal dysfunction or disease in donors. Researchers are actively investigating these important questions.
KEEPING SCIENCE RELEVANT
In a recent commentary related to the murine knockout model of APOL1-associated kidney disease, O’Toole et al offered insightful observations regarding the potential clinical impact of these new genetic discoveries.23
As we study the genetics of kidney disease in African American patients, we should keep in mind 3 critical questions of clinical importance:
Will findings identify better treatments for chronic kidney disease? The AASK trial found that knowing the genetics did not affect outcomes of routine therapy. However, basic science investigations are currently underway targeting APOL1 variants which might reduce the increased kidney disease risk among people of African descent.
Should patients be genotyped for APOL1 risk variants? For patients with chronic kidney disease, it does not seem useful at this time. But for renal transplant donors, the answer is probably yes.
How does this discovery help us to understand our patients better? The implications are enormous for combatting the assumptions that rapid chronic kidney disease progression reflects poor patient compliance or other socioeconomic factors. We now understand that genetics, at least in part, drives renal disease outcomes in African American patients.
References
National Kidney Foundation. K/DOQI clinical practice guidelines for chronic kidney disease: evaluation, classification, and stratification. Am J Kidney Dis 2002; 39(suppl 1):S1–S266.
Levey AS, de Jong PE, Coresh J, et al. The definition, classification, and prognosis of chronic kidney disease: a KDIGO Controversies Conference report. Kidney Int 2011; 80:17–28.
Navaneethan SD, Jolly SE, Schold JD, et al. Development and validation of an electronic health record-based chronic kidney disease registry. Clin J Am Soc Nephrol 2011; 6:40–49.
Glickman Urological and Kidney Institute, Cleveland Clinic. 2015 Outcomes. P11.
United States Renal Data System. 2016 USRDS annual data report: Epidemiology of kidney disease in the United States. National Institutes of Health, National Institute of Diabetes and Digestive and Kidney Diseases, Bethesda, MD, 2016.
Go AS, Chertow GM, Fan D, McCulloch CE, Hsu CY. Chronic kidney disease and the risks of death, cardiovascular events, and hospitalization. N Engl J Med 2004; 351:1296–1305.
Chronic Kidney Disease Prognosis Consortium, Matsushita K, van der Velde M, Astor BC, et al. Association of estimated glomerular filtration rate and albuminuria with all-cause and cardiovascular mortality in general population cohorts: a collaborative meta-analysis. Lancet 2010; 375:2073–2081.
Keith D, Nichols GA, Gullion CM, Brown JB, Smith DH. Longitudinal follow-up and outcomes among a population with chronic kidney disease in a large managed care organization. Arch Intern Med 2004; 164:659–663.
Navaneethan SD, Schold JD, Arrigain S, Jolly SE, Nally JV Jr. Cause-specific deaths in non-dialysis-dependent CKD. J Am Soc Nephrol 2015; 26:2512–2520.
Thompson S, James M, Wiebe N, et al; Alberta Kidney Disease Network. Cause of death in patients with reduced kidney function. J Am Soc Nephrol 2015; 26:2504–2511.
Tarver-Carr ME, Powe NR, Eberhardt MS, et al. Excess risk of chronic kidney disease among African-American versus white subjects in the United States: a population-based study of potential explanatory factors. J Am Soc Nephrol 2002; 13:2363–2370
United States Renal Data System. 2015 USRDS annual data report: epidemiology of kidney disease in the United States. National Institutes of Health, National Institute of Diabetes and Digestive and Kidney Diseases, Bethesda, MD, 2015; 1:17.
Mailloux LU, Henrich WL. Patient survival and maintenance dialysis. UpToDate 2017.
Burrows NR, Li Y, Williams DE. Racial and ethnic differences in trends of end-stage renal disease: United States, 1995 to 2005. Adv Chronic Kidney Dis 2008; 15:147–152.
Genovese G, Friedman DJ, Ross MD, et al. Association of trypanolytic ApoL1 variants with kidney disease in African Americans. Science 2010; 329:841–845.
Lecordier L, Vanhollebeke B, Poelvoorde P, et al. C-terminal mutants of apolipoprotein L-1 efficiently kill both Trypanosoma brucei brucei and Trypanosoma brucei rhodesiense. PLoS Pathogens 2009; 5:e1000685.
Thomson R, Genovese G, Canon C, et al. Evolution of the primate trypanolytic factor APOL1. Proc Natl Acad Sci USA 2014; 111:E2130–E2139.
Parsa A, Kao WH, Xie D, et al; AASK Study Investigators; CRIC Study Investigators. APOL1 risk variants, race, and progression of chronic kidney disease. N Engl J Med 2013; 369:2183–2196.
Madhavan SM, O’Toole JF, Konieczkowski M, Ganesan S, Bruggeman LA, Sedor JR. APOL1 localization in normal kidney and nondiabetic kidney disease. J Am Soc Nephrol 2011; 22:2119–2128.
Hoy WE, Hughson MD, Kopp JB, Mott SA, Bertram JF, Winkler CA. APOL1 risk alleles are associated with exaggerated age-related changes in glomerular number and volume in African-American adults: an autopsy study. J Am Soc Nephrol 2015; 26:3179–3189.
Bruggeman LA, O’Toole JF, Ross MD, et al. Plasma apolipoprotein L1 levels do not correlate with CKD. J Am Soc Nephrol 2014; 25:634–644
Beckerman P, Bi-Karchin J, Park AS, et al. Transgenic expression of human APOL1 risk variants in podocytes induces kidney disease in mice. Nat Med 2017; 23: 429–438.
O’Toole JF, Bruggeman LA, Sedor JR. A new mouse model of APOL1-associated kidney diseases: when traffic gets snarled the podocyte suffers. Am J Kidney Dis 2017; pii: S0272-6386(17)30808-9. doi: 10.1053/j.ajkd.2017.07.002. [Epub ahead of print]
Lee BT, Kumar V, Williams TA, et al. The APOL1 genotype of African American kidney transplant recipients does not impact 5-year allograft survival. Am J Transplant 2012; 12:1924–1928.
Reeves-Daniel AM, DePalma JA, Bleyer AJ, et al. The APOL1 gene and allograft survival after kidney transplantation. Am J Transplant 2011; 11:1025–1030.
Freedman BI, Julian BA, Pastan SO, et al. Apolipoprotein L1 gene variants in deceased organ donors are associated with renal allograft failure. Am J Transplant 2015; 15:1615–1622.
Kofman T, Audard V, Narjoz C, et al. APOL1 polymorphisms and development of CKD in an identical twin donor and recipient pair. Am J Kidney Dis 2014; 63:816–819.
Zwang NA, Shetty A, Sustento-Reodica N, et al. APOL1-associated end-stage renal disease in a living kidney transplant donor. Am J Transplant 2016; 16:3568–3572.
Patients with chronic kidney disease are more likely to die than to progress to end-stage disease, and cardiovascular disease and cancer are the leading causes of death.
As kidney function declines, the chance of dying from cardiovascular disease increases.
African Americans tend to develop kidney disease at a younger age than whites and are much more likely to progress to dialysis.
About 15% of African Americans are homozygous for a variant of the APOL1 gene. They are more likely to develop kidney disease and to have worse outcomes.
Disallow All Ads
Content Gating
No Gating (article Unlocked/Free)
Alternative CME
Disqus Comments
Default
Consolidated Pubs: Do Not Show Source Publication Logo
An 83-year-old man presented to the emergency department with acute, painless loss of vision in his left eye. His vision in that eye had been normal in the middle of the night when he woke to use the restroom, but on awakening 6 hours later he could perceive only light or darkness.
He denied headache, scalp tenderness, jaw claudication, fever, weight loss, myalgia, or other neurologic symptoms. He had not experienced any recent change in his vision before this presentation, including halos around lights, floaters, eye pain, or redness. However, 6 months ago he had undergone left cataract surgery (left phacoemulsification with intraocular implant) without complications. And he said that when he was 3 years old, he had sustained a serious injury to his right eye.
His medical history included ischemic heart disease and hypertension. His medications included losartan, furosemide, amlodipine, atorvastatin, and aspirin.
CAUSES OF ACUTE MONOCULAR VISION LOSS
1. Which of the following is the least likely cause of this patient’s acute monocular vision loss?
Optic neuritis
Retinal vein occlusion
Retinal artery occlusion
Pituitary apoplexy
Retinal detachment
Acute vision loss is often so distressing to the patient that the emergency department may be the first step in evaluation. While its diagnosis and management often require an interdisciplinary effort, early evaluation and triage of this potential medical emergency is often done by clinicians without specialized training in ophthalmology.
The physiology of vision is complex and the list of possible causes of vision loss is long, but the differential diagnosis can be narrowed quickly by considering the time course of vision loss and the anatomic localization.1
The time course (including onset and tempo) of vision loss can classified as:
Transient (ie, vision returned to normal by the time seen by clinician)
Acute (instantaneous onset, ie, within seconds to minutes)
Subacute (progression over days to weeks)
Chronic (insidious progression over months to years).
Although acute vision loss is usually dramatic, insidious vision loss may occasionally be unnoticed for a surprisingly long time until the normal eye is inadvertently shielded.
Figure 1. Common causes of monocular vision loss can arise in the media (cornea, anterior chamber, or lens), retina, or optic nerve.
Anatomic localization. Lesions anterior to the optic chiasm cause monocular vision loss, whereas lesions at or posterior to the chiasm lead to bilateral visual field defects. Problems leading to monocular blindness can be broadly divided into 3 anatomic categories (Figure 1):
Ocular medial (including the cornea, anterior chamber, and lens)
Retinal
Neurologic (including the optic nerve and chiasm).
Clues from the history
A careful ophthalmic history is an essential initial step in the evaluation (Table 1). In addition, nonvisual symptoms can help narrow the differential diagnosis.
Nausea and vomiting often accompany acute elevation of intraocular pressure.
Focal neurologic deficits or other neurologic symptoms can point to a demyelinating disease such as multiple sclerosis.
Risk factors for vascular atherosclerotic disease such as diabetes, hypertension, and coronary artery disease raise concern for retinal, optic nerve, or cerebral ischemia.
Medications with anticholinergic and adrenergic properties can also precipitate monocular vision loss with acute angle-closure glaucoma.
Can we rule out anything yet?
Our patient presented with painless monocular vision loss. As discussed, causes of monocular vision loss can be localized to ocular abnormalities and prechiasmatic neurologic ones. Retinal detachment, occlusion of a retinal artery or vein, and optic neuritis are all important potential causes of acute monocular vision loss.
Pituitary apoplexy, on the other hand, is characterized by an acute increase in pituitary volume, often leading to compression of the optic chiasm resulting in a visual-field defect. It is most often characterized by binocular deficits (eg, bitemporal hemianopia) but is less likely to cause monocular vision loss.1
CASE CONTINUED: EXAMINATION
On examination, the patient appeared comfortable. His temperature was 97.6°F (36.4°C), pulse 59 beats per minute, respiratory rate 18 per minute, and blood pressure 153/56 mm Hg.
Heart and lung examinations were notable for a grade 3 of 6 midsystolic, low-pitched murmur in the aortic area radiating to the neck, bilateral carotid bruits, and clear lungs. The cardiac impulse was normal in location and character. There was no evidence of aortic insufficiency (including auscultation during exhalation phase while sitting upright).
Eye examination. Visual acuity in the right eye was 20/200 with correction (owing to his eye injury at age 3). With the left eye, he could see only light or darkness. The conjunctiva and sclera were normal.
The right pupil was irregular and measured 3 mm (baseline from his previous eye injury). The left pupil was 3.5 mm. The direct pupillary response was preserved, but a relative afferent pupillary defect was present: on the swinging flashlight test, the left pupil dilated when the flashlight was passed from the right to the left pupil. Extraocular movements were full and intact bilaterally. The rest of the neurologic examination was normal.
Figure 2. The patient’s funduscopic examination revealed a cherry red spot (arrow), a characteristic finding in central retinal artery occlusion.
An ophthalmologist was urgently consulted. A dilated funduscopic examination of the left eye revealed peripapillary atrophy, tortuous vessels, a cherry red macular spot, and flame hemorrhages, but no disc edema or pallor (Figure 2).
FURTHER WORKUP
2. Which of the following investigations would be least useful and not indicated at this point for this patient?
Carotid ultrasonography
Electrocardiography and echocardiography
Magnetic resonance angiography of the brain
Computed tomographic (CT) angiography of the head and neck
Testing for the factor V Leiden and prothrombin gene mutations
A systematic ocular physical examination can offer important diagnostic information (Table 2). Ophthalmoscopy directly examines the optic disc, macula, and retinal vasculature. To interpret the funduscopic examination, we need a basic understanding of the vascular supply to the eye (Figure 3).
Information from references 4 and 5.
Figure 3. Vascular supply to the eye. The internal carotid artery’s first major branch is the ophthalmic artery. Four major vessels break off from the ophthalmic artery: Central retinal artery: large-diameter vessel that supplies the retina (vulnerable to embolic disease); short and long posterior ciliary arteries: small vessels that supply the optic nerve and macula (susceptible to small-vessel disease); anterior ciliary arteries supply the iris and ciliary body.
For example, the cherry red spot within the macula in our patient is characteristic of central retinal artery occlusion and highlights the relationship between anatomy and pathophysiology. The retina’s blood supply is compromised, leading to an ischemic, white background (secondary to edema of the inner third of the retina), but the macula continues to be nourished by the posterior ciliary arteries. This contrast in color is accentuated by the underlying structures composing the fovea, which lacks the nerve fiber layer and ganglion cell layer, making the vascular bed more visible.2,3
Also in our patient, the marked reduction in visual acuity and relative afferent pupillary defect in the left eye point to unilateral optic nerve (or retinal ganglion cell) dysfunction. The findings on direct funduscopy were consistent with acute central retinal artery ischemia or occlusion. Central retinal artery occlusion can be either arteritic (due to inflammation, most often giant cell arteritis) or nonarteritic (due to atherosclerotic vascular disease).
Thus, carotid ultrasonography, electrocardiography, and transthoracic and transesophageal echocardiography are important components of the further workup. In addition, urgent brain imaging including either CT angiography or magnetic resonance angiography of the head and neck is indicated in all patients with central retinal artery occlusion.
Thrombophilia testing, including tests for the factor V Leiden and prothrombin gene mutations, is indicated in specific cases when a hypercoagulable state is suggested by components of the history, physical examination, and laboratory and radiologic testing. Thrombophilia testing would be low-yield and should not be part of the first-line testing in elderly patients with several atherosclerotic risk factors, such as our patient.
CASE CONTINUED: LABORATORY AND IMAGING EVIDENCE
Initial laboratory work showed:
Mild microcytic anemia
Erythrocyte sedimentation rate 77 mm/hour (reference range 1–10)
C-reactive protein 4.0 mg/dL (reference range < 0.9).
The rest of the complete blood cell count and metabolic profile were unremarkable. His hemoglobin A1c value was 5.3% (reference range 4.8%–6.2%).
A neurologist was urgently consulted.
Magnetic resonance imaging of the brain without contrast revealed nonspecific white-matter disease with no evidence of ischemic stroke.
Magnetic resonance angiography of the head and neck with contrast demonstrated 20% to 40% stenosis in both carotid arteries with otherwise patent anterior and posterior circulation.
Continuous monitoring of the left carotid artery with transcranial Doppler ultrasonography was also ordered, and the study concluded there were no undetected microembolic events.
Transthoracic echocardiography showed aortic sclerosis with no other abnormalities.
Ophthalmic fluorescein angiography was performed and showed patchy choroidal hypoperfusion, severe delayed filling, and extensive pruning of the arterial circulation with no involvement of the posterior ciliary arteries.
Given the elevated inflammatory markers, pulse-dose intravenous methylprednisolone was started, and a temporal artery biopsy was planned.
CENTRAL RETINAL ARTERY OCCLUSION: NONARTERITIC VS ARTERITIC CAUSES
3. Which of the following is least useful to differentiate arteritic from nonarteritic causes of central retinal artery occlusion?
Finding emboli in the retinal vasculature on funduscopy
Temporal artery biopsy
Measuring the C-reactive protein level and the erythrocyte sedimentation rate
Echocardiography
Positron-emission tomography (PET)
Retinal fluorescein angiography
In patients diagnosed with central retinal artery occlusion, the next step is to differentiate between nonarteritic and arteritic causes, since separating them has therapeutic relevance.
The carotid artery is the main culprit for embolic disease affecting the central retinal artery, leading to the nonarteritic subtype. Thus, evaluation of acute retinal ischemia secondary to nonarteritic central retinal artery occlusion is similar to the evaluation of patients with an acute cerebral stroke.4 Studies have shown that 25% of patients diagnosed with central retinal artery occlusion have an additional ischemic insult in the cerebrovascular system, and these patients are at high risk of recurrent ocular or cerebral infarction. Workup includes diffusion-weighted MRI, angiography, echocardiography, and telemetry.5
Arteritic central retinal artery occlusion is most often caused by giant cell arteritis. The American College of Rheumatology classification criteria for giant cell arteritis include 3 of the following 5:
Age 50 or older
New onset of localized headache
Temporal artery tenderness or decreased temporal artery pulse
Erythrocyte sedimentation rate 50 mm/hour or greater
Positive biopsy findings.6
Temporal artery biopsy is the gold standard for the diagnosis of giant cell arteritis and should be done whenever the disease is suspected.7,8 However, the test is invasive and imperfect, as a negative result does not completely rule out giant cell arteritis.9
Although a unilateral temporal artery biopsy can be falsely negative, several studies evaluating the efficacy of bilateral biopsies did not show significant improvement in the diagnostic yield.10,11
Ophthalmic fluorescein angiography is another helpful test for distinguishing nonarteritic from arteritic central retinal artery occlusion.12 Involvement of the posterior ciliary arteries usually occurs in giant cell arteritis, and this leads to choroidal malperfusion with or without retinal involvement. The optic nerve may also be infarcted by closure of the paraoptic vessels fed by the posterior ciliary vessels.12,13 Such involvement of multiple vessels would not be typical with nonarteritic central retinal artery occlusion. Thus, this finding is helpful in making the final diagnosis along with supplying possible prognostic information.13
PET-CT is emerging as a test for early inflammation in extracranial disease, but its utility for diagnosing intracranial disease is limited by high uptake of the tracer fluorodeoxyglucose by the brain and low resolution.14 Currently, it has no established role in the evaluation of patients with central retinal artery occlusion and would have no utility in differentiating arteritic vs nonarteritic causes of central retinal artery occlusion.
If giant cell arteritis is suspected, it is essential to start intravenous pulse-dose methylprednisolone early to prevent further vision loss in the contralateral eye. Treatment should not be delayed for invasive testing or temporal artery biopsy. Improvement in headache, jaw claudication, or scalp tenderness once steroids are initiated also helps support the diagnosis of giant cell arteritis.7
Unfortunately, visual symptoms may be irreversible despite treatment.
Our patient’s central retinal artery occlusion
This case highlights how difficult it is in practice to distinguish nonarteritic from arteritic central retinal artery occlusion.
Our patient had numerous cardiovascular risk factors, including known carotid and coronary artery disease, favoring a nonarteritic diagnosis.
On the other hand, his elevated inflammatory markers suggested an underlying inflammatory response. He lacked the characteristic headache and other systemic signs of giant cell arteritis, but this has been described in about 25% of patients.15 If emboli are seen on funduscopy, further workup for arteritic central retinal artery occlusion is not warranted, but emboli are not always present. Then again, absence of posterior ciliary artery involvement on fluorescein angiography pointed away from giant cell arteritis.
CASE CONTINUED: FINAL DIAGNOSIS
Biopsy of the left temporal artery showed intimal thickening with focal destruction of the internal elastic lamina by dystrophic calcification with no evidence of inflammatory infiltrates, giant cells, or granulomata in the adventitia, media, or intima. Based on the results of biopsy study and fluorescein angiography, we concluded that this was nonarteritic central retinal artery occlusion related to atherosclerotic disease.
Methylprednisolone was discontinued. The patient was discharged on aspirin, losartan, furosemide, amlodipine, and high-dose atorvastatin for standard stroke prevention. He was followed by the medical team and the ophthalmology department. At 6 weeks, there was only marginal improvement in the visual acuity of the left eye.
MANAGEMENT
4. Management of nonarteritic central retinal artery occlusion could include all of the following except which one?
Ocular massage
Intravenous thrombolysis
Intra-arterial thrombolysis
Risk-factor modification
Intraocular steroid injection
In patients with acute vision loss from nonarteritic central retinal artery occlusion, acute strategies to restore retinal perfusion include noninvasive “standard” therapies and thrombolysis (intravenous or intra-arterial). Unfortunately, consensus and guidelines are lacking.
Traditional therapies include sublingual isosorbide dinitrate, systemic pentoxifylline, inhalation of a carbogen, hyperbaric oxygen, ocular massage, intravenous acetazolamide and mannitol, anterior chamber paracentesis, and systemic steroids. However, none of these have been shown to be more effective than placebo.16
Thrombolytic therapy, analogous to the treatment of patients with ischemic stroke or myocardial infarction, is more controversial in acute central retinal artery occlusion.13 Data from small case-series suggested that intra-arterial or intravenous thrombolysis might improve visual acuity with reasonable safety.17 On the other hand, a randomized study from the United Kingdom that compared intra-arterial thrombolysis within a 24-hour window and conservative measures concluded that thrombolysis should not be used.18
Thrombolysis is thus used only in selected patients on a case-specific basis with involvement of a multispecialty team including stroke neurologists, especially if patients present within hours of onset and have concomitant neurologic symptoms.
Treatment beyond the acute phase focuses on preventing complications of the eye ischemia and aggressively managing systemic atherosclerotic risk factors to decrease the incidence of further ischemic events. Other interventions include endarterectomy for significant carotid stenosis and anticoagulation to prevent cardioembolic embolization (such as atrial fibrillation). Most experts agree on the addition of an antiplatelet agent.13,19
Intraocular steroid injection can be used in the management of some retinal disorders but has no value in nonarteritic central retinal artery occlusion.
Vision recovery in nonarteritic central retinal artery occlusion is variable, but the prognosis is generally poor. The visual acuity on presentation, the onset of the symptoms, and collateral vessels are major factors influencing long-term recovery. Most of the recovery occurs within 7 days and involves peripheral vision rather than central vision. Several studies report some recovery in peripheral vision in approximately 30% to 35% of affected eyes.20–22
PROMPT ACTION MAY SAVE SIGHT
Vision loss is a common presenting symptom in the emergency setting. A meticulous history and systematic physical examination can narrow the differential diagnosis of this neuro-ophthalmologic emergency. Acute retinal ischemia from central retinal artery occlusion is the ocular equivalent of an ischemic stroke, and they share risk factors, diagnostic workup, and management approaches.
Both etiologic subtypes (ie, arteritic and nonarteritic) require prompt intervention by front-line physicians. If giant cell arteritis is suspected, corticosteroid therapy must be initiated to save the contralateral retina from ischemia. Suspicion of central retinal artery occlusion warrants immediate evaluation by a neurologist to consider thrombolysis. Prompt action and interdisciplinary care involving an ophthalmologist, neurologist, and emergency or internal medicine physician may save a patient from permanent visual disability.
KEY POINTS
Monocular vision loss requires urgent evaluation with a multidisciplinary management approach.
There are no consensus treatment guidelines for nonarteritic central retinal artery occlusion, but the workup includes a comprehensive stroke evaluation.
Arteritic central retinal artery occlusion is most often due to giant cell arteritis, and when it is suspected, the patient should be empirically treated with steroids.
References
Glezer A, Bronstein MD. Pituitary apoplexy: pathophysiology, diagnosis and management. Arch Endocrinol Metab 2015; 59:259–264.
Campbell WW. DeJong’s The Neurologic Examination. 7th ed. Philadelphia: Lippincott Williams & Wilkins, 2013.
Biller J. Practical Neurology. 4th ed. Philadelphia: Lippincott Williams & Wilkins, 2012.
Biousse V. Acute retinal arterial ischemia: an emergency often ignored. Am J Ophthalmol 2014; 157:1119–1121.
Hunder GG, Bloch DA, Michel BA, et al. American College of Rheumatology 1990 criteria for the classification of giant cell arteritis. Arthritis Rheum 1990; 33:1122–1128.
Smith JH, Swanson JW. Giant cell arteritis. Headache 2014; 54:1273–1289.
Hall S, Persellin S, Lie JT, O’Brien PC, Kurland LT, Hunder GG. The therapeutic impact of temporal artery biopsy. Lancet 1983; 2:1217–1220.
Gabriel SE, O’Fallon WM, Achkar AA, Lie JT, Hunder GG. The use of clinical characteristics to predict the results of temporal artery biopsy among patients with suspected giant cell arteritis. J Rheumatol 1995; 22:93–96.
Boyev LR, Miller NR, Green WR. Efficacy of unilateral versus bilateral temporal artery biopsies for the diagnosis of giant cell arteritis. Am J Ophthalmol 1999; 128:211–215.
Danesh-Meyer HV, Savino PJ, Eagle RC Jr, Kubis KC, Sergott RC. Low diagnostic yield with second biopsies in suspected giant cell arteritis. J Neuroophthalmol 2000; 20:213–215.
Khan A, Dasgupta B. Imaging in giant cell arteritis. Curr Rheumatol Rep 2015; 17:52.
Biousse V, Newman N. Retinal and optic nerve ischemia. Continuum (Minneap Minn) 2014; 20:838–856.
Fraser SG, Adams W. Interventions for acute non-arteritic central retinal artery occlusion. Cochrane Database Syst Rev 2009; 1:CD001989.
Beatty S, Au Eong KG. Local intra-arterial fibrinolysis for acute occlusion of the central retinal artery: a meta-analysis of the published data. Br J Ophthalmol 2000; 84:914–916.
Schumacher M, Schmidt D, Jurklies B, et al; EAGLE-Study Group. Central retinal artery occlusion: local intra-arterial fibrinolysis versus conservative treatment, a multicenter randomized trial. Ophthalmology 2010; 117:1367–1375.e1.
Antithrombotic Trialists’ Collaboration. Collaborative meta-analysis of randomised trials of antiplatelet therapy for prevention of death, myocardial infarction, and stroke in high risk patients. BMJ 2002; 324:71–86.
Hayreh SS, Zimmerman MB. Central retinal artery occlusion: visual outcome. Am J Ophthalmol 2005; 140:376–391.
Augsburger JJ, Magargal LE. Visual prognosis following treatment of acute central retinal artery obstruction. Br J Ophthalmol 1980; 64:913–917.
Brown GC, Shields JA. Cilioretinal arteries and retinal arterial occlusion. Arch Ophthalmol 1979; 97:84–92.
Justin R. Abbatemarco, MD Neurology Resident, Cleveland Clinic
Rushad Patell, MD Internal Medicine Resident, Cleveland Clinic
Janet Buccola, MD Department of Hospital Medicine, Medicine Institute, Cleveland Clinic; Clinical Assistant Professor, Cleveland Clinic Lerner College of Medicine of Case Western Reserve University, Cleveland, OH
Mary Alissa Willis, MD Mellen Center for Multiple Sclerosis Treatment and Research, Neurological Institute, Cleveland Clinic; Assistant Professor, Cleveland Clinic Lerner College of Medicine of Case Western Reserve University, Cleveland, OH
Address: Mary Alissa Willis, MD, Mellen Center for Multiple Sclerosis, U10, Cleveland Clinic, 9500 Euclid Avenue, Cleveland, OH 44195;[email protected]
Author and Disclosure Information
Justin R. Abbatemarco, MD Neurology Resident, Cleveland Clinic
Rushad Patell, MD Internal Medicine Resident, Cleveland Clinic
Janet Buccola, MD Department of Hospital Medicine, Medicine Institute, Cleveland Clinic; Clinical Assistant Professor, Cleveland Clinic Lerner College of Medicine of Case Western Reserve University, Cleveland, OH
Mary Alissa Willis, MD Mellen Center for Multiple Sclerosis Treatment and Research, Neurological Institute, Cleveland Clinic; Assistant Professor, Cleveland Clinic Lerner College of Medicine of Case Western Reserve University, Cleveland, OH
Address: Mary Alissa Willis, MD, Mellen Center for Multiple Sclerosis, U10, Cleveland Clinic, 9500 Euclid Avenue, Cleveland, OH 44195;[email protected]
An 83-year-old man presented to the emergency department with acute, painless loss of vision in his left eye. His vision in that eye had been normal in the middle of the night when he woke to use the restroom, but on awakening 6 hours later he could perceive only light or darkness.
He denied headache, scalp tenderness, jaw claudication, fever, weight loss, myalgia, or other neurologic symptoms. He had not experienced any recent change in his vision before this presentation, including halos around lights, floaters, eye pain, or redness. However, 6 months ago he had undergone left cataract surgery (left phacoemulsification with intraocular implant) without complications. And he said that when he was 3 years old, he had sustained a serious injury to his right eye.
His medical history included ischemic heart disease and hypertension. His medications included losartan, furosemide, amlodipine, atorvastatin, and aspirin.
CAUSES OF ACUTE MONOCULAR VISION LOSS
1. Which of the following is the least likely cause of this patient’s acute monocular vision loss?
Optic neuritis
Retinal vein occlusion
Retinal artery occlusion
Pituitary apoplexy
Retinal detachment
Acute vision loss is often so distressing to the patient that the emergency department may be the first step in evaluation. While its diagnosis and management often require an interdisciplinary effort, early evaluation and triage of this potential medical emergency is often done by clinicians without specialized training in ophthalmology.
The physiology of vision is complex and the list of possible causes of vision loss is long, but the differential diagnosis can be narrowed quickly by considering the time course of vision loss and the anatomic localization.1
The time course (including onset and tempo) of vision loss can classified as:
Transient (ie, vision returned to normal by the time seen by clinician)
Acute (instantaneous onset, ie, within seconds to minutes)
Subacute (progression over days to weeks)
Chronic (insidious progression over months to years).
Although acute vision loss is usually dramatic, insidious vision loss may occasionally be unnoticed for a surprisingly long time until the normal eye is inadvertently shielded.
Figure 1. Common causes of monocular vision loss can arise in the media (cornea, anterior chamber, or lens), retina, or optic nerve.
Anatomic localization. Lesions anterior to the optic chiasm cause monocular vision loss, whereas lesions at or posterior to the chiasm lead to bilateral visual field defects. Problems leading to monocular blindness can be broadly divided into 3 anatomic categories (Figure 1):
Ocular medial (including the cornea, anterior chamber, and lens)
Retinal
Neurologic (including the optic nerve and chiasm).
Clues from the history
A careful ophthalmic history is an essential initial step in the evaluation (Table 1). In addition, nonvisual symptoms can help narrow the differential diagnosis.
Nausea and vomiting often accompany acute elevation of intraocular pressure.
Focal neurologic deficits or other neurologic symptoms can point to a demyelinating disease such as multiple sclerosis.
Risk factors for vascular atherosclerotic disease such as diabetes, hypertension, and coronary artery disease raise concern for retinal, optic nerve, or cerebral ischemia.
Medications with anticholinergic and adrenergic properties can also precipitate monocular vision loss with acute angle-closure glaucoma.
Can we rule out anything yet?
Our patient presented with painless monocular vision loss. As discussed, causes of monocular vision loss can be localized to ocular abnormalities and prechiasmatic neurologic ones. Retinal detachment, occlusion of a retinal artery or vein, and optic neuritis are all important potential causes of acute monocular vision loss.
Pituitary apoplexy, on the other hand, is characterized by an acute increase in pituitary volume, often leading to compression of the optic chiasm resulting in a visual-field defect. It is most often characterized by binocular deficits (eg, bitemporal hemianopia) but is less likely to cause monocular vision loss.1
CASE CONTINUED: EXAMINATION
On examination, the patient appeared comfortable. His temperature was 97.6°F (36.4°C), pulse 59 beats per minute, respiratory rate 18 per minute, and blood pressure 153/56 mm Hg.
Heart and lung examinations were notable for a grade 3 of 6 midsystolic, low-pitched murmur in the aortic area radiating to the neck, bilateral carotid bruits, and clear lungs. The cardiac impulse was normal in location and character. There was no evidence of aortic insufficiency (including auscultation during exhalation phase while sitting upright).
Eye examination. Visual acuity in the right eye was 20/200 with correction (owing to his eye injury at age 3). With the left eye, he could see only light or darkness. The conjunctiva and sclera were normal.
The right pupil was irregular and measured 3 mm (baseline from his previous eye injury). The left pupil was 3.5 mm. The direct pupillary response was preserved, but a relative afferent pupillary defect was present: on the swinging flashlight test, the left pupil dilated when the flashlight was passed from the right to the left pupil. Extraocular movements were full and intact bilaterally. The rest of the neurologic examination was normal.
Figure 2. The patient’s funduscopic examination revealed a cherry red spot (arrow), a characteristic finding in central retinal artery occlusion.
An ophthalmologist was urgently consulted. A dilated funduscopic examination of the left eye revealed peripapillary atrophy, tortuous vessels, a cherry red macular spot, and flame hemorrhages, but no disc edema or pallor (Figure 2).
FURTHER WORKUP
2. Which of the following investigations would be least useful and not indicated at this point for this patient?
Carotid ultrasonography
Electrocardiography and echocardiography
Magnetic resonance angiography of the brain
Computed tomographic (CT) angiography of the head and neck
Testing for the factor V Leiden and prothrombin gene mutations
A systematic ocular physical examination can offer important diagnostic information (Table 2). Ophthalmoscopy directly examines the optic disc, macula, and retinal vasculature. To interpret the funduscopic examination, we need a basic understanding of the vascular supply to the eye (Figure 3).
Information from references 4 and 5.
Figure 3. Vascular supply to the eye. The internal carotid artery’s first major branch is the ophthalmic artery. Four major vessels break off from the ophthalmic artery: Central retinal artery: large-diameter vessel that supplies the retina (vulnerable to embolic disease); short and long posterior ciliary arteries: small vessels that supply the optic nerve and macula (susceptible to small-vessel disease); anterior ciliary arteries supply the iris and ciliary body.
For example, the cherry red spot within the macula in our patient is characteristic of central retinal artery occlusion and highlights the relationship between anatomy and pathophysiology. The retina’s blood supply is compromised, leading to an ischemic, white background (secondary to edema of the inner third of the retina), but the macula continues to be nourished by the posterior ciliary arteries. This contrast in color is accentuated by the underlying structures composing the fovea, which lacks the nerve fiber layer and ganglion cell layer, making the vascular bed more visible.2,3
Also in our patient, the marked reduction in visual acuity and relative afferent pupillary defect in the left eye point to unilateral optic nerve (or retinal ganglion cell) dysfunction. The findings on direct funduscopy were consistent with acute central retinal artery ischemia or occlusion. Central retinal artery occlusion can be either arteritic (due to inflammation, most often giant cell arteritis) or nonarteritic (due to atherosclerotic vascular disease).
Thus, carotid ultrasonography, electrocardiography, and transthoracic and transesophageal echocardiography are important components of the further workup. In addition, urgent brain imaging including either CT angiography or magnetic resonance angiography of the head and neck is indicated in all patients with central retinal artery occlusion.
Thrombophilia testing, including tests for the factor V Leiden and prothrombin gene mutations, is indicated in specific cases when a hypercoagulable state is suggested by components of the history, physical examination, and laboratory and radiologic testing. Thrombophilia testing would be low-yield and should not be part of the first-line testing in elderly patients with several atherosclerotic risk factors, such as our patient.
CASE CONTINUED: LABORATORY AND IMAGING EVIDENCE
Initial laboratory work showed:
Mild microcytic anemia
Erythrocyte sedimentation rate 77 mm/hour (reference range 1–10)
C-reactive protein 4.0 mg/dL (reference range < 0.9).
The rest of the complete blood cell count and metabolic profile were unremarkable. His hemoglobin A1c value was 5.3% (reference range 4.8%–6.2%).
A neurologist was urgently consulted.
Magnetic resonance imaging of the brain without contrast revealed nonspecific white-matter disease with no evidence of ischemic stroke.
Magnetic resonance angiography of the head and neck with contrast demonstrated 20% to 40% stenosis in both carotid arteries with otherwise patent anterior and posterior circulation.
Continuous monitoring of the left carotid artery with transcranial Doppler ultrasonography was also ordered, and the study concluded there were no undetected microembolic events.
Transthoracic echocardiography showed aortic sclerosis with no other abnormalities.
Ophthalmic fluorescein angiography was performed and showed patchy choroidal hypoperfusion, severe delayed filling, and extensive pruning of the arterial circulation with no involvement of the posterior ciliary arteries.
Given the elevated inflammatory markers, pulse-dose intravenous methylprednisolone was started, and a temporal artery biopsy was planned.
CENTRAL RETINAL ARTERY OCCLUSION: NONARTERITIC VS ARTERITIC CAUSES
3. Which of the following is least useful to differentiate arteritic from nonarteritic causes of central retinal artery occlusion?
Finding emboli in the retinal vasculature on funduscopy
Temporal artery biopsy
Measuring the C-reactive protein level and the erythrocyte sedimentation rate
Echocardiography
Positron-emission tomography (PET)
Retinal fluorescein angiography
In patients diagnosed with central retinal artery occlusion, the next step is to differentiate between nonarteritic and arteritic causes, since separating them has therapeutic relevance.
The carotid artery is the main culprit for embolic disease affecting the central retinal artery, leading to the nonarteritic subtype. Thus, evaluation of acute retinal ischemia secondary to nonarteritic central retinal artery occlusion is similar to the evaluation of patients with an acute cerebral stroke.4 Studies have shown that 25% of patients diagnosed with central retinal artery occlusion have an additional ischemic insult in the cerebrovascular system, and these patients are at high risk of recurrent ocular or cerebral infarction. Workup includes diffusion-weighted MRI, angiography, echocardiography, and telemetry.5
Arteritic central retinal artery occlusion is most often caused by giant cell arteritis. The American College of Rheumatology classification criteria for giant cell arteritis include 3 of the following 5:
Age 50 or older
New onset of localized headache
Temporal artery tenderness or decreased temporal artery pulse
Erythrocyte sedimentation rate 50 mm/hour or greater
Positive biopsy findings.6
Temporal artery biopsy is the gold standard for the diagnosis of giant cell arteritis and should be done whenever the disease is suspected.7,8 However, the test is invasive and imperfect, as a negative result does not completely rule out giant cell arteritis.9
Although a unilateral temporal artery biopsy can be falsely negative, several studies evaluating the efficacy of bilateral biopsies did not show significant improvement in the diagnostic yield.10,11
Ophthalmic fluorescein angiography is another helpful test for distinguishing nonarteritic from arteritic central retinal artery occlusion.12 Involvement of the posterior ciliary arteries usually occurs in giant cell arteritis, and this leads to choroidal malperfusion with or without retinal involvement. The optic nerve may also be infarcted by closure of the paraoptic vessels fed by the posterior ciliary vessels.12,13 Such involvement of multiple vessels would not be typical with nonarteritic central retinal artery occlusion. Thus, this finding is helpful in making the final diagnosis along with supplying possible prognostic information.13
PET-CT is emerging as a test for early inflammation in extracranial disease, but its utility for diagnosing intracranial disease is limited by high uptake of the tracer fluorodeoxyglucose by the brain and low resolution.14 Currently, it has no established role in the evaluation of patients with central retinal artery occlusion and would have no utility in differentiating arteritic vs nonarteritic causes of central retinal artery occlusion.
If giant cell arteritis is suspected, it is essential to start intravenous pulse-dose methylprednisolone early to prevent further vision loss in the contralateral eye. Treatment should not be delayed for invasive testing or temporal artery biopsy. Improvement in headache, jaw claudication, or scalp tenderness once steroids are initiated also helps support the diagnosis of giant cell arteritis.7
Unfortunately, visual symptoms may be irreversible despite treatment.
Our patient’s central retinal artery occlusion
This case highlights how difficult it is in practice to distinguish nonarteritic from arteritic central retinal artery occlusion.
Our patient had numerous cardiovascular risk factors, including known carotid and coronary artery disease, favoring a nonarteritic diagnosis.
On the other hand, his elevated inflammatory markers suggested an underlying inflammatory response. He lacked the characteristic headache and other systemic signs of giant cell arteritis, but this has been described in about 25% of patients.15 If emboli are seen on funduscopy, further workup for arteritic central retinal artery occlusion is not warranted, but emboli are not always present. Then again, absence of posterior ciliary artery involvement on fluorescein angiography pointed away from giant cell arteritis.
CASE CONTINUED: FINAL DIAGNOSIS
Biopsy of the left temporal artery showed intimal thickening with focal destruction of the internal elastic lamina by dystrophic calcification with no evidence of inflammatory infiltrates, giant cells, or granulomata in the adventitia, media, or intima. Based on the results of biopsy study and fluorescein angiography, we concluded that this was nonarteritic central retinal artery occlusion related to atherosclerotic disease.
Methylprednisolone was discontinued. The patient was discharged on aspirin, losartan, furosemide, amlodipine, and high-dose atorvastatin for standard stroke prevention. He was followed by the medical team and the ophthalmology department. At 6 weeks, there was only marginal improvement in the visual acuity of the left eye.
MANAGEMENT
4. Management of nonarteritic central retinal artery occlusion could include all of the following except which one?
Ocular massage
Intravenous thrombolysis
Intra-arterial thrombolysis
Risk-factor modification
Intraocular steroid injection
In patients with acute vision loss from nonarteritic central retinal artery occlusion, acute strategies to restore retinal perfusion include noninvasive “standard” therapies and thrombolysis (intravenous or intra-arterial). Unfortunately, consensus and guidelines are lacking.
Traditional therapies include sublingual isosorbide dinitrate, systemic pentoxifylline, inhalation of a carbogen, hyperbaric oxygen, ocular massage, intravenous acetazolamide and mannitol, anterior chamber paracentesis, and systemic steroids. However, none of these have been shown to be more effective than placebo.16
Thrombolytic therapy, analogous to the treatment of patients with ischemic stroke or myocardial infarction, is more controversial in acute central retinal artery occlusion.13 Data from small case-series suggested that intra-arterial or intravenous thrombolysis might improve visual acuity with reasonable safety.17 On the other hand, a randomized study from the United Kingdom that compared intra-arterial thrombolysis within a 24-hour window and conservative measures concluded that thrombolysis should not be used.18
Thrombolysis is thus used only in selected patients on a case-specific basis with involvement of a multispecialty team including stroke neurologists, especially if patients present within hours of onset and have concomitant neurologic symptoms.
Treatment beyond the acute phase focuses on preventing complications of the eye ischemia and aggressively managing systemic atherosclerotic risk factors to decrease the incidence of further ischemic events. Other interventions include endarterectomy for significant carotid stenosis and anticoagulation to prevent cardioembolic embolization (such as atrial fibrillation). Most experts agree on the addition of an antiplatelet agent.13,19
Intraocular steroid injection can be used in the management of some retinal disorders but has no value in nonarteritic central retinal artery occlusion.
Vision recovery in nonarteritic central retinal artery occlusion is variable, but the prognosis is generally poor. The visual acuity on presentation, the onset of the symptoms, and collateral vessels are major factors influencing long-term recovery. Most of the recovery occurs within 7 days and involves peripheral vision rather than central vision. Several studies report some recovery in peripheral vision in approximately 30% to 35% of affected eyes.20–22
PROMPT ACTION MAY SAVE SIGHT
Vision loss is a common presenting symptom in the emergency setting. A meticulous history and systematic physical examination can narrow the differential diagnosis of this neuro-ophthalmologic emergency. Acute retinal ischemia from central retinal artery occlusion is the ocular equivalent of an ischemic stroke, and they share risk factors, diagnostic workup, and management approaches.
Both etiologic subtypes (ie, arteritic and nonarteritic) require prompt intervention by front-line physicians. If giant cell arteritis is suspected, corticosteroid therapy must be initiated to save the contralateral retina from ischemia. Suspicion of central retinal artery occlusion warrants immediate evaluation by a neurologist to consider thrombolysis. Prompt action and interdisciplinary care involving an ophthalmologist, neurologist, and emergency or internal medicine physician may save a patient from permanent visual disability.
KEY POINTS
Monocular vision loss requires urgent evaluation with a multidisciplinary management approach.
There are no consensus treatment guidelines for nonarteritic central retinal artery occlusion, but the workup includes a comprehensive stroke evaluation.
Arteritic central retinal artery occlusion is most often due to giant cell arteritis, and when it is suspected, the patient should be empirically treated with steroids.
References
Glezer A, Bronstein MD. Pituitary apoplexy: pathophysiology, diagnosis and management. Arch Endocrinol Metab 2015; 59:259–264.
Campbell WW. DeJong’s The Neurologic Examination. 7th ed. Philadelphia: Lippincott Williams & Wilkins, 2013.
Biller J. Practical Neurology. 4th ed. Philadelphia: Lippincott Williams & Wilkins, 2012.
Biousse V. Acute retinal arterial ischemia: an emergency often ignored. Am J Ophthalmol 2014; 157:1119–1121.
Hunder GG, Bloch DA, Michel BA, et al. American College of Rheumatology 1990 criteria for the classification of giant cell arteritis. Arthritis Rheum 1990; 33:1122–1128.
Smith JH, Swanson JW. Giant cell arteritis. Headache 2014; 54:1273–1289.
Hall S, Persellin S, Lie JT, O’Brien PC, Kurland LT, Hunder GG. The therapeutic impact of temporal artery biopsy. Lancet 1983; 2:1217–1220.
Gabriel SE, O’Fallon WM, Achkar AA, Lie JT, Hunder GG. The use of clinical characteristics to predict the results of temporal artery biopsy among patients with suspected giant cell arteritis. J Rheumatol 1995; 22:93–96.
Boyev LR, Miller NR, Green WR. Efficacy of unilateral versus bilateral temporal artery biopsies for the diagnosis of giant cell arteritis. Am J Ophthalmol 1999; 128:211–215.
Danesh-Meyer HV, Savino PJ, Eagle RC Jr, Kubis KC, Sergott RC. Low diagnostic yield with second biopsies in suspected giant cell arteritis. J Neuroophthalmol 2000; 20:213–215.
Khan A, Dasgupta B. Imaging in giant cell arteritis. Curr Rheumatol Rep 2015; 17:52.
Biousse V, Newman N. Retinal and optic nerve ischemia. Continuum (Minneap Minn) 2014; 20:838–856.
Fraser SG, Adams W. Interventions for acute non-arteritic central retinal artery occlusion. Cochrane Database Syst Rev 2009; 1:CD001989.
Beatty S, Au Eong KG. Local intra-arterial fibrinolysis for acute occlusion of the central retinal artery: a meta-analysis of the published data. Br J Ophthalmol 2000; 84:914–916.
Schumacher M, Schmidt D, Jurklies B, et al; EAGLE-Study Group. Central retinal artery occlusion: local intra-arterial fibrinolysis versus conservative treatment, a multicenter randomized trial. Ophthalmology 2010; 117:1367–1375.e1.
Antithrombotic Trialists’ Collaboration. Collaborative meta-analysis of randomised trials of antiplatelet therapy for prevention of death, myocardial infarction, and stroke in high risk patients. BMJ 2002; 324:71–86.
Hayreh SS, Zimmerman MB. Central retinal artery occlusion: visual outcome. Am J Ophthalmol 2005; 140:376–391.
Augsburger JJ, Magargal LE. Visual prognosis following treatment of acute central retinal artery obstruction. Br J Ophthalmol 1980; 64:913–917.
Brown GC, Shields JA. Cilioretinal arteries and retinal arterial occlusion. Arch Ophthalmol 1979; 97:84–92.
This article reviews recommendations and evidence concerning current anticoagulant management for venous thromboembolism and perioperative care, with an emphasis on individualizing treatment for real-world patients.
TREATING ACUTE VENOUS THROMBOEMBOLISM
Case 1: Deep vein thrombosis in an otherwise healthy man
A 40-year-old man presents with 7 days of progressive right leg swelling. He has no antecedent risk factors for deep vein thrombosis or other medical problems. Venous ultrasonography reveals an iliofemoral deep vein thrombosis. How should he be managed?
Outpatient treatment with low-molecular-weight heparin for 4 to 6 days plus warfarin
Outpatient treatment with a direct oral anticoagulant, ie, apixaban, dabigatran (which requires 4 to 6 days of initial treatment with low-molecular-weight heparin), or rivaroxaban
Catheter-directed thrombolysis followed by low-molecular-weight heparin, then warfarin or a direct oral anticoagulant
Inpatient intravenous heparin for 7 to 10 days, then warfarin or a direct oral anticoagulant
All of these are acceptable for managing acute venous thromboembolism, but the clinician’s role is to identify which treatment is most appropriate for an individual patient.
Deep vein thrombosis is not a single condition
Multiple guidelines exist to help decide on a management strategy. Those of the American College of Chest Physicians (ACCP)1 are used most often.
That said, guidelines are established for “average” patients, so it is important to look beyond guidelines and individualize management. Venous thromboembolism is not a single entity; it has a myriad of clinical presentations that could call for different treatments. Most patients have submassive deep vein thrombosis or pulmonary embolism, which is not limb-threatening nor associated with hemodynamic instability. It can also differ in terms of etiology and can be unprovoked (or idiopathic), cancer-related, catheter-associated, or provoked by surgery or immobility.
Deep vein thrombosis has a wide spectrum of presentations. It can involve the veins of the calf only, or it can involve the femoral and iliac veins and other locations including the splanchnic veins, the cerebral sinuses, and upper extremities. Pulmonary embolism can be massive (defined as being associated with hemodynamic instability or impending respiratory failure) or submassive. Similarly, patients differ in terms of baseline medical conditions, mobility, and lifestyle. Anticoagulant management decisions should take all these factors into account.
Consider clot location
Our patient with iliofemoral deep vein thrombosis is best managed differently than a more typical patient with less extensive thrombosis that would involve the popliteal or femoral vein segments, or both. A clot that involves the iliac vein is more likely to lead to postthrombotic chronic pain and swelling as the lack of venous outflow bypass channels to circumvent the clot location creates higher venous pressure within the affected leg. Therefore, for our patient, catheter-directed thrombolysis is an option that should be considered.
Catheter-directed thrombolysis trials
According to the “open-vein hypothesis,” quickly eliminating the thrombus and restoring unobstructed venous flow may mitigate the risk not only of recurrent thrombosis, but also of postthrombotic syndrome, which is often not given much consideration acutely but can cause significant, life-altering chronic disability.
The “valve-integrity hypothesis” is also important; it considers whether lytic therapy may help prevent damage to such valves in an attempt to mitigate the amount of venous hypertension.
Thus, catheter-directed thrombolysis offers theoretical benefits, and recent trials have assessed it against standard anticoagulation treatments.
The CaVenT trial (Catheter-Directed Venous Thrombolysis),2 conducted in Norway, randomized 209 patients with midfemoral to iliac deep vein thrombosis to conventional treatment (anticoagulation alone) or anticoagulation plus catheter-directed thrombolysis. At 2 years, postthrombotic syndrome had occurred in 41% of the catheter-directed thrombolysis group compared with 56% of the conventional treatment group (P = .047). At 5 years, the difference widened to 43% vs 71% (P < .01, number needed to treat = 4).3 Despite the superiority of lytic therapy, the incidence of postthrombotic syndrome remained high in patients who received this treatment.
The ATTRACT trial (Acute Venous Thrombosis: Thrombus Removal With Adjunctive Catheter-Directed Thrombolysis),4 a US multicenter, open-label, assessor-blind study, randomized 698 patients with femoral or more-proximal deep vein thrombosis to either standard care (anticoagulant therapy and graduated elastic compression stockings) or standard care plus catheter-directed thrombolysis. In preliminary results presented at the Society of Interventional Radiology meeting in March 2017, although no difference was found in the primary outcome (postthrombotic syndrome at 24 months), catheter-directed thrombolysis for iliofemoral deep vein thrombosis led to a 25% reduction in moderate to severe postthrombotic syndrome.
Although it is too early to draw conclusions before publication of the ATTRACT study, the preliminary results highlight the need to individualize treatment and to be selective about using catheter-directed thrombolysis. The trials provide reassurance that catheter-directed lysis is a reasonable and safe intervention when performed by physicians experienced in the procedure. The risk of major bleeding appears to be low (about 2%) and that for intracranial hemorrhage even lower (< 0.5%).
Catheter-directed thrombolysis is appropriate in some cases
The 2016 ACCP guidelines1 recommend anticoagulant therapy alone over catheter-directed thrombolysis for patients with acute proximal deep vein thrombosis of the leg. However, it is a grade 2C (weak) recommendation.
They provide no specific recommendation as to the clinical indications for catheter-directed thrombolysis, but identify patients who would be most likely to benefit, ie, those who have:
Iliofemoral deep vein thrombosis
Symptoms for less than 14 days
Good functional status
Life expectancy of more than 1 year
Low risk of bleeding.
Our patient satisfies these criteria, suggesting that catheter-directed thrombolysis is a reasonable option for him.
Timing is important. Catheter-directed lysis is more likely to be beneficial if used before fibrin deposits form and stiffen the venous valves, causing irreversible damage that leads to postthrombotic syndrome.
Role of direct oral anticoagulants
The availability of direct oral anticoagulants has generated interest in defining their therapeutic role in patients with venous thromboembolism.
In a meta-analysis5 of major trials comparing direct oral anticoagulants and vitamin K antagonists such as warfarin, no significant difference was found for the risk of recurrent venous thromboembolism or venous thromboembolism-related deaths. However, fewer patients experienced major bleeding with direct oral anticoagulants (relative risk 0.61, P = .002). Although significant, the absolute risk reduction was small; the incidence of major bleeding was 1.1% with direct oral anticoagulants vs 1.8% with vitamin K antagonists.
The main advantage of direct oral anticoagulants is greater convenience for the patient.
The 2016 ACCP guidelines1 on the treatment of venous thrombosis and pulmonary embolism are summarized in Table 1. They suggest using direct oral anticoagulants rather than vitamin K antagonists to manage venous thromboembolism, but this is a weak (ie, grade 2B) recommendation, likely because the net clinical benefit of direct oral anticoagulants over vitamin K antagonists is modest.
WHICH PATIENTS ON WARFARIN NEED BRIDGING PREOPERATIVELY?
Many patients still take warfarin, particularly those with atrial fibrillation, a mechanical heart valve, or venous thromboembolism. In many countries, warfarin remains the dominant anticoagulant for stroke prevention. Whether these patients need heparin during the period of perioperative warfarin interruption is a frequently encountered scenario that, until recently, was controversial. Recent studies have helped to inform the need for heparin bridging in many of these patients.
Case 2: An elderly woman on warfarin facing cancer surgery
A 75-year-old woman weighing 65 kg is scheduled for elective colon resection for incidentally found colon cancer. She is taking warfarin for atrial fibrillation. She also has hypertension and diabetes and had a transient ischemic attack 10 years ago.
One doctor told her she needs to be assessed for heparin bridging, but another told her she does not need bridging.
The default management should be not to bridge patients who have atrial fibrillation, but to consider bridging in selected patients, such as those with recent stroke or transient ischemic attack or a prior thromboembolic event during warfarin interruption. However, decisions about bridging should not be made on the basis of the CHADS2 score alone. For the patient described here, I would recommend not bridging.
Complex factors contribute to stroke risk
Stroke risk for patients with atrial fibrillation can be quickly estimated with the CHADS2 score, based on:
Congestive heart failure (1 point)
Hypertension (1 point)
Age at least 75 (1 point)
Diabetes (1 point)
Stroke or transient ischemic attack (2 points).
Our patient has a score of 5, corresponding to an annual adjusted stroke risk of 12.5%. Whether her transient ischemic attack of 10 years ago is comparable in significance to a recent stroke is debatable and highlights a weakness of clinical prediction rules. Moreover, such prediction scores were developed to estimate the long-term risk of stroke if anticoagulants are not given, and they have not been assessed in a perioperative setting where there is short-term interruption of anticoagulants. Also, the perioperative milieu is associated with additional factors not captured in these clinical prediction rules that may affect the risk of stroke.
Thus, the risk of perioperative stroke likely involves the interplay of multiple factors, including the type of surgery the patient is undergoing. Some factors may be mitigated:
Rebound hypercoagulability after stopping an oral anticoagulant can be prevented by intraoperative blood pressure and volume control
Elevated biochemical factors (eg, D-dimer, B-type natriuretic peptide, troponin) may be lowered with perioperative aspirin therapy
Lipid and genetic factors may be mitigated with perioperative statin use.
Can heparin bridging also mitigate the risk?
Bridging in patients with atrial fibrillation
Most patients who are taking warfarin are doing so because of atrial fibrillation, so most evidence about perioperative bridging was developed in such patients.
The BRIDGE trial (Bridging Anticoagulation in Patients Who Require Temporary Interruption of Warfarin Therapy for an Elective Invasive Procedure or Surgery)6 was the first randomized controlled trial to compare a bridging and no-bridging strategy for patients with atrial fibrillation who required warfarin interruption for elective surgery. Nearly 2,000 patients were given either low-molecular-weight heparin or placebo starting 3 days before until 24 hours before a procedure, and then for 5 to 10 days afterwards. For all patients, warfarin was stopped 5 days before the procedure and was resumed within 24 hours afterwards.
A no-bridging strategy was noninferior to bridging: the risk of perioperative arterial thromboembolism was 0.4% without bridging vs 0.3% with bridging (P = .01 for noninferiority). In addition, a no-bridging strategy conferred a lower risk of major bleeding than bridging: 1.3% vs 3.2% (relative risk 0.41, P = .005 for superiority).
Although the difference in absolute bleeding risk was small, bleeding rates were lower than those seen outside of clinical trials, as the bridging protocol used in BRIDGE was designed to minimize the risk of bleeding. Also, although only 5% of patients had a CHADS2 score of 5 or 6, such patients are infrequent in clinical practice, and BRIDGE did include a considerable proportion (17%) of patients with a prior stroke or transient ischemic attack who would be considered at high risk.
Other evidence about heparin bridging is derived from observational studies, more than 10 of which have been conducted. In general, they have found that not bridging is associated with low rates of arterial thromboembolism (< 0.5%) and that bridging is associated with high rates of major bleeding (4%–7%).7–12
Bridging in patients with a mechanical heart valve
Warfarin is the only anticoagulant option for patients who have a mechanical heart valve. No randomized controlled trials have evaluated the benefits of perioperative bridging vs no bridging in this setting.
Observational (cohort) studies suggest that the risk of perioperative arterial thromboembolism is similar with or without bridging anticoagulation, although most patients studied were bridged and those not bridged were considered at low risk (eg, with a bileaflet aortic valve and no additional risk factors).13 However, without stronger evidence from randomized controlled trials, bridging should be the default management for patients with a mechanical heart valve. In our practice, we bridge most patients who have a mechanical heart valve unless they are considered to be at low risk, such as those who have a bileaflet aortic valve.
Bridging in patients with prior venous thromboembolism
Even less evidence is available for periprocedural management of patients who have a history of venous thromboembolism. No randomized controlled trials exist evaluating bridging vs no bridging. In 1 cohort study in which more than 90% of patients had had thromboembolism more than 3 months before the procedure, the rate of recurrent venous thromboembolism without bridging was less than 0.5%.14
It is reasonable to bridge patients who need anticoagulant interruption within 3 months of diagnosis of a deep vein thrombosis or pulmonary embolism, and to consider using a temporary inferior vena cava filter for patients who have had a clot who need treatment interruption during the initial 3 to 4 weeks after diagnosis.
Practice guidelines: Perioperative anticoagulation
The ACCP,15 the American College of Cardiology,16 and the American Heart Association17 have published guidelines for perioperative management of antithrombotic therapy. Despite a paucity of evidence from randomized trials, there are sufficient data to inform clinical management. Some guidelines are complex. A simplified algorithm has been proposed that considers the type of procedure, the CHADS2 score, whether the patient has a mechanical heart valve, and whether there has been a recent venous thromboembolic event.18
Guidance for preoperative and postoperative bridging for patients taking warfarin is summarized in Table 2.
CARDIAC PROCEDURES
For patients facing a procedure to implant an implantable cardioverter-defibrillator (ICD) or pacemaker, a procedure-specific concern is the avoidance of pocket hematoma.
Patients on warfarin: Do not bridge
The BRUISE CONTROL-1 trial (Bridge or Continue Coumadin for Device Surgery Randomized Controlled Trial)19 randomized patients undergoing pacemaker or ICD implantation to either continued anticoagulation therapy and not bridging (ie, continued warfarin so long as the international normalized ratio was < 3) vs conventional bridging treatment (ie, stopping warfarin and bridging with low-molecular-weight heparin). A clinically significant device-pocket hematoma occurred in 3.5% of the continued-warfarin group vs 16.0% in the heparin-bridging group (P < .001). Thromboembolic complications were rare, and rates did not differ between the 2 groups.
Results of the BRUISE CONTROL-1 trial serve as a caution to at least not be too aggressive with bridging. The study design involved resuming heparin 24 hours after surgery, which is perhaps more aggressive than standard practice. In our practice, we wait at least 24 hours to reinstate heparin after minor surgery, and 48 to 72 hours after surgery with higher bleeding risk.
These results are perhaps not surprising if one considers how carefully surgeons try to control bleeding during surgery for patients taking anticoagulants. For patients who are not on an anticoagulant, small bleeding may be less of a concern during a procedure. When high doses of heparin are introduced soon after surgery, small concerns during surgery may become big problems afterward.
Based on these results, it is reasonable to undertake device implantation without interruption of a vitamin K antagonist such as warfarin.
Patients on direct oral anticoagulants: The jury is still out
The similar BRUISE CONTROL-2 trial is currently under way, comparing interruption vs continuation of dabigatran for patients undergoing cardiac device surgery.
In Europe, surgeons are less concerned than those in the United States about operating while a patient is on anticoagulant therapy. But the safety of this practice is not backed by strong evidence.
Direct oral anticoagulants: Consider pharmacokinetics
Direct oral anticoagulants are potent and fast-acting, with a peak effect 1 to 3 hours after intake. This rapid anticoagulant action is similar to that of bridging with low-molecular-weight heparin, and caution is needed when administering direct oral anticoagulants, especially after major surgery or surgery with a high bleeding risk.
Frost et al20 compared the pharmacokinetics of apixaban (with twice-daily dosing) and rivaroxaban (once-daily dosing) and found that peak anticoagulant activity is faster and higher with rivaroxaban. This is important, because many patients will take their anticoagulant first thing in the morning. Consequently, if patients require any kind of procedure (including dental), they should skip the morning dose of the direct oral anticoagulant to avoid having the procedure done during the peak anticoagulant effect, and they should either not take that day’s dose or defer the dose until the evening after the procedure.
MANAGING SURGERY FOR PATIENTS ON A DIRECT ORAL ANTICOAGULANT
Case 3: An elderly woman on apixaban facing surgery
Let us imagine that our previous patient takes apixaban instead of warfarin. She is 75 years old, has atrial fibrillation, and is about to undergo elective colon resection for cancer. One doctor advises her to simply stop apixaban for 2 days, while another says she should go off apixaban for 5 days and will need bridging. Which plan is best?
In the perioperative setting, our goal is to interrupt patients’ anticoagulant therapy for the shortest time that results in no residual anticoagulant effect at the time of the procedure.
The European Society of Regional Anaesthesia and Pain Therapy and the American Society of Regional Anesthesia and Pain Medicine21 recommend an extended period of interruption of direct oral anticoagulants (Table 3)
They further recommend that if the risk of venous thromboembolism is high, low-molecular-weight heparin bridging should be done while stopping the direct oral anticoagulant, with the heparin discontinued 24 hours before the procedure. This recommendation seems counterintuitive, as it is advising replacing a short-acting anticoagulant with low-molecular-weight heparin, another short-acting anticoagulant.
The guidelines committee was unable to provide strength and grading of their recommendations, as too few well-designed studies are available to support them. The doctor in case 3 who advised stopping apixaban for 5 days and bridging is following the guidelines, but without much evidence to support this strategy.
Is bridging needed during interruption of a direct oral anticoagulant?
There are no randomized, controlled trials of bridging vs no bridging in patients taking direct oral anticoagulants. Substudies exist of patients taking these drugs for atrial fibrillation who had treatment interrupted for procedures, but the studies did not randomize bridging vs no bridging, nor were bridging regimens standardized. Three of the four atrial fibrillation trials had a blinded design (warfarin vs direct oral anticoagulants), making perioperative management difficult, as physicians did not know the pharmacokinetics of the drugs their patients were taking.22–24
We used the database from the Randomized Evaluation of Long-Term Anticoagulation Therapy (RE-LY) trial22 to evaluate bridging in patients taking either warfarin or dabigatran. With an open-label study design (the blinding was only for the 110 mg and 150 mg dabigatran doses), clinicians were aware of whether patients were receiving warfarin or dabigatran, thereby facilitating perioperative management. Among dabigatran-treated patients, those who were bridged had significantly more major bleeding than those not bridged (6.5% vs 1.8%, P < .001), with no difference between the groups for stroke or systemic embolism. Although it is not a randomized controlled trial, it does provide evidence that bridging may not be advisable for patients taking a direct oral anticoagulant.
The 2017 American College of Cardiology guidelines25 conclude that parenteral bridging is not indicated for direct oral anticoagulants. Although this is not based on strong evidence, the guidance appears reasonable according to the evidence at hand.
The 2017 American Heart Association Guidelines16 recommend a somewhat complex approach based on periprocedural bleeding risk and thromboembolic risk.
How long to interrupt direct oral anticoagulants?
Table 4 shows a simplified approach to interrupting direct oral anticoagulants that we use in Canada. The approach takes into account the type of surgery and kidney function for patients taking dabigatran, a drug that depends more on renal clearance than the other direct oral anticoagulants do.26
Evidence for this approach comes from a prospective cohort study27 of 541 patients being treated with dabigatran who were having an elective surgery or invasive procedure. Patients received standard perioperative management, with the timing of the last dabigatran dose before the procedure (24 hours, 48 hours, or 96 hours) based on the bleeding risk of surgery and the patient’s creatinine clearance. Dabigatran was resumed 24 to 72 hours after the procedure. No heparin bridging was done. Patients were followed for up to 30 days postoperatively. The results were favorable with few complications: one transient ischemic attack (0.2%), 10 major bleeding episodes (1.8%), and 28 minor bleeding episodes (5.2%).
A subgroup of 181 patients in this study28 had a plasma sample drawn just before surgery, allowing the investigators to assess the level of coagulation factors after dabigatran interruption. Results were as follows:
93% had a normal prothrombin time
80% had a normal activated partial thromboplastin time
33% had a normal thrombin time
81% had a normal dilute thrombin time.
The dilute thrombin time is considered the most reliable test of the anticoagulant effect of dabigatran but is not widely available. The activated partial thromboplastin time can provide a more widely used coagulation test to assess (in a less precise manner) whether there is an anticoagulant effect of dabigatran present, and more sensitive activated partial thromboplastin time assays can be used to better detect any residual dabigatran effect.
Dabigatran levels were also measured. Although 66% of patients had low drug levels just before surgery, the others still had substantial dabigatran on board. The fact that bleeding event rates were so low in this study despite the presence of dabigatran in many patients raises the question of whether having some drug on board is a good predictor of bleeding risk.
An interruption protocol with a longer interruption interval—12 to 14 hours longer than in the previous study (3 days for high-bleed risk procedures, 2 days for low-bleed risk procedures)—brought the activated partial thromboplastin time and dilute thrombin time to normal levels for 100% of patients with the protocol for high-bleeding-risk surgery. This study was based on small numbers and its interruption strategy needs further investigation.29
Case 3 continued
Based on the current empiric evidence, we recommend interrupting direct oral anticoagulants for 2 days (or approximately a 60-hour interval between the last dose and surgery) for this 75-year-old woman who is taking apixaban (Table 5). This interruption interval corresponds to 5 elimination half-lives for apixaban, which should result in little to no residual anticoagulant and will facilitate major surgery and, if indicated, neuraxial anesthesia.
The PAUSE study (NCT02228798), a multicenter, prospective cohort study, is designed to establish a safe, standardized protocol for the perioperative management of patients with atrial fibrillation taking dabigatran, rivaroxaban, or apixaban and will include 3,300 patients.
PATIENTS WITH A CORONARY STENT WHO NEED SURGERY
Case 4: A woman with a stent facing surgery
A 70-year-old woman needs breast cancer resection. She has coronary artery disease and had a drug-eluting stent placed 5 months ago after elective cardiac catheterization. She also has hypertension, obesity, and type 2 diabetes. Her medications include an angiotensin II receptor blocker, hydrochlorothiazide, insulin, and an oral hypoglycemic. She is also taking aspirin 81 mg daily and ticagrelor (a P2Y12 receptor antagonist) 90 mg twice daily.
Her cardiologist is concerned that stopping antiplatelet therapy could trigger acute stent thrombosis, which has a 50% or higher mortality rate.
Should she stop taking aspirin before surgery? What about the ticagrelor?
Is aspirin safe during surgery?
Evidence concerning aspirin during surgery comes from Perioperative Ischemic Evaluation 2 (POISE-2), a double-blind, randomized controlled trial.30 Patients who had known cardiovascular disease or risk factors for cardiovascular disease and were about to undergo noncardiac surgery were stratified according to whether they had been taking aspirin before the study (patients taking aspirin within 72 hours of the surgery were excluded from randomization). Participants in each group were randomized to take either aspirin or placebo just before surgery. The primary outcome was the combined rate of death or nonfatal myocardial infarction 30 days after randomization.
The study found no differences in the primary end point between the two groups. However, major bleeding occurred significantly more often in the aspirin group (4.6% vs 3.8%, hazard ratio 1.2, 95% confidence interval 1.0–1.5).
Moreover, only 4% of the patients in this trial had a cardiac stent. The trial excluded patients who had had a bare-metal stent placed within 6 weeks or a drug-eluting stent placed within 1 year, so it does not help us answer whether aspirin should be stopped for our current patient.
Is surgery safe for patients with stents?
The safety of undergoing surgery with a stent was investigated in a large US Veterans Administration retrospective cohort study.31 More than 20,000 patients with stents who underwent noncardiac surgery within 2 years of stent placement were compared with a control group of more than 41,000 patients with stents who did not undergo surgery. Patients were matched by stent type and cardiac risk factors at the time of stent placement.
The risk of an adverse cardiac event in both the surgical and nonsurgical cohorts was highest in the initial 6 weeks after stent placement and plateaued 6 months after stent placement, when the risk difference between the surgical and nonsurgical groups leveled off to 1%.
The risk of a major adverse cardiac event postoperatively was much more dependent on the timing of stent placement in complex and inpatient surgeries. For outpatient surgeries, the risk of a major cardiac event was very low and the timing of stent placement did not matter.
A Danish observational study32 compared more than 4,000 patients with drug-eluting stents having surgery to more than 20,000 matched controls without coronary heart disease having similar surgery. The risk of myocardial infarction or cardiac death was much higher for patients undergoing surgery within 1 month after drug-eluting stent placement compared with controls without heart disease and patients with stent placement longer than 1 month before surgery.
Our practice is to continue aspirin for surgery in patients with coronary stents regardless of the timing of placement. Although there is a small increased risk of bleeding, this must be balanced against thrombotic risk. We typically stop clopidogrel 5 to 7 days before surgery and ticagrelor 3 to 5 days before surgery. We may decide to give platelets before very-high-risk surgery (eg, intracranial, spinal) if there is a decision to continue both antiplatelet drugs—for example, in a patient who recently received a drug-eluting stent (ie, within 3 months). It is essential to involve the cardiologist and surgeon in these decisions.
BOTTOM LINE
Navigating the anticoagulant landscape in 2017 is complex. Doctors should review professional society guidelines while considering the strength of evidence on which they are based and tailor management to individual patient characteristics. Table 6 summarizes the management recommendations reviewed in this article.
References
Kearon C, Aki EA, Ornelas J, et al. Antithrombotic therapy for VTE disease: CHEST guideline and expert panel report. Chest 2016; 149:315–352.
Enden T, Haig Y, Klow NE, et al; CaVenT Study Group. Long-term outcome after additional catheter-directed thrombolysis versus standard treatment for acute iliofemoral deep vein thrombosis (the CaVenT study): a randomised controlled trial. Lancet 2012; 379:31–38.
Haig Y, Enden T, Grotta O, et al; CaVenT Study Group. Post-thrombotic syndrome after catheter-directed thrombolysis for deep vein thrombosis (CaVenT): 5-year follow-up results of an open-label, randomized controlled trial. Lancet Haematol 2016; 3:e64–e71.
Vedantham S, Goldhaber SZ, Kahn SR, et al. Rationale and design of the ATTRACT Study: a multicenter randomized trial to evaluate pharmacomechanical catheter-directed thrombolysis for the prevention of postthrombotic syndrome in patients with proximal deep vein thrombosis. Am Heart J 2013; 165:523–530.
Van Es N, Coppens M, Schulman S, Middeldorp S, Buller HR. Direct oral anticoagulants compared with vitamin K antagonists for acute venous thromboembolism: evidence from phase 3 trials. Blood 2014; 124:1968–1975.
Douketis JD, Spyropoulos AC, Kaatz S, et al; BRIDGE Investigators. Perioperative bridging anticoagulation in patients with atrial fibrillation. N Engl J Med 2015; 373:823–833.
Douketis J, Johnson JA, Turpie AG. Low-molecular-weight heparin as bridging anticoagulation during interruption of warfarin: assessment of a standardized periprocedural anticoagulation regimen. Arch Intern Med 2004; 164:1319–1326.
Dunn AS, Spyropoulos AC, Turpie AG. Bridging therapy in patients on long-term oral anticoagulants who require surgery: the Prospective Peri-operative Enoxaparin Cohort Trial (PROSPECT). J Thromb Haemost 2007; 5:2211–2218.
Kovacs MJ, Kearon C, Rodger M, et al. Single-arm study of bridging therapy with low-molecular-weight heparin for patients at risk of arterial embolism who require temporary interruption of warfarin. Circulation 2004; 110:1658–1663.
Spyropoulos AC, Turpie AG, Dunn AS, et al; REGIMEN Investigators. Clinical outcomes with unfractionated heparin or low-molecular-weight heparin as bridging therapy in patients on long-term oral anticoagulants: the REGIMEN registry. J Thromb Haemost 2006; 4:1246–1252.
Douketis JD, Woods K, Foster GA, Crowther MA. Bridging anticoagulation with low-molecular-weight heparin after interruption of warfarin therapy is associated with a residual anticoagulant effect prior to surgery. Thromb Haemost 2005; 94:528–531.
Schulman S, Hwang HG, Eikelboom JW, Kearon C, Pai M, Delaney J. Loading dose vs. maintenance dose of warfarin for reinitiation after invasive procedures: a randomized trial. J Thromb Haemost 2014; 12:1254-1259.
Siegal D, Yudin J, Kaatz S, Douketis JD, Lim W, Spyropoulos AC. Periprocedural heparin bridging in patients receiving vitamin K antagonists: systematic review and meta-analysis of bleeding and thromboembolic rates. Circulation 2012; 126:1630–1639.
Skeith L, Taylor J, Lazo-Langner A, Kovacs MJ. Conservative perioperative anticoagulation management in patients with chronic venous thromboembolic disease: a cohort study. J Thromb Haemost 2012; 10:2298–2304.
Douketis JD, Spyropoulos AC, Spencer FA, et al. Perioperative management of antithrombotic therapy: Antithrombotic Therapy and Prevention of Thrombosis, 9th ed: American College of Chest Physicians evidence-based clinical practice guidelines. Chest 2012; 141(2 suppl):e326S–e350S.
Doherty JU, Gluckman TJ, Hucker WJ, et al. 2017 ACC expert consensus decision pathway for periprocedural management of anticoagulation in patients with nonvalvular atrial fibrillation: a report of the American College of Cardiology Clinical Expert Consensus Document Task Force. J Am Coll Cardiol 2017; 69:871–898.
Raval AN, Cigarroa JE, Chung MK, et al; American Heart Association Clinical Pharmacology Subcommittee of the Acute Cardiac Care and General Cardiology Committee of the Council on Clinical Cardiology; Council on Cardiovascular Disease in the Young; and Council on Quality of Care and Outcomes Research. Management of patients on non-vitamin K antagonist oral anticoagulants in the acute care and periprocedural setting: a scientific statement from the American Heart Association. Circulation 2017; 135:e604–e633.
Tafur A, Douketis J. Perioperative anticoagulant management in patients with atrial fibrillation: practical implications of recent clinical trials. Pol Arch Med Wewn 2015; 125:666–671.
Birnie DH, Healey JS, Wells GA, et al: BRUISE CONTROL Investigators. Pacemaker or defibrillator surgery without interruption of anticoagulation. N Engl J Med 2013; 368:2084–2093.
Frost C, Song Y, Barrett YC, et al. A randomized direct comparison of the pharmacokinetics and pharmacodynamics of apixaban and rivaroxaban. Clin Pharmacol 2014; 6:179–187.
Narouze S, Benzon HT, Provenzano DA, et al. Interventional spine and pain procedures in patients on antiplatelet and anticoagulant medications: guidelines from the American Society of Regional Anesthesia and Pain Medicine, the European Society of Regional Anesthesia and Pain Therapy, the American Academy of Pain Medicine, the International Neuromodulation Society, the North American Neuromodulation Society, and the World institute of Pain. Reg Anesth Pain Med 2015; 40:182–212.
Douketis JD, Healey JS, Brueckmann M, et al. Perioperative bridging anticoagulation during dabigatran or warfarin interruption among patients who had an elective surgery or procedure. Substudy of the RE-LY trial. Thromb Haemost 2015; 113:625–632.
Steinberg BA, Peterson ED, Kim S, et al; Outcomes Registry for Better Informed Treatment of Atrial Fibrillation Investigators and Patients. Use and outcomes associated with bridging during anticoagulation interruptions in patients with atrial fibrillation: findings from the Outcomes Registry for Better Informed Treatment of Atrial Fibrillation (ORBIT-AF). Circulation 2015; 131:488–494.
Garcia D, Alexander JH, Wallentin L, et al. Management and clinical outcomes in patients treated with apixaban vs warfarin undergoing procedures. Blood 2014; 124:3692–3698.
Doherty JU, Gluckman TJ, Hucker WJ, et al. 2017 ACC expert consensus decision pathway for periprocedural management of anticoagulation in patients with nonvalvular atrial fibrillation: a report of the American College of Cardiology Clinical Expert Consensus Document Task Force. J Am Coll Cardiol 2017; 69:871–898.
Schulman S, Carrier M, Lee AY, et al; Periop Dabigatran Study Group. Perioperative management of dabigatran: a prospective cohort study. Circulation 2015; 132:167–173.
Douketis JD, Wang G, Chan N, et al. Effect of standardized perioperative dabigatran interruption on the residual anticoagulation effect at the time of surgery or procedure. J Thromb Haemost 2016; 14:89–97.
Douketis JD, Syed S, Schulman S. Periprocedural management of direct oral anticoagulants: comment on the 2015 American Society of Regional Anesthesia and Pain Medicine guidelines. Reg Anesth Pain Med 2016; 41:127–129.
Devereaux PJ, Mrkobrada M, Sessler DI, et al; POISE-2 Investigators. Aspirin in patients undergoing noncardiac surgery. N Engl J Med 2014; 370:1494–1503.
Holcomb CN, Graham LA, Richman JS, et al. The incremental risk of noncardiac surgery on adverse cardiac events following coronary stenting. J Am Coll Cardiol 2014; 64:2730–2739.
Egholm G, Kristensen SD, Thim T, et al. Risk associated with surgery within 12 months after coronary drug-eluting stent implantation. J Am Coll Cardiol 2016; 68:2622–2632.
James D. Douketis, MD, FRCP(C), FACP, FCCP Professor of Medicine, McMaster University, Hamilton, ON, Canada; Chair, American College of Physicians Practice Guidelines in Perioperative Management of Antithrombotic Therapy
Address: James D. Douketis, MD, St Joseph’s Healthcare Hamilton, Room F-544, 50 Charlton Ave E, Hamilton, ON, Canada L8N 4A6; [email protected]
This article is based on an edited transcript from a Heart and Vascular Institute Grand Rounds presentation at Cleveland Clinic. It was approved by the author but not peer-reviewed.
Author and Disclosure Information
James D. Douketis, MD, FRCP(C), FACP, FCCP Professor of Medicine, McMaster University, Hamilton, ON, Canada; Chair, American College of Physicians Practice Guidelines in Perioperative Management of Antithrombotic Therapy
Address: James D. Douketis, MD, St Joseph’s Healthcare Hamilton, Room F-544, 50 Charlton Ave E, Hamilton, ON, Canada L8N 4A6; [email protected]
This article is based on an edited transcript from a Heart and Vascular Institute Grand Rounds presentation at Cleveland Clinic. It was approved by the author but not peer-reviewed.
This article reviews recommendations and evidence concerning current anticoagulant management for venous thromboembolism and perioperative care, with an emphasis on individualizing treatment for real-world patients.
TREATING ACUTE VENOUS THROMBOEMBOLISM
Case 1: Deep vein thrombosis in an otherwise healthy man
A 40-year-old man presents with 7 days of progressive right leg swelling. He has no antecedent risk factors for deep vein thrombosis or other medical problems. Venous ultrasonography reveals an iliofemoral deep vein thrombosis. How should he be managed?
Outpatient treatment with low-molecular-weight heparin for 4 to 6 days plus warfarin
Outpatient treatment with a direct oral anticoagulant, ie, apixaban, dabigatran (which requires 4 to 6 days of initial treatment with low-molecular-weight heparin), or rivaroxaban
Catheter-directed thrombolysis followed by low-molecular-weight heparin, then warfarin or a direct oral anticoagulant
Inpatient intravenous heparin for 7 to 10 days, then warfarin or a direct oral anticoagulant
All of these are acceptable for managing acute venous thromboembolism, but the clinician’s role is to identify which treatment is most appropriate for an individual patient.
Deep vein thrombosis is not a single condition
Multiple guidelines exist to help decide on a management strategy. Those of the American College of Chest Physicians (ACCP)1 are used most often.
That said, guidelines are established for “average” patients, so it is important to look beyond guidelines and individualize management. Venous thromboembolism is not a single entity; it has a myriad of clinical presentations that could call for different treatments. Most patients have submassive deep vein thrombosis or pulmonary embolism, which is not limb-threatening nor associated with hemodynamic instability. It can also differ in terms of etiology and can be unprovoked (or idiopathic), cancer-related, catheter-associated, or provoked by surgery or immobility.
Deep vein thrombosis has a wide spectrum of presentations. It can involve the veins of the calf only, or it can involve the femoral and iliac veins and other locations including the splanchnic veins, the cerebral sinuses, and upper extremities. Pulmonary embolism can be massive (defined as being associated with hemodynamic instability or impending respiratory failure) or submassive. Similarly, patients differ in terms of baseline medical conditions, mobility, and lifestyle. Anticoagulant management decisions should take all these factors into account.
Consider clot location
Our patient with iliofemoral deep vein thrombosis is best managed differently than a more typical patient with less extensive thrombosis that would involve the popliteal or femoral vein segments, or both. A clot that involves the iliac vein is more likely to lead to postthrombotic chronic pain and swelling as the lack of venous outflow bypass channels to circumvent the clot location creates higher venous pressure within the affected leg. Therefore, for our patient, catheter-directed thrombolysis is an option that should be considered.
Catheter-directed thrombolysis trials
According to the “open-vein hypothesis,” quickly eliminating the thrombus and restoring unobstructed venous flow may mitigate the risk not only of recurrent thrombosis, but also of postthrombotic syndrome, which is often not given much consideration acutely but can cause significant, life-altering chronic disability.
The “valve-integrity hypothesis” is also important; it considers whether lytic therapy may help prevent damage to such valves in an attempt to mitigate the amount of venous hypertension.
Thus, catheter-directed thrombolysis offers theoretical benefits, and recent trials have assessed it against standard anticoagulation treatments.
The CaVenT trial (Catheter-Directed Venous Thrombolysis),2 conducted in Norway, randomized 209 patients with midfemoral to iliac deep vein thrombosis to conventional treatment (anticoagulation alone) or anticoagulation plus catheter-directed thrombolysis. At 2 years, postthrombotic syndrome had occurred in 41% of the catheter-directed thrombolysis group compared with 56% of the conventional treatment group (P = .047). At 5 years, the difference widened to 43% vs 71% (P < .01, number needed to treat = 4).3 Despite the superiority of lytic therapy, the incidence of postthrombotic syndrome remained high in patients who received this treatment.
The ATTRACT trial (Acute Venous Thrombosis: Thrombus Removal With Adjunctive Catheter-Directed Thrombolysis),4 a US multicenter, open-label, assessor-blind study, randomized 698 patients with femoral or more-proximal deep vein thrombosis to either standard care (anticoagulant therapy and graduated elastic compression stockings) or standard care plus catheter-directed thrombolysis. In preliminary results presented at the Society of Interventional Radiology meeting in March 2017, although no difference was found in the primary outcome (postthrombotic syndrome at 24 months), catheter-directed thrombolysis for iliofemoral deep vein thrombosis led to a 25% reduction in moderate to severe postthrombotic syndrome.
Although it is too early to draw conclusions before publication of the ATTRACT study, the preliminary results highlight the need to individualize treatment and to be selective about using catheter-directed thrombolysis. The trials provide reassurance that catheter-directed lysis is a reasonable and safe intervention when performed by physicians experienced in the procedure. The risk of major bleeding appears to be low (about 2%) and that for intracranial hemorrhage even lower (< 0.5%).
Catheter-directed thrombolysis is appropriate in some cases
The 2016 ACCP guidelines1 recommend anticoagulant therapy alone over catheter-directed thrombolysis for patients with acute proximal deep vein thrombosis of the leg. However, it is a grade 2C (weak) recommendation.
They provide no specific recommendation as to the clinical indications for catheter-directed thrombolysis, but identify patients who would be most likely to benefit, ie, those who have:
Iliofemoral deep vein thrombosis
Symptoms for less than 14 days
Good functional status
Life expectancy of more than 1 year
Low risk of bleeding.
Our patient satisfies these criteria, suggesting that catheter-directed thrombolysis is a reasonable option for him.
Timing is important. Catheter-directed lysis is more likely to be beneficial if used before fibrin deposits form and stiffen the venous valves, causing irreversible damage that leads to postthrombotic syndrome.
Role of direct oral anticoagulants
The availability of direct oral anticoagulants has generated interest in defining their therapeutic role in patients with venous thromboembolism.
In a meta-analysis5 of major trials comparing direct oral anticoagulants and vitamin K antagonists such as warfarin, no significant difference was found for the risk of recurrent venous thromboembolism or venous thromboembolism-related deaths. However, fewer patients experienced major bleeding with direct oral anticoagulants (relative risk 0.61, P = .002). Although significant, the absolute risk reduction was small; the incidence of major bleeding was 1.1% with direct oral anticoagulants vs 1.8% with vitamin K antagonists.
The main advantage of direct oral anticoagulants is greater convenience for the patient.
The 2016 ACCP guidelines1 on the treatment of venous thrombosis and pulmonary embolism are summarized in Table 1. They suggest using direct oral anticoagulants rather than vitamin K antagonists to manage venous thromboembolism, but this is a weak (ie, grade 2B) recommendation, likely because the net clinical benefit of direct oral anticoagulants over vitamin K antagonists is modest.
WHICH PATIENTS ON WARFARIN NEED BRIDGING PREOPERATIVELY?
Many patients still take warfarin, particularly those with atrial fibrillation, a mechanical heart valve, or venous thromboembolism. In many countries, warfarin remains the dominant anticoagulant for stroke prevention. Whether these patients need heparin during the period of perioperative warfarin interruption is a frequently encountered scenario that, until recently, was controversial. Recent studies have helped to inform the need for heparin bridging in many of these patients.
Case 2: An elderly woman on warfarin facing cancer surgery
A 75-year-old woman weighing 65 kg is scheduled for elective colon resection for incidentally found colon cancer. She is taking warfarin for atrial fibrillation. She also has hypertension and diabetes and had a transient ischemic attack 10 years ago.
One doctor told her she needs to be assessed for heparin bridging, but another told her she does not need bridging.
The default management should be not to bridge patients who have atrial fibrillation, but to consider bridging in selected patients, such as those with recent stroke or transient ischemic attack or a prior thromboembolic event during warfarin interruption. However, decisions about bridging should not be made on the basis of the CHADS2 score alone. For the patient described here, I would recommend not bridging.
Complex factors contribute to stroke risk
Stroke risk for patients with atrial fibrillation can be quickly estimated with the CHADS2 score, based on:
Congestive heart failure (1 point)
Hypertension (1 point)
Age at least 75 (1 point)
Diabetes (1 point)
Stroke or transient ischemic attack (2 points).
Our patient has a score of 5, corresponding to an annual adjusted stroke risk of 12.5%. Whether her transient ischemic attack of 10 years ago is comparable in significance to a recent stroke is debatable and highlights a weakness of clinical prediction rules. Moreover, such prediction scores were developed to estimate the long-term risk of stroke if anticoagulants are not given, and they have not been assessed in a perioperative setting where there is short-term interruption of anticoagulants. Also, the perioperative milieu is associated with additional factors not captured in these clinical prediction rules that may affect the risk of stroke.
Thus, the risk of perioperative stroke likely involves the interplay of multiple factors, including the type of surgery the patient is undergoing. Some factors may be mitigated:
Rebound hypercoagulability after stopping an oral anticoagulant can be prevented by intraoperative blood pressure and volume control
Elevated biochemical factors (eg, D-dimer, B-type natriuretic peptide, troponin) may be lowered with perioperative aspirin therapy
Lipid and genetic factors may be mitigated with perioperative statin use.
Can heparin bridging also mitigate the risk?
Bridging in patients with atrial fibrillation
Most patients who are taking warfarin are doing so because of atrial fibrillation, so most evidence about perioperative bridging was developed in such patients.
The BRIDGE trial (Bridging Anticoagulation in Patients Who Require Temporary Interruption of Warfarin Therapy for an Elective Invasive Procedure or Surgery)6 was the first randomized controlled trial to compare a bridging and no-bridging strategy for patients with atrial fibrillation who required warfarin interruption for elective surgery. Nearly 2,000 patients were given either low-molecular-weight heparin or placebo starting 3 days before until 24 hours before a procedure, and then for 5 to 10 days afterwards. For all patients, warfarin was stopped 5 days before the procedure and was resumed within 24 hours afterwards.
A no-bridging strategy was noninferior to bridging: the risk of perioperative arterial thromboembolism was 0.4% without bridging vs 0.3% with bridging (P = .01 for noninferiority). In addition, a no-bridging strategy conferred a lower risk of major bleeding than bridging: 1.3% vs 3.2% (relative risk 0.41, P = .005 for superiority).
Although the difference in absolute bleeding risk was small, bleeding rates were lower than those seen outside of clinical trials, as the bridging protocol used in BRIDGE was designed to minimize the risk of bleeding. Also, although only 5% of patients had a CHADS2 score of 5 or 6, such patients are infrequent in clinical practice, and BRIDGE did include a considerable proportion (17%) of patients with a prior stroke or transient ischemic attack who would be considered at high risk.
Other evidence about heparin bridging is derived from observational studies, more than 10 of which have been conducted. In general, they have found that not bridging is associated with low rates of arterial thromboembolism (< 0.5%) and that bridging is associated with high rates of major bleeding (4%–7%).7–12
Bridging in patients with a mechanical heart valve
Warfarin is the only anticoagulant option for patients who have a mechanical heart valve. No randomized controlled trials have evaluated the benefits of perioperative bridging vs no bridging in this setting.
Observational (cohort) studies suggest that the risk of perioperative arterial thromboembolism is similar with or without bridging anticoagulation, although most patients studied were bridged and those not bridged were considered at low risk (eg, with a bileaflet aortic valve and no additional risk factors).13 However, without stronger evidence from randomized controlled trials, bridging should be the default management for patients with a mechanical heart valve. In our practice, we bridge most patients who have a mechanical heart valve unless they are considered to be at low risk, such as those who have a bileaflet aortic valve.
Bridging in patients with prior venous thromboembolism
Even less evidence is available for periprocedural management of patients who have a history of venous thromboembolism. No randomized controlled trials exist evaluating bridging vs no bridging. In 1 cohort study in which more than 90% of patients had had thromboembolism more than 3 months before the procedure, the rate of recurrent venous thromboembolism without bridging was less than 0.5%.14
It is reasonable to bridge patients who need anticoagulant interruption within 3 months of diagnosis of a deep vein thrombosis or pulmonary embolism, and to consider using a temporary inferior vena cava filter for patients who have had a clot who need treatment interruption during the initial 3 to 4 weeks after diagnosis.
Practice guidelines: Perioperative anticoagulation
The ACCP,15 the American College of Cardiology,16 and the American Heart Association17 have published guidelines for perioperative management of antithrombotic therapy. Despite a paucity of evidence from randomized trials, there are sufficient data to inform clinical management. Some guidelines are complex. A simplified algorithm has been proposed that considers the type of procedure, the CHADS2 score, whether the patient has a mechanical heart valve, and whether there has been a recent venous thromboembolic event.18
Guidance for preoperative and postoperative bridging for patients taking warfarin is summarized in Table 2.
CARDIAC PROCEDURES
For patients facing a procedure to implant an implantable cardioverter-defibrillator (ICD) or pacemaker, a procedure-specific concern is the avoidance of pocket hematoma.
Patients on warfarin: Do not bridge
The BRUISE CONTROL-1 trial (Bridge or Continue Coumadin for Device Surgery Randomized Controlled Trial)19 randomized patients undergoing pacemaker or ICD implantation to either continued anticoagulation therapy and not bridging (ie, continued warfarin so long as the international normalized ratio was < 3) vs conventional bridging treatment (ie, stopping warfarin and bridging with low-molecular-weight heparin). A clinically significant device-pocket hematoma occurred in 3.5% of the continued-warfarin group vs 16.0% in the heparin-bridging group (P < .001). Thromboembolic complications were rare, and rates did not differ between the 2 groups.
Results of the BRUISE CONTROL-1 trial serve as a caution to at least not be too aggressive with bridging. The study design involved resuming heparin 24 hours after surgery, which is perhaps more aggressive than standard practice. In our practice, we wait at least 24 hours to reinstate heparin after minor surgery, and 48 to 72 hours after surgery with higher bleeding risk.
These results are perhaps not surprising if one considers how carefully surgeons try to control bleeding during surgery for patients taking anticoagulants. For patients who are not on an anticoagulant, small bleeding may be less of a concern during a procedure. When high doses of heparin are introduced soon after surgery, small concerns during surgery may become big problems afterward.
Based on these results, it is reasonable to undertake device implantation without interruption of a vitamin K antagonist such as warfarin.
Patients on direct oral anticoagulants: The jury is still out
The similar BRUISE CONTROL-2 trial is currently under way, comparing interruption vs continuation of dabigatran for patients undergoing cardiac device surgery.
In Europe, surgeons are less concerned than those in the United States about operating while a patient is on anticoagulant therapy. But the safety of this practice is not backed by strong evidence.
Direct oral anticoagulants: Consider pharmacokinetics
Direct oral anticoagulants are potent and fast-acting, with a peak effect 1 to 3 hours after intake. This rapid anticoagulant action is similar to that of bridging with low-molecular-weight heparin, and caution is needed when administering direct oral anticoagulants, especially after major surgery or surgery with a high bleeding risk.
Frost et al20 compared the pharmacokinetics of apixaban (with twice-daily dosing) and rivaroxaban (once-daily dosing) and found that peak anticoagulant activity is faster and higher with rivaroxaban. This is important, because many patients will take their anticoagulant first thing in the morning. Consequently, if patients require any kind of procedure (including dental), they should skip the morning dose of the direct oral anticoagulant to avoid having the procedure done during the peak anticoagulant effect, and they should either not take that day’s dose or defer the dose until the evening after the procedure.
MANAGING SURGERY FOR PATIENTS ON A DIRECT ORAL ANTICOAGULANT
Case 3: An elderly woman on apixaban facing surgery
Let us imagine that our previous patient takes apixaban instead of warfarin. She is 75 years old, has atrial fibrillation, and is about to undergo elective colon resection for cancer. One doctor advises her to simply stop apixaban for 2 days, while another says she should go off apixaban for 5 days and will need bridging. Which plan is best?
In the perioperative setting, our goal is to interrupt patients’ anticoagulant therapy for the shortest time that results in no residual anticoagulant effect at the time of the procedure.
The European Society of Regional Anaesthesia and Pain Therapy and the American Society of Regional Anesthesia and Pain Medicine21 recommend an extended period of interruption of direct oral anticoagulants (Table 3)
They further recommend that if the risk of venous thromboembolism is high, low-molecular-weight heparin bridging should be done while stopping the direct oral anticoagulant, with the heparin discontinued 24 hours before the procedure. This recommendation seems counterintuitive, as it is advising replacing a short-acting anticoagulant with low-molecular-weight heparin, another short-acting anticoagulant.
The guidelines committee was unable to provide strength and grading of their recommendations, as too few well-designed studies are available to support them. The doctor in case 3 who advised stopping apixaban for 5 days and bridging is following the guidelines, but without much evidence to support this strategy.
Is bridging needed during interruption of a direct oral anticoagulant?
There are no randomized, controlled trials of bridging vs no bridging in patients taking direct oral anticoagulants. Substudies exist of patients taking these drugs for atrial fibrillation who had treatment interrupted for procedures, but the studies did not randomize bridging vs no bridging, nor were bridging regimens standardized. Three of the four atrial fibrillation trials had a blinded design (warfarin vs direct oral anticoagulants), making perioperative management difficult, as physicians did not know the pharmacokinetics of the drugs their patients were taking.22–24
We used the database from the Randomized Evaluation of Long-Term Anticoagulation Therapy (RE-LY) trial22 to evaluate bridging in patients taking either warfarin or dabigatran. With an open-label study design (the blinding was only for the 110 mg and 150 mg dabigatran doses), clinicians were aware of whether patients were receiving warfarin or dabigatran, thereby facilitating perioperative management. Among dabigatran-treated patients, those who were bridged had significantly more major bleeding than those not bridged (6.5% vs 1.8%, P < .001), with no difference between the groups for stroke or systemic embolism. Although it is not a randomized controlled trial, it does provide evidence that bridging may not be advisable for patients taking a direct oral anticoagulant.
The 2017 American College of Cardiology guidelines25 conclude that parenteral bridging is not indicated for direct oral anticoagulants. Although this is not based on strong evidence, the guidance appears reasonable according to the evidence at hand.
The 2017 American Heart Association Guidelines16 recommend a somewhat complex approach based on periprocedural bleeding risk and thromboembolic risk.
How long to interrupt direct oral anticoagulants?
Table 4 shows a simplified approach to interrupting direct oral anticoagulants that we use in Canada. The approach takes into account the type of surgery and kidney function for patients taking dabigatran, a drug that depends more on renal clearance than the other direct oral anticoagulants do.26
Evidence for this approach comes from a prospective cohort study27 of 541 patients being treated with dabigatran who were having an elective surgery or invasive procedure. Patients received standard perioperative management, with the timing of the last dabigatran dose before the procedure (24 hours, 48 hours, or 96 hours) based on the bleeding risk of surgery and the patient’s creatinine clearance. Dabigatran was resumed 24 to 72 hours after the procedure. No heparin bridging was done. Patients were followed for up to 30 days postoperatively. The results were favorable with few complications: one transient ischemic attack (0.2%), 10 major bleeding episodes (1.8%), and 28 minor bleeding episodes (5.2%).
A subgroup of 181 patients in this study28 had a plasma sample drawn just before surgery, allowing the investigators to assess the level of coagulation factors after dabigatran interruption. Results were as follows:
93% had a normal prothrombin time
80% had a normal activated partial thromboplastin time
33% had a normal thrombin time
81% had a normal dilute thrombin time.
The dilute thrombin time is considered the most reliable test of the anticoagulant effect of dabigatran but is not widely available. The activated partial thromboplastin time can provide a more widely used coagulation test to assess (in a less precise manner) whether there is an anticoagulant effect of dabigatran present, and more sensitive activated partial thromboplastin time assays can be used to better detect any residual dabigatran effect.
Dabigatran levels were also measured. Although 66% of patients had low drug levels just before surgery, the others still had substantial dabigatran on board. The fact that bleeding event rates were so low in this study despite the presence of dabigatran in many patients raises the question of whether having some drug on board is a good predictor of bleeding risk.
An interruption protocol with a longer interruption interval—12 to 14 hours longer than in the previous study (3 days for high-bleed risk procedures, 2 days for low-bleed risk procedures)—brought the activated partial thromboplastin time and dilute thrombin time to normal levels for 100% of patients with the protocol for high-bleeding-risk surgery. This study was based on small numbers and its interruption strategy needs further investigation.29
Case 3 continued
Based on the current empiric evidence, we recommend interrupting direct oral anticoagulants for 2 days (or approximately a 60-hour interval between the last dose and surgery) for this 75-year-old woman who is taking apixaban (Table 5). This interruption interval corresponds to 5 elimination half-lives for apixaban, which should result in little to no residual anticoagulant and will facilitate major surgery and, if indicated, neuraxial anesthesia.
The PAUSE study (NCT02228798), a multicenter, prospective cohort study, is designed to establish a safe, standardized protocol for the perioperative management of patients with atrial fibrillation taking dabigatran, rivaroxaban, or apixaban and will include 3,300 patients.
PATIENTS WITH A CORONARY STENT WHO NEED SURGERY
Case 4: A woman with a stent facing surgery
A 70-year-old woman needs breast cancer resection. She has coronary artery disease and had a drug-eluting stent placed 5 months ago after elective cardiac catheterization. She also has hypertension, obesity, and type 2 diabetes. Her medications include an angiotensin II receptor blocker, hydrochlorothiazide, insulin, and an oral hypoglycemic. She is also taking aspirin 81 mg daily and ticagrelor (a P2Y12 receptor antagonist) 90 mg twice daily.
Her cardiologist is concerned that stopping antiplatelet therapy could trigger acute stent thrombosis, which has a 50% or higher mortality rate.
Should she stop taking aspirin before surgery? What about the ticagrelor?
Is aspirin safe during surgery?
Evidence concerning aspirin during surgery comes from Perioperative Ischemic Evaluation 2 (POISE-2), a double-blind, randomized controlled trial.30 Patients who had known cardiovascular disease or risk factors for cardiovascular disease and were about to undergo noncardiac surgery were stratified according to whether they had been taking aspirin before the study (patients taking aspirin within 72 hours of the surgery were excluded from randomization). Participants in each group were randomized to take either aspirin or placebo just before surgery. The primary outcome was the combined rate of death or nonfatal myocardial infarction 30 days after randomization.
The study found no differences in the primary end point between the two groups. However, major bleeding occurred significantly more often in the aspirin group (4.6% vs 3.8%, hazard ratio 1.2, 95% confidence interval 1.0–1.5).
Moreover, only 4% of the patients in this trial had a cardiac stent. The trial excluded patients who had had a bare-metal stent placed within 6 weeks or a drug-eluting stent placed within 1 year, so it does not help us answer whether aspirin should be stopped for our current patient.
Is surgery safe for patients with stents?
The safety of undergoing surgery with a stent was investigated in a large US Veterans Administration retrospective cohort study.31 More than 20,000 patients with stents who underwent noncardiac surgery within 2 years of stent placement were compared with a control group of more than 41,000 patients with stents who did not undergo surgery. Patients were matched by stent type and cardiac risk factors at the time of stent placement.
The risk of an adverse cardiac event in both the surgical and nonsurgical cohorts was highest in the initial 6 weeks after stent placement and plateaued 6 months after stent placement, when the risk difference between the surgical and nonsurgical groups leveled off to 1%.
The risk of a major adverse cardiac event postoperatively was much more dependent on the timing of stent placement in complex and inpatient surgeries. For outpatient surgeries, the risk of a major cardiac event was very low and the timing of stent placement did not matter.
A Danish observational study32 compared more than 4,000 patients with drug-eluting stents having surgery to more than 20,000 matched controls without coronary heart disease having similar surgery. The risk of myocardial infarction or cardiac death was much higher for patients undergoing surgery within 1 month after drug-eluting stent placement compared with controls without heart disease and patients with stent placement longer than 1 month before surgery.
Our practice is to continue aspirin for surgery in patients with coronary stents regardless of the timing of placement. Although there is a small increased risk of bleeding, this must be balanced against thrombotic risk. We typically stop clopidogrel 5 to 7 days before surgery and ticagrelor 3 to 5 days before surgery. We may decide to give platelets before very-high-risk surgery (eg, intracranial, spinal) if there is a decision to continue both antiplatelet drugs—for example, in a patient who recently received a drug-eluting stent (ie, within 3 months). It is essential to involve the cardiologist and surgeon in these decisions.
BOTTOM LINE
Navigating the anticoagulant landscape in 2017 is complex. Doctors should review professional society guidelines while considering the strength of evidence on which they are based and tailor management to individual patient characteristics. Table 6 summarizes the management recommendations reviewed in this article.
References
Kearon C, Aki EA, Ornelas J, et al. Antithrombotic therapy for VTE disease: CHEST guideline and expert panel report. Chest 2016; 149:315–352.
Enden T, Haig Y, Klow NE, et al; CaVenT Study Group. Long-term outcome after additional catheter-directed thrombolysis versus standard treatment for acute iliofemoral deep vein thrombosis (the CaVenT study): a randomised controlled trial. Lancet 2012; 379:31–38.
Haig Y, Enden T, Grotta O, et al; CaVenT Study Group. Post-thrombotic syndrome after catheter-directed thrombolysis for deep vein thrombosis (CaVenT): 5-year follow-up results of an open-label, randomized controlled trial. Lancet Haematol 2016; 3:e64–e71.
Vedantham S, Goldhaber SZ, Kahn SR, et al. Rationale and design of the ATTRACT Study: a multicenter randomized trial to evaluate pharmacomechanical catheter-directed thrombolysis for the prevention of postthrombotic syndrome in patients with proximal deep vein thrombosis. Am Heart J 2013; 165:523–530.
Van Es N, Coppens M, Schulman S, Middeldorp S, Buller HR. Direct oral anticoagulants compared with vitamin K antagonists for acute venous thromboembolism: evidence from phase 3 trials. Blood 2014; 124:1968–1975.
Douketis JD, Spyropoulos AC, Kaatz S, et al; BRIDGE Investigators. Perioperative bridging anticoagulation in patients with atrial fibrillation. N Engl J Med 2015; 373:823–833.
Douketis J, Johnson JA, Turpie AG. Low-molecular-weight heparin as bridging anticoagulation during interruption of warfarin: assessment of a standardized periprocedural anticoagulation regimen. Arch Intern Med 2004; 164:1319–1326.
Dunn AS, Spyropoulos AC, Turpie AG. Bridging therapy in patients on long-term oral anticoagulants who require surgery: the Prospective Peri-operative Enoxaparin Cohort Trial (PROSPECT). J Thromb Haemost 2007; 5:2211–2218.
Kovacs MJ, Kearon C, Rodger M, et al. Single-arm study of bridging therapy with low-molecular-weight heparin for patients at risk of arterial embolism who require temporary interruption of warfarin. Circulation 2004; 110:1658–1663.
Spyropoulos AC, Turpie AG, Dunn AS, et al; REGIMEN Investigators. Clinical outcomes with unfractionated heparin or low-molecular-weight heparin as bridging therapy in patients on long-term oral anticoagulants: the REGIMEN registry. J Thromb Haemost 2006; 4:1246–1252.
Douketis JD, Woods K, Foster GA, Crowther MA. Bridging anticoagulation with low-molecular-weight heparin after interruption of warfarin therapy is associated with a residual anticoagulant effect prior to surgery. Thromb Haemost 2005; 94:528–531.
Schulman S, Hwang HG, Eikelboom JW, Kearon C, Pai M, Delaney J. Loading dose vs. maintenance dose of warfarin for reinitiation after invasive procedures: a randomized trial. J Thromb Haemost 2014; 12:1254-1259.
Siegal D, Yudin J, Kaatz S, Douketis JD, Lim W, Spyropoulos AC. Periprocedural heparin bridging in patients receiving vitamin K antagonists: systematic review and meta-analysis of bleeding and thromboembolic rates. Circulation 2012; 126:1630–1639.
Skeith L, Taylor J, Lazo-Langner A, Kovacs MJ. Conservative perioperative anticoagulation management in patients with chronic venous thromboembolic disease: a cohort study. J Thromb Haemost 2012; 10:2298–2304.
Douketis JD, Spyropoulos AC, Spencer FA, et al. Perioperative management of antithrombotic therapy: Antithrombotic Therapy and Prevention of Thrombosis, 9th ed: American College of Chest Physicians evidence-based clinical practice guidelines. Chest 2012; 141(2 suppl):e326S–e350S.
Doherty JU, Gluckman TJ, Hucker WJ, et al. 2017 ACC expert consensus decision pathway for periprocedural management of anticoagulation in patients with nonvalvular atrial fibrillation: a report of the American College of Cardiology Clinical Expert Consensus Document Task Force. J Am Coll Cardiol 2017; 69:871–898.
Raval AN, Cigarroa JE, Chung MK, et al; American Heart Association Clinical Pharmacology Subcommittee of the Acute Cardiac Care and General Cardiology Committee of the Council on Clinical Cardiology; Council on Cardiovascular Disease in the Young; and Council on Quality of Care and Outcomes Research. Management of patients on non-vitamin K antagonist oral anticoagulants in the acute care and periprocedural setting: a scientific statement from the American Heart Association. Circulation 2017; 135:e604–e633.
Tafur A, Douketis J. Perioperative anticoagulant management in patients with atrial fibrillation: practical implications of recent clinical trials. Pol Arch Med Wewn 2015; 125:666–671.
Birnie DH, Healey JS, Wells GA, et al: BRUISE CONTROL Investigators. Pacemaker or defibrillator surgery without interruption of anticoagulation. N Engl J Med 2013; 368:2084–2093.
Frost C, Song Y, Barrett YC, et al. A randomized direct comparison of the pharmacokinetics and pharmacodynamics of apixaban and rivaroxaban. Clin Pharmacol 2014; 6:179–187.
Narouze S, Benzon HT, Provenzano DA, et al. Interventional spine and pain procedures in patients on antiplatelet and anticoagulant medications: guidelines from the American Society of Regional Anesthesia and Pain Medicine, the European Society of Regional Anesthesia and Pain Therapy, the American Academy of Pain Medicine, the International Neuromodulation Society, the North American Neuromodulation Society, and the World institute of Pain. Reg Anesth Pain Med 2015; 40:182–212.
Douketis JD, Healey JS, Brueckmann M, et al. Perioperative bridging anticoagulation during dabigatran or warfarin interruption among patients who had an elective surgery or procedure. Substudy of the RE-LY trial. Thromb Haemost 2015; 113:625–632.
Steinberg BA, Peterson ED, Kim S, et al; Outcomes Registry for Better Informed Treatment of Atrial Fibrillation Investigators and Patients. Use and outcomes associated with bridging during anticoagulation interruptions in patients with atrial fibrillation: findings from the Outcomes Registry for Better Informed Treatment of Atrial Fibrillation (ORBIT-AF). Circulation 2015; 131:488–494.
Garcia D, Alexander JH, Wallentin L, et al. Management and clinical outcomes in patients treated with apixaban vs warfarin undergoing procedures. Blood 2014; 124:3692–3698.
Doherty JU, Gluckman TJ, Hucker WJ, et al. 2017 ACC expert consensus decision pathway for periprocedural management of anticoagulation in patients with nonvalvular atrial fibrillation: a report of the American College of Cardiology Clinical Expert Consensus Document Task Force. J Am Coll Cardiol 2017; 69:871–898.
Schulman S, Carrier M, Lee AY, et al; Periop Dabigatran Study Group. Perioperative management of dabigatran: a prospective cohort study. Circulation 2015; 132:167–173.
Douketis JD, Wang G, Chan N, et al. Effect of standardized perioperative dabigatran interruption on the residual anticoagulation effect at the time of surgery or procedure. J Thromb Haemost 2016; 14:89–97.
Douketis JD, Syed S, Schulman S. Periprocedural management of direct oral anticoagulants: comment on the 2015 American Society of Regional Anesthesia and Pain Medicine guidelines. Reg Anesth Pain Med 2016; 41:127–129.
Devereaux PJ, Mrkobrada M, Sessler DI, et al; POISE-2 Investigators. Aspirin in patients undergoing noncardiac surgery. N Engl J Med 2014; 370:1494–1503.
Holcomb CN, Graham LA, Richman JS, et al. The incremental risk of noncardiac surgery on adverse cardiac events following coronary stenting. J Am Coll Cardiol 2014; 64:2730–2739.
Egholm G, Kristensen SD, Thim T, et al. Risk associated with surgery within 12 months after coronary drug-eluting stent implantation. J Am Coll Cardiol 2016; 68:2622–2632.
Venous thromboembolism has a myriad of clinical presentations, warranting a holistic management approach that incorporates multiple antithrombotic management strategies.
A direct oral anticoagulant is an acceptable treatment option in patients with submassive venous thromboembolism, whereas catheter-directed thrombolysis should be considered in patients with iliofemoral deep vein thrombosis, and low-molecular-weight heparin in patients with cancer-associated thrombosis.
Perioperative management of direct oral anticoagulants should be based on the pharmacokinetic properties of the drug, the patient’s renal function, and the risk of bleeding posed by the surgery or procedure.
Perioperative heparin bridging can be avoided in most patients who have atrial fibrillation or venous thromboembolism, but should be considered in most patients with a mechanical heart valve.
Disallow All Ads
Content Gating
No Gating (article Unlocked/Free)
Alternative CME
Disqus Comments
Default
Consolidated Pubs: Do Not Show Source Publication Logo
Since 2008, the US Food and Drug Administration (FDA) has required new diabetes drugs to demonstrate cardiovascular safety, resulting in large and lengthy clinical trials. Under the new regulations, several dipeptidyl peptidase-4 (DPP-4) inhibitors, sodium-glucose cotransporter-2 (SGLT-2) inhibitors, and glucagon-like peptide-1 (GLP-1) receptor agonists have demonstrated cardiovascular safety, with some demonstrating superior cardiovascular efficacy. In 2016, the SGLT-2 inhibitor empagliflozin became the first (and as of this writing, the only) diabetes drug approved by the FDA for a clinical outcome indication, ie, to reduce the risk of cardiovascular death.
DIABETES DRUG DEVELOPMENT
Changing priorities
The International Council for Harmonization of Technical Requirements for Pharmaceuticals for Human Use (ICH) was formed in 1990 as a collaborative effort across global regulatory agencies and coordinated by the World Health Organization to universalize criteria for drug development. The ICH standards for type 2 diabetes drug development included the following requirements for patient exposure to investigational products to satisfy new drug application requirements:
1,500 individuals total (including single-dose exposure)
300–600 patients for 6 months
100 patients for 1 year.
Thus, just 250 patient-years of exposure were needed for approval of a drug that patients might take for decades. These standards were unlikely to reveal rare, serious complications and had no ability to assess clinical outcomes efficacy for either microvascular or macrovascular disease complications.
When the ICH regulatory standards were set in the early 1990s, only insulin and sulfonylureas were available in the United States. (Metformin had been available outside the United States since the 1950s.) Since 1990, the prevalence of type 2 diabetes in the United States has increased from around 2% to now over 10% of the US adult population. This increase, along with the known increased risk of atherosclerotic cardiovascular disease and heart failure associated with diabetes, created a sense of urgency for developing new therapies. With a burgeoning population with or at risk of diabetes, new drugs were needed and were rapidly developed.
Since 1995, when metformin was approved in the United States, a new class of antihyperglycemic medication has been approved about once every 2 years, so that by 2008, 12 classes of medications had become available for the treatment of type 2 diabetes. This extraordinary rate of drug development has now yielded more classes of medications to treat type 2 diabetes than we presently have for the treatment of hypertension.
This proliferation of new treatments resolved much of the pressure of the unmet medical need, over a period of increasing awareness of the cardiovascular complications of type 2 diabetes, along with numerous examples of adverse cardiovascular effects observed with some of the drugs. In this context, the FDA (and in parallel the European Medicines Agency) made paradigm-shifting changes in the requirements for the development of new type 2 diabetes drugs, requiring large-scale randomized clinical outcome data to assess cardiovascular safety of the new drugs. In December 2008, the FDA published a Guidance for Industry,1 recommending that sponsors of new drugs for type 2 diabetes demonstrate that therapy would not only improve glucose control, but also that it would, at a minimum, not result in an unacceptable increase in cardiovascular risk.1 To better assess new diabetes drugs, the requirement for patient-years of exposure to the studied drug was increased by over 60-fold from 250 patient-years to more than 15,000.
INCRETIN MODULATORS
The incretin system, a regulator of postprandial glucose metabolism, is an attractive target for glycemic control, as it promotes early satiety and lowers blood glucose.
After a meal, endocrine cells in the distal small intestine secrete the incretin hormones GLP-1 and gastric inhibitory polypeptide (GIP), among others, which reduce gastric motility, stimulate the pancreas to augment glucose-appropriate insulin secretion, and decrease postprandial glucagon release. GLP-1 also interacts with the satiety center of the hypothalamus, suppressing appetite. GLP-1 and GIP are rapidly inactivated by the circulating protease DPP-4. Injectable formulations of GLP-1 receptor agonists that are resistant to DPP-4 degradation have been developed.
Ten incretin modulators are now available in the United States. The 4 available DPP-4 inhibitors are all once-daily oral medications, and the 6 GLP-1 receptor agonists are all injectable (Table 1).
Small studies in humans and animals suggest that DPP-4 inhibitors and GLP-1-receptor agonists may have multiple favorable effects on the cardiovascular system independent of their glycemic effects. These include reducing myocardial infarct size,2–5 improving endothelial function,6 reducing inflammation and oxidative stress,7 reducing atherosclerotic plaque volume,8 improving left ventricular function, 9,10 and lowering triglyceride levels.11 However, large clinical trials are needed to determine clinical effectiveness.
DPP-4 INHIBITORS: NOT INFERIOR TO PLACEBO
Saxagliptin
Saxagliptin, a DPP-4 inhibitor, was found in a meta-analysis of phase 2B and early phase 3 trial data involving almost 5,000 patients to be associated with a dramatic 56% relative risk reduction in cardiovascular death, heart attack, and stroke. However, this analysis was limited by the extremely low number of events to analyze, with only 41 total patients with cardiovascular events in that dataset.12
The SAVOR-TIMI 53 trial13 subsequently compared saxagliptin and placebo in a randomized, double-blind trial conducted in 26 countries with nearly 16,500 patients with type 2 diabetes. All patients continued their conventional diabetes treatment at the discretion of their physicians.
During an average follow-up of 2 years, 1,222 events of cardiovascular death, myocardial infarction, or stroke occurred. No significant difference in event rates was found between the saxagliptin and placebo groups. This did not demonstrate the expected cardiovascular benefit based on prior meta-analysis of phase 2B and phase 3 data presented above, but saxagliptin did not increase cardiovascular risk and was the first diabetes drug to earn this distinction of robustly statistically proven cardiovascular safety.
Further analysis of the SAVOR-TIMI 53 trial data revealed a 27% increased relative risk of heart failure hospitalization with saxagliptin compared with placebo.14 Although the risk was statistically significant, the absolute difference in heart failure incidence between the drug and placebo groups was only 0.7% (3.5% vs 2.8%, respectively). As the average follow-up in the trial was 2 years, the absolute incremental risk of heart failure seen with saxagliptin is 0.35% annually—almost identical in magnitude to the increased heart failure risk with pioglitazone. The increased risk of heart failure was seen within the first 6 months of the trial and persisted throughout the trial, indicating an increased up-front risk of heart failure.
Alogliptin
The EXAMINE trial15 compared the DPP-4 inhibitor alogliptin and placebo in 5,380 patients with type 2 diabetes who had had a recent acute coronary event.15 Over the 30 months of the trial, more than 600 primary outcome events of cardiovascular death, myocardial infarction, or stroke occurred, with no significant difference between drug and placebo groups with established nominal statistical noninferiority. A numerically higher incidence of heart failure was noted in patients who received alogliptin than with placebo, but the difference was not statistically significant.16 However, this study was not powered to detect such an increased risk. In patients entering the trial with no history of heart failure, the risk of hospitalization for heart failure was 76% higher in the alogliptin group than in the placebo group, with a nominally significant P value less than .05 in this subgroup.
These analyses led the FDA in 2016 to mandate label warnings for saxagliptin and alogliptin regarding the increased risk of heart failure.17
Sitagliptin
The TECOS trial18 tested the DPP-4 inhibitor sitagliptin and, unlike the SAVOR or EXAMINE trials, included hospitalization for unstable angina in the composite end point. Nearly 15,000 patients with type 2 diabetes and established cardiovascular disease were enrolled, and almost 2,500 events occurred. No significant difference was found between the 2 groups.
In a series of analyses prospectively planned, sitagliptin was not associated with an increased risk of hospitalization for heart failure.19 But despite these robust analyses demonstrating no incremental heart failure risk with sitagliptin, in August 2017, the US product label for sitagliptin was modified to include a warning that other DPP-4 inhibitors have been associated with heart failure and to suggest caution. The label for linagliptin had the same FDA-required changes, with no data yet available from outcomes trials with linagliptin.
GLP-1 RECEPTOR AGONISTS
Lixisenatide: Noninferior to placebo
The ELIXA trial20 assessed the cardiovascular safety of the GLP-1 receptor agonist lixisenatide in patients with type 2 diabetes who recently had an acute coronary event. The study enrolled 6,068 patients from 49 countries, and nearly 1,000 events (cardiovascular death, myocardial infarction, stroke, or unstable angina) occurred during the median 25 months of the study. Results showed lixisenatide did not increase or decrease cardiovascular events or adverse events when compared with placebo.
Liraglutide: Evidence of benefit
The LEADER trial21 randomized 9,340 patients with or at increased risk for cardiovascular disease to receive the injectable GLP-1 receptor agonist liraglutide or placebo. After a median of 3.8 years of follow-up, liraglutide use was associated with a statistically significant 13% relative reduction in major adverse cardiovascular events, mostly driven by a 22% reduction in cardiovascular death.
Semaglutide: Evidence of benefit
The SUSTAIN-6 trial22 found a statistically significant 26% relative risk reduction in cardiovascular outcomes comparing once-weekly semaglutide (an injectable GLP-1 receptor agonist) and placebo in 3,297 patients with type 2 diabetes and established cardiovascular disease, chronic kidney disease, or risk factors for cardiovascular disease. The significant reduction in the incidence of nonfatal stroke with semaglutide was the main driver of the observed benefit.
Taspoglutide: Development halted
Taspoglutide was a candidate GLP-1 receptor agonist that underwent clinical trials for cardiovascular outcomes planned to involve about 8,000 patients. The trials were stopped early and drug development was halted after about 600 patient-years of exposure because of antibody formation in about half of patients exposed to taspoglutide, with anaphylactoid reactions and anaphylaxis reported.23
SGLT-2 INHIBITORS
The renal glomeruli filter about 180 g of glucose every day in normal adults; nearly all of it is reabsorbed by SGLT-2 in the proximal tubules, so that very little glucose is excreted in the urine.24–26 The benign condition hereditary glucosuria occurs due to loss-of-function mutations in the gene for SGLT-2. Individuals with this condition rarely if ever develop type 2 diabetes or obesity, and this observation led pharmaceutical researchers to probe SGLT-2 as a therapeutic target.
Inhibitors of SGLT-2 block glucose reabsorption in the renal proximal tubules and lead to glucosuria. Patients treated with an SGLT-2 inhibitor have lower serum glucose levels and lose weight. Inhibitors also reduce sodium reabsorption via SGLT-2 and lead to increased sodium excretion and decreased blood pressure.27
Three SGLT-2 antagonists are available in the United States: canagliflozin, dapagliflozin, and empagliflozin (Table 1). Ertugliflozin is currently in a phase 3B trial, and cardiovascular outcomes trials are in the planning phase for sotagliflozin, a dual SGLT-1/SGLT-2 inhibitor with SGLT-1 localized to the gastrointestinal tract.28
Empaglifozin: Evidence of benefit
The EMPA-REG OUTCOME trial29 randomized more than 7,200 patients with type 2 diabetes and atherosclerotic vascular disease to receive the SGLT-2 inhibitor empagliflozin or placebo as once-daily tablets, with both groups receiving off-study treatment for glycemic control at the discretion of their own care providers. Two doses of empagliflozin were evaluated in the trial (10 and 25 mg per day), with the 2 dosing groups pooled for all analyses as prospectively planned.
Patients taking empagliflozin had a 14% relative risk reduction of the composite outcome (cardiovascular death, myocardial infarction, and stroke) vs placebo, with no difference in effect between the 2 randomized doses. The improvement in the composite outcome was seen early in the empagliflozin group and persisted for the 4 years of the study.
This was the first trial of newly developed diabetes drugs that showed a statistically significant reduction in cardiovascular risk. The study revealed a 38% relative risk reduction in cardiovascular death in the treatment group. The risk reduction occurred early in the trial and improved throughout the duration of the study. This is a dramatic finding, unequaled even in trials of drugs that specifically target cardiovascular disease. Both doses of empagliflozin studied provided similar benefit over placebo, reinforcing the validity of the findings. Interestingly, in the empagliflozin group, there was a 35% relative risk reduction in heart failure hospitalizations.
Canaglifozin: Evidence of benefit
The CANVAS Program consisted of two sister trials, CANVAS and CANVAS-R, and examined the safety and efficacy of canagliflozin.30 More than 10,000 participants with type 2 diabetes and atherosclerotic disease or at increased risk of cardiovascular disease were randomized to receive canagliflozin or placebo. Canagliflozin led to a 14% relative risk reduction in the composite outcome of cardiovascular death, nonfatal myocardial infarction, or nonfatal stroke, but there was a statistically significant doubling in the incidence of amputations. Unlike empagliflozin, canagliflozin did not demonstrate a significant reduction in death from cardiovascular causes, suggesting that this may not be a class effect of SGLT-2 inhibitors. As with empagliflozin, canagliflozin led to a 33% relative risk reduction in heart failure hospitalizations.
Cardiovascular benefits independent of glucose-lowering
The cardiovascular benefits of empagliflozin in EMPA-REG OUTCOME and canagliflozin in CANVAS were observed early, suggesting that the mechanism may be due to the direct effects on the cardiovascular system rather than glycemic modification.
Improved glycemic control with the SGLT-2 inhibitor was seen early in both studies, but with the trials designed for glycemic equipoise encouraging open-label therapy targeting hemoglobin A1c to standard-of-care targets in both groups, the contrast in hemoglobin A1c between groups diminished throughout the trial after its first assessment. Although hemoglobin A1c levels in the SGLT-2 inhibitor groups decreased in the first 12 weeks, they increased over time nearly to the level seen in the placebo group. The adjusted mean hemoglobin A1c level in the placebo groups remained near 8.0% throughout the studies, a target consistent with guidelines from the American Diabetes Association and the European Association for the Study of Diabetes31 for the high-risk populations recruited and enrolled.
Blood pressure reduction and weight loss do not explain cardiovascular benefits
SGLT-2 inhibitors lower blood pressure independent of their diuretic effects. In the EMPA-REG OUTCOME trial, the adjusted mean systolic blood pressure was 3 to 4 mm Hg lower in the treatment groups than in the placebo group throughout the trial.29 This level of blood pressure lowering translates to an estimated 10% to 12% relative risk reduction for major adverse cardiovascular events, including heart failure. Although the risk reduction from blood pressure lowering is not insignificant, it does not explain the 38% reduction in cardiovascular deaths seen in the trial. Canagliflozin led to a similar 4-mm Hg reduction in systolic pressure compared with the placebo group.30
Weight loss was seen with both empagliflozin and canagliflozin but was not dramatic and is unlikely to account for the described cardiovascular benefits.
Theories of cardiovascular benefit
Several mechanisms have been proposed to help explain the observed cardiovascular benefits of SGLT-2 inhibitors.32
Ketone-body elevation. Ferrannini et al33 found that the blood concentration of the ketone-body beta-hydroxybutyrate is about twice as high in patients with type 2 diabetes in the fasting state who are chronically taking empagliflozin as in patients not receiving the drug. Beta-hydroxybutyrate levels peak after a meal and then return to baseline over several hours before rising again during the fasting period. Although the ketone elevation is not nearly as extreme as in diabetic ketoacidosis (about a 1,000-fold increase), the observed increase may reduce myocardial oxygen demand, as beta-hydroxybutyrate is among the most efficient metabolic substrates for the myocardium.
Red blood cell expansion. Perhaps a more likely explanation of the cardiovascular benefit seen with SGLT-2 inhibitor therapy is the increase in hemoglobin and hematocrit levels. At first attributed to hemoconcentration secondary to diuresis, this has been disproven by a number of studies. The EMPA-REG OUTCOME trial29 found that within 12 weeks of exposure to empagliflozin, hematocrit levels rose nearly 4% absolutely compared with the levels in the placebo group. This increase is equivalent to transfusing a unit of red blood cells, favorably affecting myocardial oxygen supply.
Reduction in glomerular hypertension. The kidneys regulate glomerular filtration in a process involving the macula densa, an area of specialized cells in the juxtaglomerular apparatus in the loop of Henle that responds to sodium concentration in the urine. Normally, SGLT-2 receptors upstream from the loop of Henle reabsorb sodium and glucose into the bloodstream, reducing sodium delivery to the macula densa, which senses this as a low-volume state. The macula densa cells respond by releasing factors that dilate afferent arterioles and increase glomerular filtration. People with diabetes have more glucose to reabsorb and therefore also reabsorb more sodium, leading to glomerular hypertension.
SGLT-2 inhibitors block both glucose and sodium reuptake at SGLT-2 receptors, normalizing the response at the macula densa, restoring a normal glomerular filtration rate, and alleviating glomerular hypertension. As the kidney perceives a more normal volume status, renin-angiotensin-aldosterone stimulation is attenuated and sympathetic nervous system activity improves.27,34 If this model of SGLT-2 inhibitor effects on the kidney is correct, these drugs have similar effects as angiotensin-converting enzyme (ACE) inhibitors, angiotensin II receptor blockers (ARBs), mineralocorticoid antagonists, and beta-blockers combined.
Kidney benefits
Empagliflozin35 and canagliflozin30 both reduced the rate of progression of kidney dysfunction and led to fewer clinically relevant renal events compared with placebo. Treatment and placebo groups also received standard care, so many patients were treated with renin-angiotensin-aldosterone system inhibitors and with good blood pressure control, making the finding that SGLT-2 inhibitors had a significant beneficial effect even more dramatic. Beneficial effects on markers of kidney function were seen early on, suggesting a more favorable hemodynamic effect on the kidney rather than improved glycemic control attenuating microvascular disease.
Empagliflozin approved to reduce clinical events
In December 2016, the FDA approved the indication for empagliflozin to reduce the risk of cardiovascular death in patients with type 2 diabetes,36 the first-ever clinical outcome indication for a type 2 diabetes medication. The European Society of Cardiology guidelines now include empagliflozin as preferred therapy for type 2 diabetes, recommending it to prevent the onset of heart failure and prolong life.37 This recommendation goes beyond the evidence from the EMPA-REG OUTCOME trial on which it is based, as the trial only studied patients with known atherosclerotic vascular disease.
The 2016 European Guidelines on cardiovascular disease prevention also recommend that an SGLT-2 inhibitor be considered early for patients with type 2 diabetes and cardiovascular disease to reduce cardiovascular and total mortality.38 The American Diabetes Association in their 2017 guidelines also endorse empagliflozin for treating patients with type 2 diabetes and cardiovascular disease.39 The fact that the American Diabetes Association recommendation is not based on glycemic control, in line with the product-labeled indication, is a major shift in the association’s guidance.
Cautions with SGLT-2 inhibitors
Use SGLT-2 inhibitors in patients with low blood pressure with caution, and with increased blood pressure monitoring just following initiation.
Consider modifying antihypertensive drugs in patients with labile blood pressure.
Consider stopping or reducing background diuretics when starting an SGLT-2 inhibitor, and reassess volume status after 1 to 2 weeks.
For patients on insulin, sulfonylureas, or both, consider decreasing dosages when starting an SGLT-2 inhibitor, and reassess glycemic control periodically.
Counsel patients about urinary hygiene. Although bacterial urinary tract infections have not emerged as a problem, fungal genital infections have, particularly in women and uncircumcised men.
Consider SGLT-2 inhibitors to be “sick-day” medications. Patients with diabetes must adjust their diabetes medications if their oral intake is reduced for a day or more, such as while sick or fasting. SGLT-2 inhibitors should not be taken on these days. Cases of diabetic ketoacidosis have arisen in patients who reduced oral intake while continuing their SGLT-2 inhibitor.
OTHER DRUGS WITH DEVELOPMENT HALTED
Aleglitazar, a peroxisome proliferator-activated receptor agonist taken orally once daily, raised high expectations when it was found in early studies to lower serum triglycerides and raise high-density lipoprotein cholesterol levels in addition to lowering blood glucose. However, a phase 3 trial in more than 7,000 patients was terminated after a median follow up of 2 years because of increased rates of heart failure, worsened kidney function, bone fractures, and gastrointestinal bleeding.40 Development of this drug was stopped.
Fasiglifam, a G-protein-coupled receptor 40 agonist, was tested in a cardiovascular clinical outcomes trial. Compared with placebo, fasiglifam reduced hemoglobin A1c levels with low risk of hypoglycemia.41 However, safety concerns about increased liver enzyme levels led to the cessation of the drug’s development.42
HOW WILL THIS AFFECT DIABETES MANAGEMENT?
Metformin is still the most commonly prescribed drug for type 2 diabetes but has only marginal evidence for its cardiovascular benefits and may not be the first-line therapy for the management of diabetes in the future. In the EMPA REG OUTCOME, LEADER, and SUSTAIN-6 trials, the novel diabetes medications were given to patients who were already treated with available therapies, often including metformin. Treatment with empagliflozin, liraglutide, and semaglutide may be indicated for patients with diabetes and atherosclerotic vascular disease as first-line therapies in the future.
SGLT-2 inhibitor therapy can cost about $500 per month, and GLP-1 inhibitors are only slightly less expensive. The cost may be prohibitive for many patients. As more evidence, guidelines, and FDA criteria support the use of these novel diabetes drugs, third-party payers and pharmaceutical companies may be motivated to lower costs to help reach more patients who can benefit from these therapies.
References
US Food and Drug Administration. Guidance for industry. Diabetes mellitus—evaluating cardiovascular risk in new antidiabetic therapies to treat type 2 diabetes. www.fda.gov/downloads/Drugs/.../Guidances/ucm071627.pdf. Accessed September 1, 2017.
Ye Y, Keyes KT, Zhang C, Perez-Polo JR, Lin Y, Birnbaum Y. The myocardial infarct size-limiting effect of sitagliptin is PKA-dependent, whereas the protective effect of pioglitazone is partially dependent on PKA. Am J Physiol Heart Circ Physiol 2010; 298:H1454–H1465.
Hocher B, Sharkovska Y, Mark M, Klein T, Pfab T. The novel DPP-4 inhibitors linagliptin and BI 14361 reduce infarct size after myocardial ischemia/reperfusion in rats. Int J Cardiol 2013; 167:87–93.
Woo JS, Kim W, Ha SJ, et al. Cardioprotective effects of exenatide in patients with ST-segment-elevation myocardial infarction undergoing primary percutaneous coronary intervention: results of exenatide myocardial protection in revascularization study. Arterioscler Thromb Vasc Biol 2013; 33:2252–2260.
Lønborg J, Vejlstrup N, Kelbæk H, et al. Exenatide reduces reperfusion injury in patients with ST-segment elevation myocardial infarction. Eur Heart J 2012; 33:1491–1499.
van Poppel PC, Netea MG, Smits P, Tack CJ. Vildagliptin improves endothelium-dependent vasodilatation in type 2 diabetes. Diabetes Care 2011; 34:2072–2077.
Kröller-Schön S, Knorr M, Hausding M, et al. Glucose-independent improvement of vascular dysfunction in experimental sepsis by dipeptidyl-peptidase 4 inhibition. Cardiovasc Res 2012; 96:140–149.
Ta NN, Schuyler CA, Li Y, Lopes-Virella MF, Huang Y. DPP-4 (CD26) inhibitor alogliptin inhibits atherosclerosis in diabetic apolipoprotein E-deficient mice. J Cardiovasc Pharmacol 2011; 58:157–166.
Sauvé M, Ban K, Momen MA, et al. Genetic deletion or pharmacological inhibition of dipeptidyl peptidase-4 improves cardiovascular outcomes after myocardial infarction in mice. Diabetes 2010; 59:1063–1073.
Read PA, Khan FZ, Heck PM, Hoole SP, Dutka DP. DPP-4 inhibition by sitagliptin improves the myocardial response to dobutamine stress and mitigates stunning in a pilot study of patients with coronary artery disease. Circ Cardiovasc Imaging 2010; 3:195–201.
Matikainen N, Mänttäri S, Schweizer A, et al. Vildagliptin therapy reduces postprandial intestinal triglyceride-rich lipoprotein particles in patients with type 2 diabetes. Diabetologia 2006; 49:2049–2057.
Frederich R, Alexander JH, Fiedorek FT, et al. A systematic assessment of cardiovascular outcomes in the saxagliptin drug development program for type 2 diabetes. Postgrad Med 2010; 122:16–27.
Scirica BM, Bhatt DL, Braunwald E, et al; SAVOR-TIMI 53 Steering Committee and Investigators. Saxagliptin and cardiovascular outcomes in patients with type 2 diabetes mellitus. N Engl J Med 2013; 369:1317–1326.
Scirica BM, Braunwald E, Raz I, et al; SAVOR-TIMI 53 Steering Committee and Investigators. Heart failure, saxagliptin, and diabetes mellitus: observations from the SAVOR-TIMI 53 randomized trial. Circulation 2014; 130:1579–1588.
White WB, Cannon CP, Heller SR, et al; EXAMINE Investigators. Alogliptin after acute coronary syndrome in patients with type 2 diabetes. N Engl J Med 2013; 369:1327–1335.
Zannad F, Cannon CP, Cushman WC, et al; EXAMINE Investigators. Heart failure and mortality outcomes in patients with type 2 diabetes taking alogliptin versus placebo in EXAMINE: a multicentre, randomised, double-blind trial. Lancet 2015; 385:2067–2076.
Green JB, Bethel MA, Armstrong PW, et al; TECOS Study Group. Effect of sitagliptin on cardiovascular outcomes in type 2 diabetes. N Engl J Med 2015; 373:232–242.
McGuire DK, Van de Werf F, Armstrong PW, et al; Trial Evaluating Cardiovascular Outcomes With Sitagliptin (TECOS) Study Group. Association between sitagliptin use and heart failure hospitalization and related outcomes in type 2 diabetes mellitus: secondary analysis of a randomized clinical trial. JAMA Cardiol 2016; 1:126–135.
Pfeffer MA, Claggett B, Diaz R, et al; ELIXA Investigators. Lixisenatide in patients with type 2 diabetes and acute coronary syndrome. N Engl J Med 2015; 373:2247–2257.
Marso SP, Daniels GH, Brown-Frandsen K, et al; LEADER Steering Committee; LEADER Trial Investigators. Liraglutide and cardiovascular outcomes in type 2 diabetes. N Engl J Med 2016; 375:311–322.
Marso SP, Bain SC, Consoli A, et al; SUSTAIN-6 Investigators. Semaglutide and cardiovascular outcomes in patients with type 2 diabetes. N Engl J Med 2016; 375:1834–1844.
Rosenstock J, Balas B, Charbonnel B, et al; T-EMERGE 2 Study Group. The fate of taspoglutide, a weekly GLP-1 receptor agonist, versus twice-daily exenatide for type 2 diabetes: the T-EMERGE 2 trial. Diabetes Care 2013; 36:498–504.
Wright EM. Renal Na(+)-glucose cotransporters. Am J Physiol 2001; 280:F10–F18.
Lee YJ, Lee YJ, Han HJ. Regulatory mechanisms of Na(+)/glucose cotransporters in renal proximal tubule cells. Kidney Int 2007; 72(suppl 106):S27–S35.
Hummel CS, Lu C, Loo DD, Hirayama BA, Voss AA, Wright EM. Glucose transport by human renal Na+/D-glucose cotransporters SGLT1 and SGLT2. Am J Physiol Cell Physiol 2011; 300:C14–C21.
Heerspink HJ, Perkins BA, Fitchett DH, Husain M, Cherney DZ. Sodium glucose cotransporter 2 inhibitors in the treatment of diabetes mellitus: cardiovascular and kidney effects, potential mechanisms, and clinical applications. Circulation 2016; 134:752–772.
Lapuerta P, Zambrowicz, Strumph P, Sands A. Development of sotagliflozin, a dual sodium-dependent glucose transporter 1/2 inhibitor. Diabetes Vasc Dis Res 2015; 12:101–110.
Zinman B, Wanner C, Lachin JM, et al, for the EMPA-REG OUTCOME Investigators. Empagliflozin, cardiovascular outcomes, and mortality in type 2 diabetes. N Engl J Med 2015; 373:2117–2128.
Neal B, Vlado-Perkovic V, Mahaffey KW, et al, for the CANVAS Program Collaborative Group. Canagloflozin and cardiovascular and renal events in type 2 diabetes. N Engl J Med 2017; 377:644–657.
Inzucchi SE, Bergenstal RM, Buse JB, et al. Management of hyperglycemia in type 2 diabetes, 2015: a patient-centered approach: update to a position statement of the American Diabetes Association and the European Association for the Study of Diabetes. Diabetes Care 2015; 38:140–149.
Ferrannini E, Mark M, Mayoux E. CV protection in the EMPA-REG OUTCOME trial: a “thrifty substrate” hypothesis. Diabetes Care 2016; 39:1108–1114.
Cherney DZ, Perkins BA, Soleymanlou N, et al. Renal hemodynamic effect of sodium-glucose cotransporter 2 inhibition in patients with type 1 diabetes mellitus. Circulation 2014; 129:587–597.
Wanner C, Inzucchi SE, Lachin JM, et al, for the EMPA-REG OUTCOME Investigators. Empagliflozin and progression of kidney disease in type 2 diabetes. N Engl J Med 2016; 375:323–334.
Ponikowski P, Voors AA, Anker SD, et al; Authors/Task Force Members; Document Reviewers. 2016 ESC Guidelines for the diagnosis and treatment of acute and chronic heart failure: the Task Force for the diagnosis and treatment of acute and chronic heart failure of the European Society of Cardiology (ESC). Developed with the special contribution of the Heart Failure Association (HFA) of the ESC. Eur J Heart Fail 2016; 18:891–975.
Piepoli MF, Hoes AW, Agewall S, et al; Authors/Task Force Members. 2016 European guidelines on cardiovascular disease prevention in clinical practice. The Sixth Joint Task Force of the European Society of Cardiology and Other Societies on Cardiovascular Disease Prevention in Clinical Practice (constituted by representatives of 10 societies and by invited experts). Developed with the special contribution of the European Association for Cardiovascular Prevention & Rehabilitation. Eur Heart J 2016; 37:2315–2381.
American Diabetes Association. American Diabetes Association standards of medical care in diabetes. Diabetes Care 2017; 40(suppl 1):S1–S135.
Lincoff AM, Tardif JC, Schwartz GG, et al; AleCardio Investigators. Effect of aleglitazar on cardiovascular outcomes after acute coronary syndrome in patients with type 2 diabetes mellitus: the AleCardio randomized clinical trial. JAMA 2014; 311:1515–1525.
Kaku K, Enya K, Nakaya R, Ohira T, Matsuno R. Efficacy and safety of fasiglifam (TAK0*&%), a G protein-coupled receptor 40 agonist, in Japanese patients with type 2 diabetes inadequately controlled by diet and exercise: a randomized, double-blind, placebocontrolled, phase III trial. Diabetes Obes Metab 2015; 17: 675–681.
Kershaw V. Patel, MD Department of Internal Medicine, Division of Cardiology, University of Texas Southwestern Medical Center, Dallas
Natalia de Albuquerque Rocha, MD Department of Internal Medicine, Division of Cardiology, University of Texas Southwestern Medical Center, Dallas
Darren K. McGuire, MD, MHSc Department of Internal Medicine, Division of Cardiology, University of Texas Southwestern Medical Center, Dallas
Address: Darren K. McGuire, MD, UT Southwestern Medical Center, 5323 Harry Hines Boulevard, E5.726, Dallas, TX 75390-8830; [email protected]
Darren K. McGuire has disclosed clinical trial leadership for AstraZeneca, Boehringer Ingelheim, Eisai, Eli Lilly, GlaxoSmithKline, Janssen, Lexicon Genetics, Merck, Novo Nordisk, and Sanofi Aventis; and consultancy for Boehringer Ingelheim, Merck, Novo Nordisk, and Sanofi Aventis.
Medical Grand Rounds articles are based on edited transcripts from Medicine Grand Rounds presentations at Cleveland Clinic. They are approved by the authors but are not peer-reviewed.
Author and Disclosure Information
Kershaw V. Patel, MD Department of Internal Medicine, Division of Cardiology, University of Texas Southwestern Medical Center, Dallas
Natalia de Albuquerque Rocha, MD Department of Internal Medicine, Division of Cardiology, University of Texas Southwestern Medical Center, Dallas
Darren K. McGuire, MD, MHSc Department of Internal Medicine, Division of Cardiology, University of Texas Southwestern Medical Center, Dallas
Address: Darren K. McGuire, MD, UT Southwestern Medical Center, 5323 Harry Hines Boulevard, E5.726, Dallas, TX 75390-8830; [email protected]
Darren K. McGuire has disclosed clinical trial leadership for AstraZeneca, Boehringer Ingelheim, Eisai, Eli Lilly, GlaxoSmithKline, Janssen, Lexicon Genetics, Merck, Novo Nordisk, and Sanofi Aventis; and consultancy for Boehringer Ingelheim, Merck, Novo Nordisk, and Sanofi Aventis.
Medical Grand Rounds articles are based on edited transcripts from Medicine Grand Rounds presentations at Cleveland Clinic. They are approved by the authors but are not peer-reviewed.
Since 2008, the US Food and Drug Administration (FDA) has required new diabetes drugs to demonstrate cardiovascular safety, resulting in large and lengthy clinical trials. Under the new regulations, several dipeptidyl peptidase-4 (DPP-4) inhibitors, sodium-glucose cotransporter-2 (SGLT-2) inhibitors, and glucagon-like peptide-1 (GLP-1) receptor agonists have demonstrated cardiovascular safety, with some demonstrating superior cardiovascular efficacy. In 2016, the SGLT-2 inhibitor empagliflozin became the first (and as of this writing, the only) diabetes drug approved by the FDA for a clinical outcome indication, ie, to reduce the risk of cardiovascular death.
DIABETES DRUG DEVELOPMENT
Changing priorities
The International Council for Harmonization of Technical Requirements for Pharmaceuticals for Human Use (ICH) was formed in 1990 as a collaborative effort across global regulatory agencies and coordinated by the World Health Organization to universalize criteria for drug development. The ICH standards for type 2 diabetes drug development included the following requirements for patient exposure to investigational products to satisfy new drug application requirements:
1,500 individuals total (including single-dose exposure)
300–600 patients for 6 months
100 patients for 1 year.
Thus, just 250 patient-years of exposure were needed for approval of a drug that patients might take for decades. These standards were unlikely to reveal rare, serious complications and had no ability to assess clinical outcomes efficacy for either microvascular or macrovascular disease complications.
When the ICH regulatory standards were set in the early 1990s, only insulin and sulfonylureas were available in the United States. (Metformin had been available outside the United States since the 1950s.) Since 1990, the prevalence of type 2 diabetes in the United States has increased from around 2% to now over 10% of the US adult population. This increase, along with the known increased risk of atherosclerotic cardiovascular disease and heart failure associated with diabetes, created a sense of urgency for developing new therapies. With a burgeoning population with or at risk of diabetes, new drugs were needed and were rapidly developed.
Since 1995, when metformin was approved in the United States, a new class of antihyperglycemic medication has been approved about once every 2 years, so that by 2008, 12 classes of medications had become available for the treatment of type 2 diabetes. This extraordinary rate of drug development has now yielded more classes of medications to treat type 2 diabetes than we presently have for the treatment of hypertension.
This proliferation of new treatments resolved much of the pressure of the unmet medical need, over a period of increasing awareness of the cardiovascular complications of type 2 diabetes, along with numerous examples of adverse cardiovascular effects observed with some of the drugs. In this context, the FDA (and in parallel the European Medicines Agency) made paradigm-shifting changes in the requirements for the development of new type 2 diabetes drugs, requiring large-scale randomized clinical outcome data to assess cardiovascular safety of the new drugs. In December 2008, the FDA published a Guidance for Industry,1 recommending that sponsors of new drugs for type 2 diabetes demonstrate that therapy would not only improve glucose control, but also that it would, at a minimum, not result in an unacceptable increase in cardiovascular risk.1 To better assess new diabetes drugs, the requirement for patient-years of exposure to the studied drug was increased by over 60-fold from 250 patient-years to more than 15,000.
INCRETIN MODULATORS
The incretin system, a regulator of postprandial glucose metabolism, is an attractive target for glycemic control, as it promotes early satiety and lowers blood glucose.
After a meal, endocrine cells in the distal small intestine secrete the incretin hormones GLP-1 and gastric inhibitory polypeptide (GIP), among others, which reduce gastric motility, stimulate the pancreas to augment glucose-appropriate insulin secretion, and decrease postprandial glucagon release. GLP-1 also interacts with the satiety center of the hypothalamus, suppressing appetite. GLP-1 and GIP are rapidly inactivated by the circulating protease DPP-4. Injectable formulations of GLP-1 receptor agonists that are resistant to DPP-4 degradation have been developed.
Ten incretin modulators are now available in the United States. The 4 available DPP-4 inhibitors are all once-daily oral medications, and the 6 GLP-1 receptor agonists are all injectable (Table 1).
Small studies in humans and animals suggest that DPP-4 inhibitors and GLP-1-receptor agonists may have multiple favorable effects on the cardiovascular system independent of their glycemic effects. These include reducing myocardial infarct size,2–5 improving endothelial function,6 reducing inflammation and oxidative stress,7 reducing atherosclerotic plaque volume,8 improving left ventricular function, 9,10 and lowering triglyceride levels.11 However, large clinical trials are needed to determine clinical effectiveness.
DPP-4 INHIBITORS: NOT INFERIOR TO PLACEBO
Saxagliptin
Saxagliptin, a DPP-4 inhibitor, was found in a meta-analysis of phase 2B and early phase 3 trial data involving almost 5,000 patients to be associated with a dramatic 56% relative risk reduction in cardiovascular death, heart attack, and stroke. However, this analysis was limited by the extremely low number of events to analyze, with only 41 total patients with cardiovascular events in that dataset.12
The SAVOR-TIMI 53 trial13 subsequently compared saxagliptin and placebo in a randomized, double-blind trial conducted in 26 countries with nearly 16,500 patients with type 2 diabetes. All patients continued their conventional diabetes treatment at the discretion of their physicians.
During an average follow-up of 2 years, 1,222 events of cardiovascular death, myocardial infarction, or stroke occurred. No significant difference in event rates was found between the saxagliptin and placebo groups. This did not demonstrate the expected cardiovascular benefit based on prior meta-analysis of phase 2B and phase 3 data presented above, but saxagliptin did not increase cardiovascular risk and was the first diabetes drug to earn this distinction of robustly statistically proven cardiovascular safety.
Further analysis of the SAVOR-TIMI 53 trial data revealed a 27% increased relative risk of heart failure hospitalization with saxagliptin compared with placebo.14 Although the risk was statistically significant, the absolute difference in heart failure incidence between the drug and placebo groups was only 0.7% (3.5% vs 2.8%, respectively). As the average follow-up in the trial was 2 years, the absolute incremental risk of heart failure seen with saxagliptin is 0.35% annually—almost identical in magnitude to the increased heart failure risk with pioglitazone. The increased risk of heart failure was seen within the first 6 months of the trial and persisted throughout the trial, indicating an increased up-front risk of heart failure.
Alogliptin
The EXAMINE trial15 compared the DPP-4 inhibitor alogliptin and placebo in 5,380 patients with type 2 diabetes who had had a recent acute coronary event.15 Over the 30 months of the trial, more than 600 primary outcome events of cardiovascular death, myocardial infarction, or stroke occurred, with no significant difference between drug and placebo groups with established nominal statistical noninferiority. A numerically higher incidence of heart failure was noted in patients who received alogliptin than with placebo, but the difference was not statistically significant.16 However, this study was not powered to detect such an increased risk. In patients entering the trial with no history of heart failure, the risk of hospitalization for heart failure was 76% higher in the alogliptin group than in the placebo group, with a nominally significant P value less than .05 in this subgroup.
These analyses led the FDA in 2016 to mandate label warnings for saxagliptin and alogliptin regarding the increased risk of heart failure.17
Sitagliptin
The TECOS trial18 tested the DPP-4 inhibitor sitagliptin and, unlike the SAVOR or EXAMINE trials, included hospitalization for unstable angina in the composite end point. Nearly 15,000 patients with type 2 diabetes and established cardiovascular disease were enrolled, and almost 2,500 events occurred. No significant difference was found between the 2 groups.
In a series of analyses prospectively planned, sitagliptin was not associated with an increased risk of hospitalization for heart failure.19 But despite these robust analyses demonstrating no incremental heart failure risk with sitagliptin, in August 2017, the US product label for sitagliptin was modified to include a warning that other DPP-4 inhibitors have been associated with heart failure and to suggest caution. The label for linagliptin had the same FDA-required changes, with no data yet available from outcomes trials with linagliptin.
GLP-1 RECEPTOR AGONISTS
Lixisenatide: Noninferior to placebo
The ELIXA trial20 assessed the cardiovascular safety of the GLP-1 receptor agonist lixisenatide in patients with type 2 diabetes who recently had an acute coronary event. The study enrolled 6,068 patients from 49 countries, and nearly 1,000 events (cardiovascular death, myocardial infarction, stroke, or unstable angina) occurred during the median 25 months of the study. Results showed lixisenatide did not increase or decrease cardiovascular events or adverse events when compared with placebo.
Liraglutide: Evidence of benefit
The LEADER trial21 randomized 9,340 patients with or at increased risk for cardiovascular disease to receive the injectable GLP-1 receptor agonist liraglutide or placebo. After a median of 3.8 years of follow-up, liraglutide use was associated with a statistically significant 13% relative reduction in major adverse cardiovascular events, mostly driven by a 22% reduction in cardiovascular death.
Semaglutide: Evidence of benefit
The SUSTAIN-6 trial22 found a statistically significant 26% relative risk reduction in cardiovascular outcomes comparing once-weekly semaglutide (an injectable GLP-1 receptor agonist) and placebo in 3,297 patients with type 2 diabetes and established cardiovascular disease, chronic kidney disease, or risk factors for cardiovascular disease. The significant reduction in the incidence of nonfatal stroke with semaglutide was the main driver of the observed benefit.
Taspoglutide: Development halted
Taspoglutide was a candidate GLP-1 receptor agonist that underwent clinical trials for cardiovascular outcomes planned to involve about 8,000 patients. The trials were stopped early and drug development was halted after about 600 patient-years of exposure because of antibody formation in about half of patients exposed to taspoglutide, with anaphylactoid reactions and anaphylaxis reported.23
SGLT-2 INHIBITORS
The renal glomeruli filter about 180 g of glucose every day in normal adults; nearly all of it is reabsorbed by SGLT-2 in the proximal tubules, so that very little glucose is excreted in the urine.24–26 The benign condition hereditary glucosuria occurs due to loss-of-function mutations in the gene for SGLT-2. Individuals with this condition rarely if ever develop type 2 diabetes or obesity, and this observation led pharmaceutical researchers to probe SGLT-2 as a therapeutic target.
Inhibitors of SGLT-2 block glucose reabsorption in the renal proximal tubules and lead to glucosuria. Patients treated with an SGLT-2 inhibitor have lower serum glucose levels and lose weight. Inhibitors also reduce sodium reabsorption via SGLT-2 and lead to increased sodium excretion and decreased blood pressure.27
Three SGLT-2 antagonists are available in the United States: canagliflozin, dapagliflozin, and empagliflozin (Table 1). Ertugliflozin is currently in a phase 3B trial, and cardiovascular outcomes trials are in the planning phase for sotagliflozin, a dual SGLT-1/SGLT-2 inhibitor with SGLT-1 localized to the gastrointestinal tract.28
Empaglifozin: Evidence of benefit
The EMPA-REG OUTCOME trial29 randomized more than 7,200 patients with type 2 diabetes and atherosclerotic vascular disease to receive the SGLT-2 inhibitor empagliflozin or placebo as once-daily tablets, with both groups receiving off-study treatment for glycemic control at the discretion of their own care providers. Two doses of empagliflozin were evaluated in the trial (10 and 25 mg per day), with the 2 dosing groups pooled for all analyses as prospectively planned.
Patients taking empagliflozin had a 14% relative risk reduction of the composite outcome (cardiovascular death, myocardial infarction, and stroke) vs placebo, with no difference in effect between the 2 randomized doses. The improvement in the composite outcome was seen early in the empagliflozin group and persisted for the 4 years of the study.
This was the first trial of newly developed diabetes drugs that showed a statistically significant reduction in cardiovascular risk. The study revealed a 38% relative risk reduction in cardiovascular death in the treatment group. The risk reduction occurred early in the trial and improved throughout the duration of the study. This is a dramatic finding, unequaled even in trials of drugs that specifically target cardiovascular disease. Both doses of empagliflozin studied provided similar benefit over placebo, reinforcing the validity of the findings. Interestingly, in the empagliflozin group, there was a 35% relative risk reduction in heart failure hospitalizations.
Canaglifozin: Evidence of benefit
The CANVAS Program consisted of two sister trials, CANVAS and CANVAS-R, and examined the safety and efficacy of canagliflozin.30 More than 10,000 participants with type 2 diabetes and atherosclerotic disease or at increased risk of cardiovascular disease were randomized to receive canagliflozin or placebo. Canagliflozin led to a 14% relative risk reduction in the composite outcome of cardiovascular death, nonfatal myocardial infarction, or nonfatal stroke, but there was a statistically significant doubling in the incidence of amputations. Unlike empagliflozin, canagliflozin did not demonstrate a significant reduction in death from cardiovascular causes, suggesting that this may not be a class effect of SGLT-2 inhibitors. As with empagliflozin, canagliflozin led to a 33% relative risk reduction in heart failure hospitalizations.
Cardiovascular benefits independent of glucose-lowering
The cardiovascular benefits of empagliflozin in EMPA-REG OUTCOME and canagliflozin in CANVAS were observed early, suggesting that the mechanism may be due to the direct effects on the cardiovascular system rather than glycemic modification.
Improved glycemic control with the SGLT-2 inhibitor was seen early in both studies, but with the trials designed for glycemic equipoise encouraging open-label therapy targeting hemoglobin A1c to standard-of-care targets in both groups, the contrast in hemoglobin A1c between groups diminished throughout the trial after its first assessment. Although hemoglobin A1c levels in the SGLT-2 inhibitor groups decreased in the first 12 weeks, they increased over time nearly to the level seen in the placebo group. The adjusted mean hemoglobin A1c level in the placebo groups remained near 8.0% throughout the studies, a target consistent with guidelines from the American Diabetes Association and the European Association for the Study of Diabetes31 for the high-risk populations recruited and enrolled.
Blood pressure reduction and weight loss do not explain cardiovascular benefits
SGLT-2 inhibitors lower blood pressure independent of their diuretic effects. In the EMPA-REG OUTCOME trial, the adjusted mean systolic blood pressure was 3 to 4 mm Hg lower in the treatment groups than in the placebo group throughout the trial.29 This level of blood pressure lowering translates to an estimated 10% to 12% relative risk reduction for major adverse cardiovascular events, including heart failure. Although the risk reduction from blood pressure lowering is not insignificant, it does not explain the 38% reduction in cardiovascular deaths seen in the trial. Canagliflozin led to a similar 4-mm Hg reduction in systolic pressure compared with the placebo group.30
Weight loss was seen with both empagliflozin and canagliflozin but was not dramatic and is unlikely to account for the described cardiovascular benefits.
Theories of cardiovascular benefit
Several mechanisms have been proposed to help explain the observed cardiovascular benefits of SGLT-2 inhibitors.32
Ketone-body elevation. Ferrannini et al33 found that the blood concentration of the ketone-body beta-hydroxybutyrate is about twice as high in patients with type 2 diabetes in the fasting state who are chronically taking empagliflozin as in patients not receiving the drug. Beta-hydroxybutyrate levels peak after a meal and then return to baseline over several hours before rising again during the fasting period. Although the ketone elevation is not nearly as extreme as in diabetic ketoacidosis (about a 1,000-fold increase), the observed increase may reduce myocardial oxygen demand, as beta-hydroxybutyrate is among the most efficient metabolic substrates for the myocardium.
Red blood cell expansion. Perhaps a more likely explanation of the cardiovascular benefit seen with SGLT-2 inhibitor therapy is the increase in hemoglobin and hematocrit levels. At first attributed to hemoconcentration secondary to diuresis, this has been disproven by a number of studies. The EMPA-REG OUTCOME trial29 found that within 12 weeks of exposure to empagliflozin, hematocrit levels rose nearly 4% absolutely compared with the levels in the placebo group. This increase is equivalent to transfusing a unit of red blood cells, favorably affecting myocardial oxygen supply.
Reduction in glomerular hypertension. The kidneys regulate glomerular filtration in a process involving the macula densa, an area of specialized cells in the juxtaglomerular apparatus in the loop of Henle that responds to sodium concentration in the urine. Normally, SGLT-2 receptors upstream from the loop of Henle reabsorb sodium and glucose into the bloodstream, reducing sodium delivery to the macula densa, which senses this as a low-volume state. The macula densa cells respond by releasing factors that dilate afferent arterioles and increase glomerular filtration. People with diabetes have more glucose to reabsorb and therefore also reabsorb more sodium, leading to glomerular hypertension.
SGLT-2 inhibitors block both glucose and sodium reuptake at SGLT-2 receptors, normalizing the response at the macula densa, restoring a normal glomerular filtration rate, and alleviating glomerular hypertension. As the kidney perceives a more normal volume status, renin-angiotensin-aldosterone stimulation is attenuated and sympathetic nervous system activity improves.27,34 If this model of SGLT-2 inhibitor effects on the kidney is correct, these drugs have similar effects as angiotensin-converting enzyme (ACE) inhibitors, angiotensin II receptor blockers (ARBs), mineralocorticoid antagonists, and beta-blockers combined.
Kidney benefits
Empagliflozin35 and canagliflozin30 both reduced the rate of progression of kidney dysfunction and led to fewer clinically relevant renal events compared with placebo. Treatment and placebo groups also received standard care, so many patients were treated with renin-angiotensin-aldosterone system inhibitors and with good blood pressure control, making the finding that SGLT-2 inhibitors had a significant beneficial effect even more dramatic. Beneficial effects on markers of kidney function were seen early on, suggesting a more favorable hemodynamic effect on the kidney rather than improved glycemic control attenuating microvascular disease.
Empagliflozin approved to reduce clinical events
In December 2016, the FDA approved the indication for empagliflozin to reduce the risk of cardiovascular death in patients with type 2 diabetes,36 the first-ever clinical outcome indication for a type 2 diabetes medication. The European Society of Cardiology guidelines now include empagliflozin as preferred therapy for type 2 diabetes, recommending it to prevent the onset of heart failure and prolong life.37 This recommendation goes beyond the evidence from the EMPA-REG OUTCOME trial on which it is based, as the trial only studied patients with known atherosclerotic vascular disease.
The 2016 European Guidelines on cardiovascular disease prevention also recommend that an SGLT-2 inhibitor be considered early for patients with type 2 diabetes and cardiovascular disease to reduce cardiovascular and total mortality.38 The American Diabetes Association in their 2017 guidelines also endorse empagliflozin for treating patients with type 2 diabetes and cardiovascular disease.39 The fact that the American Diabetes Association recommendation is not based on glycemic control, in line with the product-labeled indication, is a major shift in the association’s guidance.
Cautions with SGLT-2 inhibitors
Use SGLT-2 inhibitors in patients with low blood pressure with caution, and with increased blood pressure monitoring just following initiation.
Consider modifying antihypertensive drugs in patients with labile blood pressure.
Consider stopping or reducing background diuretics when starting an SGLT-2 inhibitor, and reassess volume status after 1 to 2 weeks.
For patients on insulin, sulfonylureas, or both, consider decreasing dosages when starting an SGLT-2 inhibitor, and reassess glycemic control periodically.
Counsel patients about urinary hygiene. Although bacterial urinary tract infections have not emerged as a problem, fungal genital infections have, particularly in women and uncircumcised men.
Consider SGLT-2 inhibitors to be “sick-day” medications. Patients with diabetes must adjust their diabetes medications if their oral intake is reduced for a day or more, such as while sick or fasting. SGLT-2 inhibitors should not be taken on these days. Cases of diabetic ketoacidosis have arisen in patients who reduced oral intake while continuing their SGLT-2 inhibitor.
OTHER DRUGS WITH DEVELOPMENT HALTED
Aleglitazar, a peroxisome proliferator-activated receptor agonist taken orally once daily, raised high expectations when it was found in early studies to lower serum triglycerides and raise high-density lipoprotein cholesterol levels in addition to lowering blood glucose. However, a phase 3 trial in more than 7,000 patients was terminated after a median follow up of 2 years because of increased rates of heart failure, worsened kidney function, bone fractures, and gastrointestinal bleeding.40 Development of this drug was stopped.
Fasiglifam, a G-protein-coupled receptor 40 agonist, was tested in a cardiovascular clinical outcomes trial. Compared with placebo, fasiglifam reduced hemoglobin A1c levels with low risk of hypoglycemia.41 However, safety concerns about increased liver enzyme levels led to the cessation of the drug’s development.42
HOW WILL THIS AFFECT DIABETES MANAGEMENT?
Metformin is still the most commonly prescribed drug for type 2 diabetes but has only marginal evidence for its cardiovascular benefits and may not be the first-line therapy for the management of diabetes in the future. In the EMPA REG OUTCOME, LEADER, and SUSTAIN-6 trials, the novel diabetes medications were given to patients who were already treated with available therapies, often including metformin. Treatment with empagliflozin, liraglutide, and semaglutide may be indicated for patients with diabetes and atherosclerotic vascular disease as first-line therapies in the future.
SGLT-2 inhibitor therapy can cost about $500 per month, and GLP-1 inhibitors are only slightly less expensive. The cost may be prohibitive for many patients. As more evidence, guidelines, and FDA criteria support the use of these novel diabetes drugs, third-party payers and pharmaceutical companies may be motivated to lower costs to help reach more patients who can benefit from these therapies.
References
US Food and Drug Administration. Guidance for industry. Diabetes mellitus—evaluating cardiovascular risk in new antidiabetic therapies to treat type 2 diabetes. www.fda.gov/downloads/Drugs/.../Guidances/ucm071627.pdf. Accessed September 1, 2017.
Ye Y, Keyes KT, Zhang C, Perez-Polo JR, Lin Y, Birnbaum Y. The myocardial infarct size-limiting effect of sitagliptin is PKA-dependent, whereas the protective effect of pioglitazone is partially dependent on PKA. Am J Physiol Heart Circ Physiol 2010; 298:H1454–H1465.
Hocher B, Sharkovska Y, Mark M, Klein T, Pfab T. The novel DPP-4 inhibitors linagliptin and BI 14361 reduce infarct size after myocardial ischemia/reperfusion in rats. Int J Cardiol 2013; 167:87–93.
Woo JS, Kim W, Ha SJ, et al. Cardioprotective effects of exenatide in patients with ST-segment-elevation myocardial infarction undergoing primary percutaneous coronary intervention: results of exenatide myocardial protection in revascularization study. Arterioscler Thromb Vasc Biol 2013; 33:2252–2260.
Lønborg J, Vejlstrup N, Kelbæk H, et al. Exenatide reduces reperfusion injury in patients with ST-segment elevation myocardial infarction. Eur Heart J 2012; 33:1491–1499.
van Poppel PC, Netea MG, Smits P, Tack CJ. Vildagliptin improves endothelium-dependent vasodilatation in type 2 diabetes. Diabetes Care 2011; 34:2072–2077.
Kröller-Schön S, Knorr M, Hausding M, et al. Glucose-independent improvement of vascular dysfunction in experimental sepsis by dipeptidyl-peptidase 4 inhibition. Cardiovasc Res 2012; 96:140–149.
Ta NN, Schuyler CA, Li Y, Lopes-Virella MF, Huang Y. DPP-4 (CD26) inhibitor alogliptin inhibits atherosclerosis in diabetic apolipoprotein E-deficient mice. J Cardiovasc Pharmacol 2011; 58:157–166.
Sauvé M, Ban K, Momen MA, et al. Genetic deletion or pharmacological inhibition of dipeptidyl peptidase-4 improves cardiovascular outcomes after myocardial infarction in mice. Diabetes 2010; 59:1063–1073.
Read PA, Khan FZ, Heck PM, Hoole SP, Dutka DP. DPP-4 inhibition by sitagliptin improves the myocardial response to dobutamine stress and mitigates stunning in a pilot study of patients with coronary artery disease. Circ Cardiovasc Imaging 2010; 3:195–201.
Matikainen N, Mänttäri S, Schweizer A, et al. Vildagliptin therapy reduces postprandial intestinal triglyceride-rich lipoprotein particles in patients with type 2 diabetes. Diabetologia 2006; 49:2049–2057.
Frederich R, Alexander JH, Fiedorek FT, et al. A systematic assessment of cardiovascular outcomes in the saxagliptin drug development program for type 2 diabetes. Postgrad Med 2010; 122:16–27.
Scirica BM, Bhatt DL, Braunwald E, et al; SAVOR-TIMI 53 Steering Committee and Investigators. Saxagliptin and cardiovascular outcomes in patients with type 2 diabetes mellitus. N Engl J Med 2013; 369:1317–1326.
Scirica BM, Braunwald E, Raz I, et al; SAVOR-TIMI 53 Steering Committee and Investigators. Heart failure, saxagliptin, and diabetes mellitus: observations from the SAVOR-TIMI 53 randomized trial. Circulation 2014; 130:1579–1588.
White WB, Cannon CP, Heller SR, et al; EXAMINE Investigators. Alogliptin after acute coronary syndrome in patients with type 2 diabetes. N Engl J Med 2013; 369:1327–1335.
Zannad F, Cannon CP, Cushman WC, et al; EXAMINE Investigators. Heart failure and mortality outcomes in patients with type 2 diabetes taking alogliptin versus placebo in EXAMINE: a multicentre, randomised, double-blind trial. Lancet 2015; 385:2067–2076.
Green JB, Bethel MA, Armstrong PW, et al; TECOS Study Group. Effect of sitagliptin on cardiovascular outcomes in type 2 diabetes. N Engl J Med 2015; 373:232–242.
McGuire DK, Van de Werf F, Armstrong PW, et al; Trial Evaluating Cardiovascular Outcomes With Sitagliptin (TECOS) Study Group. Association between sitagliptin use and heart failure hospitalization and related outcomes in type 2 diabetes mellitus: secondary analysis of a randomized clinical trial. JAMA Cardiol 2016; 1:126–135.
Pfeffer MA, Claggett B, Diaz R, et al; ELIXA Investigators. Lixisenatide in patients with type 2 diabetes and acute coronary syndrome. N Engl J Med 2015; 373:2247–2257.
Marso SP, Daniels GH, Brown-Frandsen K, et al; LEADER Steering Committee; LEADER Trial Investigators. Liraglutide and cardiovascular outcomes in type 2 diabetes. N Engl J Med 2016; 375:311–322.
Marso SP, Bain SC, Consoli A, et al; SUSTAIN-6 Investigators. Semaglutide and cardiovascular outcomes in patients with type 2 diabetes. N Engl J Med 2016; 375:1834–1844.
Rosenstock J, Balas B, Charbonnel B, et al; T-EMERGE 2 Study Group. The fate of taspoglutide, a weekly GLP-1 receptor agonist, versus twice-daily exenatide for type 2 diabetes: the T-EMERGE 2 trial. Diabetes Care 2013; 36:498–504.
Wright EM. Renal Na(+)-glucose cotransporters. Am J Physiol 2001; 280:F10–F18.
Lee YJ, Lee YJ, Han HJ. Regulatory mechanisms of Na(+)/glucose cotransporters in renal proximal tubule cells. Kidney Int 2007; 72(suppl 106):S27–S35.
Hummel CS, Lu C, Loo DD, Hirayama BA, Voss AA, Wright EM. Glucose transport by human renal Na+/D-glucose cotransporters SGLT1 and SGLT2. Am J Physiol Cell Physiol 2011; 300:C14–C21.
Heerspink HJ, Perkins BA, Fitchett DH, Husain M, Cherney DZ. Sodium glucose cotransporter 2 inhibitors in the treatment of diabetes mellitus: cardiovascular and kidney effects, potential mechanisms, and clinical applications. Circulation 2016; 134:752–772.
Lapuerta P, Zambrowicz, Strumph P, Sands A. Development of sotagliflozin, a dual sodium-dependent glucose transporter 1/2 inhibitor. Diabetes Vasc Dis Res 2015; 12:101–110.
Zinman B, Wanner C, Lachin JM, et al, for the EMPA-REG OUTCOME Investigators. Empagliflozin, cardiovascular outcomes, and mortality in type 2 diabetes. N Engl J Med 2015; 373:2117–2128.
Neal B, Vlado-Perkovic V, Mahaffey KW, et al, for the CANVAS Program Collaborative Group. Canagloflozin and cardiovascular and renal events in type 2 diabetes. N Engl J Med 2017; 377:644–657.
Inzucchi SE, Bergenstal RM, Buse JB, et al. Management of hyperglycemia in type 2 diabetes, 2015: a patient-centered approach: update to a position statement of the American Diabetes Association and the European Association for the Study of Diabetes. Diabetes Care 2015; 38:140–149.
Ferrannini E, Mark M, Mayoux E. CV protection in the EMPA-REG OUTCOME trial: a “thrifty substrate” hypothesis. Diabetes Care 2016; 39:1108–1114.
Cherney DZ, Perkins BA, Soleymanlou N, et al. Renal hemodynamic effect of sodium-glucose cotransporter 2 inhibition in patients with type 1 diabetes mellitus. Circulation 2014; 129:587–597.
Wanner C, Inzucchi SE, Lachin JM, et al, for the EMPA-REG OUTCOME Investigators. Empagliflozin and progression of kidney disease in type 2 diabetes. N Engl J Med 2016; 375:323–334.
Ponikowski P, Voors AA, Anker SD, et al; Authors/Task Force Members; Document Reviewers. 2016 ESC Guidelines for the diagnosis and treatment of acute and chronic heart failure: the Task Force for the diagnosis and treatment of acute and chronic heart failure of the European Society of Cardiology (ESC). Developed with the special contribution of the Heart Failure Association (HFA) of the ESC. Eur J Heart Fail 2016; 18:891–975.
Piepoli MF, Hoes AW, Agewall S, et al; Authors/Task Force Members. 2016 European guidelines on cardiovascular disease prevention in clinical practice. The Sixth Joint Task Force of the European Society of Cardiology and Other Societies on Cardiovascular Disease Prevention in Clinical Practice (constituted by representatives of 10 societies and by invited experts). Developed with the special contribution of the European Association for Cardiovascular Prevention & Rehabilitation. Eur Heart J 2016; 37:2315–2381.
American Diabetes Association. American Diabetes Association standards of medical care in diabetes. Diabetes Care 2017; 40(suppl 1):S1–S135.
Lincoff AM, Tardif JC, Schwartz GG, et al; AleCardio Investigators. Effect of aleglitazar on cardiovascular outcomes after acute coronary syndrome in patients with type 2 diabetes mellitus: the AleCardio randomized clinical trial. JAMA 2014; 311:1515–1525.
Kaku K, Enya K, Nakaya R, Ohira T, Matsuno R. Efficacy and safety of fasiglifam (TAK0*&%), a G protein-coupled receptor 40 agonist, in Japanese patients with type 2 diabetes inadequately controlled by diet and exercise: a randomized, double-blind, placebocontrolled, phase III trial. Diabetes Obes Metab 2015; 17: 675–681.
Saxagliptin, alogliptin, and sitagliptin confer neither benefit nor harm for the composite outcome of cardiovascular death, myocardial infarction, or stroke. Saxagliptin and alogliptin carry warnings of increased risk of heart failure; sitagliptin was shown to not affect heart failure risk.
Liraglutide and semaglutide showed evidence of cardiovascular benefit; lixisenatide was noninferior to placebo.
Empagliflozin is now approved to reduce risk of cardiovascular death in patients with type 2 diabetes and atherosclerotic cardiovascular disease.
Canagliflozin decreased the composite outcome of cardiovascular death, nonfatal myocardial infarction, or nonfatal stroke in patients with type 2 diabetes with or at risk of cardiovascular disease, but also increased the risk of amputation and did not significantly reduce the individual outcome of cardiovascular death.
Since the first successful pregnancy in a kidney transplant recipient in 1958,1 hundreds of kidney recipients have had successful pregnancies. Chronic kidney disease disrupts the hypothalamic-pituitary-gonadal axis, leading to anovulation and infertility. However, within 6 months of kidney transplant, the hypothalamic-pituitary-gonadal axis and sex hormone levels return to normal,2 and the renal allograft is able to adapt to the various physiologic changes of pregnancy.3
Successful pregnancy after kidney transplant requires a team approach to care that includes the primary care physician, a transplant nephrologist, and an obstetrician with expertise in high-risk pregnancies. But equally important is educating and counseling the patient about the risks and challenges. This should begin at the first pretransplant visit.4
Below are answers to questions often asked by renal transplant recipients who wish to become pregnant.
WHAT IS THE IDEAL TIME TO BECOME PREGNANT AFTER KIDNEY TRANSPLANT?
According to American Society of Transplantation and European best-practice guidelines, as outlined in Table 1, the ideal time to conceive is 1 to 2 years after renal transplant if graft function is stable, proteinuria is minimal, there are no recent episodes of acute rejection, and the patient is not taking teratogenic medications. Because transplant recipients take teratogenic immunosuppressive drugs such as mycophenolate mofetil, women should be counseled to start contraception as soon as possible after kidney transplant.5,6
Mycophenolate mofetil and sirolimus are contraindicated in pregnancy and should be stopped at least 6 weeks before conception. Mycophenolate mofetil increases the risk of congenital malformations and spontaneous abortion. Data on sirolimus from clinical studies are limited, but in animal studies it is associated with delay in ossification of skeletal structure and with an increase in fetal mortality.7
WHAT INCREASES THE RISK OF A POOR PREGNANCY OUTCOME AFTER RENAL TRANSPLANT?
Risk factors for poor maternal and fetal outcomes include an elevated prepregnancy serum creatinine level (≥ 1.4 mg/dL), hypertension, and proteinuria (≥ 500 mg/24 hours). Younger age at transplant and at conception is associated with better pregnancy outcome.5,8
WHAT ARE THE POSSIBLE MATERNAL COMPLICATIONS?
Kidney transplant recipients who become pregnant have a risk of developing preeclampsia 6 times higher than normal, and the incidence rate ranges between 24% and 38%.9,10 The risk of cesarean delivery is 5 times higher than in the general population, and the incidence rate is 43% to 64%.10,11
Low-dose aspirin reduces the risk of preeclampsia and should be prescribed to all pregnant women who are kidney transplant recipients. Angiotensin-converting enzyme inhibitors are contraindicated due to the risk of teratogenic effects, ie, pulmonary hypoplasia and oligohydramnios.4
WHAT ARE THE POSSIBLE FETAL COMPLICATIONS?
Women who become pregnant after kidney transplant are at greater risk of preterm delivery (40% to 60% higher risk), having a baby with low birth weight (42% to 46% higher risk), and intrauterine growth restriction (30% to 50% higher risk). But the risk of perinatal mortality is not increased in the absence of the above-mentioned risk factors.10,11
DOES PREGNANCY INCREASE THE RISK OF GRAFT FAILURE?
Pregnancy does not increase the risk of allograft loss as long as the patient has a prepregnancy serum creatinine below 1.4 mg/dL, no hypertension, and urine protein excretion less than 500 mg/24 hours.12
WHAT CHANGES TO IMMUNE SUPPRESSION ARE REQUIRED BEFORE AND DURING PREGNANCY?
Careful management of immunosuppression is critical in renal transplant recipients before and during pregnancy because of the risks of teratogenicity and other adverse effects.
As stated above, mycophenolate mofetil and sirolimus are teratogenic and should be stopped 6 weeks before conception. The recommended maintenance immunosuppression during pregnancy includes calcineurin inhibitors (tacrolimus and cyclosporine), azathioprine, and low-dose prednisone.
A 20% to 25% increase in the dose of calcineurin inhibitor is required during pregnancy due to an increase in metabolic activity of cytochrome P450 and an increase in the volume of distribution.5,6,13 However, this dosing increase requires more frequent monitoring throughout the pregnancy to ensure the safest possible therapeutic levels.
DOES PREGNANCY INCREASE THE RISK OF INFECTION?
Because of their immunosuppressed state, renal transplant recipients are prone to infection; the incidence rate of urinary tract infection is as high as 40% due to mild reflux and pregnancy-related dilation of ureters and collecting ducts.6 Women should be screened for urinary tract infection at every visit with urine dipstick testing and with urine culture every 4 weeks. Antibiotics such as nitrofurantoin, amoxicillin, and cephalexin are safe to treat urinary tract infection during pregnancy.6
IS BREAST-FEEDING SAFE IN RENAL TRANSPLANT RECIPIENTS?
Breast-feeding is considered safe for women with renal transplant who are on prednisone, azathioprine, cyclosporine, and tacrolimus. Women should avoid breast-feeding if they are taking mycophenolate mofetil, sirolimus, everolimus, or belatacept, as clinical data on safety are not adequate.14
References
Murray JE, Reid DE, Harrison JH, Merrill JP. Successful pregnancies after human renal transplantation. N Engl J Med 1963; 269:341–343.
Saha MT, Saha HH, Niskanen LK, Salmela KT, Pasternack AI. Time course of serum prolactin and sex hormones following successful renal transplantation. Nephron 2002; 92:735–737.
Davison JM. The effect of pregnancy on kidney function in renal allograft recipients. Kidney Int 1985; 27:74–79.
Shah S, Verma P. Overview of pregnancy in renal transplant patients. Int J Nephrol 2016; 2016:4539342.
McKay DB, Josephson MA, Armenti VT, et al; Women’s Health Committee of the American Society of Transplantation. Reproduction and transplantation: report on the AST Consensus Conference on Reproductive Issues and Transplantation. Am J Transplant 2005; 5:1592–1599.
EBPG Expert Group on Renal Transplantation. European best practice guidelines for renal transplantation. Section IV: long-term management of the transplant recipient. IV.10. Pregnancy in renal transplant recipients. Nephrol Dial Transplant 2002; 17(suppl 4):50–55.
Armenti VT, Moitz MJ, Cardonick EH, Davison JM. Immunosuppression in pregnancy: choices for infant and maternal health. Drugs 2002; 62:2361–2375.
Bramham K, Chusney G, Lee J, Lightstone L, Nelson-Piercy C. Breastfeeding and tacrolimus: serial monitoring in breast-fed and bottle-fed infants. Clin J Am Soc Nephrol 2013; 8:563–567.
Deshpande NA, James NT, Kucirka LM, et al. Pregnancy outcomes in kidney transplant recipients: a systematic review and meta-analysis. Am J Transplant 2011; 11:2388–2404.
Bramham K, Nelson-Piercy C, Gao H, et al. Pregnancy in renal transplant recipients: a UK national cohort study. Clin J Am Soc Nephrol 2013; 8:290–298.
Coscia LA, Constantinescu S, Moritz MJ, et al. Report from the National Transplantation Pregnancy Registry (NTPR): outcomes of pregnancy after transplantation. Clin Transpl 2010: 65–85.
Sibanda N, Briggs JD, Davison JM, Johnson RJ, Rudge CJ. Pregnancy after organ transplantation: a report from the UK transplant pregnancy registry. Transplantation 2007; 83:1301–1307.
Kim H, Jeong JC, Yang J, et al. The optimal therapy of calcineurin inhibitors for pregnancy in kidney transplantation. Clin Transplant 2015; 29:142–148.
Constantinescu S, Pai A, Coscia LA, Davison JM, Moritz MJ, Armenti VT. Breast-feeding after transplantation. Best Pract Res Clin Obstet Gynaecol 2014; 28:1163–1173.
Silvi Shah, MD Division of Nephrology, University of Cincinnati, Cincinnati, OH
Address: Silvi Shah, MD, Division of Nephrology, University of Cincinnati, Department of Internal Medicine, 231 Albert Sabin Way, Medical Sciences Building Room 6065, PO Box 670557, Cincinnati, OH 45267-0557; [email protected]
Author and Disclosure Information
Silvi Shah, MD Division of Nephrology, University of Cincinnati, Cincinnati, OH
Address: Silvi Shah, MD, Division of Nephrology, University of Cincinnati, Department of Internal Medicine, 231 Albert Sabin Way, Medical Sciences Building Room 6065, PO Box 670557, Cincinnati, OH 45267-0557; [email protected]
Since the first successful pregnancy in a kidney transplant recipient in 1958,1 hundreds of kidney recipients have had successful pregnancies. Chronic kidney disease disrupts the hypothalamic-pituitary-gonadal axis, leading to anovulation and infertility. However, within 6 months of kidney transplant, the hypothalamic-pituitary-gonadal axis and sex hormone levels return to normal,2 and the renal allograft is able to adapt to the various physiologic changes of pregnancy.3
Successful pregnancy after kidney transplant requires a team approach to care that includes the primary care physician, a transplant nephrologist, and an obstetrician with expertise in high-risk pregnancies. But equally important is educating and counseling the patient about the risks and challenges. This should begin at the first pretransplant visit.4
Below are answers to questions often asked by renal transplant recipients who wish to become pregnant.
WHAT IS THE IDEAL TIME TO BECOME PREGNANT AFTER KIDNEY TRANSPLANT?
According to American Society of Transplantation and European best-practice guidelines, as outlined in Table 1, the ideal time to conceive is 1 to 2 years after renal transplant if graft function is stable, proteinuria is minimal, there are no recent episodes of acute rejection, and the patient is not taking teratogenic medications. Because transplant recipients take teratogenic immunosuppressive drugs such as mycophenolate mofetil, women should be counseled to start contraception as soon as possible after kidney transplant.5,6
Mycophenolate mofetil and sirolimus are contraindicated in pregnancy and should be stopped at least 6 weeks before conception. Mycophenolate mofetil increases the risk of congenital malformations and spontaneous abortion. Data on sirolimus from clinical studies are limited, but in animal studies it is associated with delay in ossification of skeletal structure and with an increase in fetal mortality.7
WHAT INCREASES THE RISK OF A POOR PREGNANCY OUTCOME AFTER RENAL TRANSPLANT?
Risk factors for poor maternal and fetal outcomes include an elevated prepregnancy serum creatinine level (≥ 1.4 mg/dL), hypertension, and proteinuria (≥ 500 mg/24 hours). Younger age at transplant and at conception is associated with better pregnancy outcome.5,8
WHAT ARE THE POSSIBLE MATERNAL COMPLICATIONS?
Kidney transplant recipients who become pregnant have a risk of developing preeclampsia 6 times higher than normal, and the incidence rate ranges between 24% and 38%.9,10 The risk of cesarean delivery is 5 times higher than in the general population, and the incidence rate is 43% to 64%.10,11
Low-dose aspirin reduces the risk of preeclampsia and should be prescribed to all pregnant women who are kidney transplant recipients. Angiotensin-converting enzyme inhibitors are contraindicated due to the risk of teratogenic effects, ie, pulmonary hypoplasia and oligohydramnios.4
WHAT ARE THE POSSIBLE FETAL COMPLICATIONS?
Women who become pregnant after kidney transplant are at greater risk of preterm delivery (40% to 60% higher risk), having a baby with low birth weight (42% to 46% higher risk), and intrauterine growth restriction (30% to 50% higher risk). But the risk of perinatal mortality is not increased in the absence of the above-mentioned risk factors.10,11
DOES PREGNANCY INCREASE THE RISK OF GRAFT FAILURE?
Pregnancy does not increase the risk of allograft loss as long as the patient has a prepregnancy serum creatinine below 1.4 mg/dL, no hypertension, and urine protein excretion less than 500 mg/24 hours.12
WHAT CHANGES TO IMMUNE SUPPRESSION ARE REQUIRED BEFORE AND DURING PREGNANCY?
Careful management of immunosuppression is critical in renal transplant recipients before and during pregnancy because of the risks of teratogenicity and other adverse effects.
As stated above, mycophenolate mofetil and sirolimus are teratogenic and should be stopped 6 weeks before conception. The recommended maintenance immunosuppression during pregnancy includes calcineurin inhibitors (tacrolimus and cyclosporine), azathioprine, and low-dose prednisone.
A 20% to 25% increase in the dose of calcineurin inhibitor is required during pregnancy due to an increase in metabolic activity of cytochrome P450 and an increase in the volume of distribution.5,6,13 However, this dosing increase requires more frequent monitoring throughout the pregnancy to ensure the safest possible therapeutic levels.
DOES PREGNANCY INCREASE THE RISK OF INFECTION?
Because of their immunosuppressed state, renal transplant recipients are prone to infection; the incidence rate of urinary tract infection is as high as 40% due to mild reflux and pregnancy-related dilation of ureters and collecting ducts.6 Women should be screened for urinary tract infection at every visit with urine dipstick testing and with urine culture every 4 weeks. Antibiotics such as nitrofurantoin, amoxicillin, and cephalexin are safe to treat urinary tract infection during pregnancy.6
IS BREAST-FEEDING SAFE IN RENAL TRANSPLANT RECIPIENTS?
Breast-feeding is considered safe for women with renal transplant who are on prednisone, azathioprine, cyclosporine, and tacrolimus. Women should avoid breast-feeding if they are taking mycophenolate mofetil, sirolimus, everolimus, or belatacept, as clinical data on safety are not adequate.14
References
Murray JE, Reid DE, Harrison JH, Merrill JP. Successful pregnancies after human renal transplantation. N Engl J Med 1963; 269:341–343.
Saha MT, Saha HH, Niskanen LK, Salmela KT, Pasternack AI. Time course of serum prolactin and sex hormones following successful renal transplantation. Nephron 2002; 92:735–737.
Davison JM. The effect of pregnancy on kidney function in renal allograft recipients. Kidney Int 1985; 27:74–79.
Shah S, Verma P. Overview of pregnancy in renal transplant patients. Int J Nephrol 2016; 2016:4539342.
McKay DB, Josephson MA, Armenti VT, et al; Women’s Health Committee of the American Society of Transplantation. Reproduction and transplantation: report on the AST Consensus Conference on Reproductive Issues and Transplantation. Am J Transplant 2005; 5:1592–1599.
EBPG Expert Group on Renal Transplantation. European best practice guidelines for renal transplantation. Section IV: long-term management of the transplant recipient. IV.10. Pregnancy in renal transplant recipients. Nephrol Dial Transplant 2002; 17(suppl 4):50–55.
Armenti VT, Moitz MJ, Cardonick EH, Davison JM. Immunosuppression in pregnancy: choices for infant and maternal health. Drugs 2002; 62:2361–2375.
Bramham K, Chusney G, Lee J, Lightstone L, Nelson-Piercy C. Breastfeeding and tacrolimus: serial monitoring in breast-fed and bottle-fed infants. Clin J Am Soc Nephrol 2013; 8:563–567.
Deshpande NA, James NT, Kucirka LM, et al. Pregnancy outcomes in kidney transplant recipients: a systematic review and meta-analysis. Am J Transplant 2011; 11:2388–2404.
Bramham K, Nelson-Piercy C, Gao H, et al. Pregnancy in renal transplant recipients: a UK national cohort study. Clin J Am Soc Nephrol 2013; 8:290–298.
Coscia LA, Constantinescu S, Moritz MJ, et al. Report from the National Transplantation Pregnancy Registry (NTPR): outcomes of pregnancy after transplantation. Clin Transpl 2010: 65–85.
Sibanda N, Briggs JD, Davison JM, Johnson RJ, Rudge CJ. Pregnancy after organ transplantation: a report from the UK transplant pregnancy registry. Transplantation 2007; 83:1301–1307.
Kim H, Jeong JC, Yang J, et al. The optimal therapy of calcineurin inhibitors for pregnancy in kidney transplantation. Clin Transplant 2015; 29:142–148.
Constantinescu S, Pai A, Coscia LA, Davison JM, Moritz MJ, Armenti VT. Breast-feeding after transplantation. Best Pract Res Clin Obstet Gynaecol 2014; 28:1163–1173.
Azithromycin is prescribed for a variety of acute respiratory and nonrespiratory infections. However, it is also used in several chronic respiratory diseases.
MECHANISM OF ACTION
Macrolide antibiotics like azithromycin inhibit bacterial growth and replication by interrupting protein synthesis. But azithromycin also has immunomodulatory properties.1
In the acute phase of inflammation, azithromycin exerts an initial neutrophil degranulation effect and enhances the oxidative response that is primed by particulate stimulus, which could facilitate its antibacterial effects. In the late phase, it down-regulates the oxidative burst and increases apoptosis of neutrophils to promote healing without compromising immunity. Azithromycin also attenuates airway mucus hypersecretion, improves ciliary function, and promotes pulmonary epithelial cell healing.2,3
Collectively, these effects make the drug effective in many chronic inflammatory lung conditions (Table 1).
CYSTIC FIBROSIS
Cystic fibrosis is a genetic disease affecting many organs, but its effect on the upper and lower airways has the greatest impact on quality of life and survival. Impaired mucociliary clearance and repeated respiratory infections contribute to chronic inflammation and a progressive decline in lung function.4,5
A 2012 Cochrane review of 5 studies in 549 patients found that, compared with those taking placebo, patients taking azithromycin 250–500 mg 3 times a week had improvement in forced expiratory volume in 1 second (FEV1). The mean difference at 6 months was 3.97% (95% cofidence interval [CI] 1.74– 6.19). Patients on azithromycin were free from pulmonary exacerbation approximately twice as long as patients on placebo (odds ratio 1.96, 95% CI 1.15–3.33).6,7
The Cystic Fibrosis Foundation recommends long-term azithromycin therapy to improve lung function and reduce exacerbations in patients age 6 or older who have persistent Pseudomonas aeruginosa airway cultures (level of evidence: fair).8
DIFFUSE PANBRONCHIOLITIS
Diffuse panbronchiolitis, or diffuse chronic inflammatory bronchiolitis and sinusitis, is seen mainly in patients of Asian descent.9 In the past, the mortality rate was greater than 90%, but between 1970 and 1979 the 10-year survival rate increased by more than 40% with chronic macrolide therapy, ie, with erythromycin.10,11
Later retrospective studies of azithromycin 500 mg 3 times a week showed results comparable to those with erythromycin, with improvement in symptoms, lung function, arterial partial pressure of oxygen, and radiologic findings, as well as fewer adverse effects.12 These benefits justify the current recommendation for azithromycin as the mainstay of therapy in diffuse panbronchiolitis.
BRONCHIOLITIS OBLITERANS SYNDROME
Bronchiolitis obliterans syndrome is an airflow limitation that arises without infection or imaging evidence of bronchiolitis in patients who received allogeneic hematopoietic stem cell or lung transplant. It occurs in 50% of lung transplant recipients as a form of chronic graft rejection and in 6% to 20% of allogeneic stem cell transplant recipients as a manifestation of chronic graft-vs-host disease.13,14
Azithromycin has been used in its management. A meta-analysis of lung transplant recipients found a significant improvement in the survival rate and overall lung function after an average of 7 months of treatment with azithromycin, with a mean increase in FEV1 of 8.8% (95% CI 5.1–12.47, P < .001).14 The evidence currently supports long-term azithromycin 250 mg 3 times a week after lung transplant to reduce any decline in lung function and to lower the mortality rate.14,15
In allogeneic stem cell transplant recipients, the evidence for long-term azithromycin treatment is sparse. A recent prospective multicenter study evaluated the effect of an azithromycin-based regimen (fluticasone, azithromycin, and montelukast, plus a steroid pulse) in stem cell recipients with bronchiolitis obliterans syndrome during the first 3 months after diagnosis. In the treated group, 6% had a drop in FEV1 of more than 10% at 3-month follow-up compared with 40% of historical controls (95% CI 1%–19%, P < .001). Also, treatment resulted in a 50% reduction in the dose of systemic steroids and a substantial improvement in functional status.16
Given the limited options in the management of these patients and until further studies are available, azithromycin 3 times weekly is suggested.
NON-CYSTIC FIBROSIS BRONCHIECTASIS
Non-cystic fibrosis bronchiectasis is a chronic inflammatory lung condition characterized by irreversible dilation of the bronchi and bronchioles due to a variety of causes including recurrent or old infection, immunodeficiency, autoimmune conditions, and connective tissue disease; it can also be idiopathic.17
Altenburg et al,18 in a randomized, double-blind, placebo-controlled trial, found that azithromycin 250 mg 3 times a week for 12 months reduced the number of exacerbations from a median number of 2 per patient with placebo to 0 per patient with azithromycin (P < .001). At 3 months, the FEV1 as a percent of predicted had increased by 1.03% in the azithromycin group and decreased by 0.10% in the placebo group (P = .047). The number needed to treat with azithromycin to maintain clinical stability was 3.0.
Wong et al19 randomized patients to receive azithromycin 500 mg 3 times a week or placebo for 6 months. The rate of exacerbations was 0.59 per patient in the azithromycin group and 1.57 per patient in the placebo group (P < .0001). The FEV1 remained unchanged from baseline in the azithromycin group while decreasing in the placebo group, but the difference was not significant.
EXACERBATIONS OF CHRONIC OBSTRUCTIVE PULMONARY DISEASE
Acute exacerbations of chronic obstructive pulmonary disease (COPD) are a major cause of death, poor quality of life, and healthcare expenditures.20 Prevention is therefore of the utmost importance.
Several studies have shown that azithromycin prophylaxis can reduce acute exacerbations of COPD. A recent meta-analysis showed that long-term macrolide prophylaxis significantly reduced exacerbations compared with rates in controls (risk ratio = 0.70, 95% CI 0.56–0.87, P < .01) and increased the median time to first COPD exacerbation by more than 90 days (P < .01).21 Long-term azithromycin therapy may be considered in selected patients who have frequent exacerbations despite optimal maintenance inhaler therapy.
PROPHYLAXIS IN IMMUNODEFICIENCY
Disseminated Mycobacterium avium complex (MAC) is an opportunistic infection most commonly occurring in patients with acquired immunodeficiency syndrome with CD4 counts below 50 cells/µL.22,23
In a double-blinded, randomized trial, patients who received azithromycin had a 47% reduction in the incidence of MAC infection.
Given the long half-life of azithromycin, it is effective with once-weekly dosing of 1,200 mg.23 Ideally, patients are placed on a prophylactic agent for disseminated MAC infection until the CD4 count reaches 100 cells/µL and remains at or above this level for 3 consecutive months.24
ADVERSE EFFECTS AND PRECAUTIONS
Long-term azithromycin therapy may produce bacterial resistance; the risk has been estimated at 2.7 times greater in patients who are on long-term azithromycin treatment.25 Also, patients at risk for MAC infection, such as those with cystic fibrosis, should be screened for it before starting treatment in order to prevent resistance to azithromycin.
The US Food and Drug Administration warns that azithromycin can lead to a prolonged corrected QT interval and potential fatal arrhythmias such as torsades de pointes. Major reviews have largely agreed that arrhythmias are more pronounced in patients with a coexisting cardiac risk factor such as existing QT-interval prolongation, low blood levels of potassium or magnesium, a slower than normal heart rate, or arrhythmias, or who are on class IA and III antiarrhythmic drugs.26–28
Other potential adverse effects of long-term azithromycin treatment are gastrointestinal symptoms and hearing impairment.29,30 A review of potential drug interactions is advised when patients are placed on long-term azithromycin therapy.
Although azithromycin is generally well tolerated, long-term treatment should be individualized and the benefits weighed against the risks. Patients should be monitored during treatment for any of the above adverse effects.
References
Bailly S, Pocidalo JJ, Fay M, Gougerot-Pocidalo MA. Differential modulation of cytokine production by macrolides: interleukin-6 production is increased by spiramycin and erythromycin. Antimicrob Agents Chemother 1991; 35:2016–2019.
Kanoh S, Rubin BK. Mechanisms of action and clinical application of macrolides as immunomodulatory medications. Clin Microbiol Rev 2010; 23:590–615.
Culić O, Eraković V, Cepelak I, et al. Azithromycin modulates neutrophil function and circulating inflammatory mediators in healthy human subjects. Eur J Pharmacol 2002; 450:277–289.
Cohen-Cymberknoh M, Kerem E, Ferkol T, Elizur A. Airway inflammation in cystic fibrosis: molecular mechanisms and clinical implications. Thorax 2013; 68:1157–1162.
Sagel SD, Wagner BD, Anthony MM, Emmett P, Zemanick ET. Sputum biomarkers of inflammation and lung function decline in children with cystic fibrosis. Am J Respir Crit Care Med 2012; 186:857–865.
Saiman L, Anstead M, Mayer-Hamblett N, et al; AZ0004 Azithromycin Study Group. Effect of azithromycin on pulmonary function in patients with cystic fibrosis uninfected with Pseudomonas aeruginosa: a randomized controlled trial. JAMA 2010; 303:1707–1715.
Southern KW, Barker PM, Solis-Moya A, Patel L. Macrolide antibiotics for cystic fibrosis. Cochrane Database Syst Rev 2012;11:CD002203.
Flume PA, O’Sullivan BP, Robinson KA, et al; Cystic Fibrosis Foundation, Pulmonary Therapies Committee. Cystic fibrosis pulmonary guidelines: chronic medications for maintenance of lung health. Am J Respir Crit Care Med 2007; 176:957–969.
Yanagihara K, Kadoto J, Kohno S. Diffuse panbronchiolitis—pathophysiology and treatment mechanisms. Int J Antimicrob Agents 2001; 18(suppl 1):S83–S87.
Kudoh S, Azuma A, Yamamoto M, Izumi T, Ando M. Improvement of survival in patients with diffuse panbronchiolitis treated with low-dose erythromycin. Am J Respir Crit Care Med 1998; 157:1829–1832.
Schultz MJ. Macrolide activities beyond their antimicrobial effects: macrolides in diffuse panbronchiolitis and cystic fibrosis. J Antimicrob Chemother 2004; 54:21–28.
Hui D, Yan F, Chen RH. The effects of azithromycin on patients with diffuse panbronchiolitis: a retrospective study of 29 cases. J Thorac Dis 2013; 5:613–617.
Khalid M, Al Saghir A, Saleemi S, et al. Azithromycin in bronchiolitis obliterans complicating bone marrow transplantation: a preliminary study. Eur Respir J 2005; 25:490–493.
Kingah PL, Muma G, Soubani A. Azithromycin improves lung function in patients with post-lung transplant bronchiolitis obliterans syndrome: a meta-analysis. Clin Transplant 2014; 28:906–910.
Corris PA, Ryan VA, Small T, et al. A randomised controlled trial of azithromycin therapy in bronchiolitis obliterans syndrome (BOS) post lung transplantation. Thorax 2015; 70:442–450.
Williams KM, Cheng GS, Pusic I, et al. Fluticasone, azithromycin, and montelukast treatment for new-onset bronchiolitis obliterans syndrome after hematopoietic cell transplantation. Biol Blood Marrow Transplant 2016; 22:710–716.
Haworth CS, Bilton D, Elborn JS. Long-term macrolide maintenance therapy in non-CF bronchiectasis: evidence and questions. Respir Med 2014; 108:1397–1408.
Altenburg J, de Graaff CS, Stienstra Y, et al. Effect of azithromycin maintenance treatment on infectious exacerbations among patients with non-cystic fibrosis bronchiectasis: the BAT randomized controlled trial. JAMA 2013; 309:1251–1259.
Wong C, Jayaram L, Karalus N, et al. Azithromycin for prevention of exacerbations in non-cystic fibrosis bronchiectasis (EMBRACE): a randomised, double-blind, placebo-controlled trial. Lancet 2012; 380:660–667.
Suissa S, Dell’Aniello S, Ernst P. Long-term natural history of chronic obstructive pulmonary disease: severe exacerbations and mortality. Thorax 2012; 67:957–963.
Ni W, Shao X, Cai X, et al. Prophylactic use of macrolide antibiotics for the prevention of chronic obstructive pulmonary disease exacerbation: a meta-analysis. PLoS One 2015; 10:e0121257.
Griffith DE, Aksamit T, Brown-Elliott BA, et al; ATS Mycobacterial Diseases Subcommittee; American Thoracic Society; Infectious Disease Society of America. An official ATS/IDSA statement: diagnosis, treatment, and prevention of nontuberculous mycobacterial diseases. Am J Respir Crit Care Med 2007; 175:367–416.
Havlir DV, Dubé MP, Sattler FR, et al. Prophylaxis against disseminated Mycobacterium avium complex with weekly azithromycin, daily rifabutin, or both. California Collaborative Treatment Group. N Engl J Med 1996; 335:392–398.
Uthman MM, Uthman OA, Yahaya I. Interventions for the prevention of Mycobacterium avium complex in adults and children with HIV. Cochrane Database Syst Rev 2013; 4:CD007191.
Li H, Liu DH, Chen LL, et al. Meta-analysis of the adverse effects of long-term azithromycin use in patients with chronic lung diseases. Antimicrob Agents Chemother 2014; 58:511–517.
Svanström H, Pasternak B, Hviid A. Use of azithromycin and death from cardiovascular causes. N Engl J Med 2013; 368:1704–1712.
Albert RK, Schuller JL; COPD Clinical Research Network. Macrolide antibiotics and the risk of cardiac arrhythmias. Am J Respir Crit Care Med 2014; 189:1173–1180.
Ray WA, Murray KT, Hall K, Arbogast PG, Stein CM. Azithromycin and the risk of cardiovascular death. N Engl J Med 2012; 366:1881–1890.
Albert RK, Connett J, Bailey WC, et al; COPD Clinical Research Network. Azithromycin for prevention of exacerbations of COPD. N Engl J Med 2011; 365:689–698.
Broad J, Sanger GJ. The antibiotic azithromycin is a motilin receptor agonist in human stomach: comparison with erythromycin. Br J Pharmacol 2013; 168:1859–1867.
Abdulrazak Alchakaki, MD Division of Pulmonary, Critical Care, and Sleep Medicine, Wayne State University School of Medicine, Detroit, MI
Cassondra Cramer Division of Pulmonary, Critical Care and Sleep Medicine, Wayne State University School of Medicine, Detroit, MI
Allie Patterson Division of Pulmonary, Critical Care, and Sleep Medicine, Wayne State University School of Medicine, Detroit, MI
Ayman O. Soubani Division of Pulmonary, Critical Care, and Sleep Medicine, Wayne State University School of Medicine, Detroit, MI
Address: Abdulrazak Alchakaki, MD, Division of Pulmonary, Critical Care, and Sleep Medicine, Wayne State University School of Medicine, 3990 John R, 3 Hudson, Detroit, MI 48201; [email protected]
Author and Disclosure Information
Abdulrazak Alchakaki, MD Division of Pulmonary, Critical Care, and Sleep Medicine, Wayne State University School of Medicine, Detroit, MI
Cassondra Cramer Division of Pulmonary, Critical Care and Sleep Medicine, Wayne State University School of Medicine, Detroit, MI
Allie Patterson Division of Pulmonary, Critical Care, and Sleep Medicine, Wayne State University School of Medicine, Detroit, MI
Ayman O. Soubani Division of Pulmonary, Critical Care, and Sleep Medicine, Wayne State University School of Medicine, Detroit, MI
Address: Abdulrazak Alchakaki, MD, Division of Pulmonary, Critical Care, and Sleep Medicine, Wayne State University School of Medicine, 3990 John R, 3 Hudson, Detroit, MI 48201; [email protected]
Azithromycin is prescribed for a variety of acute respiratory and nonrespiratory infections. However, it is also used in several chronic respiratory diseases.
MECHANISM OF ACTION
Macrolide antibiotics like azithromycin inhibit bacterial growth and replication by interrupting protein synthesis. But azithromycin also has immunomodulatory properties.1
In the acute phase of inflammation, azithromycin exerts an initial neutrophil degranulation effect and enhances the oxidative response that is primed by particulate stimulus, which could facilitate its antibacterial effects. In the late phase, it down-regulates the oxidative burst and increases apoptosis of neutrophils to promote healing without compromising immunity. Azithromycin also attenuates airway mucus hypersecretion, improves ciliary function, and promotes pulmonary epithelial cell healing.2,3
Collectively, these effects make the drug effective in many chronic inflammatory lung conditions (Table 1).
CYSTIC FIBROSIS
Cystic fibrosis is a genetic disease affecting many organs, but its effect on the upper and lower airways has the greatest impact on quality of life and survival. Impaired mucociliary clearance and repeated respiratory infections contribute to chronic inflammation and a progressive decline in lung function.4,5
A 2012 Cochrane review of 5 studies in 549 patients found that, compared with those taking placebo, patients taking azithromycin 250–500 mg 3 times a week had improvement in forced expiratory volume in 1 second (FEV1). The mean difference at 6 months was 3.97% (95% cofidence interval [CI] 1.74– 6.19). Patients on azithromycin were free from pulmonary exacerbation approximately twice as long as patients on placebo (odds ratio 1.96, 95% CI 1.15–3.33).6,7
The Cystic Fibrosis Foundation recommends long-term azithromycin therapy to improve lung function and reduce exacerbations in patients age 6 or older who have persistent Pseudomonas aeruginosa airway cultures (level of evidence: fair).8
DIFFUSE PANBRONCHIOLITIS
Diffuse panbronchiolitis, or diffuse chronic inflammatory bronchiolitis and sinusitis, is seen mainly in patients of Asian descent.9 In the past, the mortality rate was greater than 90%, but between 1970 and 1979 the 10-year survival rate increased by more than 40% with chronic macrolide therapy, ie, with erythromycin.10,11
Later retrospective studies of azithromycin 500 mg 3 times a week showed results comparable to those with erythromycin, with improvement in symptoms, lung function, arterial partial pressure of oxygen, and radiologic findings, as well as fewer adverse effects.12 These benefits justify the current recommendation for azithromycin as the mainstay of therapy in diffuse panbronchiolitis.
BRONCHIOLITIS OBLITERANS SYNDROME
Bronchiolitis obliterans syndrome is an airflow limitation that arises without infection or imaging evidence of bronchiolitis in patients who received allogeneic hematopoietic stem cell or lung transplant. It occurs in 50% of lung transplant recipients as a form of chronic graft rejection and in 6% to 20% of allogeneic stem cell transplant recipients as a manifestation of chronic graft-vs-host disease.13,14
Azithromycin has been used in its management. A meta-analysis of lung transplant recipients found a significant improvement in the survival rate and overall lung function after an average of 7 months of treatment with azithromycin, with a mean increase in FEV1 of 8.8% (95% CI 5.1–12.47, P < .001).14 The evidence currently supports long-term azithromycin 250 mg 3 times a week after lung transplant to reduce any decline in lung function and to lower the mortality rate.14,15
In allogeneic stem cell transplant recipients, the evidence for long-term azithromycin treatment is sparse. A recent prospective multicenter study evaluated the effect of an azithromycin-based regimen (fluticasone, azithromycin, and montelukast, plus a steroid pulse) in stem cell recipients with bronchiolitis obliterans syndrome during the first 3 months after diagnosis. In the treated group, 6% had a drop in FEV1 of more than 10% at 3-month follow-up compared with 40% of historical controls (95% CI 1%–19%, P < .001). Also, treatment resulted in a 50% reduction in the dose of systemic steroids and a substantial improvement in functional status.16
Given the limited options in the management of these patients and until further studies are available, azithromycin 3 times weekly is suggested.
NON-CYSTIC FIBROSIS BRONCHIECTASIS
Non-cystic fibrosis bronchiectasis is a chronic inflammatory lung condition characterized by irreversible dilation of the bronchi and bronchioles due to a variety of causes including recurrent or old infection, immunodeficiency, autoimmune conditions, and connective tissue disease; it can also be idiopathic.17
Altenburg et al,18 in a randomized, double-blind, placebo-controlled trial, found that azithromycin 250 mg 3 times a week for 12 months reduced the number of exacerbations from a median number of 2 per patient with placebo to 0 per patient with azithromycin (P < .001). At 3 months, the FEV1 as a percent of predicted had increased by 1.03% in the azithromycin group and decreased by 0.10% in the placebo group (P = .047). The number needed to treat with azithromycin to maintain clinical stability was 3.0.
Wong et al19 randomized patients to receive azithromycin 500 mg 3 times a week or placebo for 6 months. The rate of exacerbations was 0.59 per patient in the azithromycin group and 1.57 per patient in the placebo group (P < .0001). The FEV1 remained unchanged from baseline in the azithromycin group while decreasing in the placebo group, but the difference was not significant.
EXACERBATIONS OF CHRONIC OBSTRUCTIVE PULMONARY DISEASE
Acute exacerbations of chronic obstructive pulmonary disease (COPD) are a major cause of death, poor quality of life, and healthcare expenditures.20 Prevention is therefore of the utmost importance.
Several studies have shown that azithromycin prophylaxis can reduce acute exacerbations of COPD. A recent meta-analysis showed that long-term macrolide prophylaxis significantly reduced exacerbations compared with rates in controls (risk ratio = 0.70, 95% CI 0.56–0.87, P < .01) and increased the median time to first COPD exacerbation by more than 90 days (P < .01).21 Long-term azithromycin therapy may be considered in selected patients who have frequent exacerbations despite optimal maintenance inhaler therapy.
PROPHYLAXIS IN IMMUNODEFICIENCY
Disseminated Mycobacterium avium complex (MAC) is an opportunistic infection most commonly occurring in patients with acquired immunodeficiency syndrome with CD4 counts below 50 cells/µL.22,23
In a double-blinded, randomized trial, patients who received azithromycin had a 47% reduction in the incidence of MAC infection.
Given the long half-life of azithromycin, it is effective with once-weekly dosing of 1,200 mg.23 Ideally, patients are placed on a prophylactic agent for disseminated MAC infection until the CD4 count reaches 100 cells/µL and remains at or above this level for 3 consecutive months.24
ADVERSE EFFECTS AND PRECAUTIONS
Long-term azithromycin therapy may produce bacterial resistance; the risk has been estimated at 2.7 times greater in patients who are on long-term azithromycin treatment.25 Also, patients at risk for MAC infection, such as those with cystic fibrosis, should be screened for it before starting treatment in order to prevent resistance to azithromycin.
The US Food and Drug Administration warns that azithromycin can lead to a prolonged corrected QT interval and potential fatal arrhythmias such as torsades de pointes. Major reviews have largely agreed that arrhythmias are more pronounced in patients with a coexisting cardiac risk factor such as existing QT-interval prolongation, low blood levels of potassium or magnesium, a slower than normal heart rate, or arrhythmias, or who are on class IA and III antiarrhythmic drugs.26–28
Other potential adverse effects of long-term azithromycin treatment are gastrointestinal symptoms and hearing impairment.29,30 A review of potential drug interactions is advised when patients are placed on long-term azithromycin therapy.
Although azithromycin is generally well tolerated, long-term treatment should be individualized and the benefits weighed against the risks. Patients should be monitored during treatment for any of the above adverse effects.
References
Bailly S, Pocidalo JJ, Fay M, Gougerot-Pocidalo MA. Differential modulation of cytokine production by macrolides: interleukin-6 production is increased by spiramycin and erythromycin. Antimicrob Agents Chemother 1991; 35:2016–2019.
Kanoh S, Rubin BK. Mechanisms of action and clinical application of macrolides as immunomodulatory medications. Clin Microbiol Rev 2010; 23:590–615.
Culić O, Eraković V, Cepelak I, et al. Azithromycin modulates neutrophil function and circulating inflammatory mediators in healthy human subjects. Eur J Pharmacol 2002; 450:277–289.
Cohen-Cymberknoh M, Kerem E, Ferkol T, Elizur A. Airway inflammation in cystic fibrosis: molecular mechanisms and clinical implications. Thorax 2013; 68:1157–1162.
Sagel SD, Wagner BD, Anthony MM, Emmett P, Zemanick ET. Sputum biomarkers of inflammation and lung function decline in children with cystic fibrosis. Am J Respir Crit Care Med 2012; 186:857–865.
Saiman L, Anstead M, Mayer-Hamblett N, et al; AZ0004 Azithromycin Study Group. Effect of azithromycin on pulmonary function in patients with cystic fibrosis uninfected with Pseudomonas aeruginosa: a randomized controlled trial. JAMA 2010; 303:1707–1715.
Southern KW, Barker PM, Solis-Moya A, Patel L. Macrolide antibiotics for cystic fibrosis. Cochrane Database Syst Rev 2012;11:CD002203.
Flume PA, O’Sullivan BP, Robinson KA, et al; Cystic Fibrosis Foundation, Pulmonary Therapies Committee. Cystic fibrosis pulmonary guidelines: chronic medications for maintenance of lung health. Am J Respir Crit Care Med 2007; 176:957–969.
Yanagihara K, Kadoto J, Kohno S. Diffuse panbronchiolitis—pathophysiology and treatment mechanisms. Int J Antimicrob Agents 2001; 18(suppl 1):S83–S87.
Kudoh S, Azuma A, Yamamoto M, Izumi T, Ando M. Improvement of survival in patients with diffuse panbronchiolitis treated with low-dose erythromycin. Am J Respir Crit Care Med 1998; 157:1829–1832.
Schultz MJ. Macrolide activities beyond their antimicrobial effects: macrolides in diffuse panbronchiolitis and cystic fibrosis. J Antimicrob Chemother 2004; 54:21–28.
Hui D, Yan F, Chen RH. The effects of azithromycin on patients with diffuse panbronchiolitis: a retrospective study of 29 cases. J Thorac Dis 2013; 5:613–617.
Khalid M, Al Saghir A, Saleemi S, et al. Azithromycin in bronchiolitis obliterans complicating bone marrow transplantation: a preliminary study. Eur Respir J 2005; 25:490–493.
Kingah PL, Muma G, Soubani A. Azithromycin improves lung function in patients with post-lung transplant bronchiolitis obliterans syndrome: a meta-analysis. Clin Transplant 2014; 28:906–910.
Corris PA, Ryan VA, Small T, et al. A randomised controlled trial of azithromycin therapy in bronchiolitis obliterans syndrome (BOS) post lung transplantation. Thorax 2015; 70:442–450.
Williams KM, Cheng GS, Pusic I, et al. Fluticasone, azithromycin, and montelukast treatment for new-onset bronchiolitis obliterans syndrome after hematopoietic cell transplantation. Biol Blood Marrow Transplant 2016; 22:710–716.
Haworth CS, Bilton D, Elborn JS. Long-term macrolide maintenance therapy in non-CF bronchiectasis: evidence and questions. Respir Med 2014; 108:1397–1408.
Altenburg J, de Graaff CS, Stienstra Y, et al. Effect of azithromycin maintenance treatment on infectious exacerbations among patients with non-cystic fibrosis bronchiectasis: the BAT randomized controlled trial. JAMA 2013; 309:1251–1259.
Wong C, Jayaram L, Karalus N, et al. Azithromycin for prevention of exacerbations in non-cystic fibrosis bronchiectasis (EMBRACE): a randomised, double-blind, placebo-controlled trial. Lancet 2012; 380:660–667.
Suissa S, Dell’Aniello S, Ernst P. Long-term natural history of chronic obstructive pulmonary disease: severe exacerbations and mortality. Thorax 2012; 67:957–963.
Ni W, Shao X, Cai X, et al. Prophylactic use of macrolide antibiotics for the prevention of chronic obstructive pulmonary disease exacerbation: a meta-analysis. PLoS One 2015; 10:e0121257.
Griffith DE, Aksamit T, Brown-Elliott BA, et al; ATS Mycobacterial Diseases Subcommittee; American Thoracic Society; Infectious Disease Society of America. An official ATS/IDSA statement: diagnosis, treatment, and prevention of nontuberculous mycobacterial diseases. Am J Respir Crit Care Med 2007; 175:367–416.
Havlir DV, Dubé MP, Sattler FR, et al. Prophylaxis against disseminated Mycobacterium avium complex with weekly azithromycin, daily rifabutin, or both. California Collaborative Treatment Group. N Engl J Med 1996; 335:392–398.
Uthman MM, Uthman OA, Yahaya I. Interventions for the prevention of Mycobacterium avium complex in adults and children with HIV. Cochrane Database Syst Rev 2013; 4:CD007191.
Li H, Liu DH, Chen LL, et al. Meta-analysis of the adverse effects of long-term azithromycin use in patients with chronic lung diseases. Antimicrob Agents Chemother 2014; 58:511–517.
Svanström H, Pasternak B, Hviid A. Use of azithromycin and death from cardiovascular causes. N Engl J Med 2013; 368:1704–1712.
Albert RK, Schuller JL; COPD Clinical Research Network. Macrolide antibiotics and the risk of cardiac arrhythmias. Am J Respir Crit Care Med 2014; 189:1173–1180.
Ray WA, Murray KT, Hall K, Arbogast PG, Stein CM. Azithromycin and the risk of cardiovascular death. N Engl J Med 2012; 366:1881–1890.
Albert RK, Connett J, Bailey WC, et al; COPD Clinical Research Network. Azithromycin for prevention of exacerbations of COPD. N Engl J Med 2011; 365:689–698.
Broad J, Sanger GJ. The antibiotic azithromycin is a motilin receptor agonist in human stomach: comparison with erythromycin. Br J Pharmacol 2013; 168:1859–1867.


")
")
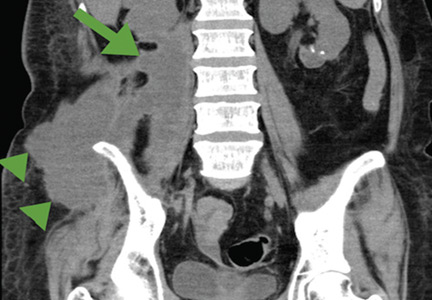


 Adapted from Navaneethan SD, Schold JD, Arrigain S, Jolly SE, Nally JV Jr. Cause-specific deaths in non-dialysis-dependent CKD. J Am Soc Nephrol 2015; 26:2512–2520.