User login
New approaches urged to address mental illness, addiction
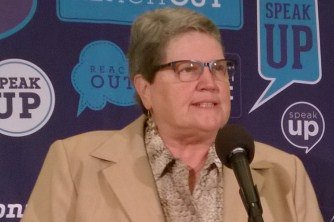
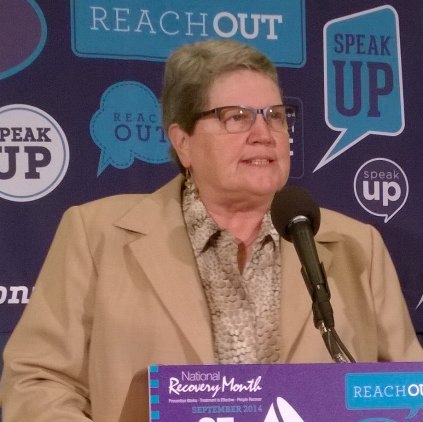
WASHINGTON – With more adolescents reporting a major depressive episode and the number of adults with any mental illness holding steady, SAMHSA Administrator Pamela S. Hyde said new approaches are needed.
"America needs to think about behavioral health differently, about addictions and mental illness and people who experience them differently," Ms. Hyde of the Substance Abuse and Mental Health Services Administrationsaid during a Sept. 4 press conference held to review key results of the 2013 National Survey on Drug Use and Health (NSDUH).

"Social norms about these illnesses have to change," she said. "The role of behavioral health of our communities, our families, and in ourselves has to change. The public’s commitment to and financial support for prevention, treatment, and recovery has to change, or else we are going to keep meeting here every fall ... giving the same numbers and showing the same problems."
NSDUH, an annual survey sponsored by SAMHSA, tracks illicit drug use and mental health issues in the United States for people aged 12 years and older. The agency plans to release the full report in the coming weeks.
To underscore the need for a different approach, Ms. Hyde highlighted two statistics on mental health from the 2013 survey – that more than 2.6 million adolescents (aged 12-17 years) experienced a major depressive episode (MDE) at some point in the 12 months prior to taking it. An MDE, defined using DSM-IV criteria, is a period of 2 weeks or longer when a depressed mood or loss of interest or pleasure in daily activities persists for this age group. In addition, the adolescent had at least four of seven additional symptoms, such as problems with sleeping, eating, energy, concentration, and self-worth. That number was up from the 2.5 million estimated to have had an MDE in the 2012 survey.
About 38% of adolescents with past-year MDE received treatment in 2013; that percentage climbed to 45% for those who had MDE with severe impairment. The survey defined treatment as talking with or seeing a doctor or other professional, or using prescription medication.
Part of the problem is simply recognizing the problem.
"This is one of the most common mental health issues among adolescents, and it’s treatable with the appropriate recognition and engagement with a trained health or behavioral health practitioner," Ms. Hyde said, noting that the normal challenges of being an adolescent can be confused with depression. Part of our work and effort is to help young people, teachers, and parents to understand the difference between a depressive episode and "the normal vagaries of adolescence," she said.
For adults aged 18 years and older with any mental illness not related to alcohol or drug use, the rate was about one in five, consistent between the 2012 and 2013 surveys. Among the 43.8 million adults in 2013 who had any mental illness, about 19.6 million received mental health services treatment. Among the 10 million adults with serious mental illness, about 68.5% received mental health services.
"So even with serious mental conditions or any mental illness with serious impairments or major depressive episodes with severe impairment, we are not getting people to the treatment they need," Ms. Hyde said, adding that the 18.5% of adults having any mental illness is greater than the 11.3% of adults diagnosed with heart disease.
Do you screen teens in your practice for major depressive disorder? Take our quick poll on the Pediatric News homepage.
WASHINGTON – With more adolescents reporting a major depressive episode and the number of adults with any mental illness holding steady, SAMHSA Administrator Pamela S. Hyde said new approaches are needed.
"America needs to think about behavioral health differently, about addictions and mental illness and people who experience them differently," Ms. Hyde of the Substance Abuse and Mental Health Services Administrationsaid during a Sept. 4 press conference held to review key results of the 2013 National Survey on Drug Use and Health (NSDUH).
"Social norms about these illnesses have to change," she said. "The role of behavioral health of our communities, our families, and in ourselves has to change. The public’s commitment to and financial support for prevention, treatment, and recovery has to change, or else we are going to keep meeting here every fall ... giving the same numbers and showing the same problems."
NSDUH, an annual survey sponsored by SAMHSA, tracks illicit drug use and mental health issues in the United States for people aged 12 years and older. The agency plans to release the full report in the coming weeks.
To underscore the need for a different approach, Ms. Hyde highlighted two statistics on mental health from the 2013 survey – that more than 2.6 million adolescents (aged 12-17 years) experienced a major depressive episode (MDE) at some point in the 12 months prior to taking it. An MDE, defined using DSM-IV criteria, is a period of 2 weeks or longer when a depressed mood or loss of interest or pleasure in daily activities persists for this age group. In addition, the adolescent had at least four of seven additional symptoms, such as problems with sleeping, eating, energy, concentration, and self-worth. That number was up from the 2.5 million estimated to have had an MDE in the 2012 survey.
About 38% of adolescents with past-year MDE received treatment in 2013; that percentage climbed to 45% for those who had MDE with severe impairment. The survey defined treatment as talking with or seeing a doctor or other professional, or using prescription medication.
Part of the problem is simply recognizing the problem.
"This is one of the most common mental health issues among adolescents, and it’s treatable with the appropriate recognition and engagement with a trained health or behavioral health practitioner," Ms. Hyde said, noting that the normal challenges of being an adolescent can be confused with depression. Part of our work and effort is to help young people, teachers, and parents to understand the difference between a depressive episode and "the normal vagaries of adolescence," she said.
For adults aged 18 years and older with any mental illness not related to alcohol or drug use, the rate was about one in five, consistent between the 2012 and 2013 surveys. Among the 43.8 million adults in 2013 who had any mental illness, about 19.6 million received mental health services treatment. Among the 10 million adults with serious mental illness, about 68.5% received mental health services.
"So even with serious mental conditions or any mental illness with serious impairments or major depressive episodes with severe impairment, we are not getting people to the treatment they need," Ms. Hyde said, adding that the 18.5% of adults having any mental illness is greater than the 11.3% of adults diagnosed with heart disease.
Do you screen teens in your practice for major depressive disorder? Take our quick poll on the Pediatric News homepage.
AT A SAMHSA PRESS BRIEFING
Young adults using emergency departments less in post-ACA world
Young adults are using emergency departments less following the implementation of expanded coverage under the Affordable Care Act, though the number of patients from this population has not significantly changed.
According to new research published in Health Affairs, ED visits by young adults increased by 3.8 visits/1,000 people between pre-ACA implementation (Sept. 1, 2009-Aug. 31, 2010) and post-ACA implementation (2011 calendar year), while the control group of adults ages 26-31 [years] increased by 6.5/1,000 people. "The difference-in-differences analysis estimated an absolute difference of –2.7%/1,000 people among the younger group, compared to the older group. After regression adjustment ... the difference-in-differences analysis estimated a reduction of 2.1% in young adults ages 19-25 [years], compared to people ages 26-31 [years]."

Researchers analyzed data from three states – California, Florida, and New York – and also found that among people aged 26-31 years, the probability of an ED visit between pre-and post-ACA implementation increased by 2.2%, while young adults aged 19-25 years had a smaller increase of 1.9%.
Findings were published online Sept. 8 and are scheduled to appear in the September issue of Health Affairs (2014 [doi:10.1377/hthaff.2014.0103]).
"Our results suggest that the ACA’s dependent coverage provision is associated with a relative decrease in the number of ED visits for young adults but a minimum relative decrease in the rate at which they ever used the ED," reported Tina Hernandez-Boussard of the departments of surgery and biomedical informatics at Stanford (Calif.) University, and her associates.
The authors state that the research and analysis showed that "ED use by young adults ages 19-25 expanded by a modest amount after the implementation of the ACA insurance expansion but that ED use by people ages 26-31, who were not including in the ACA expansion, grew faster. Relatively slower growth in use by the younger group is consistent with the view that the ACA decreased ED use in this age group."
Dr. Hernandez-Boussard and her associates suggest that better coverage of young adults "could have facilitated better access to health care in non-ED settings such as doctors’ offices, which could have reduced the use of ED care."
Young adults are using emergency departments less following the implementation of expanded coverage under the Affordable Care Act, though the number of patients from this population has not significantly changed.
According to new research published in Health Affairs, ED visits by young adults increased by 3.8 visits/1,000 people between pre-ACA implementation (Sept. 1, 2009-Aug. 31, 2010) and post-ACA implementation (2011 calendar year), while the control group of adults ages 26-31 [years] increased by 6.5/1,000 people. "The difference-in-differences analysis estimated an absolute difference of –2.7%/1,000 people among the younger group, compared to the older group. After regression adjustment ... the difference-in-differences analysis estimated a reduction of 2.1% in young adults ages 19-25 [years], compared to people ages 26-31 [years]."
Researchers analyzed data from three states – California, Florida, and New York – and also found that among people aged 26-31 years, the probability of an ED visit between pre-and post-ACA implementation increased by 2.2%, while young adults aged 19-25 years had a smaller increase of 1.9%.
Findings were published online Sept. 8 and are scheduled to appear in the September issue of Health Affairs (2014 [doi:10.1377/hthaff.2014.0103]).
"Our results suggest that the ACA’s dependent coverage provision is associated with a relative decrease in the number of ED visits for young adults but a minimum relative decrease in the rate at which they ever used the ED," reported Tina Hernandez-Boussard of the departments of surgery and biomedical informatics at Stanford (Calif.) University, and her associates.
The authors state that the research and analysis showed that "ED use by young adults ages 19-25 expanded by a modest amount after the implementation of the ACA insurance expansion but that ED use by people ages 26-31, who were not including in the ACA expansion, grew faster. Relatively slower growth in use by the younger group is consistent with the view that the ACA decreased ED use in this age group."
Dr. Hernandez-Boussard and her associates suggest that better coverage of young adults "could have facilitated better access to health care in non-ED settings such as doctors’ offices, which could have reduced the use of ED care."
FROM HEALTH AFFAIRS

Marijuana use continues to rise as perception of risk decreases
WASHINGTON – Marijuana use is increasing in teens and could climb ever higher given the relaxation in marijuana laws across the United States.
Approximately 7.5% of the U.S. population aged 12 years and older are current users of marijuana, according to the annual National Survey on Drug Use and Health (NSDUH) released Sept. 4 by the Substance Abuse and Mental Health Services Administration (SAMHSA). The survey tracks the substance use and mental health issues in the U.S. population.

The rate of marijuana use is a "significant increase" over the 2011 rate. In 2012, 7% of survey respondents said they were current users of marijuana, meaning they had used it at least once within 30 days prior to taking the survey, SAMHSA Administrator Pamela S. Hyde said at a press briefing. She suggested that rate could go up when the survey is conducted for 2014.
"These data are from 2013, so they don’t yet reflect the changes in these numbers we may experience as cities and states legalize this drug for adult recreational use."
Another indication that the numbers could continue to rise is the fact that people are perceiving a lower risk.
"The issue of marijuana is a big one in our country today," Ms. Hyde said, with 40% of adolescents aged 12-17 years reporting that they "perceive a great risk smoking marijuana once or twice a week. ... As the perception of risk of harm goes down, it follows a year or two later that the use goes up."
The increase in overall marijuana use is driving increases in overall illicit drug use, according to the survey. Respondents claiming to be current users of illicit drugs were 24.6 million of those aged 12 years and older, or 9.4% of the population.
About 52% of the population aged 12 years and over (136.9 million) reported being current users of alcohol (at least one drink in the 30 days prior), with 23% claiming binge use (at least one session with five or more drinks consumed within the 30 days prior) and 6.3% being heavy users (at least five sessions of five or more drinks in one session).
The survey also found that an estimated 22.7 million people aged 12 years and over needed treatment for an illicit drug or alcohol problem, and only 2.5 million were treated in a specialty facility.
WASHINGTON – Marijuana use is increasing in teens and could climb ever higher given the relaxation in marijuana laws across the United States.
Approximately 7.5% of the U.S. population aged 12 years and older are current users of marijuana, according to the annual National Survey on Drug Use and Health (NSDUH) released Sept. 4 by the Substance Abuse and Mental Health Services Administration (SAMHSA). The survey tracks the substance use and mental health issues in the U.S. population.
The rate of marijuana use is a "significant increase" over the 2011 rate. In 2012, 7% of survey respondents said they were current users of marijuana, meaning they had used it at least once within 30 days prior to taking the survey, SAMHSA Administrator Pamela S. Hyde said at a press briefing. She suggested that rate could go up when the survey is conducted for 2014.
"These data are from 2013, so they don’t yet reflect the changes in these numbers we may experience as cities and states legalize this drug for adult recreational use."
Another indication that the numbers could continue to rise is the fact that people are perceiving a lower risk.
"The issue of marijuana is a big one in our country today," Ms. Hyde said, with 40% of adolescents aged 12-17 years reporting that they "perceive a great risk smoking marijuana once or twice a week. ... As the perception of risk of harm goes down, it follows a year or two later that the use goes up."
The increase in overall marijuana use is driving increases in overall illicit drug use, according to the survey. Respondents claiming to be current users of illicit drugs were 24.6 million of those aged 12 years and older, or 9.4% of the population.
About 52% of the population aged 12 years and over (136.9 million) reported being current users of alcohol (at least one drink in the 30 days prior), with 23% claiming binge use (at least one session with five or more drinks consumed within the 30 days prior) and 6.3% being heavy users (at least five sessions of five or more drinks in one session).
The survey also found that an estimated 22.7 million people aged 12 years and over needed treatment for an illicit drug or alcohol problem, and only 2.5 million were treated in a specialty facility.
AT A SAMHSA PRESS BRIEFING
Drug black box warnings up post-Vioxx withdrawal
An examination of pharmacological and biological therapeutics approved between 1996 and 2012 revealed that the number of Food and Drug Administration–approved therapeutic agents given black box warnings skyrocketed in the wake of the 2004 withdrawal of Merck’s rofecoxib (Vioxx) from the market.
During this time, there were 522 novel therapeutics approved, including 441 pharmacological and 81 biological products, with 180 (136 pharmacological and 44 biological) receiving a black box warning. Premarket warnings were issued for 105 products, postmarket warnings were issued for 50 products, and 25 had both pre- and postmarket warnings associated with them. In total, there were 89 postmarket boxed warnings, with 11 withdrawals, most of which (81%) occurred after 2004, when the FDA launched initiatives to strengthen drug safety surveillance, Christine Cheng, Pharm.D., and her colleagues said in a report in JAMA Internal Medicine (2014 Aug. 15 [doi: 10.1001/jamainternmed.2014.4854]).

"Our study demonstrates that boxed warnings are common, affecting more than one-third of recent drug approvals. ... Our findings that half of biological products had boxed warnings is consistent with literature suggesting that biologic products pose a greater risk of serious adverse events compared to other drug types," wrote Dr. Cheng, of First Databank in San Francisco, and her colleagues.
A proposed rule issued by the FDA in June could undermine that communication of risk using the boxed warning, according to Dr. Sidney Wolfe, senior adviser at Public Citizen’s Health Research Group, Washington, D.C.
In an editorial accompanying Dr. Cheng’s report, Dr. Wolfe noted that the draft guidance would allow drug companies that "believe that the FDA-approved drug labeling information overstates the risks of their drug to tell physicians that the risks are, in fact, lower," adding that the draft guidance "may encourage companies to promote the supposed evidence of lower risk in a peer-reviewed article directly to physicians without the FDA ever having been informed, so that the agency can review the data" (2014 Aug. 15 [doi: 10.1001/jamainternmed.2014.4547]).
Dr. Wolfe called on the FDA to maintain current regulatory requirements that would have a company report evidence to the FDA first in support of risk reduction and get the label changed that way.
"Off-label risk reduction is a misguided approach," he said.
Dr. Cheng is employed by First Databank, a commercial drug knowledge vendor. No other authors of the research or the editorial reported any financial disclosures.
An examination of pharmacological and biological therapeutics approved between 1996 and 2012 revealed that the number of Food and Drug Administration–approved therapeutic agents given black box warnings skyrocketed in the wake of the 2004 withdrawal of Merck’s rofecoxib (Vioxx) from the market.
During this time, there were 522 novel therapeutics approved, including 441 pharmacological and 81 biological products, with 180 (136 pharmacological and 44 biological) receiving a black box warning. Premarket warnings were issued for 105 products, postmarket warnings were issued for 50 products, and 25 had both pre- and postmarket warnings associated with them. In total, there were 89 postmarket boxed warnings, with 11 withdrawals, most of which (81%) occurred after 2004, when the FDA launched initiatives to strengthen drug safety surveillance, Christine Cheng, Pharm.D., and her colleagues said in a report in JAMA Internal Medicine (2014 Aug. 15 [doi: 10.1001/jamainternmed.2014.4854]).
"Our study demonstrates that boxed warnings are common, affecting more than one-third of recent drug approvals. ... Our findings that half of biological products had boxed warnings is consistent with literature suggesting that biologic products pose a greater risk of serious adverse events compared to other drug types," wrote Dr. Cheng, of First Databank in San Francisco, and her colleagues.
A proposed rule issued by the FDA in June could undermine that communication of risk using the boxed warning, according to Dr. Sidney Wolfe, senior adviser at Public Citizen’s Health Research Group, Washington, D.C.
In an editorial accompanying Dr. Cheng’s report, Dr. Wolfe noted that the draft guidance would allow drug companies that "believe that the FDA-approved drug labeling information overstates the risks of their drug to tell physicians that the risks are, in fact, lower," adding that the draft guidance "may encourage companies to promote the supposed evidence of lower risk in a peer-reviewed article directly to physicians without the FDA ever having been informed, so that the agency can review the data" (2014 Aug. 15 [doi: 10.1001/jamainternmed.2014.4547]).
Dr. Wolfe called on the FDA to maintain current regulatory requirements that would have a company report evidence to the FDA first in support of risk reduction and get the label changed that way.
"Off-label risk reduction is a misguided approach," he said.
Dr. Cheng is employed by First Databank, a commercial drug knowledge vendor. No other authors of the research or the editorial reported any financial disclosures.
FROM JAMA INTERNAL MEDICINE
Major finding: Eighty-one percent of FDA boxed warnings/withdrawals of CDER-approved drugs between 1996 and 2012 came after Vioxx was withdrawn in 2004.
Data source: An analysis of therapeutics, including pharmacological and biological products, approved by the FDA Center for Drug Evaluation and Research and the associated boxed warnings issued before and after market approval to determine trends of warnings issued.
Disclosures: Dr. Cheng is employed by First Databank, a commercial drug knowledge vendor. No other authors of the research or the editorial reported any financial disclosures.

Patient-centered medical home shows cost savings potential
Medicare paid less for beneficiaries who received health care services as part of a National Committee for Quality Assurance–recognized patient-centered medical home, compared with those in traditional delivery models, according to new research.
Researchers examined practice-level patterns and costliness of care for Medicare fee-for-service beneficiaries who received medical treatment between July 1, 2007, and June 30, 2010, from one of 308 NCQA-recognized patient-centered medical homes (PCMHs) vs. a comparison group of beneficiaries who received health care from medical practices lacking that recognition. The Centers for Medicare & Medicaid Services funded the study.

Baseline health care utilization "was lower among NCQA-recognized PCMHs across all utilization measures used in this study," according to the report, published July 30 online in Health Services Research (2014 [doi:10.1111/1475-6773.12217]). "For example, the number of hospitalizations (per 1,000 beneficiaries) for any condition was 27% lower than in the comparison group (189 vs. 258), whereas emergency department visits (per 1,000 beneficiaries) for any condition were 21% lower (405 vs. 513)," reported Martijn van Hasselt of the University of North Carolina at Greensboro and his associates. RTI International conducted the study. "Average Medicare payments per Medicare [fee-for-service] beneficiary, except for [federally qualified health center] payments were also lower for NCQA-recognized PCMHs. For example, average total Medicare payments were 25% lower than for the comparison group ($5,382 vs. $7,169)," the report continued:
Researchers also found that emergency department visits declined for practices with PCMH recognition, though other utilization outcomes, including hospitalizations, 30-day readmissions and annual visits were not affected by receipt of recognition.
"Our findings suggest that the practices recognized as PCMHs were able to prevent some emergency department visits, perhaps through more efficient care coordination and care management," the authors stated. No financial disclosures were made by the study’s authors.
Findings of PCMH’s potential contradict results from a 3-year pilot study detailed in the Feb. 26 issue of JAMA, which showed that small- and medium-size primary care practices that had created PCMHs were not successful in reducing costs or curbing hospital and emergency department visits (JAMA 2014;311:815-25 [doi:10.1001/jama.2014.353]).
Medicare paid less for beneficiaries who received health care services as part of a National Committee for Quality Assurance–recognized patient-centered medical home, compared with those in traditional delivery models, according to new research.
Researchers examined practice-level patterns and costliness of care for Medicare fee-for-service beneficiaries who received medical treatment between July 1, 2007, and June 30, 2010, from one of 308 NCQA-recognized patient-centered medical homes (PCMHs) vs. a comparison group of beneficiaries who received health care from medical practices lacking that recognition. The Centers for Medicare & Medicaid Services funded the study.
Baseline health care utilization "was lower among NCQA-recognized PCMHs across all utilization measures used in this study," according to the report, published July 30 online in Health Services Research (2014 [doi:10.1111/1475-6773.12217]). "For example, the number of hospitalizations (per 1,000 beneficiaries) for any condition was 27% lower than in the comparison group (189 vs. 258), whereas emergency department visits (per 1,000 beneficiaries) for any condition were 21% lower (405 vs. 513)," reported Martijn van Hasselt of the University of North Carolina at Greensboro and his associates. RTI International conducted the study. "Average Medicare payments per Medicare [fee-for-service] beneficiary, except for [federally qualified health center] payments were also lower for NCQA-recognized PCMHs. For example, average total Medicare payments were 25% lower than for the comparison group ($5,382 vs. $7,169)," the report continued:
Researchers also found that emergency department visits declined for practices with PCMH recognition, though other utilization outcomes, including hospitalizations, 30-day readmissions and annual visits were not affected by receipt of recognition.
"Our findings suggest that the practices recognized as PCMHs were able to prevent some emergency department visits, perhaps through more efficient care coordination and care management," the authors stated. No financial disclosures were made by the study’s authors.
Findings of PCMH’s potential contradict results from a 3-year pilot study detailed in the Feb. 26 issue of JAMA, which showed that small- and medium-size primary care practices that had created PCMHs were not successful in reducing costs or curbing hospital and emergency department visits (JAMA 2014;311:815-25 [doi:10.1001/jama.2014.353]).
FROM HEALTH SERVICES RESEARCH

Clinical decision support demonstration shows promise, challenges
Clinical decision support, a key component in the electronic health records meaningful use criteria, still faces some significant implementation challenges, based on the results of two demonstration projects by the Agency for Healthcare Research and Quality.
Both projects "demonstrated the ability to translate evidence-based knowledge into useful, actionable guidance for clinical care through" clinical decision support (CDS), according to a report detailing the results of the projects. Further, the projects demonstrated the value of working with professional associations and guideline developers to provide tools and guidance for improving CDS development and clinical quality reporting. They also highlighted the value of aligning clinical quality measurement with CDS implementation.
However, the projects also demonstrated that while centrally developed CDS "is feasible, customization of CDS is still required on a site-by-site basis" to account for the need to customize the CDS app to local electronic health record (EHR) systems and to follow local data-coding conventions and practices. This can be "very labor intensive," the report noted.
Other significant challenges revealed by the two projects were "major difficulties" encountered when clinical guidelines were updated. "These implementation challenges point to the need for additional work on developing standards for EHR design, terminology, and data coding," the report said.
The two projects also encountered challenges associated with local variations in clinical workflow.
"It is essential to understand early in the implementation process when in the course of clinical care the data elements needed by the CDS tool are entered into the EHR system, and when it is appropriate for the decision support to appear," the report stated. "Similar considerations will also dictate to whom the decision support should be addressed."
Legal issues related to intellectual property, liability, and other concerns "merit further discussion and policy development," the report added."
Youths turning to e-cigarettes over traditional smokes
Students in grades 6-12 who have never smoked traditional cigarettes are trying e-cigarettes in greater numbers, potentially justifying the Food and Drug Administration’s proposal to broaden its tobacco oversight to include e-cigarettes.
The number of middle- to high-school-aged children who have never smoked but have used e-cigarettes increased threefold between 2011 and 2013 from 79,000 to 263,000, based on an analysis of the Centers for Disease Control and Prevention’s (CDC’s) National Youth Tobacco Survey from 2011, 2012, and 2013. In addition, among those who have tried e-cigarettes, 43.9% said they intended to smoke conventional cigarettes, according to a report published online Aug. 20 in Nicotine & Tobacco Research.

"The increasing number of young people who use e-cigarettes should be a concern for parents and the public health community, especially since youth e-cigarette users were nearly twice as likely to have intentions to smoke conventional cigarettes, compared with youth who never tried e-cigarettes," Rebecca Bunnell, Sc.D., associate director of the CDC’s Office on Smoking and Health, and her colleagues reported (Nicotine Tob. Res. 2014 Aug. 20 [doi: 10.1093/ntr/ntu166]).
Research also found connections between the number of tobacco ads to which youths were exposed and the likelihood of intention to smoke cigarettes. Of students who said they had no exposure to such advertising, 13% reported that they intended to smoke, compared with 20.4% of those who reported exposure to one or two ads and 25.6% among those reporting exposure to three or four ads.
The Food and Drug Administration currently is reviewing comments on a proposed rule that would broaden its regulatory authority over tobacco products to include e-cigarettes. Various medical societies have called for that regulation to cover advertising of e-cigarettes as well as other related products, such as refill containers.
The authors reported no conflicts of interest.
Students in grades 6-12 who have never smoked traditional cigarettes are trying e-cigarettes in greater numbers, potentially justifying the Food and Drug Administration’s proposal to broaden its tobacco oversight to include e-cigarettes.
The number of middle- to high-school-aged children who have never smoked but have used e-cigarettes increased threefold between 2011 and 2013 from 79,000 to 263,000, based on an analysis of the Centers for Disease Control and Prevention’s (CDC’s) National Youth Tobacco Survey from 2011, 2012, and 2013. In addition, among those who have tried e-cigarettes, 43.9% said they intended to smoke conventional cigarettes, according to a report published online Aug. 20 in Nicotine & Tobacco Research.
"The increasing number of young people who use e-cigarettes should be a concern for parents and the public health community, especially since youth e-cigarette users were nearly twice as likely to have intentions to smoke conventional cigarettes, compared with youth who never tried e-cigarettes," Rebecca Bunnell, Sc.D., associate director of the CDC’s Office on Smoking and Health, and her colleagues reported (Nicotine Tob. Res. 2014 Aug. 20 [doi: 10.1093/ntr/ntu166]).
Research also found connections between the number of tobacco ads to which youths were exposed and the likelihood of intention to smoke cigarettes. Of students who said they had no exposure to such advertising, 13% reported that they intended to smoke, compared with 20.4% of those who reported exposure to one or two ads and 25.6% among those reporting exposure to three or four ads.
The Food and Drug Administration currently is reviewing comments on a proposed rule that would broaden its regulatory authority over tobacco products to include e-cigarettes. Various medical societies have called for that regulation to cover advertising of e-cigarettes as well as other related products, such as refill containers.
The authors reported no conflicts of interest.
FROM NICOTINE & TOBACCO RESEARCH

Soda tax could go far to reduce childhood obesity
Adding an excise tax of $0.01 per ounce to sugar-sweetened beverages has the potential to reduce obesity rates by 2.4% in adolescents and 1.6% in children, according to new research.
"It reduces obesity while generating significant revenue for additional obesity prevention activities," Alyson Kreutensen of Partners for Prevention in Washington, D.C., and her colleagues said, citing an estimate that such a tax would have generated $13.25 billion in 2010 (Am. J. Prev. Med. 2014 Aug. 28 [doi:10.1016/ampre.2014.07.011]).

The researchers analyzed three policies aimed at reducing childhood obesity – the excise tax, after-school physical activity programs, and a ban on child-directed fast food television advertising – looking at each policy’s impact on diet or physical activity, as well as body mass index, on a simulated school-aged population in 2032.
The physical activity program fared the best, reducing obesity among the most children aged 6-12 years (a 1.8-percentage point decrease), with the advertising ban having the smallest effect of the three policies examined (a 0.9-percentage point decrease). The excise tax, however, was cited as the best option because it also would help reduce sugar-sweetened beverage consumption in adults and raise revenue.
An excise tax "would also reduce obesity among adults who consume sugar-sweetened beverages, does not require substantial federal funding to implement (unlike the afterschool policy) and would not face the legal hurdles that new regulations often encounter," they said.
The researchers also predicted that the excise tax would have a greater impact for black and Hispanic populations because whites "had higher income levels and are therefore less affected by a price increase, and had a lower baseline rate of obesity."
The investigators reported no relevant conflicts of interest. The study was funded by the Aetna Foundation.
Adding an excise tax of $0.01 per ounce to sugar-sweetened beverages has the potential to reduce obesity rates by 2.4% in adolescents and 1.6% in children, according to new research.
"It reduces obesity while generating significant revenue for additional obesity prevention activities," Alyson Kreutensen of Partners for Prevention in Washington, D.C., and her colleagues said, citing an estimate that such a tax would have generated $13.25 billion in 2010 (Am. J. Prev. Med. 2014 Aug. 28 [doi:10.1016/ampre.2014.07.011]).
The researchers analyzed three policies aimed at reducing childhood obesity – the excise tax, after-school physical activity programs, and a ban on child-directed fast food television advertising – looking at each policy’s impact on diet or physical activity, as well as body mass index, on a simulated school-aged population in 2032.
The physical activity program fared the best, reducing obesity among the most children aged 6-12 years (a 1.8-percentage point decrease), with the advertising ban having the smallest effect of the three policies examined (a 0.9-percentage point decrease). The excise tax, however, was cited as the best option because it also would help reduce sugar-sweetened beverage consumption in adults and raise revenue.
An excise tax "would also reduce obesity among adults who consume sugar-sweetened beverages, does not require substantial federal funding to implement (unlike the afterschool policy) and would not face the legal hurdles that new regulations often encounter," they said.
The researchers also predicted that the excise tax would have a greater impact for black and Hispanic populations because whites "had higher income levels and are therefore less affected by a price increase, and had a lower baseline rate of obesity."
The investigators reported no relevant conflicts of interest. The study was funded by the Aetna Foundation.
FROM THE AMERICAN JOURNAL OF PREVENTIVE MEDICINE
Key clinical finding: Among three options examined, taxing soda and other sugary beverages has the best potential to lower childhood obesity
Major finding: Taxing sugar-sweetened beverages could reduce obesity rates by 2.4% in adolescents and by 1.6% in children.
Data source: Literature review of studies published from January 2000 through July 2012 to determine effectiveness of three policies – afterschool physical activity program, taxing sugar-sweetened beverages at $0.01 per ounce, and a ban on child-directed fast food television advertising – in a simulated school-aged population in 2032.
Disclosures: The authors reported no financial conflicts. Research was funded by the Aetna Foundation.

CMS extends Open Payment review and dispute deadline – again
The Centers for Medicare & Medicaid Services is extending the deadlines for the review and dispute process for its Open Payments system to Sept. 10. It is the second announced delay in the past month.
The agency is altering the deadline because scheduled maintenance on the Open Payments system has interrupted its availability recently. (The next service disruption is set for Sept. 5.) The deadline is being extended to "allow ample time in the review, dispute, and correction process," the agency announced on Aug. 28.

The new window for the review and dispute process now closes Sept. 10, with the correction period now going from Sept. 11 to Sept. 25. The CMS still plans to publish information on Sept. 30.
The CMS reactivated the system in early August after technical glitches that caused data to be linked to the wrong physician forced Open Payments offline for several days. When it was back online, the review and dispute deadline was extended to Sept. 8 from the previous Aug. 27 deadline.
The Open Payments Program, created by the Affordable Care Act, aims to add transparency to the financial relationship between the health care industry and physicians and teaching hospitals. However, the system has had numerous technical issues and the agency has previously said that about a third of payment information will not be available when information is released to the public on Sept. 30.
The Centers for Medicare & Medicaid Services is extending the deadlines for the review and dispute process for its Open Payments system to Sept. 10. It is the second announced delay in the past month.
The agency is altering the deadline because scheduled maintenance on the Open Payments system has interrupted its availability recently. (The next service disruption is set for Sept. 5.) The deadline is being extended to "allow ample time in the review, dispute, and correction process," the agency announced on Aug. 28.
The new window for the review and dispute process now closes Sept. 10, with the correction period now going from Sept. 11 to Sept. 25. The CMS still plans to publish information on Sept. 30.
The CMS reactivated the system in early August after technical glitches that caused data to be linked to the wrong physician forced Open Payments offline for several days. When it was back online, the review and dispute deadline was extended to Sept. 8 from the previous Aug. 27 deadline.
The Open Payments Program, created by the Affordable Care Act, aims to add transparency to the financial relationship between the health care industry and physicians and teaching hospitals. However, the system has had numerous technical issues and the agency has previously said that about a third of payment information will not be available when information is released to the public on Sept. 30.

Physicians in group practice setting make more
Physicians in medical groups and other organized systems of care delivery saw a slight increase in compensation, according to annual survey data released by the American Medical Group Management Association.
In general, findings show average percentage increases in compensation in 2013 were slightly higher than in 2012, with the overall weighted average increase in 2013 being 2.9%, up from 1.6% in the previous year. Results were based on a survey conducted on behalf of the American Medical Group Management Association (AMGA) by Sullivan, Cotter and Associates, with 289 medical groups representing about 73,700 providers submitting valid survey responses. AMGA released the survey results on Aug. 20.
Individual specialties showing the biggest median total compensation increase year-over-year include gastroenterology (a 9.0% increase to $471,336), cardiac/thoracic surgery (8.2% to $569,073), emergency medicine (5.2% to $316,739), and neurology (5.1% to $268,096). Total compensation includes the total compensation of the individual provider, including base, variable, and administrative compensation, plus all voluntary salary reductions.
Four specialties saw compensation decreases during this time period, including allergy/immunology (a 1.3% decrease to $267,338), rheumatologic disease (–0.5% to $239,112), cardiology-cath lab (–0.4% to $544,733), and endocrinology (–0.2% to $233,769).
Overall, AMGA reported that 68% of specialties reported increases in compensation in 2013, with primary care specialists reporting a 3.8% increase in 2013, up from 2.8% in 2012. Other specialists saw compensation increase on average 1.8%, up from 1.6%, and surgical specialists saw an average increase of 3.0%, up from 0.5%.