User login
Doug Brunk is a San Diego-based award-winning reporter who began covering health care in 1991. Before joining the company, he wrote for the health sciences division of Columbia University and was an associate editor at Contemporary Long Term Care magazine when it won a Jesse H. Neal Award. His work has been syndicated by the Los Angeles Times and he is the author of two books related to the University of Kentucky Wildcats men's basketball program. Doug has a master’s degree in magazine journalism from the S.I. Newhouse School of Public Communications at Syracuse University. Follow him on Twitter @dougbrunk.
Decreased insulin clearance may be first step on path to insulin resistance
LOS ANGELES – As obese, nondiabetic individuals become more insulin resistant, a decrease in insulin clearance is the first change to occur, according to Sun H. Kim, MD.

“You will often hear about how insulin resistance enhances demand on beta cells to increase insulin secretion, which leads to hyperinsulinemia,” Dr. Kim said at the World Congress on Insulin Resistance, Diabetes & Cardiovascular Disease. “While well accepted, this model ignores the role of insulin clearance rate in maintaining hyperinsulinemia in insulin resistance states.”
In an effort to understand the physiologic adaptation to insulin resistance prior to the development of type 2 diabetes mellitus, Dr. Kim, an associate professor of endocrinology at Stanford (Calif) University, Stanford, and her colleagues enrolled 91 adults who had a body mass index of at least 30 kg/m2. The study was published in the March 2018 issue of Diabetologia. Each subject underwent a 75-g oral glucose tolerance test as well as the insulin suppression test to measure insulin resistance and the graded glucose infusion test to determine each subject’s insulin secretion rate and insulin clearance rate. For the graded glucose infusion test, the researchers increased the glucose infusion rate every 40 minutes, from 1 mg/kg per minute up to 8 mg/kg per minute. Next, they divided the cohort of obese individuals into tertiles of insulin resistance as quantified by the steady-state plasma glucose (SSPG): less than 9.7 mmol/L (tertile 1), 9.7-12.7 mmol/L (tertile 2), and 12.8 mmol/L or greater (tertile 3).
The mean age of subjects was 54 years. The mean SSPG level was 7.2 mmol/L among subjects in tertile 1, 11.3 mmol/L among those in tertile 2, and 14.3 mmol/L among those in tertile 3. The remainder of the demographics was similar. “Most importantly, body mass index among tertiles was nearly identical,” Dr. Kim said. “The only biomarker that was different was ALT, which increased with increasing tertiles. The individuals who were more insulin resistant likely had more fatty liver. We didn’t do imaging in this particular study.”
When the researchers evaluated oral glucose tolerance test data, they observed that subjects who were most insulin resistant had slightly higher glucose levels, “which we often see,” she said. “The body does try to keep glucose in a narrow range. What was dramatic were the insulin levels. The most insulin-resistant subjects had insulin levels that were double those of the least insulin-resistant subjects in tertile 1 during the oral glucose tolerance test.”
During the intravenous glucose infusion test, glucose levels rose similarly in the three groups, but those in tertile 3 had slightly higher glucose levels (P = .04). The insulin secretion rate, meanwhile, was similar among subjects in tertiles 1 and 2 but was increased significantly among subjects in tertile 3 (P less than .001). In contrast, the researchers observed a stepwise decline in insulin clearance rate from tertiles 1 to 3. Thus the insulin clearance rate was significantly different between subjects in tertile 1 and tertile 2 (P = .04) as well as between subjects in tertile 2 and those in tertile 3 (P less than .001).
“We propose that insulin resistance leads to an increase in intrahepatic fat, which decreases the insulin clearance rate and helps maintain euglycemia,” Dr. Kim concluded. “In the most insulin-resistant tertile, a decrease in insulin clearance rate is not sufficient, and an increase in the insulin secretion rate is also required. If you look at the relationship between insulin resistance and insulin clearance rate, there is a negative correlation, so the more insulin resistant you are, the lower your insulin clearance rate. However, there are insulin-resistant individuals who perhaps have higher insulin clearance rates than we think they should have. Could those individuals be at the highest risk to develop diabetes? That’s the story to which I don’t yet have an ending.” She reported having no financial disclosures.
SOURCE: Jung SH et al. Diabetologia. 2018;61(3):681-7.
LOS ANGELES – As obese, nondiabetic individuals become more insulin resistant, a decrease in insulin clearance is the first change to occur, according to Sun H. Kim, MD.
“You will often hear about how insulin resistance enhances demand on beta cells to increase insulin secretion, which leads to hyperinsulinemia,” Dr. Kim said at the World Congress on Insulin Resistance, Diabetes & Cardiovascular Disease. “While well accepted, this model ignores the role of insulin clearance rate in maintaining hyperinsulinemia in insulin resistance states.”
In an effort to understand the physiologic adaptation to insulin resistance prior to the development of type 2 diabetes mellitus, Dr. Kim, an associate professor of endocrinology at Stanford (Calif) University, Stanford, and her colleagues enrolled 91 adults who had a body mass index of at least 30 kg/m2. The study was published in the March 2018 issue of Diabetologia. Each subject underwent a 75-g oral glucose tolerance test as well as the insulin suppression test to measure insulin resistance and the graded glucose infusion test to determine each subject’s insulin secretion rate and insulin clearance rate. For the graded glucose infusion test, the researchers increased the glucose infusion rate every 40 minutes, from 1 mg/kg per minute up to 8 mg/kg per minute. Next, they divided the cohort of obese individuals into tertiles of insulin resistance as quantified by the steady-state plasma glucose (SSPG): less than 9.7 mmol/L (tertile 1), 9.7-12.7 mmol/L (tertile 2), and 12.8 mmol/L or greater (tertile 3).
The mean age of subjects was 54 years. The mean SSPG level was 7.2 mmol/L among subjects in tertile 1, 11.3 mmol/L among those in tertile 2, and 14.3 mmol/L among those in tertile 3. The remainder of the demographics was similar. “Most importantly, body mass index among tertiles was nearly identical,” Dr. Kim said. “The only biomarker that was different was ALT, which increased with increasing tertiles. The individuals who were more insulin resistant likely had more fatty liver. We didn’t do imaging in this particular study.”
When the researchers evaluated oral glucose tolerance test data, they observed that subjects who were most insulin resistant had slightly higher glucose levels, “which we often see,” she said. “The body does try to keep glucose in a narrow range. What was dramatic were the insulin levels. The most insulin-resistant subjects had insulin levels that were double those of the least insulin-resistant subjects in tertile 1 during the oral glucose tolerance test.”
During the intravenous glucose infusion test, glucose levels rose similarly in the three groups, but those in tertile 3 had slightly higher glucose levels (P = .04). The insulin secretion rate, meanwhile, was similar among subjects in tertiles 1 and 2 but was increased significantly among subjects in tertile 3 (P less than .001). In contrast, the researchers observed a stepwise decline in insulin clearance rate from tertiles 1 to 3. Thus the insulin clearance rate was significantly different between subjects in tertile 1 and tertile 2 (P = .04) as well as between subjects in tertile 2 and those in tertile 3 (P less than .001).
“We propose that insulin resistance leads to an increase in intrahepatic fat, which decreases the insulin clearance rate and helps maintain euglycemia,” Dr. Kim concluded. “In the most insulin-resistant tertile, a decrease in insulin clearance rate is not sufficient, and an increase in the insulin secretion rate is also required. If you look at the relationship between insulin resistance and insulin clearance rate, there is a negative correlation, so the more insulin resistant you are, the lower your insulin clearance rate. However, there are insulin-resistant individuals who perhaps have higher insulin clearance rates than we think they should have. Could those individuals be at the highest risk to develop diabetes? That’s the story to which I don’t yet have an ending.” She reported having no financial disclosures.
SOURCE: Jung SH et al. Diabetologia. 2018;61(3):681-7.
REPORTING FROM WCIRDC 2018
Key clinical point:
Major finding: In the most insulin-resistant subgroup, the insulin secretion rate increases and the insulin clearance rate decreases to compensate for insulin resistance.
Study details: A study of 91 obese adults without diabetes.
Disclosures: Dr. Kim reported having no disclosures.
Source: Jung SH et al. Diabetologia. 2018;61(3):681-7.
Study investigates statin-diabetes link
LOS ANGELES – On any given day, type “statins” in the subject line of your favorite search engine and many results are likely to focus on risks: some based on science, others not so much.

“There is all kind of misinformation that are preventing people from taking statins,” Joshua W. Knowles, MD, said at the World Congress on Insulin Resistance, Diabetes & Cardiovascular Disease. “The most important side effects of statins are the increased lifespan and decreased risk of heart attacks, but that’s not what our patients are telling us. One of the things that is true is that .”
In 2016, Dr. Knowles, a cardiologist at the Stanford (Calif.) Center for Inherited Cardiovascular Disease, coauthored a retrospective analysis of data from subjects without diabetes in the Treating to New Targets (TNT) and the Stroke Prevention by Aggressive Reduction in Cholesterol Levels (SPARCL) randomized controlled trials (Am J Cardiol 2016;118[9]:1275-81). The authors found that statins particularly increase the risk of type 2 diabetes in those with prediabetes and insulin resistance. “That’s a risk group that we are all treating,” he said. “But that still doesn’t answer the question as to why this happens. Is this because statins increase insulin resistance, because they decrease beta cell function, or because they increase insulin clearance rate?”
In an effort to find out, Dr. Knowles and his colleagues have launched a clinical trial entitled “Relationship Between Insulin Resistance and Statin Induced Type 2 Diabetes, and Integrative Personal Omics Profiling” (NCT 02437084). Candidates do not have diabetes, yet qualify for statin therapy because they have a greater than 7.5% risk of cardiovascular disease over 10 years. To date, the researchers have enrolled 74 patients: 42 to the insulin-sensitive group (defined as having an LDL above 130 mg/dL and a triglyceride level below 150 mg/dL) and 11 to the insulin-resistant group (defined as having an LDL of 130 mg/dL or greater and a triglyceride level of 150 mg/dL or greater). Dr. Knowles said that about two-thirds of patients have been recruited and that full results are expected in late 2019.
At baseline, subjects underwent the insulin suppression test, the graded glucose infusion test, metabolic characterization, and integrated personal omics profiling (iPOP), a monitoring method. After 3 months of atorvastatin therapy 40 mg/day, the researchers repeated these measures and compared the results between groups. “Basically we were looking for changes in insulin resistance, secretion, and clearance between those groups over time,” said Dr. Knowles, who is the study’s principal investigator.
Of the 74 subjects, 13 decided that they did not want to participate and 6 are still undergoing baseline tests. In all, 55 started statin therapy, and 2 have dropped out. This left 42 in the low-triglyceride group and 11 in the high-triglyceride group.
The average age of the 52 individuals who have completed the study so far is 61 years, 30 are male, 35 are non-Hispanic white, their mean body mass index was 27.9 kg/m2, and their mean blood pressure was 127/79 mm Hg. By the end of statin therapy, body mass index did not change, but total cholesterol fell from a median of 234 mg/dL to a median of 150 mg/dL, triglycerides fell from a median of 109 mg/dL to a median of 78 mg/dL, LDL cholesterol fell from a median of 153 mg/dL to a median of 71 mg/dL, and mean high-sensitivity C-reactive protein dropped from a median of 1.2 mg/L to a median of 0.8 mg/L. All differences were statistically significant.
Fasting glucose levels have been completed on only 35 patients. “Two-hour glucose is going up, but it’s not yet significant, and on the oral glucose tolerance test, the curves are separating slightly but are not yet significant,” Dr. Knowles said.
On average, insulin resistance among the 35 patients worsened slightly, from 156 mg/dL before statin therapy to 170 mg/dL after initiation. “This is nominally significant (P = 0.03), and we’ll have to see if this holds up over time,” he said. The researchers also observed that statin use was associated with slight decreases in insulin secretion and clearance. Dr. Knowles emphasized that these are preliminary results and need to be further validated.
The study is funded by the Doris Duke Charitable Foundation. Dr. Knowles reported having no disclosures.
LOS ANGELES – On any given day, type “statins” in the subject line of your favorite search engine and many results are likely to focus on risks: some based on science, others not so much.
“There is all kind of misinformation that are preventing people from taking statins,” Joshua W. Knowles, MD, said at the World Congress on Insulin Resistance, Diabetes & Cardiovascular Disease. “The most important side effects of statins are the increased lifespan and decreased risk of heart attacks, but that’s not what our patients are telling us. One of the things that is true is that .”
In 2016, Dr. Knowles, a cardiologist at the Stanford (Calif.) Center for Inherited Cardiovascular Disease, coauthored a retrospective analysis of data from subjects without diabetes in the Treating to New Targets (TNT) and the Stroke Prevention by Aggressive Reduction in Cholesterol Levels (SPARCL) randomized controlled trials (Am J Cardiol 2016;118[9]:1275-81). The authors found that statins particularly increase the risk of type 2 diabetes in those with prediabetes and insulin resistance. “That’s a risk group that we are all treating,” he said. “But that still doesn’t answer the question as to why this happens. Is this because statins increase insulin resistance, because they decrease beta cell function, or because they increase insulin clearance rate?”
In an effort to find out, Dr. Knowles and his colleagues have launched a clinical trial entitled “Relationship Between Insulin Resistance and Statin Induced Type 2 Diabetes, and Integrative Personal Omics Profiling” (NCT 02437084). Candidates do not have diabetes, yet qualify for statin therapy because they have a greater than 7.5% risk of cardiovascular disease over 10 years. To date, the researchers have enrolled 74 patients: 42 to the insulin-sensitive group (defined as having an LDL above 130 mg/dL and a triglyceride level below 150 mg/dL) and 11 to the insulin-resistant group (defined as having an LDL of 130 mg/dL or greater and a triglyceride level of 150 mg/dL or greater). Dr. Knowles said that about two-thirds of patients have been recruited and that full results are expected in late 2019.
At baseline, subjects underwent the insulin suppression test, the graded glucose infusion test, metabolic characterization, and integrated personal omics profiling (iPOP), a monitoring method. After 3 months of atorvastatin therapy 40 mg/day, the researchers repeated these measures and compared the results between groups. “Basically we were looking for changes in insulin resistance, secretion, and clearance between those groups over time,” said Dr. Knowles, who is the study’s principal investigator.
Of the 74 subjects, 13 decided that they did not want to participate and 6 are still undergoing baseline tests. In all, 55 started statin therapy, and 2 have dropped out. This left 42 in the low-triglyceride group and 11 in the high-triglyceride group.
The average age of the 52 individuals who have completed the study so far is 61 years, 30 are male, 35 are non-Hispanic white, their mean body mass index was 27.9 kg/m2, and their mean blood pressure was 127/79 mm Hg. By the end of statin therapy, body mass index did not change, but total cholesterol fell from a median of 234 mg/dL to a median of 150 mg/dL, triglycerides fell from a median of 109 mg/dL to a median of 78 mg/dL, LDL cholesterol fell from a median of 153 mg/dL to a median of 71 mg/dL, and mean high-sensitivity C-reactive protein dropped from a median of 1.2 mg/L to a median of 0.8 mg/L. All differences were statistically significant.
Fasting glucose levels have been completed on only 35 patients. “Two-hour glucose is going up, but it’s not yet significant, and on the oral glucose tolerance test, the curves are separating slightly but are not yet significant,” Dr. Knowles said.
On average, insulin resistance among the 35 patients worsened slightly, from 156 mg/dL before statin therapy to 170 mg/dL after initiation. “This is nominally significant (P = 0.03), and we’ll have to see if this holds up over time,” he said. The researchers also observed that statin use was associated with slight decreases in insulin secretion and clearance. Dr. Knowles emphasized that these are preliminary results and need to be further validated.
The study is funded by the Doris Duke Charitable Foundation. Dr. Knowles reported having no disclosures.
REPORTING FROM WCIRDC 2018
Should metabolic syndrome be renamed circadian syndrome?
LOS ANGELES – In the opinion of Paul Zimmet, MD, PhD, the
This scenario created the “perfect storm” for rising rates of metabolic syndrome, which is related to low HDL cholesterol levels, central obesity, hypertension, hyperglycemia, and high triglyceride levels, Dr. Zimmet said at the World Congress on Insulin Resistance, Diabetes & Cardiovascular Disease. These cardiometabolic risk factors “all seem to cluster together in relation to the changes in our society,” he said. “It’s on that basis and research findings that I think we should understand that most of them, if not all, have been demonstrated to relate to circadian rhythm disturbance.”
In fact, the associated comorbidities sleep apnea, depression, and fatty liver disease should be included in the metabolic syndrome cluster and should be renamed the “circadian syndrome,” according to Dr. Zimmet, professor of diabetes at Monash University, Melbourne.
The term metabolic syndrome is anathema, he said. “There have been numerous different definitions, which finally led to an effort to come up with a harmonized definition” by the International Diabetes Federation Task Force on Epidemiology and Prevention, with involvement from the American Heart Association (Circulation 2009;120[16]:1640-5).
In the early 1970s, Dr. Zimmet and his colleagues at Guys Hospital in London reported on diurnal variation in glucose tolerance. “If you did a glucose tolerance test in the afternoon it could be diabetic, whereas in the morning it was normal,” he noted. “Other researchers reported similar findings. That created in my own mind interest in this area of circadian rhythm. However, I had neglected this until recently, when I was doing background research while trying to find an answer to the elusive question of a central uniting explanation for the cardiometabolic cluster constituting the metabolic syndrome.” So decades later, Dr. Zimmet extended his research to include epigenetics in the quest. Described as the study of heritable changes in gene function that occur without a change in the sequence of the DNA, epigenetic changes “are closely linked to the circadian rhythm, otherwise known as ‘the body clock,’ ” said Dr. Zimmet, who also is codirector with Naftali Stern, MD, of the Sagol Center for Epigenetics of Metabolism and Aging at Tel Aviv Medical Center. “Many aspects of human behavior and metabolism are closely linked to the circadian clock and affected by its rhythm disturbance. We decided that we wanted to further investigate this area: To what extent is circadian rhythm the central feature to explain the clustering of all of these cardiovascular and metabolic risk factors of the metabolic syndrome.”
In recent years, he has been collaborating with Noga Kronfeld-Schor, PhD, of the department of zoology at Tel Aviv (Israel) University. The research focuses on a gerbil from the Negev: Psammomys obesus (otherwise known as the Israeli fat sand rat), which develops elevated blood sugar, obesity, depression, sleep disturbance, fatty liver, and circadian dysrhythmia when removed from the desert environment to the laboratory. “These are all key features of type 2 diabetes in humans,” he said. “This is probably the best animal model of type 2 diabetes, and we felt that it was worth looking more closely to see if there was a similar relationship in humans as to whether circadian dysrhythmia would be causing all or most of these features in humans including obesity.” An epigenetic study of the gerbil in the laboratory of Prof. Sam El-Osta at Monash has shown that parental diet during early life regulated expression of genes associated with DNA methylation in the key FTO gene associated with obesity (Int J Obesity 2016;40:1079-88). It suggests that diet-induced metabolic changes can be transmitted from parent to offspring by mechanisms under epigenetic control.
Published studies from other research groups support the link between other of the cardiometabolic metabolic syndrome characteristics, epigenetic modifications, and circadian dysrhythmia including cardiovascular regulation and disease (Eur Heart J 2018;39[14]:2326-9), sleep loss and alterations in DNA methylation (Science Advances 2018;4[8]:eaar8590), and circadian dysrhythmia and fatty liver (Cell Metab 2012;15[6]:848-60). “In 2009, the FDA approved bromocriptine mesylate, a drug which has effects on circadian rhythm, for treatment of type 2 diabetes, suggesting its use in diabetes may have some role through the alteration of circadian rhythm,” continued Dr. Zimmet, who also is honorary president of the International Diabetes Federation. “Depression is also clearly linked to circadian rhythm and there is evidence from research and human studies that light therapy may be an effective treatment for type 2 diabetes and depression.”
Dr. Zimmet ended his presentation with a strong call for adding sleep apnea, fatty liver, and depression to the existing features of the metabolic syndrome “to encourage clinicians and researchers look at the picture of cardiometabolic risk much more broadly than as just a group of metabolic abnormalities,” he said. “We propose that these comorbidities be embraced within the definition of the cardiometabolic cluster and be renamed the ‘circadian syndrome.’ This cluster is now the main driver of the global chronic disease epidemic and its health burden. This is a disease of civilization – the result of the way we live.”
Dr. Zimmet reported having no disclosures.
EXPERT ANALYSIS FROM THE WCIRDC 2018
ACR, NPF unveil new psoriatic arthritis treatment guideline
The American College of Rheumatology and the National Psoriasis Foundation have released a joint treatment guideline for psoriatic arthritis that, for the first time, includes a conditional recommendation to use tumor necrosis factor–inhibitor(TNFi) biologics over methotrexate and other oral small molecules as a first-line therapy in patients with active disease.

“The available low-quality evidence is inconclusive regarding the efficacy of OSMs [oral small molecules] in management of PsA, whereas there is moderate-quality evidence of the benefits of TNFi biologics, in particular regarding their impact on the prevention of disease progression and joint damage,” wrote the panel of authors, who were led by Jasvinder A. Singh, MD, of the University of Alabama at Birmingham. “In making their recommendation, the panel recognized the cost implications, but put considerations of quality of evidence for benefit over other considerations. This guideline provides recommendations for early and aggressive therapy in patients with newly diagnosed PsA.”
The 28-page guideline, published online Nov. 30 in the Journal of Psoriasis and Psoriatic Arthritis and also in Arthritis Care & Research and Arthritis & Rheumatology, is the first set of PsA-specific recommendations to be assembled using the Grading of Recommendations Assessment, Development and Evaluation (GRADE) methodology that the ACR has used for RA and other conditions. GRADE uses systematic reviews of the scientific literature available to evaluate and grade the quality of evidence in a particular domain. The evidence reviews are then used to create guideline recommendations for or against particular therapy options that range from strong to conditional, depending on the quality of evidence available.
Based on the GRADE methodology and consensus building, the guideline authors crafted recommendations for eight different clinical scenarios, including the initial treatment of patients with active PsA who have not received either OSMs or other treatments; treatment of patients with active PsA despite treatment with an OSM; treatment of patients with active PsA despite treatment with a TNFi biologic either as monotherapy or in combination with methotrexate; treatment of patients with active PsA despite treatment with an interleukin (IL)-17 inhibitor or IL-12/23 inhibitor monotherapy; treatment of patients with active PsA including treat-to-target, active axial disease, enthesitis, or active inflammatory bowel disease; treatment of patients with active PsA and comorbidities, including concomitant diabetes and recurrent serious infections; vaccination in patients with active PsA; and treatment of patients with active PsA with nonpharmacologic interventions such as yoga and weight loss. Most of the treatment recommendations are conditional based on very low to moderate quality evidence. “Health care providers and patients must take into consideration all active disease domains, comorbidities, and the patient’s functional status in choosing the optimal therapy for an individual at a given point in time,” the authors emphasized.
Only five of the recommendations are listed as strong, including smoking cessation. Three of the strong recommendations concern adult patients with active PsA and concomitant active inflammatory bowel disease despite treatment with an OSM. They are “switch to a monoclonal antibody TNFi biologic over a TNFi biologic soluble receptor biologic,” “switch to a TNFi monoclonal antibody biologic over an IL-7i biologic,” and “switch to an IL-12/23i biologic over switching to an IL-17i biologic.”
The process of creating the guideline included input from a panel of nine adults who provided the authors with perspective on their values and preferences. “The concept of treat-to-target was challenging for patients,” the authors noted. “Although they saw value in improved outcomes, they also thought this strategy could increase costs to the patient (e.g., copayments, time traveling to more frequent appointments, etc.) and potentially increase adverse events. Therefore, a detailed conversation with the patient is needed to make decisions regarding treat-to-target.”
The authors concluded the guideline by calling for more comparative data to inform treatment selection in the future. “Several ongoing trials, including a trial to compare a TNFi biologic combination therapy with a TNFi biologic monotherapy and MTX monotherapy, will inform treatment decisions,” they wrote. “We anticipate future updates to the guideline when new evidence is available.”
Dr. Singh, who is also a staff rheumatologist at the Birmingham (Ala.) Veterans Affairs Medical Center, led development of the 2012 and 2015 ACR treatment guidelines for RA. He has received consulting fees from a variety of companies marketing rheumatologic drugs as well as research support from Takeda and Savient. The other guideline authors reported having numerous financial ties to industry.
SOURCE: Singh J et al. Arthritis Care Res. 2018 Nov 30. doi: 10.1002/acr.23789.
The American College of Rheumatology and the National Psoriasis Foundation have released a joint treatment guideline for psoriatic arthritis that, for the first time, includes a conditional recommendation to use tumor necrosis factor–inhibitor(TNFi) biologics over methotrexate and other oral small molecules as a first-line therapy in patients with active disease.
“The available low-quality evidence is inconclusive regarding the efficacy of OSMs [oral small molecules] in management of PsA, whereas there is moderate-quality evidence of the benefits of TNFi biologics, in particular regarding their impact on the prevention of disease progression and joint damage,” wrote the panel of authors, who were led by Jasvinder A. Singh, MD, of the University of Alabama at Birmingham. “In making their recommendation, the panel recognized the cost implications, but put considerations of quality of evidence for benefit over other considerations. This guideline provides recommendations for early and aggressive therapy in patients with newly diagnosed PsA.”
The 28-page guideline, published online Nov. 30 in the Journal of Psoriasis and Psoriatic Arthritis and also in Arthritis Care & Research and Arthritis & Rheumatology, is the first set of PsA-specific recommendations to be assembled using the Grading of Recommendations Assessment, Development and Evaluation (GRADE) methodology that the ACR has used for RA and other conditions. GRADE uses systematic reviews of the scientific literature available to evaluate and grade the quality of evidence in a particular domain. The evidence reviews are then used to create guideline recommendations for or against particular therapy options that range from strong to conditional, depending on the quality of evidence available.
Based on the GRADE methodology and consensus building, the guideline authors crafted recommendations for eight different clinical scenarios, including the initial treatment of patients with active PsA who have not received either OSMs or other treatments; treatment of patients with active PsA despite treatment with an OSM; treatment of patients with active PsA despite treatment with a TNFi biologic either as monotherapy or in combination with methotrexate; treatment of patients with active PsA despite treatment with an interleukin (IL)-17 inhibitor or IL-12/23 inhibitor monotherapy; treatment of patients with active PsA including treat-to-target, active axial disease, enthesitis, or active inflammatory bowel disease; treatment of patients with active PsA and comorbidities, including concomitant diabetes and recurrent serious infections; vaccination in patients with active PsA; and treatment of patients with active PsA with nonpharmacologic interventions such as yoga and weight loss. Most of the treatment recommendations are conditional based on very low to moderate quality evidence. “Health care providers and patients must take into consideration all active disease domains, comorbidities, and the patient’s functional status in choosing the optimal therapy for an individual at a given point in time,” the authors emphasized.
Only five of the recommendations are listed as strong, including smoking cessation. Three of the strong recommendations concern adult patients with active PsA and concomitant active inflammatory bowel disease despite treatment with an OSM. They are “switch to a monoclonal antibody TNFi biologic over a TNFi biologic soluble receptor biologic,” “switch to a TNFi monoclonal antibody biologic over an IL-7i biologic,” and “switch to an IL-12/23i biologic over switching to an IL-17i biologic.”
The process of creating the guideline included input from a panel of nine adults who provided the authors with perspective on their values and preferences. “The concept of treat-to-target was challenging for patients,” the authors noted. “Although they saw value in improved outcomes, they also thought this strategy could increase costs to the patient (e.g., copayments, time traveling to more frequent appointments, etc.) and potentially increase adverse events. Therefore, a detailed conversation with the patient is needed to make decisions regarding treat-to-target.”
The authors concluded the guideline by calling for more comparative data to inform treatment selection in the future. “Several ongoing trials, including a trial to compare a TNFi biologic combination therapy with a TNFi biologic monotherapy and MTX monotherapy, will inform treatment decisions,” they wrote. “We anticipate future updates to the guideline when new evidence is available.”
Dr. Singh, who is also a staff rheumatologist at the Birmingham (Ala.) Veterans Affairs Medical Center, led development of the 2012 and 2015 ACR treatment guidelines for RA. He has received consulting fees from a variety of companies marketing rheumatologic drugs as well as research support from Takeda and Savient. The other guideline authors reported having numerous financial ties to industry.
SOURCE: Singh J et al. Arthritis Care Res. 2018 Nov 30. doi: 10.1002/acr.23789.
FROM ARTHRITIS CARE & RESEARCH
Early treatment with direct-acting antivirals linked to reduced medical costs in noncirrhotic HCV
SAN FRANCISCO – Patients with noncirrhotic chronic hepatitis C virus (HCV) infection incur high medical costs in the three years following their diagnosis. However, early initiation of oral direct-acting therapies is associated with significant medical cost savings, largely driven by reduced extrahepatic manifestations.

Those are key findings from an analysis of “real-world” claims data that Carol Bao, PhD, presented on behalf of senior author Patrice Cacoub, MD, during a poster session at the annual meeting of the American Association for the Study of Liver Diseases.
“This [study] highlights the importance of treating HCV patients early, especially with active therapies, because that will benefit not only their liver disease but, from a population health perspective, you are lifting the entire health of those patients as well,” Dr. Bao, senior director of health economics and outcomes research at AbbVie, North Chicago, said in an interview.
In an effort to quantify the health care cost savings associated with initiation of direct-acting antiviral (DAA) therapies within 2 years of the first chronic HCV (CHC) diagnosis among noncirrhotic patients in the United States, the researchers drew from Clinformatics Data Mart, a diverse health care database with longitudinal data for more than 15 million lives each year. They collected data between Jan. 1, 2009, and Jan. 31, 2016, and excluded patients followed for less than 6 months before the CHC diagnosis or less than 1 year after the CHC diagnosis, as well as those who received interferon/ribavirin therapy before their first DAA. This yielded a sample of 3,069 adults first diagnosed with CHC on or after 2013.
The index date was defined as the data of the first CHC diagnosis and researchers established two cohorts: 852 patients who initiated DAAs in the 3 years postindex date and 2,217 who did not receive any CHC treatment in the 3 years postindex date.
Outcomes of interest included all-cause and disease-specific medical costs measured yearly up to 3 years post index. These included costs related to CHC management or hepatic complications as well as those related to extrahepatic manifestations (EHMs) such as fatigue, type 2 diabetes, and cardiovascular disease.
Patients in the DAA-treated group were slightly older than those in the untreated group (a median age of 52.6 vs. 50.9 years, respectively; P less than .001) and had a higher proportion of men (65.1% vs. 60.7%; P = .07). They were also diagnosed more recently and had more advanced fibrosis at baseline. In the first 3 years post index, the researchers found that the average medical costs incurred in the DAA-treated and untreated groups were $28,392 and $42,914, respectively. On multivariate regression analyses, total all-cause medical costs were statistically lower across DAA-treated years than across the untreated years: $6,379 per year on average, because of savings related to health care for EHMs ($3,158 per year on average) and diagnoses other than CHC, hepatitis, or EHMs considered in this study ($4,638 per year on average).
When Dr. Bao and her colleagues conducted post hoc exploratory analyses of the $4,638 per year cost differences for diagnoses other than CHC, hepatic, or the EMHs considered, they determined that they appear to be driven by diagnoses related to the circulatory system (especially essential hypertension), respiratory system, blood/immune/endocrine systems, and claims with diagnoses that were not disease specific.
Dr. Bao acknowledged certain limitations of the study, including the potential for errors and omissions associated with claims data and that costs were recorded as charged amounts, which may be different from the amount actually paid. In addition, the fibrosis level could not be inferred for all patients.
AbbVie provided funding for the study, which received a “poster of distinction” award at the meeting. The company employs Dr. Bao and two of the study coauthors.
SAN FRANCISCO – Patients with noncirrhotic chronic hepatitis C virus (HCV) infection incur high medical costs in the three years following their diagnosis. However, early initiation of oral direct-acting therapies is associated with significant medical cost savings, largely driven by reduced extrahepatic manifestations.
Those are key findings from an analysis of “real-world” claims data that Carol Bao, PhD, presented on behalf of senior author Patrice Cacoub, MD, during a poster session at the annual meeting of the American Association for the Study of Liver Diseases.
“This [study] highlights the importance of treating HCV patients early, especially with active therapies, because that will benefit not only their liver disease but, from a population health perspective, you are lifting the entire health of those patients as well,” Dr. Bao, senior director of health economics and outcomes research at AbbVie, North Chicago, said in an interview.
In an effort to quantify the health care cost savings associated with initiation of direct-acting antiviral (DAA) therapies within 2 years of the first chronic HCV (CHC) diagnosis among noncirrhotic patients in the United States, the researchers drew from Clinformatics Data Mart, a diverse health care database with longitudinal data for more than 15 million lives each year. They collected data between Jan. 1, 2009, and Jan. 31, 2016, and excluded patients followed for less than 6 months before the CHC diagnosis or less than 1 year after the CHC diagnosis, as well as those who received interferon/ribavirin therapy before their first DAA. This yielded a sample of 3,069 adults first diagnosed with CHC on or after 2013.
The index date was defined as the data of the first CHC diagnosis and researchers established two cohorts: 852 patients who initiated DAAs in the 3 years postindex date and 2,217 who did not receive any CHC treatment in the 3 years postindex date.
Outcomes of interest included all-cause and disease-specific medical costs measured yearly up to 3 years post index. These included costs related to CHC management or hepatic complications as well as those related to extrahepatic manifestations (EHMs) such as fatigue, type 2 diabetes, and cardiovascular disease.
Patients in the DAA-treated group were slightly older than those in the untreated group (a median age of 52.6 vs. 50.9 years, respectively; P less than .001) and had a higher proportion of men (65.1% vs. 60.7%; P = .07). They were also diagnosed more recently and had more advanced fibrosis at baseline. In the first 3 years post index, the researchers found that the average medical costs incurred in the DAA-treated and untreated groups were $28,392 and $42,914, respectively. On multivariate regression analyses, total all-cause medical costs were statistically lower across DAA-treated years than across the untreated years: $6,379 per year on average, because of savings related to health care for EHMs ($3,158 per year on average) and diagnoses other than CHC, hepatitis, or EHMs considered in this study ($4,638 per year on average).
When Dr. Bao and her colleagues conducted post hoc exploratory analyses of the $4,638 per year cost differences for diagnoses other than CHC, hepatic, or the EMHs considered, they determined that they appear to be driven by diagnoses related to the circulatory system (especially essential hypertension), respiratory system, blood/immune/endocrine systems, and claims with diagnoses that were not disease specific.
Dr. Bao acknowledged certain limitations of the study, including the potential for errors and omissions associated with claims data and that costs were recorded as charged amounts, which may be different from the amount actually paid. In addition, the fibrosis level could not be inferred for all patients.
AbbVie provided funding for the study, which received a “poster of distinction” award at the meeting. The company employs Dr. Bao and two of the study coauthors.
REPORTING FROM THE LIVER MEETING 2018
Key clinical point: Noncirrhotic chronic hepatitis C patients incur high medical costs after their first diagnosis if left untreated.
Major finding: In the first 3 years post index, the average medical costs incurred in the direct-acting antiviral–treated and untreated groups were $28,392 and $42,914, respectively.
Study details: A database sample of 3,069 adults first diagnosed with chronic hepatitis C in or after 2013.
Disclosures: AbbVie provided funding for the study. The company employs Dr. Bao and two of the study coauthors.
Normothermic machine perfusion found to salvage fatty livers for transplantation
SAN FRANCISCO – results from a small trial showed.

“This is important in the context of liver transplantation, because fatty livers do very badly when their time is blunted,” study coauthor Carlo Ceresa, MBChB, MRCS, said during a press briefing at the annual meeting of the American Association for the Study of Liver Diseases. “They’re susceptible to ischemia reperfusion injury, and as a result, a large number are discarded. In the U.S., it’s estimated that around 6,000 steatotic livers are discarded each year. In the U.K., the picture is very similar. Because up to 20% of patients die on the waiting list for liver transplant, we need to try to identify methods to use more marginal organs. Unfortunately, with the obesity epidemic and obesity being a risk factor for NAFLD [nonalcoholic fatty liver disease], we find more fatty livers in the donor pool, and we aren’t able to use them. Identifying methods to salvage these livers for transplantation [is] of great importance.”
NMP maintains the liver in a fully functioning state ex situ and provides oxygen and nutrition at 37° C, said Dr. Ceresa, who is a clinical research fellow with the Medical Research Council and a PhD candidate at the University of Oxford, England. In an effort to evaluate the impact of NMP and defatting adjuncts on human steatotic livers, he and his colleagues perfused 18 discarded human steatotic livers on a normothermic, blood-based circuit for 48 hours. Of these, six were perfused by normothermic machine perfusion alone (group 1), while six were perfused by NMP plus apheresis filtration, which removes lipoproteins (group 2). “The hypothesis here was that we could mechanically remove the fat that the liver releases,” he said. The remaining six livers were perfused with NMP, lipid apheresis filtration, and defatting agents including
The livers in group 1 “did pretty badly,” Dr. Ceresa said. “Their function wasn’t great and within 48 hours deteriorated, and there was a slight increase in liver fat. That’s probably attributable to de novo lipogenesis.” However, the livers in groups 2 and 3 demonstrated a significant reduction in circulating triglycerides and in perfusate total cholesterol by 48 hours, compared with those in group 1. The researchers also observed an increase in median fatty acid oxidation as measured by 3-hydroxybutyrate among the livers in group 3, compared with those in groups 1 and 2. In addition, the livers in group 3 were the only ones to show a mean reduction in tissue triglyceride level.
Dr. Ceresa described the findings as “exciting, because we have a captive organ we can manipulate, which could then result in a successful transplantation,” he said. “You also get to test drive and get an objective assessment of the organ’s function before you transplant it, so the result may be more predictable. It gives us a very useful model to study NAFLD.”
The next step, he said, is to plan a clinical trial to determine if clinical outcomes can be improved through these ex situ interventions on steatotic livers.
Dr. Ceresa reported having no financial disclosures.
Source: Hepatology 2018;68[S1], Abstract 3.
SAN FRANCISCO – results from a small trial showed.
“This is important in the context of liver transplantation, because fatty livers do very badly when their time is blunted,” study coauthor Carlo Ceresa, MBChB, MRCS, said during a press briefing at the annual meeting of the American Association for the Study of Liver Diseases. “They’re susceptible to ischemia reperfusion injury, and as a result, a large number are discarded. In the U.S., it’s estimated that around 6,000 steatotic livers are discarded each year. In the U.K., the picture is very similar. Because up to 20% of patients die on the waiting list for liver transplant, we need to try to identify methods to use more marginal organs. Unfortunately, with the obesity epidemic and obesity being a risk factor for NAFLD [nonalcoholic fatty liver disease], we find more fatty livers in the donor pool, and we aren’t able to use them. Identifying methods to salvage these livers for transplantation [is] of great importance.”
NMP maintains the liver in a fully functioning state ex situ and provides oxygen and nutrition at 37° C, said Dr. Ceresa, who is a clinical research fellow with the Medical Research Council and a PhD candidate at the University of Oxford, England. In an effort to evaluate the impact of NMP and defatting adjuncts on human steatotic livers, he and his colleagues perfused 18 discarded human steatotic livers on a normothermic, blood-based circuit for 48 hours. Of these, six were perfused by normothermic machine perfusion alone (group 1), while six were perfused by NMP plus apheresis filtration, which removes lipoproteins (group 2). “The hypothesis here was that we could mechanically remove the fat that the liver releases,” he said. The remaining six livers were perfused with NMP, lipid apheresis filtration, and defatting agents including
The livers in group 1 “did pretty badly,” Dr. Ceresa said. “Their function wasn’t great and within 48 hours deteriorated, and there was a slight increase in liver fat. That’s probably attributable to de novo lipogenesis.” However, the livers in groups 2 and 3 demonstrated a significant reduction in circulating triglycerides and in perfusate total cholesterol by 48 hours, compared with those in group 1. The researchers also observed an increase in median fatty acid oxidation as measured by 3-hydroxybutyrate among the livers in group 3, compared with those in groups 1 and 2. In addition, the livers in group 3 were the only ones to show a mean reduction in tissue triglyceride level.
Dr. Ceresa described the findings as “exciting, because we have a captive organ we can manipulate, which could then result in a successful transplantation,” he said. “You also get to test drive and get an objective assessment of the organ’s function before you transplant it, so the result may be more predictable. It gives us a very useful model to study NAFLD.”
The next step, he said, is to plan a clinical trial to determine if clinical outcomes can be improved through these ex situ interventions on steatotic livers.
Dr. Ceresa reported having no financial disclosures.
Source: Hepatology 2018;68[S1], Abstract 3.
AT THE LIVER MEETING 2018
Key clinical point: The addition of apheresis filtration and defatting agents to normothermic machine perfusion led to significant improvements in liver function.
Major finding: Livers which received apheresis filtration and defatting agents fared better than those that did not.
Study details: An analysis of 18 discarded human steatotic livers that were perfused on a normothermic, blood-based circuit for 48 hours.
Disclosures: Dr. Ceresa reported having no financial disclosures.
Source: Hepatology 2018;68[S1], Abstract 3.
Despite interest, few liver transplant candidates discuss advance care planning with clinicians
SAN FRANCISCO – .

“Recent studies have shown that there have been low rates of these types of discussions in all areas of medicine, not just in liver transplantation per se,” Connie W. Wang, MD, said in an interview at the annual meeting of the American Association for the Study of Liver Diseases. “We were curious to see what it looked like in our practice setting.”
In an effort to evaluate current advanced care planning documentation practices in the liver transplantation setting, she and her colleagues reviewed the medical charts of 168 adults who underwent an initial liver transplant evaluation at the University of California, San Francisco, from January 2017 to June 2017. Next, to assess readiness to complete advanced care planning among liver transplant candidates, the researchers administered the Advanced Care Planning Engagement Survey to 41 adults who underwent an initial liver transplant evaluation from March 2018 to May 2018. The survey was scored on a Likert scale of 1-4, in which a score of 4 equaled “ready” or “confident,” and a score of 5 equaled “very ready” or “very confident.”
The mean age of the 168 transplant candidates was 53 years, 35% were female, and 52% were non-Hispanic white. Only 15 patients (9%) reported completing advanced care planning prior to their liver transplant evaluation and none had legal advance care planning forms scanned or end-of-life wishes documented in the medical record. Durable power of attorney for health care was discussed with 17 patients (10%). On logistic regression analysis, only white race was associated with completion of advanced care planning (OR 4.16; P = .03), but age, Child-Pugh score, and MELD-Na score were not.
The mean age of the 41 transplant candidates who completed the Advanced Care Planning Engagement Survey was 58 years, 39% were female, and 58% were non-Hispanic white. Nearly all respondents (93%) indicated that they were ready to appoint a durable power of attorney, 85% were ready to discuss end-of-life care, and 93% were ready to ask physicians questions about medical decisions. Similarly, 93% of patients felt confident to appoint a durable power of attorney, 88% felt confident to discuss end-of-life care, and 93% felt confident to ask physicians questions about medical decisions.
“It seems like from the patients’ perspective, they are very much open to having these conversations, but there hasn’t been [the right] environment or setting to have them,” said Dr. Wang, a third-year internal medicine resident at UCSF. “Or, there may be a barrier from the provider’s perspective. Clearly, there is a huge need that can be filled.” She noted that future research should focus on development of tools to facilitate discussions and documentation between transplant clinicians, patients, and their caregivers.
One of the study authors, Jennifer C. Lai, MD, reported being a consultant for Third Rock Ventures, LLC. The other researchers reported having no financial disclosures.
Source: Hepatol. 2018;68[S1]: Abstract 771.
SAN FRANCISCO – .
“Recent studies have shown that there have been low rates of these types of discussions in all areas of medicine, not just in liver transplantation per se,” Connie W. Wang, MD, said in an interview at the annual meeting of the American Association for the Study of Liver Diseases. “We were curious to see what it looked like in our practice setting.”
In an effort to evaluate current advanced care planning documentation practices in the liver transplantation setting, she and her colleagues reviewed the medical charts of 168 adults who underwent an initial liver transplant evaluation at the University of California, San Francisco, from January 2017 to June 2017. Next, to assess readiness to complete advanced care planning among liver transplant candidates, the researchers administered the Advanced Care Planning Engagement Survey to 41 adults who underwent an initial liver transplant evaluation from March 2018 to May 2018. The survey was scored on a Likert scale of 1-4, in which a score of 4 equaled “ready” or “confident,” and a score of 5 equaled “very ready” or “very confident.”
The mean age of the 168 transplant candidates was 53 years, 35% were female, and 52% were non-Hispanic white. Only 15 patients (9%) reported completing advanced care planning prior to their liver transplant evaluation and none had legal advance care planning forms scanned or end-of-life wishes documented in the medical record. Durable power of attorney for health care was discussed with 17 patients (10%). On logistic regression analysis, only white race was associated with completion of advanced care planning (OR 4.16; P = .03), but age, Child-Pugh score, and MELD-Na score were not.
The mean age of the 41 transplant candidates who completed the Advanced Care Planning Engagement Survey was 58 years, 39% were female, and 58% were non-Hispanic white. Nearly all respondents (93%) indicated that they were ready to appoint a durable power of attorney, 85% were ready to discuss end-of-life care, and 93% were ready to ask physicians questions about medical decisions. Similarly, 93% of patients felt confident to appoint a durable power of attorney, 88% felt confident to discuss end-of-life care, and 93% felt confident to ask physicians questions about medical decisions.
“It seems like from the patients’ perspective, they are very much open to having these conversations, but there hasn’t been [the right] environment or setting to have them,” said Dr. Wang, a third-year internal medicine resident at UCSF. “Or, there may be a barrier from the provider’s perspective. Clearly, there is a huge need that can be filled.” She noted that future research should focus on development of tools to facilitate discussions and documentation between transplant clinicians, patients, and their caregivers.
One of the study authors, Jennifer C. Lai, MD, reported being a consultant for Third Rock Ventures, LLC. The other researchers reported having no financial disclosures.
Source: Hepatol. 2018;68[S1]: Abstract 771.
REPORTING FROM THE LIVER MEETING 2018
Key clinical point: There is a paucity of documentation of advance care planning or identification of a durable power of attorney in the medical record of liver transplant candidates.
Major finding: Only 9% of liver transplant candidates reported completing advanced care planning prior to their liver transplant evaluations and none had legal advance care planning forms scanned or end-of-life wishes documented in the medical record.
Study details: A retrospective review of 168 adults who underwent an initial liver transplant evaluation at the University of California, San Francisco.
Disclosures: One of the study authors, Jennifer C. Lai, MD, reported being a consultant for Third Rock Ventures, LLC. The other researchers reported having no financial disclosures.
Source: Hepatol. 2018;68[S1]:Abstract 771.
Medicaid patients have higher MELD scores at time of liver transplantation
SAN FRANCISCO – Despite implementation of the Model for End Stage Liver Disease score to prioritize liver transplantation, .
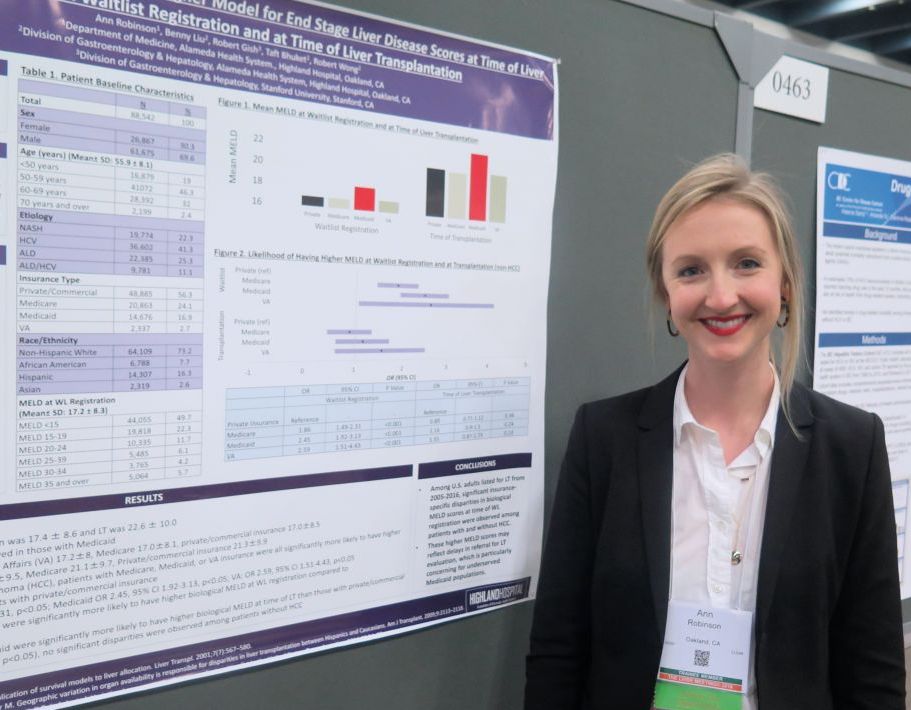
“It can be difficult for patients with Medicaid to access liver transplantation,” lead study author Ann Robinson, MD, said in an interview at the annual meeting of the American Association for the Study of Liver Diseases. “These patients may be living in underserved areas with limited resources.”
In an effort to evaluate insurance-specific disparities in severity of liver disease at the time of liver transplantation wait-list registration and at the time of liver transplantation, Dr. Robinson and her colleagues retrospectively evaluated the 2005-2016 United Network for Organ Sharing/Organ Procurement and Transplant Network liver transplant registry. They used multivariate linear regression models to make insurance-specific comparisons of MELD scores at wait-list registration and at liver transplantation, which included adjustments for age, sex, year, etiology of liver disease, body mass index, ascites, hepatocellular carcinoma (HCC), and hepatic encephalopathy.
Dr. Robinson, who is a third-year internal medicine resident at Highland Hospital, Oakland, Calif., reported findings from 88,542 liver transplantation wait-list registrants with a mean age of 56 years. Their overall mean MELD score was 17.4 at wait-list registration and 22.6 at time of liver transplantation. The greatest mean MELD score at the time of wait-list registration was observed in Medicaid patients (18.4, compared with 17.2 among Veterans Affairs patients, 17 among Medicare patients, and 17 among privately/commercially insured patients; P less than .01). Meanwhile, the greatest mean MELD score at the time of liver transplantation was observed in Medicaid patients (23.5, compared with 21.4 among VA patients, 21.3 among privately/commercially insured patients, and 21.1 among Medicare patients; P less than .01).
Multivariate regression analysis revealed that, among patients without hepatocellular carcinoma, those with coverage other than private or commercial insurance had significantly higher MELD scores at wait-list registration (P less than .01). Specifically, the odds ratio was highest for VA patients (odds ratio, 2.59), followed by those covered by Medicaid (OR, 2.45), and Medicare (OR, 1.86). Similar trends were observed in hepatocellular carcinoma patients, with the highest biological MELD score at wait-list seen in those covered by Medicaid.
On regression analysis, while Medicaid patients with hepatocellular carcinoma had significantly higher biological MELD scores at time of liver transplantation, compared with those with private/commercial insurance (Medicaid OR, 2.06; P less than .05), no differences were observed among patients without hepatocellular carcinoma.
Dr. Robinson reported having no financial disclosures.
Source: Hepatology 2018 Oct 1;68[S1], Abstract 464.
SAN FRANCISCO – Despite implementation of the Model for End Stage Liver Disease score to prioritize liver transplantation, .
“It can be difficult for patients with Medicaid to access liver transplantation,” lead study author Ann Robinson, MD, said in an interview at the annual meeting of the American Association for the Study of Liver Diseases. “These patients may be living in underserved areas with limited resources.”
In an effort to evaluate insurance-specific disparities in severity of liver disease at the time of liver transplantation wait-list registration and at the time of liver transplantation, Dr. Robinson and her colleagues retrospectively evaluated the 2005-2016 United Network for Organ Sharing/Organ Procurement and Transplant Network liver transplant registry. They used multivariate linear regression models to make insurance-specific comparisons of MELD scores at wait-list registration and at liver transplantation, which included adjustments for age, sex, year, etiology of liver disease, body mass index, ascites, hepatocellular carcinoma (HCC), and hepatic encephalopathy.
Dr. Robinson, who is a third-year internal medicine resident at Highland Hospital, Oakland, Calif., reported findings from 88,542 liver transplantation wait-list registrants with a mean age of 56 years. Their overall mean MELD score was 17.4 at wait-list registration and 22.6 at time of liver transplantation. The greatest mean MELD score at the time of wait-list registration was observed in Medicaid patients (18.4, compared with 17.2 among Veterans Affairs patients, 17 among Medicare patients, and 17 among privately/commercially insured patients; P less than .01). Meanwhile, the greatest mean MELD score at the time of liver transplantation was observed in Medicaid patients (23.5, compared with 21.4 among VA patients, 21.3 among privately/commercially insured patients, and 21.1 among Medicare patients; P less than .01).
Multivariate regression analysis revealed that, among patients without hepatocellular carcinoma, those with coverage other than private or commercial insurance had significantly higher MELD scores at wait-list registration (P less than .01). Specifically, the odds ratio was highest for VA patients (odds ratio, 2.59), followed by those covered by Medicaid (OR, 2.45), and Medicare (OR, 1.86). Similar trends were observed in hepatocellular carcinoma patients, with the highest biological MELD score at wait-list seen in those covered by Medicaid.
On regression analysis, while Medicaid patients with hepatocellular carcinoma had significantly higher biological MELD scores at time of liver transplantation, compared with those with private/commercial insurance (Medicaid OR, 2.06; P less than .05), no differences were observed among patients without hepatocellular carcinoma.
Dr. Robinson reported having no financial disclosures.
Source: Hepatology 2018 Oct 1;68[S1], Abstract 464.
AT THE LIVER MEETING 2018
Key clinical point: Significant insurance-specific disparities in MELD scores at time of wait-list registration were observed among patients with and without hepatocellular carcinoma.
Major finding: Among patients without hepatocellular carcinoma, those with Medicaid coverage were 2.45 times more likely to have higher MELD scores at wait-list registration, compared with those covered by commercial or private insurance (P less than .01).
Study details: A retrospective analysis of 88,542 liver transplantation wait-list registrants.
Disclosures: Dr. Robinson reported having no disclosures.
Source: Hepatology 2018 Oct 1;68[S1], Abstract 464.
Expert highlights rare causes of stroke to keep in mind
ATLANTA – According to Peter Berlit, MD, clinicians should .

Other factors include combination of ischemic and hemorrhagic stroke, exclusive involvement of intracranial vessels, systemic signs, and lab tests indicating inflammation.
At the annual meeting of the American Neurological Association, Dr. Berlit, secretary general of the German Society of Neurology in Berlin, discussed the diagnosis and management of rare causes of stroke.
Giant cell arteritis (GCA)
One of the rare causes of stroke, GCA can be diagnosed when three of five criteria are met: being 50 years of age or older, having a newly developed headache, tenderness of the superficial temporal artery, elevated sedimentation rate of at least 50 mm per hour, and GCA in a biopsy specimen from the temporal artery.
“What we fear most is sudden blindness due to involvement of arteries serving the eyes, which appears in up to 30% of GCA patients,” said Dr. Berlit, who formerly chaired the department of neurology at Alfried Krupp Hospital, Essen, Germany. “Stroke occurs in approximately 2% of GCA patients, so it’s a lot rarer.” GCA can also be diagnosed by ultrasound. One meta-analysis of 23 studies using halo, stenosis, and occlusion as ultrasound criteria found a sensitivity of 87% and a specificity of 96% (Ann Intern Med. 2005;142[5]:359-69). “You can also use 3-Tesla MRI with the use of contrast agent, which shows inflammation of the temporal artery, but also other large vessels including the aortic arch,” he said. “The treatment of GCA has changed since the end of 2017 and involves starting with prednisolone 1 mg/kg body weight.” After a dose of 30 mg for 4 weeks, reduce the dose by 2.5 mg every 2 weeks. After reaching the dose of 15 mg daily, reduce by 1 mg per month. “The recommended steroid-sparing treatment is subcutaneous tocilizumab at a dose of 162 mg weekly or every other week, combined with a prednisone taper for a minimum of 26 weeks,” he said. Supportive therapies include pantoprazole 20 mg, aspirin 100 mg, calcium, vitamin D, and bisphosphonates.
Primary angiitis of the central nervous system (PACNS)
Next, Dr. Berlit discussed diagnostic criteria for PACNS, an acquired neurological deficit unexplained after complete evaluation. “You should have a diagnostic cerebral angiogram or biopsy demonstrating vasculitis,” he said. “There should be no evidence of systemic vasculitis or any other conditions that could mimic the angiogram findings. Usually you have abnormal CSF findings, including pleocytosis and protein elevation, and a biopsy demonstrating vasculitis.”
MRI studies in suspected vasculitis include fluid-attenuated inversion recovery (FLAIR), diffusion imaging with apparent diffusion coefficient (ADC) maps, gradient ECHO, MR angiography, and contrast-enhanced imaging. “These usually show multifocal lesions of different ages, and hemorrhages occur in about 10% of lesions,” Dr. Berlit said. “Leptomeningeal enhancement is an indicator of good treatment response.”
A brain and leptomeningeal biopsy demonstrating the angiitis remains the preferred method for diagnosis of PACNS. “Open biopsies out of recent MRI lesions are especially diagnostic,” he said. “If there are no lesions accessible for surgery in noneloquent brain areas, a biopsy from the right frontal lobe is recommended.” The histologic findings of PACNS consist of granulomatous inflammation, fibrinoid necrosis of vessel walls, or exclusively lymphocytic cellular infiltrates. “The treatment of choice in PACNS is the combination of steroids and cyclophosphamide pulse therapy,” he said. “There are also data showing that rituximab or methotrexate might be treatment options. With a relapse rate of 25% and a reduced survival rate, a close follow-up of suspected PACNS is mandatory.”
Reversible cerebral vasoconstriction syndrome (RCVS)
Another rare cause of stroke is RCVS, which typically presents as thunderclap headaches with or without neurologic symptoms. MRI may be normal, but symmetric border zone infarctions and small subarachnoid hemorrhages are possible. Catheter, CT, or MR angiography show segmental arterial vasoconstriction. “You always have to exclude cerebral aneurysm,” Dr. Berlit said. “There is reversibility of RCVS within 3 months.” RCVS is often associated with a long list of drugs, including phenylpropanolamine, Methergine (methylergonovine), bromocriptine, lisuride, SSRIs, triptans, isometheptene, tacrolimus, cyclophosphamide, erythropoietin, intravenous immunoglobulins, erythrocyte concentrates, nasal sprays, cocaine, ecstasy, amphetamines, cannabis, and LSD. “After stopping responsible medications, treatment involves a course of nimodipine,” he said.
Moyamoya disease (MMD)
Dr. Berlit closed his presentation by discussing MMD, a rare occlusive cerebrovascular disorder characterized by progressive stenosis or occlusion of the intracranial portion of the internal carotid artery and proximal cerebral arteries with an extensive network of fine collaterals. “This is an idiopathic vasculopathy with remarkable regional and racial differences worldwide; it’s most frequently found in Asians, especially in Japan and Korea,” he said. “In Europe, there is about one-tenth the incidence, compared with that of Japan. In Asian MMD, about 15% of cases follow an autosomal dominant inheritance. The collaterals in MMD present histologically as a thin media, a fragmented elastic laminae, and the formation of microaneurysms. There is no inflammation.”
MMD diagnostic criteria include stenosis or occlusion of the terminal portion of the internal carotid artery and at the proximal portion of the anterior and middle cerebral arteries. Abnormal vascular networks are present in the basal ganglia and angiographic findings present bilaterally. Cases with unilateral angiographic findings are considered probable. Clinicians should exclude the following conditions: arteriosclerosis, autoimmune disease, brain neoplasm, history of cranial irradiation, Down syndrome, head trauma, neurofibromatosis, and meningitis. “If the angiographic pattern is resembled by one of these conditions, this is called moyamoya syndrome,” Dr. Berlit noted. “MMD is a progressive disorder. Within a few months you can see occlusion of the middle cerebral artery and the anterior cerebral artery, so you have to treat these patients.”
In patients who are white, MMD presents with lower rates of hemorrhage, but in Asians, microbleeds occur in up to 44% of patients and hemorrhages in up to 65% patients. “Both subarachnoidal and intracerebral hemorrhages occur, especially in connection with pregnancy and delivery,” he said. “The risk of both cerebral ischemia and hemorrhagic complications increases with stages of MMD.”
Direct or indirect intracranial bypass surgery is recommended in stages 3 or more, and has been shown to significantly reduce the 5-year stroke risk. To date, Dr. Berlit and his associates have treated 86 hemispheres in 56 patients. The average age of the patients was 42 years, 70% were female, and the average follow-up was 39 months. All intracranial bypasses were open on follow-up, and a decrease of the typical moyamoya vessels was observed in 81% of patients.
Dr. Berlit reported having no financial disclosures.
ATLANTA – According to Peter Berlit, MD, clinicians should .
Other factors include combination of ischemic and hemorrhagic stroke, exclusive involvement of intracranial vessels, systemic signs, and lab tests indicating inflammation.
At the annual meeting of the American Neurological Association, Dr. Berlit, secretary general of the German Society of Neurology in Berlin, discussed the diagnosis and management of rare causes of stroke.
Giant cell arteritis (GCA)
One of the rare causes of stroke, GCA can be diagnosed when three of five criteria are met: being 50 years of age or older, having a newly developed headache, tenderness of the superficial temporal artery, elevated sedimentation rate of at least 50 mm per hour, and GCA in a biopsy specimen from the temporal artery.
“What we fear most is sudden blindness due to involvement of arteries serving the eyes, which appears in up to 30% of GCA patients,” said Dr. Berlit, who formerly chaired the department of neurology at Alfried Krupp Hospital, Essen, Germany. “Stroke occurs in approximately 2% of GCA patients, so it’s a lot rarer.” GCA can also be diagnosed by ultrasound. One meta-analysis of 23 studies using halo, stenosis, and occlusion as ultrasound criteria found a sensitivity of 87% and a specificity of 96% (Ann Intern Med. 2005;142[5]:359-69). “You can also use 3-Tesla MRI with the use of contrast agent, which shows inflammation of the temporal artery, but also other large vessels including the aortic arch,” he said. “The treatment of GCA has changed since the end of 2017 and involves starting with prednisolone 1 mg/kg body weight.” After a dose of 30 mg for 4 weeks, reduce the dose by 2.5 mg every 2 weeks. After reaching the dose of 15 mg daily, reduce by 1 mg per month. “The recommended steroid-sparing treatment is subcutaneous tocilizumab at a dose of 162 mg weekly or every other week, combined with a prednisone taper for a minimum of 26 weeks,” he said. Supportive therapies include pantoprazole 20 mg, aspirin 100 mg, calcium, vitamin D, and bisphosphonates.
Primary angiitis of the central nervous system (PACNS)
Next, Dr. Berlit discussed diagnostic criteria for PACNS, an acquired neurological deficit unexplained after complete evaluation. “You should have a diagnostic cerebral angiogram or biopsy demonstrating vasculitis,” he said. “There should be no evidence of systemic vasculitis or any other conditions that could mimic the angiogram findings. Usually you have abnormal CSF findings, including pleocytosis and protein elevation, and a biopsy demonstrating vasculitis.”
MRI studies in suspected vasculitis include fluid-attenuated inversion recovery (FLAIR), diffusion imaging with apparent diffusion coefficient (ADC) maps, gradient ECHO, MR angiography, and contrast-enhanced imaging. “These usually show multifocal lesions of different ages, and hemorrhages occur in about 10% of lesions,” Dr. Berlit said. “Leptomeningeal enhancement is an indicator of good treatment response.”
A brain and leptomeningeal biopsy demonstrating the angiitis remains the preferred method for diagnosis of PACNS. “Open biopsies out of recent MRI lesions are especially diagnostic,” he said. “If there are no lesions accessible for surgery in noneloquent brain areas, a biopsy from the right frontal lobe is recommended.” The histologic findings of PACNS consist of granulomatous inflammation, fibrinoid necrosis of vessel walls, or exclusively lymphocytic cellular infiltrates. “The treatment of choice in PACNS is the combination of steroids and cyclophosphamide pulse therapy,” he said. “There are also data showing that rituximab or methotrexate might be treatment options. With a relapse rate of 25% and a reduced survival rate, a close follow-up of suspected PACNS is mandatory.”
Reversible cerebral vasoconstriction syndrome (RCVS)
Another rare cause of stroke is RCVS, which typically presents as thunderclap headaches with or without neurologic symptoms. MRI may be normal, but symmetric border zone infarctions and small subarachnoid hemorrhages are possible. Catheter, CT, or MR angiography show segmental arterial vasoconstriction. “You always have to exclude cerebral aneurysm,” Dr. Berlit said. “There is reversibility of RCVS within 3 months.” RCVS is often associated with a long list of drugs, including phenylpropanolamine, Methergine (methylergonovine), bromocriptine, lisuride, SSRIs, triptans, isometheptene, tacrolimus, cyclophosphamide, erythropoietin, intravenous immunoglobulins, erythrocyte concentrates, nasal sprays, cocaine, ecstasy, amphetamines, cannabis, and LSD. “After stopping responsible medications, treatment involves a course of nimodipine,” he said.
Moyamoya disease (MMD)
Dr. Berlit closed his presentation by discussing MMD, a rare occlusive cerebrovascular disorder characterized by progressive stenosis or occlusion of the intracranial portion of the internal carotid artery and proximal cerebral arteries with an extensive network of fine collaterals. “This is an idiopathic vasculopathy with remarkable regional and racial differences worldwide; it’s most frequently found in Asians, especially in Japan and Korea,” he said. “In Europe, there is about one-tenth the incidence, compared with that of Japan. In Asian MMD, about 15% of cases follow an autosomal dominant inheritance. The collaterals in MMD present histologically as a thin media, a fragmented elastic laminae, and the formation of microaneurysms. There is no inflammation.”
MMD diagnostic criteria include stenosis or occlusion of the terminal portion of the internal carotid artery and at the proximal portion of the anterior and middle cerebral arteries. Abnormal vascular networks are present in the basal ganglia and angiographic findings present bilaterally. Cases with unilateral angiographic findings are considered probable. Clinicians should exclude the following conditions: arteriosclerosis, autoimmune disease, brain neoplasm, history of cranial irradiation, Down syndrome, head trauma, neurofibromatosis, and meningitis. “If the angiographic pattern is resembled by one of these conditions, this is called moyamoya syndrome,” Dr. Berlit noted. “MMD is a progressive disorder. Within a few months you can see occlusion of the middle cerebral artery and the anterior cerebral artery, so you have to treat these patients.”
In patients who are white, MMD presents with lower rates of hemorrhage, but in Asians, microbleeds occur in up to 44% of patients and hemorrhages in up to 65% patients. “Both subarachnoidal and intracerebral hemorrhages occur, especially in connection with pregnancy and delivery,” he said. “The risk of both cerebral ischemia and hemorrhagic complications increases with stages of MMD.”
Direct or indirect intracranial bypass surgery is recommended in stages 3 or more, and has been shown to significantly reduce the 5-year stroke risk. To date, Dr. Berlit and his associates have treated 86 hemispheres in 56 patients. The average age of the patients was 42 years, 70% were female, and the average follow-up was 39 months. All intracranial bypasses were open on follow-up, and a decrease of the typical moyamoya vessels was observed in 81% of patients.
Dr. Berlit reported having no financial disclosures.
EXPERT ANALYSIS FROM ANA 2018
High rates of HCV treatment completion seen in people who inject drugs
SAN FRANCISCO – , preliminary results from an ongoing study showed.

“Both from a public health and a human rights perspective, hepatitis C elimination in people who inject drugs is critical,” study coauthor Elana Rosenthal, MD, said during a press briefing at the annual meeting of the American Association for the Study of Liver Diseases. “People who inject drugs are the main progenitors of ongoing transmission of hepatitis C. However, they are often denied access to hepatitis C treatment due to concerns about their ability to take medication consistently and achieve cure. This is especially true amongst patients with challenging demographic factors, frequent drug use, and those not on treatment for opioid use disorder. However, there are limited data on hepatitis C adherence in people who inject drugs outside of vigorous clinical trial settings.”
In an effort to understand whether a marginalized population with ongoing injection drug use could adhere to HCV treatment, and how this adherence would impact cure, Dr. Rosenthal and her associates enrolled 100 subjects in ANCHOR, a single-center study evaluating HCV treatment in patients who have chronic HCV, opioid use disorder, and ongoing injection drug use. “We did not preferentially enroll patients who we thought we would be most likely to cure, and we did not exclude patients who seemed unlikely to adhere to treatment,” said Dr. Rosenthal, codirector of the DC Partnership for HIV/AIDS Progress hepatitis clinical research program at the University of Maryland, Baltimore. “All patients were treated with sofosbuvir/velpatasvir, with a plan to complete 12 weeks of treatment.” Medication was dispensed monthly in bottles containing 28 pills, and patients were seen for monthly visits, mirroring standard clinical care for HCV. The researchers monitored patients for medication adherence through pill counts and evaluated them for hepatitis C cure 12 weeks after treatment.
The median age of the 100 patients was 57 years, 76% were black, 33% had cirrhosis, 51% were unstably housed, 92% had a history of incarceration, and 92% had no income source or relied exclusively on government benefits. “The patients represent an incredibly marginalized population,” she said. At baseline, 58% reported daily or more frequent injection drug use, 33% reported medication-assisted treatment, 29% shared injection drug use equipment within the past 3 months, and 40% met criteria for hazardous drinking based on the Alcohol Use Disorders Identification Test (AUDIT-C).
Of the 100 patients, 59 received 12 weeks of treatment. Of these 59 patients, 28 finished 1-7 days after the anticipated end date, 9 finished between 8 and 14 days late, and 9 patients finished more than 14 days late.
Of the 58 patients who attended an office visit at week 24 of their treatment, 52 (90%) achieved a sustained virologic response. This cure rate was associated with having an HCV viral load less than 200 IU/mL at week 4, and with taking 12 weeks of treatment. Nonsustained virologic response was driven by virologic failure, loss to follow-up, and death.
When the researchers compared subjects who achieved sustained virologic response with those who did not, baseline demographics including frequent drug use, unstable housing status, and not being on medication to treat opioid use disorder were not associated with decreased cure rates. “While we found high rates of treatment completion in this population, because of external factors such as incarceration, hospitalization, and having medications stolen, 13 patients had interruptions in treatment,” Dr. Rosenthal said. “Further, while 21 patients had near-perfect medication adherence, 46 patients took longer than 12 weeks to complete the full treatment course due to intermittent missed doses. However, as long as patients completed the prescribed amount, imperfect adherence was not associated with decreased cure rates.”
Based on ANCHOR’s preliminary results, Dr. Rosenthal concluded that concerns about HCV treatment adherence such as baseline housing status, drug use frequency, and being on medication for opioid use disorder “are not likely to influence treatment outcome of HCV and should not be used to justify exclusion from treatment in this population. The ANCHOR investigation adds to the growing body of literature supporting expansion of HCV treatment to all patients, including people who inject drugs. Treatment of people who inject drugs is a critical factor in HCV elimination and, most importantly, reducing morbidity and mortality in this population.”
Dr. Rosenthal disclosed that she has received grant/research support from Gilead Sciences and from Merck.
Source: Rosenthal E et al. Hepatol. 2018;68[S1], Abstract 18.
SAN FRANCISCO – , preliminary results from an ongoing study showed.
“Both from a public health and a human rights perspective, hepatitis C elimination in people who inject drugs is critical,” study coauthor Elana Rosenthal, MD, said during a press briefing at the annual meeting of the American Association for the Study of Liver Diseases. “People who inject drugs are the main progenitors of ongoing transmission of hepatitis C. However, they are often denied access to hepatitis C treatment due to concerns about their ability to take medication consistently and achieve cure. This is especially true amongst patients with challenging demographic factors, frequent drug use, and those not on treatment for opioid use disorder. However, there are limited data on hepatitis C adherence in people who inject drugs outside of vigorous clinical trial settings.”
In an effort to understand whether a marginalized population with ongoing injection drug use could adhere to HCV treatment, and how this adherence would impact cure, Dr. Rosenthal and her associates enrolled 100 subjects in ANCHOR, a single-center study evaluating HCV treatment in patients who have chronic HCV, opioid use disorder, and ongoing injection drug use. “We did not preferentially enroll patients who we thought we would be most likely to cure, and we did not exclude patients who seemed unlikely to adhere to treatment,” said Dr. Rosenthal, codirector of the DC Partnership for HIV/AIDS Progress hepatitis clinical research program at the University of Maryland, Baltimore. “All patients were treated with sofosbuvir/velpatasvir, with a plan to complete 12 weeks of treatment.” Medication was dispensed monthly in bottles containing 28 pills, and patients were seen for monthly visits, mirroring standard clinical care for HCV. The researchers monitored patients for medication adherence through pill counts and evaluated them for hepatitis C cure 12 weeks after treatment.
The median age of the 100 patients was 57 years, 76% were black, 33% had cirrhosis, 51% were unstably housed, 92% had a history of incarceration, and 92% had no income source or relied exclusively on government benefits. “The patients represent an incredibly marginalized population,” she said. At baseline, 58% reported daily or more frequent injection drug use, 33% reported medication-assisted treatment, 29% shared injection drug use equipment within the past 3 months, and 40% met criteria for hazardous drinking based on the Alcohol Use Disorders Identification Test (AUDIT-C).
Of the 100 patients, 59 received 12 weeks of treatment. Of these 59 patients, 28 finished 1-7 days after the anticipated end date, 9 finished between 8 and 14 days late, and 9 patients finished more than 14 days late.
Of the 58 patients who attended an office visit at week 24 of their treatment, 52 (90%) achieved a sustained virologic response. This cure rate was associated with having an HCV viral load less than 200 IU/mL at week 4, and with taking 12 weeks of treatment. Nonsustained virologic response was driven by virologic failure, loss to follow-up, and death.
When the researchers compared subjects who achieved sustained virologic response with those who did not, baseline demographics including frequent drug use, unstable housing status, and not being on medication to treat opioid use disorder were not associated with decreased cure rates. “While we found high rates of treatment completion in this population, because of external factors such as incarceration, hospitalization, and having medications stolen, 13 patients had interruptions in treatment,” Dr. Rosenthal said. “Further, while 21 patients had near-perfect medication adherence, 46 patients took longer than 12 weeks to complete the full treatment course due to intermittent missed doses. However, as long as patients completed the prescribed amount, imperfect adherence was not associated with decreased cure rates.”
Based on ANCHOR’s preliminary results, Dr. Rosenthal concluded that concerns about HCV treatment adherence such as baseline housing status, drug use frequency, and being on medication for opioid use disorder “are not likely to influence treatment outcome of HCV and should not be used to justify exclusion from treatment in this population. The ANCHOR investigation adds to the growing body of literature supporting expansion of HCV treatment to all patients, including people who inject drugs. Treatment of people who inject drugs is a critical factor in HCV elimination and, most importantly, reducing morbidity and mortality in this population.”
Dr. Rosenthal disclosed that she has received grant/research support from Gilead Sciences and from Merck.
Source: Rosenthal E et al. Hepatol. 2018;68[S1], Abstract 18.
AT THE LIVER MEETING 2018
Key clinical point: People who inject drugs have high rates of HCV treatment adherence, treatment completion, and sustained virologic response.
Major finding: Of 58 patients who attended an office visit at week 24 of their treatment, 52 (90%) achieved a sustained virologic response.
Study details: Preliminary results from an ongoing, single-center study of 100 people with a median age of 57 years.
Disclosures: Dr. Rosenthal disclosed that she has received grant/research support from Gilead Sciences and from Merck.
Source: Rosenthal E et al. Hepatol. 2018;68[S1], Abstract 18.