User login
Implementing the AMI READMITS Risk Assessment Score to Increase Referrals Among Patients With Type I Myocardial Infarction
From The Johns Hopkins Hospital, Baltimore, MD (Dr. Muganlinskaya and Dr. Skojec, retired); The George Washington University, Washington, DC (Dr. Posey); and Johns Hopkins University, Baltimore, MD (Dr. Resar).
Abstract
Objective: Assessing the risk characteristics of patients with acute myocardial infarction (MI) can help providers make appropriate referral decisions. This quality improvement project sought to improve timely, appropriate referrals among patients with type I MI by adding a risk assessment, the AMI READMITS score, to the existing referral protocol.
Methods: Patients’ chart data were analyzed to assess changes in referrals and timely follow-up appointments from pre-intervention to intervention. A survey assessed providers’ satisfaction with the new referral protocol.
Results: Among 57 patients (n = 29 preintervention; n = 28 intervention), documented referrals increased significantly from 66% to 89% (χ2 = 4.571, df = 1, P = 0.033); and timely appointments increased by 10%, which was not significant (χ2 = 3.550, df = 2, P = 0.169). Most providers agreed that the new protocol was easy to use, useful in making referral decisions, and improved the referral process. All agreed the risk score should be incorporated into electronic clinical notes. Provider opinions related to implementing the risk score in clinical practice were mixed. Qualitative feedback suggests this was due to limited validation of the AMI READMITS score in reducing readmissions.
Conclusions: Our risk-based referral protocol helped to increase appropriate referrals among patients with type I MI. Provider adoption may be enhanced by incorporating the protocol into electronic clinical notes. Research to further validate the accuracy of the AMI READMITS score in predicting readmissions may support adoption of the protocol in clinical practice.
Keywords: quality improvement; type I myocardial infarction; referral process; readmission risk; risk assessment; chart review.
Early follow-up after discharge is an important strategy to reduce the risk of unplanned hospital readmissions among patients with various conditions.1-3 While patient confounding factors, such as chronic health problems, environment, socioeconomic status, and literacy, make it difficult to avoid all unplanned readmissions, early follow-up may help providers identify and appropriately manage some health-related issues, and as such is a pivotal element of a readmission prevention strategy.4 There is evidence that patients with non-ST elevation myocardial infarction (NSTEMI) who have an outpatient appointment with a physician within 7 days after discharge have a lower risk of 30-day readmission.5
Our hospital’s postmyocardial infarction clinic was created to prevent unplanned readmissions within 30 days after discharge among patients with type I myocardial infarction (MI). Since inception, the number of referrals has been much lower than expected. In 2018, the total number of patients discharged from the hospital with type I MI and any troponin I level above 0.40 ng/mL was 313. Most of these patients were discharged from the hospital’s cardiac units; however, only 91 referrals were made. To increase referrals, the cardiology nurse practitioners (NPs) developed a post-MI referral protocol (Figure 1). However, this protocol was not consistently used and referrals to the clinic remained low.

Evidence-based risk assessment tools have the potential to increase effective patient management. For example, cardiology providers at the hospital utilize various scores, such as CHA2DS2-VASc6 and the Society of Thoracic Surgery risk score,7 to plan patient management. Among the scores used to predict unplanned readmissions for MI patients, the most promising is the AMI READMITS score.8 Unlike other nonspecific prediction models, the AMI READMITS score was developed based on variables extracted from the electronic health records (EHRs) of patients who were hospitalized for MI and readmitted within 30 days after discharge. Recognizing the potential to increase referrals by integrating an MI-specific risk assessment, this quality improvement study modified the existing referral protocol to include the patients’ AMI READMITS score and recommendations for follow-up.
Currently, there are no clear recommendations on how soon after discharge patients with MI should undergo follow-up. As research data vary, we selected 7 days follow-up for patients from high risk groups based on the “See you in 7” initiative for patients with heart failure (HF) and MI,9,10 as well as evidence that patients with NSTEMI have a lower risk of 30-day readmission if they have follow-up within 7 days after discharge5; and we selected 14 days follow-up for patients from low-risk groups based on evidence that postdischarge follow-up within 14 days reduces risk of 30-day readmission in patients with acute myocardial infarction (AMI) and/or acutely decompensated HF.11
Methods
This project was designed to answer the following question: For adult patients with type I MI, does implementation of a readmission risk assessment referral protocol increase the percentage of referrals and appointments scheduled within a recommended time? Anticipated outcomes included: (1) increased referrals to a cardiologist or the post-MI clinic; (2) increased scheduled follow-up appointments within 7 to 14 days; (3) provider satisfaction with the usability and usefulness of the new protocol; and (4) consistent provider adoption of the new risk assessment referral protocol.
To evaluate the degree to which these outcomes were achieved, we reviewed patient charts for 2 months prior and 2 months during implementation of the new referral protocol. As shown in Figure 2, the new protocol added the following process steps to the existing protocol: calculation of the AMI READMITS score, recommendations for follow-up based on patients’ risk score, and guidance to refer patients to the post-MI clinic if patients did not have an appointment with a cardiologist within 7 to 14 days after discharge. Patients’ risk assessment scores were obtained from forms completed by clinicians during the intervention. Clinician’s perceptions related to the usability and usefulness of the new protocol and feedback related to its long-term adoption were assessed using a descriptive survey.

The institutional review board classified this project as a quality improvement project. To avoid potential loss of patient privacy, no identifiable data were collected, a unique identifier unrelated to patients’ records was generated for each patient, and data were saved on a password-protected cardiology office computer.
Population
The project population included all adult patients (≥ 18 years old) with type I MI who were admitted or transferred to the hospital, had a percutaneous coronary intervention (PCI), or were managed without PCI and discharged from the hospital’s cardiac care unit (CCU) and progressive cardiac care unit (PCCU). The criteria for type I MI included the “detection of a rise and/or fall of cardiac troponin with at least 1 value above the 99th percentile and with at least 1 of the following: symptoms of acute myocardial ischemia; new ischemic electrocardiographic (ECG) changes; development of new pathological Q waves; imaging evidence of new loss of viable myocardium or new regional wall motion abnormality in a pattern consistent with an ischemic etiology; identification of a coronary thrombus by angiography including intracoronary imaging or by autopsy.”12 The study excluded patients with type I MI who were referred for coronary bypass surgery.
Intervention
The revised risk assessment protocol was implemented within the CCU and PCCU. The lead investigator met with each provider to discuss the role of the post-MI clinic, current referral rates, the purpose of the project, and the new referral process to be completed during the project for each patient discharged with type I MI. Cardiology NPs, fellows, and residents were asked to use the risk-assessment form to calculate patients’ risk for readmission, and refer patients to the post-MI clinic if an appointment with a cardiologist was not available within 7 to 14 days after discharge. Every week during the intervention phase, the investigator sent reminder emails to ensure form completion. Providers were asked to calculate and write the score, the discharge and referral dates, where referrals were made (a cardiologist or the post-MI clinic), date of appointment, and reason for not scheduling an appointment or not referring on the risk assessment form, and to drop the completed forms in specific labeled boxes located at the CCU and PCCU work stations. The investigator collected the completed forms weekly. When the number of discharged patients did not match the number of completed forms, the investigator followed up with discharging providers to understand why.
Data and Data Collection
Data to determine whether the use of the new protocol increased discharge referrals among patients with type I MI within the recommended timeframes were collected by electronic chart review. Data included discharging unit, patients’ age, gender, admission and discharge date, diagnosis, referral to a cardiologist and the post-MI clinic, and appointment date. Clinical data needed to calculate the AMI READMITS score was also collected: PCI within 24 hours, serum creatinine, systolic blood pressure (SBP), brain natriuretic peptide (BNP), and diabetes status.
Data to assess provider satisfaction with the usability and usefulness of the new protocol were gathered through an online survey. The survey included 1 question related to the providers’ role, 1 question asking whether they used the risk assessment for each patient, and 5 Likert-items assessing the ease of usage. An additional open-ended question asked providers to share feedback related to integrating the AMI READMITS risk assessment score to the post-MI referral protocol long term.
To evaluate how consistently providers utilized the new referral protocol when discharging patients with type I MI, the number of completed forms was compared with the number of those patients who were discharged.
Statistical Analysis
Descriptive statistics were used to summarize patient demographics and to calculate the frequency of referrals before and during the intervention. Chi-square statistics were calculated to determine whether the change in percentage of referrals and timely referrals was significant. Descriptive statistics were used to determine the level of provider satisfaction related to each survey item. A content analysis method was used to synthesize themes from the open-ended question asking clinicians to share their feedback related to the new protocol.
Results
Fifty-seven patients met the study inclusion criteria: 29 patients during the preintervention phase and 28 patients during the intervention phase. There were 35 male (61.4%) and 22 female (38.6%) patients. Twenty-five patients (43.9%) were from age groups 41 through 60 years and 61 through 80 years, respectively, representing the majority of included patients. Seven patients (12.3%) were from the 81 years and older age group. There were no patients in the age group 18 through 40 years. Based on the AMI READMITS score calculation, 57.9% (n = 33) patients were from a low-risk group (includes extremely low and low risk for readmission) and 42.1% (n = 24) were from a high-risk group (includes moderate, high, and extremely high risk for readmission).
Provider adoption of the new protocol during the intervention was high. Referral forms were completed for 82% (n = 23) of the 28 patients during the intervention. Analysis findings showed a statistically significant increase in documented referrals after implementing the new referral protocol. During the preintervention phase, 66% (n = 19) of patients with type I MI were referred to see a cardiologist or an NP at a post-MI clinic and there was no documented referral for 34% (n = 10) of patients. During the intervention phase, 89% (n = 25) of patients were referred and there was no documented referral for 11% (n = 3) of patients. Chi-square results indicated that the increase in referrals was significant (χ2 = 4.571, df = 1, P = 0.033).
Data analysis examined whether patient referrals fell within the recommended timeframe of 7 days for the high-risk group (included moderate-to-extremely high risk) and 14 days for the low-risk group (included low-to-extremely low risk). During the preintervention phase, 31% (n = 9) of patient referrals were scheduled as recommended; 28% (n = 8) of patient referrals were scheduled but delayed; and there was no referral date documented for 41% (n = 12) of patients. During the intervention phase, referrals scheduled as recommended increased to 53% (n = 15); 25% (n = 7) of referrals were scheduled but delayed; and there was no referral date documented for 21.4% (n = 6) of patients. The change in appointments scheduled as recommended was not significant (χ2 = 3.550, df = 2, P = 0.169).
Surveys were emailed to 25 cardiology fellows and 3 cardiology NPs who participated in this study. Eighteen of the 28 clinicians (15 cardiology fellows and 3 cardiology NPs) responded for a response rate of 64%. One of several residents who rotated through the CCU and PCCU during the intervention also completed the survey, for a total of 19 participants. When asked if the protocol was easy to use, 79% agreed or strongly agreed. Eighteen of the 19 participants (95%) agreed or strongly agreed that the protocol was useful in making referral decisions. Sixty-eight percent agreed or strongly agreed that the AMI READMITS risk assessment score improves referral process. All participants agreed or strongly agreed that there should be an option to incorporate the AMI READMITS risk assessment score into electronic clinical notes. When asked whether the AMI READMITS risk score should be implemented in clinical practice, responses were mixed (Figure 3). A common theme among the 4 participants who responded with comments was the need for additional data to validate the usefulness of the AMI READMITS to reduce readmissions. In addition, 1 participant commented that “manual calculation [of the risk score] is not ideal.”

Discussion
This project demonstrated that implementing an evidence-based referral protocol integrating the AMI-READMITS score can increase timely postdischarge referrals among patients with type I MI. The percentage of appropriately scheduled appointments increased during the intervention phase; however, a relatively high number of appointments were scheduled outside of the recommended timeframe, similar to preintervention. Thus, while the new protocol increased referrals and provider documentation of these referrals, it appears that challenges in scheduling timely referral appointments remained. This project did not examine the reasons for delayed appointments.
The survey findings indicated that providers were generally satisfied with the usability and usefulness of the new risk assessment protocol. A large majority agreed or strongly agreed that it was easy to use and useful in making referral decisions, and most agreed or strongly agreed that it improves the referral process. Mixed opinions regarding implementing the AMI READMITS score in clinical practice, combined with qualitative findings, suggest that a lack of external validation of the AMI READMITS presents a barrier to its long-term adoption. All providers who participated in the survey agreed or strongly agreed that the risk assessment should be incorporated into electronic clinical notes. We have begun the process of working with the EHR vendor to automate the AMI risk-assessment within the referral work-flow, which will provide an opportunity for a follow-up quality improvement study.
This quality improvement project has several limitations. First, it implemented a small change in 2 inpatient units at 1 hospital using a simple pre- posttest design. Therefore, the findings are not generalizable to other settings. Prior to the intervention, some referrals may have been made without documentation. While the authors were able to trace undocumented referrals for patients who were referred to the post-MI clinic or to a cardiologist affiliated with the hospital, some patients may have been referred to cardiologists who were not affiliated with the hospital. Another limitation was that the self-created provider survey used was not tested in other clinical settings; thus, it cannot be determined whether the sensitivity and specificity of the survey questions are high. In addition, the clinical providers who participated in the study knew the study team, which may have influenced their behavior during the study period. Furthermore, the identified improvement in clinicians’ referral practices may not be sustainable due to the complexity and effort required to manually calculate the risk score. This limitation could be eliminated by integrating the risk score calculation into the EHR.
Conclusion
Early follow-up after discharge plays an important role in supporting patients’ self-management of some risk factors (ie, diet, weight, and smoking) and identifying gaps in postdischarge care which may lead to readmission. This project provides evidence that integrating the AMI READMITS risk assessment score into the referral process can help to guide discharge decision-making and increase timely, appropriate referrals for patients with MI. Integration of a specific risk assessment, such as the AMI READMITS, within the post-MI referral protocol may help clinicians make more efficient, educated referral decisions. Future studies should explore more specifically how and why the new protocol impacts clinicians’ decision-making and behavior related to post-MI referrals. In addition, future studies should investigate challenges associated with scheduling postdischarge appointments. It will be important to investigate how integration of the new protocol within the EHR may increase efficiency, consistency, and provider satisfaction with the new referral process. Additional research investigating the effects of the AMI READMITS score on readmissions reduction will be important to promote long-term adoption of the improved referral protocol in clinical practice.
Acknowledgments: The authors thank Shelly Conaway, ANP-BC, MSN, Angela Street, ANP-BC, MSN, Andrew Geis, ACNP-BC, MSN, Richard P. Jones II, MD, Eunice Young, MD, Joy Rothwell, MSN, RN-BC, Allison Olazo, MBA, MSN, RN-BC, Elizabeth Heck, RN-BC, and Matthew Trojanowski, MHA, MS, RRT, CSSBB for their support of this study.
Corresponding author: Nailya Muganlinskaya, DNP, MPH, ACNP-BC, MSN, The Johns Hopkins Hospital, 1800 Orleans St, Baltimore, MD 21287; [email protected].
Financial disclosures: None.
1. Why it is important to improve care transitions? Society of Hospital Medicine. Accessed June 15, 2020. https://www.hospitalmedicine.org/clinical-topics/care-transitions/
2. Tong L, Arnold T, Yang J, et al. The association between outpatient follow-up visits and all-cause non-elective 30-day readmissions: a retrospective observational cohort study. PloS One. 2018;13(7):e0200691.
3. Jackson C, Shahsahebi M, Wedlake T, DuBard CA. Timeliness of outpatient follow-up: an evidence-based approach for planning after hospital discharge. Ann Fam Med. 2015;13(2):115-22.
4. Health Research & Educational Trust. Preventable Readmissions Change Package. American Hospital Association. Updated December 2015. Accessed June 10, 2020. https://www.aha.org/sites/default/files/hiin/HRETHEN_ChangePackage_Readmissions.pd
5. Tung Y-C, Chang G-M, Chang H-Y, Yu T-H. Relationship between early physician follow-up and 30-day readmission after acute myocardial infarction and heart failure. Plos One. 2017;12(1):e0170061.
6. Kaplan RM, Koehler J, Zieger PD, et al. Stroke risk as a function of atrial fibrillation duration and CHA2DS2-VASc score. Circulation. 2019;140(20):1639-46.
7. Balan P, Zhao Y, Johnson S, et al. The Society of Thoracic Surgery Risk Score as a predictor of 30-day mortality in transcatheter vs surgical aortic valve replacement: a single-center experience and its implications for the development of a TAVR risk-prediction model. J Invasive Cardiol. 2017;29(3):109-14.
8. Smith LN, Makam AN, Darden D, et al. Acute myocardial infarction readmission risk prediction models: A systematic review of model performance. Circ Cardiovasc Qual Outcomes9.9. 2018;11(1):e003885.
9. Baker H, Oliver-McNeil S, Deng L, Hummel SL. See you in 7: regional hospital collaboration and outcomes in Medicare heart failure patients. JACC Heart Fail. 2015;3(10):765-73.
10. Batten A, Jaeger C, Griffen D, et al. See you in 7: improving acute myocardial infarction follow-up care. BMJ Open Qual. 2018;7(2):e000296.
11. Lee DW, Armistead L, Coleman H, et al. Abstract 15387: Post-discharge follow-up within 14 days reduces 30-day hospital readmission rates in patients with acute myocardial infarction and/or acutely decompensated heart failure. Circulation. 2018;134 (1):A 15387.
12. Thygesen K, Alpert JS, Jaffe AS, et al. Fourth universal definition of myocardial infarction. Circulation. 2018;138 (20):e:618-51.
From The Johns Hopkins Hospital, Baltimore, MD (Dr. Muganlinskaya and Dr. Skojec, retired); The George Washington University, Washington, DC (Dr. Posey); and Johns Hopkins University, Baltimore, MD (Dr. Resar).
Abstract
Objective: Assessing the risk characteristics of patients with acute myocardial infarction (MI) can help providers make appropriate referral decisions. This quality improvement project sought to improve timely, appropriate referrals among patients with type I MI by adding a risk assessment, the AMI READMITS score, to the existing referral protocol.
Methods: Patients’ chart data were analyzed to assess changes in referrals and timely follow-up appointments from pre-intervention to intervention. A survey assessed providers’ satisfaction with the new referral protocol.
Results: Among 57 patients (n = 29 preintervention; n = 28 intervention), documented referrals increased significantly from 66% to 89% (χ2 = 4.571, df = 1, P = 0.033); and timely appointments increased by 10%, which was not significant (χ2 = 3.550, df = 2, P = 0.169). Most providers agreed that the new protocol was easy to use, useful in making referral decisions, and improved the referral process. All agreed the risk score should be incorporated into electronic clinical notes. Provider opinions related to implementing the risk score in clinical practice were mixed. Qualitative feedback suggests this was due to limited validation of the AMI READMITS score in reducing readmissions.
Conclusions: Our risk-based referral protocol helped to increase appropriate referrals among patients with type I MI. Provider adoption may be enhanced by incorporating the protocol into electronic clinical notes. Research to further validate the accuracy of the AMI READMITS score in predicting readmissions may support adoption of the protocol in clinical practice.
Keywords: quality improvement; type I myocardial infarction; referral process; readmission risk; risk assessment; chart review.
Early follow-up after discharge is an important strategy to reduce the risk of unplanned hospital readmissions among patients with various conditions.1-3 While patient confounding factors, such as chronic health problems, environment, socioeconomic status, and literacy, make it difficult to avoid all unplanned readmissions, early follow-up may help providers identify and appropriately manage some health-related issues, and as such is a pivotal element of a readmission prevention strategy.4 There is evidence that patients with non-ST elevation myocardial infarction (NSTEMI) who have an outpatient appointment with a physician within 7 days after discharge have a lower risk of 30-day readmission.5
Our hospital’s postmyocardial infarction clinic was created to prevent unplanned readmissions within 30 days after discharge among patients with type I myocardial infarction (MI). Since inception, the number of referrals has been much lower than expected. In 2018, the total number of patients discharged from the hospital with type I MI and any troponin I level above 0.40 ng/mL was 313. Most of these patients were discharged from the hospital’s cardiac units; however, only 91 referrals were made. To increase referrals, the cardiology nurse practitioners (NPs) developed a post-MI referral protocol (Figure 1). However, this protocol was not consistently used and referrals to the clinic remained low.
Evidence-based risk assessment tools have the potential to increase effective patient management. For example, cardiology providers at the hospital utilize various scores, such as CHA2DS2-VASc6 and the Society of Thoracic Surgery risk score,7 to plan patient management. Among the scores used to predict unplanned readmissions for MI patients, the most promising is the AMI READMITS score.8 Unlike other nonspecific prediction models, the AMI READMITS score was developed based on variables extracted from the electronic health records (EHRs) of patients who were hospitalized for MI and readmitted within 30 days after discharge. Recognizing the potential to increase referrals by integrating an MI-specific risk assessment, this quality improvement study modified the existing referral protocol to include the patients’ AMI READMITS score and recommendations for follow-up.
Currently, there are no clear recommendations on how soon after discharge patients with MI should undergo follow-up. As research data vary, we selected 7 days follow-up for patients from high risk groups based on the “See you in 7” initiative for patients with heart failure (HF) and MI,9,10 as well as evidence that patients with NSTEMI have a lower risk of 30-day readmission if they have follow-up within 7 days after discharge5; and we selected 14 days follow-up for patients from low-risk groups based on evidence that postdischarge follow-up within 14 days reduces risk of 30-day readmission in patients with acute myocardial infarction (AMI) and/or acutely decompensated HF.11
Methods
This project was designed to answer the following question: For adult patients with type I MI, does implementation of a readmission risk assessment referral protocol increase the percentage of referrals and appointments scheduled within a recommended time? Anticipated outcomes included: (1) increased referrals to a cardiologist or the post-MI clinic; (2) increased scheduled follow-up appointments within 7 to 14 days; (3) provider satisfaction with the usability and usefulness of the new protocol; and (4) consistent provider adoption of the new risk assessment referral protocol.
To evaluate the degree to which these outcomes were achieved, we reviewed patient charts for 2 months prior and 2 months during implementation of the new referral protocol. As shown in Figure 2, the new protocol added the following process steps to the existing protocol: calculation of the AMI READMITS score, recommendations for follow-up based on patients’ risk score, and guidance to refer patients to the post-MI clinic if patients did not have an appointment with a cardiologist within 7 to 14 days after discharge. Patients’ risk assessment scores were obtained from forms completed by clinicians during the intervention. Clinician’s perceptions related to the usability and usefulness of the new protocol and feedback related to its long-term adoption were assessed using a descriptive survey.
The institutional review board classified this project as a quality improvement project. To avoid potential loss of patient privacy, no identifiable data were collected, a unique identifier unrelated to patients’ records was generated for each patient, and data were saved on a password-protected cardiology office computer.
Population
The project population included all adult patients (≥ 18 years old) with type I MI who were admitted or transferred to the hospital, had a percutaneous coronary intervention (PCI), or were managed without PCI and discharged from the hospital’s cardiac care unit (CCU) and progressive cardiac care unit (PCCU). The criteria for type I MI included the “detection of a rise and/or fall of cardiac troponin with at least 1 value above the 99th percentile and with at least 1 of the following: symptoms of acute myocardial ischemia; new ischemic electrocardiographic (ECG) changes; development of new pathological Q waves; imaging evidence of new loss of viable myocardium or new regional wall motion abnormality in a pattern consistent with an ischemic etiology; identification of a coronary thrombus by angiography including intracoronary imaging or by autopsy.”12 The study excluded patients with type I MI who were referred for coronary bypass surgery.
Intervention
The revised risk assessment protocol was implemented within the CCU and PCCU. The lead investigator met with each provider to discuss the role of the post-MI clinic, current referral rates, the purpose of the project, and the new referral process to be completed during the project for each patient discharged with type I MI. Cardiology NPs, fellows, and residents were asked to use the risk-assessment form to calculate patients’ risk for readmission, and refer patients to the post-MI clinic if an appointment with a cardiologist was not available within 7 to 14 days after discharge. Every week during the intervention phase, the investigator sent reminder emails to ensure form completion. Providers were asked to calculate and write the score, the discharge and referral dates, where referrals were made (a cardiologist or the post-MI clinic), date of appointment, and reason for not scheduling an appointment or not referring on the risk assessment form, and to drop the completed forms in specific labeled boxes located at the CCU and PCCU work stations. The investigator collected the completed forms weekly. When the number of discharged patients did not match the number of completed forms, the investigator followed up with discharging providers to understand why.
Data and Data Collection
Data to determine whether the use of the new protocol increased discharge referrals among patients with type I MI within the recommended timeframes were collected by electronic chart review. Data included discharging unit, patients’ age, gender, admission and discharge date, diagnosis, referral to a cardiologist and the post-MI clinic, and appointment date. Clinical data needed to calculate the AMI READMITS score was also collected: PCI within 24 hours, serum creatinine, systolic blood pressure (SBP), brain natriuretic peptide (BNP), and diabetes status.
Data to assess provider satisfaction with the usability and usefulness of the new protocol were gathered through an online survey. The survey included 1 question related to the providers’ role, 1 question asking whether they used the risk assessment for each patient, and 5 Likert-items assessing the ease of usage. An additional open-ended question asked providers to share feedback related to integrating the AMI READMITS risk assessment score to the post-MI referral protocol long term.
To evaluate how consistently providers utilized the new referral protocol when discharging patients with type I MI, the number of completed forms was compared with the number of those patients who were discharged.
Statistical Analysis
Descriptive statistics were used to summarize patient demographics and to calculate the frequency of referrals before and during the intervention. Chi-square statistics were calculated to determine whether the change in percentage of referrals and timely referrals was significant. Descriptive statistics were used to determine the level of provider satisfaction related to each survey item. A content analysis method was used to synthesize themes from the open-ended question asking clinicians to share their feedback related to the new protocol.
Results
Fifty-seven patients met the study inclusion criteria: 29 patients during the preintervention phase and 28 patients during the intervention phase. There were 35 male (61.4%) and 22 female (38.6%) patients. Twenty-five patients (43.9%) were from age groups 41 through 60 years and 61 through 80 years, respectively, representing the majority of included patients. Seven patients (12.3%) were from the 81 years and older age group. There were no patients in the age group 18 through 40 years. Based on the AMI READMITS score calculation, 57.9% (n = 33) patients were from a low-risk group (includes extremely low and low risk for readmission) and 42.1% (n = 24) were from a high-risk group (includes moderate, high, and extremely high risk for readmission).
Provider adoption of the new protocol during the intervention was high. Referral forms were completed for 82% (n = 23) of the 28 patients during the intervention. Analysis findings showed a statistically significant increase in documented referrals after implementing the new referral protocol. During the preintervention phase, 66% (n = 19) of patients with type I MI were referred to see a cardiologist or an NP at a post-MI clinic and there was no documented referral for 34% (n = 10) of patients. During the intervention phase, 89% (n = 25) of patients were referred and there was no documented referral for 11% (n = 3) of patients. Chi-square results indicated that the increase in referrals was significant (χ2 = 4.571, df = 1, P = 0.033).
Data analysis examined whether patient referrals fell within the recommended timeframe of 7 days for the high-risk group (included moderate-to-extremely high risk) and 14 days for the low-risk group (included low-to-extremely low risk). During the preintervention phase, 31% (n = 9) of patient referrals were scheduled as recommended; 28% (n = 8) of patient referrals were scheduled but delayed; and there was no referral date documented for 41% (n = 12) of patients. During the intervention phase, referrals scheduled as recommended increased to 53% (n = 15); 25% (n = 7) of referrals were scheduled but delayed; and there was no referral date documented for 21.4% (n = 6) of patients. The change in appointments scheduled as recommended was not significant (χ2 = 3.550, df = 2, P = 0.169).
Surveys were emailed to 25 cardiology fellows and 3 cardiology NPs who participated in this study. Eighteen of the 28 clinicians (15 cardiology fellows and 3 cardiology NPs) responded for a response rate of 64%. One of several residents who rotated through the CCU and PCCU during the intervention also completed the survey, for a total of 19 participants. When asked if the protocol was easy to use, 79% agreed or strongly agreed. Eighteen of the 19 participants (95%) agreed or strongly agreed that the protocol was useful in making referral decisions. Sixty-eight percent agreed or strongly agreed that the AMI READMITS risk assessment score improves referral process. All participants agreed or strongly agreed that there should be an option to incorporate the AMI READMITS risk assessment score into electronic clinical notes. When asked whether the AMI READMITS risk score should be implemented in clinical practice, responses were mixed (Figure 3). A common theme among the 4 participants who responded with comments was the need for additional data to validate the usefulness of the AMI READMITS to reduce readmissions. In addition, 1 participant commented that “manual calculation [of the risk score] is not ideal.”
Discussion
This project demonstrated that implementing an evidence-based referral protocol integrating the AMI-READMITS score can increase timely postdischarge referrals among patients with type I MI. The percentage of appropriately scheduled appointments increased during the intervention phase; however, a relatively high number of appointments were scheduled outside of the recommended timeframe, similar to preintervention. Thus, while the new protocol increased referrals and provider documentation of these referrals, it appears that challenges in scheduling timely referral appointments remained. This project did not examine the reasons for delayed appointments.
The survey findings indicated that providers were generally satisfied with the usability and usefulness of the new risk assessment protocol. A large majority agreed or strongly agreed that it was easy to use and useful in making referral decisions, and most agreed or strongly agreed that it improves the referral process. Mixed opinions regarding implementing the AMI READMITS score in clinical practice, combined with qualitative findings, suggest that a lack of external validation of the AMI READMITS presents a barrier to its long-term adoption. All providers who participated in the survey agreed or strongly agreed that the risk assessment should be incorporated into electronic clinical notes. We have begun the process of working with the EHR vendor to automate the AMI risk-assessment within the referral work-flow, which will provide an opportunity for a follow-up quality improvement study.
This quality improvement project has several limitations. First, it implemented a small change in 2 inpatient units at 1 hospital using a simple pre- posttest design. Therefore, the findings are not generalizable to other settings. Prior to the intervention, some referrals may have been made without documentation. While the authors were able to trace undocumented referrals for patients who were referred to the post-MI clinic or to a cardiologist affiliated with the hospital, some patients may have been referred to cardiologists who were not affiliated with the hospital. Another limitation was that the self-created provider survey used was not tested in other clinical settings; thus, it cannot be determined whether the sensitivity and specificity of the survey questions are high. In addition, the clinical providers who participated in the study knew the study team, which may have influenced their behavior during the study period. Furthermore, the identified improvement in clinicians’ referral practices may not be sustainable due to the complexity and effort required to manually calculate the risk score. This limitation could be eliminated by integrating the risk score calculation into the EHR.
Conclusion
Early follow-up after discharge plays an important role in supporting patients’ self-management of some risk factors (ie, diet, weight, and smoking) and identifying gaps in postdischarge care which may lead to readmission. This project provides evidence that integrating the AMI READMITS risk assessment score into the referral process can help to guide discharge decision-making and increase timely, appropriate referrals for patients with MI. Integration of a specific risk assessment, such as the AMI READMITS, within the post-MI referral protocol may help clinicians make more efficient, educated referral decisions. Future studies should explore more specifically how and why the new protocol impacts clinicians’ decision-making and behavior related to post-MI referrals. In addition, future studies should investigate challenges associated with scheduling postdischarge appointments. It will be important to investigate how integration of the new protocol within the EHR may increase efficiency, consistency, and provider satisfaction with the new referral process. Additional research investigating the effects of the AMI READMITS score on readmissions reduction will be important to promote long-term adoption of the improved referral protocol in clinical practice.
Acknowledgments: The authors thank Shelly Conaway, ANP-BC, MSN, Angela Street, ANP-BC, MSN, Andrew Geis, ACNP-BC, MSN, Richard P. Jones II, MD, Eunice Young, MD, Joy Rothwell, MSN, RN-BC, Allison Olazo, MBA, MSN, RN-BC, Elizabeth Heck, RN-BC, and Matthew Trojanowski, MHA, MS, RRT, CSSBB for their support of this study.
Corresponding author: Nailya Muganlinskaya, DNP, MPH, ACNP-BC, MSN, The Johns Hopkins Hospital, 1800 Orleans St, Baltimore, MD 21287; [email protected].
Financial disclosures: None.
1. Why it is important to improve care transitions? Society of Hospital Medicine. Accessed June 15, 2020. https://www.hospitalmedicine.org/clinical-topics/care-transitions/
2. Tong L, Arnold T, Yang J, et al. The association between outpatient follow-up visits and all-cause non-elective 30-day readmissions: a retrospective observational cohort study. PloS One. 2018;13(7):e0200691.
3. Jackson C, Shahsahebi M, Wedlake T, DuBard CA. Timeliness of outpatient follow-up: an evidence-based approach for planning after hospital discharge. Ann Fam Med. 2015;13(2):115-22.
4. Health Research & Educational Trust. Preventable Readmissions Change Package. American Hospital Association. Updated December 2015. Accessed June 10, 2020. https://www.aha.org/sites/default/files/hiin/HRETHEN_ChangePackage_Readmissions.pd
5. Tung Y-C, Chang G-M, Chang H-Y, Yu T-H. Relationship between early physician follow-up and 30-day readmission after acute myocardial infarction and heart failure. Plos One. 2017;12(1):e0170061.
6. Kaplan RM, Koehler J, Zieger PD, et al. Stroke risk as a function of atrial fibrillation duration and CHA2DS2-VASc score. Circulation. 2019;140(20):1639-46.
7. Balan P, Zhao Y, Johnson S, et al. The Society of Thoracic Surgery Risk Score as a predictor of 30-day mortality in transcatheter vs surgical aortic valve replacement: a single-center experience and its implications for the development of a TAVR risk-prediction model. J Invasive Cardiol. 2017;29(3):109-14.
8. Smith LN, Makam AN, Darden D, et al. Acute myocardial infarction readmission risk prediction models: A systematic review of model performance. Circ Cardiovasc Qual Outcomes9.9. 2018;11(1):e003885.
9. Baker H, Oliver-McNeil S, Deng L, Hummel SL. See you in 7: regional hospital collaboration and outcomes in Medicare heart failure patients. JACC Heart Fail. 2015;3(10):765-73.
10. Batten A, Jaeger C, Griffen D, et al. See you in 7: improving acute myocardial infarction follow-up care. BMJ Open Qual. 2018;7(2):e000296.
11. Lee DW, Armistead L, Coleman H, et al. Abstract 15387: Post-discharge follow-up within 14 days reduces 30-day hospital readmission rates in patients with acute myocardial infarction and/or acutely decompensated heart failure. Circulation. 2018;134 (1):A 15387.
12. Thygesen K, Alpert JS, Jaffe AS, et al. Fourth universal definition of myocardial infarction. Circulation. 2018;138 (20):e:618-51.
Could tamoxifen dose be slashed down to 2.5 mg?
Tamoxifen has long been used in breast cancer, both in the adjuvant and preventive setting, but uptake and adherence are notoriously low, mainly because of adverse events.
Using a much lower dose to reduce the incidence of side effects would be a “way forward,” reasoned Swedish researchers. They report that a substantially lower dose of tamoxifen (2.5 mg) may be as effective as the standard dose (20 mg), but reduced by half the incidence of severe vasomotor symptoms, including hot flashes, cold sweats, and night sweats.
The research was published online March 18 in the Journal of Clinical Oncology.
The study involved 1,439 women (aged 40-74 years) who were participating in the Swedish mammography screening program and tested tamoxifen at various doses.
“We performed a dose determination study that we hope will initiate follow-up studies that in turn will influence both adjuvant treatment and prevention of breast cancer,” said lead author Per Hall, MD, PhD, head of the department of medical epidemiology and biostatistics at Karolinska Institutet in Stockholm.
The study measured the effects of the different doses (1, 2.5, 5, 10, and 20 mg) on mammographic breast density.
Dr. Hall emphasized that breast density was used as a proxy for therapy response. “We do not know how that translates to actual clinical effect,” he said in an interview. “This is step one.”
Previous studies have also used breast density changes as a proxy endpoint for tamoxifen therapy response, in both prophylactic and adjuvant settings, the authors note. There is some data to suggest that this does translate to a clinical effect. A recent study showed that tamoxifen at 5 mg/day taken for 3 years reduced the recurrence of breast intraepithelial neoplasia by 50% and contralateral breast cancer by 75%, with a symptom profile similar to placebo (J Clin Oncol. 2019;37:1629-1637).
Lower density, fewer symptoms
In the current study, Dr. Hall and colleagues found that the mammographic breast density (mean overall area) was decreased by 9.6% in the 20 mg tamoxifen group, and similar decreases were seen in the 2.5 and 10 mg dose groups, but not in the placebo and 1 mg dose groups.
These changes were driven primarily by changes observed among premenopausal women where the 20 mg mean decrease was 18.5% (P < .001 for interaction with menopausal status) with decreases of 13.4% in the 2.5 mg group, 19.6% in the 5 mg group, and 17% in the 10 mg group.
The results were quite different in postmenopausal participants, where those who received the 20 mg dose had a density mean decrease of 4%, which was not substantially different to the placebo, 1 mg, 2.5 mg, and 10 mg treatment arms.
The authors point out that the difference in density decrease between premenopausal and postmenopausal women was not dependent on differences in baseline density.
When reviewing adverse events with the various doses, the team found a large decrease in severe vasomotor symptoms with the lower doses of tamoxifen. These adverse events were reported by 34% of women taking 20 mg, 24.4% on 5 mg, 20.5% on 2.5 mg, 18.5% on 1 mg, and 13.7% of women taking placebo. There were no similar trends seen for gynecologic, sexual, or musculoskeletal symptoms.
Future studies should test whether 2.5 mg of tamoxifen reduces the risk of primary breast cancer, Dr. Hall commented.
“We are planning a trial now where women are offered risk assessment when attending mammography screening,” Dr. Hall said. “For those at very high risk, low-dose tamoxifen will be offered.”
The study received support from the Kamprad Foundation, Swedish Research Council, Marit and Hans Rausing’s Initiative Against Breast Cancer, Swedish Cancer Society, and Stockholm County Council.
Dr. Hall reports several relationships with industry, had a pending patent on compositions and methods for prevention of breast cancer with an option to license to Atossa Therapeutics, and has licensed an algorithm for risk prediction based on analyses of mammographic features to iCAD Travel. Several co-authors have also declared relationships with industry.
A version of this article first appeared on Medscape.com.
Recurrent miscarriage: What’s the evidence-based evaluation and management?
A pregnancy loss at any gestational age is devastating. Women and/or couples may, unfairly, self-blame as they desperately seek substantive answers. Their support systems, including health care providers, offer some, albeit fleeting, comfort. Conception is merely the start of an emotionally arduous first trimester that often results in a learned helplessness. This month, we focus on the comprehensive evaluation and the medical evidence–based approach to recurrent pregnancy loss (RPL).

RPL is defined by the American Society for Reproductive Medicine as two or more clinical pregnancy losses of less than 20 weeks’ gestation with a prevalence of approximately 5%. Embryo aneuploidy is the most common reason for a spontaneous miscarriage, occurring in 50%-70% of losses. The risk of spontaneous miscarriage during the reproductive years follows a J-shaped pattern. The lowest percentage is in women aged 25-29 years (9.8%), with a nadir at age 27 (9.5%), then an increasingly steep rise after age 35 to a peak at age 45 and over (53.6%). The loss rate is closer to 50% of all fertilizations since many spontaneous miscarriages occur at 2-4 weeks, before a pregnancy can be clinically diagnosed. The frequency of embryo aneuploidy significantly decreases and embryo euploidy increases with successive numbers of spontaneous miscarriages.
After three or more spontaneous miscarriages, nulliparous women appear to have a higher rate of subsequent pregnancy loss, compared with parous women (BMJ. 2000;320:1708). We recommend an evaluation following two losses given the lack of evidence for a difference in diagnostic yield following two versus three miscarriages and particularly because of the emotional effects of impact of RPL.
RPL causes, percentages of contribution, and evaluation
1. Genetic (2%-5%). Because of the risk of an embryo with an unbalanced chromosomal rearrangement inherited from a translocation present in either of the couple, a blood karyotype of the couple is essential despite a history of one or more successful live births. While in vitro fertilization (IVF) with preimplantation genetic testing for structural rearrangements (PGT-SR) can successfully diagnose affected embryos to avoid their intrauterine transfer, overall live birth rates are similar when comparing natural conception attempts with PGT-SR, although the latter may reduce miscarriages.
2. Anatomic (10%-15%). Hysteroscopy, hysterosalpingogram, or saline ultrasound can be used to image the uterine cavity to evaluate for polyps, fibroids, scarring, or a congenital septum – all of which can be surgically corrected. Chronic endometritis has been found in 27% of patients with recurrent miscarriage (and in 14% with recurrent implantation failure), therefore testing by biopsy is reasonable. An elevated level of homocysteine has been reported to impair DNA methylation and gene expression, causing defective chorionic villous vascularization in spontaneous miscarriage tissues. We recommend folic acid supplementation and the avoidance of testing for MTHFR (methylenetetrahydrofolate reductase). Of note, the recent TRUST study showed no significant benefit from metroplasty in comparison with expectant management in 12 months of observation resulting in a live birth rate of 31% versus 35%, respectively.
3. Acquired thrombophilias (20%). Medical evidence supports testing for the antiphospholipid antibody syndrome (APS), i.e., RPL with either the presence of lupus anticoagulant (LAC), anticardiolipin antibodies, or anti-beta2 glycoprotein for IgG and IgM. Persistent LAC or elevations of antibodies greater than 40 GPL or greater than the 99th percentile for more than 12 weeks justifies the use of low-molecular-weight heparin (LMWH). APS has been shown to cause RPL, thrombosis, and/or autoimmune thrombocytopenia. There is no definitive evidence to support testing for MTHFR or any other thrombophilias for first trimester RPL. APS has up to a 90% fetal loss rate without therapeutic intervention. Treatment includes low-dose aspirin (81 mg daily) and LMWH. These medications are thought to help prevent thrombosis in the placenta, helping to maintain pregnancies.
4. Hormonal (17%-20%). The most common hormonal disorders increasing the risk for miscarriage is thyroid dysfunction (both hyper- and hypothyroid), prolactin elevations, and lack of glucose control. While the concern for a luteal phase (LPD) prevails, there is no accepted definition or treatment. There is recent evidence that antibodies to thyroid peroxidase may increase miscarriage and that low-dose thyroid replacement may reduce this risk. One other important area is the polycystic ovarian syndrome (PCOS). This hormonal abnormality affects 6%-20% of all reproductive aged women and may increase miscarriage.
5. Unexplained (40%-50%). The most frustrating but most common reason for RPL. Nevertheless, close monitoring and supportive care throughout the first trimester has been demonstrated in medical studies to improve outcome.
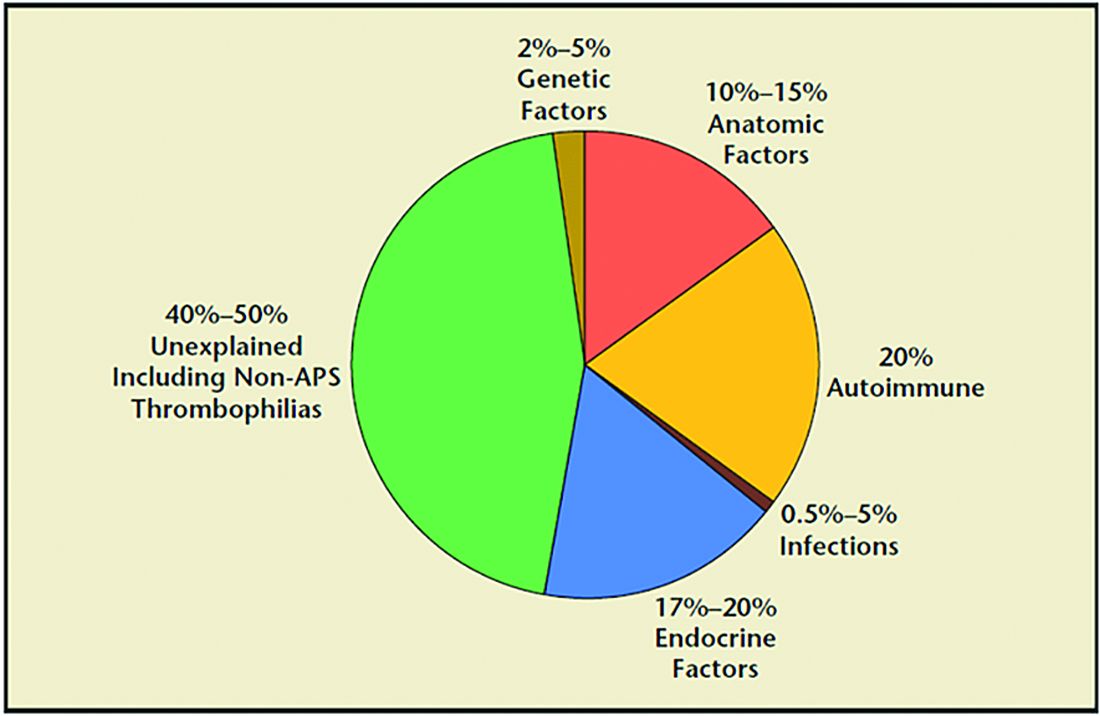
Seven surprising facts about recurrent miscarriage
1. Folic acid 4 mg daily may decrease embryo chromosomal abnormalities and miscarriage.
Folic acid in doses of at least 0.4 mg daily have long been advocated to reduce spina bifida and neural tube defects. It is optimal to begin folic acid for several months prior to conception attempts. There is evidence it may help treat RPL by reducing the chance for chromosomal errors.
2. A randomized trial did not demonstrate an improved live birth rate using progesterone in the first trimester. However, women enrolled may not have begun progesterone until 6 weeks of pregnancy, begging the question if earlier progesterone would have demonstrated improvement.
Dydrogesterone, a progestogen that is highly selective for the progesterone receptor, lacks estrogenic, androgenic, anabolic, and corticoid properties. Although not available in the United States, dydrogesterone appears to reduce the rate of idiopathic recurrent miscarriage (two or more losses). Also, progesterone support has been shown to reduce loss in threatened miscarriage – 17 OHPC 500 mg IM weekly in the first trimester.
3. No benefit of aspirin and/or heparin to treat unexplained RM.
The use of aspirin and/or heparin-like medication has convincingly been shown to not improve live birth rates in RPL.
4. Inherited thrombophilias are NOT associated with RM and should not be tested.
Screening for factor V (Leiden mutation), factor II (Prothrombin G20210A), and MTHFR have not been shown to cause RM and no treatment, such as aspirin and/or heparin-like medications, improves the live birth rate.
5. Close monitoring and empathetic care improves outcomes.
For unknown reasons, clinics providing close monitoring, emotional support, and education to patients with unexplained RM report higher live birth rates, compared with patients not receiving this level of care.
6. Behavior changes reduce miscarriage.
Elevations in body mass index (BMI) and cigarette smoking both increase the risk of miscarriage. As a result, a healthy BMI and eliminating tobacco use reduce the risk of pregnancy loss. Excessive caffeine use (more than two equivalent cups of caffeine in coffee per day) also may increase spontaneous miscarriage.
7. Fertility medications, intrauterine insemination, in vitro fertilization, or preimplantation genetic testing for aneuploidy (PGT-A) do not improve outcomes.
While patients and, often, health care providers, feel compelled to proceed with fertility treatment, ovulation induction medications, intrauterine insemination, in vitro fertilization, or PGT-A have not been shown to improve the chance for a live birth. PGT-A did not reduce the risk of miscarriage in women with recurrent pregnancy loss.
In summary, following two or more pregnancy losses, I recommend obtaining chromosomal testing of the couple, viewing the uterine cavity, blood testing for thyroid, prolactin, and glucose control, and acquired thrombophilias (as above). Fortunately, when the cause is unexplained, the woman has a 70%-80% chance of a spontaneous live birth over the next 10 years from diagnosis. By further understanding, knowing how to diagnose, and, finally, treating the cause of RPL we can hopefully prevent the heartbreak women and couples endure.
Dr. Trolice is director of Fertility CARE – The IVF Center in Winter Park, Fla., and professor of obstetrics and gynecology at the University of Central Florida, Orlando.
A pregnancy loss at any gestational age is devastating. Women and/or couples may, unfairly, self-blame as they desperately seek substantive answers. Their support systems, including health care providers, offer some, albeit fleeting, comfort. Conception is merely the start of an emotionally arduous first trimester that often results in a learned helplessness. This month, we focus on the comprehensive evaluation and the medical evidence–based approach to recurrent pregnancy loss (RPL).
RPL is defined by the American Society for Reproductive Medicine as two or more clinical pregnancy losses of less than 20 weeks’ gestation with a prevalence of approximately 5%. Embryo aneuploidy is the most common reason for a spontaneous miscarriage, occurring in 50%-70% of losses. The risk of spontaneous miscarriage during the reproductive years follows a J-shaped pattern. The lowest percentage is in women aged 25-29 years (9.8%), with a nadir at age 27 (9.5%), then an increasingly steep rise after age 35 to a peak at age 45 and over (53.6%). The loss rate is closer to 50% of all fertilizations since many spontaneous miscarriages occur at 2-4 weeks, before a pregnancy can be clinically diagnosed. The frequency of embryo aneuploidy significantly decreases and embryo euploidy increases with successive numbers of spontaneous miscarriages.
After three or more spontaneous miscarriages, nulliparous women appear to have a higher rate of subsequent pregnancy loss, compared with parous women (BMJ. 2000;320:1708). We recommend an evaluation following two losses given the lack of evidence for a difference in diagnostic yield following two versus three miscarriages and particularly because of the emotional effects of impact of RPL.
RPL causes, percentages of contribution, and evaluation
1. Genetic (2%-5%). Because of the risk of an embryo with an unbalanced chromosomal rearrangement inherited from a translocation present in either of the couple, a blood karyotype of the couple is essential despite a history of one or more successful live births. While in vitro fertilization (IVF) with preimplantation genetic testing for structural rearrangements (PGT-SR) can successfully diagnose affected embryos to avoid their intrauterine transfer, overall live birth rates are similar when comparing natural conception attempts with PGT-SR, although the latter may reduce miscarriages.
2. Anatomic (10%-15%). Hysteroscopy, hysterosalpingogram, or saline ultrasound can be used to image the uterine cavity to evaluate for polyps, fibroids, scarring, or a congenital septum – all of which can be surgically corrected. Chronic endometritis has been found in 27% of patients with recurrent miscarriage (and in 14% with recurrent implantation failure), therefore testing by biopsy is reasonable. An elevated level of homocysteine has been reported to impair DNA methylation and gene expression, causing defective chorionic villous vascularization in spontaneous miscarriage tissues. We recommend folic acid supplementation and the avoidance of testing for MTHFR (methylenetetrahydrofolate reductase). Of note, the recent TRUST study showed no significant benefit from metroplasty in comparison with expectant management in 12 months of observation resulting in a live birth rate of 31% versus 35%, respectively.
3. Acquired thrombophilias (20%). Medical evidence supports testing for the antiphospholipid antibody syndrome (APS), i.e., RPL with either the presence of lupus anticoagulant (LAC), anticardiolipin antibodies, or anti-beta2 glycoprotein for IgG and IgM. Persistent LAC or elevations of antibodies greater than 40 GPL or greater than the 99th percentile for more than 12 weeks justifies the use of low-molecular-weight heparin (LMWH). APS has been shown to cause RPL, thrombosis, and/or autoimmune thrombocytopenia. There is no definitive evidence to support testing for MTHFR or any other thrombophilias for first trimester RPL. APS has up to a 90% fetal loss rate without therapeutic intervention. Treatment includes low-dose aspirin (81 mg daily) and LMWH. These medications are thought to help prevent thrombosis in the placenta, helping to maintain pregnancies.
4. Hormonal (17%-20%). The most common hormonal disorders increasing the risk for miscarriage is thyroid dysfunction (both hyper- and hypothyroid), prolactin elevations, and lack of glucose control. While the concern for a luteal phase (LPD) prevails, there is no accepted definition or treatment. There is recent evidence that antibodies to thyroid peroxidase may increase miscarriage and that low-dose thyroid replacement may reduce this risk. One other important area is the polycystic ovarian syndrome (PCOS). This hormonal abnormality affects 6%-20% of all reproductive aged women and may increase miscarriage.
5. Unexplained (40%-50%). The most frustrating but most common reason for RPL. Nevertheless, close monitoring and supportive care throughout the first trimester has been demonstrated in medical studies to improve outcome.
Seven surprising facts about recurrent miscarriage
1. Folic acid 4 mg daily may decrease embryo chromosomal abnormalities and miscarriage.
Folic acid in doses of at least 0.4 mg daily have long been advocated to reduce spina bifida and neural tube defects. It is optimal to begin folic acid for several months prior to conception attempts. There is evidence it may help treat RPL by reducing the chance for chromosomal errors.
2. A randomized trial did not demonstrate an improved live birth rate using progesterone in the first trimester. However, women enrolled may not have begun progesterone until 6 weeks of pregnancy, begging the question if earlier progesterone would have demonstrated improvement.
Dydrogesterone, a progestogen that is highly selective for the progesterone receptor, lacks estrogenic, androgenic, anabolic, and corticoid properties. Although not available in the United States, dydrogesterone appears to reduce the rate of idiopathic recurrent miscarriage (two or more losses). Also, progesterone support has been shown to reduce loss in threatened miscarriage – 17 OHPC 500 mg IM weekly in the first trimester.
3. No benefit of aspirin and/or heparin to treat unexplained RM.
The use of aspirin and/or heparin-like medication has convincingly been shown to not improve live birth rates in RPL.
4. Inherited thrombophilias are NOT associated with RM and should not be tested.
Screening for factor V (Leiden mutation), factor II (Prothrombin G20210A), and MTHFR have not been shown to cause RM and no treatment, such as aspirin and/or heparin-like medications, improves the live birth rate.
5. Close monitoring and empathetic care improves outcomes.
For unknown reasons, clinics providing close monitoring, emotional support, and education to patients with unexplained RM report higher live birth rates, compared with patients not receiving this level of care.
6. Behavior changes reduce miscarriage.
Elevations in body mass index (BMI) and cigarette smoking both increase the risk of miscarriage. As a result, a healthy BMI and eliminating tobacco use reduce the risk of pregnancy loss. Excessive caffeine use (more than two equivalent cups of caffeine in coffee per day) also may increase spontaneous miscarriage.
7. Fertility medications, intrauterine insemination, in vitro fertilization, or preimplantation genetic testing for aneuploidy (PGT-A) do not improve outcomes.
While patients and, often, health care providers, feel compelled to proceed with fertility treatment, ovulation induction medications, intrauterine insemination, in vitro fertilization, or PGT-A have not been shown to improve the chance for a live birth. PGT-A did not reduce the risk of miscarriage in women with recurrent pregnancy loss.
In summary, following two or more pregnancy losses, I recommend obtaining chromosomal testing of the couple, viewing the uterine cavity, blood testing for thyroid, prolactin, and glucose control, and acquired thrombophilias (as above). Fortunately, when the cause is unexplained, the woman has a 70%-80% chance of a spontaneous live birth over the next 10 years from diagnosis. By further understanding, knowing how to diagnose, and, finally, treating the cause of RPL we can hopefully prevent the heartbreak women and couples endure.
Dr. Trolice is director of Fertility CARE – The IVF Center in Winter Park, Fla., and professor of obstetrics and gynecology at the University of Central Florida, Orlando.
Reproductive safety of treatments for women with bipolar disorder
Since March 2020, my colleagues and I have conducted Virtual Rounds at the Center for Women’s Mental Health at Massachusetts General Hospital. It has been an opportunity to review the basic tenets of care for reproductive age women before, during, and after pregnancy, and also to learn of extraordinary cases being managed both in the outpatient setting and in the context of the COVID-19 pandemic.

As I’ve noted in previous columns, we have seen a heightening of symptoms of anxiety and insomnia during the pandemic in women who visit our center, and at the centers of the more than 100 clinicians who join Virtual Rounds each week. These colleagues represent people in rural areas, urban environments, and underserved communities across America that have been severely affected by the pandemic. It is clear that the stress of the pandemic is undeniable for patients both with and without psychiatric or mental health issues. We have also seen clinical roughening in women who have been well for a long period of time. In particular, we have noticed that postpartum women are struggling with the stressors of the postpartum period, such as figuring out the logistics of support with respect to childcare, managing maternity leave, and adapting to shifting of anticipated support systems.
Hundreds of women with bipolar disorder come to see us each year about the reproductive safety of the medicines on which they are maintained. Those patients are typically well, and we collaborate with them and their doctors about the safest treatment recommendations. With that said, women with bipolar disorder are at particular risk for postpartum worsening of their mood. The management of their medications during pregnancy requires extremely careful attention because relapse of psychiatric disorder during pregnancy is the strongest predictor of postpartum worsening of underlying psychiatric illness.
This is an opportunity to briefly review the reproductive safety of treatments for these women. We know through initiatives such as the Massachusetts General Hospital National Pregnancy Registry for Psychiatric Medications that the most widely used medicines for bipolar women during pregnancy include lamotrigine, atypical antipsychotics, and lithium carbonate.
Lamotrigine
The last 15 years have generated the most consistent data on the reproductive safety of lamotrigine. One of the issues, however, with respect to lamotrigine is that its use requires very careful and slow titration and it is also more effective in patients who are well and in the maintenance phase of the illness versus those who are more acutely manic or who are suffering from frank bipolar depression.
Critically, the literature does not support the use of lamotrigine for patients with bipolar I or with more manic symptoms. That being said, it remains a mainstay of treatment for many patients with bipolar disorder, is easy to use across pregnancy, and has an attractive side-effect profile and a very strong reproductive safety profile, suggesting the absence of an increased risk for major malformations.
Atypical antipsychotics
We have less information but have a growing body of evidence about atypical antipsychotics. Both data from administrative databases as well a growing literature from pregnancy registries, such as the National Pregnancy Registry for Atypical Antipsychotics, fail to show a signal for teratogenicity with respect to use of the medicines as a class, and also with specific reference to some of the most widely used atypical antipsychotics, particularly quetiapine and aripiprazole. Our comfort level, compared with a decade ago, with using the second-generation antipsychotics is much greater. That’s a good thing considering the extent to which patients presenting on a combination of, for example, lamotrigine and atypical antipsychotics.
Lithium carbonate
Another mainstay of treatment for women with bipolar I disorder and prominent symptoms of mania is lithium carbonate. The data for efficacy of lithium carbonate used both acutely and for maintenance treatment of bipolar disorder has been unequivocal. Concerns about the teratogenicity of lithium go back to the 1970s and indicate a small increased absolute and relative risk for cardiovascular malformations. More recently, a meta-analysis of lithium exposure during pregnancy and the postpartum period supports this older data, which suggests this increased risk, and examines other outcomes concerning to women with bipolar disorder who use lithium, such as preterm labor, low birth weight, miscarriage, and other adverse neonatal outcomes.
In 2021, with the backdrop of the pandemic, what we actually see is that, for our pregnant and postpartum patients with bipolar disorder, the imperative to keep them well, keep them out of the hospital, and keep them safe has often required careful coadministration of drugs like lamotrigine, lithium, and atypical antipsychotics (and even benzodiazepines). Keeping this population well during the perinatal period is so critical. We were all trained to use the least number of medications when possible across psychiatric illnesses. But the years, data, and clinical experience have shown that polypharmacy may be required to sustain euthymia in many patients with bipolar disorder. The reflex historically has been to stop medications during pregnancy. We take pause, particularly during the pandemic, before reverting back to the practice of 25 years ago of abruptly stopping medicines such as lithium or atypical antipsychotics in patients with bipolar disorder because we know that the risk for relapse is very high following a shift from the regimen that got the patient well.
The COVID-19 pandemic in many respects has highlighted a need to clinically thread the needle with respect to developing a regimen that minimizes risk of reproductive safety concerns but maximizes the likelihood that we can sustain the emotional well-being of these women across pregnancy and into the postpartum period.
Dr. Cohen is the director of the Ammon-Pinizzotto Center for Women’s Mental Health at Massachusetts General Hospital, which provides information resources and conducts clinical care and research in reproductive mental health. He has been a consultant to manufacturers of psychiatric medications. Email Dr. Cohen at [email protected].
Since March 2020, my colleagues and I have conducted Virtual Rounds at the Center for Women’s Mental Health at Massachusetts General Hospital. It has been an opportunity to review the basic tenets of care for reproductive age women before, during, and after pregnancy, and also to learn of extraordinary cases being managed both in the outpatient setting and in the context of the COVID-19 pandemic.
As I’ve noted in previous columns, we have seen a heightening of symptoms of anxiety and insomnia during the pandemic in women who visit our center, and at the centers of the more than 100 clinicians who join Virtual Rounds each week. These colleagues represent people in rural areas, urban environments, and underserved communities across America that have been severely affected by the pandemic. It is clear that the stress of the pandemic is undeniable for patients both with and without psychiatric or mental health issues. We have also seen clinical roughening in women who have been well for a long period of time. In particular, we have noticed that postpartum women are struggling with the stressors of the postpartum period, such as figuring out the logistics of support with respect to childcare, managing maternity leave, and adapting to shifting of anticipated support systems.
Hundreds of women with bipolar disorder come to see us each year about the reproductive safety of the medicines on which they are maintained. Those patients are typically well, and we collaborate with them and their doctors about the safest treatment recommendations. With that said, women with bipolar disorder are at particular risk for postpartum worsening of their mood. The management of their medications during pregnancy requires extremely careful attention because relapse of psychiatric disorder during pregnancy is the strongest predictor of postpartum worsening of underlying psychiatric illness.
This is an opportunity to briefly review the reproductive safety of treatments for these women. We know through initiatives such as the Massachusetts General Hospital National Pregnancy Registry for Psychiatric Medications that the most widely used medicines for bipolar women during pregnancy include lamotrigine, atypical antipsychotics, and lithium carbonate.
Lamotrigine
The last 15 years have generated the most consistent data on the reproductive safety of lamotrigine. One of the issues, however, with respect to lamotrigine is that its use requires very careful and slow titration and it is also more effective in patients who are well and in the maintenance phase of the illness versus those who are more acutely manic or who are suffering from frank bipolar depression.
Critically, the literature does not support the use of lamotrigine for patients with bipolar I or with more manic symptoms. That being said, it remains a mainstay of treatment for many patients with bipolar disorder, is easy to use across pregnancy, and has an attractive side-effect profile and a very strong reproductive safety profile, suggesting the absence of an increased risk for major malformations.
Atypical antipsychotics
We have less information but have a growing body of evidence about atypical antipsychotics. Both data from administrative databases as well a growing literature from pregnancy registries, such as the National Pregnancy Registry for Atypical Antipsychotics, fail to show a signal for teratogenicity with respect to use of the medicines as a class, and also with specific reference to some of the most widely used atypical antipsychotics, particularly quetiapine and aripiprazole. Our comfort level, compared with a decade ago, with using the second-generation antipsychotics is much greater. That’s a good thing considering the extent to which patients presenting on a combination of, for example, lamotrigine and atypical antipsychotics.
Lithium carbonate
Another mainstay of treatment for women with bipolar I disorder and prominent symptoms of mania is lithium carbonate. The data for efficacy of lithium carbonate used both acutely and for maintenance treatment of bipolar disorder has been unequivocal. Concerns about the teratogenicity of lithium go back to the 1970s and indicate a small increased absolute and relative risk for cardiovascular malformations. More recently, a meta-analysis of lithium exposure during pregnancy and the postpartum period supports this older data, which suggests this increased risk, and examines other outcomes concerning to women with bipolar disorder who use lithium, such as preterm labor, low birth weight, miscarriage, and other adverse neonatal outcomes.
In 2021, with the backdrop of the pandemic, what we actually see is that, for our pregnant and postpartum patients with bipolar disorder, the imperative to keep them well, keep them out of the hospital, and keep them safe has often required careful coadministration of drugs like lamotrigine, lithium, and atypical antipsychotics (and even benzodiazepines). Keeping this population well during the perinatal period is so critical. We were all trained to use the least number of medications when possible across psychiatric illnesses. But the years, data, and clinical experience have shown that polypharmacy may be required to sustain euthymia in many patients with bipolar disorder. The reflex historically has been to stop medications during pregnancy. We take pause, particularly during the pandemic, before reverting back to the practice of 25 years ago of abruptly stopping medicines such as lithium or atypical antipsychotics in patients with bipolar disorder because we know that the risk for relapse is very high following a shift from the regimen that got the patient well.
The COVID-19 pandemic in many respects has highlighted a need to clinically thread the needle with respect to developing a regimen that minimizes risk of reproductive safety concerns but maximizes the likelihood that we can sustain the emotional well-being of these women across pregnancy and into the postpartum period.
Dr. Cohen is the director of the Ammon-Pinizzotto Center for Women’s Mental Health at Massachusetts General Hospital, which provides information resources and conducts clinical care and research in reproductive mental health. He has been a consultant to manufacturers of psychiatric medications. Email Dr. Cohen at [email protected].
Obesity pegged as source of marked increased risk of diabetes in PCOS
The increased risk of type 2 diabetes in women with polycystic ovary syndrome is well established, but a new analysis has shown that obesity is the major mediator and a target for preventing or reversing this comorbidity.
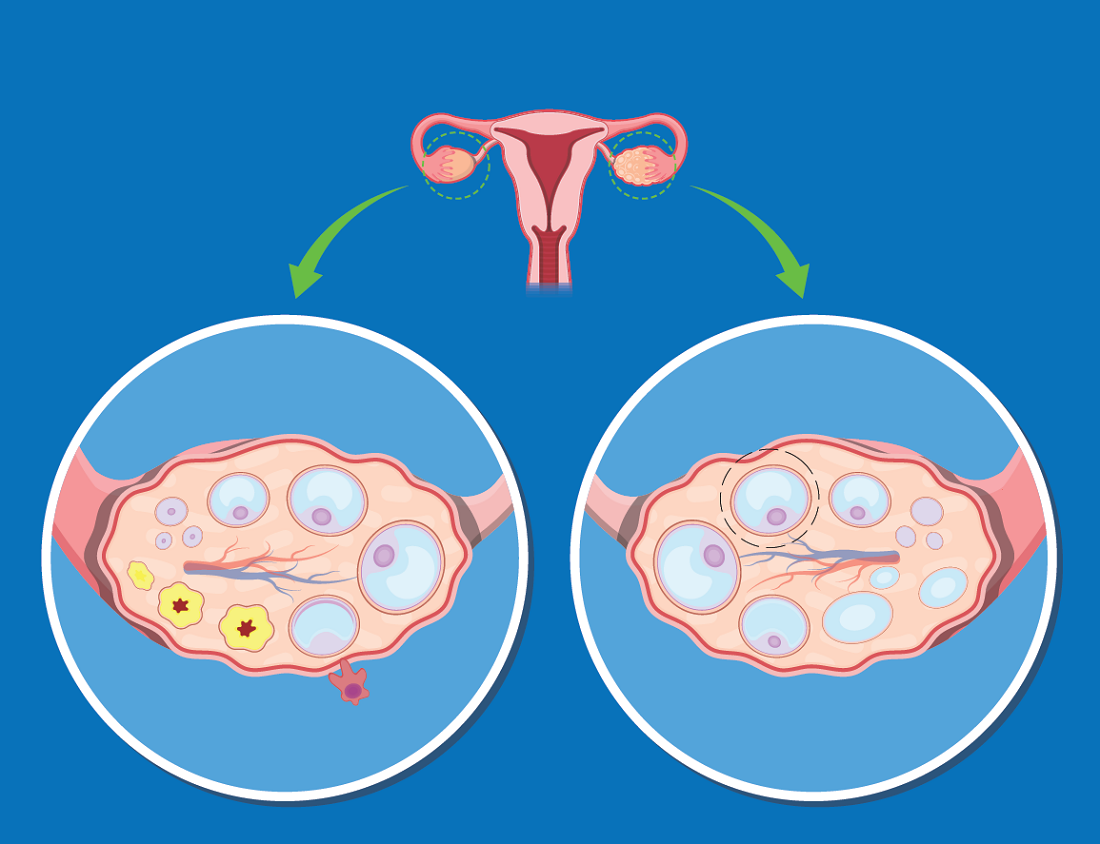
“Most women with PCOS are obese, complicating the effort to understand whether high rates of diabetes in this population are due to PCOS or excess weight, but our study now suggest that obesity isa targetable risk factor,” reported Panagiotis Anagnostis, MD, PhD, a reproductive endocrinologist at the Medical School of Aristotle University, Thessaloniki, Greece.
Obesity is also a known risk factor for type 2 diabetes (T2D), but there is reason to suspect that PCOS, which is associated with abnormal carbohydrate metabolism, has a direct impact on the risk of developing T2D, according to Dr. Anagnostis. It is also reasonable to expect “a synergistic deleterious effect” from PCOS and obesity on adverse changes in glucose metabolism that lead to T2D.
Even though rates of obesity among women with PCOS reach 80% in some studies, Dr. Anagnostis attempted to disentangle the relationship between obesity, PCOS, and risk of T2D using a large set of data drawn from a comprehensive search of published studies.
After screening with predefined criteria, 12 studies provided data on 224,284 women, of whom 45,361 had PCOS and 5,717 had T2D. Not least of the criteria for inclusion in this analysis, all studies stratified women as obese, defined as a body mass index (BMI) greater than 30 kg/m2, or nonobese, he reported at the annual meeting of the Endocrine Society.
Diabetes risk tripled in PCOS
When compared without regard to BMI, the relative risk of having T2D among those with PCOS relative to those without this condition was more than three times greater (RR 3.13; P < .001). When women with PCOS were stratified for BMI, obesity was associated with a more than fourfold increased risk relative to controls without PCOS (RR, 4.06; P < .001).
In women who were nonobese, the risk of T2D was numerically higher for those with PCOS than those without (RR, 2.68), but it was only a trend with a large confidence interval (95% confidence interval, 0.97-7.49).
Among women with PCOS, those who were obese also had a more than fourfold and highly significant increased risk of T2D relative to those who were not obese (RR, 4.20; P < .001).
The message from these data is that obesity is a major and potentially modifiable risk factor for diabetes in women with PCOS, according to Dr. Anagnostis.
He said these data provide the basis for recommending weight loss specifically for managing this common PCOS comorbidity.
Almost the same relative risk of diabetes was derived from an analysis of a women’s health database published 2 years ago in Diabetes Care. In that study with 1,916 person-years of follow-up, the hazard ratio for T2D was also more than three times greater (HR, 3.23; P < .001) for those with PCOS relative to those without the syndrome.
However, normal BMI did not eliminate risk of developing diabetes in this study. Rather, the relative risk of T2D in women with PCOS was higher in those of normal weight, compared with those who were obese (HR, 4.68 vs. 2.36; P < .005). The investigators recommend screening all women with PCOS at least every 3 years with more frequent screening in those with risk factors.
PCOS complexity challenges simple conclusions
The complexity of disturbed metabolic pathways in patients with PCOS and obesity might explain some of the difficulty in unraveling the relationship between these two disease states and diabetes risk. In one recent review, it was suggested that obesity and PCOS share interrelated adverse effects on glucose metabolism. As a result, these associations are “more complex than a simple cause-and-effect process.” the authors of that article concluded.
Furthermore, in their examination of metabolic pathways, genetic susceptibility, and behavioral factors that might link PCOS, weight gain, and T2D, the authors did not ignore the psychological impact of PCOS in causing obesity and, as a byproduct, diabetes. These psychological factors might be relevant to treatment.
For example, depression and stress “might hamper ongoing attempts at lifestyle change and therefore effective weight loss” in at least some women, they cautioned.
However, in encouraging weight loss in overweight women with PCOS, the debate about cause of T2D might be moot in practical terms, according to Michael Dansinger, MD, founding director of the diabetes reversal program at Tufts Medical Center, Boston.
“Reducing excess body fat reduces the risk of type 2 diabetes,” Dr. Dansinger said in an interview. “Since women with obesity and PCOS are clearly at risk for future type 2 diabetes, that’s another reason to lose excess body fat through healthy eating and exercise.”
Dr. Anagnostis and Dr. Dansinger reported no relevant conflicts of interest.
The increased risk of type 2 diabetes in women with polycystic ovary syndrome is well established, but a new analysis has shown that obesity is the major mediator and a target for preventing or reversing this comorbidity.
“Most women with PCOS are obese, complicating the effort to understand whether high rates of diabetes in this population are due to PCOS or excess weight, but our study now suggest that obesity isa targetable risk factor,” reported Panagiotis Anagnostis, MD, PhD, a reproductive endocrinologist at the Medical School of Aristotle University, Thessaloniki, Greece.
Obesity is also a known risk factor for type 2 diabetes (T2D), but there is reason to suspect that PCOS, which is associated with abnormal carbohydrate metabolism, has a direct impact on the risk of developing T2D, according to Dr. Anagnostis. It is also reasonable to expect “a synergistic deleterious effect” from PCOS and obesity on adverse changes in glucose metabolism that lead to T2D.
Even though rates of obesity among women with PCOS reach 80% in some studies, Dr. Anagnostis attempted to disentangle the relationship between obesity, PCOS, and risk of T2D using a large set of data drawn from a comprehensive search of published studies.
After screening with predefined criteria, 12 studies provided data on 224,284 women, of whom 45,361 had PCOS and 5,717 had T2D. Not least of the criteria for inclusion in this analysis, all studies stratified women as obese, defined as a body mass index (BMI) greater than 30 kg/m2, or nonobese, he reported at the annual meeting of the Endocrine Society.
Diabetes risk tripled in PCOS
When compared without regard to BMI, the relative risk of having T2D among those with PCOS relative to those without this condition was more than three times greater (RR 3.13; P < .001). When women with PCOS were stratified for BMI, obesity was associated with a more than fourfold increased risk relative to controls without PCOS (RR, 4.06; P < .001).
In women who were nonobese, the risk of T2D was numerically higher for those with PCOS than those without (RR, 2.68), but it was only a trend with a large confidence interval (95% confidence interval, 0.97-7.49).
Among women with PCOS, those who were obese also had a more than fourfold and highly significant increased risk of T2D relative to those who were not obese (RR, 4.20; P < .001).
The message from these data is that obesity is a major and potentially modifiable risk factor for diabetes in women with PCOS, according to Dr. Anagnostis.
He said these data provide the basis for recommending weight loss specifically for managing this common PCOS comorbidity.
Almost the same relative risk of diabetes was derived from an analysis of a women’s health database published 2 years ago in Diabetes Care. In that study with 1,916 person-years of follow-up, the hazard ratio for T2D was also more than three times greater (HR, 3.23; P < .001) for those with PCOS relative to those without the syndrome.
However, normal BMI did not eliminate risk of developing diabetes in this study. Rather, the relative risk of T2D in women with PCOS was higher in those of normal weight, compared with those who were obese (HR, 4.68 vs. 2.36; P < .005). The investigators recommend screening all women with PCOS at least every 3 years with more frequent screening in those with risk factors.
PCOS complexity challenges simple conclusions
The complexity of disturbed metabolic pathways in patients with PCOS and obesity might explain some of the difficulty in unraveling the relationship between these two disease states and diabetes risk. In one recent review, it was suggested that obesity and PCOS share interrelated adverse effects on glucose metabolism. As a result, these associations are “more complex than a simple cause-and-effect process.” the authors of that article concluded.
Furthermore, in their examination of metabolic pathways, genetic susceptibility, and behavioral factors that might link PCOS, weight gain, and T2D, the authors did not ignore the psychological impact of PCOS in causing obesity and, as a byproduct, diabetes. These psychological factors might be relevant to treatment.
For example, depression and stress “might hamper ongoing attempts at lifestyle change and therefore effective weight loss” in at least some women, they cautioned.
However, in encouraging weight loss in overweight women with PCOS, the debate about cause of T2D might be moot in practical terms, according to Michael Dansinger, MD, founding director of the diabetes reversal program at Tufts Medical Center, Boston.
“Reducing excess body fat reduces the risk of type 2 diabetes,” Dr. Dansinger said in an interview. “Since women with obesity and PCOS are clearly at risk for future type 2 diabetes, that’s another reason to lose excess body fat through healthy eating and exercise.”
Dr. Anagnostis and Dr. Dansinger reported no relevant conflicts of interest.
FROM ENDO 2021
How long is the second stage of labor in women delivering twins?
, researchers say.

Although the analysis found statistically significant differences in second-stage labor lengths for twin and singleton deliveries, “ultimately I think the value in this is seeing that it is not much different,” said Nathan Fox, MD, a maternal-fetal medicine specialist who has studied twin pregnancies and delivery of twins.
Knowledge gap
While most twin births occur by cesarean delivery, vaginal delivery is a preferred method for diamniotic twins with the first twin in vertex presentation, wrote study author Gabriel Levin, MD, and colleagues. Prior studies, however, have not clearly established the duration of the second stage of labor in twin deliveries – that is, the time from 10-cm dilation until delivery of the first twin, they said.
Knowing “the parameters of the normal second stage of labor” for twin deliveries may help guide clinical practice and possibly avoid unnecessary operative deliveries, the researchers wrote.
To establish normal ranges for the second stage of labor in twin deliveries, Dr. Levin, of the department of obstetrics and gynecology at Hadassah-Hebrew University Medical Center, Jerusalem, and coauthors conducted a retrospective cohort study. They analyzed data from three large academic hospitals in Israel between 2011 and June 2020 and assessed the length of the second stage of labor by obstetric history and clinical characteristics.
The researchers included data from women who delivered the first of diamniotic twins spontaneously or delivered a singleton spontaneously. The researchers excluded twin pregnancies with fetal demise of one or both twins, structural anomaly or chromosomal abnormality, monochorionic complications, and first twin in a nonvertex presentation. They did not consider the delivery mode of the second twin.
The study included 2,009 twin deliveries and 135,217 singleton deliveries. Of the women with twin deliveries, 32.6% were nulliparous (that is, no previous vaginal deliveries), 61.5% were parous (one to four previous vaginal deliveries, and no cesarean deliveries), and 5.9% were grand multiparous (at least five previous deliveries).
Of the women with singleton deliveries, 29% were nulliparous.
For nulliparous women delivering twins, the median length of the second stage was 1 hour 27 minutes (interquartile range, 40-147 minutes), and the 95th percentile was 3 hours 51 minutes.
For parous women delivering twins, the median length of the second stage was 18 minutes (interquartile range, 8-36 minutes), and the 95th percentile was 1 hour 56 minutes.
For grand multiparous women, the median length of the second stage was 10 minutes.
In a multivariable analysis, epidural anesthesia and induction of labor were independently associated with increased length of the second stage of labor.
Second-stage labor longer than the 95th percentile based on parity and epidural status was associated with approximately twice the risk of admission to the neonatal intensive care unit (35.4% vs. 16.4%) and need for phototherapy, the researchers reported.
Compared with singleton deliveries, the second stage was longer in twin deliveries. Among nulliparous patients, the median length of the second stage of labor was 1 hour 18 minutes for singleton deliveries, versus 1 hour 30 minutes for twin deliveries. Among parous patients, the median length of the second stage was 19 minutes for twin deliveries, compared with 10 minutes for singleton deliveries.
The study was conducted in Israel, which may limit its generalizability, the authors noted. In addition, the researchers lacked data about maternal morbidity and had limited data about neonatal morbidity. “The exact time that the woman became 10-cm dilated cannot be known, a problem inherent to all such studies,” and cases where doctors artificially ended labor with operative delivery were not included, the researchers added. “More research is needed to determine at what point, if any, intervention is warranted to shorten the second stage in patients delivering twins,” Dr. Levin and colleagues wrote.
Providing a framework
“We always get more concerned if the labor process is happening in a way that is unusual,” and this study provides data that can provide a framework for that thought process, said Dr. Fox, who was not involved in the study.
The results demonstrate that the second stage of labor for twin deliveries may take a long time and “that is not necessarily a bad thing,” said Dr. Fox, clinical professor of obstetrics and gynecology and maternal and fetal medicine at the Icahn School of Medicine at Mount Sinai in New York.
For women having their first child, the second stage of labor tends to take much longer than it does for women who have had children. “That is well known for singletons, and everyone assumes it is the same for twins,” but this study quantifies the durations for twins, he said. “That is valuable, and it is also helpful for women to know what to expect.”
A study coauthor disclosed financial ties to PregnanTech and Anthem AI, and money paid to their institution from New Sight. Dr. Fox works at Maternal Fetal Medicine Associates and Carnegie Imaging for Women in New York and is the creator and host of the Healthful Woman Podcast. He had no relevant financial disclosures.
, researchers say.
Although the analysis found statistically significant differences in second-stage labor lengths for twin and singleton deliveries, “ultimately I think the value in this is seeing that it is not much different,” said Nathan Fox, MD, a maternal-fetal medicine specialist who has studied twin pregnancies and delivery of twins.
Knowledge gap
While most twin births occur by cesarean delivery, vaginal delivery is a preferred method for diamniotic twins with the first twin in vertex presentation, wrote study author Gabriel Levin, MD, and colleagues. Prior studies, however, have not clearly established the duration of the second stage of labor in twin deliveries – that is, the time from 10-cm dilation until delivery of the first twin, they said.
Knowing “the parameters of the normal second stage of labor” for twin deliveries may help guide clinical practice and possibly avoid unnecessary operative deliveries, the researchers wrote.
To establish normal ranges for the second stage of labor in twin deliveries, Dr. Levin, of the department of obstetrics and gynecology at Hadassah-Hebrew University Medical Center, Jerusalem, and coauthors conducted a retrospective cohort study. They analyzed data from three large academic hospitals in Israel between 2011 and June 2020 and assessed the length of the second stage of labor by obstetric history and clinical characteristics.
The researchers included data from women who delivered the first of diamniotic twins spontaneously or delivered a singleton spontaneously. The researchers excluded twin pregnancies with fetal demise of one or both twins, structural anomaly or chromosomal abnormality, monochorionic complications, and first twin in a nonvertex presentation. They did not consider the delivery mode of the second twin.
The study included 2,009 twin deliveries and 135,217 singleton deliveries. Of the women with twin deliveries, 32.6% were nulliparous (that is, no previous vaginal deliveries), 61.5% were parous (one to four previous vaginal deliveries, and no cesarean deliveries), and 5.9% were grand multiparous (at least five previous deliveries).
Of the women with singleton deliveries, 29% were nulliparous.
For nulliparous women delivering twins, the median length of the second stage was 1 hour 27 minutes (interquartile range, 40-147 minutes), and the 95th percentile was 3 hours 51 minutes.
For parous women delivering twins, the median length of the second stage was 18 minutes (interquartile range, 8-36 minutes), and the 95th percentile was 1 hour 56 minutes.
For grand multiparous women, the median length of the second stage was 10 minutes.
In a multivariable analysis, epidural anesthesia and induction of labor were independently associated with increased length of the second stage of labor.
Second-stage labor longer than the 95th percentile based on parity and epidural status was associated with approximately twice the risk of admission to the neonatal intensive care unit (35.4% vs. 16.4%) and need for phototherapy, the researchers reported.
Compared with singleton deliveries, the second stage was longer in twin deliveries. Among nulliparous patients, the median length of the second stage of labor was 1 hour 18 minutes for singleton deliveries, versus 1 hour 30 minutes for twin deliveries. Among parous patients, the median length of the second stage was 19 minutes for twin deliveries, compared with 10 minutes for singleton deliveries.
The study was conducted in Israel, which may limit its generalizability, the authors noted. In addition, the researchers lacked data about maternal morbidity and had limited data about neonatal morbidity. “The exact time that the woman became 10-cm dilated cannot be known, a problem inherent to all such studies,” and cases where doctors artificially ended labor with operative delivery were not included, the researchers added. “More research is needed to determine at what point, if any, intervention is warranted to shorten the second stage in patients delivering twins,” Dr. Levin and colleagues wrote.
Providing a framework
“We always get more concerned if the labor process is happening in a way that is unusual,” and this study provides data that can provide a framework for that thought process, said Dr. Fox, who was not involved in the study.
The results demonstrate that the second stage of labor for twin deliveries may take a long time and “that is not necessarily a bad thing,” said Dr. Fox, clinical professor of obstetrics and gynecology and maternal and fetal medicine at the Icahn School of Medicine at Mount Sinai in New York.
For women having their first child, the second stage of labor tends to take much longer than it does for women who have had children. “That is well known for singletons, and everyone assumes it is the same for twins,” but this study quantifies the durations for twins, he said. “That is valuable, and it is also helpful for women to know what to expect.”
A study coauthor disclosed financial ties to PregnanTech and Anthem AI, and money paid to their institution from New Sight. Dr. Fox works at Maternal Fetal Medicine Associates and Carnegie Imaging for Women in New York and is the creator and host of the Healthful Woman Podcast. He had no relevant financial disclosures.
FROM OBSTETRICS AND GYNECOLOGY
High-intensity interval training cuts cardiometabolic risks in women with PCOS
High-intensity interval training (HIIT) was better than moderate-intensity continuous training (MICT) for improving several measures of cardiometabolic health in women with polycystic ovary syndrome (PCOS) in a prospective, randomized, single-center study with 27 women.

After 12 weeks on a supervised exercise regimen, the women with PCOS who followed the HIIT program had significantly better improvements in aerobic capacity, insulin sensitivity, and level of sex hormone–binding globulin, Rhiannon K. Patten, MSc, said at the annual meeting of the Endocrine Society.
“HIIT can offer superior improvements in health outcomes, and should be considered as an effective tool to reduce cardiometabolic risk in women with PCOS,” concluded Ms. Patten, a researcher in the Institute for Health and Sport at Victoria University in Melbourne in her presentation (Abstract OR10-1).
“The changes we see [after 12 weeks on the HIIT regimen] seem to occur despite no change in body mass index, so rather than focus on weight loss we encourage participants to focus on the health improvements that seem to be greater with HIIT. We actively encourage the HIIT protocol right now,” she said.
Both regimens use a stationary cycle ergometer. In the HIIT protocol patients twice weekly pedal through 12 1-minute intervals at a heart rate of 90%-100% maximum, interspersed with 1 minute rest intervals. On a third day per week, patients pedal to a heart rate of 90%-95% maximum for 6-8 intervals maintained for 2 minutes and interspersed with rest intervals of 2 minutes. The MICT regimen used as a comparator has participants pedal to 60%-70% of their maximum heart rate continuously for 50 minutes 3 days weekly.
HIIT saves time
“These findings are relevant to clinical practice, because they demonstrate that HIIT is effective in women with PCOS. Reducing the time devoted to exercise to achieve fitness goals is attractive to patients. The reduced time to achieve training benefits with HIIT should improve patient compliance,” commented Andrea Dunaif, MD, professor and chief of the division of endocrinology, diabetes, and bone disease of the Mount Sinai Health System in New York, who was not involved with the study.
The overall weekly exercise time on the MICT regimen, 150 minutes, halves down to 75 minutes a week in the HIIT program. Guideline recommendations released in 2018 by the International PCOS Network recommended these as acceptable alternative exercise strategies. Ms. Patten and her associates sought to determine whether one strategy surpassed the other, the first time this has been examined in women with PCOS, she said.
They randomized 27 sedentary women 18-45 years old with a body mass index (BMI) above 25 kg/m2 and diagnosed with PCOS by the Rotterdam criteria to a 12-week supervised exercise program on either the HIIT or MICT protocol. Their average BMI at entry was 36-37 kg/m2. The study excluded women who smoked, were pregnant, had an illness or injury that would prevent exercise, or were on an oral contraceptive or insulin-sensitizing medication.
At the end of 12 weeks, neither group had a significant change in average weight or BMI, and waist circumference dropped by an average of just over 2 cm in both treatment groups. Lean mass increased by a mean 1 kg in the HIIT group, a significant change, compared with a nonsignificant 0.3 kg average increase in the MICT group.
Increased aerobic capacity ‘partially explains’ improved insulin sensitivity
Aerobic capacity, measured as peak oxygen consumption (VO2peak), increased by an average 5.7 mL/kg per min among the HIIT patients, significantly more than the mean 3.2 mL/kg per min increase among those in the MICT program.
The insulin sensitivity index rose by a significant, relative 35% among the HIIT patients, but barely budged in the MICT group. Fasting glucose fell significantly and the glucose infusion rate increased significantly among the women who performed HIIT, but again showed little change among those doing MICT.
Analysis showed a significant link between the increase in VO2peak and the increase in insulin sensitivity among the women engaged in HIIT, Ms. Patten reported. The improvement in the insulin sensitivity index was “partially explained” by the increase in VO2peak, she said.
Assessment of hormone levels showed a significant increase in sex hormone–binding globulin in the HIIT patients while those in the MICT group showed a small decline in this level. The free androgen index fell by a relative 39% on average in the HIIT group, a significant drop, but decreased by a much smaller and not significant amount among the women who did MICT. The women who performed HIIT also showed a significant drop in their free testosterone level, a change not seen with MICT.
Women who performed the HIIT protocol also had a significant improvement in their menstrual cyclicity, and significant improvements in depression, stress, and anxiety, Ms Patten reported. She next plans to do longer follow-up on study participants, out to 6 and 12 months after the end of the exercise protocol.
“Overall, the findings suggest that HIIT is superior to MICT for improving fitness and insulin sensitivity in the short term. Results from a number of studies in individuals without PCOS suggest that HIIT is superior to MICT for improving fitness short term,” commented Dr. Dunaif. “This study makes an important contribution by directly investigating the impact of training intensity in women with PCOS. Larger studies will be needed before the superiority of HIIT is established for women with PCOS, and study durations of at least several months will be needed to assess the impact on reproductive outcomes such as ovulation,” she said in an interview. She also called for assessing the effects of HIIT in more diverse populations of women with PCOS.
Ms. Patten had no disclosures. Dr. Dunaif has been a consultant to Equator Therapeutics, Fractyl Laboratories, and Globe Life Sciences.
High-intensity interval training (HIIT) was better than moderate-intensity continuous training (MICT) for improving several measures of cardiometabolic health in women with polycystic ovary syndrome (PCOS) in a prospective, randomized, single-center study with 27 women.
After 12 weeks on a supervised exercise regimen, the women with PCOS who followed the HIIT program had significantly better improvements in aerobic capacity, insulin sensitivity, and level of sex hormone–binding globulin, Rhiannon K. Patten, MSc, said at the annual meeting of the Endocrine Society.
“HIIT can offer superior improvements in health outcomes, and should be considered as an effective tool to reduce cardiometabolic risk in women with PCOS,” concluded Ms. Patten, a researcher in the Institute for Health and Sport at Victoria University in Melbourne in her presentation (Abstract OR10-1).
“The changes we see [after 12 weeks on the HIIT regimen] seem to occur despite no change in body mass index, so rather than focus on weight loss we encourage participants to focus on the health improvements that seem to be greater with HIIT. We actively encourage the HIIT protocol right now,” she said.
Both regimens use a stationary cycle ergometer. In the HIIT protocol patients twice weekly pedal through 12 1-minute intervals at a heart rate of 90%-100% maximum, interspersed with 1 minute rest intervals. On a third day per week, patients pedal to a heart rate of 90%-95% maximum for 6-8 intervals maintained for 2 minutes and interspersed with rest intervals of 2 minutes. The MICT regimen used as a comparator has participants pedal to 60%-70% of their maximum heart rate continuously for 50 minutes 3 days weekly.
HIIT saves time
“These findings are relevant to clinical practice, because they demonstrate that HIIT is effective in women with PCOS. Reducing the time devoted to exercise to achieve fitness goals is attractive to patients. The reduced time to achieve training benefits with HIIT should improve patient compliance,” commented Andrea Dunaif, MD, professor and chief of the division of endocrinology, diabetes, and bone disease of the Mount Sinai Health System in New York, who was not involved with the study.
The overall weekly exercise time on the MICT regimen, 150 minutes, halves down to 75 minutes a week in the HIIT program. Guideline recommendations released in 2018 by the International PCOS Network recommended these as acceptable alternative exercise strategies. Ms. Patten and her associates sought to determine whether one strategy surpassed the other, the first time this has been examined in women with PCOS, she said.
They randomized 27 sedentary women 18-45 years old with a body mass index (BMI) above 25 kg/m2 and diagnosed with PCOS by the Rotterdam criteria to a 12-week supervised exercise program on either the HIIT or MICT protocol. Their average BMI at entry was 36-37 kg/m2. The study excluded women who smoked, were pregnant, had an illness or injury that would prevent exercise, or were on an oral contraceptive or insulin-sensitizing medication.
At the end of 12 weeks, neither group had a significant change in average weight or BMI, and waist circumference dropped by an average of just over 2 cm in both treatment groups. Lean mass increased by a mean 1 kg in the HIIT group, a significant change, compared with a nonsignificant 0.3 kg average increase in the MICT group.
Increased aerobic capacity ‘partially explains’ improved insulin sensitivity
Aerobic capacity, measured as peak oxygen consumption (VO2peak), increased by an average 5.7 mL/kg per min among the HIIT patients, significantly more than the mean 3.2 mL/kg per min increase among those in the MICT program.
The insulin sensitivity index rose by a significant, relative 35% among the HIIT patients, but barely budged in the MICT group. Fasting glucose fell significantly and the glucose infusion rate increased significantly among the women who performed HIIT, but again showed little change among those doing MICT.
Analysis showed a significant link between the increase in VO2peak and the increase in insulin sensitivity among the women engaged in HIIT, Ms. Patten reported. The improvement in the insulin sensitivity index was “partially explained” by the increase in VO2peak, she said.
Assessment of hormone levels showed a significant increase in sex hormone–binding globulin in the HIIT patients while those in the MICT group showed a small decline in this level. The free androgen index fell by a relative 39% on average in the HIIT group, a significant drop, but decreased by a much smaller and not significant amount among the women who did MICT. The women who performed HIIT also showed a significant drop in their free testosterone level, a change not seen with MICT.
Women who performed the HIIT protocol also had a significant improvement in their menstrual cyclicity, and significant improvements in depression, stress, and anxiety, Ms Patten reported. She next plans to do longer follow-up on study participants, out to 6 and 12 months after the end of the exercise protocol.
“Overall, the findings suggest that HIIT is superior to MICT for improving fitness and insulin sensitivity in the short term. Results from a number of studies in individuals without PCOS suggest that HIIT is superior to MICT for improving fitness short term,” commented Dr. Dunaif. “This study makes an important contribution by directly investigating the impact of training intensity in women with PCOS. Larger studies will be needed before the superiority of HIIT is established for women with PCOS, and study durations of at least several months will be needed to assess the impact on reproductive outcomes such as ovulation,” she said in an interview. She also called for assessing the effects of HIIT in more diverse populations of women with PCOS.
Ms. Patten had no disclosures. Dr. Dunaif has been a consultant to Equator Therapeutics, Fractyl Laboratories, and Globe Life Sciences.
FROM ENDO 2021
Women with PCOS at increased risk for COVID-19
Women with polycystic ovary syndrome (PCOS) face an almost 30% increased risk for COVID-19 compared with unaffected women, even after adjusting for cardiometabolic and other related factors, suggests an analysis of United Kingdom primary care data.
“Our research has highlighted that women with PCOS are an often overlooked and potentially high-risk population for contracting COVID-19,” said joint senior author Wiebke Arlt, MD, PhD, director of the Institute of Metabolism and Systems Research at the University of Birmingham (England), in a press release.
“Before the onset of the COVID-19 pandemic, women with PCOS consistently report fragmented care, delayed diagnosis and a perception of poor clinician understanding of their condition,” added co-author Michael W. O’Reilly, MD, PhD, University of Medicine and Health Sciences, Dublin.
“Women suffering from this condition may fear, with some degree of justification, that an enhanced risk of COVID-19 infection will further compromise timely access to health care and serve to increase the sense of disenfranchisement currently experienced by many patients,” he added.
Consequently, “these findings need to be considered when designing public health policy and advice as our understanding of COVID-19 evolves,” noted first author Anuradhaa Subramanian, PhD Student, Institute of Applied Health Research, University of Birmingham.
The research was published by the European Journal of Endocrinology on March 9.
Women with PCOS: A distinct subgroup?
PCOS, which is thought to affect up to 16% of women, is associated with a significantly increased risk for type 2 diabetes, non-alcoholic fatty liver disease, and cardiovascular disease, all which have been linked to more severe COVID-19.
The condition is more prevalent in Black and South Asian women, who also appear to have an increased risk for severe COVID-19 vs. their White counterparts.
However, women and younger people in general have a lower overall risk for severe COVID-19 and mortality compared with older people and men.
Women with PCOS may therefore “represent a distinct subgroup of women at higher than average [on the basis of their sex and age] risk of adverse COVID-19–related outcomes,” the researchers note.
To investigate further, they collated data from The Health Improvement Network primary care database, which includes information from 365 active general practices in the U.K. for the period Jan. 31, 2020, to July 22, 2020.
They identified women with PCOS or a coded diagnosis of polycystic ovaries (PCO), and then for each woman randomly selected four unaffected controls matched for age and general practice location.
They included 21,292 women with PCOS/PCO and 78,310 controls, who had a mean age at study entry of 39.3 years and 39.5 years, respectively. The mean age at diagnosis of PCOS was 27 years, and the mean duration of the condition was 12.4 years.
The crude incidence of COVID-19 was 18.1 per 1000 person-years among women with PCOS vs. 11.9 per 1000 person-years in those without.
Cox regression analysis adjusted for age indicated that women with PCOS faced a significantly increased risk for COVID-19 than those without, at a hazard ratio of 1.51 (P < .001).
Further adjustment for body mass index (BMI) and age reduced the hazard ratio to 1.36 (P = .001).
In the fully adjusted model, which also took into account impaired glucose regulation, androgen excess, anovulation, hypertension, and other PCOS-related factors, the hazard ratio remained significant, at 1.28 (P = .015).
For shielding, balance benefits with impact on mental health
Joint senior author Krishnarajah Nirantharakumar, MD, PhD, also of the University of Birmingham, commented that, despite the increased risks, shielding strategies for COVID-19 need to take into account the impact of PCOS on women’s mental health.
“The risk of mental health problems, including low self-esteem, anxiety, and depression, is significantly higher in women with PCOS,” he said, “and advice on strict adherence to social distancing needs to be tempered by the associated risk of exacerbating these underlying problems.”
Arlt also pointed out that the study only looked at the incidence of COVID-19 infection, rather than outcomes.
“Our study does not provide information on the risk of a severe course of the COVID-19 infection or on the risk of COVID-19–related long-term complications [in women with PCOS], and further research is required,” she concluded.
The study was funded by Health Data Research UK and supported by the Wellcome Trust, the Health Research Board, and the National Institute for Health Research Birmingham Biomedical Research Centre based at the University of Birmingham and University Hospitals Birmingham NHS Foundation Trust. The study authors have disclosed no relevant financial relationships.
A version of this article first appeared on Medscape.com.
‘Reassuring’ data on COVID-19 vaccines in pregnancy
Pregnant women can safely get vaccinated with the Pfizer-BioNTech and Moderna vaccines for COVID-19, surveillance data from the Centers for Disease Control and Prevention suggest.
More than 30,000 women who received these vaccines have reported pregnancies through the CDC’s V-Safe voluntary reporting system, and their rates of complications are not significantly different from those of unvaccinated pregnant women, said Tom Shimabukuro, MD, MPH, MBA, deputy director of the CDC Immunization Safety Office.
“Overall, the data are reassuring with respect to vaccine safety in pregnant women,” he told this news organization.
Dr. Shimabukuro presented the data during a March 1 meeting of the Advisory Committee on Immunization Practices, a group of health experts selected by the Secretary of the U.S. Department of Health & Human Services.
The CDC has included pregnancy along with other underlying conditions that qualify people to be offered vaccines in the third priority tier (Phase 1c).
“There is evidence that pregnant women who get COVID-19 are at increased risk of severe illness and complications from severe illness,” Dr. Shimabukuro explained. “And there is also evidence that pregnant persons who get COVID-19 may be at increased risk for adverse pregnancy outcomes.”
The American College of Obstetrics and Gynecology recommends that “COVID-19 vaccines should not be withheld from pregnant individuals.”
By contrast, the World Health Organization recommends the vaccines only for those pregnant women who are “at high risk of exposure to SARS-CoV-2 (for example, health workers) or who have comorbidities which add to their risk of severe disease.”
Not enough information was available from the pivotal trials of the Moderna and Pfizer vaccines to assess risk in pregnant women, according to these manufacturers. Pfizer has announced a follow-up trial of its vaccine in healthy pregnant women.
Analyzing surveillance data
To better assess whether the Pfizer or Moderna vaccines cause problems in pregnancy or childbirth, Dr. Shimabukuro and colleagues analyzed data from V-Safe and the Vaccine Adverse Event Reporting System (VAERS).
The CDC encourages providers to inform people they vaccinate about the V-Safe program. Participants can voluntarily enter their data through a website, and may receive follow-up text messages and phone calls from the CDC asking for additional information at various times after vaccination. It is not a systematic survey, and the sample is not necessarily representative of everyone who gets the vaccine, Dr. Shimabukuro noted.
At the time of the study, V-Safe recorded 55,220,364 reports from people who received at least one dose of the Pfizer or Moderna vaccine through Feb. 16. These included 30,494 pregnancies, of which 16,039 were in women who received the Pfizer vaccine and 14,455 in women who received the Moderna vaccine.
Analyzing data collected through Jan. 13, 2021, the researchers found that both local and systemic reactions were similar between pregnant and nonpregnant women aged 16-54 years.
Most women reported pain, and some reported swelling, redness, and itching at the injection site. Of systemic reactions, fatigue was the most common, followed by headache, myalgia, chills, nausea, and fever. The systemic reactions were more common with the second Pfizer dose; fatigue affected a majority of both pregnant and nonpregnant women. Data on the second Moderna dose were not available.
The CDC enrolled 1,815 pregnant women for additional follow-up, among whom there were 275 completed pregnancies and 232 live births.
Rates of outcomes “of interest” were no higher among these women than in the general population. 
In contrast to V-Safe, data from VAERS, comanaged by the CDC and U.S. Food and Drug Administration, are from spontaneous reports of adverse events. The sources for those reports are varied. “That could be the health care provider,” Dr. Shimabukuro said. “That could be the patient themselves. It could be a caregiver for children.”
Just 154 VAERS reports through Feb. 16 concerned pregnant women, and of these, only 42 (27%) were for pregnancy-specific conditions, with the other 73% representing the types of adverse events reported for the general population of vaccinated people, such as headache and fatigue.
Of the 42 pregnancy-related events, there were 29 spontaneous abortions or miscarriages, with the remainder divided among 10 other pregnancy and neonatal conditions.
“When we looked at those outcomes and we compared the reporting rates, based on known background rates of these conditions, we did not see anything unexpected or concerning with respect to pregnancy or neonatal-specific conditions,” Dr. Shimabukuro said about the VAERS data.
The CDC did not collect data on fertility. “We’ve done a lot of work with other vaccines,” said Dr. Shimabukuro. “And just from a biological basis, we don’t have any evidence that vaccination, just in general, causes fertility problems.”
Also, Dr. Shimabukuro noted that the COVID-19 vaccine made by Janssen/Johnson & Johnson did not receive emergency authorization from the FDA in time to be included in the current report, but is being tracked for future reports.
Vaccination could benefit infants
In addition to the new safety data, experts continue to remind clinicians and the public that vaccination during pregnancy could benefit offspring. The unborn babies of pregnant women who receive the COVID-19 vaccine could be protected from the virus for the first several months of their lives, said White House COVID-19 czar Anthony Fauci, MD, at a briefing on March 10.
“We’ve seen this with many other vaccines,” Dr. Fauci said. “That’s a very good way you can get protection for the mother during pregnancy and also a transfer of protection for the infant, which will last a few months following the birth.”
Dr. Fauci also noted that the same vaccine platform used in Johnson & Johnson’s COVID-19 vaccine was successfully used for Ebola in pregnant women in Africa.
Dr. Shimabukuro has reported no relevant financial relationships.
Lindsay Kalter contributed to the reporting for this story.
A version of this article first appeared on Medscape.com.
Pregnant women can safely get vaccinated with the Pfizer-BioNTech and Moderna vaccines for COVID-19, surveillance data from the Centers for Disease Control and Prevention suggest.
More than 30,000 women who received these vaccines have reported pregnancies through the CDC’s V-Safe voluntary reporting system, and their rates of complications are not significantly different from those of unvaccinated pregnant women, said Tom Shimabukuro, MD, MPH, MBA, deputy director of the CDC Immunization Safety Office.
“Overall, the data are reassuring with respect to vaccine safety in pregnant women,” he told this news organization.
Dr. Shimabukuro presented the data during a March 1 meeting of the Advisory Committee on Immunization Practices, a group of health experts selected by the Secretary of the U.S. Department of Health & Human Services.
The CDC has included pregnancy along with other underlying conditions that qualify people to be offered vaccines in the third priority tier (Phase 1c).
“There is evidence that pregnant women who get COVID-19 are at increased risk of severe illness and complications from severe illness,” Dr. Shimabukuro explained. “And there is also evidence that pregnant persons who get COVID-19 may be at increased risk for adverse pregnancy outcomes.”
The American College of Obstetrics and Gynecology recommends that “COVID-19 vaccines should not be withheld from pregnant individuals.”
By contrast, the World Health Organization recommends the vaccines only for those pregnant women who are “at high risk of exposure to SARS-CoV-2 (for example, health workers) or who have comorbidities which add to their risk of severe disease.”
Not enough information was available from the pivotal trials of the Moderna and Pfizer vaccines to assess risk in pregnant women, according to these manufacturers. Pfizer has announced a follow-up trial of its vaccine in healthy pregnant women.
Analyzing surveillance data
To better assess whether the Pfizer or Moderna vaccines cause problems in pregnancy or childbirth, Dr. Shimabukuro and colleagues analyzed data from V-Safe and the Vaccine Adverse Event Reporting System (VAERS).
The CDC encourages providers to inform people they vaccinate about the V-Safe program. Participants can voluntarily enter their data through a website, and may receive follow-up text messages and phone calls from the CDC asking for additional information at various times after vaccination. It is not a systematic survey, and the sample is not necessarily representative of everyone who gets the vaccine, Dr. Shimabukuro noted.
At the time of the study, V-Safe recorded 55,220,364 reports from people who received at least one dose of the Pfizer or Moderna vaccine through Feb. 16. These included 30,494 pregnancies, of which 16,039 were in women who received the Pfizer vaccine and 14,455 in women who received the Moderna vaccine.
Analyzing data collected through Jan. 13, 2021, the researchers found that both local and systemic reactions were similar between pregnant and nonpregnant women aged 16-54 years.
Most women reported pain, and some reported swelling, redness, and itching at the injection site. Of systemic reactions, fatigue was the most common, followed by headache, myalgia, chills, nausea, and fever. The systemic reactions were more common with the second Pfizer dose; fatigue affected a majority of both pregnant and nonpregnant women. Data on the second Moderna dose were not available.
The CDC enrolled 1,815 pregnant women for additional follow-up, among whom there were 275 completed pregnancies and 232 live births.
Rates of outcomes “of interest” were no higher among these women than in the general population.
In contrast to V-Safe, data from VAERS, comanaged by the CDC and U.S. Food and Drug Administration, are from spontaneous reports of adverse events. The sources for those reports are varied. “That could be the health care provider,” Dr. Shimabukuro said. “That could be the patient themselves. It could be a caregiver for children.”
Just 154 VAERS reports through Feb. 16 concerned pregnant women, and of these, only 42 (27%) were for pregnancy-specific conditions, with the other 73% representing the types of adverse events reported for the general population of vaccinated people, such as headache and fatigue.
Of the 42 pregnancy-related events, there were 29 spontaneous abortions or miscarriages, with the remainder divided among 10 other pregnancy and neonatal conditions.
“When we looked at those outcomes and we compared the reporting rates, based on known background rates of these conditions, we did not see anything unexpected or concerning with respect to pregnancy or neonatal-specific conditions,” Dr. Shimabukuro said about the VAERS data.
The CDC did not collect data on fertility. “We’ve done a lot of work with other vaccines,” said Dr. Shimabukuro. “And just from a biological basis, we don’t have any evidence that vaccination, just in general, causes fertility problems.”
Also, Dr. Shimabukuro noted that the COVID-19 vaccine made by Janssen/Johnson & Johnson did not receive emergency authorization from the FDA in time to be included in the current report, but is being tracked for future reports.
Vaccination could benefit infants
In addition to the new safety data, experts continue to remind clinicians and the public that vaccination during pregnancy could benefit offspring. The unborn babies of pregnant women who receive the COVID-19 vaccine could be protected from the virus for the first several months of their lives, said White House COVID-19 czar Anthony Fauci, MD, at a briefing on March 10.
“We’ve seen this with many other vaccines,” Dr. Fauci said. “That’s a very good way you can get protection for the mother during pregnancy and also a transfer of protection for the infant, which will last a few months following the birth.”
Dr. Fauci also noted that the same vaccine platform used in Johnson & Johnson’s COVID-19 vaccine was successfully used for Ebola in pregnant women in Africa.
Dr. Shimabukuro has reported no relevant financial relationships.
Lindsay Kalter contributed to the reporting for this story.
A version of this article first appeared on Medscape.com.
Most breast cancer screening centers not following guidelines
, say researchers reporting on a new analysis.
They assessed 606 centers and report that, among the centers that recommended a starting age for screening mammography, nearly 90% advised women to begin screening at age 40 years and to continue annually.
This contrasts with the current recommendations from the U.S. Preventive Services Task Force (USPSTF) on mammography screening, which stipulate starting at age 50 years and continuing every 2 years.
The new analysis was published online in JAMA Internal Medicine.
This may be doing “more harm than good,” warn the authors of an accompanying editorial.
“The recommendation for annual mammography in women younger than 50 years is, at best, confusing for patients and is likely to conflict with advice from their primary care physicians, which can create tension,” write Anand R. Habib, MD, MPhil; Deborah Grady, MD; and Rita F. Redberg, MD, all from the University of California, San Francisco.
“This recommendation can also produce unnecessary testing, invasive procedures, overdiagnosis, and anxiety among women who receive screening,” they write.
“Breast cancer centers with clear financial benefits from increased mammography rates may wish to reconsider offering recommendations that create greater referral volume but conflict with unbiased evidence-based USPSTF guidelines and have the potential to increase harms among women,” the editorialists add.
The age at which to start mammography screening has long been a contentious issue, with some experts and medical societies arguing that it should begin at 40.
The American College of Radiology, the Society of Breast Imaging, and the American Society of Breast Surgeons recommend that women start annual mammography screening at age 40.
The American Cancer Society’s guidelines recommend an initial screening mammogram between ages 45 and 55 and after that, screening every 1-2 years.
One expert who argues for starting at 40 years is Laurie Margolies, MD, chief of breast imaging, Mount Sinai Health System, and professor of radiology, Icahn School of Medicine at Mount Sinai, New York.
In a statement, she noted that 17% of all breast cancers are diagnosed in women in their 40s and that the majority of these women are not considered to be at high risk of developing the disease.
“Our own Mount Sinai research has shown that women with screen-detected breast cancers are less likely to need a mastectomy and are less likely to require chemotherapy or axillary node dissection,” Dr. Margolies said.
“Additionally, women who get regular breast cancer screening have a 47% lower risk of breast cancer death within 20 years of diagnosis than those not regularly screened. Skipping a mammogram can have lethal consequences,” she said.
Details of the analysis
The analysis of recommendations by breast cancer centers regarding screening mammography was carried out by Jennifer L. Marti, MD, from Weill Cornell Medicine, New York, and colleagues.
They examined 606 centers and found that 487 (80.4%) offered screening recommendations on their public websites.
Of 431 centers that recommended a starting age, 376 centers (87.2%) advised women to begin screening at age 40 years; 35 centers (8.1%) recommended beginning at age 45 years; and the remaining 20 centers (4.6%) recommended that screening begin at age 50 years.
A total of 429 centers recommended both a starting age and a screening interval. Of this group, 347 centers (80.9%) advised that annual screening begin at age 40 years. Only 16 centers (3.3%) recommended biennial mammography (as per the USPSTF guidelines). Almost three-quarters (72.7%, n = 354) recommended annual screening; 59 centers (12.1%) recommended annual or biennial screening; and 58 centers (11.9%) recommended a discussion with a physician.
The authors note that there were differences between centers according to National Cancer Institute designation, but these differences did not reach statistical significance.
Dr. Marti and coauthors, Dr. Habib and coauthors, and Dr. Margolies have disclosed no relevant financial relationships.
A version of this article first appeared on Medscape.com.