User login
Is Hospital Discharge the Rube Goldberg Machine of Academic Internal Medicine?
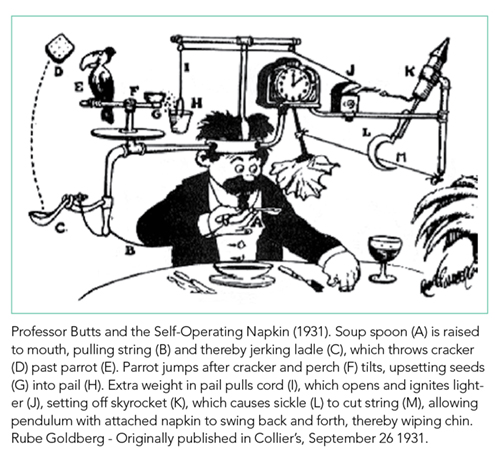
One of the least taught yet most complicated tasks confronting new trainees is the bewildering process of discharging a patient. On an internal medicine service, this process can often resemble a Rube Goldberg machine, in which a “simple” task is accomplished through a series of interconnected, almost comically convoluted, yet separate steps that are triggered one after another and must be executed perfectly in sequence for success. It seems easy at first; just tap out a few sentences in the discharge paperwork, do a quick medication reconciliation, and a click of a button later, voila! The patient magically falls off the list and is on their merry way home. In reality, it only takes one wrench thrown into the Rube Goldberg machine to take down the whole operation. Much to the chagrin of internal medicine interns across the country, residents quickly learn that discharge planning is usually far from straightforward and that a myriad of obstacles (often dynamic and frustratingly unpredictable) can stand in the way of a successful discharge.
While some surgical services can streamline discharge processes to target defined lengths of stay based on a particular diagnosis, general medicine patients tend to have greater numbers of comorbid conditions, complex hospital courses, and wider variation in access to posthospital healthcare. In addition, there is very little formal instruction in transitions of care, and most residents identify direct patient care (learning by doing) as the primary mode of education.1,2 Struggling through the process of finding an appropriate placement, ensuring adequate outpatient follow-up, and untangling a jumbled mess of a medication reconciliation is often the only way that housestaff learn the Sisyphean task of transitioning care out of the hospital. The unpredictability and intensity of patient care adds to the ever growing list of competing demands on the time and attention of residents. Attendings face pressure on all sides to not only provide exemplary patient care and an educational experience but also to optimize hospital throughput by discharging patients as soon as possible (and ideally before noon). No wonder that the discharge process can threaten to unravel at any time, with delays and complications in discharge metamorphosing into increased length of stay (LOS), poorer outcomes, and increased 30-day readmission rates. As on-the-ground providers, what realities do we face when challenging ourselves to discharge patients before noon, and what practical changes in our workflow can we make to reach this goal?
In this month’s Journal of Hospital Medicine, Zoucha et al. examine these questions in real time by identifying barriers preventing both “definite” and “possible” discharges at three representative time points over the course of randomly chosen weekdays. They surveyed both housestaff and attendings at five academic hospitals across the United States, and the majority of patients were cared for on teaching services.3 Reflecting the inherent differences in workflow between teaching and nonteaching services, delays in definite discharges on teaching services were most often hindered by completing rounds and the need to staff the patient with the attending, whereas nonresident services identified other patient-care-related (both urgent and nonurgent) issues to be the culprits. Late-afternoon discharges were delayed on teaching services due to outstanding paperwork and follow-up arrangements, both of which most senior residents are keenly aware of and make their best effort to complete ahead of time. Patients designated as “possible” discharges were awaiting clinical improvement and resolution of disposition issues dependent on social work and safe placement, which reasonably seemed independent of service type. These descriptive findings suggest that nonresident services are more efficient than resident teams, and we are keen to identify novel solutions, such as dedicated discharge coordinators,4 to facilitate the discharge process on resident teams without detracting from the educational value of the rotation.
Zoucha et al. also found that factors beyond our control (having a lower daily census, attending on a nonresident service) were significantly associated with both earlier discharge order entry times and the actual time of patient discharge.3 While it is tempting to foist the entirety of the blame on extrinsic factors such as discharge placement and insurance issues, the reality is there might be some workflow changes that could expedite the discharge process. The authors are correct to emphasize that rounding style, in which discharges are prioritized to be seen first, is a behavior modification worth targeting. The percentage of teams that routinely see discharges first is not well studied, as other factors, such as clinically unstable patients, new admissions from overnight, and even mundane characteristics such as geographic location in the hospital, can also compete for prioritization in rounding order. Given the authors’ findings, we are eager to see further work in this area as prioritization of discharges during rounds could conceivably be studied within the context of a randomized controlled trial. Other innovations in rounding styles such as rounding-in-flow5 (in which all tasks are completed for a single patient before rounding on the next patient) can also significantly reduce the time to discharge order placement.
With help from the Penn Medicine Center for Health Care Innovation, we are actively studying bottlenecks in the discharge process by developing an interactive platform focused on delivering real-time information to all members of the healthcare team. Rapid rounds are held every morning with the attending physician, floor nursing leadership, physical therapy, social worker, and case management to quickly identify pending tasks, anticipated disposition, and a target date of discharge. Efficiency is key, as each team is limited to approximately 5-10 minutes. Previous studies (mostly pre–post studies) have shown that this simple intervention significantly reduced LOS,6,7 increased rates of discharge before noon,8 and was improved by electronic tracking tools.9 Our multidisciplinary rounds are unique in that information is then entered into an intuitive, web-based platform, which allows consolidation and analysis that permits generation of real-time statistics. By standardizing the discharge planning process, we hope to streamline a previously fragmented process and maximize the efficiency of hospital resource utilization.
Ultimately, high-quality care of complex patients on internal medicine services from admission to discharge requires hard work, smart utilization of resources, and a little bit of luck. There may not be a secret ingredient that guarantees perfectly efficient discharges 100% of the time, but this study inspires us to ponder additional approaches to this longstanding problem. The authors are to be congratulated for a rigorous study that illuminates where we as healthcare providers are able to realistically intervene to expedite the discharge process. First, having a lower census cap may not be possible in this era of maximal hospital usage, but this work suggests that thoughtful management of time on rounds may be a way to address the underlying problem. Secondly, the superior efficiency of nonteaching services may merely reflect the increased experience of the providers, and a realistic solution could be to implement a formal curriculum to educate housestaff about the discharge process, which would simultaneously address residency competency standards for transitions of care. Finally, the role of innovative informatics tools will surely open further avenues of investigation, as we continually evolve in response to intensifying standards of modern, efficient healthcare delivery in the 21st century. It may not be possible to eliminate the complexity from this particular Rube Goldberg machine, but taking the steps above may allow us to implement as many fail-safes as we can.
Disclosures
The authors have nothing to disclose.
1. Young E, Stickrath C, McNulty M, et al. Residents’ exposure to educational experiences in facilitating hospital discharges. J Grad Med Educ. 2017;9(2):184-189. doi: 10.4300/JGME-D-16-00503.1. PubMed
2. Greysen SR, Schiliro D, Curry L, et al. “Learning by doing” - Resident perspectives on developing competency in high-quality discharge care. J Gen Intern Med. 2012;27(9):1188-1194. doi: 10.1007/s11606-012-2094-5. PubMed
3. Zoucha J, Hull M, Keniston A, et al. Barriers to Early Hospital Discharge: A Cross-Sectional Study at Five Academic Hospitals. J Hosp Med. 2018;13(12):816-822. doi: 10.12788/jhm.3074. PubMed
4. Finn KM, Heffner R, Chang Y, et al. Improving the discharge process by embedding a discharge facilitator in a resident team. J Hosp Med. 2011;6(9):494-500. doi: 10.1002/jhm.924. PubMed
5. Calderon AS, Blackmore CC, Williams BL, et al. Transforming ward rounds through rounding-in-flow. J Grad Med Educ. 2014;6(4):750-755. doi: 10.4300/JGME-D-13-00324.1. PubMed
6. Kane M, Rohatgi N, Heidenreich PA, et al. Lean-based redesign of multidisciplinary rounds on general medicine service. J Hosp Med. 2018;13(7):482-485. doi: 10.12788/jhm.2908. PubMed
7. Gonçalves-Bradley D, Lannin N, Clemson L, Cameron ID, Shepperd S. Discharge planning from hospital. Cochrane Database Syst Rev. 2016;1-3. doi: 10.1002/14651858.CD000313.pub5.www.cochranelibrary.com. PubMed
8. Wertheimer B, Jacobs REA, Bailey M, et al. Discharge before noon: an achievable hospital goal. J Hosp Med. 2014;9(4):210-214. doi: 10.1002/jhm.2154. PubMed
9. Meo N, Paul E, Wilson C, Powers J, Magbual M, Miles KM. Introducing an electronic tracking tool into daily multidisciplinary discharge rounds on a medicine service: a quality improvement project to reduce length of stay. BMJ Open Qual. 2018;7(3):e000174. doi: 10.1136/bmjoq-2017-000174. PubMed
One of the least taught yet most complicated tasks confronting new trainees is the bewildering process of discharging a patient. On an internal medicine service, this process can often resemble a Rube Goldberg machine, in which a “simple” task is accomplished through a series of interconnected, almost comically convoluted, yet separate steps that are triggered one after another and must be executed perfectly in sequence for success. It seems easy at first; just tap out a few sentences in the discharge paperwork, do a quick medication reconciliation, and a click of a button later, voila! The patient magically falls off the list and is on their merry way home. In reality, it only takes one wrench thrown into the Rube Goldberg machine to take down the whole operation. Much to the chagrin of internal medicine interns across the country, residents quickly learn that discharge planning is usually far from straightforward and that a myriad of obstacles (often dynamic and frustratingly unpredictable) can stand in the way of a successful discharge.
While some surgical services can streamline discharge processes to target defined lengths of stay based on a particular diagnosis, general medicine patients tend to have greater numbers of comorbid conditions, complex hospital courses, and wider variation in access to posthospital healthcare. In addition, there is very little formal instruction in transitions of care, and most residents identify direct patient care (learning by doing) as the primary mode of education.1,2 Struggling through the process of finding an appropriate placement, ensuring adequate outpatient follow-up, and untangling a jumbled mess of a medication reconciliation is often the only way that housestaff learn the Sisyphean task of transitioning care out of the hospital. The unpredictability and intensity of patient care adds to the ever growing list of competing demands on the time and attention of residents. Attendings face pressure on all sides to not only provide exemplary patient care and an educational experience but also to optimize hospital throughput by discharging patients as soon as possible (and ideally before noon). No wonder that the discharge process can threaten to unravel at any time, with delays and complications in discharge metamorphosing into increased length of stay (LOS), poorer outcomes, and increased 30-day readmission rates. As on-the-ground providers, what realities do we face when challenging ourselves to discharge patients before noon, and what practical changes in our workflow can we make to reach this goal?
In this month’s Journal of Hospital Medicine, Zoucha et al. examine these questions in real time by identifying barriers preventing both “definite” and “possible” discharges at three representative time points over the course of randomly chosen weekdays. They surveyed both housestaff and attendings at five academic hospitals across the United States, and the majority of patients were cared for on teaching services.3 Reflecting the inherent differences in workflow between teaching and nonteaching services, delays in definite discharges on teaching services were most often hindered by completing rounds and the need to staff the patient with the attending, whereas nonresident services identified other patient-care-related (both urgent and nonurgent) issues to be the culprits. Late-afternoon discharges were delayed on teaching services due to outstanding paperwork and follow-up arrangements, both of which most senior residents are keenly aware of and make their best effort to complete ahead of time. Patients designated as “possible” discharges were awaiting clinical improvement and resolution of disposition issues dependent on social work and safe placement, which reasonably seemed independent of service type. These descriptive findings suggest that nonresident services are more efficient than resident teams, and we are keen to identify novel solutions, such as dedicated discharge coordinators,4 to facilitate the discharge process on resident teams without detracting from the educational value of the rotation.
Zoucha et al. also found that factors beyond our control (having a lower daily census, attending on a nonresident service) were significantly associated with both earlier discharge order entry times and the actual time of patient discharge.3 While it is tempting to foist the entirety of the blame on extrinsic factors such as discharge placement and insurance issues, the reality is there might be some workflow changes that could expedite the discharge process. The authors are correct to emphasize that rounding style, in which discharges are prioritized to be seen first, is a behavior modification worth targeting. The percentage of teams that routinely see discharges first is not well studied, as other factors, such as clinically unstable patients, new admissions from overnight, and even mundane characteristics such as geographic location in the hospital, can also compete for prioritization in rounding order. Given the authors’ findings, we are eager to see further work in this area as prioritization of discharges during rounds could conceivably be studied within the context of a randomized controlled trial. Other innovations in rounding styles such as rounding-in-flow5 (in which all tasks are completed for a single patient before rounding on the next patient) can also significantly reduce the time to discharge order placement.
With help from the Penn Medicine Center for Health Care Innovation, we are actively studying bottlenecks in the discharge process by developing an interactive platform focused on delivering real-time information to all members of the healthcare team. Rapid rounds are held every morning with the attending physician, floor nursing leadership, physical therapy, social worker, and case management to quickly identify pending tasks, anticipated disposition, and a target date of discharge. Efficiency is key, as each team is limited to approximately 5-10 minutes. Previous studies (mostly pre–post studies) have shown that this simple intervention significantly reduced LOS,6,7 increased rates of discharge before noon,8 and was improved by electronic tracking tools.9 Our multidisciplinary rounds are unique in that information is then entered into an intuitive, web-based platform, which allows consolidation and analysis that permits generation of real-time statistics. By standardizing the discharge planning process, we hope to streamline a previously fragmented process and maximize the efficiency of hospital resource utilization.
Ultimately, high-quality care of complex patients on internal medicine services from admission to discharge requires hard work, smart utilization of resources, and a little bit of luck. There may not be a secret ingredient that guarantees perfectly efficient discharges 100% of the time, but this study inspires us to ponder additional approaches to this longstanding problem. The authors are to be congratulated for a rigorous study that illuminates where we as healthcare providers are able to realistically intervene to expedite the discharge process. First, having a lower census cap may not be possible in this era of maximal hospital usage, but this work suggests that thoughtful management of time on rounds may be a way to address the underlying problem. Secondly, the superior efficiency of nonteaching services may merely reflect the increased experience of the providers, and a realistic solution could be to implement a formal curriculum to educate housestaff about the discharge process, which would simultaneously address residency competency standards for transitions of care. Finally, the role of innovative informatics tools will surely open further avenues of investigation, as we continually evolve in response to intensifying standards of modern, efficient healthcare delivery in the 21st century. It may not be possible to eliminate the complexity from this particular Rube Goldberg machine, but taking the steps above may allow us to implement as many fail-safes as we can.
Disclosures
The authors have nothing to disclose.
1. Young E, Stickrath C, McNulty M, et al. Residents’ exposure to educational experiences in facilitating hospital discharges. J Grad Med Educ. 2017;9(2):184-189. doi: 10.4300/JGME-D-16-00503.1. PubMed
2. Greysen SR, Schiliro D, Curry L, et al. “Learning by doing” - Resident perspectives on developing competency in high-quality discharge care. J Gen Intern Med. 2012;27(9):1188-1194. doi: 10.1007/s11606-012-2094-5. PubMed
3. Zoucha J, Hull M, Keniston A, et al. Barriers to Early Hospital Discharge: A Cross-Sectional Study at Five Academic Hospitals. J Hosp Med. 2018;13(12):816-822. doi: 10.12788/jhm.3074. PubMed
4. Finn KM, Heffner R, Chang Y, et al. Improving the discharge process by embedding a discharge facilitator in a resident team. J Hosp Med. 2011;6(9):494-500. doi: 10.1002/jhm.924. PubMed
5. Calderon AS, Blackmore CC, Williams BL, et al. Transforming ward rounds through rounding-in-flow. J Grad Med Educ. 2014;6(4):750-755. doi: 10.4300/JGME-D-13-00324.1. PubMed
6. Kane M, Rohatgi N, Heidenreich PA, et al. Lean-based redesign of multidisciplinary rounds on general medicine service. J Hosp Med. 2018;13(7):482-485. doi: 10.12788/jhm.2908. PubMed
7. Gonçalves-Bradley D, Lannin N, Clemson L, Cameron ID, Shepperd S. Discharge planning from hospital. Cochrane Database Syst Rev. 2016;1-3. doi: 10.1002/14651858.CD000313.pub5.www.cochranelibrary.com. PubMed
8. Wertheimer B, Jacobs REA, Bailey M, et al. Discharge before noon: an achievable hospital goal. J Hosp Med. 2014;9(4):210-214. doi: 10.1002/jhm.2154. PubMed
9. Meo N, Paul E, Wilson C, Powers J, Magbual M, Miles KM. Introducing an electronic tracking tool into daily multidisciplinary discharge rounds on a medicine service: a quality improvement project to reduce length of stay. BMJ Open Qual. 2018;7(3):e000174. doi: 10.1136/bmjoq-2017-000174. PubMed
© 2018 Society of Hospital Medicine
We May Not “Have It All,” But We Can Make It Better through Structural Changes
In this issue of the Journal of Hospital Medicine, the paper by Gottenborg et al. captures the experiences of female academic hospitalists navigating one of the most significant transitions they will face—becoming new mothers.1 This article gives an accessible voice to impersonal statistics about the barriers women physicians encounter within and across specialties in academia. The challenges and anecdotes shared by the study participants were eminently relatable and captured the all-too-familiar circumstances most of us with children have faced in our careers as physician mothers.
STUDY COMMENTARY AND DISCUSSION
This study uses qualitative research methods to illustrate the hurdles faced by mothers in hospital medicine beyond what is demonstrated by quantitative measures and provides the helpful step of proposing some solutions to the obstacles they have faced. While the sample size was very small, the women interviewed were diverse in their years in practice, geographic distribution, and percent clinical effort, providing evidence that the themes discussed prevail across demographic categories.
The snowball sampling via the Society of Hospital Medicine committees may not have yielded a representative sample of female hospitalists. It seems possible that women who are involved in this type of leadership may be better supported and/or have different work schedules than their peers who are not in leadership positions. We also wish there had been more emphasis on the systemic and structural factors that can improve the quality of life of physician mothers. These policies include paternity leave and other creative ways of acknowledging the useful skills and experience that motherhood brings to bear on clinical practice, such as increased empathy and compassion, as mentioned by one of the study participants.
Even with the aforementioned limitations, this study is important because it combines authentic quotes from practicing academic hospitalists with concrete and tangible suggestions for structural changes. The most striking element is that the majority of the study participants experienced uncertainty and a lack of transparency around parental leave policies. As nearly half of hospitalists are women and 80% are under age 40,2 it seems unimaginable that there would not be explicit policies in place for what is a common and largely anticipated life event. Medicine has made great strides toward gender equality, but we are unlikely to ever reach the goal of true parity without openly addressing the disproportionate effect of childbearing and child rearing on women physicians. Standardized, readily available, and equitable parental leave policies (for both birth parents and nonbirth parents) are the first and most critical step.
The absence of standard leave policies naturally puts physician mothers in the position of having to negotiate or “haggle” with various supervisors, the majority of whom are male division chiefs and department chairs,3 which places all parties in an uncomfortable position, further reinforcing inequities and sowing discord and resentment. Having formal policies around leave protects not only those who utilize parental leave but also the other members of a hospital medicine practice who take on the workload of the person on leave.
Uncertainty around how to address the increased clinical load and for how long, also creates anxiety among other group members and may lead to feelings of bitterness toward clinicians on leave, further contributing to the negative impact of new parenthood on female hospitalists. We can think of no other medical circumstance in which there is as much advance notice of the need for significant time away from work. Yet pregnancy, which is subject to complications and emergencies just like other medical conditions, is treated with so little concern that one may be asked to arrange for their own coverage during such an emergency, as one study subject reported.
We also empathize with the study participants’ reports of feeling that supervisors often mentally discounted their ability to participate in projects on return to work. These pernicious assumptions can compound a cycle of lost productivity, disengagement, and attrition from the workforce.
Female hospitalists returning from leave face additional challenges that place an undue burden on their professional activities, most notably related to breastfeeding. This is particularly relevant in the context of the intensity inherent in practicing hospital medicine, which includes long days of being the primary provider for acutely ill inpatients, as well as long stretches of many consecutive days when it may not be possible to return home before children’s bedtime. Even at our own institution, which has been recognized as a “Healthy Mothers Workplace,” breastfeeding accommodations are not set up to allow for ongoing clinical activities while taking time to express breastmilk, and the clinical schedule does not build in adjustments for this time-consuming and psychologically taxing commitment. Breastfeeding for at least one year is the medical recommendation of the American Academy of Pediatrics in line with a substantial body of evidence.4 One quote from the article poignantly notes, “Pumping every 3-4 hours: stopping what you’re doing, finding an empty room to pump, finding a place to store your milk, then going back to work, three times per shift, for the next 9 months of your life, was hell.” If we cannot enable our own medical providers to follow evidence-based recommendations, how can we possibly expect this of our patients?
CONCLUSIONS
The notion of women “having it all” is an impossible ideal—both work and life outside of work will inevitably require tradeoffs. However, there is an abundance of evidence and recommendations for concrete steps that can be taken to improve the experience of female physicians who have children. These include formal policies for childbearing and child rearing leave (the American Academy of Pediatrics recommends at least six to nine months5), convenient space and protected time for pumping milk during the first year, on-site childcare services and back-up child care, and flexible work schedules.6 It is time to stop treating childbirth among female physicians like an unexpected inconvenience and acknowledge the undeniable demographics of physicians in hospital medicine and the duty of healthcare systems and hospital medicine leaders to effectively plan for the needs of half of their workforce.
Disclosures
Neither of the authors have any financial conflicts of interest to disclose.
1. Gottenborg E, Maw A, Ngov LK, Burden M, Ponomaryova A, Jones CD. You can’t have it all: The experience of academic hospitalists during pregnancy, parental leave, and return to work. J Hosp Med. 2018;13(12):836-839. doi: 10.12788/jhm.3076. PubMed
2. Reid MB, Misky GJ, Harrison RA, Sharpe B, Auerbach A, Glasheen JJ. Mentorship, productivity, and promotion among academic hospitalists. J Gen Intern Med. 2012;27(1):23-27. doi: 10.1007/s11606-011-1892-5. PubMed
3. Association of American Medical Colleges. The state of women in academic medicine: The pipeline and pathways to leadership, 2015-2016. https://www.aamc.org/members/gwims/statistics/. Accessed October 1, 2018.
4. American Academy of Pediatrics. Breastfeeding and the use of human milk. Pediatrics. 2012;129(3):e827-e841. doi: 10.1542/peds.2011-3552. PubMed
5. National Public Radio. A Pediatrician’s View of Paid Parental Leave. https://www.npr.org/sections/health-shots/2016/10/10/497052014/a-pediatricians-view-of-paid-parental-leave. Accessed September 26, 2018.
6. Mangurian C, Linos E, Sarkar U, Rodriguez C, Jagsi R. What’s holding women in medicine back from leadership? (2018, June 19). Harvard Business Review. https://hbr.org/2018/06/whats-holding-women-in-medicine-back-from-leadership. Accessed October 1, 2018.
In this issue of the Journal of Hospital Medicine, the paper by Gottenborg et al. captures the experiences of female academic hospitalists navigating one of the most significant transitions they will face—becoming new mothers.1 This article gives an accessible voice to impersonal statistics about the barriers women physicians encounter within and across specialties in academia. The challenges and anecdotes shared by the study participants were eminently relatable and captured the all-too-familiar circumstances most of us with children have faced in our careers as physician mothers.
STUDY COMMENTARY AND DISCUSSION
This study uses qualitative research methods to illustrate the hurdles faced by mothers in hospital medicine beyond what is demonstrated by quantitative measures and provides the helpful step of proposing some solutions to the obstacles they have faced. While the sample size was very small, the women interviewed were diverse in their years in practice, geographic distribution, and percent clinical effort, providing evidence that the themes discussed prevail across demographic categories.
The snowball sampling via the Society of Hospital Medicine committees may not have yielded a representative sample of female hospitalists. It seems possible that women who are involved in this type of leadership may be better supported and/or have different work schedules than their peers who are not in leadership positions. We also wish there had been more emphasis on the systemic and structural factors that can improve the quality of life of physician mothers. These policies include paternity leave and other creative ways of acknowledging the useful skills and experience that motherhood brings to bear on clinical practice, such as increased empathy and compassion, as mentioned by one of the study participants.
Even with the aforementioned limitations, this study is important because it combines authentic quotes from practicing academic hospitalists with concrete and tangible suggestions for structural changes. The most striking element is that the majority of the study participants experienced uncertainty and a lack of transparency around parental leave policies. As nearly half of hospitalists are women and 80% are under age 40,2 it seems unimaginable that there would not be explicit policies in place for what is a common and largely anticipated life event. Medicine has made great strides toward gender equality, but we are unlikely to ever reach the goal of true parity without openly addressing the disproportionate effect of childbearing and child rearing on women physicians. Standardized, readily available, and equitable parental leave policies (for both birth parents and nonbirth parents) are the first and most critical step.
The absence of standard leave policies naturally puts physician mothers in the position of having to negotiate or “haggle” with various supervisors, the majority of whom are male division chiefs and department chairs,3 which places all parties in an uncomfortable position, further reinforcing inequities and sowing discord and resentment. Having formal policies around leave protects not only those who utilize parental leave but also the other members of a hospital medicine practice who take on the workload of the person on leave.
Uncertainty around how to address the increased clinical load and for how long, also creates anxiety among other group members and may lead to feelings of bitterness toward clinicians on leave, further contributing to the negative impact of new parenthood on female hospitalists. We can think of no other medical circumstance in which there is as much advance notice of the need for significant time away from work. Yet pregnancy, which is subject to complications and emergencies just like other medical conditions, is treated with so little concern that one may be asked to arrange for their own coverage during such an emergency, as one study subject reported.
We also empathize with the study participants’ reports of feeling that supervisors often mentally discounted their ability to participate in projects on return to work. These pernicious assumptions can compound a cycle of lost productivity, disengagement, and attrition from the workforce.
Female hospitalists returning from leave face additional challenges that place an undue burden on their professional activities, most notably related to breastfeeding. This is particularly relevant in the context of the intensity inherent in practicing hospital medicine, which includes long days of being the primary provider for acutely ill inpatients, as well as long stretches of many consecutive days when it may not be possible to return home before children’s bedtime. Even at our own institution, which has been recognized as a “Healthy Mothers Workplace,” breastfeeding accommodations are not set up to allow for ongoing clinical activities while taking time to express breastmilk, and the clinical schedule does not build in adjustments for this time-consuming and psychologically taxing commitment. Breastfeeding for at least one year is the medical recommendation of the American Academy of Pediatrics in line with a substantial body of evidence.4 One quote from the article poignantly notes, “Pumping every 3-4 hours: stopping what you’re doing, finding an empty room to pump, finding a place to store your milk, then going back to work, three times per shift, for the next 9 months of your life, was hell.” If we cannot enable our own medical providers to follow evidence-based recommendations, how can we possibly expect this of our patients?
CONCLUSIONS
The notion of women “having it all” is an impossible ideal—both work and life outside of work will inevitably require tradeoffs. However, there is an abundance of evidence and recommendations for concrete steps that can be taken to improve the experience of female physicians who have children. These include formal policies for childbearing and child rearing leave (the American Academy of Pediatrics recommends at least six to nine months5), convenient space and protected time for pumping milk during the first year, on-site childcare services and back-up child care, and flexible work schedules.6 It is time to stop treating childbirth among female physicians like an unexpected inconvenience and acknowledge the undeniable demographics of physicians in hospital medicine and the duty of healthcare systems and hospital medicine leaders to effectively plan for the needs of half of their workforce.
Disclosures
Neither of the authors have any financial conflicts of interest to disclose.
1. Gottenborg E, Maw A, Ngov LK, Burden M, Ponomaryova A, Jones CD. You can’t have it all: The experience of academic hospitalists during pregnancy, parental leave, and return to work. J Hosp Med. 2018;13(12):836-839. doi: 10.12788/jhm.3076. PubMed
2. Reid MB, Misky GJ, Harrison RA, Sharpe B, Auerbach A, Glasheen JJ. Mentorship, productivity, and promotion among academic hospitalists. J Gen Intern Med. 2012;27(1):23-27. doi: 10.1007/s11606-011-1892-5. PubMed
3. Association of American Medical Colleges. The state of women in academic medicine: The pipeline and pathways to leadership, 2015-2016. https://www.aamc.org/members/gwims/statistics/. Accessed October 1, 2018.
4. American Academy of Pediatrics. Breastfeeding and the use of human milk. Pediatrics. 2012;129(3):e827-e841. doi: 10.1542/peds.2011-3552. PubMed
5. National Public Radio. A Pediatrician’s View of Paid Parental Leave. https://www.npr.org/sections/health-shots/2016/10/10/497052014/a-pediatricians-view-of-paid-parental-leave. Accessed September 26, 2018.
6. Mangurian C, Linos E, Sarkar U, Rodriguez C, Jagsi R. What’s holding women in medicine back from leadership? (2018, June 19). Harvard Business Review. https://hbr.org/2018/06/whats-holding-women-in-medicine-back-from-leadership. Accessed October 1, 2018.
© 2018 Society of Hospital Medicine
On Decreasing Utilization: Models of Care for Frequently Hospitalized Patients and Their Effect on Outcomes
In this month’s edition of the Journal of Hospital Medicine, Goodwin and colleagues report their findings from their systematic review of models of care for frequently hospitalized patients. The authors reviewed the literature for interventions to reduce hospital admissions in frequently hospitalized patients with the goal of assessing the success of the interventions. This report contributes to the literature base of interventions to reduce healthcare utilization, particularly in the area of inpatient hospitalization.1
Goodwin et al. report that only nine studies met their criteria for review after a thorough search of the published literature. Of these nine studies, only four were determined to be high-quality studies. Interestingly, the low-quality studies found positive results in reducing hospital utilization, whereas the high-quality studies found decreases that were mirrored by their control groups. Impressive heterogeneity was found in the range of definitions, interventions, and outcome measures in the studies. These studies highlight the issue of “regression to the mean” for sicker individuals; however, they may not address readmission rates of specific medical systems or procedures that are also cost drivers, even if the patients are not considered critically ill. They also show where research partnerships can assist in increasing the number of members included in the studies for robust analyses.
From the perspective of a health plan, we applaud all efforts to improve patient outcomes and reduce cost. This report states that efforts to reduce chronic hospitalizations have not been unqualified successes. We must reflect upon how reducing utilization and improving outcomes align with our overall goals as a society. Recently, Federal Reserve Chairman Jay Powell summed up our nation’s particular issue, stating, “It is widely understood that the United States is on an unsustainable fiscal path, largely due to the interaction between an aging population and a healthcare system that delivers pretty average healthcare at a cost that is much higher than that of any other advanced economy.”2
A recent Kaiser Family Foundation analysis showed that 1% of patients accounted for 23% of all medical spending in the United States, and 97% of medical spending is attributed to the top 50% of patients.3 Pharmaceutical costs also play a role in this trend. Blue Cross and Blue Shield of Texas (BCBSTX) found that 2.5% of our population accounted for just under 50% of total medical spending. Conversely, when looking at patients with very high costs, only 0.4% had over $100,000 in spending exclusive of pharmacy. When including pharmacy, that number rises to 0.5%. As we consider annual medical and pharmacy trends year over year, we find that pharmacy spending may outpace hospital expenses in the near future.
Our internal data are also consistent with published reports that fewer than half of high-cost patients in one year continue to be high-cost cases the following year. Niall Brennan et al. reported that only 39% of the top 5% of spenders in a given year are also high spenders the following year.4 This finding not only coincides with the author’s statement around regression to the mean for the high admission utilizers, but it may be instructive to those looking to a Pareto method of attacking cost. If more than half of targeted patients will move out of the high cost category on their own, then demonstrating the effectiveness of interventions becomes challenging. Moreover, this regression finding speaks to the need to create effective programs to manage population health on a broad basis, which can address quality to all members and streamline costs for a large group that covers well more than 50% of medical spending.
BCBSTX emphasizes the creation of systems that let providers become responsible and accountable to outcomes and cost. Accountable Care Organizations (ACOs) and Intensive Medical Homes (IMHs) have played important roles in this journey, but physicians need to continue to invent and prioritize interventions that may achieve both goals. In particular, hospitalists have an important role to play. As ACOs flourish, hospitalists will need to join under the value-based umbrella and continue to intervene in patient care, policies, and procedures to reduce avoidable hospitalizations.
The development of value-based arrangements offers the healthcare system a unique opportunity to bring much-needed change. In our medical partnerships, direct communication with providers regarding their member experience and sharing of vital information about their patients’ health status have helped improve patient outcomes and decrease cost. Our IMH partnerships show a savings of up to $45,000 per member per year driven by decreases in admissions and ER visits, and in some cases, expensive medications. The hard work in these successes lies within the subtleties of fostering the relationship between payers and providers. Each pillar within the ecosystem plays a key role offering strengths, but the upside toward change comes in how we support each other’s weaknesses. This support is manifested in two ways: collaboration through communication and transparency through data sharing.
The road to change is one less traveled but not unpaved; advances in technology allow us to take experiences and build from them. At its core, technology has enhanced our collaboration and data capabilities. The ability to stay in touch with providers allows for almost real-time addressing of issues, promoting efficiency. The connection we have with providers has evolved from being solely paper contracts to a multichannel, multifunctional system. The ability to take claims experience, insert clinical acumen, and perform data analysis brings actionable solutions to be executed by our providers.
Those in the healthcare system will need to come together to continue to create interventions that improve quality while decreasing costs. The second part may require even more work than the first. The Health Care Cost Institute recently published data showing that inpatient utilization over a five-year period fell 12.9% in the commercially insured.5 However, over that same period, hospital prices for inpatient care rose 24.3%. The fundamental reason for the excess amount of money spent in US healthcare is that the prices are incredibly high.6 Currently, when diligence is exercised in reducing utilization, hospitals simply raise prices as a response to compensate for the lost income. Likewise, although prescription drug utilization only increased 1.8% during that period, the prices increased by 24.9%.
For the United States healthcare system to improve its quality and reduce its cost, we will need inventive partnerships to continue to create new systems to interact with patients in the most efficient and effective way possible. Readmissions and hospital utilization will be a large part of that improvement. Hospitals and hospitalists should ensure that they continue to focus on making healthcare more affordable by improving efficiency and outcomes and by resisting the tendencies of hospitals and pharmaceutical companies to raise prices in reaction to the improved efficiency.
Disclosures
The authors have nothing to disclose.
1. Goodwin A, Henschen BL, O’Dwyer LC, Nichols N, O’Leary KJ. Interventions for Frequently Hospitalized Patients and their Effect on Outcomes: A Systematic Review. J Hosp Med. 2018; 13(12):853-859. doi: 10.12788/jhm.3089. PubMed
2. Marketplace. Fed Chair Jay Powel. https://www.marketplace.org/2018/07/12/economy/powell-transcript. Accessed August 3, 2018.
3. Health System Tracker. https://www.healthsystemtracker.org/chart-collection/health-expenditures-vary-across-population/#item-start%2012/01/2017. Accessed August 3, 2018.
4. NEJM Catalyst. Consistently High Turnover in the Group of Top Health Care Spenders. https://catalyst.nejm.org/high-turnover-top-health-care-spenders/. Accessed August 3, 2018.
5. Health Care Cost Institute. 2016 Health Care Cost and Utilization Report. http://www.healthcostinstitute.org/report/2016-health-care-cost-utilization-report/. Accessed August 3, 2018.
6. Anderson GF, Reinhardt UE, Hussey PS, Peterosyan V. It’s the prices, stupid: why the United States is so different from other countries. Health Aff (Millwood). 2003;22(3):89-105. doi: 10.1377/hlthaff.22.3.89. PubMed
In this month’s edition of the Journal of Hospital Medicine, Goodwin and colleagues report their findings from their systematic review of models of care for frequently hospitalized patients. The authors reviewed the literature for interventions to reduce hospital admissions in frequently hospitalized patients with the goal of assessing the success of the interventions. This report contributes to the literature base of interventions to reduce healthcare utilization, particularly in the area of inpatient hospitalization.1
Goodwin et al. report that only nine studies met their criteria for review after a thorough search of the published literature. Of these nine studies, only four were determined to be high-quality studies. Interestingly, the low-quality studies found positive results in reducing hospital utilization, whereas the high-quality studies found decreases that were mirrored by their control groups. Impressive heterogeneity was found in the range of definitions, interventions, and outcome measures in the studies. These studies highlight the issue of “regression to the mean” for sicker individuals; however, they may not address readmission rates of specific medical systems or procedures that are also cost drivers, even if the patients are not considered critically ill. They also show where research partnerships can assist in increasing the number of members included in the studies for robust analyses.
From the perspective of a health plan, we applaud all efforts to improve patient outcomes and reduce cost. This report states that efforts to reduce chronic hospitalizations have not been unqualified successes. We must reflect upon how reducing utilization and improving outcomes align with our overall goals as a society. Recently, Federal Reserve Chairman Jay Powell summed up our nation’s particular issue, stating, “It is widely understood that the United States is on an unsustainable fiscal path, largely due to the interaction between an aging population and a healthcare system that delivers pretty average healthcare at a cost that is much higher than that of any other advanced economy.”2
A recent Kaiser Family Foundation analysis showed that 1% of patients accounted for 23% of all medical spending in the United States, and 97% of medical spending is attributed to the top 50% of patients.3 Pharmaceutical costs also play a role in this trend. Blue Cross and Blue Shield of Texas (BCBSTX) found that 2.5% of our population accounted for just under 50% of total medical spending. Conversely, when looking at patients with very high costs, only 0.4% had over $100,000 in spending exclusive of pharmacy. When including pharmacy, that number rises to 0.5%. As we consider annual medical and pharmacy trends year over year, we find that pharmacy spending may outpace hospital expenses in the near future.
Our internal data are also consistent with published reports that fewer than half of high-cost patients in one year continue to be high-cost cases the following year. Niall Brennan et al. reported that only 39% of the top 5% of spenders in a given year are also high spenders the following year.4 This finding not only coincides with the author’s statement around regression to the mean for the high admission utilizers, but it may be instructive to those looking to a Pareto method of attacking cost. If more than half of targeted patients will move out of the high cost category on their own, then demonstrating the effectiveness of interventions becomes challenging. Moreover, this regression finding speaks to the need to create effective programs to manage population health on a broad basis, which can address quality to all members and streamline costs for a large group that covers well more than 50% of medical spending.
BCBSTX emphasizes the creation of systems that let providers become responsible and accountable to outcomes and cost. Accountable Care Organizations (ACOs) and Intensive Medical Homes (IMHs) have played important roles in this journey, but physicians need to continue to invent and prioritize interventions that may achieve both goals. In particular, hospitalists have an important role to play. As ACOs flourish, hospitalists will need to join under the value-based umbrella and continue to intervene in patient care, policies, and procedures to reduce avoidable hospitalizations.
The development of value-based arrangements offers the healthcare system a unique opportunity to bring much-needed change. In our medical partnerships, direct communication with providers regarding their member experience and sharing of vital information about their patients’ health status have helped improve patient outcomes and decrease cost. Our IMH partnerships show a savings of up to $45,000 per member per year driven by decreases in admissions and ER visits, and in some cases, expensive medications. The hard work in these successes lies within the subtleties of fostering the relationship between payers and providers. Each pillar within the ecosystem plays a key role offering strengths, but the upside toward change comes in how we support each other’s weaknesses. This support is manifested in two ways: collaboration through communication and transparency through data sharing.
The road to change is one less traveled but not unpaved; advances in technology allow us to take experiences and build from them. At its core, technology has enhanced our collaboration and data capabilities. The ability to stay in touch with providers allows for almost real-time addressing of issues, promoting efficiency. The connection we have with providers has evolved from being solely paper contracts to a multichannel, multifunctional system. The ability to take claims experience, insert clinical acumen, and perform data analysis brings actionable solutions to be executed by our providers.
Those in the healthcare system will need to come together to continue to create interventions that improve quality while decreasing costs. The second part may require even more work than the first. The Health Care Cost Institute recently published data showing that inpatient utilization over a five-year period fell 12.9% in the commercially insured.5 However, over that same period, hospital prices for inpatient care rose 24.3%. The fundamental reason for the excess amount of money spent in US healthcare is that the prices are incredibly high.6 Currently, when diligence is exercised in reducing utilization, hospitals simply raise prices as a response to compensate for the lost income. Likewise, although prescription drug utilization only increased 1.8% during that period, the prices increased by 24.9%.
For the United States healthcare system to improve its quality and reduce its cost, we will need inventive partnerships to continue to create new systems to interact with patients in the most efficient and effective way possible. Readmissions and hospital utilization will be a large part of that improvement. Hospitals and hospitalists should ensure that they continue to focus on making healthcare more affordable by improving efficiency and outcomes and by resisting the tendencies of hospitals and pharmaceutical companies to raise prices in reaction to the improved efficiency.
Disclosures
The authors have nothing to disclose.
1. Goodwin A, Henschen BL, O’Dwyer LC, Nichols N, O’Leary KJ. Interventions for Frequently Hospitalized Patients and their Effect on Outcomes: A Systematic Review. J Hosp Med. 2018; 13(12):853-859. doi: 10.12788/jhm.3089. PubMed
2. Marketplace. Fed Chair Jay Powel. https://www.marketplace.org/2018/07/12/economy/powell-transcript. Accessed August 3, 2018.
3. Health System Tracker. https://www.healthsystemtracker.org/chart-collection/health-expenditures-vary-across-population/#item-start%2012/01/2017. Accessed August 3, 2018.
4. NEJM Catalyst. Consistently High Turnover in the Group of Top Health Care Spenders. https://catalyst.nejm.org/high-turnover-top-health-care-spenders/. Accessed August 3, 2018.
5. Health Care Cost Institute. 2016 Health Care Cost and Utilization Report. http://www.healthcostinstitute.org/report/2016-health-care-cost-utilization-report/. Accessed August 3, 2018.
6. Anderson GF, Reinhardt UE, Hussey PS, Peterosyan V. It’s the prices, stupid: why the United States is so different from other countries. Health Aff (Millwood). 2003;22(3):89-105. doi: 10.1377/hlthaff.22.3.89. PubMed
© 2018 Society of Hospital Medicine
Towards Scalable Hospital-Based Palliative Care: Challenges and Opportunities for Hospitalists
There is growing evidence that supports the ability of specialty palliative care to achieve the Triple Aim in healthcare: (1) improve patient and family experience of care, (2) improve health outcomes, and (3) reduce healthcare costs.1,2 However, the full realization of this value remains elusive due, in large part, to the increasing demand for specialty palliative care services outpacing the supply of specialists.3 Because expansion of the specialty palliative care workforce will never be sufficient to meet the needs of seriously ill patients, and nonspecialist physicians often fail to recognize palliative care needs in a timely manner,4 innovative and systematic solutions are needed to provide high-quality palliative care in a manner that is sustainable.5
To close the gap between workforce and patient needs, experts have largely advocated for two care delivery models that aim to improve the organization and allocation of limited palliative care resources: (1) a tier-based approach in which primary palliative care (basic skills for all clinicians) and specialty palliative care (advanced skills requiring additional training) have distinct but supportive roles, and (2) a need-based approach where different types of palliative care clinicians are deployed based on specific needs.5,6 In this issue, Abedini and Chopra propose a “Palliative Care Redistribution Integrated System Model” (PRISM) that combines these two approaches, with need-based care delivery that escalates through skill tiers to improve hospital-based palliative care.7
PRISM is attractive because it leverages the skill sets of clinicians across disciplines and is designed for the hospital, where the vast majority of specialty palliative care is provided in the United States. Moreover, it employs hospitalists who routinely care for a high volume of seriously ill patients, and are therefore well positioned to expand the palliative care workforce. The authors suggest several approaches to implement PRISM, such as designating certain hospitalist teams for palliative care, more interdisciplinary support, automated patient risk stratification or mandatory screening checklists, and strategic use of bedside nurses and social workers to facilitate early basic needs assessments. Although sound in principle, there are several foreseeable barriers to each of these approaches and potential unintended consequences of PRISM in the fields of hospital and palliative medicine.
Applying insights from behavioral economics will be essential for the successful implementation and dissemination of PRISM. Changing clinician behavior is not a challenge unique to palliative care interventions, but it may be particularly difficult due to misperceptions that palliative care is synonymous with end-of-life care and that such conversations are always time-intensive. Indeed, Abedini and Chopra acknowledge that all clinicians need to be well versed in basic palliative care skills for PRISM to succeed, yet most educational initiatives have shown modest results at best. The most promising clinician education programs, such as the Serious Illness Care Program and VitalTalk require intensive training simulations and are most effective when implemented on a system level to promote cultural change.8.9 Thus, training hospitalists in preparation for PRISM will require considerable upfront investment by hospitals. While policy efforts to improve palliative care training in medical education are progressing (Palliative Care and Hospice Education and Training Act, H.R.1676), any evidence of impact is nearly a generation away.
The authors also advocate for a technology-driven solution for systematic and early identification of palliative care needs. However, ideal clinical decision support would not rely on checklists to be completed by bedside clinicians or “hard stop” alerts in the electronic health record, as both of these approaches rely heavily upon consistent and accurate data entry by busy clinicians. Rather, innovative predictive analytics with machine learning and natural language processing methods hold great promise to support an electronic precision medicine approach for palliative care delivery. Even after such prediction models are developed, rigorous studies are needed to understand how they can change clinician behavior and impact the quality and cost of care.
Shifting palliative care tasks to nonspecialists has implications beyond quality and access. First, there are likely to be reimbursement implications as nonbillable clinicians such as social workers provide palliative care services that were previously provided by physicians and advance practice providers. As value-based payment models grow, healthcare systems may be wise to invest in innovative palliative care delivery models such as PRISM, but obtaining financial support will require rigorous evidence of value. Second, it will be important to monitor the already high rates of burnout and emotional exhaustion among palliative care clinicians10 when implementing care delivery models that select only the most complex patients for referral to specialty palliative care. Finally, new palliative care delivery models must fit within a larger national strategy to grow palliative care across the care continuum.11 This is of particular importance with hospital-focused solutions such as PRISM due to concerns about the growing split in care coordination between inpatient and outpatient care. Since seriously ill patients spend the majority of time outside the hospital and evidence for the value of palliative care is most robust in home and ambulatory settings,1 an important role for hospitalists could be to systematically identify and refer high-risk patients to community-based palliative care services after discharge from a sentinel hospitalization.
In conclusion, innovative palliative care delivery models such as PRISM are critical to ensuring that seriously ill patients have access to high-quality palliative care; however, more work is still needed to create the training programs, patient identification tools, scalable implementation, and evaluation processes necessary for success.
Disclosures
Dr. Courtright and Dr. O’Connor have nothing to disclose.
Funding
This work was funded in part by a career development award from the National Palliative Care Research Center (KRC). The views expressed herein solely represent those of the authors.
1. Kavalieratos D, Corbelli J, Zhang D, et al. Association between palliative care and patient and caregiver outcomes. Jama. 2016;316(20):2104. doi: 10.1001/jama.2016.16840. PubMed
2. May P, Normand C, Cassel JB, et al. Economics of palliative care for hospitalized adults with serious illness. JAMA Intern Med. 2018;178(6):820. doi: 10.1001/jamainternmed.2018.0750. PubMed
3. Dumanovsky T, Augustin R, Rogers M, Lettang K, Meier DE, Morrison RS. The growth of palliative care in U.S. hospitals: a status report. J Palliat Med. 2016;19(1):8-15. doi: 10.1089/jpm.2015.0351. PubMed
4. Heyland DK. Failure to Engage hospitalized elderly patients and their families in advance care planning. JAMA Intern Med. 2013;173(9):778. doi: 10.1001/jamainternmed.2013.180. PubMed
5. Courtright KR, Cassel JB, Halpern SD. A research agenda for high-value palliative care. Ann Intern Med. 2017;168(1):71. doi: 10.7326/m17-2164. PubMed
6. Billings JA, Bernacki R. Strategic targeting of advance care planning interventions. JAMA Intern Med. 2014;174(4):620. doi: 10.1001/jamainternmed.2013.14384. PubMed
7. Abedini NC, Chopra V. A Model to Improve Hospital-Based Palliative Care: The Palliative Care Redistribution Integrated System Model (PRISM). J Hosp Med. 2018;13(12):868-871. doi: 10.12788/jhm.3065 PubMed
8. Bernacki R, Hutchings M, Vick J, et al. Development of the Serious Illness Care Program: a randomized controlled trial of a palliative care communication intervention. BMJ Open. 2015;5(10):e009032. doi: 10.1136/bmjopen-2015-009032. PubMed
9. Clayton JM, Butow PN, Waters A, et al. Evaluation of a novel individualized communication-skills training intervention to improve doctors’ confidence and skills in end-of-life communication. Palliat Med. 2012;27(3):236-243. doi: 10.1177/0269216312449683. PubMed
10. Kamal AH, Bull JH, Wolf SP, et al. Prevalence and predictors of burnout among hospice and palliative care clinicians in the U.S. J Pain Symptom Manag. 2016;51(4):690-696. doi: 10.1016/j.jpainsymman.2015.10.020. PubMed
11. Meier DE, Back AL, Berman A, Block SD, Corrigan JM, Morrison RS. A national strategy for palliative care. Health Aff (Millwood). 2017;36(7):1265-1273. doi: 10.1377/hlthaff.2017.0164. PubMed
There is growing evidence that supports the ability of specialty palliative care to achieve the Triple Aim in healthcare: (1) improve patient and family experience of care, (2) improve health outcomes, and (3) reduce healthcare costs.1,2 However, the full realization of this value remains elusive due, in large part, to the increasing demand for specialty palliative care services outpacing the supply of specialists.3 Because expansion of the specialty palliative care workforce will never be sufficient to meet the needs of seriously ill patients, and nonspecialist physicians often fail to recognize palliative care needs in a timely manner,4 innovative and systematic solutions are needed to provide high-quality palliative care in a manner that is sustainable.5
To close the gap between workforce and patient needs, experts have largely advocated for two care delivery models that aim to improve the organization and allocation of limited palliative care resources: (1) a tier-based approach in which primary palliative care (basic skills for all clinicians) and specialty palliative care (advanced skills requiring additional training) have distinct but supportive roles, and (2) a need-based approach where different types of palliative care clinicians are deployed based on specific needs.5,6 In this issue, Abedini and Chopra propose a “Palliative Care Redistribution Integrated System Model” (PRISM) that combines these two approaches, with need-based care delivery that escalates through skill tiers to improve hospital-based palliative care.7
PRISM is attractive because it leverages the skill sets of clinicians across disciplines and is designed for the hospital, where the vast majority of specialty palliative care is provided in the United States. Moreover, it employs hospitalists who routinely care for a high volume of seriously ill patients, and are therefore well positioned to expand the palliative care workforce. The authors suggest several approaches to implement PRISM, such as designating certain hospitalist teams for palliative care, more interdisciplinary support, automated patient risk stratification or mandatory screening checklists, and strategic use of bedside nurses and social workers to facilitate early basic needs assessments. Although sound in principle, there are several foreseeable barriers to each of these approaches and potential unintended consequences of PRISM in the fields of hospital and palliative medicine.
Applying insights from behavioral economics will be essential for the successful implementation and dissemination of PRISM. Changing clinician behavior is not a challenge unique to palliative care interventions, but it may be particularly difficult due to misperceptions that palliative care is synonymous with end-of-life care and that such conversations are always time-intensive. Indeed, Abedini and Chopra acknowledge that all clinicians need to be well versed in basic palliative care skills for PRISM to succeed, yet most educational initiatives have shown modest results at best. The most promising clinician education programs, such as the Serious Illness Care Program and VitalTalk require intensive training simulations and are most effective when implemented on a system level to promote cultural change.8.9 Thus, training hospitalists in preparation for PRISM will require considerable upfront investment by hospitals. While policy efforts to improve palliative care training in medical education are progressing (Palliative Care and Hospice Education and Training Act, H.R.1676), any evidence of impact is nearly a generation away.
The authors also advocate for a technology-driven solution for systematic and early identification of palliative care needs. However, ideal clinical decision support would not rely on checklists to be completed by bedside clinicians or “hard stop” alerts in the electronic health record, as both of these approaches rely heavily upon consistent and accurate data entry by busy clinicians. Rather, innovative predictive analytics with machine learning and natural language processing methods hold great promise to support an electronic precision medicine approach for palliative care delivery. Even after such prediction models are developed, rigorous studies are needed to understand how they can change clinician behavior and impact the quality and cost of care.
Shifting palliative care tasks to nonspecialists has implications beyond quality and access. First, there are likely to be reimbursement implications as nonbillable clinicians such as social workers provide palliative care services that were previously provided by physicians and advance practice providers. As value-based payment models grow, healthcare systems may be wise to invest in innovative palliative care delivery models such as PRISM, but obtaining financial support will require rigorous evidence of value. Second, it will be important to monitor the already high rates of burnout and emotional exhaustion among palliative care clinicians10 when implementing care delivery models that select only the most complex patients for referral to specialty palliative care. Finally, new palliative care delivery models must fit within a larger national strategy to grow palliative care across the care continuum.11 This is of particular importance with hospital-focused solutions such as PRISM due to concerns about the growing split in care coordination between inpatient and outpatient care. Since seriously ill patients spend the majority of time outside the hospital and evidence for the value of palliative care is most robust in home and ambulatory settings,1 an important role for hospitalists could be to systematically identify and refer high-risk patients to community-based palliative care services after discharge from a sentinel hospitalization.
In conclusion, innovative palliative care delivery models such as PRISM are critical to ensuring that seriously ill patients have access to high-quality palliative care; however, more work is still needed to create the training programs, patient identification tools, scalable implementation, and evaluation processes necessary for success.
Disclosures
Dr. Courtright and Dr. O’Connor have nothing to disclose.
Funding
This work was funded in part by a career development award from the National Palliative Care Research Center (KRC). The views expressed herein solely represent those of the authors.
1. Kavalieratos D, Corbelli J, Zhang D, et al. Association between palliative care and patient and caregiver outcomes. Jama. 2016;316(20):2104. doi: 10.1001/jama.2016.16840. PubMed
2. May P, Normand C, Cassel JB, et al. Economics of palliative care for hospitalized adults with serious illness. JAMA Intern Med. 2018;178(6):820. doi: 10.1001/jamainternmed.2018.0750. PubMed
3. Dumanovsky T, Augustin R, Rogers M, Lettang K, Meier DE, Morrison RS. The growth of palliative care in U.S. hospitals: a status report. J Palliat Med. 2016;19(1):8-15. doi: 10.1089/jpm.2015.0351. PubMed
4. Heyland DK. Failure to Engage hospitalized elderly patients and their families in advance care planning. JAMA Intern Med. 2013;173(9):778. doi: 10.1001/jamainternmed.2013.180. PubMed
5. Courtright KR, Cassel JB, Halpern SD. A research agenda for high-value palliative care. Ann Intern Med. 2017;168(1):71. doi: 10.7326/m17-2164. PubMed
6. Billings JA, Bernacki R. Strategic targeting of advance care planning interventions. JAMA Intern Med. 2014;174(4):620. doi: 10.1001/jamainternmed.2013.14384. PubMed
7. Abedini NC, Chopra V. A Model to Improve Hospital-Based Palliative Care: The Palliative Care Redistribution Integrated System Model (PRISM). J Hosp Med. 2018;13(12):868-871. doi: 10.12788/jhm.3065 PubMed
8. Bernacki R, Hutchings M, Vick J, et al. Development of the Serious Illness Care Program: a randomized controlled trial of a palliative care communication intervention. BMJ Open. 2015;5(10):e009032. doi: 10.1136/bmjopen-2015-009032. PubMed
9. Clayton JM, Butow PN, Waters A, et al. Evaluation of a novel individualized communication-skills training intervention to improve doctors’ confidence and skills in end-of-life communication. Palliat Med. 2012;27(3):236-243. doi: 10.1177/0269216312449683. PubMed
10. Kamal AH, Bull JH, Wolf SP, et al. Prevalence and predictors of burnout among hospice and palliative care clinicians in the U.S. J Pain Symptom Manag. 2016;51(4):690-696. doi: 10.1016/j.jpainsymman.2015.10.020. PubMed
11. Meier DE, Back AL, Berman A, Block SD, Corrigan JM, Morrison RS. A national strategy for palliative care. Health Aff (Millwood). 2017;36(7):1265-1273. doi: 10.1377/hlthaff.2017.0164. PubMed
© 2018 Society of Hospital Medicine
Perioperative cardiovascular medicine: 5 questions for 2018
A plethora of studies are under way in the field of perioperative medicine. As a result, evidence-based care of surgical patients is evolving at an exponential rate.
We performed a literature search and, using consensus, identified recent articles we believe will have a great impact on perioperative cardiovascular medicine. These articles report studies that were presented at national meetings in 2018, including the Perioperative Medicine Summit, Society of General Internal Medicine, and Society of Hospital Medicine. These articles are grouped under 5 questions that will help guide clinical practice in perioperative cardiovascular medicine.
SHOULD ASPIRIN BE CONTINUED PERIOPERATIVELY IN PATIENTS WITH A CORONARY STENT?
The Perioperative Ischemic Evaluation 2 (POISE-2) trial1 found that giving aspirin before surgery and throughout the early postoperative period had no significant effect on the rate of a composite of death or nonfatal myocardial infarction; moreover, aspirin increased the risk of major bleeding. However, many experts felt uncomfortable stopping aspirin preoperatively in patients taking it for secondary prophylaxis, particularly patients with a coronary stent.
[Graham MM, Sessler DI, Parlow JL, et al. Aspirin in patients with previous percutaneous coronary intervention undergoing noncardiac surgery. Ann Intern Med 2018; 168(4):237–244.]
This post hoc subgroup analysis2 of POISE-2 evaluated the benefit and harm of perioperative aspirin in patients who had previously undergone percutaneous coronary intervention, more than 90% of whom had received a stent. Patients were age 45 or older with atherosclerotic heart disease or risk factors for it who had previously undergone percutaneous coronary intervention and were now undergoing noncardiac surgery.
Patients who had received a bare-metal stent within the previous 6 weeks or a drug-eluting stent within 12 months before surgery were excluded because guidelines at that time said to continue dual antiplatelet therapy for that long. Recommendations have since changed; the optimal duration for dual antiplatelet therapy with drug-eluting stents is now 6 months. Second-generation drug-eluting stents pose a lower risk of stent thrombosis and require a shorter duration of dual antiplatelet therapy than first-generation drug-eluting stents. Approximately 25% of the percutaneous coronary intervention subgroup had a drug-eluting stent, but the authors did not specify the type of drug-eluting stent.
The post hoc analysis2 included a subgroup of 234 of 4,998 patients receiving aspirin and 236 of 5,012 patients receiving placebo initiated within 4 hours before surgery and continued postoperatively. The primary outcome measured was the rate of death or nonfatal myocardial infarction within 30 days after surgery, and bleeding was a secondary outcome.
Findings. Although the overall POISE-2 study found no benefit from aspirin, in the subgroup who had previously undergone percutaneous coronary intervention, aspirin significantly reduced the risk of the primary outcome, which occurred in 6% vs 11.5% of the patients:
- Absolute risk reduction 5.5% (95% confidence interval 0.4%–10.5%)
- Hazard ratio 0.50 (0.26–0.95).
The reduction was primarily due to fewer myocardial infarctions:
- Absolute risk reduction 5.9% (1.0%–10.8%)
- Hazard ratio 0.44 (0.22–0.87).
The type of stent had no effect on the primary outcome, although this subgroup analysis had limited power. In the nonpercutaneous coronary intervention subgroup, there was no significant difference in outcomes between the aspirin and placebo groups. This subgroup analysis was underpowered to evaluate the effect of aspirin on the composite of major and life-threatening bleeding in patients with prior percutaneous coronary intervention, which was reported as “uncertain” due to wide confidence intervals (absolute risk increase 1.3%, 95% confidence interval –2.6% to 5.2%), but the increased risk of major or life-threatening bleeding with aspirin demonstrated in the overall POISE-2 study population likely applies:
- Absolute risk increase 0.8% (0.1%–1.6%)
- Hazard ratio 1.22 (1.01–1.48).
Limitations. This was a nonspecified subgroup analysis that was underpowered and had a relatively small sample size with few events.
Conclusion. In the absence of a very high bleeding risk, continuing aspirin perioperatively in patients with prior percutaneous coronary intervention undergoing noncardiac surgery is more likely to result in benefit than harm. This finding is in agreement with current recommendations from the American College Cardiology and American Heart Association (class I; level of evidence C).3
WHAT IS THE INCIDENCE OF MINS? IS MEASURING TROPONIN USEFUL?
Despite advances in anesthesia and surgical techniques, about 1% of patients over age 45 die within 30 days of noncardiac surgery.4 Studies have demonstrated a high mortality rate in patients who experience myocardial injury after noncardiac surgery (MINS), defined as elevations of troponin T with or without ischemic symptoms or electrocardiographic changes.5 Most of these studies used earlier, “non-high-sensitivity” troponin T assays. Fifth-generation, highly sensitive troponin T assays are now available that can detect troponin T at lower concentrations, but their utility in predicting postoperative outcomes remains uncertain. Two recent studies provide further insight into these issues.
[Writing Committee for the VISION Study Investigators, Devereaux PJ, Biccard BM, Sigamani A, et al. Association of postoperative high-sensitivity troponin levels with myocardial injury and 30-day mortality among patients undergoing noncardiac surgery. JAMA 2017; 317(16):1642–1651.]
The Vascular Events in Noncardiac Surgery Patients Cohort Evaluation (VISION) study5 was an international, prospective cohort study that initially evaluated the association between MINS and the 30-day mortality rate using a non-high-sensitivity troponin T assay (Roche fourth-generation Elecsys TnT assay) in patients age 45 or older undergoing noncardiac surgery and requiring hospital admission for at least 1 night. After the first 15,000 patients, the study switched to the Roche fifth-generation assay, with measurements at 6 to 12 hours after surgery and on postoperative days 1, 2, and 3.
A 2017 analysis by Devereaux et al6 included only these later-enrolled patients and correlated their high-sensitivity troponin T levels with 30-day mortality rates. Patients with a level 14 ng/L or higher, the upper limit of normal in this study, were also assessed for ischemic symptoms and electrocardiographic changes. Although not required by the study, more than 7,800 patients had their troponin T levels measured before surgery, and the absolute change was also analyzed for an association with the 30-day mortality rate.
Findings. Of the 21,842 patients, about two-thirds underwent some form of major surgery; some of them had more than 1 type. A total of 1.2% of the patients died within 30 days of surgery.

Based on their analysis, the authors proposed that MINS be defined as:
- A postoperative troponin T level of 65 ng/L or higher, or
- A level in the range of 20 ng/L to less than 65 ng/L with an absolute increase from the preoperative level at least 5 ng/L, not attributable to a nonischemic cause.
Seventeen percent of the study patients met these criteria, and of these, 21.7% met the universal definition of myocardial infarction, although only 6.9% had symptoms of it.
Limitations. Only 40.4% of the patients had a preoperative high-sensitivity troponin T measurement for comparison, and in 13.8% of patients who had an elevated perioperative measurement, their preoperative value was the same or higher than their postoperative one. Thus, the incidence of MINS may have been overestimated if patients were otherwise not known to have troponin T elevations before surgery.
[Puelacher C, Lurati Buse G, Seeberger D, et al. Perioperative myocardial injury after noncardiac surgery: incidence, mortality, and characterization. Circulation 2018; 137(12):1221–1232.]
Puelacher et al7 investigated the prevalence of MINS in 2,018 patients at increased cardiovascular risk (age ≥ 65, or age ≥ 45 with a history of coronary artery disease, peripheral vascular disease, or stroke) who underwent major noncardiac surgery (planned overnight stay ≥ 24 hours) at a university hospital in Switzerland. Patients had their troponin T measured with a high-sensitivity assay within 30 days before surgery and on postoperative days 1 and 2.
Instead of MINS, the investigators used the term “perioperative myocardial injury” (PMI), defined as an absolute increase in troponin T of at least 14 ng/L from before surgery to the peak postoperative reading. Similar to MINS, PMI did not require ischemic features, but in this study, noncardiac triggers (sepsis, stroke, or pulmonary embolus) were not excluded.
Findings. PMI occurred in 16% of surgeries, and of the patients with PMI, 6% had typical chest pain and 18% had any ischemic symptoms. Unlike in the POISE-2 study discussed above, PMI triggered an automatic referral to a cardiologist.
The unadjusted 30-day mortality rate was 8.9% among patients with PMI and 1.5% in those without. Multivariable logistic regression analysis showed an adjusted hazard ratio for 30-day mortality of 2.7 (95% CI 1.5–4.8) for those with PMI vs without, and this difference persisted for at least 1 year.
In patients with PMI, the authors compared the 30-day mortality rate of those with no ischemic signs or symptoms (71% of the patients) with those who met the criteria for myocardial infarction and found no difference. Patients with PMI triggered by a noncardiac event had a worse prognosis than those with a presumed cardiac etiology.
Limitations. Despite the multivariate analysis that included adjustment for age, nonelective surgery, and Revised Cardiac Risk Index (RCRI), the increased risk associated with PMI could simply reflect higher risk at baseline. Although PMI resulted in automatic referral to a cardiologist, only 10% of patients eventually underwent coronary angiography; a similar percentage were discharged with additional medical therapy such as aspirin, a statin, or a beta-blocker. The effect of these interventions is not known.
Conclusions. MINS is common and has a strong association with mortality risk proportional to the degree of troponin T elevation using high-sensitivity assays, consistent with data from previous studies of earlier assays. Because the mechanism of MINS may differ from that of myocardial infarction, its prevention and treatment may differ, and it remains unclear how serial measurement in postoperative patients should change clinical practice.
The recently published Dabigatran in Patients With Myocardial Injury After Non-cardiac Surgery (MANAGE) trial8 suggests that dabigatran may reduce arterial and venous complications in patients with MINS, but the study had a number of limitations that may restrict the clinical applicability of this finding.
While awaiting further clinical outcomes data, pre- and postoperative troponin T measurement may be beneficial in higher-risk patients (such as those with cardiovascular disease or multiple RCRI risk factors) if the information will change perioperative management.
WHAT IS THE ROLE OF HYPOTENSION OR BLOOD PRESSURE CONTROL?
Intraoperative hypotension is associated with organ ischemia, which may cause postoperative myocardial infarction, myocardial injury, and acute kidney injury.9 Traditional anesthesia practice is to maintain intraoperative blood pressure within 20% of the preoperative baseline, based on the notion that hypertensive patients require higher perfusion pressures.
[Futier E, Lefrant J-Y, Guinot P-G, et al. Effect of individualized vs standard blood pressure management strategies on postoperative organ dysfunction among high-risk patients undergoing major surgery: a randomized clinical trial. JAMA 2017; 318(14):1346–1357.]
Futier et al10 sought to address uncertainty in intraoperative and immediate postoperative management of systolic blood pressure. In this multicenter, randomized, parallel-group trial, 298 patients at increased risk of postoperative renal complications were randomized to blood pressure management that was either “individualized” (within 10% of resting systolic pressure) or “standard” (≥ 80 mm Hg or ≥ 40% of resting systolic pressure) from induction to 4 hours postoperatively.
Blood pressure was monitored using radial arterial lines and maintained using a combination of intravenous fluids, norepinephrine (the first-line agent for the individualized group), and ephedrine (in the standard treatment group only). The primary outcome was a composite of systemic inflammatory response syndrome (SIRS) and organ dysfunction affecting at least 1 organ system (cardiovascular, respiratory, renal, hematologic, or neurologic).
Findings. Data on the primary outcome were available for 292 of 298 patients enrolled. The mean age was 70 years, 15% were women, and 82% had previously diagnosed hypertension. Despite the requirement for an elevated risk of acute kidney injury, only 13% of the patients had a baseline estimated glomerular filtration rate of less than 60 mL/min/1.73 m2, and the median was 88 mL/min/1.73 m2. Ninety-five percent of patients underwent abdominal surgery, and 50% of the surgeries were elective.
The mean systolic blood pressure was 123 mm Hg in the individualized treatment group compared with 116 mm Hg in the standard treatment group. Despite this small difference, 96% of individualized treatment patients received norepinephrine, compared with 26% in the standard treatment group.
The primary outcome of SIRS with organ dysfunction occurred in 38.1% of patients in the individualized treatment group and 51.7% of those in the standard treatment group. After adjusting for center, surgical urgency, surgical site, and acute kidney injury risk index, the relative risk of developing SIRS in those receiving individualized management was 0.73 (P = .02). Renal dysfunction (based on Acute Dialysis Quality Initiative criteria11) occurred in 32.7% of individualized treatment patients and 49% of standardized treatment patients.
Limitations of this study included differences in pharmacologic approach to maintain blood pressure in the 2 protocols (ephedrine and fluids vs norepinephrine) and a modest sample size.
Conclusions. Despite this, the difference in organ dysfunction was striking, with a number needed to treat of only 7 patients. This intervention extended 4 hours postoperatively, a time when many of these patients have left the postanesthesia care unit and have returned to hospitalist care on inpatient wards.
While optimal management of intraoperative and immediate postoperative blood pressure may not be settled, this study suggests that even mild relative hypotension may justify immediate action. Further studies may be useful to delineate high- and low-risk populations, the timing of greatest risk, and indications for intraarterial blood pressure monitoring.
[Salmasi V, Maheswari K, Yang D, et al. Relationship between intraoperative hypotension, defined by either reduction from baseline or absolute thresholds, and acute kidney and myocardial injury after noncardiac surgery: a retrospective cohort analysis. Anesthesiology 2017; 126(1):47–65.]
This retrospective cohort study12 assessed the association between myocardial or kidney injury and absolute or relative thresholds of intraoperative mean arterial pressure. It included 57,315 adults who underwent inpatient noncardiac surgery, had a preoperative and at least 1 postoperative serum creatinine measurement within 7 days, and had blood pressure recorded in preoperative appointments within 6 months. Patients with chronic kidney disease (glomerular filtration rate < 60 mL/min/1.73 m2) and those on dialysis were excluded. The outcomes were MINS5 and acute kidney injury as defined by the Acute Kidney Injury Network.9
Findings. A mean arterial pressure below an absolute threshold of 65 mm Hg or a relative threshold of 20% lower than baseline value was associated with myocardial and kidney injury. At each threshold, prolonged periods of hypotension were associated with progressively increased risk.
An important conclusion of the study was that relative thresholds of mean arterial pressure were not any more predictive than absolute thresholds. Absolute thresholds are easier to use intraoperatively, especially when baseline values are not available. The authors did not find a clinically significant interaction between baseline blood pressure and the association of hypotension and myocardial and kidney injury.
Limitations included use of cardiac enzymes postoperatively to define MINS. Since these were not routinely collected, clinically silent myocardial injury may have been missed. Baseline blood pressure may have important implications in other forms of organ injury (ie, cerebral ischemia) that were not studied.
Summary. The lowest absolute mean arterial pressure is as predictive of postoperative myocardial and kidney injury as the relative pressure reduction, at least in patients with normal renal function. Limiting exposure to intraoperative hypotension is important. Baseline blood pressure values may have limited utility for intraoperative management.
In combination, these studies confirm that intraoperative hypotension is a predictor of postoperative organ dysfunction, but the definition and management remain unclear. While aggressive intraoperative management is likely beneficial, how to manage the antihypertensive therapy the patient has been taking as an outpatient when he or she comes into the hospital for surgery remains uncertain.
DOES PATENT FORAMEN OVALE INCREASE THE RISK OF STROKE?
Perioperative stroke is an uncommon, severe complication of noncardiac surgery. The pathophysiology has been better defined in cardiac than in noncardiac surgeries. In nonsurgical patients, patent foramen ovale (PFO) is associated with stroke, even in patients considered to be at low risk.13 Perioperative patients have additional risk for venous thromboembolism and may have periprocedural antithrombotic medications altered, increasing their risk of paradoxical embolism through the PFO.
[Ng PY, Ng AK, Subramaniam B, et al. Association of preoperatively diagnosed patent foramen ovale with perioperative ischemic stroke. JAMA 2018; 319(5):452–462.]
This retrospective cohort study of noncardiac surgery patients at 3 hospitals14 sought to determine the association of preoperatively diagnosed PFO with the risk of perioperative ischemic stroke identified by International Classification of Diseases diagnoses.
Of 150,198 patients, 1.0% had a preoperative diagnosis of PFO, and at baseline, those with PFO had significantly more comorbidities than those without PFO. Stroke occurred in 3.2% of patients with PFO vs 0.5% of those without. Patients known to have a PFO were much more likely to have cardiovascular and thromboembolic risk factors for stroke. In the adjusted analysis, the absolute risk difference between groups was 0.4% (95% CI 0.2–0.6%), with an estimated perioperative stroke risk of 5.9 per 1,000 in patients with known patent foramen ovale and 2.2 per 1,000 in those without. A diagnosis of PFO was also associated with increased risk of large-vessel-territory stroke and more severe neurologic deficit.
Further attempts to adjust for baseline risk factors and other potential bias, including a propensity score-matched cohort analysis and an analysis limited to patients who had echocardiography performed in the same healthcare system, still showed a higher risk of perioperative stroke among patients with preoperatively detected patent foramen ovale.
Limitations. The study was retrospective and observational, used administrative data, and had a low rate of PFO diagnosis (1%), compared with about 25% in population-based studies.15 Indications for preoperative echocardiography are unknown. In addition, the study specifically examined preoperatively diagnosed PFO, rather than including those diagnosed in the postoperative period.
Discussion. How does this study affect clinical practice? The absolute stroke risk was increased by 0.4% in patients with PFO compared with those without. Although this is a relatively small increase, millions of patients undergo noncardiac surgery annually. The risks of therapeutic anticoagulation or PFO closure are likely too high in this context; however, clinicians may approach the perioperative management of antiplatelet agents and venous thromboembolism prophylaxis in patients with known PFO with additional caution.
HOW DOES TIMING OF EMERGENCY SURGERY AFTER PRIOR STROKE AFFECT OUTCOMES?
A history of stroke or transient ischemic attack is a known risk factor for perioperative vascular complications. A recent large cohort study demonstrated that a history of stroke within 9 months of elective surgery was associated with increased adverse outcomes.16 Little is known, however, of the perioperative risk in patients with a history of stroke who undergo emergency surgery.
[Christiansen MN, Andersson C, Gislason GH, et al. Risks of cardiovascular adverse events and death in patients with previous stroke undergoing emergency noncardiac, nonintracranial surgery: the importance of operative timing. Anesthesiology 2017; 127(1):9–19.]
In this study,17 all emergency noncardiac and nonintracranial surgeries from 2005 to 2011 were analyzed using multiple national patient registries in Denmark according to time elapsed between previous stroke and surgery. Primary outcomes were 30-day all-cause mortality and 30-day major adverse cardiac events (MACE), defined as nonfatal ischemic stroke, nonfatal myocardial infarction, and cardiovascular death. Statistical analysis to assess the risk of adverse outcomes included logistic regression models, spline analyses, and propensity-score matching.
Findings. The authors identified 146,694 emergency surgeries, with 7,861 patients (5.4%) having had a previous stroke (transient ischemic attacks and hemorrhagic strokes were not included). Rates of postoperative stroke were as follows:
- 9.9% in patents with a history of ischemic stroke within 3 months of surgery
- 2.8% in patients with a history of stroke 3 to 9 months before surgery
- 0.3% in patients with no previous stroke.
The risk plateaued when the time between stroke and surgery exceeded 4 to 5 months.15
Interestingly, in patients who underwent emergency surgery within 14 days of stroke, the risk of MACE was significantly lower immediately after surgery (1–3 days after stroke) compared with surgery that took place 4 to 14 days after stroke. The authors hypothesized that because cerebral autoregulation does not become compromised until approximately 5 days after a stroke, the risk was lower 1 to 3 days after surgery and increased thereafter.
Limitations of this study included the possibility of residual confounding, given its retrospective design using administrative data, not accounting for preoperative antithrombotic and anticoagulation therapy, and lack of information regarding the etiology of recurrent stroke (eg, thromboembolic, atherothrombotic, hypoperfusion).
Conclusions. Although it would be impractical to postpone emergency surgery in a patient who recently had a stroke, this study shows that the incidence rates of postoperative recurrent stroke and MACE are high. Therefore, it is important that the patient and perioperative team be aware of the risk. Further research is needed to confirm these estimates of postoperative adverse events in more diverse patient populations.
- Devereaux PJ, Mrkobrada M, Sessler DI, et al. Aspirin in patients undergoing noncardiac surgery. N Engl J Med 2014; 370(16):1494–1503. doi:10.1056/NEJMoa1401105
- Graham MM, Sessler DI, Parlow JL, et al. Aspirin in patients with previous percutaneous coronary intervention undergoing noncardiac surgery. Ann Intern Med 2018; 168(4):237–244. doi:10.7326/M17-2341
- Fleisher LA, Fleischmann KE, Auerbach AD, et al. 2014 ACC/AHA guideline on perioperative cardiovascular evaluation and management of patients undergoing noncardiac surgery: a report of the American College of Cardiology/American Heart Association Task Force on Practice Guidelines. Circulation 2014; 130(24):2215–2245. doi:10.1161/CIR.0000000000000105
- Smilowitz NR, Gupta N, Ramakrishna H, Guo Y, Berger JS, Bangalore S. Perioperative major adverse cardiovascular and cerebrovascular events associated with noncardiac surgery. JAMA Cardiol 2017; 2(2):181–187. doi:10.1001/jamacardio.2016.4792
- Botto F, Alonso-Coello P, Chan MT, et al. Myocardial injury after noncardiac surgery: a large, international, prospective cohort study establishing diagnostic criteria, characteristics, predictors, and 30-day outcomes. Anesthesiology 2014; 120(3):564–578. doi:10.1097/ALN.0000000000000113
- Writing Committee for the VISION Study Investigators, Devereaux PJ, Biccard BM, Sigamani A, et al. Association of postoperative high-sensitivity troponin levels with myocardial injury and 30-day mortality among patients undergoing noncardiac surgery. JAMA 2017; 317(16):1642–1651. doi:10.1001/jama.2017.4360
- Puelacher C, Lurati Buse G, Seeberger D, et al. Perioperative myocardial injury after noncardiac surgery: incidence, mortality, and characterization. Circulation 2018; 137(12):1221–1232. doi:10.1161/CIRCULATIONAHA.117.030114
- Devereaux PJ, Duceppe E, Guyatt G, et al. Dabigatran in patients with myocardial injury after non-cardiac surgery (MANAGE): an international, randomised, placebo-controlled trial. Lancet 2018; 391(10137):2325–2334. doi:10.1016/S0140-6736(18)30832-8
- Walsh M, Devereaux PJ, Garg AX, et al. Relationship between intraoperative mean arterial pressure and clinical outcomes after noncardiac surgery: toward an empirical definition of hypotension. Anesthesiology 2013; 119(3):507–515. doi:10.1097/ALN.0b013e3182a10e26
- Futier E, Lefrant JY, Guinot PG, et al. Effect of individualized vs standard blood pressure management strategies on postoperative organ dysfunction among high-risk patients undergoing major surgery: a randomized clinical trial. JAMA 2017; 318(14):1346–1357. doi:10.1001/jama.2017.14172
- Bellomo R, Ronco C, Kellum JA, Mehta RL, Palevsky P; Acute Dialysis Quality Initiative workgroup. Acute renal failure—definition, outcome measures, animal models, fluid therapy and information technology needs: the Second International Consensus Conference of the Acute Dialysis Quality Initiative (ADQI) group. Crit Care 2004; 8:R204. doi:10.1186/cc2872
- Salmasi V, Maheswari K, Yang D, et al. Relationship between intraoperative hypotension, defined by either reduction from baseline or absolute thresholds, and acute kidney and myocardial injury after noncardiac surgery: a retrospective cohort analysis. Anesthesiology 2017; 126(1):47–65. doi:10.1097/ALN.0000000000001432
- Lechat P, Mas JL, Lascault G, et al. Prevalence of patent foramen ovale in patients with stroke. N Engl J Med 1988; 318(18):1148–1152. doi:10.1056/NEJM198805053181802
- Ng PY, Ng AK, Subramaniam B, et al. Association of preoperatively diagnosed patent foramen ovale with perioperative ischemic stroke. JAMA 2018; 319(5):452–462. doi:10.1001/jama.2017.21899
- Meissner I, Whisnant JP, Khandheria BK, et al. Prevalence of potential risk factors for stroke assessed by transesophageal echocardiography and carotid ultrasonography: the SPARC study. Stroke Prevention: Assessment of Risk in a Community. Mayo Clin Proc 1999; 74(9):862–869. pmid:10488786
- Jørgensen ME, Torp-Pedersen C, Gislason GH, et al. Time elapsed after ischemic stroke and risk of adverse cardiovascular events and mortality following elective noncardiac surgery. JAMA 2014; 312:269–277. doi:10.1001/jama.2014.8165
- Christiansen MN, Andersson C, Gislason GH, et al. Risks of cardiovascular adverse events and death in patients with previous stroke undergoing emergency noncardiac, nonintracranial surgery: the importance of operative timing. Anesthesiology 2017; 127(1):9–19. doi:10.1097/ALN.0000000000001685
A plethora of studies are under way in the field of perioperative medicine. As a result, evidence-based care of surgical patients is evolving at an exponential rate.
We performed a literature search and, using consensus, identified recent articles we believe will have a great impact on perioperative cardiovascular medicine. These articles report studies that were presented at national meetings in 2018, including the Perioperative Medicine Summit, Society of General Internal Medicine, and Society of Hospital Medicine. These articles are grouped under 5 questions that will help guide clinical practice in perioperative cardiovascular medicine.
SHOULD ASPIRIN BE CONTINUED PERIOPERATIVELY IN PATIENTS WITH A CORONARY STENT?
The Perioperative Ischemic Evaluation 2 (POISE-2) trial1 found that giving aspirin before surgery and throughout the early postoperative period had no significant effect on the rate of a composite of death or nonfatal myocardial infarction; moreover, aspirin increased the risk of major bleeding. However, many experts felt uncomfortable stopping aspirin preoperatively in patients taking it for secondary prophylaxis, particularly patients with a coronary stent.
[Graham MM, Sessler DI, Parlow JL, et al. Aspirin in patients with previous percutaneous coronary intervention undergoing noncardiac surgery. Ann Intern Med 2018; 168(4):237–244.]
This post hoc subgroup analysis2 of POISE-2 evaluated the benefit and harm of perioperative aspirin in patients who had previously undergone percutaneous coronary intervention, more than 90% of whom had received a stent. Patients were age 45 or older with atherosclerotic heart disease or risk factors for it who had previously undergone percutaneous coronary intervention and were now undergoing noncardiac surgery.
Patients who had received a bare-metal stent within the previous 6 weeks or a drug-eluting stent within 12 months before surgery were excluded because guidelines at that time said to continue dual antiplatelet therapy for that long. Recommendations have since changed; the optimal duration for dual antiplatelet therapy with drug-eluting stents is now 6 months. Second-generation drug-eluting stents pose a lower risk of stent thrombosis and require a shorter duration of dual antiplatelet therapy than first-generation drug-eluting stents. Approximately 25% of the percutaneous coronary intervention subgroup had a drug-eluting stent, but the authors did not specify the type of drug-eluting stent.
The post hoc analysis2 included a subgroup of 234 of 4,998 patients receiving aspirin and 236 of 5,012 patients receiving placebo initiated within 4 hours before surgery and continued postoperatively. The primary outcome measured was the rate of death or nonfatal myocardial infarction within 30 days after surgery, and bleeding was a secondary outcome.
Findings. Although the overall POISE-2 study found no benefit from aspirin, in the subgroup who had previously undergone percutaneous coronary intervention, aspirin significantly reduced the risk of the primary outcome, which occurred in 6% vs 11.5% of the patients:
- Absolute risk reduction 5.5% (95% confidence interval 0.4%–10.5%)
- Hazard ratio 0.50 (0.26–0.95).
The reduction was primarily due to fewer myocardial infarctions:
- Absolute risk reduction 5.9% (1.0%–10.8%)
- Hazard ratio 0.44 (0.22–0.87).
The type of stent had no effect on the primary outcome, although this subgroup analysis had limited power. In the nonpercutaneous coronary intervention subgroup, there was no significant difference in outcomes between the aspirin and placebo groups. This subgroup analysis was underpowered to evaluate the effect of aspirin on the composite of major and life-threatening bleeding in patients with prior percutaneous coronary intervention, which was reported as “uncertain” due to wide confidence intervals (absolute risk increase 1.3%, 95% confidence interval –2.6% to 5.2%), but the increased risk of major or life-threatening bleeding with aspirin demonstrated in the overall POISE-2 study population likely applies:
- Absolute risk increase 0.8% (0.1%–1.6%)
- Hazard ratio 1.22 (1.01–1.48).
Limitations. This was a nonspecified subgroup analysis that was underpowered and had a relatively small sample size with few events.
Conclusion. In the absence of a very high bleeding risk, continuing aspirin perioperatively in patients with prior percutaneous coronary intervention undergoing noncardiac surgery is more likely to result in benefit than harm. This finding is in agreement with current recommendations from the American College Cardiology and American Heart Association (class I; level of evidence C).3
WHAT IS THE INCIDENCE OF MINS? IS MEASURING TROPONIN USEFUL?
Despite advances in anesthesia and surgical techniques, about 1% of patients over age 45 die within 30 days of noncardiac surgery.4 Studies have demonstrated a high mortality rate in patients who experience myocardial injury after noncardiac surgery (MINS), defined as elevations of troponin T with or without ischemic symptoms or electrocardiographic changes.5 Most of these studies used earlier, “non-high-sensitivity” troponin T assays. Fifth-generation, highly sensitive troponin T assays are now available that can detect troponin T at lower concentrations, but their utility in predicting postoperative outcomes remains uncertain. Two recent studies provide further insight into these issues.
[Writing Committee for the VISION Study Investigators, Devereaux PJ, Biccard BM, Sigamani A, et al. Association of postoperative high-sensitivity troponin levels with myocardial injury and 30-day mortality among patients undergoing noncardiac surgery. JAMA 2017; 317(16):1642–1651.]
The Vascular Events in Noncardiac Surgery Patients Cohort Evaluation (VISION) study5 was an international, prospective cohort study that initially evaluated the association between MINS and the 30-day mortality rate using a non-high-sensitivity troponin T assay (Roche fourth-generation Elecsys TnT assay) in patients age 45 or older undergoing noncardiac surgery and requiring hospital admission for at least 1 night. After the first 15,000 patients, the study switched to the Roche fifth-generation assay, with measurements at 6 to 12 hours after surgery and on postoperative days 1, 2, and 3.
A 2017 analysis by Devereaux et al6 included only these later-enrolled patients and correlated their high-sensitivity troponin T levels with 30-day mortality rates. Patients with a level 14 ng/L or higher, the upper limit of normal in this study, were also assessed for ischemic symptoms and electrocardiographic changes. Although not required by the study, more than 7,800 patients had their troponin T levels measured before surgery, and the absolute change was also analyzed for an association with the 30-day mortality rate.
Findings. Of the 21,842 patients, about two-thirds underwent some form of major surgery; some of them had more than 1 type. A total of 1.2% of the patients died within 30 days of surgery.
Based on their analysis, the authors proposed that MINS be defined as:
- A postoperative troponin T level of 65 ng/L or higher, or
- A level in the range of 20 ng/L to less than 65 ng/L with an absolute increase from the preoperative level at least 5 ng/L, not attributable to a nonischemic cause.
Seventeen percent of the study patients met these criteria, and of these, 21.7% met the universal definition of myocardial infarction, although only 6.9% had symptoms of it.
Limitations. Only 40.4% of the patients had a preoperative high-sensitivity troponin T measurement for comparison, and in 13.8% of patients who had an elevated perioperative measurement, their preoperative value was the same or higher than their postoperative one. Thus, the incidence of MINS may have been overestimated if patients were otherwise not known to have troponin T elevations before surgery.
[Puelacher C, Lurati Buse G, Seeberger D, et al. Perioperative myocardial injury after noncardiac surgery: incidence, mortality, and characterization. Circulation 2018; 137(12):1221–1232.]
Puelacher et al7 investigated the prevalence of MINS in 2,018 patients at increased cardiovascular risk (age ≥ 65, or age ≥ 45 with a history of coronary artery disease, peripheral vascular disease, or stroke) who underwent major noncardiac surgery (planned overnight stay ≥ 24 hours) at a university hospital in Switzerland. Patients had their troponin T measured with a high-sensitivity assay within 30 days before surgery and on postoperative days 1 and 2.
Instead of MINS, the investigators used the term “perioperative myocardial injury” (PMI), defined as an absolute increase in troponin T of at least 14 ng/L from before surgery to the peak postoperative reading. Similar to MINS, PMI did not require ischemic features, but in this study, noncardiac triggers (sepsis, stroke, or pulmonary embolus) were not excluded.
Findings. PMI occurred in 16% of surgeries, and of the patients with PMI, 6% had typical chest pain and 18% had any ischemic symptoms. Unlike in the POISE-2 study discussed above, PMI triggered an automatic referral to a cardiologist.
The unadjusted 30-day mortality rate was 8.9% among patients with PMI and 1.5% in those without. Multivariable logistic regression analysis showed an adjusted hazard ratio for 30-day mortality of 2.7 (95% CI 1.5–4.8) for those with PMI vs without, and this difference persisted for at least 1 year.
In patients with PMI, the authors compared the 30-day mortality rate of those with no ischemic signs or symptoms (71% of the patients) with those who met the criteria for myocardial infarction and found no difference. Patients with PMI triggered by a noncardiac event had a worse prognosis than those with a presumed cardiac etiology.
Limitations. Despite the multivariate analysis that included adjustment for age, nonelective surgery, and Revised Cardiac Risk Index (RCRI), the increased risk associated with PMI could simply reflect higher risk at baseline. Although PMI resulted in automatic referral to a cardiologist, only 10% of patients eventually underwent coronary angiography; a similar percentage were discharged with additional medical therapy such as aspirin, a statin, or a beta-blocker. The effect of these interventions is not known.
Conclusions. MINS is common and has a strong association with mortality risk proportional to the degree of troponin T elevation using high-sensitivity assays, consistent with data from previous studies of earlier assays. Because the mechanism of MINS may differ from that of myocardial infarction, its prevention and treatment may differ, and it remains unclear how serial measurement in postoperative patients should change clinical practice.
The recently published Dabigatran in Patients With Myocardial Injury After Non-cardiac Surgery (MANAGE) trial8 suggests that dabigatran may reduce arterial and venous complications in patients with MINS, but the study had a number of limitations that may restrict the clinical applicability of this finding.
While awaiting further clinical outcomes data, pre- and postoperative troponin T measurement may be beneficial in higher-risk patients (such as those with cardiovascular disease or multiple RCRI risk factors) if the information will change perioperative management.
WHAT IS THE ROLE OF HYPOTENSION OR BLOOD PRESSURE CONTROL?
Intraoperative hypotension is associated with organ ischemia, which may cause postoperative myocardial infarction, myocardial injury, and acute kidney injury.9 Traditional anesthesia practice is to maintain intraoperative blood pressure within 20% of the preoperative baseline, based on the notion that hypertensive patients require higher perfusion pressures.
[Futier E, Lefrant J-Y, Guinot P-G, et al. Effect of individualized vs standard blood pressure management strategies on postoperative organ dysfunction among high-risk patients undergoing major surgery: a randomized clinical trial. JAMA 2017; 318(14):1346–1357.]
Futier et al10 sought to address uncertainty in intraoperative and immediate postoperative management of systolic blood pressure. In this multicenter, randomized, parallel-group trial, 298 patients at increased risk of postoperative renal complications were randomized to blood pressure management that was either “individualized” (within 10% of resting systolic pressure) or “standard” (≥ 80 mm Hg or ≥ 40% of resting systolic pressure) from induction to 4 hours postoperatively.
Blood pressure was monitored using radial arterial lines and maintained using a combination of intravenous fluids, norepinephrine (the first-line agent for the individualized group), and ephedrine (in the standard treatment group only). The primary outcome was a composite of systemic inflammatory response syndrome (SIRS) and organ dysfunction affecting at least 1 organ system (cardiovascular, respiratory, renal, hematologic, or neurologic).
Findings. Data on the primary outcome were available for 292 of 298 patients enrolled. The mean age was 70 years, 15% were women, and 82% had previously diagnosed hypertension. Despite the requirement for an elevated risk of acute kidney injury, only 13% of the patients had a baseline estimated glomerular filtration rate of less than 60 mL/min/1.73 m2, and the median was 88 mL/min/1.73 m2. Ninety-five percent of patients underwent abdominal surgery, and 50% of the surgeries were elective.
The mean systolic blood pressure was 123 mm Hg in the individualized treatment group compared with 116 mm Hg in the standard treatment group. Despite this small difference, 96% of individualized treatment patients received norepinephrine, compared with 26% in the standard treatment group.
The primary outcome of SIRS with organ dysfunction occurred in 38.1% of patients in the individualized treatment group and 51.7% of those in the standard treatment group. After adjusting for center, surgical urgency, surgical site, and acute kidney injury risk index, the relative risk of developing SIRS in those receiving individualized management was 0.73 (P = .02). Renal dysfunction (based on Acute Dialysis Quality Initiative criteria11) occurred in 32.7% of individualized treatment patients and 49% of standardized treatment patients.
Limitations of this study included differences in pharmacologic approach to maintain blood pressure in the 2 protocols (ephedrine and fluids vs norepinephrine) and a modest sample size.
Conclusions. Despite this, the difference in organ dysfunction was striking, with a number needed to treat of only 7 patients. This intervention extended 4 hours postoperatively, a time when many of these patients have left the postanesthesia care unit and have returned to hospitalist care on inpatient wards.
While optimal management of intraoperative and immediate postoperative blood pressure may not be settled, this study suggests that even mild relative hypotension may justify immediate action. Further studies may be useful to delineate high- and low-risk populations, the timing of greatest risk, and indications for intraarterial blood pressure monitoring.
[Salmasi V, Maheswari K, Yang D, et al. Relationship between intraoperative hypotension, defined by either reduction from baseline or absolute thresholds, and acute kidney and myocardial injury after noncardiac surgery: a retrospective cohort analysis. Anesthesiology 2017; 126(1):47–65.]
This retrospective cohort study12 assessed the association between myocardial or kidney injury and absolute or relative thresholds of intraoperative mean arterial pressure. It included 57,315 adults who underwent inpatient noncardiac surgery, had a preoperative and at least 1 postoperative serum creatinine measurement within 7 days, and had blood pressure recorded in preoperative appointments within 6 months. Patients with chronic kidney disease (glomerular filtration rate < 60 mL/min/1.73 m2) and those on dialysis were excluded. The outcomes were MINS5 and acute kidney injury as defined by the Acute Kidney Injury Network.9
Findings. A mean arterial pressure below an absolute threshold of 65 mm Hg or a relative threshold of 20% lower than baseline value was associated with myocardial and kidney injury. At each threshold, prolonged periods of hypotension were associated with progressively increased risk.
An important conclusion of the study was that relative thresholds of mean arterial pressure were not any more predictive than absolute thresholds. Absolute thresholds are easier to use intraoperatively, especially when baseline values are not available. The authors did not find a clinically significant interaction between baseline blood pressure and the association of hypotension and myocardial and kidney injury.
Limitations included use of cardiac enzymes postoperatively to define MINS. Since these were not routinely collected, clinically silent myocardial injury may have been missed. Baseline blood pressure may have important implications in other forms of organ injury (ie, cerebral ischemia) that were not studied.
Summary. The lowest absolute mean arterial pressure is as predictive of postoperative myocardial and kidney injury as the relative pressure reduction, at least in patients with normal renal function. Limiting exposure to intraoperative hypotension is important. Baseline blood pressure values may have limited utility for intraoperative management.
In combination, these studies confirm that intraoperative hypotension is a predictor of postoperative organ dysfunction, but the definition and management remain unclear. While aggressive intraoperative management is likely beneficial, how to manage the antihypertensive therapy the patient has been taking as an outpatient when he or she comes into the hospital for surgery remains uncertain.
DOES PATENT FORAMEN OVALE INCREASE THE RISK OF STROKE?
Perioperative stroke is an uncommon, severe complication of noncardiac surgery. The pathophysiology has been better defined in cardiac than in noncardiac surgeries. In nonsurgical patients, patent foramen ovale (PFO) is associated with stroke, even in patients considered to be at low risk.13 Perioperative patients have additional risk for venous thromboembolism and may have periprocedural antithrombotic medications altered, increasing their risk of paradoxical embolism through the PFO.
[Ng PY, Ng AK, Subramaniam B, et al. Association of preoperatively diagnosed patent foramen ovale with perioperative ischemic stroke. JAMA 2018; 319(5):452–462.]
This retrospective cohort study of noncardiac surgery patients at 3 hospitals14 sought to determine the association of preoperatively diagnosed PFO with the risk of perioperative ischemic stroke identified by International Classification of Diseases diagnoses.
Of 150,198 patients, 1.0% had a preoperative diagnosis of PFO, and at baseline, those with PFO had significantly more comorbidities than those without PFO. Stroke occurred in 3.2% of patients with PFO vs 0.5% of those without. Patients known to have a PFO were much more likely to have cardiovascular and thromboembolic risk factors for stroke. In the adjusted analysis, the absolute risk difference between groups was 0.4% (95% CI 0.2–0.6%), with an estimated perioperative stroke risk of 5.9 per 1,000 in patients with known patent foramen ovale and 2.2 per 1,000 in those without. A diagnosis of PFO was also associated with increased risk of large-vessel-territory stroke and more severe neurologic deficit.
Further attempts to adjust for baseline risk factors and other potential bias, including a propensity score-matched cohort analysis and an analysis limited to patients who had echocardiography performed in the same healthcare system, still showed a higher risk of perioperative stroke among patients with preoperatively detected patent foramen ovale.
Limitations. The study was retrospective and observational, used administrative data, and had a low rate of PFO diagnosis (1%), compared with about 25% in population-based studies.15 Indications for preoperative echocardiography are unknown. In addition, the study specifically examined preoperatively diagnosed PFO, rather than including those diagnosed in the postoperative period.
Discussion. How does this study affect clinical practice? The absolute stroke risk was increased by 0.4% in patients with PFO compared with those without. Although this is a relatively small increase, millions of patients undergo noncardiac surgery annually. The risks of therapeutic anticoagulation or PFO closure are likely too high in this context; however, clinicians may approach the perioperative management of antiplatelet agents and venous thromboembolism prophylaxis in patients with known PFO with additional caution.
HOW DOES TIMING OF EMERGENCY SURGERY AFTER PRIOR STROKE AFFECT OUTCOMES?
A history of stroke or transient ischemic attack is a known risk factor for perioperative vascular complications. A recent large cohort study demonstrated that a history of stroke within 9 months of elective surgery was associated with increased adverse outcomes.16 Little is known, however, of the perioperative risk in patients with a history of stroke who undergo emergency surgery.
[Christiansen MN, Andersson C, Gislason GH, et al. Risks of cardiovascular adverse events and death in patients with previous stroke undergoing emergency noncardiac, nonintracranial surgery: the importance of operative timing. Anesthesiology 2017; 127(1):9–19.]
In this study,17 all emergency noncardiac and nonintracranial surgeries from 2005 to 2011 were analyzed using multiple national patient registries in Denmark according to time elapsed between previous stroke and surgery. Primary outcomes were 30-day all-cause mortality and 30-day major adverse cardiac events (MACE), defined as nonfatal ischemic stroke, nonfatal myocardial infarction, and cardiovascular death. Statistical analysis to assess the risk of adverse outcomes included logistic regression models, spline analyses, and propensity-score matching.
Findings. The authors identified 146,694 emergency surgeries, with 7,861 patients (5.4%) having had a previous stroke (transient ischemic attacks and hemorrhagic strokes were not included). Rates of postoperative stroke were as follows:
- 9.9% in patents with a history of ischemic stroke within 3 months of surgery
- 2.8% in patients with a history of stroke 3 to 9 months before surgery
- 0.3% in patients with no previous stroke.
The risk plateaued when the time between stroke and surgery exceeded 4 to 5 months.15
Interestingly, in patients who underwent emergency surgery within 14 days of stroke, the risk of MACE was significantly lower immediately after surgery (1–3 days after stroke) compared with surgery that took place 4 to 14 days after stroke. The authors hypothesized that because cerebral autoregulation does not become compromised until approximately 5 days after a stroke, the risk was lower 1 to 3 days after surgery and increased thereafter.
Limitations of this study included the possibility of residual confounding, given its retrospective design using administrative data, not accounting for preoperative antithrombotic and anticoagulation therapy, and lack of information regarding the etiology of recurrent stroke (eg, thromboembolic, atherothrombotic, hypoperfusion).
Conclusions. Although it would be impractical to postpone emergency surgery in a patient who recently had a stroke, this study shows that the incidence rates of postoperative recurrent stroke and MACE are high. Therefore, it is important that the patient and perioperative team be aware of the risk. Further research is needed to confirm these estimates of postoperative adverse events in more diverse patient populations.
- Devereaux PJ, Mrkobrada M, Sessler DI, et al. Aspirin in patients undergoing noncardiac surgery. N Engl J Med 2014; 370(16):1494–1503. doi:10.1056/NEJMoa1401105
- Graham MM, Sessler DI, Parlow JL, et al. Aspirin in patients with previous percutaneous coronary intervention undergoing noncardiac surgery. Ann Intern Med 2018; 168(4):237–244. doi:10.7326/M17-2341
- Fleisher LA, Fleischmann KE, Auerbach AD, et al. 2014 ACC/AHA guideline on perioperative cardiovascular evaluation and management of patients undergoing noncardiac surgery: a report of the American College of Cardiology/American Heart Association Task Force on Practice Guidelines. Circulation 2014; 130(24):2215–2245. doi:10.1161/CIR.0000000000000105
- Smilowitz NR, Gupta N, Ramakrishna H, Guo Y, Berger JS, Bangalore S. Perioperative major adverse cardiovascular and cerebrovascular events associated with noncardiac surgery. JAMA Cardiol 2017; 2(2):181–187. doi:10.1001/jamacardio.2016.4792
- Botto F, Alonso-Coello P, Chan MT, et al. Myocardial injury after noncardiac surgery: a large, international, prospective cohort study establishing diagnostic criteria, characteristics, predictors, and 30-day outcomes. Anesthesiology 2014; 120(3):564–578. doi:10.1097/ALN.0000000000000113
- Writing Committee for the VISION Study Investigators, Devereaux PJ, Biccard BM, Sigamani A, et al. Association of postoperative high-sensitivity troponin levels with myocardial injury and 30-day mortality among patients undergoing noncardiac surgery. JAMA 2017; 317(16):1642–1651. doi:10.1001/jama.2017.4360
- Puelacher C, Lurati Buse G, Seeberger D, et al. Perioperative myocardial injury after noncardiac surgery: incidence, mortality, and characterization. Circulation 2018; 137(12):1221–1232. doi:10.1161/CIRCULATIONAHA.117.030114
- Devereaux PJ, Duceppe E, Guyatt G, et al. Dabigatran in patients with myocardial injury after non-cardiac surgery (MANAGE): an international, randomised, placebo-controlled trial. Lancet 2018; 391(10137):2325–2334. doi:10.1016/S0140-6736(18)30832-8
- Walsh M, Devereaux PJ, Garg AX, et al. Relationship between intraoperative mean arterial pressure and clinical outcomes after noncardiac surgery: toward an empirical definition of hypotension. Anesthesiology 2013; 119(3):507–515. doi:10.1097/ALN.0b013e3182a10e26
- Futier E, Lefrant JY, Guinot PG, et al. Effect of individualized vs standard blood pressure management strategies on postoperative organ dysfunction among high-risk patients undergoing major surgery: a randomized clinical trial. JAMA 2017; 318(14):1346–1357. doi:10.1001/jama.2017.14172
- Bellomo R, Ronco C, Kellum JA, Mehta RL, Palevsky P; Acute Dialysis Quality Initiative workgroup. Acute renal failure—definition, outcome measures, animal models, fluid therapy and information technology needs: the Second International Consensus Conference of the Acute Dialysis Quality Initiative (ADQI) group. Crit Care 2004; 8:R204. doi:10.1186/cc2872
- Salmasi V, Maheswari K, Yang D, et al. Relationship between intraoperative hypotension, defined by either reduction from baseline or absolute thresholds, and acute kidney and myocardial injury after noncardiac surgery: a retrospective cohort analysis. Anesthesiology 2017; 126(1):47–65. doi:10.1097/ALN.0000000000001432
- Lechat P, Mas JL, Lascault G, et al. Prevalence of patent foramen ovale in patients with stroke. N Engl J Med 1988; 318(18):1148–1152. doi:10.1056/NEJM198805053181802
- Ng PY, Ng AK, Subramaniam B, et al. Association of preoperatively diagnosed patent foramen ovale with perioperative ischemic stroke. JAMA 2018; 319(5):452–462. doi:10.1001/jama.2017.21899
- Meissner I, Whisnant JP, Khandheria BK, et al. Prevalence of potential risk factors for stroke assessed by transesophageal echocardiography and carotid ultrasonography: the SPARC study. Stroke Prevention: Assessment of Risk in a Community. Mayo Clin Proc 1999; 74(9):862–869. pmid:10488786
- Jørgensen ME, Torp-Pedersen C, Gislason GH, et al. Time elapsed after ischemic stroke and risk of adverse cardiovascular events and mortality following elective noncardiac surgery. JAMA 2014; 312:269–277. doi:10.1001/jama.2014.8165
- Christiansen MN, Andersson C, Gislason GH, et al. Risks of cardiovascular adverse events and death in patients with previous stroke undergoing emergency noncardiac, nonintracranial surgery: the importance of operative timing. Anesthesiology 2017; 127(1):9–19. doi:10.1097/ALN.0000000000001685
KEY POINTS
- Patients undergoing noncardiac surgery who have a history of percutaneous coronary intervention will benefit from continuing aspirin perioperatively if they are not at very high risk of bleeding.
- Myocardial injury after noncardiac surgery is strongly associated with a risk of death, and the higher the troponin level, the higher the risk. Measuring troponin T before and after surgery may be beneficial in patients at high risk if the information leads to a change in management.
- Perioperative hypotension can lead to end-organ dysfunction postoperatively. There is conflicting evidence whether the absolute or relative reduction in blood pressure is more predictive.
- Perioperative risk of stroke is higher in patients with patent foramen ovale than in those without.
- Many patients who recently had a stroke suffer recurrent stroke and major adverse cardiac events if they undergo emergency surgery.

Which patients with pulmonary embolism need echocardiography?
Most patients admitted with pulmonary embolism (PE) do not need transthoracic echocardiography (TTE); it should be performed in hemodynamically unstable patients, as well as in hemodynamically stable patients with specific elevated cardiac biomarkers and imaging features.
The decision to perform TTE should be based on clinical presentation, PE burden, and imaging findings (eg, computed tomographic angiography). TTE helps to stratify risk, guide management, monitor response to therapy, and give prognostic information for a subset of patients at increased risk for PE-related adverse events.
RISK STRATIFICATION IN PULMONARY EMBOLISM
PE has a spectrum of presentations ranging from no symptoms to shock. Based on the clinical presentation, PE can be categorized as high, intermediate, or low risk.
High-risk PE, often referred to as “massive” PE, is defined in current American Heart Association guidelines as acute PE with sustained hypotension (systolic blood pressure < 90 mm Hg for at least 15 minutes or requiring inotropic support), persistent profound bradycardia (heart rate < 40 beats per minute with signs or symptoms of shock), syncope, or cardiac arrest.1
Intermediate-risk or “submassive” PE is more challenging to identify because patients are more hemodynamically stable, yet have evidence on electrocardiography, TTE, computed tomography, or cardiac biomarker testing—ie, N-terminal pro-B-type natriuretic peptide (NT-proBNP) or troponin—that indicates myocardial injury or volume overload.1
Low-risk PE is acute PE in the absence of clinical markers of adverse prognosis that define massive or submassive PE.1


ECHOCARDIOGRAPHIC FEATURES OF HIGH-RISK PULMONARY EMBOLISM
Certain TTE findings suggest increased risk of a poor outcome and may warrant therapy that is more invasive and aggressive. High-risk features include the following:
- Impaired right ventricular function
- Interventricular septum bulging into the left ventricle (“D-shaped” septum)
- Dilated proximal pulmonary arteries
- Increased severity of tricuspid regurgitation
- Elevated right atrial pressure
- Elevated pulmonary artery pressure
- Free-floating right ventricular thrombi, which are associated with a mortality rate of up to 45% and can be detected in 7% to 18% of patients6
- Tricuspid annular plane systolic excursion, an echocardiographic measure of right ventricular function1; a value less than 17 mm suggests impaired right ventricular systolic function7
- The McConnell sign, a feature of acute massive PE: akinesia of the mid-free wall of the right ventricle and hypercontractility of the apex.
These TTE findings often lead to treatment with thrombolysis, transfer to the intensive care unit, and activation of the interventional team for catheter-based therapies.1,8 Free-floating right heart thrombi or thrombus straddling the interatrial septum (“thrombus in transit”) through a patent foramen ovale may require surgical embolectomy.8
PATIENT SELECTION AND INDICATIONS FOR ECHOCARDIOGRAPHY

- Jaff MR, McMurtry MS, Archer SL, et al. Management of massive and submassive pulmonary embolism, iliofemoral deep vein thrombosis, and chronic thromboembolic pulmonary hypertension. Circulation 2011; 123:1788–1830. doi:10.1161/CIR.0b013e318214914f
- Jiménez D, Aujesky D, Moores L, et al; RIETE Investigators. Simplification of the pulmonary embolism severity index for prognostication in patients with acute symptomatic pulmonary embolism. Arch Intern Med 2010; 170:1383–1389. doi:10.1001/archinternmed.2010.199
- Aujesky D, Obrosky DS, Stone RA, et al. Derivation and validation of a prognostic model for pulmonary embolism. Am J Respir Crit Care Med 2005; 172:1041–1046. doi:10.1164/rccm.200506-862OC
- Bova C, Pesavento R, Marchiori A, et al; TELESIO Study Group. Risk stratification and outcomes in hemodynamically stable patients with acute pulmonary embolism. J Thromb Haemost 2009; 7:938–944. doi:10.1111/j.1538-7836.2009.03345.x
- Fernandez C, Bova C, Sanchez O, et al. Validation of a model for identification of patients at intermediate to high risk for complications associated with acute symptomatic pulmonary embolism. Chest 2015; 148:211–218. doi:10.1378/chest.14-2551
- Chartier L, Bera J, Delomez M, et al. Free-floating thrombi in the right heart: diagnosis, management, and prognostic indexes in 38 consecutive patients. Circulation 1999; 99:2779–2783. pmid:10351972
- Rudski LG, Lai WW, Afilalo J, et al. Guidelines for the echocardiographic assessment of the right heart in adults. J Am Soc Echocardiogr 2010; 23:685–713. doi:10.1016/j.echo.2010.05.010
- Konstantinides S, Torbicki A, Agnelli G, et al. 2014 ESC guidelines on the diagnosis and management of acute pulmonary embolism. Eur Heart J 2014; 35:3033–3069a–k. doi:10.1093/eurheartj/ehu283
- Saric M, Armour AC, Arnaout MS, et al. Guidelines for the use of echocardiography in the evaluation of a cardiac source of embolism. J Am Soc Echocardiogr 2016; 29:1–42. doi:10.1016/j.echo.2015.09.011
Most patients admitted with pulmonary embolism (PE) do not need transthoracic echocardiography (TTE); it should be performed in hemodynamically unstable patients, as well as in hemodynamically stable patients with specific elevated cardiac biomarkers and imaging features.
The decision to perform TTE should be based on clinical presentation, PE burden, and imaging findings (eg, computed tomographic angiography). TTE helps to stratify risk, guide management, monitor response to therapy, and give prognostic information for a subset of patients at increased risk for PE-related adverse events.
RISK STRATIFICATION IN PULMONARY EMBOLISM
PE has a spectrum of presentations ranging from no symptoms to shock. Based on the clinical presentation, PE can be categorized as high, intermediate, or low risk.
High-risk PE, often referred to as “massive” PE, is defined in current American Heart Association guidelines as acute PE with sustained hypotension (systolic blood pressure < 90 mm Hg for at least 15 minutes or requiring inotropic support), persistent profound bradycardia (heart rate < 40 beats per minute with signs or symptoms of shock), syncope, or cardiac arrest.1
Intermediate-risk or “submassive” PE is more challenging to identify because patients are more hemodynamically stable, yet have evidence on electrocardiography, TTE, computed tomography, or cardiac biomarker testing—ie, N-terminal pro-B-type natriuretic peptide (NT-proBNP) or troponin—that indicates myocardial injury or volume overload.1
Low-risk PE is acute PE in the absence of clinical markers of adverse prognosis that define massive or submassive PE.1
ECHOCARDIOGRAPHIC FEATURES OF HIGH-RISK PULMONARY EMBOLISM
Certain TTE findings suggest increased risk of a poor outcome and may warrant therapy that is more invasive and aggressive. High-risk features include the following:
- Impaired right ventricular function
- Interventricular septum bulging into the left ventricle (“D-shaped” septum)
- Dilated proximal pulmonary arteries
- Increased severity of tricuspid regurgitation
- Elevated right atrial pressure
- Elevated pulmonary artery pressure
- Free-floating right ventricular thrombi, which are associated with a mortality rate of up to 45% and can be detected in 7% to 18% of patients6
- Tricuspid annular plane systolic excursion, an echocardiographic measure of right ventricular function1; a value less than 17 mm suggests impaired right ventricular systolic function7
- The McConnell sign, a feature of acute massive PE: akinesia of the mid-free wall of the right ventricle and hypercontractility of the apex.
These TTE findings often lead to treatment with thrombolysis, transfer to the intensive care unit, and activation of the interventional team for catheter-based therapies.1,8 Free-floating right heart thrombi or thrombus straddling the interatrial septum (“thrombus in transit”) through a patent foramen ovale may require surgical embolectomy.8
PATIENT SELECTION AND INDICATIONS FOR ECHOCARDIOGRAPHY
- Jaff MR, McMurtry MS, Archer SL, et al. Management of massive and submassive pulmonary embolism, iliofemoral deep vein thrombosis, and chronic thromboembolic pulmonary hypertension. Circulation 2011; 123:1788–1830. doi:10.1161/CIR.0b013e318214914f
- Jiménez D, Aujesky D, Moores L, et al; RIETE Investigators. Simplification of the pulmonary embolism severity index for prognostication in patients with acute symptomatic pulmonary embolism. Arch Intern Med 2010; 170:1383–1389. doi:10.1001/archinternmed.2010.199
- Aujesky D, Obrosky DS, Stone RA, et al. Derivation and validation of a prognostic model for pulmonary embolism. Am J Respir Crit Care Med 2005; 172:1041–1046. doi:10.1164/rccm.200506-862OC
- Bova C, Pesavento R, Marchiori A, et al; TELESIO Study Group. Risk stratification and outcomes in hemodynamically stable patients with acute pulmonary embolism. J Thromb Haemost 2009; 7:938–944. doi:10.1111/j.1538-7836.2009.03345.x
- Fernandez C, Bova C, Sanchez O, et al. Validation of a model for identification of patients at intermediate to high risk for complications associated with acute symptomatic pulmonary embolism. Chest 2015; 148:211–218. doi:10.1378/chest.14-2551
- Chartier L, Bera J, Delomez M, et al. Free-floating thrombi in the right heart: diagnosis, management, and prognostic indexes in 38 consecutive patients. Circulation 1999; 99:2779–2783. pmid:10351972
- Rudski LG, Lai WW, Afilalo J, et al. Guidelines for the echocardiographic assessment of the right heart in adults. J Am Soc Echocardiogr 2010; 23:685–713. doi:10.1016/j.echo.2010.05.010
- Konstantinides S, Torbicki A, Agnelli G, et al. 2014 ESC guidelines on the diagnosis and management of acute pulmonary embolism. Eur Heart J 2014; 35:3033–3069a–k. doi:10.1093/eurheartj/ehu283
- Saric M, Armour AC, Arnaout MS, et al. Guidelines for the use of echocardiography in the evaluation of a cardiac source of embolism. J Am Soc Echocardiogr 2016; 29:1–42. doi:10.1016/j.echo.2015.09.011
Pulmonary infarction due to pulmonary embolism
A 76-year-old man whose history included abdominal aortic aneurysm repair, bilateral femoral artery bypass for popliteal artery aneurysm, hypertension, and peptic ulcer disease was admitted to a community hospital with pleuritic chest pain and shortness of breath. Two days earlier, he had undergone repair of a ventral hernia.
At the time of that admission, he reported no fever, chills, night sweats, cough, or history of heart or lung disease. His vital signs were normal, and physical examination had revealed no apparent respiratory distress, no jugular venous distention, normal heart sounds, and no pedal edema; however, decreased air entry was noted in the right lung base. Initial serum levels of troponin and N-terminal pro-B-type natriuretic peptide were normal.
At that time, computed tomographic angiography of the chest showed segmental pulmonary emboli in the left upper and right lower lobes of the lungs and right pleural effusion. Transthoracic echocardiography showed normal atrial and ventricular sizes with no right or left ventricular systolic dysfunction and a left ventricular ejection fraction of 59%.
Treatment with intravenous heparin was started, and the patient was transferred to our hospital.
PLEURAL EFFUSION AND PULMONARY EMBOLISM
1. Which of the following is true about pleural effusion?
- It is rarely, if ever, associated with pulmonary embolism
- Most patients with pleural effusion due to pulmonary embolism do not have pleuritic chest pain
- Pulmonary embolism should be excluded in all cases of pleural effusion without a clear cause
Pulmonary embolism should be excluded in all cases of pleural effusion that do not have a clear cause. As for the other answer choices:
- Pulmonary embolism is the fourth leading cause of pleural effusion in the United States, after heart failure, pneumonia, and malignancy.1
- About 75% of patients who develop pleural effusion in the setting of pulmonary embolism complain of pleuritic chest pain on the side of the effusion.2 Most effusions are unilateral, small, and usually exudative.3
EVALUATION BEGINS: RESULTS OF THORACENTESIS
Our patient continued to receive intravenous heparin.
He underwent thoracentesis on hospital day 3, and 1,000 mL of turbid sanguineous pleural fluid was removed. Analysis of the fluid showed pH 7.27, white blood cell count 3.797 × 10⁹/L with 80% neutrophils, and lactate dehydrogenase (LDH) concentration 736 U/L (a ratio of pleural fluid LDH to a concurrent serum LDH > 0.6 is suggestive of an exudate); the fluid was also sent for culture and cytology. Thoracentesis was terminated early due to cough, and follow-up chest radiography showed a moderate-sized pneumothorax.

Computed tomography (CT) of the chest at this time showed a small wedge-shaped area of lung consolidation in the right lower lobe (also seen on CT done 1 day before admission to our hospital), with an intrinsic air-fluid level suggesting a focal infarct or lung abscess, now obscured by adjacent consolidation and atelectasis. In the interval since the previous CT, the multiloculated right pleural effusion had increased in size (Figure 1).
THE NEXT STEP
2. What is the most appropriate next step for this patient?
- Consult an interventional radiologist for chest tube placement
- Start empiric antibiotic therapy and ask an interventional radiologist to place a chest tube
- Start empiric antibiotic therapy, withhold anticoagulation, and consult a thoracic surgeon
- Start empiric antibiotic therapy and consult a thoracic surgeon while continuing anticoagulation
The most appropriate next step is to start empiric antibiotic therapy and consult a thoracic surgeon while continuing anticoagulation.
In this patient, it is appropriate to initiate antibiotics empirically on the basis of his significant pleural loculations, a wedge-shaped consolidation, and 80% neutrophils in the pleural fluid, all of which suggest infection. The unmasking of a wedge-shaped consolidation after thoracentesis, with a previously noted air-fluid level and an interval increase in multiloculated pleural fluid, raises suspicion of a necrotic infection that may have ruptured into the pleural space, a possible lung infarct, or a malignancy. Hence, simply placing a chest tube may not be enough.
Blood in the pleural fluid does not necessitate withholding anticoagulation unless the bleeding is heavy. A pleural fluid hematocrit greater than 50% of the peripheral blood hematocrit suggests hemothorax and is an indication to withhold anticoagulation.1 Our patient’s pleural fluid was qualitatively sanguineous but not frankly bloody, and therefore we judged that it was not necessary to stop his heparin.
HOW DOES PULMONARY INFARCTION PRESENT CLINICALLY?
3. Which of the following statements about pulmonary infarction is incorrect?
- Cavitation and infarction are more common with larger emboli
- Cavitation occurs in fewer than 10% of pulmonary infarctions
- Lung abscess develops in more than 50% of pulmonary infarctions
- Pulmonary thromboembolism is the most common cause of pulmonary infarction
Lung abscess develops in far fewer than 50% of cases of pulmonary infarction. The rest of the statements are correct.
Cavitation complicates about 4% to 7% of infarctions and is more common when the infarction is 4 cm or greater in diameter.4 These cavities are usually single and predominantly on the right side in the apical or posterior segment of the upper lobe or the apical segment of the right lower lobe, as in our patient.5–8 CT demonstrating scalloped inner margins and cross-cavity band shadows suggests a cavitary pulmonary infarction.9,10
Infection and abscess in pulmonary infarction are poorly understood but have been linked to larger infarctions, coexistent congestion or atelectasis, and dental or oropharyngeal infection. In an early series of 550 cases of pulmonary infarction, 23 patients (4.2%) developed lung abscess and 6 (1.1%) developed empyema.11 The mean time to cavitation for an infected pulmonary infarction has been reported to be 18 days.12
A reversed halo sign, generally described as a focal, rounded area of ground-glass opacity surrounded by a nearly complete ring of consolidation, has been reported to be more frequent with pulmonary infarction than with other diseases, especially when in the lower lobes.13
CASE CONTINUED: THORACOSCOPY
A cardiothoracic surgeon was consulted, intravenous heparin was discontinued, an inferior vena cava filter was placed, and the patient underwent video-assisted thoracoscopy.
Purulent fluid was noted on the lateral aspect of right lower lobe; this appeared to be the ruptured cavitary lesion functioning like an uncontrolled bronchopleural fistula. Two chest tubes, sizes 32F and 28F, were placed after decortication, resection of the lung abscess, and closure of the bronchopleural fistula. No significant air leak was noted after resection of this segment of lung.

Pathologic study showed acute organizing pneumonia with abscess formation; no malignant cells or granulomas were seen (Figure 2). Pleural fluid cultures grew Streptococcus intermedius, while the tissue culture was negative for any growth, including acid-fast bacilli and fungi.
On 3 different occasions, both chest tubes were shortened, backed out 2 cm, and resecured with sutures and pins, and Heimlich valves were applied before the patient was discharged.
Intravenous piperacillin-tazobactam was started on the fifth hospital day. On discharge, the patient was advised to continue this treatment for 3 weeks at home.
The patient was receiving enoxaparin subcutaneously in prophylactic doses; 72 hours after the thorascopic procedure this was increased to therapeutic doses, continuing after discharge. Bridging to warfarin was not advised in view of his chest tubes.
Our patient appeared to have developed a right lower lobe infarction that cavitated and ruptured into the pleural space, causing a bronchopleural fistula with empyema after a recent pulmonary embolism. Other reported causes of pulmonary infarction in pulmonary embolism are malignancy and heavy clot burden,6 but these have not been confirmed in subsequent studies.5 Malignancy was ruled out by biopsy of the resected portion of the lung, and our patient did not have a history of heart failure. A clear cavity was not noted (because it ruptured into the pleura), but an air-fluid level was described in a wedge-shaped consolidation, suggesting infarction.
How common is pulmonary infarction after pulmonary embolism?
Pulmonary infarction occurs in few patients with pulmonary embolism.13 Since the lungs receive oxygen from the airways and have a dual blood supply from the pulmonary and bronchial arteries, they are not particularly vulnerable to ischemia. However, the reported incidence of pulmonary infarction in patients with pulmonary embolism has ranged from 10% to higher than 30%.5,14,15
The reasons behind pulmonary infarction with complications after pulmonary embolism have varied in different case series in different eras. CT, biopsy, or autopsy studies reveal pulmonary infarction after pulmonary embolism to be more common than suspected by clinical symptoms.
In a Mayo Clinic series of 43 cases of pulmonary infarction diagnosed over a 6-year period by surgical lung biopsy, 18 (42%) of the patients had underlying pulmonary thromboembolism, which was the most common cause.16
RISK FACTORS FOR PULMONARY INFARCTION
4. Which statement about risk factors for pulmonary infarction in pulmonary embolism is incorrect?
- Heart failure may be a risk factor for pulmonary infarction
- Pulmonary hemorrhage is a risk factor for pulmonary infarction
- Pulmonary infarction is more common with more proximal sites of pulmonary embolism
- Collateral circulation may protect against pulmonary infarction
Infarction is more common with emboli that are distal rather than proximal.
Dalen et al15 suggested that after pulmonary embolism, pulmonary hemorrhage is an important contributor to the development of pulmonary infarction independent of the presence or absence of associated cardiac or pulmonary disease, but that the effect depends on the site of obstruction.
This idea was first proposed in 1913, when Karsner and Ghoreyeb17 showed that when pulmonary arteries are completely obstructed, the bronchial arteries take over, except when the embolism is present in a small branch of the pulmonary artery. This is because the physiologic anastomosis between the pulmonary artery and the bronchial arteries is located at the precapillary level of the pulmonary artery, and the bronchial circulation does not take over until the pulmonary arterial pressure in the area of the embolism drops to zero.
Using CT data, Kirchner et al5 confirmed that the risk of pulmonary infarction is higher if the obstruction is peripheral, ie, distal.
Using autopsy data, Tsao et al18 reported a higher risk of pulmonary infarction in embolic occlusion of pulmonary vessels less than 3 mm in diameter.
Collateral circulation has been shown to protect against pulmonary infarction. For example, Miniati et al14 showed that healthy young patients with pulmonary embolism were more prone to develop pulmonary infarction, probably because they had less efficient collateral systems in the peripheral lung fields. In lung transplant recipients, it has been shown that the risk of infarction decreased with development of collateral circulation.19
Dalen et al,15 however, attributed delayed resolution of pulmonary hemorrhage (as measured by resolution of infiltrate on chest radiography) to higher underlying pulmonary venous pressure in patients with heart failure and consequent pulmonary infarction. In comparison, healthy patients without cardiac or pulmonary disease have faster resolution of pulmonary hemorrhage when present, and less likelihood of pulmonary infarction (and death in submassive pulmonary embolism).
Data on the management of infected pulmonary infarction are limited. Mortality rates have been as high as 41% with noninfected and 73% with infected cavitary infarctions.4 Some authors have advocated early surgical resection in view of high rates of failure of medical treatment due to lack of blood supply within the cavity and continued risk of infection.
KEY POINTS
In patients with a recently diagnosed pulmonary embolism and concurrent symptoms of bacterial pneumonia, a diagnosis of cavitary pulmonary infarction should be considered.
Consolidations that are pleural-based with sharp, rounded margins and with focal areas of central hyperlucencies representing hemorrhage on the mediastinal windows on CT are more likely to represent a pulmonary infarct.20
- Light RW. Pleural Diseases. 4th ed. Baltimore, MD: Lippincott, Williams & Wilkins; 2001.
- Stein PD, Terrin ML, Hales CA, et al. Clinical, laboratory, roentgenographic, and electrocardiographic findings in patients with acute pulmonary embolism and no pre-existing cardiac or pulmonary disease. Chest 1991; 100(3):598–603. pmid:1909617
- Light RW. Pleural effusion due to pulmonary emboli. Curr Opin Pulm Med 2001; 7(4):198–201. pmid:11470974
- Libby LS, King TE, LaForce FM, Schwarz MI. Pulmonary cavitation following pulmonary infarction. Medicine (Baltimore) 1985; 64(5):342–348. pmid:4033411
- Kirchner J, Obermann A, Stuckradt S, et al. Lung infarction following pulmonary embolism: a comparative study on clinical conditions and CT findings to identify predisposing factors. Rofo 2015; 187(6):440–444. doi:10.1055/s-0034-1399006
- He H, Stein MW, Zalta B, Haramati LB. Pulmonary infarction: spectrum of findings on multidetector helical CT. J Thorac Imaging 2006; 21(1):1–7. doi:10.1097/01.rti.0000187433.06762.fb
- Scharf J, Nahir AM, Munk J, Lichtig C. Aseptic cavitation in pulmonary infarction. Chest 1971; 59(4):456–458. pmid:5551596
- Wilson AG, Joseph AE, Butland RJ. The radiology of aseptic cavitation in pulmonary infarction. Clin Radiol 1986; 37(4):327–333. pmid:3731699
- Butler MD, Biscardi FH, Schain DC, Humphries JE, Blow O, Spotnitz WD. Pulmonary resection for treatment of cavitary pulmonary infarction. Ann Thorac Surg 1997; 63(3):849–850. pmid:9066420
- Koroscil MT, Hauser TR. Acute pulmonary embolism leading to cavitation and large pulmonary abscess: a rare complication of pulmonary infarction. Respir Med Case Rep 2016; 20:72–74. doi:10.1016/j.rmcr.2016.12.001
- Levin L, Kernohan JW, Moersch HJ. Pulmonary abscess secondary to bland pulmonary infarction. Dis Chest 1948; 14(2):218–232. pmid:18904835
- Marchiori E, Menna Barreto M, Pereira Freitas HM, et al. Morphological characteristics of the reversed halo sign that may strongly suggest pulmonary infarction. Clin Radiol 2018; 73(5):503.e7–503.e13. doi:10.1016/j.crad.2017.11.022
- Smith GT, Dexter L, Dammin GJ. Postmortem quantitative studies in pulmonary embolism. In: Sasahara AA, Stein M, eds. Pulmonary Embolic Disease. New York, NY: Grune & Stratton, Inc; 1965:120–126.
- Miniati M, Bottai M, Ciccotosto C, Roberto L, Monti S. Predictors of pulmonary infarction. Medicine (Baltimore) 2015; 94(41):e1488. doi:10.1097/MD.0000000000001488
- Dalen JE, Haffajee CI, Alpert JS, Howe JP, Ockene IS, Paraskos JA. Pulmonary embolism, pulmonary hemorrhage and pulmonary infarction. N Engl J Med 1977; 296(25):1431–1435. doi:10.1056/NEJM197706232962503
- Parambil JG, Savci CD, Tazelaar HD, Ryu JH. Causes and presenting features of pulmonary infarctions in 43 cases identified by surgical lung biopsy. Chest 2005; 127(4):1178–1183. doi:10.1378/chest.127.4.1178
- Karsner HT, Ghoreyeb AA. Studies in infarction: III. The circulation in experimental pulmonary embolism. J Exp Med 1913; 18(5):507–511. pmid:19867725
- Tsao MS, Schraufnagel D, Wang NS. Pathogenesis of pulmonary infarction. Am J Med 1982; 72(4):599–606. pmid:6462058
- Burns KE, Iacono AT. Incidence of clinically unsuspected pulmonary embolism in mechanically ventilated lung transplant recipients. Transplantation 2003; 76(6):964–968. doi:10.1097/01.TP.0000084523.58610.BA
- Yousem SA. The surgical pathology of pulmonary infarcts: diagnostic confusion with granulomatous disease, vasculitis, and neoplasia. Mod Pathol 2009; 22(5):679–685. doi:10.1038/modpathol.2009.20
A 76-year-old man whose history included abdominal aortic aneurysm repair, bilateral femoral artery bypass for popliteal artery aneurysm, hypertension, and peptic ulcer disease was admitted to a community hospital with pleuritic chest pain and shortness of breath. Two days earlier, he had undergone repair of a ventral hernia.
At the time of that admission, he reported no fever, chills, night sweats, cough, or history of heart or lung disease. His vital signs were normal, and physical examination had revealed no apparent respiratory distress, no jugular venous distention, normal heart sounds, and no pedal edema; however, decreased air entry was noted in the right lung base. Initial serum levels of troponin and N-terminal pro-B-type natriuretic peptide were normal.
At that time, computed tomographic angiography of the chest showed segmental pulmonary emboli in the left upper and right lower lobes of the lungs and right pleural effusion. Transthoracic echocardiography showed normal atrial and ventricular sizes with no right or left ventricular systolic dysfunction and a left ventricular ejection fraction of 59%.
Treatment with intravenous heparin was started, and the patient was transferred to our hospital.
PLEURAL EFFUSION AND PULMONARY EMBOLISM
1. Which of the following is true about pleural effusion?
- It is rarely, if ever, associated with pulmonary embolism
- Most patients with pleural effusion due to pulmonary embolism do not have pleuritic chest pain
- Pulmonary embolism should be excluded in all cases of pleural effusion without a clear cause
Pulmonary embolism should be excluded in all cases of pleural effusion that do not have a clear cause. As for the other answer choices:
- Pulmonary embolism is the fourth leading cause of pleural effusion in the United States, after heart failure, pneumonia, and malignancy.1
- About 75% of patients who develop pleural effusion in the setting of pulmonary embolism complain of pleuritic chest pain on the side of the effusion.2 Most effusions are unilateral, small, and usually exudative.3
EVALUATION BEGINS: RESULTS OF THORACENTESIS
Our patient continued to receive intravenous heparin.
He underwent thoracentesis on hospital day 3, and 1,000 mL of turbid sanguineous pleural fluid was removed. Analysis of the fluid showed pH 7.27, white blood cell count 3.797 × 10⁹/L with 80% neutrophils, and lactate dehydrogenase (LDH) concentration 736 U/L (a ratio of pleural fluid LDH to a concurrent serum LDH > 0.6 is suggestive of an exudate); the fluid was also sent for culture and cytology. Thoracentesis was terminated early due to cough, and follow-up chest radiography showed a moderate-sized pneumothorax.
Computed tomography (CT) of the chest at this time showed a small wedge-shaped area of lung consolidation in the right lower lobe (also seen on CT done 1 day before admission to our hospital), with an intrinsic air-fluid level suggesting a focal infarct or lung abscess, now obscured by adjacent consolidation and atelectasis. In the interval since the previous CT, the multiloculated right pleural effusion had increased in size (Figure 1).
THE NEXT STEP
2. What is the most appropriate next step for this patient?
- Consult an interventional radiologist for chest tube placement
- Start empiric antibiotic therapy and ask an interventional radiologist to place a chest tube
- Start empiric antibiotic therapy, withhold anticoagulation, and consult a thoracic surgeon
- Start empiric antibiotic therapy and consult a thoracic surgeon while continuing anticoagulation
The most appropriate next step is to start empiric antibiotic therapy and consult a thoracic surgeon while continuing anticoagulation.
In this patient, it is appropriate to initiate antibiotics empirically on the basis of his significant pleural loculations, a wedge-shaped consolidation, and 80% neutrophils in the pleural fluid, all of which suggest infection. The unmasking of a wedge-shaped consolidation after thoracentesis, with a previously noted air-fluid level and an interval increase in multiloculated pleural fluid, raises suspicion of a necrotic infection that may have ruptured into the pleural space, a possible lung infarct, or a malignancy. Hence, simply placing a chest tube may not be enough.
Blood in the pleural fluid does not necessitate withholding anticoagulation unless the bleeding is heavy. A pleural fluid hematocrit greater than 50% of the peripheral blood hematocrit suggests hemothorax and is an indication to withhold anticoagulation.1 Our patient’s pleural fluid was qualitatively sanguineous but not frankly bloody, and therefore we judged that it was not necessary to stop his heparin.
HOW DOES PULMONARY INFARCTION PRESENT CLINICALLY?
3. Which of the following statements about pulmonary infarction is incorrect?
- Cavitation and infarction are more common with larger emboli
- Cavitation occurs in fewer than 10% of pulmonary infarctions
- Lung abscess develops in more than 50% of pulmonary infarctions
- Pulmonary thromboembolism is the most common cause of pulmonary infarction
Lung abscess develops in far fewer than 50% of cases of pulmonary infarction. The rest of the statements are correct.
Cavitation complicates about 4% to 7% of infarctions and is more common when the infarction is 4 cm or greater in diameter.4 These cavities are usually single and predominantly on the right side in the apical or posterior segment of the upper lobe or the apical segment of the right lower lobe, as in our patient.5–8 CT demonstrating scalloped inner margins and cross-cavity band shadows suggests a cavitary pulmonary infarction.9,10
Infection and abscess in pulmonary infarction are poorly understood but have been linked to larger infarctions, coexistent congestion or atelectasis, and dental or oropharyngeal infection. In an early series of 550 cases of pulmonary infarction, 23 patients (4.2%) developed lung abscess and 6 (1.1%) developed empyema.11 The mean time to cavitation for an infected pulmonary infarction has been reported to be 18 days.12
A reversed halo sign, generally described as a focal, rounded area of ground-glass opacity surrounded by a nearly complete ring of consolidation, has been reported to be more frequent with pulmonary infarction than with other diseases, especially when in the lower lobes.13
CASE CONTINUED: THORACOSCOPY
A cardiothoracic surgeon was consulted, intravenous heparin was discontinued, an inferior vena cava filter was placed, and the patient underwent video-assisted thoracoscopy.
Purulent fluid was noted on the lateral aspect of right lower lobe; this appeared to be the ruptured cavitary lesion functioning like an uncontrolled bronchopleural fistula. Two chest tubes, sizes 32F and 28F, were placed after decortication, resection of the lung abscess, and closure of the bronchopleural fistula. No significant air leak was noted after resection of this segment of lung.
Pathologic study showed acute organizing pneumonia with abscess formation; no malignant cells or granulomas were seen (Figure 2). Pleural fluid cultures grew Streptococcus intermedius, while the tissue culture was negative for any growth, including acid-fast bacilli and fungi.
On 3 different occasions, both chest tubes were shortened, backed out 2 cm, and resecured with sutures and pins, and Heimlich valves were applied before the patient was discharged.
Intravenous piperacillin-tazobactam was started on the fifth hospital day. On discharge, the patient was advised to continue this treatment for 3 weeks at home.
The patient was receiving enoxaparin subcutaneously in prophylactic doses; 72 hours after the thorascopic procedure this was increased to therapeutic doses, continuing after discharge. Bridging to warfarin was not advised in view of his chest tubes.
Our patient appeared to have developed a right lower lobe infarction that cavitated and ruptured into the pleural space, causing a bronchopleural fistula with empyema after a recent pulmonary embolism. Other reported causes of pulmonary infarction in pulmonary embolism are malignancy and heavy clot burden,6 but these have not been confirmed in subsequent studies.5 Malignancy was ruled out by biopsy of the resected portion of the lung, and our patient did not have a history of heart failure. A clear cavity was not noted (because it ruptured into the pleura), but an air-fluid level was described in a wedge-shaped consolidation, suggesting infarction.
How common is pulmonary infarction after pulmonary embolism?
Pulmonary infarction occurs in few patients with pulmonary embolism.13 Since the lungs receive oxygen from the airways and have a dual blood supply from the pulmonary and bronchial arteries, they are not particularly vulnerable to ischemia. However, the reported incidence of pulmonary infarction in patients with pulmonary embolism has ranged from 10% to higher than 30%.5,14,15
The reasons behind pulmonary infarction with complications after pulmonary embolism have varied in different case series in different eras. CT, biopsy, or autopsy studies reveal pulmonary infarction after pulmonary embolism to be more common than suspected by clinical symptoms.
In a Mayo Clinic series of 43 cases of pulmonary infarction diagnosed over a 6-year period by surgical lung biopsy, 18 (42%) of the patients had underlying pulmonary thromboembolism, which was the most common cause.16
RISK FACTORS FOR PULMONARY INFARCTION
4. Which statement about risk factors for pulmonary infarction in pulmonary embolism is incorrect?
- Heart failure may be a risk factor for pulmonary infarction
- Pulmonary hemorrhage is a risk factor for pulmonary infarction
- Pulmonary infarction is more common with more proximal sites of pulmonary embolism
- Collateral circulation may protect against pulmonary infarction
Infarction is more common with emboli that are distal rather than proximal.
Dalen et al15 suggested that after pulmonary embolism, pulmonary hemorrhage is an important contributor to the development of pulmonary infarction independent of the presence or absence of associated cardiac or pulmonary disease, but that the effect depends on the site of obstruction.
This idea was first proposed in 1913, when Karsner and Ghoreyeb17 showed that when pulmonary arteries are completely obstructed, the bronchial arteries take over, except when the embolism is present in a small branch of the pulmonary artery. This is because the physiologic anastomosis between the pulmonary artery and the bronchial arteries is located at the precapillary level of the pulmonary artery, and the bronchial circulation does not take over until the pulmonary arterial pressure in the area of the embolism drops to zero.
Using CT data, Kirchner et al5 confirmed that the risk of pulmonary infarction is higher if the obstruction is peripheral, ie, distal.
Using autopsy data, Tsao et al18 reported a higher risk of pulmonary infarction in embolic occlusion of pulmonary vessels less than 3 mm in diameter.
Collateral circulation has been shown to protect against pulmonary infarction. For example, Miniati et al14 showed that healthy young patients with pulmonary embolism were more prone to develop pulmonary infarction, probably because they had less efficient collateral systems in the peripheral lung fields. In lung transplant recipients, it has been shown that the risk of infarction decreased with development of collateral circulation.19
Dalen et al,15 however, attributed delayed resolution of pulmonary hemorrhage (as measured by resolution of infiltrate on chest radiography) to higher underlying pulmonary venous pressure in patients with heart failure and consequent pulmonary infarction. In comparison, healthy patients without cardiac or pulmonary disease have faster resolution of pulmonary hemorrhage when present, and less likelihood of pulmonary infarction (and death in submassive pulmonary embolism).
Data on the management of infected pulmonary infarction are limited. Mortality rates have been as high as 41% with noninfected and 73% with infected cavitary infarctions.4 Some authors have advocated early surgical resection in view of high rates of failure of medical treatment due to lack of blood supply within the cavity and continued risk of infection.
KEY POINTS
In patients with a recently diagnosed pulmonary embolism and concurrent symptoms of bacterial pneumonia, a diagnosis of cavitary pulmonary infarction should be considered.
Consolidations that are pleural-based with sharp, rounded margins and with focal areas of central hyperlucencies representing hemorrhage on the mediastinal windows on CT are more likely to represent a pulmonary infarct.20
- Light RW. Pleural Diseases. 4th ed. Baltimore, MD: Lippincott, Williams & Wilkins; 2001.
- Stein PD, Terrin ML, Hales CA, et al. Clinical, laboratory, roentgenographic, and electrocardiographic findings in patients with acute pulmonary embolism and no pre-existing cardiac or pulmonary disease. Chest 1991; 100(3):598–603. pmid:1909617
- Light RW. Pleural effusion due to pulmonary emboli. Curr Opin Pulm Med 2001; 7(4):198–201. pmid:11470974
- Libby LS, King TE, LaForce FM, Schwarz MI. Pulmonary cavitation following pulmonary infarction. Medicine (Baltimore) 1985; 64(5):342–348. pmid:4033411
- Kirchner J, Obermann A, Stuckradt S, et al. Lung infarction following pulmonary embolism: a comparative study on clinical conditions and CT findings to identify predisposing factors. Rofo 2015; 187(6):440–444. doi:10.1055/s-0034-1399006
- He H, Stein MW, Zalta B, Haramati LB. Pulmonary infarction: spectrum of findings on multidetector helical CT. J Thorac Imaging 2006; 21(1):1–7. doi:10.1097/01.rti.0000187433.06762.fb
- Scharf J, Nahir AM, Munk J, Lichtig C. Aseptic cavitation in pulmonary infarction. Chest 1971; 59(4):456–458. pmid:5551596
- Wilson AG, Joseph AE, Butland RJ. The radiology of aseptic cavitation in pulmonary infarction. Clin Radiol 1986; 37(4):327–333. pmid:3731699
- Butler MD, Biscardi FH, Schain DC, Humphries JE, Blow O, Spotnitz WD. Pulmonary resection for treatment of cavitary pulmonary infarction. Ann Thorac Surg 1997; 63(3):849–850. pmid:9066420
- Koroscil MT, Hauser TR. Acute pulmonary embolism leading to cavitation and large pulmonary abscess: a rare complication of pulmonary infarction. Respir Med Case Rep 2016; 20:72–74. doi:10.1016/j.rmcr.2016.12.001
- Levin L, Kernohan JW, Moersch HJ. Pulmonary abscess secondary to bland pulmonary infarction. Dis Chest 1948; 14(2):218–232. pmid:18904835
- Marchiori E, Menna Barreto M, Pereira Freitas HM, et al. Morphological characteristics of the reversed halo sign that may strongly suggest pulmonary infarction. Clin Radiol 2018; 73(5):503.e7–503.e13. doi:10.1016/j.crad.2017.11.022
- Smith GT, Dexter L, Dammin GJ. Postmortem quantitative studies in pulmonary embolism. In: Sasahara AA, Stein M, eds. Pulmonary Embolic Disease. New York, NY: Grune & Stratton, Inc; 1965:120–126.
- Miniati M, Bottai M, Ciccotosto C, Roberto L, Monti S. Predictors of pulmonary infarction. Medicine (Baltimore) 2015; 94(41):e1488. doi:10.1097/MD.0000000000001488
- Dalen JE, Haffajee CI, Alpert JS, Howe JP, Ockene IS, Paraskos JA. Pulmonary embolism, pulmonary hemorrhage and pulmonary infarction. N Engl J Med 1977; 296(25):1431–1435. doi:10.1056/NEJM197706232962503
- Parambil JG, Savci CD, Tazelaar HD, Ryu JH. Causes and presenting features of pulmonary infarctions in 43 cases identified by surgical lung biopsy. Chest 2005; 127(4):1178–1183. doi:10.1378/chest.127.4.1178
- Karsner HT, Ghoreyeb AA. Studies in infarction: III. The circulation in experimental pulmonary embolism. J Exp Med 1913; 18(5):507–511. pmid:19867725
- Tsao MS, Schraufnagel D, Wang NS. Pathogenesis of pulmonary infarction. Am J Med 1982; 72(4):599–606. pmid:6462058
- Burns KE, Iacono AT. Incidence of clinically unsuspected pulmonary embolism in mechanically ventilated lung transplant recipients. Transplantation 2003; 76(6):964–968. doi:10.1097/01.TP.0000084523.58610.BA
- Yousem SA. The surgical pathology of pulmonary infarcts: diagnostic confusion with granulomatous disease, vasculitis, and neoplasia. Mod Pathol 2009; 22(5):679–685. doi:10.1038/modpathol.2009.20
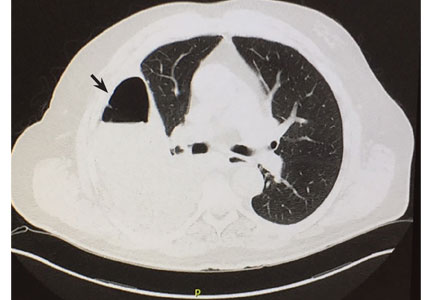
How acute pain leads to chronic opioid use
Mary, age 38, was hospitalized for acute cholecystitis requiring laparoscopic surgery. Her hospital course was uneventful. At the time of discharge, I, her inpatient doctor, prescribed 15 hydrocodone tablets for postoperative pain. I never saw her again. Did she struggle to stop taking the hydrocodone I prescribed?
Heather is a 50-year-old patient in my addiction medicine clinic who developed opioid use disorder while being treated for chronic pain. After much hardship and to her credit, she is now in long-term remission. Did her opioid use disorder start with an opioid prescription for an accepted indication?
The issues Mary and Heather face seem unrelated, but these 2 patients may be at different time points in the progression of the same disease. As a hospitalist, I want to optimize the chances that patients taking opioids for acute pain will be able to stop taking them.
CHRONIC USE VS OPIOID USE DISORDER
There is a distinction between chronic use of opioids and opioid use disorder. The latter is also known as addiction.
Patients who take opioids daily do not necessarily have opioid use disorder, even if they have physiologic dependence on them. Physiologic opioid dependence is commonly confused with opioid use disorder, but it is the expected result of regularly taking these drugs.
Opioid use disorder is a chronic disease of the brain characterized by loss of control over opioid use, resulting in harm. The Diagnostic and Statistical Manual, fifth edition, excludes physiologic dependence on opioids (tolerance and withdrawal) from its criteria for opioid use disorder if the patient is taking opioids solely under medical supervision.1 To be diagnosed with opioid use disorder, patients need to do only 2 of the following within 12 months:
- Take more of the drug than intended
- Want or try to cut down without success
- Spend a lot of time in getting, using, or recovering from the drug
- Crave the drug
- Fail to meet commitments due to the drug
- Continue to use the drug, even though it causes social or relationship problems
- Give up or reduce other activities because of the drug
- Use the drug even when it isn’t safe
- Continue to use even when it causes physical or psychological problems
- Develop tolerance (but, as noted, not if taking the drug as directed under a doctor’s supervision)
- Experience withdrawal (again, but not if taking the drug under medical supervision).
WHY DO SOME PATIENTS STRUGGLE TO STOP TAKING OPIOIDS?
Studying opioid use disorder as an outcome in large groups of patients is complicated by imperfect medical documentation. However, using pharmacy claims data, researchers can accurately describe opioid prescription patterns in large groups of patients over time. This means we can count how many patients keep taking prescribed opioids but not how many become addicted.
In a country where nearly 40% of adults are prescribed an opioid annually, the question is not why people start taking opioids, but why some have to struggle to stop.2 Several recent studies used pharmacy claims data to identify factors that may predict chronic opioid use in patients prescribed opioids for acute pain. The findings suggest that we can better treat acute pain to prevent chronic opioid use.
We don’t yet know how to protect patients like Mary from opioid use disorder, but the following 3 studies have already changed my practice.
HIGHER TOTAL DOSE MEANS HIGHER RISK
[Shah A, Hayes CJ, Martin BC. Characteristics of initial prescription episodes and likelihood of long-term opioid use—United States, 2006–2015. MMWR Morb Mortal Wkly Rep 2017; 66(10):265–269.]
Shah et al3 reported a study of nearly 1.3 million opioid-naive patients who received opioid prescriptions. Of those prescribed at least 1 day of opioids, 6% were still taking them 1 year later, and 2.9% were still taking them 3 years later.
Opioid exposure in acute pain was measured in total “morphine milligram equivalents” (MME), ie, the cumulative amount of opioids prescribed in the treatment episode, standardized across different types of opioids. We usually think of exposure in terms of how many milligrams a patient takes per day, which correlates with mortality in chronic opioid use.4 But this study showed a linear relationship between total MME prescribed for acute pain and ongoing opioid use in opioid-naive patients. By itself, the difference between daily and total MME made the article revelatory.
But the study went further, asking how much is too much: ie, What is the cutoff MME above which the patient is at risk of chronic opioid use? The relationship between acute opioid dose and chronic use is linear and starts early. Shah et al suggested that a total threshold of 700 MME predicts chronic opioid use—140 hydrocodone tablets, or 1 month of regular use.3
Many doctors worry that specific opioids such as oxycodone, hydromorphone, and fentanyl may be more habit-forming. Surprisingly, this study showed that these drugs were associated with rates of chronic use similar to those of other opioids when they controlled for potency.
Bottom line. Total opioid use in acute pain was the best predictor of chronic opioid use, and it showed that chronicity begins earlier than thought.
DON’T BE A ‘HIGH-INTENSITY’ PRESCRIBER
[Barnett ML, Olenski AR, Jena AB. Opioid-prescribing patterns of emergency physicians and risk of long-term use. N Engl J Med 2017; 376(7):663–673.]
Barnett et al5 analyzed opioid prescribing for acute pain in the emergency department, using Medicare pharmacy data from 377,629 previously opioid-naive patients. They categorized the emergency providers into quartiles based on the frequency of opioid prescribing.
The relative risk of ongoing opioid use 1 year after being treated by a “high-intensity” prescriber (ie, one in the top quartile) was 30% greater than in similar patients seen by a low-intensity prescriber (ie, one in the bottom quartile). In addition, those who were treated by high-intensity prescribers were more likely to have a serious fall.
In designing the study, the authors assumed that patients visiting an emergency department had their doctor assigned randomly. They controlled for many patient variables that might have confounded the results, such as age, sex, race, depression, medical comorbidities, and geographic region. Were the higher rates of ongoing opioid use in the high-intensity-prescriber group due to the higher prescribing rates of their emergency providers, or did the providers counsel patients differently? This is not known.
Bottom line. Different doctors manage similar patients differently when it comes to pain, and those who prescribe more opioids for acute pain put their patients at risk of chronic opioid use and falls. I don’t want to be a high-intensity opioid prescriber.
SURGERY AND CHRONIC OPIOID USE
[Brummett CM, Waljee JF, Goesling J, et al. New persistent opioid use after minor and major surgical procedures in US adults. JAMA Surg 2017; 152(6):e170504.]
Brummett et al6 examined ongoing opioid use after surgery in 36,177 opioid-naive patients and in a nonsurgical control group. After 3 months, 6% of the patients who underwent surgery remained on opioids, compared with only 0.4% of the nonsurgical controls. Whether the surgery was major or minor did not affect the rate of postoperative opioid use.
Risk factors for ongoing opioid use were preexisting addiction to anything (including tobacco), mood disorders, and preoperative pain disorders. These risk factors have previously been reported in nonsurgical patients.7
Brummett et al speculated that patients are counseled about postoperative opioids in a way that leads them to overestimate the safety and efficacy of these drugs for treating other common pain conditions.6
Bottom line. Patients with mental health comorbidities have a hard time stopping opioids. The remarkable finding in this study was the similarity between major and minor surgery in terms of chronic opioid use. If postoperative opioids treat only the pain caused by the surgery, major surgery should be associated with greater opioid use. The similarity suggests that a mechanism other than postoperative pain confers risk of chronic opioid use.
THINKING ABOUT OPIOIDS
Collectively, these articles describe elements of acute pain treatment that correlate with chronic ongoing opioid use: a higher cumulative dose,3 being seen by a physician who prescribes a lot of opioids,5 undergoing surgery,6 and psychiatric comorbidity.6 They made me wonder if opioid use for acute pain acts as an inoculation, analogous to inoculating a Petri dish with bacteria. The likelihood of chronic opioid use arises from the inoculum dose, the host response, and the context of inoculation.
These articles do not show how patients taking opioids chronically for pain become addicted. Stumbo et al8 interviewed 283 opioid-dependent patients and identified 5 pathways to opioid use disorder, 3 of which were related to pain control: inadequately controlled chronic pain, exposure to opioids during acute pain episodes, and chronic pain in patients who already had substance use disorders. Brat et al9 recently estimated the risk of opioid use disorder after receiving opioids postoperatively to be less than 1%, but it increased dramatically with duration of opioid treatment.

A patient who fills an opioid prescription does not necessarily have chronic pain. Nor do all patients with chronic pain require an opioid prescription. These studies did not establish whether the patients had a pain syndrome. In practice, we call our patients who chronically take opioids our “chronic pain patients.” But 40% of Americans have chronic pain, while only 5% take opioids daily for pain.11,12
We assume that those taking opioids have the most severe pain. But Brummett et al suggested that continued opioid use is predicted less by pain and more by psychiatric comorbidity.6 More than half of the opioid prescriptions in the United States are written for patients with serious mental illness, who represent one-sixth of that population.11 Maybe chronic opioid use for pain has more to do with vulnerability to opioids and less to do with a pain syndrome.
I now think about daily opioid use in much the same way as I think about daily prednisone use. Patients on daily prednisone have a characteristic set of medical risks from the prednisone itself, regardless of its indication. Yet we do not consider these patients addicted to prednisone. Opioid use may be similar.
Like most doctors, I am troubled by the continued rise in the opioid overdose rate.13 Yet addiction and death from overdose are not the only risks that patients on chronic opioids face; they also have higher rates of falls, cardiovascular death, pneumonia, death from chronic obstructive pulmonary disease, and motor vehicle crashes.14–17 Patients on chronic opioids for pain have greater mental health comorbidity and worse function.18
Most concerning, chronic opioid treatment for pain lacks proof of benefit. In fact, a recent study disproved the benefit of opioids for chronic pain compared with nonopioid options.19 When I meet with patients who are taking chronic opioids for pain, I often can’t identify why the drugs were started or ought to be continued, and I anticipate a bad outcome. Yet the patient is afraid to stop the drug. For these reasons, chronic opioid use for pain strikes me as worth considering separately from opioid use disorder.
HOW THIS CHANGED MY PRACTICE
The studies described above have had a powerful effect on my clinical care as a hospitalist.
I now talk to all patients starting opioids about how hard it can be to stop. Some patients are defensive at first, believing this does not apply to them. But I politely continue.
People with depression and anxiety can have a harder time stopping opioids. Addiction is both a risk with ongoing opioid use and a possible outcome of acute opioid use.8 But one can struggle to stop opioids without being addicted or depressed. Even the healthiest person may wish to continue opioids past the point of benefit.
I am careful not to invalidate the patient’s experience of pain. It is challenging for patients to find the balance between current discomfort and a possible future adverse effect. In these conversations, I imagine how I would want a loved one counseled on their pain control. This centers me as I choose my words and my tone.
I now monitor the total amount of opioid I prescribe for acute pain in addition to the daily dose. I give my patients as few opioids as reasonable, and advise them to take the minimum dose required for tolerable comfort. I offer nonopioid options as the preferred choice, presenting them as effective and safe. I do this irrespective of the indication for opioids.
I limit opioids in all patients, not just those with comorbidities. I include in my shared decision-making process the risk of chronic opioid use when I prescribe opioids for acute pain, carefully distinguishing it from opioid use disorder. Instead of excess opioids, I give patients my office phone number to call in case they struggle. I rarely get calls. But I find patients would rather have access to a doctor than extra pills. And offering them my contact information lets me limit opioids while letting them know that I am committed to their comfort and health.
As an addiction medicine doctor, I consult on patients not taking their opioids as prescribed. Caring for these patients is intellectually and emotionally draining; they suffer daily, and the opioids they take provide a modicum of relief at a high cost. The publications I have discussed here provide insight into how a troubled relationship with opioids begins. I remind myself that these patients have an iatrogenic condition. Their behaviors that we label “aberrant” may reflect an adverse reaction to medications prescribed to them for acute pain.
Mary, my patient with postoperative pain after cholecystectomy, may over time develop opioid use disorder as Heather did. That progression may have begun with the hydrocodone I prescribed and the counseling I gave her, and it may proceed to chronic opioid use and then opioid use disorder.
I am looking closely at the care I give for acute pain in light of these innovative studies. But even more so, they have increased the compassion with which I care for patients like Heather, those harmed by prescribed opioids.
- American Psychiatric Association. Diagnostic and Statistical Manual of Mental Disorders. 5th ed. Washington, DC: American Psychiatric Association Publishing; 2013:541–546.
- Han B, Compton WM, Blanco C, Crane E, Lee J, Jones CM. Prescription opioid use, misuse, and use disorders in US adults: 2015 national survey on drug use and health. Ann Intern Med 2017; 167(5):293–301. doi:10.7326/M17-0865
- Shah A, Hayes CJ, Martin BC. Characteristics of initial prescription episodes and likelihood of long-term opioid use—United States, 2006–2015. MMWR Morb Mortal Wkly Rep 2017; 66(10):265–269. doi:10.15585/mmwr.mm6610a1
- Dasgupta N, Funk MJ, Proescholdbell S, Hirsch A, Ribisl KM, Marshall S. Cohort study of the impact of high-dose opioid analgesics on overdose mortality. Pain Med 2016; 17(1):85–98. doi:10.1111/pme.12907
- Barnett ML, Olenski AR, Jena AB. Opioid-prescribing patterns of emergency physicians and risk of long-term use. N Engl J Med 2017; 376(7):663–673. doi:10.1056/NEJMsa1610524
- Brummett CM, Waljee JF, Goesling J, et al. New persistent opioid use after minor and major surgical procedures in US adults. JAMA Surg 2017; 152(6):e170504. doi:10.1001/jamasurg.2017.0504
- Volkow ND, McLellan AT. Opioid abuse in chronic pain—misconceptions and mitigation strategies. N Engl J Med 2016; 374(13):1253–1263. doi:10.1056/NEJMra1507771
- Stumbo SP, Yarborough BJ, McCarty D, Weisner C, Green CA. Patient-reported pathways to opioid use disorders and pain-related barriers to treatment engagement. J Subst Abuse Treat 2017; 73:47–54. doi:10.1016/j.jsat.2016.11.003
- Brat GA, Agniel D, Beam A, et al. Postsurgical prescriptions for opioid naive patients and association with overdose and misuse: retrospective cohort study. BMJ 2018; 360:j5790. doi:10.1136/bmj.j5790
- Vowles KE, McEntee ML, Julnes PS, Frohe T, Ney JP, van der Goes DN. Rates of opioid misuse, abuse, and addiction in chronic pain: a systematic review and data synthesis. Pain 2015; 156(4):569–576. doi:10.1097/01.j.pain.0000460357.01998.f1
- Davis MA, Lin LA, Liu H, Sites BD. Prescription opioid use among adults with mental health disorders in the United States. J Am Board Fam Med 2017; 30(4):407–417. doi:10.3122/jabfm.2017.04.170112
- Tsang A, Von Korff M, Lee S, et al. Common chronic pain conditions in developed and developing countries: gender and age differences and comorbidity with depression-anxiety disorders. J Pain 2008; 9(10):883–891. doi:10.1016/j.jpain.2008.05.005
- QuickStats: age-adjusted death rates for drug overdose, by race/ethnicity—national vital statistics system, United States, 2015–2016. MMWR Morb Mortal Wkly Rep 2018; 67(12):374. doi:10.15585/mmwr.mm6712a9
- Solomon DH, Rassen JA, Glynn RJ, Lee J, Levin R, Schneeweiss S. The comparative safety of analgesics in older adults with arthritis. Arch Intern Med 2010; 170(22):1968–1976. doi:10.1001/archinternmed.2010.391
- Vozoris NT, Wang X, Fischer HD, et al. Incident opioid drug use and adverse respiratory outcomes among older adults with COPD. Eur Respir J 2016; 48(3):683–693. doi:10.1183/13993003.01967-2015
- Wiese AD, Griffin MR, Schaffner W, et al. Opioid analgesic use and risk for invasive pneumococcal diseases: a nested case-control study. Ann Intern Med 2018; 168(6):396–404. doi:10.7326/M17-1907
- Chihuri S, Li G. Use of prescription opioids and motor vehicle crashes: a meta analysis. Accid Anal Prev 2017; 109:123–131. doi:10.1016/j.aap.2017.10.004
- Morasco BJ, Yarborough BJ, Smith NX, et al. Higher prescription opioid dose is associated with worse patient-reported pain outcomes and more health care utilization. J Pain 2017; 18(4):437–445. doi:10.1016/j.jpain.2016.12.004
- Krebs EE, Gravely A, Nugent S, et al. Effect of opioid vs nonopioid medications on pain-related function in patients with chronic back pain or hip or knee osteoarthritis pain: the SPACE randomized clinical trial. JAMA 2018; 319(9):872–882. doi:10.1001/jama.2018.0899
Mary, age 38, was hospitalized for acute cholecystitis requiring laparoscopic surgery. Her hospital course was uneventful. At the time of discharge, I, her inpatient doctor, prescribed 15 hydrocodone tablets for postoperative pain. I never saw her again. Did she struggle to stop taking the hydrocodone I prescribed?
Heather is a 50-year-old patient in my addiction medicine clinic who developed opioid use disorder while being treated for chronic pain. After much hardship and to her credit, she is now in long-term remission. Did her opioid use disorder start with an opioid prescription for an accepted indication?
The issues Mary and Heather face seem unrelated, but these 2 patients may be at different time points in the progression of the same disease. As a hospitalist, I want to optimize the chances that patients taking opioids for acute pain will be able to stop taking them.
CHRONIC USE VS OPIOID USE DISORDER
There is a distinction between chronic use of opioids and opioid use disorder. The latter is also known as addiction.
Patients who take opioids daily do not necessarily have opioid use disorder, even if they have physiologic dependence on them. Physiologic opioid dependence is commonly confused with opioid use disorder, but it is the expected result of regularly taking these drugs.
Opioid use disorder is a chronic disease of the brain characterized by loss of control over opioid use, resulting in harm. The Diagnostic and Statistical Manual, fifth edition, excludes physiologic dependence on opioids (tolerance and withdrawal) from its criteria for opioid use disorder if the patient is taking opioids solely under medical supervision.1 To be diagnosed with opioid use disorder, patients need to do only 2 of the following within 12 months:
- Take more of the drug than intended
- Want or try to cut down without success
- Spend a lot of time in getting, using, or recovering from the drug
- Crave the drug
- Fail to meet commitments due to the drug
- Continue to use the drug, even though it causes social or relationship problems
- Give up or reduce other activities because of the drug
- Use the drug even when it isn’t safe
- Continue to use even when it causes physical or psychological problems
- Develop tolerance (but, as noted, not if taking the drug as directed under a doctor’s supervision)
- Experience withdrawal (again, but not if taking the drug under medical supervision).
WHY DO SOME PATIENTS STRUGGLE TO STOP TAKING OPIOIDS?
Studying opioid use disorder as an outcome in large groups of patients is complicated by imperfect medical documentation. However, using pharmacy claims data, researchers can accurately describe opioid prescription patterns in large groups of patients over time. This means we can count how many patients keep taking prescribed opioids but not how many become addicted.
In a country where nearly 40% of adults are prescribed an opioid annually, the question is not why people start taking opioids, but why some have to struggle to stop.2 Several recent studies used pharmacy claims data to identify factors that may predict chronic opioid use in patients prescribed opioids for acute pain. The findings suggest that we can better treat acute pain to prevent chronic opioid use.
We don’t yet know how to protect patients like Mary from opioid use disorder, but the following 3 studies have already changed my practice.
HIGHER TOTAL DOSE MEANS HIGHER RISK
[Shah A, Hayes CJ, Martin BC. Characteristics of initial prescription episodes and likelihood of long-term opioid use—United States, 2006–2015. MMWR Morb Mortal Wkly Rep 2017; 66(10):265–269.]
Shah et al3 reported a study of nearly 1.3 million opioid-naive patients who received opioid prescriptions. Of those prescribed at least 1 day of opioids, 6% were still taking them 1 year later, and 2.9% were still taking them 3 years later.
Opioid exposure in acute pain was measured in total “morphine milligram equivalents” (MME), ie, the cumulative amount of opioids prescribed in the treatment episode, standardized across different types of opioids. We usually think of exposure in terms of how many milligrams a patient takes per day, which correlates with mortality in chronic opioid use.4 But this study showed a linear relationship between total MME prescribed for acute pain and ongoing opioid use in opioid-naive patients. By itself, the difference between daily and total MME made the article revelatory.
But the study went further, asking how much is too much: ie, What is the cutoff MME above which the patient is at risk of chronic opioid use? The relationship between acute opioid dose and chronic use is linear and starts early. Shah et al suggested that a total threshold of 700 MME predicts chronic opioid use—140 hydrocodone tablets, or 1 month of regular use.3
Many doctors worry that specific opioids such as oxycodone, hydromorphone, and fentanyl may be more habit-forming. Surprisingly, this study showed that these drugs were associated with rates of chronic use similar to those of other opioids when they controlled for potency.
Bottom line. Total opioid use in acute pain was the best predictor of chronic opioid use, and it showed that chronicity begins earlier than thought.
DON’T BE A ‘HIGH-INTENSITY’ PRESCRIBER
[Barnett ML, Olenski AR, Jena AB. Opioid-prescribing patterns of emergency physicians and risk of long-term use. N Engl J Med 2017; 376(7):663–673.]
Barnett et al5 analyzed opioid prescribing for acute pain in the emergency department, using Medicare pharmacy data from 377,629 previously opioid-naive patients. They categorized the emergency providers into quartiles based on the frequency of opioid prescribing.
The relative risk of ongoing opioid use 1 year after being treated by a “high-intensity” prescriber (ie, one in the top quartile) was 30% greater than in similar patients seen by a low-intensity prescriber (ie, one in the bottom quartile). In addition, those who were treated by high-intensity prescribers were more likely to have a serious fall.
In designing the study, the authors assumed that patients visiting an emergency department had their doctor assigned randomly. They controlled for many patient variables that might have confounded the results, such as age, sex, race, depression, medical comorbidities, and geographic region. Were the higher rates of ongoing opioid use in the high-intensity-prescriber group due to the higher prescribing rates of their emergency providers, or did the providers counsel patients differently? This is not known.
Bottom line. Different doctors manage similar patients differently when it comes to pain, and those who prescribe more opioids for acute pain put their patients at risk of chronic opioid use and falls. I don’t want to be a high-intensity opioid prescriber.
SURGERY AND CHRONIC OPIOID USE
[Brummett CM, Waljee JF, Goesling J, et al. New persistent opioid use after minor and major surgical procedures in US adults. JAMA Surg 2017; 152(6):e170504.]
Brummett et al6 examined ongoing opioid use after surgery in 36,177 opioid-naive patients and in a nonsurgical control group. After 3 months, 6% of the patients who underwent surgery remained on opioids, compared with only 0.4% of the nonsurgical controls. Whether the surgery was major or minor did not affect the rate of postoperative opioid use.
Risk factors for ongoing opioid use were preexisting addiction to anything (including tobacco), mood disorders, and preoperative pain disorders. These risk factors have previously been reported in nonsurgical patients.7
Brummett et al speculated that patients are counseled about postoperative opioids in a way that leads them to overestimate the safety and efficacy of these drugs for treating other common pain conditions.6
Bottom line. Patients with mental health comorbidities have a hard time stopping opioids. The remarkable finding in this study was the similarity between major and minor surgery in terms of chronic opioid use. If postoperative opioids treat only the pain caused by the surgery, major surgery should be associated with greater opioid use. The similarity suggests that a mechanism other than postoperative pain confers risk of chronic opioid use.
THINKING ABOUT OPIOIDS
Collectively, these articles describe elements of acute pain treatment that correlate with chronic ongoing opioid use: a higher cumulative dose,3 being seen by a physician who prescribes a lot of opioids,5 undergoing surgery,6 and psychiatric comorbidity.6 They made me wonder if opioid use for acute pain acts as an inoculation, analogous to inoculating a Petri dish with bacteria. The likelihood of chronic opioid use arises from the inoculum dose, the host response, and the context of inoculation.
These articles do not show how patients taking opioids chronically for pain become addicted. Stumbo et al8 interviewed 283 opioid-dependent patients and identified 5 pathways to opioid use disorder, 3 of which were related to pain control: inadequately controlled chronic pain, exposure to opioids during acute pain episodes, and chronic pain in patients who already had substance use disorders. Brat et al9 recently estimated the risk of opioid use disorder after receiving opioids postoperatively to be less than 1%, but it increased dramatically with duration of opioid treatment.
A patient who fills an opioid prescription does not necessarily have chronic pain. Nor do all patients with chronic pain require an opioid prescription. These studies did not establish whether the patients had a pain syndrome. In practice, we call our patients who chronically take opioids our “chronic pain patients.” But 40% of Americans have chronic pain, while only 5% take opioids daily for pain.11,12
We assume that those taking opioids have the most severe pain. But Brummett et al suggested that continued opioid use is predicted less by pain and more by psychiatric comorbidity.6 More than half of the opioid prescriptions in the United States are written for patients with serious mental illness, who represent one-sixth of that population.11 Maybe chronic opioid use for pain has more to do with vulnerability to opioids and less to do with a pain syndrome.
I now think about daily opioid use in much the same way as I think about daily prednisone use. Patients on daily prednisone have a characteristic set of medical risks from the prednisone itself, regardless of its indication. Yet we do not consider these patients addicted to prednisone. Opioid use may be similar.
Like most doctors, I am troubled by the continued rise in the opioid overdose rate.13 Yet addiction and death from overdose are not the only risks that patients on chronic opioids face; they also have higher rates of falls, cardiovascular death, pneumonia, death from chronic obstructive pulmonary disease, and motor vehicle crashes.14–17 Patients on chronic opioids for pain have greater mental health comorbidity and worse function.18
Most concerning, chronic opioid treatment for pain lacks proof of benefit. In fact, a recent study disproved the benefit of opioids for chronic pain compared with nonopioid options.19 When I meet with patients who are taking chronic opioids for pain, I often can’t identify why the drugs were started or ought to be continued, and I anticipate a bad outcome. Yet the patient is afraid to stop the drug. For these reasons, chronic opioid use for pain strikes me as worth considering separately from opioid use disorder.
HOW THIS CHANGED MY PRACTICE
The studies described above have had a powerful effect on my clinical care as a hospitalist.
I now talk to all patients starting opioids about how hard it can be to stop. Some patients are defensive at first, believing this does not apply to them. But I politely continue.
People with depression and anxiety can have a harder time stopping opioids. Addiction is both a risk with ongoing opioid use and a possible outcome of acute opioid use.8 But one can struggle to stop opioids without being addicted or depressed. Even the healthiest person may wish to continue opioids past the point of benefit.
I am careful not to invalidate the patient’s experience of pain. It is challenging for patients to find the balance between current discomfort and a possible future adverse effect. In these conversations, I imagine how I would want a loved one counseled on their pain control. This centers me as I choose my words and my tone.
I now monitor the total amount of opioid I prescribe for acute pain in addition to the daily dose. I give my patients as few opioids as reasonable, and advise them to take the minimum dose required for tolerable comfort. I offer nonopioid options as the preferred choice, presenting them as effective and safe. I do this irrespective of the indication for opioids.
I limit opioids in all patients, not just those with comorbidities. I include in my shared decision-making process the risk of chronic opioid use when I prescribe opioids for acute pain, carefully distinguishing it from opioid use disorder. Instead of excess opioids, I give patients my office phone number to call in case they struggle. I rarely get calls. But I find patients would rather have access to a doctor than extra pills. And offering them my contact information lets me limit opioids while letting them know that I am committed to their comfort and health.
As an addiction medicine doctor, I consult on patients not taking their opioids as prescribed. Caring for these patients is intellectually and emotionally draining; they suffer daily, and the opioids they take provide a modicum of relief at a high cost. The publications I have discussed here provide insight into how a troubled relationship with opioids begins. I remind myself that these patients have an iatrogenic condition. Their behaviors that we label “aberrant” may reflect an adverse reaction to medications prescribed to them for acute pain.
Mary, my patient with postoperative pain after cholecystectomy, may over time develop opioid use disorder as Heather did. That progression may have begun with the hydrocodone I prescribed and the counseling I gave her, and it may proceed to chronic opioid use and then opioid use disorder.
I am looking closely at the care I give for acute pain in light of these innovative studies. But even more so, they have increased the compassion with which I care for patients like Heather, those harmed by prescribed opioids.
- American Psychiatric Association. Diagnostic and Statistical Manual of Mental Disorders. 5th ed. Washington, DC: American Psychiatric Association Publishing; 2013:541–546.
- Han B, Compton WM, Blanco C, Crane E, Lee J, Jones CM. Prescription opioid use, misuse, and use disorders in US adults: 2015 national survey on drug use and health. Ann Intern Med 2017; 167(5):293–301. doi:10.7326/M17-0865
- Shah A, Hayes CJ, Martin BC. Characteristics of initial prescription episodes and likelihood of long-term opioid use—United States, 2006–2015. MMWR Morb Mortal Wkly Rep 2017; 66(10):265–269. doi:10.15585/mmwr.mm6610a1
- Dasgupta N, Funk MJ, Proescholdbell S, Hirsch A, Ribisl KM, Marshall S. Cohort study of the impact of high-dose opioid analgesics on overdose mortality. Pain Med 2016; 17(1):85–98. doi:10.1111/pme.12907
- Barnett ML, Olenski AR, Jena AB. Opioid-prescribing patterns of emergency physicians and risk of long-term use. N Engl J Med 2017; 376(7):663–673. doi:10.1056/NEJMsa1610524
- Brummett CM, Waljee JF, Goesling J, et al. New persistent opioid use after minor and major surgical procedures in US adults. JAMA Surg 2017; 152(6):e170504. doi:10.1001/jamasurg.2017.0504
- Volkow ND, McLellan AT. Opioid abuse in chronic pain—misconceptions and mitigation strategies. N Engl J Med 2016; 374(13):1253–1263. doi:10.1056/NEJMra1507771
- Stumbo SP, Yarborough BJ, McCarty D, Weisner C, Green CA. Patient-reported pathways to opioid use disorders and pain-related barriers to treatment engagement. J Subst Abuse Treat 2017; 73:47–54. doi:10.1016/j.jsat.2016.11.003
- Brat GA, Agniel D, Beam A, et al. Postsurgical prescriptions for opioid naive patients and association with overdose and misuse: retrospective cohort study. BMJ 2018; 360:j5790. doi:10.1136/bmj.j5790
- Vowles KE, McEntee ML, Julnes PS, Frohe T, Ney JP, van der Goes DN. Rates of opioid misuse, abuse, and addiction in chronic pain: a systematic review and data synthesis. Pain 2015; 156(4):569–576. doi:10.1097/01.j.pain.0000460357.01998.f1
- Davis MA, Lin LA, Liu H, Sites BD. Prescription opioid use among adults with mental health disorders in the United States. J Am Board Fam Med 2017; 30(4):407–417. doi:10.3122/jabfm.2017.04.170112
- Tsang A, Von Korff M, Lee S, et al. Common chronic pain conditions in developed and developing countries: gender and age differences and comorbidity with depression-anxiety disorders. J Pain 2008; 9(10):883–891. doi:10.1016/j.jpain.2008.05.005
- QuickStats: age-adjusted death rates for drug overdose, by race/ethnicity—national vital statistics system, United States, 2015–2016. MMWR Morb Mortal Wkly Rep 2018; 67(12):374. doi:10.15585/mmwr.mm6712a9
- Solomon DH, Rassen JA, Glynn RJ, Lee J, Levin R, Schneeweiss S. The comparative safety of analgesics in older adults with arthritis. Arch Intern Med 2010; 170(22):1968–1976. doi:10.1001/archinternmed.2010.391
- Vozoris NT, Wang X, Fischer HD, et al. Incident opioid drug use and adverse respiratory outcomes among older adults with COPD. Eur Respir J 2016; 48(3):683–693. doi:10.1183/13993003.01967-2015
- Wiese AD, Griffin MR, Schaffner W, et al. Opioid analgesic use and risk for invasive pneumococcal diseases: a nested case-control study. Ann Intern Med 2018; 168(6):396–404. doi:10.7326/M17-1907
- Chihuri S, Li G. Use of prescription opioids and motor vehicle crashes: a meta analysis. Accid Anal Prev 2017; 109:123–131. doi:10.1016/j.aap.2017.10.004
- Morasco BJ, Yarborough BJ, Smith NX, et al. Higher prescription opioid dose is associated with worse patient-reported pain outcomes and more health care utilization. J Pain 2017; 18(4):437–445. doi:10.1016/j.jpain.2016.12.004
- Krebs EE, Gravely A, Nugent S, et al. Effect of opioid vs nonopioid medications on pain-related function in patients with chronic back pain or hip or knee osteoarthritis pain: the SPACE randomized clinical trial. JAMA 2018; 319(9):872–882. doi:10.1001/jama.2018.0899

Reply to “Increasing Inpatient Consultation: Hospitalist Perceptions and Objective Findings. In Reference to: ‘Hospitalist Perspective of Interactions with Medicine Subspecialty Consult Services’”
The finding by Kachman et al. that consultations have decreased at their institution is an interesting and important observation.1 In contrast, our study found that more than a third of hospitalists reported an increase in consultation requests.2 There may be several explanations for this discrepancy. First, as Kachman et al. suggest, there may be differences between hospitalist perception and actual consultation use. Second, a significant variability in consultation may exist between hospitals. Although our study examined four institutions, we were unable to examine the variability between them, which requires further study. Third, there may be considerable variability between individual hospitalist practices, which is consistent with the findings reported by Kachman et al. Finally, the fact that our study examined only nonteaching services may be another explanation as Kachman et al. found that hospitalists on nonteaching services ordered more consultations than those on teaching services. These findings are consistent with a recent study conducted by Perez et al., who found that hospitalists on teaching services utilized fewer consultations and had lower direct care costs and shorter lengths of stay compared with those on nonteaching services.3 This finding raises the question of whether consultations impact care costs and lengths of stay, a topic that should be explored in future studies.
Disclosures
The authors report no conflicts of interest.
1. Kachman M, Carter K, Martin S. Increasing inpatient consultation: hospitalist perceptions and objective findings. In Reference to: “Hospitalist perspective of interactions with medicine subspecialty consult services”. J Hosp Med. 2018;13(11):802. doi: 10.12788/jhm.2992.
2. Adams TN, Bonsall J, Hunt D, et al. Hospitalist perspective of interactions with medicine subspecialty consult services. J Hosp Med. 2018;13(5):318-323. doi: 10.12788/jhm.2882. PubMed
3. Perez JA Jr, Awar M, Nezamabadi A, et al. Comparison of direct patient care costs and quality outcomes of the teaching and nonteaching hospitalist services at a large academic medical center. Acad Med. 2018;93(3):491-497. doi: 10.1097/ACM.0000000000002026. PubMed
The finding by Kachman et al. that consultations have decreased at their institution is an interesting and important observation.1 In contrast, our study found that more than a third of hospitalists reported an increase in consultation requests.2 There may be several explanations for this discrepancy. First, as Kachman et al. suggest, there may be differences between hospitalist perception and actual consultation use. Second, a significant variability in consultation may exist between hospitals. Although our study examined four institutions, we were unable to examine the variability between them, which requires further study. Third, there may be considerable variability between individual hospitalist practices, which is consistent with the findings reported by Kachman et al. Finally, the fact that our study examined only nonteaching services may be another explanation as Kachman et al. found that hospitalists on nonteaching services ordered more consultations than those on teaching services. These findings are consistent with a recent study conducted by Perez et al., who found that hospitalists on teaching services utilized fewer consultations and had lower direct care costs and shorter lengths of stay compared with those on nonteaching services.3 This finding raises the question of whether consultations impact care costs and lengths of stay, a topic that should be explored in future studies.
Disclosures
The authors report no conflicts of interest.
1. Kachman M, Carter K, Martin S. Increasing inpatient consultation: hospitalist perceptions and objective findings. In Reference to: “Hospitalist perspective of interactions with medicine subspecialty consult services”. J Hosp Med. 2018;13(11):802. doi: 10.12788/jhm.2992.
2. Adams TN, Bonsall J, Hunt D, et al. Hospitalist perspective of interactions with medicine subspecialty consult services. J Hosp Med. 2018;13(5):318-323. doi: 10.12788/jhm.2882. PubMed
3. Perez JA Jr, Awar M, Nezamabadi A, et al. Comparison of direct patient care costs and quality outcomes of the teaching and nonteaching hospitalist services at a large academic medical center. Acad Med. 2018;93(3):491-497. doi: 10.1097/ACM.0000000000002026. PubMed
© 2018 Society of Hospital Medicine
In Reply to “Diving Into Diagnostic Uncertainty: Strategies to Mitigate Cognitive Load. In Reference to: ‘Focused Ethnography of Diagnosis in Academic Medical Centers’”
We thank Dr. Santhosh and colleagues for their letter concerning our article.1 We agree that the diagnostic journey includes interactions both between and across teams, not just those within the patient’s team. In an article currently in press in Diagnosis, we examine how systems and cognitive factors interact during the process of diagnosis. Specifically, we reported on how communication between consultants can be both a barrier and facilitator to the diagnostic process.2 We found that the frequency, quality, and pace of communication between and across inpatient teams and specialists are essential to timely diagnoses. As diagnostic errors remain a costly and morbid issue in the hospital setting, efforts to improve communication are clearly needed.3
Santhosh et al. raise an interesting point regarding cognitive load in evaluating diagnosis. Cognitive load is a multidimensional construct that represents the load that performing a specific task poses on a learner’s cognitive system.4 Components often used for measuring load include (a) task characteristics such as format, complexity, and time pressure; (b) subject characteristics such as expertise level, age, and spatial abilities; and (c) mental load and effort that originate from the interaction between task and subject characteristics.5 While there is little doubt that measuring these constructs has face value in diagnosis, we know of no instruments that are nimble
Disclosures
The authors have nothing to disclose.
Funding
This project was supported by grant number P30HS024385 from the Agency for Healthcare Research and Quality. The funding source played no role in study design, data acquisition, analysis or decision to report these data.
1. Chopra V, Harrod M, Winter S, et al. Focused ethnography of diagnosis in academic medical centers. J Hosp Med. 2018;13(10):668-672. doi: 10.12788/jhm.2966 PubMed
2. Gupta A, Harrod M, Quinn M, et al. Mind the overlap: how system problems contribute to cognitive failure and diagnostic errors. Diagnosis. 2018; In Press PubMed
3. Gupta A, Snyder A, Kachalia A, et al. Malpractice claims related to diagnostic errors in the hospital [published online ahead of print August 11, 2017]. BMJ Qual Saf. 2017. doi: 10.1136/bmjqs-2017-006774 PubMed
4. Paas FG, Van Merrienboer JJ, Adam JJ. Measurement of cognitive load in instructional research. Percept Mot Skills. 1994;79(1 Pt 2):419-30. doi: 10.2466/pms.1994.79.1.419 PubMed
5. Paas FG, Tuovinen JE, Tabbers H, et al. Cognitive load measurement as a means to advance cognitive load theory. Educational Psychologist. 2003;38(1):63-71. doi: 10.1207/S15326985EP3801_8
We thank Dr. Santhosh and colleagues for their letter concerning our article.1 We agree that the diagnostic journey includes interactions both between and across teams, not just those within the patient’s team. In an article currently in press in Diagnosis, we examine how systems and cognitive factors interact during the process of diagnosis. Specifically, we reported on how communication between consultants can be both a barrier and facilitator to the diagnostic process.2 We found that the frequency, quality, and pace of communication between and across inpatient teams and specialists are essential to timely diagnoses. As diagnostic errors remain a costly and morbid issue in the hospital setting, efforts to improve communication are clearly needed.3
Santhosh et al. raise an interesting point regarding cognitive load in evaluating diagnosis. Cognitive load is a multidimensional construct that represents the load that performing a specific task poses on a learner’s cognitive system.4 Components often used for measuring load include (a) task characteristics such as format, complexity, and time pressure; (b) subject characteristics such as expertise level, age, and spatial abilities; and (c) mental load and effort that originate from the interaction between task and subject characteristics.5 While there is little doubt that measuring these constructs has face value in diagnosis, we know of no instruments that are nimble
Disclosures
The authors have nothing to disclose.
Funding
This project was supported by grant number P30HS024385 from the Agency for Healthcare Research and Quality. The funding source played no role in study design, data acquisition, analysis or decision to report these data.
1. Chopra V, Harrod M, Winter S, et al. Focused ethnography of diagnosis in academic medical centers. J Hosp Med. 2018;13(10):668-672. doi: 10.12788/jhm.2966 PubMed
2. Gupta A, Harrod M, Quinn M, et al. Mind the overlap: how system problems contribute to cognitive failure and diagnostic errors. Diagnosis. 2018; In Press PubMed
3. Gupta A, Snyder A, Kachalia A, et al. Malpractice claims related to diagnostic errors in the hospital [published online ahead of print August 11, 2017]. BMJ Qual Saf. 2017. doi: 10.1136/bmjqs-2017-006774 PubMed
4. Paas FG, Van Merrienboer JJ, Adam JJ. Measurement of cognitive load in instructional research. Percept Mot Skills. 1994;79(1 Pt 2):419-30. doi: 10.2466/pms.1994.79.1.419 PubMed
5. Paas FG, Tuovinen JE, Tabbers H, et al. Cognitive load measurement as a means to advance cognitive load theory. Educational Psychologist. 2003;38(1):63-71. doi: 10.1207/S15326985EP3801_8
© 2018 Society of Hospital Medicine