User login
High-Goal ‘Lytes: Repletion Gone Awry?
Electrolyte imbalances, per se, predispose to ventricular ectopy and, in extreme cases, sudden cardiac death.1 As these outcomes are more common in the presence of intrinsic heart disease, serum electrolytes—particularly potassium and magnesium—are routinely monitored and made replete in patients with myocardial infarction (MI) or acute decompensated heart failure (ADHF).
Patients hospitalized with ADHF often present with metabolic derangements and varying degrees of chronic adaptations in their renin–angiotensin–aldosterone system.1,2 In addition, during an ADHF hospitalization, they are subjected to guideline-directed medical therapy (GDMT), commonly in escalating doses, that exhibit well-established effects on serum potassium levels, including diuretics, angiotensin-converting-enzyme inhibitors, angiotensin receptor blockers, beta blockers, and mineralocorticoid receptor antagonists. Thus, there are myriad ways patients hospitalized for ADHF might experience electrolyte abnormalities.
In this issue of the Journal of Hospital Medicine, O’Sullivan et al. explore the associations between mean 72-hour serum potassium and important clinical outcomes—in-hospital mortality, transfer to an intensive care unit (ICU), and length of stay (LOS)—among patients with normal admission serum potassium hospitalized for ADHF.3 Through a retrospective review of electronic records from 116 hospitals, the authors identified 4,995 initially normokalemic heart failure (HF; identified by ICD-9 codes) patients and grouped them into low-normal (3.5-4.0 mEq/L), normal (4.0-4.5 mEq/L), and high-normal (4.5-5.0 mEq/L) potassium groups.3 Adjustments were made for composite scores encapsulating other lab abnormalities and comorbidities.
Over the 72-hour exposure window, the authors observed no statistically significant difference in mortality, ICU transfer, or LOS between the low-normal and normal potassium groups.3 Moreover, in a sensitivity analysis of patients who did not receive potassium supplementation, there remained statistically similar rates of mortality, ICU transfer, and LOS.3 Together, these findings suggest that maintenance of potassium >4 mEq/L may not be efficacious for preventing in-hospital complications of ADHF.3 In fact, they observed more frequent mortality and ICU transfer in patients who had high-normal potassium. This group, however, had a higher burden of chronic kidney disease and illness severity on presentation and was less likely to receive supplemental potassium.3
ADHF accounts for more than one million hospital admissions annually with one in four patients readmitted within 30 days; estimated costs surpass $30 billion.2 Reducing unnecessary expenditures in the management of HF through evidence-based guidelines is paramount. Electrolyte repletion in the setting of ADHF may represent one such opportunity by reducing excess phlebotomy, laboratory services, and potassium supplementation. Patient experience may also improve from curbing these cumbersome practices. While society guidelines endorse potassium repletion in MI to reduce the risk of ventricular arrhythmia,4 there is no uniform consensus in ADHF. As the authors cite, existing data regarding ideal potassium levels in patients with ADHF is lacking, with current evidence drawn from small observational studies. The present study, being much larger in size and being linked with observed rates of active potassium supplementation, provides some of the strongest evidence to date that a potassium goal of >4 mEq/L may not be efficacious at reducing ADHF-related complications in the generalized HF population.
While it remains uncertain if avoiding low-normal potassium levels in ADHF is beneficial, over the long term, intermediate-range potassium levels are clearly associated with the lowest HF-related mortality. In a study of over 2,000 HF patients who underwent longitudinal potassium monitoring, mortality was distributed along a U-shaped curve with highest mortality at the extremes of kalemia and a nadir at a level of 4.3 mEq/L.5
A major limitation of the present study is that it does not account for variability within the ADHF population. Firstly, knowledge regarding the use of GDMT, which not only affects serum potassium (all GDMTs) but also reduces the likelihood of arrhythmias (beta blockers), would have been informative. Moreover, the authors do not have access to data regarding incident arrhythmia and instead use ICU admission as a surrogate. In addition, ADHF patients in this study varied greatly in illness severity, ranging from those receiving initial therapy with loop diuretics alone to those requiring augmentation with thiazides and even the use of temporary mechanical circulatory support.3 Escalating loop diuretic or metolazone use not only is associated with increased mortality6 but often results in impressive natriuresis and, potentially dangerous, kaliuresis secondary to the sequential nephron blockade.7 Those who underwent extensive potassium swings in the study may not be appropriately captured using 72-hour serum potassium averages. Additionally, this study did not assess for quantity of diuresis, which is known to affect serum potassium values. It is possible that those with low-normal potassium represent patients who underwent more effective diuresis and therefore were discharged sooner. Adding to the variability, ADHF in this study encompassed both systolic (HF with a reduced ejection fraction) and diastolic (HF with a preserved ejection fraction) HF although, perhaps not surprisingly, there were marked differences in the HF subtype by potassium group—the proportions with only diastolic dysfunction were 37.1%, 39.0%, and 45.8% in the low-normal, normal, and high-normal groups, respectively (P = .0174).3 Given the known heterogeneity between these two HF subtypes,8 particularly with respect to their response to mortality-reducing GDMT,2,8 the results may be significantly confounded.
Relatedly, by excluding initially hypokalemic patients, the authors have lost considerable power and broad generalizability as these patients likely represent those at greatest risk of recurrent hypokalemia and its attendant complications during admission.
This study should be lauded for critically appraising the ubiquitous practice of electrolyte repletion. The authors present compelling preliminary data suggesting that maintenance of potassium >4 mEq/L in the general ADHF population is not efficacious at preventing ADHF complications and, as a corollary, is likely not cost-effective. However, we agree with the authors that a randomized controlled trial will be needed to change clinical practice. Ideally, such a study would account for HF subtype and GDMT use and could compare rates of arrhythmia, AHDF-related death, and all-cause mortality in patients maintained to goal normokalemia (>3.5 mEq/L) versus “high
Disclosures
Dr. Blaha reports grants from NIH, grants from FDA, grants from AHA, grants and personal fees from Amgen Foundation, grants from Aetna Foundation, personal fees from Sanofi, personal fees from Regeneron, and personal fees from Novartis, from Novo Nordisk, and from Bayer, outside the submitted work. Dr. Dudum and Dr. Lahti have nothing to disclose.
1. Packer M, Gottlieb SS, Blum MA. Immediate and long-term pathophysiologic mechanisms underlying the genesis of sudden cardiac death in patients with congestive heart failure. Am J Med. 1987;82(3):4-10. https://doi.org/10.1016/0002-9343(87)90126-4.
2. Yancy CW, Jessup M, Bozkurt B, et al. 2013 ACCF/AHA guideline for the management of heart failure: a report of the American College of Cardiology Foundation/American Heart Association Task Force on Practice Guidelines. J Am Coll Cardiol. 2013;62(16):e147-e239. https://doi.org/10.1016/j.jacc.2013.05.019.
3. O’Sullivan KF, Kashef MA, Knee AB, et al. Examining the “Repletion Reflex”: the association between serum potassium and outcomes in hospitalized patients with HF. J Hosp Med. 14(12);729-736. https://doi.org/10.12788/jhm.3270.
4. Antman EM, Anbe DT, Armstrong PW, et al. ACC/AHA guidelines for the management of patients with ST-elevation myocardial infarction--executive summary: a report of the American College of Cardiology/American Heart Association Task Force on Practice Guidelines (Writing Committee to Revise the 1999 Guidelines for the Management of Patients With Acute Myocardial Infarction). Circulation 2004;110(5):588-636. https://doi.org/10.1161/01.CIR.0000134791.68010.FA
5. Nunez J, Bayes-Genis A, Zannad F, et al. Long-Term Potassium Monitoring and Dynamics in Heart Failure and Risk of Mortality. Circulation 2018;137(13):1320-1330. https://doi.org/10.1161/CIRCULATIONAHA.117.030576.
6. Neuberg GW, Miller AB, O’Connor CM, et al. Diuretic resistance predicts mortality in patients with advanced heart failure. Am Heart J. 2002;144(1):31-38. https://doi.org/10.1067/mhj.2002.123144
7. Jentzer JC, DeWald TA, Hernandez AF. Combination of loop diuretics with thiazide-type diuretics in heart failure. J Am Coll Cardiol. 2010;56(19):1527-1534. https://doi.org/10.1016/j.jacc.2010.06.034.
8. Triposkiadis F, Butler J, Abboud FM, et al. The continuous heart failure spectrum: moving beyond an ejection fraction classification. Eur Heart J. 40(26):2155-2163. https://doi.org/10.1093/eurheartj/ehz158.
Electrolyte imbalances, per se, predispose to ventricular ectopy and, in extreme cases, sudden cardiac death.1 As these outcomes are more common in the presence of intrinsic heart disease, serum electrolytes—particularly potassium and magnesium—are routinely monitored and made replete in patients with myocardial infarction (MI) or acute decompensated heart failure (ADHF).
Patients hospitalized with ADHF often present with metabolic derangements and varying degrees of chronic adaptations in their renin–angiotensin–aldosterone system.1,2 In addition, during an ADHF hospitalization, they are subjected to guideline-directed medical therapy (GDMT), commonly in escalating doses, that exhibit well-established effects on serum potassium levels, including diuretics, angiotensin-converting-enzyme inhibitors, angiotensin receptor blockers, beta blockers, and mineralocorticoid receptor antagonists. Thus, there are myriad ways patients hospitalized for ADHF might experience electrolyte abnormalities.
In this issue of the Journal of Hospital Medicine, O’Sullivan et al. explore the associations between mean 72-hour serum potassium and important clinical outcomes—in-hospital mortality, transfer to an intensive care unit (ICU), and length of stay (LOS)—among patients with normal admission serum potassium hospitalized for ADHF.3 Through a retrospective review of electronic records from 116 hospitals, the authors identified 4,995 initially normokalemic heart failure (HF; identified by ICD-9 codes) patients and grouped them into low-normal (3.5-4.0 mEq/L), normal (4.0-4.5 mEq/L), and high-normal (4.5-5.0 mEq/L) potassium groups.3 Adjustments were made for composite scores encapsulating other lab abnormalities and comorbidities.
Over the 72-hour exposure window, the authors observed no statistically significant difference in mortality, ICU transfer, or LOS between the low-normal and normal potassium groups.3 Moreover, in a sensitivity analysis of patients who did not receive potassium supplementation, there remained statistically similar rates of mortality, ICU transfer, and LOS.3 Together, these findings suggest that maintenance of potassium >4 mEq/L may not be efficacious for preventing in-hospital complications of ADHF.3 In fact, they observed more frequent mortality and ICU transfer in patients who had high-normal potassium. This group, however, had a higher burden of chronic kidney disease and illness severity on presentation and was less likely to receive supplemental potassium.3
ADHF accounts for more than one million hospital admissions annually with one in four patients readmitted within 30 days; estimated costs surpass $30 billion.2 Reducing unnecessary expenditures in the management of HF through evidence-based guidelines is paramount. Electrolyte repletion in the setting of ADHF may represent one such opportunity by reducing excess phlebotomy, laboratory services, and potassium supplementation. Patient experience may also improve from curbing these cumbersome practices. While society guidelines endorse potassium repletion in MI to reduce the risk of ventricular arrhythmia,4 there is no uniform consensus in ADHF. As the authors cite, existing data regarding ideal potassium levels in patients with ADHF is lacking, with current evidence drawn from small observational studies. The present study, being much larger in size and being linked with observed rates of active potassium supplementation, provides some of the strongest evidence to date that a potassium goal of >4 mEq/L may not be efficacious at reducing ADHF-related complications in the generalized HF population.
While it remains uncertain if avoiding low-normal potassium levels in ADHF is beneficial, over the long term, intermediate-range potassium levels are clearly associated with the lowest HF-related mortality. In a study of over 2,000 HF patients who underwent longitudinal potassium monitoring, mortality was distributed along a U-shaped curve with highest mortality at the extremes of kalemia and a nadir at a level of 4.3 mEq/L.5
A major limitation of the present study is that it does not account for variability within the ADHF population. Firstly, knowledge regarding the use of GDMT, which not only affects serum potassium (all GDMTs) but also reduces the likelihood of arrhythmias (beta blockers), would have been informative. Moreover, the authors do not have access to data regarding incident arrhythmia and instead use ICU admission as a surrogate. In addition, ADHF patients in this study varied greatly in illness severity, ranging from those receiving initial therapy with loop diuretics alone to those requiring augmentation with thiazides and even the use of temporary mechanical circulatory support.3 Escalating loop diuretic or metolazone use not only is associated with increased mortality6 but often results in impressive natriuresis and, potentially dangerous, kaliuresis secondary to the sequential nephron blockade.7 Those who underwent extensive potassium swings in the study may not be appropriately captured using 72-hour serum potassium averages. Additionally, this study did not assess for quantity of diuresis, which is known to affect serum potassium values. It is possible that those with low-normal potassium represent patients who underwent more effective diuresis and therefore were discharged sooner. Adding to the variability, ADHF in this study encompassed both systolic (HF with a reduced ejection fraction) and diastolic (HF with a preserved ejection fraction) HF although, perhaps not surprisingly, there were marked differences in the HF subtype by potassium group—the proportions with only diastolic dysfunction were 37.1%, 39.0%, and 45.8% in the low-normal, normal, and high-normal groups, respectively (P = .0174).3 Given the known heterogeneity between these two HF subtypes,8 particularly with respect to their response to mortality-reducing GDMT,2,8 the results may be significantly confounded.
Relatedly, by excluding initially hypokalemic patients, the authors have lost considerable power and broad generalizability as these patients likely represent those at greatest risk of recurrent hypokalemia and its attendant complications during admission.
This study should be lauded for critically appraising the ubiquitous practice of electrolyte repletion. The authors present compelling preliminary data suggesting that maintenance of potassium >4 mEq/L in the general ADHF population is not efficacious at preventing ADHF complications and, as a corollary, is likely not cost-effective. However, we agree with the authors that a randomized controlled trial will be needed to change clinical practice. Ideally, such a study would account for HF subtype and GDMT use and could compare rates of arrhythmia, AHDF-related death, and all-cause mortality in patients maintained to goal normokalemia (>3.5 mEq/L) versus “high
Disclosures
Dr. Blaha reports grants from NIH, grants from FDA, grants from AHA, grants and personal fees from Amgen Foundation, grants from Aetna Foundation, personal fees from Sanofi, personal fees from Regeneron, and personal fees from Novartis, from Novo Nordisk, and from Bayer, outside the submitted work. Dr. Dudum and Dr. Lahti have nothing to disclose.
1. Packer M, Gottlieb SS, Blum MA. Immediate and long-term pathophysiologic mechanisms underlying the genesis of sudden cardiac death in patients with congestive heart failure. Am J Med. 1987;82(3):4-10. https://doi.org/10.1016/0002-9343(87)90126-4.
2. Yancy CW, Jessup M, Bozkurt B, et al. 2013 ACCF/AHA guideline for the management of heart failure: a report of the American College of Cardiology Foundation/American Heart Association Task Force on Practice Guidelines. J Am Coll Cardiol. 2013;62(16):e147-e239. https://doi.org/10.1016/j.jacc.2013.05.019.
3. O’Sullivan KF, Kashef MA, Knee AB, et al. Examining the “Repletion Reflex”: the association between serum potassium and outcomes in hospitalized patients with HF. J Hosp Med. 14(12);729-736. https://doi.org/10.12788/jhm.3270.
4. Antman EM, Anbe DT, Armstrong PW, et al. ACC/AHA guidelines for the management of patients with ST-elevation myocardial infarction--executive summary: a report of the American College of Cardiology/American Heart Association Task Force on Practice Guidelines (Writing Committee to Revise the 1999 Guidelines for the Management of Patients With Acute Myocardial Infarction). Circulation 2004;110(5):588-636. https://doi.org/10.1161/01.CIR.0000134791.68010.FA
5. Nunez J, Bayes-Genis A, Zannad F, et al. Long-Term Potassium Monitoring and Dynamics in Heart Failure and Risk of Mortality. Circulation 2018;137(13):1320-1330. https://doi.org/10.1161/CIRCULATIONAHA.117.030576.
6. Neuberg GW, Miller AB, O’Connor CM, et al. Diuretic resistance predicts mortality in patients with advanced heart failure. Am Heart J. 2002;144(1):31-38. https://doi.org/10.1067/mhj.2002.123144
7. Jentzer JC, DeWald TA, Hernandez AF. Combination of loop diuretics with thiazide-type diuretics in heart failure. J Am Coll Cardiol. 2010;56(19):1527-1534. https://doi.org/10.1016/j.jacc.2010.06.034.
8. Triposkiadis F, Butler J, Abboud FM, et al. The continuous heart failure spectrum: moving beyond an ejection fraction classification. Eur Heart J. 40(26):2155-2163. https://doi.org/10.1093/eurheartj/ehz158.
© 2019 Society of Hospital Medicine
Bridging the “Digital Divide”
The “digital divide”: That is how the VA describes the situation of the 42% of veterans without reliable—or any—Internet access. The lack of access means they are effectively barred from participating in telehealth and other online services.
With the goal of “digital inclusion,” the Veterans Health Administration (VHA) is partnering with a variety of nongovernmental businesses. VHA and T-Mobile, for instance, host the VA Video Connect application, which connects veterans to health care providers on a secure line on all devices with T-Mobile for free.
Walmart, Philips, and Veteran Service Organizations have set up remote clinics for veterans to access telehealth services closer to their home; with those partners, the VHA also lends Internet-connected iPads to veterans who do not have home computers.
Now, the VHA is working with Microsoft and Internet service providers to bring broadband access to rural areas with large populations of veterans.
The initiatives will not only improve access to health care, but also open other avenues. Dr. Kevin Galpin, executive director of VHA Telehealth Services, says, “We really want veterans to have the opportunities that come with being connected. There is lots of value in being able to maintain social relationships, conduct job searches online, and connect with VA. We know limited access is a problem and we’re exploring a multitude of options.”
If a picture is worth a thousand words, a patient is worth ten thousand
Today’s most prominent medical journals have a “clinical images” section. High- quality, readily accessible digital photography can transport a patient to the journal’s pages, as demonstrated by Grandjean and Huber’s “Thinker sign” images in this issue of the Journal.1 Images challenge healthcare practitioners to recall diseases via pattern recognition, or to deduce them by higher-order cognition. Images can reinforce prior learning, change perspective, and challenge preconceived notions.
See related article and editorial
I have used clinical images—physical examination findings, skin rashes, blood smears, radiography—for more than 20 years as a medical educator. I have dimmed the lights in conference rooms and lecture halls from Maine to Northern California, challenging students, residents, and faculty to contemplate a snippet of history and describe what they see to arrive at a diagnosis. Images are compelling teaching tools for first-year medical students beginning to make clinical observations, and for seasoned clinicians who have seen thousands of patients.
In my experience, clinical image presentations are consistently engaging. Introducing an audience to 8 to 10 patients in an hour loosely mimics the experience of seeing patients over the course of morning hospital rounds or clinic. The images I use are assembled from a collection of images of patients I have seen during my career in medical education. Showing images of patients I’ve personally cared for consistently prompts people to engage. “Here is a patient I saw last week on the medicine wards” reignites the sagging eyes and fading attention of the audience. In retelling a patient encounter, I create a human connection between a picture on the screen—my patient—and the listener. My patient becomes a patient of anyone in the room, a patient someone might see tomorrow on hospital rounds or in clinic.
Sometimes, instead of presenting a brief clinical history or select physical findings, I tell a story about the patient in the image. Whether sad or funny, these stories often bring learners together, prompting them to wonder how there could ever be a better job than the one they have. A prominent educator once approached me after a clinical images presentation to opine, “What you did with us today is the cure for physician burnout.” Hyperbole, perhaps, but I understood what he meant. Over the course of an hour, the audience had been transported to numerous bedsides and examination rooms, witnessing the interesting and delightfully mundane jewels our patients often bring—true pearls, indeed.
However, as educational, fun, and intellectually challenging as clinical images can be, they can never replace the experience of being at the bedside. There is nothing as engaging as the stories the patients themselves tell us. Unfiltered musings come to life, physical findings are indelibly seared into memory.
But unfortunately, even as trainees spend less time than ever before with their patients,2,3 bedside rounding has dramatically faded, replaced by rounds in conference rooms and hospital hallways.4 The underlying cause is multifactorial—declining physical examination skills, increasing use of radiography and other advanced imaging, the electronic health record, and the overwhelming volume of clinical tasks carried out at a distance from the patient.
But this is not the whole story. I also believe that teachers and leaders fear the “thin ice” of rounding at the patient’s bedside. One never knows what will happen there—what will be said, what will be asked, what will be uncovered. What if, while talking to and examining the patient with the Dahl sign shown in Grandjean and Huber,1 the patient’s condition would suddenly deteriorate, urgently requiring nebulized beta-2 agonists and transfer to the medical intensive care unit? What if the patient rambles for 5 minutes about extraneous details not relevant to his or her disease? What if the nurse needs to dispense scheduled medications or hang the next dose of antibiotics? What if the patient asks to use the bedpan at the moment digital clubbing was to be pointed out and discussed?
Of course, the patient may have lots to say, or nothing at all. But in those moments when the ice does not break, when the patient is not suddenly wheeled away to radiology, key clinical findings are seen and remembered, often for an entire career. If the ice does not break, the patient, the story, and the clinical finding—otherwise seen on a large screen in a dark room or on a page in a textbook or journal—come together in that moment, in a way nothing else ever quite can.
In this golden age of technology, we must remember that these images portray real patients with stories to tell, sometimes mundane and sometimes profound, but always worth hearing.
Acknowledgment: The author wishes to thank Mark C. Henderson, MD, for his helpful comments on this manuscript.
- Grandjean R, Huber LC. Thinker’s sign. Cleve Clin J Med 2019; 86(7):439. doi:10.3949/ccjm.86a.19036
- Chaiyachati KH, Shea JA, Asch DA, et al. Assessment of inpatient time allocation among first-year internal medicine residents using time-motion observations. JAMA Intern Med 2019. Epub ahead of print. doi:10.1001/jamainternmed.2019.0095
- Block L, Habicht R, Wu AW, et al. In the wake of the 2003 and 2011 duty hours regulations, how do internal medicine interns spend their time? J Gen Intern Med 2013; 28(8):1042–1047. doi:10.1007/s11606-013-2376-6
- Crumlish CM, Yialamas MA, McMahon GT. Quantification of bedside teaching by an academic hospitalist group. J Hosp Med 2009; 4(5):304–307. doi:10.1002/jhm.540
Today’s most prominent medical journals have a “clinical images” section. High- quality, readily accessible digital photography can transport a patient to the journal’s pages, as demonstrated by Grandjean and Huber’s “Thinker sign” images in this issue of the Journal.1 Images challenge healthcare practitioners to recall diseases via pattern recognition, or to deduce them by higher-order cognition. Images can reinforce prior learning, change perspective, and challenge preconceived notions.
See related article and editorial
I have used clinical images—physical examination findings, skin rashes, blood smears, radiography—for more than 20 years as a medical educator. I have dimmed the lights in conference rooms and lecture halls from Maine to Northern California, challenging students, residents, and faculty to contemplate a snippet of history and describe what they see to arrive at a diagnosis. Images are compelling teaching tools for first-year medical students beginning to make clinical observations, and for seasoned clinicians who have seen thousands of patients.
In my experience, clinical image presentations are consistently engaging. Introducing an audience to 8 to 10 patients in an hour loosely mimics the experience of seeing patients over the course of morning hospital rounds or clinic. The images I use are assembled from a collection of images of patients I have seen during my career in medical education. Showing images of patients I’ve personally cared for consistently prompts people to engage. “Here is a patient I saw last week on the medicine wards” reignites the sagging eyes and fading attention of the audience. In retelling a patient encounter, I create a human connection between a picture on the screen—my patient—and the listener. My patient becomes a patient of anyone in the room, a patient someone might see tomorrow on hospital rounds or in clinic.
Sometimes, instead of presenting a brief clinical history or select physical findings, I tell a story about the patient in the image. Whether sad or funny, these stories often bring learners together, prompting them to wonder how there could ever be a better job than the one they have. A prominent educator once approached me after a clinical images presentation to opine, “What you did with us today is the cure for physician burnout.” Hyperbole, perhaps, but I understood what he meant. Over the course of an hour, the audience had been transported to numerous bedsides and examination rooms, witnessing the interesting and delightfully mundane jewels our patients often bring—true pearls, indeed.
However, as educational, fun, and intellectually challenging as clinical images can be, they can never replace the experience of being at the bedside. There is nothing as engaging as the stories the patients themselves tell us. Unfiltered musings come to life, physical findings are indelibly seared into memory.
But unfortunately, even as trainees spend less time than ever before with their patients,2,3 bedside rounding has dramatically faded, replaced by rounds in conference rooms and hospital hallways.4 The underlying cause is multifactorial—declining physical examination skills, increasing use of radiography and other advanced imaging, the electronic health record, and the overwhelming volume of clinical tasks carried out at a distance from the patient.
But this is not the whole story. I also believe that teachers and leaders fear the “thin ice” of rounding at the patient’s bedside. One never knows what will happen there—what will be said, what will be asked, what will be uncovered. What if, while talking to and examining the patient with the Dahl sign shown in Grandjean and Huber,1 the patient’s condition would suddenly deteriorate, urgently requiring nebulized beta-2 agonists and transfer to the medical intensive care unit? What if the patient rambles for 5 minutes about extraneous details not relevant to his or her disease? What if the nurse needs to dispense scheduled medications or hang the next dose of antibiotics? What if the patient asks to use the bedpan at the moment digital clubbing was to be pointed out and discussed?
Of course, the patient may have lots to say, or nothing at all. But in those moments when the ice does not break, when the patient is not suddenly wheeled away to radiology, key clinical findings are seen and remembered, often for an entire career. If the ice does not break, the patient, the story, and the clinical finding—otherwise seen on a large screen in a dark room or on a page in a textbook or journal—come together in that moment, in a way nothing else ever quite can.
In this golden age of technology, we must remember that these images portray real patients with stories to tell, sometimes mundane and sometimes profound, but always worth hearing.
Acknowledgment: The author wishes to thank Mark C. Henderson, MD, for his helpful comments on this manuscript.
- Grandjean R, Huber LC. Thinker’s sign. Cleve Clin J Med 2019; 86(7):439. doi:10.3949/ccjm.86a.19036
- Chaiyachati KH, Shea JA, Asch DA, et al. Assessment of inpatient time allocation among first-year internal medicine residents using time-motion observations. JAMA Intern Med 2019. Epub ahead of print. doi:10.1001/jamainternmed.2019.0095
- Block L, Habicht R, Wu AW, et al. In the wake of the 2003 and 2011 duty hours regulations, how do internal medicine interns spend their time? J Gen Intern Med 2013; 28(8):1042–1047. doi:10.1007/s11606-013-2376-6
- Crumlish CM, Yialamas MA, McMahon GT. Quantification of bedside teaching by an academic hospitalist group. J Hosp Med 2009; 4(5):304–307. doi:10.1002/jhm.540

NIH Study Will Test New Preventive Drug for Multidrug-Resistant TB
Tuberculosis (TB) kills more people each year than any other infectious disease. Not only the patients, but their nearest and dearest are at risk, as well. They are more likely to acquire latent TB infection and many will progress to active TB.
NIH is launching a study to compare delamanid, a new drug for multidrug-resistant TB (MDR-TB) with isoniazid, the long-time standard. The study hypothesis is that prophylactic delamanid will better protect family and other household members of patients with MDR-TB. Existing treatments for MDR-TB are often highly toxic and poorly tolerated, putting patients at risk while curing them only about half the time. Delamanid is one of the first drugs available specifically to treat people with MDR-TB and the first formulation suitable for children.
“A highly effective preventive TB therapy for vulnerable household members of people with active MDR-TB disease would be a game-changer in TB care,” says Dr. Anneke Hesseling, MD, PhD, one of the study leaders.
The phase 3 trial, Protecting Households on Exposure to Newly Diagnosed Index Multidrug-Resistant Tuberculosis Patients (PHOENIx MDR-TB), will take place at > 27 sites in at ≥ 12 countries. The researchers plan to enroll 2,158 adults being treated for confirmed active MDR-TB and 3,452 members of their households who are at high risk for developing active TB. The household members will be assigned randomly to receive oral delamanid daily for 26 weeks or oral isoniazid plus vitamin B6 daily for 26 weeks. All at-risk members of the same household will receive the same drug regimen.
Every 2 to 12 weeks, participating household contacts will have physical exams and other health assessments. The researchers will follow them for 96 weeks. Final results are expected in 2024.
TB is the leading cause of death among people with HIV. Both delamanid and isoniazid have minimal potential for interacting with antiretroviral drugs. Study participants with HIV who have not yet begun treatment will be referred to local health care providers for antiretroviral treatment.
Leadership & Professional Development: Sponsored—Catapulting Underrepresented Talent off the Cusp and into the Game
“When you’ve worked hard, and done well, and walked through that doorway of opportunity, you do not slam it shut behind you. You reach back and you give other folks the same chances that helped you succeed.” —Michelle Obama
We are at a point in time where awareness around the existing disparities in gender equity in academic medicine couldn’t be higher. It is time for us to take this knowledge and move swiftly into action. What’s one of the best ways to do this? Become a sponsor or be sponsored. “Sponsorship can effectively catapult nascent talent from unknown to rising-star status.”1
Catapult—an excellent and fitting word to describe the effect sponsorship can have on careers. Women start out behind and often remain behind men, even with mentoring.2 With the catapult of sponsorship, however, high-level career advancement is attainable. Studies show that sponsorship is significantly associated with success: 72.5% of men and 59.0% of women who reported sponsorship were successful, compared with 57.7% and 44.8% who did not report sponsorship.3 For women and underrepresented minorities, sponsorship is especially important and can “dramatically overcome many of the tripwires to achievement.”4
Sponsorship is a two-way proposition—and both the sponsor and protégé have responsibility to make the relationship successful. Want to be sponsored? Here’s what to do: (1) Broadcast your achievements. You don’t have to be a braggart, but you don’t need to be humble—celebrate and share your achievements within and outside your network. (2) Seek out leaders of different backgrounds—sponsors don’t need to be just like you. Varied viewpoints bring broader perspectives to the challenges ahead as you climb the leadership ladder. (3) Clearly spell out your leadership goals for yourself and a potential sponsor. Then work to achieve your shared goals in a timely way.
Consider how you can be a sponsor, particularly for junior faculty and those from under-represented groups. Ask yourself: Who have you sponsored this week? Whose success have you celebrated this quarter? Who will you nominate for an award or recognition this year?
Sponsorship is an essential component of good leadership. Individual leaders and academic health centers (AHCs) must take a step forward toward equity by making sponsorship an expectation and strategic priority. Set the expectation that senior leaders will act as sponsors, set clear goals to work toward (ie, more female chairs, increasing recruitment and retention of underrepresented minorities, etc.), and track metrics.2 While “pay it forward” may seem cliché, sponsorship can truly be a remarkable opportunity for growth for both the sponsor and the protégé, and a winning proposition for the institution.
Disclosures
Dr. Spector reports other from I-PASS Patient Safety Institute, outside the submitted work; and she is a co-founder and holds equity in the I-PASS Patient Safety Institute and the Executive Director of Executive Leadership in Academic Medicine. Ms. Overholser has nothing to disclose.
1. Sponsorship: A Path to the Academic Medicine C-suite for Women Faculty? Elizabeth L. Travis, PhD, Leilani Doty, PhD, and Deborah L. Helitzer, ScD. Acad Med. 2013;88(10):1414-1417. doi: 10.1097/ACM.0b013e3182a35456. PubMed
2. Foust-Cummings, Dinolfo S, Kohler K. Sponsoring Women to Success. https://www.catalyst.org/research/sponsoring-women-to-success/. Accessed May 10, 2019.
3. Patton EW, Griffith KA, Jones RD, Stewart A, Ubel PA, Jagsi R. Differences in mentor-mentee sponsorship in male vs female recipients of national institutes of health grants. JAMA Intern Med. 2017;177(4):580-582. doi: 10.1001/jamainternmed.2016.9391. PubMed
4. Hewlett SA. Celebrating Sponsors -- and Sponsorship. Inc. https://www.inc.com/sylvia-ann-hewlett/celebrating-sponsors-and-sponsorship.html. Accessed May 10, 2019.
“When you’ve worked hard, and done well, and walked through that doorway of opportunity, you do not slam it shut behind you. You reach back and you give other folks the same chances that helped you succeed.” —Michelle Obama
We are at a point in time where awareness around the existing disparities in gender equity in academic medicine couldn’t be higher. It is time for us to take this knowledge and move swiftly into action. What’s one of the best ways to do this? Become a sponsor or be sponsored. “Sponsorship can effectively catapult nascent talent from unknown to rising-star status.”1
Catapult—an excellent and fitting word to describe the effect sponsorship can have on careers. Women start out behind and often remain behind men, even with mentoring.2 With the catapult of sponsorship, however, high-level career advancement is attainable. Studies show that sponsorship is significantly associated with success: 72.5% of men and 59.0% of women who reported sponsorship were successful, compared with 57.7% and 44.8% who did not report sponsorship.3 For women and underrepresented minorities, sponsorship is especially important and can “dramatically overcome many of the tripwires to achievement.”4
Sponsorship is a two-way proposition—and both the sponsor and protégé have responsibility to make the relationship successful. Want to be sponsored? Here’s what to do: (1) Broadcast your achievements. You don’t have to be a braggart, but you don’t need to be humble—celebrate and share your achievements within and outside your network. (2) Seek out leaders of different backgrounds—sponsors don’t need to be just like you. Varied viewpoints bring broader perspectives to the challenges ahead as you climb the leadership ladder. (3) Clearly spell out your leadership goals for yourself and a potential sponsor. Then work to achieve your shared goals in a timely way.
Consider how you can be a sponsor, particularly for junior faculty and those from under-represented groups. Ask yourself: Who have you sponsored this week? Whose success have you celebrated this quarter? Who will you nominate for an award or recognition this year?
Sponsorship is an essential component of good leadership. Individual leaders and academic health centers (AHCs) must take a step forward toward equity by making sponsorship an expectation and strategic priority. Set the expectation that senior leaders will act as sponsors, set clear goals to work toward (ie, more female chairs, increasing recruitment and retention of underrepresented minorities, etc.), and track metrics.2 While “pay it forward” may seem cliché, sponsorship can truly be a remarkable opportunity for growth for both the sponsor and the protégé, and a winning proposition for the institution.
Disclosures
Dr. Spector reports other from I-PASS Patient Safety Institute, outside the submitted work; and she is a co-founder and holds equity in the I-PASS Patient Safety Institute and the Executive Director of Executive Leadership in Academic Medicine. Ms. Overholser has nothing to disclose.
1. Sponsorship: A Path to the Academic Medicine C-suite for Women Faculty? Elizabeth L. Travis, PhD, Leilani Doty, PhD, and Deborah L. Helitzer, ScD. Acad Med. 2013;88(10):1414-1417. doi: 10.1097/ACM.0b013e3182a35456. PubMed
2. Foust-Cummings, Dinolfo S, Kohler K. Sponsoring Women to Success. https://www.catalyst.org/research/sponsoring-women-to-success/. Accessed May 10, 2019.
3. Patton EW, Griffith KA, Jones RD, Stewart A, Ubel PA, Jagsi R. Differences in mentor-mentee sponsorship in male vs female recipients of national institutes of health grants. JAMA Intern Med. 2017;177(4):580-582. doi: 10.1001/jamainternmed.2016.9391. PubMed
4. Hewlett SA. Celebrating Sponsors -- and Sponsorship. Inc. https://www.inc.com/sylvia-ann-hewlett/celebrating-sponsors-and-sponsorship.html. Accessed May 10, 2019.
© 2019 Society of Hospital Medicine
Frailty Tools are Not Yet Ready for Prime Time in High-Risk Identification
In this issue of the Journal of Hospital Medicine, McAlister et al.1 compared the ability of the Clinical Frailty Scale (CFS) and the Hospital Frailty Risk Score (HFRS) to predict 30-day readmission or death. The authors prospectively assessed adult patients aged ≥18 years without cognitive impairment being discharged back to the community after medical admissions. They demonstrated only modest overlap in frailty designation between HFRS and CFS and concluded that CFS is better than HFRS for predicting the outcomes of interest.
Before a prediction rule is widely adopted for use in routine practice, robust external validation is needed.2 Factors such as the prevalence of disease in a population, the clinical competencies of a health system, the socioeconomic status, and the ethnicity of the population can all affect how well a clinical rule performs, but may not become apparent until a prospective validation in a different population is attempted.
In developing the HFRS, Gilbert et al. aimed to create a low-cost, highly generalizable method of identifying frailty using International Classification of Diseases (ICD) 10 billing codes.3 The derivation and validation cohorts for HFRS included older adults aged >75 years in the United Kingdom, many of whom had cognitive impairment. Therefore, it is not surprising that the tool behaved very differently in the younger Canadian cohort described by McAlister et al. where persons with cognitive impairment were excluded. That the HFRS had less predictability in the Canadian cohort may simply indicate that it performs better in an older population with cognitive vulnerabilities; given the frailty constructs of the CFS, it may provide less insights in older populations.
We applaud the efforts to find a way to better identify high-risk groups of adults. We also appreciate the increasing attention to function and other frailty-related domains in risk prediction models. Nevertheless, we recommend caution in using any of the many existing frailty indices4 in risk prediction tools unless it is clear what domains of frailty are most relevant for the predicted outcome and what population is the subject of interest.
One of the challenges of choosing an appropriate frailty tool is that different tools are measuring different domains or constructs of frailty. Most consider frailty either as a physical phenotype5 or as a more multifaceted construct with impairments in physical and mental health, function, and social interaction.6 There is often poor overlap between those individuals identified as frail by different measures, highlighting that they are in fact identifying different people within the population studied and have different predictive abilities.
An ideal frailty tool for clinical use would allow clinicians to identify high-risk patients relative to specific outcome(s) in real time prior to discharge from hospital or prior to a sentinel event in the community. CFS can be calculated at the bedside, but HFRS calculation can only be done retrospectively when medical records are coded for claims after discharge. This makes HFRS more suited to research or post hoc quality measure work and CFS more suited to clinical use as the authors describe.
Although using a frailty indicator to help determine those at high risk of early readmission is an important objective, the presence of frailty accounts for only part of a person’s risk for readmission or other untoward events. Reasons for readmissions are complex and often heavily weighted on a lack of social and community supports. A deeper understanding of the reasons for readmission is needed to establish whether readmission of these complex patients has more to do with frailty or other drivers such as poor transitions of care.
The prevalence of frailty will continue to increase as our population ages. Definitions of frailty vary, but there is a broad agreement that frailty, regardless of how it is constructed, increases with age, results in multisystem changes, and leads to increased healthcare utilization and costs. Preventing the development of frailty, identifying frailty, and developing interventions to address frailty in and out of the hospital setting are all vital. We welcome further research regarding the biopsychosocial constructs of frailty, how they overlap with the frailty phenotype, and how these constructs inform both our understanding of frailty and the use of frailty tools.
Disclosures
The authors have no conflicts of interest to report.
1. McAlister FA, Lin M, Bakal JA. Prevalence and Postdischarge Outcomes Associated with Frailty in Medical Inpatients: Impact of Different Frailty Definitions. J Hosp Med. 2019;14(7):407-410. doi: 10.12788/jhm.3174 PubMed
2. Wasson JH, Sox HC, Neff RK, Goldman L. Clinical prediction rules. Applications and methodological standards. N Engl J Med. 1985;313(13):793-799. doi: 10.1056/NEJM198509263131306. PubMed
3. Gilbert T, Neuburger J, Kraindler J, et al. Development and validation of a Hospital Frailty Risk Score focusing on older people in acute care settings using electronic hospital records: an observational study. Lancet. 2018;391(10132):1775-1782. doi: 10.1016/S0140-6736(18)30668-8. PubMed
4. de Vries NM, Staal JB, van Ravensberg CD, et al. Outcome instruments to measure frailty: a systematic review. Ageing Res Rev. 2011;10(1):104-114. doi: 0.1016/j.arr.2010.09.001. PubMed
5. Fried LP, Tangen CM, Walston J, et al. Frailty in older adults: evidence for a phenotype. J Gerontol A Biol Sci Med Sci. 2001;56(3);M146-M156. PubMed
6. Cesari M, Gambassi G, van Kan GA, Vellas B. The frailty phenotype and the frailty index: different instruments for different purposes. Age Ageing. 2014;43(1):10-12. doi: 10.1093/ageing/aft160. PubMed
In this issue of the Journal of Hospital Medicine, McAlister et al.1 compared the ability of the Clinical Frailty Scale (CFS) and the Hospital Frailty Risk Score (HFRS) to predict 30-day readmission or death. The authors prospectively assessed adult patients aged ≥18 years without cognitive impairment being discharged back to the community after medical admissions. They demonstrated only modest overlap in frailty designation between HFRS and CFS and concluded that CFS is better than HFRS for predicting the outcomes of interest.
Before a prediction rule is widely adopted for use in routine practice, robust external validation is needed.2 Factors such as the prevalence of disease in a population, the clinical competencies of a health system, the socioeconomic status, and the ethnicity of the population can all affect how well a clinical rule performs, but may not become apparent until a prospective validation in a different population is attempted.
In developing the HFRS, Gilbert et al. aimed to create a low-cost, highly generalizable method of identifying frailty using International Classification of Diseases (ICD) 10 billing codes.3 The derivation and validation cohorts for HFRS included older adults aged >75 years in the United Kingdom, many of whom had cognitive impairment. Therefore, it is not surprising that the tool behaved very differently in the younger Canadian cohort described by McAlister et al. where persons with cognitive impairment were excluded. That the HFRS had less predictability in the Canadian cohort may simply indicate that it performs better in an older population with cognitive vulnerabilities; given the frailty constructs of the CFS, it may provide less insights in older populations.
We applaud the efforts to find a way to better identify high-risk groups of adults. We also appreciate the increasing attention to function and other frailty-related domains in risk prediction models. Nevertheless, we recommend caution in using any of the many existing frailty indices4 in risk prediction tools unless it is clear what domains of frailty are most relevant for the predicted outcome and what population is the subject of interest.
One of the challenges of choosing an appropriate frailty tool is that different tools are measuring different domains or constructs of frailty. Most consider frailty either as a physical phenotype5 or as a more multifaceted construct with impairments in physical and mental health, function, and social interaction.6 There is often poor overlap between those individuals identified as frail by different measures, highlighting that they are in fact identifying different people within the population studied and have different predictive abilities.
An ideal frailty tool for clinical use would allow clinicians to identify high-risk patients relative to specific outcome(s) in real time prior to discharge from hospital or prior to a sentinel event in the community. CFS can be calculated at the bedside, but HFRS calculation can only be done retrospectively when medical records are coded for claims after discharge. This makes HFRS more suited to research or post hoc quality measure work and CFS more suited to clinical use as the authors describe.
Although using a frailty indicator to help determine those at high risk of early readmission is an important objective, the presence of frailty accounts for only part of a person’s risk for readmission or other untoward events. Reasons for readmissions are complex and often heavily weighted on a lack of social and community supports. A deeper understanding of the reasons for readmission is needed to establish whether readmission of these complex patients has more to do with frailty or other drivers such as poor transitions of care.
The prevalence of frailty will continue to increase as our population ages. Definitions of frailty vary, but there is a broad agreement that frailty, regardless of how it is constructed, increases with age, results in multisystem changes, and leads to increased healthcare utilization and costs. Preventing the development of frailty, identifying frailty, and developing interventions to address frailty in and out of the hospital setting are all vital. We welcome further research regarding the biopsychosocial constructs of frailty, how they overlap with the frailty phenotype, and how these constructs inform both our understanding of frailty and the use of frailty tools.
Disclosures
The authors have no conflicts of interest to report.
1. McAlister FA, Lin M, Bakal JA. Prevalence and Postdischarge Outcomes Associated with Frailty in Medical Inpatients: Impact of Different Frailty Definitions. J Hosp Med. 2019;14(7):407-410. doi: 10.12788/jhm.3174 PubMed
2. Wasson JH, Sox HC, Neff RK, Goldman L. Clinical prediction rules. Applications and methodological standards. N Engl J Med. 1985;313(13):793-799. doi: 10.1056/NEJM198509263131306. PubMed
3. Gilbert T, Neuburger J, Kraindler J, et al. Development and validation of a Hospital Frailty Risk Score focusing on older people in acute care settings using electronic hospital records: an observational study. Lancet. 2018;391(10132):1775-1782. doi: 10.1016/S0140-6736(18)30668-8. PubMed
4. de Vries NM, Staal JB, van Ravensberg CD, et al. Outcome instruments to measure frailty: a systematic review. Ageing Res Rev. 2011;10(1):104-114. doi: 0.1016/j.arr.2010.09.001. PubMed
5. Fried LP, Tangen CM, Walston J, et al. Frailty in older adults: evidence for a phenotype. J Gerontol A Biol Sci Med Sci. 2001;56(3);M146-M156. PubMed
6. Cesari M, Gambassi G, van Kan GA, Vellas B. The frailty phenotype and the frailty index: different instruments for different purposes. Age Ageing. 2014;43(1):10-12. doi: 10.1093/ageing/aft160. PubMed
© 2019 Society of Hospital Medicine
Restarting Anticoagulants after a Gastrointestinal Hemorrhage—Between Rockall and a Hard Place
Anticoagulant use to prevent ischemic strokes in patients with atrial fibrillation (AF) continues to be one of the most challenging decisions facing patients and their physicians, in large part due to significant patient-to-patient variation in both AF-related stroke risk and anticoagulant-associated hemorrhage risk. Now, add a layer of complexity—.how should one approach anticoagulant use following an adverse event such as an acute upper gastrointestinal (GI) hemorrhage? On the one side, the risk of ischemic stroke, and on the other, the risk of recurrent bleeding, either of which can lead to death or disability. Making this decision requires humility, clinical acumen, shared decision-making, and data.
Data on this subject are sparse.1,2 Observational studies show that patients who restart anticoagulants after GI hemorrhage experience fewer ischemic strokes. These studies also show that patients who restart anticoagulant therapy are healthier than those who do not—in measurable ways and, importantly, in unmeasurable ways. Thus far, observational studies have not sufficiently dealt with confounding by indication; that is, patients who restart anticoagulants are fundamentally different than patients who do not.
In this issue of the Journal of Hospital Medicine®, Pappas et al. focus on the optimal timing of resuming oral anticoagulation in patients who have sustained acute upper GI bleeds while receiving oral anticoagulation for AF.3 They use a microsimulation modeling approach to address this question, by creating a synthetic population of patients reflective of age, gender, and comorbidities in a United States population of patients with AF. Using data from epidemiologic studies that describe the risk of rebleeding, hemorrhagic complications, and ischemic stroke as well as the quality of life associated with each of these events, the authors have constructed a decision analytic model to determine the optimal day to restart anticoagulation. This modeling approach mitigates confounding by indication, a limitation of observational studies. They report that the optimal day to restart anticoagulant therapy is in the range of 32-51 days. As one would predict, when using direct-acting anticoagulants and for patients with high stroke risk, the investigators find that restarting therapy earlier is associated with greater benefit. These findings help to untangle a knot of risk and benefits facing patients with AF following an acute GI hemorrhage.
Interpreting the results relies on an understanding of the strengths and weaknesses of simulation modeling and the data used in the analysis. Like any research method, the devil is in the details. Stitching together event rates and outcomes from multiple studies, the results of a simulation model are only as good as the studies the model draws from. In particular, assumptions regarding the time-dependent decline in rebleeding risk are a critical component of determining the optimal time to resume anticoagulation. The authors had to make multiple assumptions to project the 24-hour risk of rebleeding determined from the Rockall score to estimate the risk of rebleeding over the next days to months.4 Consequently, the results are likely overly precise. Practically, 30-50 days or four to eight weeks may better reflect the precision of the study findings.
Results on optimal timing of resuming anticoagulation therapy are most applicable for patients when the decision to restart anticoagulants has already been made. We part ways with the authors in their conclusion that these results confirm that anticoagulants should be restarted. There are multiple appropriate reasons why anticoagulant therapy should not be restarted following an acute upper GI hemorrhage. For example, in observational studies, patients not restarted on anticoagulant therapy were more likely to have a history of falls and to have had severe bleeds.1 Furthermore, patients who do not restart therapy are more likely to die in follow-up. It is tempting to use this fact to support restarting anticoagulants. However, when the causes of death are examined, the vast majority of deaths were unrelated to thrombosis or hemorrhage.2 Patients with AF are older and have multiple comorbidities and life-limiting conditions. Accordingly, the results of this study are better used to engage patients in shared decision-making and contextualized in the broader picture of patients’ health and goals.5
Restarting anticoagulants after a GI hemorrhage is a difficult and high-stakes clinical decision. The study by Pappas et al. uses a simulation model to advance our understanding about the optimal timing to restart anticoagulants. By integrating the dynamic risk of ischemic stroke and recurrent hemorrhage following GI hemorrhage, they estimate the maximal benefit when anticoagulants are restarted between 30 days and 50 days after hemorrhage. The results of their analysis are best used to inform timing among patients where the decision to restart anticoagulants has already been made. The analysis also provides a useful starting point for shared decision-making by highlighting that the optimal net benefit is influenced by patient-to-patient variation in the underlying AF-related stroke risk and anticoagulant-associated rebleeding risk.
Disclosures: Dr. Shah has nothing to disclose. Dr. Eckman reports grants from Heart Rhythm Society/Boehringer-Ingelheim and grants from Bristol-Myers Squibb/Pfizer Education Consortium, outside the submitted work.
1. Qureshi W, Mittal C, Patsias I, et al. Restarting anticoagulation and outcomes after major gastrointestinal bleeding in atrial fibrillation. Am J Cardiol. 2014;113(4):662-668. doi: 10.1016/j.amjcard.2013.10.044. PubMed
2. Witt DM, Delate T, Garcia DA, et al. Risk of thromboembolism, recurrent hemorrhage, and death after warfarin therapy interruption for gastrointestinal tract bleeding. Arch Intern Med. 2012;172(19):1484-1491. doi: 10.1001/archinternmed.2012.4261. PubMed
3. Pappas MA, Evans N, Rizk MK, Rothberg MB. Resuming anticoagulation following upper gastrointestinal bleeding among patients with nonvalvular atrial fibrillation—a microsimulation analysis. J Hosp Med. 2019;14(7):394-400. doi: 10.12788/jhm.3189. PubMed
4. Rockall TA, Logan RF, Devlin HB, Northfield TC. Risk assessment after acute upper gastrointestinal haemorrhage. Gut. 1996;38(3):316-321. doi: 10.1136/gut.38.3.316. PubMed
5. Tinetti ME, Naik AD, Dodson JA. Moving from disease-centered to patient goals–directed care for patients with multiple chronic conditions: patient value-based care. JAMA Cardiol. 2016;1(1):9-10. doi: 10.1001/jamacardio.2015.0248. PubMed
Anticoagulant use to prevent ischemic strokes in patients with atrial fibrillation (AF) continues to be one of the most challenging decisions facing patients and their physicians, in large part due to significant patient-to-patient variation in both AF-related stroke risk and anticoagulant-associated hemorrhage risk. Now, add a layer of complexity—.how should one approach anticoagulant use following an adverse event such as an acute upper gastrointestinal (GI) hemorrhage? On the one side, the risk of ischemic stroke, and on the other, the risk of recurrent bleeding, either of which can lead to death or disability. Making this decision requires humility, clinical acumen, shared decision-making, and data.
Data on this subject are sparse.1,2 Observational studies show that patients who restart anticoagulants after GI hemorrhage experience fewer ischemic strokes. These studies also show that patients who restart anticoagulant therapy are healthier than those who do not—in measurable ways and, importantly, in unmeasurable ways. Thus far, observational studies have not sufficiently dealt with confounding by indication; that is, patients who restart anticoagulants are fundamentally different than patients who do not.
In this issue of the Journal of Hospital Medicine®, Pappas et al. focus on the optimal timing of resuming oral anticoagulation in patients who have sustained acute upper GI bleeds while receiving oral anticoagulation for AF.3 They use a microsimulation modeling approach to address this question, by creating a synthetic population of patients reflective of age, gender, and comorbidities in a United States population of patients with AF. Using data from epidemiologic studies that describe the risk of rebleeding, hemorrhagic complications, and ischemic stroke as well as the quality of life associated with each of these events, the authors have constructed a decision analytic model to determine the optimal day to restart anticoagulation. This modeling approach mitigates confounding by indication, a limitation of observational studies. They report that the optimal day to restart anticoagulant therapy is in the range of 32-51 days. As one would predict, when using direct-acting anticoagulants and for patients with high stroke risk, the investigators find that restarting therapy earlier is associated with greater benefit. These findings help to untangle a knot of risk and benefits facing patients with AF following an acute GI hemorrhage.
Interpreting the results relies on an understanding of the strengths and weaknesses of simulation modeling and the data used in the analysis. Like any research method, the devil is in the details. Stitching together event rates and outcomes from multiple studies, the results of a simulation model are only as good as the studies the model draws from. In particular, assumptions regarding the time-dependent decline in rebleeding risk are a critical component of determining the optimal time to resume anticoagulation. The authors had to make multiple assumptions to project the 24-hour risk of rebleeding determined from the Rockall score to estimate the risk of rebleeding over the next days to months.4 Consequently, the results are likely overly precise. Practically, 30-50 days or four to eight weeks may better reflect the precision of the study findings.
Results on optimal timing of resuming anticoagulation therapy are most applicable for patients when the decision to restart anticoagulants has already been made. We part ways with the authors in their conclusion that these results confirm that anticoagulants should be restarted. There are multiple appropriate reasons why anticoagulant therapy should not be restarted following an acute upper GI hemorrhage. For example, in observational studies, patients not restarted on anticoagulant therapy were more likely to have a history of falls and to have had severe bleeds.1 Furthermore, patients who do not restart therapy are more likely to die in follow-up. It is tempting to use this fact to support restarting anticoagulants. However, when the causes of death are examined, the vast majority of deaths were unrelated to thrombosis or hemorrhage.2 Patients with AF are older and have multiple comorbidities and life-limiting conditions. Accordingly, the results of this study are better used to engage patients in shared decision-making and contextualized in the broader picture of patients’ health and goals.5
Restarting anticoagulants after a GI hemorrhage is a difficult and high-stakes clinical decision. The study by Pappas et al. uses a simulation model to advance our understanding about the optimal timing to restart anticoagulants. By integrating the dynamic risk of ischemic stroke and recurrent hemorrhage following GI hemorrhage, they estimate the maximal benefit when anticoagulants are restarted between 30 days and 50 days after hemorrhage. The results of their analysis are best used to inform timing among patients where the decision to restart anticoagulants has already been made. The analysis also provides a useful starting point for shared decision-making by highlighting that the optimal net benefit is influenced by patient-to-patient variation in the underlying AF-related stroke risk and anticoagulant-associated rebleeding risk.
Disclosures: Dr. Shah has nothing to disclose. Dr. Eckman reports grants from Heart Rhythm Society/Boehringer-Ingelheim and grants from Bristol-Myers Squibb/Pfizer Education Consortium, outside the submitted work.
1. Qureshi W, Mittal C, Patsias I, et al. Restarting anticoagulation and outcomes after major gastrointestinal bleeding in atrial fibrillation. Am J Cardiol. 2014;113(4):662-668. doi: 10.1016/j.amjcard.2013.10.044. PubMed
2. Witt DM, Delate T, Garcia DA, et al. Risk of thromboembolism, recurrent hemorrhage, and death after warfarin therapy interruption for gastrointestinal tract bleeding. Arch Intern Med. 2012;172(19):1484-1491. doi: 10.1001/archinternmed.2012.4261. PubMed
3. Pappas MA, Evans N, Rizk MK, Rothberg MB. Resuming anticoagulation following upper gastrointestinal bleeding among patients with nonvalvular atrial fibrillation—a microsimulation analysis. J Hosp Med. 2019;14(7):394-400. doi: 10.12788/jhm.3189. PubMed
4. Rockall TA, Logan RF, Devlin HB, Northfield TC. Risk assessment after acute upper gastrointestinal haemorrhage. Gut. 1996;38(3):316-321. doi: 10.1136/gut.38.3.316. PubMed
5. Tinetti ME, Naik AD, Dodson JA. Moving from disease-centered to patient goals–directed care for patients with multiple chronic conditions: patient value-based care. JAMA Cardiol. 2016;1(1):9-10. doi: 10.1001/jamacardio.2015.0248. PubMed
© 2019 Society of Hospital Medicine
Leading By Example: How Medical Journals Can Improve Representation in Academic Medicine
Women and racial and ethnic minorities remain underrepresented in senior faculty roles and academic leadership positions.1 Participation in peer review and publication in medical journals are important components of academic advancement that are emphasized in the promotion process. These efforts offer recognition of expertise and increase visibility in the scientific community, which may enhance opportunities for networking and collaboration, and provide other opportunities for career advancement. In addition, abundant evidence shows that organizations benefit from diverse teams, with better quality decisions and increased productivity resulting from diverse ideas and perspectives.2
Numerous studies have highlighted the prevalence and persistence of disparities in peer review and authorship.3,4 Much of this work has focused on gender though gaps in these measures likely exist for racial and ethnic minorities. Yet, there are few examples of journals implementing strategies to address disparities and track results of such efforts.5 While institutional barriers to advancement must be addressed, we believe that medical journals have an obligation to address unequal opportunities.
At the Journal of Hospital Medicine, we are committed to leading by example and developing approaches to create equity in all facets of journal leadership and authorship.6 The first step towards progress is to assess the current representation of women and racial and ethnic minorities in our journal community, including first and senior authors, invited expert contributors, reviewers, and editorial team members. Like most journals, we have not collected demographic information from authors or reviewers. But now, as part of the journal’s commitment to this cause, we request that everyone in the journal community (author, reviewer, editor) update their journal account (accessible at https://mc.manuscriptcentral.com/jhm) with demographic data, including gender, race, and ethnicity.
Inclusion of these data is voluntary. While each individual will be able to access and edit their personal demographic data, the individual data will remain private and unviewable to others. As such, it will not be available for nor will it be used in the manuscript review or decision process but rather for assessing our own inclusiveness. We will review these data in aggregate to broadly inform outreach efforts to promote diversity and inclusion in our author, invited expert contributor, reviewer, and journal leadership pools. We will report on the progress of these efforts in upcoming years.
We are committed to equity in providing opportunities for academic advancement across the journal community. Diversity and inclusion are important in raising the quality of the work that we publish. Different perspectives strengthen our journal and will help us continue to advance the field of Hospital Medicine.
Disclosures
The authors have nothing to disclose.
1. American Association of Medical Colleges. U.S. Medical School Faculty, 2018. https://www.aamc.org/data/facultyroster/reports/494946/usmsf18.html. Accessed May 6, 2019.
2. Turban S, Wu D, Zhang L. “When Gender Diversity Makes Firms More Productive” Harvard Business Review Feb 2019. https://hbr.org/2019/02/research-when-gender-diversity-makes-firms-more-productive. Accessed May 6, 2019.
3. Silver JK, Poorman JA, Reilly JM, Spector ND, Goldstein R, Zafonte RD. Assessment of women physicians among authors of perspective-type articles published in high-impact pediatric journals. JAMA Netw Open. 2018;1(3):e180802. doi: 10.1001/jamanetworkopen.2018.0802. PubMed
4. Jagsi R, Guancial EA, Worobey CC, Henault LE, Chang Y, Starr R, Tarbell NJ, Hylek EM. The “gender gap” in authorship of academic medical literature- a 35-year perspective. N Engl J Med. 2006;355(3):281-287. doi: 10.1056/NEJMsa053910. PubMed
5. Nature’s under-representation of women. Nature. 2018;558:344. doi: 10.1038/d41586-018-05465-7. PubMed
6. Shah SS. The Journal of Hospital Medicine in 2019 and beyond. J Hosp Med. 2019;14(1):7. doi: 10.12788/jhm.3143. PubMed
Women and racial and ethnic minorities remain underrepresented in senior faculty roles and academic leadership positions.1 Participation in peer review and publication in medical journals are important components of academic advancement that are emphasized in the promotion process. These efforts offer recognition of expertise and increase visibility in the scientific community, which may enhance opportunities for networking and collaboration, and provide other opportunities for career advancement. In addition, abundant evidence shows that organizations benefit from diverse teams, with better quality decisions and increased productivity resulting from diverse ideas and perspectives.2
Numerous studies have highlighted the prevalence and persistence of disparities in peer review and authorship.3,4 Much of this work has focused on gender though gaps in these measures likely exist for racial and ethnic minorities. Yet, there are few examples of journals implementing strategies to address disparities and track results of such efforts.5 While institutional barriers to advancement must be addressed, we believe that medical journals have an obligation to address unequal opportunities.
At the Journal of Hospital Medicine, we are committed to leading by example and developing approaches to create equity in all facets of journal leadership and authorship.6 The first step towards progress is to assess the current representation of women and racial and ethnic minorities in our journal community, including first and senior authors, invited expert contributors, reviewers, and editorial team members. Like most journals, we have not collected demographic information from authors or reviewers. But now, as part of the journal’s commitment to this cause, we request that everyone in the journal community (author, reviewer, editor) update their journal account (accessible at https://mc.manuscriptcentral.com/jhm) with demographic data, including gender, race, and ethnicity.
Inclusion of these data is voluntary. While each individual will be able to access and edit their personal demographic data, the individual data will remain private and unviewable to others. As such, it will not be available for nor will it be used in the manuscript review or decision process but rather for assessing our own inclusiveness. We will review these data in aggregate to broadly inform outreach efforts to promote diversity and inclusion in our author, invited expert contributor, reviewer, and journal leadership pools. We will report on the progress of these efforts in upcoming years.
We are committed to equity in providing opportunities for academic advancement across the journal community. Diversity and inclusion are important in raising the quality of the work that we publish. Different perspectives strengthen our journal and will help us continue to advance the field of Hospital Medicine.
Disclosures
The authors have nothing to disclose.
1. American Association of Medical Colleges. U.S. Medical School Faculty, 2018. https://www.aamc.org/data/facultyroster/reports/494946/usmsf18.html. Accessed May 6, 2019.
2. Turban S, Wu D, Zhang L. “When Gender Diversity Makes Firms More Productive” Harvard Business Review Feb 2019. https://hbr.org/2019/02/research-when-gender-diversity-makes-firms-more-productive. Accessed May 6, 2019.
3. Silver JK, Poorman JA, Reilly JM, Spector ND, Goldstein R, Zafonte RD. Assessment of women physicians among authors of perspective-type articles published in high-impact pediatric journals. JAMA Netw Open. 2018;1(3):e180802. doi: 10.1001/jamanetworkopen.2018.0802. PubMed
4. Jagsi R, Guancial EA, Worobey CC, Henault LE, Chang Y, Starr R, Tarbell NJ, Hylek EM. The “gender gap” in authorship of academic medical literature- a 35-year perspective. N Engl J Med. 2006;355(3):281-287. doi: 10.1056/NEJMsa053910. PubMed
5. Nature’s under-representation of women. Nature. 2018;558:344. doi: 10.1038/d41586-018-05465-7. PubMed
6. Shah SS. The Journal of Hospital Medicine in 2019 and beyond. J Hosp Med. 2019;14(1):7. doi: 10.12788/jhm.3143. PubMed
© 2019 Society of Hospital Medicine
Diversion of Controlled Drugs in Hospitals: A Scoping Review of Contributors and Safeguards
The United States (US) and Canada are the two highest per-capita consumers of opioids in the world;1 both are struggling with unprecedented opioid-related mortality.2,3 The nonmedical use of opioids is facilitated by diversion and defined as the transfer of drugs from lawful to unlawful channels of use4,5 (eg, sharing legitimate prescriptions with family and friends6). Opioids and other controlled drugs are also diverted from healthcare facilities;4,5,7,8 Canadian data suggest these incidents may be increasing (controlled-drug loss reports have doubled each year since 20159).
The diversion of controlled drugs from hospitals affects patients, healthcare workers (HCWs), hospitals, and the public. Patients suffer insufficient analgesia or anesthesia, experience substandard care from impaired HCWs, and are at risk of infections from compromised syringes.4,10,11 HCWs that divert are at risk of overdose and death; they also face regulatory censure, criminal prosecution, and civil malpractice suits.12,13 Hospitals bear the cost of diverted drugs,14,15 internal investigations,4 and follow-up care for affected patients,4,13 and can be fined in excess of $4 million dollars for inadequate safeguards.16 Negative publicity highlights hospitals failing to self-regulate and report when diversion occurs, compromising public trust.17-19 Finally, diverted drugs impact population health by contributing to drug misuse.
Hospitals face a critical problem: how does a hospital prevent the diversion of controlled drugs? Hospitals have not yet implemented safeguards needed to detect or understand how diversion occurs. For example, 79% of Canadian hospital controlled-drug loss reports are “unexplained losses,”9 demonstrating a lack of traceability needed to understand the root causes of the loss. A single US endoscopy clinic showed that $10,000 of propofol was unaccounted for over a four-week period.14 Although transactional discrepancies do not equate to diversion, they are a potential signal of diversion and highlight areas for improvement.15 The hospital medication-use process (MUP; eg, procurement, storage, preparation, prescription, dispensing, administration, waste, return, and removal) has multiple vulnerabilities that have been exploited. Published accounts of diversion include falsification of clinical documents, substitution of saline for medication, and theft.4,20-23 Hospitals require guidance to assess their drug processes against known vulnerabilities and identify safeguards that may improve their capacity to prevent or detect diversion.
In this work, we provide a scoping review on the emerging topic of drug diversion to support hospitals. Scoping reviews can be a “preliminary attempt to provide an overview of existing literature that identifies areas where more research might be required.”24 Past literature has identified sources of drugs for nonmedical use,6,25,26 provided partial data on the quantities of stolen drug,7,8 and estimated the rate of HCW diversion.5,27-29 However, no reviews have focused on system gaps specific to hospital MUPs and diversion. Our review remedies this knowledge gap by consolidating known weaknesses and safeguards from peer- and nonpeer-reviewed articles. Drug diversion has been discussed at conferences and in news articles, case studies, and legal reports; excluding such discussion ignores substantive work that informs diversion practices in hospitals. Early indications suggest that hospitals have not yet implemented safeguards to properly identify when diversion has occurred, and consequently, lack the evidence to contribute to peer-reviewed literature. This article summarizes (1) clinical units, health professions, and stages of the MUP discussed, (2) contributors to diversion in hospitals, and (3) safeguards to prevent or detect diversion in hospitals.
METHODS
Scoping Review
We followed Arksey and O’Malley’s six-step framework for scoping reviews,30 with the exception of the optional consultation phase (step 6). We addressed three questions (step 1): what clinical units, health professions, or stages of the medication-use process are commonly discussed; what are the identified contributors to diversion in hospitals; and what safeguards have been described for prevention or detection of diversion in hospitals? We then identified relevant studies (step 2) by searching records published from January 2005 to June 2018 in MEDLINE, Embase, PsycINFO, CINAHL, Scopus, and Web of Science; the gray literature was also searched (see supplementary material for search terms).
All study designs were considered, including quantitative and qualitative methods, such as experiments, chart reviews and audit reports, surveys, focus groups, outbreak investigations, and literature reviews. Records were included (step 3) if abstracts met the Boolean logic criteria outlined in Appendix 1. If no abstract was available, then the full-text article was assessed. Prior to abstract screening, four reviewers (including R.R.) independently screened batches of 50 abstracts at a time to iteratively assess interrater reliability (IRR). Disagreements were resolved by consensus and the eligibility criteria were refined until IRR was achieved (Fleiss kappa > 0.65). Once IRR was achieved, the reviewers applied the criteria independently. For each eligible abstract, the full text was retrieved and assigned to a reviewer for independent assessment of eligibility. The abstract was reviewed if the full-text article was not available. Only articles published in English were included.
Reviewers charted findings from the full-text records (steps 4 and 5) by using themes defined a priori, specifically literature characteristics (eg, authors, year of publication), characteristics related to study method (eg, article type), variables related to our research questions (eg, variations by clinical unit, health profession), contributors to diversion, and safeguards to detect or prevent diversion. Inductive additions or modifications to the themes were proposed during the full-text review (eg, reviewers added a theme “name of drugs diverted” to identify drugs frequently reported as diverted) and accepted by consensus among the reviewers.
RESULTS
Scoping Review
The literature search generated 4,733 records of which 307 were duplicates and 4,009 were excluded on the basis of the eligibility criteria. The reviewers achieved 100% interrater agreement on the fourth round of abstract screening. Upon full-text review, 312 articles were included for data abstraction (Figure).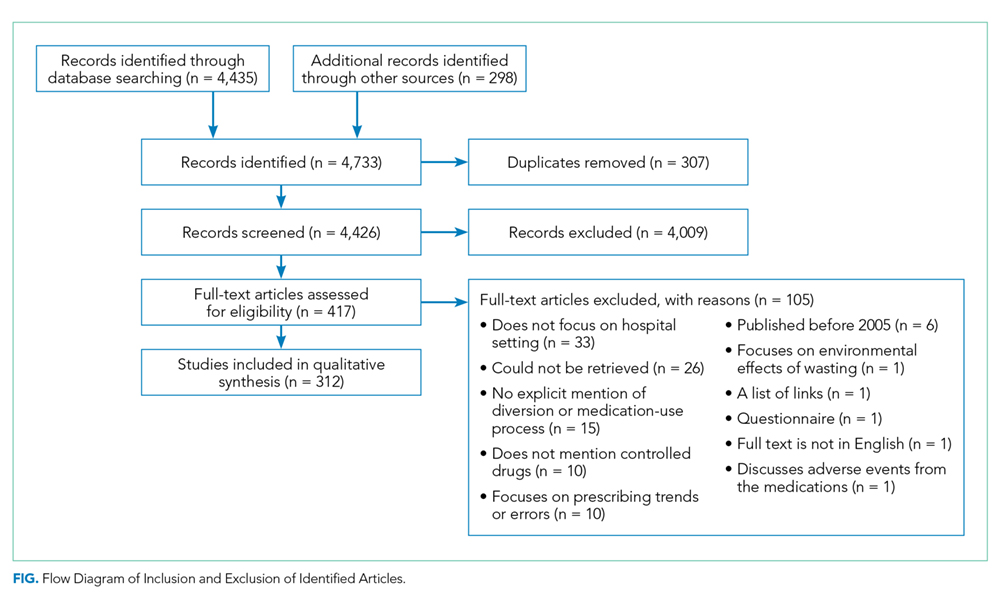
Literature Characteristics
Table 1 summarizes the characteristics of the included literature. The articles were published in a mix of peer-reviewed (137, 44%) and nonpeer-reviewed (175, 56%) sources. Some peer-reviewed articles did not use research methods, and some nonpeer-reviewed articles used research methods (eg, doctoral theses). Therefore, Table 1 categorizes the articles by research method (if applicable) and by peer-review status. The articles primarily originated in the United States (211, 68%) followed by Canada (79, 25%) and other countries (22, 7%). Most articles were commentaries, editorials, reports or news media, rather than formal studies presenting original data.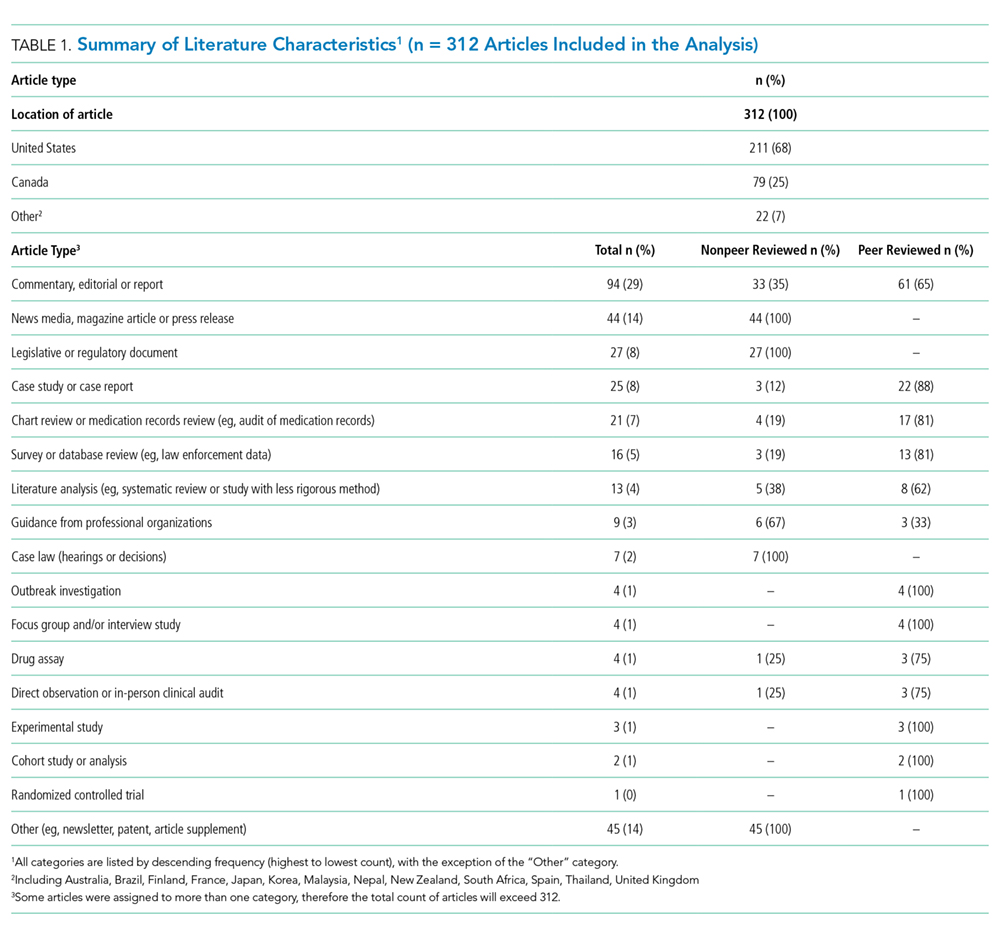
Literature Focus by Clinical Unit, Health Profession, and Stage of Medication-Use Process
Most articles did not focus the discussion on any one clinical unit, health profession, or stage of the MUP. Of the articles that made explicit mention of clinical units, hospital pharmacies and operating rooms were discussed most often, nurses were the most frequently highlighted health profession, and most stages of the MUP were discussed equally, with the exception of prescribing which was mentioned the least (Supplementary Table).
Contributors to Diversion
The literature describes a variety of contributors to drug diversion. Table 2 organizes these contributors by stage of the MUP and provides references for further discussion.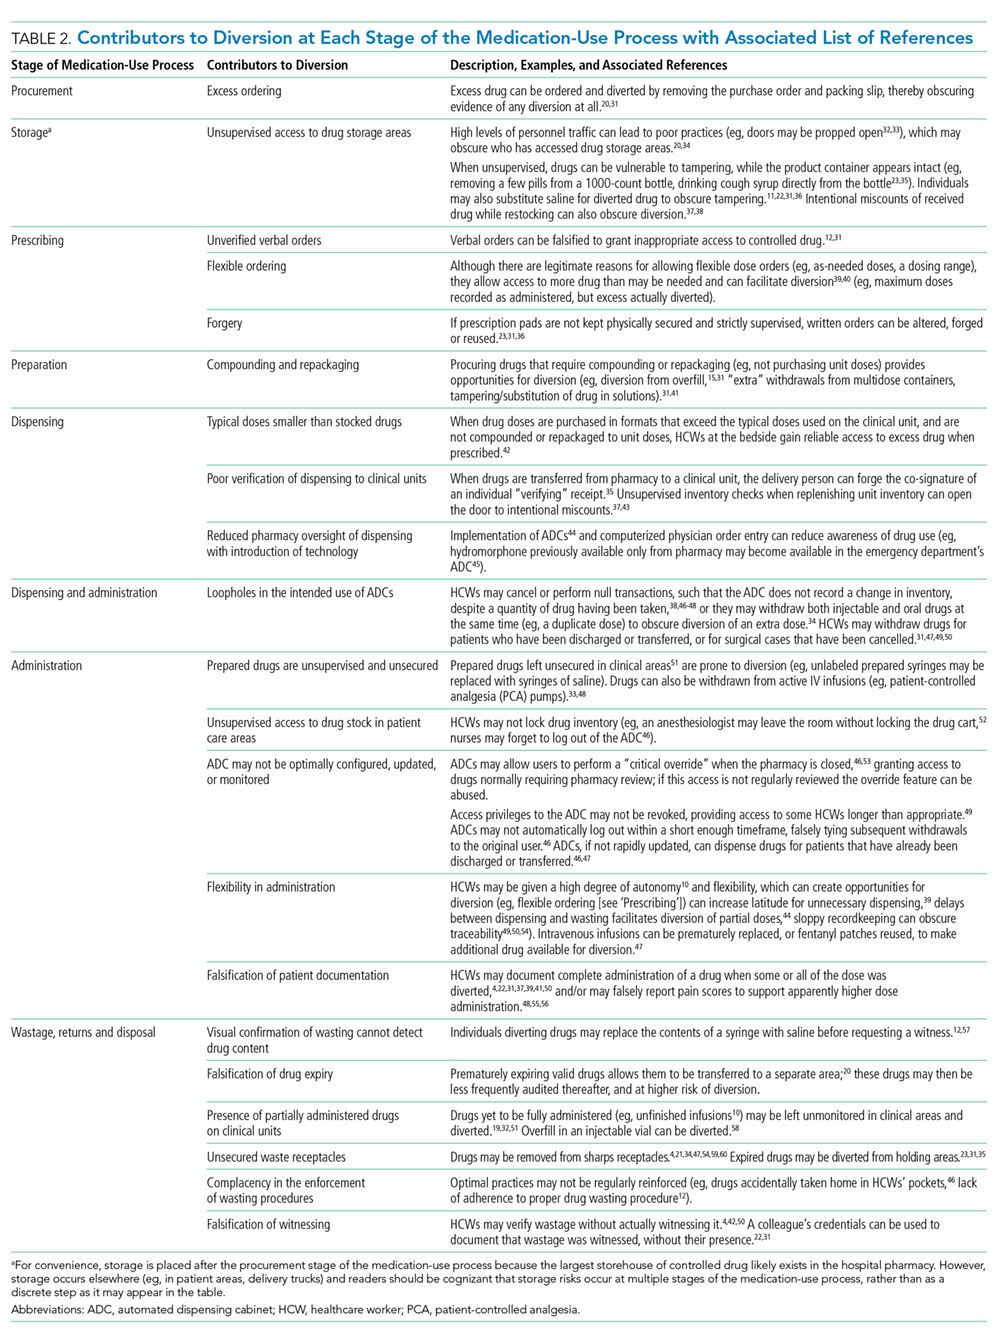
The diverse and system-wide contributors to diversion described in Table 2 support inappropriate access to controlled drugs and can delay the detection of diversion after it occurred. These contributors are more likely to occur in organizations that fail to adhere to drug-handling practices or to carefully review practices.34,44
Diversion Safeguards in Hospitals
Table 3 summarizes published recommendations to mitigate the risk of diversion by stage of the MUP.
DISCUSSION
This review synthesizes a broad sample of peer- and nonpeer-reviewed literature to produce a consolidated list of known contributors (Table 2) and safeguards against (Table 3) controlled-drug diversion in hospitals. The literature describes an extensive list of ways drugs have been diverted in all stages of the MUP and can be exploited by all health professions in any clinical unit. Hospitals should be aware that nonclinical HCWs may also be at risk (eg, shipping and receiving personnel may handle drug shipments or returns, housekeeping may encounter partially filled vials in patient rooms). Patients and their families may also use some of the methods described in Table 2 (eg, acquiring fentanyl patches from unsecured waste receptacles and tampering with unsecured intravenous infusions).
Given the established presence of drug diversion in the literature,5,7-9,96,97 hospitals should assess their clinical practices against these findings, review the associated references, and refer to existing guidance to better understand the intricacies of the topic.7,31,51,53,60,79 To accommodate variability in practice between hospitals, we suggest considering two underlying issues that recur in Tables 2 and 3 that will allow hospitals to systematically analyze their unique practices for each stage of the MUP.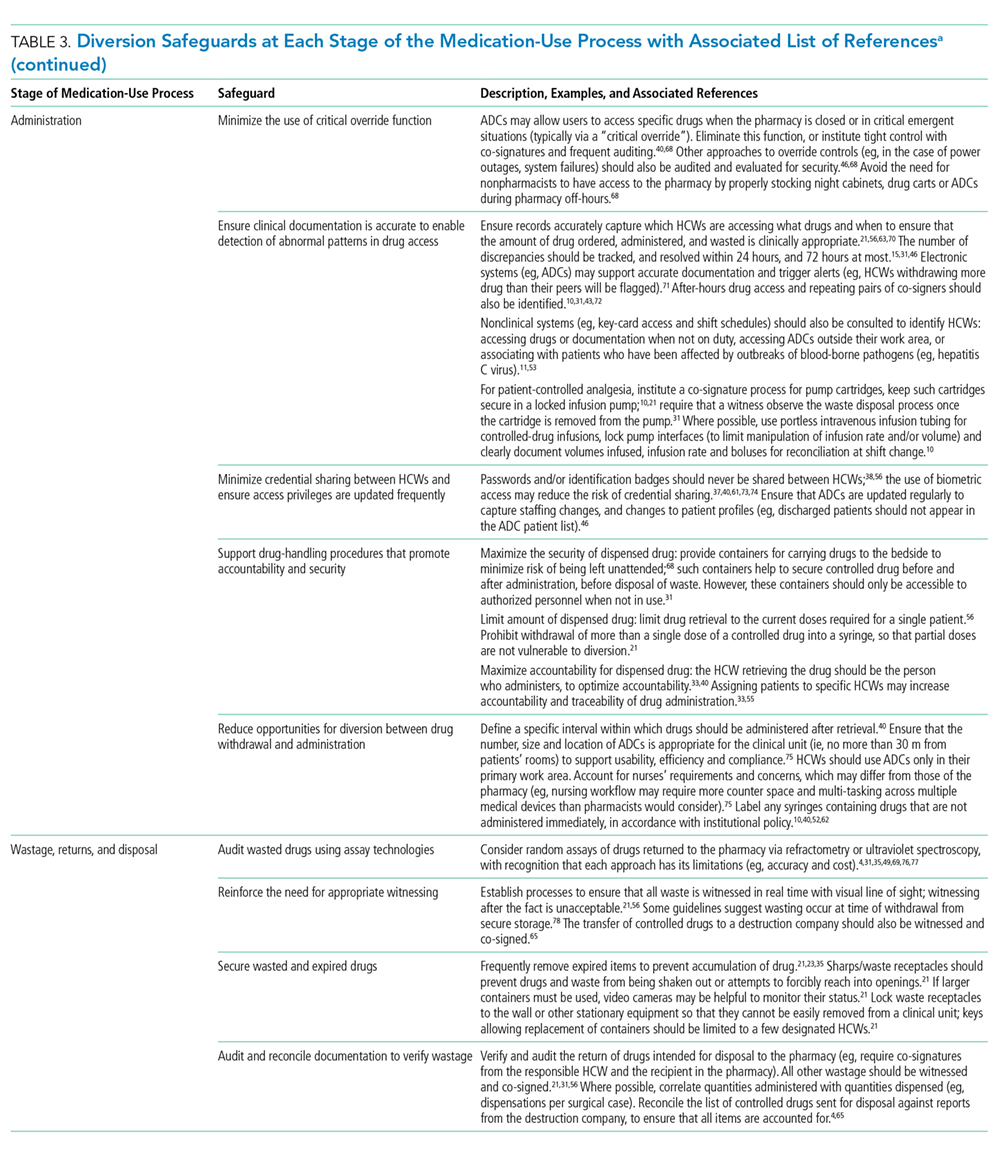
The first issue is falsification of clinical or inventory documentation. Falsified documents give the opportunity and appearance of legitimate drug transactions, obscure drug diversion, or create opportunities to collect additional drugs. Clinical documentation can be falsified actively (eg, deliberately falsifying verbal orders, falsifying drug amounts administered or wasted, and artificially increasing patients’ pain scores) or passively (eg, profiled automated dispensing cabinets [ADC] allow drug withdrawals for a patient that has been discharged or transferred over 72 hours ago because the system has not yet been updated). 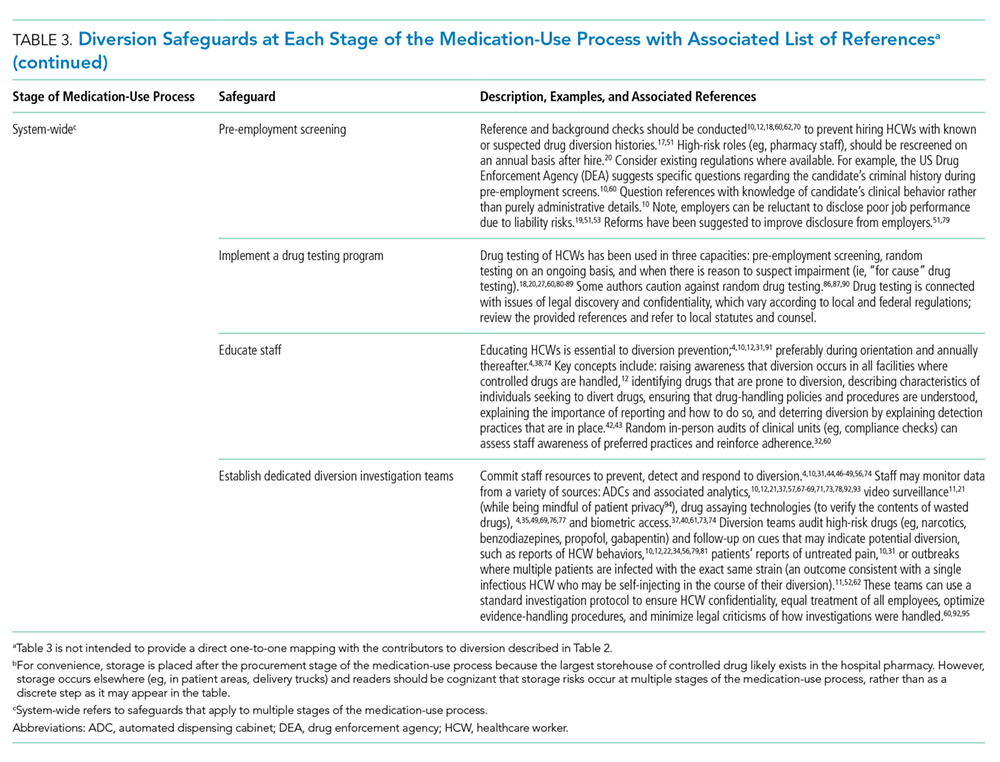
The second issue involves failure to maintain the physical security of controlled drugs, thereby allowing unauthorized access. This issue includes failing to physically secure drug stock (eg, propping doors open to controlled-drug areas; failing to log out of ADCs, thereby facilitating unauthorized access; and leaving prepared drugs unsupervised in patient care areas) or failing to maintain accurate access credentials (eg, staff no longer working on the care unit still have access to the ADC or other secure areas). Prevention safeguards require adherence to existing security protocols (eg, locked doors and staff access frequently updated) and limiting the amount of controlled drugs that can be accessed (eg, supply on care unit should be minimized to what is needed and purchase smallest unit doses to minimize excess drug available to HCWs). Hospitals may need to consider if security measures are actually feasible for HCWs. For example, syringes of prepared drugs should not be left unsupervised to prevent risk of substitution or tampering; however, if the responsible HCW is also expected to collect supplies from outside the care area, they cannot be expected to maintain constant supervision. Detection safeguards include the use of tamper-evident packaging to support detection of compromised controlled drugs or assaying drug waste or other suspicious drug containers to detect dilution or tampering. Hospitals may also consider monitoring whether staff access controlled-drug areas when they are not scheduled to work to detect security breaches.
Safeguards for both issues benefit from an organizational culture reinforced through training at orientation and annually thereafter. Staff should be aware of reporting mechanisms (eg, anonymous hotlines), employee and professional assistance programs, self-reporting protocols, and treatment and rehabilitation options.10,12,29,47,72,91 Other system-wide safeguards described in Table 3 should also be considered. Detection of transactional discrepancies does not automatically indicate diversion, but recurrent discrepancies indicate a weakness in controlled-drug management and should be rectified; diversion prevention is a responsibility of all departments, not just the pharmacy.
Hospitals have several motivations to actively invest in safeguards. Drug diversion is a patient safety issue, a patient privacy issue (eg, patient records are inappropriately accessed to identify opportunities for diversion), an occupational health issue given the higher risks of opioid-related SUD faced by HCWs, a regulatory compliance issue, and a legal issue.31,41,46,59,78,98,99 Although individuals are accountable for drug diversion itself, hospitals should take adequate measures to prevent or detect diversion and protect patients and staff from associated harms. Hospitals should pay careful attention to the configuration of healthcare technologies, environments, and processes in their institution to reduce the opportunity for diversion.
Our study has several limitations. We did not include articles prior to 2005 because we captured a sizable amount of literature with the current search terms and wanted the majority of the studies to reflect workflow based on electronic health records and medication ordering, which only came into wide use in the past 15 years. Other possible contributors and safeguards against drug diversion may not be captured in our review. Nevertheless, thorough consideration of the two underlying issues described will help protect hospitals against new and emerging methods of diversion. The literature search yielded a paucity of controlled trials formally evaluating the effectiveness of these interventions, so safeguards identified in our review may not represent optimal strategies for responding to drug diversion. Lastly, not all suggestions may be applicable or effective in every institution.
CONCLUSION
Drug diversion in hospitals is a serious and urgent concern that requires immediate attention to mitigate harms. Past incidents of diversion have shown that hospitals have not yet implemented safeguards to fully account for drug losses, with resultant harms to patients, HCWs, hospitals themselves, and the general public. Further research is needed to identify system factors relevant to drug diversion, identify new safeguards, evaluate the effectiveness of known safeguards, and support adoption of best practices by hospitals and regulatory bodies.
Acknowledgments
The authors wish to thank Iveta Lewis and members of the HumanEra team (Carly Warren, Jessica Tomasi, Devika Jain, Maaike deVries, and Betty Chang) for screening and data extraction of the literature and to Peggy Robinson, Sylvia Hyland, and Sonia Pinkney for editing and commentary.
Disclosures
Ms. Reding and Ms. Hyland were employees of North York General Hospital at the time of this work. Dr. Hamilton and Ms. Tscheng are employees of ISMP Canada, a subcontractor to NYGH, during the conduct of the study. Mark Fan and Patricia Trbovich have received honoraria from BD Canada for presenting preliminary study findings at BD sponsored events.
Funding
This work was supported by Becton Dickinson (BD) Canada Inc. (grant #ROR2017-04260JH-NYGH). BD Canada had no involvement in study design; in the collection, analysis or interpretation of data; in the writing of the report; or in the decision to submit the article for publication.
1. International Narcotics Control Board. Narcotic drugs: estimated world requirements for 2017 - statistics for 2015. https://www.incb.org/documents/Narcotic-Drugs/Technical-Publications/2016/Narcotic_Drugs_Publication_2016.pdf. Accessed February 2, 2018.
2. Gomes T, Tadrous M, Mamdani MM, Paterson JM, Juurlink DN. The burden of opioid-related mortality in the United States. JAMA Netw Open. 2018;1(2):e180217. doi: 10.1001/jamanetworkopen.2018.0217. PubMed
3. Special Advisory Committee on the Epidemic of Opioid Overdoses. National report: apparent opioid-related deaths in Canada (December 2017). https://www.canada.ca/en/public-health/services/publications/healthy-living/apparent-opioid-related-deaths-report-2016-2017-december.html. Accessed June 5, 2018.
4. Berge KH, Dillon KR, Sikkink KM, Taylor TK, Lanier WL. Diversion of drugs within health care facilities, a multiple-victim crime: patterns of diversion, scope, consequences, detection, and prevention. Mayo Clin Proc. 2012;87(7):674-682. doi: 10.1016/j.mayocp.2012.03.013. PubMed
5. Inciardi JA, Surratt HL, Kurtz SP, Burke JJ. The diversion of prescription drugs by health care workers in Cincinnati, Ohio. Subst Use Misuse. 2006;41(2):255-264. doi: 10.1080/10826080500391829. PubMed
6. Hulme S, Bright D, Nielsen S. The source and diversion of pharmaceutical drugs for non-medical use: A systematic review and meta-analysis. Drug Alcohol Depend. 2018;186:242-256. doi: 10.1016/j.drugalcdep.2018.02.010. PubMed
7. Minnesota Hospital Association. Minnesota controlled substance diversion prevention coalition: final report. https://www.mnhospitals.org/Portals/0/Documents/ptsafety/diversion/drug-diversion-final-report-March2012.pdf. Accessed July 21, 2017.
8. Joranson DE, Gilson AM. Drug crime is a source of abused pain medications in the United States. J Pain Symptom Manag. 2005;30(4):299-301. doi: 10.1016/j.jpainsymman.2005.09.001. PubMed
9. Carman T. Analysis of Health Canada missing controlled substances and precursors data (2017). Github. https://github.com/taracarman/drug_losses. Accessed July 1, 2018.
10. New K. Preventing, detecting, and investigating drug diversion in health care facilities. Mo State Board Nurs Newsl. 2014;5(4):11-14.
11. Schuppener LM, Pop-Vicas AE, Brooks EG, et al. Serratia marcescens Bacteremia: Nosocomial Clustercluster following narcotic diversion. Infect Control Hosp Epidemiol. 2017;38(9):1027-1031. doi: 10.1017/ice.2017.137. PubMed
12. New K. Investigating institutional drug diversion. J Leg Nurse Consult. 2015;26(4):15-18. doi: https://doi.org/10.1016/S2155-8256(15)30095-8
13. Berge KH, Lanier WL. Bloodstream infection outbreaks related to opioid-diverting health care workers: a cost-benefit analysis of prevention and detection programs. Mayo Clin Proc. 2014;89(7):866-868. doi: 10.1016/j.mayocp.2014.04.010. PubMed
14. Horvath C. Implementation of a new method to track propofol in an endoscopy unit. Int J Evid Based Healthc. 2017;15(3):102-110. doi: 10.1097/XEB.0000000000000112. PubMed
15. Pontore KM. The Epidemic of Controlled Substance Diversion Related to Healthcare Professionals. Graduate School of Public Health, University of Pittsburgh; 2015.
16. Knowles M. Georgia health system to pay $4.1M settlement over thousands of unaccounted opioids. Becker’s Hospital Review. https://www.beckershospitalreview.com/opioids/georgia-health-system-to-pay-4-1m-settlement-over-thousands-of-unaccounted-opioids.html. Accessed September 11, 2018.
17. Olinger D, Osher CN. Drug-addicted, dangerous and licensed for the operating room. The Denver Post. https://www.denverpost.com/2016/04/23/drug-addicted-dangerous-and-licensed-for-the-operating-room. Accessed August 2, 2017.
18. Levinson DR, Broadhurst ET. Why aren’t doctors drug tested? The New York Times. https://www.nytimes.com/2014/03/13/opinion/why-arent-doctors-drug-tested.html. Accessed July 21, 2017.
19. Eichenwald K. When Drug Addicts Work in Hospitals, No One is Safe. Newsweek. https://www.newsweek.com/2015/06/26/traveler-one-junkies-harrowing-journey-across-america-344125.html. Accessed August 2, 2017.
20. Martin ES, Dzierba SH, Jones DM. Preventing large-scale controlled substance diversion from within the pharmacy. Hosp Pharm. 2013;48(5):406-412. doi: 10.1310/hpj4805-406. PubMed
21. Institute for Safe Medication Practices. Partially filled vials and syringes in sharps containers are a key source of drugs for diversion. Medication safety alerts. https://www.ismp.org/resources/partially-filled-vials-and-syringes-sharps-containers-are-key-source-drugs-diversion?id=1132. Accessed June 29, 2017.
22. Fleming K, Boyle D, Lent WJB, Carpenter J, Linck C. A novel approach to monitoring the diversion of controlled substances: the role of the pharmacy compliance officer. Hosp Pharm. 2007;42(3):200-209. doi: 10.1310/hpj4203-200.
23. Merlo LJ, Cummings SM, Cottler LB. Prescription drug diversion among substance-impaired pharmacists. Am J Addict. 2014;23(2):123-128. doi: 10.1111/j.1521-0391.2013.12078.x. PubMed
24. O’Malley L, Croucher K. Housing and dementia care-a scoping review of the literature. Health Soc Care Commun. 2005;13(6):570-577. doi: 10.1111/j.1365-2524.2005.00588.x. PubMed
25. Fischer B, Bibby M, Bouchard M. The global diversion of pharmaceutical drugs non-medical use and diversion of psychotropic prescription drugs in North America: a review of sourcing routes and control measures. Addiction. 2010;105(12):2062-2070. doi: 10.1111/j.1360-0443.2010.03092.x. PubMed
26. Inciardi JA, Surratt HL, Cicero TJ, et al. The “black box” of prescription drug diversion. J Addict Dis. 2009;28(4):332-347. doi: 10.1080/10550880903182986. PubMed
27. Boulis S, Khanduja PK, Downey K, Friedman Z. Substance abuse: a national survey of Canadian residency program directors and site chiefs at university-affiliated anesthesia departments. Can J Anesth. 2015;62(9):964-971. doi: 10.1007/s12630-015-0404-1. PubMed
28. Warner DO, Berge K, Sun H et al. Substance use disorder among anesthesiology residents, 1975-2009. JAMA. 2013;310(21):2289-2296. doi: 10.1001/jama.2013.281954. PubMed
29. Kunyk D. Substance use disorders among registered nurses: prevalence, risks and perceptions in a disciplinary jurisdiction. J Nurs Manag. 2015;23(1):54-64. doi: 10.1111/jonm.12081. PubMed
30. Arksey H, O’Malley L. Scoping studies: towards a methodological framework. Int J Soc Res Methodol. 2005;8(1):19-32. doi: 10.1080/1364557032000119616. PubMed
31. Brummond PW, Chen DF, Churchill WW, et al. ASHP guidelines on preventing diversion of controlled substances. Am J Health System Pharm. 2017;74(5):325-348. doi: 10.2146/ajhp160919. PubMed
32. New K. Diversion risk rounds: a reality check on your drug-handling policies. http://www.diversionspecialists.com/wp-content/uploads/Diversion-Risk-Rounds-A-Reality-Check-on-Your-Drug-Handling-Policies.pdf. Accessed July 13, 2017.
33. New K. Uncovering Diversion: 6 case studies on Diversion. https://www.pppmag.com/article/2162. Accessed January 30, 2018.
34. New KS. Undertaking a System Wide Diversion Risk Assessment [PowerPoint]. International Health Facility Diversion Association Conference; 2016. Accessed July 14, 2016.
35. O’Neal B, Siegel J. Diversion in the pharmacy. Hosp Pharm. 2007;42(2):145-148. doi: 10.1310/hpj4202-145.
36. Holleran RS. What is wrong With this picture? J Emerg Nurs. 2010;36(5):396-397. doi: 10.1016/j.jen.2010.08.005. PubMed
37. Vrabel R. Identifying and dealing with drug diversion. How hospitals can stay one step ahead. https://www.hcinnovationgropu.com/home/article/13003330/identifying-and-dealing-with-drug-diversion. Accessed September 18, 2017.
38. Mentler P. Preventing diversion in the ED. https://www.pppmag.com/article/1778. Accessed July 19, 2017.
39. Fernandez J. Hospitals wage battle against drug diversion. https://www.drugtopics.com/top-news/hospitals-wage-battle-against-drug-diversion. Accessed August 17, 2017.
40. Minnesota Hospital Association. Road map to controlled substance diversion Prevention 2.0. https://www.mnhospitals.org/Portals/0/Documents/ptsafety/diversion/Road Map to Controlled Substance Diversion Prevention 2.0.pdf. Accessed June 30, 2017.
41. Bryson EO, Silverstein JH. Addiction and substance abuse in anesthesiology. Anesthesiology. 2008;109(5):905-917. doi: 10.1097/ALN.0b013e3181895bc1. PubMed
42. McCammon C. Diversion: a quiet threat in the healthcare setting. https://www.acep.org/Content.aspx?ID=94932. Accessed August 17, 2017.
43. Minnesota Hospital Association. Identifying potentially impaired practitioners [PowerPoint]. https://www.mnhospitals.org/Portals/0/Documents/ptsafety/diversion/potentially-impaired-practitioners.pdf. Accessed July 21, 2017.
44. Burger G, Burger M. Drug diversion: new approaches to an old problem. Am J Pharm Benefits. 2016;8(1):30-33.
45. Greenall J, Santora P, Koczmara C, Hyland S. Enhancing safe medication use for pediatric patients in the emergency department. Can J Hosp Pharm. 2009;62(2):150-153. doi: 10.4212/cjhp.v62i2.445. PubMed
46. New K. Avoid diversion practices that prompt DEA investigations. https://www.pppmag.com/article/1818. Accessed October 4, 2017.
47. New K. Detecting and responding to drug diversion. https://rxdiversion.com/detecting-and-responding-to-drug-diversion. Accessed July 13, 2017.
48. New KS. Institutional Diversion Prevention, Detection and Response [PowerPoint]. https://www.ncsbn.org/0613_DISC_Kim_New.pdf. Accessed August 25, 2017.
49. Siegel J, Forrey RA. Four case studies on diversion prevention. https://www.pppmag.com/article/1469/March_2014/Four_Case_Studies_on_Diversion_Prevention. Accessed July 31, 2017.
50. Copp MAB. Drug addiction among nurses: confronting a quiet epidemic-Many RNs fall prey to this hidden, potentially deadly disease. http://www.modernmedicine.com/modern-medicine/news/modernmedicine/modern-medicine-feature-articles/drug-addiction-among-nurses-con. Accessed September 8, 2017.
51. Maryland Department of Health and Mental Hygiene. Public health vulnerability review: drug diversion, infection risk, and David Kwiatkowski’s employment as a healthcare worker in Maryland. https://health.maryland.gov/pdf/Public Health Vulnerability Review.pdf. Accessed July 21, 2017.
52. Warner AE, Schaefer MK, Patel PR, et al. Outbreak of hepatitis C virus infection associated with narcotics diversion by an hepatitis C virus-infected surgical technician. Am J Infect Control. 2015;43(1):53-58. doi: 10.1016/j.ajic.2014.09.012. PubMed
53. New Hampshire Department of Health and Human Services-Division of Public Health Services. Hepatitis C outbreak investigation Exeter Hospital public report. https://www.dhhs.nh.gov/dphs/cdcs/hepatitisc/documents/hepc-outbreak-rpt.pdf . Accessed July 21, 2017.
54. Paparella SF. A tale of waste and loss: lessons learned. J Emerg Nurs. 2016;42(4):352-354. doi: 10.1016/j.jen.2016.03.025. PubMed
55. Ramer LM. Using servant leadership to facilitate healing after a drug diversion experience. AORN J. 2008;88(2):253-258. doi: 10.1016/j.aorn.2008.05.002. PubMed
56. Siegel J, O’Neal B, Code N. Prevention of controlled substance diversion-Code N: multidisciplinary approach to proactive drug diversion prevention. Hosp Pharm. 2007;42(3):244-248. doi: 10.1310/hpj4203-244.
57. Saver C. Drug diversion in the OR: how can you keep it from happening? https://pdfs.semanticscholar.org/f066/32113de065ca628a1f37218d18c654c15671.pdf. Accessed September 21, 2017.
58. Peterson DM. New DEA rules expand options for controlled substance disposal. J Pain Palliat Care Pharmacother. 2015;29(1):22-26. doi: 10.3109/15360288.2014.1002964. PubMed
59. Lefebvre LG, Kaufmann IM. The identification and management of substance use disorders in anesthesiologists. Can J Anesth J Can Anesth. 2017;64(2):211-218. doi: 10.1007/s12630-016-0775-y. PubMed
60. Missouri Bureau of Narcotics & Dangerous Drugs. Drug diversion in hospitals-A guide to preventing and investigating diversion issues. https://health.mo.gov/safety/bndd/doc/drugdiversion.doc. Accessed July 21, 2017.
61. Hayes S. Pharmacy diversion: prevention, detection and monitoring: a pharmacy fraud investigator’s perspective. International Health Facility Diversion Association Conference 2016. Accessed July 5, 2017.
62. Schaefer MK, Perz JF. Outbreaks of infections associated with drug diversion by US health care personnel. Mayo Clin Proc. 2014;89(7):878-887. doi: 10.1016/j.mayocp.2014.04.007. PubMed
63. Vigoda MM, Gencorelli FJ, Lubarsky DA. Discrepancies in medication entries between anesthetic and pharmacy records using electronic databases. Anesth Analg. 2007;105(4):1061-1065. doi: 10.1213/01.ane.0000282021.74832.5e. PubMed
64. Goodine C. Safety audit of automated dispensing cabinets. https://www.ncbi.nlm.nih.gov/pmc/articles/PMC2832564/. Accessed September 25, 2017.
65. Ontario College of Pharmacists. Hospital assessment criteria. http://www.ocpinfo.com/library/practice-related/download/library/practice-related/download/Hospital-Assessment-Criteria.pdf. Accessed August 30, 2017.
66. Lizza BD, Jagow B, Hensler D, et al. Impact of multiple daily clinical pharmacist-enforced assessments on time in target sedation range. J Pharm Pract. 2018;31(5):445-449. doi: 10.1177/0897190017729522. PubMed
67. Landro L. Hospitals address a drug problem: software and Robosts help secure and monitor medications. The Wall Street Journal. https://www.wsj.com/articles/hospitals-address-a-drug-problem-1392762765. Accessed June 29, 2017.
68. Hyland S, Koczmara C, Salsman B, Musing ELS, Greenall J. Optimizing the use of automated dispensing cabinets. Can J Hosp Pharm. 2007;60(5):332-334. doi: http://dx.doi.org/10.4212/cjhp.v60i5.205
69. O’Neal B, Bass K, Siegel J. Diversion in the operating room. Hosp Pharm. 2007;42(4):359-363. doi: 10.1310/hpj4204-359.
70. White C, Malida J. Large pill theft shows challenge of securing hospital drugs. https://www.matrixhomecare.com/downloads/HRM060110.pdf. Accessed August 18, 2017.
71. Crowson K, Monk-Tutor M. Use of automated controlled substance cabinets for detection of diversion in US hospitals: a national study. Hosp Pharm. 2005;40(11):977-983. doi: 10.1177/001857870504001107.
72. National Council of State Boards of Nursing Inc. Substance use disorder in the workplace [chapter 6]. In: Substance Use Disorder in Nursing. Chicago: National Council of State Boards of Nursing Inc. https://www.ncsbn.org/SUDN_11.pdf. Accessed. July 21, 2017.
73. Swanson B-M. Preventing prescription drug diversions at your hospital. Campus Safety. http://www.campussafetymagazine.com/cs/preventing-prescription-drug-diversions-at-your-hospital. Accessed June 30, 2017.
74. O’Neal B, Siegel J. Prevention of controlled substance diversion—scope, strategy, and tactics: Code N: the intervention process. Hosp Pharm. 2007;42(7):633-656. doi: 10.1310/hpj4207-653
75. Mandrack M, Cohen MR, Featherling J, et al. Nursing best practices using automated dispensing cabinets: nurses’ key role in improving medication safety. Medsurg Nurs. 2012;21(3):134-139. PubMed
76. Berge KH, Seppala MD, Lanier WL. The anesthesiology community’s approach to opioid- and anesthetic-abusing personnel: time to change course. Anesthesiology. 2008;109(5):762-764. doi: 10.1097/ALN.0b013e31818a3814. PubMed
77. Gemensky J. The pharmacist’s role in surgery: the indispensable asset. US Pharm. 2015;40(3):HS8-HS12.
78. New K. Drug diversion: regulatory requirements and best practices. http://www.hospitalsafetycenter.com/content/328646/topic/ws_hsc_hsc.html. Accessed September 21, 2017.
79. Lahey T, Nelson WA. A proposed nationwide reporting system to satisfy the ethical obligation to prevent drug diversion-related transmission of hepatitis C in healthcare facilities. Clin Infect Dis. 2015;60(12):1816-1820. doi: 10.1093/cid/civ203. PubMed
80. Gavin KG
81. Tetzlaff J, Collins GB, Brown DL, et al. A strategy to prevent substance abuse in an academic anesthesiology department. J Clin Anesth. 2010;22(2):143-150. doi: 10.1016/j.jclinane.2008.12.030. PubMed
82. Kintz P, Villain M, Dumestre V, Cirimele V. Evidence of addiction by anesthesiologists as documented by hair analysis. Forensic Sci Int. 2005;153(1):81-84. doi: 10.1016/j.forsciint.2005.04.033. PubMed
83. Wolf CE, Poklis A. A rapid HPLC procedure for analysis of analgesic pharmaceutical mixtures for quality assurance and drug diversion testing. J Anal Toxicol. 2005;29(7):711-714. doi: 10.1093/jat/29.7.711. PubMed
84. Poklis JL, Mohs AJ, Wolf CE, Poklis A, Peace MR. Identification of drugs in parenteral pharmaceutical preparations from a quality assurance and a diversion program by direct analysis in real-time AccuTOF(TM)-mass spectrometry (Dart-MS). J Anal Toxicol. 2016;40(8):608-616. doi: 10.1093/jat/bkw065. PubMed
85. Pham JC, Pronovost PJ, Skipper GE. Identification of physician impairment. JAMA. 2013;309(20):2101-2102. doi: 10.1001/jama.2013.4635. PubMed
86. Stolbach A, Nelson LS, Hoffman RS. Protection of patients from physician substance misuse. JAMA. 2013;310(13):1402-1403. doi: 10.1001/jama.2013.277948. PubMed
87. Berge KH, McGlinch BP. The law of unintended consequences can never be repealed: the hazards of random urine drug screening of anesthesia providers. Anesth Analg. 2017;124(5):1397-1399. doi: 10.1213/ANE.0000000000001972. PubMed
88. Oreskovich MR, Caldeiro RM. Anesthesiologists recovering from chemical dependency: can they safely return to the operating room? Mayo Clin Proc. 2009;84(7):576-580. doi: 10.1016/S0025-6196(11)60745-3. PubMed
89. Di Costanzo M. Road to recovery. http://rnao.ca/sites/rnao-ca/files-RNJ-JanFeb2015.pdf. Accessed September 28, 2017.
90. Selzer J. Protection of patients from physician substance misuse. JAMA. 2013;310(13):1402-1403. doi: 10.1001/jama.2013.277948. PubMed
91. Wright RL. Drug diversion in nursing practice a call for professional accountability to recognize and respond. J Assoc Occup Health Prof Healthc. 2013;33(1):27-30. PubMed
92. Siegel J, O’Neal B, Wierwille C. The investigative process. Hosp Pharm. 2007;42(5):466-469. doi: 10.1310/hpj4205-466.
93. Brenn BR, Kim MA, Hilmas E. Development of a computerized monitoring program to identify narcotic diversion in a pediatric anesthesia practice. Am J Health System Pharm. 2015;72(16):1365-1372. doi: 10.2146/ajhp140691. PubMed
94. Drug diversion sting goes wrong and privacy is questioned. http://www.reliasmedia.com/articles/138142-drug-diversion-sting-goes-wrong-and-privacy-is-questioned. Accessed September 21, 2017.
95. New K. Drug diversion defined: steps to prevent, detect, and respond to drug diversion in facilities. CDC’s healthcare blog. https://blogs.cdc.gov/safehealthcare/drug-diversion-defined-steps-to-prevent-detect-and-respond-to-drug-diversion-in-facilities. Accessed July 21, 2017.
96. Howorun C. ‘Unexplained losses’ of opioids on the rise in Canadian hospitals. Maclean’s. http://www.macleans.ca/society/health/unexplained-losses-of-opioids-on-the-rise-in-canadian-hospitals. Accessed December 5, 2017.
97. Carman T. When prescription opioids run out, users look for the supply on the streets. CBC News. https://www.cbc.ca/news/canada/when-prescription-opioids-run-out-users-look-for-the-supply-on-the-streets-1.4720952. Accessed July 1, 2018.
98. Tanga HY. Nurse drug diversion and nursing leader’s responsibilities: legal, regulatory, ethical, humanistic, and practical considerations. JONAs Healthc Law Eth Regul. 2011;13(1):13-16. doi: 10.1097/NHL.0b013e31820bd9e6. PubMed
99. Scholze AR, Martins JT, Galdino MJQ, Ribeiro RP. Occupational environment and psychoactive substance consumption among nurses. Acta Paul Enferm. 2017;30(4):404-411. doi: 10.1590/1982-0194201700060.
The United States (US) and Canada are the two highest per-capita consumers of opioids in the world;1 both are struggling with unprecedented opioid-related mortality.2,3 The nonmedical use of opioids is facilitated by diversion and defined as the transfer of drugs from lawful to unlawful channels of use4,5 (eg, sharing legitimate prescriptions with family and friends6). Opioids and other controlled drugs are also diverted from healthcare facilities;4,5,7,8 Canadian data suggest these incidents may be increasing (controlled-drug loss reports have doubled each year since 20159).
The diversion of controlled drugs from hospitals affects patients, healthcare workers (HCWs), hospitals, and the public. Patients suffer insufficient analgesia or anesthesia, experience substandard care from impaired HCWs, and are at risk of infections from compromised syringes.4,10,11 HCWs that divert are at risk of overdose and death; they also face regulatory censure, criminal prosecution, and civil malpractice suits.12,13 Hospitals bear the cost of diverted drugs,14,15 internal investigations,4 and follow-up care for affected patients,4,13 and can be fined in excess of $4 million dollars for inadequate safeguards.16 Negative publicity highlights hospitals failing to self-regulate and report when diversion occurs, compromising public trust.17-19 Finally, diverted drugs impact population health by contributing to drug misuse.
Hospitals face a critical problem: how does a hospital prevent the diversion of controlled drugs? Hospitals have not yet implemented safeguards needed to detect or understand how diversion occurs. For example, 79% of Canadian hospital controlled-drug loss reports are “unexplained losses,”9 demonstrating a lack of traceability needed to understand the root causes of the loss. A single US endoscopy clinic showed that $10,000 of propofol was unaccounted for over a four-week period.14 Although transactional discrepancies do not equate to diversion, they are a potential signal of diversion and highlight areas for improvement.15 The hospital medication-use process (MUP; eg, procurement, storage, preparation, prescription, dispensing, administration, waste, return, and removal) has multiple vulnerabilities that have been exploited. Published accounts of diversion include falsification of clinical documents, substitution of saline for medication, and theft.4,20-23 Hospitals require guidance to assess their drug processes against known vulnerabilities and identify safeguards that may improve their capacity to prevent or detect diversion.
In this work, we provide a scoping review on the emerging topic of drug diversion to support hospitals. Scoping reviews can be a “preliminary attempt to provide an overview of existing literature that identifies areas where more research might be required.”24 Past literature has identified sources of drugs for nonmedical use,6,25,26 provided partial data on the quantities of stolen drug,7,8 and estimated the rate of HCW diversion.5,27-29 However, no reviews have focused on system gaps specific to hospital MUPs and diversion. Our review remedies this knowledge gap by consolidating known weaknesses and safeguards from peer- and nonpeer-reviewed articles. Drug diversion has been discussed at conferences and in news articles, case studies, and legal reports; excluding such discussion ignores substantive work that informs diversion practices in hospitals. Early indications suggest that hospitals have not yet implemented safeguards to properly identify when diversion has occurred, and consequently, lack the evidence to contribute to peer-reviewed literature. This article summarizes (1) clinical units, health professions, and stages of the MUP discussed, (2) contributors to diversion in hospitals, and (3) safeguards to prevent or detect diversion in hospitals.
METHODS
Scoping Review
We followed Arksey and O’Malley’s six-step framework for scoping reviews,30 with the exception of the optional consultation phase (step 6). We addressed three questions (step 1): what clinical units, health professions, or stages of the medication-use process are commonly discussed; what are the identified contributors to diversion in hospitals; and what safeguards have been described for prevention or detection of diversion in hospitals? We then identified relevant studies (step 2) by searching records published from January 2005 to June 2018 in MEDLINE, Embase, PsycINFO, CINAHL, Scopus, and Web of Science; the gray literature was also searched (see supplementary material for search terms).
All study designs were considered, including quantitative and qualitative methods, such as experiments, chart reviews and audit reports, surveys, focus groups, outbreak investigations, and literature reviews. Records were included (step 3) if abstracts met the Boolean logic criteria outlined in Appendix 1. If no abstract was available, then the full-text article was assessed. Prior to abstract screening, four reviewers (including R.R.) independently screened batches of 50 abstracts at a time to iteratively assess interrater reliability (IRR). Disagreements were resolved by consensus and the eligibility criteria were refined until IRR was achieved (Fleiss kappa > 0.65). Once IRR was achieved, the reviewers applied the criteria independently. For each eligible abstract, the full text was retrieved and assigned to a reviewer for independent assessment of eligibility. The abstract was reviewed if the full-text article was not available. Only articles published in English were included.
Reviewers charted findings from the full-text records (steps 4 and 5) by using themes defined a priori, specifically literature characteristics (eg, authors, year of publication), characteristics related to study method (eg, article type), variables related to our research questions (eg, variations by clinical unit, health profession), contributors to diversion, and safeguards to detect or prevent diversion. Inductive additions or modifications to the themes were proposed during the full-text review (eg, reviewers added a theme “name of drugs diverted” to identify drugs frequently reported as diverted) and accepted by consensus among the reviewers.
RESULTS
Scoping Review
The literature search generated 4,733 records of which 307 were duplicates and 4,009 were excluded on the basis of the eligibility criteria. The reviewers achieved 100% interrater agreement on the fourth round of abstract screening. Upon full-text review, 312 articles were included for data abstraction (Figure).
Literature Characteristics
Table 1 summarizes the characteristics of the included literature. The articles were published in a mix of peer-reviewed (137, 44%) and nonpeer-reviewed (175, 56%) sources. Some peer-reviewed articles did not use research methods, and some nonpeer-reviewed articles used research methods (eg, doctoral theses). Therefore, Table 1 categorizes the articles by research method (if applicable) and by peer-review status. The articles primarily originated in the United States (211, 68%) followed by Canada (79, 25%) and other countries (22, 7%). Most articles were commentaries, editorials, reports or news media, rather than formal studies presenting original data.
Literature Focus by Clinical Unit, Health Profession, and Stage of Medication-Use Process
Most articles did not focus the discussion on any one clinical unit, health profession, or stage of the MUP. Of the articles that made explicit mention of clinical units, hospital pharmacies and operating rooms were discussed most often, nurses were the most frequently highlighted health profession, and most stages of the MUP were discussed equally, with the exception of prescribing which was mentioned the least (Supplementary Table).
Contributors to Diversion
The literature describes a variety of contributors to drug diversion. Table 2 organizes these contributors by stage of the MUP and provides references for further discussion.
The diverse and system-wide contributors to diversion described in Table 2 support inappropriate access to controlled drugs and can delay the detection of diversion after it occurred. These contributors are more likely to occur in organizations that fail to adhere to drug-handling practices or to carefully review practices.34,44
Diversion Safeguards in Hospitals
Table 3 summarizes published recommendations to mitigate the risk of diversion by stage of the MUP.
DISCUSSION
This review synthesizes a broad sample of peer- and nonpeer-reviewed literature to produce a consolidated list of known contributors (Table 2) and safeguards against (Table 3) controlled-drug diversion in hospitals. The literature describes an extensive list of ways drugs have been diverted in all stages of the MUP and can be exploited by all health professions in any clinical unit. Hospitals should be aware that nonclinical HCWs may also be at risk (eg, shipping and receiving personnel may handle drug shipments or returns, housekeeping may encounter partially filled vials in patient rooms). Patients and their families may also use some of the methods described in Table 2 (eg, acquiring fentanyl patches from unsecured waste receptacles and tampering with unsecured intravenous infusions).
Given the established presence of drug diversion in the literature,5,7-9,96,97 hospitals should assess their clinical practices against these findings, review the associated references, and refer to existing guidance to better understand the intricacies of the topic.7,31,51,53,60,79 To accommodate variability in practice between hospitals, we suggest considering two underlying issues that recur in Tables 2 and 3 that will allow hospitals to systematically analyze their unique practices for each stage of the MUP.
The first issue is falsification of clinical or inventory documentation. Falsified documents give the opportunity and appearance of legitimate drug transactions, obscure drug diversion, or create opportunities to collect additional drugs. Clinical documentation can be falsified actively (eg, deliberately falsifying verbal orders, falsifying drug amounts administered or wasted, and artificially increasing patients’ pain scores) or passively (eg, profiled automated dispensing cabinets [ADC] allow drug withdrawals for a patient that has been discharged or transferred over 72 hours ago because the system has not yet been updated).
The second issue involves failure to maintain the physical security of controlled drugs, thereby allowing unauthorized access. This issue includes failing to physically secure drug stock (eg, propping doors open to controlled-drug areas; failing to log out of ADCs, thereby facilitating unauthorized access; and leaving prepared drugs unsupervised in patient care areas) or failing to maintain accurate access credentials (eg, staff no longer working on the care unit still have access to the ADC or other secure areas). Prevention safeguards require adherence to existing security protocols (eg, locked doors and staff access frequently updated) and limiting the amount of controlled drugs that can be accessed (eg, supply on care unit should be minimized to what is needed and purchase smallest unit doses to minimize excess drug available to HCWs). Hospitals may need to consider if security measures are actually feasible for HCWs. For example, syringes of prepared drugs should not be left unsupervised to prevent risk of substitution or tampering; however, if the responsible HCW is also expected to collect supplies from outside the care area, they cannot be expected to maintain constant supervision. Detection safeguards include the use of tamper-evident packaging to support detection of compromised controlled drugs or assaying drug waste or other suspicious drug containers to detect dilution or tampering. Hospitals may also consider monitoring whether staff access controlled-drug areas when they are not scheduled to work to detect security breaches.
Safeguards for both issues benefit from an organizational culture reinforced through training at orientation and annually thereafter. Staff should be aware of reporting mechanisms (eg, anonymous hotlines), employee and professional assistance programs, self-reporting protocols, and treatment and rehabilitation options.10,12,29,47,72,91 Other system-wide safeguards described in Table 3 should also be considered. Detection of transactional discrepancies does not automatically indicate diversion, but recurrent discrepancies indicate a weakness in controlled-drug management and should be rectified; diversion prevention is a responsibility of all departments, not just the pharmacy.
Hospitals have several motivations to actively invest in safeguards. Drug diversion is a patient safety issue, a patient privacy issue (eg, patient records are inappropriately accessed to identify opportunities for diversion), an occupational health issue given the higher risks of opioid-related SUD faced by HCWs, a regulatory compliance issue, and a legal issue.31,41,46,59,78,98,99 Although individuals are accountable for drug diversion itself, hospitals should take adequate measures to prevent or detect diversion and protect patients and staff from associated harms. Hospitals should pay careful attention to the configuration of healthcare technologies, environments, and processes in their institution to reduce the opportunity for diversion.
Our study has several limitations. We did not include articles prior to 2005 because we captured a sizable amount of literature with the current search terms and wanted the majority of the studies to reflect workflow based on electronic health records and medication ordering, which only came into wide use in the past 15 years. Other possible contributors and safeguards against drug diversion may not be captured in our review. Nevertheless, thorough consideration of the two underlying issues described will help protect hospitals against new and emerging methods of diversion. The literature search yielded a paucity of controlled trials formally evaluating the effectiveness of these interventions, so safeguards identified in our review may not represent optimal strategies for responding to drug diversion. Lastly, not all suggestions may be applicable or effective in every institution.
CONCLUSION
Drug diversion in hospitals is a serious and urgent concern that requires immediate attention to mitigate harms. Past incidents of diversion have shown that hospitals have not yet implemented safeguards to fully account for drug losses, with resultant harms to patients, HCWs, hospitals themselves, and the general public. Further research is needed to identify system factors relevant to drug diversion, identify new safeguards, evaluate the effectiveness of known safeguards, and support adoption of best practices by hospitals and regulatory bodies.
Acknowledgments
The authors wish to thank Iveta Lewis and members of the HumanEra team (Carly Warren, Jessica Tomasi, Devika Jain, Maaike deVries, and Betty Chang) for screening and data extraction of the literature and to Peggy Robinson, Sylvia Hyland, and Sonia Pinkney for editing and commentary.
Disclosures
Ms. Reding and Ms. Hyland were employees of North York General Hospital at the time of this work. Dr. Hamilton and Ms. Tscheng are employees of ISMP Canada, a subcontractor to NYGH, during the conduct of the study. Mark Fan and Patricia Trbovich have received honoraria from BD Canada for presenting preliminary study findings at BD sponsored events.
Funding
This work was supported by Becton Dickinson (BD) Canada Inc. (grant #ROR2017-04260JH-NYGH). BD Canada had no involvement in study design; in the collection, analysis or interpretation of data; in the writing of the report; or in the decision to submit the article for publication.
1. International Narcotics Control Board. Narcotic drugs: estimated world requirements for 2017 - statistics for 2015. https://www.incb.org/documents/Narcotic-Drugs/Technical-Publications/2016/Narcotic_Drugs_Publication_2016.pdf. Accessed February 2, 2018.
2. Gomes T, Tadrous M, Mamdani MM, Paterson JM, Juurlink DN. The burden of opioid-related mortality in the United States. JAMA Netw Open. 2018;1(2):e180217. doi: 10.1001/jamanetworkopen.2018.0217. PubMed
3. Special Advisory Committee on the Epidemic of Opioid Overdoses. National report: apparent opioid-related deaths in Canada (December 2017). https://www.canada.ca/en/public-health/services/publications/healthy-living/apparent-opioid-related-deaths-report-2016-2017-december.html. Accessed June 5, 2018.
4. Berge KH, Dillon KR, Sikkink KM, Taylor TK, Lanier WL. Diversion of drugs within health care facilities, a multiple-victim crime: patterns of diversion, scope, consequences, detection, and prevention. Mayo Clin Proc. 2012;87(7):674-682. doi: 10.1016/j.mayocp.2012.03.013. PubMed
5. Inciardi JA, Surratt HL, Kurtz SP, Burke JJ. The diversion of prescription drugs by health care workers in Cincinnati, Ohio. Subst Use Misuse. 2006;41(2):255-264. doi: 10.1080/10826080500391829. PubMed
6. Hulme S, Bright D, Nielsen S. The source and diversion of pharmaceutical drugs for non-medical use: A systematic review and meta-analysis. Drug Alcohol Depend. 2018;186:242-256. doi: 10.1016/j.drugalcdep.2018.02.010. PubMed
7. Minnesota Hospital Association. Minnesota controlled substance diversion prevention coalition: final report. https://www.mnhospitals.org/Portals/0/Documents/ptsafety/diversion/drug-diversion-final-report-March2012.pdf. Accessed July 21, 2017.
8. Joranson DE, Gilson AM. Drug crime is a source of abused pain medications in the United States. J Pain Symptom Manag. 2005;30(4):299-301. doi: 10.1016/j.jpainsymman.2005.09.001. PubMed
9. Carman T. Analysis of Health Canada missing controlled substances and precursors data (2017). Github. https://github.com/taracarman/drug_losses. Accessed July 1, 2018.
10. New K. Preventing, detecting, and investigating drug diversion in health care facilities. Mo State Board Nurs Newsl. 2014;5(4):11-14.
11. Schuppener LM, Pop-Vicas AE, Brooks EG, et al. Serratia marcescens Bacteremia: Nosocomial Clustercluster following narcotic diversion. Infect Control Hosp Epidemiol. 2017;38(9):1027-1031. doi: 10.1017/ice.2017.137. PubMed
12. New K. Investigating institutional drug diversion. J Leg Nurse Consult. 2015;26(4):15-18. doi: https://doi.org/10.1016/S2155-8256(15)30095-8
13. Berge KH, Lanier WL. Bloodstream infection outbreaks related to opioid-diverting health care workers: a cost-benefit analysis of prevention and detection programs. Mayo Clin Proc. 2014;89(7):866-868. doi: 10.1016/j.mayocp.2014.04.010. PubMed
14. Horvath C. Implementation of a new method to track propofol in an endoscopy unit. Int J Evid Based Healthc. 2017;15(3):102-110. doi: 10.1097/XEB.0000000000000112. PubMed
15. Pontore KM. The Epidemic of Controlled Substance Diversion Related to Healthcare Professionals. Graduate School of Public Health, University of Pittsburgh; 2015.
16. Knowles M. Georgia health system to pay $4.1M settlement over thousands of unaccounted opioids. Becker’s Hospital Review. https://www.beckershospitalreview.com/opioids/georgia-health-system-to-pay-4-1m-settlement-over-thousands-of-unaccounted-opioids.html. Accessed September 11, 2018.
17. Olinger D, Osher CN. Drug-addicted, dangerous and licensed for the operating room. The Denver Post. https://www.denverpost.com/2016/04/23/drug-addicted-dangerous-and-licensed-for-the-operating-room. Accessed August 2, 2017.
18. Levinson DR, Broadhurst ET. Why aren’t doctors drug tested? The New York Times. https://www.nytimes.com/2014/03/13/opinion/why-arent-doctors-drug-tested.html. Accessed July 21, 2017.
19. Eichenwald K. When Drug Addicts Work in Hospitals, No One is Safe. Newsweek. https://www.newsweek.com/2015/06/26/traveler-one-junkies-harrowing-journey-across-america-344125.html. Accessed August 2, 2017.
20. Martin ES, Dzierba SH, Jones DM. Preventing large-scale controlled substance diversion from within the pharmacy. Hosp Pharm. 2013;48(5):406-412. doi: 10.1310/hpj4805-406. PubMed
21. Institute for Safe Medication Practices. Partially filled vials and syringes in sharps containers are a key source of drugs for diversion. Medication safety alerts. https://www.ismp.org/resources/partially-filled-vials-and-syringes-sharps-containers-are-key-source-drugs-diversion?id=1132. Accessed June 29, 2017.
22. Fleming K, Boyle D, Lent WJB, Carpenter J, Linck C. A novel approach to monitoring the diversion of controlled substances: the role of the pharmacy compliance officer. Hosp Pharm. 2007;42(3):200-209. doi: 10.1310/hpj4203-200.
23. Merlo LJ, Cummings SM, Cottler LB. Prescription drug diversion among substance-impaired pharmacists. Am J Addict. 2014;23(2):123-128. doi: 10.1111/j.1521-0391.2013.12078.x. PubMed
24. O’Malley L, Croucher K. Housing and dementia care-a scoping review of the literature. Health Soc Care Commun. 2005;13(6):570-577. doi: 10.1111/j.1365-2524.2005.00588.x. PubMed
25. Fischer B, Bibby M, Bouchard M. The global diversion of pharmaceutical drugs non-medical use and diversion of psychotropic prescription drugs in North America: a review of sourcing routes and control measures. Addiction. 2010;105(12):2062-2070. doi: 10.1111/j.1360-0443.2010.03092.x. PubMed
26. Inciardi JA, Surratt HL, Cicero TJ, et al. The “black box” of prescription drug diversion. J Addict Dis. 2009;28(4):332-347. doi: 10.1080/10550880903182986. PubMed
27. Boulis S, Khanduja PK, Downey K, Friedman Z. Substance abuse: a national survey of Canadian residency program directors and site chiefs at university-affiliated anesthesia departments. Can J Anesth. 2015;62(9):964-971. doi: 10.1007/s12630-015-0404-1. PubMed
28. Warner DO, Berge K, Sun H et al. Substance use disorder among anesthesiology residents, 1975-2009. JAMA. 2013;310(21):2289-2296. doi: 10.1001/jama.2013.281954. PubMed
29. Kunyk D. Substance use disorders among registered nurses: prevalence, risks and perceptions in a disciplinary jurisdiction. J Nurs Manag. 2015;23(1):54-64. doi: 10.1111/jonm.12081. PubMed
30. Arksey H, O’Malley L. Scoping studies: towards a methodological framework. Int J Soc Res Methodol. 2005;8(1):19-32. doi: 10.1080/1364557032000119616. PubMed
31. Brummond PW, Chen DF, Churchill WW, et al. ASHP guidelines on preventing diversion of controlled substances. Am J Health System Pharm. 2017;74(5):325-348. doi: 10.2146/ajhp160919. PubMed
32. New K. Diversion risk rounds: a reality check on your drug-handling policies. http://www.diversionspecialists.com/wp-content/uploads/Diversion-Risk-Rounds-A-Reality-Check-on-Your-Drug-Handling-Policies.pdf. Accessed July 13, 2017.
33. New K. Uncovering Diversion: 6 case studies on Diversion. https://www.pppmag.com/article/2162. Accessed January 30, 2018.
34. New KS. Undertaking a System Wide Diversion Risk Assessment [PowerPoint]. International Health Facility Diversion Association Conference; 2016. Accessed July 14, 2016.
35. O’Neal B, Siegel J. Diversion in the pharmacy. Hosp Pharm. 2007;42(2):145-148. doi: 10.1310/hpj4202-145.
36. Holleran RS. What is wrong With this picture? J Emerg Nurs. 2010;36(5):396-397. doi: 10.1016/j.jen.2010.08.005. PubMed
37. Vrabel R. Identifying and dealing with drug diversion. How hospitals can stay one step ahead. https://www.hcinnovationgropu.com/home/article/13003330/identifying-and-dealing-with-drug-diversion. Accessed September 18, 2017.
38. Mentler P. Preventing diversion in the ED. https://www.pppmag.com/article/1778. Accessed July 19, 2017.
39. Fernandez J. Hospitals wage battle against drug diversion. https://www.drugtopics.com/top-news/hospitals-wage-battle-against-drug-diversion. Accessed August 17, 2017.
40. Minnesota Hospital Association. Road map to controlled substance diversion Prevention 2.0. https://www.mnhospitals.org/Portals/0/Documents/ptsafety/diversion/Road Map to Controlled Substance Diversion Prevention 2.0.pdf. Accessed June 30, 2017.
41. Bryson EO, Silverstein JH. Addiction and substance abuse in anesthesiology. Anesthesiology. 2008;109(5):905-917. doi: 10.1097/ALN.0b013e3181895bc1. PubMed
42. McCammon C. Diversion: a quiet threat in the healthcare setting. https://www.acep.org/Content.aspx?ID=94932. Accessed August 17, 2017.
43. Minnesota Hospital Association. Identifying potentially impaired practitioners [PowerPoint]. https://www.mnhospitals.org/Portals/0/Documents/ptsafety/diversion/potentially-impaired-practitioners.pdf. Accessed July 21, 2017.
44. Burger G, Burger M. Drug diversion: new approaches to an old problem. Am J Pharm Benefits. 2016;8(1):30-33.
45. Greenall J, Santora P, Koczmara C, Hyland S. Enhancing safe medication use for pediatric patients in the emergency department. Can J Hosp Pharm. 2009;62(2):150-153. doi: 10.4212/cjhp.v62i2.445. PubMed
46. New K. Avoid diversion practices that prompt DEA investigations. https://www.pppmag.com/article/1818. Accessed October 4, 2017.
47. New K. Detecting and responding to drug diversion. https://rxdiversion.com/detecting-and-responding-to-drug-diversion. Accessed July 13, 2017.
48. New KS. Institutional Diversion Prevention, Detection and Response [PowerPoint]. https://www.ncsbn.org/0613_DISC_Kim_New.pdf. Accessed August 25, 2017.
49. Siegel J, Forrey RA. Four case studies on diversion prevention. https://www.pppmag.com/article/1469/March_2014/Four_Case_Studies_on_Diversion_Prevention. Accessed July 31, 2017.
50. Copp MAB. Drug addiction among nurses: confronting a quiet epidemic-Many RNs fall prey to this hidden, potentially deadly disease. http://www.modernmedicine.com/modern-medicine/news/modernmedicine/modern-medicine-feature-articles/drug-addiction-among-nurses-con. Accessed September 8, 2017.
51. Maryland Department of Health and Mental Hygiene. Public health vulnerability review: drug diversion, infection risk, and David Kwiatkowski’s employment as a healthcare worker in Maryland. https://health.maryland.gov/pdf/Public Health Vulnerability Review.pdf. Accessed July 21, 2017.
52. Warner AE, Schaefer MK, Patel PR, et al. Outbreak of hepatitis C virus infection associated with narcotics diversion by an hepatitis C virus-infected surgical technician. Am J Infect Control. 2015;43(1):53-58. doi: 10.1016/j.ajic.2014.09.012. PubMed
53. New Hampshire Department of Health and Human Services-Division of Public Health Services. Hepatitis C outbreak investigation Exeter Hospital public report. https://www.dhhs.nh.gov/dphs/cdcs/hepatitisc/documents/hepc-outbreak-rpt.pdf . Accessed July 21, 2017.
54. Paparella SF. A tale of waste and loss: lessons learned. J Emerg Nurs. 2016;42(4):352-354. doi: 10.1016/j.jen.2016.03.025. PubMed
55. Ramer LM. Using servant leadership to facilitate healing after a drug diversion experience. AORN J. 2008;88(2):253-258. doi: 10.1016/j.aorn.2008.05.002. PubMed
56. Siegel J, O’Neal B, Code N. Prevention of controlled substance diversion-Code N: multidisciplinary approach to proactive drug diversion prevention. Hosp Pharm. 2007;42(3):244-248. doi: 10.1310/hpj4203-244.
57. Saver C. Drug diversion in the OR: how can you keep it from happening? https://pdfs.semanticscholar.org/f066/32113de065ca628a1f37218d18c654c15671.pdf. Accessed September 21, 2017.
58. Peterson DM. New DEA rules expand options for controlled substance disposal. J Pain Palliat Care Pharmacother. 2015;29(1):22-26. doi: 10.3109/15360288.2014.1002964. PubMed
59. Lefebvre LG, Kaufmann IM. The identification and management of substance use disorders in anesthesiologists. Can J Anesth J Can Anesth. 2017;64(2):211-218. doi: 10.1007/s12630-016-0775-y. PubMed
60. Missouri Bureau of Narcotics & Dangerous Drugs. Drug diversion in hospitals-A guide to preventing and investigating diversion issues. https://health.mo.gov/safety/bndd/doc/drugdiversion.doc. Accessed July 21, 2017.
61. Hayes S. Pharmacy diversion: prevention, detection and monitoring: a pharmacy fraud investigator’s perspective. International Health Facility Diversion Association Conference 2016. Accessed July 5, 2017.
62. Schaefer MK, Perz JF. Outbreaks of infections associated with drug diversion by US health care personnel. Mayo Clin Proc. 2014;89(7):878-887. doi: 10.1016/j.mayocp.2014.04.007. PubMed
63. Vigoda MM, Gencorelli FJ, Lubarsky DA. Discrepancies in medication entries between anesthetic and pharmacy records using electronic databases. Anesth Analg. 2007;105(4):1061-1065. doi: 10.1213/01.ane.0000282021.74832.5e. PubMed
64. Goodine C. Safety audit of automated dispensing cabinets. https://www.ncbi.nlm.nih.gov/pmc/articles/PMC2832564/. Accessed September 25, 2017.
65. Ontario College of Pharmacists. Hospital assessment criteria. http://www.ocpinfo.com/library/practice-related/download/library/practice-related/download/Hospital-Assessment-Criteria.pdf. Accessed August 30, 2017.
66. Lizza BD, Jagow B, Hensler D, et al. Impact of multiple daily clinical pharmacist-enforced assessments on time in target sedation range. J Pharm Pract. 2018;31(5):445-449. doi: 10.1177/0897190017729522. PubMed
67. Landro L. Hospitals address a drug problem: software and Robosts help secure and monitor medications. The Wall Street Journal. https://www.wsj.com/articles/hospitals-address-a-drug-problem-1392762765. Accessed June 29, 2017.
68. Hyland S, Koczmara C, Salsman B, Musing ELS, Greenall J. Optimizing the use of automated dispensing cabinets. Can J Hosp Pharm. 2007;60(5):332-334. doi: http://dx.doi.org/10.4212/cjhp.v60i5.205
69. O’Neal B, Bass K, Siegel J. Diversion in the operating room. Hosp Pharm. 2007;42(4):359-363. doi: 10.1310/hpj4204-359.
70. White C, Malida J. Large pill theft shows challenge of securing hospital drugs. https://www.matrixhomecare.com/downloads/HRM060110.pdf. Accessed August 18, 2017.
71. Crowson K, Monk-Tutor M. Use of automated controlled substance cabinets for detection of diversion in US hospitals: a national study. Hosp Pharm. 2005;40(11):977-983. doi: 10.1177/001857870504001107.
72. National Council of State Boards of Nursing Inc. Substance use disorder in the workplace [chapter 6]. In: Substance Use Disorder in Nursing. Chicago: National Council of State Boards of Nursing Inc. https://www.ncsbn.org/SUDN_11.pdf. Accessed. July 21, 2017.
73. Swanson B-M. Preventing prescription drug diversions at your hospital. Campus Safety. http://www.campussafetymagazine.com/cs/preventing-prescription-drug-diversions-at-your-hospital. Accessed June 30, 2017.
74. O’Neal B, Siegel J. Prevention of controlled substance diversion—scope, strategy, and tactics: Code N: the intervention process. Hosp Pharm. 2007;42(7):633-656. doi: 10.1310/hpj4207-653
75. Mandrack M, Cohen MR, Featherling J, et al. Nursing best practices using automated dispensing cabinets: nurses’ key role in improving medication safety. Medsurg Nurs. 2012;21(3):134-139. PubMed
76. Berge KH, Seppala MD, Lanier WL. The anesthesiology community’s approach to opioid- and anesthetic-abusing personnel: time to change course. Anesthesiology. 2008;109(5):762-764. doi: 10.1097/ALN.0b013e31818a3814. PubMed
77. Gemensky J. The pharmacist’s role in surgery: the indispensable asset. US Pharm. 2015;40(3):HS8-HS12.
78. New K. Drug diversion: regulatory requirements and best practices. http://www.hospitalsafetycenter.com/content/328646/topic/ws_hsc_hsc.html. Accessed September 21, 2017.
79. Lahey T, Nelson WA. A proposed nationwide reporting system to satisfy the ethical obligation to prevent drug diversion-related transmission of hepatitis C in healthcare facilities. Clin Infect Dis. 2015;60(12):1816-1820. doi: 10.1093/cid/civ203. PubMed
80. Gavin KG
81. Tetzlaff J, Collins GB, Brown DL, et al. A strategy to prevent substance abuse in an academic anesthesiology department. J Clin Anesth. 2010;22(2):143-150. doi: 10.1016/j.jclinane.2008.12.030. PubMed
82. Kintz P, Villain M, Dumestre V, Cirimele V. Evidence of addiction by anesthesiologists as documented by hair analysis. Forensic Sci Int. 2005;153(1):81-84. doi: 10.1016/j.forsciint.2005.04.033. PubMed
83. Wolf CE, Poklis A. A rapid HPLC procedure for analysis of analgesic pharmaceutical mixtures for quality assurance and drug diversion testing. J Anal Toxicol. 2005;29(7):711-714. doi: 10.1093/jat/29.7.711. PubMed
84. Poklis JL, Mohs AJ, Wolf CE, Poklis A, Peace MR. Identification of drugs in parenteral pharmaceutical preparations from a quality assurance and a diversion program by direct analysis in real-time AccuTOF(TM)-mass spectrometry (Dart-MS). J Anal Toxicol. 2016;40(8):608-616. doi: 10.1093/jat/bkw065. PubMed
85. Pham JC, Pronovost PJ, Skipper GE. Identification of physician impairment. JAMA. 2013;309(20):2101-2102. doi: 10.1001/jama.2013.4635. PubMed
86. Stolbach A, Nelson LS, Hoffman RS. Protection of patients from physician substance misuse. JAMA. 2013;310(13):1402-1403. doi: 10.1001/jama.2013.277948. PubMed
87. Berge KH, McGlinch BP. The law of unintended consequences can never be repealed: the hazards of random urine drug screening of anesthesia providers. Anesth Analg. 2017;124(5):1397-1399. doi: 10.1213/ANE.0000000000001972. PubMed
88. Oreskovich MR, Caldeiro RM. Anesthesiologists recovering from chemical dependency: can they safely return to the operating room? Mayo Clin Proc. 2009;84(7):576-580. doi: 10.1016/S0025-6196(11)60745-3. PubMed
89. Di Costanzo M. Road to recovery. http://rnao.ca/sites/rnao-ca/files-RNJ-JanFeb2015.pdf. Accessed September 28, 2017.
90. Selzer J. Protection of patients from physician substance misuse. JAMA. 2013;310(13):1402-1403. doi: 10.1001/jama.2013.277948. PubMed
91. Wright RL. Drug diversion in nursing practice a call for professional accountability to recognize and respond. J Assoc Occup Health Prof Healthc. 2013;33(1):27-30. PubMed
92. Siegel J, O’Neal B, Wierwille C. The investigative process. Hosp Pharm. 2007;42(5):466-469. doi: 10.1310/hpj4205-466.
93. Brenn BR, Kim MA, Hilmas E. Development of a computerized monitoring program to identify narcotic diversion in a pediatric anesthesia practice. Am J Health System Pharm. 2015;72(16):1365-1372. doi: 10.2146/ajhp140691. PubMed
94. Drug diversion sting goes wrong and privacy is questioned. http://www.reliasmedia.com/articles/138142-drug-diversion-sting-goes-wrong-and-privacy-is-questioned. Accessed September 21, 2017.
95. New K. Drug diversion defined: steps to prevent, detect, and respond to drug diversion in facilities. CDC’s healthcare blog. https://blogs.cdc.gov/safehealthcare/drug-diversion-defined-steps-to-prevent-detect-and-respond-to-drug-diversion-in-facilities. Accessed July 21, 2017.
96. Howorun C. ‘Unexplained losses’ of opioids on the rise in Canadian hospitals. Maclean’s. http://www.macleans.ca/society/health/unexplained-losses-of-opioids-on-the-rise-in-canadian-hospitals. Accessed December 5, 2017.
97. Carman T. When prescription opioids run out, users look for the supply on the streets. CBC News. https://www.cbc.ca/news/canada/when-prescription-opioids-run-out-users-look-for-the-supply-on-the-streets-1.4720952. Accessed July 1, 2018.
98. Tanga HY. Nurse drug diversion and nursing leader’s responsibilities: legal, regulatory, ethical, humanistic, and practical considerations. JONAs Healthc Law Eth Regul. 2011;13(1):13-16. doi: 10.1097/NHL.0b013e31820bd9e6. PubMed
99. Scholze AR, Martins JT, Galdino MJQ, Ribeiro RP. Occupational environment and psychoactive substance consumption among nurses. Acta Paul Enferm. 2017;30(4):404-411. doi: 10.1590/1982-0194201700060.
© 2019 Society of Hospital Medicine
Methods for Research Evidence Synthesis: The Scoping Review Approach
Research evidence synthesis involves the aggregation of available information using well-defined and transparent methods to search, summarize, and interpret a body of literature, frequently following a systematic review approach. A scoping review is a relatively new approach to evidence synthesis and differs from systematic reviews in its purpose and aims.1 The purpose of a scoping review is to provide an overview of the available research evidence without producing a summary answer to a discrete research question.2 Scoping reviews can be useful for answering broad questions, such as “What information has been presented on this topic in the literature?” and for gathering and assessing information prior to conducting a systematic review.1
In this issue of the Journal of Hospital Medicine, Fan et al. used a scoping review to identify information available in the literature on contributors to loss and theft of controlled drugs in hospitals and the safeguards that have been suggested to address these diversions.3 The authors followed Arksey and O’Malley’s framework for scoping reviews and the PRISMA-ScR (Preferred Reporting Items for Systematic reviews and Meta-Analyses extension for Scoping Reviews) checklist in reporting findings.2,4
PURPOSE OF A SCOPING REVIEW
Scoping reviews describe existing literature and other sources of information commonly include findings from a range of different study designs and methods.5 The broad scope of the collected information makes using formal meta-analytic methods difficult, if not impossible. Results of a scoping review often focus on the range of content identified, and quantitative assessment is often limited to a tally of the number of sources reporting a particular issue or recommendation. In contrast, systematic reviews commonly select the information sources by requiring specific study types, such as randomized controlled trials, and imposing quality standards, such as adequate allocation concealment, and place their emphasis on synthesizing data to address a specific research question. (Table) By focusing on specific studies, the synthesis component in a systematic review often takes the form of a meta-analysis in which the results of multiple scientific studies are combined to develop a summary conclusion, such as a common effect estimate, along with an evaluation of its heterogeneity across studies.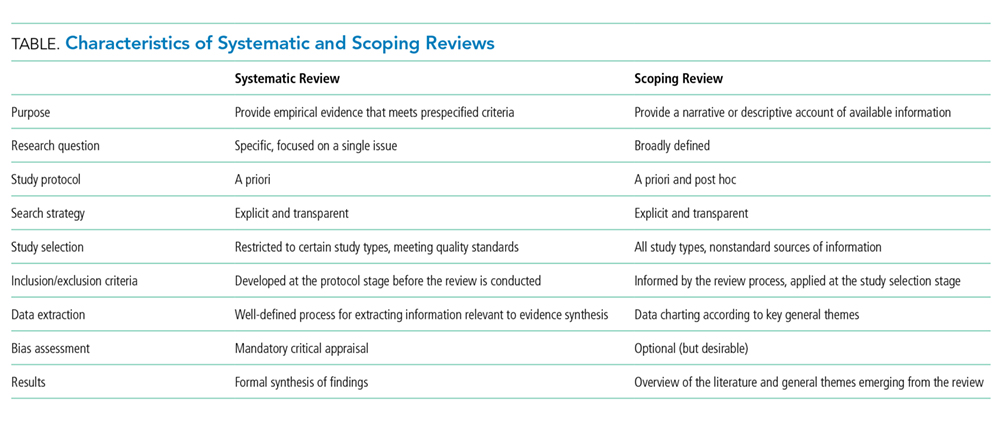
A scoping review can be a particularly useful approach when the information on a topic has not been comprehensively reviewed or is complex and diverse.6 Munn et al. proposed several objectives that can be achieved utilizing the scoping review framework, including identifying types of existing evidence in a given field, clarifying key concepts or definitions in the literature, surveying how research is conducted on a certain topic, identifying key characteristics related to a certain topic, and identifying knowledge gaps.1 When choosing to use a scoping review approach, it is important that the objective of the review align with the review’s indication or purpose.
METHODOLOGICAL FRAMEWORK OF SCOPING REVIEWS
Scoping reviews, like systematic reviews, require comprehensive and structured searches of the literature to maximize the capture of relevant information, provide reproducible results, and decrease potential bias from flawed implementations. The methodological framework for scoping reviews was developed by Arksey and O’Malley1 and further refined by Levac et al.7 and the Joanna Briggs Institute.6,8 Arksey and O’Malley’s framework for scoping reviews consists of the following six steps:
- Step 1: Identify the research question—the research question should be clearly defined and usually broad in scope to provide extensive coverage.
- Step 2: Identify relevant studies—the search strategy should be thorough and broad in scope and typically include electronic databases, reference lists, hand searches, and gray literature (ie, substantive or scholarly information that has not been formally published and often is not peer-reviewed), including conference abstracts, presentations, regulatory data, working papers, and patents.
- Step 3: Study selection—the study selection process can include post hoc, or modified, inclusion and exclusion criteria as new ideas emerge during the process of gathering and reviewing information.
- Step 4: Chart the data—the data extraction process in a scoping review is called data charting and involves the use of a data charting form to extract the relevant information from the reviewed literature.
- Step 5: Collate, summarize, and report the results—the description of the scope of the literature is commonly presented in tables and charts according to key themes.
- Optional Step 6: Consultation exercise—in this optional step, stakeholders outside the study review team are invited to provide their insights to inform and validate findings from the scoping review.
Since the number of studies included in a scoping review can be substantial, several study team members may participate in the review process. When multiple reviewers are employed, the team ought to conduct a calibration exercise at each step of the review process to ensure adequate interrater agreement. In addition, the PRISMA-ScR guidelines should be followed when reporting findings from scoping reviews to facilitate complete, transparent, and consistent reporting in the literature.4
LIMITATIONS OF THE SCOPING REVIEW APPROACH
The scoping review approach has several limitations. Scoping reviews do not formally evaluate the quality of evidence and often gather information from a wide range of study designs and methods. By design, the number of studies included in the review process can be sizable. Thus, a large study team is typically needed to screen the large number of studies and other sources for potential inclusion in the scoping review. Because scoping reviews provide a descriptive account of available information, this often leads to broad, less defined searches that require multiple structured strategies focused on alternative sets of themes. Hand searching the literature is therefore necessary to ensure the validity of this process. Scoping reviews do not provide a synthesized result or answer to a specific question, but rather provide an overview of the available literature. Even though statements regarding the quality of evidence and formal synthesis are avoided, the scoping review approach is not necessarily easier or faster than the systematic review approach. Scoping reviews require a substantial amount of time to complete due to the wide coverage of the search implicit in the approach.
Like other studies, scoping reviews are at risk for bias from different sources. Critical appraisal of the risk of bias in scoping reviews is not considered mandatory, but some scoping reviews may include a bias assessment. Even if bias is not formally assessed, that does not mean that bias does not exist. For example, selection bias may occur if the scoping review does not identify all available data on a topic and the resulting descriptive account of available information is flawed.
WHY DID THE AUTHORS USE THE SCOPING REVIEW METHOD?
Fan et al. used the scoping review approach to examine the available information on contributors to and safeguards against controlled-drug losses and theft (drug diversion) in the hospital setting.3 The authors addressed the following questions: (1) “What clinical units, health professions, or stages of the medication-use process are commonly discussed?” (2) “What are the identified contributors to diversion in hospitals?” and (3) “What safeguards to prevent or detect diversion in hospitals have been described?” Part of the rationale for using a scoping review approach was to permit the inclusion of a wide range of sources falling outside the typical peer-reviewed article. The authors comment that the stigmatized topic of drug diversion frequently falls outside the peer-reviewed literature and emphasize the importance of including such sources as conferences, news articles, and legal reports. The search strategy included electronic research databases, such as Web of Science, as well as an extensive gray literature search. Multiple reviewers were included in the process and a calibration exercise was conducted to ensure consistency in the selection of articles and to improve interrater agreement. The scoping review identified contributors to controlled-drug diversion and suggested safeguards to address them in the hospital setting.
OTHER CONSIDERATIONS
Methodological approaches to evidence synthesis vary, and new methods continue to emerge to meet different research objectives, including evidence mapping,9 concept analysis,10 rapid reviews,11 and others.12 Choosing the right approach may not be straightforward. Researchers may need to seek guidance from methodologists, including epidemiologists, statisticians, and information specialists, when choosing an appropriate review approach to ensure that the review methods are suitable for the objectives of the review.
Disclosures
The authors have no conflicts of interest to disclose.
Financial Disclosures
The authors have no financial relationships relevant to this article to disclose.
1. Munn Z, Peters M, Stern C, Tufanaru C, McArthur A, Aromataris E. Systematic review or scoping review? Guidance for authors when choosing between a systematic or scoping review approach. BMC Med Res Methodol. 2018;18:143. doi: 10.1186/s12874-018-0611-x PubMed
2. Arksey H, O’Malley L. Scoping Studies: towards a methodological framework. Int J Soc Res Methodol. 2005;8(1):19-32. doi: 10.1080/1364557032000119616
3. Fan M, Tscheng D, Hamilton M, Hyland B, Reding R, Trbovich P. Diversion of controlled drugs in hospitals: a scoping review of contributors and safeguards [published online ahead of print June 12, 2019]. J Hosp Med. 2019. doi: 10.12788/jhm.3228 PubMed
4. Tricco AC, Lillie E, Zarin W, et al. PRISMA Extension for Scoping Reviews (PRISMA-ScR): Checklist and Explanation. Ann Intern Med. 2018;169(7):467-473. doi: 10.7326/M18-0850 PubMed
5. Davis K, Drey N, Gould D. What are scoping studies? A review of the nursing literature. Int J Nurs Stud. 2009;46(10):1386-1400. doi: 10.1016/j.ijnurstu.2009.02.010. PubMed
6. Peters MD, Godfrey CM, Khalil H, McInerney P, Parker D, Soares CB. Guidance for conducting systematic scoping reviews. Int J Evid Based Healthc. 2015;13(3):141-146. doi: 10.1097/XEB.0000000000000050. PubMed
7. Levac D, Colquhoun H, O’Brien KK. Scoping studies: advancing the methodology. Implement Sci. 2010;5(1):69. doi: 10.1186/1748-5908-5-69. PubMed
8. Peters MDJ, Godfrey C, McInerney P, Baldini Soares C, Khalil H, Parker D. Scoping reviews. In: Aromataris E, Munn Z, eds. Joanna Briggs Institute Reviewer’s Manual. Adelaide, Australia: Joanna Briggs Inst; 2017. Available from https://reviewersmanual.joannabriggs.org/
9. Hetrick SE, Parker AG, Callahan P, Purcell R. Evidence mapping: illustrating an emerging methodology to improve evidence-based practice in youth mental health. J Eval Clin Pract. 2010;16(6):1025-1030. doi: 10.1111/j.1365-2753.2008.01112.x. PubMed
10. Ream E, Richardson A. Fatigue: a concept analysis. Int J Nurs Stud. 1996;33(5):519-529. doi: 10.1016/0020-7489(96)00004-1. PubMed
11. Tricco AC, Antony J, Zarin W, et al. A scoping review of rapid review methods. BMC Med. 2015;13(1):224. doi: 10.1186/s12916-015-0465-6. PubMed
12. Grant MJ, Booth A. A typology of reviews: an analysis of 14 review types and associated methodologies. Health Info Libr J. 2009;26(2):91-108. doi: 10.1111/j.1471-1842.2009.00848.x. PubMed
Research evidence synthesis involves the aggregation of available information using well-defined and transparent methods to search, summarize, and interpret a body of literature, frequently following a systematic review approach. A scoping review is a relatively new approach to evidence synthesis and differs from systematic reviews in its purpose and aims.1 The purpose of a scoping review is to provide an overview of the available research evidence without producing a summary answer to a discrete research question.2 Scoping reviews can be useful for answering broad questions, such as “What information has been presented on this topic in the literature?” and for gathering and assessing information prior to conducting a systematic review.1
In this issue of the Journal of Hospital Medicine, Fan et al. used a scoping review to identify information available in the literature on contributors to loss and theft of controlled drugs in hospitals and the safeguards that have been suggested to address these diversions.3 The authors followed Arksey and O’Malley’s framework for scoping reviews and the PRISMA-ScR (Preferred Reporting Items for Systematic reviews and Meta-Analyses extension for Scoping Reviews) checklist in reporting findings.2,4
PURPOSE OF A SCOPING REVIEW
Scoping reviews describe existing literature and other sources of information commonly include findings from a range of different study designs and methods.5 The broad scope of the collected information makes using formal meta-analytic methods difficult, if not impossible. Results of a scoping review often focus on the range of content identified, and quantitative assessment is often limited to a tally of the number of sources reporting a particular issue or recommendation. In contrast, systematic reviews commonly select the information sources by requiring specific study types, such as randomized controlled trials, and imposing quality standards, such as adequate allocation concealment, and place their emphasis on synthesizing data to address a specific research question. (Table) By focusing on specific studies, the synthesis component in a systematic review often takes the form of a meta-analysis in which the results of multiple scientific studies are combined to develop a summary conclusion, such as a common effect estimate, along with an evaluation of its heterogeneity across studies.
A scoping review can be a particularly useful approach when the information on a topic has not been comprehensively reviewed or is complex and diverse.6 Munn et al. proposed several objectives that can be achieved utilizing the scoping review framework, including identifying types of existing evidence in a given field, clarifying key concepts or definitions in the literature, surveying how research is conducted on a certain topic, identifying key characteristics related to a certain topic, and identifying knowledge gaps.1 When choosing to use a scoping review approach, it is important that the objective of the review align with the review’s indication or purpose.
METHODOLOGICAL FRAMEWORK OF SCOPING REVIEWS
Scoping reviews, like systematic reviews, require comprehensive and structured searches of the literature to maximize the capture of relevant information, provide reproducible results, and decrease potential bias from flawed implementations. The methodological framework for scoping reviews was developed by Arksey and O’Malley1 and further refined by Levac et al.7 and the Joanna Briggs Institute.6,8 Arksey and O’Malley’s framework for scoping reviews consists of the following six steps:
- Step 1: Identify the research question—the research question should be clearly defined and usually broad in scope to provide extensive coverage.
- Step 2: Identify relevant studies—the search strategy should be thorough and broad in scope and typically include electronic databases, reference lists, hand searches, and gray literature (ie, substantive or scholarly information that has not been formally published and often is not peer-reviewed), including conference abstracts, presentations, regulatory data, working papers, and patents.
- Step 3: Study selection—the study selection process can include post hoc, or modified, inclusion and exclusion criteria as new ideas emerge during the process of gathering and reviewing information.
- Step 4: Chart the data—the data extraction process in a scoping review is called data charting and involves the use of a data charting form to extract the relevant information from the reviewed literature.
- Step 5: Collate, summarize, and report the results—the description of the scope of the literature is commonly presented in tables and charts according to key themes.
- Optional Step 6: Consultation exercise—in this optional step, stakeholders outside the study review team are invited to provide their insights to inform and validate findings from the scoping review.
Since the number of studies included in a scoping review can be substantial, several study team members may participate in the review process. When multiple reviewers are employed, the team ought to conduct a calibration exercise at each step of the review process to ensure adequate interrater agreement. In addition, the PRISMA-ScR guidelines should be followed when reporting findings from scoping reviews to facilitate complete, transparent, and consistent reporting in the literature.4
LIMITATIONS OF THE SCOPING REVIEW APPROACH
The scoping review approach has several limitations. Scoping reviews do not formally evaluate the quality of evidence and often gather information from a wide range of study designs and methods. By design, the number of studies included in the review process can be sizable. Thus, a large study team is typically needed to screen the large number of studies and other sources for potential inclusion in the scoping review. Because scoping reviews provide a descriptive account of available information, this often leads to broad, less defined searches that require multiple structured strategies focused on alternative sets of themes. Hand searching the literature is therefore necessary to ensure the validity of this process. Scoping reviews do not provide a synthesized result or answer to a specific question, but rather provide an overview of the available literature. Even though statements regarding the quality of evidence and formal synthesis are avoided, the scoping review approach is not necessarily easier or faster than the systematic review approach. Scoping reviews require a substantial amount of time to complete due to the wide coverage of the search implicit in the approach.
Like other studies, scoping reviews are at risk for bias from different sources. Critical appraisal of the risk of bias in scoping reviews is not considered mandatory, but some scoping reviews may include a bias assessment. Even if bias is not formally assessed, that does not mean that bias does not exist. For example, selection bias may occur if the scoping review does not identify all available data on a topic and the resulting descriptive account of available information is flawed.
WHY DID THE AUTHORS USE THE SCOPING REVIEW METHOD?
Fan et al. used the scoping review approach to examine the available information on contributors to and safeguards against controlled-drug losses and theft (drug diversion) in the hospital setting.3 The authors addressed the following questions: (1) “What clinical units, health professions, or stages of the medication-use process are commonly discussed?” (2) “What are the identified contributors to diversion in hospitals?” and (3) “What safeguards to prevent or detect diversion in hospitals have been described?” Part of the rationale for using a scoping review approach was to permit the inclusion of a wide range of sources falling outside the typical peer-reviewed article. The authors comment that the stigmatized topic of drug diversion frequently falls outside the peer-reviewed literature and emphasize the importance of including such sources as conferences, news articles, and legal reports. The search strategy included electronic research databases, such as Web of Science, as well as an extensive gray literature search. Multiple reviewers were included in the process and a calibration exercise was conducted to ensure consistency in the selection of articles and to improve interrater agreement. The scoping review identified contributors to controlled-drug diversion and suggested safeguards to address them in the hospital setting.
OTHER CONSIDERATIONS
Methodological approaches to evidence synthesis vary, and new methods continue to emerge to meet different research objectives, including evidence mapping,9 concept analysis,10 rapid reviews,11 and others.12 Choosing the right approach may not be straightforward. Researchers may need to seek guidance from methodologists, including epidemiologists, statisticians, and information specialists, when choosing an appropriate review approach to ensure that the review methods are suitable for the objectives of the review.
Disclosures
The authors have no conflicts of interest to disclose.
Financial Disclosures
The authors have no financial relationships relevant to this article to disclose.
1. Munn Z, Peters M, Stern C, Tufanaru C, McArthur A, Aromataris E. Systematic review or scoping review? Guidance for authors when choosing between a systematic or scoping review approach. BMC Med Res Methodol. 2018;18:143. doi: 10.1186/s12874-018-0611-x PubMed
2. Arksey H, O’Malley L. Scoping Studies: towards a methodological framework. Int J Soc Res Methodol. 2005;8(1):19-32. doi: 10.1080/1364557032000119616
3. Fan M, Tscheng D, Hamilton M, Hyland B, Reding R, Trbovich P. Diversion of controlled drugs in hospitals: a scoping review of contributors and safeguards [published online ahead of print June 12, 2019]. J Hosp Med. 2019. doi: 10.12788/jhm.3228 PubMed
4. Tricco AC, Lillie E, Zarin W, et al. PRISMA Extension for Scoping Reviews (PRISMA-ScR): Checklist and Explanation. Ann Intern Med. 2018;169(7):467-473. doi: 10.7326/M18-0850 PubMed
5. Davis K, Drey N, Gould D. What are scoping studies? A review of the nursing literature. Int J Nurs Stud. 2009;46(10):1386-1400. doi: 10.1016/j.ijnurstu.2009.02.010. PubMed
6. Peters MD, Godfrey CM, Khalil H, McInerney P, Parker D, Soares CB. Guidance for conducting systematic scoping reviews. Int J Evid Based Healthc. 2015;13(3):141-146. doi: 10.1097/XEB.0000000000000050. PubMed
7. Levac D, Colquhoun H, O’Brien KK. Scoping studies: advancing the methodology. Implement Sci. 2010;5(1):69. doi: 10.1186/1748-5908-5-69. PubMed
8. Peters MDJ, Godfrey C, McInerney P, Baldini Soares C, Khalil H, Parker D. Scoping reviews. In: Aromataris E, Munn Z, eds. Joanna Briggs Institute Reviewer’s Manual. Adelaide, Australia: Joanna Briggs Inst; 2017. Available from https://reviewersmanual.joannabriggs.org/
9. Hetrick SE, Parker AG, Callahan P, Purcell R. Evidence mapping: illustrating an emerging methodology to improve evidence-based practice in youth mental health. J Eval Clin Pract. 2010;16(6):1025-1030. doi: 10.1111/j.1365-2753.2008.01112.x. PubMed
10. Ream E, Richardson A. Fatigue: a concept analysis. Int J Nurs Stud. 1996;33(5):519-529. doi: 10.1016/0020-7489(96)00004-1. PubMed
11. Tricco AC, Antony J, Zarin W, et al. A scoping review of rapid review methods. BMC Med. 2015;13(1):224. doi: 10.1186/s12916-015-0465-6. PubMed
12. Grant MJ, Booth A. A typology of reviews: an analysis of 14 review types and associated methodologies. Health Info Libr J. 2009;26(2):91-108. doi: 10.1111/j.1471-1842.2009.00848.x. PubMed
© 2019 Society of Hospital Medicine