User login
William Beaumont: A Pioneer of Physiology
William Beaumont Army Medical Center in El Paso, Texas, was the first of several military and civilian medical facilities named for U.S. Army doctor William Beaumont (1785-1853). Beaumont was born into a large farming family in Lebanon, Connecticut, and was educated with his siblings in a local schoolhouse. His medical education was by apprenticeship with an established physician in Vermont. At the time, there were fewer than a dozen medical schools in the U.S., and most physicians were educated and trained as apprentices. In July 1812, he passed the Vermont medical examination and became a licensed physician.
In an age when no information traveled faster than the 4 legs of a horse, it is not known how much William Beaumont was aware of the events that led to the American declaration of war against Great Britain in June 1812. It is equally unknown whether a sense of patriotism, youthful adventurism, or simply the need for a job drove Beaumont to join the U.S. Army in September 1812. Regardless of the reasons, he soon was under fire as a Brevet Surgeon’s Mate with the 6th Regiment at the Battle of York in Canada.
The retreating British booby-trapped their powder magazine, which exploded on the Americans and caused more casualties than the battle itself. Beaumont wrote in his journal, “The surgeons wading in blood, cutting off arms, legs, and trepanning heads to rescue their fellow creatures from untimely deaths.” He also wrote that, “it awoke my liveliest sympathy” for his fellow soldiers; he worked for 48 hours without food or sleep. Beaumont saw additional action at Fort George and the Battle of Plattsburgh.Beaumont left the U.S. Army after the war, but following a few years of civilian practice, he returned to active duty and was assigned to the northwestern frontier post on Mackinac Island, Michigan, the site of lively summer fur trading between Canadian trappers and American traders. In June 1822, a young Canadian voyageur, Alexis St. Martin, was accidentally shot in the upper left abdomen at close range with what we know today as a shotgun. Beaumont described the wound as the size of a man’s palm with burned lung and stomach spilling out as well as recently eaten food. He thought attempts to save St. Martin’s life were “entirely useless.”
But Beaumont gave it his best, and St. Martin miraculously survived. The wound healed but left a gastric fistula to the abdominal wall. Over time, Beaumont realized that he was able to witness the previously mysterious functions of the gastrointestinal tract. For more than 10 years, Beaumont studied the physiology of St. Martin’s fistulous stomach, leading to the publication of several articles and a book that earned Beaumont the reputation of at the very least the father of gastric physiology if not of American physiology.
Beaumont and St. Martin eventually parted ways. Beaumont pleaded with St. Martin to return for more studies, but with a wife and many children to support, St. Martin would not. Beaumont again left the U.S. Army to practice medicine in St. Louis, where in 1853, he slipped on ice and struck his head. Several weeks later at the age of 67, he died of his injuries. St. Martin died in 1880 at age 76, living almost 6 decades with a gastric fistula and fathering 17 children.
In 1921, the U.S. Army hospital at Ft. Bliss, Texas, was named for William Beaumont. The building was replaced in 1972 with a 12-story facility known as William Beaumont Army Medical Center. In November 1995, additional space was added for the VA health care center. In 1955, the William Beaumont Hospital opened in Royal Oak, Michigan. This civilian hospital has grown to a health care system with many facilities that include a school of medicine founded in 2011, all named for Beaumont.
For more detailed information on William Beaumont, read Frank TW. Builders of Trust, William Beaumont. The Borden Institute: Fort Detrick, Maryland; 2011.
About this column
This column provides biographical sketches of the namesakes of military and VA health care facilities. To learn more about the individual your facility was named for or to offer a topic suggestion, contact us at [email protected] or on Facebook.

Veterans as Caregivers:Those Who Continue to Serve
More than 20% of the U.S. population will be aged ≥ 65 years by 2030, an increase from 13% in 2012.1 The likelihood of needing assistance with activities of daily living (ADLs) increases with age.2 People who need such assistance often depend on informal and unpaid assistance from friends and family. In 2009, about 65.7 million Americans (28.5%) provided informal care for people with an illness or disability, and that number only is expected to rise.3 These informal caregivers provide up to 80% of the total care hours needed by community-dwelling older adults—an estimated economic value of $450 billion in unpaid contributions in 2009.4,5
Caregiving can lead to significant physical, psychological, social, and financial burdens.6 The caregiving burden is associated with a host of adverse health behaviors and outcomes such as poor diet, lack of exercise and sleep, smoking, decreased participation in preventive health care, anxiety, depression, relationship difficulties, employment disruption, financial hardship, suicide, and higher mortality compared with that of noncaregivers.6-10 Additionally, care recipients are at increased risk for abuse or neglect when the caregiver is experiencing a significant burden.11 Therefore, efforts to improve caregiver support are important for both partners in the caregiver/care recipient dyad.
Caregiver support is beneficial to the health of caregivers and care recipients.10,12 For example, the Resources for Enhancing Alzheimer’s Caregiver Health (REACH) program has been shown to reduce the stress of informal caregiving and the risk of depression in caregivers.13,14 This program showed similar effects when implemented within the VHA.14 In the Partners in Dementia Care project, the VHA and Alzheimer’s Association coordinated care and support for veterans with dementia and their family and friends. This intervention resulted in lower caregiver strain and depression scores among participants.15
With a growing medical literature that shows the benefits of caregiver support interventions, the VHA developed a robust support program for informal caregivers of veterans. The VA caregiver support website (www.caregiver.va.gov) provides information and resources targeted to caregivers for veterans, including psychosocial and functional support for caregivers. The psychosocial support provided by the VA includes caregiver education, counseling, access to caregiver support coordinators, a caregiver support line, support groups, and referral to community support organizations.16 Functional support on the site includes financial assistance toward skilled home care, home hospice care, adult day care, home-based primary care, homemaker and home health aide services, telehealth, and respite care.16 Veterans who are caregiving for nonveterans have access to VHA psychosocial support but not to functional support services. For these veterans, functional caregiver support must come from family or referral to community organizations.
Background
In the U.S., about 11% of caregivers are veterans, but the availability of data about these caregivers is limited to veteran subgroups.3 For example, a 2011 study reported that 20% of veterans aged ≥ 60 years are caregivers.17 However, this estimate included child care for unimpaired children, which is not commonly included in other caregiving estimates. In another study, 30% of middle-aged active-duty officers reported helping their parents with instrumental ADLs (IADLs).18 These data suggest a significant proportion of veterans may be caregivers; however, the estimates do not identify prevalence of caregiving among a population of VHA enrolled veterans.
Likewise, few studies discuss the burden veterans experience from caregiving. A study of the 2009/2010 CDC Behavioral Risk Factor Surveillance System data found that female caregivers were more likely to report problems with sleep and mental health if they were veterans vs nonveterans.19 In a second study, caregiving veterans frequently reported physical (39%) and emotional (53%) strain, with emotional strain relating to depressive symptoms. The study of active-duty officers noted that worry was prevalent among military officers caregiving for parents from a distance.18 In contrast to the negative outcomes of caregiving, Monin and colleagues found that many veterans perceived caregiving as rewarding. Since caregiving may be a positive experience, veterans may benefit and be a potential resource for care to elderly and disabled citizens.17
Project Rationale and Goals
Social workers are the cornerstone of caregiver support at the George E. Wahlen VA Salt Lake City Health Care System (VASLCHCS) in Utah. They educate veterans and caregivers about VA resources to support caregivers of veterans. For those veterans who are caregiving for a nonveteran, the VASLCHCS social workers provide psychosocial support and help veterans connect to a local area agency on aging (AAA) for access to functional support. In practice, primary care clinic (PCC) providers have observed that directing a veteran to call the AAA does not usually result in a phone call. Therefore, an aim of this quality improvement (QI) project was to determine the most effective means of completing a successful AAA referral.
The VASLCHCS Geriatric Research Education and Clinical Center collaborates with the Utah Aging and Disability Resource Connection (ADRC) to improve awareness of available resources for veterans. Building on this collaborative project, the authors created a formal referral process for veterans needing local AAA services. This QI project had 3 aims: (1) estimate the prevalence of caregiving among veterans in the VASLCHCS primary care clinic; (2) identify perceived caregiving difficulties and resource use difficulty in caregiving tasks; and (3) test different strategies to connect veterans with a referral to community resources through the AAA.
The authors hypothesized that a veteran would be more likely to connect with the AAA if contact was initiated by the AAA rather than the standard practice of asking the veteran to make the call. However, the authors also hypothesized that a veteran who took the time to make the call would be more likely to use AAA resources compared with veterans who were called by the AAA.
Methods
The VASLCHCS Research and Development Office reviewed this project and determined that it met the definition of QI. Therefore, it did not require IRB approval.
The study drew from a convenience sample of veterans who were waiting for appointments in the PCC and who were referred by their health care provider (HCP). To identify caregivers, veterans were asked: “People may provide regular care or assistance to a friend or family member who has a health problem, long-term illness, or disability. During the past month, did you provide any such care or assistance to a friend or family member?” Referrals from HCPs were included in all calculations except the prevalence estimate.
The authors interviewed veterans over a 3-month period in 2015. As of November 2014, the clinic was serving about 11,000 veterans, of which 6,589 lived in Salt Lake County. The clinic also serves veterans who live in other counties in Utah, Nevada, Wyoming, Idaho, and Colorado. 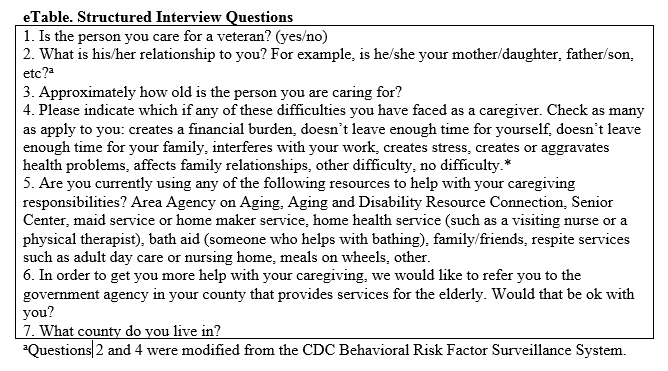
Intervention and Partnering With Community Resources
All willing caregivers were provided a referral to a local AAA (Figure). Salt Lake County veterans interested in referral to the AAA were randomized to 1 of 2 referral methods: veteran-initiated referral (VIR), in which the veteran was given a handout with the phone number of the Salt Lake County caregiver support program (CSP), or provider-initiated referral (PIR), in which the veteran’s phone number was given to the CSP. Caregiving veterans living outside Salt Lake County were provided the AAA phone number in their area and instructed to call for information.
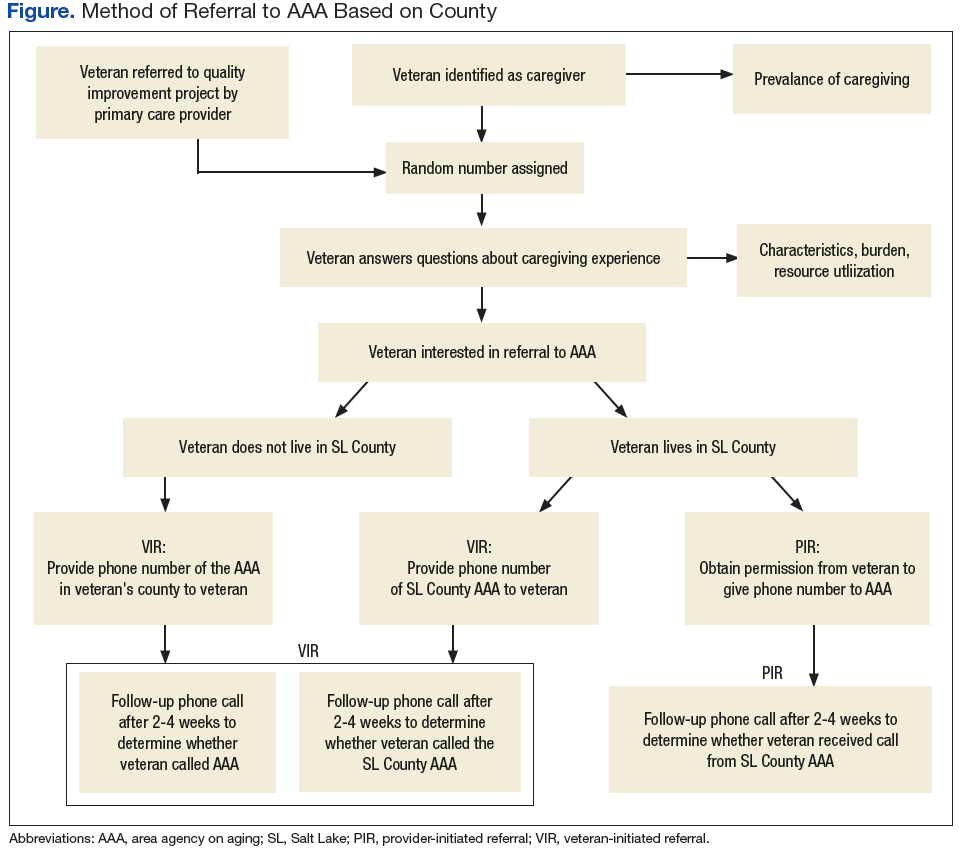
The interview form was randomized using an even or odd number before the interview. Some veterans who were randomized to a PIR needed to be moved into the VIR intervention arm because of the following reasons: the veteran’s care recipient was aged < 18 years (3); the veteran lived outside of Salt Lake County (20); the veteran did not want his/her name given to an outside agency (5); or the interviewer mistakenly gave the veteran the AAA contact information (4).
The primary author called caregivers in the PIR and VIR groups 2 to 4 weeks after the referral to determine whether they had contacted or were contacted by the AAA. Ten call attempts were made before participants were considered lost to follow-up. Caregivers that had been in contact with the AAA reported in open-ended fashion the resources to which they had been referred and whether those resources had been helpful.
Analysis
In this evaluation, the primary outcome of interest was whether contact between the veteran and AAA occurred. For the VIR group, contact was defined as the veteran having called the AAA, regardless of whether he or she actually spoke to someone. For the PIR group, contact occurred if the veteran reported receiving a phone call from AAA regardless of whether he or she had actually spoken with someone (eg, if the veteran reported that the AAA had left a voice mail, this was considered contact). Veterans also were asked whether connecting with the AAA led to resource referrals and whether these referrals were useful.
To achieve a power of 80% with a 95% confidence interval, 20 people were needed in each intervention group to detect a 40% difference in the rate of contact between the 2 groups. STATA12 (College Station, TX) was used to calculate Fisher exact and chi-square values to evaluate differences between groups.
Results
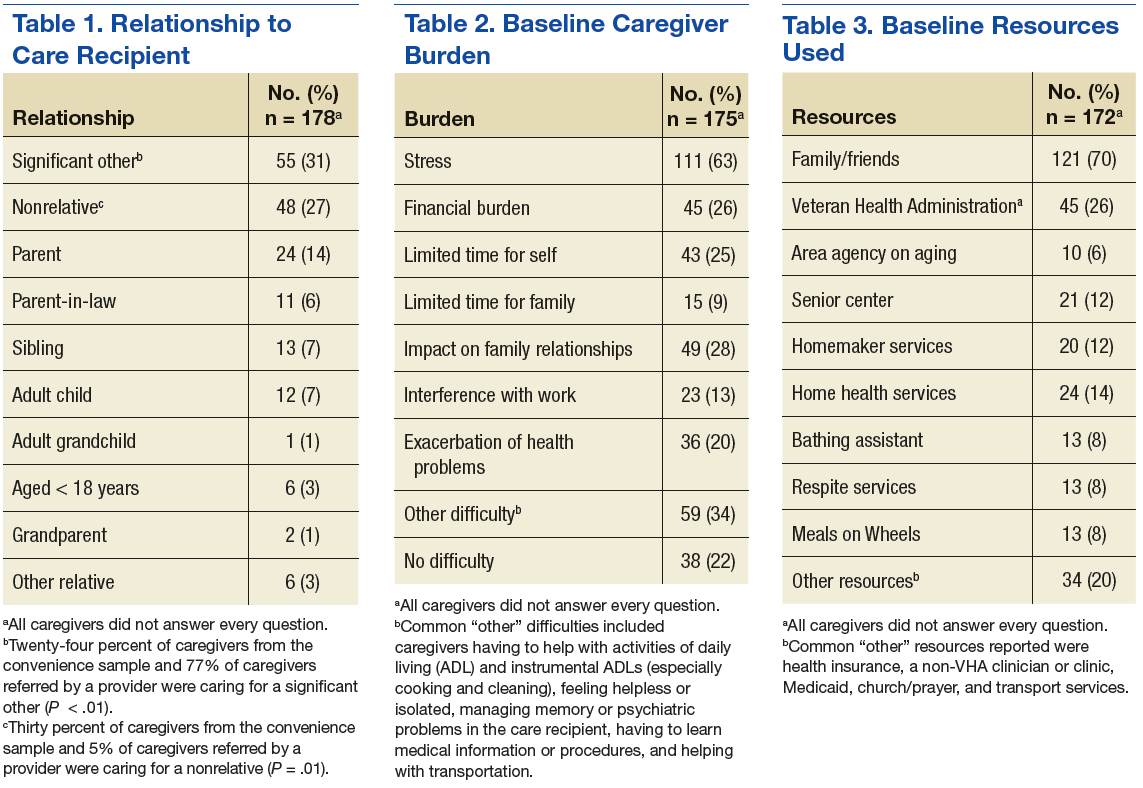
For the study, 433 PCC veterans were interviewed, and 157 (36%) self-identified as a caregiver. An additional 22 referrals were included for a total of 179 caregivers. Caregiver and care recipient characteristics, caregiver burden, and resource utilization were calculated for all 179 caregivers; however, all caregivers did not answer every question. Ninety-eight percent (176) of caregivers were men; 64% (109/170) were from Salt Lake County, and 5% were from outside Utah (8). Twelve percent (21) of the 179 caregivers were providing care for > 1 person. Of 177 caregivers, 3% (5) were caring for both a veteran and a nonveteran, 69% (122) were caring for a nonveteran only, and 28% (49) were caring for another veteran only (Table 1).
The most common burden reported by caregivers was stress (63%); 70% endorsed family/friends as a resource (Table 2). Just 6% (10) of caregivers used the AAA, whereas 26% (45) received VHA support. Of the 54 veterans who were caring for a veteran, 40 reported using the VHA as a resource. Five people caring for nonveterans reported using the VHA as a resource; however, data about which resources those caregivers were accessing were not collected (Table 3).
AAA Referral and Randomization
Sixty-five percent of caregivers accepted AAA referrals. Of 109 Salt Lake County caregivers, 70% accepted referral to the AAA. There was no statistically significant difference in referral acceptance rates when comparing Salt Lake County residents with nonresidents (P = .09).The authors were unable to obtain the phone number for 1 caregiver who had accepted a referral, and 1 caregiver who accepted referral did not want a follow-up. This left 111 caregivers available for follow-up, 75 in Salt Lake County. Fifty Salt Lake County veterans were randomly assigned to the VIR group and 25 to the PIR group. The 36 caregivers who accepted referrals outside Salt Lake County also were placed in the VIR group, for a total of 86 caregivers.
Follow-up
Ninety-eight percent of caregivers were reached for follow-up. Both people lost to follow-up were in Salt Lake County (1 in each group).
In Salt Lake County, 12% (6) of the VIR group and 64% (16) of the PIR group had connected with the AAA (P < .01). Although 64% of those in the PIR group reported having been called by the AAA, the AAA representative reported all 25 had been called. The AAA records showed 9 of those called were reached by voice mail, 6 were provided information about caregiving resources, 2 formally joined the support program, 5 declined help, 1 was no longer caregiving, 1 was too busy to talk, and 1 was the wrong phone number (and was lost to follow-up as well).
Outside of Salt Lake County 19% (7) reported calling the local AAA. There was no difference in referral completion between the Salt Lake County/non-Salt Lake County VIR groups (P = .4).
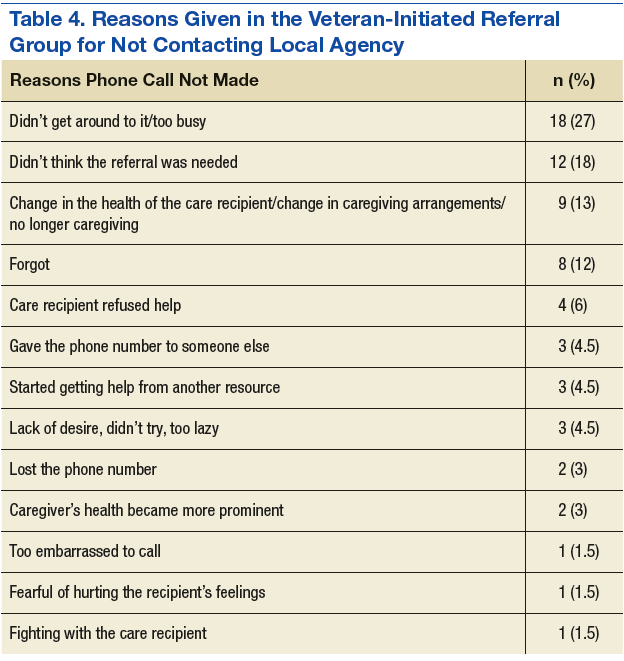
Fifteen percent of all VIR caregivers reported calling the AAA. There were no statistical differences between Salt Lake County VIR and non-Salt Lake County VIR for reasons why the veteran had not called the AAA (Table 4).
Of 28 people who connected with the AAA, 16 (57%) said they had received access to a needed resource as a result of the phone call. Seven caregivers (25%) said they had not been referred to other resources as a result of the call. The VIR group was more likely to be referred to other resources after contacting the AAA than was the PIR group, although this difference did not reach significance (69% vs 47%, P = .28).
Discussion
More than one-third (36%) of veterans seen in the VASLCHCS PCC are caregivers. This prevalence is higher than that reported for the general U.S. population and higher than that reported in other veteran groups.5,17,18 Most caregivers in this project were caring for nonveterans and only had access to VHA psychosocial caregiver support programs because VHA functional caregiver support (eg, respite, homemaker services) is not available to veterans who care for nonveterans. A majority (78%) of caregiving veterans reported some caregiver burden. Despite the burden, most are not using community resources. However when offered, more than half the caregivers were interested in an AAA referral.
Although the VHA does not provide functional caregiver support resources to veterans caring for nonveterans, there are other agencies that can assist veterans: AAAs for care recipients aged ≥ 60 years and the ADRCs for younger veterans. Through AAAs, caregivers can access a variety of support services, including transportation, adult day care, caregiver support, and health promotion programs. Partnership between agencies such as the VHA and the AAAs could benefit caregiving veterans. This QI project suggests ways to strengthen interagency cooperation.
This study also suggests that a provider or clinic-initiated referral is more likely to connect veterans with information and resources than the current practice of recommending that the veteran initiate the referral. Once in contact with the AAA, most caregivers were referred to needed resources. The next step will be to establish an efficient way for clinic staff to identify caregiving veterans and make referrals to community programs. Referrals could be made by any member of the patient aligned care team (PACT) to further standardize and streamline the process.
Thirty-one percent of veterans in this project were eligible for the VHA caregiver support program because they cared for a veteran. However, 25% of these caregiving veterans were not accessing this resource. Increasing awareness of the VHA caregiver support program among veterans caring for other veterans would improve caregiver support to both caregiving and care recipient veterans.
Limitations
One limitation of this project was the intentional exclusion of the women’s clinic from the sampling process. For consistency, the authors wanted to limit the intervention to 1 PCC and so they chose the clinic that serves the majority of the veterans who receive primary care at VASLCHCS. Additionally, the literature showed that male caregivers compared with women caregivers20,21 have different characteristics in regards to caregiver burden, and a well-designed study of women caregivers already has been published.19
Also, this study did not obtain data on age, health problems, or socioeconomic status of the caregivers to avoid identifying information. Last, the authors did not ask about time spent caregiving or type of care provided. These questions may be important for future studies. Future investigations should evaluate health care use and health of caregivers vs noncaregivers in the veteran population. It also could be important to determine methods for building bridges between the VHA, AAAs, and other community services.
Conclusion
To minimize the disruption that a research study might have caused to normal clinical workflow, the primary author played the role that a medical social worker or other PACT member might play in the future. This project sheds light on how to improve outcomes for community referrals and an important future step in this research would be to develop and test a process that would integrate the PACT into the referral process.
More than one-third of veterans seen in the VASLCHCS PCC are caregivers. To the authors’ knowledge, this is the first estimate of prevalence of caregiving in veterans who receive primary care from the VHA. About 63% of caregiving veterans perceived some burden due to caregiving, and 66% accepted referral to community resources. However, only 12% who were asked to self-refer made contact with the AAA compared with 64% when a provider made the referral for them. Provider referral is more effective in connecting caregiving veterans with resources. Development of interagency partnerships should be fostered to help veterans decrease caregiving burden.
This project is one of the few studies looking at this special group of caregivers: veterans who serve as caregivers. It highlights the need for the VHA to establish policies and partnerships to improve caregiver support to this valuable group of veterans.
1. Ortman JM, Velkoff VA, Hogan H. An aging nation: the older population in the United States: population estimates and projections. http://www.census .gov/prod/2014pubs/p25-1140.pdf. Published May 2014. Accessed March 9, 2017.
2. Smith AK, Walter LC, Miao Y, Boscardin WJ, Covinsky KE. Disability during the last two years of life. JAMA Intern Med. 2013;173(16):1506-1513.
3. National Alliance for Caregiving, American Association of Retired Persons. Caregiving in the U.S. 2009 executive summary. http://assets.aarp.org/rgcenter/il/caregiving_09_es.pdf. Published November 2009. Accessed March 9, 2017.
4. Spillman BC, Wolff J, Freedman VA, Kasper JD; Office of the Assistant Secretary for Planning and Evaluation, U.S. Department of Health and Human Services. Informal caregiving for older Americans: an analysis of the 2011 national study of caregiving. https://aspe.hhs.gov/report/informal-caregiving-older-americans-analysis-2011-national-study-caregiving. Published April 1, 2014. Accessed March 9, 2017.
5. Feinberg L, Reinhard SC, Houser A, Choula R; AARP Public Policy Institute. Valuing the invaluable: 2011 update. The growing contributions and costs of family caregiving. https://assets.aarp .org/rgcenter/ppi/ltc/i51-caregiving.pdf. Published June 2011. Accessed March 9, 2017.
6. Adelman RD, Tmanova LL, Delgado D, Dion S, Lachs MS. Caregiver burden: a clinical review. JAMA. 2014;311(10):1052-1059.
7. Burton LC, Newsom JT, Schulz R, Hirsch CH, German PS. Preventive health behaviors among spousal caregivers. Prev Med. 1997;26(2):162-169.
8. Talley RC, Crews JE. Framing the public health of caregiving. Am J Public Health. 2007;97(2):224-228.
9. Hoffman GJ, Lee J, Mendez-Luck CA. Health behaviors among baby boomer informal caregivers. Gerontologist. 2012;52(2):219-230.
10. National Alliance for Caregiving. Caregivers of veterans—serving on the homefront: report of study findings. http://www.caregiving.org/data/2010 _Caregivers_of_Veterans_FULLREPORT_WEB_FINAL.pdf. Published November 2010. Accessed March 9, 2017.
11. Johannesen M, LoGuidice D. Elder abuse: a systematic review of risk factors in community dwelling elders. Age Ageing. 2013;42(3):292-298.
12. Goy E, Kansagara D, Freeman M;Department of Veterans Affairs, Health Services Research & Development Service. A systematic evidence review of interventions for non-professional caregivers of individuals with dementia. http://www.hsrd.research .va.gov/publications/esp/DementiaCaregivers-EXEC .pdf. Published October 2010. Accessed March 9, 2017.
13. Belle SH, Burgio L, Burns R, et al; Resources for Enhancing Alzheimer’s Caregiver Health (REACH) II Investigators. Enhancing the quality of life of dementia caregivers from different ethnic or racial groups: a randomized controlled trial. Ann Intern Med. 2006;145(10):727-738.
14. Nichols LO, Martindale-Adams J, Burns R, Graney MJ, Zuber J. Translation of a dementia caregiver support program in a health care system—REACH VA. Arch Intern Med. 2011;171(4):353-359.
15. Bass DM, Judge KS, Snow AL, et al. Caregiver outcomes of partners in dementia care: effect of a care coordination program for veterans with dementia and their family members and friends. J Am Geriatr Soc. 2013;61(8):1377-1386.
16. U.S. Department of Veteran Affairs. VA caregiver support: caregiver services. http://www.caregiver .va.gov/support/support_services.asp. Updated June 3, 2015. Accessed March 9, 2017.
17. Monin JK, Levy BR, Pietrzak RH. From serving in the military to serving loved ones: unique experiences of older veteran caregivers. Am J Geriatr Psychiatry. 2014;22(6):570-579.
18. Parker MW, Call VR, Dunkle R, Vaitkus M. “Out of sight” but not “out of mind”: parent contact and worry among senior ranking male officers in the military who live long distances from parents. Milit Psychol. 2002;14(4):257-277.
19. Lavela SL, Etingen B, Louise-Bender Pape T. Caregiving experiences and health conditions of women veteran and non-veteran caregivers. Womens Health Issues. 2013;23(4):e225-e232.
20. Yee JL, Schultz RS. Gender differences in psychiatric morbidity among family caregivers: a review and analysis. Gerontologist. 2000;40(2):147-164.
21. Collins CR. Men as caregivers of the elderly: support for the contributions of sons. J Multidiscip Healthc. 2014;7:525-531.
More than 20% of the U.S. population will be aged ≥ 65 years by 2030, an increase from 13% in 2012.1 The likelihood of needing assistance with activities of daily living (ADLs) increases with age.2 People who need such assistance often depend on informal and unpaid assistance from friends and family. In 2009, about 65.7 million Americans (28.5%) provided informal care for people with an illness or disability, and that number only is expected to rise.3 These informal caregivers provide up to 80% of the total care hours needed by community-dwelling older adults—an estimated economic value of $450 billion in unpaid contributions in 2009.4,5
Caregiving can lead to significant physical, psychological, social, and financial burdens.6 The caregiving burden is associated with a host of adverse health behaviors and outcomes such as poor diet, lack of exercise and sleep, smoking, decreased participation in preventive health care, anxiety, depression, relationship difficulties, employment disruption, financial hardship, suicide, and higher mortality compared with that of noncaregivers.6-10 Additionally, care recipients are at increased risk for abuse or neglect when the caregiver is experiencing a significant burden.11 Therefore, efforts to improve caregiver support are important for both partners in the caregiver/care recipient dyad.
Caregiver support is beneficial to the health of caregivers and care recipients.10,12 For example, the Resources for Enhancing Alzheimer’s Caregiver Health (REACH) program has been shown to reduce the stress of informal caregiving and the risk of depression in caregivers.13,14 This program showed similar effects when implemented within the VHA.14 In the Partners in Dementia Care project, the VHA and Alzheimer’s Association coordinated care and support for veterans with dementia and their family and friends. This intervention resulted in lower caregiver strain and depression scores among participants.15
With a growing medical literature that shows the benefits of caregiver support interventions, the VHA developed a robust support program for informal caregivers of veterans. The VA caregiver support website (www.caregiver.va.gov) provides information and resources targeted to caregivers for veterans, including psychosocial and functional support for caregivers. The psychosocial support provided by the VA includes caregiver education, counseling, access to caregiver support coordinators, a caregiver support line, support groups, and referral to community support organizations.16 Functional support on the site includes financial assistance toward skilled home care, home hospice care, adult day care, home-based primary care, homemaker and home health aide services, telehealth, and respite care.16 Veterans who are caregiving for nonveterans have access to VHA psychosocial support but not to functional support services. For these veterans, functional caregiver support must come from family or referral to community organizations.
Background
In the U.S., about 11% of caregivers are veterans, but the availability of data about these caregivers is limited to veteran subgroups.3 For example, a 2011 study reported that 20% of veterans aged ≥ 60 years are caregivers.17 However, this estimate included child care for unimpaired children, which is not commonly included in other caregiving estimates. In another study, 30% of middle-aged active-duty officers reported helping their parents with instrumental ADLs (IADLs).18 These data suggest a significant proportion of veterans may be caregivers; however, the estimates do not identify prevalence of caregiving among a population of VHA enrolled veterans.
Likewise, few studies discuss the burden veterans experience from caregiving. A study of the 2009/2010 CDC Behavioral Risk Factor Surveillance System data found that female caregivers were more likely to report problems with sleep and mental health if they were veterans vs nonveterans.19 In a second study, caregiving veterans frequently reported physical (39%) and emotional (53%) strain, with emotional strain relating to depressive symptoms. The study of active-duty officers noted that worry was prevalent among military officers caregiving for parents from a distance.18 In contrast to the negative outcomes of caregiving, Monin and colleagues found that many veterans perceived caregiving as rewarding. Since caregiving may be a positive experience, veterans may benefit and be a potential resource for care to elderly and disabled citizens.17
Project Rationale and Goals
Social workers are the cornerstone of caregiver support at the George E. Wahlen VA Salt Lake City Health Care System (VASLCHCS) in Utah. They educate veterans and caregivers about VA resources to support caregivers of veterans. For those veterans who are caregiving for a nonveteran, the VASLCHCS social workers provide psychosocial support and help veterans connect to a local area agency on aging (AAA) for access to functional support. In practice, primary care clinic (PCC) providers have observed that directing a veteran to call the AAA does not usually result in a phone call. Therefore, an aim of this quality improvement (QI) project was to determine the most effective means of completing a successful AAA referral.
The VASLCHCS Geriatric Research Education and Clinical Center collaborates with the Utah Aging and Disability Resource Connection (ADRC) to improve awareness of available resources for veterans. Building on this collaborative project, the authors created a formal referral process for veterans needing local AAA services. This QI project had 3 aims: (1) estimate the prevalence of caregiving among veterans in the VASLCHCS primary care clinic; (2) identify perceived caregiving difficulties and resource use difficulty in caregiving tasks; and (3) test different strategies to connect veterans with a referral to community resources through the AAA.
The authors hypothesized that a veteran would be more likely to connect with the AAA if contact was initiated by the AAA rather than the standard practice of asking the veteran to make the call. However, the authors also hypothesized that a veteran who took the time to make the call would be more likely to use AAA resources compared with veterans who were called by the AAA.
Methods
The VASLCHCS Research and Development Office reviewed this project and determined that it met the definition of QI. Therefore, it did not require IRB approval.
The study drew from a convenience sample of veterans who were waiting for appointments in the PCC and who were referred by their health care provider (HCP). To identify caregivers, veterans were asked: “People may provide regular care or assistance to a friend or family member who has a health problem, long-term illness, or disability. During the past month, did you provide any such care or assistance to a friend or family member?” Referrals from HCPs were included in all calculations except the prevalence estimate.
The authors interviewed veterans over a 3-month period in 2015. As of November 2014, the clinic was serving about 11,000 veterans, of which 6,589 lived in Salt Lake County. The clinic also serves veterans who live in other counties in Utah, Nevada, Wyoming, Idaho, and Colorado.
Intervention and Partnering With Community Resources
All willing caregivers were provided a referral to a local AAA (Figure). Salt Lake County veterans interested in referral to the AAA were randomized to 1 of 2 referral methods: veteran-initiated referral (VIR), in which the veteran was given a handout with the phone number of the Salt Lake County caregiver support program (CSP), or provider-initiated referral (PIR), in which the veteran’s phone number was given to the CSP. Caregiving veterans living outside Salt Lake County were provided the AAA phone number in their area and instructed to call for information.
The interview form was randomized using an even or odd number before the interview. Some veterans who were randomized to a PIR needed to be moved into the VIR intervention arm because of the following reasons: the veteran’s care recipient was aged < 18 years (3); the veteran lived outside of Salt Lake County (20); the veteran did not want his/her name given to an outside agency (5); or the interviewer mistakenly gave the veteran the AAA contact information (4).
The primary author called caregivers in the PIR and VIR groups 2 to 4 weeks after the referral to determine whether they had contacted or were contacted by the AAA. Ten call attempts were made before participants were considered lost to follow-up. Caregivers that had been in contact with the AAA reported in open-ended fashion the resources to which they had been referred and whether those resources had been helpful.
Analysis
In this evaluation, the primary outcome of interest was whether contact between the veteran and AAA occurred. For the VIR group, contact was defined as the veteran having called the AAA, regardless of whether he or she actually spoke to someone. For the PIR group, contact occurred if the veteran reported receiving a phone call from AAA regardless of whether he or she had actually spoken with someone (eg, if the veteran reported that the AAA had left a voice mail, this was considered contact). Veterans also were asked whether connecting with the AAA led to resource referrals and whether these referrals were useful.
To achieve a power of 80% with a 95% confidence interval, 20 people were needed in each intervention group to detect a 40% difference in the rate of contact between the 2 groups. STATA12 (College Station, TX) was used to calculate Fisher exact and chi-square values to evaluate differences between groups.
Results
For the study, 433 PCC veterans were interviewed, and 157 (36%) self-identified as a caregiver. An additional 22 referrals were included for a total of 179 caregivers. Caregiver and care recipient characteristics, caregiver burden, and resource utilization were calculated for all 179 caregivers; however, all caregivers did not answer every question. Ninety-eight percent (176) of caregivers were men; 64% (109/170) were from Salt Lake County, and 5% were from outside Utah (8). Twelve percent (21) of the 179 caregivers were providing care for > 1 person. Of 177 caregivers, 3% (5) were caring for both a veteran and a nonveteran, 69% (122) were caring for a nonveteran only, and 28% (49) were caring for another veteran only (Table 1).
The most common burden reported by caregivers was stress (63%); 70% endorsed family/friends as a resource (Table 2). Just 6% (10) of caregivers used the AAA, whereas 26% (45) received VHA support. Of the 54 veterans who were caring for a veteran, 40 reported using the VHA as a resource. Five people caring for nonveterans reported using the VHA as a resource; however, data about which resources those caregivers were accessing were not collected (Table 3).
AAA Referral and Randomization
Sixty-five percent of caregivers accepted AAA referrals. Of 109 Salt Lake County caregivers, 70% accepted referral to the AAA. There was no statistically significant difference in referral acceptance rates when comparing Salt Lake County residents with nonresidents (P = .09).The authors were unable to obtain the phone number for 1 caregiver who had accepted a referral, and 1 caregiver who accepted referral did not want a follow-up. This left 111 caregivers available for follow-up, 75 in Salt Lake County. Fifty Salt Lake County veterans were randomly assigned to the VIR group and 25 to the PIR group. The 36 caregivers who accepted referrals outside Salt Lake County also were placed in the VIR group, for a total of 86 caregivers.
Follow-up
Ninety-eight percent of caregivers were reached for follow-up. Both people lost to follow-up were in Salt Lake County (1 in each group).
In Salt Lake County, 12% (6) of the VIR group and 64% (16) of the PIR group had connected with the AAA (P < .01). Although 64% of those in the PIR group reported having been called by the AAA, the AAA representative reported all 25 had been called. The AAA records showed 9 of those called were reached by voice mail, 6 were provided information about caregiving resources, 2 formally joined the support program, 5 declined help, 1 was no longer caregiving, 1 was too busy to talk, and 1 was the wrong phone number (and was lost to follow-up as well).
Outside of Salt Lake County 19% (7) reported calling the local AAA. There was no difference in referral completion between the Salt Lake County/non-Salt Lake County VIR groups (P = .4).
Fifteen percent of all VIR caregivers reported calling the AAA. There were no statistical differences between Salt Lake County VIR and non-Salt Lake County VIR for reasons why the veteran had not called the AAA (Table 4).
Of 28 people who connected with the AAA, 16 (57%) said they had received access to a needed resource as a result of the phone call. Seven caregivers (25%) said they had not been referred to other resources as a result of the call. The VIR group was more likely to be referred to other resources after contacting the AAA than was the PIR group, although this difference did not reach significance (69% vs 47%, P = .28).
Discussion
More than one-third (36%) of veterans seen in the VASLCHCS PCC are caregivers. This prevalence is higher than that reported for the general U.S. population and higher than that reported in other veteran groups.5,17,18 Most caregivers in this project were caring for nonveterans and only had access to VHA psychosocial caregiver support programs because VHA functional caregiver support (eg, respite, homemaker services) is not available to veterans who care for nonveterans. A majority (78%) of caregiving veterans reported some caregiver burden. Despite the burden, most are not using community resources. However when offered, more than half the caregivers were interested in an AAA referral.
Although the VHA does not provide functional caregiver support resources to veterans caring for nonveterans, there are other agencies that can assist veterans: AAAs for care recipients aged ≥ 60 years and the ADRCs for younger veterans. Through AAAs, caregivers can access a variety of support services, including transportation, adult day care, caregiver support, and health promotion programs. Partnership between agencies such as the VHA and the AAAs could benefit caregiving veterans. This QI project suggests ways to strengthen interagency cooperation.
This study also suggests that a provider or clinic-initiated referral is more likely to connect veterans with information and resources than the current practice of recommending that the veteran initiate the referral. Once in contact with the AAA, most caregivers were referred to needed resources. The next step will be to establish an efficient way for clinic staff to identify caregiving veterans and make referrals to community programs. Referrals could be made by any member of the patient aligned care team (PACT) to further standardize and streamline the process.
Thirty-one percent of veterans in this project were eligible for the VHA caregiver support program because they cared for a veteran. However, 25% of these caregiving veterans were not accessing this resource. Increasing awareness of the VHA caregiver support program among veterans caring for other veterans would improve caregiver support to both caregiving and care recipient veterans.
Limitations
One limitation of this project was the intentional exclusion of the women’s clinic from the sampling process. For consistency, the authors wanted to limit the intervention to 1 PCC and so they chose the clinic that serves the majority of the veterans who receive primary care at VASLCHCS. Additionally, the literature showed that male caregivers compared with women caregivers20,21 have different characteristics in regards to caregiver burden, and a well-designed study of women caregivers already has been published.19
Also, this study did not obtain data on age, health problems, or socioeconomic status of the caregivers to avoid identifying information. Last, the authors did not ask about time spent caregiving or type of care provided. These questions may be important for future studies. Future investigations should evaluate health care use and health of caregivers vs noncaregivers in the veteran population. It also could be important to determine methods for building bridges between the VHA, AAAs, and other community services.
Conclusion
To minimize the disruption that a research study might have caused to normal clinical workflow, the primary author played the role that a medical social worker or other PACT member might play in the future. This project sheds light on how to improve outcomes for community referrals and an important future step in this research would be to develop and test a process that would integrate the PACT into the referral process.
More than one-third of veterans seen in the VASLCHCS PCC are caregivers. To the authors’ knowledge, this is the first estimate of prevalence of caregiving in veterans who receive primary care from the VHA. About 63% of caregiving veterans perceived some burden due to caregiving, and 66% accepted referral to community resources. However, only 12% who were asked to self-refer made contact with the AAA compared with 64% when a provider made the referral for them. Provider referral is more effective in connecting caregiving veterans with resources. Development of interagency partnerships should be fostered to help veterans decrease caregiving burden.
This project is one of the few studies looking at this special group of caregivers: veterans who serve as caregivers. It highlights the need for the VHA to establish policies and partnerships to improve caregiver support to this valuable group of veterans.
1. Ortman JM, Velkoff VA, Hogan H. An aging nation: the older population in the United States: population estimates and projections. http://www.census .gov/prod/2014pubs/p25-1140.pdf. Published May 2014. Accessed March 9, 2017.
2. Smith AK, Walter LC, Miao Y, Boscardin WJ, Covinsky KE. Disability during the last two years of life. JAMA Intern Med. 2013;173(16):1506-1513.
3. National Alliance for Caregiving, American Association of Retired Persons. Caregiving in the U.S. 2009 executive summary. http://assets.aarp.org/rgcenter/il/caregiving_09_es.pdf. Published November 2009. Accessed March 9, 2017.
4. Spillman BC, Wolff J, Freedman VA, Kasper JD; Office of the Assistant Secretary for Planning and Evaluation, U.S. Department of Health and Human Services. Informal caregiving for older Americans: an analysis of the 2011 national study of caregiving. https://aspe.hhs.gov/report/informal-caregiving-older-americans-analysis-2011-national-study-caregiving. Published April 1, 2014. Accessed March 9, 2017.
5. Feinberg L, Reinhard SC, Houser A, Choula R; AARP Public Policy Institute. Valuing the invaluable: 2011 update. The growing contributions and costs of family caregiving. https://assets.aarp .org/rgcenter/ppi/ltc/i51-caregiving.pdf. Published June 2011. Accessed March 9, 2017.
6. Adelman RD, Tmanova LL, Delgado D, Dion S, Lachs MS. Caregiver burden: a clinical review. JAMA. 2014;311(10):1052-1059.
7. Burton LC, Newsom JT, Schulz R, Hirsch CH, German PS. Preventive health behaviors among spousal caregivers. Prev Med. 1997;26(2):162-169.
8. Talley RC, Crews JE. Framing the public health of caregiving. Am J Public Health. 2007;97(2):224-228.
9. Hoffman GJ, Lee J, Mendez-Luck CA. Health behaviors among baby boomer informal caregivers. Gerontologist. 2012;52(2):219-230.
10. National Alliance for Caregiving. Caregivers of veterans—serving on the homefront: report of study findings. http://www.caregiving.org/data/2010 _Caregivers_of_Veterans_FULLREPORT_WEB_FINAL.pdf. Published November 2010. Accessed March 9, 2017.
11. Johannesen M, LoGuidice D. Elder abuse: a systematic review of risk factors in community dwelling elders. Age Ageing. 2013;42(3):292-298.
12. Goy E, Kansagara D, Freeman M;Department of Veterans Affairs, Health Services Research & Development Service. A systematic evidence review of interventions for non-professional caregivers of individuals with dementia. http://www.hsrd.research .va.gov/publications/esp/DementiaCaregivers-EXEC .pdf. Published October 2010. Accessed March 9, 2017.
13. Belle SH, Burgio L, Burns R, et al; Resources for Enhancing Alzheimer’s Caregiver Health (REACH) II Investigators. Enhancing the quality of life of dementia caregivers from different ethnic or racial groups: a randomized controlled trial. Ann Intern Med. 2006;145(10):727-738.
14. Nichols LO, Martindale-Adams J, Burns R, Graney MJ, Zuber J. Translation of a dementia caregiver support program in a health care system—REACH VA. Arch Intern Med. 2011;171(4):353-359.
15. Bass DM, Judge KS, Snow AL, et al. Caregiver outcomes of partners in dementia care: effect of a care coordination program for veterans with dementia and their family members and friends. J Am Geriatr Soc. 2013;61(8):1377-1386.
16. U.S. Department of Veteran Affairs. VA caregiver support: caregiver services. http://www.caregiver .va.gov/support/support_services.asp. Updated June 3, 2015. Accessed March 9, 2017.
17. Monin JK, Levy BR, Pietrzak RH. From serving in the military to serving loved ones: unique experiences of older veteran caregivers. Am J Geriatr Psychiatry. 2014;22(6):570-579.
18. Parker MW, Call VR, Dunkle R, Vaitkus M. “Out of sight” but not “out of mind”: parent contact and worry among senior ranking male officers in the military who live long distances from parents. Milit Psychol. 2002;14(4):257-277.
19. Lavela SL, Etingen B, Louise-Bender Pape T. Caregiving experiences and health conditions of women veteran and non-veteran caregivers. Womens Health Issues. 2013;23(4):e225-e232.
20. Yee JL, Schultz RS. Gender differences in psychiatric morbidity among family caregivers: a review and analysis. Gerontologist. 2000;40(2):147-164.
21. Collins CR. Men as caregivers of the elderly: support for the contributions of sons. J Multidiscip Healthc. 2014;7:525-531.
Establishing a Genetic Cancer Risk Assessment Clinic
Genetic cancers are relatively uncommon but not rare. Although there has not been a comprehensive study of the incidence of cancers that are caused by an identifiable single gene mutation, it is estimated that they account for approximately 5% to 10% of all cancers, or 50,000 to 100,000 patients annually in the U.S.1 The hallmarks of a genetic cancer syndrome are early onset, multiple family members in multiple generations with cancer, bilateral cancer, and multiple cancers in the same person.
Until recently, the VA has not had a significant interest in genetic cancer risk assessment (GCRA). This is changing, however, because veterans with identified genetic risks for cancer can benefit from targeted screening and intervention strategies to lower their risk of dying of cancer. The value of GCRA was also recognized in the 2015 standards for accreditation of the American College of Surgeons, which include a requirement for programs to include a provision for GCRA.2
The 2 most common familial cancer syndromes are hereditary breast and ovarian cancer (HBOC) syndrome, which occurs in about 5% of all patients with breast cancer, and Lynch syndrome (LS), or hereditary nonpolyposis colorectal cancer (CRC) syndrome, which occurs in about 3% of all patients with CRC.3,4 Other familial cancer syndromes are rare: For example, familial adenomatous polyposis (FAP) accounts for 0.2% to 0.5% of all CRC cases.5
The Raymond G. Murphy VAMC in Albuquerque is the sole VA hospital in New Mexico. Its catchment area extends into southern Colorado, eastern Arizona, and western Texas. About 40 CRCs and 8 breast cancers are diagnosed at this facility yearly. Given the incidence of these familial cancer syndromes, one might expect to see 1 LS case/year, 1 HBOC case every 2 years, and 1 FAP or attenuated FAP case every 5 to 10 years.
Methods
In 2010, a GCRA clinic was set up to evaluate and manage treatment of veterans who might have inherited a genetic cancer syndrome. Prior to that, veterans with suspected genetic cancer family syndromes were referred to the University of New Mexico for evaluation and testing. Initially, the pathology department (PD) paid for genetic testing. However, due to the cost of testing, a formal budget for genetic testing was approved. Contracts were set up by the PD with outside laboratories for genetic testing services. For quality control, all veterans who were referred for genetic evaluation were seen by Dr. Lin.
The initial consultation consisted of construction of a family pedigree and evaluation, using available models or tables, such as the Myriad tables (BRCA), Penn II BRCA, or PREMM1,2,6 (LS), to estimate likelihood of finding a mutation. Veterans who had a 10% likelihood of finding a gene mutation were counseled, following the American Society of Clinical Oncology guidelines (Table 1). Those who consented to genetic testing signed a consent form and were given a copy of that form and a copy of their family pedigree. Because the VA covers the cost of counseling and testing, cost was not discussed.
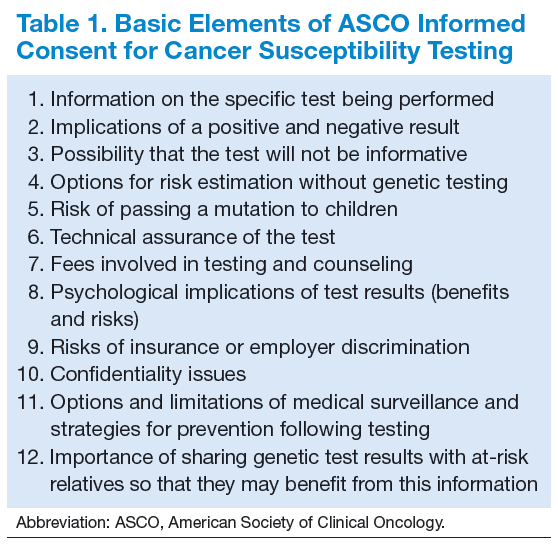
Veterans had a follow-up visit to review the test results. Patients were counseled on treatment recommendations, including a copy of current consensus recommendations, and disclosure to the family. The recommendations were then included in the patient’s electronic medical record. For example, BRCA patients had a discussion of risks and benefits of various management options, including breast magnetic resonance imaging, prophylactic mastectomy, and prophylactic bilateral salpingo-oophorectomy, once childbearing was complete.
Results
Table 2 shows the number of veterans referred to the GCRA clinic since it started in late 2010, categorized by the likely genetic syndrome, the number and percentage of veterans where genetic testing was recommended, and the results of testing. Four veterans, 2 with LS, 1 with CHEK2 mutation, and 1 with Peutz-Jeghers syndrome, were identified outside the VA system but were referred for counseling. One of the veterans with LS was referred by an outside provider who obtained a suspicious family history, and the other was identified via pathologic screening. The miscellaneous group included 1 veteran with MEN 1 and 1 veteran with Birt-Hogg-Dube.
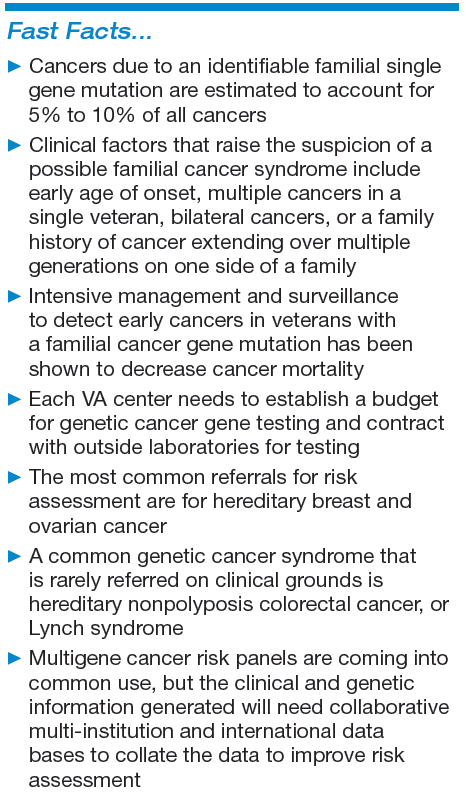
There are a number of interesting results. Although the number of patients referred for LS was low, the number of annual referrals for possible BRCA was about equal to the number of patients with breast cancer who were diagnosed and treated yearly. Although this could have been due to pent up demand initially, the number of annual referrals has not decreased with time. Furthermore, the number of patients referred for polyposis has been considerably higher than would be expected by the rarity of attenuated FAP. Initially, patients with 10 to 20 polyps of any type were referred for evaluation. All but 1 had their first polyp diagnosed after the age of 50 years. Five veterans who were referred to GCRA had < 10 polyps lifetime, 3 veterans had between 10 and 20 polyps, and 12 veterans have had ≥ 20 adenomatous polyps over their lifetime. None seen to date have had a personal or family history of gastrointestinal (GI) cancer.
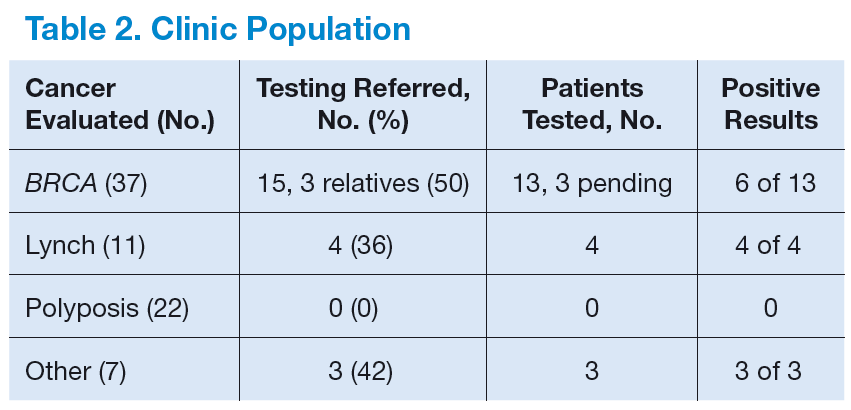
Discussion
A genetic cancer risk assessment clinic was set up in a VA hospital and has been running successfully for 4 years. Although many parts of setting up such a clinic are common to a community GCRA clinic, there are also aspects that are specific to a VA setting.6
Because genetic testing is relatively expensive, a budget must be set up and approved by VA administration. This budget is based on the estimated number of veterans that will be referred yearly, the likely percentage that will need to be tested, and the cost of testing. Currently, the average cost of a single gene test is about $2,000 to $3,000. Some patients will need to have 2 to 4 genes tested. Furthermore, many centers are now moving to multigene testing, and the cost of these panels is about $10,000 or more, though this is less than the cumulative cost of the genes done individually.
Since there is currently no national VA contract for genetic cancer testing, each VA facility needs to negotiate contracts with outside laboratories. Several of these laboratories offer gene panel testing, but the panels vary from one laboratory to another.
Limiting the number of providers who can order genetic testing helps maintain quality control and ensure a comprehensive database of patient testing. At the Albuquerque VAMC, Dr. Lin is currently the only provider who can order genetic testing for cancer risk assessment. Nearly all GCRA consultations, from obtaining a detailed family history to providing education on the risks, benefits, and limitations of genetic testing, can be conducted via telemedicine. The VA GCRA program in Utah has established a number of telemedicine collaborations with VA facilities around the country, beginning with BRCA consultations and branching out into a national LS screening program.
The first few years of the program have shown some unexpected results, including a much higher referral rate for HBOC referrals than was anticipated. The reasons for this are not clear. The high rate of polyposis referrals can be attributed in large part to the robust CRC screening program in the VA system. Veterans are routinely screened for CRC with occult blood tests, and positive results are referred for colonoscopy. Nearly 400 veterans per year have a colonoscopy at the Albuquerque VAMC.
Because the VA screening program begins at age 50 years, nearly all the veterans referred to date have had their first polyp diagnosed at age ≥ 50 years. Unfortunately, the 1 patient who had polyps and CRC at a young age was not tested due to lack of budget when she was evaluated. By contrast, in a large study, the median age of first polyp diagnosis in patients with APC mutation was 30 years, and with biallelic MUTYH mutations was 47 years.7
The difficulty in distinguishing which veterans should be tested for attenuated FAP lies in the fact that age of onset and personal or family history alone or in
combination do not seem to be adequate discriminators to screen out low-risk veterans who do not need testing.7 Considering the number of veterans referred each year and the incidence of attenuated FAP, if every veteran who fit the current criteria of 20 adenomatous polyps lifetime were tested, about 35 to 70 veterans would have to be tested to detect 1 mutation carrier. The development of clinical criteria to identify low-risk patients would be very helpful.
On the other hand, referrals for LS were uncommon. This is consistent with results reported elsewhere.8 For this reason, diagnosis of LS has shifted from clinical identification to pathologic screening for the molecular hallmarks of LS in tumor specimens.8,9 Shortly after the GCRA clinic was established, a pathologist with an interest in GI malignancies developed and validated a pathologic screening program using immunohistochemistry (IHC) staining for mismatch repair (MMR) gene expression, with the assistance of a pathologist who had been involved in a community-based LS screening program.9 For the past 3 years, all CRC patients aged ≤ 60 years have been screened for loss of expression of MMR IHC. Patients identified have been seen in the GCRA clinic to discuss possible genetic testing. This screening program is now extending to all patients with CRC aged ≤ 70 years, in line with consensus recommendations.10
The Future
The lack of a national VA contract with outside laboratories for genetic testing means that each facility has to negotiate its own contract, which is a wasteful duplication of resources that needs to be addressed. Beyond this parochial concern, GCRA is undergoing a revolution in diagnosing and managing cancer risk. In the past, a careful family history was followed by selected single gene testing for mutations, using Sanger sequencing. However, many laboratories are now offering multigene testing using next-generation sequencing that can look at multiple genes, all the way up to whole genome sequencing. Current estimates for the actual cost to the laboratory for a whole genome using next-generation sequencing is about $1,000.
A number of laboratories also have been offering multigene panels for testing in patients with familial cancer syndromes. The genes in these panels include those with a well-documented association with known cancer syndromes as well as other genes where mutations may confer only a modestly increased risk. Furthermore, new genetic syndromes and new genes associated with known syndromes are being reported yearly.
This revolution in technology and the virtual explosion in the amount of data generated have raised as many questions as answers.11 One joke in the genetic testing community goes: “$1,000 genome, $100,000 interpretation.” Among the remaining issues are how to counsel patients about the possible results from multigene testing, including the possibility of results that may be applicable to noncancer-related diagnoses; what to do about the unanticipated actionable finding (incidentaloma); how to interpret and treat a patient whose gene test results are at odds with the clinical family history; how to treat patients whose panel returns with a mutation in a gene that has only a minor increased risk for the cancers; how genes with modestly increased or decreased risk singly or in combination may modify highrisk gene expression; and how to address variants of unknown significance.
A general consensus has emerged that these questions will need much more research correlating genetic and clinical data to answer. As a result, many leading researchers have set up multi-institutional, international collaborative groups directed at specific syndromes, which pool data from many investigators to answer questions beyond the capability of any single investigator or group. These big data collaborative studies are already beginning to publish early results and seem to represent the future of genetic cancer risk assessment, a field that is at once dynamic, exciting, and confusing.4
A major question is whether and how the VA can cooperate with these international consortia. The VA has particular concerns about confidentiality based on past experience, but it also has a unique group of patients who could provide valuable contributions to our knowledge about genetic markers for disease, including cancer. A method for the VA system to provide data to collaborative groups who are advancing our knowledge of the genetic risk factors for cancer while protecting the confidentiality of veterans could provide a model for collaboration between the VA and non-VA health care systems.
Author disclosures
The author reports no actual or potential conflicts of interest with regard to this article.
Disclaimer
The opinions expressed herein are those of the author and do not necessarily reflect those of Federal Practitioner, Frontline Medical Communications Inc., the U.S. Government, or any of its agencies. This article may discuss unlabeled or investigational use of certain drugs. Please review the complete prescribing information for specific drugs or drug combinations—including indications, contraindications, warnings, and adverse effects—before administering pharmacologic therapy to patients.
Click here to read the digital edition.
1. Claus EB, Schildkraut JM, Thompson WD, Risch NJ. The genetic attributable risk of breast and ovarian cancer. Cancer. 1996;77(11):2318-2324.
2. American College of Surgeons. Cancer Program Standards 2012: Ensuring Patient- Centered Care, v1.2.1. Chicago, IL: American College of Surgeons; 2012. https://www.facs.org/~/media/files/quality%20programs/cancer/coc/programstandards2012.ashx. Accessed July 6, 2015.
3. Campeau PM, Foulkes WD, Tischkowitz MD. Hereditary breast cancer: new genetic developments, new therapeutic avenues. Hum Genet. 2008;124(1):31-34.
4. Moreira L, Balaguer F, Lindor N, et al; EPICOLON Consortium. Identification of Lynch syndrome among patients with colorectal cancer. JAMA. 2012;308(15):1555-1565.
5. Bülow S, Faurschou Nielsen T, Bülow C, Bisgaard ML, Karlsen L, Moesgaard F. The incidence rate of familial adenomatous polyposis. Results from the Danish Polyposis Register. Int J Colorect Dis. 1996;11(2):88-91.
6. Duncan PR, Lin JT. Ingredients for success: a familial cancer clinic in an oncology
practice setting. J Oncol Pract. 2011;7(1):39-42.
7. Grover S, Kastrinos F, Steyerberg EW, et al. Prevalence and phenotypes of APC and MUTYH mutations in patients with multiple colorectal adenomas. JAMA. 2012;308(5):485-492.
8. Hampel H, de la Chapelle A. How do we approach the goal of identifying everybody with Lynch syndrome? Fam Cancer. 2013;12(2):313-317.
9. Duncan PR, Lin JT, Feddersen R. Prospective screening for Lynch syndrome (LS) in a cohort of colorectal cancer (CRC) surgical patients in a community hospital. J Clin Oncol. 2010;28(suppl; abstr 1535):15s.
10. Giardiello FM, Allen JI, Axilbund JE, et al. Guidelines on genetic evaluation and management of Lynch syndrome: a consensus statement by the US Multi-Society Task Force on Colorectal Cancer. Dis Colon Rectum. 2014;57(8):1025-1048.
11. Domchek SM, Bradbury A, Garber JE, Offit K, Robson ME. Multiplex genetic testing for cancer susceptibility: out on a high wire without a net? J Clin Oncol. 2013;31(10):1267-1270.
Genetic cancers are relatively uncommon but not rare. Although there has not been a comprehensive study of the incidence of cancers that are caused by an identifiable single gene mutation, it is estimated that they account for approximately 5% to 10% of all cancers, or 50,000 to 100,000 patients annually in the U.S.1 The hallmarks of a genetic cancer syndrome are early onset, multiple family members in multiple generations with cancer, bilateral cancer, and multiple cancers in the same person.
Until recently, the VA has not had a significant interest in genetic cancer risk assessment (GCRA). This is changing, however, because veterans with identified genetic risks for cancer can benefit from targeted screening and intervention strategies to lower their risk of dying of cancer. The value of GCRA was also recognized in the 2015 standards for accreditation of the American College of Surgeons, which include a requirement for programs to include a provision for GCRA.2
The 2 most common familial cancer syndromes are hereditary breast and ovarian cancer (HBOC) syndrome, which occurs in about 5% of all patients with breast cancer, and Lynch syndrome (LS), or hereditary nonpolyposis colorectal cancer (CRC) syndrome, which occurs in about 3% of all patients with CRC.3,4 Other familial cancer syndromes are rare: For example, familial adenomatous polyposis (FAP) accounts for 0.2% to 0.5% of all CRC cases.5
The Raymond G. Murphy VAMC in Albuquerque is the sole VA hospital in New Mexico. Its catchment area extends into southern Colorado, eastern Arizona, and western Texas. About 40 CRCs and 8 breast cancers are diagnosed at this facility yearly. Given the incidence of these familial cancer syndromes, one might expect to see 1 LS case/year, 1 HBOC case every 2 years, and 1 FAP or attenuated FAP case every 5 to 10 years.
Methods
In 2010, a GCRA clinic was set up to evaluate and manage treatment of veterans who might have inherited a genetic cancer syndrome. Prior to that, veterans with suspected genetic cancer family syndromes were referred to the University of New Mexico for evaluation and testing. Initially, the pathology department (PD) paid for genetic testing. However, due to the cost of testing, a formal budget for genetic testing was approved. Contracts were set up by the PD with outside laboratories for genetic testing services. For quality control, all veterans who were referred for genetic evaluation were seen by Dr. Lin.
The initial consultation consisted of construction of a family pedigree and evaluation, using available models or tables, such as the Myriad tables (BRCA), Penn II BRCA, or PREMM1,2,6 (LS), to estimate likelihood of finding a mutation. Veterans who had a 10% likelihood of finding a gene mutation were counseled, following the American Society of Clinical Oncology guidelines (Table 1). Those who consented to genetic testing signed a consent form and were given a copy of that form and a copy of their family pedigree. Because the VA covers the cost of counseling and testing, cost was not discussed.
Veterans had a follow-up visit to review the test results. Patients were counseled on treatment recommendations, including a copy of current consensus recommendations, and disclosure to the family. The recommendations were then included in the patient’s electronic medical record. For example, BRCA patients had a discussion of risks and benefits of various management options, including breast magnetic resonance imaging, prophylactic mastectomy, and prophylactic bilateral salpingo-oophorectomy, once childbearing was complete.
Results
Table 2 shows the number of veterans referred to the GCRA clinic since it started in late 2010, categorized by the likely genetic syndrome, the number and percentage of veterans where genetic testing was recommended, and the results of testing. Four veterans, 2 with LS, 1 with CHEK2 mutation, and 1 with Peutz-Jeghers syndrome, were identified outside the VA system but were referred for counseling. One of the veterans with LS was referred by an outside provider who obtained a suspicious family history, and the other was identified via pathologic screening. The miscellaneous group included 1 veteran with MEN 1 and 1 veteran with Birt-Hogg-Dube.
There are a number of interesting results. Although the number of patients referred for LS was low, the number of annual referrals for possible BRCA was about equal to the number of patients with breast cancer who were diagnosed and treated yearly. Although this could have been due to pent up demand initially, the number of annual referrals has not decreased with time. Furthermore, the number of patients referred for polyposis has been considerably higher than would be expected by the rarity of attenuated FAP. Initially, patients with 10 to 20 polyps of any type were referred for evaluation. All but 1 had their first polyp diagnosed after the age of 50 years. Five veterans who were referred to GCRA had < 10 polyps lifetime, 3 veterans had between 10 and 20 polyps, and 12 veterans have had ≥ 20 adenomatous polyps over their lifetime. None seen to date have had a personal or family history of gastrointestinal (GI) cancer.
Discussion
A genetic cancer risk assessment clinic was set up in a VA hospital and has been running successfully for 4 years. Although many parts of setting up such a clinic are common to a community GCRA clinic, there are also aspects that are specific to a VA setting.6
Because genetic testing is relatively expensive, a budget must be set up and approved by VA administration. This budget is based on the estimated number of veterans that will be referred yearly, the likely percentage that will need to be tested, and the cost of testing. Currently, the average cost of a single gene test is about $2,000 to $3,000. Some patients will need to have 2 to 4 genes tested. Furthermore, many centers are now moving to multigene testing, and the cost of these panels is about $10,000 or more, though this is less than the cumulative cost of the genes done individually.
Since there is currently no national VA contract for genetic cancer testing, each VA facility needs to negotiate contracts with outside laboratories. Several of these laboratories offer gene panel testing, but the panels vary from one laboratory to another.
Limiting the number of providers who can order genetic testing helps maintain quality control and ensure a comprehensive database of patient testing. At the Albuquerque VAMC, Dr. Lin is currently the only provider who can order genetic testing for cancer risk assessment. Nearly all GCRA consultations, from obtaining a detailed family history to providing education on the risks, benefits, and limitations of genetic testing, can be conducted via telemedicine. The VA GCRA program in Utah has established a number of telemedicine collaborations with VA facilities around the country, beginning with BRCA consultations and branching out into a national LS screening program.
The first few years of the program have shown some unexpected results, including a much higher referral rate for HBOC referrals than was anticipated. The reasons for this are not clear. The high rate of polyposis referrals can be attributed in large part to the robust CRC screening program in the VA system. Veterans are routinely screened for CRC with occult blood tests, and positive results are referred for colonoscopy. Nearly 400 veterans per year have a colonoscopy at the Albuquerque VAMC.
Because the VA screening program begins at age 50 years, nearly all the veterans referred to date have had their first polyp diagnosed at age ≥ 50 years. Unfortunately, the 1 patient who had polyps and CRC at a young age was not tested due to lack of budget when she was evaluated. By contrast, in a large study, the median age of first polyp diagnosis in patients with APC mutation was 30 years, and with biallelic MUTYH mutations was 47 years.7
The difficulty in distinguishing which veterans should be tested for attenuated FAP lies in the fact that age of onset and personal or family history alone or in
combination do not seem to be adequate discriminators to screen out low-risk veterans who do not need testing.7 Considering the number of veterans referred each year and the incidence of attenuated FAP, if every veteran who fit the current criteria of 20 adenomatous polyps lifetime were tested, about 35 to 70 veterans would have to be tested to detect 1 mutation carrier. The development of clinical criteria to identify low-risk patients would be very helpful.
On the other hand, referrals for LS were uncommon. This is consistent with results reported elsewhere.8 For this reason, diagnosis of LS has shifted from clinical identification to pathologic screening for the molecular hallmarks of LS in tumor specimens.8,9 Shortly after the GCRA clinic was established, a pathologist with an interest in GI malignancies developed and validated a pathologic screening program using immunohistochemistry (IHC) staining for mismatch repair (MMR) gene expression, with the assistance of a pathologist who had been involved in a community-based LS screening program.9 For the past 3 years, all CRC patients aged ≤ 60 years have been screened for loss of expression of MMR IHC. Patients identified have been seen in the GCRA clinic to discuss possible genetic testing. This screening program is now extending to all patients with CRC aged ≤ 70 years, in line with consensus recommendations.10
The Future
The lack of a national VA contract with outside laboratories for genetic testing means that each facility has to negotiate its own contract, which is a wasteful duplication of resources that needs to be addressed. Beyond this parochial concern, GCRA is undergoing a revolution in diagnosing and managing cancer risk. In the past, a careful family history was followed by selected single gene testing for mutations, using Sanger sequencing. However, many laboratories are now offering multigene testing using next-generation sequencing that can look at multiple genes, all the way up to whole genome sequencing. Current estimates for the actual cost to the laboratory for a whole genome using next-generation sequencing is about $1,000.
A number of laboratories also have been offering multigene panels for testing in patients with familial cancer syndromes. The genes in these panels include those with a well-documented association with known cancer syndromes as well as other genes where mutations may confer only a modestly increased risk. Furthermore, new genetic syndromes and new genes associated with known syndromes are being reported yearly.
This revolution in technology and the virtual explosion in the amount of data generated have raised as many questions as answers.11 One joke in the genetic testing community goes: “$1,000 genome, $100,000 interpretation.” Among the remaining issues are how to counsel patients about the possible results from multigene testing, including the possibility of results that may be applicable to noncancer-related diagnoses; what to do about the unanticipated actionable finding (incidentaloma); how to interpret and treat a patient whose gene test results are at odds with the clinical family history; how to treat patients whose panel returns with a mutation in a gene that has only a minor increased risk for the cancers; how genes with modestly increased or decreased risk singly or in combination may modify highrisk gene expression; and how to address variants of unknown significance.
A general consensus has emerged that these questions will need much more research correlating genetic and clinical data to answer. As a result, many leading researchers have set up multi-institutional, international collaborative groups directed at specific syndromes, which pool data from many investigators to answer questions beyond the capability of any single investigator or group. These big data collaborative studies are already beginning to publish early results and seem to represent the future of genetic cancer risk assessment, a field that is at once dynamic, exciting, and confusing.4
A major question is whether and how the VA can cooperate with these international consortia. The VA has particular concerns about confidentiality based on past experience, but it also has a unique group of patients who could provide valuable contributions to our knowledge about genetic markers for disease, including cancer. A method for the VA system to provide data to collaborative groups who are advancing our knowledge of the genetic risk factors for cancer while protecting the confidentiality of veterans could provide a model for collaboration between the VA and non-VA health care systems.
Author disclosures
The author reports no actual or potential conflicts of interest with regard to this article.
Disclaimer
The opinions expressed herein are those of the author and do not necessarily reflect those of Federal Practitioner, Frontline Medical Communications Inc., the U.S. Government, or any of its agencies. This article may discuss unlabeled or investigational use of certain drugs. Please review the complete prescribing information for specific drugs or drug combinations—including indications, contraindications, warnings, and adverse effects—before administering pharmacologic therapy to patients.
Click here to read the digital edition.
1. Claus EB, Schildkraut JM, Thompson WD, Risch NJ. The genetic attributable risk of breast and ovarian cancer. Cancer. 1996;77(11):2318-2324.
2. American College of Surgeons. Cancer Program Standards 2012: Ensuring Patient- Centered Care, v1.2.1. Chicago, IL: American College of Surgeons; 2012. https://www.facs.org/~/media/files/quality%20programs/cancer/coc/programstandards2012.ashx. Accessed July 6, 2015.
3. Campeau PM, Foulkes WD, Tischkowitz MD. Hereditary breast cancer: new genetic developments, new therapeutic avenues. Hum Genet. 2008;124(1):31-34.
4. Moreira L, Balaguer F, Lindor N, et al; EPICOLON Consortium. Identification of Lynch syndrome among patients with colorectal cancer. JAMA. 2012;308(15):1555-1565.
5. Bülow S, Faurschou Nielsen T, Bülow C, Bisgaard ML, Karlsen L, Moesgaard F. The incidence rate of familial adenomatous polyposis. Results from the Danish Polyposis Register. Int J Colorect Dis. 1996;11(2):88-91.
6. Duncan PR, Lin JT. Ingredients for success: a familial cancer clinic in an oncology
practice setting. J Oncol Pract. 2011;7(1):39-42.
7. Grover S, Kastrinos F, Steyerberg EW, et al. Prevalence and phenotypes of APC and MUTYH mutations in patients with multiple colorectal adenomas. JAMA. 2012;308(5):485-492.
8. Hampel H, de la Chapelle A. How do we approach the goal of identifying everybody with Lynch syndrome? Fam Cancer. 2013;12(2):313-317.
9. Duncan PR, Lin JT, Feddersen R. Prospective screening for Lynch syndrome (LS) in a cohort of colorectal cancer (CRC) surgical patients in a community hospital. J Clin Oncol. 2010;28(suppl; abstr 1535):15s.
10. Giardiello FM, Allen JI, Axilbund JE, et al. Guidelines on genetic evaluation and management of Lynch syndrome: a consensus statement by the US Multi-Society Task Force on Colorectal Cancer. Dis Colon Rectum. 2014;57(8):1025-1048.
11. Domchek SM, Bradbury A, Garber JE, Offit K, Robson ME. Multiplex genetic testing for cancer susceptibility: out on a high wire without a net? J Clin Oncol. 2013;31(10):1267-1270.
Write for Us, Right for You
In many parts of the country, spring is finally emerging from the long, hard, cold winter. In almost every culture, spring is associated with rebirth, the return of longer daylight hours, growth, and new life. Like seeds planted in the fall, many of the ideas we at Federal Practitioner sowed in 2016 are now blossoming—our new Historic Profiles and Mental Health Care Practice columns, among others. Just as many of us are engaging in spring cleaning in our homes and yards and opening windows to let in the warmth and the breezes, we at the journal are making room for inspiration and illumination—yours.
Our internal reorganization has enabled us to focus on what we enjoy most—publishing your work. We invite each of you to consider submitting a manuscript and encouraging your colleagues to do so. Almost every health care professional at some time in his or her career has thought of a study to write, read an article they wished they had written, or reviewed a topic they thought suitable for publication. Well, it is time to dust off those ideas and pull them out of the drawer or computer file, just like getting out the warm weather clothing.
In order to reflect the positive trend in federal health care toward multi- and interdisciplinary teams and practice, we welcome submissions from all our clinical constituents, including physicians, surgeons, chaplains, nurses, clinical pharmacists, advanced practice nurses, psychologists, physician assistants, administrators, allied health professionals, and any and all that my old brain cannot recall.
There is nothing like the feeling of seeing your work published in print or on the Internet for the first time in an esteemed journal. If you are a teacher or mentor, think about the gift of inviting a trainee or junior colleague to coauthor an article. This collaboration can be a wonderful shared creative endeavor for educators and their students.
If you have a good idea but are concerned that your writing may be too rough, we invite you to take a leap of faith. Although as a peer-reviewed journal we cannot guarantee acceptance of any manuscript, we can assure you that our editorial staff has smoothed more than a few bumps in our authors’ literary endeavors.
Federal Practitioner is a peer-reviewed journal that has a wide audience among federal health care professionals in the DoD, VA, and PHS. We at the journal are working to become indexed in PubMed, which will provide potential authors with an even wider and more prestigious exposure for their work. We invite you to visit our website and review this print journal to get an idea—if you don’t already have one—of the types of articles we publish. To jump-start your motivation, here is a brief description of the many types of articles we accept.
Feature Articles
Feature articles may be original research or comprehensive summaries of a clinically related topic. The possibilities are as endless as federal practice and could cover medications, other types of interventions (including psychosocial treatments), and reviews of diagnoses.
Original Research
We welcome empirical studies of completed research both biomedical and biobehavioral. More experienced and senior researchers might consider that publication in Federal Practitioner potentially can demonstrate their commitment to conducting research that benefits the members of the armed forces, public services, and veterans, to government funding agencies, increasingly a requirement for grants from those institutions. And for junior or new researchers, we offer a new option to publish pilot studies for research that is just getting launched or is on a smaller scale.
Case Reports
What health care professional has not had a case so memorable that he or she cannot forget it, or a patient encounter that made a lasting impression, or one in which they gained valuable medical knowledge or human wisdom? Ever thought of writing it up for your peers to learn from as well? Submit a case to Federal Practitioner and share your clinical pearls with your colleagues. The authoring process also gives you a chance to review the latest clinical literature on a diagnosis or treatment you wanted to know more about.
Program Profiles
This section of the journal reflects the unparalleled scope and resources of federal health care. Whether it is a national initiative or a local experiment, we want to know and let others read about the beneficial work that you are doing to care for service members, veterans, and the public. Submissions can be of innovative clinical or research projects or programs.
Guest Editorials
While usually members of the Editorial Advisory Association author guest editorials, we are pleased to consider high-quality, thought provoking editorials on themes of health care policy, organization, care delivery, ethics, and professionalism, among others.
Most of us have made the painful adjustment to daylight savings time. Use those extra hours of daylight to stimulate your creative brain. If writing a manuscript does not fit in to your busy schedule right now, think about becoming a peer reviewer or even a member of the Editorial Advisory Association. And last but not least, we are a friendly and open editorial team that is willing to entertain an imaginative suggestion for a manuscript that is novel and vital just like spring.
The Federal Practitioner submission guidelines, accessed at http://www.fedprac.com, include the journal’s style and format. If you need more information or have questions about submitting a manuscript to the journal, e-mail me at [email protected], Editor Reid Paul at [email protected],or Managing Editor Joyce Brody at [email protected].

Cardiogenic shock: From ECMO to Impella and beyond
A 43-year-old man presented to a community hospital with acute chest pain and shortness of breath and was diagnosed with anterior ST-elevation myocardial infarction. He was a smoker with a history of alcohol abuse, hypertension, and hyperlipidemia, and in the past he had undergone percutaneous coronary interventions to the right coronary artery and the first obtuse marginal artery.
Angiography showed total occlusion in the left anterior descending artery, 90% stenosis in the right coronary artery, and mild disease in the left circumflex artery. A drug-eluting stent was placed in the left anterior descending artery, resulting in good blood flow.
However, his left ventricle continued to have severe dysfunction. An intra-aortic balloon pump was inserted. Afterward, computed tomography showed subsegmental pulmonary embolism with congestion. His mean arterial pressure was 60 mm Hg (normal 70–110), central venous pressure 12 mm Hg (3–8), pulmonary artery pressure 38/26 mm Hg (15–30/4–12), pulmonary capillary wedge pressure 24 mm Hg (2–15), and cardiac index 1.4 L/min (2.5–4).
The patient was started on dobutamine and norepinephrine and transferred to Cleveland Clinic on day 2. Over the next day, he had runs of ventricular tachycardia, for which he was given amiodarone and lidocaine. His urine output was low, and his serum creatinine was elevated at 1.65 mg/dL (baseline 1.2, normal 0.5–1.5). Liver function tests were also elevated, with aspartate aminotransferase at 115 U/L(14–40) and alanine aminotransferase at 187 U/L (10–54).
Poor oxygenation was evident: his arterial partial pressure of oxygen was 64 mm Hg (normal 75–100). He was intubated and given 100% oxygen with positive end-expiratory pressure of 12 cm H2O.
Echocardiography showed a left ventricular ejection fraction of 15% (normal 55%–70%) and mild right ventricular dysfunction.
ECMO and then Impella placement
On his third hospital day, a venoarterial extracorporeal membrane oxygenation (ECMO) device was placed peripherally (Figure 1).
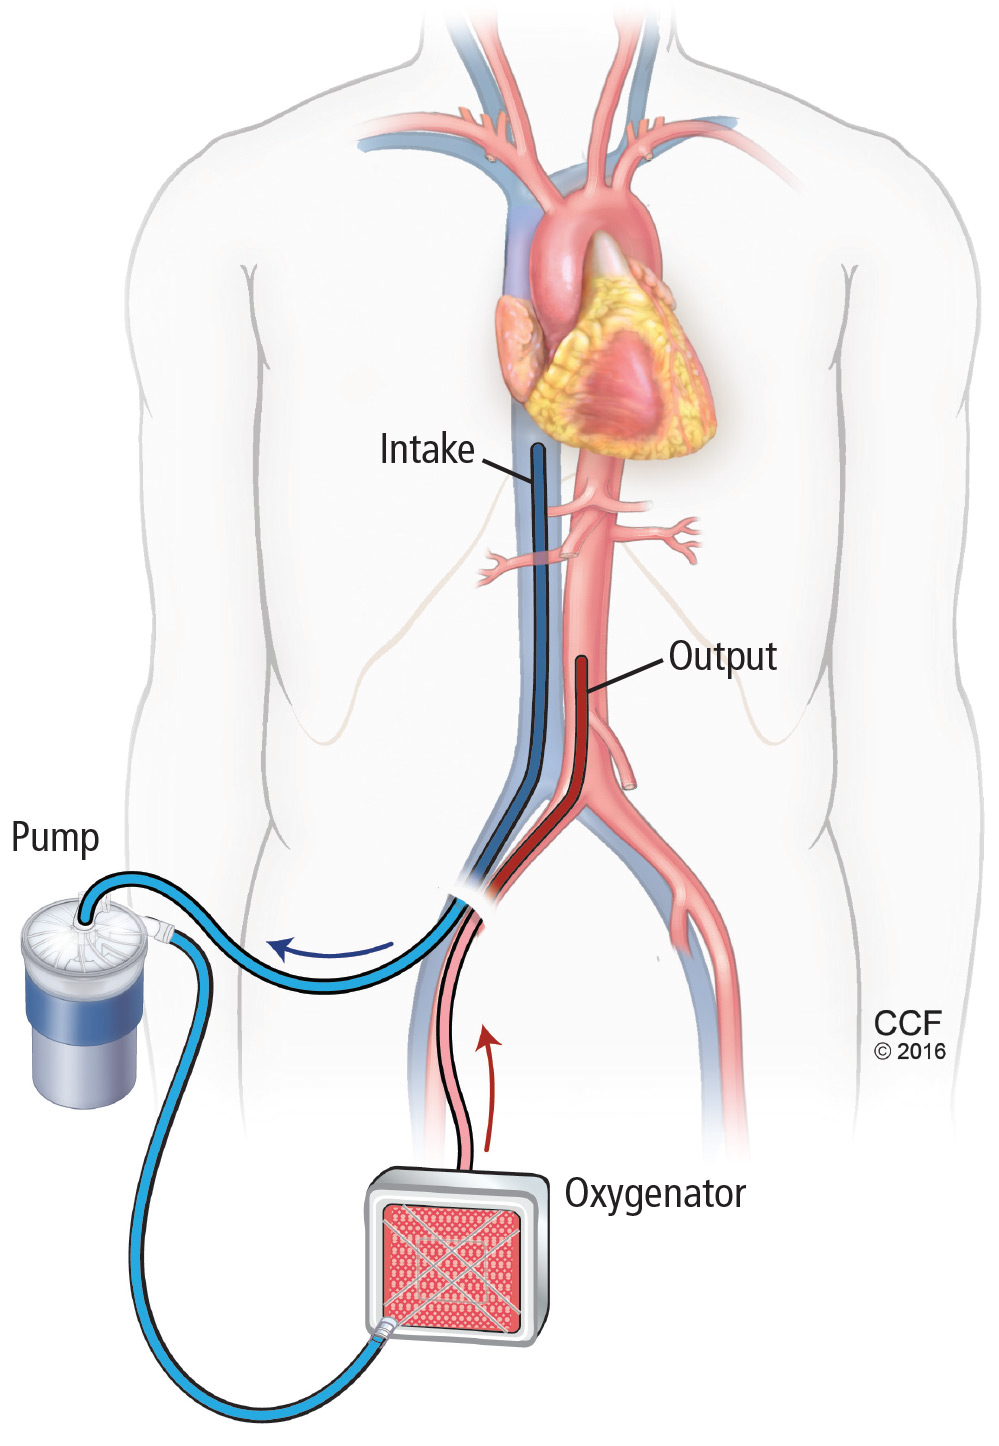
His hemodynamic variables stabilized, and he was weaned off dobutamine and norepinephrine. Results of liver function tests normalized, his urinary output increased, and his serum creatinine dropped to a normal 1.0 mg/dL. However, a chest radiograph showed pulmonary congestion, and echocardiography now showed severe left ventricular dysfunction.
On hospital day 5, the patient underwent surgical placement of an Impella 5.0 device (Abiomed, Danvers, MA) through the right axillary artery in an effort to improve his pulmonary edema. The ECMO device was removed. Placement of a venovenous ECMO device was deemed unnecessary when oxygenation improved with the Impella.
Three days after Impella placement, radiography showed improved edema with some remaining pleural effusion.
ACUTE CARDIOGENIC SHOCK
Cardiogenic shock remains a challenging clinical problem: patients with it are among the sickest in the hospital, and many of them die. ECMO was once the only therapy available and is still widely used. However, it is a 2-edged sword; complications such as bleeding, infection, and thrombosis are almost inevitable if it is used for long. Importantly, patients are usually kept intubated and bedridden.
In recent years, new devices have become available that are easier to place (some in the catheterization laboratory or even at the bedside) and allow safer bridging to recovery, transplant, or other therapies.
This case illustrates the natural history of cardiogenic shock and the preferred clinical approach: ie, ongoing evaluation that permits rapid response to evolving challenges.
In general, acute cardiogenic shock occurs within 24 to 48 hours after the initial insult, so even if a procedure succeeds, the patient may develop progressive hypotension and organ dysfunction. Reduced cardiac output causes a downward spiral with multiple systemic and inflammatory processes as well as increased nitric oxide synthesis, leading to progressive decline and eventual end-organ dysfunction.
Continuously evaluate
The cardiac team should continuously assess the acuity and severity of a patient’s condition, with the goals of maintaining end-organ perfusion and identifying the source of problems. Refractory cardiogenic shock, with tissue hypoperfusion despite vasoactive medications and treatment of the underlying cause, is associated with in-hospital mortality rates ranging from 30% to 50%.1,2 The rates have actually increased over the past decade, as sicker patients are being treated.
When a patient presents with cardiogenic shock, we first try a series of vasoactive drugs and usually an intra-aortic balloon pump (Figure 2). We then tailor treatment depending on etiology. For example, a patient may have viral myocarditis and may even require a biopsy.
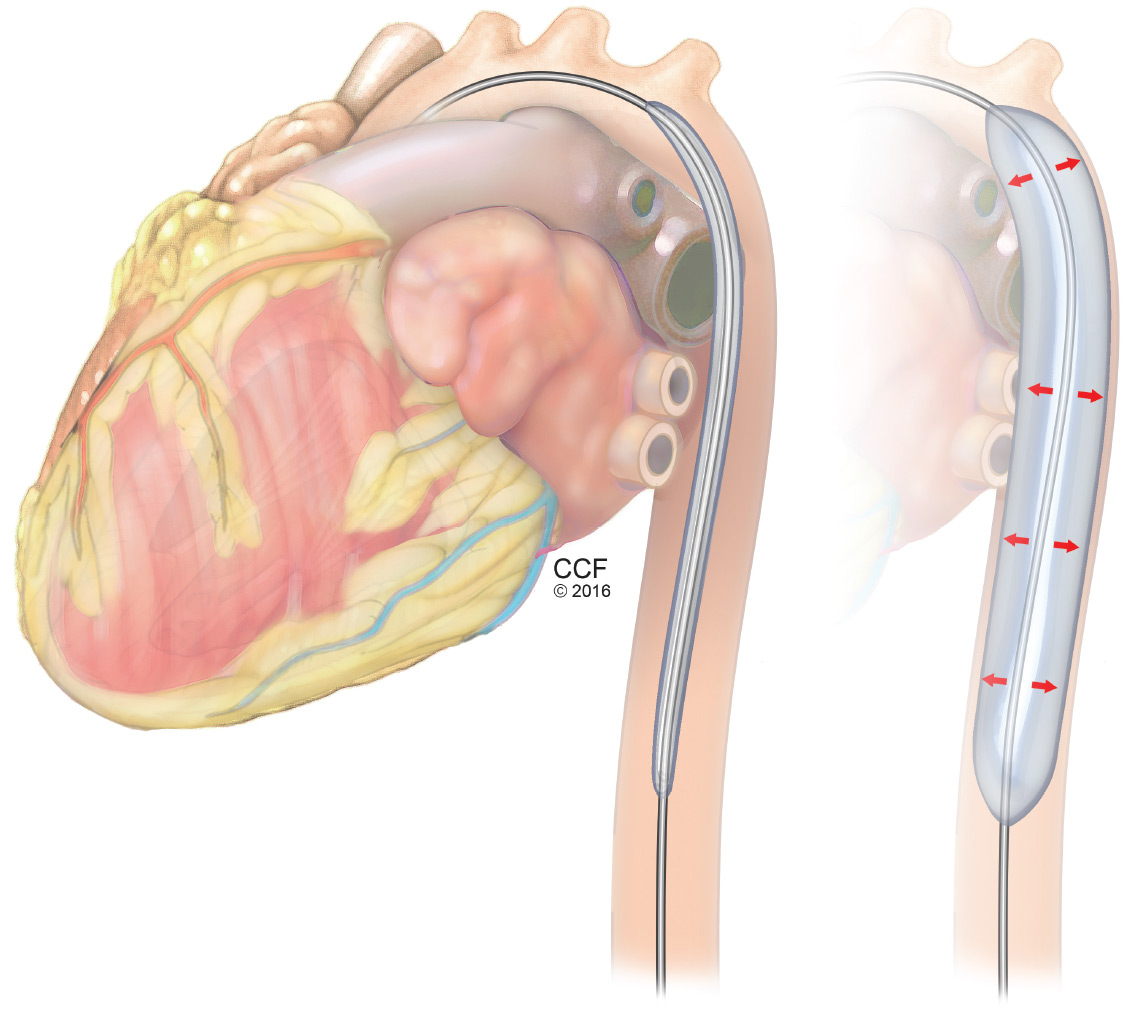
If cardiogenic shock is refractory, mechanical circulatory support devices can be a short-term bridge to either recovery or a new decision. A multidisciplinary team should be consulted to consider transplant, a long-term device, or palliative care. Sometimes a case requires “bridging to a bridge,” with several devices used short-term in turn.
Prognostic factors in cardiogenic shock
Several tools help predict outcome in a severely ill patient. End-organ function, indicated by blood lactate levels and estimated glomerular filtration rate, is perhaps the most informative and should be monitored serially.
CardShock3 is a simple scoring system based on age, mental status at presentation, laboratory values, and medical history. Patients receive 1 point for each of the following factors:
- Age > 75
- Confusion at presentation
- Previous myocardial infarction or coronary artery bypass grafting
- Acute coronary syndrome etiology
- Left ventricular ejection fraction < 40%
- Blood lactate level between 2 and 4 mmol/L, inclusively (2 points for lactate levels > 4 mmol/L)
- Estimated glomerular filtration rate between 30 and 60 mL/min/1.73 m2, inclusively (2 points if < 30 mL/min/1.73 m2).
Thus, scores range from 0 (best) to 9 (worst). A score of 0 to 3 points was associated with a 9% risk of death in the hospital, a score of 4 or 5 with a risk of 36%, and a score of 6 through 9 with a risk of 77%.3
The Survival After Veno-arterial ECMO (SAVE) score (www.save-score.com) is a prediction tool derived from a large international ECMO registry.4 It is based on patient age, diagnosis, and indicators of end-organ dysfunction. Scores range from –35 (worst) to +7 (best).
The mortality rate associated with postcardiotomy cardiogenic shock increases with the amount of inotropic support provided. In a 1996–1999 case series of patients who underwent open-heart surgery,5 the hospital mortality rate was 40% in those who received 2 inotropes in high doses and 80% in those who received 3. A strategy of early implementation of mechanical support is critical.
Selection criteria for destination therapy
Deciding whether a patient should receive a long-term device is frequently a challenge. The decision often must be based on limited information about not only the medical indications but also psychosocial factors that influence long-term success.
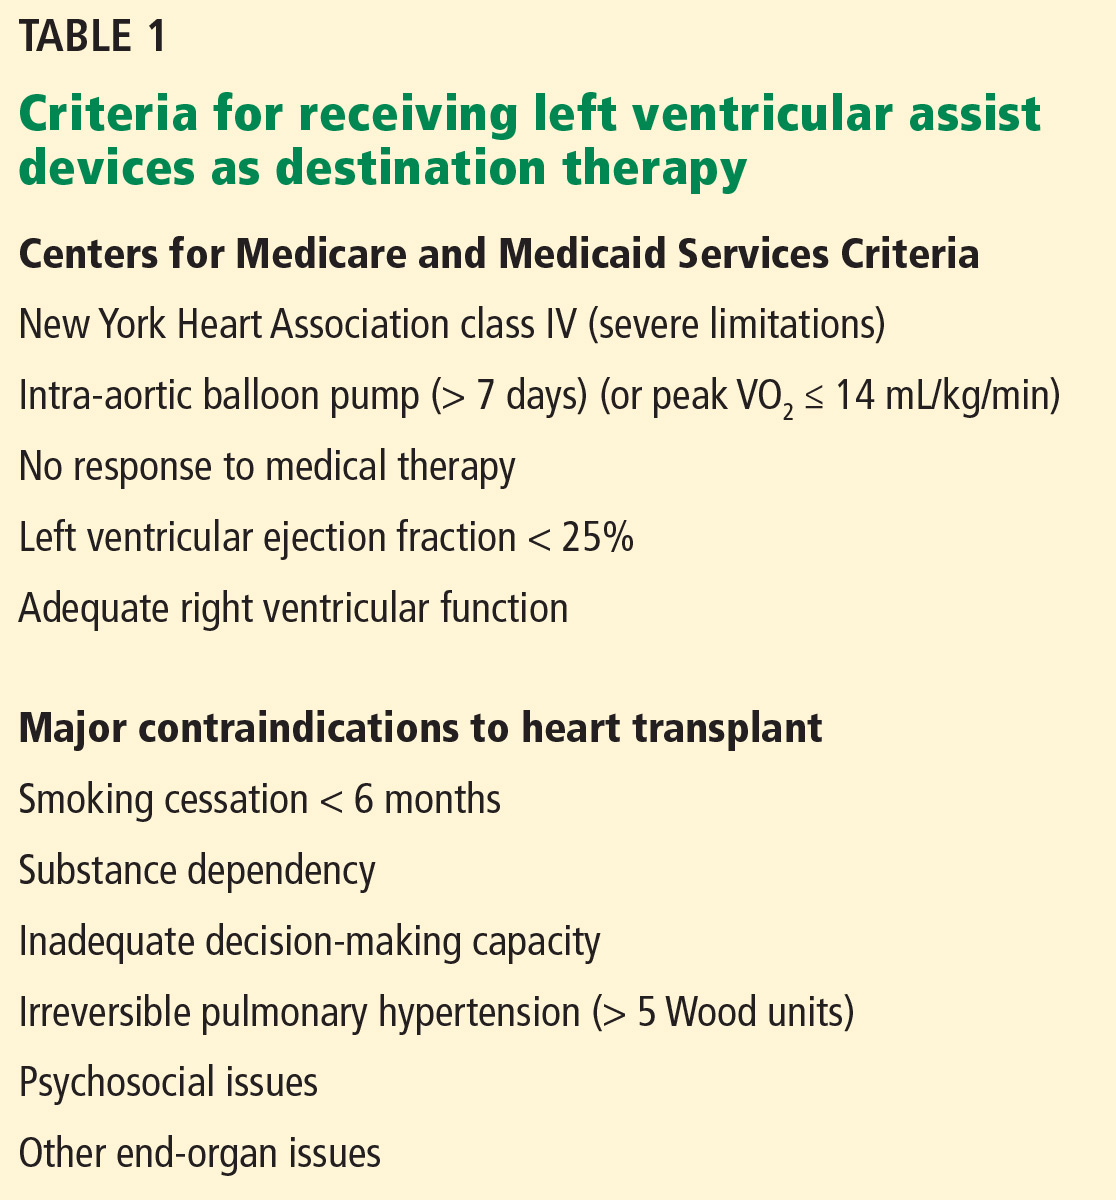
The Centers for Medicare and Medicaid Services have established criteria for candidates for left ventricular assist devices (LVADs) as destination therapy.6 Contraindications established for heart transplant should also be considered (Table 1).
CASE REVISITED
Several factors argued against LVAD placement in our patient. He had no health insurance and had been off medications. He smoked and said he consumed 3 hard liquor drinks per week. His Stanford Integrated Psychosocial Assessment for Transplantation score was 30 (minimally acceptable). He had hypoxia with subsegmental pulmonary edema, a strong contraindication to immediate transplant.
On the other hand, he had only mild right ventricular dysfunction. His CardShock score was 4 (intermediate risk, based on lactate 1.5 mmol/L and estimated glomerular filtration rate 52 mL/min/1.73 m2). His SAVE score was –9 (class IV), which overall is associated with a 30% risk of death (low enough to consider treatment).
During the patient’s time on temporary support, the team had the opportunity to better understand him and assess his family support and his ability to handle a permanent device. His surviving the acute course bolstered the team’s confidence that he could enjoy long-term survival with destination therapy.
CATHETERIZATION LABORATORY DEVICE CAPABILITIES
Although most implantation procedures are done in the operating room, they are often done in the catheterization laboratory because patients undergoing catheterization may not be stable enough for transfer, or an emergency intervention may be required during the night. Catheterization interventionists are also an important part of the team to help determine the best approach for long-term therapy.
The catheterization laboratory has multiple acute intervention options. Usually, decisions must be made quickly. In general, patients needing mechanical support are managed as follows:
- Those who need circulation support and oxygenation receive ECMO
- Those who need circulation support alone because of mechanical issues (eg, myocardial infarction) are considered for an intra-aortic balloon pump, Impella, or TandemHeart pump (Cardiac Assist, Pittsburgh, PA).
Factors that guide the selection of a temporary pump include:
- Left ventricular function
- Right ventricular function
- Aortic valve stenosis (some devices cannot be inserted through critical aortic stenosis)
- Aortic regurgitation (can affect some devices)
- Peripheral artery disease (some devices are large and must be placed percutaneously).
CHOOSING AMONG PERCUTANEOUS DEVICES
Circulatory support in cardiogenic shock improves outcomes, and devices play an important role in supporting high-risk procedures. The goal is not necessarily to use the device throughout the hospital stay. Acute stabilization is most important initially; a more considered decision about long-term therapy can be made when more is known about the patient.
Patient selection is the most important component of success. However, randomized data to support outcomes with the various devices are sparse and complicated by the critically ill state of the patient population.
SHORT-TERM CIRCULATORY SUPPORT: ECMO, IMPELLA, TANDEMHEART
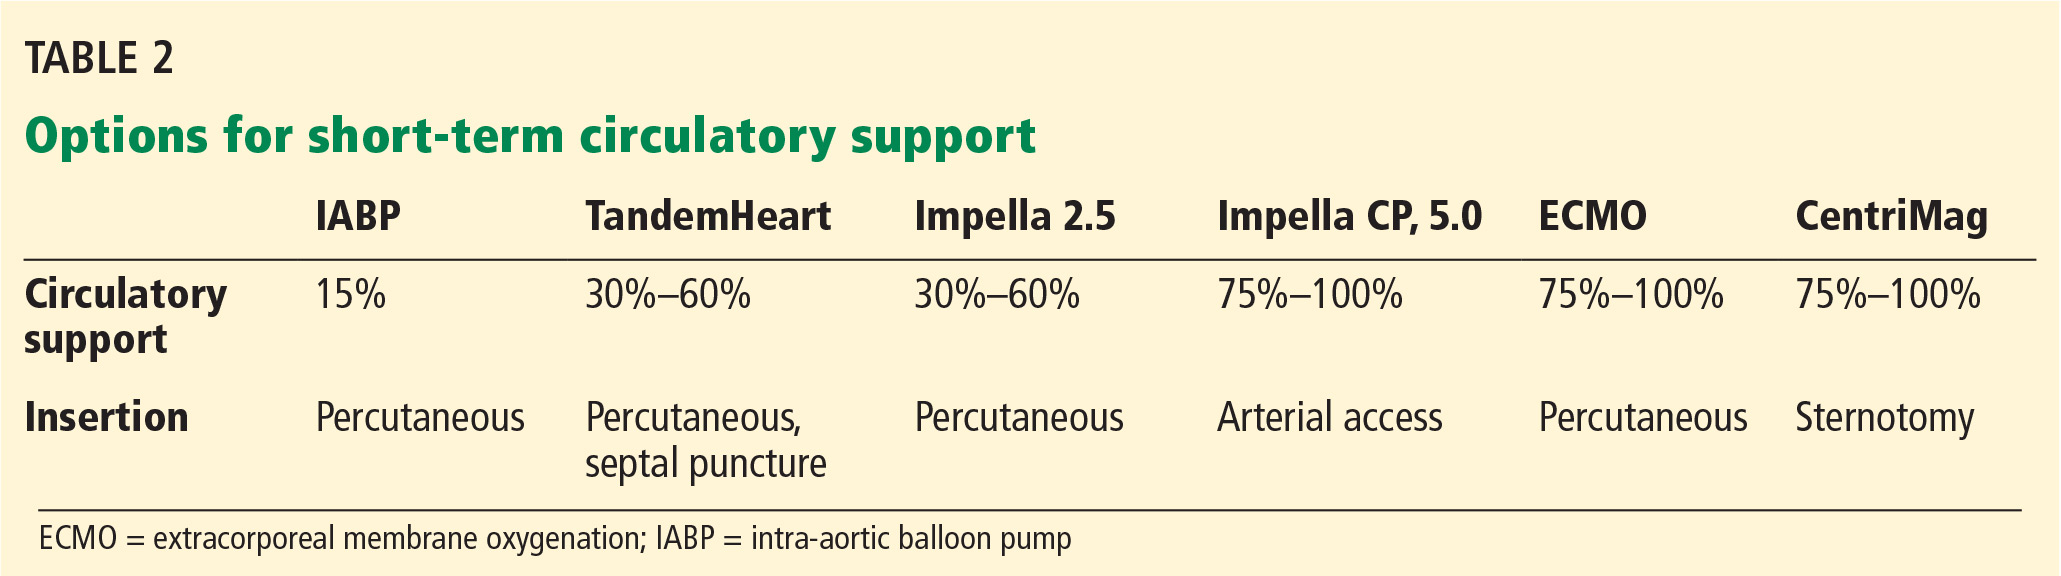
A menu of options is available for temporary mechanical support. Options differ by their degree of circulatory support and ease of insertion (Table 2).
ECMO: A fast option with many advantages
ECMO has evolved and now can be placed quickly. A remote diagnostic platform such as CardioHub permits management at the bedside, in the medical unit, or in the cardiac intensive care unit.7
ECMO has several advantages. It can be used during cardiopulmonary bypass, it provides oxygenation, it is the only option in the setting of lung injury, it can be placed peripherally (without thoracotomy), and it is the only percutaneous option for biventricular support.
ECMO also has significant disadvantages
ECMO is a good device for acute resuscitation of a patient in shock, as it offers quick placement and resuscitation. But it is falling out of favor because of significant disadvantages.
Its major drawback is that it provides no left ventricular unloading. Although in a very unstable patient ECMO can stabilize end organs and restore their function, the lack of left ventricular unloading and reduced ventricular work threaten the myocardium. It creates extremely high afterload; therefore, in a left ventricle with poor function, wall tension and myocardial oxygen demand increase. Multiple studies have shown that coronary perfusion worsens, especially if the patient is cannulated peripherally. Because relative cerebral hypoxia occurs in many situations, it is imperative to check blood saturations at multiple sites to determine if perfusion is adequate everywhere.
Ineffective left ventricular unloading with venoarterial ECMO is managed in several ways. Sometimes left ventricular distention is slight and the effects are subtle. Left ventricular distention causing pulmonary edema can be addressed with:
- Inotropes (in moderate doses)
- Anticoagulation to prevent left ventricular thrombus formation
- An intra-aortic balloon pump. Most patients on ECMO already have an intra-aortic balloon pump in place, and it should be left in to provide additional support. For those who do not have one, it should be placed via the contralateral femoral artery.
If problems persist despite these measures, apical cannulation or left ventricular septostomy can be performed.
Outcomes with ECMO have been disappointing. Studies show that whether ECMO was indicated for cardiac failure or for respiratory failure, survival is only about 25% at 5 years. Analyzing data only for arteriovenous ECMO, survival was 48% in bridged patients and 41% in patients who were weaned.
The Extracorporeal Life Support Organization Registry, in their international summary from 2010, found that 34% of cardiac patients on ECMO survived to discharge or transfer. Most of these patients had cardiogenic shock from acute myocardial infarction. Outcomes are so poor because of complications endemic to ECMO, eg, dialysis-dependent renal failure (about 40%) and neurologic complications (about 30%), often involving ischemic or hemorrhagic stroke.
Limb and pump complications were also significant in the past. These have been reduced with the new reperfusion cannula and the Quadrox oxygenator.
Complications unique to ECMO should be understood and anticipated so that they can be avoided. Better tools are available, ie, Impella and TandemHeart.
Left-sided Impella: A longer-term temporary support
ECMO is a temporary fix that is usually used only for a few days. If longer support is needed, axillary placement of an Impella should be used as a bridge to recovery, transplant, or a durable LVAD.

The Impella device (Figure 3) is a miniature rotary blood pump increasingly used to treat cardiogenic shock. It is inserted retrograde across the aortic valve to provide short-term ventricular support. Most devices are approved by the US Food and Drug Administration (FDA) for less than 7 days of use, but we have experience using them up to 30 days. They are very hemocompatible, involving minimal hemolysis. Axillary placement allows early extubation and ambulation and is more stable than groin placement.
Several models are available: the 2.5 and 3.5 L/min devices can be placed percutaneously, while the 5 L/min model must be surgically placed in the axillary or groin region. Heparin is required with their use. They can replace ECMO. A right ventricular assist device (RVAD), Impella RP, is also available.
Physiologic impact of the Impella
The Impella fully unloads the left ventricle, reducing myocardial oxygen demand and increasing myocardial blood flow. It reduces end-diastolic volume and pressure, the mechanical work of the heart, and wall tension. Microvascular resistance is reduced, allowing increased coronary flow. Cardiac output and power are increased by multiple means.8–11
The RECOVER 1 trial evaluated the 5L Impella placed after cardiac surgery. The cardiac index increased in all the patients, and the systemic vascular resistance and wedge pressure decreased.12
Unloading the ventricle is critical. Meyns and colleagues13 found a fivefold reduction in infarct size from baseline in a left anterior descending occlusion model in pigs after off-loading the ventricle.
Impella has the advantage of simple percutaneous insertion (the 2.5 and CP models). It also tests right ventricular tolerance: if the right ventricle is doing well, one can predict with high certainty that it will tolerate an LVAD (eg, HeartWare, HeartMate 2 (Pleasanton, CA), or HeartMate 3 when available).
Disadvantages include that it provides only left ventricular support, although a right ventricular device can be inserted for dual support. Placement requires fluoroscopic or echocardiographic guidance.
TandemHeart requires septal puncture
The TandemHeart is approved for short-term and biventricular use. It consists of an extracorporeal centrifugal pump that withdraws blood from the left atrium via a trans-septal cannula placed through the femoral vein (Figure 4) and returns it to one or both femoral arteries. The blood is pumped at up to 5 L/min.
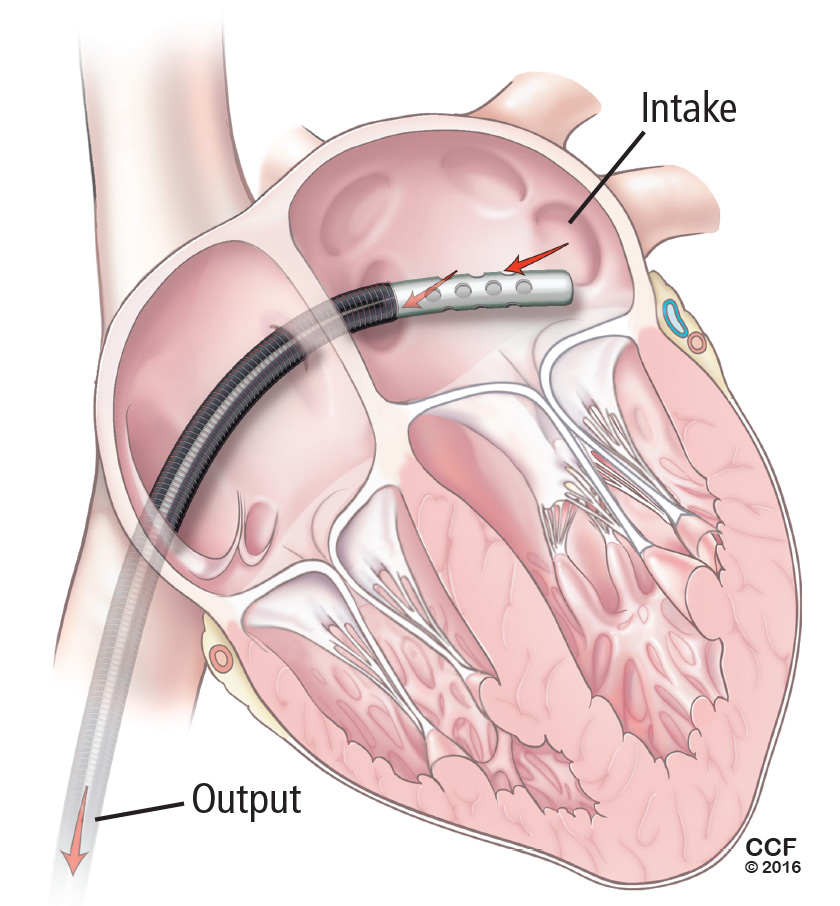
It is designed to reduce the pulmonary capillary wedge pressure, ventricular work, and myocardial oxygen demand and increase cardiac output and mean arterial pressure. It has the advantages of percutaneous placement and the ability to provide biventricular support with 2 devices. It can be used for up to 3 weeks. It can easily be converted to ECMO by either splicing in an oxygenator or adding another cannula.
Although the TandemHeart provides significant support, it is no longer often used. A 21F venous cannula must be passed to the left atrium by trans-septal puncture, which requires advanced skill and must be done in the catheterization laboratory. Insertion can take too much time and cause bleeding in patients taking an anticoagulant. Insertion usually destroys the septum, and removal requires a complete patch of the entire septum. Systemic anticoagulation is required. Other disadvantages are risks of hemolysis, limb ischemia, and infection with longer support times.
The CentriMag (Levitronix LLC; Framingham, MA) is an improved device that requires only 1 cannula instead of 2 to cover both areas.
DEVICES FOR RIGHT-SIDED SUPPORT
Most early devices were designed for left-sided support. The right heart, especially in failure, has been more difficult to manage. Previously the only option for a patient with right ventricular failure was venoarterial ECMO. This is more support than needed for a patient with isolated right ventricular failure and involves the risk of multiple complications from the device.

With more options available for the right heart (Table 3), we can choose the most appropriate device according to the underlying cause of right heart failure (eg, right ventricular infarct, pulmonary hypertension), the likelihood of recovery, and the expected time to recovery.
The ideal RVAD would be easy to implant, maintain, and remove. It would allow for chest closure and patient ambulation. It would be durable and biocompatible, so that it could remain implanted for months if necessary. It would cause little blood trauma, have the capability for adding an oxygenator for pulmonary support, and be cost-effective.
Although no single system has all these qualities, each available device fulfills certain combinations of these criteria, so the best one can be selected for each patient’s needs.
ECMO Rotaflow centrifugal pump: Fast, simple, inexpensive
A recent improvement to ECMO is the Rotaflow centrifugal pump (Maquet, Wayne, NJ), which is connected by sewing an 8-mm graft onto the pulmonary artery and placing a venous cannula in the femoral vein. If the patient is not bleeding, the chest can then be closed. This creates a fast, simple, and inexpensive temporary RVAD system. When the patient is ready to be weaned, the outflow graft can be disconnected at the bedside without reopening the chest.
The disadvantage is that the Rotaflow system contains a sapphire bearing. Although it is magnetically coupled, it generates heat and is a nidus for thrombus formation, which can lead to pump failure and embolization. This system can be used for patients who are expected to need support for less than 5 to 7 days. Beyond this duration, the incidence of complications increases.
CentriMag Ventricular Assist System offers right, left, or bilateral support
The CentriMag Ventricular Assist System is a fully magnetically levitated pump containing no bearings or seals, and with the same technology as is found in many of the durable devices such as HeartMate 3. It is coupled with a reusable motor and is easy to use.
CentriMag offers versatility, allowing for right, left, or bilateral ventricular support. An oxygenator can be added for pulmonary edema and additional support. It is the most biocompatible device and is FDA-approved for use for 4 weeks, although it has been used successfully for much longer. It allows for chest closure and ambulation. It is especially important as a bridge to transplant. The main disadvantage is that insertion and removal require sternotomy.
Impella RP: One size does not fit all
The Impella RP (Figure 5) has an 11F catheter diameter, 23F pump, and a maximum flow rate of more than 4 L/minute. It has a unique 3-dimensional cannula design based on computed tomography 3-dimensional reconstructions from hundreds of patients.

The device is biocompatible and can be used for support for more than 7 days, although most patients require only 3 or 4 days. There is almost no priming volume, so there is no hemodilution.
The disadvantages are that it is more challenging to place than other devices, and some patients cannot use it because the cannula does not fit. It also does not provide pulmonary support. Finally, it is the most expensive of the 3 right-sided devices.
CASE REVISITED
The patient described at the beginning of this article was extubated on day 12 but was then reintubated. On day 20, a tracheotomy tube was placed. By day 24, he had improved so little that his family signed a “do-not-resuscitate–comfort-care-arrest” order (ie, if the patient’s heart or breathing stops, only comfort care is to be provided).
But slowly he got better, and the Impella was removed on day 30. Afterward, serum creatinine and liver function tests began rising again, requiring dobutamine for heart support.
On day 34, his family reversed the do-not-resuscitate order, and he was reevaluated for an LVAD as destination therapy. At this point, echocardiography showed a left ventricular ejection fraction of 10%, normal right ventricular function, with a normal heartbeat and valves. On day 47, a HeartMate II LVAD was placed.
On postoperative day 18, he was transferred out of the intensive care unit, then discharged to an acute rehabilitation facility 8 days later (hospital day 73). He was subsequently discharged.
At a recent follow-up appointment, the patient said that he was feeling “pretty good” and walked with no shortness of breath.
- Reyentovich A, Barghash MH, Hochman JS. Management of refractory cardiogenic shock. Nat Rev Cardiol 2016; 13:481–492.
- Wayangankar SA, Bangalore S, McCoy LA, et al. Temporal trends and outcomes of patients undergoing percutaneous coronary interventions for cardiogenic shock in the setting of acute myocardial infarction: a report from the CathPCI registry. JACC Cardiovasc Interv 2016; 9:341–351.
- Harjola VP, Lassus J, Sionis A, et al; CardShock Study Investigators; GREAT network. Clinical picture and risk prediction of short-term mortality in cardiogenic shock. Eur J Heart Fail 2015; 17:501–509.
- Schmidt M, Burrell A, Roberts L, et al. Predicting survival after ECMO for refractory cardiogenic shock: the survival after veno-arterial-ECMO (SAVE)-score. Eur Heart J 2015; 36:2246–2256.
- Samuels LE, Kaufman MS, Thomas MP, Holmes EC, Brockman SK, Wechsler AS. Pharmacological criteria for ventricular assist device insertion following postcardiotomy shock: experience with the Abiomed BVS system. J Card Surg 1999; 14:288–293.
- Centers for Medicare & Medicaid Services. Decision memo for ventricular assist devices as destination therapy (CAG-00119R2). www.cms.gov/medicare-coverage-database/details/nca-decision-memo.aspx?NCAId=243&ver=9&NcaName=Ventricular+Assist+Devices+as+Destination+Therapy+(2nd+Recon)&bc=BEAAAAAAEAAA&&fromdb=true. Accessed March 10, 2017.
- Kulkarni T, Sharma NS, Diaz-Guzman E. Extracorporeal membrane oxygenation in adults: a practical guide for internists. Cleve Clin J Med 2016; 83:373–384.
- Remmelink M, Sjauw KD, Henriques JP, et al. Effects of left ventricular unloading by Impella Recover LP2.5 on coronary hemodynamics. Catheter Cardiovasc Interv 2007; 70:532–537.
- Aqel RA, Hage FG, Iskandrian AE. Improvement of myocardial perfusion with a percutaneously inserted left ventricular assist device. J Nucl Cardiol 2010; 17:158–160.
- Sarnoff SJ, Braunwald E, Welch Jr GH, Case RB, Stainsby WN, Macruz R. Hemodynamic determinants of oxygen consumption of the heart with special reference to the tension-time index. Am J Physiol 1957; 192:148–156.
- Braunwald E. 50th anniversary historical article. Myocardial oxygen consumption: the quest for its determinants and some clinical fallout. J Am Coll Cardiol 1999; 34:1365–1368.
- Griffith BP, Anderson MB, Samuels LE, Pae WE Jr, Naka Y, Frazier OH. The RECOVER I: A multicenter prospective study of Impella 5.0/LD for postcardiotomy circulatory support. J Thorac Cardiovasc Surg 2013; 145:548–554
- Meyns B, Stolinski J, Leunens V, Verbeken E, Flameng W. Left ventricular support by cathteter-mounted axial flow pump reduces infarct size. J Am Coll Cardiol 2003; 41:1087–1095.
A 43-year-old man presented to a community hospital with acute chest pain and shortness of breath and was diagnosed with anterior ST-elevation myocardial infarction. He was a smoker with a history of alcohol abuse, hypertension, and hyperlipidemia, and in the past he had undergone percutaneous coronary interventions to the right coronary artery and the first obtuse marginal artery.
Angiography showed total occlusion in the left anterior descending artery, 90% stenosis in the right coronary artery, and mild disease in the left circumflex artery. A drug-eluting stent was placed in the left anterior descending artery, resulting in good blood flow.
However, his left ventricle continued to have severe dysfunction. An intra-aortic balloon pump was inserted. Afterward, computed tomography showed subsegmental pulmonary embolism with congestion. His mean arterial pressure was 60 mm Hg (normal 70–110), central venous pressure 12 mm Hg (3–8), pulmonary artery pressure 38/26 mm Hg (15–30/4–12), pulmonary capillary wedge pressure 24 mm Hg (2–15), and cardiac index 1.4 L/min (2.5–4).
The patient was started on dobutamine and norepinephrine and transferred to Cleveland Clinic on day 2. Over the next day, he had runs of ventricular tachycardia, for which he was given amiodarone and lidocaine. His urine output was low, and his serum creatinine was elevated at 1.65 mg/dL (baseline 1.2, normal 0.5–1.5). Liver function tests were also elevated, with aspartate aminotransferase at 115 U/L(14–40) and alanine aminotransferase at 187 U/L (10–54).
Poor oxygenation was evident: his arterial partial pressure of oxygen was 64 mm Hg (normal 75–100). He was intubated and given 100% oxygen with positive end-expiratory pressure of 12 cm H2O.
Echocardiography showed a left ventricular ejection fraction of 15% (normal 55%–70%) and mild right ventricular dysfunction.
ECMO and then Impella placement
On his third hospital day, a venoarterial extracorporeal membrane oxygenation (ECMO) device was placed peripherally (Figure 1).
His hemodynamic variables stabilized, and he was weaned off dobutamine and norepinephrine. Results of liver function tests normalized, his urinary output increased, and his serum creatinine dropped to a normal 1.0 mg/dL. However, a chest radiograph showed pulmonary congestion, and echocardiography now showed severe left ventricular dysfunction.
On hospital day 5, the patient underwent surgical placement of an Impella 5.0 device (Abiomed, Danvers, MA) through the right axillary artery in an effort to improve his pulmonary edema. The ECMO device was removed. Placement of a venovenous ECMO device was deemed unnecessary when oxygenation improved with the Impella.
Three days after Impella placement, radiography showed improved edema with some remaining pleural effusion.
ACUTE CARDIOGENIC SHOCK
Cardiogenic shock remains a challenging clinical problem: patients with it are among the sickest in the hospital, and many of them die. ECMO was once the only therapy available and is still widely used. However, it is a 2-edged sword; complications such as bleeding, infection, and thrombosis are almost inevitable if it is used for long. Importantly, patients are usually kept intubated and bedridden.
In recent years, new devices have become available that are easier to place (some in the catheterization laboratory or even at the bedside) and allow safer bridging to recovery, transplant, or other therapies.
This case illustrates the natural history of cardiogenic shock and the preferred clinical approach: ie, ongoing evaluation that permits rapid response to evolving challenges.
In general, acute cardiogenic shock occurs within 24 to 48 hours after the initial insult, so even if a procedure succeeds, the patient may develop progressive hypotension and organ dysfunction. Reduced cardiac output causes a downward spiral with multiple systemic and inflammatory processes as well as increased nitric oxide synthesis, leading to progressive decline and eventual end-organ dysfunction.
Continuously evaluate
The cardiac team should continuously assess the acuity and severity of a patient’s condition, with the goals of maintaining end-organ perfusion and identifying the source of problems. Refractory cardiogenic shock, with tissue hypoperfusion despite vasoactive medications and treatment of the underlying cause, is associated with in-hospital mortality rates ranging from 30% to 50%.1,2 The rates have actually increased over the past decade, as sicker patients are being treated.
When a patient presents with cardiogenic shock, we first try a series of vasoactive drugs and usually an intra-aortic balloon pump (Figure 2). We then tailor treatment depending on etiology. For example, a patient may have viral myocarditis and may even require a biopsy.
If cardiogenic shock is refractory, mechanical circulatory support devices can be a short-term bridge to either recovery or a new decision. A multidisciplinary team should be consulted to consider transplant, a long-term device, or palliative care. Sometimes a case requires “bridging to a bridge,” with several devices used short-term in turn.
Prognostic factors in cardiogenic shock
Several tools help predict outcome in a severely ill patient. End-organ function, indicated by blood lactate levels and estimated glomerular filtration rate, is perhaps the most informative and should be monitored serially.
CardShock3 is a simple scoring system based on age, mental status at presentation, laboratory values, and medical history. Patients receive 1 point for each of the following factors:
- Age > 75
- Confusion at presentation
- Previous myocardial infarction or coronary artery bypass grafting
- Acute coronary syndrome etiology
- Left ventricular ejection fraction < 40%
- Blood lactate level between 2 and 4 mmol/L, inclusively (2 points for lactate levels > 4 mmol/L)
- Estimated glomerular filtration rate between 30 and 60 mL/min/1.73 m2, inclusively (2 points if < 30 mL/min/1.73 m2).
Thus, scores range from 0 (best) to 9 (worst). A score of 0 to 3 points was associated with a 9% risk of death in the hospital, a score of 4 or 5 with a risk of 36%, and a score of 6 through 9 with a risk of 77%.3
The Survival After Veno-arterial ECMO (SAVE) score (www.save-score.com) is a prediction tool derived from a large international ECMO registry.4 It is based on patient age, diagnosis, and indicators of end-organ dysfunction. Scores range from –35 (worst) to +7 (best).
The mortality rate associated with postcardiotomy cardiogenic shock increases with the amount of inotropic support provided. In a 1996–1999 case series of patients who underwent open-heart surgery,5 the hospital mortality rate was 40% in those who received 2 inotropes in high doses and 80% in those who received 3. A strategy of early implementation of mechanical support is critical.
Selection criteria for destination therapy
Deciding whether a patient should receive a long-term device is frequently a challenge. The decision often must be based on limited information about not only the medical indications but also psychosocial factors that influence long-term success.
The Centers for Medicare and Medicaid Services have established criteria for candidates for left ventricular assist devices (LVADs) as destination therapy.6 Contraindications established for heart transplant should also be considered (Table 1).
CASE REVISITED
Several factors argued against LVAD placement in our patient. He had no health insurance and had been off medications. He smoked and said he consumed 3 hard liquor drinks per week. His Stanford Integrated Psychosocial Assessment for Transplantation score was 30 (minimally acceptable). He had hypoxia with subsegmental pulmonary edema, a strong contraindication to immediate transplant.
On the other hand, he had only mild right ventricular dysfunction. His CardShock score was 4 (intermediate risk, based on lactate 1.5 mmol/L and estimated glomerular filtration rate 52 mL/min/1.73 m2). His SAVE score was –9 (class IV), which overall is associated with a 30% risk of death (low enough to consider treatment).
During the patient’s time on temporary support, the team had the opportunity to better understand him and assess his family support and his ability to handle a permanent device. His surviving the acute course bolstered the team’s confidence that he could enjoy long-term survival with destination therapy.
CATHETERIZATION LABORATORY DEVICE CAPABILITIES
Although most implantation procedures are done in the operating room, they are often done in the catheterization laboratory because patients undergoing catheterization may not be stable enough for transfer, or an emergency intervention may be required during the night. Catheterization interventionists are also an important part of the team to help determine the best approach for long-term therapy.
The catheterization laboratory has multiple acute intervention options. Usually, decisions must be made quickly. In general, patients needing mechanical support are managed as follows:
- Those who need circulation support and oxygenation receive ECMO
- Those who need circulation support alone because of mechanical issues (eg, myocardial infarction) are considered for an intra-aortic balloon pump, Impella, or TandemHeart pump (Cardiac Assist, Pittsburgh, PA).
Factors that guide the selection of a temporary pump include:
- Left ventricular function
- Right ventricular function
- Aortic valve stenosis (some devices cannot be inserted through critical aortic stenosis)
- Aortic regurgitation (can affect some devices)
- Peripheral artery disease (some devices are large and must be placed percutaneously).
CHOOSING AMONG PERCUTANEOUS DEVICES
Circulatory support in cardiogenic shock improves outcomes, and devices play an important role in supporting high-risk procedures. The goal is not necessarily to use the device throughout the hospital stay. Acute stabilization is most important initially; a more considered decision about long-term therapy can be made when more is known about the patient.
Patient selection is the most important component of success. However, randomized data to support outcomes with the various devices are sparse and complicated by the critically ill state of the patient population.
SHORT-TERM CIRCULATORY SUPPORT: ECMO, IMPELLA, TANDEMHEART
A menu of options is available for temporary mechanical support. Options differ by their degree of circulatory support and ease of insertion (Table 2).
ECMO: A fast option with many advantages
ECMO has evolved and now can be placed quickly. A remote diagnostic platform such as CardioHub permits management at the bedside, in the medical unit, or in the cardiac intensive care unit.7
ECMO has several advantages. It can be used during cardiopulmonary bypass, it provides oxygenation, it is the only option in the setting of lung injury, it can be placed peripherally (without thoracotomy), and it is the only percutaneous option for biventricular support.
ECMO also has significant disadvantages
ECMO is a good device for acute resuscitation of a patient in shock, as it offers quick placement and resuscitation. But it is falling out of favor because of significant disadvantages.
Its major drawback is that it provides no left ventricular unloading. Although in a very unstable patient ECMO can stabilize end organs and restore their function, the lack of left ventricular unloading and reduced ventricular work threaten the myocardium. It creates extremely high afterload; therefore, in a left ventricle with poor function, wall tension and myocardial oxygen demand increase. Multiple studies have shown that coronary perfusion worsens, especially if the patient is cannulated peripherally. Because relative cerebral hypoxia occurs in many situations, it is imperative to check blood saturations at multiple sites to determine if perfusion is adequate everywhere.
Ineffective left ventricular unloading with venoarterial ECMO is managed in several ways. Sometimes left ventricular distention is slight and the effects are subtle. Left ventricular distention causing pulmonary edema can be addressed with:
- Inotropes (in moderate doses)
- Anticoagulation to prevent left ventricular thrombus formation
- An intra-aortic balloon pump. Most patients on ECMO already have an intra-aortic balloon pump in place, and it should be left in to provide additional support. For those who do not have one, it should be placed via the contralateral femoral artery.
If problems persist despite these measures, apical cannulation or left ventricular septostomy can be performed.
Outcomes with ECMO have been disappointing. Studies show that whether ECMO was indicated for cardiac failure or for respiratory failure, survival is only about 25% at 5 years. Analyzing data only for arteriovenous ECMO, survival was 48% in bridged patients and 41% in patients who were weaned.
The Extracorporeal Life Support Organization Registry, in their international summary from 2010, found that 34% of cardiac patients on ECMO survived to discharge or transfer. Most of these patients had cardiogenic shock from acute myocardial infarction. Outcomes are so poor because of complications endemic to ECMO, eg, dialysis-dependent renal failure (about 40%) and neurologic complications (about 30%), often involving ischemic or hemorrhagic stroke.
Limb and pump complications were also significant in the past. These have been reduced with the new reperfusion cannula and the Quadrox oxygenator.
Complications unique to ECMO should be understood and anticipated so that they can be avoided. Better tools are available, ie, Impella and TandemHeart.
Left-sided Impella: A longer-term temporary support
ECMO is a temporary fix that is usually used only for a few days. If longer support is needed, axillary placement of an Impella should be used as a bridge to recovery, transplant, or a durable LVAD.
The Impella device (Figure 3) is a miniature rotary blood pump increasingly used to treat cardiogenic shock. It is inserted retrograde across the aortic valve to provide short-term ventricular support. Most devices are approved by the US Food and Drug Administration (FDA) for less than 7 days of use, but we have experience using them up to 30 days. They are very hemocompatible, involving minimal hemolysis. Axillary placement allows early extubation and ambulation and is more stable than groin placement.
Several models are available: the 2.5 and 3.5 L/min devices can be placed percutaneously, while the 5 L/min model must be surgically placed in the axillary or groin region. Heparin is required with their use. They can replace ECMO. A right ventricular assist device (RVAD), Impella RP, is also available.
Physiologic impact of the Impella
The Impella fully unloads the left ventricle, reducing myocardial oxygen demand and increasing myocardial blood flow. It reduces end-diastolic volume and pressure, the mechanical work of the heart, and wall tension. Microvascular resistance is reduced, allowing increased coronary flow. Cardiac output and power are increased by multiple means.8–11
The RECOVER 1 trial evaluated the 5L Impella placed after cardiac surgery. The cardiac index increased in all the patients, and the systemic vascular resistance and wedge pressure decreased.12
Unloading the ventricle is critical. Meyns and colleagues13 found a fivefold reduction in infarct size from baseline in a left anterior descending occlusion model in pigs after off-loading the ventricle.
Impella has the advantage of simple percutaneous insertion (the 2.5 and CP models). It also tests right ventricular tolerance: if the right ventricle is doing well, one can predict with high certainty that it will tolerate an LVAD (eg, HeartWare, HeartMate 2 (Pleasanton, CA), or HeartMate 3 when available).
Disadvantages include that it provides only left ventricular support, although a right ventricular device can be inserted for dual support. Placement requires fluoroscopic or echocardiographic guidance.
TandemHeart requires septal puncture
The TandemHeart is approved for short-term and biventricular use. It consists of an extracorporeal centrifugal pump that withdraws blood from the left atrium via a trans-septal cannula placed through the femoral vein (Figure 4) and returns it to one or both femoral arteries. The blood is pumped at up to 5 L/min.
It is designed to reduce the pulmonary capillary wedge pressure, ventricular work, and myocardial oxygen demand and increase cardiac output and mean arterial pressure. It has the advantages of percutaneous placement and the ability to provide biventricular support with 2 devices. It can be used for up to 3 weeks. It can easily be converted to ECMO by either splicing in an oxygenator or adding another cannula.
Although the TandemHeart provides significant support, it is no longer often used. A 21F venous cannula must be passed to the left atrium by trans-septal puncture, which requires advanced skill and must be done in the catheterization laboratory. Insertion can take too much time and cause bleeding in patients taking an anticoagulant. Insertion usually destroys the septum, and removal requires a complete patch of the entire septum. Systemic anticoagulation is required. Other disadvantages are risks of hemolysis, limb ischemia, and infection with longer support times.
The CentriMag (Levitronix LLC; Framingham, MA) is an improved device that requires only 1 cannula instead of 2 to cover both areas.
DEVICES FOR RIGHT-SIDED SUPPORT
Most early devices were designed for left-sided support. The right heart, especially in failure, has been more difficult to manage. Previously the only option for a patient with right ventricular failure was venoarterial ECMO. This is more support than needed for a patient with isolated right ventricular failure and involves the risk of multiple complications from the device.
With more options available for the right heart (Table 3), we can choose the most appropriate device according to the underlying cause of right heart failure (eg, right ventricular infarct, pulmonary hypertension), the likelihood of recovery, and the expected time to recovery.
The ideal RVAD would be easy to implant, maintain, and remove. It would allow for chest closure and patient ambulation. It would be durable and biocompatible, so that it could remain implanted for months if necessary. It would cause little blood trauma, have the capability for adding an oxygenator for pulmonary support, and be cost-effective.
Although no single system has all these qualities, each available device fulfills certain combinations of these criteria, so the best one can be selected for each patient’s needs.
ECMO Rotaflow centrifugal pump: Fast, simple, inexpensive
A recent improvement to ECMO is the Rotaflow centrifugal pump (Maquet, Wayne, NJ), which is connected by sewing an 8-mm graft onto the pulmonary artery and placing a venous cannula in the femoral vein. If the patient is not bleeding, the chest can then be closed. This creates a fast, simple, and inexpensive temporary RVAD system. When the patient is ready to be weaned, the outflow graft can be disconnected at the bedside without reopening the chest.
The disadvantage is that the Rotaflow system contains a sapphire bearing. Although it is magnetically coupled, it generates heat and is a nidus for thrombus formation, which can lead to pump failure and embolization. This system can be used for patients who are expected to need support for less than 5 to 7 days. Beyond this duration, the incidence of complications increases.
CentriMag Ventricular Assist System offers right, left, or bilateral support
The CentriMag Ventricular Assist System is a fully magnetically levitated pump containing no bearings or seals, and with the same technology as is found in many of the durable devices such as HeartMate 3. It is coupled with a reusable motor and is easy to use.
CentriMag offers versatility, allowing for right, left, or bilateral ventricular support. An oxygenator can be added for pulmonary edema and additional support. It is the most biocompatible device and is FDA-approved for use for 4 weeks, although it has been used successfully for much longer. It allows for chest closure and ambulation. It is especially important as a bridge to transplant. The main disadvantage is that insertion and removal require sternotomy.
Impella RP: One size does not fit all
The Impella RP (Figure 5) has an 11F catheter diameter, 23F pump, and a maximum flow rate of more than 4 L/minute. It has a unique 3-dimensional cannula design based on computed tomography 3-dimensional reconstructions from hundreds of patients.
The device is biocompatible and can be used for support for more than 7 days, although most patients require only 3 or 4 days. There is almost no priming volume, so there is no hemodilution.
The disadvantages are that it is more challenging to place than other devices, and some patients cannot use it because the cannula does not fit. It also does not provide pulmonary support. Finally, it is the most expensive of the 3 right-sided devices.
CASE REVISITED
The patient described at the beginning of this article was extubated on day 12 but was then reintubated. On day 20, a tracheotomy tube was placed. By day 24, he had improved so little that his family signed a “do-not-resuscitate–comfort-care-arrest” order (ie, if the patient’s heart or breathing stops, only comfort care is to be provided).
But slowly he got better, and the Impella was removed on day 30. Afterward, serum creatinine and liver function tests began rising again, requiring dobutamine for heart support.
On day 34, his family reversed the do-not-resuscitate order, and he was reevaluated for an LVAD as destination therapy. At this point, echocardiography showed a left ventricular ejection fraction of 10%, normal right ventricular function, with a normal heartbeat and valves. On day 47, a HeartMate II LVAD was placed.
On postoperative day 18, he was transferred out of the intensive care unit, then discharged to an acute rehabilitation facility 8 days later (hospital day 73). He was subsequently discharged.
At a recent follow-up appointment, the patient said that he was feeling “pretty good” and walked with no shortness of breath.
- Reyentovich A, Barghash MH, Hochman JS. Management of refractory cardiogenic shock. Nat Rev Cardiol 2016; 13:481–492.
- Wayangankar SA, Bangalore S, McCoy LA, et al. Temporal trends and outcomes of patients undergoing percutaneous coronary interventions for cardiogenic shock in the setting of acute myocardial infarction: a report from the CathPCI registry. JACC Cardiovasc Interv 2016; 9:341–351.
- Harjola VP, Lassus J, Sionis A, et al; CardShock Study Investigators; GREAT network. Clinical picture and risk prediction of short-term mortality in cardiogenic shock. Eur J Heart Fail 2015; 17:501–509.
- Schmidt M, Burrell A, Roberts L, et al. Predicting survival after ECMO for refractory cardiogenic shock: the survival after veno-arterial-ECMO (SAVE)-score. Eur Heart J 2015; 36:2246–2256.
- Samuels LE, Kaufman MS, Thomas MP, Holmes EC, Brockman SK, Wechsler AS. Pharmacological criteria for ventricular assist device insertion following postcardiotomy shock: experience with the Abiomed BVS system. J Card Surg 1999; 14:288–293.
- Centers for Medicare & Medicaid Services. Decision memo for ventricular assist devices as destination therapy (CAG-00119R2). www.cms.gov/medicare-coverage-database/details/nca-decision-memo.aspx?NCAId=243&ver=9&NcaName=Ventricular+Assist+Devices+as+Destination+Therapy+(2nd+Recon)&bc=BEAAAAAAEAAA&&fromdb=true. Accessed March 10, 2017.
- Kulkarni T, Sharma NS, Diaz-Guzman E. Extracorporeal membrane oxygenation in adults: a practical guide for internists. Cleve Clin J Med 2016; 83:373–384.
- Remmelink M, Sjauw KD, Henriques JP, et al. Effects of left ventricular unloading by Impella Recover LP2.5 on coronary hemodynamics. Catheter Cardiovasc Interv 2007; 70:532–537.
- Aqel RA, Hage FG, Iskandrian AE. Improvement of myocardial perfusion with a percutaneously inserted left ventricular assist device. J Nucl Cardiol 2010; 17:158–160.
- Sarnoff SJ, Braunwald E, Welch Jr GH, Case RB, Stainsby WN, Macruz R. Hemodynamic determinants of oxygen consumption of the heart with special reference to the tension-time index. Am J Physiol 1957; 192:148–156.
- Braunwald E. 50th anniversary historical article. Myocardial oxygen consumption: the quest for its determinants and some clinical fallout. J Am Coll Cardiol 1999; 34:1365–1368.
- Griffith BP, Anderson MB, Samuels LE, Pae WE Jr, Naka Y, Frazier OH. The RECOVER I: A multicenter prospective study of Impella 5.0/LD for postcardiotomy circulatory support. J Thorac Cardiovasc Surg 2013; 145:548–554
- Meyns B, Stolinski J, Leunens V, Verbeken E, Flameng W. Left ventricular support by cathteter-mounted axial flow pump reduces infarct size. J Am Coll Cardiol 2003; 41:1087–1095.
KEY POINTS
- ECMO is the fastest way to stabilize a patient in acute cardiogenic shock and prevent end-organ failure, but it should likely be used for a short time and does not reduce the work of (“unload”) the left ventricle.
- An intra-aortic balloon pump may provide diastolic filling in a patient on ECMO.
- The TandemHeart provides significant support, but its insertion requires puncture of the atrial septum.
- The Impella fully unloads the left ventricle, critically reducing the work of the heart.
- Options for right-ventricular support include the ECMO Rotaflow circuit, CentriMag, and Impella RP.
- The CentriMag is the most versatile device, allowing right, left, or biventricular support, but placement requires sternotomy.
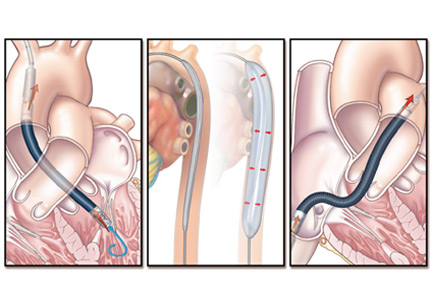
Blending classic clinical skills with new technology

Now that we can order MRI studies on a break from rounds walking to Starbucks, utilize portable ultrasounds to direct IV line placement, and use dual-energy CT to detect a gout attack that has not yet occurred, it seems like a romantic anachronism to extol the ongoing virtues of the seemingly lost art of the physical examination. Back “in the day,” the giants of medicine roamed the halls with their natural instruments of palpation and percussion and their skills in observation and auscultation. They were giants because they stood out then, just as skilled diagnosticians stand out today using an upgraded set of tools. Some physicians a few decades ago were able to recognize, describe, and diagnose late-stage endocarditis with a stethoscope, a magnifying glass, and an ophthalmoscope. The giants of today recognize the patient with endocarditis and document its presence using transesophageal echocardiography before the peripheral eponymous stigmata of Janeway and Osler appear or the blood cultures turn positive. The physical examination, history, diagnostic reasoning, and clinical technology are all essential for a blend that provides efficient and effective medical care. The blending is the challenge.
Clinicians are not created equal. We learn and prioritize our skills in different ways. But if we are not taught to value and trust the physical examination, if we don’t have the opportunity to see it influence patient management in positive ways, we may eschew it and instead indiscriminately use easily available laboratory and imaging tests—a more expensive and often misleading strategic approach. Today while in clinic, I saw a 54-year-old woman for evaluation of possible lupus who had arthritis of the hands and a high positive antinuclear antibody titer, but negative or normal results on other, previously ordered tests, including anti-DNA, rheumatoid factor, anti-cyclic citrullinated peptide, hepatitis C studies, complement levels, and another half-dozen immune serologic tests. On examination, she had typical nodular osteoarthritis of the proximal and distal interphalangeal joints of her hand with squaring of her thumbs. The antinuclear antibody was most likely associated with her previously diagnosed autoimmune thyroid disease.
In an editorial in this issue of the Journal, Dr. Salvatore Mangione, the author of a book on physical diagnosis,1 cites a recent study indicating that the most common recognized diagnostic error related to the physical examination is that the appropriate examination isn’t done.2 I would add to that my concerns over the new common custom of cutting and pasting the findings from earlier physical examinations into later progress notes in the electronic record. So much for the value of being able to recognize “changing murmurs” when diagnosing infectious endocarditis.
The apparent efficiency (reflected in length of stay) and availability of technology, as well as a lack of physician skill and time, are often cited as reasons for the demise of the physical examination. Yet this does not need to be the case. If I had trained with portable ultrasonography readily available to confirm or refute my impressions, my skills at detecting low-grade synovitis would surely be better than they are. With a gold standard at hand, which may be technology or at times a skilled mentor, our examinations can be refined if we want them to be.
But the issue of limited physician time must be addressed. Efficiency is a critical concept in preserving how we practice and perform the physical examination. When we know what we are looking for, we are more likely to find it if it is present, or to have confidence that it is not present. I am far more likely to recognize a loud pulmonic second heart sound if I suspect that the dyspneic patient I am examining has pulmonary hypertension associated with her scleroderma than if I am doing a perfunctory cardiac auscultation in a patient admitted with cellulitis. Appropriate focus provides power to the directed physical examination. If I am looking for the cause of unexplained fevers, I will do a purposeful axillary and epitrochlear lymph node examination. I am not mindlessly probing the flesh.
Nishigori and colleagues have written of the “hypothesis-driven” physical examination.3 Busy clinicians, they say, don’t have time to perform a head-to-toe, by-the-book physical examination. Instead, we should, by a dynamic process, formulate a differential diagnosis from the history and other initial information, and then perform the directed physical examination in earnest, looking for evidence to support or refute our diagnostic hypothesis—and thus redirect it. Plus, in a nice break from electronic charting, we can actually explain our thought processes to the patient as we perform the examination.
This approach makes sense to me as both intellectually satisfying and clinically efficient. And then we can consider which lab tests and technologic gadgetry we should order, while walking to get the café latte we ordered with our cell phone app.
New technology can support and not necessarily replace old habits.
- Mangione S. Physical Diagnosis Secrets, 2nd ed. Philadelphia: Mosby/Elsevier, 2008.
- Verghese A, Charlton B, Kassirer JP, Ramsey M, Ioannidis JP. Inadequacies of physical examination as a cause of medical errors and adverse events: a collection of vignettes. Am J Med 2015; 128:1322–1324.
- Nishigori H, Masuda K, Kikukawa M, et al. A model teaching session for the hypothesis-driven physical examination. Medical Teacher 2011; 33:410–417.
Now that we can order MRI studies on a break from rounds walking to Starbucks, utilize portable ultrasounds to direct IV line placement, and use dual-energy CT to detect a gout attack that has not yet occurred, it seems like a romantic anachronism to extol the ongoing virtues of the seemingly lost art of the physical examination. Back “in the day,” the giants of medicine roamed the halls with their natural instruments of palpation and percussion and their skills in observation and auscultation. They were giants because they stood out then, just as skilled diagnosticians stand out today using an upgraded set of tools. Some physicians a few decades ago were able to recognize, describe, and diagnose late-stage endocarditis with a stethoscope, a magnifying glass, and an ophthalmoscope. The giants of today recognize the patient with endocarditis and document its presence using transesophageal echocardiography before the peripheral eponymous stigmata of Janeway and Osler appear or the blood cultures turn positive. The physical examination, history, diagnostic reasoning, and clinical technology are all essential for a blend that provides efficient and effective medical care. The blending is the challenge.
Clinicians are not created equal. We learn and prioritize our skills in different ways. But if we are not taught to value and trust the physical examination, if we don’t have the opportunity to see it influence patient management in positive ways, we may eschew it and instead indiscriminately use easily available laboratory and imaging tests—a more expensive and often misleading strategic approach. Today while in clinic, I saw a 54-year-old woman for evaluation of possible lupus who had arthritis of the hands and a high positive antinuclear antibody titer, but negative or normal results on other, previously ordered tests, including anti-DNA, rheumatoid factor, anti-cyclic citrullinated peptide, hepatitis C studies, complement levels, and another half-dozen immune serologic tests. On examination, she had typical nodular osteoarthritis of the proximal and distal interphalangeal joints of her hand with squaring of her thumbs. The antinuclear antibody was most likely associated with her previously diagnosed autoimmune thyroid disease.
In an editorial in this issue of the Journal, Dr. Salvatore Mangione, the author of a book on physical diagnosis,1 cites a recent study indicating that the most common recognized diagnostic error related to the physical examination is that the appropriate examination isn’t done.2 I would add to that my concerns over the new common custom of cutting and pasting the findings from earlier physical examinations into later progress notes in the electronic record. So much for the value of being able to recognize “changing murmurs” when diagnosing infectious endocarditis.
The apparent efficiency (reflected in length of stay) and availability of technology, as well as a lack of physician skill and time, are often cited as reasons for the demise of the physical examination. Yet this does not need to be the case. If I had trained with portable ultrasonography readily available to confirm or refute my impressions, my skills at detecting low-grade synovitis would surely be better than they are. With a gold standard at hand, which may be technology or at times a skilled mentor, our examinations can be refined if we want them to be.
But the issue of limited physician time must be addressed. Efficiency is a critical concept in preserving how we practice and perform the physical examination. When we know what we are looking for, we are more likely to find it if it is present, or to have confidence that it is not present. I am far more likely to recognize a loud pulmonic second heart sound if I suspect that the dyspneic patient I am examining has pulmonary hypertension associated with her scleroderma than if I am doing a perfunctory cardiac auscultation in a patient admitted with cellulitis. Appropriate focus provides power to the directed physical examination. If I am looking for the cause of unexplained fevers, I will do a purposeful axillary and epitrochlear lymph node examination. I am not mindlessly probing the flesh.
Nishigori and colleagues have written of the “hypothesis-driven” physical examination.3 Busy clinicians, they say, don’t have time to perform a head-to-toe, by-the-book physical examination. Instead, we should, by a dynamic process, formulate a differential diagnosis from the history and other initial information, and then perform the directed physical examination in earnest, looking for evidence to support or refute our diagnostic hypothesis—and thus redirect it. Plus, in a nice break from electronic charting, we can actually explain our thought processes to the patient as we perform the examination.
This approach makes sense to me as both intellectually satisfying and clinically efficient. And then we can consider which lab tests and technologic gadgetry we should order, while walking to get the café latte we ordered with our cell phone app.
New technology can support and not necessarily replace old habits.
- Mangione S. Physical Diagnosis Secrets, 2nd ed. Philadelphia: Mosby/Elsevier, 2008.
- Verghese A, Charlton B, Kassirer JP, Ramsey M, Ioannidis JP. Inadequacies of physical examination as a cause of medical errors and adverse events: a collection of vignettes. Am J Med 2015; 128:1322–1324.
- Nishigori H, Masuda K, Kikukawa M, et al. A model teaching session for the hypothesis-driven physical examination. Medical Teacher 2011; 33:410–417.

Automating venous thromboembolism risk calculation using electronic health record data upon hospital admission: The automated Padua Prediction Score
Hospital-acquired venous thromboembolism (VTE) continues to be a critical quality challenge for U.S. hospitals,1 and high-risk patients are often not adequately prophylaxed. Use of VTE prophylaxis (VTEP) varies as widely as 26% to 85% of patients in various studies, as does patient outcomes and care expenditures.2-6 The 9th edition of the American College of Chest Physicians (CHEST) guidelines7 recommend the Padua Prediction Score (PPS) to select individual patients who may be at high risk for venous thromboembolism (VTE) and could benefit from thromboprophylaxis. Use of the manually calculated PPS to select patients for thromboprophylaxis has been shown to help decrease 30-day and 90-day mortality associated with VTE events after hospitalization to medical services.8 However, the PPS requires time-consuming manual calculation by a provider, who may be focused on more immediate aspects of patient care and several other risk scores competing for his attention, potentially decreasing its use.
Other risk scores that use only discrete scalar data, such as vital signs and lab results to predict early recognition of sepsis, have been successfully automated and implemented within electronic health records (EHRs).9-11 Successful automation of scores requiring input of diagnoses, recent medical events, and current clinical status such as the PPS remains difficult.12 Data representing these characteristics are more prone to error, and harder to translate clearly into a single data field than discrete elements like heart rate, potentially impacting validity of the calculated result.13 To improve usage of guideline based VTE risk assessment and decrease physician burden, we developed an algorithm called Automated Padua Prediction Score (APPS) that automatically calculates the PPS using only EHR data available within prior encounters and the first 4 hours of admission, a similar timeframe to when admitting providers would be entering orders. Our goal was to assess if an automatically calculated version of the PPS, a score that depends on criteria more complex than vital signs and labs, would accurately assess risk for hospital-acquired VTE when compared to traditional manual calculation of the Padua Prediction Score by a provider.
METHODS
Site Description and Ethics
The study was conducted at University of California, San Francisco Medical Center, a 790-bed academic hospital; its Institutional Review Board approved the study and collection of data via chart review. Handling of patient information complied with the Health Insurance Portability and Accountability Act of 1996.
Patient Inclusion
Adult patients admitted to a medical or surgical service between July 1, 2012 and April 1, 2014 were included in the study if they were candidates for VTEP, defined as: length of stay (LOS) greater than 2 days, not on hospice care, not pregnant at admission, no present on admission VTE diagnosis, no known contraindications to prophylaxis (eg, gastrointestinal bleed), and were not receiving therapeutic doses of warfarin, low molecular weight heparins, heparin, or novel anticoagulants prior to admission.
Data Sources
Clinical variables were extracted from the EHR’s enterprise data warehouse (EDW) by SQL Server query (Microsoft, Redmond, Washington) and deposited in a secure database. Chart review was conducted by a trained researcher (Mr. Jacolbia) using the EHR and a standardized protocol. Findings were recorded using REDCap (REDCap Consortium, Vanderbilt University, Nashville, Tennessee). The specific ICD-9, procedure, and lab codes used to determine each criterion of APPS are available in the Appendix.
Creation of the Automated Padua Prediction Score (APPS)
We developed APPS from the original 11 criteria that comprise the Padua Prediction Score: active cancer, previous VTE (excluding superficial vein thrombosis), reduced mobility, known thrombophilic condition, recent (1 month or less) trauma and/or surgery, age 70 years or older, heart and/or respiratory failure, acute myocardial infarction and/or ischemic stroke, acute infection and/or rheumatologic disorder, body mass index (BMI) 30 or higher, and ongoing hormonal treatment.13 APPS has the same scoring methodology as PPS: criteria are weighted from 1 to 3 points and summed with a maximum score of 20, representing highest risk of VTE. To automate the score calculation from data routinely available in the EHR, APPS checks pre-selected structured data fields for specific values within laboratory results, orders, nursing flowsheets and claims. Claims data included all ICD-9 and procedure codes used for billing purposes. If any of the predetermined data elements are found, then the specific criterion is considered positive; otherwise, it is scored as negative. The creators of the PPS were consulted in the generation of these data queries to replicate the original standards for deeming a criterion positive. The automated calculation required no use of natural language processing.
Characterization of Study Population
We recorded patient demographics (age, race, gender, BMI), LOS, and rate of hospital-acquired VTE. These patients were separated into 2 cohorts determined by the VTE prophylaxis they received. The risk profile of patients who received pharmacologic prophylaxis was hypothesized to be inherently different from those who had not. To evaluate APPS within this heterogeneous cohort, patients were divided into 2 major categories: pharmacologic vs. no pharmacologic prophylaxis. If they had a completed order or medication administration record on the institution’s approved formulary for pharmacologic VTEP, they were considered to have received pharmacologic prophylaxis. If they had only a completed order for usage of mechanical prophylaxis (sequential compression devices) or no evidence of any form of VTEP, they were considered to have received no pharmacologic prophylaxis. Patients with evidence of both pharmacologic and mechanical were placed in the pharmacologic prophylaxis group. To ensure that automated designation of prophylaxis group was accurate, we reviewed 40 randomly chosen charts because prior researchers were able to achieve sensitivity and specificity greater than 90% with that sample size.14
The primary outcome of hospital-acquired VTE was defined as an ICD-9 code for VTE (specific codes are found in the Appendix) paired with a “present on admission = no” flag on that encounter’s hospital billing data, abstracted from the EDW. A previous study at this institution used the same methodology and found 212/226 (94%) of patients with a VTE ICD-9 code on claim had evidence of a hospital-acquired VTE event upon chart review.14 Chart review was also completed to ensure that the primary outcome of newly discovered hospital-acquired VTE was differentiated from chronic VTE or history of VTE. Theoretically, ICD-9 codes and other data elements treat chronic VTE, history of VTE, and hospital-acquired VTE as distinct diagnoses, but it was unclear if this was true in our dataset. For 75 randomly selected cases of presumed hospital-acquired VTE, charts were reviewed for evidence that confirmed newly found VTE during that encounter.
Validation of APPS through Comparison to Manual Calculation of the Original PPS
To compare our automated calculation to standard clinical practice, we manually calculated the PPS through chart review within the first 2 days of admission on 300 random patients, a subsample of the entire study cohort. The largest study we could find had manually calculated the PPS of 1,080 hospitalized patients with a mean PPS of 4.86 (standard deviation [SD], 2.26).15 One researcher (Mr. Jacolbia) accessed the EHR with all patient information available to physicians, including admission notes, orders, labs, flowsheets, past medical history, and all prior encounters to calculate and record the PPS. To limit potential score bias, 2 authors (Drs. Elias and Davies) assessed 30 randomly selected charts from the cohort of 300. The standardized chart review protocol mimicked a physician’s approach to determine if a patient met a criterion, such as concluding if he/she had active cancer by examining medication lists for chemotherapy, procedure notes for radiation, and recent diagnoses on problem lists. After the original PPS was manually calculated, APPS was automatically calculated for the same 300 patients. We intended to characterize similarities and differences between APPS and manual calculation prior to investigating APPS’ predictive capacity for the entire study population, because it would not be feasible to manually calculate the PPS for all 30,726 patients.
Statistical Analysis
For the 75 randomly selected cases of presumed hospital-acquired VTE, the number of cases was chosen by powering our analysis to find a difference in proportion of 20% with 90% power, α = 0.05 (two-sided). We conducted χ2 tests on the entire study cohort to determine if there were significant differences in demographics, LOS, and incidence of hospital-acquired VTE by prophylaxis received. For both the pharmacologic and the no pharmacologic prophylaxis groups, we conducted 2-sample Student t tests to determine significant differences in demographics and LOS between patients who experienced a hospital-acquired VTE and those who did not.
For the comparison of our automated calculation to standard clinical practice, we manually calculated the PPS through chart review within the first 2 days of admission on a subsample of 300 random patients. We powered our analysis to detect a difference in mean PPS from 4.86 to 4.36, enough to alter the point value, with 90% power and α = 0.05 (two-sided) and found 300 patients to be comfortably above the required sample size. We compared APPS and manual calculation in the 300-patient cohort using: 2-sample Student t tests to compare mean scores, χ2 tests to compare the frequency with which criteria were positive, and receiver operating characteristic (ROC) curves to determine capacity to predict a hospital-acquired VTE event. Pearson’s correlation was also completed to assess score agreement between APPS and manual calculation on a per-patient basis. After comparing automated calculation of APPS to manual chart review on the same 300 patients, we used APPS to calculate scores for the entire study cohort (n = 30,726). We calculated the mean of APPS by prophylaxis group and whether hospital-acquired VTE had occurred. We analyzed APPS’ ROC curve statistics by prophylaxis group to determine its overall predictive capacity in our study population. Lastly, we computed the time required to calculate APPS per patient. Statistical analyses were conducted using SPSS Statistics (IBM, Armonk, New York) and Python 2.7 (Python Software Foundation, Beaverton, Oregon); 95% confidence intervals (CI) and (SD) were reported when appropriate.
RESULTS
Among the 30,726 unique patients in our entire cohort (all patients admitted during the time period who met the study criteria), we found 6574 (21.4%) on pharmacologic (with or without mechanical) prophylaxis, 13,511 (44.0%) on mechanical only, and 10,641 (34.6%) on no prophylaxis. χ2 tests found no significant differences in demographics, LOS, or incidence of hospital-acquired VTE between the patients who received mechanical prophylaxis only and those who received no prophylaxis (Table 1). Similarly, there were no differences in these characteristics in patients receiving pharmacologic prophylaxis with or without the addition of mechanical prophylaxis. Designation of prophylaxis group by manual chart review vs. our automated process was found to agree in categorization for 39/40 (97.5%) sampled encounters. When comparing the cohort that received pharmacologic prophylaxis against the cohort that did not, there were significant differences in racial distribution, sex, BMI, and average LOS as shown in Table 1. Those who received pharmacologic prophylaxis were found to be significantly older than those who did not (62.7 years versus 53.2 years, P < 0.001), more likely to be male (50.6% vs, 42.4%, P < 0.001), more likely to have hospital-acquired VTE (2.2% vs. 0.5%, P < 0.001), and to have a shorter LOS (7.1 days vs. 9.8, P < 0.001).

Within the cohort group receiving pharmacologic prophylaxis (n = 6574), hospital-acquired VTE occurred in patients who were significantly younger (58.2 years vs. 62.8 years, P = 0.003) with a greater LOS (23.8 days vs. 6.7, P < 0.001) than those without. Within the group receiving no pharmacologic prophylaxis (n = 24,152), hospital-acquired VTE occurred in patients who were significantly older (57.1 years vs. 53.2 years, P = 0.014) with more than twice the LOS (20.2 days vs. 9.7 days, P < 0.001) compared to those without. Sixty-six of 75 (88%) randomly selected patients in which new VTE was identified by the automated electronic query had this diagnosis confirmed during manual chart review.
As shown in Table 2, automated calculation on a subsample of 300 randomly selected patients using APPS had a mean of 5.5 (SD, 2.9) while manual calculation of the original PPS on the same patients had a mean of 5.1 (SD, 2.6). There was no significant difference in mean between manual calculation and APPS (P = 0.073). There were, however, significant differences in how often individual criteria were considered present. The largest contributors to the difference in scores between APPS and manual calculation were “prior VTE” (positive, 16% vs. 8.3%, respectively) and “reduced mobility” (positive, 74.3% vs. 66%, respectively) as shown in Table 2. In the subsample, there were a total of 6 (2.0%) hospital-acquired VTE events. APPS’ automated calculation had an AUC = 0.79 (CI, 0.63-0.95) that was significant (P = 0.016) with a cutoff value of 5. Chart review’s manual calculation of the PPS had an AUC = 0.76 (CI 0.61-0.91) that was also significant (P = 0.029).
Distribution of Patient Characteristics in Cohort
Our entire cohort of 30,726 unique patients admitted during the study period included 260 (0.8%) who experienced hospital-acquired VTEs (Table 3). In patients receiving no pharmacologic prophylaxis, the average APPS was 4.0 (SD, 2.4) for those without VTE and 7.1 (SD, 2.3) for those with VTE. In patients who had received pharmacologic prophylaxis, those without hospital-acquired VTE had an average APPS of 4.9 (SD, 2.6) and those with hospital-acquired VTE averaged 7.7 (SD, 2.6). APPS’ ROC curves for “no pharmacologic prophylaxis” had an AUC = 0.81 (CI, 0.79 – 0.83) that was significant (P < 0.001) with a cutoff value of 5. There was similar performance in the pharmacologic prophylaxis group with an AUC = 0.79 (CI, 0.76 – 0.82) and cutoff value of 5, as shown in the Figure. Over the entire cohort, APPS had a sensitivity of 85.4%, specificity of 53.3%, positive predictive value (PPV) of 1.5%, and a negative predictive value (NPV) of 99.8% when using a cutoff of 5. The average APPS calculation time was 0.03 seconds per encounter. Additional information on individual criteria can be found in Table 3.

DISCUSSION
Automated calculation of APPS using EHR data from prior encounters and the first 4 hours of admission was predictive of in-hospital VTE. APPS performed as well as traditional manual score calculation of the PPS. It was able to do so with no physician input, significantly lessening the burden of calculation and potentially increasing frequency of data-driven VTE risk assessment.
While automated calculation of certain scores is becoming more common, risk calculators that require data beyond vital signs and lab results have lagged,16-19 in part because of uncertainty about 2 issues. The first is whether EHR data accurately represent the current clinical picture. The second is if a machine-interpretable algorithm to determine a clinical status (eg, “active cancer”) would be similar to a doctor’s perception of that same concept. We attempted to better understand these 2 challenges through developing APPS. Concerning accuracy, EHR data correctly represent the clinical scenario: designations of VTEP and hospital-acquired VTE were accurate in approximately 90% of reviewed cases. Regarding the second concern, when comparing APPS to manual calculation, we found significant differences (P < 0.001) in how often 8 of the 11 criteria were positive, yet no significant difference in overall score and similar predictive capacity. Manual calculation appeared more likely to find data in the index encounter or in structured data. For example, “active cancer” may be documented only in a physician’s note, easily accounted for during a physician’s calculation but missed by APPS looking only for structured data. In contrast, automated calculation found historic criteria, such as “prior VTE” or “known thrombophilic condition,” positive more often. If the patient is being admitted for a problem unrelated to blood clots, the physician may have little time or interest to look through hundreds of EHR documents to discover a 2-year-old VTE. As patients’ records become larger and denser, more historic data can become buried and forgotten. While the 2 scores differ on individual criteria, they are similarly predictive and able to bifurcate the at-risk population to those who should and should not receive pharmacologic prophylaxis.

The APPS was found to have near-equal performance in the pharmacologic vs. no pharmacologic prophylaxis cohorts. This finding agrees with a study that found no significant difference in predicting 90-day VTE when looking at 86 risk factors vs. the most significant 4, none of which related to prescribed prophylaxis.18 The original PPS had a reported sensitivity of 94.6%, specificity 62%, PPV 7.5%, and NPV 99.7% in its derivation cohort.13 We matched APPS to the ratio of sensitivity to specificity, using 5 as the cutoff value. APPS performed slightly worse with sensitivity of 85.4%, specificity 53.3%, PPV 1.5%, and NPV 99.8%. This difference may have resulted from the original PPS study’s use of 90-day follow-up to determine VTE occurrence, whereas we looked only until the end of current hospitalization, an average of 9.2 days. Furthermore, the PPS had significantly poorer performance (AUC = 0.62) than that seen in the original derivation cohort in a separate study that manually calculated the score on more than 1000 patients.15
There are important limitations to our study. It was done at a single academic institution using a dataset of VTE-associated, validated research that was well-known to the researchers.20 Another major limitation is the dependence of the algorithm on data available within the first 4 hours of admission and earlier; thus, previous encounters may frequently play an important role. Patients presenting to our health system for the first time would have significantly fewer data available at the time of calculation. Additionally, our data could not reliably tell us the total doses of pharmacologic prophylaxis that a patient received. While most patients will maintain a consistent VTEP regimen once initiated in the hospital, 2 patients with the same LOS may have received differing amounts of pharmacologic prophylaxis. This research study did not assess how much time automatic calculation of VTE risk might save providers, because we did not record the time for each manual abstraction; however, from discussion with the main abstracter, chart review and manual calculation for this study took from 2 to 14 minutes per patient, depending on the number of previous interactions with the health system. Finally, although we chose data elements that are likely to exist at most institutions using an EHR, many institutions’ EHRs do not have EDW capabilities nor programmers who can assist with an automated risk score.
The EHR interventions to assist providers in determining appropriate VTEP have been able to increase rates of VTEP and decrease VTE-associated mortality.16,21 In addition to automating the calculation of guideline-adherent risk scores, there is a need for wider adoption for clinical decision support for VTE. For this reason, we chose only structured data fields from some of the most common elements within our EHR’s data warehouse to derive APPS (Appendix 1). Our study supports the idea that automated calculation of scores requiring input of more complex data such as diagnoses, recent medical events, and current clinical status remains predictive of hospital-acquired VTE risk. Because it is calculated automatically in the background while the clinician completes his or her assessment, the APPS holds the potential to significantly reduce the burden on providers while making guideline-adherent risk assessment more readily accessible. Further research is required to determine the exact amount of time automatic calculation saves, and, more important, if the relatively high predictive capacity we observed using APPS would be reproducible across institutions and could reduce incidence of hospital-acquired VTE.
Disclosures
Dr. Auerbach was supported by NHLBI K24HL098372 during the period of this study. Dr. Khanna, who is an implementation scientist at the University of California San Francisco Center for Digital Health Innovation, is the principal inventor of CareWeb, and may benefit financially from its commercialization. The other authors report no financial conflicts of interest.
1. Galson S. The Surgeon General’s call to action to prevent deep vein thrombosis and pulmonary embolism. 2008. https://www.ncbi.nlm.nih.gov/books/NBK44178/. Accessed February 11, 2016. PubMed
2. Borch KH, Nyegaard C, Hansen JB, et al. Joint effects of obesity and body height on the risk of venous thromboembolism: the Tromsø study. Arterioscler Thromb Vasc Biol. 2011;31(6):1439-44. PubMed
3. Braekkan SK, Borch KH, Mathiesen EB, Njølstad I, Wilsgaard T, Hansen JB.. Body height and risk of venous thromboembolism: the Tromsø Study. Am J Epidemiol. 2010;171(10):1109-1115. PubMed
4. Bounameaux H, Rosendaal FR. Venous thromboembolism: why does ethnicity matter? Circulation. 2011;123(200:2189-2191. PubMed
5. Spyropoulos AC, Anderson FA Jr, Fitzgerald G, et al; IMPROVE Investigators. Predictive and associative models to identify hospitalized medical patients at risk for VTE. Chest. 2011;140(3):706-714. PubMed
6. Rothberg MB, Lindenauer PK, Lahti M, Pekow PS, Selker HP. Risk factor model to predict venous thromboembolism in hospitalized medical patients. J Hosp Med. 2011;6(4):202-209. PubMed
7. Perioperative Management of Antithrombotic Therapy: Prevention of VTE in Nonsurgical Patients: Antithrombotic Therapy and Prevention of Thrombosis, 9th ed: American College of Chest Physicians Evidence-Based Clinical Practice Guidelines. Chest. 2012;141(6):1645.
8. Subbe CP, Kruger M, Rutherford P, Gemmel L. Validation of a modified Early Warning Score in medical admissions. QJM. 2001;94(10):521-526. PubMed
9. Alvarez CA, Clark CA, Zhang S, et al. Predicting out of intensive care unit cardiopulmonary arrest or death using electronic medical record data. BMC Med Inform Decis Mak. 2013;13:28. PubMed
10. Escobar GJ, LaGuardia JC, Turk BJ, Ragins A, Kipnis P, Draper D. Early detection of impending physiologic deterioration among patients who are not in intensive care: development of predictive models using data from an automated electronic medical record. J Hosp Med. 2012;7(5):388-395. PubMed
11. Umscheid CA, Hanish A, Chittams J, Weiner MG, Hecht TE. Effectiveness of a novel and scalable clinical decision support intervention to improve venous thromboembolism prophylaxis: a quasi-experimental study. BMC Med Inform Decis Mak. 2012;12:92. PubMed
12. Tepas JJ 3rd, Rimar JM, Hsiao AL, Nussbaum MS. Automated analysis of electronic medical record data reflects the pathophysiology of operative complications. Surgery. 2013;154(4):918-924. PubMed
13. Barbar S, Noventa F, Rossetto V, et al. A risk assessment model for the identification of hospitalized medical patients at risk for venous thromboembolism: the Padua Prediction Score. J Thromb Haemost. 2010; 8(11):2450-2457. PubMed
14. Khanna R, Maynard G, Sadeghi B, et al. Incidence of hospital-acquired venous thromboembolic codes in medical patients hospitalized in academic medical centers. J Hosp Med. 2014; 9(4):221-225. PubMed
15. Vardi M, Ghanem-Zoubi NO, Zidan R, Yurin V, Bitterman H. Venous thromboembolism and the utility of the Padua Prediction Score in patients with sepsis admitted to internal medicine departments. J Thromb Haemost. 2013;11(3):467-473. PubMed
16. Samama MM, Dahl OE, Mismetti P, et al. An electronic tool for venous thromboembolism prevention in medical and surgical patients. Haematologica. 2006;91(1):64-70. PubMed
17. Mann DM, Kannry JL, Edonyabo D, et al. Rationale, design, and implementation protocol of an electronic health record integrated clinical prediction rule (iCPR) randomized trial in primary care. Implement Sci. 2011;6:109. PubMed
18. Woller SC, Stevens SM, Jones JP, et al. Derivation and validation of a simple model to identify venous thromboembolism risk in medical patients. Am J Med. 2011;124(10):947-954. PubMed
19. Huang W, Anderson FA, Spencer FA, Gallus A, Goldberg RJ. Risk-assessment models for predicting venous thromboembolism among hospitalized non-surgical patients: a systematic review. J Thromb Thrombolysis. 2013;35(1):67-80. PubMed
20. Khanna RR, Kim SB, Jenkins I, et al. Predictive value of the present-on-admission indicator for hospital-acquired venous thromboembolism. Med Care. 2015;53(4):e31-e36. PubMed
21. Kucher N, Koo S, Quiroz R, et al. Electronic alerts to prevent venous thromboembolism a
Hospital-acquired venous thromboembolism (VTE) continues to be a critical quality challenge for U.S. hospitals,1 and high-risk patients are often not adequately prophylaxed. Use of VTE prophylaxis (VTEP) varies as widely as 26% to 85% of patients in various studies, as does patient outcomes and care expenditures.2-6 The 9th edition of the American College of Chest Physicians (CHEST) guidelines7 recommend the Padua Prediction Score (PPS) to select individual patients who may be at high risk for venous thromboembolism (VTE) and could benefit from thromboprophylaxis. Use of the manually calculated PPS to select patients for thromboprophylaxis has been shown to help decrease 30-day and 90-day mortality associated with VTE events after hospitalization to medical services.8 However, the PPS requires time-consuming manual calculation by a provider, who may be focused on more immediate aspects of patient care and several other risk scores competing for his attention, potentially decreasing its use.
Other risk scores that use only discrete scalar data, such as vital signs and lab results to predict early recognition of sepsis, have been successfully automated and implemented within electronic health records (EHRs).9-11 Successful automation of scores requiring input of diagnoses, recent medical events, and current clinical status such as the PPS remains difficult.12 Data representing these characteristics are more prone to error, and harder to translate clearly into a single data field than discrete elements like heart rate, potentially impacting validity of the calculated result.13 To improve usage of guideline based VTE risk assessment and decrease physician burden, we developed an algorithm called Automated Padua Prediction Score (APPS) that automatically calculates the PPS using only EHR data available within prior encounters and the first 4 hours of admission, a similar timeframe to when admitting providers would be entering orders. Our goal was to assess if an automatically calculated version of the PPS, a score that depends on criteria more complex than vital signs and labs, would accurately assess risk for hospital-acquired VTE when compared to traditional manual calculation of the Padua Prediction Score by a provider.
METHODS
Site Description and Ethics
The study was conducted at University of California, San Francisco Medical Center, a 790-bed academic hospital; its Institutional Review Board approved the study and collection of data via chart review. Handling of patient information complied with the Health Insurance Portability and Accountability Act of 1996.
Patient Inclusion
Adult patients admitted to a medical or surgical service between July 1, 2012 and April 1, 2014 were included in the study if they were candidates for VTEP, defined as: length of stay (LOS) greater than 2 days, not on hospice care, not pregnant at admission, no present on admission VTE diagnosis, no known contraindications to prophylaxis (eg, gastrointestinal bleed), and were not receiving therapeutic doses of warfarin, low molecular weight heparins, heparin, or novel anticoagulants prior to admission.
Data Sources
Clinical variables were extracted from the EHR’s enterprise data warehouse (EDW) by SQL Server query (Microsoft, Redmond, Washington) and deposited in a secure database. Chart review was conducted by a trained researcher (Mr. Jacolbia) using the EHR and a standardized protocol. Findings were recorded using REDCap (REDCap Consortium, Vanderbilt University, Nashville, Tennessee). The specific ICD-9, procedure, and lab codes used to determine each criterion of APPS are available in the Appendix.
Creation of the Automated Padua Prediction Score (APPS)
We developed APPS from the original 11 criteria that comprise the Padua Prediction Score: active cancer, previous VTE (excluding superficial vein thrombosis), reduced mobility, known thrombophilic condition, recent (1 month or less) trauma and/or surgery, age 70 years or older, heart and/or respiratory failure, acute myocardial infarction and/or ischemic stroke, acute infection and/or rheumatologic disorder, body mass index (BMI) 30 or higher, and ongoing hormonal treatment.13 APPS has the same scoring methodology as PPS: criteria are weighted from 1 to 3 points and summed with a maximum score of 20, representing highest risk of VTE. To automate the score calculation from data routinely available in the EHR, APPS checks pre-selected structured data fields for specific values within laboratory results, orders, nursing flowsheets and claims. Claims data included all ICD-9 and procedure codes used for billing purposes. If any of the predetermined data elements are found, then the specific criterion is considered positive; otherwise, it is scored as negative. The creators of the PPS were consulted in the generation of these data queries to replicate the original standards for deeming a criterion positive. The automated calculation required no use of natural language processing.
Characterization of Study Population
We recorded patient demographics (age, race, gender, BMI), LOS, and rate of hospital-acquired VTE. These patients were separated into 2 cohorts determined by the VTE prophylaxis they received. The risk profile of patients who received pharmacologic prophylaxis was hypothesized to be inherently different from those who had not. To evaluate APPS within this heterogeneous cohort, patients were divided into 2 major categories: pharmacologic vs. no pharmacologic prophylaxis. If they had a completed order or medication administration record on the institution’s approved formulary for pharmacologic VTEP, they were considered to have received pharmacologic prophylaxis. If they had only a completed order for usage of mechanical prophylaxis (sequential compression devices) or no evidence of any form of VTEP, they were considered to have received no pharmacologic prophylaxis. Patients with evidence of both pharmacologic and mechanical were placed in the pharmacologic prophylaxis group. To ensure that automated designation of prophylaxis group was accurate, we reviewed 40 randomly chosen charts because prior researchers were able to achieve sensitivity and specificity greater than 90% with that sample size.14
The primary outcome of hospital-acquired VTE was defined as an ICD-9 code for VTE (specific codes are found in the Appendix) paired with a “present on admission = no” flag on that encounter’s hospital billing data, abstracted from the EDW. A previous study at this institution used the same methodology and found 212/226 (94%) of patients with a VTE ICD-9 code on claim had evidence of a hospital-acquired VTE event upon chart review.14 Chart review was also completed to ensure that the primary outcome of newly discovered hospital-acquired VTE was differentiated from chronic VTE or history of VTE. Theoretically, ICD-9 codes and other data elements treat chronic VTE, history of VTE, and hospital-acquired VTE as distinct diagnoses, but it was unclear if this was true in our dataset. For 75 randomly selected cases of presumed hospital-acquired VTE, charts were reviewed for evidence that confirmed newly found VTE during that encounter.
Validation of APPS through Comparison to Manual Calculation of the Original PPS
To compare our automated calculation to standard clinical practice, we manually calculated the PPS through chart review within the first 2 days of admission on 300 random patients, a subsample of the entire study cohort. The largest study we could find had manually calculated the PPS of 1,080 hospitalized patients with a mean PPS of 4.86 (standard deviation [SD], 2.26).15 One researcher (Mr. Jacolbia) accessed the EHR with all patient information available to physicians, including admission notes, orders, labs, flowsheets, past medical history, and all prior encounters to calculate and record the PPS. To limit potential score bias, 2 authors (Drs. Elias and Davies) assessed 30 randomly selected charts from the cohort of 300. The standardized chart review protocol mimicked a physician’s approach to determine if a patient met a criterion, such as concluding if he/she had active cancer by examining medication lists for chemotherapy, procedure notes for radiation, and recent diagnoses on problem lists. After the original PPS was manually calculated, APPS was automatically calculated for the same 300 patients. We intended to characterize similarities and differences between APPS and manual calculation prior to investigating APPS’ predictive capacity for the entire study population, because it would not be feasible to manually calculate the PPS for all 30,726 patients.
Statistical Analysis
For the 75 randomly selected cases of presumed hospital-acquired VTE, the number of cases was chosen by powering our analysis to find a difference in proportion of 20% with 90% power, α = 0.05 (two-sided). We conducted χ2 tests on the entire study cohort to determine if there were significant differences in demographics, LOS, and incidence of hospital-acquired VTE by prophylaxis received. For both the pharmacologic and the no pharmacologic prophylaxis groups, we conducted 2-sample Student t tests to determine significant differences in demographics and LOS between patients who experienced a hospital-acquired VTE and those who did not.
For the comparison of our automated calculation to standard clinical practice, we manually calculated the PPS through chart review within the first 2 days of admission on a subsample of 300 random patients. We powered our analysis to detect a difference in mean PPS from 4.86 to 4.36, enough to alter the point value, with 90% power and α = 0.05 (two-sided) and found 300 patients to be comfortably above the required sample size. We compared APPS and manual calculation in the 300-patient cohort using: 2-sample Student t tests to compare mean scores, χ2 tests to compare the frequency with which criteria were positive, and receiver operating characteristic (ROC) curves to determine capacity to predict a hospital-acquired VTE event. Pearson’s correlation was also completed to assess score agreement between APPS and manual calculation on a per-patient basis. After comparing automated calculation of APPS to manual chart review on the same 300 patients, we used APPS to calculate scores for the entire study cohort (n = 30,726). We calculated the mean of APPS by prophylaxis group and whether hospital-acquired VTE had occurred. We analyzed APPS’ ROC curve statistics by prophylaxis group to determine its overall predictive capacity in our study population. Lastly, we computed the time required to calculate APPS per patient. Statistical analyses were conducted using SPSS Statistics (IBM, Armonk, New York) and Python 2.7 (Python Software Foundation, Beaverton, Oregon); 95% confidence intervals (CI) and (SD) were reported when appropriate.
RESULTS
Among the 30,726 unique patients in our entire cohort (all patients admitted during the time period who met the study criteria), we found 6574 (21.4%) on pharmacologic (with or without mechanical) prophylaxis, 13,511 (44.0%) on mechanical only, and 10,641 (34.6%) on no prophylaxis. χ2 tests found no significant differences in demographics, LOS, or incidence of hospital-acquired VTE between the patients who received mechanical prophylaxis only and those who received no prophylaxis (Table 1). Similarly, there were no differences in these characteristics in patients receiving pharmacologic prophylaxis with or without the addition of mechanical prophylaxis. Designation of prophylaxis group by manual chart review vs. our automated process was found to agree in categorization for 39/40 (97.5%) sampled encounters. When comparing the cohort that received pharmacologic prophylaxis against the cohort that did not, there were significant differences in racial distribution, sex, BMI, and average LOS as shown in Table 1. Those who received pharmacologic prophylaxis were found to be significantly older than those who did not (62.7 years versus 53.2 years, P < 0.001), more likely to be male (50.6% vs, 42.4%, P < 0.001), more likely to have hospital-acquired VTE (2.2% vs. 0.5%, P < 0.001), and to have a shorter LOS (7.1 days vs. 9.8, P < 0.001).
Within the cohort group receiving pharmacologic prophylaxis (n = 6574), hospital-acquired VTE occurred in patients who were significantly younger (58.2 years vs. 62.8 years, P = 0.003) with a greater LOS (23.8 days vs. 6.7, P < 0.001) than those without. Within the group receiving no pharmacologic prophylaxis (n = 24,152), hospital-acquired VTE occurred in patients who were significantly older (57.1 years vs. 53.2 years, P = 0.014) with more than twice the LOS (20.2 days vs. 9.7 days, P < 0.001) compared to those without. Sixty-six of 75 (88%) randomly selected patients in which new VTE was identified by the automated electronic query had this diagnosis confirmed during manual chart review.
As shown in Table 2, automated calculation on a subsample of 300 randomly selected patients using APPS had a mean of 5.5 (SD, 2.9) while manual calculation of the original PPS on the same patients had a mean of 5.1 (SD, 2.6). There was no significant difference in mean between manual calculation and APPS (P = 0.073). There were, however, significant differences in how often individual criteria were considered present. The largest contributors to the difference in scores between APPS and manual calculation were “prior VTE” (positive, 16% vs. 8.3%, respectively) and “reduced mobility” (positive, 74.3% vs. 66%, respectively) as shown in Table 2. In the subsample, there were a total of 6 (2.0%) hospital-acquired VTE events. APPS’ automated calculation had an AUC = 0.79 (CI, 0.63-0.95) that was significant (P = 0.016) with a cutoff value of 5. Chart review’s manual calculation of the PPS had an AUC = 0.76 (CI 0.61-0.91) that was also significant (P = 0.029).
Distribution of Patient Characteristics in Cohort
Our entire cohort of 30,726 unique patients admitted during the study period included 260 (0.8%) who experienced hospital-acquired VTEs (Table 3). In patients receiving no pharmacologic prophylaxis, the average APPS was 4.0 (SD, 2.4) for those without VTE and 7.1 (SD, 2.3) for those with VTE. In patients who had received pharmacologic prophylaxis, those without hospital-acquired VTE had an average APPS of 4.9 (SD, 2.6) and those with hospital-acquired VTE averaged 7.7 (SD, 2.6). APPS’ ROC curves for “no pharmacologic prophylaxis” had an AUC = 0.81 (CI, 0.79 – 0.83) that was significant (P < 0.001) with a cutoff value of 5. There was similar performance in the pharmacologic prophylaxis group with an AUC = 0.79 (CI, 0.76 – 0.82) and cutoff value of 5, as shown in the Figure. Over the entire cohort, APPS had a sensitivity of 85.4%, specificity of 53.3%, positive predictive value (PPV) of 1.5%, and a negative predictive value (NPV) of 99.8% when using a cutoff of 5. The average APPS calculation time was 0.03 seconds per encounter. Additional information on individual criteria can be found in Table 3.
DISCUSSION
Automated calculation of APPS using EHR data from prior encounters and the first 4 hours of admission was predictive of in-hospital VTE. APPS performed as well as traditional manual score calculation of the PPS. It was able to do so with no physician input, significantly lessening the burden of calculation and potentially increasing frequency of data-driven VTE risk assessment.
While automated calculation of certain scores is becoming more common, risk calculators that require data beyond vital signs and lab results have lagged,16-19 in part because of uncertainty about 2 issues. The first is whether EHR data accurately represent the current clinical picture. The second is if a machine-interpretable algorithm to determine a clinical status (eg, “active cancer”) would be similar to a doctor’s perception of that same concept. We attempted to better understand these 2 challenges through developing APPS. Concerning accuracy, EHR data correctly represent the clinical scenario: designations of VTEP and hospital-acquired VTE were accurate in approximately 90% of reviewed cases. Regarding the second concern, when comparing APPS to manual calculation, we found significant differences (P < 0.001) in how often 8 of the 11 criteria were positive, yet no significant difference in overall score and similar predictive capacity. Manual calculation appeared more likely to find data in the index encounter or in structured data. For example, “active cancer” may be documented only in a physician’s note, easily accounted for during a physician’s calculation but missed by APPS looking only for structured data. In contrast, automated calculation found historic criteria, such as “prior VTE” or “known thrombophilic condition,” positive more often. If the patient is being admitted for a problem unrelated to blood clots, the physician may have little time or interest to look through hundreds of EHR documents to discover a 2-year-old VTE. As patients’ records become larger and denser, more historic data can become buried and forgotten. While the 2 scores differ on individual criteria, they are similarly predictive and able to bifurcate the at-risk population to those who should and should not receive pharmacologic prophylaxis.
The APPS was found to have near-equal performance in the pharmacologic vs. no pharmacologic prophylaxis cohorts. This finding agrees with a study that found no significant difference in predicting 90-day VTE when looking at 86 risk factors vs. the most significant 4, none of which related to prescribed prophylaxis.18 The original PPS had a reported sensitivity of 94.6%, specificity 62%, PPV 7.5%, and NPV 99.7% in its derivation cohort.13 We matched APPS to the ratio of sensitivity to specificity, using 5 as the cutoff value. APPS performed slightly worse with sensitivity of 85.4%, specificity 53.3%, PPV 1.5%, and NPV 99.8%. This difference may have resulted from the original PPS study’s use of 90-day follow-up to determine VTE occurrence, whereas we looked only until the end of current hospitalization, an average of 9.2 days. Furthermore, the PPS had significantly poorer performance (AUC = 0.62) than that seen in the original derivation cohort in a separate study that manually calculated the score on more than 1000 patients.15
There are important limitations to our study. It was done at a single academic institution using a dataset of VTE-associated, validated research that was well-known to the researchers.20 Another major limitation is the dependence of the algorithm on data available within the first 4 hours of admission and earlier; thus, previous encounters may frequently play an important role. Patients presenting to our health system for the first time would have significantly fewer data available at the time of calculation. Additionally, our data could not reliably tell us the total doses of pharmacologic prophylaxis that a patient received. While most patients will maintain a consistent VTEP regimen once initiated in the hospital, 2 patients with the same LOS may have received differing amounts of pharmacologic prophylaxis. This research study did not assess how much time automatic calculation of VTE risk might save providers, because we did not record the time for each manual abstraction; however, from discussion with the main abstracter, chart review and manual calculation for this study took from 2 to 14 minutes per patient, depending on the number of previous interactions with the health system. Finally, although we chose data elements that are likely to exist at most institutions using an EHR, many institutions’ EHRs do not have EDW capabilities nor programmers who can assist with an automated risk score.
The EHR interventions to assist providers in determining appropriate VTEP have been able to increase rates of VTEP and decrease VTE-associated mortality.16,21 In addition to automating the calculation of guideline-adherent risk scores, there is a need for wider adoption for clinical decision support for VTE. For this reason, we chose only structured data fields from some of the most common elements within our EHR’s data warehouse to derive APPS (Appendix 1). Our study supports the idea that automated calculation of scores requiring input of more complex data such as diagnoses, recent medical events, and current clinical status remains predictive of hospital-acquired VTE risk. Because it is calculated automatically in the background while the clinician completes his or her assessment, the APPS holds the potential to significantly reduce the burden on providers while making guideline-adherent risk assessment more readily accessible. Further research is required to determine the exact amount of time automatic calculation saves, and, more important, if the relatively high predictive capacity we observed using APPS would be reproducible across institutions and could reduce incidence of hospital-acquired VTE.
Disclosures
Dr. Auerbach was supported by NHLBI K24HL098372 during the period of this study. Dr. Khanna, who is an implementation scientist at the University of California San Francisco Center for Digital Health Innovation, is the principal inventor of CareWeb, and may benefit financially from its commercialization. The other authors report no financial conflicts of interest.
1. Galson S. The Surgeon General’s call to action to prevent deep vein thrombosis and pulmonary embolism. 2008. https://www.ncbi.nlm.nih.gov/books/NBK44178/. Accessed February 11, 2016. PubMed
2. Borch KH, Nyegaard C, Hansen JB, et al. Joint effects of obesity and body height on the risk of venous thromboembolism: the Tromsø study. Arterioscler Thromb Vasc Biol. 2011;31(6):1439-44. PubMed
3. Braekkan SK, Borch KH, Mathiesen EB, Njølstad I, Wilsgaard T, Hansen JB.. Body height and risk of venous thromboembolism: the Tromsø Study. Am J Epidemiol. 2010;171(10):1109-1115. PubMed
4. Bounameaux H, Rosendaal FR. Venous thromboembolism: why does ethnicity matter? Circulation. 2011;123(200:2189-2191. PubMed
5. Spyropoulos AC, Anderson FA Jr, Fitzgerald G, et al; IMPROVE Investigators. Predictive and associative models to identify hospitalized medical patients at risk for VTE. Chest. 2011;140(3):706-714. PubMed
6. Rothberg MB, Lindenauer PK, Lahti M, Pekow PS, Selker HP. Risk factor model to predict venous thromboembolism in hospitalized medical patients. J Hosp Med. 2011;6(4):202-209. PubMed
7. Perioperative Management of Antithrombotic Therapy: Prevention of VTE in Nonsurgical Patients: Antithrombotic Therapy and Prevention of Thrombosis, 9th ed: American College of Chest Physicians Evidence-Based Clinical Practice Guidelines. Chest. 2012;141(6):1645.
8. Subbe CP, Kruger M, Rutherford P, Gemmel L. Validation of a modified Early Warning Score in medical admissions. QJM. 2001;94(10):521-526. PubMed
9. Alvarez CA, Clark CA, Zhang S, et al. Predicting out of intensive care unit cardiopulmonary arrest or death using electronic medical record data. BMC Med Inform Decis Mak. 2013;13:28. PubMed
10. Escobar GJ, LaGuardia JC, Turk BJ, Ragins A, Kipnis P, Draper D. Early detection of impending physiologic deterioration among patients who are not in intensive care: development of predictive models using data from an automated electronic medical record. J Hosp Med. 2012;7(5):388-395. PubMed
11. Umscheid CA, Hanish A, Chittams J, Weiner MG, Hecht TE. Effectiveness of a novel and scalable clinical decision support intervention to improve venous thromboembolism prophylaxis: a quasi-experimental study. BMC Med Inform Decis Mak. 2012;12:92. PubMed
12. Tepas JJ 3rd, Rimar JM, Hsiao AL, Nussbaum MS. Automated analysis of electronic medical record data reflects the pathophysiology of operative complications. Surgery. 2013;154(4):918-924. PubMed
13. Barbar S, Noventa F, Rossetto V, et al. A risk assessment model for the identification of hospitalized medical patients at risk for venous thromboembolism: the Padua Prediction Score. J Thromb Haemost. 2010; 8(11):2450-2457. PubMed
14. Khanna R, Maynard G, Sadeghi B, et al. Incidence of hospital-acquired venous thromboembolic codes in medical patients hospitalized in academic medical centers. J Hosp Med. 2014; 9(4):221-225. PubMed
15. Vardi M, Ghanem-Zoubi NO, Zidan R, Yurin V, Bitterman H. Venous thromboembolism and the utility of the Padua Prediction Score in patients with sepsis admitted to internal medicine departments. J Thromb Haemost. 2013;11(3):467-473. PubMed
16. Samama MM, Dahl OE, Mismetti P, et al. An electronic tool for venous thromboembolism prevention in medical and surgical patients. Haematologica. 2006;91(1):64-70. PubMed
17. Mann DM, Kannry JL, Edonyabo D, et al. Rationale, design, and implementation protocol of an electronic health record integrated clinical prediction rule (iCPR) randomized trial in primary care. Implement Sci. 2011;6:109. PubMed
18. Woller SC, Stevens SM, Jones JP, et al. Derivation and validation of a simple model to identify venous thromboembolism risk in medical patients. Am J Med. 2011;124(10):947-954. PubMed
19. Huang W, Anderson FA, Spencer FA, Gallus A, Goldberg RJ. Risk-assessment models for predicting venous thromboembolism among hospitalized non-surgical patients: a systematic review. J Thromb Thrombolysis. 2013;35(1):67-80. PubMed
20. Khanna RR, Kim SB, Jenkins I, et al. Predictive value of the present-on-admission indicator for hospital-acquired venous thromboembolism. Med Care. 2015;53(4):e31-e36. PubMed
21. Kucher N, Koo S, Quiroz R, et al. Electronic alerts to prevent venous thromboembolism a
© 2017 Society of Hospital Medicine
Impact of a Connected Care model on 30-day readmission rates from skilled nursing facilities
Approximately 20% of hospitalized Medicare beneficiaries in the U.S. are discharged to skilled nursing facilities (SNFs) for post-acute care,1,2 and 23.5% of these patients are readmitted within 30 days.3 Because hospital readmissions are costly and associated with worse outcomes,4,5 30-day readmission rates are considered a quality indicator,6 and there are financial penalties for hospitals with higher than expected rates.7 As a result, hospitals invest substantial resources in programs to reduce readmissions.8-10 The SNFs represent an attractive target for readmission reduction efforts, since SNFs contribute a disproportionate share of readmissions.3,4 Because SNF patients are in a monitored environment with high medication adherence, risk factors for readmission likely differ between patients discharged to SNFs and those sent home. For example, 1 study showed that among heart failure patients with cognitive impairment, those discharged to SNFs had lower readmissions during the first 20 days, likely due to better medication adherence.11 Patients discharged to SNFs generally have more complex illnesses, lower functional status, and higher 1-year mortality than patients discharged to the community.12,13 Despite this, SNF patients might have infrequent contact with physicians. Federal regulations require only that patients discharged to SNFs need to be seen within 30 days and then at least once every 30 days thereafter.14 According to the 2014 Office of Inspector General report, one-third of Medicare beneficiaries in SNFs experience adverse events from substandard treatment, inadequate resident monitoring and failure or delay of necessary care, most of which are thought to be preventable.15
To address this issue, the Cleveland Clinic developed a program called “Connected Care SNF,” in which hospital-employed physicians and advanced practice professionals visit patients in selected SNFs 4 to 5 times per week, for the purpose of reducing preventable readmissions. The aim of this study was to assess whether the program reduced 30-day readmissions, and to identify which patients benefited most from the program.
METHODS
Setting and Intervention
The Cleveland Clinic main campus is a tertiary academic medical center with 1400 beds and approximately 50,000 admissions per year. In late 2012, the Cleveland Clinic implemented the Connected Care SNF program, wherein Cleveland Clinic physicians regularly visited patients who were discharged from the Cleveland Clinic main campus to 7 regional SNFs. Beginning in December 2012, these 7 high-volume referral SNFs that were not part of the Cleveland Clinic Health System (CCHS) agreed to participate in the program, which focused on reducing avoidable hospital readmissions and delivering quality care (Table 1). The Connected Care team, comprised of 2 geriatricians (1 of whom was also a palliative medicine specialist), 1 internist, 1 family physician, and 5 advanced practice professionals (nurse practitioners and physician assistants), provided medical services at the participating SNFs. These providers aimed to see patients 4 to 5 times per week, were available on site during working hours, and provided telephone coverage at nights and on weekends. All providers had access to hospital electronic medical records and could communicate with the discharging physician and with specialists familiar with the patient as needed. Prior to the admission, providers were informed about patient arrival and, at the time of admission to the SNF, providers reviewed medications and discussed goals of care with patients and their families. In the SNF, providers worked closely with staff members to deliver medications and timely treatment. They also met monthly with multidisciplinary teams for continuous quality improvement and to review outcomes. Patients at Connected Care SNFs who had their own physicians, including most long-stay and some short-stay residents, did not receive the Connected Care intervention. They constituted less than 10% of the patients discharged from Cleveland Clinic main campus.

Study Design and Population
We reviewed administrative and clinical data from a retrospective cohort of patients discharged to SNF from the Cleveland Clinic main campus from January 1, 2011 to December 31, 2014. We included all patients who were discharged to an SNF during the study period. Our main outcome measure was 30-day all-cause readmissions to any hospital in the Cleveland Clinic Health System (CCHS), including the main campus and 8 regional community hospitals. Study patients were followed until January 30, 2015 to capture 30-day readmissions. According to 2012 Medicare data, of CCHS patients who were readmitted within 30 days, 83% of pneumonia, 81% of major joint replacement, 72% of heart failure and 57% of acute myocardial infarction patients were readmitted to a CCHS facility. As the Cleveland Clinic main campus attracts cardiac patients from a 100+-mile radius, they may be more likely to seek care readmission near home and are not reflective of CCHS patients overall. Because we did not have access to readmissions data from non-CCHS hospitals, we excluded patients who were discharged to SNFs beyond a 25-mile radius from the main campus, where they may be more likely to utilize non-CCHS hospitals for acute hospitalization. We also excluded patients discharged to non-CCHS hospital-based SNFs, which may refer readmissions to their own hospital system. Because the Connected Care program began in December 2012, the years 2011-2012 served as the baseline period. The intervention was conducted at 7 SNFs. All other SNFs within the 25-mile radius were included as controls, except for 3 hospital-based SNFs that would be unlikely to admit patients to CCHS. We compared the change in all-cause 30-day readmission rates after implementation of Connected Care, using all patients discharged to SNFs within 25 miles to control for temporal changes in local readmission rates. Discharge to specific SNFs was determined solely by patient choice.
Data Collection
For each patient, we collected the following data that has been shown to be associated with readmissions:16-18 demographics (age, race, sex, ZIP code), lab values on discharge (hemoglobin and sodium); hemodialysis status; medicine or surgical service; elective surgery or nonelective surgery; details of the index admission index (diagnosis-related group [DRG], Medicare severity-diagnosis-related groups [MS-DRG] weight, primary diagnosis code; principal procedure code; admission date; discharge date, length of stay, and post-acute care provider); and common comorbidities, as listed in Table 2. We also calculated each patient’s HOSPITAL19,20 score. The HOSPITAL score was developed to predict risk of preventable 30-day readmissions,19 but it has also been validated to predict 30-day all-cause readmission rates for patients discharged to SNF.21 The model contains 7 elements (hemoglobin, oncology service, sodium, procedure, index type, admissions within the last year, length of stay) (supplemental Table).Patients with a high score (7 or higher) have a 41% chance of readmission, while those with a low score (4 or lower) have only a 15% chance. 21 We assessed all cause 30-day readmission status from CCHS administrative data. Observation patients and outpatient same-day surgeries were not considered to be admissions. For patients with multiple admissions, each admission was counted as a separate index hospitalization. Cleveland Clinic’s Institutional Review Board approved the study.

Statistical Analysis
For the 7 intervention SNFs, patient characteristics were summarized as means and standard deviations or frequencies and percentages for the periods of 2011-2012 and 2013-2014, respectively, and the 2 periods were compared using the Student t test or χ2 test as appropriate.
Mixed-effects logistic regression models were used to model 30-day readmission rates. Since the intervention was implemented in the last quarter of 2012, we examined the difference in readmission rates before and after that time point. The model included the following fixed effects: SNF type (intervention or usual care), time points (quarters of 2011-2014), whether the time is pre- or postintervention (binary), and the 3-way interaction between SNF type, pre- or postintervention and time points, and patient characteristics. The model also contained a Gaussian random effect at the SNF level to account for possible correlations among the outcomes of patients from the same SNF. For each quarter, the mean adjusted readmission rates of 2 types of SNFs were calculated from the fitted mixed models and plotted over time. Furthermore, we compared the mean readmission rates of the 2 groups in the pre- and postintervention periods. Subgroup analyses were performed for medical and surgical patients, and for patients in the low, intermediate and high HOSPITAL score groups.
All analyses were performed using RStudio (Boston, Massachusetts). Statistical significance was established with 2-sided P values less than 0.05.
RESULTS
We identified 119 SNFs within a 25-mile radius of the hospital. Of these, 6 did not receive any referrals. Three non-CCHS hospital-based SNFs were excluded, leaving a total of 110 SNFs in the study sample: 7 intervention SNFs and 103 usual-care SNFs. Between January 2011 and December 2014, there were 23,408 SNF discharges from Cleveland Clinic main campus, including 13,544 who were discharged to study SNFs (Supplemental Figure). Of these, 3334 were discharged to 7 intervention SNFs and 10,210 were discharged to usual care SNFs. Characteristics of patients in both periods appear in Table 2. At baseline, patients in the intervention and control SNFs varied in a number of ways. Patients at intervention SNFs were older (75.6 vs. 70.2 years; P < 0.001), more likely to be African American (45.5% vs. 35.9%; P < 0.001), female (61% vs. 55.4%; P < 0.001) and to be insured by Medicare (85.2% vs. 71.4%; P < 0.001). Both groups had similar proportions of patients with high, intermediate, and low readmission risk as measured by HOSPITAL score. Compared to the 2011-2012 pre-intervention period, during the 2013-2014 intervention period, there were more surgeries (34.3% vs. 41.9%; P < 0.001), more elective surgeries (21.8% vs. 25.5%; P = 0.01), fewer medical patients (65.7% vs. 58.1%; P < 0.001), and an increase in comorbidities, including myocardial infarction, peripheral vascular disease, and liver disease (Table 2).

Table 3 shows adjusted 30-day readmissions rates, before and during the intervention period at the intervention and usual care SNFs. Compared to the pre-intervention period, 30-day all-cause adjusted readmission rates declined in the intervention SNFs (28.1% to 21.7%, P < 0.001), while it increased slightly at control sites (27.1% to 28.5%, P < 0.001). The Figure shows the adjusted 30-day readmission rates by quarter throughout the study period.

Declines in 30-day readmission rates were greater for medical patients (31.0% to 24.6%, P < 0.001) than surgical patients (22.4% to 17.7%, P < 0.001). Patients with high HOSPITAL scores had the greatest decline, while those with low HOSPITAL scores had smaller declines.
DISCUSSION
In this retrospective study of 4 years of discharges to 110 SNFs, we report on the impact of a Connected Care program, in which a physician visited patients on admission to the SNF and 4 to 5 times per week during their stay. Introduction of the program was followed by a 6.8% absolute reduction in all-cause 30-day readmission rates compared to usual care. The absolute reductions ranged from 4.6% for patients at low risk for readmission to 9.1% for patients at high risk, and medical patients benefited more than surgical patients.
Most studies of interventions to reduce hospital readmissions have focused on patients discharged to the community setting.7-9 Interventions have centered on discharge planning, medication reconciliation, and close follow-up to assess for medication adherence and early signs of deterioration. Because patients in SNFs have their medications administered by staff and are under frequent surveillance, such interventions are unlikely to be helpful in this population. We found no studies that focus on short-stay or skilled patients discharged to SNF. Two studies have demonstrated that interventions can reduce hospitalization from nursing homes.22,23 Neither study included readmissions. The Evercare model consisted of nurse practitioners providing active primary care services within the nursing home, as well as offering incentive payments to nursing homes for not hospitalizing patients.22 During a 2-year period, long term residents who enrolled in Evercare had an almost 50% reduction in incident hospitalizations compared to those who did not.22 INTERACT II was a quality improvement intervention that provided tools, education, and strategies to help identify and manage acute conditions proactively.23 In 25 nursing homes employing INTERACT II, there was a 17% reduction in self-reported hospital admissions during the 6-month project, with higher rates of reduction among nursing homes rated as more engaged in the process.23 Although nursing homes may serve some short-stay or skilled patients, they generally serve long-term populations, and studies have shown that short-stay patients are at higher risk for 30-day readmissions.24
There are a number of reasons that short-term SNF patients are at higher risk for readmission. Although prior to admission, they were considered hospital level of care and received a physician visit daily, on transfer to the SNF, relatively little medical care is available. Current federal regulations regarding physician services at a SNF require the resident to be seen by a physician at least once every 30 days for the first 90 days after admission, and at least once every 60 days thereafter.25
The Connected Care program physicians provided a smooth transition of care from hospital to SNF as well as frequent reassessment. Physicians were alerted prior to hospital discharge and performed an initial comprehensive visit generally on the day of admission to the SNF and always within 48 hours. The initial evaluation is important because miscommunication during the handoff from hospital to SNF may result in incorrect medication regimens or inaccurate assessments. By performing prompt medication reconciliation and periodic reassessments of a patient’s medical condition, the Connected Care providers recreate some of the essential elements of successful outpatient readmissions prevention programs.
They also worked together with each SNF’s interdisciplinary team to deliver quality care. There were monthly meetings at each participating Connected Care SNF. Physicians reviewed monthly 30-day readmissions and performed root-cause analysis. When they discovered challenges to timely medication and treatment delivery during daily rounds, they provided in-services to SNF nurses.
In addition, Connected Care providers discussed goals of care—something that is often overlooked on admission to a SNF. This is particularly important because patients with chronic illnesses who are discharged to SNF often have poor prognoses. For example, Medicare patients with heart failure who are discharged to SNFs have 1-year mortality in excess of 50%.13 By implementing a plan of care consistent with patient and family goals, inappropriate readmissions for terminal patients may be avoided.
Reducing readmissions is important for hospitals because under the Hospital Readmissions Reduction Program, hospitals now face substantial penalties for higher than expected readmissions rates. Hospitals involved in bundled payments or other total cost-of-care arrangements have additional incentive to avoid readmissions. Beginning in 2019, SNFs will also receive incentive payments based on their 30-day all-cause hospital readmissions as part of the Skilled Nursing Facility Value-Based Purchasing program.25 The Connected Care model offers 1 means of achieving this goal through partnership between hospitals and SNFs.
Our study has several limitations. First, our study was observational in nature, so the observed reduction in readmissions could have been due to temporal trends unrelated to the intervention. However, no significant reduction was noted during the same time period in other area SNFs. There was also little change in the characteristics of patients admitted to the intervention SNFs. Importantly, the HOSPITAL score, which can predict 30-day readmission rates,20 did not change throughout the study period. Second, the results reflect patients discharged from a single hospital and may not be generalizable to other geographic areas. However, because the program included 7 SNFs, we believe it could be reproduced in other settings. Third, our readmissions measure included only those patients who returned to a CCHS facility. Although we may have missed some readmissions to other hospital systems, such leakage is uncommon—more than 80% of CCHS patients are readmitted to CCHS facilities—and would be unlikely to differ across the short duration of the study. Finally, at the intervention SNFs, most long-stay and some short-stay residents did not receive the Connected Care intervention because they were cared for by their own physicians who did not participate in Connected Care. Had these patients’ readmissions been excluded from our results, the intervention might appear even more effective.
CONCLUSION
A Connected Care intervention reduced 30-day readmission rates among patients discharged to SNFs from a tertiary academic center. While all subgroups had substantial reductions in readmissions following the implementation of the intervention, patients who are at the highest risk of readmission benefited the most. Further study is necessary to know whether Connected Care can be reproduced in other health care systems and whether it reduces overall costs.
Acknowledgments
The authors would like to thank Michael Felver, MD, and teams for their clinical care of patients; Michael Felver, MD, William Zafirau, MD, Dan Blechschmid, MHA, and Kathy Brezine, and Seth Vilensky, MBA, for their administrative support; and Brad Souder, MPT, for assistance with data collection.
Disclosure
Nothing to report.
1. Medicare Payment Advisory Commission. Report to the Congress: Medicare Payment Policy. Chapter 8. Skilled Nursing Facility Services. March 2013. http://www.medpac.gov/docs/default-source/reports/mar13_entirereport.pdf?sfvrsn=0. Accessed March 1, 2017.
2. Kim DG, Messinger-Rapport BJ. Clarion call for a dedicated clinical and research approach to post-acute care. J Am Med Dir Assoc. 2014;15(8):607. e1-e3. PubMed
3. Mor V, Intrator O, Feng Z, Grabowski D. The revolving door of rehospitalization from skilled nursing facilities. Health Aff. 2010;29(1):57-64. PubMed
4. Jencks SF, Williams MV, Coleman EA. Rehospitalizations among patients in the Medicare fee-for-service program. N Engl J Med. 2009;360(14):1418-1428. PubMed
5. Creditor MC. Hazards of hospitalization of the elderly. Ann Intern Med 1993;118(3):219-223. PubMed
6. Van Walraven C, Bennett C, Jennings A, Austin PC, Forester AJ. Proportion of hospital readmissions deemed avoidable: a systematic review. CMAJ. 2011;183(7):E391-E402. PubMed
7. Brenson RA, Paulus RA, Kalman NS. Medicare’s readmissions-reduction program – a positive alternative. N Engl J Med 2012;366(15):1364-1366. PubMed
8. Jack BW, Chetty VK, Anthony D, et al. A reengineered hospital discharge program to decrease rehospitalization: a randomized trial. Ann Intern Med. 2009;150(3):178-187. PubMed
9. Naylor MD, Brooten D, Campbell R, et al. Comprehensive discharge planning and home follow-up of hospitalized elders: a randomized clinical trial. JAMA. 1999;281(7):613-620. PubMed
10. Coleman EA, Parry C, Chalmers S, Min SJ. The care transition intervention: results of a randomized controlled trial. Arch Intern Med. 2006;166(17):1822-1828. PubMed
11. Patel A, Parikh R, Howell EH, Hsich E, Landers SH, Gorodeski EZ. Mini-cog performance: novel marker of post discharge risk among patients hospitalized for heart failure. Circ Heart Fail. 2015;8(1):8-16. PubMed
12. Walter LC, Brand RJ, Counsell SR, et al. Development and validation of a prognostic index for 1-year mortality in older adults after hospitalization. JAMA. 2001;285(23):2987-2994. PubMed
13. Allen LA, Hernandez AF, Peterson ED, et al. Discharge to a skilled nursing facility and subsequent clinical outcomes among older patients hospitalized for heart failure. Circ Heart Fail. 2011;4(3):293-300. PubMed
14. 42 CFR 483.40 – Physician services. US government Publishing Office. https://www.gpo.gov/fdsys/granule/CFR-2011-title42-vol5/CFR-2011-title42-vol5-sec483-40. Published October 1, 2011. Accessed August 31, 2016.
15. Office of Inspector General. Adverse Events in Skilled Nursing Facilities: National Incidence among Medicare Beneficiaries. OEI-06-11-00370. February 2014. http://oig.hhs.gov/oei/reports/oei-06-11-00370.pdf. Accessed March 22, 2016.
16. Hasan O, Meltzer DO, Shaykevich SA, et al. Hospital readmission in general medicine patients: a prediction model. J Gen Intern Med. 2010;25(3):211-219. PubMed
17. Boult C, Dowd B, McCaffrey D, Boult L, Hernandez R, Krulewitch H. Screening elders for risk of hospital admission. J Am Geriatr Soc. 1993;41(8):811-817. PubMed
18. Silverstein MD, Qin H, Mercer SQ, Fong J, Haydar Z. Risk factors for 30-day hospital readmission in patients ≥65 years of age. Proc (Bayl Univ Med Cent). 2008;21(4):363-372. PubMed
19. Donzé J, Aujesky D, Williams D, Schnipper JL. Potentially avoidable 30-day hospital readmissions in medical patients: derivation and validation of a prediction model. JAMA Intern Med. 2013;173(8):632-638. PubMed
20. Donzé JD, Williams MV, Robinson EJ, et al. International validity of the HOSPITAL score to predict 30-day potentially avoidable hospital readmissions. JAMA Intern Med. 2016;176(4):496-502. PubMed
21. Kim LD, Kou L, Messinger-Rapport BJ, Rothberg MB. Validation of the HOSPITAL score for 30-day all-cause readmissions of patients discharged to skilled nursing facilities. J Am Med Dir Assoc. 2016;17(9):e15-e18. PubMed
22. Kane RL, Keckhafer G, Flood S, Bershardsky B, Siadaty MS. The effect of Evercare on hospital use. J Am Geriatr Soc. 2003;51(10):1427-1434. PubMed
23. Ouslander JG, Lamb G, Tappen R, et al. Interventions to reduce hospitalizations from nursing homes: Evaluation of the INTERACT II collaboration quality improvement project. J Am Geriatr Soc. 2011;59(4):745-753. PubMed
24. Cost drivers for dually eligible beneficiaries: Potentially avoidable hospitalizations from nursing facility, skilled nursing facility, and home and community based service waiver programs. http://www.cms.gov/Research-Statistics-Data-and-Systems/Statistics-Trends-and-Reports/Reports/downloads/costdriverstask2.pdf. Accessed August 31, 2016.
25. H.R. 4302 (113th), Section 215, Protecting Access to Medicare Act of 2014 (PAMA). April 2, 2014. https://www.govtrack.us/congress/bills/113/hr4302/text. Accessed August 31, 2016.
Approximately 20% of hospitalized Medicare beneficiaries in the U.S. are discharged to skilled nursing facilities (SNFs) for post-acute care,1,2 and 23.5% of these patients are readmitted within 30 days.3 Because hospital readmissions are costly and associated with worse outcomes,4,5 30-day readmission rates are considered a quality indicator,6 and there are financial penalties for hospitals with higher than expected rates.7 As a result, hospitals invest substantial resources in programs to reduce readmissions.8-10 The SNFs represent an attractive target for readmission reduction efforts, since SNFs contribute a disproportionate share of readmissions.3,4 Because SNF patients are in a monitored environment with high medication adherence, risk factors for readmission likely differ between patients discharged to SNFs and those sent home. For example, 1 study showed that among heart failure patients with cognitive impairment, those discharged to SNFs had lower readmissions during the first 20 days, likely due to better medication adherence.11 Patients discharged to SNFs generally have more complex illnesses, lower functional status, and higher 1-year mortality than patients discharged to the community.12,13 Despite this, SNF patients might have infrequent contact with physicians. Federal regulations require only that patients discharged to SNFs need to be seen within 30 days and then at least once every 30 days thereafter.14 According to the 2014 Office of Inspector General report, one-third of Medicare beneficiaries in SNFs experience adverse events from substandard treatment, inadequate resident monitoring and failure or delay of necessary care, most of which are thought to be preventable.15
To address this issue, the Cleveland Clinic developed a program called “Connected Care SNF,” in which hospital-employed physicians and advanced practice professionals visit patients in selected SNFs 4 to 5 times per week, for the purpose of reducing preventable readmissions. The aim of this study was to assess whether the program reduced 30-day readmissions, and to identify which patients benefited most from the program.
METHODS
Setting and Intervention
The Cleveland Clinic main campus is a tertiary academic medical center with 1400 beds and approximately 50,000 admissions per year. In late 2012, the Cleveland Clinic implemented the Connected Care SNF program, wherein Cleveland Clinic physicians regularly visited patients who were discharged from the Cleveland Clinic main campus to 7 regional SNFs. Beginning in December 2012, these 7 high-volume referral SNFs that were not part of the Cleveland Clinic Health System (CCHS) agreed to participate in the program, which focused on reducing avoidable hospital readmissions and delivering quality care (Table 1). The Connected Care team, comprised of 2 geriatricians (1 of whom was also a palliative medicine specialist), 1 internist, 1 family physician, and 5 advanced practice professionals (nurse practitioners and physician assistants), provided medical services at the participating SNFs. These providers aimed to see patients 4 to 5 times per week, were available on site during working hours, and provided telephone coverage at nights and on weekends. All providers had access to hospital electronic medical records and could communicate with the discharging physician and with specialists familiar with the patient as needed. Prior to the admission, providers were informed about patient arrival and, at the time of admission to the SNF, providers reviewed medications and discussed goals of care with patients and their families. In the SNF, providers worked closely with staff members to deliver medications and timely treatment. They also met monthly with multidisciplinary teams for continuous quality improvement and to review outcomes. Patients at Connected Care SNFs who had their own physicians, including most long-stay and some short-stay residents, did not receive the Connected Care intervention. They constituted less than 10% of the patients discharged from Cleveland Clinic main campus.
Study Design and Population
We reviewed administrative and clinical data from a retrospective cohort of patients discharged to SNF from the Cleveland Clinic main campus from January 1, 2011 to December 31, 2014. We included all patients who were discharged to an SNF during the study period. Our main outcome measure was 30-day all-cause readmissions to any hospital in the Cleveland Clinic Health System (CCHS), including the main campus and 8 regional community hospitals. Study patients were followed until January 30, 2015 to capture 30-day readmissions. According to 2012 Medicare data, of CCHS patients who were readmitted within 30 days, 83% of pneumonia, 81% of major joint replacement, 72% of heart failure and 57% of acute myocardial infarction patients were readmitted to a CCHS facility. As the Cleveland Clinic main campus attracts cardiac patients from a 100+-mile radius, they may be more likely to seek care readmission near home and are not reflective of CCHS patients overall. Because we did not have access to readmissions data from non-CCHS hospitals, we excluded patients who were discharged to SNFs beyond a 25-mile radius from the main campus, where they may be more likely to utilize non-CCHS hospitals for acute hospitalization. We also excluded patients discharged to non-CCHS hospital-based SNFs, which may refer readmissions to their own hospital system. Because the Connected Care program began in December 2012, the years 2011-2012 served as the baseline period. The intervention was conducted at 7 SNFs. All other SNFs within the 25-mile radius were included as controls, except for 3 hospital-based SNFs that would be unlikely to admit patients to CCHS. We compared the change in all-cause 30-day readmission rates after implementation of Connected Care, using all patients discharged to SNFs within 25 miles to control for temporal changes in local readmission rates. Discharge to specific SNFs was determined solely by patient choice.
Data Collection
For each patient, we collected the following data that has been shown to be associated with readmissions:16-18 demographics (age, race, sex, ZIP code), lab values on discharge (hemoglobin and sodium); hemodialysis status; medicine or surgical service; elective surgery or nonelective surgery; details of the index admission index (diagnosis-related group [DRG], Medicare severity-diagnosis-related groups [MS-DRG] weight, primary diagnosis code; principal procedure code; admission date; discharge date, length of stay, and post-acute care provider); and common comorbidities, as listed in Table 2. We also calculated each patient’s HOSPITAL19,20 score. The HOSPITAL score was developed to predict risk of preventable 30-day readmissions,19 but it has also been validated to predict 30-day all-cause readmission rates for patients discharged to SNF.21 The model contains 7 elements (hemoglobin, oncology service, sodium, procedure, index type, admissions within the last year, length of stay) (supplemental Table).Patients with a high score (7 or higher) have a 41% chance of readmission, while those with a low score (4 or lower) have only a 15% chance. 21 We assessed all cause 30-day readmission status from CCHS administrative data. Observation patients and outpatient same-day surgeries were not considered to be admissions. For patients with multiple admissions, each admission was counted as a separate index hospitalization. Cleveland Clinic’s Institutional Review Board approved the study.
Statistical Analysis
For the 7 intervention SNFs, patient characteristics were summarized as means and standard deviations or frequencies and percentages for the periods of 2011-2012 and 2013-2014, respectively, and the 2 periods were compared using the Student t test or χ2 test as appropriate.
Mixed-effects logistic regression models were used to model 30-day readmission rates. Since the intervention was implemented in the last quarter of 2012, we examined the difference in readmission rates before and after that time point. The model included the following fixed effects: SNF type (intervention or usual care), time points (quarters of 2011-2014), whether the time is pre- or postintervention (binary), and the 3-way interaction between SNF type, pre- or postintervention and time points, and patient characteristics. The model also contained a Gaussian random effect at the SNF level to account for possible correlations among the outcomes of patients from the same SNF. For each quarter, the mean adjusted readmission rates of 2 types of SNFs were calculated from the fitted mixed models and plotted over time. Furthermore, we compared the mean readmission rates of the 2 groups in the pre- and postintervention periods. Subgroup analyses were performed for medical and surgical patients, and for patients in the low, intermediate and high HOSPITAL score groups.
All analyses were performed using RStudio (Boston, Massachusetts). Statistical significance was established with 2-sided P values less than 0.05.
RESULTS
We identified 119 SNFs within a 25-mile radius of the hospital. Of these, 6 did not receive any referrals. Three non-CCHS hospital-based SNFs were excluded, leaving a total of 110 SNFs in the study sample: 7 intervention SNFs and 103 usual-care SNFs. Between January 2011 and December 2014, there were 23,408 SNF discharges from Cleveland Clinic main campus, including 13,544 who were discharged to study SNFs (Supplemental Figure). Of these, 3334 were discharged to 7 intervention SNFs and 10,210 were discharged to usual care SNFs. Characteristics of patients in both periods appear in Table 2. At baseline, patients in the intervention and control SNFs varied in a number of ways. Patients at intervention SNFs were older (75.6 vs. 70.2 years; P < 0.001), more likely to be African American (45.5% vs. 35.9%; P < 0.001), female (61% vs. 55.4%; P < 0.001) and to be insured by Medicare (85.2% vs. 71.4%; P < 0.001). Both groups had similar proportions of patients with high, intermediate, and low readmission risk as measured by HOSPITAL score. Compared to the 2011-2012 pre-intervention period, during the 2013-2014 intervention period, there were more surgeries (34.3% vs. 41.9%; P < 0.001), more elective surgeries (21.8% vs. 25.5%; P = 0.01), fewer medical patients (65.7% vs. 58.1%; P < 0.001), and an increase in comorbidities, including myocardial infarction, peripheral vascular disease, and liver disease (Table 2).
Table 3 shows adjusted 30-day readmissions rates, before and during the intervention period at the intervention and usual care SNFs. Compared to the pre-intervention period, 30-day all-cause adjusted readmission rates declined in the intervention SNFs (28.1% to 21.7%, P < 0.001), while it increased slightly at control sites (27.1% to 28.5%, P < 0.001). The Figure shows the adjusted 30-day readmission rates by quarter throughout the study period.
Declines in 30-day readmission rates were greater for medical patients (31.0% to 24.6%, P < 0.001) than surgical patients (22.4% to 17.7%, P < 0.001). Patients with high HOSPITAL scores had the greatest decline, while those with low HOSPITAL scores had smaller declines.
DISCUSSION
In this retrospective study of 4 years of discharges to 110 SNFs, we report on the impact of a Connected Care program, in which a physician visited patients on admission to the SNF and 4 to 5 times per week during their stay. Introduction of the program was followed by a 6.8% absolute reduction in all-cause 30-day readmission rates compared to usual care. The absolute reductions ranged from 4.6% for patients at low risk for readmission to 9.1% for patients at high risk, and medical patients benefited more than surgical patients.
Most studies of interventions to reduce hospital readmissions have focused on patients discharged to the community setting.7-9 Interventions have centered on discharge planning, medication reconciliation, and close follow-up to assess for medication adherence and early signs of deterioration. Because patients in SNFs have their medications administered by staff and are under frequent surveillance, such interventions are unlikely to be helpful in this population. We found no studies that focus on short-stay or skilled patients discharged to SNF. Two studies have demonstrated that interventions can reduce hospitalization from nursing homes.22,23 Neither study included readmissions. The Evercare model consisted of nurse practitioners providing active primary care services within the nursing home, as well as offering incentive payments to nursing homes for not hospitalizing patients.22 During a 2-year period, long term residents who enrolled in Evercare had an almost 50% reduction in incident hospitalizations compared to those who did not.22 INTERACT II was a quality improvement intervention that provided tools, education, and strategies to help identify and manage acute conditions proactively.23 In 25 nursing homes employing INTERACT II, there was a 17% reduction in self-reported hospital admissions during the 6-month project, with higher rates of reduction among nursing homes rated as more engaged in the process.23 Although nursing homes may serve some short-stay or skilled patients, they generally serve long-term populations, and studies have shown that short-stay patients are at higher risk for 30-day readmissions.24
There are a number of reasons that short-term SNF patients are at higher risk for readmission. Although prior to admission, they were considered hospital level of care and received a physician visit daily, on transfer to the SNF, relatively little medical care is available. Current federal regulations regarding physician services at a SNF require the resident to be seen by a physician at least once every 30 days for the first 90 days after admission, and at least once every 60 days thereafter.25
The Connected Care program physicians provided a smooth transition of care from hospital to SNF as well as frequent reassessment. Physicians were alerted prior to hospital discharge and performed an initial comprehensive visit generally on the day of admission to the SNF and always within 48 hours. The initial evaluation is important because miscommunication during the handoff from hospital to SNF may result in incorrect medication regimens or inaccurate assessments. By performing prompt medication reconciliation and periodic reassessments of a patient’s medical condition, the Connected Care providers recreate some of the essential elements of successful outpatient readmissions prevention programs.
They also worked together with each SNF’s interdisciplinary team to deliver quality care. There were monthly meetings at each participating Connected Care SNF. Physicians reviewed monthly 30-day readmissions and performed root-cause analysis. When they discovered challenges to timely medication and treatment delivery during daily rounds, they provided in-services to SNF nurses.
In addition, Connected Care providers discussed goals of care—something that is often overlooked on admission to a SNF. This is particularly important because patients with chronic illnesses who are discharged to SNF often have poor prognoses. For example, Medicare patients with heart failure who are discharged to SNFs have 1-year mortality in excess of 50%.13 By implementing a plan of care consistent with patient and family goals, inappropriate readmissions for terminal patients may be avoided.
Reducing readmissions is important for hospitals because under the Hospital Readmissions Reduction Program, hospitals now face substantial penalties for higher than expected readmissions rates. Hospitals involved in bundled payments or other total cost-of-care arrangements have additional incentive to avoid readmissions. Beginning in 2019, SNFs will also receive incentive payments based on their 30-day all-cause hospital readmissions as part of the Skilled Nursing Facility Value-Based Purchasing program.25 The Connected Care model offers 1 means of achieving this goal through partnership between hospitals and SNFs.
Our study has several limitations. First, our study was observational in nature, so the observed reduction in readmissions could have been due to temporal trends unrelated to the intervention. However, no significant reduction was noted during the same time period in other area SNFs. There was also little change in the characteristics of patients admitted to the intervention SNFs. Importantly, the HOSPITAL score, which can predict 30-day readmission rates,20 did not change throughout the study period. Second, the results reflect patients discharged from a single hospital and may not be generalizable to other geographic areas. However, because the program included 7 SNFs, we believe it could be reproduced in other settings. Third, our readmissions measure included only those patients who returned to a CCHS facility. Although we may have missed some readmissions to other hospital systems, such leakage is uncommon—more than 80% of CCHS patients are readmitted to CCHS facilities—and would be unlikely to differ across the short duration of the study. Finally, at the intervention SNFs, most long-stay and some short-stay residents did not receive the Connected Care intervention because they were cared for by their own physicians who did not participate in Connected Care. Had these patients’ readmissions been excluded from our results, the intervention might appear even more effective.
CONCLUSION
A Connected Care intervention reduced 30-day readmission rates among patients discharged to SNFs from a tertiary academic center. While all subgroups had substantial reductions in readmissions following the implementation of the intervention, patients who are at the highest risk of readmission benefited the most. Further study is necessary to know whether Connected Care can be reproduced in other health care systems and whether it reduces overall costs.
Acknowledgments
The authors would like to thank Michael Felver, MD, and teams for their clinical care of patients; Michael Felver, MD, William Zafirau, MD, Dan Blechschmid, MHA, and Kathy Brezine, and Seth Vilensky, MBA, for their administrative support; and Brad Souder, MPT, for assistance with data collection.
Disclosure
Nothing to report.
1. Medicare Payment Advisory Commission. Report to the Congress: Medicare Payment Policy. Chapter 8. Skilled Nursing Facility Services. March 2013. http://www.medpac.gov/docs/default-source/reports/mar13_entirereport.pdf?sfvrsn=0. Accessed March 1, 2017.
2. Kim DG, Messinger-Rapport BJ. Clarion call for a dedicated clinical and research approach to post-acute care. J Am Med Dir Assoc. 2014;15(8):607. e1-e3. PubMed
3. Mor V, Intrator O, Feng Z, Grabowski D. The revolving door of rehospitalization from skilled nursing facilities. Health Aff. 2010;29(1):57-64. PubMed
4. Jencks SF, Williams MV, Coleman EA. Rehospitalizations among patients in the Medicare fee-for-service program. N Engl J Med. 2009;360(14):1418-1428. PubMed
5. Creditor MC. Hazards of hospitalization of the elderly. Ann Intern Med 1993;118(3):219-223. PubMed
6. Van Walraven C, Bennett C, Jennings A, Austin PC, Forester AJ. Proportion of hospital readmissions deemed avoidable: a systematic review. CMAJ. 2011;183(7):E391-E402. PubMed
7. Brenson RA, Paulus RA, Kalman NS. Medicare’s readmissions-reduction program – a positive alternative. N Engl J Med 2012;366(15):1364-1366. PubMed
8. Jack BW, Chetty VK, Anthony D, et al. A reengineered hospital discharge program to decrease rehospitalization: a randomized trial. Ann Intern Med. 2009;150(3):178-187. PubMed
9. Naylor MD, Brooten D, Campbell R, et al. Comprehensive discharge planning and home follow-up of hospitalized elders: a randomized clinical trial. JAMA. 1999;281(7):613-620. PubMed
10. Coleman EA, Parry C, Chalmers S, Min SJ. The care transition intervention: results of a randomized controlled trial. Arch Intern Med. 2006;166(17):1822-1828. PubMed
11. Patel A, Parikh R, Howell EH, Hsich E, Landers SH, Gorodeski EZ. Mini-cog performance: novel marker of post discharge risk among patients hospitalized for heart failure. Circ Heart Fail. 2015;8(1):8-16. PubMed
12. Walter LC, Brand RJ, Counsell SR, et al. Development and validation of a prognostic index for 1-year mortality in older adults after hospitalization. JAMA. 2001;285(23):2987-2994. PubMed
13. Allen LA, Hernandez AF, Peterson ED, et al. Discharge to a skilled nursing facility and subsequent clinical outcomes among older patients hospitalized for heart failure. Circ Heart Fail. 2011;4(3):293-300. PubMed
14. 42 CFR 483.40 – Physician services. US government Publishing Office. https://www.gpo.gov/fdsys/granule/CFR-2011-title42-vol5/CFR-2011-title42-vol5-sec483-40. Published October 1, 2011. Accessed August 31, 2016.
15. Office of Inspector General. Adverse Events in Skilled Nursing Facilities: National Incidence among Medicare Beneficiaries. OEI-06-11-00370. February 2014. http://oig.hhs.gov/oei/reports/oei-06-11-00370.pdf. Accessed March 22, 2016.
16. Hasan O, Meltzer DO, Shaykevich SA, et al. Hospital readmission in general medicine patients: a prediction model. J Gen Intern Med. 2010;25(3):211-219. PubMed
17. Boult C, Dowd B, McCaffrey D, Boult L, Hernandez R, Krulewitch H. Screening elders for risk of hospital admission. J Am Geriatr Soc. 1993;41(8):811-817. PubMed
18. Silverstein MD, Qin H, Mercer SQ, Fong J, Haydar Z. Risk factors for 30-day hospital readmission in patients ≥65 years of age. Proc (Bayl Univ Med Cent). 2008;21(4):363-372. PubMed
19. Donzé J, Aujesky D, Williams D, Schnipper JL. Potentially avoidable 30-day hospital readmissions in medical patients: derivation and validation of a prediction model. JAMA Intern Med. 2013;173(8):632-638. PubMed
20. Donzé JD, Williams MV, Robinson EJ, et al. International validity of the HOSPITAL score to predict 30-day potentially avoidable hospital readmissions. JAMA Intern Med. 2016;176(4):496-502. PubMed
21. Kim LD, Kou L, Messinger-Rapport BJ, Rothberg MB. Validation of the HOSPITAL score for 30-day all-cause readmissions of patients discharged to skilled nursing facilities. J Am Med Dir Assoc. 2016;17(9):e15-e18. PubMed
22. Kane RL, Keckhafer G, Flood S, Bershardsky B, Siadaty MS. The effect of Evercare on hospital use. J Am Geriatr Soc. 2003;51(10):1427-1434. PubMed
23. Ouslander JG, Lamb G, Tappen R, et al. Interventions to reduce hospitalizations from nursing homes: Evaluation of the INTERACT II collaboration quality improvement project. J Am Geriatr Soc. 2011;59(4):745-753. PubMed
24. Cost drivers for dually eligible beneficiaries: Potentially avoidable hospitalizations from nursing facility, skilled nursing facility, and home and community based service waiver programs. http://www.cms.gov/Research-Statistics-Data-and-Systems/Statistics-Trends-and-Reports/Reports/downloads/costdriverstask2.pdf. Accessed August 31, 2016.
25. H.R. 4302 (113th), Section 215, Protecting Access to Medicare Act of 2014 (PAMA). April 2, 2014. https://www.govtrack.us/congress/bills/113/hr4302/text. Accessed August 31, 2016.
© 2017 Society of Hospital Medicine
Hospitalizations with observation services and the Medicare Part A complex appeals process at three academic medical centers
Hospitalists and other inpatient providers are familiar with hospitalizations classified observation. The Centers for Medicare & Medicaid Services (CMS) uses the “2-midnight rule” to distinguish between outpatient services (which include all observation stays) and inpatient services for most hospitalizations. The rule states that “inpatient admissions will generally be payable … if the admitting practitioner expected the patient to require a hospital stay that crossed two midnights and the medical record supports that reasonable expectation.”1
Hospitalization under inpatient versus outpatient status is a billing distinction that can have significant financial consequences for patients, providers, and hospitals. The inpatient or outpatient observation orders written by hospitalists and other hospital-based providers direct billing based on CMS and other third-party regulation. However, providers may have variable expertise writing such orders. To audit the correct use of the visit-status orders by hospital providers, CMS uses recovery auditors (RAs), also referred to as recovery audit contractors.2,3
Historically, RAs had up to 3 years from date of service (DOS) to perform an audit, which involves asking a hospital for a medical record for a particular stay. The audit timeline includes 45 days for hospitals to produce such documentation, and 60 days for the RA either to agree with the hospital’s billing or to make an “overpayment determination” that the hospital should have billed Medicare Part B (outpatient) instead of Part A (inpatient).3,4 The hospital may either accept the RA decision, or contest it by using the pre-appeals discussion period or by directly entering the 5-level Medicare administrative appeals process.3,4 Level 1 and Level 2 appeals are heard by a government contractor, Level 3 by an administrative law judge (ALJ), Level 4 by a Medicare appeals council, and Level 5 by a federal district court. These different appeal types have different deadlines (Appendix 1). The deadlines for hospitals and government responses beyond Level 1 are set by Congress and enforced by CMS,3,4 and CMS sets discussion period timelines. Hospitals that miss an appeals deadline automatically default their appeals request, but there are no penalties for missed government deadlines.
Recently, there has been increased scrutiny of the audit-and-appeals process of outpatient and inpatient status determinations.5 Despite the 2-midnight rule, the Medicare Benefit Policy Manual (MBPM) retains the passage: “Physicians should use a 24-hour period as a benchmark, i.e., they should order admission for patients who are expected to need hospital care for 24 hours or more, and treat other patients on an outpatient basis.”6 Auditors often cite “medical necessity” in their decisions, which is not well defined in the MBPM and can be open to different interpretation. This lack of clarity likely contributed to the large number of status determination discrepancies between providers and RAs, thereby creating a federal appeals backlog that caused the Office of Medicare Hearings and Appeals to halt hospital appeals assignments7 and prompted an ongoing lawsuit against CMS regarding the lengthy appeals process.4 To address these problems and clear the appeals backlog, CMS proposed a “$0.68 settlement offer.”4 The settlement “offered an administrative agreement to any hospital willing to withdraw their pending appeals in exchange for timely partial payment (68% of the net allowable amount)”8 and paid out almost $1.5 billion to the third of eligible hospitals that accepted the offer.9 CMS also made programmatic improvements to the RA program.10
Despite these efforts, problems remain. On June 9, 2016, the U.S. Government Accountability Office (GAO) published Medicare Fee-for-Service: Opportunities Remain to Improve Appeals Process, citing an approximate 2000% increase in hospital inpatient appeals during the period 2010–2014 and the concern that appeals requests will continue to exceed adjudication capabilities.11 On July 5, 2016, CMS issued its proposed rule for appeals reform that allows the Medicare Appeals Council (Level 4) to set precedents which would be binding at lower levels and allows senior attorneys to handle some cases and effectively increase manpower at the Level 3 (ALJ). In addition, CMS proposes to revise the method for calculating dollars at risk needed to schedule an ALJ hearing, and develop methods to better adjudicate similar claims, and other process improvements aimed at decreasing the more than 750,000 current claims awaiting ALJ decisions.12
We conducted a study to better understand the Medicare appeals process in the context of the proposed CMS reforms by investigating all appeals reaching Level 3 at Johns Hopkins Hospital (JHH), University of Wisconsin Hospitals and Clinics (UWHC), and University of Utah Hospital (UU). Because relatively few cases nationally are appealed beyond Level 3, the study focused on most-relevant data.3 We examined time spent at each appeal Level and whether it met federally mandated deadlines, as well as the percentage accountable to hospitals versus government contractors or ALJs. We also recorded the overturn rate at Level 3 and evaluated standardized text in de-identified decision letters to determine criteria cited by contractors in their decisions to deny hospital appeal requests.
METHODS
The JHH, UWHC, and UU Institutional Review Boards did not require a review. The study included all complex Part A appeals involving DOS before October 1, 2013 and reaching Level 3 (ALJ) as of May 1, 2016.
Our general methods were described previously.2 Briefly, the 3 academic medical centers are geographically diverse. JHH is in region A, UWHC in region B, and UU in region D (3 of the 4 RA regions are represented). The hospitals had different Medicare administrative contractors but the same qualified independent contractor until March 1, 2015 (Appendix 2).
 at 3 Academic Medical Centers")
For this paper, time spent in the discussion period, if applicable, is included in appeals time, except as specified (Table 1). The term partially favorable is used for UU cases only, based on the O’Connor Hospital decision13 (Table 1). Reflecting ambiguity in the MBPM, for time-based encounter length of stay (LOS) statements, JHH and UU used time between admission order and discharge order, whereas UWHC used time between decision to admit (for emergency department patients) or time care began (direct admissions) and time patient stopped receiving care (Table 2). Although CMS now defines when a hospital encounter begins under the 2-midnight rule,14 there was no standard definition when the cases in this study were audited.

We reviewed de-identified standardized text in Level 1 and Level 2 decision letters. Each hospital designated an analyst to search letters for Medicare Benefit Policy Manual chapter 1, which references the 24-hour benchmark, or the MBPM statement regarding use of the 24-hour period as a benchmark to guide inpatient admission orders.6 Associated paragraphs that included these terms were coded and reviewed by Drs. Sheehy, Engel, and Locke to confirm that the 24-hour time-based benchmark was mentioned, as per the MBPM statement (Table 2, Appendix 3).
Descriptive statistics are used to describe the data, and representative de-identified standardized text is included.
RESULTS
Of 219 Level 3 cases, 135 (61.6%) concluded at Level 3. Of these 135 cases, 96 (71.1%) were decided in favor of the hospital, 11 (8.1%) were settled in the CMS $0.68 settlement offer, and 28 (20.7%) were unfavorable to the hospital (Table 1).
Mean total days since DOS was 1,663.3 (536.8) (mean [SD]), with median 1708 days. This included 560.4 (351.6) days between DOS and audit (median 556 days) and 891.3 (320.3) days in appeal (median 979 days). The hospitals were responsible for 29.3% of that time (260.7 [68.2] days) while government contractors were responsible for 70.7% (630.6 [277.2] days). Government contractors and ALJs met deadlines 47.7% of the time, meeting appeals deadlines 92.5% of the time for Discussion, 85.4% for Level 1, 38.8% for Level 2, and 0% for Level 3 (Table 1).
All “redetermination” (level 1 appeals letters) received at UU and UWHC, and all “reconsideration” (level 2 appeals letters) received by UU, UWHC, and JHH contained standardized time-based 24–hour benchmark text directly or referencing the MBPM containing such text, to describe criteria for inpatient status (Table 2 and Appendix 3).6 In total, 417 of 438 (95.2%) of Level 1 and Level 2 appeals results letters contained time-based 24-hour benchmark criteria for inpatient status despite 154 of 219 (70.3%) of denied cases exceeding a 24-hour LOS.
DISCUSSION
This study demonstrated process and timeliness concerns in the Medicare RA program for Level 3 cases at 3 academic medical centers. Although hospitals forfeit any appeal for which they miss a filing deadline, government contractors and ALJs met their deadlines less than half the time without default or penalty. Average time from the rendering of services to the conclusion of the audit-and-appeals process exceeded 4.5 years, which included an average 560 days between hospital stay and initial RA audit, and almost 900 days in appeals, with more than 70% of that time attributable to government contractors and ALJs.
Objective time-based 24-hour inpatient status criteria were referenced in 95% of decision letters, even though LOS exceeded 24 hours in more than 70% of these cases, suggesting that objective LOS data played only a small role in contractor decisions, or that contractors did not actually audit for LOS when reviewing cases. Unclear criteria likely contributed to payment denials and improper payments, despite admitting providers’ best efforts to comply with Medicare rules when writing visit-status orders. There was also a significant cost to hospitals; our prior study found that navigating the appeals process required 5 full-time equivalents per institution.2
At the 2 study hospitals with Level 3 decisions, more than two thirds of the decisions favored the hospital, suggesting the hospitals were justified in appealing RA Level 1 and Level 2 determinations. This proportion is consistent with the 43% ALJ overturn rate (including RA- and non-RA-derived appeals) cited in the recent U.S. Court of Appeals for the DC Circuit decision.9
This study potentially was limited by contractor and hospital use of the nonstandardized LOS calculation during the study period. That the majority of JHH and UU cases cited the 24-hour benchmark in their letters but nevertheless exceeded 24-hour LOS (using the most conservative definition of LOS) suggests contractors did not audit for or consider LOS in their decisions.
Our results support recent steps taken by CMS to reform the appeals process, including shortening the RA “look-back period” from 3 years to 6 months,10 which will markedly shorten the 560-day lag between DOS and audit found in this study. In addition, CMS has replaced RAs with beneficiary and family-centered care quality improvement organizations (BFCC-QIOs)1,8 for initial status determination audits. Although it is too soon to tell, the hope is that BFCC-QIOs will decrease the volume of audits and denials that have overwhelmed the system and most probably contributed to process delays and the appeals backlog.
However, our data demonstrate several areas of concern not addressed in the recent GAO report11 or in the rule proposed by CMS.12 Most important, CMS could consider an appeals deadline missed by a government contractor as a decision for the hospital, in the same way a hospital’s missed deadline defaults its appeal. Such equity would ensure due process and prevent another appeals backlog. In addition, the large number of Level 3 decisions favoring hospitals suggests a need for process improvement at the Medicare administrative contractor and qualified independent contractor Level of appeals—such as mandatory review of Level 1 and Level 2 decision letters for appeals overturned at Level 3, accountability for Level 1 and Level 2 contractors with high rates of Level 3 overturn, and clarification of criteria used to judge determinations.
Medicare fraud cannot be tolerated, and a robust auditing process is essential to the integrity of the Medicare program. CMS’s current and proposed reforms may not be enough to eliminate the appeals backlog and restore a timely and fair appeals process. As CMS explores bundled payments and other reimbursement reforms, perhaps the need to distinguish observation hospital care will be eliminated. Short of that, additional actions must be taken so that a just and efficient Medicare appeals system can be realized for observation hospitalizations.
Acknowledgments
For invaluable assistance in data preparation and presentation, the authors thank Becky Borchert, RN, MS, MBA, Program Manager for Medicare/Medicaid Utilization Review, University of Wisconsin Hospital and Clinics; Carol Duhaney, Calvin Young, and Joan Kratz, RN, Johns Hopkins Hospital; and Morgan Walker and Lisa Whittaker, RN, University of Utah.
Disclosure
Nothing to report.
1. Centers for Medicare & Medicaid Services, US Dept of Health and Human Services. Fact sheet: 2-midnight rule. https://www.cms.gov/Newsroom/MediaReleaseDatabase/Fact-sheets/2015-Fact-sheets-items/2015-07-01-2.html. Published July 1, 2015. Accessed August 9, 2016.
2. Sheehy AM, Locke C, Engel JZ, et al. Recovery Audit Contractor audits and appeals at three academic medical centers. J Hosp Med. 2015;10(4):212-219. PubMed
3. Centers for Medicare & Medicaid Services, US Dept of Health and Human Services. Recovery auditing in Medicare for fiscal year 2014. https://www.cms.gov/Research-Statistics-Data-and-Systems/Monitoring-Programs/Medicare-FFS-Compliance-Programs/Recovery-Audit-Program/Downloads/RAC-RTC-FY2014.pdf. Accessed August 9, 2016.
4. American Hospital Association vs Burwell. No 15-5015. Circuit court decision. https://www.cadc.uscourts.gov/internet/opinions.nsf/CDFE9734F0D36C2185257F540052A39D/$file/15-5015-1597907.pdf. Decided February 9, 2016. Accessed August 9, 2016
5. AMA news: Payment recovery audit program needs overhaul: Doctors to CMS. https://wire.ama-assn.org/ama-news/payment-recovery-audit-program-needs-overhaul-doctors-cms. Accessed March 17, 2017.
6. Centers for Medicare & Medicaid Services, US Dept of Health and Human Services. Inpatient hospital services covered under Part A. In: Medicare Benefit Policy Manual. Chapter 1. Publication 100-02. https://www.cms.gov/Regulations-and-Guidance/Guidance/Manuals/downloads/bp102c01.pdf. Accessed August 9, 2016.
7. Griswold NJ; Office of Medicare Hearings and Appeals, US Dept of Health and Human Services. Memorandum to OMHA Medicare appellants. http://www.modernhealthcare.com/assets/pdf/CH92573110.pdf. Accessed August 9, 2016.
8. Centers for Medicare & Medicaid Services, US Dept of Health and Human Services. Inpatient hospital reviews. https://www.cms.gov/Research-Statistics-Data-and-Systems/Monitoring-Programs/Medicare-FFS-Compliance-Programs/Medical-Review/InpatientHospitalReviews.html. Accessed August 9, 2016.
9. Galewitz P. CMS identifies hospitals paid nearly $1.5B in 2015 Medicare billing settlement. Kaiser Health News. http://khn.org/news/cms-identifies-hospitals-paid-nearly-1-5b-in-2015-medicare-billing-settlement/. Published August 23, 2016. Accessed October 14, 2016.
10. Centers for Medicare & Medicaid Services, US Dept of Health and Human Services. Recovery audit program improvements. https://www.cms.gov/research-statistics-data-and-systems/monitoring-programs/medicare-ffs-compliance-programs/recovery-audit-program/downloads/RAC-program-improvements.pdf. Accessed August 9, 2016.
11. US Government Accountability Office. Medicare Fee-for-Service: Opportunities Remain to Improve Appeals Process. http://www.gao.gov/assets/680/677034.pdf. Publication GAO-16-366. Published May 10, 2016. Accessed August 9, 2016.
12. Centers for Medicare & Medicaid Services, US Dept of Health and Human Services. Changes to the Medicare Claims and Entitlement, Medicare Advantage Organization Determination, and Medicare Prescription Drug Coverage Determination Appeals Procedures. https://www.gpo.gov/fdsys/pkg/FR-2016-07-05/pdf/2016-15192.pdf. Accessed August 9, 2016.
13. Departmental Appeals Board, US Dept of Health and Human Services. Action and Order of Medicare Appeals Council: in the case of O’Connor Hospital. http://www.hhs.gov/dab/divisions/medicareoperations/macdecisions/oconnorhospital.pdf. Accessed August 9, 2016.
14. Centers for Medicare & Medicaid Services, US Dept of Health and Human Services. Frequently asked questions: 2 midnight inpatient admission guidance & patient status reviews for admissions on or after October 1, 2013. https://www.cms.gov/Research-Statistics-Data-and-Systems/Monitoring-Programs/Medical-Review/Downloads/QAsforWebsitePosting_110413-v2-CLEAN.pdf. Accessed August 9, 2016.
Hospitalists and other inpatient providers are familiar with hospitalizations classified observation. The Centers for Medicare & Medicaid Services (CMS) uses the “2-midnight rule” to distinguish between outpatient services (which include all observation stays) and inpatient services for most hospitalizations. The rule states that “inpatient admissions will generally be payable … if the admitting practitioner expected the patient to require a hospital stay that crossed two midnights and the medical record supports that reasonable expectation.”1
Hospitalization under inpatient versus outpatient status is a billing distinction that can have significant financial consequences for patients, providers, and hospitals. The inpatient or outpatient observation orders written by hospitalists and other hospital-based providers direct billing based on CMS and other third-party regulation. However, providers may have variable expertise writing such orders. To audit the correct use of the visit-status orders by hospital providers, CMS uses recovery auditors (RAs), also referred to as recovery audit contractors.2,3
Historically, RAs had up to 3 years from date of service (DOS) to perform an audit, which involves asking a hospital for a medical record for a particular stay. The audit timeline includes 45 days for hospitals to produce such documentation, and 60 days for the RA either to agree with the hospital’s billing or to make an “overpayment determination” that the hospital should have billed Medicare Part B (outpatient) instead of Part A (inpatient).3,4 The hospital may either accept the RA decision, or contest it by using the pre-appeals discussion period or by directly entering the 5-level Medicare administrative appeals process.3,4 Level 1 and Level 2 appeals are heard by a government contractor, Level 3 by an administrative law judge (ALJ), Level 4 by a Medicare appeals council, and Level 5 by a federal district court. These different appeal types have different deadlines (Appendix 1). The deadlines for hospitals and government responses beyond Level 1 are set by Congress and enforced by CMS,3,4 and CMS sets discussion period timelines. Hospitals that miss an appeals deadline automatically default their appeals request, but there are no penalties for missed government deadlines.
Recently, there has been increased scrutiny of the audit-and-appeals process of outpatient and inpatient status determinations.5 Despite the 2-midnight rule, the Medicare Benefit Policy Manual (MBPM) retains the passage: “Physicians should use a 24-hour period as a benchmark, i.e., they should order admission for patients who are expected to need hospital care for 24 hours or more, and treat other patients on an outpatient basis.”6 Auditors often cite “medical necessity” in their decisions, which is not well defined in the MBPM and can be open to different interpretation. This lack of clarity likely contributed to the large number of status determination discrepancies between providers and RAs, thereby creating a federal appeals backlog that caused the Office of Medicare Hearings and Appeals to halt hospital appeals assignments7 and prompted an ongoing lawsuit against CMS regarding the lengthy appeals process.4 To address these problems and clear the appeals backlog, CMS proposed a “$0.68 settlement offer.”4 The settlement “offered an administrative agreement to any hospital willing to withdraw their pending appeals in exchange for timely partial payment (68% of the net allowable amount)”8 and paid out almost $1.5 billion to the third of eligible hospitals that accepted the offer.9 CMS also made programmatic improvements to the RA program.10
Despite these efforts, problems remain. On June 9, 2016, the U.S. Government Accountability Office (GAO) published Medicare Fee-for-Service: Opportunities Remain to Improve Appeals Process, citing an approximate 2000% increase in hospital inpatient appeals during the period 2010–2014 and the concern that appeals requests will continue to exceed adjudication capabilities.11 On July 5, 2016, CMS issued its proposed rule for appeals reform that allows the Medicare Appeals Council (Level 4) to set precedents which would be binding at lower levels and allows senior attorneys to handle some cases and effectively increase manpower at the Level 3 (ALJ). In addition, CMS proposes to revise the method for calculating dollars at risk needed to schedule an ALJ hearing, and develop methods to better adjudicate similar claims, and other process improvements aimed at decreasing the more than 750,000 current claims awaiting ALJ decisions.12
We conducted a study to better understand the Medicare appeals process in the context of the proposed CMS reforms by investigating all appeals reaching Level 3 at Johns Hopkins Hospital (JHH), University of Wisconsin Hospitals and Clinics (UWHC), and University of Utah Hospital (UU). Because relatively few cases nationally are appealed beyond Level 3, the study focused on most-relevant data.3 We examined time spent at each appeal Level and whether it met federally mandated deadlines, as well as the percentage accountable to hospitals versus government contractors or ALJs. We also recorded the overturn rate at Level 3 and evaluated standardized text in de-identified decision letters to determine criteria cited by contractors in their decisions to deny hospital appeal requests.
METHODS
The JHH, UWHC, and UU Institutional Review Boards did not require a review. The study included all complex Part A appeals involving DOS before October 1, 2013 and reaching Level 3 (ALJ) as of May 1, 2016.
Our general methods were described previously.2 Briefly, the 3 academic medical centers are geographically diverse. JHH is in region A, UWHC in region B, and UU in region D (3 of the 4 RA regions are represented). The hospitals had different Medicare administrative contractors but the same qualified independent contractor until March 1, 2015 (Appendix 2).
For this paper, time spent in the discussion period, if applicable, is included in appeals time, except as specified (Table 1). The term partially favorable is used for UU cases only, based on the O’Connor Hospital decision13 (Table 1). Reflecting ambiguity in the MBPM, for time-based encounter length of stay (LOS) statements, JHH and UU used time between admission order and discharge order, whereas UWHC used time between decision to admit (for emergency department patients) or time care began (direct admissions) and time patient stopped receiving care (Table 2). Although CMS now defines when a hospital encounter begins under the 2-midnight rule,14 there was no standard definition when the cases in this study were audited.
We reviewed de-identified standardized text in Level 1 and Level 2 decision letters. Each hospital designated an analyst to search letters for Medicare Benefit Policy Manual chapter 1, which references the 24-hour benchmark, or the MBPM statement regarding use of the 24-hour period as a benchmark to guide inpatient admission orders.6 Associated paragraphs that included these terms were coded and reviewed by Drs. Sheehy, Engel, and Locke to confirm that the 24-hour time-based benchmark was mentioned, as per the MBPM statement (Table 2, Appendix 3).
Descriptive statistics are used to describe the data, and representative de-identified standardized text is included.
RESULTS
Of 219 Level 3 cases, 135 (61.6%) concluded at Level 3. Of these 135 cases, 96 (71.1%) were decided in favor of the hospital, 11 (8.1%) were settled in the CMS $0.68 settlement offer, and 28 (20.7%) were unfavorable to the hospital (Table 1).
Mean total days since DOS was 1,663.3 (536.8) (mean [SD]), with median 1708 days. This included 560.4 (351.6) days between DOS and audit (median 556 days) and 891.3 (320.3) days in appeal (median 979 days). The hospitals were responsible for 29.3% of that time (260.7 [68.2] days) while government contractors were responsible for 70.7% (630.6 [277.2] days). Government contractors and ALJs met deadlines 47.7% of the time, meeting appeals deadlines 92.5% of the time for Discussion, 85.4% for Level 1, 38.8% for Level 2, and 0% for Level 3 (Table 1).
All “redetermination” (level 1 appeals letters) received at UU and UWHC, and all “reconsideration” (level 2 appeals letters) received by UU, UWHC, and JHH contained standardized time-based 24–hour benchmark text directly or referencing the MBPM containing such text, to describe criteria for inpatient status (Table 2 and Appendix 3).6 In total, 417 of 438 (95.2%) of Level 1 and Level 2 appeals results letters contained time-based 24-hour benchmark criteria for inpatient status despite 154 of 219 (70.3%) of denied cases exceeding a 24-hour LOS.
DISCUSSION
This study demonstrated process and timeliness concerns in the Medicare RA program for Level 3 cases at 3 academic medical centers. Although hospitals forfeit any appeal for which they miss a filing deadline, government contractors and ALJs met their deadlines less than half the time without default or penalty. Average time from the rendering of services to the conclusion of the audit-and-appeals process exceeded 4.5 years, which included an average 560 days between hospital stay and initial RA audit, and almost 900 days in appeals, with more than 70% of that time attributable to government contractors and ALJs.
Objective time-based 24-hour inpatient status criteria were referenced in 95% of decision letters, even though LOS exceeded 24 hours in more than 70% of these cases, suggesting that objective LOS data played only a small role in contractor decisions, or that contractors did not actually audit for LOS when reviewing cases. Unclear criteria likely contributed to payment denials and improper payments, despite admitting providers’ best efforts to comply with Medicare rules when writing visit-status orders. There was also a significant cost to hospitals; our prior study found that navigating the appeals process required 5 full-time equivalents per institution.2
At the 2 study hospitals with Level 3 decisions, more than two thirds of the decisions favored the hospital, suggesting the hospitals were justified in appealing RA Level 1 and Level 2 determinations. This proportion is consistent with the 43% ALJ overturn rate (including RA- and non-RA-derived appeals) cited in the recent U.S. Court of Appeals for the DC Circuit decision.9
This study potentially was limited by contractor and hospital use of the nonstandardized LOS calculation during the study period. That the majority of JHH and UU cases cited the 24-hour benchmark in their letters but nevertheless exceeded 24-hour LOS (using the most conservative definition of LOS) suggests contractors did not audit for or consider LOS in their decisions.
Our results support recent steps taken by CMS to reform the appeals process, including shortening the RA “look-back period” from 3 years to 6 months,10 which will markedly shorten the 560-day lag between DOS and audit found in this study. In addition, CMS has replaced RAs with beneficiary and family-centered care quality improvement organizations (BFCC-QIOs)1,8 for initial status determination audits. Although it is too soon to tell, the hope is that BFCC-QIOs will decrease the volume of audits and denials that have overwhelmed the system and most probably contributed to process delays and the appeals backlog.
However, our data demonstrate several areas of concern not addressed in the recent GAO report11 or in the rule proposed by CMS.12 Most important, CMS could consider an appeals deadline missed by a government contractor as a decision for the hospital, in the same way a hospital’s missed deadline defaults its appeal. Such equity would ensure due process and prevent another appeals backlog. In addition, the large number of Level 3 decisions favoring hospitals suggests a need for process improvement at the Medicare administrative contractor and qualified independent contractor Level of appeals—such as mandatory review of Level 1 and Level 2 decision letters for appeals overturned at Level 3, accountability for Level 1 and Level 2 contractors with high rates of Level 3 overturn, and clarification of criteria used to judge determinations.
Medicare fraud cannot be tolerated, and a robust auditing process is essential to the integrity of the Medicare program. CMS’s current and proposed reforms may not be enough to eliminate the appeals backlog and restore a timely and fair appeals process. As CMS explores bundled payments and other reimbursement reforms, perhaps the need to distinguish observation hospital care will be eliminated. Short of that, additional actions must be taken so that a just and efficient Medicare appeals system can be realized for observation hospitalizations.
Acknowledgments
For invaluable assistance in data preparation and presentation, the authors thank Becky Borchert, RN, MS, MBA, Program Manager for Medicare/Medicaid Utilization Review, University of Wisconsin Hospital and Clinics; Carol Duhaney, Calvin Young, and Joan Kratz, RN, Johns Hopkins Hospital; and Morgan Walker and Lisa Whittaker, RN, University of Utah.
Disclosure
Nothing to report.
1. Centers for Medicare & Medicaid Services, US Dept of Health and Human Services. Fact sheet: 2-midnight rule. https://www.cms.gov/Newsroom/MediaReleaseDatabase/Fact-sheets/2015-Fact-sheets-items/2015-07-01-2.html. Published July 1, 2015. Accessed August 9, 2016.
2. Sheehy AM, Locke C, Engel JZ, et al. Recovery Audit Contractor audits and appeals at three academic medical centers. J Hosp Med. 2015;10(4):212-219. PubMed
3. Centers for Medicare & Medicaid Services, US Dept of Health and Human Services. Recovery auditing in Medicare for fiscal year 2014. https://www.cms.gov/Research-Statistics-Data-and-Systems/Monitoring-Programs/Medicare-FFS-Compliance-Programs/Recovery-Audit-Program/Downloads/RAC-RTC-FY2014.pdf. Accessed August 9, 2016.
4. American Hospital Association vs Burwell. No 15-5015. Circuit court decision. https://www.cadc.uscourts.gov/internet/opinions.nsf/CDFE9734F0D36C2185257F540052A39D/$file/15-5015-1597907.pdf. Decided February 9, 2016. Accessed August 9, 2016
5. AMA news: Payment recovery audit program needs overhaul: Doctors to CMS. https://wire.ama-assn.org/ama-news/payment-recovery-audit-program-needs-overhaul-doctors-cms. Accessed March 17, 2017.
6. Centers for Medicare & Medicaid Services, US Dept of Health and Human Services. Inpatient hospital services covered under Part A. In: Medicare Benefit Policy Manual. Chapter 1. Publication 100-02. https://www.cms.gov/Regulations-and-Guidance/Guidance/Manuals/downloads/bp102c01.pdf. Accessed August 9, 2016.
7. Griswold NJ; Office of Medicare Hearings and Appeals, US Dept of Health and Human Services. Memorandum to OMHA Medicare appellants. http://www.modernhealthcare.com/assets/pdf/CH92573110.pdf. Accessed August 9, 2016.
8. Centers for Medicare & Medicaid Services, US Dept of Health and Human Services. Inpatient hospital reviews. https://www.cms.gov/Research-Statistics-Data-and-Systems/Monitoring-Programs/Medicare-FFS-Compliance-Programs/Medical-Review/InpatientHospitalReviews.html. Accessed August 9, 2016.
9. Galewitz P. CMS identifies hospitals paid nearly $1.5B in 2015 Medicare billing settlement. Kaiser Health News. http://khn.org/news/cms-identifies-hospitals-paid-nearly-1-5b-in-2015-medicare-billing-settlement/. Published August 23, 2016. Accessed October 14, 2016.
10. Centers for Medicare & Medicaid Services, US Dept of Health and Human Services. Recovery audit program improvements. https://www.cms.gov/research-statistics-data-and-systems/monitoring-programs/medicare-ffs-compliance-programs/recovery-audit-program/downloads/RAC-program-improvements.pdf. Accessed August 9, 2016.
11. US Government Accountability Office. Medicare Fee-for-Service: Opportunities Remain to Improve Appeals Process. http://www.gao.gov/assets/680/677034.pdf. Publication GAO-16-366. Published May 10, 2016. Accessed August 9, 2016.
12. Centers for Medicare & Medicaid Services, US Dept of Health and Human Services. Changes to the Medicare Claims and Entitlement, Medicare Advantage Organization Determination, and Medicare Prescription Drug Coverage Determination Appeals Procedures. https://www.gpo.gov/fdsys/pkg/FR-2016-07-05/pdf/2016-15192.pdf. Accessed August 9, 2016.
13. Departmental Appeals Board, US Dept of Health and Human Services. Action and Order of Medicare Appeals Council: in the case of O’Connor Hospital. http://www.hhs.gov/dab/divisions/medicareoperations/macdecisions/oconnorhospital.pdf. Accessed August 9, 2016.
14. Centers for Medicare & Medicaid Services, US Dept of Health and Human Services. Frequently asked questions: 2 midnight inpatient admission guidance & patient status reviews for admissions on or after October 1, 2013. https://www.cms.gov/Research-Statistics-Data-and-Systems/Monitoring-Programs/Medical-Review/Downloads/QAsforWebsitePosting_110413-v2-CLEAN.pdf. Accessed August 9, 2016.
© 2017 Society of Hospital Medicine
Detecting sepsis: Are two opinions better than one?
Sepsis is a leading cause of hospital mortality in the United States, contributing to up to half of all deaths.1 If the infection is identified and treated early, however, its associated morbidity and mortality can be significantly reduced.2 The 2001 sepsis guidelines define sepsis as the suspicion of infection plus meeting 2 or more systemic inflammatory response syndrome (SIRS) criteria.3 Although the utility of SIRS criteria has been extensively debated, providers’ accuracy and agreement regarding suspicion of infection are not yet fully characterized. This is very important, as the source of infection is often not identified in patients with severe sepsis or septic shock.4
Although much attention recently has been given to ideal objective criteria for accurately identifying sepsis, less is known about what constitutes ideal subjective criteria and who can best make that assessment.5-7 We conducted a study to measure providers’ agreement regarding this subjective assessment and the impact of that agreement on patient outcomes.
METHODS
We performed a secondary analysis of prospectively collected data on consecutive adults hospitalized on a general medicine ward at an academic medical center between April 1, 2014 and March 31, 2015. This study was approved by the University of Chicago Institutional Review Board with a waiver of consent.
A sepsis screening tool was developed locally as part of the Surviving Sepsis Campaign Quality Improvement Learning Collaborative8 (Supplemental Figure). This tool was completed by bedside nurses for each patient during each shift. Bedside registered nurse (RN) suspicion of infection was deemed positive if the nurse answered yes to question 2: “Does the patient have evidence of an active infection?” We compared RN assessment with assessment by the ordering provider, a medical doctor or advanced practice professionals (MD/APP), using an existing order for antibiotics or a new order for either blood or urine cultures placed within 12 hours before nursing screen time to indicate MD/APP suspicion of infection.
All nursing screens were transcribed into an electronic database, excluding screens not performed, or missing RN suspicion of infection. For quality purposes, screening data were merged with electronic health record data to verify SIRS criteria at the time of the screens as well as the presence of culture and/or antibiotic orders preceding the screens. Outcome data were obtained from an administrative database and confirmed by chart review using the 2001 sepsis definitions.6 Data were de-identified and time-shifted before this analysis. SIRS-positive criteria were defined as meeting 2 or more of the following: temperature higher than 38°C or lower than 36°C; heart rate higher than 90 beats per minute; respiratory rate more than 20 breaths per minute; and white blood cell count more than 2,000/mm3 or less than 4,000/mm3.The primary clinical outcome was progression to severe sepsis or septic shock. Secondary outcomes included transfer to intensive care unit (ICU) and in-hospital mortality. Given that RN and MD/APP suspicion of infection can vary over time, only the initial screen for each patient was used in assessing progression to severe sepsis or septic shock and in-hospital mortality. All available screens were used to investigate the association between each provider’s suspicion of infection over time and ICU transfer.
Demographic characteristics were compared using the χ2 test and analysis of variance, as appropriate. Provider agreement was evaluated with a weighted κ statistic. Fisher exact tests were used to compare proportions of mortality and severe sepsis/septic shock, and the McNemar test was used to compare proportions of ICU transfers. The association of outcomes based on provider agreement was evaluated with a nonparametric test for trend.
RESULTS
During the study period, 1386 distinct patients had 13,223 screening opportunities, with a 95.4% compliance rate. A total of 1127 screens were excluded for missing nursing documentation of suspicion of infection, leaving 1192 first screens and 11,489 total screens for analysis. Of the completed screens, 3744 (32.6%) met SIRS criteria; suspicion of infection was noted by both RN and MD/APP in 5.8% of cases, by RN only in 22.2%, by MD/APP only in 7.2%, and by neither provider in 64.7% (Figure 1). Overall agreement rate was 80.7% for suspicion of infection (κ = 0.11, P < 0.001). Demographics by subgroup are shown in the Supplemental Table. Progression to severe sepsis or shock was highest when both providers suspected infection in a SIRS-positive patient (17.7%), was substantially reduced with single-provider suspicion (6.0%), and was lowest when neither provider suspected infection (1.5%) (P < 0.001). A similar trend was found for in-hospital mortality (both providers, 6.3%; single provider, 2.7%; neither provider, 2.5%; P = 0.01). Compared with MD/APP-only suspicion, SIRS-positive patients in whom only RNs suspected infection had similar frequency of progression to severe sepsis or septic shock (6.5% vs 5.6%; P = 0.52) and higher mortality (5.0% vs 1.1%; P = 0.32), though these findings were not statistically significant.

For the 121 patients (10.2%) transferred to ICU, RNs were more likely than MD/APPs to suspect infection at all time points (Figure 2). The difference was small (P = 0.29) 48 hours before transfer (RN, 12.5%; MD/APP, 5.6%) but became more pronounced (P = 0.06) by 3 hours before transfer (RN, 46.3%; MD/APP, 33.1%). Nursing assessments were not available after transfer, but 3 hours after transfer the proportion of patients who met MD/APP suspicion-of-infection criteria (44.6%) was similar (P = 0.90) to that of the RNs 3 hours before transfer (46.3%).

DISCUSSION
Our findings reveal that bedside nurses and ordering providers routinely have discordant assessments regarding presence of infection. Specifically, when RNs are asked to screen patients on the wards, they are suspicious of infection more often than MD/APPs are, and they suspect infection earlier in ICU transfer patients. These findings have significant implications for patient care, compliance with the new national SEP-1 Centers for Medicare & Medicaid Services quality measure, and identification of appropriate patients for enrollment in sepsis-related clinical trials.
To our knowledge, this is the first study to explore agreement between bedside RN and MD/APP suspicion of infection in sepsis screening and its association with patient outcomes. Studies on nurse and physician concordance in other domains have had mixed findings.9-11 The high discordance rate found in our study points to the highly subjective nature of suspicion of infection.
Our finding that RNs suspect infection earlier in patients transferred to ICU suggests nursing suspicion has value above and beyond current practice. A possible explanation for the higher rate of RN suspicion, and earlier RN suspicion, is that bedside nurses spend substantially more time with their patients and are more attuned to subtle changes that often occur before any objective signs of deterioration. This phenomenon is well documented and accounts for why rapid response calling criteria often include “nurse worry or concern.”12,13 Thus, nurse intuition may be an important signal for early identification of patients at high risk for sepsis.
That about one third of all screens met SIRS criteria and that almost two thirds of those screens were not thought by RN or MD/APP to be caused by infection add to the literature demonstrating the limited value of SIRS as a screening tool for sepsis.14 To address this issue, the 2016 sepsis definitions propose using the quick Sepsis-Related Organ Failure Assessment (qSOFA) to identify patients at high risk for clinical deterioration; however, the Surviving Sepsis Campaign continues to encourage sepsis screening using the SIRS criteria.15
Limitations of this study include its lack of generalizability, as it was conducted with general medical patients at a single center. Second, we did not specifically ask the MD/APPs whether they suspected infection; instead, we relied on their ordering practices. Third, RN and MD/APP assessments were not independent, as RNs had access to MD/APP orders before making their own assessments, which could bias our results.
Discordance in provider suspicion of infection is common, with RNs documenting suspicion more often than MD/APPs, and earlier in patients transferred to ICU. Suspicion by either provider alone is associated with higher risk for sepsis progression and in-hospital mortality than is the case when neither provider suspects infection. Thus, a collaborative method that includes both RNs and MD/APPs may improve the accuracy and timing of sepsis detection on the wards.
Acknowledgments
The authors thank the members of the Surviving Sepsis Campaign (SSC) Quality Improvement Learning Collaborative at the University of Chicago for their help in data collection and review, especially Meredith Borak, Rita Lanier, Mary Ann Francisco, and Bill Marsack. The authors also thank Thomas Best and Mary-Kate Springman for their assistance in data entry and Nicole Twu for administrative support. Data from this study were provided by the Clinical Research Data Warehouse (CRDW) maintained by the Center for Research Informatics (CRI) at the University of Chicago. CRI is funded by the Biological Sciences Division of the Institute for Translational Medicine/Clinical and Translational Science Award (CTSA) (National Institutes of Health UL1 TR000430) at the University of Chicago.
Disclosures
Dr. Bhattacharjee is supported by postdoctoral training grant 4T32HS000078 from the Agency for Healthcare Research and Quality. Drs. Churpek and Edelson have a patent pending (ARCD.P0535US.P2) for risk stratification algorithms for hospitalized patients. Dr. Churpek is supported by career development award K08 HL121080 from the National Heart, Lung, and Blood Institute. Dr. Edelson has received research support from Philips Healthcare (Andover, Massachusetts), American Heart Association (Dallas, Texas), and Laerdal Medical (Stavanger, Norway) and has ownership interest in Quant HC (Chicago, Illinois), which is developing products for risk stratification of hospitalized patients. The other authors report no conflicts of interest.
1. Liu V, Escobar GJ, Greene JD, et al. Hospital deaths in patients with sepsis from 2 independent cohorts. JAMA. 2014;312(1):90-92. PubMed
2. Rivers E, Nguyen B, Havstad S, et al; Early Goal-Directed Therapy Collaborative Group. Early goal-directed therapy in the treatment of severe sepsis and septic shock. N Engl J Med. 2001;345(19):1368-1377. PubMed
3. Levy MM, Fink MP, Marshall JC, et al; SCCM/ESICM/ACCP/ATS/SIS. 2001 SCCM/ESICM/ACCP/ATS/SIS International Sepsis Definitions Conference. Crit Care Med. 2003;31(4):1250-1256. PubMed
4. Vincent JL, Sakr Y, Sprung CL, et al; Sepsis Occurrence in Acutely Ill Patients Investigators. Sepsis in European intensive care units: results of the SOAP study. Crit Care Med. 2006;34(2):344-353. PubMed
5. Kaukonen KM, Bailey M, Pilcher D, Cooper DJ, Bellomo R. Systemic inflammatory response syndrome criteria in defining severe sepsis. N Engl J Med. 2015;372(17):1629-1638. PubMed
6. Vincent JL, Opal SM, Marshall JC, Tracey KJ. Sepsis definitions: time for change. Lancet. 2013;381(9868):774-775. PubMed
7. Singer M, Deutschman CS, Seymour CW, et al. The Third International Consensus Definitions for Sepsis and Septic Shock (Sepsis-3). JAMA. 2016;315(8):801-810. PubMed
8. Surviving Sepsis Campaign (SSC) Sepsis on the Floors Quality Improvement Learning Collaborative. Frequently asked questions (FAQs). Society of Critical Care Medicine website. http://www.survivingsepsis.org/SiteCollectionDocuments/About-Collaboratives.pdf. Published October 8, 2013.
9. Fiesseler F, Szucs P, Kec R, Richman PB. Can nurses appropriately interpret the Ottawa ankle rule? Am J Emerg Med. 2004;22(3):145-148. PubMed
10. Blomberg H, Lundström E, Toss H, Gedeborg R, Johansson J. Agreement between ambulance nurses and physicians in assessing stroke patients. Acta Neurol Scand. 2014;129(1):4955. PubMed
11. Neville TH, Wiley JF, Yamamoto MC, et al. Concordance of nurses and physicians on whether critical care patients are receiving futile treatment. Am J Crit Care. 2015;24(5):403410. PubMed
12. Odell M, Victor C, Oliver D. Nurses’ role in detecting deterioration in ward patients: systematic literature review. J Adv Nurs. 2009;65(10):1992-2006. PubMed
13. Howell MD, Ngo L, Folcarelli P, et al. Sustained effectiveness of a primary-team-based rapid response system. Crit Care Med. 2012;40(9):2562-2568. PubMed
14. Churpek MM, Zadravecz FJ, Winslow C, Howell MD, Edelson DP. Incidence and prognostic value of the systemic inflammatory response syndrome and organ dysfunctions in ward patients. Am J Respir Crit Care Med. 2015;192(8):958-964. PubMed
15. Antonelli M, DeBacker D, Dorman T, Kleinpell R, Levy M, Rhodes A; Surviving Sepsis Campaign Executive Committee. Surviving Sepsis Campaign responds to Sepsis-3. Society of Critical Care Medicine website. http://www.survivingsepsis.org/SiteCollectionDocuments/SSC-Statements-Sepsis-Definitions-3-2016.pdf. Published March 1, 2016. Accessed May 11, 2016.
Sepsis is a leading cause of hospital mortality in the United States, contributing to up to half of all deaths.1 If the infection is identified and treated early, however, its associated morbidity and mortality can be significantly reduced.2 The 2001 sepsis guidelines define sepsis as the suspicion of infection plus meeting 2 or more systemic inflammatory response syndrome (SIRS) criteria.3 Although the utility of SIRS criteria has been extensively debated, providers’ accuracy and agreement regarding suspicion of infection are not yet fully characterized. This is very important, as the source of infection is often not identified in patients with severe sepsis or septic shock.4
Although much attention recently has been given to ideal objective criteria for accurately identifying sepsis, less is known about what constitutes ideal subjective criteria and who can best make that assessment.5-7 We conducted a study to measure providers’ agreement regarding this subjective assessment and the impact of that agreement on patient outcomes.
METHODS
We performed a secondary analysis of prospectively collected data on consecutive adults hospitalized on a general medicine ward at an academic medical center between April 1, 2014 and March 31, 2015. This study was approved by the University of Chicago Institutional Review Board with a waiver of consent.
A sepsis screening tool was developed locally as part of the Surviving Sepsis Campaign Quality Improvement Learning Collaborative8 (Supplemental Figure). This tool was completed by bedside nurses for each patient during each shift. Bedside registered nurse (RN) suspicion of infection was deemed positive if the nurse answered yes to question 2: “Does the patient have evidence of an active infection?” We compared RN assessment with assessment by the ordering provider, a medical doctor or advanced practice professionals (MD/APP), using an existing order for antibiotics or a new order for either blood or urine cultures placed within 12 hours before nursing screen time to indicate MD/APP suspicion of infection.
All nursing screens were transcribed into an electronic database, excluding screens not performed, or missing RN suspicion of infection. For quality purposes, screening data were merged with electronic health record data to verify SIRS criteria at the time of the screens as well as the presence of culture and/or antibiotic orders preceding the screens. Outcome data were obtained from an administrative database and confirmed by chart review using the 2001 sepsis definitions.6 Data were de-identified and time-shifted before this analysis. SIRS-positive criteria were defined as meeting 2 or more of the following: temperature higher than 38°C or lower than 36°C; heart rate higher than 90 beats per minute; respiratory rate more than 20 breaths per minute; and white blood cell count more than 2,000/mm3 or less than 4,000/mm3.The primary clinical outcome was progression to severe sepsis or septic shock. Secondary outcomes included transfer to intensive care unit (ICU) and in-hospital mortality. Given that RN and MD/APP suspicion of infection can vary over time, only the initial screen for each patient was used in assessing progression to severe sepsis or septic shock and in-hospital mortality. All available screens were used to investigate the association between each provider’s suspicion of infection over time and ICU transfer.
Demographic characteristics were compared using the χ2 test and analysis of variance, as appropriate. Provider agreement was evaluated with a weighted κ statistic. Fisher exact tests were used to compare proportions of mortality and severe sepsis/septic shock, and the McNemar test was used to compare proportions of ICU transfers. The association of outcomes based on provider agreement was evaluated with a nonparametric test for trend.
RESULTS
During the study period, 1386 distinct patients had 13,223 screening opportunities, with a 95.4% compliance rate. A total of 1127 screens were excluded for missing nursing documentation of suspicion of infection, leaving 1192 first screens and 11,489 total screens for analysis. Of the completed screens, 3744 (32.6%) met SIRS criteria; suspicion of infection was noted by both RN and MD/APP in 5.8% of cases, by RN only in 22.2%, by MD/APP only in 7.2%, and by neither provider in 64.7% (Figure 1). Overall agreement rate was 80.7% for suspicion of infection (κ = 0.11, P < 0.001). Demographics by subgroup are shown in the Supplemental Table. Progression to severe sepsis or shock was highest when both providers suspected infection in a SIRS-positive patient (17.7%), was substantially reduced with single-provider suspicion (6.0%), and was lowest when neither provider suspected infection (1.5%) (P < 0.001). A similar trend was found for in-hospital mortality (both providers, 6.3%; single provider, 2.7%; neither provider, 2.5%; P = 0.01). Compared with MD/APP-only suspicion, SIRS-positive patients in whom only RNs suspected infection had similar frequency of progression to severe sepsis or septic shock (6.5% vs 5.6%; P = 0.52) and higher mortality (5.0% vs 1.1%; P = 0.32), though these findings were not statistically significant.
For the 121 patients (10.2%) transferred to ICU, RNs were more likely than MD/APPs to suspect infection at all time points (Figure 2). The difference was small (P = 0.29) 48 hours before transfer (RN, 12.5%; MD/APP, 5.6%) but became more pronounced (P = 0.06) by 3 hours before transfer (RN, 46.3%; MD/APP, 33.1%). Nursing assessments were not available after transfer, but 3 hours after transfer the proportion of patients who met MD/APP suspicion-of-infection criteria (44.6%) was similar (P = 0.90) to that of the RNs 3 hours before transfer (46.3%).
DISCUSSION
Our findings reveal that bedside nurses and ordering providers routinely have discordant assessments regarding presence of infection. Specifically, when RNs are asked to screen patients on the wards, they are suspicious of infection more often than MD/APPs are, and they suspect infection earlier in ICU transfer patients. These findings have significant implications for patient care, compliance with the new national SEP-1 Centers for Medicare & Medicaid Services quality measure, and identification of appropriate patients for enrollment in sepsis-related clinical trials.
To our knowledge, this is the first study to explore agreement between bedside RN and MD/APP suspicion of infection in sepsis screening and its association with patient outcomes. Studies on nurse and physician concordance in other domains have had mixed findings.9-11 The high discordance rate found in our study points to the highly subjective nature of suspicion of infection.
Our finding that RNs suspect infection earlier in patients transferred to ICU suggests nursing suspicion has value above and beyond current practice. A possible explanation for the higher rate of RN suspicion, and earlier RN suspicion, is that bedside nurses spend substantially more time with their patients and are more attuned to subtle changes that often occur before any objective signs of deterioration. This phenomenon is well documented and accounts for why rapid response calling criteria often include “nurse worry or concern.”12,13 Thus, nurse intuition may be an important signal for early identification of patients at high risk for sepsis.
That about one third of all screens met SIRS criteria and that almost two thirds of those screens were not thought by RN or MD/APP to be caused by infection add to the literature demonstrating the limited value of SIRS as a screening tool for sepsis.14 To address this issue, the 2016 sepsis definitions propose using the quick Sepsis-Related Organ Failure Assessment (qSOFA) to identify patients at high risk for clinical deterioration; however, the Surviving Sepsis Campaign continues to encourage sepsis screening using the SIRS criteria.15
Limitations of this study include its lack of generalizability, as it was conducted with general medical patients at a single center. Second, we did not specifically ask the MD/APPs whether they suspected infection; instead, we relied on their ordering practices. Third, RN and MD/APP assessments were not independent, as RNs had access to MD/APP orders before making their own assessments, which could bias our results.
Discordance in provider suspicion of infection is common, with RNs documenting suspicion more often than MD/APPs, and earlier in patients transferred to ICU. Suspicion by either provider alone is associated with higher risk for sepsis progression and in-hospital mortality than is the case when neither provider suspects infection. Thus, a collaborative method that includes both RNs and MD/APPs may improve the accuracy and timing of sepsis detection on the wards.
Acknowledgments
The authors thank the members of the Surviving Sepsis Campaign (SSC) Quality Improvement Learning Collaborative at the University of Chicago for their help in data collection and review, especially Meredith Borak, Rita Lanier, Mary Ann Francisco, and Bill Marsack. The authors also thank Thomas Best and Mary-Kate Springman for their assistance in data entry and Nicole Twu for administrative support. Data from this study were provided by the Clinical Research Data Warehouse (CRDW) maintained by the Center for Research Informatics (CRI) at the University of Chicago. CRI is funded by the Biological Sciences Division of the Institute for Translational Medicine/Clinical and Translational Science Award (CTSA) (National Institutes of Health UL1 TR000430) at the University of Chicago.
Disclosures
Dr. Bhattacharjee is supported by postdoctoral training grant 4T32HS000078 from the Agency for Healthcare Research and Quality. Drs. Churpek and Edelson have a patent pending (ARCD.P0535US.P2) for risk stratification algorithms for hospitalized patients. Dr. Churpek is supported by career development award K08 HL121080 from the National Heart, Lung, and Blood Institute. Dr. Edelson has received research support from Philips Healthcare (Andover, Massachusetts), American Heart Association (Dallas, Texas), and Laerdal Medical (Stavanger, Norway) and has ownership interest in Quant HC (Chicago, Illinois), which is developing products for risk stratification of hospitalized patients. The other authors report no conflicts of interest.
1. Liu V, Escobar GJ, Greene JD, et al. Hospital deaths in patients with sepsis from 2 independent cohorts. JAMA. 2014;312(1):90-92. PubMed
2. Rivers E, Nguyen B, Havstad S, et al; Early Goal-Directed Therapy Collaborative Group. Early goal-directed therapy in the treatment of severe sepsis and septic shock. N Engl J Med. 2001;345(19):1368-1377. PubMed
3. Levy MM, Fink MP, Marshall JC, et al; SCCM/ESICM/ACCP/ATS/SIS. 2001 SCCM/ESICM/ACCP/ATS/SIS International Sepsis Definitions Conference. Crit Care Med. 2003;31(4):1250-1256. PubMed
4. Vincent JL, Sakr Y, Sprung CL, et al; Sepsis Occurrence in Acutely Ill Patients Investigators. Sepsis in European intensive care units: results of the SOAP study. Crit Care Med. 2006;34(2):344-353. PubMed
5. Kaukonen KM, Bailey M, Pilcher D, Cooper DJ, Bellomo R. Systemic inflammatory response syndrome criteria in defining severe sepsis. N Engl J Med. 2015;372(17):1629-1638. PubMed
6. Vincent JL, Opal SM, Marshall JC, Tracey KJ. Sepsis definitions: time for change. Lancet. 2013;381(9868):774-775. PubMed
7. Singer M, Deutschman CS, Seymour CW, et al. The Third International Consensus Definitions for Sepsis and Septic Shock (Sepsis-3). JAMA. 2016;315(8):801-810. PubMed
8. Surviving Sepsis Campaign (SSC) Sepsis on the Floors Quality Improvement Learning Collaborative. Frequently asked questions (FAQs). Society of Critical Care Medicine website. http://www.survivingsepsis.org/SiteCollectionDocuments/About-Collaboratives.pdf. Published October 8, 2013.
9. Fiesseler F, Szucs P, Kec R, Richman PB. Can nurses appropriately interpret the Ottawa ankle rule? Am J Emerg Med. 2004;22(3):145-148. PubMed
10. Blomberg H, Lundström E, Toss H, Gedeborg R, Johansson J. Agreement between ambulance nurses and physicians in assessing stroke patients. Acta Neurol Scand. 2014;129(1):4955. PubMed
11. Neville TH, Wiley JF, Yamamoto MC, et al. Concordance of nurses and physicians on whether critical care patients are receiving futile treatment. Am J Crit Care. 2015;24(5):403410. PubMed
12. Odell M, Victor C, Oliver D. Nurses’ role in detecting deterioration in ward patients: systematic literature review. J Adv Nurs. 2009;65(10):1992-2006. PubMed
13. Howell MD, Ngo L, Folcarelli P, et al. Sustained effectiveness of a primary-team-based rapid response system. Crit Care Med. 2012;40(9):2562-2568. PubMed
14. Churpek MM, Zadravecz FJ, Winslow C, Howell MD, Edelson DP. Incidence and prognostic value of the systemic inflammatory response syndrome and organ dysfunctions in ward patients. Am J Respir Crit Care Med. 2015;192(8):958-964. PubMed
15. Antonelli M, DeBacker D, Dorman T, Kleinpell R, Levy M, Rhodes A; Surviving Sepsis Campaign Executive Committee. Surviving Sepsis Campaign responds to Sepsis-3. Society of Critical Care Medicine website. http://www.survivingsepsis.org/SiteCollectionDocuments/SSC-Statements-Sepsis-Definitions-3-2016.pdf. Published March 1, 2016. Accessed May 11, 2016.
© 2017 Society of Hospital Medicine