User login
Direct-acting antivirals tied to better outcomes in chronic Hep C
Eiichi Ogawa, MD, PhD, with the department of general internal medicine, Kyushu University Hospital in Fukuoka, Japan, led the retrospective study of 245,596 adults with CHC. In the new research, which was published in JAMA Internal Medicine, the authors analyzed data from the Optum Clinformatics Data Mart (CDM) database, 2010-2021.
It was important to do the study because of limited and conflicting information – mostly from case reports – on safety of the DAAs when they were approved for CHC in 2014, said coauthor Mindie H. Nguyen, MD, in an interview.
‘DAA treatment is safe’
“The main message is that DAA treatment is safe,” said Dr. Nguyen, of the division of gastroenterology and hepatology at Stanford (Calif.) University Medical Center in Palo Alto. In the early days of treatment, physicians were treating the sickest patients with the DAAs, which may have introduced patient selection bias and caused lasting misperceptions about poor safety, she noted.
“I really hope to dispel this myth,” she said, adding that this study also shows improved liver and nonliver outcomes.
Of the total cohort in this study, 40,654 patients had one or more prescriptions for a DAA (without interferon) and 204,942 patients had not been treated.
All-cause mortality reduced by 57%
DAA treatment, vs. no treatment, was linked with a large and significant reduction (57%) in all-cause mortality. That finding was particularly notable, because it was seen regardless of age, sex, race and ethnicity, comorbidities, alcohol use, and presence of hepatocellular carcinoma or cirrhosis.
The authors noted that patients without cirrhosis are a population previously considered to receive less benefit from an HCV cure than patients with cirrhosis.
DAAs were associated with lower risk of hepatocellular carcinoma and decompensation as well as risk of nonliver outcomes, including diabetes, cardiovascular disease (CVD), and chronic kidney disease (CKD).
Lower risk of poor nonliver outcomes
The researchers found that when they compared DAA-treated patients with untreated patients, the incidences per 1,000 person-years of having diabetes were 30.2 vs. 37.2 (P less than .001), and of having kidney disease was 31.1 vs. 34.1 (P less than .001), respectively.
“This retrospective cohort study provides valuable information to physicians,” Noel Deep, MD, chief medical officer at Aspirus Langlade Hospital in Antigo, Wis., said, in an interview.
The study’s size helps confirm DAAs’ safety and benefit, and previously unknown added benefits, in treating CHC, he continued.
Large study confirms, introduces DAA benefits
Dr. Deep, who was not part of the study, noted that DAAs now show much promise in efficacy and tolerability in most people with chronic hepatitis C, including those with concomitant conditions such as CKD.
“Previous studies did not have such large-scale nationwide data. [The findings of the new study] greatly enhance our knowledge of DAA treatment for chronic hepatitis C patients across the spectrum from noncirrhotic to compensated cirrhotic to decompensated cirrhotic,” Dr. Deep said. “The added benefit of improved outcomes for diabetes, CVD, CKD, and nonliver cancers truly surprised me.”
Dr. Deep pointed out some limitations of the study, including that, as the authors acknowledge, only privately insured patients were included so results may not be generalizable to the underinsured/uninsured “who might have other risk factors, poorer health, and fewer resources.”
He added: “The data also may not be reflective of the outcomes in Asians who were, in my opinion, also underrepresented in this study.”
The authors cited the insurance claims database they used as a strength of the study, due to it containing information on 61 million people from across all regions of the United States.
Dr. Ogawa reports grants from Gilead Sciences outside the submitted work. Coauthor Dr. Nguyen reports institutional grants and advisory board fees from Gilead Sciences outside the submitted work. Another coauthor reports speaking/consulting fees from Gilead and Merck Sharp & Dohme outside the submitted work. No other disclosures were reported.
The Stanford Center for Population Health Sciences (PHS) supported this study by providing access to the PHS Data Core.
Dr. Deep reports no relevant financial relationships. He serves on the editorial advisory board of Internal Medicine News.
FROM JAMA INTERNAL MEDICINE
A bold national plan to eliminate HCV by 2050
WASHINGTON – “We don’t get to use the ‘eliminate’ word all that often with a disease that’s taking thousands or tens of thousands – or worldwide, hundreds of thousands – of lives every year, but we have that opportunity with hepatitis C.”
So said Francis S. Collins, MD, PhD, special projects advisor to the Executive Office of the President of the United States, and former director of the National Institutes of Health, speaking at a special session outlining ambitious goals for a national plan to eliminate hepatitis C virus (HCV) infections by the year 2050.
The session was held at the annual meeting of the American Association for the Study of Liver Diseases.
A public health crisis
Dr. Collins labeled HCV a public health crisis, citing statistics from the Centers for Disease Control and Prevention that show that the rate of reported acute HCV infection cases increased 400% between 2010 and 2020, with the highest rates among young adults aged 20-39 years.
In addition, an estimated 2.4 million people in the United States are living with chronic HCV infections, but as many as 40% of these people are unaware of their infection, despite broad recommendations for the screening of all adults aged 18 years and older, he said.
“Our goal is to try to do something to change this,” Dr. Collins said. He noted that for the past 8 years we have had highly effective oral agents that don’t just treat the disease but cure it – 95%-97% of the time, with only 8-12 weeks of oral therapy and relatively few side effects.
“A wonderful story, one of the most exciting stories that’s come out of biomedical research in the last couple of decades,” he said.
Yet Dr. Collins also acknowledged that the task of developing a national plan is daunting, despite that pharmaceutical triumph.
National pharmacy claims data show that the number of persons treated for HCV with direct-acting antiviral agents (DAAs) in the United States declined from a high of 164,247 in 2015 to 83,740 in 2020.
Furthermore, CDC data from 2019 and 2020 show that, of persons with a diagnosis of HCV infection, only 23% of those on Medicaid, 28% of those on Medicare, and 35% of those with private insurance were treated for their infections.
“We have a huge gap here between the ability to know you have the disease and to get treatment, and we don’t see the numbers here for the uninsured, or people in prisons, but they’re probably much worse,” he said.
Obstacles abound, as do ways to overcome them
Current barriers to treatment include the aforementioned lack of awareness of infection, a “clunky” two-step diagnosis requiring an antibody test followed by an RNA or core antigen test necessitating three visits often separated by several weeks, and the high cost of treatment (around $90,000 per patient).
In addition, insurers commonly require proof that patients remain sober for extended periods, insist that treatment monitoring be performed by specialists only, and often approve treatment only for those patients who have documented evidence of liver damage.
“Does that make sense to you?” Dr. Collins asked. “You’ve got a cure for a liver disease, and you have to wait and show that the liver’s been damaged before you receive it? That just doesn’t fit,” he said.
Dr. Collins also pointed out that we’re dealing with hard-to-reach populations (underserved, uninsured, justice-involved), and people who are in tough times. “Anything that you put in the way as a barrier is going to make this worse in terms of its ability to be implemented,” he said.
To demonstrate how a coordinated HCV-elimination program could work, Dr. Collins pointed to a Medicaid cohort study in Louisiana conducted from July 2019 through December 2021, in which 8,867 patients started on therapy, 7,763 (88%) completed therapy, and 5,882 (66%) returned for testing. Of those tested, 5,285 (90%) had sustained virologic responses.
Another model of a hepatitis C elimination program was provided by the Veterans Health Administration. They received funding for an effort for all veterans, and in the space of 7 years were able to reach out even to some of their difficult-to-reach populations and achieve high diagnosis and treatment rates in a way that could be a model for what we would want to do across the nation, Dr. Collins noted.
Doing the math
Also at the session, Jagpreet Chhatwal, PhD, director of the Massachusetts General Hospital Institute for Technology Assessment and associate professor of radiology at Harvard Medical School, Boston, described outcomes projected by a mathematical simulation model of the HCV epidemic that he and his colleagues developed.
The HEP-SIM (Hepatitis C Disease Burden Simulation) model evaluates HCV prevalence trends, the number needed to screen and treat to eliminate HCV, HCV-associated clinical outcomes, the cost of an elimination program, and the cost savings that could be realized from preventing long-term complications.
The model seeks to determine whether the upfront costs of a national HCV elimination program could be offset by savings down the road. Specifically, it assumes that within the next 5 years 1.31 million individuals would be diagnosed with HCV and projects that within that time frame 1.52 million would need to be treated to meet HCV elimination goals.
The model shows that, compared with the status quo, a concerted campaign of screening and treatment would prevent more than 10,000 HCV-related deaths by 2030, and 91,000 deaths by 2050.
A coordinated screening program is also projected to prevent 17,000 cases of hepatocellular carcinoma by 2030 and 108,000 cases by 2050, as well as avert 29,000 cases of decompensated cirrhosis by 2030 and 93,000 such cases by 2050.
The cost savings associated with an HCV elimination plan would also be substantial, Dr. Chhatwal said.
According to the model, over the next decade the cumulative costs associated with HCV would decline by $14.2 billion, compared with the status quo. Nearly 80% of those savings ($11.2 billion) would be in Medicare and Medicaid.
The total projected savings from 2024 through 2050 – in disease management, testing, treatment, and pragmatic costs – are estimated at $59.3 billion, Dr. Chhatwal said.
“This is unprecedented,” he said.
Getting it done
Rachael L. Fleurence, PhD, MSc, a health economist currently serving as a senior advisor in the Executive Office of the President, summarized efforts to build a national HCV elimination program with input from federal health care agencies, state health leaders, patients, advocacy groups, drug manufacturers, and insurers.
She noted that a large component and focus of the program will be working on diagnostic test development but also accelerating bringing tests into the United States that are currently unavailable here. “These include point-of-care RNA diagnostic tests, as well as core antigen laboratory tests,” she said.
The program will be designed to offer broad access to curative anti-HCV drugs through a national subscription model that would make DAAs available to Medicaid recipients, justice-involved populations, the uninsured, and American Indians and Alaskan Natives who receive care through the Indian Health Service.
“On the Medicare and commercial insurance fronts, we’re still exploring different approaches, including potentially a co-pay assistance for Medicare beneficiaries, as well as working with commercial insurers to reduce barriers to access,” she said.
The program would also involve screening strategies extending to more settings, especially for high-risk populations, expanding the number of providers allowed to screen and treat HCV infections through telehealth, ensuring incentives for providers, and increasing the number of community health workers and case workers to improve linkage to care.
The next steps for the program would include funding to support the NIH’s RADx diagnostics program to accelerate access to testing, planning for the subscription model for DAA purchase, and launching pilot programs with the CDC, the Health Resources and Services Administration, the Substance Abuse and Mental Health Services Administration, and the Indian Health Service.
A call to action
Dr. Collins ended this portion of the program with an exhortation to AASLD members to do their part.
“We need your help,” Dr. Collins said. “This is a bold initiative, but it’s an opportunity. It’s even a responsibility. If we can actually succeed at this kind of outreach and save lives, and at the same time save money, how can we not do that?”
Dr. Collins, Dr. Chhatwal, and Dr. Fleurence each reported having no financial conflicts.
A version of this article first appeared on Medscape.com.
AT THE LIVER MEETING
How a cheap liver drug may be the key to preventing COVID
Welcome to Impact Factor, your weekly dose of commentary on a new medical study. I’m Dr F. Perry Wilson of the Yale School of Medicine.
As soon as the pandemic started, the search was on for a medication that could stave off infection, or at least the worst consequences of infection.
One that would be cheap to make, safe, easy to distribute, and, ideally, was already available. The search had a quest-like quality, like something from a fairy tale. Society, poisoned by COVID, would find the antidote out there, somewhere, if we looked hard enough.
You know the story. There were some pretty dramatic failures: hydroxychloroquine, ivermectin. There were some successes, like dexamethasone.
I’m not here today to tell you that the antidote has been found – no, it takes large randomized trials to figure that out. But
How do you make a case that an existing drug – UDCA, in this case – might be useful to prevent or treat COVID? In contrast to prior basic-science studies, like the original ivermectin study, which essentially took a bunch of cells and virus in a tube filled with varying concentrations of the antiparasitic agent, the authors of this paper appearing in Nature give us multiple, complementary lines of evidence. Let me walk you through it.
All good science starts with a biologically plausible hypothesis. In this case, the authors recognized that SARS-CoV-2, in all its variants, requires the presence of the ACE2 receptor on the surface of cells to bind.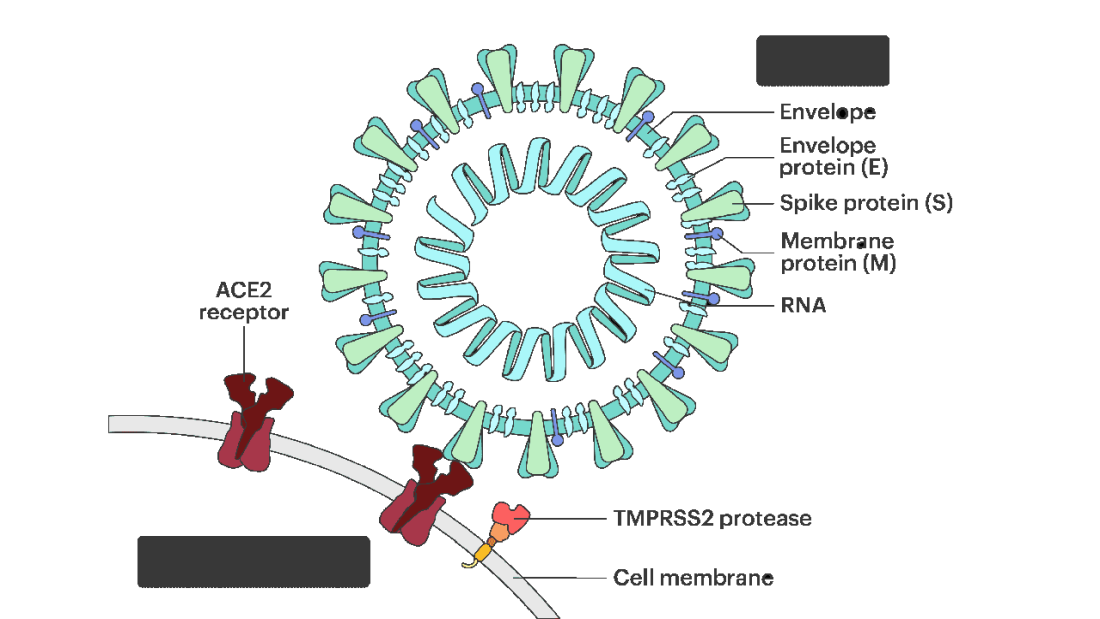
That is the doorway to infection. Vaccines and antibodies block the key to this door, the spike protein and its receptor binding domain. But what if you could get rid of the doors altogether?
The authors first showed that ACE2 expression is controlled by a certain transcription factor known as the farnesoid X receptor, or FXR. Reducing the binding of FXR should therefore reduce ACE2 expression.
As luck would have it, UDCA – Actigall – reduces the levels of FXR and thus the expression of ACE2 in cells.
Okay. So we have a drug that can reduce ACE2, and we know that ACE2 is necessary for the virus to infect cells. Would UDCA prevent viral infection?
They started with test tubes, showing that cells were less likely to be infected by SARS-CoV-2 in the presence of UDCA at concentrations similar to what humans achieve in their blood after standard dosing. The red staining here is spike protein; you can see that it is markedly lower in the cells exposed to UDCA.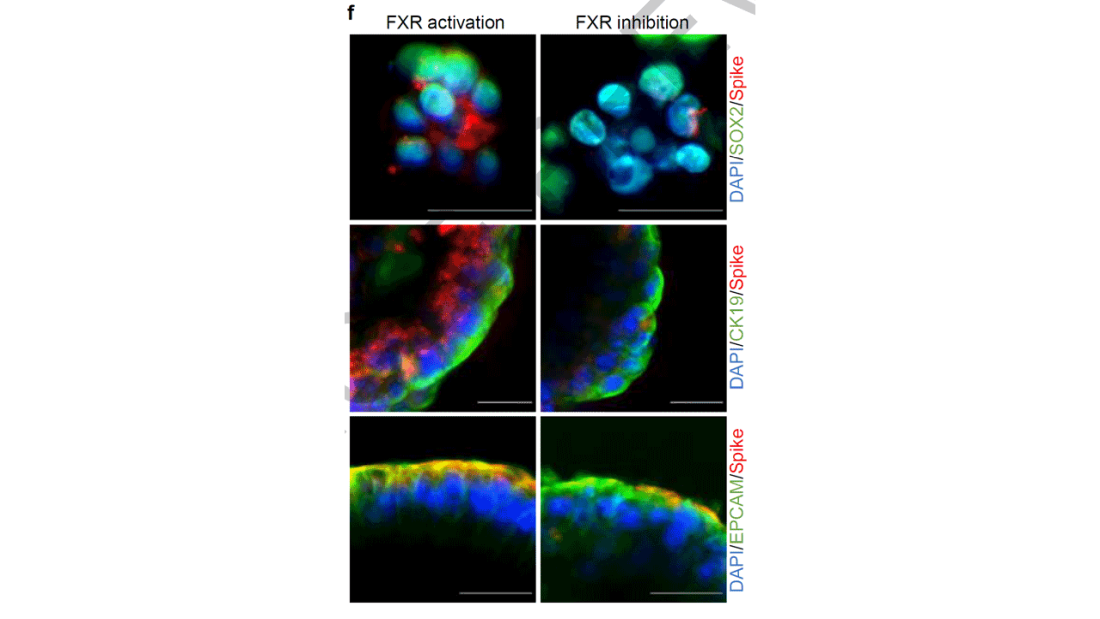
So far, so good. But test tubes aren’t people. So they moved up to mice and Syrian golden hamsters. These cute fellows are quite susceptible to human COVID and have been a model organism in countless studies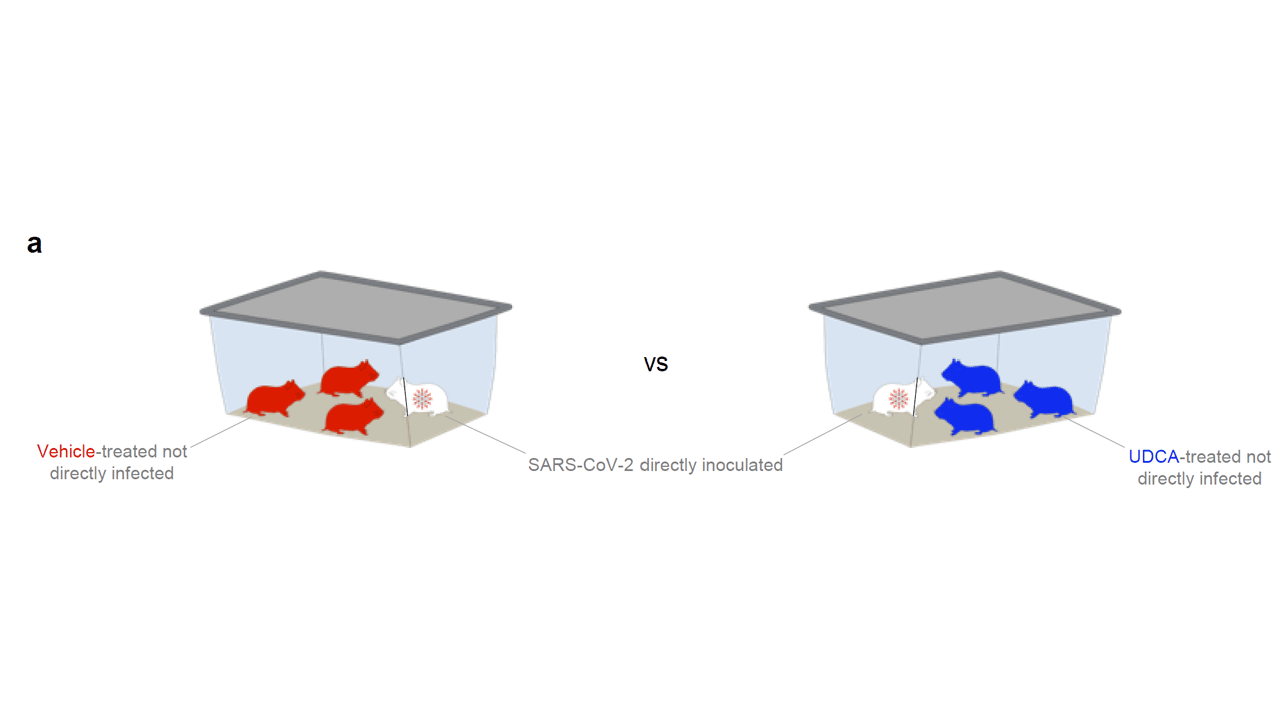
Mice and hamsters treated with UDCA in the presence of littermates with COVID infections were less likely to become infected themselves compared with mice not so treated. They also showed that mice and hamsters treated with UDCA had lower levels of ACE2 in their nasal passages.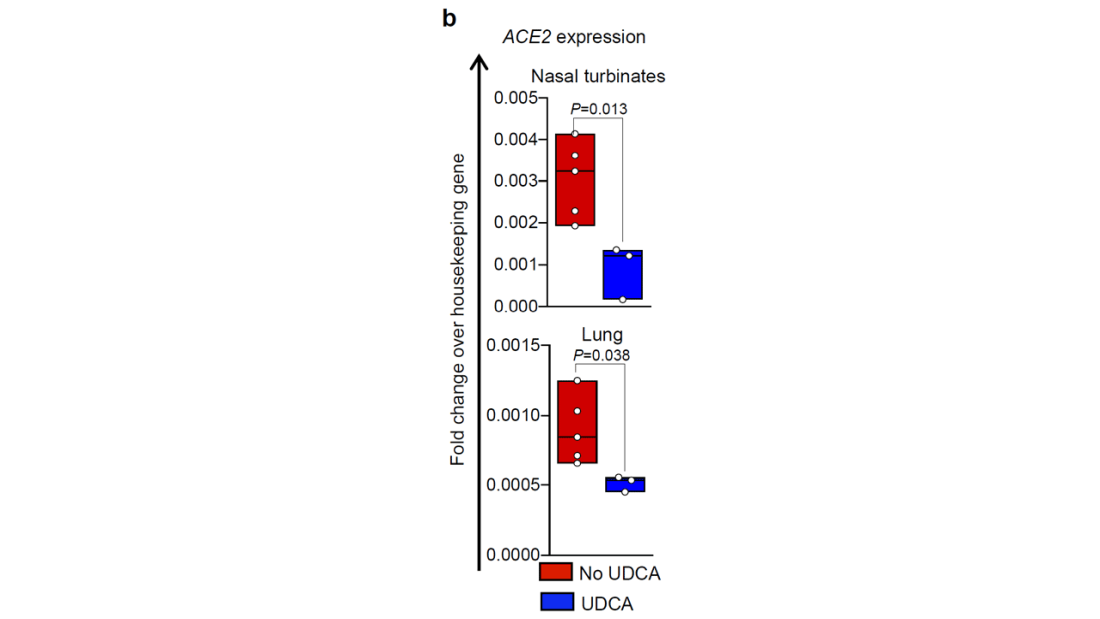
Of course, mice aren’t humans either. So the researchers didn’t stop there.
To determine the effects of UDCA on human tissue, they utilized perfused human lungs that had been declined for transplantation. The lungs were perfused with a special fluid to keep them viable, and were mechanically ventilated. One lung was exposed to UDCA and the other served as a control. The authors were able to show that ACE2 levels went down in the exposed lung. And, importantly, when samples of tissue from both lungs were exposed to SARS-CoV-2, the lung tissue exposed to UDCA had lower levels of viral infection.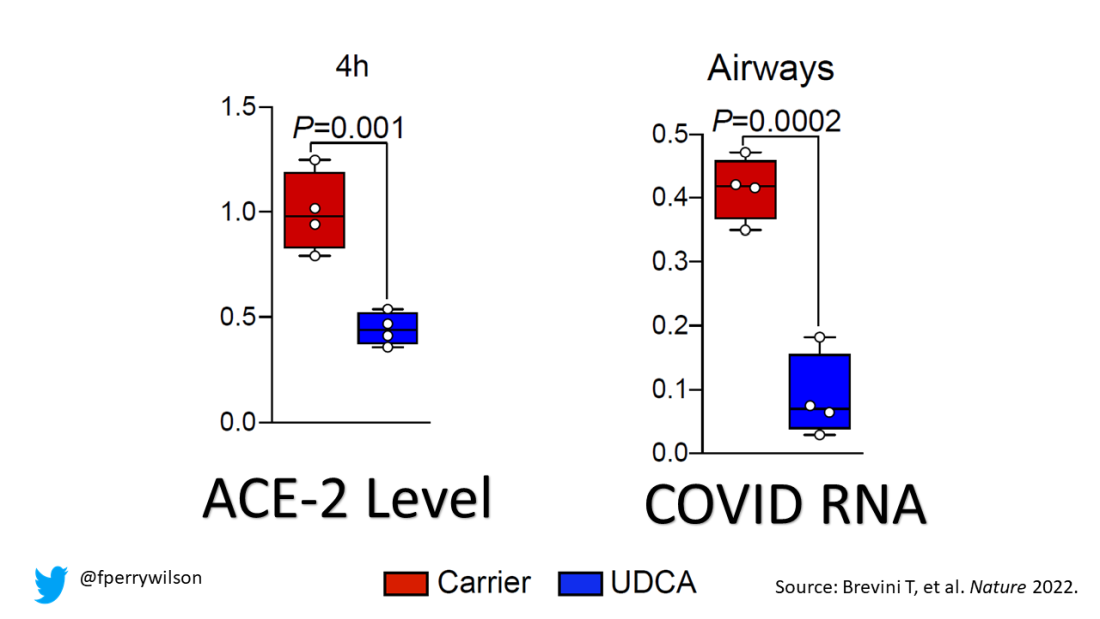
They didn’t stop there.
Eight human volunteers were recruited to take UDCA for 5 days. ACE2 levels in the nasal passages went down over the course of treatment. They confirmed those results from a proteomics dataset with several hundred people who had received UDCA for clinical reasons. Treated individuals had lower ACE2 levels.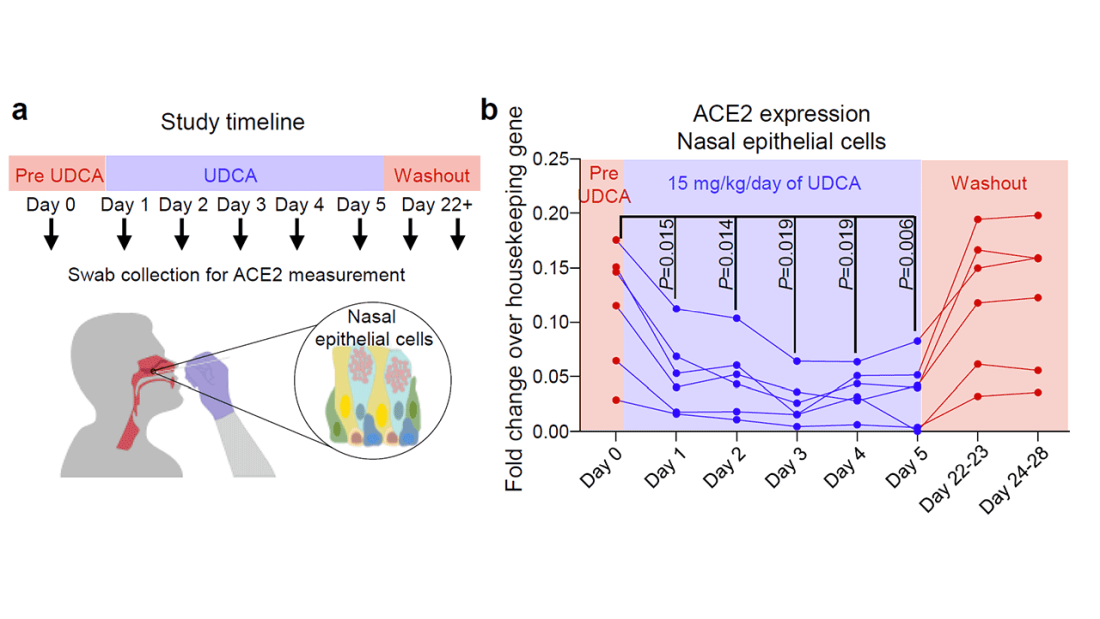
Finally, they looked at the epidemiologic effect. They examined a dataset that contained information on over 1,000 patients with liver disease who had contracted COVID-19, 31 of whom had been receiving UDCA. Even after adjustment for baseline differences, those receiving UDCA were less likely to be hospitalized, require an ICU, or die.
Okay, we’ll stop there. Reading this study, all I could think was, Yes! This is how you generate evidence that you have a drug that might work – step by careful step.
But let’s be careful as well. Does this study show that taking Actigall will prevent COVID? Of course not. It doesn’t show that it will treat COVID either. But I bring it up because the rigor of this study stands in contrast to those that generated huge enthusiasm earlier in the pandemic only to let us down in randomized trials. If there has been a drug out there this whole time which will prevent or treat COVID, this is how we’ll find it. The next step? Test it in a randomized trial.
For Medscape, I’m Perry Wilson.
F. Perry Wilson, MD, MSCE, is an associate professor of medicine and director of Yale’s Clinical and Translational Research Accelerator. He disclosed no relevant financial relationships.
A version of this video transcript first appeared on Medscape.com.
Poor NAFLD outcomes with increased VCTE-measured liver stiffness
according to new findings presented at the annual meeting of the American Association for the Study of Liver Diseases.
Although previous retrospective studies have suggested that increased liver stiffness, as measured by VCTE (FibroScan), is associated with increases in liver-related events, there is a paucity of prospective data, reported Samer Gawrieh, MD, from Indiana University, Carmel and Indianapolis. VCTE is a noninvasive measure of cirrhosis progression.
In their prospective cohort study of patients representing the entire spectrum of NAFLD, the progression to LSM-defined cirrhosis was independently associated with the risk for a composite clinical outcome of death, decompensation, hepatocellular carcinoma, or a Model for End Stage Liver Disease (MELD) score of greater than 15, he said.
Their findings show that “progression to LSM-defined cirrhosis by VCTE is strongly associated with poor clinical outcomes,” Dr. Gawrieh said.
Study findings
Investigators looked at prospective data on 894 patients with biopsy-proven NAFLD in the Nonalcoholic Steatohepatitis (NASH) Clinical Research Network database. The sample included patients with a minimum of two LSM readings taken from 2014 through 2022.
They defined LSM-defined cirrhosis as reaching LSM of greater than 14.9 kPa (90% specificity cutoff) among patients without cirrhosis on the baseline VCTE (a 90% sensitivity cutoff of LSM less than 12.1 kPa).
They also performed a histology-based subanalysis, including data only from those patients who had LSM within 6 months of a liver biopsy.
The median patient age was 60 years, 37% were male, and 80.9% were White and 11.5% were Hispanic/Latino. The median body mass index (BMI) was 32.
Out of all the patients, 119 (13.3%) had progression to LSM-defined cirrhosis.
At a median follow-up of 3.69 years for the 775 patients without LSM progression, 79 (10.2%) had one or more of the events in the composite clinical outcome.
In contrast, after a median 5.48 years of follow-up, 31 of the 119 patients with progression (26.1%) had one or more of the composite events (P < .0001).
The median rates of progression to LSM-defined cirrhosis in the overall cohort were 2% at 1 year, 11% at 3 years, and 16% at 5 years.
Researchers found a correlation between progression to LSM-defined cirrhosis and baseline histological fibrosis stage on biopsy, with a rate of 7% among those with no baseline fibrosis, 9% each for patients with stage I A-C or stage II fibrosis, 24% of those with baseline bridging fibrosis, and 25% of those with baseline cirrhosis.
A comparison of the time to a composite clinical outcome event between patients with progression to LSM-defined cirrhosis and those without progression showed that LSM-defined progression was associated with near doubling in risk, with a hazard ratio of 1.84 (P = .0039).
In a multivariate Cox regression analysis controlling for age, sex, race, BMI, diabetes status, and baseline LSM, only LSM-defined progression (HR, 1.93; P < .01) and age (HR, 1.03; P < .01) were significant predictors.
Dr. Gawrieh noted that while age was a statistically significant factor, it was only weakly associated.
“These data suggest that development of cirrhosis LSM criteria is a promising surrogate for clinical outcomes in patients with NAFLD,” Dr. Gawrieh concluded.
Progression definition questioned
Following the presentation, Nezam Afdhal, MD, chief of the division of gastroenterology, hepatology, and nutrition at Beth Israel Deaconess Hospital in Boston, questioned how 25% of patients who had biopsy-proven cirrhosis could progress to LSM-defined cirrhosis.
Dr. Gawrieh said that, according to inclusion criteria, the patients could not have LSM-defined cirrhosis with the sensitivity cutoff of 12.1 kPa, and that of the 10 patients with baseline cirrhosis in the cohort, all had LSM of less than 12.1 kPa. However, he admitted that because those 10 patients were technically not progressors to cirrhosis, they should have been removed from the analysis for clinical outcomes.
Mark Hartman, MD, a clinical researcher at Eli Lilly and Company in Indianapolis, said the study is valuable but noted that those patients who progressed tended to have higher LSM at baseline as well as a higher [fibrosis-4 score].
Dr. Gawrieh added that the investigators are exploring variables that might explain progression to cirrhosis among patients without high baseline liver stiffness, such as alcohol use or drug-induced liver injury.
The study was supported by the National Institutes of Health and the NASH Clinical Research Network institutions. Dr. Gawrieh disclosed research grants from NIH, Zydus, Viking, and Sonic Incytes, and consulting for TransMedics and Pfizer. Dr. Afdhal and Dr. Hartman reported no relevant financial relationships.
A version of this article first appeared on Medscape.com.
FROM THE LIVER MEETING
How accurate is transcutaneous bilirubin testing in newborns with darker skin tones?
EVIDENCE SUMMARY
Some evidence suggests overestimation in all skin tones
In a prospective diagnostic cohort study of 1553 infants in Nigeria, the accuracy of TcB measurement with 2 transcutaneous bilirubinometers (Konica Minolta/Air Shields JM- 103 and Respironics BiliChek) was analyzed. 1 The study population was derived from neonates delivered in a single maternity hospital in Lagos who were ≥ 35 weeks gestational age or ≥ 2.2 kg.
Using a color scale generated for this population, researchers stratified neonates into 1 of 3 skin tone groups: light brown, medium brown, or dark brown. TcB and TSB paired samples were collected in the first 120 hours of life in all patients. JM-103 recordings comprised 71.9% of TcB readings.
Overall, TcB testing overestimated the TSB by ≥ 2 mg/dL in 64.5% of infants, ≥ 3 mg/dL in 42.7%, and > 4 mg/dL in 25.7%. TcB testing underestimated the TSB by ≥ 2 mg/dL in 1.1% of infants, ≥ 3 mg/dL in 0.5%, and > 4 mg/dL in 0.3%.1
Local variation in skin tone was not associated with changes in overestimation, although the researchers noted that a key limitation of the study was a lack of lighttoned infants for comparison.1
A prospective diagnostic cohort study of 1359 infants in Spain compared TcB measurements to TSB levels using the Dräger Jaundice Meter JM-105.2 Patients included all neonates (gestational age, 36.6 to 41.1 weeks) born at a single hospital in Barcelona.
Using a validated skin tone scale, researchers stratified neonates at 24 hours of life to 1 of 4 skin tones: light (n = 337), medium light (n = 750), medium dark (n = 249), and dark (n = 23). They then obtained TSB samples at 48 to 72 hours of life, along with other routine screening labs and midsternal TcB measurements.
TcB testing tended to overestimate TSB (when < 15 mg/dL) for all skin tones, although to a larger degree for neonates with dark skin tones (mean overestimation, 0.7 mg/dL for light; 1.08 mg/dL for medium light; 1.89 mg/dL for medium dark; and 1.86 mg/dL for dark; P < .001 for light vs medium dark or dark).2
Continue to: Stated limitations...
Stated limitations of the study included relatively low numbers of neonates with dark skin tone, no test of interobserver reliability in skin tone assignment, and enrollment of exclusively healthy neonates with low bilirubin levels.2
Other studies report overestimation in infants with darker skin tone
Two Canadian diagnostic cohort studies also found evidence that TcB testing overestimated TSB in infants with darker skin tones, although TcB test characteristics proved stable over a wide range of bilirubin levels.
The first study enrolled 451 neonates ≥ 35 weeks gestational age at a hospital in Ottawa and assessed TcB using the JM-103 meter.3 The neonates were stratified into light (n = 51), medium (n = 326), and dark (n = 74) skin tones using cosmetic reference color swatches. All had a TcB and TSB obtained within 30 minutes of each other.
TcB testing underestimated TSB in infants with light and medium skin tones and overestimated TSB in infants with darker skin tone (mean difference, –0.88 mg/dL for light; –1.1 mg/dL for medium; and 0.68 mg/dL for dark; P not given). The mean area under the curve (AUC) was ≥ 0.94 for all receiver–operator characteristic (ROC) curves across all skin tones and bilirubin thresholds (AUC range, 0-1, with > 0.8 indicating strong modeling).3
Limitations of the study included failure to check interrater reliability for skin tone assessment, low numbers of infants with elevated bilirubin (≥ 13.5 mg/dL), and very few infants in either the dark or light skin tone groups.3
Continue to: The second Canadian study...
The second Canadian study enrolled 774 infants born at ≥ 37 weeks gestational age in Calgary and assessed TcB with the JM-103.4 Infants were categorized as having light (n = 347), medium (n = 412), and dark (n = 15) skin tones by study nurses, based on reference cosmetic colors. All infants had paired TcB and TSB measurements within 60 minutes of each other and before 120 hours of life.
Multivariate linear regression analysis using medium skin tone as the reference group found a tendency toward low TcB levels in infants with light skin tone and a tendency toward high TcB levels in infants with dark skin tone (adjusted R2 = 0.86). The AUC was ≥ 0.95 for all ROC curves for lightand medium-toned infants at key TSB cutoff points; the study included too few infants with dark skin tone to generate ROC curves for that group.4
Recommendations from others
In 2009, the American Academy of Pediatrics (AAP) recommended universal predischarge screening for hyperbilirubinemia in newborns using either TcB testing or TSB. The AAP statement did not address the effect of skin tone on TcB levels, but did advise regular calibration of TcB and TSB results at the hospital level.5
In 2016, the National Institute for Health and Care Excellence (NICE) updated their guideline on jaundice in newborns younger than 28 days old. NICE recommended visual inspection of all babies for jaundice by examining them in bright natural light and looking for jaundice on blanched skin; it specifically advised checking sclera and gums in infants with darker skin tones.6
The Nigerian researchers noted earlier have published an updated TcB nomogram for their patient population.7
Editor’s takeaway
Even with the small variation of 2 mg/dL or less between transcutaneous and serum bilirubin, and the SOR of C due to lab values being labeled disease-oriented evidence, TcB proves to be useful. In practice, concerning TcB values should lead to serum bilirubin confirmation. This evidence indicates we might be ordering TSB measurements more or less often depending on skin tone, reinforcing the need for review and adjustment of TcB cut-off levels based on the local population.
1. Olusanya BO, Imosemi DO, Emokpae AA. Differences between transcutaneous and serum bilirubin measurements in Black African neonates. Pediatrics. 2016;138:e20160907. doi: 10.1542/ peds.2016-0907
2. Maya-Enero S, Candel-Pau J, Garcia-Garcia J, et al. Reliability of transcutaneous bilirubin determination based on skin color determined by a neonatal skin color scale of our own. Eur J Pediatr. 2021;180:607-616. doi: 10.1007/s00431-020-03885-0
3. Samiee-Zafarghandy S, Feberova J, Williams K, et al. Influence of skin colour on diagnostic accuracy of the jaundice meter JM 103 in newborns. Arch Dis Child Fetal Neonatal Ed. 2014;99: F480-F484. doi: 10.1136/archdischild-2013-305699
4. Wainer S, Rabi Y, Parmar SM, et al. Impact of skin tone on the performance of a transcutaneous jaundice meter. Acta Paediatr. 2009;98:1909-1915. doi: 10.1111/j.1651-2227.2009.01497.x
5. Maisels MJ, Bhutani VK, Bogen D, et al. Hyperbilirubinemia in the newborn infant > or = 35 weeks’ gestation: an update with clarifications. Pediatrics. 2009;124:1193-1198. doi: 10.1542/peds. 2009-0329
6. Amos RC, Jacob H, Leith W. Jaundice in newborn babies under 28 days: NICE guideline 2016 (CG98). Arch Dis Child Educ Pract Ed. 2017;102:207-209. doi: 10.1136/archdischild-2016-311556
7. Olusanya BO, Mabogunje CA, Imosemi DO, et al. Transcutaneous bilirubin nomograms in African neonates. PloS ONE. 2017; 12:e0172058. doi: 10.1371/journal.pone.0172058
EVIDENCE SUMMARY
Some evidence suggests overestimation in all skin tones
In a prospective diagnostic cohort study of 1553 infants in Nigeria, the accuracy of TcB measurement with 2 transcutaneous bilirubinometers (Konica Minolta/Air Shields JM- 103 and Respironics BiliChek) was analyzed. 1 The study population was derived from neonates delivered in a single maternity hospital in Lagos who were ≥ 35 weeks gestational age or ≥ 2.2 kg.
Using a color scale generated for this population, researchers stratified neonates into 1 of 3 skin tone groups: light brown, medium brown, or dark brown. TcB and TSB paired samples were collected in the first 120 hours of life in all patients. JM-103 recordings comprised 71.9% of TcB readings.
Overall, TcB testing overestimated the TSB by ≥ 2 mg/dL in 64.5% of infants, ≥ 3 mg/dL in 42.7%, and > 4 mg/dL in 25.7%. TcB testing underestimated the TSB by ≥ 2 mg/dL in 1.1% of infants, ≥ 3 mg/dL in 0.5%, and > 4 mg/dL in 0.3%.1
Local variation in skin tone was not associated with changes in overestimation, although the researchers noted that a key limitation of the study was a lack of lighttoned infants for comparison.1
A prospective diagnostic cohort study of 1359 infants in Spain compared TcB measurements to TSB levels using the Dräger Jaundice Meter JM-105.2 Patients included all neonates (gestational age, 36.6 to 41.1 weeks) born at a single hospital in Barcelona.
Using a validated skin tone scale, researchers stratified neonates at 24 hours of life to 1 of 4 skin tones: light (n = 337), medium light (n = 750), medium dark (n = 249), and dark (n = 23). They then obtained TSB samples at 48 to 72 hours of life, along with other routine screening labs and midsternal TcB measurements.
TcB testing tended to overestimate TSB (when < 15 mg/dL) for all skin tones, although to a larger degree for neonates with dark skin tones (mean overestimation, 0.7 mg/dL for light; 1.08 mg/dL for medium light; 1.89 mg/dL for medium dark; and 1.86 mg/dL for dark; P < .001 for light vs medium dark or dark).2
Continue to: Stated limitations...
Stated limitations of the study included relatively low numbers of neonates with dark skin tone, no test of interobserver reliability in skin tone assignment, and enrollment of exclusively healthy neonates with low bilirubin levels.2
Other studies report overestimation in infants with darker skin tone
Two Canadian diagnostic cohort studies also found evidence that TcB testing overestimated TSB in infants with darker skin tones, although TcB test characteristics proved stable over a wide range of bilirubin levels.
The first study enrolled 451 neonates ≥ 35 weeks gestational age at a hospital in Ottawa and assessed TcB using the JM-103 meter.3 The neonates were stratified into light (n = 51), medium (n = 326), and dark (n = 74) skin tones using cosmetic reference color swatches. All had a TcB and TSB obtained within 30 minutes of each other.
TcB testing underestimated TSB in infants with light and medium skin tones and overestimated TSB in infants with darker skin tone (mean difference, –0.88 mg/dL for light; –1.1 mg/dL for medium; and 0.68 mg/dL for dark; P not given). The mean area under the curve (AUC) was ≥ 0.94 for all receiver–operator characteristic (ROC) curves across all skin tones and bilirubin thresholds (AUC range, 0-1, with > 0.8 indicating strong modeling).3
Limitations of the study included failure to check interrater reliability for skin tone assessment, low numbers of infants with elevated bilirubin (≥ 13.5 mg/dL), and very few infants in either the dark or light skin tone groups.3
Continue to: The second Canadian study...
The second Canadian study enrolled 774 infants born at ≥ 37 weeks gestational age in Calgary and assessed TcB with the JM-103.4 Infants were categorized as having light (n = 347), medium (n = 412), and dark (n = 15) skin tones by study nurses, based on reference cosmetic colors. All infants had paired TcB and TSB measurements within 60 minutes of each other and before 120 hours of life.
Multivariate linear regression analysis using medium skin tone as the reference group found a tendency toward low TcB levels in infants with light skin tone and a tendency toward high TcB levels in infants with dark skin tone (adjusted R2 = 0.86). The AUC was ≥ 0.95 for all ROC curves for lightand medium-toned infants at key TSB cutoff points; the study included too few infants with dark skin tone to generate ROC curves for that group.4
Recommendations from others
In 2009, the American Academy of Pediatrics (AAP) recommended universal predischarge screening for hyperbilirubinemia in newborns using either TcB testing or TSB. The AAP statement did not address the effect of skin tone on TcB levels, but did advise regular calibration of TcB and TSB results at the hospital level.5
In 2016, the National Institute for Health and Care Excellence (NICE) updated their guideline on jaundice in newborns younger than 28 days old. NICE recommended visual inspection of all babies for jaundice by examining them in bright natural light and looking for jaundice on blanched skin; it specifically advised checking sclera and gums in infants with darker skin tones.6
The Nigerian researchers noted earlier have published an updated TcB nomogram for their patient population.7
Editor’s takeaway
Even with the small variation of 2 mg/dL or less between transcutaneous and serum bilirubin, and the SOR of C due to lab values being labeled disease-oriented evidence, TcB proves to be useful. In practice, concerning TcB values should lead to serum bilirubin confirmation. This evidence indicates we might be ordering TSB measurements more or less often depending on skin tone, reinforcing the need for review and adjustment of TcB cut-off levels based on the local population.
1. Olusanya BO, Imosemi DO, Emokpae AA. Differences between transcutaneous and serum bilirubin measurements in Black African neonates. Pediatrics. 2016;138:e20160907. doi: 10.1542/ peds.2016-0907
2. Maya-Enero S, Candel-Pau J, Garcia-Garcia J, et al. Reliability of transcutaneous bilirubin determination based on skin color determined by a neonatal skin color scale of our own. Eur J Pediatr. 2021;180:607-616. doi: 10.1007/s00431-020-03885-0
3. Samiee-Zafarghandy S, Feberova J, Williams K, et al. Influence of skin colour on diagnostic accuracy of the jaundice meter JM 103 in newborns. Arch Dis Child Fetal Neonatal Ed. 2014;99: F480-F484. doi: 10.1136/archdischild-2013-305699
4. Wainer S, Rabi Y, Parmar SM, et al. Impact of skin tone on the performance of a transcutaneous jaundice meter. Acta Paediatr. 2009;98:1909-1915. doi: 10.1111/j.1651-2227.2009.01497.x
5. Maisels MJ, Bhutani VK, Bogen D, et al. Hyperbilirubinemia in the newborn infant > or = 35 weeks’ gestation: an update with clarifications. Pediatrics. 2009;124:1193-1198. doi: 10.1542/peds. 2009-0329
6. Amos RC, Jacob H, Leith W. Jaundice in newborn babies under 28 days: NICE guideline 2016 (CG98). Arch Dis Child Educ Pract Ed. 2017;102:207-209. doi: 10.1136/archdischild-2016-311556
7. Olusanya BO, Mabogunje CA, Imosemi DO, et al. Transcutaneous bilirubin nomograms in African neonates. PloS ONE. 2017; 12:e0172058. doi: 10.1371/journal.pone.0172058
EVIDENCE-BASED ANSWER:
Fairly accurate. Photometric transcutaneous bilirubin (TcB) testing may overestimate total serum bilirubin (TSB) in neonates with darker skin tones by a mean of 0.68 to > 2 mg/dL (strength of recommendation [SOR]: C, diagnostic cohort studies with differing reference standards).
Overall, TcB meters retain acceptable accuracy in infants of all skin tones across a range of bilirubin levels, despite being more likely to underestimate lighter skin tones and overestimate darker ones (SOR: C, diagnostic cohort studies with differing reference standards). It is unclear if the higher readings prompt an increase in blood draws or otherwise alter care.

Midodrine may be comparable to albumin for PICD prevention in ACLF
WASHINGTON – , according to the results of a randomized controlled trial.
Albumin protected 80% of patients from PICD 6 days after paracentesis, whereas midodrine protected 84%, a difference that was not statistically significant. However, albumin was associated with a slightly higher incidence of adverse events and higher costs, said Mithun Sharma, MD, during his presentation at the annual meeting of the American Association for the Study of Liver Diseases.
Midodrine may be a safer and cost-effective option for these patients, said Dr. Sharma, of the department of hepatology and liver transplantation, AIG Hospitals, Hyderabad, India.
But he cautioned that given the small size of the open-label study, with only 25 patients in each arm, the results should be considered as proof of concept and need to be validated in larger studies.
PICD common in ACLF
PICD is caused by fluid shift during paracentesis, leading to a decrease in effective circulating blood volume.
The incidence of PICD after large-volume paracentesis in patients receiving albumin ranges from 12% to 20%, Dr. Sharma noted.
Albumin has been shown in several trials to be effective at reducing the incidence of PICD in patients undergoing paracentesis, but this agent requires IV infusion and is comparatively costly, he said.
In contrast, midodrine, a selective alpha-adrenergic agonist usually prescribed for orthostatic hypotension, may help to prevent PICD through its mechanism of action, maintaining mean arterial pressure (MAP).
In two small studies comparing albumin infusion in patients undergoing paracentesis with 8 liters of fluid removal, midodrine was either inferior to albumin or had no beneficial effect, Dr. Sharma said.
Patients with ACLF, however, have paracentesis with much lower fluid volumes, typically with less than 5 liters removed, and may be good candidates for midodrine.
Study details
Dr. Sharma and colleagues tested their hypothesis that in patients with ACLF undergoing modest-volume paracentesis, with fluid removal below 5 liters, midodrine could prevent PICD by increasing MAP, with an efficacy similar to that of intravenous 20% human albumin infusions.
They enrolled 50 patients with ACLF defined by Asian Pacific Association for the Study of the Liver criteria who were undergoing paracentesis with 3- to 4-liter fluid volumes.
They defined PICD as at least a 50% increase in plasma renin activity (PRA) over baseline on the 6th day following paracentesis.
The patients were randomly assigned to receive either intravenous 20% human albumin infusions toward the end of paracentesis or midodrine-hydrochloride 7.5 mg three times daily starting 2 hours before paracentesis. Because of the difference in drug delivery methods, the study could not be blinded to treatment type.
Patients’ mean arterial pressures were recorded daily, renal parameters and serum electrolytes were monitored on days 3 and 6, and blood samples were tested for PRA on day 1 and day 6.
The most common acute and chronic hepatic insults and baseline characteristics of the patients were similar between the groups, with alcohol-related liver disease the most common underlying etiology of cirrhosis.
The incidence of PICD at day 6, the primary endpoint, did not differ significantly between the groups, although mean PRA levels on day 6 were numerically higher in the midodrine group. There was a significant rise in the absolute PRA volume from baseline (P = .006), but this rise did not meet the PICD definition.
Researchers found no significant differences between the two groups in absolute change in PRA, and no significant changes in either group in MAP, creatinine, or sodium levels.
Complications and costs
PICD developed in four patients assigned to the albumin group and five patients assigned to the midodrine group; however, this difference was not significant. Fluid overload occurred in only one patient, in the albumin group.
No cases of hypertension or urinary retention arose in either group.
Grade I/II hepatic encephalopathy occurred 2-3 days after paracentesis in three patients on albumin and in two patients on midodrine.
Acute kidney injury was seen in three patients on albumin and in one patient on midodrine.
At 28 days after paracentesis, three patients in the albumin group had died, all from sepsis and multiorgan failure, while four patients in the midodrine group had died, three from sepsis and multiorgan failure and one from an upper gastrointestinal bleed.
Two patients in the albumin group and one patient in the midodrine group underwent liver transplant 1 month after paracentesis.
A cost-effectiveness analysis showed that the mean cost of albumin infusions was about sixfold higher than that of oral midodrine.
More data needed
Session moderator Shiv K. Sarin, MD, from the Institute of Liver and Biliary Sciences in New Delhi, India, who was not involved in the study, commented that while midodrine is a good drug and generally safe, he would wait to use it in patients who needed modest-volume paracentesis until more data are published.
Dr. Sarin also emphasized that albumin is “mandatory” for protecting patients who require large-volume paracentesis, and that it would be “unethical” not to use it in that clinical situation.
The study was internally supported. Dr. Sharma and Dr. Sarin have disclosed no relevant financial relationships.
A version of this article first appeared on Medscape.com.
FROM THE LIVER MEETING
Bepirovirsen: Is a ‘functional cure’ for HBV on the horizon?
Treatment with bepirovirsen led to sustained clearance of hepatitis B surface antigen (HBsAg) and hepatitis B virus (HBV) DNA for 24 weeks after the end of treatment for adults with chronic HBV in the phase 2b B-Clear study.
The study results were presented at the annual meeting of the American Association for the Study of Liver Diseases and were simultaneously published in The New England Journal of Medicine.
Currently, nucleoside/nucleotide analogue (NA) therapy is the recommended first-line therapy for patients with chronic HBV because it can inhibit viral replication.
However, fewer than 5% of patients have HBsAg loss after 12 months of NA therapy, which underscores the need for therapies that can achieve a “functional” cure, largely defined as sustained, undetectable levels of HBV DNA and HBsAg in the blood, with or without generation of protective antibodies against HBsAg, the researchers noted.
Bepirovirsen is a potential first-in-class antisense oligonucleotide that targets all HBV messenger RNA and acts to decrease levels of viral proteins.
The phase 2b B-Clear study enrolled 457 patients with chronic HBV; 227 were receiving NA therapy, and 230 were not.
Participants were randomly assigned to receive weekly subcutaneous injections of bepirovirsen 300 mg for 24 weeks; bepirovirsen 300 mg for 12 weeks, then 150 mg for 12 weeks; bepirovirsen 300 mg for 12 weeks, then placebo for 12 weeks; or placebo for 12 weeks, then bepirovirsen 300 mg for 12 weeks (groups 1, 2, 3, and 4, respectively).
The composite primary outcome was HBsAg level below the limit of detection and HBV DNA level below the limit of quantification maintained for 24 weeks after the end of bepirovirsen treatment, without newly initiated antiviral medication.
Bepirovirsen 300 mg weekly for 24 weeks (group 1) led to HBsAg and HBV DNA loss in 9% of patients receiving NA therapy and 10% of patients not receiving NA treatment, which was sustained for 24 weeks after the last dose.
For groups 2, 3, and 4, HBsAg and HBV DNA loss occurred in 9%, 3%, and 0%, respectively, of patients receiving NA therapy and 6%, 1%, and 0%, respectively, of patients not receiving NA treatment.
Patients with low baseline HBsAg levels (< 1,000 IU/mL) responded best to treatment with bepirovirsen. Among patients who received bepirovirsen 300 mg weekly for 24 weeks, the primary outcome was achieved by 16% of patients taking NA therapy and by 25% of patients not taking NA therapy.
Although a “relatively low percentage” of patients overall achieved the primary outcome, the study “indicates the possibility of enhanced efficacy with the selection of patients according to baseline characteristics (low HBsAg level at baseline), with combination therapies, or both,” the researchers wrote.
Adverse events with bepirovirsen included injection-site reactions, pyrexia, fatigue, and increased alanine aminotransferase (ALT) levels. Increases in ALT levels, which were more common in those not receiving NA therapy than in those receiving NA therapy (41% vs. 17%), led to two serious adverse events.
On the basis of phase 2b data, GlaxoSmithKline (GSK) plans to advance bepirovirsen into phase 3 development, according to a news release.
Further pursuit of bepirovirsen therapy is “certainly warranted, with the use of a dose of 300 mg per week for at least 24 weeks; indeed, the duration of therapy might be dictated best by HBsAg levels at baseline,” Jay H. Hoofnagle, MD, director of the liver disease research branch at the National Institute of Diabetes and Digestive and Kidney Diseases, wrote in an editorial in the New England Journal of Medicine.
Several critical questions remain, including whether HBsAg negativity will persist beyond 24 weeks, wrote Dr. Hoofnagle, who was not involved in the study.
It’s a question GSK is addressing in the B-Sure trial, which will follow participants for an additional 33 months, the study noted.
Other questions include when NA therapy can be safely stopped, what other factors predict response, and whether RNA therapy–induced loss of HBsAg materially improves long-term outcomes, Dr. Hoofnagle wrote.
“Bepirovirsen is just one RNA-based HBV therapy now being pursued. Several other antisense RNAs as well as the more malleable small interfering RNA molecules (‘-sirans’) are currently in early-phase clinical trials. A new era in the control of hepatitis B may be at hand with these most modern of therapies for this most ancient disease,” Dr. Hoofnagle noted.
The B-Clear study was supported by GSK. Several authors have disclosed relationships with the company. A complete list of author disclosures is available with the original article. Dr. Hoofnagle has disclosed no relevant financial relationships.
A version of this article first appeared on Medscape.com.
FROM THE LIVER MEETING
Steroids and G-CSF improve 90-day survival in severe alcoholic hepatitis
, researchers from India reported.
Among patients with SAH, the combination of G-CSF and prednisolone was associated with a 90-day survival rate of 88.1%, compared with 78.6% for patients assigned to G-CSF alone, and 64.3% for patients assigned to prednisolone alone (P = .03).
The G-CSF/prednisolone combination was also associated with significantly better steroid responsiveness, as determined by the Lille Model for Alcoholic Hepatitis, reported Shiv K. Sarin, MD, from the Institute of Liver and Biliary Sciences, New Delhi.
The drug combo in steroid-eligible patients also “reduces morbidity related to infections, rehospitalizations, and hepatic encephalopathy [and] reduces infection rates,” Dr. Sarin said at the annual meeting of the American Association for the Study of Liver Diseases. He did caution that the treatment requires close monitoring.
Prednisolone-only drawbacks
For patients with SAH, 30-day mortality ranges from 20%-50%. While some patients respond to treatment with corticosteroids, the response is often modest and limited in duration, Dr. Sarin said.
The STOPAH trial found that 15% of patients with SAH treated with prednisolone developed serious infections, compared with 8% of patients on placebo (P = .002), he noted.
Dr. Sarin also pointed to a recent worldwide study attempting to identify the optimal therapeutic window for steroid use in patients with alcoholic hepatitis. The investigators found that corticosteroids reduced 30-day mortality by 41% but only among patients with SAH, especially those with Model for End-Stage Liver Disease (MELD) scores between 25 and 39.
In previous studies, G-CSF has been shown to improve survival in patients with acute-on-chronic liver failure, including patients with SAH; in patients with SAH alone; and in steroid nonresponders, Dr. Sarin said.
Regenerative properties
In an interview with this news organization, Dr. Sarin said that although the use of G-CSF for patients with severe SAH is still under investigation at his center, “we are using G-CSF routinely for decompensated cirrhosis, where it is like an in vivo extension of regenerative stem cells. G-CSF recruits from bone marrow a lot of hematopoietic stem cells and mesenchymal stem cells.”
Dr. Sarin and colleagues hypothesized that G-CSF, with its immunomodulatory and regenerative properties, would be effective either alone or in combination with steroids in steroid-eligible patients with SAH.
To test this idea, they enrolled 126 patients ages 18-65 with SAH, defined as a Maddrey’s Discriminant Function (mDF) score greater than 32. They excluded patients with active infections, acute gastrointestinal bleeding, hepatorenal syndrome, an mDF score greater than 90, autoimmune hepatitis, hepatitis B or C, HIV, pregnancy, hemophagocytic lymphohistiocytosis, and those with hemoglobin below 8 and baseline white blood cell count over 25,000.
The patients were randomly assigned, 42 in each group, to receive one of the following:
- Prednisolone monotherapy 40 mg/day for 7 days, with the drug stopped at 7 days for patients with Lille scores above 0.45 or continued for up to 21 days for those with Lille scores below 0.45;
- Prednisolone plus G-CSF 300 mcg/day for 7 days, with those who achieve a Lille score above 0.45 stopping the steroid but continuing G-CSF, while those with Lille scores below 0.45 continuing on prednisolone for 21 days, plus G-CSF once every 3 days for 5 additional doses; or
- G-CSF monotherapy at a dose of 150-300 mcg/day for 7 days, then every 3 days for 28 days up to a total of 12 doses.
Improved response
In addition to its superior results on the primary endpoint of 90-day survival, combination therapy was associated with significantly better response to therapy. The mean Lille score at day 7 was 0.14 for the combination, compared with 0.21 for prednisolone alone and 0.28 for G-CSF alone (P = .002).
There were also significantly fewer nonresponders in the combination arm than either of the monotherapy groups (P = .03).
At 90 days, the rate of new infections was significantly higher among patients treated with prednisolone alone, at 35.7%, compared with 19% in the combination arm and 7.1% in the G-CSF alone group (P = .02). There were also significantly fewer skin and mucosal bleeding episodes with the combination (19% vs, 25% and 35.7% with prednisolone and G-CSF monotherapies, respectively, P = .03), as well as lower rates of hepatic encephalopathy (9.5% vs. 47.5% and 25%, respectively, P < .01).
No differences in alcohol relapse rates were found among the three groups.
Patient selection important
“I know a lot of the G-CSF studies that have been conducted in the U.S. and Europe have all been negative,” said David Goldberg, MD, from the University of Miami, during the session. “Do you think there’s something unique in your patients, the microbiome or maybe genetics, that leads to such different results?” he asked Dr. Sarin.
European studies included patients with infections, acute kidney injury (AKI), or other comorbidities that were exclusion criteria in his study, Dr. Sarin noted.
“If you already have an infection, you already have an AKI, then it’s not a good patient for treatment, so I think the choice of patient is important,” he said.
The study was internally supported. Dr. Sarin and Dr. Goldberg report no relevant financial relationships.
A version of this article first appeared on Medscape.com.
FROM THE LIVER MEETING
Liver disease-related deaths rise during pandemic
according to new findings presented at the annual meeting of the American Association for the Study of Liver Diseases.

Between 2019 and 2021, ALD-related deaths increased by 17.6% and NAFLD-related deaths increased by 14.5%, Yee Hui Yeo, MD, a resident physician and hepatology-focused investigator at Cedars-Sinai Medical Center in Los Angeles, said at a preconference press briefing.
“Even before the pandemic, the mortality rates for these two diseases have been increasing, with NAFLD having an even steeper increasing trend,” he said. “During the pandemic, these two diseases had a significant surge.”
Recent U.S. liver disease death rates
Dr. Yeo and colleagues analyzed data from the Center for Disease Control and Prevention’s National Vital Statistic System to estimate the age-standardized mortality rates (ASMR) of liver disease between 2010 and 2021, including ALD, NAFLD, hepatitis B, and hepatitis C. Using prediction modeling analyses based on trends from 2010 to 2019, they predicted mortality rates for 2020-2021 and compared them with the observed rates to quantify the differences related to the pandemic.
Between 2010 and 2021, there were about 626,000 chronic liver disease–related deaths, including about 343,000 ALD-related deaths, 204,000 hepatitis C–related deaths, 58,000 NAFLD-related deaths, and 21,000 hepatitis B–related deaths.
For ALD-related deaths, the annual percentage change was 3.5% for 2010-2019 and 17.6% for 2019-2021. The observed ASMR in 2020 was significantly higher than predicted, at 15.7 deaths per 100,000 people versus 13.0 predicted from the 2010-2019 rate. The trend continued in 2021, with 17.4 deaths per 100,000 people versus 13.4 in the previous decade.
The highest numbers of ALD-related deaths during the COVID-19 pandemic occurred in Alaska, Montana, Wyoming, Colorado, New Mexico, and South Dakota.
For NAFLD-related deaths, the annual percentage change was 7.6% for 2010-2014, 11.8% for 2014-2019, and 14.5% for 2019-2021. The observed ASMR was also higher than predicted, at 3.1 deaths per 100,000 people versus 2.6 in 2020, as well as 3.4 versus 2.8 in 2021.
The highest numbers of NAFLD-related deaths during the COVID-19 pandemic occurred in Oklahoma, Indiana, Kentucky, Tennessee, and West Virginia.
Hepatitis B and C gains lost in pandemic
In contrast, the annual percentage change in was –1.9% for hepatitis B and –2.8% for hepatitis C. After new treatment for hepatitis C emerged in 2013-2014, mortality rates were –7.8% for 2014-2019, Dr. Yeo noted.
“However, during the pandemic, we saw that this decrease has become a nonsignificant change,” he said. “That means our progress of the past 5 or 6 years has already stopped during the pandemic.”
By race and ethnicity, the increase in ALD-related mortality was most pronounced in non-Hispanic White, non-Hispanic Black, and Alaska Native/American Indian populations, Dr. Yeo said. Alaska Natives and American Indians had the highest annual percentage change, at 18%, followed by non-Hispanic Whites at 11.7% and non-Hispanic Blacks at 10.8%. There were no significant differences in race and ethnicity for NAFLD-related deaths, although all groups had major increases in recent years.
Biggest rise in young adults
By age, the increase in ALD-related mortality was particularly severe for ages 25-44, with an annual percentage change of 34.6% in 2019-2021, as compared with 13.7% for ages 45-64 and 12.6% for ages 65 and older.
For NAFLD-related deaths, another major increase was observed among ages 25-44, with an annual percentage change of 28.1% for 2019-2021, as compared with 12% for ages 65 and older and 7.4% for ages 45-64.
By sex, the ASMR increase in NAFLD-related mortality was steady throughout 2010-2021 for both men and women. In contrast, ALD-related death increased sharply between 2019 and 2021, with an annual percentage change of 19.1% for women and 16.7% for men.
“The increasing trend in mortality rates for ALD and NAFLD has been quite alarming, with disparities in age, race, and ethnicity,” Dr. Yeo said.
The study received no funding support. Some authors disclosed research funding, advisory board roles, and consulting fees with various pharmaceutical companies.
according to new findings presented at the annual meeting of the American Association for the Study of Liver Diseases.
Between 2019 and 2021, ALD-related deaths increased by 17.6% and NAFLD-related deaths increased by 14.5%, Yee Hui Yeo, MD, a resident physician and hepatology-focused investigator at Cedars-Sinai Medical Center in Los Angeles, said at a preconference press briefing.
“Even before the pandemic, the mortality rates for these two diseases have been increasing, with NAFLD having an even steeper increasing trend,” he said. “During the pandemic, these two diseases had a significant surge.”
Recent U.S. liver disease death rates
Dr. Yeo and colleagues analyzed data from the Center for Disease Control and Prevention’s National Vital Statistic System to estimate the age-standardized mortality rates (ASMR) of liver disease between 2010 and 2021, including ALD, NAFLD, hepatitis B, and hepatitis C. Using prediction modeling analyses based on trends from 2010 to 2019, they predicted mortality rates for 2020-2021 and compared them with the observed rates to quantify the differences related to the pandemic.
Between 2010 and 2021, there were about 626,000 chronic liver disease–related deaths, including about 343,000 ALD-related deaths, 204,000 hepatitis C–related deaths, 58,000 NAFLD-related deaths, and 21,000 hepatitis B–related deaths.
For ALD-related deaths, the annual percentage change was 3.5% for 2010-2019 and 17.6% for 2019-2021. The observed ASMR in 2020 was significantly higher than predicted, at 15.7 deaths per 100,000 people versus 13.0 predicted from the 2010-2019 rate. The trend continued in 2021, with 17.4 deaths per 100,000 people versus 13.4 in the previous decade.
The highest numbers of ALD-related deaths during the COVID-19 pandemic occurred in Alaska, Montana, Wyoming, Colorado, New Mexico, and South Dakota.
For NAFLD-related deaths, the annual percentage change was 7.6% for 2010-2014, 11.8% for 2014-2019, and 14.5% for 2019-2021. The observed ASMR was also higher than predicted, at 3.1 deaths per 100,000 people versus 2.6 in 2020, as well as 3.4 versus 2.8 in 2021.
The highest numbers of NAFLD-related deaths during the COVID-19 pandemic occurred in Oklahoma, Indiana, Kentucky, Tennessee, and West Virginia.
Hepatitis B and C gains lost in pandemic
In contrast, the annual percentage change in was –1.9% for hepatitis B and –2.8% for hepatitis C. After new treatment for hepatitis C emerged in 2013-2014, mortality rates were –7.8% for 2014-2019, Dr. Yeo noted.
“However, during the pandemic, we saw that this decrease has become a nonsignificant change,” he said. “That means our progress of the past 5 or 6 years has already stopped during the pandemic.”
By race and ethnicity, the increase in ALD-related mortality was most pronounced in non-Hispanic White, non-Hispanic Black, and Alaska Native/American Indian populations, Dr. Yeo said. Alaska Natives and American Indians had the highest annual percentage change, at 18%, followed by non-Hispanic Whites at 11.7% and non-Hispanic Blacks at 10.8%. There were no significant differences in race and ethnicity for NAFLD-related deaths, although all groups had major increases in recent years.
Biggest rise in young adults
By age, the increase in ALD-related mortality was particularly severe for ages 25-44, with an annual percentage change of 34.6% in 2019-2021, as compared with 13.7% for ages 45-64 and 12.6% for ages 65 and older.
For NAFLD-related deaths, another major increase was observed among ages 25-44, with an annual percentage change of 28.1% for 2019-2021, as compared with 12% for ages 65 and older and 7.4% for ages 45-64.
By sex, the ASMR increase in NAFLD-related mortality was steady throughout 2010-2021 for both men and women. In contrast, ALD-related death increased sharply between 2019 and 2021, with an annual percentage change of 19.1% for women and 16.7% for men.
“The increasing trend in mortality rates for ALD and NAFLD has been quite alarming, with disparities in age, race, and ethnicity,” Dr. Yeo said.
The study received no funding support. Some authors disclosed research funding, advisory board roles, and consulting fees with various pharmaceutical companies.
FROM THE LIVER MEETING
World falls short on HBV, HCV elimination targets
Vaccination campaigns in more than 80 nations have successfully reduced the prevalence of hepatitis B virus (HBV) surface antigen. That’s the good news.
Less good is the news that reported Sarah Blach, MHS, associate director of the Center for Disease Analysis Foundation, based in Lafayette, Colo.
“As countries progress toward eliminating hepatitis B and C, we really need to do more to expand political will and financing of national elimination programs. It’s great to see that it’s happening in some of these countries, but we really need that to expand,” she said at the annual meeting of the American Association for the Study of Liver Diseases.
Ms. Blach presented data from the foundation’s Polaris Observatory, an initiative that provides epidemiological data, modeling tools, training, and decision analytics to support eliminating HBV and HCV globally by 2030.
The investigators used mathematical disease burden models for HBV and HCV to assess worldwide trends toward viral elimination. They also evaluated HBV and HCV elimination policies as reported by authorities in various countries.
They forecast the year in which each country or territory would meet each of the World Health Organization’s four elimination targets from 110 HCV models and 166 HBV models. The targets are 90% diagnosed, 80% of the eligible population treated, 65% reduction in mortality, and 80% incidence reduction for HCV and either 95% incidence reduction or prevalence of 0.1% or less in children aged 5 years and younger for HBV.
Investigators summarized the results across countries by disease area and time period of elimination; that is, elimination before 2030, between 2031 and 2050, or after 2050.
Results for HCV and HBV targets
The 11 nations on track to achieve all absolute or relative (programmatic) targets for HCV by 2030 are Australia, Canada, Denmark, Egypt, Finland, France, Georgia, Japan, Norway, Spain, and the United Kingdom.
An additional 24 countries are on track to meet their goals for HCV between 2031 and 2050.
But the rest, including the United States, much of sub-Saharan Africa, China, and South Asia, are not on track to meet their goals for HCV by 2050.
No countries are on track to achieve the absolute or relative (programmatic) targets for elimination of HBV, Ms. Blach said.
However, 83 countries or territories, including the United States, are on track for achieving the HBV surface antigen prevalence target of less than 0.1% in children aged 5 years and younger by 2030.
Ms. Blach and colleagues also looked at results of quantitative policy surveys submitted by 61 countries. The respondents were asked to report on linkage to care, awareness and screening, monitoring and evaluation, ability to expand capacity, harm-reduction programs, financing of national programs, and political will to achieve targets.
The investigators scored countries on a scale of 1-10, with 10 being the highest score, in each category. For HCV, 25 countries (42%) had high scores, defined as 9 or 10, for political will, and 33 countries (54%) had high scores for national funding. For HBV, 17 countries (30%) received the high scores for political will, and 30 (51%) received the high scores for financing the national program.
The big picture
Most countries have not expanded HBV or HCV treatment beyond specialists, and HBV policies appear to lag behind policies directed toward HCV elimination, Ms. Blach noted.
“We do need to expand screening and treatment for hepatitis B moving forward,” she said.
The United States and the rest of the world need to do better, especially regarding HBV elimination, but the United States does appear to be making progress, said Richard Sterling, MD, MSc, from Virginia Commonwealth University, Richmond, who comoderated the session where Ms. Blach reported the data.
“My impression is that we’re doing a pretty good job with [HBV] vaccinations in the United States,” Dr. Sterling, who was not involved in the study, said in an interview.
One way to make progress, he said, may be to expand eligibility for HBV vaccines beyond the current upper age limit of 59 years.
Implementing simpler dosing regimens – the currently available vaccine is split into three doses – could improve vaccine compliance and lower costs, Dr. Sterling added.
During the session, Brian Conway, MD, medical director of the Vancouver Infectious Disease Centre, said it seems hard to use a composite set of data to determine a yes/no answer about whether a country is on track to reach targets.
“When you take my country of Canada, we have absolutely no national program, no hope of a national program, very little funding, and yet we make the cut. So how do you balance all these different variables to arrive at a yes/no answer and is there a way of putting a bit more subtlety into it?” Dr. Conway asked Ms. Blach.
Ms. Blach replied that the data are fluid, and countries can move closer or farther from reaching targets over time as conditions change.
Some countries seem to be improving efforts and “just need a bit more” work, Ms. Blach said.
“But we also saw some countries who we thought were going to be a shoo-in, and as time progressed the number of treatments just dropped in shocking ways. The reality is that a lot of countries are struggling to treat patients,” she said.
Canada “has a really great health system. It’s not a fragmented health system, and so even if you don’t have some of that push for elimination from the government level, having access to treatment, having access to those services, means that at least patients can come in and get what they need,” Ms. Blach said.
The study data are available for free on the Center for Disease Analysis Foundation’s Polaris website.
The study was funded by grants from the John C. Martin Foundation, ZeShan Foundation, EndHep2030, Gilead Sciences, and AbbVie. Ms. Blach is employed by the Center for Disease Analysis Foundation, which receives research grants from Gilead and AbbVie. Dr. Sterling and Dr. Conway reported no relevant disclosures.
A version of this article first appeared on Medscape.com.
FROM THE LIVER MEETING