User login
Thrombocytopenia and neutropenia: A structured approach to evaluation
Thrombocytopenia and neutropenia are commonly encountered laboratory abnormalities. The presence of either requires that you promptly evaluate for life-threatening causes and identify the appropriate etiology. This article identifies key questions to ask. It also includes algorithms and tables that will facilitate your evaluation of patients with isolated thrombocytopenia or isolated neutropenia and speed the way toward appropriate treatment.
Thrombocytopenia: A look at the numbers
Thrombocytopenia is defined as a platelet count <150,000/mcL.1 The blood abnormality is either suspected based on the patient’s signs or symptoms, such as ecchymoses, petechiae, purpura, epistaxis, gingival bleeding, or melena, or it is incidentally discovered during review of a complete blood count (CBC).
The development of clinical symptoms is closely related to the severity of the thrombocytopenia, with platelet counts <30,000/mcL more likely to result in clinical symptoms with minor trauma and counts <5,000/mcL potentially resulting in spontaneous bleeding. While most patients will have asymptomatic, incidentally-found thrombocytopenia, and likely a benign etiology, those with the signs/symptoms just described, evidence of infection, or thrombosis are more likely to have a serious etiology and require an expedited work-up. Although pregnancy may be associated with thrombocytopenia, this review confines itself to the causes of thrombocytopenia in non-pregnant adults.
Rule out pseudothrombocytopenia
When isolated thrombocytopenia is discovered incidentally in an asymptomatic person, the first step is to perform a repeat CBC with a peripheral smear to confirm the presence of thrombocytopenia, rule out laboratory error, and assess for platelet clumping. If thrombocytopenia is confirmed and platelet clumping is present, it may be due to the calcium chelator in the ethylenediaminetetraacetic anticoagulant contained within the laboratory transport tube; this cause of pseudothrombocytopenia occurs in up to 0.29% of the population.1 Obtaining a platelet count from a citrated or heparinized tube avoids this phenomenon.
Is the patient’s thrombocytopenia drug induced?
Once true thrombocytopenia is confirmed, the next step is to review the patient’s prescribed medications, as well as any illicit drugs used, for potential causes of drug-induced thrombocytopenia. DITP can be either immune-mediated or nonimmune-mediated.
Immune-mediated DITP typically occurs within 1 to 2 weeks of medication exposure and begins to improve within 1 to 2 days of stopping the offending drug.2 (See TABLE 13 for a list of medications that can induce thrombocytopenia.) It should be noted that most patients who take the medications listed in TABLE 1 do not experience thrombocytopenia; nonetheless, it is a potential risk associated with their use.

Heparin-induced thrombocytopenia (HIT) is a unique form of immune-mediated DITP in that it is caused by antibody complexes, resulting in platelet activation, clumping, and thrombotic events.4 HIT occurs <1% of patients in intensive care units, but can occur in any patient on long-term heparin therapy. It manifests as a >50% drop in platelet count within 5 to 14 days of the introduction of heparin; however, in those previously exposed to heparin, it can occur within 24 hours.4,5
Continue to: Non-immune-mediated DITP
Non-immune-mediated DITP, resulting from myelosuppression, chemotherapeutic agents, or valproic acid, is less common.1,2
Acute and chronic alcohol use. Although alcohol is not a drug per se, it can also result in thrombocytopenia. The mechanism is the direct suppression of bone marrow, although alcohol also causes B12 and folate deficiency, further contributing to the development of the blood abnormality.1
Is there thrombosis?
In addition to exploring a connection between thrombocytopenia and the drugs a patient is taking, it’s also important to look for evidence of thrombosis. The causes of thrombocytopenia that paradoxically result in thrombosis are: disseminated intravascular coagulation, hemolytic uremic syndrome, thrombotic thrombocytopenic purpura, catastrophic antiphospholipid antibody syndrome, and the previously mentioned HIT. TABLE 24,6-9 outlines the clinical settings, laboratory findings, and treatments of thrombocytopenia associated with thrombosis.

Is an infectious cause to blame?
If the patient is ill, consider infectious causes of thrombocytopenia. Thrombocytopenia associated with infection may result from an immune-mediated response to an illness itself, to treatment of an illness, to splenic sequestration, or to bone marrow suppression. TABLE 31,9-11 lists common infections that may cause thrombocytopenia.

Of note, infection with Helicobacter pylori can cause asymptomatic thrombocytopenia via an immune-mediated mechanism.12 Eradication of H pylori results in a variable elevation in platelets, on average 30,000/mcL in 50% of patients with the infection.13
Is there pancytopenia?
A review of the peripheral smear, with attention to abnormalities in other cell lines, may assist in arriving at a diagnosis. If the peripheral smear reveals pancytopenia, then, in addition to many of the etiologies described earlier, one should also consider vitamin B12 or folate deficiency, copper deficiency, drug- and viral-induced aplastic anemia, paroxysmal nocturnal hemoglobinuria, leukemias, myelodysplastic disorders, and systemic lupus erythematosis.14 Pancytopenia is also seen with hypersplenism, which is often associated with cirrhosis.15 If the etiology isn’t readily apparent, a bone marrow biopsy may be required.

Continue to: Is immune thrombocytopenia to blame?
Is immune thrombocytopenia to blame?
Immune thrombocytopenia (ITP) is an autoimmune disorder resulting in the destruction of normal platelets and may be primary or secondary to processes described previously (HIT, H pylori infection, etc). Consider ITP if, after a thorough work-up, a cause of isolated thrombocytopenia is not identified.16 Treatment for ITP is outlined in TABLE 4.16 FIGURE 1 is an algorithm for the complete evaluation of thrombocytopenia in adults.

Treatment: Platelet transfusions
In general, patients who are not actively bleeding are considered stable and do not require platelet transfusions to minimize their risk of bleeding or prevent bleeding during a planned procedure unless their platelet count falls below the levels specified in TABLE 5.17 For patients who are actively bleeding, a more aggressive approach may be required. Locally-derived transfusion protocols typically guide transfusions for the actively hemorrhaging patient. The American Association of Blood Banks has put forth evidence-based guidelines for platelet transfusions when a patient is given a diagnosis of thrombocytopenia (see TABLE 5).17 Single-donor platelets have a shelf life of 3 to 5 days, and one unit will raise platelets 30,000 to 50,000/mcL.

Neutropenia: Prevalence varies by ethnicity
An absolute neutrophil count (ANC) of <1500 cells/mcL traditionally defines neutropenia, with an ANC of 1000 to 1500 cells/mcL constituting mild neutropenia; 500 to 999 cells/mcL, moderate; and <500 cells/mcL, severe.18 Similar to the evaluation of thrombocytopenia, it is important to repeat the CBC prior to initiating a work-up in order to confirm that the neutropenia is not a laboratory error. Additionally, patients with signs or symptoms of infection should be worked up expeditiously.
The prevalence of neutropenia varies by ethnicity. According to the National Health and Nutrition Examination Survey 1999 to 2004, the prevalence was 4.5%, 0.79%, and 0.38% in black, white, and Mexican-American participants, respectively.19 FIGURE 2 outlines the outpatient work-up of adult patients with neutropenia not related to chemotherapy.

Continue to: Is the patient severely ill?
Is the patient severely ill?
The prognosis of the patient is related both to the etiology of the neutropenia, as well as to the nadir of the neutrophil count. Patients who have an ANC <500 cells/mcL or who have inadequate bone marrow reserves are at highest risk for an overwhelming infection.20,21 The absence of oral ulcers and gingivitis and/or the presence of purulent material at the site of an infection are signs of adequate bone marrow reserves.
Additionally, neutropenia may be the source—or the result—of a serious life-threatening illness. This distinction may not be readily apparent at the time of the patient’s presentation. If signs or symptoms of a severe illness are apparent (fever, hypotension, tachycardia, ANC <500 cells/mcL), admit the patient to the hospital for evaluation and initiation of antibiotics.
Is the neutropenia chronic?
A review of previous CBCs will identify whether this condition is new or chronic. A persistent, mild neutropenia (ANC 1000-1500 cells/mcL) in a healthy individual is consistent with benign familial or ethnic neutropenia (see TABLE 6).20 If prior CBCs are unavailable, then a diagnosis of chronic neutropenia may be established by verifying the persistence of mild neutropenia over time.

Cyclic neutropenia is a periodic neutropenia (occurring every 2-5 weeks) associated with mild illnesses that are related to the nadir of the neutrophil count. The diagnosis is established by obtaining serial CBCs twice weekly for 4 to 6 weeks, which reflect cycling of the neutrophil count.20,22
Are any medications contributing to the neutropenia?
Medications that suppress bone marrow or that interfere with other immune-mediated processes are the most common cause of acquired neutropenia.23 Drug-induced agranulocytosis is defined as an ANC <500 cells/mcL due to exposure to a drug that results in immunologic or cytotoxic destruction of neutrophils.24
A systematic review of case reports of drug-induced agranulocytosis (a decrease in peripheral neutrophil count to <500 cells/mcL) revealed that although at least 125 drugs were probably related to agranulocytosis, only 11 drugs were responsible for 50% of cases (carbimazole, clozapine, dapsone, dipyrone, methimazole, penicillin G, procainamide, propylthiouracil, rituximab, sulfasalazine, and ticlopidine), and fatality rates were higher (10% vs 3%) among those patients with a nadir <100 cells/mcL.25 TABLE 725 lists medications that can be associated with agranulocytosis. Depending on prior exposure to a drug, neutropenia/agranulocytosis can occur within hours to months of exposure to the causal drug and can take a few days to 3 weeks to resolve after cessation.25,26

Continue to: Has the patient had any recent illnesses?
Has the patient had any recent illnesses?
The usual response to an infection is an increase in neutrophil count. However, certain bacterial, rickettsial, parasitic, and viral infections can result in neutropenia (see TABLE 823,27-29). Viral infections may cause transient neutropenia because of either bone marrow suppression or increased peripheral destruction, while neutropenia related to an overwhelming bacterial infection results from the depletion of bone marrow reserves.23,27

Do you suspect a nutritional deficiency?
Patients with a nutritional deficiency of B12, folate, or copper are likely to exhibit a deficiency in more than just neutrophils.23,27 In developed countries, people with neutropenia may have a history of malnutrition due to a disease (eg, anorexia nervosa) or surgery (eg, gastric bypass) that causes severe calorie restriction.20
Does your patient have symptoms of a connective tissue disease?
Neutropenia, in association with arthralgias, joint swelling, splenomegaly, or rash may be a manifestation of an underlying collagen vascular disorder, such as rheumatoid arthritis (RA) or systemic lupus erythematosus (SLE).20 If the clinical scenario supports one of these diagnoses, undertake or refer the patient for a rheumatologic evaluation. This may include studies of anti-cyclic citrullinated peptide antibodies, rheumatoid factor to evaluate for RA, and/or antinuclear antibodies to evaluate for SLE.30,31 While most neutropenias associated with autoimmune disease are mild, neutropenia associated with Felty syndrome (RA, splenomegaly, and neutropenia) may be severe (ANC <100 cells/mcL).20,23
Is the etiology unclear?
Patients with moderate to severe neutropenia without an apparent etiology, in the setting of aplastic anemia, or in the presence of splenomegaly and/or lymphadenopathy, should undergo a hematologic evaluation and/or bone marrow biopsy, given that hematologic malignancy is a potential cause.20,27
The treatment of neutropenia hinges on correctly identifying the etiology of the diminished neutrophil count. If the cause is a medication, infection, underlying rheumatologic condition, or nutritional deficiency, then either treating the entity or withdrawing the offending medication should result in resolution of the neutropenia. If the cause is determined to be familial or ethnic, then patient reassurance is all that is required.
CORRESPONDENCE
Richard W. Temple, MD, FAAFP, CDR MC USN, Camp Lejeune Family Medicine Residency, Naval Medical Center Camp Lejeune, 100 Brewster Blvd, Camp Lejeune, NC 28547-2538; [email protected].
1. Wong EY, Rose MG. Why does my patient have thrombocytopenia? Hematol Oncol Clin North Am. 2012;26:231-252.
2. Aster RH, Bougie DW. Drug-induced immune thrombocytopenia. N Engl J Med. 2007;357:580-587.
3. University of Oklahoma Health Sciences Center. Database for Drug–induced thrombocytopenia from group patient reports: an update. Available at: http://www.ouhsc.edu/platelets/InternetPostingGroupFrames2014.htm. Accessed May 7, 2018.
4. Sniecinski RM, Hursting MJ, Paidas MJ, et al. Etiology and assessment of hypercoagulability with lessons from heparin-induced thrombocytopenia. Anesth Analg. 2011;112:46-58.
5. Warkentin TE. Heparin-induced thrombocytopenia in critically ill patients. Crit Care Clin. 2011;27:805-823.
6. Connell NT, Sweeney JD. Does my patient have life- or limb-threatening thrombocytopenia? Hematol Oncol Clin North Am. 2012;26:369-382.
7. George JN, Nester CM. Syndromes of thrombotic microangiopathy. N Engl J Med. 2014;371:654-666.
8. Hanly JG. Antiphospholipid syndrome: an overview. CMAJ. 2003;168:1675-1682.
9. Sekhon SS, Roy V. Thrombocytopenia in adults: a practical approach to evaluation and management. South Med J. 2006;99:491-498.
10. Gauer RL, Braun MM. Thrombocytopenia. Am Fam Physician. 2012;85:612-622.
11. Bratton RL, Corey R. Tick-borne disease. Am Fam Physician. 2005;71:2323-2330.
12. Yeh JJ, Tsai S, Wu DC, et al. P-selectin-dependent platelet aggregation and apoptosis may explain the decrease in platelet count during Helicobacter pylori infection. Blood. 2010;115:4247-4253.
13. Stasi R, Sarpatwari A, Segal JB, et al. Effects of eradication of Helicobacter pylori infection in patients with immune thrombocytopenic purpura: a systemic review. Blood. 2009;113:1231-1240.
14. Weinzierl EP, Arber DA. The differential diagnosis and bone marrow evaluation of new-onset pancytopenia. Am J Clin Pathol. 2013;139:9-29.
15. Peck-Radosavljevic M. Hypersplenism. Eur J Gastroenterol Hepatol. 2001;13:317-323.
16. Neunert C, Lim W, Crowther M, et al. The American Society of Hematology 2011 evidence-based practice guideline for immune thrombocytopenia. Blood. 2011;117:4190-4207.
17. Kaufman RM, Djulbegovic B, Gernsheimer T, et al. Platelet transfusion: a clinical practice guideline from the AABB. Ann Int Med. 2015;162:205-213.
18. Palmblad J, Dufour C, Papadaki HA. How we diagnose neutropenia in the adult and elderly patient. Haematologica. 2014;99:1130-1133.
19. Hsieh MM, Everhart JE, Byrd-Holt DD, et al. Prevalence of neutropenia in the U.S. population: age, sex, smoking status, and ethnic differences. Ann Intern Med. 2007;146:486-492.
20. Gibson C, Berliner N. How we evaluate and treat neutropenia in adults. Blood. 2014;124:1251-1258.
21. Urabe A. Clinical features of the neutropenic host: definitions and initial evaluation. CID. 2004;39(suppl 1):S53-S55.
22. Dale DC, Hammond WP 4th. Cyclic neutropenia: a clinical review. Blood Rev. 1988;2:178-185.
23. Munshi HG, Montgomery RB. Severe neutropenia: a diagnostic approach. West J Med. 2000;172:248-252.
24. Pisciotta AV. Drug-induced agranulocytosis peripheral destruction of polymorphonuclear leukocytes and their marrow precursors. Blood Rev. 1990;4:226-237.
25. Andersohn F, Konzen C, Garbe E. Systematic review: agranulocytosis induced by nonchemotherapy drugs. Ann Intern Med. 2007;146:657-665.
26. Bhatt V, Saleem A. Review: drug-induced neutropenia – pathophysiology, clinical features, and management. Ann Clin Lab Sci. 2004;34:131-137.
27. Newburger PE, Dale DC. Evaluation and management of patients with isolated neutropenia. Semin Hematol. 2013;50:198-206.
28. Bakken JS, Krueth J, Wilson-Nordskog C, et al. Clinical and laboratory characteristics of human granulcytic ehrlichiosis. JAMA. 1996;275:199-205.
29. Hall GW, Schwartz RP. White blood cell count and differential in Rocky Mountain spotted fever. NC Med J. 1979;40:212-214.
30. Nishimura K, Sugiyama D, Kogata Y, et al. Meta-analysis: diagnostic accuracy of anti-cyclic citrullinated peptide antibody and rheumatoid factor for rheumatoid arthritis. Ann Intern Med. 2007;146:797-808.
31. Petri M, Orbai AM, Alarcón GS, et al. Derivation and validation of the Systemic Lupus International Collaborating Clinics classification criteria for systemic lupus erythematosus. Arthritis Rheum. 2012; 64:2677-2686.
Thrombocytopenia and neutropenia are commonly encountered laboratory abnormalities. The presence of either requires that you promptly evaluate for life-threatening causes and identify the appropriate etiology. This article identifies key questions to ask. It also includes algorithms and tables that will facilitate your evaluation of patients with isolated thrombocytopenia or isolated neutropenia and speed the way toward appropriate treatment.
Thrombocytopenia: A look at the numbers
Thrombocytopenia is defined as a platelet count <150,000/mcL.1 The blood abnormality is either suspected based on the patient’s signs or symptoms, such as ecchymoses, petechiae, purpura, epistaxis, gingival bleeding, or melena, or it is incidentally discovered during review of a complete blood count (CBC).
The development of clinical symptoms is closely related to the severity of the thrombocytopenia, with platelet counts <30,000/mcL more likely to result in clinical symptoms with minor trauma and counts <5,000/mcL potentially resulting in spontaneous bleeding. While most patients will have asymptomatic, incidentally-found thrombocytopenia, and likely a benign etiology, those with the signs/symptoms just described, evidence of infection, or thrombosis are more likely to have a serious etiology and require an expedited work-up. Although pregnancy may be associated with thrombocytopenia, this review confines itself to the causes of thrombocytopenia in non-pregnant adults.
Rule out pseudothrombocytopenia
When isolated thrombocytopenia is discovered incidentally in an asymptomatic person, the first step is to perform a repeat CBC with a peripheral smear to confirm the presence of thrombocytopenia, rule out laboratory error, and assess for platelet clumping. If thrombocytopenia is confirmed and platelet clumping is present, it may be due to the calcium chelator in the ethylenediaminetetraacetic anticoagulant contained within the laboratory transport tube; this cause of pseudothrombocytopenia occurs in up to 0.29% of the population.1 Obtaining a platelet count from a citrated or heparinized tube avoids this phenomenon.
Is the patient’s thrombocytopenia drug induced?
Once true thrombocytopenia is confirmed, the next step is to review the patient’s prescribed medications, as well as any illicit drugs used, for potential causes of drug-induced thrombocytopenia. DITP can be either immune-mediated or nonimmune-mediated.
Immune-mediated DITP typically occurs within 1 to 2 weeks of medication exposure and begins to improve within 1 to 2 days of stopping the offending drug.2 (See TABLE 13 for a list of medications that can induce thrombocytopenia.) It should be noted that most patients who take the medications listed in TABLE 1 do not experience thrombocytopenia; nonetheless, it is a potential risk associated with their use.
Heparin-induced thrombocytopenia (HIT) is a unique form of immune-mediated DITP in that it is caused by antibody complexes, resulting in platelet activation, clumping, and thrombotic events.4 HIT occurs <1% of patients in intensive care units, but can occur in any patient on long-term heparin therapy. It manifests as a >50% drop in platelet count within 5 to 14 days of the introduction of heparin; however, in those previously exposed to heparin, it can occur within 24 hours.4,5
Continue to: Non-immune-mediated DITP
Non-immune-mediated DITP, resulting from myelosuppression, chemotherapeutic agents, or valproic acid, is less common.1,2
Acute and chronic alcohol use. Although alcohol is not a drug per se, it can also result in thrombocytopenia. The mechanism is the direct suppression of bone marrow, although alcohol also causes B12 and folate deficiency, further contributing to the development of the blood abnormality.1
Is there thrombosis?
In addition to exploring a connection between thrombocytopenia and the drugs a patient is taking, it’s also important to look for evidence of thrombosis. The causes of thrombocytopenia that paradoxically result in thrombosis are: disseminated intravascular coagulation, hemolytic uremic syndrome, thrombotic thrombocytopenic purpura, catastrophic antiphospholipid antibody syndrome, and the previously mentioned HIT. TABLE 24,6-9 outlines the clinical settings, laboratory findings, and treatments of thrombocytopenia associated with thrombosis.
Is an infectious cause to blame?
If the patient is ill, consider infectious causes of thrombocytopenia. Thrombocytopenia associated with infection may result from an immune-mediated response to an illness itself, to treatment of an illness, to splenic sequestration, or to bone marrow suppression. TABLE 31,9-11 lists common infections that may cause thrombocytopenia.
Of note, infection with Helicobacter pylori can cause asymptomatic thrombocytopenia via an immune-mediated mechanism.12 Eradication of H pylori results in a variable elevation in platelets, on average 30,000/mcL in 50% of patients with the infection.13
Is there pancytopenia?
A review of the peripheral smear, with attention to abnormalities in other cell lines, may assist in arriving at a diagnosis. If the peripheral smear reveals pancytopenia, then, in addition to many of the etiologies described earlier, one should also consider vitamin B12 or folate deficiency, copper deficiency, drug- and viral-induced aplastic anemia, paroxysmal nocturnal hemoglobinuria, leukemias, myelodysplastic disorders, and systemic lupus erythematosis.14 Pancytopenia is also seen with hypersplenism, which is often associated with cirrhosis.15 If the etiology isn’t readily apparent, a bone marrow biopsy may be required.
Continue to: Is immune thrombocytopenia to blame?
Is immune thrombocytopenia to blame?
Immune thrombocytopenia (ITP) is an autoimmune disorder resulting in the destruction of normal platelets and may be primary or secondary to processes described previously (HIT, H pylori infection, etc). Consider ITP if, after a thorough work-up, a cause of isolated thrombocytopenia is not identified.16 Treatment for ITP is outlined in TABLE 4.16 FIGURE 1 is an algorithm for the complete evaluation of thrombocytopenia in adults.
Treatment: Platelet transfusions
In general, patients who are not actively bleeding are considered stable and do not require platelet transfusions to minimize their risk of bleeding or prevent bleeding during a planned procedure unless their platelet count falls below the levels specified in TABLE 5.17 For patients who are actively bleeding, a more aggressive approach may be required. Locally-derived transfusion protocols typically guide transfusions for the actively hemorrhaging patient. The American Association of Blood Banks has put forth evidence-based guidelines for platelet transfusions when a patient is given a diagnosis of thrombocytopenia (see TABLE 5).17 Single-donor platelets have a shelf life of 3 to 5 days, and one unit will raise platelets 30,000 to 50,000/mcL.
Neutropenia: Prevalence varies by ethnicity
An absolute neutrophil count (ANC) of <1500 cells/mcL traditionally defines neutropenia, with an ANC of 1000 to 1500 cells/mcL constituting mild neutropenia; 500 to 999 cells/mcL, moderate; and <500 cells/mcL, severe.18 Similar to the evaluation of thrombocytopenia, it is important to repeat the CBC prior to initiating a work-up in order to confirm that the neutropenia is not a laboratory error. Additionally, patients with signs or symptoms of infection should be worked up expeditiously.
The prevalence of neutropenia varies by ethnicity. According to the National Health and Nutrition Examination Survey 1999 to 2004, the prevalence was 4.5%, 0.79%, and 0.38% in black, white, and Mexican-American participants, respectively.19 FIGURE 2 outlines the outpatient work-up of adult patients with neutropenia not related to chemotherapy.
Continue to: Is the patient severely ill?
Is the patient severely ill?
The prognosis of the patient is related both to the etiology of the neutropenia, as well as to the nadir of the neutrophil count. Patients who have an ANC <500 cells/mcL or who have inadequate bone marrow reserves are at highest risk for an overwhelming infection.20,21 The absence of oral ulcers and gingivitis and/or the presence of purulent material at the site of an infection are signs of adequate bone marrow reserves.
Additionally, neutropenia may be the source—or the result—of a serious life-threatening illness. This distinction may not be readily apparent at the time of the patient’s presentation. If signs or symptoms of a severe illness are apparent (fever, hypotension, tachycardia, ANC <500 cells/mcL), admit the patient to the hospital for evaluation and initiation of antibiotics.
Is the neutropenia chronic?
A review of previous CBCs will identify whether this condition is new or chronic. A persistent, mild neutropenia (ANC 1000-1500 cells/mcL) in a healthy individual is consistent with benign familial or ethnic neutropenia (see TABLE 6).20 If prior CBCs are unavailable, then a diagnosis of chronic neutropenia may be established by verifying the persistence of mild neutropenia over time.
Cyclic neutropenia is a periodic neutropenia (occurring every 2-5 weeks) associated with mild illnesses that are related to the nadir of the neutrophil count. The diagnosis is established by obtaining serial CBCs twice weekly for 4 to 6 weeks, which reflect cycling of the neutrophil count.20,22
Are any medications contributing to the neutropenia?
Medications that suppress bone marrow or that interfere with other immune-mediated processes are the most common cause of acquired neutropenia.23 Drug-induced agranulocytosis is defined as an ANC <500 cells/mcL due to exposure to a drug that results in immunologic or cytotoxic destruction of neutrophils.24
A systematic review of case reports of drug-induced agranulocytosis (a decrease in peripheral neutrophil count to <500 cells/mcL) revealed that although at least 125 drugs were probably related to agranulocytosis, only 11 drugs were responsible for 50% of cases (carbimazole, clozapine, dapsone, dipyrone, methimazole, penicillin G, procainamide, propylthiouracil, rituximab, sulfasalazine, and ticlopidine), and fatality rates were higher (10% vs 3%) among those patients with a nadir <100 cells/mcL.25 TABLE 725 lists medications that can be associated with agranulocytosis. Depending on prior exposure to a drug, neutropenia/agranulocytosis can occur within hours to months of exposure to the causal drug and can take a few days to 3 weeks to resolve after cessation.25,26
Continue to: Has the patient had any recent illnesses?
Has the patient had any recent illnesses?
The usual response to an infection is an increase in neutrophil count. However, certain bacterial, rickettsial, parasitic, and viral infections can result in neutropenia (see TABLE 823,27-29). Viral infections may cause transient neutropenia because of either bone marrow suppression or increased peripheral destruction, while neutropenia related to an overwhelming bacterial infection results from the depletion of bone marrow reserves.23,27
Do you suspect a nutritional deficiency?
Patients with a nutritional deficiency of B12, folate, or copper are likely to exhibit a deficiency in more than just neutrophils.23,27 In developed countries, people with neutropenia may have a history of malnutrition due to a disease (eg, anorexia nervosa) or surgery (eg, gastric bypass) that causes severe calorie restriction.20
Does your patient have symptoms of a connective tissue disease?
Neutropenia, in association with arthralgias, joint swelling, splenomegaly, or rash may be a manifestation of an underlying collagen vascular disorder, such as rheumatoid arthritis (RA) or systemic lupus erythematosus (SLE).20 If the clinical scenario supports one of these diagnoses, undertake or refer the patient for a rheumatologic evaluation. This may include studies of anti-cyclic citrullinated peptide antibodies, rheumatoid factor to evaluate for RA, and/or antinuclear antibodies to evaluate for SLE.30,31 While most neutropenias associated with autoimmune disease are mild, neutropenia associated with Felty syndrome (RA, splenomegaly, and neutropenia) may be severe (ANC <100 cells/mcL).20,23
Is the etiology unclear?
Patients with moderate to severe neutropenia without an apparent etiology, in the setting of aplastic anemia, or in the presence of splenomegaly and/or lymphadenopathy, should undergo a hematologic evaluation and/or bone marrow biopsy, given that hematologic malignancy is a potential cause.20,27
The treatment of neutropenia hinges on correctly identifying the etiology of the diminished neutrophil count. If the cause is a medication, infection, underlying rheumatologic condition, or nutritional deficiency, then either treating the entity or withdrawing the offending medication should result in resolution of the neutropenia. If the cause is determined to be familial or ethnic, then patient reassurance is all that is required.
CORRESPONDENCE
Richard W. Temple, MD, FAAFP, CDR MC USN, Camp Lejeune Family Medicine Residency, Naval Medical Center Camp Lejeune, 100 Brewster Blvd, Camp Lejeune, NC 28547-2538; [email protected].
1. Wong EY, Rose MG. Why does my patient have thrombocytopenia? Hematol Oncol Clin North Am. 2012;26:231-252.
2. Aster RH, Bougie DW. Drug-induced immune thrombocytopenia. N Engl J Med. 2007;357:580-587.
3. University of Oklahoma Health Sciences Center. Database for Drug–induced thrombocytopenia from group patient reports: an update. Available at: http://www.ouhsc.edu/platelets/InternetPostingGroupFrames2014.htm. Accessed May 7, 2018.
4. Sniecinski RM, Hursting MJ, Paidas MJ, et al. Etiology and assessment of hypercoagulability with lessons from heparin-induced thrombocytopenia. Anesth Analg. 2011;112:46-58.
5. Warkentin TE. Heparin-induced thrombocytopenia in critically ill patients. Crit Care Clin. 2011;27:805-823.
6. Connell NT, Sweeney JD. Does my patient have life- or limb-threatening thrombocytopenia? Hematol Oncol Clin North Am. 2012;26:369-382.
7. George JN, Nester CM. Syndromes of thrombotic microangiopathy. N Engl J Med. 2014;371:654-666.
8. Hanly JG. Antiphospholipid syndrome: an overview. CMAJ. 2003;168:1675-1682.
9. Sekhon SS, Roy V. Thrombocytopenia in adults: a practical approach to evaluation and management. South Med J. 2006;99:491-498.
10. Gauer RL, Braun MM. Thrombocytopenia. Am Fam Physician. 2012;85:612-622.
11. Bratton RL, Corey R. Tick-borne disease. Am Fam Physician. 2005;71:2323-2330.
12. Yeh JJ, Tsai S, Wu DC, et al. P-selectin-dependent platelet aggregation and apoptosis may explain the decrease in platelet count during Helicobacter pylori infection. Blood. 2010;115:4247-4253.
13. Stasi R, Sarpatwari A, Segal JB, et al. Effects of eradication of Helicobacter pylori infection in patients with immune thrombocytopenic purpura: a systemic review. Blood. 2009;113:1231-1240.
14. Weinzierl EP, Arber DA. The differential diagnosis and bone marrow evaluation of new-onset pancytopenia. Am J Clin Pathol. 2013;139:9-29.
15. Peck-Radosavljevic M. Hypersplenism. Eur J Gastroenterol Hepatol. 2001;13:317-323.
16. Neunert C, Lim W, Crowther M, et al. The American Society of Hematology 2011 evidence-based practice guideline for immune thrombocytopenia. Blood. 2011;117:4190-4207.
17. Kaufman RM, Djulbegovic B, Gernsheimer T, et al. Platelet transfusion: a clinical practice guideline from the AABB. Ann Int Med. 2015;162:205-213.
18. Palmblad J, Dufour C, Papadaki HA. How we diagnose neutropenia in the adult and elderly patient. Haematologica. 2014;99:1130-1133.
19. Hsieh MM, Everhart JE, Byrd-Holt DD, et al. Prevalence of neutropenia in the U.S. population: age, sex, smoking status, and ethnic differences. Ann Intern Med. 2007;146:486-492.
20. Gibson C, Berliner N. How we evaluate and treat neutropenia in adults. Blood. 2014;124:1251-1258.
21. Urabe A. Clinical features of the neutropenic host: definitions and initial evaluation. CID. 2004;39(suppl 1):S53-S55.
22. Dale DC, Hammond WP 4th. Cyclic neutropenia: a clinical review. Blood Rev. 1988;2:178-185.
23. Munshi HG, Montgomery RB. Severe neutropenia: a diagnostic approach. West J Med. 2000;172:248-252.
24. Pisciotta AV. Drug-induced agranulocytosis peripheral destruction of polymorphonuclear leukocytes and their marrow precursors. Blood Rev. 1990;4:226-237.
25. Andersohn F, Konzen C, Garbe E. Systematic review: agranulocytosis induced by nonchemotherapy drugs. Ann Intern Med. 2007;146:657-665.
26. Bhatt V, Saleem A. Review: drug-induced neutropenia – pathophysiology, clinical features, and management. Ann Clin Lab Sci. 2004;34:131-137.
27. Newburger PE, Dale DC. Evaluation and management of patients with isolated neutropenia. Semin Hematol. 2013;50:198-206.
28. Bakken JS, Krueth J, Wilson-Nordskog C, et al. Clinical and laboratory characteristics of human granulcytic ehrlichiosis. JAMA. 1996;275:199-205.
29. Hall GW, Schwartz RP. White blood cell count and differential in Rocky Mountain spotted fever. NC Med J. 1979;40:212-214.
30. Nishimura K, Sugiyama D, Kogata Y, et al. Meta-analysis: diagnostic accuracy of anti-cyclic citrullinated peptide antibody and rheumatoid factor for rheumatoid arthritis. Ann Intern Med. 2007;146:797-808.
31. Petri M, Orbai AM, Alarcón GS, et al. Derivation and validation of the Systemic Lupus International Collaborating Clinics classification criteria for systemic lupus erythematosus. Arthritis Rheum. 2012; 64:2677-2686.
From The Journal of Family Practice | 2018;67(7):E1-E8.
PRACTICE RECOMMENDATIONS
› Employ a systematic approach to the diagnosis and treatment of thrombocytopenia and neutropenia. C
› Do not transfuse platelets in patients with platelet counts >10,000/mcL who are stable and are not undergoing an invasive procedure. C
› Monitor patients on heparin therapy for >4 days for heparin-induced thrombocytopenia. C
› Monitor (for life) patients with a history of gastric bypass for the development of nutritional neutropenias. C
Strength of recommendation (SOR)
A Good-quality patient-oriented evidence
B Inconsistent or limited-quality patient-oriented evidence
C Consensus, usual practice, opinion, disease-oriented evidence, case series

Unravelling the CAR T-cell therapy reimbursement riddle
Physicians may finally have some clarity on payment for inpatient administration of 2 chimeric antigen receptor (CAR) T-cell therapies if a proposed rule from the Centers of Medicare & Medicaid Services becomes final.
The agency is seeking to assign ICD-10-PCS codes XW033C3 and XW043C3 to the use of axicabtagene ciloleucel (Yescarta; Kite Pharma, acquired by Gilead in October 2017) and tisagenlecleucel (Kymriah; Novartis) in the inpatient setting for fiscal year 2019. It is also considering the creation of a new Medicare Severity-Diagnosis Related Group (MS-DRG) code for procedures involving the use of CAR T-cell therapy drugs.
Stephanie Farnia, director of health policy and strategic relations for the American Society for Blood and Marrow Transplantation, said the proposal demonstrates that CMS is listening to physicians’ concerns about CAR T payments and working to provide a more reasonable framework. “The primary point of significance is that CAR-T care episodes should be assigned to a specific MS-DRG in FY2019, which will give physicians a clearer sense of inpatient reimbursement in advance,” she said in an interview.
Uncertainty about inpatient payment for administration of the 2 approved CAR T therapies (see p. e126) have been a lingering concern of specialists who use, or are interested in using, the therapies. In April 2018, CMS announced payment rates for outpatient administration of the 2 drugs, settling on $395,380 for axicabtagene ciloleucel and $500,839 for tisagenlecleucel. The two medications have list prices of $373,000 and $475,000, respectively.
However, physicians noted at the time that even if the drugs were first administered in the outpatient setting, inpatient care is likely to occur with CAR T-cell therapies because some patients will need to be admitted for monitoring for serious side effects. In such cases, all payments would then become part of the inpatient stay as per CMS’s 3-day payment window rule.
In the most recent payment proposal, CMS stated that its clinical advisers believe that patients receiving treatment with CAR T-cell therapy would have similar clinical characteristics and comorbidities as patients treated with autologous bone marrow transplant therapy, who are currently assigned to MS-DRG 016 Autologous Bone Marrow Transplant with CC/MCC. Therefore, CMS officials said they would suggest ICD-10-PCS procedure codes XW033C3 and XW043C3 to pre-MDC MS-DRG 016. In addition, the agency is proposing to revise the title of MS-DRG 016 to Autologous Bone Marrow Transplant with CC/MCC or T-cell Immunotherapy.
The agency emphasized that it invites public comment on alternative payment approaches for CAR T-cell therapies in the context of the pending, new technology add-on payment applications by the CAR-T drugmakers Novartis and Kite Pharma/Gilead. If approved, the technology add-on payments would provide an additional and separate payment equivalent to up to 50% of the product cost plus the MS-DRG payment received for the episode of care.
Shifts and realignments in the face of new developments
The CMS announcement is the latest development in the rapidly growing landscape of CAR T-cell therapies. In 2017, the Food and Drug Administration approved tisagenlecleucel for pediatric acute lymphoblastic leukemia and axicabtagene ciloleucel for relapsed/refractory large B-cell lymphoma in adults, and in May 2018, the agency expanded the indication for tisagenlecleucel to include adults with relapsed/refractory large B-cell lymphoma.
Further advancements are expected for CAR T-cell therapies in 2018, said Cai Xuan, PhD, senior analyst in oncology and hematology for GlobalData, a data analytics and commercial intelligence firm.
For starters, pharmaceutical companies are now working toward next-generation CAR T-cell therapies that can be mass produced, Dr Xuan noted. At a recent American Association for Cancer Research meeting, for example, the biopharmaceutical company Cellectis presented early clinical data in pediatric B-cell acute lymphoblastic leukemia for its off-the-shelf CAR T-cell candidate UCART19. In addition, CRISPR Therapeutics presented preclinical data for one of its off-the-shelf CAR T-cell candidates for multiple myeloma, and the company announced it would apply for approval to start human trials by the end of 2018.
“The trend for 2018 is focused on how to eliminate some of the profitability issues with first-generation CAR Ts because companies realize that manufacturing individualized treatments for each patient is not an ideal business model,” Dr Xuan said in an interview.
More market competition is also in the forecast, particularly from smaller companies, Dr Xuan said. “We are likely to see larger companies acquiring smaller ones once their CAR T technology has matured to a certain point. We have seen it with the Gilead-Kite acquisition and Celgene’s acquisition of Juno Therapeutics. This trend will continue as long as smaller companies are able to develop proprietary next-generation CAR T technologies.”
Cost, accessibility, and real-world side effects
The key concerns about the therapies are cost and accessibility, especially for the Medicare population. Cost estimates have put the cost of CAR T-cell therapies as high as $1.5 million per patient and that could make them inaccessible for many.
“There remain unanswered questions about value and cost in older adults,” said Walid F Gellad, MD, codirector for the Center for Pharmaceutical Policy and Prescribing at the University of Pittsburgh. “There are many life-saving treatments in the medical system that cost much less than this therapy. Presumably, its cost will go down as the indications expand and the experience with creating the CAR T cells improves. At least, one would hope.”
The creation of off-the-shelf, third-party products would help improve accessibility for CAR T-cell therapies and lower cost, said Helen Heslop, MD, director of the Center for Cell and Gene Therapy at Baylor College of Medicine, Houston. “In the longer term, there’re obviously a lot of people looking at how [the treatments] can be made more accessible. These are the first-generation CAR T [products], and I think there’ll be lots of refinements both to make them more effective and safer and also to use a third-party product to bring the cost of goods down.”
Other lingering unknowns about CAR T-cell therapies include how many patients in real-world clinical practice will have serious side effects, compared with those in trials, and the long-term recurrence rates after therapy use, Dr Gellad noted. He recently proposed in an article that government payers reimburse only the cost of manufacturing and some predetermined mark-up for such therapies until confirmatory trials demonstrate clinical benefit (N Engl J Med. 2017;376[21]:2001-4).
The current CAR T-cell therapies are only the beginning, said Dr Richard T Maziarz, MD, a bone marrow transplantation and blood cancer specialist at the Oregon Health and Science University Knight Cancer Institute in Portland. “Genetically engineered cell products are going to explode over the course of the next decade. This is not the end of the line, this is the starting point.”
Disclosures. Dr Maziarz has received consulting fees from Novartis, Juno Therapeutics, and Kite Pharma. Dr Heslop has received consulting fees from Novartis, has conducted research for Cell Medica and holds intellectual property rights/patents from Cell Medica, and has ownership interest in ViraCyte and Marker Therapeutics. Dr Gellad reports grants from Express Scripts.
CAR T-cell approvals: multiple myeloma likely next up
The next major approval in the chimeric antigen receptor (CAR) T-cell therapy arena will target multiple myeloma, according to Carl June, MD, the Richard W Vague Professor in Immunotherapy and a pioneer in CAR T-cell research at the University of Pennsylvania, Philadelphia. That approval is anticipated sometime in 2019, and will “completely transform oncology,” Dr June said in a recent interview. “Myeloma is the most common blood cancer in adults, and there’s never been a curative therapy, but now there is a subset of patients who look like they’re cured with CAR T cells.”
Researcher-turned-patient
The first treated patient in a trial of a novel anti–B-cell maturation antigen (BCMA)–specific CAR T-cell therapy (CART-BCMA)1 developed by University of Pennsylvania researchers in collaboration with Novartis is part of that subset. Earlier this year, Woodring Wright, MD, a professor of cell biology and medicine at the University of Texas (UT) Southwestern Medical Center in Dallas, outed himself as that first patient when he announced that CART-BCMA saved his life.2
Dr Wright had been diagnosed with multiple myeloma about 12 years ago and had failed 11 previous chemotherapies before he was enrolled in the CART-BCMA trial. He remains cancer free more than 2 years after receiving CART-BCMA and he’s now conducting CAR T-cell–related research in his UT Southwestern laboratory to broaden the effectiveness of current CAR T-cell therapies. In particular, he is looking at whether the small percentage of patients in whom CAR T-cell therapy does not work might benefit from telomerase to lengthen telomeres, because most patients who fail CAR T-cell therapy are elderly and might have terminally short telomeres. 2
Pharma lines up the trials
An ongoing University of Pennsylvania trial led by Adam D Cohen, MD, director of myeloma immunotherapy at the Abramson Cancer Center, has an overall response rate of 64%; initial phase 1 efficacy and safety results were reported at the 2016 annual meeting of the American Society of Hematology (ASH).3 In addition, multiple companies are pursuing registration trials for CAR T-cell therapies in myeloma, Dr June said.
Among those companies are bluebird bio and Celgene, which together are developing an anti-BCMA CAR T-cell therapy known as bb2121. The product was granted breakthrough therapy designation by the US Food and Drug Administration in November 2017 and will thus receive expedited review by the agency. It has also been fast-tracked in Europe.
The decision to fast-track bb2121 in the United States was based on preliminary results from the CRB-410 trial.4 Updated findings from that trial were presented at the 2017 ASH annual meeting and showed an overall response rate of 94% in 21 patients, with 17 of 18 patients who received doses above 50 x 106 CAR+ T cells having an overall response, and 10 of the 18 achieving complete remission. The progression-free survival rates were 81% at 6 months, and 71% at 9 months, with responses deepening over time. The complete response rates were 27% and 56% in May and October of 2017, respectively.
Responses were durable, lasting more than 1 year in several patients, the investigators reported. Phase 2 of the trial – the global pivotal KarMMA trial – is currently enrolling and will dose patients at between 150 and 350 x 106 CAR+ T cells.5
Janssen Biotech Inc and Legend Biotech USA Inc/ Legend Biotech Ireland Ltd have also joined forces to develop an anti-BCMA CAR T-cell product for multiple myeloma, Dr June said. The companies announced in late 2017 that they had entered into “a worldwide collaboration and license agreement” to develop the CAR T-cell drug candidate, LCAR-B38M.6 It has been accepted for review by the China Food and Drug Administration and is in the planning phase of clinical studies in the United States for multiple myeloma, according to that announcement.
Cost, financial toxicity, and a new therapeutic landscape
The rush for the approval of a CAR T-cell therapy for myeloma will lead to a welcome addition to the treatment armamentarium not just because of the clinical benefits, but because of the possibility of reducing disease-related costs (p. e177). Although myeloma represents only about 2% of all cancers, it is responsible for 7% of cancer costs, Dr June noted, and since many patients live with their disease for a long time, that can mean substantial “financial toxicity” being associated with treatment for the disease. “So CAR T-cell therapy for myeloma will bring a huge change to the practice of oncology,” he added.
Dr June explained that tisagenlecleucel, the first CAR T-cell therapy to be approved (in August 2017; p. e126), was for pediatric acute lymphoblastic leukemia that had relapsed at least twice.7 “That’s only about 600 kids a year in the United States, so it’s an ultra-orphan market,” he said. However, with the subsequent October 2017 approval of axicabtagene ciloleucel for certain cases of large B-cell lymphoma8 and the anticipated myeloma approval, CAR T-cell therapy will move away from that orphan status.
“There are a lot of difficulties whenever you change to something new,” he said, comparing the CAR T-cell therapy evolution to that of bone marrow transplantation in the 1980s, when many voiced concern about the new therapy because it was available at only 2 centers in the United states and required a high level of specialized skill. “But over the years, millions of transplants have been done [and] they’re done at many community centers. And it’s the same thing with CARs.” There are now 30 centers offering CAR T-cell therapy and people have to be trained. “It’s a new skill set, and it will take time,” he said.
Access to trials: balancing demand and availability
That delay can be particularly frustrating because there are many patients who might benefit “in a major way” from CAR T-cell therapy, but who can’t get on a clinical trial, Dr June noted.
“There’s more demand than availability, and it’s going to take a while” for that to change, he said. The solution most likely will involve the complementary use of off-the-shelf CAR T cells in some patients to induce remission and perhaps provide a bridge to another definitive therapy, and ultrapersonalized CAR T-cell therapy in others, as well as combinations that include CAR T cells and targeted agents or checkpoint inhibitors.
CRISPR-Cas9 gene editing is also being considered as a tool for engineering multiple myeloma cellular immunotherapy (and other cancer treatments), as in the Parker Institute-funded NYCE study,9 Dr June said. “We’re actually removing the [programmed death-1] gene and the T-cell receptors ... it shows enormous potential for gene editing. CRISPR is going to be used for a lot of things, but the first use is with T-cell therapies, so we’re really excited about that trial.”
Disclosures. Dr June reported royalties and research funding from Novartis and an ownership interest in Tmunity Therapeutics.
1. University of Pennsylvania. CART-BCMA cells for multiple myeloma. https://clinicaltrials.gov/ct2/show/NCT02546167. NCT02546167. Accessed June 13, 2018.
2. Frisinger C. Cancer researcher's life saved by CAR-T treatment. UT Southwestern Medical Center website. https://www.utsouthwestern.edu/newsroom/articles/year-2018/wright-car-t.html. Published. Accessed June 13, 2018.
3. Cohen AD, Garfall AL, Stadtmauer EA, et al. B-cell maturation antigen (BCMA)-specific chimeric antigen receptor T cells (CART-BCMA) for multiple myeloma (MM): initial safety and efficacy from a phase I study. Blood. 2016;128(22):1147.
4. Berdeja JG, Lin Y, Raje N, et al. Durable clinical responses in heavily pretreated patients with relapsed/refractory multiple myeloma: updated results from a multicenter study of bb2121 anti-BCMA CAR T cell therapy. Blood. 2017;130:740.
5. Celgene. Efficacy and safety study of bb2121 in subjects with relapsed and refractory multiple myeloma (KarMMa) (bb2121). https://clinicaltrials.gov/ct2/show/NCT03361748. NCT03361748. Accessed June 13, 2018.
6. Janssen enters worldwide collaboration and license agreement with Chinese company Legend Biotech to develop investigational CAR-T anti-cancer therapy. https://www.jnj.com/media-center/press-releases/janssen-enters-worldwide-collaboration-and-license-agreement-with-chinese-company-legend-biotech-to-develop-investigational-car-t-anti-cancer-therapy. New Brunswick, NJ: Johnson & Johnson. December 21, 2017. Accessed June 13, 2018.
7. FDA approves tisagenlecleucel for B-cell ALL and tocilizumab for cytokine release syndrome. FDA News Release. August 30, 2017. https://www.fda.gov/Drugs/InformationOnDrugs/ApprovedDrugs/ucm574154.htm. Accessed June 13, 2018.
8. FDA approves axicabtagene ciloleucel for large B-cell lymphoma. FDA News Release. October 18, 2017. https://www.fda.gov/Drugs/InformationOnDrugs/ApprovedDrugs/ucm581296.htm. Accessed June 13, 2018.
9. University of Pennsylvania. NY-ESO-1-redirected CRISPR (TCRendo and PD1) edited T cells (NYCE T Cells). NCT03399448. Accessed June 13, 2018.
The next major approval in the chimeric antigen receptor (CAR) T-cell therapy arena will target multiple myeloma, according to Carl June, MD, the Richard W Vague Professor in Immunotherapy and a pioneer in CAR T-cell research at the University of Pennsylvania, Philadelphia. That approval is anticipated sometime in 2019, and will “completely transform oncology,” Dr June said in a recent interview. “Myeloma is the most common blood cancer in adults, and there’s never been a curative therapy, but now there is a subset of patients who look like they’re cured with CAR T cells.”
Researcher-turned-patient
The first treated patient in a trial of a novel anti–B-cell maturation antigen (BCMA)–specific CAR T-cell therapy (CART-BCMA)1 developed by University of Pennsylvania researchers in collaboration with Novartis is part of that subset. Earlier this year, Woodring Wright, MD, a professor of cell biology and medicine at the University of Texas (UT) Southwestern Medical Center in Dallas, outed himself as that first patient when he announced that CART-BCMA saved his life.2
Dr Wright had been diagnosed with multiple myeloma about 12 years ago and had failed 11 previous chemotherapies before he was enrolled in the CART-BCMA trial. He remains cancer free more than 2 years after receiving CART-BCMA and he’s now conducting CAR T-cell–related research in his UT Southwestern laboratory to broaden the effectiveness of current CAR T-cell therapies. In particular, he is looking at whether the small percentage of patients in whom CAR T-cell therapy does not work might benefit from telomerase to lengthen telomeres, because most patients who fail CAR T-cell therapy are elderly and might have terminally short telomeres. 2
Pharma lines up the trials
An ongoing University of Pennsylvania trial led by Adam D Cohen, MD, director of myeloma immunotherapy at the Abramson Cancer Center, has an overall response rate of 64%; initial phase 1 efficacy and safety results were reported at the 2016 annual meeting of the American Society of Hematology (ASH).3 In addition, multiple companies are pursuing registration trials for CAR T-cell therapies in myeloma, Dr June said.
Among those companies are bluebird bio and Celgene, which together are developing an anti-BCMA CAR T-cell therapy known as bb2121. The product was granted breakthrough therapy designation by the US Food and Drug Administration in November 2017 and will thus receive expedited review by the agency. It has also been fast-tracked in Europe.
The decision to fast-track bb2121 in the United States was based on preliminary results from the CRB-410 trial.4 Updated findings from that trial were presented at the 2017 ASH annual meeting and showed an overall response rate of 94% in 21 patients, with 17 of 18 patients who received doses above 50 x 106 CAR+ T cells having an overall response, and 10 of the 18 achieving complete remission. The progression-free survival rates were 81% at 6 months, and 71% at 9 months, with responses deepening over time. The complete response rates were 27% and 56% in May and October of 2017, respectively.
Responses were durable, lasting more than 1 year in several patients, the investigators reported. Phase 2 of the trial – the global pivotal KarMMA trial – is currently enrolling and will dose patients at between 150 and 350 x 106 CAR+ T cells.5
Janssen Biotech Inc and Legend Biotech USA Inc/ Legend Biotech Ireland Ltd have also joined forces to develop an anti-BCMA CAR T-cell product for multiple myeloma, Dr June said. The companies announced in late 2017 that they had entered into “a worldwide collaboration and license agreement” to develop the CAR T-cell drug candidate, LCAR-B38M.6 It has been accepted for review by the China Food and Drug Administration and is in the planning phase of clinical studies in the United States for multiple myeloma, according to that announcement.
Cost, financial toxicity, and a new therapeutic landscape
The rush for the approval of a CAR T-cell therapy for myeloma will lead to a welcome addition to the treatment armamentarium not just because of the clinical benefits, but because of the possibility of reducing disease-related costs (p. e177). Although myeloma represents only about 2% of all cancers, it is responsible for 7% of cancer costs, Dr June noted, and since many patients live with their disease for a long time, that can mean substantial “financial toxicity” being associated with treatment for the disease. “So CAR T-cell therapy for myeloma will bring a huge change to the practice of oncology,” he added.
Dr June explained that tisagenlecleucel, the first CAR T-cell therapy to be approved (in August 2017; p. e126), was for pediatric acute lymphoblastic leukemia that had relapsed at least twice.7 “That’s only about 600 kids a year in the United States, so it’s an ultra-orphan market,” he said. However, with the subsequent October 2017 approval of axicabtagene ciloleucel for certain cases of large B-cell lymphoma8 and the anticipated myeloma approval, CAR T-cell therapy will move away from that orphan status.
“There are a lot of difficulties whenever you change to something new,” he said, comparing the CAR T-cell therapy evolution to that of bone marrow transplantation in the 1980s, when many voiced concern about the new therapy because it was available at only 2 centers in the United states and required a high level of specialized skill. “But over the years, millions of transplants have been done [and] they’re done at many community centers. And it’s the same thing with CARs.” There are now 30 centers offering CAR T-cell therapy and people have to be trained. “It’s a new skill set, and it will take time,” he said.
Access to trials: balancing demand and availability
That delay can be particularly frustrating because there are many patients who might benefit “in a major way” from CAR T-cell therapy, but who can’t get on a clinical trial, Dr June noted.
“There’s more demand than availability, and it’s going to take a while” for that to change, he said. The solution most likely will involve the complementary use of off-the-shelf CAR T cells in some patients to induce remission and perhaps provide a bridge to another definitive therapy, and ultrapersonalized CAR T-cell therapy in others, as well as combinations that include CAR T cells and targeted agents or checkpoint inhibitors.
CRISPR-Cas9 gene editing is also being considered as a tool for engineering multiple myeloma cellular immunotherapy (and other cancer treatments), as in the Parker Institute-funded NYCE study,9 Dr June said. “We’re actually removing the [programmed death-1] gene and the T-cell receptors ... it shows enormous potential for gene editing. CRISPR is going to be used for a lot of things, but the first use is with T-cell therapies, so we’re really excited about that trial.”
Disclosures. Dr June reported royalties and research funding from Novartis and an ownership interest in Tmunity Therapeutics.
1. University of Pennsylvania. CART-BCMA cells for multiple myeloma. https://clinicaltrials.gov/ct2/show/NCT02546167. NCT02546167. Accessed June 13, 2018.
2. Frisinger C. Cancer researcher's life saved by CAR-T treatment. UT Southwestern Medical Center website. https://www.utsouthwestern.edu/newsroom/articles/year-2018/wright-car-t.html. Published. Accessed June 13, 2018.
3. Cohen AD, Garfall AL, Stadtmauer EA, et al. B-cell maturation antigen (BCMA)-specific chimeric antigen receptor T cells (CART-BCMA) for multiple myeloma (MM): initial safety and efficacy from a phase I study. Blood. 2016;128(22):1147.
4. Berdeja JG, Lin Y, Raje N, et al. Durable clinical responses in heavily pretreated patients with relapsed/refractory multiple myeloma: updated results from a multicenter study of bb2121 anti-BCMA CAR T cell therapy. Blood. 2017;130:740.
5. Celgene. Efficacy and safety study of bb2121 in subjects with relapsed and refractory multiple myeloma (KarMMa) (bb2121). https://clinicaltrials.gov/ct2/show/NCT03361748. NCT03361748. Accessed June 13, 2018.
6. Janssen enters worldwide collaboration and license agreement with Chinese company Legend Biotech to develop investigational CAR-T anti-cancer therapy. https://www.jnj.com/media-center/press-releases/janssen-enters-worldwide-collaboration-and-license-agreement-with-chinese-company-legend-biotech-to-develop-investigational-car-t-anti-cancer-therapy. New Brunswick, NJ: Johnson & Johnson. December 21, 2017. Accessed June 13, 2018.
7. FDA approves tisagenlecleucel for B-cell ALL and tocilizumab for cytokine release syndrome. FDA News Release. August 30, 2017. https://www.fda.gov/Drugs/InformationOnDrugs/ApprovedDrugs/ucm574154.htm. Accessed June 13, 2018.
8. FDA approves axicabtagene ciloleucel for large B-cell lymphoma. FDA News Release. October 18, 2017. https://www.fda.gov/Drugs/InformationOnDrugs/ApprovedDrugs/ucm581296.htm. Accessed June 13, 2018.
9. University of Pennsylvania. NY-ESO-1-redirected CRISPR (TCRendo and PD1) edited T cells (NYCE T Cells). NCT03399448. Accessed June 13, 2018.
Tumor heterogeneity: a central foe in the war on cancer
A major challenge to effective cancer treatment is the astounding level of heterogeneity that tumors display on many different fronts. Here, we discuss how a deeper appreciation of this heterogeneity and its impact is driving research efforts to better understand and tackle it and a radical rethink of treatment paradigms.
A complex and dynamic disease
The nonuniformity of cancer has long been appreciated, reflected most visibly in the variation of response to the same treatment across patients with the same type of tumor (inter-tumor heterogeneity). The extent of tumor heterogeneity is being fully realized only now, with the advent of next-generation sequencing technologies. Even within the same tumor, there can be significant heterogeneity from cell to cell (intra-tumor heterogeneity), yielding substantial complexity in cancer.
Heterogeneity reveals itself on many different levels. Histologically speaking, tumors are composed of a nonhomogenous mass of cells that vary in type and number. In terms of their molecular make-up, there is substantial variation in the types of molecular alterations observed, all the way down to the single cell level. In even more abstract terms, beyond the cancer itself, the microenvironment in which it resides can be highly heterogeneous, composed of a plethora of different supportive and tumor-infiltrating normal cells.
Heterogeneity can manifest spatially, reflecting differences in the composition of the primary tumor and tumors at secondary sites or across regions of the same tumor mass and temporally, at different time points across a tumor’s natural history. Evocative of the second law of thermodynamics, cancers generally become more diverse and complex over time.1-3
A tale of 2 models
It is widely accepted that the transformation of a normal cell into a malignant one occurs with the acquisition of certain “hallmark” abilities, but there are myriad ways in which these can be attained.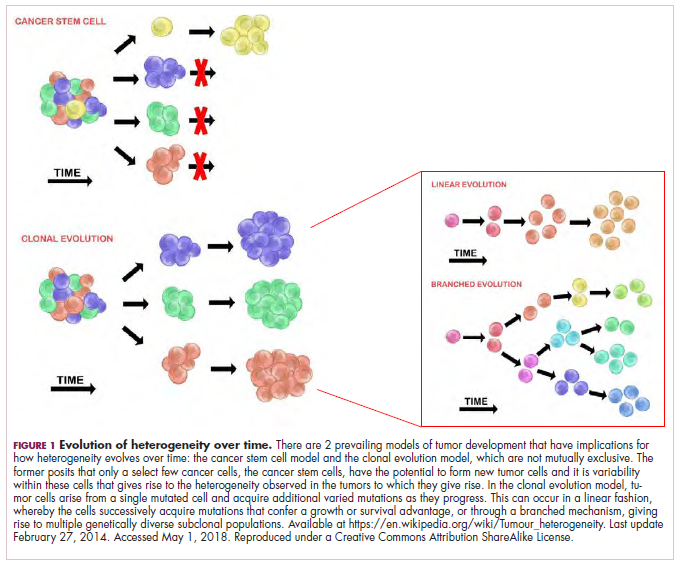
The clonal evolution model
As cells divide, they randomly acquire mutations as a result of DNA damage. The clonal evolution model posits that cancer develops as the result of a multistep accumulation of a series of “driver” mutations that confer a promalignant advantage to the cell and ultimately fuel a cancerous hallmark.
This evolution can occur in a linear fashion, whereby the emergence of a new driver mutation conveys such a potent evolutionary advantage that it outcompetes all previous clones. There is limited evidence for linear evolution in most advanced human cancers; instead, they are thought to evolve predominantly through a process of branching evolution, in which multiple clones can diverge in parallel from a common ancestor through the acquisition of different driver mutations. This results in common clonal mutations that form the trunk of the cancer’s evolutionary tree and are shared by all cells and subclonal mutations, which make up the branches and differ from cell to cell.
More recently, several other mechanisms of clonal evolution have been proposed, including neutral evolution, a type of branching evolution in which there are no selective pressures and evolution occurs by random mutations occurring over time that lead to genetic drift, and punctuated evolution, in which there are short evolutionary bursts of hypermutation.4,5
The CSC model
This model posits that the ability to form and sustain a cancer is restricted to a single cell type – the cancer stem cells – which have the unique capacity for self-renewal and differentiation. Although the forces of evolution are still involved in this model, they act on a hierarchy of cells, with stem cells sitting at the top. A tumor is derived from a single stem cell that has acquired a mutation, and the heterogeneity observed results both from the differentiation and the accumulation of mutations in CSCs.
Accumulated experimental evidence suggests that these models are not mutually exclusive and that they can all contribute to heterogeneity in varied amounts across different tumor types. What is clear is that heterogeneity and evolution are intricately intertwined in cancer development.1,2,6
An unstable genome
Heterogeneity and evolution are fueled by genomic alterations and the genome instability that they foster. This genome instability can range from single base pair substitutions to a doubling of the entire genome and results from both exposure to exogenous mutagens (eg, chemicals and ultraviolet radiation) and genomic alterations that have an impact on important cellular processes (eg, DNA repair or replication).
Among the most common causes of genome instability are mutations in the DNA mismatch repair pathway proteins or in the proofreading polymerase enzymes. Genome instability is often associated with unique mutational signatures – characteristic combinations of mutations that arose as the result of the specific biological processes underlying them.7
Genome-wide analyses have begun to reveal these mutational signatures across the spectrum of human cancers. The Wellcome Sanger Institute’s Catalogue of Somatic Mutations in Cancer (COSMIC) database has generated a set of 30 mutational signatures based on analysis of almost 11,000 exomes and more than 1,000 whole genomes spanning 40 different cancer types, some of which have been linked with specific mutagenic processes, such as tobacco, UV radiation, and DNA repair deficiency (Table 1).8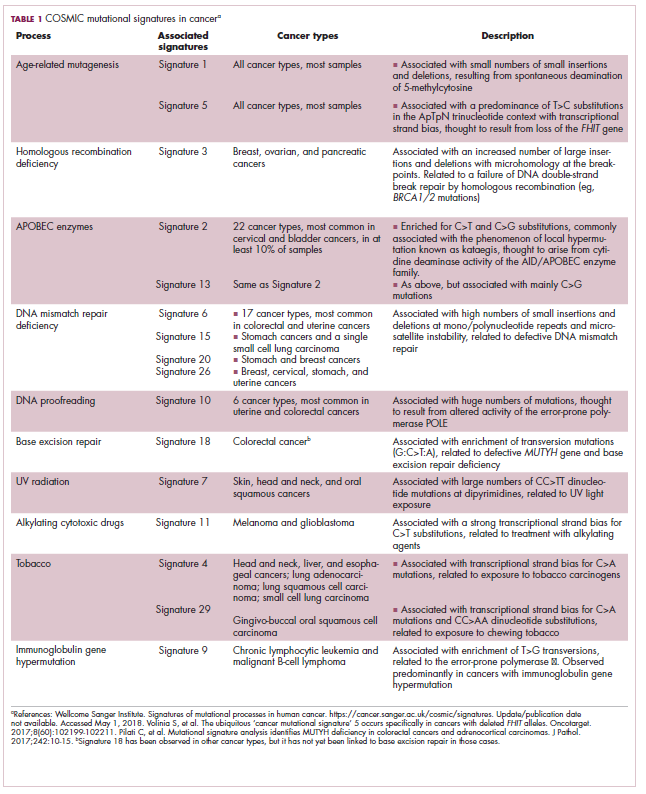
Fueling resistance
Arguably, heterogeneity presents one of the most significant barriers to effective cancer therapy, and this has become increasingly true in the era of personalized medicine in which targeted therapies take aim at specific molecular abnormalities.
It is vital that drugs target the truncal alterations that are present in all cancer cells to ensure that the entire cancer is eradicated. However, it is not always possible to target these alterations, for example, at the present time tumor suppressor proteins like p53 are not druggable.
Even when truncal alterations have been targeted successfully, such as epidermal growth factor receptor (EGFR) mutations and anaplastic lymphoma kinase (ALK) chromosomal rearrangements in non–small-cell lung cancer (NSCLC) and BRAF mutations in melanoma, the long-term efficacy of these drugs is almost invariably limited by the development of resistance.
Tumor heterogeneity and the clonal evolution it fuels are central drivers of resistance. Because tumors are dynamic and continue to evolve, anticancer treatments can act as a strong selective pressure and drive the emergence of drug-resistant subclones that allow the tumor to persist. In fact, study findings have revealed that small populations of resistant cells may be present before treatment. Thus, resistance may also occur as a result of the outgrowth of preexisting treatment-resistant cells that suddenly find that they acquire a survival advantage in the presence of a drug.1,6
Tackling heterogeneity
Despite extensive clinical documentation of the existence of heterogeneity and its underlying mechanisms across a range of tumor types, the development of novel clinical trial designs and therapeutic strategies that account for its effects have only recently begun to be explored.
For the most part, this was because of a lack of effective methods for evaluating intratumor heterogeneity. Multiregion biopsies, in which tissue derived from multiple different regions of a single tumor mass or from distinct cancerous lesions within the same patient, give a snapshot of tumor heterogeneity at a single point in time. The repeated longitudinal sampling required to gain a deeper appreciation of tumor heterogeneity over the course of tumor evolution is often not possible because of the morbidity associated with repeated surgical procedures.
Liquid biopsies, in which DNA sequencing can be performed on tumor components that are found circulating in the blood of cancer patients (including circulating tumor cells and cell-free circulating tumor DNA) have rapidly gained traction in the past several decades and offer an unprecedented opportunity for real-time assessment of evolving tumor heterogeneity.
They have proved to be highly sensitive and specific, with a high degree of concordance with tissue biopsy, they can identify both clonal and subclonal mutations, and they can detect resistance substantially earlier than radiographic imaging, which could permit earlier intervention.10,11 The first liquid biopsy-based companion diagnostic test was approved by the US Food and Drug Administration in 2016, for the detection of EGFR mutations associated with NSCLC.
Yet, even liquid biopsy alone is not able to fully dissect the extent of tumor heterogeneity, especially because it is limited in its ability to assess spatial heterogeneity. Truly effective assessment of tumor heterogeneity is likely to require a combination of liquid biopsy, carefully selected tumor tissue biopsies, imaging diagnostics, and biomarkers.
The ongoing TRACERx (Tracking cancer evolution through therapy [Rx]) trials are evaluating a combination of approaches to follow tumor evolution across the course of treatment. The study in NSCLC began in 2014 with a target enrollment of 842 patients and will follow patients over 6 years. Preliminary data from the first 100 patients were recently published and demonstrated that increased intratumor heterogeneity correlated with increased risk of recurrence or death.12
If patients consent, the TRACERx trials also feed into the PEACE (Posthumous evaluation of advanced cancer environment) trials, which are collecting postmortem biopsies to further evaluate tumor heterogeneity and evolution. TRACERx trials in several other cancer types are now also underway.
Cutting off the source
The main therapeutic strategies for overcoming tumor heterogeneity are focused on the mechanisms of resistance that it drives. It is becoming increasingly apparent that rationally designed combinations of drugs are likely to be required and might need to be administered early in the course of disease to prevent resistance.
However, according to mathematical modeling studies, combinations of at least 3 drugs may be necessary.13 In many cases, this is unlikely to be feasible owing to the unavailability of drugs for certain targets and issues of toxicity, as well as the high cost.
An alternative strategy is to use immunotherapy, because a single treatment can target multiple neoantigens simultaneously. Although immunotherapy has proved to be a highly effective treatment paradigm in multiple tumor types, resistance still arises through varied mechanisms with tumor heterogeneity at their core.14,15
A promising avenue for drug development is to cut off the source of tumor heterogeneity – genomic instability and the mutagenic processes that foster it (Table 2). This is exemplified by the success of poly(ADP-ribose) polymerase (PARP) inhibitors in patients with breast cancer susceptibility (BRCA1/2) gene mutations.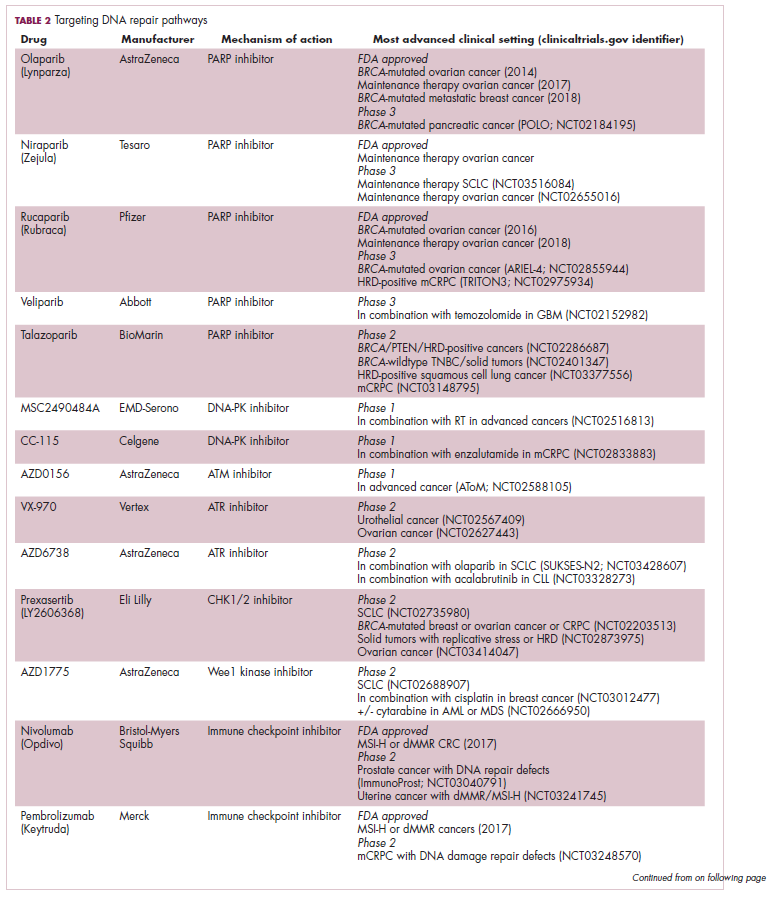
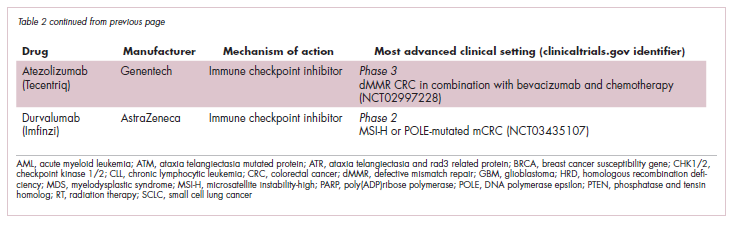
Both germline and somatic mutations in the BRCA1/2 genes are observed in 10% to 15% of patients with ovarian cancer and a substantial number of patients with other types of cancer, including breast, pancreatic, and prostate cancers.16,17
These genes play a central role in the homologous recombination (HR) pathway of DNA repair, which repairs double-strand breaks in DNA. PARP inhibitors target a different DNA repair pathway, base excision repair, which repairs single-strand breaks. The use of PARP inhibitors in patients with BRCA1/2 mutations is designed to create irreparable damage to the DNA repair processes and drive an unsustainable level of genome instability that leads to cell death, whereas normal cells without HR deficiency can survive.18
A growing number of PARP inhibitors are now approved for use in the United States for the treatment of ovarian cancer. In January, olaparib became the first PARP inhibitor approved for patients with BRCA1/2-mutant breast cancer, based on data from the OlympiAD trial in which 302 patients were randomized to receive olaparib 300 mg twice daily or physician’s choice of chemotherapy. Olaparib improved progression-free survival from 4.2 months to 7.0 months (hazard ratio, 0.58; P = .0009), and the most common adverse events included anemia, nausea, fatigue, and vomiting.19
Tumors with other defects in HR have also shown susceptibility to PARP inhibition, shifting interest toward identifying and treating these tumors as a group, independent of histology – about a quarter of all tumors display HR deficiency.20 This novel strategy of targeting mutational processes across a range of tumor types has also been exploited in the development of immunotherapies.
Patients with defects in the mismatch repair (MMR) pathway and microsatellite instability (MSI) – multiple alterations in the length of microsatellite markers within the DNA – are more sensitive to immunotherapy, likely because they are predisposed to a high level of somatic mutations that can serve as neoantigens to provoke a strong anti-tumor immune response.
In 2017, 2 immune checkpoint inhibitors were approved for use in patients with MSI-high or defective MMR (dMMR) cancers. The indication for pembrolizumab (Keytruda) was independent of tumor histology, the first approval of its kind. It was based on the results of 5 clinical trials in which 149 patients with MSI-H or dMMR cancers were given pembrolizumab 200 mg every 3 weeks or 10 mg/kg every 2 weeks for a maximum of 24 months. The overall response rate was 39.6%, including 11 complete responses and 48 partial responses.21
A new paradigm
Treatment of a tumor is one of the major selective pressures that shapes its evolution and recent evidence has emerged that these selective pressures can be highly dynamic. Study findings have shown that there is a cost associated with evolution of resistant subclones and, if the selective pressure of therapy is removed, that cost may become too high, such that resistant subclones are then outcompeted by drug-sensitive ones. There have been reports of reversal of drug resistance when drug treatment is interrupted.
The current treatment paradigm is to try to eliminate tumors by hitting them hard and fast with the maximum tolerated dose (MTD) of a drug. However, there is increasing appreciation that this may be inadvertently fostering more rapid disease progression because it selects for the emergence of resistant cells and eliminates all their competitors (Figure 2).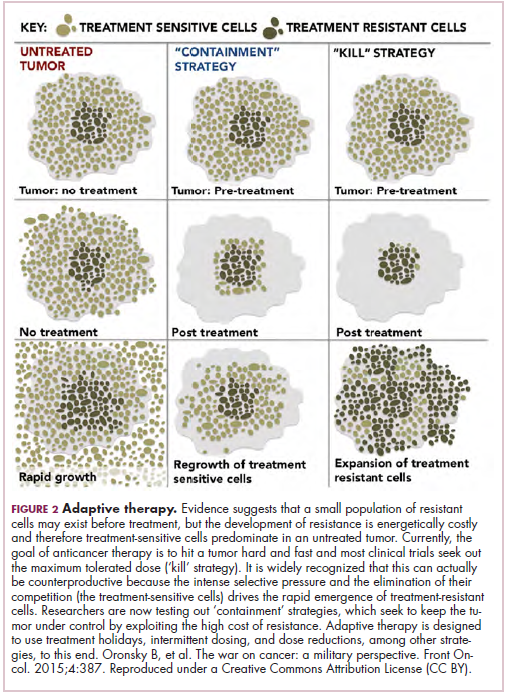
This is driving a potential paradigm shift, in which researchers are applying concepts from evolutionary biology and the control of invasive species to the treatment of cancer. Instead of completely eliminating a cancer, a strategy of adaptive therapy could be used to set up competition between different subclones and keep tumor growth in check by exploiting the high cost of resistance.22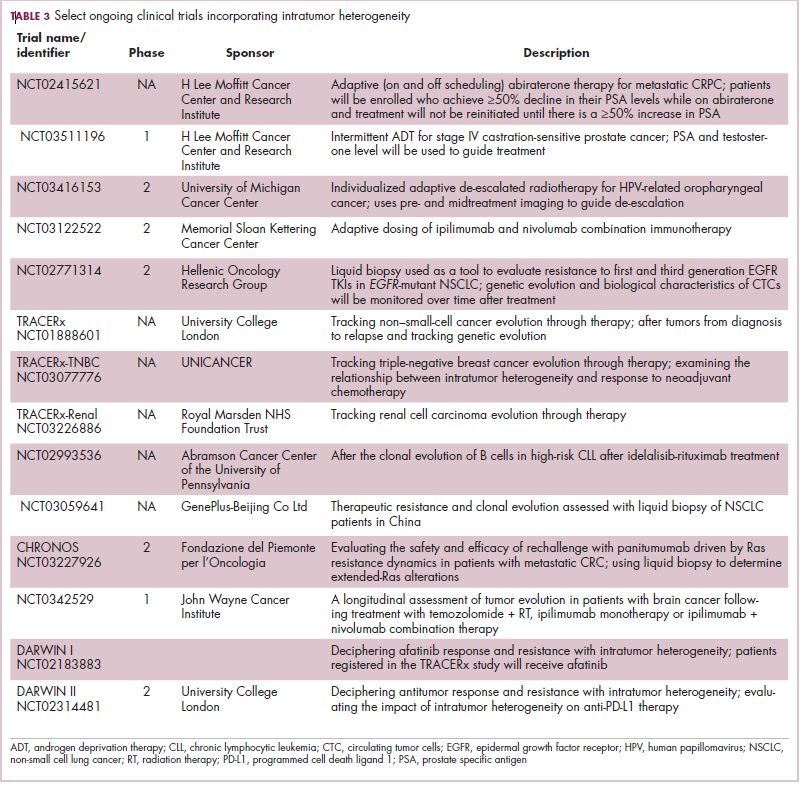
Adaptive therapy involves the use of treatment holidays, intermittent dosing schedules or reduced drug doses, rather than using the MTD. Adaptive therapy was tested recently in mice with triple-negative and estrogen receptor-positive breast cancer. The standard maximum dose of chemotherapy was compared with adaptive therapy with either reduced doses or skipped doses as the tumor responded. Tumor growth initially decreased with all 3 treatment scenarios, but then regrew when chemotherapy was stopped or doses were skipped. However, adaptive therapy with lower doses resulted in long-term stabilization of the tumor where treatment was eventually able to be withdrawn.23 Clinical trials of several different types of adaptive therapy strategies are ongoing (Table 3).
1. Dagogo-Jack I, Shaw AT. Tumour heterogeneity and resistance to cancer therapies. Nat Rev Clin Oncol. 2018;15(2):81-94.
2. Dzobo K, Senthebane DA, Thomford NE, Rowe A, Dandara C, Parker MI. Not everyone fits the mold: intratumor and intertumor heterogeneity and innovative cancer drug design and development. OMICS. 2018;22(1):17-34.
3. McGranahan N, Swanton C. Clonal heterogeneity and tumor evolution: past, present, and the future. Cell. 2017;168(4):613-628.
4. Davis A, Gao R, Navin N. Tumor evolution: linear, branching, neutral or punctuated? Biochim Biophys Acta. 2017;1867(2):151-161.
5. Amirouchene-Angelozzi N, Swanton C, Bardelli A. Tumor evolution as a therapeutic target. Cancer Discov. Published online first July 20, 2017. Accessed May 23, 2018. doi: 10.1158/2159-8290.CD-17-0343
6. Wu D, Wang DC, Cheng Y, et al. Roles of tumor heterogeneity in the development of drug resistance: a call for precision therapy. Semin Cancer Biol. 2017;42:13-19.
7. Ferguson LR, Chen H, Collins AR, et al. Genomic instability in human cancer: molecular insights and opportunities for therapeutic attack and prevention through diet and nutrition. Semin Cancer Biol. 2015;35(suppl):S5-S24.
8. Forbes SA, Beare D, Gunasekaran P, et al. COSMIC: exploring the world’s knowledge of somatic mutations in human cancer. Nucleic Acids Res. 2015;43(Database issue):D805-811.
9. Rosenthal R, McGranahan N, Herrero J, Swanton C. Deciphering genetic intratumor heterogeneity and its impact on cancer evolution. Ann Rev Cancer Biol. 2017;1(1):223-240.
10. Esposito A, Criscitiello C, Locatelli M, Milano M, Curigliano G. Liquid biopsies for solid tumors: understanding tumor heterogeneity and real time monitoring of early resistance to targeted therapies. Pharmacol Ther. 2016;157:120-124.
11. Venesio T, Siravegna G, Bardelli A, Sapino A. Liquid biopsies for monitoring temporal genomic heterogeneity in breast and colon cancers. Pathobiology. 2018;85(1-2):146-154.
12. Jamal-Hanjani M, Wilson GA, McGranahan N, et al. Tracking the evolution of non–small-cell lung cancer. New Engl J Med. 2017;376(22):2109-2121.
13. Bozic I, Reiter JG, Allen B, et al. Evolutionary dynamics of cancer in response to targeted combination therapy. Elife. 2013;2:e00747.
14. Zugazagoitia J, Guedes C, Ponce S, Ferrer I, Molina-Pinelo S, Paz-Ares L. Current challenges in cancer treatment. Clin Ther. 2016;38(7):1551-1566.
15. Ventola CL. Cancer immunotherapy, Part 3: challenges and future trends. PT. 2017;42(8):514-521.
16. Cavanagh H, Rogers KMA. The role of BRCA1 and BRCA2 mutations in prostate, pancreatic and stomach cancers. Hered Cancer Clin Pract. 2015;13:16.
17. Moschetta M, George A, Kaye SB, Banerjee S. BRCA somatic mutations and epigenetic BRCA modifications in serous ovarian cancer. Ann Oncol. 2016;27(8):1449-1455.
18. Brown JS, O’Carrigan B, Jackson SP, Yap TA. Targeting DNA repair in cancer: beyond PARP inhibitors. Cancer Discov. 2017;7(1):20-37.
19. Robson M, Im S-A, Senkus E, et al. Olaparib for Metastatic Breast Cancer in Patients with a Germline BRCA Mutation. New England Journal of Medicine. 2017;377(6):523-533.
20. Williers H, Pfaffle HN, Zou L. Targeting homologous recombination repair in cancer: molecular targets and clinical applications. In: Kelley M, Fishel M, eds. DNA repair in cancer therapy. 2nd ed: Academic Press; 2016:119-160.
21. U.S. Food and Drug Administration. FDA grants accelerated approval to pembrolizumab for first tissue/site agnostic indication. 2017; https://www.fda.gov/Drugs/InformationOnDrugs/ ApprovedDrugs/ucm560040.htm. Accessed May 1st,, 2018.
22. Gallaher JA, Enriquez-Navas PM, Luddy KA, Gatenby RA, Anderson ARA. Adaptive Therapy For Heterogeneous Cancer: Exploiting Space And Trade-Offs In Drug Scheduling. bioRxiv. 2017.
23. Enriquez-Navas PM, Kam Y, Das T, et al. Exploiting evolutionary principles to prolong tumor control in preclinical models of breast cancer. Sci Transl Med. 2016;8(327):327ra24.
A major challenge to effective cancer treatment is the astounding level of heterogeneity that tumors display on many different fronts. Here, we discuss how a deeper appreciation of this heterogeneity and its impact is driving research efforts to better understand and tackle it and a radical rethink of treatment paradigms.
A complex and dynamic disease
The nonuniformity of cancer has long been appreciated, reflected most visibly in the variation of response to the same treatment across patients with the same type of tumor (inter-tumor heterogeneity). The extent of tumor heterogeneity is being fully realized only now, with the advent of next-generation sequencing technologies. Even within the same tumor, there can be significant heterogeneity from cell to cell (intra-tumor heterogeneity), yielding substantial complexity in cancer.
Heterogeneity reveals itself on many different levels. Histologically speaking, tumors are composed of a nonhomogenous mass of cells that vary in type and number. In terms of their molecular make-up, there is substantial variation in the types of molecular alterations observed, all the way down to the single cell level. In even more abstract terms, beyond the cancer itself, the microenvironment in which it resides can be highly heterogeneous, composed of a plethora of different supportive and tumor-infiltrating normal cells.
Heterogeneity can manifest spatially, reflecting differences in the composition of the primary tumor and tumors at secondary sites or across regions of the same tumor mass and temporally, at different time points across a tumor’s natural history. Evocative of the second law of thermodynamics, cancers generally become more diverse and complex over time.1-3
A tale of 2 models
It is widely accepted that the transformation of a normal cell into a malignant one occurs with the acquisition of certain “hallmark” abilities, but there are myriad ways in which these can be attained.
The clonal evolution model
As cells divide, they randomly acquire mutations as a result of DNA damage. The clonal evolution model posits that cancer develops as the result of a multistep accumulation of a series of “driver” mutations that confer a promalignant advantage to the cell and ultimately fuel a cancerous hallmark.
This evolution can occur in a linear fashion, whereby the emergence of a new driver mutation conveys such a potent evolutionary advantage that it outcompetes all previous clones. There is limited evidence for linear evolution in most advanced human cancers; instead, they are thought to evolve predominantly through a process of branching evolution, in which multiple clones can diverge in parallel from a common ancestor through the acquisition of different driver mutations. This results in common clonal mutations that form the trunk of the cancer’s evolutionary tree and are shared by all cells and subclonal mutations, which make up the branches and differ from cell to cell.
More recently, several other mechanisms of clonal evolution have been proposed, including neutral evolution, a type of branching evolution in which there are no selective pressures and evolution occurs by random mutations occurring over time that lead to genetic drift, and punctuated evolution, in which there are short evolutionary bursts of hypermutation.4,5
The CSC model
This model posits that the ability to form and sustain a cancer is restricted to a single cell type – the cancer stem cells – which have the unique capacity for self-renewal and differentiation. Although the forces of evolution are still involved in this model, they act on a hierarchy of cells, with stem cells sitting at the top. A tumor is derived from a single stem cell that has acquired a mutation, and the heterogeneity observed results both from the differentiation and the accumulation of mutations in CSCs.
Accumulated experimental evidence suggests that these models are not mutually exclusive and that they can all contribute to heterogeneity in varied amounts across different tumor types. What is clear is that heterogeneity and evolution are intricately intertwined in cancer development.1,2,6
An unstable genome
Heterogeneity and evolution are fueled by genomic alterations and the genome instability that they foster. This genome instability can range from single base pair substitutions to a doubling of the entire genome and results from both exposure to exogenous mutagens (eg, chemicals and ultraviolet radiation) and genomic alterations that have an impact on important cellular processes (eg, DNA repair or replication).
Among the most common causes of genome instability are mutations in the DNA mismatch repair pathway proteins or in the proofreading polymerase enzymes. Genome instability is often associated with unique mutational signatures – characteristic combinations of mutations that arose as the result of the specific biological processes underlying them.7
Genome-wide analyses have begun to reveal these mutational signatures across the spectrum of human cancers. The Wellcome Sanger Institute’s Catalogue of Somatic Mutations in Cancer (COSMIC) database has generated a set of 30 mutational signatures based on analysis of almost 11,000 exomes and more than 1,000 whole genomes spanning 40 different cancer types, some of which have been linked with specific mutagenic processes, such as tobacco, UV radiation, and DNA repair deficiency (Table 1).8
Fueling resistance
Arguably, heterogeneity presents one of the most significant barriers to effective cancer therapy, and this has become increasingly true in the era of personalized medicine in which targeted therapies take aim at specific molecular abnormalities.
It is vital that drugs target the truncal alterations that are present in all cancer cells to ensure that the entire cancer is eradicated. However, it is not always possible to target these alterations, for example, at the present time tumor suppressor proteins like p53 are not druggable.
Even when truncal alterations have been targeted successfully, such as epidermal growth factor receptor (EGFR) mutations and anaplastic lymphoma kinase (ALK) chromosomal rearrangements in non–small-cell lung cancer (NSCLC) and BRAF mutations in melanoma, the long-term efficacy of these drugs is almost invariably limited by the development of resistance.
Tumor heterogeneity and the clonal evolution it fuels are central drivers of resistance. Because tumors are dynamic and continue to evolve, anticancer treatments can act as a strong selective pressure and drive the emergence of drug-resistant subclones that allow the tumor to persist. In fact, study findings have revealed that small populations of resistant cells may be present before treatment. Thus, resistance may also occur as a result of the outgrowth of preexisting treatment-resistant cells that suddenly find that they acquire a survival advantage in the presence of a drug.1,6
Tackling heterogeneity
Despite extensive clinical documentation of the existence of heterogeneity and its underlying mechanisms across a range of tumor types, the development of novel clinical trial designs and therapeutic strategies that account for its effects have only recently begun to be explored.
For the most part, this was because of a lack of effective methods for evaluating intratumor heterogeneity. Multiregion biopsies, in which tissue derived from multiple different regions of a single tumor mass or from distinct cancerous lesions within the same patient, give a snapshot of tumor heterogeneity at a single point in time. The repeated longitudinal sampling required to gain a deeper appreciation of tumor heterogeneity over the course of tumor evolution is often not possible because of the morbidity associated with repeated surgical procedures.
Liquid biopsies, in which DNA sequencing can be performed on tumor components that are found circulating in the blood of cancer patients (including circulating tumor cells and cell-free circulating tumor DNA) have rapidly gained traction in the past several decades and offer an unprecedented opportunity for real-time assessment of evolving tumor heterogeneity.
They have proved to be highly sensitive and specific, with a high degree of concordance with tissue biopsy, they can identify both clonal and subclonal mutations, and they can detect resistance substantially earlier than radiographic imaging, which could permit earlier intervention.10,11 The first liquid biopsy-based companion diagnostic test was approved by the US Food and Drug Administration in 2016, for the detection of EGFR mutations associated with NSCLC.
Yet, even liquid biopsy alone is not able to fully dissect the extent of tumor heterogeneity, especially because it is limited in its ability to assess spatial heterogeneity. Truly effective assessment of tumor heterogeneity is likely to require a combination of liquid biopsy, carefully selected tumor tissue biopsies, imaging diagnostics, and biomarkers.
The ongoing TRACERx (Tracking cancer evolution through therapy [Rx]) trials are evaluating a combination of approaches to follow tumor evolution across the course of treatment. The study in NSCLC began in 2014 with a target enrollment of 842 patients and will follow patients over 6 years. Preliminary data from the first 100 patients were recently published and demonstrated that increased intratumor heterogeneity correlated with increased risk of recurrence or death.12
If patients consent, the TRACERx trials also feed into the PEACE (Posthumous evaluation of advanced cancer environment) trials, which are collecting postmortem biopsies to further evaluate tumor heterogeneity and evolution. TRACERx trials in several other cancer types are now also underway.
Cutting off the source
The main therapeutic strategies for overcoming tumor heterogeneity are focused on the mechanisms of resistance that it drives. It is becoming increasingly apparent that rationally designed combinations of drugs are likely to be required and might need to be administered early in the course of disease to prevent resistance.
However, according to mathematical modeling studies, combinations of at least 3 drugs may be necessary.13 In many cases, this is unlikely to be feasible owing to the unavailability of drugs for certain targets and issues of toxicity, as well as the high cost.
An alternative strategy is to use immunotherapy, because a single treatment can target multiple neoantigens simultaneously. Although immunotherapy has proved to be a highly effective treatment paradigm in multiple tumor types, resistance still arises through varied mechanisms with tumor heterogeneity at their core.14,15
A promising avenue for drug development is to cut off the source of tumor heterogeneity – genomic instability and the mutagenic processes that foster it (Table 2). This is exemplified by the success of poly(ADP-ribose) polymerase (PARP) inhibitors in patients with breast cancer susceptibility (BRCA1/2) gene mutations.
Both germline and somatic mutations in the BRCA1/2 genes are observed in 10% to 15% of patients with ovarian cancer and a substantial number of patients with other types of cancer, including breast, pancreatic, and prostate cancers.16,17
These genes play a central role in the homologous recombination (HR) pathway of DNA repair, which repairs double-strand breaks in DNA. PARP inhibitors target a different DNA repair pathway, base excision repair, which repairs single-strand breaks. The use of PARP inhibitors in patients with BRCA1/2 mutations is designed to create irreparable damage to the DNA repair processes and drive an unsustainable level of genome instability that leads to cell death, whereas normal cells without HR deficiency can survive.18
A growing number of PARP inhibitors are now approved for use in the United States for the treatment of ovarian cancer. In January, olaparib became the first PARP inhibitor approved for patients with BRCA1/2-mutant breast cancer, based on data from the OlympiAD trial in which 302 patients were randomized to receive olaparib 300 mg twice daily or physician’s choice of chemotherapy. Olaparib improved progression-free survival from 4.2 months to 7.0 months (hazard ratio, 0.58; P = .0009), and the most common adverse events included anemia, nausea, fatigue, and vomiting.19
Tumors with other defects in HR have also shown susceptibility to PARP inhibition, shifting interest toward identifying and treating these tumors as a group, independent of histology – about a quarter of all tumors display HR deficiency.20 This novel strategy of targeting mutational processes across a range of tumor types has also been exploited in the development of immunotherapies.
Patients with defects in the mismatch repair (MMR) pathway and microsatellite instability (MSI) – multiple alterations in the length of microsatellite markers within the DNA – are more sensitive to immunotherapy, likely because they are predisposed to a high level of somatic mutations that can serve as neoantigens to provoke a strong anti-tumor immune response.
In 2017, 2 immune checkpoint inhibitors were approved for use in patients with MSI-high or defective MMR (dMMR) cancers. The indication for pembrolizumab (Keytruda) was independent of tumor histology, the first approval of its kind. It was based on the results of 5 clinical trials in which 149 patients with MSI-H or dMMR cancers were given pembrolizumab 200 mg every 3 weeks or 10 mg/kg every 2 weeks for a maximum of 24 months. The overall response rate was 39.6%, including 11 complete responses and 48 partial responses.21
A new paradigm
Treatment of a tumor is one of the major selective pressures that shapes its evolution and recent evidence has emerged that these selective pressures can be highly dynamic. Study findings have shown that there is a cost associated with evolution of resistant subclones and, if the selective pressure of therapy is removed, that cost may become too high, such that resistant subclones are then outcompeted by drug-sensitive ones. There have been reports of reversal of drug resistance when drug treatment is interrupted.
The current treatment paradigm is to try to eliminate tumors by hitting them hard and fast with the maximum tolerated dose (MTD) of a drug. However, there is increasing appreciation that this may be inadvertently fostering more rapid disease progression because it selects for the emergence of resistant cells and eliminates all their competitors (Figure 2).
This is driving a potential paradigm shift, in which researchers are applying concepts from evolutionary biology and the control of invasive species to the treatment of cancer. Instead of completely eliminating a cancer, a strategy of adaptive therapy could be used to set up competition between different subclones and keep tumor growth in check by exploiting the high cost of resistance.22
Adaptive therapy involves the use of treatment holidays, intermittent dosing schedules or reduced drug doses, rather than using the MTD. Adaptive therapy was tested recently in mice with triple-negative and estrogen receptor-positive breast cancer. The standard maximum dose of chemotherapy was compared with adaptive therapy with either reduced doses or skipped doses as the tumor responded. Tumor growth initially decreased with all 3 treatment scenarios, but then regrew when chemotherapy was stopped or doses were skipped. However, adaptive therapy with lower doses resulted in long-term stabilization of the tumor where treatment was eventually able to be withdrawn.23 Clinical trials of several different types of adaptive therapy strategies are ongoing (Table 3).
1. Dagogo-Jack I, Shaw AT. Tumour heterogeneity and resistance to cancer therapies. Nat Rev Clin Oncol. 2018;15(2):81-94.
2. Dzobo K, Senthebane DA, Thomford NE, Rowe A, Dandara C, Parker MI. Not everyone fits the mold: intratumor and intertumor heterogeneity and innovative cancer drug design and development. OMICS. 2018;22(1):17-34.
3. McGranahan N, Swanton C. Clonal heterogeneity and tumor evolution: past, present, and the future. Cell. 2017;168(4):613-628.
4. Davis A, Gao R, Navin N. Tumor evolution: linear, branching, neutral or punctuated? Biochim Biophys Acta. 2017;1867(2):151-161.
5. Amirouchene-Angelozzi N, Swanton C, Bardelli A. Tumor evolution as a therapeutic target. Cancer Discov. Published online first July 20, 2017. Accessed May 23, 2018. doi: 10.1158/2159-8290.CD-17-0343
6. Wu D, Wang DC, Cheng Y, et al. Roles of tumor heterogeneity in the development of drug resistance: a call for precision therapy. Semin Cancer Biol. 2017;42:13-19.
7. Ferguson LR, Chen H, Collins AR, et al. Genomic instability in human cancer: molecular insights and opportunities for therapeutic attack and prevention through diet and nutrition. Semin Cancer Biol. 2015;35(suppl):S5-S24.
8. Forbes SA, Beare D, Gunasekaran P, et al. COSMIC: exploring the world’s knowledge of somatic mutations in human cancer. Nucleic Acids Res. 2015;43(Database issue):D805-811.
9. Rosenthal R, McGranahan N, Herrero J, Swanton C. Deciphering genetic intratumor heterogeneity and its impact on cancer evolution. Ann Rev Cancer Biol. 2017;1(1):223-240.
10. Esposito A, Criscitiello C, Locatelli M, Milano M, Curigliano G. Liquid biopsies for solid tumors: understanding tumor heterogeneity and real time monitoring of early resistance to targeted therapies. Pharmacol Ther. 2016;157:120-124.
11. Venesio T, Siravegna G, Bardelli A, Sapino A. Liquid biopsies for monitoring temporal genomic heterogeneity in breast and colon cancers. Pathobiology. 2018;85(1-2):146-154.
12. Jamal-Hanjani M, Wilson GA, McGranahan N, et al. Tracking the evolution of non–small-cell lung cancer. New Engl J Med. 2017;376(22):2109-2121.
13. Bozic I, Reiter JG, Allen B, et al. Evolutionary dynamics of cancer in response to targeted combination therapy. Elife. 2013;2:e00747.
14. Zugazagoitia J, Guedes C, Ponce S, Ferrer I, Molina-Pinelo S, Paz-Ares L. Current challenges in cancer treatment. Clin Ther. 2016;38(7):1551-1566.
15. Ventola CL. Cancer immunotherapy, Part 3: challenges and future trends. PT. 2017;42(8):514-521.
16. Cavanagh H, Rogers KMA. The role of BRCA1 and BRCA2 mutations in prostate, pancreatic and stomach cancers. Hered Cancer Clin Pract. 2015;13:16.
17. Moschetta M, George A, Kaye SB, Banerjee S. BRCA somatic mutations and epigenetic BRCA modifications in serous ovarian cancer. Ann Oncol. 2016;27(8):1449-1455.
18. Brown JS, O’Carrigan B, Jackson SP, Yap TA. Targeting DNA repair in cancer: beyond PARP inhibitors. Cancer Discov. 2017;7(1):20-37.
19. Robson M, Im S-A, Senkus E, et al. Olaparib for Metastatic Breast Cancer in Patients with a Germline BRCA Mutation. New England Journal of Medicine. 2017;377(6):523-533.
20. Williers H, Pfaffle HN, Zou L. Targeting homologous recombination repair in cancer: molecular targets and clinical applications. In: Kelley M, Fishel M, eds. DNA repair in cancer therapy. 2nd ed: Academic Press; 2016:119-160.
21. U.S. Food and Drug Administration. FDA grants accelerated approval to pembrolizumab for first tissue/site agnostic indication. 2017; https://www.fda.gov/Drugs/InformationOnDrugs/ ApprovedDrugs/ucm560040.htm. Accessed May 1st,, 2018.
22. Gallaher JA, Enriquez-Navas PM, Luddy KA, Gatenby RA, Anderson ARA. Adaptive Therapy For Heterogeneous Cancer: Exploiting Space And Trade-Offs In Drug Scheduling. bioRxiv. 2017.
23. Enriquez-Navas PM, Kam Y, Das T, et al. Exploiting evolutionary principles to prolong tumor control in preclinical models of breast cancer. Sci Transl Med. 2016;8(327):327ra24.

The impact of inpatient rehabilitation on outcomes for patients with cancer
The American Cancer Society reports that 1.6 million people are diagnosed with cancer each year, of whom 78% are aged 55 years or older. The 5-year survival rate for cancer is 68%.1 Almost 15.5 million living Americans have been diagnosed with cancer.2 Many patients with cancer have difficulty walking and with activities of daily living. Patients with primary brain tumors or tumors metastatic to the brain may present with focal weakness or cognitive deficits similar to patients with stroke. Patients with tumors metastatic to the spine may have the same deficits as a patient with a traumatic spinal cord injury. Patients with metastasis to bone may have pathologic fractures of the hip or long bones. Patients may develop peripheral neuropathy associated with a paraneoplastic syndrome, chemotherapy, or critical illness neuropathy. Lehmann and colleagues evaluated 805 patients admitted to hospitals affiliated with the University of Washington Medical School with a diagnosis of cancer and found that 15% had difficulty walking and 20% had difficulty with activities of daily living.3
Many patients with cancer can benefit from inpatient rehabilitation.4,5 Study findings have shown that patients with impairments in function related to cancer are often not referred for rehabilitation. Among the reasons mentioned for that are that oncologists are more focused on treating the patients’ cancer than on their functional deficits and that specialists in rehabilitation medicine do not want to be involved with patients with complex medical problems. Rehabilitation facilities may not want to incur the costs associated with caring for patients with cancer.6
The present paper looks at the outcomes of 61 consecutive patients with cancer who were admitted to an inpatient rehabilitation facility (IRF) and received radiation therapy concurrent with rehabilitation. It compares the outcomes of the cancer patients with the outcomes of patients without cancer who were admitted with stroke or spinal cord injury, conditions more commonly treated at an IRF.
Methods
We reviewed electronic medical records of all patients with cancer admitted to the IRF from 2008 through 2013 who received radiation therapy while at the facility. We also reviewed the data of all patients without cancer admitted with a diagnosis of stroke in 2013 and all patients admitted with a diagnosis of traumatic spinal cord injury in 2012 and 2013. No patients were excluded from stroke and traumatic spinal cord injury groups.
We recorded the sex, age, diagnostic group, Functional Independence Measure (FIM) admission score, FIM discharge score, length of stay (LoS) in the IRF, place of discharge of each patient (eg, home, acute care, or subacute care), and calculated the FIM efficiency score (change in FIM/LoS) for each patient. The FIM is an instrument that has 18 items measuring mobility, participation in activities of daily living, ability to communicate, and cognitive function.7 Each item is scored from 1 to 7, with 1 denoting that the patient cannot perform the task and 7 that the activity can be performed independently. The minimum score is 18 (complete dependence), and the maximum score is 126 (independent function). Thirteen items compose the motor FIM score: eating, grooming, bathing, dressing upper body, dressing lower body, toileting, bladder management, management of bowel, transfer to bed or wheelchair, transfer to toilet, tub transfer, walking (or wheelchair use), and climbing stairs. Five items – comprehension, expression, social interaction, problem solving, and memory – compose the cognitive FIM score.
We used a 1-way analysis of variance to evaluate differences between age and cancer type, age and diagnostic group, admission FIM score and cancer type, discharge FIM score and cancer type, change in FIM and cancer type, LoS and cancer type, and LoS and diagnostic group. The Pearson chi-square test was used to test the goodness of fit between the place of disposition and diagnostic group. The paired t test was used to evaluate the improvement in FIM of the patients who were in the cancer groups. The Tukey Simultaneous Tests for Differences of Means was used to compare the FIM efficiency scores of the groups. A 2-sample t test was used to evaluate the factors associated with the need for transfer from the IRF to the acute medical service.
Results
The demographic characteristics of the patients in the study and the admission and discharge FIM scores are reported in Table 1. There were initially 62 cancer patients in the radiation group, which was further divided into 4 subgroups based on the site of the primary tumor or metastasis. In all, 23 had a primary malignant brain tumor and received radiation and temozolomide. Sixteen patients had malignancies metastatic to the brain, 15 patients had tumors metastatic to the spine, and 7 had tumors metastatic to the long bones. One patient had laryngeal cancer and was excluded from the study because we did not think that we could do an analysis of a group with only 1 patient. The final number of patients in the cancer group was therefore 61. There were 69 patients in the stroke group and 23 in the spinal cord injury group.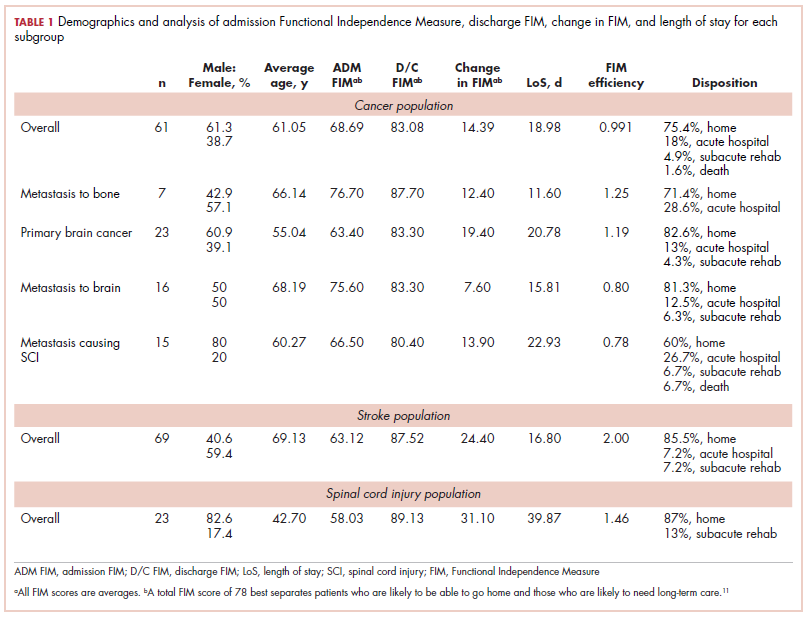
We report improvement in total FIM, motor FIM, and cognitive FIM scores and were able to identify all 18 of the items of the FIM score on 60 of the 61 patients in the cancer group. Improvement in total FIM of the 61 patients in the cancer groups was significant at P P P = .05. Just over 75% of the patients in the cancer group had sufficient enough improvement in their level of function that they were able to return to their homes (Table 1). The average FIM score at the time of discharge was 83.08. This was not significantly different than the level of function of patients discharged after stroke (87.52) or traumatic spinal cord injury (89.13).
The patients with primary brain tumors were younger than the patients with cancer metastatic to the brain (P = .013). The patients with a primary brain tumor had lower admission FIM scores than patients with tumors metastatic to the brain (P = .027). The patients with a primary brain tumor had a greater increase in FIM score than patients with metastasis to the brain (P = .043; Table 2). There was not a significant difference between these 2 groups in FIM score at discharge or in the likelihood of discharge to home (Table 1). The FIM efficiency score was 1.12 for the patients in the primary brain tumor group and .80 in those with metastasis to the brain. This difference was not significant P = .96.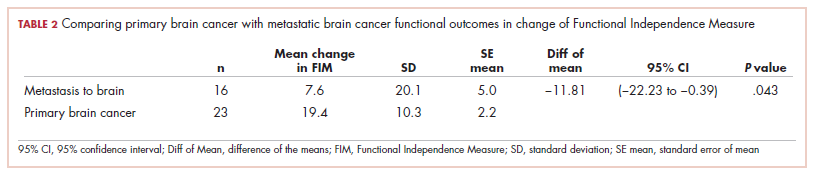
There were 69 patients in the stroke group. We compared the 39 patients with primary or metastatic brain lesion to the stroke group. The patients with primary or metastatic cancer of the brain were younger than the patients with stroke, 60.4 years old versus 69.1 years old (P = .004). The patients in the combined cancer group had a higher admission FIM score compared with the stroke patients (68.4 vs 63.12; P = .05). The discharge FIM scores were 83.3 in the combined cancer group and 87.5 in the stroke group (Table 1). This difference was not significant, but the improvement in the combined cancer group (14.6) was less than the improvement in the stroke group (24.40; P = .002) (Table 3).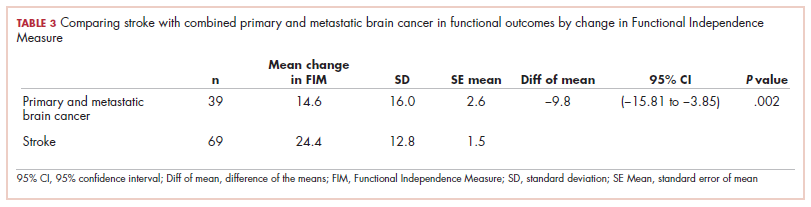
The average LoS in the IRF was 18.7 days in the combined cancer group and 16.8 days in the stroke group. This difference was not significant. An average of 82% of the patients in the primary tumor or brain metastasis group and 85.5% of the patients in the stroke group were discharged to home. This difference was not significant. The FIM efficiency score of the patients in the stroke group was 2.0. This was significantly greater than the score for the patients in the metastasis to the brain group (0.80; P = .044) but not significantly greater than the primary brain cancer group (1.19; P = .22).
There were 23 patients in the traumatic spinal cord injury group. A comparison of the patients with tumors metastatic to the spine and patients with traumatic spinal cord injury showed that the patients in the cancer group were older (60.27 and 42.70 years, respectively; P = .001). In all, 80% of patients with tumors metastatic to the spine were men. This was not significantly different from the percentage of men in the traumatic spinal cord injury group (82.6%; Table 1). The admission FIM score of the patients with cancer was 66.5 (standard deviation [SD], 13.3) and 58.03 (SD, 15.1) in the patients with a traumatic spinal cord injury (Table 1). The FIM score at discharge was 80.4 (SD, 19.1) in the patients with cancer and 89.1 (SD, 20.3) in the patients with a traumatic spinal cord injury (Table 1). Neither of these were statistically significant. The improvement in patients with cancer was 13.9 (SD, 12.2) and 31.1 (SD, 13.9) in the traumatic spinal cord injured patients. This difference was significant (P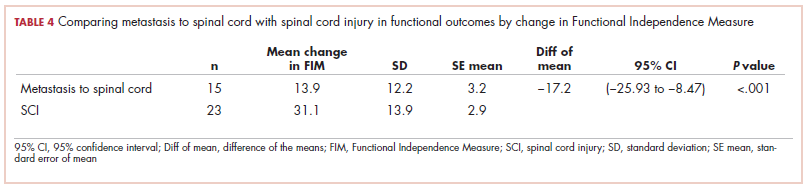
The median LoS was 18.98 days in the cancer metastasis to spine group (interquartile range [IQR] is the 25th-75th percentile, 12-30 days). In the traumatic group the median LoS was 23 days (IQR, 16-50 days). This difference was not significant (P = .14 Mann-Whitney test). The mean FIM efficiency score was 1.46 in the traumatic spinal cord injury group and .78 in the group with cancer metastatic to the spine. This difference was not significant (P = .72). Sixty percent of the patients in the cancer group were discharged to home, and 87% of patients in the traumatic spinal cord group were discharged to home. This difference was not significant (P = .12; Fisher exact test).
As far as we can ascertain, this is the first paper that has looked at the outcomes of patients receiving rehabilitation concurrent with radiation of the long bones. The average improvement in FIM was 12.4 (Table 1). The LoS was 11.6 days, and the FIM efficiency was 1.25. In all, 71.4% made enough progress to go home.
Of the total number of cancer patients, 18% were transferred to the acute medical service of the hospital (Table 1). Neither age, sex, type of cancer, nor admission FIM score were associated with the need for transfer to acute hospital care. Change in FIM score was inversely associated with transfer to acute hospital care (P = .027). Patients whose function did not improve with rehabilitation were most likely to be transferred back to acute hospital care.
Discussion
Radiation therapy is considered a service that is provided to people who come for treatment as an outpatient. Caregivers may have difficulty transporting patients to radiation if the patient has deficits in mobility. This may be particularly true if the patient is heavy, the caregivers are frail, or perhaps if they live in rural settings where there is no wheelchair-accessible public transportation. There are many factors that help determine whether a patient with functional deficits can be discharged to his or her home. These include sex, age, marital status, family and/or community support, income, and insurance.8 The FIM is an instrument that indicates how much help a patient needs with mobility and self-care skills. It also correlates with the amount of time that caregivers must spend helping a patient.9 Study findings have shown that the FIM score is an important determinant of whether a patient can be discharged to home. The total FIM score is as useful as an analysis of the components of the FIM score in predicting whether a patient can return to the community.10,11 Reistetter and colleagues found a total FIM score of 78 to be the score that best separates patients who are likely to be able to go home and patients who are likely to need long-term care.11 Bottemiller and colleagues10 reported that 37% of patients with total discharge FIM scores of less than 40 were discharged to home. They reported that 62% of patients with FIM scores between 40 and 79 were discharged to home, and 88% of patients with scores of 80 or above were discharged to home.10 The goal in bringing patients to the IRF was to accept and treat patients with reasonable community support and potential to achieve a functional level compatible with discharge to the community. Most patients in each of the cancer groups were able to reach an FIM score of 78 to 80 and to be discharged to home.
Most of the patients in the cancer groups had underlying problems that are not considered curable. The primary goal was to enable the patients to have some time at home with their families before requiring readmission to a hospital or hospice care. Reasonable LoS and rate of progress are now expected or required by third-party payors and hospital administrators. Physicians at the Mayo Clinic have indicated that a rehabilitation service should aim for an FIM efficiency score of at least .6 points per day.10 The FIM efficiency of patients in each of the 4 cancer subgroups in this study was higher than this level.
J. Herbert Dietz, Jr was an early advocate of the need to provide comprehensive rehabilitation services for patients with cancer. He first described his work in 1969.12 Since that time, there have been many papers that have documented the benefits of IRF for patients with cancer. O’Toole and Golden have shown outcomes of a large series of patients from an IRF. They reported that at the time of admission, 14% of patients could ambulate, but at discharge, 80% could ambulate without hands-on assistance. They reported significant improvements in continence, FIM score, and score on the Karnofsky Performance Scale.13 Marciniak,14 Hunter,15 Shin,16 and Cole,17 and their respective colleagues have all shown that patients with many different types of cancer benefit from rehabilitation at the IRF level. Gallegos-Kearin and colleagues4 reported on the care of 115,570 patients admitted to IRF with cancer from 2002 to 2014. Patients had significant improvement in function, with more than 70% of patients discharged to home.4 Ng and colleagues studied a group of 200 patients who received IRF care and found there was significant improvement in function. Ninety-four percent of patients rated their stay as either extremely good or very good.5
Metastasis to the spine is a common problem. It is found in 30% of cancer patients at autopsy. The most common sources of metastasis to the spine are breast, lung, prostate, kidney, and thyroid.18 Multiple myeloma and lymphoma may also involve the spine. Several authors have shown that these patients benefit from inpatient rehabilitation. Mckinley and colleagues19 have noted that patients with metastasis to the spine make significant improvement with care at an IRF. Compared with patients with a traumatic spinal cord injury, the cancer patients had shorter LoS, smaller improvement in FIM, equal FIM efficiency (FIM gain/LoS), and equal success in making enough progress to be discharged to home.19 Eriks and colleagues showed that patients at an IRF in Amsterdam made significant improvement in function as measured by the Barthel’s Index.20 Tang .,21 and Parsch22 and their respective colleagues, Murray,23 and New24 and colleagues have published findings confirming that patients with spinal cord injury caused by metastasis to the spine make significant progress with inpatient rehabilitation programs. The present study adds to the literature by showing that patients with metastasis to the spine who are receiving radiation can make progress and be discharged to the community.
There are 24,000 new cases of primary malignant brain tumors in the United States each year.25 The incidence of metastatic cancer to the brain has been estimated to be 100,000 cases per year in the United States. The most common cancer sources are lung, breast, melanoma, kidney, and colon.26,27 The first study of patients admitted to an IRF for treatment of brain tumors was published in 1998 by Huang and colleagues28 who compared the outcomes of 63 patients with brain tumors with the outcomes of 63 patients with stroke. They reported that the patients with the brain tumors made significant improvement in function. There was not a significant difference between the 2 groups of patients in improvement in function, FIM efficiency, or success in discharging the patients to home.28 Greenberg29 and Bartolo30 and their respective colleagues compared the outcomes of patients admitted with brain tumors and patients with stroke and found that improvement in function and discharge to home was similar in the 2 groups. In 2000, Huang and his same colleagues31 compared a group of patients with brain tumors to a group of patients with traumatic brain injury. They found significant improvement in the function of the patients with brain tumors. Patients in the traumatic brain injury group made more progress but had longer LoS. FIM efficiency was not significantly different between the groups.31
Three papers have reported outcomes of patients who received radiation concurrent with inpatient rehabilitation. Tang and colleagues32 reported 63 patients, of whom 48% percent received radiation concurrent with rehabilitation. The patients who received radiation made significant gains in function, and more than 70% were discharged to home. There was no difference in the outcomes of the patients in the radiation and nonradiation groups.32 Marciniak33 and O’Dell34 and their colleagues also reported that patients with brain tumors that required radiation therapy can benefit from inpatient rehabilitation. The present paper is the fourth (with the largest patient group) to show that patients with primary and metastatic tumors to the brain can benefit from a program that provides radiation concurrent with inpatient rehabilitation. We have shown that patients can achieve functional levels and rates of discharge to home that are not significantly different from those of the most commonly admitted group of patients to IRF – patients with stroke.
In the present study, 18% of all of the cancer patients were transferred to medical services and/or acute hospital care (Table 1). This is consistent with a paper by Asher and colleagues35 who reported that 17.4% of patients at an IRF with a diagnosis of cancer required transfer back to medical service, and that low admission motor FIM score correlated with the likelihood of transfer back to medical service. In the present paper, the total admission FIM score was not related to the likelihood of return to medical service, although a lack of improvement in the FIM score did correlate with transfer to medical service.
All of the papers we reviewed found that appropriately selected patients with cancer make significant improvement in function with treatment at an IRF. Tang and colleagues have also shown that for patients with malignant brain tumors and metastasis to the spine, improvement in function correlates with increased survival.32 Our paper confirms that patients with primary malignant brain tumors, malignant tumors metastatic to the brain or spine, and tumors metastatic to long bones may benefit from rehabilitation concurrent with radiation. Rehabilitation units are traditionally associated with treating patients with stroke and spinal cord injury. The patients in our study had cancer and were receiving radiation therapy. They had significant improvement in function and FIM efficiency scores that are not below the threshold set as expected for care at an IRF. Most patients in our study achieved a functional level consistent with what is needed to go home.
There is a prospective payment or reimbursement system for rehabilitation units.36 The payments are based on the admitting diagnosis, the admission FIM score, the age of the patient, and comorbidities. There are 4 tiers for comorbidities with no additional payments for patients in tier 0 but with additional payments for patients with conditions that qualify for tiers 1 through 3. The highest payments are for patients in tier 1. Examples of conditions that can increase payment include morbid obesity, congestive heart failure, vocal cord paralysis, and the need for hemodialysis. There is no increased payment for provision of radiation therapy. There are no reports on the feasibility, in terms of finances, of providing radiation on an IRF. We asked the finance office of the Albany Medical Center to comment on the cost to the hospital of providing radiation therapy to patients on the rehabilitation unit. The hospital’s finance department reviewed available data and reported that the variable cost of providing radiation therapy is about 6.5% of the revenue collected from third-party payors for caring for patients who receive that service (personal communication from the finance office of Albany Medical Center to George Forrest, 2015). Our findings suggest that the Centers for Medicare & Medicaid Services should make an adjustment to the payment system to support the cost of providing radiation to patients at an IRF. Even under the current payment system, for a hospital that has the equipment and personnel to provide radiation treatments, the variable cost of 6.5% of revenue should not be an absolute barrier to providing this service.
Limitations
This study reports on the experience of only 1 facility. The number of patients in the radiation group is greater than the number of patients in any previous report of people receiving radiation at an IRF, but the statistician does not think it is large enough to allow statistical analysis of covariates such as age, sex, and comorbid conditions. In addition, we did not investigate all of the factors that influence the type of care patients are offered and their LoS, such as hospital policy, insurance coverage, income, and family structure.
Conclusions
Acute care medical units are now challenged to both reduce LoS and reduce the number of patients who are readmitted to the hospital. Rehabilitation units are challenged to maintain census, as government and private payors are shifting patients from acute rehabilitation units to subacute rehabilitation units. We found that patients with cancer who need radiation are a population of patients who are seen by payors as needing to be in a facility with excellent nursing, therapy, and comprehensive physician services. A comprehensive cancer care program within a rehabilitation unit can be a great benefit to the acute care services, the IRF, and, most importantly, patients and their families.
1. American Cancer Society. Cancer facts & figures 2016. Atlanta, GA: American Cancer Society; 2016.
2. National Cancer Institute: Office of cancer survivorship: statistics. https://cancercontrol.cancer.gov/ocs/statistics/statistics.html. Updated October 17, 2016. Accessed April 21, 2018.
3. Lehmann JF, DeLisa JA, Warren CG, deLateur BJ, Bryant PL, Nicholson CG. Cancer rehabilitation: assessment of need, development and evaluation of a model of care. Arch Phys Med Rehabil. 1978;59(9):410-419.
4. Gallegos-Kearin V, Knowlton SE, Goldstein R, et al. Outcome trends of adult cancer patients receiving inpatient rehabilitation: a 13-year review [published online Feb 21, 2018]. Am J Phys Med Rehabil. doi:10.1097/PHM.0000000000000911
5. Ng AH, Gupta E, Fontillas RC, et al. Patient-reported usefulness of acute cancer rehabilitation. PM R. 2017;9(11):1135-1143.
6. Cheville AL, Kornblith AB, Basford JR. An examination of the causes for the underutilization of rehabilitation services among people with advanced cancer. Am J Phys Med Rehabil. 2011;90(5 suppl 1):S27-S37.
7. Cohen ME, Marino RJ. The tools of disability outcomes research functional status measures. Arch Phys Med Rehabil. 2000;81(12 suppl 2):S21-S29.
8. Nguyen VQ, PrvuBettger J, Guerrier T, et al. Factors associated with discharge to home versus discharge to institutional care after inpatient stroke rehabilitation. Arch Phys Med Rehabil. 2015;96(7):1297-1303.
9. Forrest G, Schwam A, Cohen E. Time of care required by patients discharged from a rehabilitation unit. Am J Phys Med Rehabil. 2002;81(1):57-62.
10. Bottemiller KL, Bieber PL, Basford JR, Harris M. FIM scores, FIM efficiency and discharge following inpatient stroke rehabilitation. Rehabil Nurs. 2006;31(1):22-25.
11. Reistetter TA, Graham JE, Deutsch A, Granger CV, Markello S, Ottenbacher KJ. Utility of functional status for classifying community versus institutional discharges after inpatient rehabilitation for stroke. Arch Phys Med Rehabil. 2010;91(3):345-350.
12. Dietz JH Jr. Rehabilitation of the cancer patient. Med Clin North Am. 1969;53(3):607-624.
13. O'Toole DM, Golden AM. Evaluating cancer patients for rehabilitation potential. West J Med. 1991;155(4):384-387.
14. Marciniak CM, Sliwa JA, Spill G, Heinemann AW, Semik PE. Functional outcome following rehabilitation of the cancer patient. Arch Phys Med Rehabil. 1996;77(1):54-57.
15. Hunter EG, Baltisberger J. Functional outcomes by age for inpatient cancer rehabilitation: a retrospective chart review. J Appl Gerontol. 2013;32(4):443-456.
16. Shin KY, Guo Y, Konzen B, Fu J, Yadav R, Bruera E. Inpatient cancer rehabilitation: the experience of a national comprehensive cancer center. Am J Phys Med Rehabil. 2011;90(5 suppl 1):S63-S68.
17. Cole RP, Scialla S, Bednarz L. Functional recovery in cancer rehabilitation. Arch Phys Med Rehabil. 2000;81(5):623-627.
18. White AP, Kwon BK, Lindskog DM, Friedlaender GE, Grauer JN. Metastatic disease of the spine. J Am Acad Orthop Surg. 2006;14(11):587-598.
19. McKinley WO, Huang ME, Tewksbury MA. Neoplastic vs traumatic spinal cord injury: an inpatient rehabilitation comparison. Am J Phys Med Rehabil. 2000;79(2):138-144.
20. Eriks IE, Angenot EL, Lankhorst GJ. Epidural metastatic spinal cord compression: functional outcome and survival after inpatient rehabilitation. Spinal Cord. 2004;42(4):235-239.
21. Tang V, Harvey D, Park Dorsay J, Jiang S, Rathbone MP. Prognostic indicators in metastatic spinal cord compression: using functional independence measure and Tokuhashi scale to optimize rehabilitation planning. Spinal Cord. 2007;45(10):671-677.
22. Parsch D, Mikut R, Abel R. Postacute management of patients with spinal cord injury due to metastatic tumor disease: survival and efficacy of rehabilitation. Spinal Cord. 2003;41:205-210.
23. Murray PK. Functional outcome and survival in spinal cord injury secondary to neoplasia. Cancer. 1985;55:197-201.
24. New PW. Functional outcomes and disability after nontraumatic spinal cord injury rehabilitation: results from a retrospective study. Arch Phys Med Rehabil. 2005;86(2):250-261
25. Central Brain Tumor Registry of the United States: 2016 CBTRUS fact sheet. www.cbtrus.org/factsheet/factsheet.html. Updated 2017. Accessed May 28, 2016.
26. Memorial Sloan Kettering Cancer Center: Metastatic brain tumors & secondary brain cancer. https://www.mskcc.org/cancer-care/types/brain-tumors-metastatic. Updated 2018. Accessed April 21, 2018.
27. Bruckner JC, Brown PD, O'Neill BP, Meyer FB, Wetmore CJ, Uhm JH. Central nervous system tumors. Mayo Clin Proc. 2007;82(10):1271-1286.
28. Huang ME, Cifu DX, Keyser-Marcus L. Functional outcome after brain tumor and acute stroke: a comparative analysis. Arch Phys Med Rehabil. 1998;79(11):1386-1390.
29. Greenberg E, Treger I, Ring H. Rehabilitation outcomes in patients with brain tumors and acute stroke: comparative study of inpatient rehabilitation. Am J Phys Med Rehabil. 2006;85(7):568-573.
30. Bartolo M, Zucchella C, Pace A, et al. Early rehabilitation after surgery improves functional outcomes in inpatients with brain tumours. J Neurooncol. 2012;107(3);537-544.
31. Huang ME, Cifu DX, Keyser-Marcus L. Functional outcomes in patients with brain tumor after inpatient rehabilitation: comparison with traumatic brain injury. Am J Phys Med Rehabil. 2000;79(4):327-335.
32. Tang V, Rathbone M, Park Dorsay J, Jiang S, Harvey D. Rehabilitation in primary and metastatic brain tumours: impact of functional outcomes on survival. J Neurol. 2008;255(6):820-827.
33. Marciniak CM, Sliwa JA, Heinemann AW, Semik PE. Functional outcomes of persons with brain tumors after inpatient rehabilitation. Arch Phys Med Rehabil. 2001;82(4):457-463.
34. O'Dell MW, Barr K, Spanier D, Warnick RE. Functional outcome of inpatient rehabilitation in persons with brain tumors. Arch Phys Med Rehabil. 1998;79(12):1530-1534.
35. Asher A, Roberts PS, Bresee C, Zabel G, Riggs RV, Rogatko A. Transferring inpatient rehabilitation facility cancer patients back to acute care (TRIPBAC). PM R. 2014;6(9):808-813.
36. Centers for Medicare and Medicaid Services: Inpatient rehabilitation facilities. https://www.cms.gov/Medicare/Provider-Enrollment-and-Certification/CertificationandComplianc/InpatientRehab.html. Published March 5, 2012. Accessed May 21, 2018.
The American Cancer Society reports that 1.6 million people are diagnosed with cancer each year, of whom 78% are aged 55 years or older. The 5-year survival rate for cancer is 68%.1 Almost 15.5 million living Americans have been diagnosed with cancer.2 Many patients with cancer have difficulty walking and with activities of daily living. Patients with primary brain tumors or tumors metastatic to the brain may present with focal weakness or cognitive deficits similar to patients with stroke. Patients with tumors metastatic to the spine may have the same deficits as a patient with a traumatic spinal cord injury. Patients with metastasis to bone may have pathologic fractures of the hip or long bones. Patients may develop peripheral neuropathy associated with a paraneoplastic syndrome, chemotherapy, or critical illness neuropathy. Lehmann and colleagues evaluated 805 patients admitted to hospitals affiliated with the University of Washington Medical School with a diagnosis of cancer and found that 15% had difficulty walking and 20% had difficulty with activities of daily living.3
Many patients with cancer can benefit from inpatient rehabilitation.4,5 Study findings have shown that patients with impairments in function related to cancer are often not referred for rehabilitation. Among the reasons mentioned for that are that oncologists are more focused on treating the patients’ cancer than on their functional deficits and that specialists in rehabilitation medicine do not want to be involved with patients with complex medical problems. Rehabilitation facilities may not want to incur the costs associated with caring for patients with cancer.6
The present paper looks at the outcomes of 61 consecutive patients with cancer who were admitted to an inpatient rehabilitation facility (IRF) and received radiation therapy concurrent with rehabilitation. It compares the outcomes of the cancer patients with the outcomes of patients without cancer who were admitted with stroke or spinal cord injury, conditions more commonly treated at an IRF.
Methods
We reviewed electronic medical records of all patients with cancer admitted to the IRF from 2008 through 2013 who received radiation therapy while at the facility. We also reviewed the data of all patients without cancer admitted with a diagnosis of stroke in 2013 and all patients admitted with a diagnosis of traumatic spinal cord injury in 2012 and 2013. No patients were excluded from stroke and traumatic spinal cord injury groups.
We recorded the sex, age, diagnostic group, Functional Independence Measure (FIM) admission score, FIM discharge score, length of stay (LoS) in the IRF, place of discharge of each patient (eg, home, acute care, or subacute care), and calculated the FIM efficiency score (change in FIM/LoS) for each patient. The FIM is an instrument that has 18 items measuring mobility, participation in activities of daily living, ability to communicate, and cognitive function.7 Each item is scored from 1 to 7, with 1 denoting that the patient cannot perform the task and 7 that the activity can be performed independently. The minimum score is 18 (complete dependence), and the maximum score is 126 (independent function). Thirteen items compose the motor FIM score: eating, grooming, bathing, dressing upper body, dressing lower body, toileting, bladder management, management of bowel, transfer to bed or wheelchair, transfer to toilet, tub transfer, walking (or wheelchair use), and climbing stairs. Five items – comprehension, expression, social interaction, problem solving, and memory – compose the cognitive FIM score.
We used a 1-way analysis of variance to evaluate differences between age and cancer type, age and diagnostic group, admission FIM score and cancer type, discharge FIM score and cancer type, change in FIM and cancer type, LoS and cancer type, and LoS and diagnostic group. The Pearson chi-square test was used to test the goodness of fit between the place of disposition and diagnostic group. The paired t test was used to evaluate the improvement in FIM of the patients who were in the cancer groups. The Tukey Simultaneous Tests for Differences of Means was used to compare the FIM efficiency scores of the groups. A 2-sample t test was used to evaluate the factors associated with the need for transfer from the IRF to the acute medical service.
Results
The demographic characteristics of the patients in the study and the admission and discharge FIM scores are reported in Table 1. There were initially 62 cancer patients in the radiation group, which was further divided into 4 subgroups based on the site of the primary tumor or metastasis. In all, 23 had a primary malignant brain tumor and received radiation and temozolomide. Sixteen patients had malignancies metastatic to the brain, 15 patients had tumors metastatic to the spine, and 7 had tumors metastatic to the long bones. One patient had laryngeal cancer and was excluded from the study because we did not think that we could do an analysis of a group with only 1 patient. The final number of patients in the cancer group was therefore 61. There were 69 patients in the stroke group and 23 in the spinal cord injury group.
We report improvement in total FIM, motor FIM, and cognitive FIM scores and were able to identify all 18 of the items of the FIM score on 60 of the 61 patients in the cancer group. Improvement in total FIM of the 61 patients in the cancer groups was significant at P P P = .05. Just over 75% of the patients in the cancer group had sufficient enough improvement in their level of function that they were able to return to their homes (Table 1). The average FIM score at the time of discharge was 83.08. This was not significantly different than the level of function of patients discharged after stroke (87.52) or traumatic spinal cord injury (89.13).
The patients with primary brain tumors were younger than the patients with cancer metastatic to the brain (P = .013). The patients with a primary brain tumor had lower admission FIM scores than patients with tumors metastatic to the brain (P = .027). The patients with a primary brain tumor had a greater increase in FIM score than patients with metastasis to the brain (P = .043; Table 2). There was not a significant difference between these 2 groups in FIM score at discharge or in the likelihood of discharge to home (Table 1). The FIM efficiency score was 1.12 for the patients in the primary brain tumor group and .80 in those with metastasis to the brain. This difference was not significant P = .96.
There were 69 patients in the stroke group. We compared the 39 patients with primary or metastatic brain lesion to the stroke group. The patients with primary or metastatic cancer of the brain were younger than the patients with stroke, 60.4 years old versus 69.1 years old (P = .004). The patients in the combined cancer group had a higher admission FIM score compared with the stroke patients (68.4 vs 63.12; P = .05). The discharge FIM scores were 83.3 in the combined cancer group and 87.5 in the stroke group (Table 1). This difference was not significant, but the improvement in the combined cancer group (14.6) was less than the improvement in the stroke group (24.40; P = .002) (Table 3).
The average LoS in the IRF was 18.7 days in the combined cancer group and 16.8 days in the stroke group. This difference was not significant. An average of 82% of the patients in the primary tumor or brain metastasis group and 85.5% of the patients in the stroke group were discharged to home. This difference was not significant. The FIM efficiency score of the patients in the stroke group was 2.0. This was significantly greater than the score for the patients in the metastasis to the brain group (0.80; P = .044) but not significantly greater than the primary brain cancer group (1.19; P = .22).
There were 23 patients in the traumatic spinal cord injury group. A comparison of the patients with tumors metastatic to the spine and patients with traumatic spinal cord injury showed that the patients in the cancer group were older (60.27 and 42.70 years, respectively; P = .001). In all, 80% of patients with tumors metastatic to the spine were men. This was not significantly different from the percentage of men in the traumatic spinal cord injury group (82.6%; Table 1). The admission FIM score of the patients with cancer was 66.5 (standard deviation [SD], 13.3) and 58.03 (SD, 15.1) in the patients with a traumatic spinal cord injury (Table 1). The FIM score at discharge was 80.4 (SD, 19.1) in the patients with cancer and 89.1 (SD, 20.3) in the patients with a traumatic spinal cord injury (Table 1). Neither of these were statistically significant. The improvement in patients with cancer was 13.9 (SD, 12.2) and 31.1 (SD, 13.9) in the traumatic spinal cord injured patients. This difference was significant (P
The median LoS was 18.98 days in the cancer metastasis to spine group (interquartile range [IQR] is the 25th-75th percentile, 12-30 days). In the traumatic group the median LoS was 23 days (IQR, 16-50 days). This difference was not significant (P = .14 Mann-Whitney test). The mean FIM efficiency score was 1.46 in the traumatic spinal cord injury group and .78 in the group with cancer metastatic to the spine. This difference was not significant (P = .72). Sixty percent of the patients in the cancer group were discharged to home, and 87% of patients in the traumatic spinal cord group were discharged to home. This difference was not significant (P = .12; Fisher exact test).
As far as we can ascertain, this is the first paper that has looked at the outcomes of patients receiving rehabilitation concurrent with radiation of the long bones. The average improvement in FIM was 12.4 (Table 1). The LoS was 11.6 days, and the FIM efficiency was 1.25. In all, 71.4% made enough progress to go home.
Of the total number of cancer patients, 18% were transferred to the acute medical service of the hospital (Table 1). Neither age, sex, type of cancer, nor admission FIM score were associated with the need for transfer to acute hospital care. Change in FIM score was inversely associated with transfer to acute hospital care (P = .027). Patients whose function did not improve with rehabilitation were most likely to be transferred back to acute hospital care.
Discussion
Radiation therapy is considered a service that is provided to people who come for treatment as an outpatient. Caregivers may have difficulty transporting patients to radiation if the patient has deficits in mobility. This may be particularly true if the patient is heavy, the caregivers are frail, or perhaps if they live in rural settings where there is no wheelchair-accessible public transportation. There are many factors that help determine whether a patient with functional deficits can be discharged to his or her home. These include sex, age, marital status, family and/or community support, income, and insurance.8 The FIM is an instrument that indicates how much help a patient needs with mobility and self-care skills. It also correlates with the amount of time that caregivers must spend helping a patient.9 Study findings have shown that the FIM score is an important determinant of whether a patient can be discharged to home. The total FIM score is as useful as an analysis of the components of the FIM score in predicting whether a patient can return to the community.10,11 Reistetter and colleagues found a total FIM score of 78 to be the score that best separates patients who are likely to be able to go home and patients who are likely to need long-term care.11 Bottemiller and colleagues10 reported that 37% of patients with total discharge FIM scores of less than 40 were discharged to home. They reported that 62% of patients with FIM scores between 40 and 79 were discharged to home, and 88% of patients with scores of 80 or above were discharged to home.10 The goal in bringing patients to the IRF was to accept and treat patients with reasonable community support and potential to achieve a functional level compatible with discharge to the community. Most patients in each of the cancer groups were able to reach an FIM score of 78 to 80 and to be discharged to home.
Most of the patients in the cancer groups had underlying problems that are not considered curable. The primary goal was to enable the patients to have some time at home with their families before requiring readmission to a hospital or hospice care. Reasonable LoS and rate of progress are now expected or required by third-party payors and hospital administrators. Physicians at the Mayo Clinic have indicated that a rehabilitation service should aim for an FIM efficiency score of at least .6 points per day.10 The FIM efficiency of patients in each of the 4 cancer subgroups in this study was higher than this level.
J. Herbert Dietz, Jr was an early advocate of the need to provide comprehensive rehabilitation services for patients with cancer. He first described his work in 1969.12 Since that time, there have been many papers that have documented the benefits of IRF for patients with cancer. O’Toole and Golden have shown outcomes of a large series of patients from an IRF. They reported that at the time of admission, 14% of patients could ambulate, but at discharge, 80% could ambulate without hands-on assistance. They reported significant improvements in continence, FIM score, and score on the Karnofsky Performance Scale.13 Marciniak,14 Hunter,15 Shin,16 and Cole,17 and their respective colleagues have all shown that patients with many different types of cancer benefit from rehabilitation at the IRF level. Gallegos-Kearin and colleagues4 reported on the care of 115,570 patients admitted to IRF with cancer from 2002 to 2014. Patients had significant improvement in function, with more than 70% of patients discharged to home.4 Ng and colleagues studied a group of 200 patients who received IRF care and found there was significant improvement in function. Ninety-four percent of patients rated their stay as either extremely good or very good.5
Metastasis to the spine is a common problem. It is found in 30% of cancer patients at autopsy. The most common sources of metastasis to the spine are breast, lung, prostate, kidney, and thyroid.18 Multiple myeloma and lymphoma may also involve the spine. Several authors have shown that these patients benefit from inpatient rehabilitation. Mckinley and colleagues19 have noted that patients with metastasis to the spine make significant improvement with care at an IRF. Compared with patients with a traumatic spinal cord injury, the cancer patients had shorter LoS, smaller improvement in FIM, equal FIM efficiency (FIM gain/LoS), and equal success in making enough progress to be discharged to home.19 Eriks and colleagues showed that patients at an IRF in Amsterdam made significant improvement in function as measured by the Barthel’s Index.20 Tang .,21 and Parsch22 and their respective colleagues, Murray,23 and New24 and colleagues have published findings confirming that patients with spinal cord injury caused by metastasis to the spine make significant progress with inpatient rehabilitation programs. The present study adds to the literature by showing that patients with metastasis to the spine who are receiving radiation can make progress and be discharged to the community.
There are 24,000 new cases of primary malignant brain tumors in the United States each year.25 The incidence of metastatic cancer to the brain has been estimated to be 100,000 cases per year in the United States. The most common cancer sources are lung, breast, melanoma, kidney, and colon.26,27 The first study of patients admitted to an IRF for treatment of brain tumors was published in 1998 by Huang and colleagues28 who compared the outcomes of 63 patients with brain tumors with the outcomes of 63 patients with stroke. They reported that the patients with the brain tumors made significant improvement in function. There was not a significant difference between the 2 groups of patients in improvement in function, FIM efficiency, or success in discharging the patients to home.28 Greenberg29 and Bartolo30 and their respective colleagues compared the outcomes of patients admitted with brain tumors and patients with stroke and found that improvement in function and discharge to home was similar in the 2 groups. In 2000, Huang and his same colleagues31 compared a group of patients with brain tumors to a group of patients with traumatic brain injury. They found significant improvement in the function of the patients with brain tumors. Patients in the traumatic brain injury group made more progress but had longer LoS. FIM efficiency was not significantly different between the groups.31
Three papers have reported outcomes of patients who received radiation concurrent with inpatient rehabilitation. Tang and colleagues32 reported 63 patients, of whom 48% percent received radiation concurrent with rehabilitation. The patients who received radiation made significant gains in function, and more than 70% were discharged to home. There was no difference in the outcomes of the patients in the radiation and nonradiation groups.32 Marciniak33 and O’Dell34 and their colleagues also reported that patients with brain tumors that required radiation therapy can benefit from inpatient rehabilitation. The present paper is the fourth (with the largest patient group) to show that patients with primary and metastatic tumors to the brain can benefit from a program that provides radiation concurrent with inpatient rehabilitation. We have shown that patients can achieve functional levels and rates of discharge to home that are not significantly different from those of the most commonly admitted group of patients to IRF – patients with stroke.
In the present study, 18% of all of the cancer patients were transferred to medical services and/or acute hospital care (Table 1). This is consistent with a paper by Asher and colleagues35 who reported that 17.4% of patients at an IRF with a diagnosis of cancer required transfer back to medical service, and that low admission motor FIM score correlated with the likelihood of transfer back to medical service. In the present paper, the total admission FIM score was not related to the likelihood of return to medical service, although a lack of improvement in the FIM score did correlate with transfer to medical service.
All of the papers we reviewed found that appropriately selected patients with cancer make significant improvement in function with treatment at an IRF. Tang and colleagues have also shown that for patients with malignant brain tumors and metastasis to the spine, improvement in function correlates with increased survival.32 Our paper confirms that patients with primary malignant brain tumors, malignant tumors metastatic to the brain or spine, and tumors metastatic to long bones may benefit from rehabilitation concurrent with radiation. Rehabilitation units are traditionally associated with treating patients with stroke and spinal cord injury. The patients in our study had cancer and were receiving radiation therapy. They had significant improvement in function and FIM efficiency scores that are not below the threshold set as expected for care at an IRF. Most patients in our study achieved a functional level consistent with what is needed to go home.
There is a prospective payment or reimbursement system for rehabilitation units.36 The payments are based on the admitting diagnosis, the admission FIM score, the age of the patient, and comorbidities. There are 4 tiers for comorbidities with no additional payments for patients in tier 0 but with additional payments for patients with conditions that qualify for tiers 1 through 3. The highest payments are for patients in tier 1. Examples of conditions that can increase payment include morbid obesity, congestive heart failure, vocal cord paralysis, and the need for hemodialysis. There is no increased payment for provision of radiation therapy. There are no reports on the feasibility, in terms of finances, of providing radiation on an IRF. We asked the finance office of the Albany Medical Center to comment on the cost to the hospital of providing radiation therapy to patients on the rehabilitation unit. The hospital’s finance department reviewed available data and reported that the variable cost of providing radiation therapy is about 6.5% of the revenue collected from third-party payors for caring for patients who receive that service (personal communication from the finance office of Albany Medical Center to George Forrest, 2015). Our findings suggest that the Centers for Medicare & Medicaid Services should make an adjustment to the payment system to support the cost of providing radiation to patients at an IRF. Even under the current payment system, for a hospital that has the equipment and personnel to provide radiation treatments, the variable cost of 6.5% of revenue should not be an absolute barrier to providing this service.
Limitations
This study reports on the experience of only 1 facility. The number of patients in the radiation group is greater than the number of patients in any previous report of people receiving radiation at an IRF, but the statistician does not think it is large enough to allow statistical analysis of covariates such as age, sex, and comorbid conditions. In addition, we did not investigate all of the factors that influence the type of care patients are offered and their LoS, such as hospital policy, insurance coverage, income, and family structure.
Conclusions
Acute care medical units are now challenged to both reduce LoS and reduce the number of patients who are readmitted to the hospital. Rehabilitation units are challenged to maintain census, as government and private payors are shifting patients from acute rehabilitation units to subacute rehabilitation units. We found that patients with cancer who need radiation are a population of patients who are seen by payors as needing to be in a facility with excellent nursing, therapy, and comprehensive physician services. A comprehensive cancer care program within a rehabilitation unit can be a great benefit to the acute care services, the IRF, and, most importantly, patients and their families.
1. American Cancer Society. Cancer facts & figures 2016. Atlanta, GA: American Cancer Society; 2016.
2. National Cancer Institute: Office of cancer survivorship: statistics. https://cancercontrol.cancer.gov/ocs/statistics/statistics.html. Updated October 17, 2016. Accessed April 21, 2018.
3. Lehmann JF, DeLisa JA, Warren CG, deLateur BJ, Bryant PL, Nicholson CG. Cancer rehabilitation: assessment of need, development and evaluation of a model of care. Arch Phys Med Rehabil. 1978;59(9):410-419.
4. Gallegos-Kearin V, Knowlton SE, Goldstein R, et al. Outcome trends of adult cancer patients receiving inpatient rehabilitation: a 13-year review [published online Feb 21, 2018]. Am J Phys Med Rehabil. doi:10.1097/PHM.0000000000000911
5. Ng AH, Gupta E, Fontillas RC, et al. Patient-reported usefulness of acute cancer rehabilitation. PM R. 2017;9(11):1135-1143.
6. Cheville AL, Kornblith AB, Basford JR. An examination of the causes for the underutilization of rehabilitation services among people with advanced cancer. Am J Phys Med Rehabil. 2011;90(5 suppl 1):S27-S37.
7. Cohen ME, Marino RJ. The tools of disability outcomes research functional status measures. Arch Phys Med Rehabil. 2000;81(12 suppl 2):S21-S29.
8. Nguyen VQ, PrvuBettger J, Guerrier T, et al. Factors associated with discharge to home versus discharge to institutional care after inpatient stroke rehabilitation. Arch Phys Med Rehabil. 2015;96(7):1297-1303.
9. Forrest G, Schwam A, Cohen E. Time of care required by patients discharged from a rehabilitation unit. Am J Phys Med Rehabil. 2002;81(1):57-62.
10. Bottemiller KL, Bieber PL, Basford JR, Harris M. FIM scores, FIM efficiency and discharge following inpatient stroke rehabilitation. Rehabil Nurs. 2006;31(1):22-25.
11. Reistetter TA, Graham JE, Deutsch A, Granger CV, Markello S, Ottenbacher KJ. Utility of functional status for classifying community versus institutional discharges after inpatient rehabilitation for stroke. Arch Phys Med Rehabil. 2010;91(3):345-350.
12. Dietz JH Jr. Rehabilitation of the cancer patient. Med Clin North Am. 1969;53(3):607-624.
13. O'Toole DM, Golden AM. Evaluating cancer patients for rehabilitation potential. West J Med. 1991;155(4):384-387.
14. Marciniak CM, Sliwa JA, Spill G, Heinemann AW, Semik PE. Functional outcome following rehabilitation of the cancer patient. Arch Phys Med Rehabil. 1996;77(1):54-57.
15. Hunter EG, Baltisberger J. Functional outcomes by age for inpatient cancer rehabilitation: a retrospective chart review. J Appl Gerontol. 2013;32(4):443-456.
16. Shin KY, Guo Y, Konzen B, Fu J, Yadav R, Bruera E. Inpatient cancer rehabilitation: the experience of a national comprehensive cancer center. Am J Phys Med Rehabil. 2011;90(5 suppl 1):S63-S68.
17. Cole RP, Scialla S, Bednarz L. Functional recovery in cancer rehabilitation. Arch Phys Med Rehabil. 2000;81(5):623-627.
18. White AP, Kwon BK, Lindskog DM, Friedlaender GE, Grauer JN. Metastatic disease of the spine. J Am Acad Orthop Surg. 2006;14(11):587-598.
19. McKinley WO, Huang ME, Tewksbury MA. Neoplastic vs traumatic spinal cord injury: an inpatient rehabilitation comparison. Am J Phys Med Rehabil. 2000;79(2):138-144.
20. Eriks IE, Angenot EL, Lankhorst GJ. Epidural metastatic spinal cord compression: functional outcome and survival after inpatient rehabilitation. Spinal Cord. 2004;42(4):235-239.
21. Tang V, Harvey D, Park Dorsay J, Jiang S, Rathbone MP. Prognostic indicators in metastatic spinal cord compression: using functional independence measure and Tokuhashi scale to optimize rehabilitation planning. Spinal Cord. 2007;45(10):671-677.
22. Parsch D, Mikut R, Abel R. Postacute management of patients with spinal cord injury due to metastatic tumor disease: survival and efficacy of rehabilitation. Spinal Cord. 2003;41:205-210.
23. Murray PK. Functional outcome and survival in spinal cord injury secondary to neoplasia. Cancer. 1985;55:197-201.
24. New PW. Functional outcomes and disability after nontraumatic spinal cord injury rehabilitation: results from a retrospective study. Arch Phys Med Rehabil. 2005;86(2):250-261
25. Central Brain Tumor Registry of the United States: 2016 CBTRUS fact sheet. www.cbtrus.org/factsheet/factsheet.html. Updated 2017. Accessed May 28, 2016.
26. Memorial Sloan Kettering Cancer Center: Metastatic brain tumors & secondary brain cancer. https://www.mskcc.org/cancer-care/types/brain-tumors-metastatic. Updated 2018. Accessed April 21, 2018.
27. Bruckner JC, Brown PD, O'Neill BP, Meyer FB, Wetmore CJ, Uhm JH. Central nervous system tumors. Mayo Clin Proc. 2007;82(10):1271-1286.
28. Huang ME, Cifu DX, Keyser-Marcus L. Functional outcome after brain tumor and acute stroke: a comparative analysis. Arch Phys Med Rehabil. 1998;79(11):1386-1390.
29. Greenberg E, Treger I, Ring H. Rehabilitation outcomes in patients with brain tumors and acute stroke: comparative study of inpatient rehabilitation. Am J Phys Med Rehabil. 2006;85(7):568-573.
30. Bartolo M, Zucchella C, Pace A, et al. Early rehabilitation after surgery improves functional outcomes in inpatients with brain tumours. J Neurooncol. 2012;107(3);537-544.
31. Huang ME, Cifu DX, Keyser-Marcus L. Functional outcomes in patients with brain tumor after inpatient rehabilitation: comparison with traumatic brain injury. Am J Phys Med Rehabil. 2000;79(4):327-335.
32. Tang V, Rathbone M, Park Dorsay J, Jiang S, Harvey D. Rehabilitation in primary and metastatic brain tumours: impact of functional outcomes on survival. J Neurol. 2008;255(6):820-827.
33. Marciniak CM, Sliwa JA, Heinemann AW, Semik PE. Functional outcomes of persons with brain tumors after inpatient rehabilitation. Arch Phys Med Rehabil. 2001;82(4):457-463.
34. O'Dell MW, Barr K, Spanier D, Warnick RE. Functional outcome of inpatient rehabilitation in persons with brain tumors. Arch Phys Med Rehabil. 1998;79(12):1530-1534.
35. Asher A, Roberts PS, Bresee C, Zabel G, Riggs RV, Rogatko A. Transferring inpatient rehabilitation facility cancer patients back to acute care (TRIPBAC). PM R. 2014;6(9):808-813.
36. Centers for Medicare and Medicaid Services: Inpatient rehabilitation facilities. https://www.cms.gov/Medicare/Provider-Enrollment-and-Certification/CertificationandComplianc/InpatientRehab.html. Published March 5, 2012. Accessed May 21, 2018.
FDA approves long-acting ESA for dialysis-related anemia in children, adolescents
The patients aged 5-17 years with chronic kidney disease whose hemoglobin had been stabilized with an erythropoiesis-stimulating agent (ESA).

Efficacy was based partly on how well target hemoglobin levels were maintained in this trial, but also on extrapolation from results of trials in adults. The safety profile in these pediatric patients was consistent with those previously observed in adults. Mircera is manufactured by Vifor Pharma.
More information on the approval of Mircera in this population can be found in the FDA release. The prescribing information for Mircera, initially approved in 2007, has also been updated.
The patients aged 5-17 years with chronic kidney disease whose hemoglobin had been stabilized with an erythropoiesis-stimulating agent (ESA).
Efficacy was based partly on how well target hemoglobin levels were maintained in this trial, but also on extrapolation from results of trials in adults. The safety profile in these pediatric patients was consistent with those previously observed in adults. Mircera is manufactured by Vifor Pharma.
More information on the approval of Mircera in this population can be found in the FDA release. The prescribing information for Mircera, initially approved in 2007, has also been updated.
Does Oral Chemotherapy Venetoclax Combined with Rituximab Improve Survival in Patients with Relapsed or Refractory Chronic Lymphocytic Leukemia?
Study Overview
Objective. To assess whether a combination of venetoclax with rituximab, compared to standard chemoimmunotherapy (bendamustine with rituximab), improves outcomes in patients with relapsed or refractory chronic lymphocytic leukemia.
Design. International, randomized, open-label, phase 3 clinical trial (MURANO).
Setting and participants. Patients were eligilble for the study if they were 18 years of age or older with a diagnosis of relapsed or refractory chronic lymphocytic leukemia that required therapy, and had received 1 to 3 previous treatments (including at least 1 chemotherapy-containing regimen), had an Eastern Cooperative Oncology Group performance status score of 0 or 1, and had adequate bone marrow, renal, and hepatic function. Patients were randomly assigned either to receive venetoclax plus rituximab or bendamustine plus rituximab. Randomization was stratified by geographic region, responsiveness to previous therapy, as well as the presence or absence of chromosome 17p deletion.
Main outcome measures. Primary outcome was investigator-assessed progression-free survival, which was defined as the time from randomization to the first occurrence of disease progression or relapse or death from any cause, whichever occurs first. Secondary efficacy endpoints included independent review committee-assessed progression-free survival (stratified by chromosome 17p deletion), independent review committee-assessed overall response rate and complete response rate, overall survival, rates of clearance of minimal residual disease, the duration of response, event-free survival, and the time to the next treatment for chronic lymphocytic leukemia.
Main results. From 31 March 2014 to 23 September 2015, a total of 389 patients were enrolled at 109 sites in 20 countries and were randomly assigned to receive venetoclax plus rituximab (n = 194), or bendamustine plus rituximab (n = 195). Median age was 65 years (range, 22–85) and a majority of the patients (73.8%) were men. Overall, the demographic and disease characteristics of the 2 groups were similar at baseline.
The median follow-up period was 23.8 months (range, 0–37.4). The median investigator-assessed progression-free survival was significantly longer in the venetoclax-rituximab group (median progression-free survival not reached, 32 events of progression or death in 194 patients) and was 17 months in the bendamustine-rituximab group (114 events in 195 patients). The 2-year rate of investigator-assessed progression-free survival was 84.9% (95% confidence interval [CI] 79.1–90.5) in the venetoclax-rituximab group and 36.3% (95% CI 28.5–44.0) in the bendamustine-rituximab group (hazard ratio for progression or death, 0.17; 95% CI 0.11 to 0.25; P < 0.001). Benefit was consistent in favor of the venetoclax-rituximab group in all prespecified subgroup analyses, with or without chromosome 17p deletion.
The rate of overall survival was higher in the venetoclax-rituximab group than in the bendamustine-rituximab group, with 24-month rates of 91.9% and 86.6%, respectively (hazard ratio 0.58, 95% CI 0.25–0.90). Assessments of minimal residual disease were available for 366 of the 389 patients (94.1%). On the basis of peripheral-blood samples, the venetoclax-rituximab group had a higher minimal residual disease compared to the bendamustine-rituximab group (121 of 194 patients [62.4%] vs. 26 of 195 patients [13.3%]). In bone marrow aspirate, higher rates of clearance of minimal residual disease was seen in the venetoclax-rituximab group (53 of 194 patients [27.3%]) as compared to the bendamustine-rituximab group (3 of 195 patients [1.5%]).
In terms of safety, the most common adverse event reported was neutropenia (60.8% of the patients in the venetoclax-rituximab group vs. 44.1% of the patients in the bendamustine-rituximab group). This contributed to the overall higher grade 3 or 4 adverse event rate in the venetoclax-rituximab group (159 of the 194 patients, or 82.0%) as compared to the bendamustine-rituximab group (132 of 188 patients, or 70.2%). The incidence of serious adverse events, as well as adverse events that resulted in death were similar in the 2 groups.
Conclusion. For patients with relapsed or refractory chronic lymphocytic leukemia, venetoclax plus rituximab resulted in significantly higher rates of progression-free survival than standard therapy with bendamustine plus rituximab.
Commentary
Despite advances in treatment, chronic lymphocytic leukemia remains incurable with conventional chemoimmunotherapy regimens, and almost all patient relapse after initial therapy. Following relapse of the disease, the goal is to provide durable progression-free survival, which may extend overall survival [1]. In a subset of chronic lymphocytic leukemia patients with deletion or mutation of TP53 loci on chromosome 17p13, their disease responds especially poorly to conventional treatment and they have a median survival of less than 3 years from the time of initiating first treatment.
Apoptosis defines a process of programmed cell death with an extrinsic and intrinsic cellular apoptotic pathway. B-cell lymphoma/leukemia 2 (BCL-2) protein is a key regulator of the intrinsic apoptotic pathway and almost all chronic lymphocytic leukemia cells elude apoptosis through overexpression of BCL-2. Venetoclax is an orally administered, highly selective, potent BCL-2 inhibitor approved by the FDA in 2016 for the treatment of chronic lymphocytic leukemia patients with 17p deletion who have received at least 1 prior therapy [3]. There has been great interest in combining venetoclax with other active agents in chronic lymphocytic leukemia such as chemotherapy, monoclonal antibodies, and B-cell receptor inhibitors. The combination of venetoclax with the CD20 antibody rituximab was found to be able to overcome micro-environment-induced resistance to venetoclax [4].
In this analysis of the phase 3 MURANO trial of venetoclax plus rituximab in relapsed or refractory chronic lymphocytic leukemia by Seymour et al, the authors demonstrated a significantly higher rate of progression-free survival with venetoclax plus rituximab than with standard chemoimmunotherapy bendamustine plus rituximab. In addition, secondary efficacy measures, including the complete response rate, the overall response rate, and overall survival were also higher in the venetoclax plus rituximab than with bendamustine plus rituximab.
There are several limitations of this study. First, this study was terminated early at the time of the data review on 6 September 2017. The independent data monitoring committee recommended that the primary analysis be conducted at that time because the prespecified statistical boundaries for early stopping were crossed for progression-free survival on the basis of stratified log-rank tests. In a letter to the editor, Alexander et al questioned the validity of results when design stages are violated. In immunotherapy trials, progression-free survival curves often separated at later time, rather than as a constant process; this violates the key assumption of proportionality of hazard functions. When the study was terminated early, post hoc confirmatory analyses and evaluations of robustness of the statistical plan could be used; however, prespecified analyses are critical to reproducibility in trials that are meant to be practice-changing [5]. Second, complete response rates were lower when responses was assessed by the independent review committee than when assessed by the investigator. While this represented a certain degree of author bias, the overall results were similar and the effect of venetoclax plus rituximab remain significantly better than bendamustine plus rituximab.
Applications for Clinical Practice
The current study demonstrated that venetoclax is safe and effective when combining with rituximab in the treating of chronic lymphocytic leukemia patients with or without 17p deletion who have received at least one prior therapy. The most common serious adverse event was neutropenia, correlated with tumor lysis syndrome. Careful monitoring, slow dose ramp-up, and adequate prophylaxis can mitigate some of the adverse effects.
—Ka Ming Gordon Ngai, MD, MPH
1. Tam CS, Stilgenbauder S. How best to manage patients with chronic lymphocytic leuekmia with 17p deletion and/or TP53 mutation? Leuk Lymphoma 2015;56:587–93.
2. Zenz T, Eichhorst B, B
3. FDA news release. FDA approves new drug for chronic lymphocytic leukemia in patients with a specific chromosomal abnormality. 11 April 2016. Accessed 9 May 2018 at www.fda.gov/newsevents/newsroom/pressannouncements/ucm495253.htm.
4. Thijssen R, Slinger E, Weller K, et al. Resistance to ABT-199 induced by micro-environmental signals in chronic lymphocytic leukemia can be counteracted by CD20 antibodies or kinase inhibitors. Haematologica 2015;100:e302-e306.
5. Alexander BM, Schoenfeld JD, Trippa L. Hazards of hazard ratios—deviations from model assumptions in immunotherapy. N Engl J Med 2018;378:1158–9.
Study Overview
Objective. To assess whether a combination of venetoclax with rituximab, compared to standard chemoimmunotherapy (bendamustine with rituximab), improves outcomes in patients with relapsed or refractory chronic lymphocytic leukemia.
Design. International, randomized, open-label, phase 3 clinical trial (MURANO).
Setting and participants. Patients were eligilble for the study if they were 18 years of age or older with a diagnosis of relapsed or refractory chronic lymphocytic leukemia that required therapy, and had received 1 to 3 previous treatments (including at least 1 chemotherapy-containing regimen), had an Eastern Cooperative Oncology Group performance status score of 0 or 1, and had adequate bone marrow, renal, and hepatic function. Patients were randomly assigned either to receive venetoclax plus rituximab or bendamustine plus rituximab. Randomization was stratified by geographic region, responsiveness to previous therapy, as well as the presence or absence of chromosome 17p deletion.
Main outcome measures. Primary outcome was investigator-assessed progression-free survival, which was defined as the time from randomization to the first occurrence of disease progression or relapse or death from any cause, whichever occurs first. Secondary efficacy endpoints included independent review committee-assessed progression-free survival (stratified by chromosome 17p deletion), independent review committee-assessed overall response rate and complete response rate, overall survival, rates of clearance of minimal residual disease, the duration of response, event-free survival, and the time to the next treatment for chronic lymphocytic leukemia.
Main results. From 31 March 2014 to 23 September 2015, a total of 389 patients were enrolled at 109 sites in 20 countries and were randomly assigned to receive venetoclax plus rituximab (n = 194), or bendamustine plus rituximab (n = 195). Median age was 65 years (range, 22–85) and a majority of the patients (73.8%) were men. Overall, the demographic and disease characteristics of the 2 groups were similar at baseline.
The median follow-up period was 23.8 months (range, 0–37.4). The median investigator-assessed progression-free survival was significantly longer in the venetoclax-rituximab group (median progression-free survival not reached, 32 events of progression or death in 194 patients) and was 17 months in the bendamustine-rituximab group (114 events in 195 patients). The 2-year rate of investigator-assessed progression-free survival was 84.9% (95% confidence interval [CI] 79.1–90.5) in the venetoclax-rituximab group and 36.3% (95% CI 28.5–44.0) in the bendamustine-rituximab group (hazard ratio for progression or death, 0.17; 95% CI 0.11 to 0.25; P < 0.001). Benefit was consistent in favor of the venetoclax-rituximab group in all prespecified subgroup analyses, with or without chromosome 17p deletion.
The rate of overall survival was higher in the venetoclax-rituximab group than in the bendamustine-rituximab group, with 24-month rates of 91.9% and 86.6%, respectively (hazard ratio 0.58, 95% CI 0.25–0.90). Assessments of minimal residual disease were available for 366 of the 389 patients (94.1%). On the basis of peripheral-blood samples, the venetoclax-rituximab group had a higher minimal residual disease compared to the bendamustine-rituximab group (121 of 194 patients [62.4%] vs. 26 of 195 patients [13.3%]). In bone marrow aspirate, higher rates of clearance of minimal residual disease was seen in the venetoclax-rituximab group (53 of 194 patients [27.3%]) as compared to the bendamustine-rituximab group (3 of 195 patients [1.5%]).
In terms of safety, the most common adverse event reported was neutropenia (60.8% of the patients in the venetoclax-rituximab group vs. 44.1% of the patients in the bendamustine-rituximab group). This contributed to the overall higher grade 3 or 4 adverse event rate in the venetoclax-rituximab group (159 of the 194 patients, or 82.0%) as compared to the bendamustine-rituximab group (132 of 188 patients, or 70.2%). The incidence of serious adverse events, as well as adverse events that resulted in death were similar in the 2 groups.
Conclusion. For patients with relapsed or refractory chronic lymphocytic leukemia, venetoclax plus rituximab resulted in significantly higher rates of progression-free survival than standard therapy with bendamustine plus rituximab.
Commentary
Despite advances in treatment, chronic lymphocytic leukemia remains incurable with conventional chemoimmunotherapy regimens, and almost all patient relapse after initial therapy. Following relapse of the disease, the goal is to provide durable progression-free survival, which may extend overall survival [1]. In a subset of chronic lymphocytic leukemia patients with deletion or mutation of TP53 loci on chromosome 17p13, their disease responds especially poorly to conventional treatment and they have a median survival of less than 3 years from the time of initiating first treatment.
Apoptosis defines a process of programmed cell death with an extrinsic and intrinsic cellular apoptotic pathway. B-cell lymphoma/leukemia 2 (BCL-2) protein is a key regulator of the intrinsic apoptotic pathway and almost all chronic lymphocytic leukemia cells elude apoptosis through overexpression of BCL-2. Venetoclax is an orally administered, highly selective, potent BCL-2 inhibitor approved by the FDA in 2016 for the treatment of chronic lymphocytic leukemia patients with 17p deletion who have received at least 1 prior therapy [3]. There has been great interest in combining venetoclax with other active agents in chronic lymphocytic leukemia such as chemotherapy, monoclonal antibodies, and B-cell receptor inhibitors. The combination of venetoclax with the CD20 antibody rituximab was found to be able to overcome micro-environment-induced resistance to venetoclax [4].
In this analysis of the phase 3 MURANO trial of venetoclax plus rituximab in relapsed or refractory chronic lymphocytic leukemia by Seymour et al, the authors demonstrated a significantly higher rate of progression-free survival with venetoclax plus rituximab than with standard chemoimmunotherapy bendamustine plus rituximab. In addition, secondary efficacy measures, including the complete response rate, the overall response rate, and overall survival were also higher in the venetoclax plus rituximab than with bendamustine plus rituximab.
There are several limitations of this study. First, this study was terminated early at the time of the data review on 6 September 2017. The independent data monitoring committee recommended that the primary analysis be conducted at that time because the prespecified statistical boundaries for early stopping were crossed for progression-free survival on the basis of stratified log-rank tests. In a letter to the editor, Alexander et al questioned the validity of results when design stages are violated. In immunotherapy trials, progression-free survival curves often separated at later time, rather than as a constant process; this violates the key assumption of proportionality of hazard functions. When the study was terminated early, post hoc confirmatory analyses and evaluations of robustness of the statistical plan could be used; however, prespecified analyses are critical to reproducibility in trials that are meant to be practice-changing [5]. Second, complete response rates were lower when responses was assessed by the independent review committee than when assessed by the investigator. While this represented a certain degree of author bias, the overall results were similar and the effect of venetoclax plus rituximab remain significantly better than bendamustine plus rituximab.
Applications for Clinical Practice
The current study demonstrated that venetoclax is safe and effective when combining with rituximab in the treating of chronic lymphocytic leukemia patients with or without 17p deletion who have received at least one prior therapy. The most common serious adverse event was neutropenia, correlated with tumor lysis syndrome. Careful monitoring, slow dose ramp-up, and adequate prophylaxis can mitigate some of the adverse effects.
—Ka Ming Gordon Ngai, MD, MPH
1. Tam CS, Stilgenbauder S. How best to manage patients with chronic lymphocytic leuekmia with 17p deletion and/or TP53 mutation? Leuk Lymphoma 2015;56:587–93.
2. Zenz T, Eichhorst B, B
3. FDA news release. FDA approves new drug for chronic lymphocytic leukemia in patients with a specific chromosomal abnormality. 11 April 2016. Accessed 9 May 2018 at www.fda.gov/newsevents/newsroom/pressannouncements/ucm495253.htm.
4. Thijssen R, Slinger E, Weller K, et al. Resistance to ABT-199 induced by micro-environmental signals in chronic lymphocytic leukemia can be counteracted by CD20 antibodies or kinase inhibitors. Haematologica 2015;100:e302-e306.
5. Alexander BM, Schoenfeld JD, Trippa L. Hazards of hazard ratios—deviations from model assumptions in immunotherapy. N Engl J Med 2018;378:1158–9.
MRD-negative status signals better outcomes in CAR T–treated ALL
CHICAGO – Minimal residual disease (MRD)–negative complete remission was strongly associated with improved survival outcomes in patients with B-cell acute lymphocytic leukemia (ALL) who received CD19 chimeric antigen receptor (CAR) T cells, results of a retrospective study showed.
Allogeneic hematopoietic stem cell transplant (HSCT) appeared to improve both disease-free and overall survival in those patients who had achieved MRD-negative complete remission, according to results of the study, which were presented at the annual meeting of the American Society of Clinical Oncology.
“Based upon our interaction testing, the potential benefit [of transplant] appears to exist in both good-risk and bad-risk patients as identified through multivariate modeling,” said study investigator Kevin Anthony Hay, MD, of Fred Hutchinson Cancer Research Center, Seattle.
In a comment on the results, Sarah Cooley, MD, noted that the benefits of allogeneic transplant were apparent regardless of whether the patients met criteria for the good-risk subgroup, which was defined by levels of lactate dehydrogenase (LDH) and platelets along with exposure to fludarabine as part of the conditioning regimen.
“I think this suggests that the goal at this point is to get patients to an MRD-negative state and to potentially curative transplant,” said Dr. Cooley, director of investigator-initiated research at Masonic Medical Center at the University of Minnesota, Minneapolis.
The retrospective analysis by Dr. Hay and his colleagues included 53 adults with relapsed or refractory ALL who had bone marrow or extramedullary disease at baseline and had received CD19 CAR T cells at or under the maximum tolerated dose at least 1 year prior to this analysis. Of that group, 45 (85%) achieved MRD-negative complete remission.
Those patients who did achieve MRD-negative complete remission had an improved median disease-free survival at 7.6 months versus 0.8 months (P less than .0001) and improved overall survival at 20.0 months versus 5.0 months (P = 0.014).
Most of the MRD-negative patients who relapsed did so within the first 6 months, an observation that led investigators to consider whether factors exist that could predict better outcomes.
In a multivariate analysis, they found three variables associated with disease free survival: higher LDH prior to lymphodepletion (hazard ratio, 1.39), along with higher platelet count prior to lymphodepletion and incorporation of fludarabine into the regimen, with hazard ratios of 0.65 and 0.34, respectively.
Using those three characteristics, investigators grouped patients as “good risk” if they had normal LDH, platelet count at or above 100 prior to lymphodepletion that included fludarabine. The 24-month disease-free survival for good-risk patients was 78%, and overall survival was 86%.
The role of allogeneic HSCT after ALL patients achieved MRD-negative complete remission with CAR T-cell therapy was one of the “major questions in the field,” Dr. Hay said.
In this analysis, Dr. Hay and colleagues found that patients who underwent transplant in MRD-negative complete remission had a 24-month disease free survival and overall survival of 61% and 72%, respectively, both of which were significantly higher than in patients with MRD-negative complete remission who had no transplant.
The disease-free survival benefit was not specific to the good-risk group, according to Dr. Hay, who said an interaction test demonstrated no significant interaction between risk group and allogeneic HSCT after CAR T-cell infusion (P = 0.53).
“This is a very important finding that should be further [studied] in an appropriately designed clinical trial,” Dr. Hay said during an oral presentation of the study results.
Dr. Hay and several coauthors reported financial disclosures related to Juno Therapeutics. Other disclosures reported by study coauthors included Cell Medica, Celgene, Eureka Therapeutics, Genentech/Roche, Gilead Sciences, Kite Pharma, Novartis, and others.
SOURCE: Hay KA. ASCO 2018, Abstract 7005.
REPORTING FROM ASCO 2018
Key clinical point:
Major finding: Patients who achieved MRD-negative complete remission had an improved median disease-free survival at 7.6 months versus 0.8 months (P less than .0001)
Study details: A retrospective analysis including 53 patients with ALL who had bone marrow or extramedullary disease at baseline and had received CD19 CAR T cells at or under the maximum tolerated dose at least 1 year prior to this analysis.
Disclosures: Researchers reported financial ties to Juno Therapeutics, Cell Medica, Celgene, Eureka Therapeutics, Genentech/Roche, Gilead Sciences, Kite Pharma, Novartis, and others.
Source: Hay KA. ASCO 2018, Abstract 7005.
What is causing my patients’ macrocytosis?
A 56-year-old man presents for his annual physical. He brings in blood work done for all employees in his workplace (he is an aerospace engineer), and wants to talk about the lab that has an asterisk by it. All his labs are normal, except that his mean corpuscular volume (MCV) is 101. His hematocrit (HCT) is 42. He has no symptoms and a normal physical exam.
What test or tests would most likely be abnormal?
A. Thyroid-stimulating hormone.
B. Vitamin B12/folate.
C. Testosterone.
D. Gamma-glutamyl-transferase (GGT).
The finding of macrocytosis is fairly common in primary care, estimated to be found in 3% of complete blood count results.1 Most students in medical school quickly learn that vitamin B12 and folate deficiency can cause macrocytic anemias. The standard workups for patients with macrocytosis began and ended with checking vitamin B12 and folate levels, which are usually normal in the vast majority of patients with macrocytosis.
For this patient, the correct answer would be an abnormal GGT, because chronic moderate to heavy alcohol use can raise GGT levels, as well as MCVs.
Dr. David Savage and colleagues evaluated the etiology of macrocytosis in 300 consecutive hospitalized patients with macrocytosis.2 They found that the most common causes were medications, alcohol, liver disease, and reticulocytosis. The study was done in New York and was published in 2000, so zidovudine (AZT) was a common medication cause of the macrocytosis. This medication is much less commonly used today. Zidovudine causes macrocytosis in more than 80% of patients who take it. They also found in the study that very high MCVs (> 120) were most commonly associated with vitamin B12 deficiency.
Dr. Kaija Seppä and colleagues looked at all outpatients who had a blood count done over an 8-month period. A total of 9,527 blood counts were ordered, and 287 (3%) had macrocytosis.1 Further workup was done for 113 of the patients. The most common cause found for macrocytosis was alcohol abuse, in 74 (65%) of the patients (80% of the men and 36% of the women). No cause of the macrocytosis was found in 24 (21%) of the patients.
Dr. A. Wymer and colleagues looked at 2,800 adult outpatients who had complete blood counts. A total of 138 (3.7%) had macrocytosis, with 128 of these patients having charts that could be reviewed.3 A total of 73 patients had a workup for their macrocytosis. Alcohol was the diagnostic cause of the macrocytosis in 47 (64%). Only five of the patients had B12 deficiency (7%).
Dr. Seppä and colleagues also reported on hematologic morphologic features in nonanemic patients with macrocytosis due to alcohol abuse or vitamin B12 deficiency.4 They studied 136 patients with alcohol abuse and normal B12 levels, and 18 patients with pernicious anemia. The combination of a low red cell count or a high red cell distribution width with a normal platelet count was found in 94.4% of the vitamin-deficient patients but in only 14.6% of the abusers.

Pearl:
Dr. Paauw is professor of medicine in the division of general internal medicine at the University of Washington, Seattle, and he serves as third-year medical student clerkship director at the university. Contact Dr. Paauw at [email protected].
References
1. J Stud Alcohol. 1996 Jan;57(1):97-100.
2. Am J Med Sci. 2000 Jun;319(6):343-52.
3. J Gen Intern Med. 1990 May-Jun;5(3):192-7.
4. Alcohol. 1993 Sep-Oct;10(5):343-7.
5. South Med J. 2013 Feb;106(2):121-5.
A 56-year-old man presents for his annual physical. He brings in blood work done for all employees in his workplace (he is an aerospace engineer), and wants to talk about the lab that has an asterisk by it. All his labs are normal, except that his mean corpuscular volume (MCV) is 101. His hematocrit (HCT) is 42. He has no symptoms and a normal physical exam.
What test or tests would most likely be abnormal?
A. Thyroid-stimulating hormone.
B. Vitamin B12/folate.
C. Testosterone.
D. Gamma-glutamyl-transferase (GGT).
The finding of macrocytosis is fairly common in primary care, estimated to be found in 3% of complete blood count results.1 Most students in medical school quickly learn that vitamin B12 and folate deficiency can cause macrocytic anemias. The standard workups for patients with macrocytosis began and ended with checking vitamin B12 and folate levels, which are usually normal in the vast majority of patients with macrocytosis.
For this patient, the correct answer would be an abnormal GGT, because chronic moderate to heavy alcohol use can raise GGT levels, as well as MCVs.
Dr. David Savage and colleagues evaluated the etiology of macrocytosis in 300 consecutive hospitalized patients with macrocytosis.2 They found that the most common causes were medications, alcohol, liver disease, and reticulocytosis. The study was done in New York and was published in 2000, so zidovudine (AZT) was a common medication cause of the macrocytosis. This medication is much less commonly used today. Zidovudine causes macrocytosis in more than 80% of patients who take it. They also found in the study that very high MCVs (> 120) were most commonly associated with vitamin B12 deficiency.
Dr. Kaija Seppä and colleagues looked at all outpatients who had a blood count done over an 8-month period. A total of 9,527 blood counts were ordered, and 287 (3%) had macrocytosis.1 Further workup was done for 113 of the patients. The most common cause found for macrocytosis was alcohol abuse, in 74 (65%) of the patients (80% of the men and 36% of the women). No cause of the macrocytosis was found in 24 (21%) of the patients.
Dr. A. Wymer and colleagues looked at 2,800 adult outpatients who had complete blood counts. A total of 138 (3.7%) had macrocytosis, with 128 of these patients having charts that could be reviewed.3 A total of 73 patients had a workup for their macrocytosis. Alcohol was the diagnostic cause of the macrocytosis in 47 (64%). Only five of the patients had B12 deficiency (7%).
Dr. Seppä and colleagues also reported on hematologic morphologic features in nonanemic patients with macrocytosis due to alcohol abuse or vitamin B12 deficiency.4 They studied 136 patients with alcohol abuse and normal B12 levels, and 18 patients with pernicious anemia. The combination of a low red cell count or a high red cell distribution width with a normal platelet count was found in 94.4% of the vitamin-deficient patients but in only 14.6% of the abusers.
Pearl:
Dr. Paauw is professor of medicine in the division of general internal medicine at the University of Washington, Seattle, and he serves as third-year medical student clerkship director at the university. Contact Dr. Paauw at [email protected].
References
1. J Stud Alcohol. 1996 Jan;57(1):97-100.
2. Am J Med Sci. 2000 Jun;319(6):343-52.
3. J Gen Intern Med. 1990 May-Jun;5(3):192-7.
4. Alcohol. 1993 Sep-Oct;10(5):343-7.
5. South Med J. 2013 Feb;106(2):121-5.
‘Non-criteria’ antiphospholipid antibodies and thrombosis
To the Editor: We read with great interest the excellent article on thrombosis secondary to antiphospholipid antibody syndrome.1 We wish to comment on the section “Antiphospholipid antibodies are not all the same,” specifically on question 6: “Which of the following antiphospholipid antibodies have not been associated with an increased thrombotic risk?”
The answer offered was antiphosphatidylserine, and the authors stated, “While lupus anticoagulant, anti-beta-2-glycoprotein I, and anticardiolipin antibodies are associated with thrombosis, antiprothrombin antibodies (including antiprothrombin and antiphosphatidylserine antibodies) are not.”1
Antiphospholipid antibody testing in antiphospholipid antibody syndrome is complicated, but we feel the information provided was inaccurate. It should be noted that 3 antibodies are under discussion: in addition to antiphosphatidylserine (aPS) antibodies, antiprothrombin antibodies are heterogeneous, comprising antibodies to prothrombin alone (aPT-A) and antibodies to the antiphosphatidylserine-prothrombin complex (aPS/PT). While the diagnostic utility of these antibodies is in evolution, there are numerous studies on their association with thrombosis or antiphospholipid antibody syndrome, or both.2,3 Most recently, a systematic review (N = 7,000) concluded that prothrombin antibodies (aPT, aPS/PT) were strong risk factors for thrombosis (odds ratio 2.3, 95% confidence interval 1.72–3.5).4
The revised Sapporo (Sydney) guidelines referenced by the authors addressed these “non-criteria” antiphospholipid antibodies.5 At that time (2006), it was thought premature to include these antibodies as independent criteria for definite antiphospholipid antibody syndrome, even though their association with the syndrome was recognized by the committee. The guidelines considered an interesting scenario: What if a case fulfills the clinical criteria of antiphospholipid antibody syndrome, but serology is positive only for these “non-criteria” antibodies? It was suggested that these cases be classified as “probable” antiphospholipid antibody syndrome. Also, aPS/PT was proposed as a confirmatory assay for lupus anticoagulant testing.
In 2010, the International Congress on Antiphospholipid Antibodies concluded that aPS/PT is truly relevant to thrombosis and antiphospholipid antibody syndrome, with the possibility of aPS/PT becoming a criterion for the syndrome in the future.6 Studies have already started on this.7 Since then, 2 scoring systems to quantify the risk of thrombosis and obstetric events have incorporated aPS/PT—the Antiphospholipid Score (2012) and the Global Anti-Phospholipid Syndrome Score (2013).8.9
In conclusion, these antibodies are associated with thrombosis, can be considered features of antiphospholipid antibody syndrome in the right clinical context, and have a role in contemporary discussion of this disease.
- Serhal M, Evans N, Gornik HL. A 75-year-old with abdominal pain, hypoxia, and weak pulses in the left leg. Cleve Clin J Med 2018; 85(2):145–154. doi:10.3949/ccjm.85a.16069
- Khogeer H, Alfattani A, Al Kaff M, Al Shehri T, Khojah O, Owaidah T. Antiphosphatidylserine antibodies as diagnostic indicators of antiphospholipid syndrome. Lupus 2015; 24(2):186–190. doi:10.1177/0961203314552462
- Sciascia S, Bertolaccini ML. Antibodies to phosphatidylserine/prothrombin complex and the antiphospholipid syndrome. Lupus 2014; 23(12):1309–1312. doi:10.1177/0961203314538332
- Sciascia S, Sanna G, Murru V, Roccatello D, Khamashta MA, Bertolaccini ML. Anti-prothrombin (aPT) and anti-phosphatidylserine/prothrombin (aPS/PT) antibodies and the risk of thrombosis in the antiphospholipid syndrome. A systematic review. Thromb Haemost 2014; 111(2):354–364. doi:10.1160/TH13-06-0509
- Miyakis S, Lockshin MD, Atsumi T, et al. International consensus statement on an update of the classification criteria for definite antiphospholipid syndrome (APS). J Thromb Haemost 2006; 4(2):295–306. doi:10.1111/j.1538-7836.2006.01753.x
- Bertolaccini ML, Amengual O, Atsumi T, et al. ‘Non-criteria’ aPL tests: report of a task force and preconference workshop at the 13th International Congress on Antiphospholipid Antibodies, Galveston, TX, USA, April 2010. Lupus 2011; 20:191–205. doi:10.1177/0961203310397082
- Fabris M, Giacomello R, Poz A, et al. The introduction of anti-phosphatidylserine/prothrombin autoantibodies in the laboratory diagnostic process of anti-phospholipid antibody syndrome: 6 months of observation. Auto-Immunity Highlights 2014; 5(2):63–67. doi:10.1007/s13317-014-0061-3
- Otomo K, Atsumi T, Amengual O, et al. Efficacy of the antiphospholipid score for the diagnosis of antiphospholipid syndrome and its predictive value for thrombotic events. Arthritis Rheum 2012; 64(2):504–512. doi:10.1002/art.33340
- Sciascia S, Sanna G, Murru V, Roccatello D, Khamashta MA, Bertolaccini ML. GAPSS: the Global Anti-Phospholipid Syndrome Score. Rheumatology (Oxford) 2013; 52(8):1397–1403. doi:10.1093/rheumatology/kes388
To the Editor: We read with great interest the excellent article on thrombosis secondary to antiphospholipid antibody syndrome.1 We wish to comment on the section “Antiphospholipid antibodies are not all the same,” specifically on question 6: “Which of the following antiphospholipid antibodies have not been associated with an increased thrombotic risk?”
The answer offered was antiphosphatidylserine, and the authors stated, “While lupus anticoagulant, anti-beta-2-glycoprotein I, and anticardiolipin antibodies are associated with thrombosis, antiprothrombin antibodies (including antiprothrombin and antiphosphatidylserine antibodies) are not.”1
Antiphospholipid antibody testing in antiphospholipid antibody syndrome is complicated, but we feel the information provided was inaccurate. It should be noted that 3 antibodies are under discussion: in addition to antiphosphatidylserine (aPS) antibodies, antiprothrombin antibodies are heterogeneous, comprising antibodies to prothrombin alone (aPT-A) and antibodies to the antiphosphatidylserine-prothrombin complex (aPS/PT). While the diagnostic utility of these antibodies is in evolution, there are numerous studies on their association with thrombosis or antiphospholipid antibody syndrome, or both.2,3 Most recently, a systematic review (N = 7,000) concluded that prothrombin antibodies (aPT, aPS/PT) were strong risk factors for thrombosis (odds ratio 2.3, 95% confidence interval 1.72–3.5).4
The revised Sapporo (Sydney) guidelines referenced by the authors addressed these “non-criteria” antiphospholipid antibodies.5 At that time (2006), it was thought premature to include these antibodies as independent criteria for definite antiphospholipid antibody syndrome, even though their association with the syndrome was recognized by the committee. The guidelines considered an interesting scenario: What if a case fulfills the clinical criteria of antiphospholipid antibody syndrome, but serology is positive only for these “non-criteria” antibodies? It was suggested that these cases be classified as “probable” antiphospholipid antibody syndrome. Also, aPS/PT was proposed as a confirmatory assay for lupus anticoagulant testing.
In 2010, the International Congress on Antiphospholipid Antibodies concluded that aPS/PT is truly relevant to thrombosis and antiphospholipid antibody syndrome, with the possibility of aPS/PT becoming a criterion for the syndrome in the future.6 Studies have already started on this.7 Since then, 2 scoring systems to quantify the risk of thrombosis and obstetric events have incorporated aPS/PT—the Antiphospholipid Score (2012) and the Global Anti-Phospholipid Syndrome Score (2013).8.9
In conclusion, these antibodies are associated with thrombosis, can be considered features of antiphospholipid antibody syndrome in the right clinical context, and have a role in contemporary discussion of this disease.
- Serhal M, Evans N, Gornik HL. A 75-year-old with abdominal pain, hypoxia, and weak pulses in the left leg. Cleve Clin J Med 2018; 85(2):145–154. doi:10.3949/ccjm.85a.16069
- Khogeer H, Alfattani A, Al Kaff M, Al Shehri T, Khojah O, Owaidah T. Antiphosphatidylserine antibodies as diagnostic indicators of antiphospholipid syndrome. Lupus 2015; 24(2):186–190. doi:10.1177/0961203314552462
- Sciascia S, Bertolaccini ML. Antibodies to phosphatidylserine/prothrombin complex and the antiphospholipid syndrome. Lupus 2014; 23(12):1309–1312. doi:10.1177/0961203314538332
- Sciascia S, Sanna G, Murru V, Roccatello D, Khamashta MA, Bertolaccini ML. Anti-prothrombin (aPT) and anti-phosphatidylserine/prothrombin (aPS/PT) antibodies and the risk of thrombosis in the antiphospholipid syndrome. A systematic review. Thromb Haemost 2014; 111(2):354–364. doi:10.1160/TH13-06-0509
- Miyakis S, Lockshin MD, Atsumi T, et al. International consensus statement on an update of the classification criteria for definite antiphospholipid syndrome (APS). J Thromb Haemost 2006; 4(2):295–306. doi:10.1111/j.1538-7836.2006.01753.x
- Bertolaccini ML, Amengual O, Atsumi T, et al. ‘Non-criteria’ aPL tests: report of a task force and preconference workshop at the 13th International Congress on Antiphospholipid Antibodies, Galveston, TX, USA, April 2010. Lupus 2011; 20:191–205. doi:10.1177/0961203310397082
- Fabris M, Giacomello R, Poz A, et al. The introduction of anti-phosphatidylserine/prothrombin autoantibodies in the laboratory diagnostic process of anti-phospholipid antibody syndrome: 6 months of observation. Auto-Immunity Highlights 2014; 5(2):63–67. doi:10.1007/s13317-014-0061-3
- Otomo K, Atsumi T, Amengual O, et al. Efficacy of the antiphospholipid score for the diagnosis of antiphospholipid syndrome and its predictive value for thrombotic events. Arthritis Rheum 2012; 64(2):504–512. doi:10.1002/art.33340
- Sciascia S, Sanna G, Murru V, Roccatello D, Khamashta MA, Bertolaccini ML. GAPSS: the Global Anti-Phospholipid Syndrome Score. Rheumatology (Oxford) 2013; 52(8):1397–1403. doi:10.1093/rheumatology/kes388